Procedia Economics and Finance 7 (2013) 103 – 115 2212-5671 © 2013 The Authors. Published by Elsevier B.V. Selection and peer-review under responsibility of ICEBR 2013 doi:10.1016/S2212-5671(13)00224-4 ScienceDirect International Conference on Economics and Business Research 2013 (ICEBR 2013) Impact of Leverage and Managerial Skills on Shareholders’ Return Matemilola, B.T a , Bany-Ariffin, A.N b* and Azman-Saini, W.N.W c a,b,c Universiti Putra Malaysia, Serdang, 43400, Malaysia Abstract The recent financial crisis that saw an increase in the risk premium and shareholders’ return around the world is partly caused by the management use of excessive leverage. This paper investigates the effect of leverage and managerial skills on shareholders’ return. Our regression analysis that accounts for managerial skill factors reveals that leverage has a positive relationship with shareholders’ return. Similarly, managerial skills have a positive relationship with shareholders’ return. Based on the findings, the study suggests that leverage and managerial skills may be priced in equity valuation. We develop an index measure of managerial skills and use the upper-echelon theory of the management literature to explain how managerial skills relate to shareholders’ return. Keywords: Leverage; Managerial skills; Shareholders’ return; M&M proposition 2; Upper- echelon theory; Malaysia 1. Introduction The global increase in the risk premium and shareholders’ return during the recent financial crisis is partly attributed to the top management use of excessive leverage. Since the use of high leverage increases financial risk, shareholders’ would demand a higher return to compensate them for the added financial risk. * Corresponding author. Tel.: +603-89462000; fax: +603-8948-6188. E-mail address: [email protected] Available online at www.sciencedirect.com © 2013 The Authors. Published by Elsevier B.V. Selection and peer-review under responsibility of ICEBR 2013 Open access under CC BY-NC-ND license. Open access under CC BY-NC-ND license.

Welcome message from author
This document is posted to help you gain knowledge. Please leave a comment to let me know what you think about it! Share it to your friends and learn new things together.
Transcript
Procedia Economics and Finance 7 ( 2013 ) 103 – 115
2212-5671 © 2013 The Authors. Published by Elsevier B.V.Selection and peer-review under responsibility of ICEBR 2013doi: 10.1016/S2212-5671(13)00224-4
ScienceDirect
International Conference on Economics and Business Research 2013 (ICEBR 2013)
Impact of Leverage and Managerial Skills on Shareholders’ Return
Matemilola, B.T a, Bany-Ariffin, A.Nb* and Azman-Saini, W.N.W c
a,b,c Universiti Putra Malaysia, Serdang, 43400, Malaysia
Abstract
The recent financial crisis that saw an increase in the risk premium and shareholders’ return around the world is partly caused by the management use of excessive leverage. This paper investigates the effect of leverage and managerial skills on shareholders’ return. Our regression analysis that accounts for managerial skill factors reveals that leverage has a positive relationship with shareholders’ return. Similarly, managerial skills have a positive relationship with shareholders’ return. Based on the findings, the study suggests that leverage and managerial skills may be priced in equity valuation. We develop an index measure of managerial skills and use the upper-echelon theory of the management literature to explain how managerial skills relate to shareholders’ return. © 2013 The Authors. Published by Elsevier B.V. Selection and peer-review under responsibility of ICEBR 2013. Keywords: Leverage; Managerial skills; Shareholders’ return; M&M proposition 2; Upper- echelon theory; Malaysia
1. Introduction
The global increase in the risk premium and shareholders’ return during the recent financial crisis is partly attributed to the top management use of excessive leverage. Since the use of high leverage increases financial risk, shareholders’ would demand a higher return to compensate them for the added financial risk.
* Corresponding author. Tel.: +603-89462000; fax: +603-8948-6188. E-mail address: [email protected]
Available online at www.sciencedirect.com
© 2013 The Authors. Published by Elsevier B.V.Selection and peer-review under responsibility of ICEBR 2013
Open access under CC BY-NC-ND license.
Open access under CC BY-NC-ND license.
104 B.T. Matemilola et al. / Procedia Economics and Finance 7 ( 2013 ) 103 – 115
Over the years, finance researchers have identified reliable factors such as leverage, tax, price-to-book ratio and size as some of the variables that affect the shareholders’ return. Nonetheless, managerial skill factor has been frequently omitted because it is unobservable and difficult to measure which explains why these variables are frequently omitted in return model. Pandey, 2005, and Jacobson, 1990, argue that failure to account for unobservable firm-specific factors in a return model would lead to omitted variable bias. Moreover, the inferences we make based on a model that does not account for these unobservable firms-specific factors would be incorrect. Despite the difficulty of dealing with unobservable factors that affect shareholders’ return, studies in this area which concern with the problem created by omitted variable bias, have used techniques designed to control for the influence of unobservable firm-specific factors in a return model (Pandey, 2005 and Jacobson, 1990). Specifically, the role of unobservable firm-specific factors such as managerial skills has been ignored in the literature, but managerial skills could have a strong influence on the shareholders’ return. Do leverage and managerial skills affect shareholders’ return in Malaysia?
In order to investigate the effects of leverage and managerial skills on shareholders’ return in Malaysia, we select the top 400 listed firms as our sample framework. We focus on listed firms because they provide direct setting for us to empirically investigate how leverage and managerial skills affect shareholders’ return within the Modigliani and Miller’s, (1958 and 1963) risk-return relationship framework. Listed firms provide a good setting because valuation is attached to listed firm stock.
In Malaysia, there are cases of firms that have financial distress problems and financial practices that do not justify continuous trading. This has prompted Bursa Malaysia to introduce Practice Note No. 4/2001[PN4] and Practice Note No. 17/2005 [PN17] in order to provide a comprehensive plan to help listed firms with signs of financial distress to improve their operating conditions (Alifiah et al., 2011). The use of high leverage leads to the financial distress problem, and we may attribute it to a failure on the part of top management to maintain sustainable leverage level. Consistent with risk-return relationship, shareholders demand higher returns to compensate them for added financial risk caused by the management use of high leverage.
We hope this study can fill in the gap in the executive leadership and in Malaysia firm’s asset valuation and capital structure literature through systemic assessment of relationship between top management team’s characteristics and shareholders’ return. It is well established in the upper-echelon perspective that the maximization of shareholders’ return is a reflection of top management skills. Thus, investigating the effect of leverage and managerial skills on shareholders’ return adds new insight to the relationship between return and leverage from Malaysia perspective.
The rest of the paper is organized as follows: section two reviews relevant literature, section three describes method and data, section four discusses the results and section five provides concluding remarks.
2. Literature review
Upper-echelon theory draws from organizational behavior and management science literatures to argue that demographic attributes such as education level and years of experience of top management influence their strategic decision (Hambrick and Mason, 1984). Furthermore, upper-echelon theorists suggest that a firm’s top management is a critical resource for its success because of the significant influence the top management has on firms’ strategic decisions and success (Escriba-Esteve, 2009; Barney, 1991 and Hambrick and Mason, 1984). The underlying assumption in upper echelon theory is that demographic attributes such as educational level and years of experience serve as surrogates for cognitive ability of top managers. Top management managers with high level of education and experience make high quality decisions because they have the cognitive ability to execute complex strategic decision (Escriba-Esteve, 2009).
Maximization of shareholders’ return is a strategic decision that top management faces, and better educated managers at top management are more confident of their strategic decision. This is because they are better positioned to analyze the outcome of their strategic choices. Similarly, we expect top management to
105 B.T. Matemilola et al. / Procedia Economics and Finance 7 ( 2013 ) 103 – 115
have high-risk tolerance level since they are better able to analyze expected risk and outcome of their strategic decision. Therefore, managerial skills should be related to shareholders’ return. As in previous studies that use the upper echelon theory, we use demographic attributes such as education level and years of experience as a proxy to measure managerial skills. Past studies have investigated the relationship between return and leverage based on the assumption that economic agents are rational. However, this may not be true because top management’s values and cognitive base may influence shareholders’ return in different ways. Carmeli and Tishler, 2006, use upper-echelon theory to investigate the effect of managerial skills of top management team on performance of industrial firms. Carmeli and Tishler, 2006, find that managerial skills possessed by top management affect firm performance and their impact is more than size and age variables.
2.1. Theory and empirical evidence that relate debt to return
The global financial crisis that causes increased in the risk premium and shareholders’ returns around the world is in part attributed to the use of excessive leverage in firms’ capital structure. Theoretically, how leverage affects shareholder’s return is not a settled issue. The debate started with the research work of Modigliani and Miller, 1958, who argue that leverage is independent of a firm’s cost of capital under the assumption of a perfect capital market. If capital market is perfect, debt is truly irrelevant. However, various market imperfections exist, particularly in emerging countries which make leverage relevant. Traditionalists argue that there is an optimal leverage that balances gain from leverage against the dead weight cost of bankruptcy (Lintner, 1956 and Gordon, 1959).
Conversely, Modigliani and Miller, 1958, in their proposition one without tax, argue that leverage is independent of a firm’s cost of capital. Subsequently, Modigliani and Miller, 1963, in their proposition two with corporate tax, argue that leverage reduces firm’s cost of capital, but tax savings from debt is offset by the rising cost of equity. Specifically, their proposition two states that the rate of return on equity of firms whose capital structure includes leverage is equal to the appropriate capitalization rate for pure equity stream plus a premium related to financial risk. Consequently, their finding implies that return is an increasing function of leverage. This is because leverage increases risk premium; therefore, shareholders will demand a higher return on their investments.
Recent studies that investigate how leverage relates to returns report mixed results. Ben, 2012, investigates the impact of financing decision on return and finds that leverage is positively related to return. Similarly, Ahmad et al., 2012, examines the effect of leverage on return. They find that three measures of leverage have a positive relationship with returns. Matemilola et al., 2012, tests the impact of leverage on shareholders’ return using GMM estimation. They find that long-term debt and total debt are positively elated to shareholders’ return for South African firms. Dimitrov and Jain, 2008, find that leverage has a negative relationship with stock returns. They study changes in leverage level and show that leverage is negatively related with current and future adjusted returns. George and Hwang, 2007, find that evidence of a negative relationship between defaults risks disappears after controlling for leverage. They argue that their result is consistent with the hypothesis that the risk of bearing financial distress costs is priced, and that firms with greatest exposure to these costs avoid leverage. Abor, 2005, uses regression analysis to examine the relationship between return on equity and capital structure measures. His results reveal a significant positive relationship between both short-term leverage and total leverage on equity return. However, Abor, 2005, finds that long-term leverage has a negative relationship with equity return. Conversely, Coleman, 2007, utilizes fixed effect and random effect techniques to examine the impact of capital structure on micro finance institutions. He finds that micro finance institutions use more leverage and finance their operations with long term debt as against short-term debt.
In our paper, we investigate the effect of leverage and managerial skills on shareholders’ returns with the use of the fixed effects technique that accounts for unobserved firm-specific factors such as managerial skills.
106 B.T. Matemilola et al. / Procedia Economics and Finance 7 ( 2013 ) 103 – 115
Furthermore, we develop an index measure of managerial skills and include it in our regression analysis. Hull, 1999, studies the relationship between leverage and market reaction to common stock and reports a negative immediate response, particularly for firms away from their industry average. He measures returns using three-day cumulative returns, while we measure shareholder’s return as the ratio of earnings after tax divided by the shareholder’s fund, which is in line with the Modigliani and Miller’s measure of return for equity holders. Korteweg, 2004, tests Modigliani and Miller’s proposition two and reports a negative relationship between stock returns and leverage. His tests are based on pure debt changes and suffer similar sample problem as Masulis’, 1983, because these firms may not represent firms in all risk classes. These samples are restricted to certain groups of firms that go through pure debt changes which might represent a certain risk class itself. In our study, we use panel data that utilize information across firms in all risk classes and over time.
Muradoglu and Sivaprasad, 2009, look at whether leverage is value-relevant to an equity investor. They integrate the Modigliani and Miller's framework into an investment approach by estimating abnormal returns in excess of market return on average portfolios in the time-series for different risk classes. We follow Modigliani and Miller’s model, but account for additional risk factors. Certainly, leverage policy is an important decision that managers face because excessive leverage increases the possibility of financial distress due to the inability to make sufficient earnings to repay principal plus interest. Additionally, investors will demand a risk premium to compensate them for the increase in financial risk due to excessive use of leverage. George and Hwang, 2007, examine the probability of financial distress and show that book leverage has a negative relationship with returns. They argue that firms that suffer most in financial distress maintain low (high) leverage and vice versa. Thus, the return premium to low leverage firms compared to high leverage firms seems to be a compensation for added financial risk arising from using high leverage.
Penman et al., 2007, study book-to-price effect on stock returns by accounting for leverage. They break down book-to-price component into enterprise book-to-price which reflects the operating risk and leverage component which reflects the financing risk. They find that the leverage component is negatively related to return. This evident holds in firms with both high and low book-to-price ratio. Similarly, George and Hwang, 2007, find a negative relationship between leverage and returns. Conversely, Gomes and Schmid, 2009, and Mahdi and Kumars, 2009, document a positive relationship between leverage and returns.
The literature review reveals that the relationship between return and debt examined in developed and developing countries show mixed results. Moreover, it is hard to find studies that investigate the effect of managerial skills on shareholders’ return. We therefore put forward the study hypothesized in the H1 form that:
(1) There is a significant relationship between long-term debt and shareholders’ return. (2) There is a significant relationship between total debt and shareholders’ return.
2.2. Relationship between managerial skills and return
Upper echelon theory relates managerial skills to strategic outcomes such as maximizing returns to shareholders. The managerial skills proxy by educational level and experience of managers have been associated with their cognitive ability and knowledge base (Hambrick and Mason, 1984). The underlying assumption in the upper echelon theory is that demographic attributes such as educational level and years of experience serve as surrogates for cognitive skills or ability of top managers. Escriba-Esteve et al., 2009, and Carmeli and Tishler, 2006, have linked high educational attainment and experience with skills. Carmeli and Tishler, 2006, find that managerial skills of top management affect firm performance and their impact is more than size and age variables. Escriba-Esteve et al., 2009, argue that top management with high level of education and experience makes high quality decisions because they have the cognitive skills to execute complex strategic decision and influence strategic outcomes such as higher returns to shareholders. However,
107 B.T. Matemilola et al. / Procedia Economics and Finance 7 ( 2013 ) 103 – 115
it is also possible that managers with high cognitive skills will use their educational level and experience to conceal and influence shareholder’s return in a negative way. Thus, it is reasonable to assume that managerial skills are a risk factor that may influence shareholder’s return in either negative or positive ways. Thus, it is interesting to know how managerial skills affect the shareholders’ return within the risk-return relationship framework of Modigliani and Miller’s theory. Based on the argument presented in this section, we therefore put forward the study hypothesized in the H1 form that:
(3) There is a significant relationship between managerial skills and shareholders’ return. Our paper departs from past studies because we extend the basic Modigliani and Miller’s proposition two
as we include additional risk factors using the fixed effects panel and regression that account for managerial skill factor. Furthermore, we develop an index measure of managerial skills and include it in our regression analysis. Managerial skills are measured as the educational level and years of experience of top management and they may affect the shareholders’ return. Educated and experienced top management may have high risk tolerance level because they are confident of their ability to analyze the outcome of their strategic decisions. Thus, it is interesting to know how managerial skills affect the shareholders’ return.
2. Methodology and Data
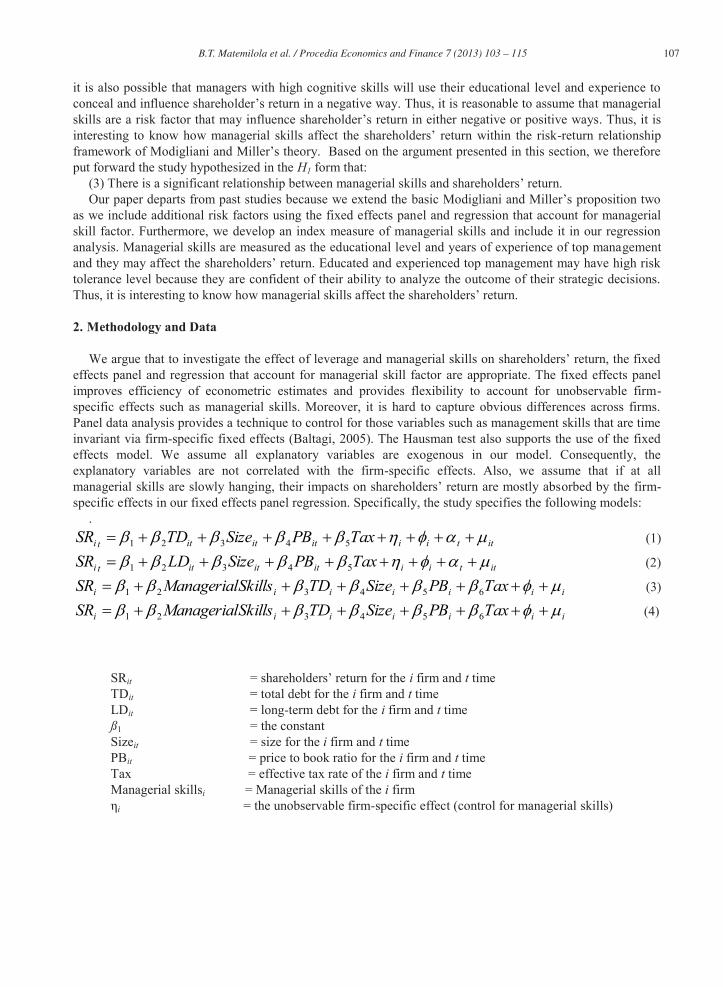
We argue that to investigate the effect of leverage and managerial skills on shareholders’ return, the fixed effects panel and regression that account for managerial skill factor are appropriate. The fixed effects panel improves efficiency of econometric estimates and provides flexibility to account for unobservable firm-specific effects such as managerial skills. Moreover, it is hard to capture obvious differences across firms. Panel data analysis provides a technique to control for those variables such as management skills that are time invariant via firm-specific fixed effects (Baltagi, 2005). The Hausman test also supports the use of the fixed effects model. We assume all explanatory variables are exogenous in our model. Consequently, the explanatory variables are not correlated with the firm-specific effects. Also, we assume that if at all managerial skills are slowly hanging, their impacts on shareholders’ return are mostly absorbed by the firm-specific effects in our fixed effects panel regression. Specifically, the study specifies the following models:
.
ittiiitititti TaxPBSizeTDSR 54321 (1)
ittiiitititti TaxPBSizeLDSR 54321 (2)
iiiiiii TaxPBSizeTDSkillsManagerialSR 654321 (3)
iiiiiii TaxPBSizeTDSkillsManagerialSR 654321 (4)
SRit = shareholders’ return for the i firm and t time TDit = total debt for the i firm and t time LDit = long-term debt for the i firm and t time ß1 = the constant Sizeit = size for the i firm and t time PBit = price to book ratio for the i firm and t time Tax = effective tax rate of the i firm and t time Managerial skillsi = Managerial skills of the i firm ηi = the unobservable firm-specific effect (control for managerial skills)
108 B.T. Matemilola et al. / Procedia Economics and Finance 7 ( 2013 ) 103 – 115
φi = industry fixed effects αt = the year fixed effects μit = the residual term
We use subscript 'i' and’t’ to represent the firm and time period, respectively. Shareholders’ return (SR) is the ratio of earnings after tax to total shareholders’ fund. Total debt (TD) is the ratio of total debt to total assets. Long-term debt (LD) is the ratio of long-term debt to total assets. Size is log of total assets. Price to book (PB) is the ratio of market price to book value of assets. Wally and Baum, 1994, argue that observable demographic attributes such as education level and years of experience shape values and beliefs of managers and can be seen as valid proxy for underlying cognitive ability. Cognitive ability here refers to an assumption about future events and consequences attached to alternative decisions.
Chen et al., 2010, use level of education as a proxy to measure attributes of top managers in their capital structure study. They examine moderating effects of top management team characteristics on financing decision of research and development investment in small and medium size firms. Similarly, we use a top management education level and years of experience to measure managerial skills. Model 1 and model 2 are fixed effects panel model. Models 3 and 4 are cross-sectional model because managerial skills are measured for one year.
3.1. Data
The sample consists of firms listed on Bursa Malaysia. The data for the analysis is obtained from Data Stream. To derive the final sample, we impose some restrictions. Firstly, we use annual data of the top 400 listed firms on Bursa Malaysia from 2000 to 2009. Furthermore, consistent with Herrmann and Datta, 2005, we collect information of top management education level in 2009. Altogether, 94 top managers fill in the information on their education level and years of experience (a measure of top management skills). In order to investigate the effect of managerial skills on shareholders’ return, we apply the cross-sectional regression analysis because we have data for one year.
Secondly, as part of the data sampling process, financial firms are excluded because their financial statement differs significantly from that of non-financial firms. Third, we exclude regulated firms because their debt ratio is usually higher than other non-financial firms (Rajan and Zingales, 1995).
Past researchers (Rajan and Zingales, 1995; Frank and Goyal, 2008; Matemilola et al., 2012) use balance sheet and income statement data to conduct capital structure research. Similarly, we use balance sheet and income statement data. In addition, as a robustness check, we use two measures of leverage ratio: long-term debt ratio and total debt ratio. The book value of debt is less subjected to price fluctuation compared to market value of debt. In line with Gomes and Schmid, 2009, and Mahdi and Kumars, 2009, the study uses debt measures (long-term debt/total assets and total debt/ total assets) and explanatory variables that are established in the literature and believed to be determinants of shareholders’ return. Our measure of shareholder’s return (earnings after tax/ shareholders’ fund) is in line with Modigliani’s measure of returns for equity holders.
4. Results and Discussion
Table 1 gives descriptive statistics and correlation results, respectively. The correlation coefficients are low, suggesting that there is no multi-collinearity problem in the data. Total debt ratio is the main independent variable for Model one, while the long-term debt ratio is the main independent variable for Model two. We use fixed effects panel because it provides a technique to control for unobservable factors such as managerial skills that could affect the shareholders’ return.

109 B.T. Matemilola et al. / Procedia Economics and Finance 7 ( 2013 ) 103 – 115
Table 1: Summary statistics Panel A: Mean and standard deviations
SR LD TD SIZE PB TAX Mean 0.52 0.17 0.25 0.08 1.11 31.46 Std. dev 5.30 0.25 0.34 1.29 1.57 9.52
Panel B: Correlation coefficients SR TD LD SIZE PB TAX
SR 1.000 TD 0.077*** 1.000 LD 0.076*** 0.495*** 1.000
SIZE 0.296*** 0.041** 0.039** 1.000 PB -0.018 -0.051*** -0.051*** 0.005 1.000 TAX 0.077*** 0.045*** 0.395*** -0.041** -0.051*** 1.000 Notes: SR is a ratio of earnings after tax to shareholder’s fund. TD (Total debt) is the ratio of total debt to total assets. LD (Long term debt) is ratio of long term debt to total assets. Size is log of total assets. PB (Market price to book ratio) is ratio of market price to book value of total assets. Tax (effective tax rate ) is the ratio of tax liability to taxable income multiply by 100). Industry fixed effects are included but not reported to save space. ***, ** indicate correlation is significant at 1 per cent and 5 per cent respectively. N = 400, T = 10. The sample uses top 400 listed firms over a 10-year period. Table 2 below presents the summary of the results for fixed effects panel. The estimated coefficients are statistically significant and have the expected sign. Total debt has a significant positive relationship with shareholders’ return in Model 1. Similarly, long-term debt has a significant positive relationship with shareholders’ return in Model 2. The significant positive relationship between total debt and shareholders’ return as well as the significant positive relationship between long-term debt and shareholders’ return implies that leverage may be an important risk factor in equity valuation. The study shows that when leverage increases, investors demand a higher return to compensate them for the added financial risk. The results make economic sense because shareholders are expected to demand higher returns to compensate them for the additional financial risk. Financial risk arises from the usage of high leverage which leads to bankruptcy if managers are unable to repay interest on the debt plus the principal. The results suggest that leverage may be an important risk factor to be priced in equity valuation, especially in the Malaysian context. Our results are in line with George and Hwang, 2007, who find that the negative relationship between default risk and stock returns disappears after controlling for debt. They argue that their results are consistent with the hypothesis that risk of bearing financial distress costs is priced. Similarly, our results are consistent with Gomes and Schmid, 2009, and Mahdi and Kumars, 2009, that report positive relationship between leverage and returns. However, our results are inconsistent with Dimitrov and Jain, 2008, that study leverage changes which find a negative relation between changes in leverage and stock returns. Also, our results are inconsistent with Penman et al., 2007, that study book-to-price effect on stock returns by accounting for leverage. Penman et al., 2007, break down book-to-price component into enterprise book-to-price which reflects the operating risk and a debt component which reflects the financing risk. They discover that the leverage component is negatively related to return for both high and low book-to-price ratio.
Moreover, the results reveal that size as a control variable carries expected sign (positive sign) and could be a potential determinant of shareholders’ return in Malaysia. Large empirical literature agrees that bigger firms are able to generate more earnings. This explains the positive relationship between size and shareholders’ return. However, tax variable is only marginally significant at 10 percent level in model 2.

110 B.T. Matemilola et al. / Procedia Economics and Finance 7 ( 2013 ) 103 – 115
Table 2. Fixed effect panel results
Independent variable
Fixed effects panel
Model 1
Fixed effects panel
Model 2
Total debt 0.73*** (4.42) - -
Long term debt - - 0.24*** (4.53)
Size 0.04*** (3.02) 0.33*** (3.13)
Price to book ratio -0.04 (-0.52) -0.03 (-0.50)
Tax 0.26 (0.42) 0.01* (1.92)
Industry effects Yes Yes
R2 0.22 0.20
F-statistics (7.53) (8.07)
N 400 400
Notes: a Dependent variable is returned on shareholder’s equity (SR). b SR is the ratio of earning after tax to shareholder’s fund. Total debt is the ratio of total debt to total assets. Long term debt is ratio of long -term debt to total assets. Size is log of total assets. Price to book ratio is ratio of market price to book value of assets. Tax (the effective tax rate) is the ratio of tax liability to taxable income multiply by 100. Industry effects is a dummy variable equal to one if firm belongs to a particular industry and zero otherwise. Industry fixed effects are included but not reported to save space. c Figures in parentheses are White (1980) heteroskedasticity constant test statistics. d Year fixed effects are included in the model .e *** indicate coefficients are significant at 1 per cent. N = 400, T = 10.
Furthermore, we investigate the effect of managerial skills on shareholders’ return. Table 3 below shows the results for the model that uses an average education level of top management in each firm as a proxy for managerial skills. Similarly, Table 4 below reports the results for the model that uses the average years of experience of top management in each firm as a proxy for managerial skills. Despite the difficulty in measuring unobservable firm-specific variable such as management skills, this study approximates management skills using an average education level and average years of experience of top management for each firm in 2009.
Herrmann and Datta, 2005, adopt a seven-point scale on the highest degree earned; (1=high school, 2=some college, 3=undergraduate degree, 4=some graduate school, 5=master’s degree, 6=attended doctoral programme, and 7=doctorate) as a measure of educational level. Whilst Wally and Becerra (2001) adopt a three-point scale as follows; 1=Bachelor’s degree or less, 2=Master’s degree, and 3=PhD. In this study, the scale was modified to a five-point scale with maintaining the scale concept used by Herrmann and Datta, 2005, as educational measures; (1 = Diploma and lower; 2 = First degree; 3 = Professional qualification; 4 = Master’s degree, and 5 = Doctorate degree.
The average educational level of top management is finally computed for each firm. Thus, the top management educational level was measured as the average educational level of top management from the assigned score of each individual member. Then the score of top management educational level was aggregated to calculate the mean to find an average educational level for each firm. The managerial experience is measured as average years of experience of top management in each firm. The results reveal that managerial skills are significant and positively related to shareholders’ return in Models 3 and 4 that include managerial skill factor. This supports the upper-echelon theory that demographic attributes of top management such as education level (a measure of managerial skills) affect their strategic choices.
Maximization of shareholders’ return is a strategic decision faced by top management. Top managers with strong managerial skills are more confident of their strategic choices since they are better able to analyze the outcome of their strategic decision.
Moreover, the fixed effect panel and cross sectional regression that account for managerial skills reveal that size is significant and positively related to shareholders’ return. Large empirical literature agrees that

111 B.T. Matemilola et al. / Procedia Economics and Finance 7 ( 2013 ) 103 – 115
bigger firms are more stable and less risky. This explains the positive relationship between size and shareholders’ return. Conversely, price-to-book ratio is not significant in the models. The results are consistent with the findings of Gomes and Schmid, 2009, and Mahdi and Kumars, 2009, that find that leverage is positively related to return. Conversely, the results are inconsistent with Penman et al., 2007, and with George and Hwang, 2007, which indicate that leverage is negatively related to return.
Table 3. Ordinary Least Squares (cross sectional regression) Dependent Variable: Shareholders’ Return
Independent Variables
Model 3 (with Management Education)
Model 4 (With Management Education)
Managerial skills 0.09*** (4.63) 0.10*** (4.59)
Long-term debt - 0.66*** (3.96)
Total debt 0.47*** (4.31) -
Size 0.19** (6.58) 0.16** (6.47)
Price-to-book ratio Tax
-0.03 (-1.31) 0.00 (0.32)
-0.04 (-1.47) 0.01 (0.29)
Industry effects Yes Yes
F-test 38.10 36.36
R-squared 0.35 0.33
Adjusted R-square 0.33 0.31 Notes: a Dependent variable is returned on shareholder’s equity (SR). b SR is the ratio of earning after tax to shareholder’s fund. TD (Total debt) is the ratio of total debt to total assets. LD (Long term debt) is ratio of long term debt to total assets. Size is log of total assets. PB (Market price to book ratio) is ratio of market price to book value of assets. Managerial skill is average education level of top management in each firm. Tax (effective tax rate) is the ratio of tax liability to taxable income multiply by 100. Industry effects are a dummy variable equal to one if firm belongs to a particular industry and zero otherwise. Industry fixed effects are included but not reported to save space. c Figures in parentheses are White (1980) heteroskedasticity constant test statistics. d *** and **, indicate coefficients are significant at 1 per cent and 5 per cent respectively. N = 94. Table 4 Ordinary Least Squares (cross sectional regression)
Dependent Variable Shareholders’ Return
Independent Variables
Model 3 (with Management Experience)
Model 4 (With Management Experience)
Managerial skills 0.31*** (3.21) 0.31*** (3.07)
Long-term debt - 0.80*** (4.64)
Total debt 0.56*** (5.03) -
Size 0.28** (5.23) 0.33*** (5.37)
Price-to-book ratio Tax
-0.03 (-1.07)
0.01** (2.36)
-0.03 (-1.25)
0.01** (2.34)
Industry effects Yes Yes
F-test 31.69 29.87
R-squared 0.39 0.38
Adjusted R-square 0.37 0.36
112 B.T. Matemilola et al. / Procedia Economics and Finance 7 ( 2013 ) 103 – 115
Notes: a Dependent variable is returned on shareholder’s equity (SR). b SR is the ratio of earning after tax to shareholder’s fund. TD (Total debt) is the ratio of total debt to total assets. LD (Long term debt) is ratio of long term debt to total assets. Size is log of total assets. PB (Market price to book ratio) is ratio of market price to book value of assets. Managerial skill is the average years of experience of top management in each firm. Tax is the effective tax rate. Industry effect is a dummy variable equal to one if firm belongs to a particular industry and zero otherwise. Industry fixed effects are included but not reported to save space. c Figures in parentheses are White (1980) heteroskedasticity constant test statistics. d *** and **, indicate coefficients are significant at 1 per cent and 5 per cent respectively. N = 94.
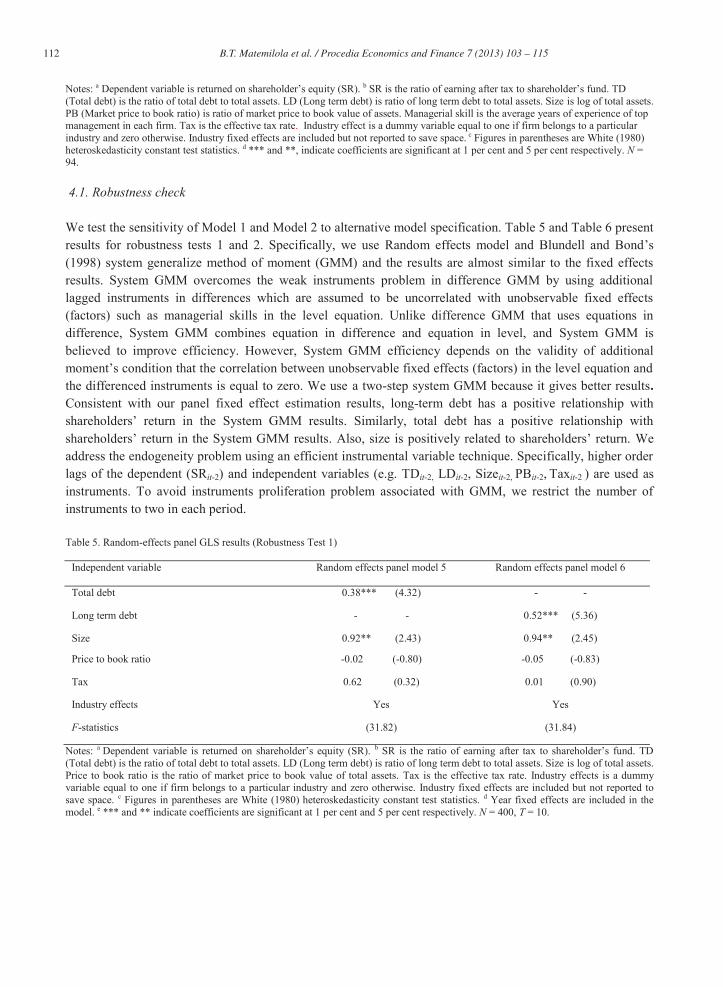
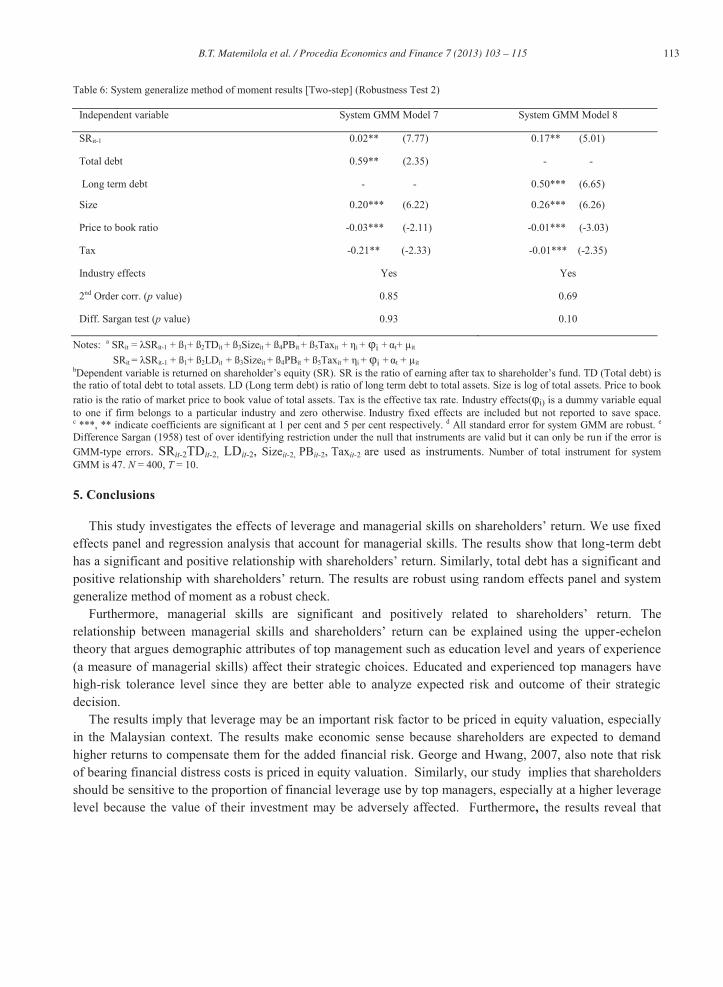
4.1. Robustness check We test the sensitivity of Model 1 and Model 2 to alternative model specification. Table 5 and Table 6 present results for robustness tests 1 and 2. Specifically, we use Random effects model and Blundell and Bond’s (1998) system generalize method of moment (GMM) and the results are almost similar to the fixed effects results. System GMM overcomes the weak instruments problem in difference GMM by using additional lagged instruments in differences which are assumed to be uncorrelated with unobservable fixed effects (factors) such as managerial skills in the level equation. Unlike difference GMM that uses equations in difference, System GMM combines equation in difference and equation in level, and System GMM is believed to improve efficiency. However, System GMM efficiency depends on the validity of additional moment’s condition that the correlation between unobservable fixed effects (factors) in the level equation and the differenced instruments is equal to zero. We use a two-step system GMM because it gives better results. Consistent with our panel fixed effect estimation results, long-term debt has a positive relationship with shareholders’ return in the System GMM results. Similarly, total debt has a positive relationship with shareholders’ return in the System GMM results. Also, size is positively related to shareholders’ return. We address the endogeneity problem using an efficient instrumental variable technique. Specifically, higher order lags of the dependent (SRit-2) and independent variables (e.g. TDit-2, LDit-2, Sizeit-2, PBit-2, Taxit-2 ) are used as instruments. To avoid instruments proliferation problem associated with GMM, we restrict the number of instruments to two in each period. Table 5. Random-effects panel GLS results (Robustness Test 1)
Independent variable Random effects panel model 5 Random effects panel model 6
Total debt 0.38*** (4.32) - -
Long term debt - - 0.52*** (5.36)
Size 0.92** (2.43) 0.94** (2.45)
Price to book ratio -0.02 (-0.80) -0.05 (-0.83)
Tax 0.62 (0.32) 0.01 (0.90)
Industry effects Yes Yes
F-statistics (31.82) (31.84)
Notes: a Dependent variable is returned on shareholder’s equity (SR). b SR is the ratio of earning after tax to shareholder’s fund. TD (Total debt) is the ratio of total debt to total assets. LD (Long term debt) is ratio of long term debt to total assets. Size is log of total assets. Price to book ratio is the ratio of market price to book value of total assets. Tax is the effective tax rate. Industry effects is a dummy variable equal to one if firm belongs to a particular industry and zero otherwise. Industry fixed effects are included but not reported to save space. c Figures in parentheses are White (1980) heteroskedasticity constant test statistics. d Year fixed effects are included in the model. e *** and ** indicate coefficients are significant at 1 per cent and 5 per cent respectively. N = 400, T = 10.
113 B.T. Matemilola et al. / Procedia Economics and Finance 7 ( 2013 ) 103 – 115
Table 6: System generalize method of moment results [Two-step] (Robustness Test 2)
Independent variable System GMM Model 7 System GMM Model 8
SRit-1 0.02** (7.77) 0.17** (5.01)
Total debt 0.59** (2.35) - -
Long term debt - - 0.50*** (6.65)
Size 0.20*** (6.22) 0.26*** (6.26)
Price to book ratio -0.03*** (-2.11) -0.01*** (-3.03)
Tax -0.21** (-2.33) -0.01*** (-2.35)
Industry effects Yes Yes
2nd Order corr. (p value) 0.85 0.69
Diff. Sargan test (p value) 0.93 0.10
Notes: a SRit = λSRit-1 + ß1+ ß2TDit + ß3Sizeit + ß4PBit + ß5Taxit + ηi + φi + αt+ μit SRit = λSRit-1 + ß1+ ß2LDit + ß3Sizeit + ß4PBit + ß5Taxit + ηi + φi + αt + μit bDependent variable is returned on shareholder’s equity (SR). SR is the ratio of earning after tax to shareholder’s fund. TD (Total debt) is the ratio of total debt to total assets. LD (Long term debt) is ratio of long term debt to total assets. Size is log of total assets. Price to book ratio is the ratio of market price to book value of total assets. Tax is the effective tax rate. Industry effects(φi) is a dummy variable equal to one if firm belongs to a particular industry and zero otherwise. Industry fixed effects are included but not reported to save space. c ***, ** indicate coefficients are significant at 1 per cent and 5 per cent respectively. d All standard error for system GMM are robust. e Difference Sargan (1958) test of over identifying restriction under the null that instruments are valid but it can only be run if the error is GMM-type errors. SRit-2TDit-2, LDit-2, Sizeit-2, PBit-2, Taxit-2 are used as instruments. Number of total instrument for system GMM is 47. N = 400, T = 10.
5. Conclusions
This study investigates the effects of leverage and managerial skills on shareholders’ return. We use fixed effects panel and regression analysis that account for managerial skills. The results show that long-term debt has a significant and positive relationship with shareholders’ return. Similarly, total debt has a significant and positive relationship with shareholders’ return. The results are robust using random effects panel and system generalize method of moment as a robust check.
Furthermore, managerial skills are significant and positively related to shareholders’ return. The relationship between managerial skills and shareholders’ return can be explained using the upper-echelon theory that argues demographic attributes of top management such as education level and years of experience (a measure of managerial skills) affect their strategic choices. Educated and experienced top managers have high-risk tolerance level since they are better able to analyze expected risk and outcome of their strategic decision.
The results imply that leverage may be an important risk factor to be priced in equity valuation, especially in the Malaysian context. The results make economic sense because shareholders are expected to demand higher returns to compensate them for the added financial risk. George and Hwang, 2007, also note that risk of bearing financial distress costs is priced in equity valuation. Similarly, our study implies that shareholders should be sensitive to the proportion of financial leverage use by top managers, especially at a higher leverage level because the value of their investment may be adversely affected. Furthermore, the results reveal that
114 B.T. Matemilola et al. / Procedia Economics and Finance 7 ( 2013 ) 103 – 115
size as a control variable has the expected sign (positive sign) and may be a potential determinant of shareholders’ return in Malaysia. Large empirical studies agree that bigger firms are able to generate more earnings. This explains the positive relationship between size and shareholders’ return. The significant positive relationship between managerial skills and shareholders’ return implies careful selection of top management because they exert significant influence on the shareholders’ return. Moreover, our study suggests that policy makers (i.e. Government) could consider management skill factor as an important input on the recent efforts to revitalize the private sector in economic transformation program.
The study contributes to the literature in two ways. Firstly, the paper develops an index measure of top management skills for Malaysian firms and uses the upper-echelon theory from the literature in management to explain how managerial skills relate to shareholders’ return. Secondly, we add managerial skill factor to basic Modigliani and Miller’s model and investigate their proposition in a fast growing country like Malaysia.
We use fixed effects panel and regression that account for managerial skill factor as our main method. Also, we assume that the variables are exogenous. However, robust check using the system Generalized Method of Moment (GMM) reveals the relevance of dynamic models. System GMM controls for endogeneity problem and it accounts for unobservable effects such as managerial skills. Thus, dynamic modeling may be necessary. Additionally, future empirical research needs to place emphasis on the role of unobservable firm-specific factors such as managerial skills in equity valuation model, especially in the context of Malaysia. Perhaps, studies that build on this research and give fresh insight to explain the relationship between managerial skills and shareholders’ return will be informative. References Abor, J., 2005. The Effect of Capital structure on Profitability: An Empirical Analysis of Listed Firms in
Ghana, Journal of Risk Finance 6, p.438-445 Ahmad, Z., Abdullah, N.M.H and Roslan, S. 2012. Capital structure effects on firms performance: focusing
on consumers and industrial sector on Malaysian firms, International Review of Business Research Papers, p.8(5), 137-155.
Alifiah, M.N., Salamudin , N.,Ahmad, I. , 2011. Revisiting Financial Distress Prediction in the Development Sector in Malaysia, Business Management Quarterly Review 2, p.25-38.
Barney, J.B., 1991. Firm Resources and Sustained Competitive Advantage, Journal of Management 17, p. 99-120.
Baltagi BH., 2005. Econometric Analysis of Panel Data, John Wiley and Sons, West Sussex. Ben, A.A. (2012), The impact of financing decision on the shareholders’ value creation. Journal of Business
Study Quarterly, 101: 1-14. Blundell, R., Bond, S., 1998. Initial Conditions and Moment Restrictions in Dynamic Panel Data Models”. Journal of Econometrics 87:115-143. Carmeli, A., Tishler A., 2006. The Relative Importance of the Top Management Team’s Managerial Skills,
International Journal of Manpower 27, p. 9-36. Chen, H.L., Hsu W.T., Huang, Y.S., 2010. Top Management Team Characteristics, R&D Investment and
Capital Structure in the I.T Industry, Small Business Economics 35, p.319-333. Coleman A.K., 2007. The Impact of Capital structure on the Performance of Micro-finance Institutions. Journal of Risk Finance 8, p. 56-71.
Dimitrov V., Jain P.C., 2008. Value Relevance of Changes in Financial Leverage beyond Growth in Assets and GAPP Earnings, Journal of Accounting and Finance 23, p.199-222.

115 B.T. Matemilola et al. / Procedia Economics and Finance 7 ( 2013 ) 103 – 115
Escriba-Esteve, A., Sanchez-Peinado L., Sanchez-Peinado E., 2009. The Influence of Top Management Teams in the Strategic Orientation and Performance of Small and Medium-sized Enterprises, British Journal of Management 20, p. 581-597.
Frank, M.Z, Goya K.V., 2008. Trade-off and Pecking Order Theories of Debt, Handbook of Corporate Finance: Empirical Corporate Finance 2, p. 1-82. George, T, Hwang, C., 2007. Leverage, Financial Distress and the Cross-section of Stock Returns. Working
paper, University of Houston. Gomes, J., Schmid, L., 2009. Levered Returns, Journal of Finance 65, p. 467-494. Gordon, M.J., 1959. Dividends, Earnings and Stock Prices, Review of Economics and Statistics 41, p. 99-105. Hambrick, D., Mason P., 1984. Upper-echelon: The Organization as a Reflection of its Top Managers.
Academy of Management Review 9: 193-206. Herrmann, P., Datta, D.K., 2005. Relationships between Top Management Team Characteristics and
International Diversification: Empirical Investigation, British Journal of Management 16, p.69-78. Hull, R.M., Michelson, S.E., 1999. The Information Contents of Senior Offerings that Reduces Junior
Securities. Quarterly Review of Economics and Finance 39, p. 419-438. Jacobson, R., 1990. Unobservable Effects and Business Performance, Marketing Science 9, p. 74-85. Korteweg, A., 2004. Financial Leverage and Expected Stock Returns: Evidence from Pure Exchange Offers.
Working paper, University of Chicago Graduate School of Business. Lintner, J., 1956. Distribution of Incomes of Corporations among Dividend, Retained Earnings and Taxes,
American Economic Review 46 (2): 97-102. Mahdi, S., Kumars, B., 2009. Study of the Relationship between Capital structure and Performance: Evidence
from Iran. International Journal of Business and Management, 4, p. 97-102. Masulis, R., 1983. The Impact of Capital Structure Change on Firm’s Value, some Estimates, Journal of
Finance 38, p. 107-126. Matemilola, B.T, Bany-Ariffin, A.N., Azman-Saini, W.N.W., 2012. Financial Leverage and Shareholder’s
Required Returns: Evidence from South Africa Corporate Sector, Transition Studies Review 18, p. 601-602.
Modigliani, F., Miller, M.H., 1958. The Cost of Capital, Corporation Finance and the Theory of Investment. American Economic Review 48, p. 261-97. Modigliani, F., Miller, M.H., 1963. Corporate Income Taxes and the Cost of Capital: A Correction, American Economic Review 53, p. 433-43.
Muradoglu, G.S., Sivaprasad, S., 2009. Firm Leverage as an Investment Strategy. Working Paper, Cass Business School, London.
Pandey, I.M., 2005. What Drives the Shareholder Value? Asian Academy of Management Journal of Accounting and Finance 1, p. 105-120.
Penman , S., Richardson, S., Tuna, I., 2007. The Book-to-price Effect in Stock Returns: Accounting for Leverage. Journal of Accounting Research 45 (2): 427-467.
Rajan , R., Zingales, L., 1995. What Do We Know about Capital structure? Some Evidence from International Data, Journal of Finance, 50, p.1421-1460.
Sargan, D., 1958. The Estimation of Economic Relationships using Instrumental Variables. Econometrica 26 p. 393-415.
Wally, S., Baum ,J., 1994. Personal and Structural Determinants of the Pace of Strategic Decision Making. Academy of Management Journal 37, p. 932-956.
Wally, S., Becerra, M., 2001. Top Management Team Characteristics and Strategic Changes in International Diversification: the Case of U. S. Multinationals in the European Community, Group & Organizational Management 26, p. 165-187.
White, H., 1980. A Heteroskedasticity Consistent Covariance Matrix Estimation and a Direct Test of Heteroskedasticity, Econometrica 48, p. 817-838.
Related Documents