University of New Hampshire University of New Hampshire Scholars' Repository Doctoral Dissertations Student Scholarship Spring 1997 Impact of land-use and climatic changes on hydrology of the Himalayan Basin: A case study of the Kosi Basin Keshav Prasad Sharma University of New Hampshire, Durham Follow this and additional works at: hps://scholars.unh.edu/dissertation is Dissertation is brought to you for free and open access by the Student Scholarship at University of New Hampshire Scholars' Repository. It has been accepted for inclusion in Doctoral Dissertations by an authorized administrator of University of New Hampshire Scholars' Repository. For more information, please contact [email protected]. Recommended Citation Sharma, Keshav Prasad, "Impact of land-use and climatic changes on hydrology of the Himalayan Basin: A case study of the Kosi Basin" (1997). Doctoral Dissertations. 1961. hps://scholars.unh.edu/dissertation/1961

Welcome message from author
This document is posted to help you gain knowledge. Please leave a comment to let me know what you think about it! Share it to your friends and learn new things together.
Transcript

University of New HampshireUniversity of New Hampshire Scholars' Repository
Doctoral Dissertations Student Scholarship
Spring 1997
Impact of land-use and climatic changes onhydrology of the Himalayan Basin: A case study ofthe Kosi BasinKeshav Prasad SharmaUniversity of New Hampshire, Durham
Follow this and additional works at: https://scholars.unh.edu/dissertation
This Dissertation is brought to you for free and open access by the Student Scholarship at University of New Hampshire Scholars' Repository. It hasbeen accepted for inclusion in Doctoral Dissertations by an authorized administrator of University of New Hampshire Scholars' Repository. For moreinformation, please contact [email protected].
Recommended CitationSharma, Keshav Prasad, "Impact of land-use and climatic changes on hydrology of the Himalayan Basin: A case study of the KosiBasin" (1997). Doctoral Dissertations. 1961.https://scholars.unh.edu/dissertation/1961

INFORMATION TO USERS
This manuscript has been reproduced from the microfilm master. UMI
films the text directly from the original or copy submitted. Thus, some
thesis and dissertation copies are in typewriter free, while others may be
from any type o f computer printer.
The quality of this reproduction is dependent upon the quality of the
copy submitted. Broken or indistinct print, colored or poor quality
illustrations and photographs, print bleedthrough, substandard margins,
and improper alignment can adversely afreet reproduction.
In the unlikely event that the author did not send UMI a complete
manuscript and there are missing pages, these will be noted. Also, if
unauthorized copyright material had to be removed, a note will indicate
the deletion.
Oversize materials (e.g., maps, drawings, charts) are reproduced by
sectioning the original, beginning at the upper left-hand comer and
continuing from left to right in equal sections with small overlaps. Each
original is also photographed in one exposure and is included in reduced
form at the back o f the book.
Photographs included in the original manuscript have been reproduced
xerographically in this copy. Higher quality 6” x 9” black and white
photographic prints are available for any photographs or illustrations
appearing in this copy for an additional charge. Contact UMI directly to
order.
UMIA Bell & Howell Information Company
300 North Zeeb Road, Ann A'toor MI 48106-1346 USA 313/761-4700 800/521-0600
Reproduced with permission of the copyright owner. Further reproduction prohibited without permission.

Reproduced with permission of the copyright owner. Further reproduction prohibited without permission.

IMPACT OF LAND-USE AND CLIMATIC CHANGES ON HYDROLOGY OF THE HIMALAYAN BASIN: A CASE STUDY OF THE KOSI BASIN
BY
KESHAV PRASAD SHARMA Diploma in Science, Tribhuvan University, 1975
Degree in Atmospheric Physics, Tribhuvan University, 1979 Master of Technology in Hydrology, University o f Roorkee, 1982
DISSERTATION
Submitted to the University of New Hampshire in Partial Fulfillment of
the Requirements for the Degree of
Doctor of Philosophy
in
Earth Sciences
May, 1997
Reproduced with permission of the copyright owner. Further reproduction prohibited without permission.

UMI Number: 9730844
Copyright 1997 by Sharma, Keshav PrasadAll rights reserved.
UMI Microform 9730844 Copyright 1997, by UMI Company. All rights reserved.
This microform edition is protected against unauthorized copying under Title 17, United States Code.
UMI300 North Zeeb Road Ann Arbor, MI 48103
Reproduced with permission of the copyright owner. Further reproduction prohibited without permission.

ALL RIGHTS RESERVED
c 1997
Keshav Prasad Sharma
Reproduced with permission of the copyright owner. Further reproduction prohibited without permission.

This dissertation has been examined and approved.
.W-t- [J j HDissertation Director, Berrien Moore III,Director of the Institute for the Studv of Earth.
*
Oceans, and Space.
Charles S. Vorosmarty, Research Assistant Professor of Eartnj Sciences and Earth, Oceans, and Space.
Professor of Hydrologyand Water Resources.
Paul A. Mavewski, Professor of Glaciology in Earth Sciences and Earth, Oceans, and Space.
M atthew T ^a^^A ss^n tP rofessor of Hydrogeology.
May 9 , L997 Date
Reproduced with permission of the copyright owner. Further reproduction prohibited without permission.

ACKNOWLEDGMENTS
Timely completion of this dissertation work was possible only through support,
guidance, constructive comments, and continuous encouragement that I received from my
advisor Professor Berrien Moore III throughout this research work. I am grateful to all
the members o f my committee for allowing me to work with them and for their thought
ful comments on the draft. I am particularly indebted to Dr. Charles J. Vorosmarty and
Professor S. L. Dingman for their help, guidance, and several discussions. I acknowledge
the enormous help provided by Dr. Sharad. P. Adhikary and Kiran Shankar in Nepal and
Karen Bushold at the University of New Hampshire.
Several colleagues and staff at the University of New Hampshire and at the De
partment of Hydrology and Meteorology in Nepal have helped me in different aspects of
research work, field work and data collection. I am particularly thankful to: Dilip
Gautam, Narendra Khanal, Dirk Metzko, and W. Laible in Nepal and Balazs Fekete and
Nancy Voorhis at the University of New Hampshire. Several pieces of information,
obtained from Annette Schloss, Fay Rubin, John Canfield, Alastair Lough, and Scott
Robeson, and discussions with Dr. Janet Campbell and Professor Loren D. Meeker
helped to refine some of the chapters of this dissertation.
I would like to acknowledge the Department of Hydrology and Meteorology,
Kathmandu for making hydrological and meteorological data available for this study.
The department also made available different facilities for carrying out field and labora
tory works at its central office in Kathmandu and at the basin office in Dharan. The
iv
Reproduced with permission of the copyright owner. Further reproduction prohibited without permission.

German Development Service (GDS) provided partial support for some of the field
activities and travels. Some supplementary hydrological and meteorological data were
obtained from Eastern Region Road Maintenance Project, Dharan. Forest Resource
Information System Project of the Department of Forest, Nepal provided land-use data
for eastern Nepal in digital format.
Lastly, I want to express my thanks to all the members of my family for supporting
me with their love and affection during the long period of research work. Many thanks
are due to my daughter Kalandika who helped me to enter the volumes of data into
computer.
This work has been supported by the NASA Mission to Planet Earth grant number
NAGW 2669. Most of the researches were carried out at the Complex Systems Research
Center, Institute for the Study of Earth, Oceans, and Space, University of New Hamp
shire.
V
Reproduced with permission of the copyright owner. Further reproduction prohibited without permission.

TABLE OF CONTENTS
ACKNOWLEDGMENTS......................................................................................... ivLIST OF TA BLES................................................................................................... xLIST OF FIG URES........................................................................................... xiiiGLOSSARY OF ABBREVIATION..................................................................... xviiABSTRACT.......................................................................................................... xx
CHAPTER PAGE
I. INTRODUCTION...................................................................................... 1Background................................................................................................. 3Objectives.................................................................................................. 7Research Questions..................................................................................... 7Scope and Limitations of the Study............................................................. 8
II STUDY AREA.......................................................................................... 11Basin Characteristics.................................................................................. 14Hydrometeorological Characteristics........................................................... 23
III REVIEW OF RELATED LITERATURE.............................................. 27Land-use changes in the Himalayas................................................................ 27
Catastrophic degradation.............................................................. 28Normal Processes.......................................................................... 29Greening trend............................................................................. 31Realities........................................................................................ 32
Land-use and climate change................................................................... 33Sensitivity o f the Himalayan clim ate......................................................... 34Discussion................................................................................................ 37
IV COLLECTION AND ANALYSIS OF DATA............................................ 39Meteorological and hydrological d a t^ ....................................................... 39Land-use and anthropogenic d a t a .............................................................. 44Digital elevation m odel............................................................................ 48Data quality ............................................................................................... 49
Instrumentation and Measurements................................................. 50N etw ork ......................................................................................... 51Missing records............................................................................ 53
Homogeneity of time series...................................................................... 54Test o f Normality......................................................................... 55Test o f Randomness....................................................................... 56
Discussion.................................................................................................. 58V METHODOLOGY..................................................................................... 60
vi
Reproduced with permission of the copyright owner. Further reproduction prohibited without permission.

Statement of Hypotheses............................................................................ 60Characteristics of Time Series.................................................................... 61Analysis of Trend........................................................................................ 62
Parametric Method........................................................................ 62Nonparametric Method.................................................................... 63
Modeling.................................................................................................... 66Lumped Approach............................................................................... 66
Basinwide Water Balance........................................................ 66Statistical Approach........................................................ 68
Distributed Deterministic Model.................................................... 68VI ANTHROPOGENIC CHANGES.............................................................. 70
Population Pressure...................................................................................... 70Human Population........................................................................ 70Livestock Population..................................................................... 73
Land-use Changes....................................................................................... 75Higher Elevation Z o n e ...................................................................... 75Lower Elevation Z o n e .................................................................. 75
Discussion.................................................................................................... 78VII HYDRO-CLIMATIC CHANGES............................................................. 81
Temperature Changes................................................................................. 81Temperature Trend in Kathmandu...................................................... 81Temperature Trend in the Kosi basin.............................................. 84
Precipitation Changes................................................................................. 106Precipitation Trend in Kathmandu................................................ 106Precipitation Trend in the Kosi Basin............................................... 107
River Discharge Changes........................................................................ 118Discussion.............................................................................................. 129
V in MODELING HYDROMETEOROLOGIC CHARACTERISTICS . . . 131Modeling Precipitation............................................................................. 131Modeling Temperature............................................................................ 145Modeling Evapotranspiration................................................................... 146
Water Balance.............................................................................. 146Empirical Equations...................................................................... 147
Temperature-Based Methods........................................... 147Hargreaves Equation........................................................ 147Penman Equation-Based Method.......................................... 148
Pan-Based M ethod....................................................................... 148Comparison................................................................................. 149
Discussion................................................................................................ 154IX WATER BALANCE............................................................................... 156
Discussion................................................................................................ 162X HYDROLOGIC RESPONSE................................................................... 164
Scenarios................................................................................................. 164Temperature Scenarios................................................................ 164Precipitation Scenarios................................................................ 165
vii
Reproduced with permission of the copyright owner. Further reproduction prohibited without permission.

Evapotranspiration Scenarios...................................................... 166Land-use Change Scenarios......................................................... 166
Water Balance under Changed Scenarios............................................... 167Statistical Assessment............................................................................... 170Discussion................................................................................................ 173
XI HYDROLOGIC MODELING................................................................... 175Model Parameters....................................................................................... 175
Soil Texture.................................................................................. 175Vegetative Cover......................................................................... 179Temperature................................................................................. 179
Precipitation.............................................................................................. 180Model Results............................................................................................ 181Discussion.................................................................................................. 185
XII IMPACT ON SEDIMENT FLUX........................................................ 187Sediment Information............................................................................... 189Analysis of Trend....................................................................................... 190Response to Land-use and Climatic Changes............................................. 191Discussion................................................................................................. 195
XIII STRATEGY FOR MONITORING HIMALAYAN HYDROLOGY. . . 197Existing Infrastructure .................................................................... 197Shortcomings........................................................................................... 199Strategy...................................................................................................... 200Discussion................................................................................................ 203
XIV CONCLUSIONS AND RECOMMENDATIONS...................................... 205REFERENCES.................................................................................................. 209
APPENDICESA. METEOROLOGICAL STATONS IN THE KOSI BASIN......................... 226B. HYDROMETRIC STATONS IN THE KOSI BA SIN ......................... 228C. AVERAGE MONTHLY AND ANNUAL PRECIPITATION...................... 229D. AVERAGE MONTHLY AND ANNUAL TEMPERATURE....................231E. AVERAGE MONTHLY AND ANNUAL DISCHARGE.......................... 232F. AVERAGE MONTHLY AND ANNUAL CLASS A PAN EVAPORATION
RATE.......................................................................................................... 233G. AVERAGE MONTHLY AND ANNUAL SUNSHINE DURATION. . 233H. AVERAGE MONTHLY AND ANNUAL WIND SPEED .........................233I. ANNUAL PRECIPITATION FOR SELECTED STATIONS....................234J. ANNUAL TEMPERATURE FOR SELECTED STATIONS.................... 235K. ANNUAL DISCHARGE FOR SELECTED STATIONS..................... 236L. DOUBLE MASS-CURVE OF PRECIPITATION FOR SELECTED
STATONS............................................................................................... 237M. DOUBLE MASS-CURVE OF DISCHARGE FOR SELECTED
STATIONS.............................................................................................. 238N. Z-STATISTICS OF MONTHLY AND ANNUAL NONPARAMETRIC
TRENDS.................................................................................... 240
viii
Reproduced with permission of the copyright owner. Further reproduction prohibited without permission.

O. COMPUTATION OF AVERAGE BASIN PRECIPITATION................... 243P. COMPUTATION OF EVAPOTRANSPIRATION CHANGES DUE
TO CHANGE IN CLIMATE AND LAND-USE................................ 244Q. OUTLINE: PROPOSED HIMALAYAN BENCH-MARK BASIN..............247
ix
Reproduced with permission of the copyright owner. Further reproduction prohibited without permission.

LIST OF TABLES
Table Page
II-1 Comparative chart showing the average annual hydrological and sediment delivery characteristics of the Kosi River, major Himalayan rivers, and the largest (the Amazon), the longest (the Nile), and the most sediment laden (the Huanghe) river of the world....................................................................... 15
II-2 Characteristics of the major physiographic divisions o f the Kosi basin. . . 21
VI-1 Area and population density in the districts of Nepal and the Tibet autonomous region of China that lie in the Kosi basin.............................................. 72
VI-2 Livestock population in the districts of Nepal and the Tibet autonomous region of China that lie in the Kosi basin...........................................................74
VI-3 Land-use in the Kosi basin in the late 1970s...................................................76
VI-4 Land-use in the Kosi basin below 4000 m in the late 1970s....................... 77
VI-5 Comparison of forest cover in the Mahabharat and the middle mountain regionof the Kosi basin during 1964-65 and 1978-79........................................... 77
VII-1 Statistical significance of maximum temperature trend in Kathmandu at two locations during two different periods....................................................... 83
ViI-2 Statistical significance of minimum temperature trend in Kathmandu at two locations during two different periods......................................................... 84
VTI-3 Statistical significance of maximum temperature in three selected locations in Kosi basin. Period of record is from 1962 through 1993 for stations 1206 and 1303. The period of record for Station No. 1405 is from 1962 through 1992.. . ......................................................................................................................... 85
VII-4 Statistical significance of minimum temperature trend in three selected locations in the Kosi basin. Period of record is from 1962 through 1993 for stations 1206 and 1303. The period of record is 1962 through 1992 for station 1405. . . ......................................................................................................................... 85
X
Reproduced with permission of the copyright owner. Further reproduction prohibited without permission.

VII-5 Statistical significance of the trend of average temperature in the Kosi basin for selected stations...................................................................................... 87
VII-6 Statistical significance: heterogeneity of basinwide nonparametric maximum temperature, minimum temperature, and average temperature trend in the Kosi basin..................................................................................................... 88
Vn-7 Statistical significance of the trend of precipitation in the Kosi basin at stations with relatively long record length.............................................................. 107
Vn-8 Statistical significance: heterogeneity of basinwide nonparametric precipitation trend in the Kosi basin............................................................................... 109
VII-9 Statistical significance of trend for discharge recorded on the Kosi River and the Tamor River...............................................................................................118
VII-10 Statistical significance: heterogeneity of basinwide nonparametric discharge trend in the Kosi basin.................................................................................... 119
VIII-1 Univariate statistics of locational and topographical variables used in multivariate regression with precipitation...............................................................134
VIII-2 Coefficient of determination and p-values for potential predictors (applied individually), and mean monthly and seasonal precipitation over the Kosi basin. .........................................................................................................................135
VIII-3 Coefficient of determination and p-values for potential predictors (applied individually), and mean monthly and seasonal precipitation over the Kosi basin for observation stations lying below 2800 m................................................. 139
VIII-4 Statistical models for topographical variation of average precipitation over the Kosi basin................................................................................................... 142
VIII-5 Alternate statistical models for topographical variation of average precipitation over the Kosi basin for winter months....................................................... 143
VIII-6 Monthly temperature models for the Kosi basin...................................... 145
VIII-7 Average monthly Class A pan evaporation and potential evapotranspiration at 1700 m estimated by different methods.................................................... 149
VTII-8 Relation between elevation and monthly and annual evaporation.................153
IX-1 Average annual water balance of the Kosi River and its major tributaries. . 158
XI
Reproduced with permission of the copyright owner. Further reproduction prohibited without permission.

EX-2
EX-3
X-l
X-2
X-3
X-4
XI-1
XI-2
XI-3
XII-1
Long term water balance of the Kosi basin and its northern dry area and southern humid area..........................................................................................159
Comparison of the estimates of average annual evapotranspiration or evaporation for a selected location in the Kosi basin using different methods. . . 160
Expected change in runoff ratio in the Kosi basin in different scenarios of temperature, precipitation, and land-use changes. The changes in runoff ratio are computed for the wet part (w = 0.82), dry part (w = 0.67), and average condition (w = 0.72) of the basin.................................................................... 169
Land-use and hypsometric data o f the Kosi basin and its major gauged tributaries..............................................................................................................171
Wetness index obtained by gridding the point precipitation values over the basin and sub-basins....................................................................................... 172
Hypsometric and land-use classes of the basin having the highest correlation with discharge............................................................................................... 172
Classification of soil texture for WBM input......................................... 176
Weights used for individual stations to compute basin precipitation. . . . 180
Actual runoff and water balance components of Tamor River basin computed using WBM.....................................................................................................181
Parametric and nonparametric trend of sediment load on the Kosi River at Chatara................................................................................................... 191
x ii
Reproduced with permission of the copyright owner. Further reproduction prohibited without permission.

Figure
H-l
II-2
n-3
II-4
n-5
II-6
n-7
II-8
IV-1
IV-2
IV-3
rv-4
VI-1
VII-1
LIST OF FIGURES
Page
Study area showing geographical locations and major tributaries of the Kosi River. The Kosi River forms and enters into the Gangetic plain at Chatara. 12
Major components of annual hydrological cycle of the Kosi basin in relation to the continent and the globe.................................................................... 16
Topographical variation in the Kosi basin................................................... 18
Relief map of the Kosi basin derived from DEM....................................... 19
Profile of the Kosi River and its tributaries................................................ 20
Simplified schematic diagram of hydrometeorological, topographical, and geological characteristics of the Kosi basin................................................ 22
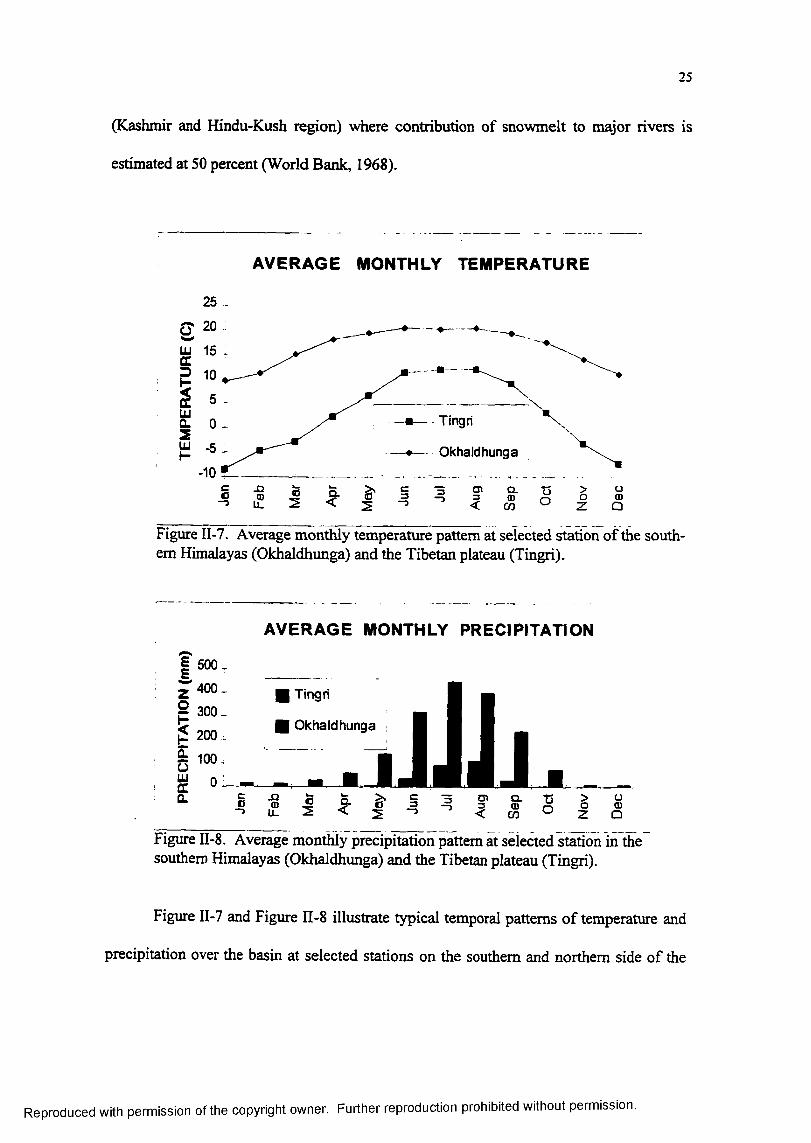
Average monthly temperature pattern at selected station of the southern Himalayas (Okhaldhunga) and the Tibetan plateau............................................. 25
Average monthly precipitation pattern at selected station of the southern Himalayas (Okhaldhunga) and the Tibetan plateau....................................... 25
Meteorological network in the Kosi basin. Appendix A contains the list of the stations......................................................................................................... 42
Gauged sub-basins that contribute to the Kosi River. Appendix B contains the station description.........................................................................................43
Land-use in the Mahabharat and the middle hills and interior Himalayan areas of eastern Nepal before 1965..................................................................... 45
Major land-use in the Kosi basin in 1978-79............................................. 46
Population trend in (a) Nepal and (b) the Kosi basin..................................................... 71
Original time series of monthly maximum and minimum temperature and their seasonal, trend cycle, and irregular components: (a) Maximum temperature in
X I I I
Reproduced with permission of the copyright owner. Further reproduction prohibited without permission.

Kathmandu (Indian Embassy, Station No. 1014). (b) Maximum temperature in Kathmandu (Airport, Station No. 1030) (c) Maximum temperature in Okhaldhunga (Station No. 1206) (d) Maximum temperature in Chainpur (Station No. 1303) (e) Maximum temperature in Taplejung (Station No. 1405) (f) Minimum temperature in Kathmandu (Indian Embassy, Station No. 1014) (g) Minimum temperature in Kathmandu (Airport, Station No. 1030) (h) Minimum temperature in Okhaldhunga (Station No. 1206) (i) Minimum temperature in Chainpur (Station No. 1303) (j) Minimum temperature in Taplejung (Station No. 1405)......................................................................................... 89
VII-2 Minimum, maximum, and average temperature anomaly in Kathmandu. . 99
VII-3 Comparison of minimum, maximum, and average temperature anomalies for Chainpur, Okhaldhunga, and Taplejung.......................................................100
VIM Comparison of average temperature anomaly of Kathmandu, the eastern Nepal, the Kosi basin, and the globe.................................................... 101
VII-5 Trend of monthly maximum temperature in the Kosi basin computed usingparametric method.......................................................................... 102
VII-6 Trend of monthly maximum temperature in the Kosi basin computed usingnonparametric method................................................................................ 103
VII-7 Trend of monthly minimum temperature in the Kosi basin computed using parametric method........................................................................................... 104
VII-8 Trend of monthly minimum temperature in the Kosi basin computed using nonparametric method..................................................................................... 105
Vn-9 Original time series of precipitation in Kathmandu and its seasonal, trend cycle, and irregular components..........................................................................110
VII-10 Trend cycle component of monthly precipitation: (a) Gumthang (b) Nawalpur (c) Dolalghat (d) Charikot (e) Melung (f) Chaurikharka (g) Pakamas (h) Aise- lukharka (I) Okhaldhunga (j) Khotang Bazaar (k) Num (1) Chainpur (m) Munga (n) Dhankuta (o) Mulghat (p) Tribeni (q) Chatara (r ) Dingla (s) Lungthung (t) taplethok................................................................................... I l l
VII-11 Trend of seasonal precipitation in the Kosi basin computed using parametric method............................................................................................................. 116
VII-12 Trend of monthly precipitation in the Kosi basin computed using nonparametric method........................................................................................................ 117
x iv
Reproduced with permission of the copyright owner. Further reproduction prohibited without permission.

VII-13 Original time series of discharge and its seasonal, trend cycle and irregular components: (a) Kosi River at Chatara (b) Tamor River at Mulghat (c) Dudhkosi at Rabuwa (d) Sunkosi at Kampughat and (e) Balephi Khola at Jal- bire................................................................................................................ 120
VII-14 Trend of monthly discharge in the Kosi basin computed using parametric method........................................................................................................ 125
VII-15 Trend of monthly discharge in the Kosi basin computed using nonparametric method.............................................................................................................126
VII-16 Trend of annual temperature, annual precipitation, and annual discharge in the Kosi basin computed using parametric method............................................127
VII-17 Overall trend of temperature, precipitation and discharge in the Kosi basin computed using nonparametric method.......................................................128
VIII-1 Longitudinal profile of precipitation (monsoon and annual) and elevation in north-south direction in the southern part of the Kosi basin (Biratnagar to Basantapur). The area considered in this figure extends beyond 45 km to the South from the study area............................................................................. 133
Vni-2 Relation between annual precipitation and elevation in the Kosi basin. Thecross symbols indicate the values excluded in computation....................... 136
VDI-3 Variation of monthly (selected months), annual, and seasonal precipitation in the Kosi basin with respect to elevation.........................................................137
VIII-4 Variation of monthly (selected months), annual, and seasonal precipitation in the Kosi basin with respect to slope.............................................................138
VIII-5 Average annual temperature in the Kosi basin based on an annual lapse rate of 5.9 degree Celsius per kilometer (see Table VIII-6)..................................... 144
VIII-6 Monthly pan evaporation at Tarahara, Okhaldhunga, and Tingri.................151
VIII-7 Relation between elevation and Class A pan evaporationrecorded in different parts of Nepal.............................................................................................. 152
IX-1 Average monthly precipitation and runoff budget for: (a) the humid south of the Kosi basin, (b) the dry north o f the Kosi basin, and (c) average for the Kosi basin.............................................................................................................. 161
XI-1 WBM input: layers of topography, land-use, and soil texture.......................177
X V
Reproduced with permission of the copyright owner. Further reproduction prohibited without permission.

XI-2 WBM input: layers of temperature, precipitation, and potential evapotranspiration for a selected dry and wet month......................................................... 178
XI-3 WBM output: layers of actual evapotranspiration, soil moisture, and runoff for a selected dry and wet months...................................................................... 182
XI-4 Actual average runoff and the runoff computed by WBM for the Tamor Riverbasin.................................................................................................................183
XI-5 Expected runoff change in the Tamor River basin in different scenarios of temperature and precipitation changes: (a) existing land-use, (b) change of all lands below 4000 m into forest cover, and (c) change of all lands below 4000 m into agriculture land..................................................................................... 184
XII-1 Annual sediment load measured on the Kosi River at Chatara...................190
XH-2 Predicted change in sediment delivery of the Kosi basin in possible scenarios of (a) change in precipitation and agriculture area and (b) change in snow area. ..........................................................................................................................194
x v i
Reproduced with permission of the copyright owner. Further reproduction prohibited without permission.

GLOSSARY OF ABBREVIATION
a Significance levelAA Agriculture area (km2)AG Alpine grazing land (km2)asl Above sea levelC Cyclic componentCBS Central Bureau of StatisticsCG Cold-tropical grazing land (km2)CSRC Complex Systems Research Centercdf Cumulative distribution functionCF Conifer forest (km2)CSRC Complex Systems Research CenterCWC Central Water CommissionD Detention storage (mm)d Fraction of vegetative area of a catchmentDCW Digital Chart of the WorldDD Degree decimalDEM Digital Elevation ModelDEM30 Digital Elevation Model with 30 Arc-Sec
ResolutionDHM Department of Hydrology and MeteorologyDTED Digital Terrain Elevation DataE Total loss that includes ET and interception (mm)ELV Elevation (m)F F-StatisticsFAO Food and Agriculture Organizatione Evaporation fractione s Saturation vapor pressure (mb)ET Evapotranspiration (mm)FAO Food and Agriculture OrganizationFRISP Forest Resource Information System ProjectGCM Global Climate Model(s)GDS German Development ServiceGELV Grid elevation (m)GEN Glaciological Expedition in NepalGLOF Glacier Lake Outburst FloodGTZ German Agency for Technical CooperationHF Hardwood and mixed forest (km2)HMG His Majesty’s Government
Reproduced with permission of the copyright owner. Further reproduction prohibited without permission.

I Irregular componentICIMOD International Centre for Integrated Mountain
DevelopmentIA Intense agriculture area (km2)IMD India Meteorology DepartmentIS Ice and snow area (km2)KM1 Area between 500 m to 1 km (km2)KM2 Area between 1 km to 2 km (km2)KM3 Area between 2 km to 3 km (km2)KM4 Area between 3 km to 4 km (km2)KM5 Area between 4 km to 5 km (km2)KM6 Area between 5 km to 6 km (km2)KM9 Area between 6 km to 9 km (km2)L Lake (km2)LA Light agriculture (km2)LAT LatitudeLRMP Land Resources Mapping ProjectLON LongitudeLT Local TimeLT500 Area less than 500 m (km2)MA Medium agriculture (km2)MAB Man and BiosphereN Number of observationns NonsignificantP Precipitation (mm)p Precipitation fractionPET Potential Evapotranspiration (mm)p-value ProbabilityR2 Coefficient of determinationRB Rock and boulders (km2)S Seasonal componentS Shrub (km2)SAINDX Slope-aspect indexSG Sub-tropical grazing land (km2)SGHU Snow and Glacier Hydrology UnitSy Sediment yield (million ton)T Temperature (°C)t t-statisticsTU Tribhuvan Universityu/s UpstreamUNEP/GRID United Nations Environmental Program/Global
Resource Information Database UNDP United Nations Development ProgramUNH University of New HampshireVar Variance
xv ii i
Reproduced with permission of the copyright owner. Further reproduction prohibited without permission.

W Runoff ratioWEC Water and Energy CommissionWMO World Meteorological OrganizationZ Elevation (m)
x ix
Reproduced with permission of the copyright owner. Further reproduction prohibited without permission.

ABSTRACT
IMPACT OF LAND-USE AND CLIMATIC CHANGES ON HYDROLOGY OF THE HIMALAYAN BASIN: A CASE STUDY OF THE KOSI BASIN
By
Keshav Prasad Sharma University of New Hampshire, May 1997
Land-use and climatic changes are of major concern in the Himalayan region be
cause of their potential impacts on a predominantly agriculture-based economy and a
regional hydrology dominated by strong seasonality. Such concerns are not limited to
any particular basin but exist throughout the region including the downstream plain areas.
As a representative basin of the Himalayas, we studied the Kosi basin (54,000 km2)
located in the mountainous area of the central Himalayan region. We analyzed climatic
and hydrologic information to assess the impacts of existing and potential future land-use
and climatic changes over the basin.
The assessment of anthropogenic inputs showed that the population grew at a
compound growth rate of about one percent per annum over the basin during the last four
decades. The comparison of land-use data based on the surveys made in the 1960s, and
the surveys of 1978-79 did not reveal noticeable trends in land-use change. Analysis of
meteorological and hydrological trends using parametric and nonparametric statistics for
monthly data from 1947 to 1993 showed some increasing tendency for temperature and
precipitation. Statistical tests of hydrological trends indicated an overall decrease of
discharge along mainstem Kosi River and its major tributaries. The decreasing trends of
streamflow were more significant during low-flow months. Statistical analysis of homo-
XX
Reproduced with permission of the copyright owner. Further reproduction prohibited without permission.

geneity showed that the climatological as well as the hydrological trends were more
localized in nature lacking distinct basinwide significance. Statistical analysis of annual
sediment time series, available for a single station on the Kosi River did not reveal a
significant trend.
We used water balance, statistical correlation, and distributed deterministic mod
eling approaches to analyze the hydrological sensitivity of the basin to possible land-use
and climatic changes. The results indicated a stronger influence of basin characteristics
compared to climatic characteristics on flow regime. Among the climatic variables,
hydrologic response was much more sensitive to changes in precipitation, and the re
sponse was more significant in the drier areas of the basin. Rapid retreat of glaciers due
to potential global wanning was shown to be as important as projected deforestation
scenarios in regulating sediment flux over the basin.
xxi
Reproduced with permission of the copyright owner. Further reproduction prohibited without permission.

CHAPTER I
INTRODUCTION
Two thousand and four hundred kilometers long and 150 to 400 km wide, the Hi
malayan ranges are the biggest and the tallest mountain structure on Earth. These high
mountains not only provide the sources for several perennial rivers but also influence the
climate, water cycle, and energy budget of the region. Along with the Tibetan plateau,
massive mountains of the Himalayas, extending up to the tropopause, play major role in
the generation of monsoons (Hahn & Manabe, 1975; Murakami, 1987), the most exten
sive and the most dynamic weather system on Earth. The agriculture-based socio
economy of the region is vulnerable to any unfavorable climatic change over the Himala
yas (Swaminathan, 1987). Such impacts have the potential for directly affecting the lives
of almost one tenth of the world’s population living in the Himalayas and its adjacent
plains.
Influence of population pressure on land resources coupled with the potential im
pacts of global climate change on regional water cycle is a major concern; however, the
nature of such impacts has been a subject of debate among scientists. There are large
uncertainties regarding the scale of water cycle impacts due to changes in land use (Bosch
& Hewlett, 1982) as the impacts depend on several governing factors and forcing func
Reproduced with permission of the copyright owner. Further reproduction prohibited without permission.

tions. Similarly, a significant uncertainty lies in the estimate of climatic trends particu
larly at regional levels (Lamb, 1987; Mitchell & Qingcun, 1991).
Considerable concern has been expressed in the past about the degradation of the
Himalayan environment due to land use changes in the mountains (Eckholm, 1975;
Bruijnzeel, 1989). Likewise, effects of global climate change on the Himalayan region as
a whole have been drawing the significant attention of scientists. A particular concern is
the predicted rise in temperature in the central Himalayas which is generally greater than
the adjacent areas under different global wanning scenarios (Bhaskaran et al., 1995;
Schneider & Rosenberg, 1989). The ‘Himalayan dilemma5 (Ives & Messerli, 1989) as a
result of land-use changes has, hence, become a more complex dilemma with the addi
tional issue of global climatic changes.
This study considers one aspect of climate change: the water cycle. Within this
broad topic we focus upon climatic trends and riverine transport in a selected Himalayan
drainage basin: the Kosi River basin. The selection of this basin is based on the follow
ing factors:
1. Location and representativeness
• The basin lies in the central Himalayas.
• Almost half of the basin lies in the southern part o f the Himalayas and the
remaining half lies in the Tibetan plateau. These are the two distinct Hi
malayan environments representing humid and steep topography of the
South and dry plateau of the North.
Reproduced with permission of the copyright owner. Further reproduction prohibited without permission.

• Relatively longer climatologic records are available for this basin as com
pared to other similar basins of the Nepal Himalayas.
• The size of the basin is suitable for meso-scale hydrological study (Ives,
Messerli, & Thompson, 1987).
2. Environmental concerns
• The anthropogenic influence in this basin is considered to be severe
among similar Himalayan basins of the region.
• There are currently no major structural changes, such as inter-basin water
transfer or dam construction, to the flow regime of the Kosi River and its
major tributaries.
• The river system includes some of the most sediment laden rivers of the
world.
• The basin has high potential economical significance through future hy
dropower development. The basin has higher hydro-power and irrigation
potential (Sharma, 1977; Thapa, 1993) than any other basins in Nepal.
Background
Despite narrations on environmental degradation because of serious damage to
forests in the Nepalese mountains are available (Collier, 1928) long before the onset of
the population explosion (Karan, 1987) in the region, the general conception of the
government and people of Nepal supported the view that the country was rich in forest
resources. The government of Nepal even encouraged deforestation for more agricultural
land, for commercial exploitation of timber, and for reducing depredations of wild
Reproduced with permission of the copyright owner. Further reproduction prohibited without permission.

4
animals (Bajrachaiya, 1983; Collier, 1928). A closed agrarian society, high illiteracy
rate, and nonexistence o f proper governmental or nongovernmental organizations to deal
with the environment were some of the reasons behind a lack of consciousness towards
environmental conservation.
Uciyog Parishad (Development Board), constituted in 1935, was the first organ
ized government agency to be charged with several development activities including
agriculture and forest. It was followed by the establishment o f specialized agencies, such
as, Krishi Parishad (Agriculture Board) and Kathmal Report Adda (Forestry Report
Office). Despite these developments, little happened regarding the development of land-
use inventory and land-use policy until 1956 when government announced the first five
year plan (Shrestha, 1968).
The following are some of the major developments that followed as a result of the
establishment of responsible government agencies (Bajracharya, 1985; Carson, Nield,
Amatya, & Hildreth, 1986; Department of Forest, 1973).
• Nationalization of the forest in 1957.
• Forest Act 1961 with recognition of Panchayat (local community) and
private forest.
• Establishment of the Forest Resources Survey office in 1963 that initiated
the development of a forest inventory as a part of its responsibilities.
Reproduced with permission of the copyright owner. Further reproduction prohibited without permission.

• National Parks and Wildlife Protection Act of 1973 that resulted in the
establishment of several national parks in the nation including Sagarmatha
National Park in the Kosi basin.
• Panchayat Protected Forest Law of 1978 which laid down the rules and
regulations for the Panchayat forests.
• Community Forest Development Project of 1979 with assistance from
UNDP and FAO.
The above list shews that there were several changes in forest policies within a
period of two decades. These subsequent changes in forest policy were the result of
failure of some of the implemented programs. Particularly, the nationalization of forest
in 1957 is believed to be a major debacle in the forest history of Nepal (Bista, 1992). The
nationalization of the forests is blamed for the anarchy created from the transfer of
community and private forest into government forest (Carson et al., 1986; Mess-
erschmidt, 1987). Present policies of the government of Nepal are directed towards
community forest development programs. In the process, the Department of Forest
developed a master plan in 1989 and implemented the Forest Act of 1993 and the Forest
Regulation of 1995. All these policies and programs promote the extension of commu
nity forests.
As described in the previous paragraphs, little information exists about the history
of land-use change over the Kosi basin before 1950s. Some available historical accounts
of land-use change in the Kosi basin indicate that most of the potential agricultural lands
were already exploited by fanners long before this century to support the needs of the
Reproduced with permission of the copyright owner. Further reproduction prohibited without permission.

6
population (Lionel, 1970; Applegate & Gilmour, 1987). Lack of agricultural land is
believed to be the main reason behind massive migration of Nepali citizens to India,
Bhutan, and Sikkim particularly after the Nepal-Britain treaty in 1918 that ended the war
(Lionel, 1970).
In contrast to the issues of land-use changes in the Himalayan mountains, the is
sue of global climatic changes is relatively new. Furthermore, the issue of global climatic
changes has not yet received wide publicity in the region and hence the populace is
generally unconcerned. It has been an issue mainly within the scientific community both
inside and external to Nepal.
Although meteorological observations for the Indian Himalayas are available
since the last quarter of nineteenth century (Sharma, 1982), no meteorological time series
data are available for the Nepalese Himalayas before 1921. The history of secular
meteorological records in Nepal started with the establishment of a precipitation gauging
station in Kathmandu. The sole station at Kathmandu served to represent Nepal until late
1940s during which a network of precipitation gauging stations was initiated in the Kosi
basin. The hydrological and meteorological network was upgraded in the 1960s after the
establishment of the Department of Hydrology and Meteorology (DHM) in 1962. The
department is the sole agency in Nepal responsible for maintaining and upgrading the
hydrological and meteorological network, and it has been compiling, processing, and
publishing hydrological and meteorological data since its fist publication in 1966 (DHM,
various years). This study is the first assessment of the DHM data base for analyzing
basin scale climatic trend and water balances.
Reproduced with permission of the copyright owner. Further reproduction prohibited without permission.

Objectives
The main goal of this research is to analyze (1) the climatic trends in the Himala
yas on the basis secular meteorological and hydrological data and (2) the impact of land-
use and climatic changes on hydrology. The Kosi basin is chosen as representative of the
central Himalayan region. The major objectives of the research work are the assessment
and evaluation of the following:
• Land-use changes within the basin particularly during the period of secular
hydrological and meteorological data.
• Climatic changes within the secular period.
• Overall impact caused by land-use and climatic changes on the hydrology of
the basin.
• Trends in land-use and climatic changes in the basin and their possible impact
on hydrology and sediment flux.
Research Questions
This research is directed towards addressing the following major scientific ques
tions
1. Have there been significant changes in land-use area and land-use pattern in
the past?
2. What are the characteristics of such changes?
Reproduced with permission of the copyright owner. Further reproduction prohibited without permission.

8
3. Do available climatic data reveal any trend?
4. Do available hydrological and sediment data reveal any trend?
5. Has the yield of any river, stream or spring increased or decreased during low-
flow or high-flow season?
6. What differences the land-use practices bring to the sediment yield character
istics o f the main river and its major tributaries?
7. What type of basin scale hydrological responses can be expected in future in
the different scenarios of potential climatic changes and projected land-use
changes?
An implicit objective is an assessment, from the perspective of environmental
change, of the DHM sampling network.
Scope and Limitations of the Study
The study is based on the analysis of most of the available information on envi
ronmental changes as a result of anthropogenic changes. It fills a significant gap existing
in such study of highly fragile mountain environments of the world. The study attempts
to answer several environmental questions on the basis of scientific indicators such as
climate, river discharge and sediment yield of the basin. The outcome of the study is not
only relevant to the scientists involved in the Earth sciences but also to policy makers and
general public of the region.
The Kosi basin with an area of about 54,000 km2 represents a major region of the
Himalayas. Although the study falls in a category o f meso-scale for the general classifi
Reproduced with permission of the copyright owner. Further reproduction prohibited without permission.

9
cation of hydrological modeling scales, we can consider it a study of regional nature.
Despite the heterogeneity of mountain environment in the Himalayan region, most of the
meso-scale basins share many similarities in terms of physiography, bio-diversity, and
anthropogenic activities. For instance, not only the drainage basin of Narayani (32, 000
km2) and Kamali (42,000 km2), the other two major rivers of Nepal, are comparable but
also are monthly and annual discharges from these rivers (Sharma, 1993). The study has,
hence, a significant scope to extend results to other meso-scale Himalayan basins with
additional consideration of few eco-climatological differences.
Since the study deals with an environmental issue of relatively long temporal di
mension and highly heterogeneous mountain environment, it has several obvious limita
tions. The followings are brief account of some of the limitations that directly affect the
results of the study.
• Record length and missing records. Very little historical information of land-
use and climate is available before the initiation of Kosi Project in 1947. Hence, almost
all the analysis is based on relatively recent information. Besides length of the records,
most of the data suffers from missing records.
* Inadequate spatial sampling. More than half of the basin lies 4,000 m above
sea level. Except for three stations in Tibetan plateau of China, virtually no hydrological
and meteorological data is available for this region.
Reproduced with permission of the copyright owner. Further reproduction prohibited without permission.

10
• A dearth o f sediment information. Although sediment transport by rivers is an
important indicator of environmental changes within a basin, the sediment data base for
the Kosi basin is poor for proper assessment.
• Complex nature o f the study. The complex characteristic of land surface-
atmosphere interaction under the influence of anthropogenic changes results in a wide
range of uncertainties. These processes can not be studied in isolation. However, inte
grated application of available GIS tools and hydrological models has contributed to
wards reducing such shortcomings in recent years.
Reproduced with permission of the copyright owner. Further reproduction prohibited without permission.

CHAPTER II
STUDY AREA
The Kosi River with its immeasurable historic, cultural and religious value (Pande
& Goel, 1992) originates in the Tibetan plateau and the Nepalese high-lands. The river
has seven major tributaries: Indrawati, Sunkosi, Tamakosi, Likhukhola, Dudhkosi, Arun,
and Tamor (Figure II-1).
The Kosi River is known by several names in Nepal and India. The river is gen
erally known as Saptakosi, meaning seven Kosis, in Nepal. In India, it is also known as
Mahakosi meaning the great Kosi and Saharsadhara, meaning several currents as the river
spreads into several currents when it merges out of the Mahabharat mountains at Chatara
(Plate 1). Kosi is also synonymous with large river in the eastern Nepal; hence most of
the major tributaries are called Kosi, for example, Sunkosi.
Although there are several explanations about the name of the Kosi River
(Zollinger, 1979), it is believed to be derived from the name of a great rishi (hermit)
Kaushik who used to live on the bank of this river. The river is referred to as Kaushika in
Sanskrit literature.
The two major tributaries o f the Kosi River, coming down into Nepal, are known
by different names in Tibet. The Bhotekosi (upstream of Sunkosi) and the Arun are
known as Poiqu and Pumqu in Tibet. The Bhotekosi (upstream of the Tamakosi) also
Reproduced with permission of the copyright owner. Further reproduction prohibited without permission.

12
STUDY AREA
TIBET (CHINA)
IWHm,
BHUTANNEPAL
INDIA
BANGLADESH
F ig u re I I - l . S tu d y a r e a sh o w in g g e o g r a p h ic a l l o c a t i o n s a n d m ajo r t r i b u t a r i e s o f th e K o s i R iv e r . The K o s i R iv e r fo rm s and e n t e r s i n to th e G a n g e tic p la in a t C h a ta ra .
Reproduced with permission of the copyright owner. Further reproduction prohibited without permission.

13
Reproduced with permission of the copyright owner. Further reproduction prohibited without permission

14
originates in Tibetan glacier close to the Nepal-China border. These rivers are called
Bhote Kosi in Nepal as they originate in Bhot (commonly known name of Tibet in
Nepal).
Basin Characteristics
The area considered in this study is the Kosi River basin upstream of Chatara ly
ing in the mountainous region of the eastern Nepal and the southern Tibet (Figure II-l).
The study area includes all the mountainous region of the Kosi basin. The area lies
within the latitudes 26° 51 and 29° 79 and the longitudes 85° 24 and 88° 57.
Three major river systems of the world originate in the Himalayas: Ganga, Brah
maputra, and Indus. Based on the river discharge, the Brahmaputra and the Ganga rank
fourth and fifth respectively among the major rivers of the world (van der Leeden, Troise,
& Todd, 1990). The amount of sediment transported to the ocean by the Ganga-
Brahmaputra River system is the highest among the rivers of the world (van der Leeden
et al., 1990). The Kosi is the third largest river in the Himalayas based on discharge and
drainage area, with the Brahmaputra and the Indus rated first and the second. The Kosi is
the biggest river system in Nepal. Table II-1 gives some major hydrological and sedi
ment delivery characteristics of the Kosi River, its major tributaries, other major Himala
yan rivers and compares these to the largest and the longest river systems of the world.
Figure II-2 illustrates a comparison of the hydrology of the Kosi basin with the regional
and the global hydrology.
Reproduced with permission of the copyright owner. Further reproduction prohibited without permission.

15
Table II-1. Comparative chart showing the average annual hydrological and sediment delivery characteristics of the Kosi River, major Himalayan rivers and the largest (the Amazon), the longest (the Nile) and the most sediment laden (the Huanghe) river of the world.
Kosi Ganga Brahmaputra
Indus Huanghe Nile Amazon
Drainage Area (*103 km2) 53.7 1060 935 927 673 3000 5800
Length (km) 520 2510 2900 2900 5460 6650 6400
Discharge (km3/yr) 49.5 589 625 175 104 89 6700
B.unofF (mm/yr) 922 556 668 189 154 30 1160
Sediment load (million tonnnes/yr) 135 520 540 250 1100 120 1200
Sediment yield (tonnes/km2/yr) 2514 491 578 270 1634 40 207
Sedimentper unit runoff (* 1 O'3) 1.95 0.63 0.62 1.02 7.59 0.96 0.13
Data for the Kosi basin were derived from this study. Data for other basins are from: drainage area, length, and discharge (van der Leeden, Troise, & Todd, 1990) and sediment load (Milliman & Syvitski, 1992).Assumption: one cubic meter of sediment = 1.4 tons of sediment
Combined, the three major Himalayan rivers: Ganga, Brahmaputra, and Indus
contribute to about 3.6 percent of the global river discharge and 9.3 percent of the global
sediment discharge to the ocean (Figure II-2 and Table II-l). The Kosi River in the
mountainous areas of the Himalayas flows with about 0.4 percent of the runoff and eight
percent of the sediment delivered to the oceans by the three major rivers originating in the
Himalayas (Figure H-2 and Table II-1). Although the sediment:discharge ratio of the Kosi
River is lower than that of the Huanghe River (Yellow River) of China (Table II-1), the
sediment yield is the highest of the rivers of the world with similar or larger basin area
(Milliman & Syvitski, 1992).
Reproduced with permission of the copyright owner. Further reproduction prohibited without permission.

16
Globe (Land)
Asia
Kosi
Area
2.94:1:0.0012
o
«<ooo
RO = 0.0049 X 10³ km5 yr1
S = 0.14 X 10* tonnes yr'1
S = 8.3 X10* tonnes yr'1 i
P = Precipitation ET = Evapotranspiration
RO = RunoffS = Suspended SedimentS = 14 X 10* tonnes yr'1
CM©o
RO = 39 X 10* km1 yr'1
RO = 13.2 X 10* km3 yr1
F ig u re I I - 2 . M ajor com ponents o f a n n u a l h y d r o lo g ic a l c y c le o f t h e K o si b a s i n i n r e l a t i o n to th e c o n t i n e n t and th e g lo b e .
D a ta from C h a p te r IX ( th e K o s i) and v a n d e r L eeden , T r o i s e , and Todd (1 9 9 0 ) .
Reproduced with permission of the copyright owner. Further reproduction prohibited without permission.

17
Geologically, the basin is a part of the region uplifted since the Pliocene Epoch
(Sharma, 1990). The age of geological units, found in the higher Himalayan part of the
Kosi basin, is estimated as pre-Cambrian to Mesozoic and those in the middle mountains
are pre-Cambrian to upper Paleozoic (Morrison-Kundeson, 1991). The region is still
believed to be geologically active (Jhingran, 1981). Bhotekosi and Arun, the two major
tributaries of the Kosi River, are considered antecedent (Holmes, 1965; Wager, 1937).
The Kosi River at Chatara drains the highest and the steepest mountain system of
the world. The average elevation of the basin is 3,800 m but varies from 140 m at
Chatara to more than 8,000 m in the great Himalayan range. Figure II-3 and Figure II—4
illustrate the topographic pattern and the relief of the Kosi basin respectively. Sagar-
matha (Mt. Everest), the highest peak of the world, lies close to the center of the basin.
More than 60 percent of the basin lies within a circle of 100 km radius from Sagarmatha.
The basin drains the head-water area of six (Figure II-1) of the ten highest peaks of the
world including Kanchanjangha (8,598 m), Lhotse (8,516 m), Yalungkang (8,505 m) next
to Kanchanjangha, Makalu (8,463 m), and Chooyu (8,201 m). There are about 500 peaks
exceeding 6,000 m in the basin (Pandey, 1987). Southern half of the basin provides a
high relief topography within a short distance of about 200 km (Figure II-3). Figure II-5
illustrates the profile of the seven major tributaries of the Kosi River system.
Reproduced with permission of the copyright owner. Further reproduction prohibited without permission.

18
Reproduced with permission of the copyright owner. Further reproduction prohibited without permission.
Figur
e n-
3.
Top
ogra
phic
al
varia
tion
in the
K
osi
basin
.

19
Reproduced with permission of the copyright owner. Further reproduction prohibited without permission.
Figu
re
II-4
. R
elie
f ma
p of
the
Kos
i ba
sin
deri
ved
from
DE
M.

20
The Kosi River has a predominantly southerly direction of flow to Chatara and
beyond to the Ganga River. Flow patterns of the Arun River in its head area and flow
patterns of the Sunkosi and the Tamor rivers before their confluence are influenced by the
Greater Himalayan and the Mahabharat range, respectively. Longitudinal diversion of the
Kosi River by Mahabharat range results in a funnel effect. The Sunkosi and its major
tributaries are believed to have diverted by the upliftment o f the Mahabharat range due to
tectonic activities during the recent geological period (Sharma, 1977).
Profile o f th e Rivers
8000 _
7000 .■m— Sapta
6000 .
5000 1
.2 4000 -
— Sun
I 3000 _m
2000 .
0
1000 .
Tam a
Tamor
O LO LO LO LO LO LO LOD ( f i r - ( f i r — CD t— COc s j o o m c n ^ - ^ r L o t o
LOtOCO
tnCO
LO LOT— C OLO LO
LO LO r— COto to a Likhu
D ist from the Ganga confluence (km)
Figure II-5. Profile of the Kosi River and its tributaries.Data from Defense Mapping Agency Aerospace Center (1986)
Reproduced with permission of the copyright owner. Further reproduction prohibited without permission.

21
Table II-2. Characteristics of the major physiographic divisions of the Kosi basin.
Mahabharat MiddleMountains
High Mountains
Himalayas TibetanPlateau
Elevation (m) 140 - 3,000 200-4,000 1,000 - 4,000 4,000 - 8,848 3,500 - 6,000Land System Mountain Complex Steep and long Glaciated Glacial and
chain in east- series o f ridges slope valleys and high alluvial fanswest direction and valleys ridges
■Geology Mainly soft Mainly soft Mainly hard Mainly hard Tethys’srocks rocks rocks rocks sediment up to
10 km thickClimate Temperate Temperate, Temperate Alpine and Arctic and aridKoppen’s Class tundra.(Trewartha, (Cwag) (Cwag-Cwbg) (Cwb) (EFH, ETH) (Dwb)1954)Vegetation Chir pine, Chir pine, oak, Fir, birch, Birch and Meadow and
chestnut, oaks, bluepine, juniper, oak, rhododendron some alpinerhododendron, rhododendron, rhododendron, in lower part. vegetationbanmara, banmara blue pine and Alpine meadowSal in valleys meadow in higher parts
Soil Moderately Mostly deep Mostly deep Shallow and Shallowdeep dark dark yellowish dark brown loose soil with pockets (10-15grayish and brown clay stony and fine sandy gravel cm thick) ofbrown gravely loam soil with sandy loams and cobbles in loams mixedsandy loams or gravel and with boulders valleys. Rocks with rocks andloamy sand boulders above 5,500 m. glacial drift
Agriculture Maize, rice, Maize, rice Oat, barley, Barley, wheat,wheat, millet, wheat, barley, wheat, potato, rapes, andbarley, potato sugarcane, yams, herb peas in low
potato, herb land (<4,200
Population Moderate Population About 10 per Very lowm;Very low
pattern population density ranges sq km population populationdensity from 65 to 150 density density (<l/sq
per sq km. km)Environmental Growing Deforestation, Deforestation Growing Grazing andconcern deforestation grazing and in few slopes tourism and some defores
and agriculture development o f Dudhkosi grazing tationactivities activities and Arun
valleysSediment High sediment High sediment High sediment Avalanches Sediment
delivery with delivery with delivery with mainlygullies and several avalanches and deposited inlandslides landslides landslides wide valleys
Information from (Ekvall, 1968; Hagen, 1980; Majupuria, 1985; Nelson, Laban, Shrestha, & Kandel, 1980; Pandey, 1987; Sharma, 1988, Shrestha, 1989)
Reproduced with permission of the copyright owner. Further reproduction prohibited without permission.

Reproduced
with perm
ission of the
copyright ow
ner. Further
reproduction prohibited
without
permission.
Rain-Shadow / V s Dry Land
Winter Monsoon
f f l SummerMonsoon
F ig u re I I - 6 . S im p l i f ie d s c h e m a tic d iag ra m o f h y d r o m e te o r o lo g ic a l , t o p o g r a p h ic a l , and g e o lo g ic a l c h a r a c t e r i s t i c s o f th e K osi b a s in . N>to

The study area can be divided into five major geographic units: (a) Mahabharat
(b) Middle Mountains (c) High Mountains (d) Himalayas and (e) Tibetan plateau. The
salient features o f these divisions are described Table II-2. Figure II-5 illustrates the
profile of the seven major tributaries of the Kosi River system.
Table II-2 shows that the high topographical variation within the basin has re
sulted in several extremities in physiographic, climatic, and demographic patterns within
the basin. Under this extreme variation of climatic factors and moisture conditions, the
basin breeds numerous flora and fauna (Shrestha, 1989; Wenhua, 1993) and varieties of
social and cultural practices (Pandey, 1987).
Hydrometeorological Characteristics
The climatology of atmospheric circulation, variations in topography, and rain-
shadow effect of the Himalayas are the three major factors influencing hydrometeorologi
cal characteristics of the Kosi basin. The following weather systems play a major role in
bringing precipitation over the basin:
• Summer monsoon brings several wet spells widespread over the basin. Al
most 80 percent of the annual precipitation over the basin occurs during mon
soon. Monsoon generally sets-in over the basin during the first half of June
and withdraws towards mid-September. The period from June to September
is considered the monsoon season.
• Winter monsoon period is dominated by westerly wind with westerly jet
stream in the higher troposphere. The weather systems develop as westerly
disturbances; hence enter into the Kosi basin from the West. Precipitation
Reproduced with permission of the copyright owner. Further reproduction prohibited without permission.

24
amount, although insignificant compared to monsoon precipitation, contrib
utes to significant snow accumulation in high elevation areas.
• The transitional times, before and after the monsoons, are referred to as pre
monsoon and post-monsoon period respectively. Local weather systems,
such as convective activities, are highly dominant particularly during the pre
monsoon period.
Annual precipitation within the basin under the influence of topography varies
from less than 250 mm to more than 4000 mm. There are several instances of maximum
daily precipitation exceeding 300 mm in high precipitation areas of the basin; but these
are rare above 3000 m.
The seasonal distribution of precipitation has a strong influence on the hydrologi
cal characteristics of the basin (Figure II-6). The period of summer monsoon is also the
period of high flows. The lowest flows are generally observed during the first three
months of a calendar year (Appendix E). Streamflows begin to rise in spring with rising
temperatures and increasing snowmelt in high altitude zones. Most of the areas of the
basin above 6000 m are covered by permanent snow as the temperature remains below
freezing point throughout a year. The areas between 2500 m to 6000 m experience
seasonal snow accumulation that melts along with the rise in temperature during spring
and summer.
Despite the significant role of snowmelt in generating runoff in high elevation ar
eas, its overall contribution to the Kosi River is less than ten percent of the total runoff
(Sharma, 1993). This observation is different from findings in the western Himalayas
Reproduced with permission of the copyright owner. Further reproduction prohibited without permission.
25
(Kashmir and Hindu-Kush region) where contribution of snowmelt to major rivers is
estimated at 50 percent (World Bank, 1968).
AVERAGE MONTHLY TEMPERATURE
25
OUJa.DH
UiCL2
20
15
10
5■ m — Tingri0
-5 ■ Okhaldhunga-10
©c03 CL<-Q ST >O oQ)CL<D
Figure II-7. Average monthly temperature pattern at selected station of the southern Himalayas (Okhaldhunga) and the Tibetan plateau (Tingri).
| 500 r 2 4 0 0 .
2 3 0 0 .
£ 2001 Sb 100.Ouj na. u -CL
AVERAGE MONTHLY PRECIPITATION
Tingri
Okhaldhunga
£<0 S3mU-
>o uCDo
Figure II-8. Average monthly precipitation pattern at selected station in the southern Himalayas (Okhaldhunga) and the Tibetan plateau (Tingri).
Figure II-7 and Figure II-8 illustrate typical temporal patterns of temperature and
precipitation over the basin at selected stations on the southern and northern side of the
Reproduced with permission of the copyright owner. Further reproduction prohibited without permission.

26
Himalayas. The average monthly precipitation (Figure II-8) shows a similar temporal
pattern of moisture regime on both sides of the Himalayas under the influence of mon
soon; but the absolute amounts of rainfall vary significantly.
Reproduced with permission of the copyright owner. Further reproduction prohibited without permission.

CHAPTER III
REVIEW OF RELATED LITERATURE
Most of the available literature related to the environmental aspects of the Hima
layas deals with deforestation and its linkage to climatic variables, such as, floods,
droughts, and precipitation pattern. This chapter reviews the literature concerning land-
use changes, climatic changes, and the sensitivity of the watershed to such alterations.
The review has a greater focus on the Himalayan region for land-use aspect and the mon
soon region for climatic aspect.
Land-use Changes in the Himalayas
Land-use change in the Himalayas and its impact over the region are the most
publicized Himalayan environmental issues. Most of the available literature concerned
with this subject, deals with the issue of large scale land-use changes as a result of rising
population. In addition, some available literature relates the increasing occurrence and
severity of natural disasters in the downstream Gangetic plain areas to the massive defor
estation in the Himalayas.
Most of the publications regarding environmental degradation in the Himalayas
are available in international and national popular press. In addition, there are some spe
cialized publications such as, Bruijnzeel and Bremmer (1989), Ives and Messerli (1989),
and Lall (1981) that deal with several aspects of the problem. A general review of the
Reproduced with permission of the copyright owner. Further reproduction prohibited without permission.

28
literature shows the existence of a great debate not only on the nature of human impact
but also on the scale of such activities in the Himalayas. The majority of the available
literature deals with one or more of the following three major hypotheses related to envi
ronmental degradation.
Catastrophic Degradation
This category is generally referred to as the ‘Theory of Himalayan degradation.'
The picture of the Himalayas presented by several authors (Claire, 1976; Denniston,
1993; Eckholm, 1975; Messerschmidt, 1987; Modie, 1981; Reiger, 1981; World Bank,
1984) can be summarized as:
• Mountain deserts of the western Himalayas are moving eastward.
• The trend of forest loss indicates total loss of accessible forest by the end of
this century.
• People have already exploited most of the potential arable land.
• Existing agriculture land has lost its fertility due to washing away of top soil.
• Natural disasters, such as 1987 and 1988 floods of Bangladesh (Jacobson,
1988; Smith, 1988), are increasing every year due to increasing magnitude of
floods and droughts.
Such assessments and predictions are based on the following observations made
in the Himalayan region:
• Documentation of a rapid rise in population (two per cent or more per annum)
during post 1950 period
• Severe deforestation
Reproduced with permission of the copyright owner. Further reproduction prohibited without permission.

29
• Receding tree-lines and browning hills
• Most of the hill districts running under food and fuel deficiency
• Shifting cultivation and existence of abandoned lands.
The theory of Himalayan degradation is focused on the forest situation of Nepal in
1960s and 1970s during which time people were less concerned about protecting the na
tionalized forests. Furthermore, eradication of malaria and construction of highways en
couraged the subsistence level farmers of the hills and mountains to migrate towards the
foothills (areas in Tarai close to the hilly region) and Tarai (Central Bureau of Statistics
[CBS], 1987). Such movements of people led to a great deal o f deforestation of the intact
forests of foot hills, commonly known as ‘Char Kose Jhadi ’ (Eight miles Strip of Dense
Forest). Population growth rate exceeding eight per cent per annum in some Tarai dis
tricts during 1971-81 (CBS, 1987) and more than 24 per cent reduction in forest cover in
Tarai during 1964-78 (Gilmour, 1991) support the theory of large scale deforestation.
Hence, the term ‘Himalayan Degradation’ is, in fact, a misnomer as the land-use changes
occurred mainly in Tarai, not in the mountains. A general conception about Nepal being
synonymous to the Himalayas may have contributed towards such a terminology.
Normal Processes
Several authors have challenged the 'Theory of Himalayan degradation’
(Bajracharya, 1983; Bruijnzeel & Bremmer; Gilmour, 1981; Ives & Messerli, 1989; Kat-
teimann, 1990). The major points presented by them against the degradation theory can
be summarized as:
Reproduced with permission of the copyright owner. Further reproduction prohibited without permission.

30
• Decrease of forest cover in the Himalayas is not significant except some re
duction of forest density.
• Land-use pattern in the Himalayas is not the result of post-1950 population
explosion but is over a much longer time frame.
• Models used by authors, supporting the hypothesis of environmental degrada
tion, are not suitable due to high uncertainties in the evaluation of processes
related to deforestation.
• Scale o f human activities is insignificant when compared with the dimension
of natural processes in the Himalayas.
• People-farm-forest relationship might have already led to a sustainable envi
ronment.
• Large-scale floods in Ganga-Brahmaputra plains are not usually linked with
the Himalayan hydrology (Alford, 1992; Brammer, 1990; Kattlemann, 1987,
1990).
The theories of nonsignificant changes in the Himalayas are established through a
better information base. Land-use surveys of Nepal made in the 1970s did not validate
the hypothesis of large scale deforestation in the Himalayas. Similarly, a lack of relation
between precipitation in the Himalayan watersheds and floods and droughts in the Ganga-
Brahmaputra basin did not support the ‘Theory of Himalayan Degradation’ proposed ear
lier.
Although the literature supporting nonsignificant changes is based on data and
facts, we may still ask “Are there enough evidences?” or “Are not the increasing food,
Reproduced with permission of the copyright owner. Further reproduction prohibited without permission.

31
fuel, and fodder demands creating negative impacts on the environment?” Recent studies
of some of the districts (Dahal, 1994) and microcatchments (ICIMOD, 1995) in the Kosi
basin contradict the theory o f historical deforestation concluding the deforestation being
post-1950 phenomena. Similarly, some available hydrological studies are difficult to in
terpret, such as, “Nepali rivers modulate rather than contribute negatively to the flow of
the Ganges.” (Alford, 1992, p 58), although these rivers are the major tributaries of the
Ganga River.
Comparison of the two contradictory theories on the Himalayan environment
would suggest that there is neither catastrophic degradation of the Himalayas nor no
worry situation. On the other hand, some new facts put forward by some researchers (next
paragraph) indicate an increasing trend in forest extent in Nepal.
Greening Trend
Recently, some researchers have been pointing out towards the greening of the
Himalayas, that is, observation of a trend in forest increase. Carter and Gilmour (1989),
Fox (1993), and Gilmour (1991) report up to three-fold increases in forest in some local
areas of the Kosi basin during two decades in the recent past. Similarly, the success sto
ries of community forest development policy of the government of Nepal are (User
Group, 1995) indicating a significant increase of community forest. A. Tuladhar
(personal communication, September 22, 1995), a research student at Clark University,
after his preliminary assessment of satellite pictures over Nepal, finds statistically signifi
cant trends of increasing forests in most of the Himalayan region.
Greening trends, reported for several parts of the Kosi basin are the success stories
of forestry programs; nevertheless, we did not find any plausible explanation for a
Reproduced with permission of the copyright owner. Further reproduction prohibited without permission.

greening trend in the entire Himalayan range. Attempts to explain the greening trend
may lead to other questions, such as, “Are the forestry programs very successful and
widespread over the Himalayas," “Are there any climatic changes in the region influenc
ing positively to the vegetation growth?” Spreading of Banmara (Eopatorium adenopho-
rum) in the middle mountains of the eastern Nepal since the 1950s (Shrestha, 1989) is
another puzzle that may directly affect the assessment of forest cover. These plants are
found to be invading abandoned cultivation lands.
Realities
The last three sections of this chapter describe completely different perspectives
on the same environmental issue. The obvious questions are hence: what are the truths?
The major reason behind such discrepancies by different authors can either be due
to the lack of information on environmental assessment in the region or the lack of syn
thesis of available information. The reasoning can further be verified by recent informa
tion that shows that the earlier predictions of deforestation rate as well as the population
growth rate are grossly overestimated (Bajracharya, 1983; Gurung, 1991).
Since the inadequacy of environmental information is a reality throughout the de
veloping world, the remote areas of the Himalayas are no exception. Our major emphasis
in this study is, hence, on the evaluation of the most appropriate environmental indica
tors, such as climatic variables to determine the trend of changes. In addition, the analy
sis of hydrological variables such as discharge and sediment flux, provides an indication
of the integrated impact of environmental changes in the region.
Reproduced with permission of the copyright owner. Further reproduction prohibited without permission.

33
Land-use Change and Climate
Land-use changes result in the alteration of hydrological and meteorological con
ditions of affected areas. Obvious hydrological impacts of deforestation include: overall
increase in yield and change in temporal variation of runoff, decrease in evapotranspira
tion, change in soil moisture characteristics, and increase in soil erosion. Similarly, me
teorological responses to deforestation are associated with increases in: surface albedo,
wind speed, turbulence, maximum air temperature, and net radiation loss. Opposite ef
fects are expected when land-use change occurs as a result of afforestation.
Bosch and Hewlett (1982), Bruijnzeel (1990), and Whitehead and Robinson
(1993) have compiled and reviewed the results obtained from several empirical studies
related to hydrological impacts, described above, as a result of land-use changes. Studies
concerning meteorological impacts have indicated micro-meteorological changes whereas
the regional, continental and global scale impacts are still a topic of debate. Several
studies conducted for the Amazon basin using Global Climate Model (GCM) simulation
indicate increase in temperature from one to three degree Kelvin (Dickinson & Hender-
son-Seller, 1988; Shukla et al., 1990) and decrease in evapotranspiration up to 30 per cent
(Shukla et al., 1990). On the other hand, the GCM based studies have many discrepan
cies and disagreements among modelers, especially when the results are interpreted at
regional levels (Lamb, 1987; Mitchell & Qingcun, 1991).
Impact of land-use change on precipitation, one of the three major components of
hydrological cycle, has been less understood as compared to other two components:
evapotranspiration and runoff. Although studies have been conducted since the first
quarter of this century (Brooks, 1928), no acceptable relations have been established so
Reproduced with permission of the copyright owner. Further reproduction prohibited without permission.

34
far (Ward & Robinson, 1990). Some evidence of the effects found at the local scale
(Anthes, 1984) lacks sufficient empirical justification. Despite such insufficient theoreti
cal and empirical evidence, there exists strong perception not only among people and
policy makers but also among scientists about the role of deforestation in decreasing pre
cipitation. Such perception is primarily based on some literature that justifies such ob
servation on the basis of observed data including those of south India where strong influ
ence of summer monsoons is experienced (Meher-homji, 1991). Some other examples,
showing evidence o f decreasing precipitation because of deforestation, include several
parts of the world: China (Zhang, 1986), Ghana (Mann, 1987), Panama (Windson &
Rand, 1985 as quoted in Meher-homji, 1991) and Costa Rica (Fleming, 1986). Length of
record for such assessment and difference in catch efficiency of rain gauges in forested
and non-forested environment are some of the questions that still do not have satisfactory
answers for accepting the hypothesis.
Sensitivity of Himalayan Climate
Examples of decreasing precipitation as a result of increasing deforestation, pre
sented by Meher-homji (1991) consider several places in the Indian subcontinent includ
ing Cherrapunji that lies in the eastern Himalayas. Similarly, Kothyari and Singh (1996)
show increasing temperature and decreasing precipitation trends over the Ganga basin
since mid-1960s and relate these to deforestation. Similar trends of increasing tempera
ture and decreasing rainfall in different parts of the Indian subcontinent and China, south
and north of the Himalayas respectively, have also been reported by Denniston (1993),
Hingane, Kumar, and Murty (1985), Myers (1986, 1988), and Hingane (1996). Several
Reproduced with permission of the copyright owner. Further reproduction prohibited without permission.

35
studies also indicate that the decreasing precipitation trend as a result of deforestation is
more distinct in mountainous areas than in coastal regions (Meher-Homji, 1991).
Some studies indicate decreasing trend of temperature even in the areas of heat
island effects such as Delhi (Lai, 1993). Similar decrease can also be expected in some
areas contiguous to the Kosi basin on the basis of extrapolated results of Hingane et al.
(1985). Despite such observations in different parts of the Himalayas and its adjacent
plains, there is less dispute about recent trend of temperature rise in the northern hemi
sphere including the Himalayas.
In contrast to the general agreement of an increasing temperature trend among
scientists, there is less agreement about the declining precipitation trend described above.
For instance, the results presented by Parthasarathy and Mooley (1978) and Mooley and
Parthasarathy (1984) on the basis of all India monsoon rainfall data for the period of
about 100 years does not reveal any trend that could be related to global warming. Sev
eral other studies in the region that do not support the hypothesis of decreasing trend of
precipitation in the region include: Rogers, Lydon, and Seckler (1989), and Srivastava et
al. (1992).
How sensitive are the monsoonal circulation and the monsoon activities to cli
matic changes? Attempts have been made to relate the monsoon variabilities to regional
anomalies, such as, El Nino (Ju & Singo, 1995) and snow cover in central Asia (Shukla,
1987; Walsh, 1995). Although the inverse relation of El Nino and Eurasian snow cover
to the strengthening of monsoons looks promising, the results are not consistent (Shukla,
1995(b); Walsh, 1995). Predictions of monsoon sensitivities on the basis of such con
nections are at a primary stage of research. Additionally, the intensive monsoon activities
Reproduced with permission of the copyright owner. Further reproduction prohibited without permission.

36
in India may not correspond to active monsoon in the Himalayan region since the region
generally experiences strong monsoon activities during the periods of inactive monsoon
in India (‘monsoon breaks’; Dhar & Narayanan, 1966; Dhar, Soman, & Mulya, 1982).
Existence of a vast amount of water as ice and snow is an additional aspect behind
sensitivity of the Himalayas to possible climatic changes. More than ten per cent of the
Kosi basin is covered by snow throughout a year (Sharma, 1977). Receding glaciers,
which may provide some evidence of warming (Barry, 1981, 1992) have been observed
in the Himalayas in recent past. Kadota and Ageta (1992) report the receding of Shorong «
glacier in the Dudhkosi tributary of the Kosi River by about 30 m within a decade ending
1989. Yamada et al. (1992) report accelerating rate of retreat of almost all the studied
glaciers in the Kosi and other adjacent Himalayan basin since 1980. Relating these gla
cier retreats to the reported global warming is not straightforward as the Himalayan gla
ciers have been retreating at least for the last 140 years (Mayewski & Jeshcke, 1979).
In the preceding paragraphs, we discussed the literature dealing with the sensitiv
ity of the Himalayas to the land-use and climatic changes on the basis of observed cli
matic variables. In addition, some literature is also available that deals with the sensitiv
ity of the Himalayas to the predicted global warming on the basis of GCM results.
The size of the Kosi basin is less than or close to the size of a single grid of most
of the available GCM experiments. Extrapolation of results to the size of the Kosi basin
is hence subject to higher uncertainties. Nevertheless, the results of GCM simulations,
obtained in areas covering the central Himalayas, are less ambiguous than in many other
regions (Hansen et al., 1988; Meehl, 1994). The scale of predicted warming, however,
varies significantly among different models.
Reproduced with permission of the copyright owner. Further reproduction prohibited without permission.

37
Since the monsoons are analogous to land breeze and sea breeze at a seasonal
scale, their activities are highly related to the differential heating of the Indian subconti
nent and the Tibetan plateau (Trewartha, 1954). In a scenario of predicted global warm
ing, the thermal gradient is likely to steepen due to higher warming of continent than
ocean and a lowering of albedo as a result of reduction in snow area. In the background
of these physical processes, GCM results indicate intensification of monsoons in the sce
narios of global warming bringing more precipitation over the region (Pioneering Study,
1994, 4). The monsoon precipitation is expected to be enhanced further in a scenario of
deforestation (Shukla & Mintz, 1982; Meehl, 1994) because of drier soil conditions be
fore the onset of monsoon. Lower heat loss in drier soil causes increased thermal gradi
ent between land and sea surface resulting in the intensification of the monsoons.
Discussion
The Himalayan region of Nepal is probably one of the most studied regions of the
world; however, it does not imply that it is the best studied nor does it imply that it has
been adequately studied. The general survey of literature regarding the relationship be
tween anthropogenic changes and climatic changes, presented above, exemplifies the
complexities involved in meteorological, hydrological, and anthropogenic processes and
their interaction. These processes have been analyzed by scientists and journalists on the
basis of observation, judgment, reasoning, and modeling. The studies have provided
valuable insight about the biospheric environment, but the diversity of the conclusions
has added more uncertainties and confusion.
The large number of variables involved in environmental processes and the com
plex nature of their interactions are likely to be a challenge to the scientific communities
Reproduced with permission of the copyright owner. Further reproduction prohibited without permission.

38
for several years. The existing knowledge base is adequate neither for scientific explana
tion of the environmental processes nor for predictions. In general, the literature review
does not lead us towards conclusive facts, but rather leads us toward making recommen
dation to develop a reliable time series data base of the land surface conditions and at
mospheric environment. Standard time series data for land-use, water cycle, and sedi
ment flux are the most critical aspect for environmental studies in the region as several
disparities exist in the available information. For instance, Shrestha (1989), finds the re
ported agriculture area of three districts in the Arun River basin differing by 80 to 140 per
cent in two different authenticated sources.
The research trends indicate that the Himalayan regions have attracted regional
and international scientific communities during the last three decades. Unfortunately, the
emphasis of research works seems to be biased more on using limited information and
less on improving the available data base. Since a reliable data base provides higher con
fidence in explaining processes, there is an urgent need to change the emphasis of the
Himalayan research from an existing principle-based approach to information-rich ap
proach.
Fortunately, we are equipped with simple instruments that have been used to
monitor environmental indicators, such as, precipitation and temperature. Similarly, the
available measurement of river discharge is an excellent indicator that can be monitored
at a single location for the whole basin. These data can be replaced neither by scientific
knowledge nor by computer simulation or modeling. Despite some shortcomings in the
length of the records, areal representation, and data quality we will rely heavily on this
available information for assessing the environmental trends in the Kosi basin.
Reproduced with permission of the copyright owner. Further reproduction prohibited without permission.

CHAPTER IV
COLLECTION AND ANALYSIS OF DATA
This study is based on three types of basic information: hydrological and mete
orological data, land-use data, and a digital elevation model. This chapter contains a de
scription of nature, source, and quality of the data sets used in this study.
Meteorological and Hydrological Data
Meteorological and hydrological data, available at the Department of Hydrology
and Meteorology (DHM) in Nepal, are the major source of information used in this study.
Very little meteorological and hydrological information is available for the Tibetan part
of the Kosi basin. We obtained some records for the Tibetan part mainly from the World
Weather Records (various years) and Nepal-China joint glacial study report
(LIGG/WECS/NEA, 1988).
Various organizations are involved in collecting hydrological and meteorological
information in the Kosi basin as a part of gathering information for implementation of
certain projects. Among them, Central Water Commission (CWC) of the government of
India was the only organization involved in regular hydrological and meteorological data
collection on regular basis before the establishment of DHM in Nepal. CWC established
and maintained a regular gauging station on the Kosi River at Barahksetra, about two km
downstream of the confluence of Arun, Tamor, and Sunkosi (Figure II-1), in 1947. CWC
also established one station on each of the two major tributaries of the Kosi; the Sunkosi
Reproduced with permission of the copyright owner. Further reproduction prohibited without permission.

40
River at Kampughat and the Tamor River at Tribeni (confluence of three rivers) in 1948.
All these stations were discontinued in the 1970s after the establishment of new stations
by DHM. The present DHM station on the Kosi River is about 5 km downstream of the
CWC site whereas the location of DHM station on the Tamor River is about 15 km up
stream of the CWC site. Although these represent a small difference in basin area, we
combined these records for trend analysis as the F-statistics did not reject the hypothesis
of their belonging to same population. Streamflow and sediment discharge data obtained
by CWC have not been published. Only the monthly and annual summaries of these data
are available in hydrological reports, such as, WEC(1982).
Along with the initiation of hydrometric survey, India Meteorology Department
(IMD) established several climatological stations in the Kosi basin in the late 1940s and
1950s. The Government of India made available all the daily precipitation and tempera
ture data collected by IMD to DHM when it transferred all the meteorological and hy
drological stations to the government of Nepal after the establishment of DHM. Later,
DHM either closed the IMD stations or replaced with a new system following the stan
dard procedures and instruments as recommended by the World Meteorological Organi
zation (WMO, 1981).
DHM has published the hydrological and meteorological data regularly since its
first publication in 1966. The publications include monthly precipitation through 1990
and other monthly climatic summaries through 1986. Hydrological data have been pub
lished through 1977 and the rest have been documented in various stages of processing as
internal publications or in a computer data base at DHM. DHM introduced digitization of
the hydrological and meteorological records using micro-computers in the 1980s. Several
Reproduced with permission of the copyright owner. Further reproduction prohibited without permission.

41
historical data are still in the process of digitization. Most of the sediment data are yet to
be digitized and processed.
A major task of the research program was to collect, compile, and review all the
existing processed data and expand the digital data base to include the latest information.
Collection of some supplemental data, such as sediment concentration of the major rivers
was also necessary to analyze existing unprocessed sediment data of the Kosi River and
its tributaries. We accomplished these tasks on the basis of a proposal submitted to the
concerned institutes (Sharma, 1994). The task involved the following activities:
• Collecting, processing, and updating meteorological and hydrological data
• Computerization of data in suitable formats for data analysis and modeling
software
• Processing of sediment data with additional measurements at major gauging
sites for developing sediment ratings
• Review of the whole data set for its applicability in climate change studies and
hydrological modeling
We established a data base with information available at the central office in
Kathmandu and the Kosi Basin Field Office in Dharan during the monsoon and the post
monsoon period of 1994. The data base consists of all the discharge and precipitation
values at a daily time step for Nepali side of the Kosi basin. Other climatological data
that were digitized at monthly time steps include: temperature, relative humidity, sun
shine hours, evaporation, and wind. The recent five year climatological data including all
the variables described above are digitized at a daily time step.
Reproduced with permission of the copyright owner. Further reproduction prohibited without permission.

42
METEOROLOGICAL NETWORK
P re c ip ita t io n - G a u g e N e tw o rk
C lim a to lo g ica l N e tw o rk
F ig u re IV -1 . M e te o r o lo g ic a l n e tw o rk i n th e K o s i b a s in . A p p en d ix A c o n ta in s th e l i s t o f th e s t a t i o n s .
Reproduced with permission of the copyright owner. Further reproduction prohibited without permission.

43
Reproduced with permission of the copyright owner. Further reproduction prohibited without permission.
Figu
re
IV-2
. G
auge
d su
b-ba
sins
th
at co
ntrib
ute
to the
K
osi
river
. Ap
pend
ix
B co
ntai
ns
the
statio
n de
scri
ptio
n.

44
Appendix A and Appendix B list the meteorological and hydrological stations and
Appendix C to Appendix H contains a summary of the processed records (Sharma, 1996)
used in the study. Figure IV-1 presents the location of precipitation gauging stations and
climatological stations. The climatological stations are the stations equipped with at least
maximum, minimum, wet-bulb, and dry-bulb thermometers besides precipitation gauge.
Some of these climatological stations are equipped with Class A evaporation pan, sun
shine recorder, and anemometer (Appendix F, Appendix G, and Appendix H). Figure IV-
2 shows the gauged sub-basins of the Kosi River system. Both of these figures clearly
illustrate the disparities of gauging network density between the southern half and the
northern half of the basin; the northern half showing very sparse network.
Land-use and Anthropogenic Data
Unlike meteorological and hydrological data, no time series of land-use data is
available for the Himalayan region. Basic sources of land-use data are the two major sur
veys carried out in late 1950s in the hills of Nepal (Department of Forest [DOF], 1973)
and in late 1970s covering the whole Kingdom. The land-use data, prepared by the later
project, known as the Land Resources Mapping Project (LRMP) of the Survey Depart
ment (1984), are available in paper maps at 1:50,000 scale. These data are also available
in digitized form. We obtained all these maps and digitized data covering the southern
side of the Himalayas for this study.
The following paragraph, reproduced here from DOF(1973), describes the first
major forest inventory. Areas covered by the survey in the eastern Nepal and the reported
land-use data are reproduced in Figure IV-3.
Reproduced with permission of the copyright owner. Further reproduction prohibited without permission.

45
^ S R A S S W % OTHERS 0-4% WKTER W % BARREN f3V .
F ig u r e IV -3 . L a n d -u s e i n th e M ah ab h a ra t an d m id d le h i l l s and i n t e r i o r Him a layan a r e a s o f th e e a s t e r n N ep a l b e f o r e 1965.
(A dap ted from D e p a rtm e n t o f F o r e s t r y , 1 9 7 3 , p p . 12)
Reproduced with permission of the copyright owner. Further reproduction prohibited without permission.

Reproduced
with perm
ission of the
copyright ow
ner. Further
reproduction prohibited
without
permission
LAND-USE
1 flu km
Intense (75-100% ) [ H Light (25-50% ) A griculture A griculture
CoolT cm perule/Sub-A lpine L J Snow Grazing Lund
M edium (50-75% ) H | Subtropical/Tem perate | | A lpineAgriculture G razing Land — G razing Land
Rock/Gravel
Lake M ixed/H anlw oodForest
Coniferous Forest | Shtub
Figure IV-4. Major land-use in the Kosi basin in 1978-79.
■p-os

47
This information is obtained from the aerial photographs taken during 1953-58, 1962 and 1967. Wherever possible, the percentage of forest cover has been calculated for a unit of 15 minutes quadrangle. For most part of the hill area, it is based on photographs taken as many as twenty years back. The cover percentage shown on the map is, therefore, what it was at that time of photography. It is calculated by using the forest area unadjusted by strip photographs of 1964-1965. (p. 8)
The land-use, classified by the LRMP, consists of 75 classes within the Kosi ba
sin. Use of these detailed classifications are not justified, primarily due to nonavailability
of such data in the Tibetan part of the basin; hence, we reclassified the land uses into
thirteen major classes. We used information available in maps (Population Map of
China, 1988) and different other publications (Ekvall, 1968; Rongzu, 1989; Wenhua,
1993; Yanhua, 1992) for developing a land-use map for the Tibetan part of the Kosi ba
sin. Figure IV-3 presents 13 major reclassified Iand-uses in the Kosi basin with added
information on the Tibetan part.
As described in Chapter III, it is believed that rapid deforestation occurred from
mid-1950s to 1960s. The two sets of available forest data (DOF, 1973; Survey Depart
ment, 1984), unfortunately, do not cover the period believed to be affected by the highest
rate of deforestation.
Central Bureau of Statistics publications (CBS, 1987, 1993) are the additional
source of land-use and anthropogenic data used in this study. CBS publishes different
types of statistics regularly by dividing Nepal into political units, such as, development
regions and districts. In addition, some data are published for the major physiographic
divisions of Nepal: mountain, hill, and Tarai. The Kosi basin in Nepal shares its area
with two major political divisions: Eastern Development Region and Central Develop-
Reproduced with permission of the copyright owner. Further reproduction prohibited without permission.

48
ment Region. Twelve districts that fall entirely in the Kosi basin include: Taplejung,
Panchthar, Dhankuta, Terhathum, Sankhuwasabha, Bhojpur, Solukhumbu, Okhaldhunga,
Khotang, Ramechhap, Dolakha, and Sindhupalchok. Almost 90 per cent of the Kavrepal-
anchok district lies in the Kosi basin while less than five per cent areas of the Sindhuli
and Udaipur districts contribute to the Kosi. Nyalam, Tingri, Dinggye, and Gamba are
the counties in Tibet that fall in the Kosi basin.
The history of population census in an organized manner in Nepal goes back to
1911. The first census of 1911 has been repeated every ten years (1920, 1930,1940,
1952-54, 1961, 1971, 1981, and 1991). The census taken in 1952-54 is recognized as the
first scientific census conducted by an organization established for such task (CBS,
1987).
Digital Elevation Model
Digital Elevation Model (DEM) is core information; topography dominates al
most all the land surface and atmospheric environment of the Himalayas. Besides, DEM
is the only available data base that covers the whole basin with reasonable accuracy and
satisfactory resolution. In conjunction with a GIS technology, we used a DEM for sev
eral hydrological computations including: watershed boundary of the basin and its gauged
sub-basins, river network and basin characteristics. We also used DEM information for
classification o f vegetation in Tibetan plateau and for developing soil map of the Tamor
River basin.
We obtained the digital elevation model for the Kosi basin from a 1-km elevation
data base made available by Earth Resources Observation System (EROS) data center.
We downloaded the data from the UNEP/GRID (1996), Sioux Falls internet site, for the
Reproduced with permission of the copyright owner. Further reproduction prohibited without permission.

49
region covering the Kosi basin. Primary source of the 1-km resolution elevation data
base is the US Defense Mapping Agency Digital Terrain Elevation Data (DTED). Addi
tional sources used to fill the gaps in DTED include: Digital Chart of the World (DCW,
ESRI, 1992a) and ET0P05 (Edwards, 1992). Since the primary source of 1-km data
base is not available, it is difficult to assess the accuracy of the data for the Kosi basin.
DCW data base contains significant gaps in the high elevation areas of the Kosi basin.
Comparison of the map obtained from 1-km elevation data base (Figure II-3) to
the maps published in atlases indicates good agreement. We also used the data base to
generate a river networking using Arc/Info (ESRI, 1992b). Comparison of the generated
river network with the river network available in DCW also confirms good quality of the
1-km elevation data base. We faced only one problem in the generated river network at
the southernmost part of the Sunkosi River. The program was not able to capture the
north easterly flow of the Sunkosi River at its lower end. We rectified the error manually
by editing few grids employing elevation data of the area.
Data Quality
Before the use of data in this research work, it was essential to evaluate its tempo
ral and spatial accuracy and representativeness. Such evaluation is more important for
the region such as the Kosi basin where poor logistic and technical support, rugged ter
rain, and inaccessibility directly affect establishment and maintenance of hydrological
and meteorological networks. Despite this, the Kosi basin has the longest records of cli
matic data when compared with other major basins in Nepal. The following sections de
scribe the factors that may affect the quality of hydrological and meteorological data in
general.
Reproduced with permission of the copyright owner. Further reproduction prohibited without permission.

50
Instrumentation and Measnrements
WMO standard practices (WMO, 1981) are the major guidelines that are followed
while selecting instruments and sites and while installing, maintaining, and observing
climatological and hydrological variables. Observations are made at all the climatological
and precipitation gauging stations every day at 0300 Universal Time that is 0845 Local
Time (LT). The daily climatic values observed at 0300 are used to compute the monthly
means used in this study. Unlike climatic observations, river gauges are not read at stan
dard times. The daily values of the river gauge height are obtained by calculating the
arithmetic mean of different observations made in a day. In general, river gauges are read
three times a day at 0800 LT, 1200 LT, and 1700 LT with additional observations during
floods at some stations. Hourly gauge heights are used to compute the daily mean values
for stations equipped with automatic water level recorder. The average daily gauge
heights are used to compute the average daily river discharges using stage-discharge re
lations. The stage-discharge relation for a site is updated every year with additional dis
charge measurements.
Daily precipitation amount is measured with a standard 203 mm cylindrical pre
cipitation gauge without wind shield. Precipitation is measured with a measuring stick.
Daily values of temperature are computed by using the m axim um and minimum readings
of the day. The maximum temperature thermometer is the mercury-in-glass type and the
minimum temperature thermometer is the alcohol-in-glass type. Relative humidity is
computed by using the dry-bulb and wet-bulb thermometers both of which are the mer
cury-in-glass type. Precipitation, maximum temperature, and minimum temperature are
observed at all the climatological stations.
Reproduced with permission of the copyright owner. Further reproduction prohibited without permission.

51
The instruments used for the measurement o f evaporation, wind, and sunshine du
ration are Class A pan evaporimeter, vertical axis rotating cup anemometer with digital
counter, and Campbeil-Stokes sunshine recorder, respectively (WMO, 1971). Similarly,
the river discharges and suspended sediment are measured by Price meter and depth inte
grated sediment sampler, respectively (WMO, 1981).
Despite the application of standard instruments and procedures, there are several
shortcomings that may directly affect the quality of data. Some examples of such short
comings are the inadequate discharge measurements for establishing and updating stage-
discharge relations, and the use of current meters for several years without recalibration.
Similarly, there is not enough information to trace the history of the stations to evaluate
the changes in site conditions and relocation. Inadequate funds for regular field visits and
inadequate training facilities for the technical personnel are other factors influencing the
proper monitoring of hydrological and meteorological networks. Application of stage-
discharge relation to the mean daily gauge heights, instead of individual gauge heights, to
compute mean daily discharge is an example of procedural deficiency as the stage dis
charge relations are often nonlinear.
Network
Existing networks of precipitation gauges, thermometers, evaporimeters, stream
gauging and sediment sampling stations in the Kosi basin are less than the ideal (100-250
km2 per station) recommended by the World Meteorological Organization (1981). Al
though the existing precipitation network of about one station per 900 km2 is within the
limit of recommended network for difficult conditions, the density falls short in the Ti
betan part of the basin (12,000 km2 per station). This density is even less than the rec
Reproduced with permission of the copyright owner. Further reproduction prohibited without permission.

52
ommended limit (10,000 km2) applicable for highly remote areas such as polar and arid
regions.
Besides spatial inadequacy, the network also lacks representation of high eleva
tion areas of the drainage. Six, out of eight, stations located above 3000 m on the south
ern side of the Himalayas have been closed. Both of the stations located at and above
4000 m were operational for less than seven years starting in 1948.
Poor precipitation gauge network density in the northern half of the basin is a
major constraint toward establishing an accurate precipitation distribution pattern over the
basin. We used measurements and estimates available for few locations in the Tibetan
plateau near Nepal-China border (LIGG/WEC/NEA, 1988) to assess precipitation pattern
in data sparse areas. Although such interpolation as well as extrapolation of records can
be considered reasonably acceptable for average water balance computation, it is inade
quate for modeling of temporally continuous hydrographs.
The stream gauging network density of about 100 km2 per station below 500 m
and 600 km2 per station between 500 m and 1000 m meets the WMO(1981) recommen
dations of minimum network. The network of about 2000 km2 per station in the elevation
range of 1000 m and 2000 m meets the WMO recommended network criteria under diffi
cult conditions. No regular hydrometric station exists above 2000 m that covers almost
three quarters o f the total basin area.
The class A pan evaporation network of about 11,000 km2 per station is satisfac
tory for the basin; the WMO(1981) recommended minimum network being 50,000 km2
per station. Notwithstanding, the information available for the high elevation areas of the
Reproduced with permission of the copyright owner. Further reproduction prohibited without permission.

53
basin is inadequate. The southern part of the basin is represented by the stations lying in
lower elevation zones below 1800 m.
Missing Records
Although sixteen precipitation gauges were established in 1947 in the Kosi basin,
only three stations (1303, 1316, and 1403) have almost complete data set from 1948 to
1993. The other stations have several missing records particularly before 1960. Twenty-
one out of sixty-one precipitation stations contain almost complete record from 1960 to
1992. We estimated some of the missing records for these data sets using precipitation
records at neighboring stations. Such estimates are made mainly for the dry months, so
that the estimations do not significantly affect the annual amount. Appendix I contains
the annual time series of the precipitation for these stations.
Temperature data are available for twenty-three locations within the basin; out of
which seven stations were established in 1962. Only three stations have reasonably com
plete records. We have used average monthly values for estimating the values of few
missing months of the time series. About four per cent of the total monthly data contains
such estimates for these selected three stations. Appendix J gives the annual temperature
time series for these three stations: 1206, 1303, and 1405.
Out of the sixteen regular streams gauging stations over the Kosi basin, two sta
tions have less than ten years and four stations have less than twenty years of discharge
records. The records of the Kosi River extend from 1947 to 1994 with about nine miss
ing months in 1980/1981. We have estimated the data for these missing months using
flows in the nearest upstream tributaries. The other stations with long term discharge re
cords include the Tamor at Tribeni/Mulghat (1948-1994) and the Sunkosi River at Kam-
Reproduced with permission of the copyright owner. Further reproduction prohibited without permission.

54
pughat (1948-1984). The other two stations, with complete data from 1968 to 1993, are
the Balephikhola (Station No. 620) and the Dudhkosi (Station No. 670). Appendix K
gives the time series of the annual discharge values for all the stations with longer than 25
years of records.
We used some estimated data, as described above, only for some stations with
fairly complete and relatively long period of records. The remaining data are used with
out filling in missing records.
Homogeneity of Time Series
Evaluation of the homogeneity of time series data is a primary step for long term
climatic trend studies (Mitchel et al., 1966) and for the validation of proper instrument,
site, exposure, and data processing procedure. The evaluation of the homogeneity of data
for the Kosi basin is particularly important as the hydrological and meteorological net
works were established by CWC and IMD and upgraded by DHM. An example of the
instrumental changes as a result of such transition is the different types of precipitation
gauges used by different agencies. IMD uses 127 mm Symon’s precipitation gauge as its
standard for measurement of precipitation whereas DHM uses a standard 203 mm pre
cipitation gauge. Similarly, some of the stations were relocated after the transfer of sta
tions from IMD/CWC to DHM as described earlier.
We applied the following procedures for assessing the homogeneity of precipita
tion, temperature (Mitchell et al., 1966) and discharge (Linsley, Kohler & Paulhus, 1988)
records.
Reproduced with permission of the copyright owner. Further reproduction prohibited without permission.

55
• Assessment of the homogeneity of precipitation and discharge by plotting
double-mass curves. Appendix L and appendix M presents double mass
curves for selected stations with relatively long length of records.
• Objective assessment o f the homogeneity of precipitation and temperature
using statistical methods.
We used the following steps, as recommended by Mitchell et al. (1966), for test
ing the homogeneity of precipitation and temperature data series.
Test of Normality
We obtained the difference between the values of two stations in the case of tem
perature and ratio between the values of two stations in the case of precipitation. We then
tested the normality of the series of the difference or ratio by using Kolmogorov-Smimov
statistics (Haan, 1977) given as:
D = Maxy \Fn(y) - F(y)\ (IV-1)
where F(y) is the hypothesized cumulative distribution function (cdf) and Fn(y) is
the empirical distribution function o f the sample computed as:
K t H) = - £ / ( y , < y ) , av-2)n ;=1
where n is the number of observations and I(yi<y) is the indicator function in
which:
i(yi<y) = i tf yi<y (iv-3a)
= 0 i f yi>y. (IV-3b)
The null hypothesis of a normal distribution is rejected if the probability value for
this hypothesis is significantly small. Application of this test to 22 ratio sets with rela
Reproduced with permission of the copyright owner. Further reproduction prohibited without permission.

56
tively long term annual precipitation series indicated a lack of evidence against the null
hypothesis in all cases at one per cent level of significance and all but six cases at five per
cent level of significance.
Application of the test to the difference set obtained for the maximum and mini
mum temperature data of three stations with more than 30 years of records indicated
normal distribution in all cases except one (minimum temperature for station 1303) at one
per cent level of significance. The null hypothesis was, however, rejected for minimum
temperature at five per cent level of significance for all the three stations. Hence, despite
some limitations, particularly for minimum temperature, we considered annual precipita
tion as well as temperature data suitable for analysis using parametric statistics. Null hy
pothesis of normality was not rejected at one per cent level of significance for the dis
charge data (Appendix K) and at five per cent level of significance for all but one station
(670).
Test of Randomness
We tested the difference or ratio series of the last step for nonrandom component
using Bartlett’s Kolmogorov-Smimov statistics and Fisher’s Kappa statistics to the spec
trum of the data. The Kolmogorov-Smimov statistic tests the critical value of maximum
absolute difference between normalized periodogram and cumulative distribution func
tion of a uniform random variable (SAS, 1993). Fisher’s Kappa statistic, under the null
hypothesis of normal white noise, tests the Kappa value given by the following relation
against entries within a table (Fuller, 1976).
Reproduced with permission of the copyright owner. Further reproduction prohibited without permission.

Where m = (n-1)/2 if n is odd
= n/2 if n is even
In(wk) ~ Periodogram ordinate
w fc = ( 2 h k ) M
n = Number of observation
In(L) = Largest periodogram ordinate in a sample
If £ > (Value)mt a then null hypothesis is rejected. (Value)m< a is the value ob
tained from a table for a significance level of a.
Almost all the annual time series of precipitation indicated white noise when
Fisher’s Kappa statistics were applied. Data of only one station (Station No. 1403)
showed statistically significant cycle of two to three years. Two to three year cycle was
also found to be statistically significant by Kolmogorov-Smironov test but not by the
Kappa test for the station 1104. The 73-year long precipitation record at Kathmandu also
shows 2.5-year cycle at five per cent level of significance. The white noise test applied to
the long term temperature data of three stations of the Kosi basin shows that the null hy
pothesis of white noise is not rejected in the case of two stations (1206 and 1405) but is
rejected in the case of station 1303.
Analysis of discharge data for five stations (620, 670,680, 690, and 695) indicates
white noise for all the cases except one (620) which shows 15 year's cycle. Station No.
Reproduced with permission of the copyright owner. Further reproduction prohibited without permission.

58
690 shows 11.5-year cycle under Kolmogorov-Simironov test, but none under the Kappa
test.
Discussion
Regular monitoring of the Himalayas for land-use and climatic changes represents
a significant challenge and the existing operational hydrological and meteorological tech
niques are not adequate for climatic monitoring in remote areas. Meteorological and hy
drological information, although not long enough for historical climate change studies,
covers the most important period. It covers the recent 30 to 50 years which is the period
of major concern regarding high population growth rate in the region and the enhanced
greenhouse warming. The processed and analyzed meteorological and hydrological data
are consistent, homogeneous, and fairly regular for the majority of the stations. Due to
strong seasonal influences, the monthly time series are not normally distributed; but the
annual data or the data for particular months for most of the hydrological and meteoro
logical elements are good for analysis using parametric statistics. Some time series data
show significant periodicities; but the periodicities are not homogeneous. In summary,
nonparametric statistics are better suited for the analysis of meteorological and hydro-
logical time series while parametric statistics can be used for annual series of annual and
monthly values with due caution.
DEM is the only information that does not need regular monitoring but is a major
factor influencing the climate of the region. Application of DEM within a GIS is proba
bly the best means available for modeling hydrology and other environmental aspects at
present. Out of the available ten minute resolution DEM and 30 arc second resolution
DEM, the first one is almost useless as it can not capture the drainage pattern correctly
Reproduced with permission of the copyright owner. Further reproduction prohibited without permission.

59
for the Himalayan topography while the later is adequate for meso-scale hydrological
modeling.
Available land-use data are good for qualitative assessment of land-use changes
for about 30 years from 1950 to 1980. Quantitative assessment based on this information
should be considered approximate. There is no scope for statistical interpretation and
analysis of land-use data. Decadal national censuses o f Nepal provide a reliable time se
ries of anthropogenic data for the Himalayan region in Nepal.
Reproduced with permission of the copyright owner. Further reproduction prohibited without permission.

CHAPTER V
METHODOLOGY
As described in the earlier chapters, this study considers the following two major
aspects for the assessment of climatic changes over the Kosi basin.
• Evaluation of existing meteorological and hydrological information using sta
tistical tools, and
• Evaluation on the basis of hydrological principles.
The following sections describe the hypothesis, major approaches, and methods
used in the study.
Statement of Hypothesis
Using the observed climatic and hydrologic records, we tested the hypothesis that
observed climatic trends in the Himalayan basin reflect a stationary climate. An alternate
hypothesis is that the observed trends in climatic records indicate significant change in
climate.
The null hypothesis in the case of hydrological impacts due to changes in climate
and land-use is that the hydrological variables do not show statistically significant trends.
The alternate hypothesis, in this case, is that significant trends are evident in hydrological
variables. Discharges of the main river and its major tributaries are the main hydrological
variables used to test the hypothesis. We also used sediment records to supplement the
tests obtained using discharge records.
Reproduced with permission of the copyright owner. Further reproduction prohibited without permission.

Characteristics of Time Series
All the climatic and hydrologic data used in this study have a strong seasonal
component due to the influence of monsoonal climate in the region. As a first attempt to
assess the general long term characteristics of the time series, we used X -ll method
(Kendall & Ord, 1990; SAS, 1993) to deseasonalize the data. The basic of the X -ll
procedure is to separate time series into seasonal component, trend-cycle component, and
random component. The additive model used in this procedure can be given as:
X= C + 5 + 7, (V-l)
where X is the original time series, C is the trend cycle component, S is the seasonal
component, and / is the irregular component. The trend cycle component obtained in this
fashion gives a clearer picture of the long term progression along with the long term
periodic characteristics of a time series.
A series of 12 month moving averages is the first approximation of trend-cycle
component computed in the X -ll method. The program in this method subtracts this
component from the original series to obtain the sum of irregular and seasonal compo
nents. The moving average of this combined seasonal plus irregular component gives the
preliminary estimate of seasonal component. The irregular component is the residual
after removal of the seasonal component from seasonal plus irregular component. As its
second iteration, the program adjusts the original series using a moving standard devia
tion of irregular components. The program computes the final series of trend-cycle,
seasonal, and irregular components in its third iteration. The details of the computation
are given in SAS (1993).
Reproduced with permission of the copyright owner. Further reproduction prohibited without permission.

62
Analysis of Trend
Common statistical methods used to test the hypothesis of the existence of a long
term trend can be divided into two broad categories: parametric and nonparametric.
Several methods are available in both of these categories (Helsel & Hirsch, 1992). The
following sections describe the methods used to assess time series data and their trends
from each of these two categories.
Parametric Method
A simple linear trend can be computed by using the linear equation:
y = a + b *T, (V-2)
where y is the variable used to test the trend, T is the time variable of the time series, and
a and b are the coefficients of the equation obtained by regression. The coefficient b,
which is slope of the regression line, is an indicator of the trend. Null hypothesis (6=0) is
tested using t statistics given as:
y /N -2t = (V-3)" V l- r2
where N is the number of observations and r is the correlation coefficient. The null
hypothesis is rejected if / > t j . ^ u where a is the significance level and u is the degrees
of freedom. The parametric method is considered a powerful method for testing trend
(Helsel & Hirsch, 1992); however, we note that the normality of residuals is a basic
requirement for the application of this method.
Reproduced with permission of the copyright owner. Further reproduction prohibited without permission.

63
Nonparametric Method
The nonparametric method used in this study is the seasonal Kendall test (Smith,
Hirsch, & Slack, 1982). The method, based on a modified form of Kendall’s r, computes
statistics for different seasonal divisions independent of each other. Kendall’s S statistics
are computed for rth season by the following relation:
S i= P i -Qi, (V*4)
where P\ is the number o f positive values and Qi is the number of negative values ob
tained by subtracting each value of the series to subsequent values. The Kendall’s r for a
given month is computed by using the following equation:
r / = ~ ( -A ’ W ~ 5)«/(«/-1)
The significance of r is assessed by evaluating the value of 5/ against the p-values
for Kendall’s r. For larger samples (>I0), the Kendall’s statistics are approximated by
the normal distribution (Helsel & Hirsch, 1992). Standard normal deviates (Z-statistics)
are then computed as (Smith, Hirsch, & Slack, 1982):
z Sy-1 , if Si >0 (V-6a)' JVariS,)
2,= 0 , if Sj= 0 (V-6b)
iS +1z, = ■ if 5/<0 (V-6c)
' J r a r ( S , ) ’
Far (Si) is computed by using the following relation:
Reproduced with permission of the copyright owner. Further reproduction prohibited without permission.

64
(V-7)
where #1/ is the number of data for / season. The 2/ values are then used to test the null
hypothesis by using critical values of standard normal distribution. Equation (V-7) is
changed to the following form if ties (zero difference between compared values) are
present in the series.
M « . ) =»,(», - I X 2^ + 5 ) - Z ' j WO’-1 X 27 + 5)
j =I
18(V- 8)
where tj is the tie of extent j .
Overall trend of the whole series for a given station is obtained by the Kendall's S
statistics adding all the seasonal S statistics.
s = £ s ,(V-9)
1=1
where m is the number of seasons. The slope of the trend line, in this method, is obtained
by computing median value of Djj where Djj is given as:
Ay=— - 7 i - j
(V-10)
where x/ and xj are consecutive ith and jth values of the variable.
For obtaining the basinwide trend, we used the methods described by Belle and
Hughes (1984). Global trends in these methods are assessed in terms of seasonal hetero
geneity, site heterogeneity, and the combined site-season heterogeneity. The trends with
Reproduced with permission of the copyright owner. Further reproduction prohibited without permission.

65
m seasons and n stations are tested against x using the following formulation and de
grees of freedom.
a) Total x2 with m*n degree of freedom is given as:
m n
i z v/= ! v = l
b) Homogeneity with (m*n -1) degree of freedom is given as:
nt it -z.y<=l 7=1
c) Seasonal homogeneity with (m-1) degree of freedom is given as:
nt
« £ ( Z , - Z . . ) 2;=l
d) Site homogeneity with (n-1) degree of freedom is given as:
nt
mS ( z > - z - ) !/= !
e) Site-season homogeneity with (m-l)(n-l) degree of freedom is given as:
nt n
I I ( Z , - Z , . - Z J + Z..)J1=1 7=1
f) Trend with one degree of freedom is given as:
mk(Z..)2
The subscripts i, and j , in the above expressions given above, indicate season and
station respectively. The subscript /. indicates average of all the stations in a basin
obtained for each season. Similarly, j indicates average of all seasons obtained for each
station and.. indicates an overall average.
Reproduced with permission of the copyright owner. Further reproduction prohibited without permission.

66
If the x for the given degrees of freedom is nonsignificant in all the cases of site,
season, and site-season then the null hypothesis of homogeneous trend is not rejected. In
such instances, we can test the overall trend for a basin using the expression (f).
Modeling
Watershed and regional scale modeling are widely used for assessing the impacts
of land-use changes (Henderson-Sellers et al., 1993; Kite, 1993) and the impacts of
climatic changes (Nikolaidis, Hu, Ecsedy, & Lin, 1993; Panagoulia, 1991; Rind, Ro-
senzweig & Goldberg, 1992) on hydrology. Such models are useful to simulate the
effects of predicted changes on hydrology of a basin. We used the following two ap
proaches to evaluate the expected hydrologic impact over the Kosi basin as a result of
conceivable climatic changes and land-use changes.
Lumped Approach
Basin wide Water Balance. We used the methodology proposed by Wigley and
Jones (1985) for assessing C02 induced global warming effect on runoff characteristics.
The method, summarized by Dingman (1994) can be given as:
RO = P - ET, (V - 11)
where RO, P, and ET are runoff, precipitation and evapotranspiration respectively.
Similarly, the long term average runoff can also be defined as:
RO = w*P, (V-12)
where w is the runoff ratio obtained by dividing long term runoff by long term precipita
tion. The value of w depends on basin characteristics. The following expression can be
obtained for change in runoff by solving the equations (VI-11) and (VI-12).
Reproduced with permission of the copyright owner. Further reproduction prohibited without permission.

where, e and p are the fraction of change in evaporation and precipitation respectively as
a result of climatic changes as well as changes in C 02 of the atmosphere.
For the evaluation of changes in runoff using equation (VI-13), we used the pre
cipitation scenarios applicable for the south Asia in general and the Kosi basin in par
ticular (Chapter X). Evaluation of e needs the assessment of evaporation changes due to:
temperature change, land-use change and CO, change. The multiplicative effects o f these
three variables are used to compute e given as (Wigley & Jones, 1985).
e = e / * e 2 * e j (V-14)
where e / t e2t and e j are the factors affecting evapotranspiration due to temperature
change, land-use change and C02 change, respectively.
We used Table VII-6 and Table VII-8 to compute change in evapotranspiration
due to change in temperature (e/). For the computation of ej-, the change in evapotran
spiration due to change in forest cover, we used the semi-empirical Calder-Newson
model (Calder & Newson, 1979) given as:
E = PET + f(a*P - b*PET), (V-l5)
where E is the total water loss due to evapotranspiration including interception loss, PET
is the potential evapotranspiration of the basin, f is the fraction of watershed with full
canopy cover, a is the interception fraction, and b is the fraction of year canopy is wet.
Evapotranspiration from the plants is expected to be suppressed in a scenario of
increased C 02 due to progressive reduction in photorespiration and stomatal openings
(Kimball, Mauney, Nakayama, & Idso, 1993; Kirschbaum, 1996; Mooney, Drake,
Reproduced with permission of the copyright owner. Further reproduction prohibited without permission.

68
Luxmoore, Oechel, & Pitelka, 1991; Nonhebel, 1996). We used the following approxi
mate relationship for the computation of es which is the C 02 induced evapotranspiration
factor (Wigley & Jones, 1985).
e$ = 1- 0.3*d, (V-16)
where d is fraction of vegetated area of the watershed.
Statistical Approach. Regression analysis provides information on the strength of
association between streamflow and basin characteristics including climatic variables.
We used this approach to examine the role of vulnerable climatic variables and basin
characteristics in influencing the flow regime of the basin. For instance, only the low
laying areas and valleys o f the basin are vulnerable to land-use changes whereas the
climatic changes may influence snow cover and snowmelt in high elevation zones and
evapotranspiration and precipitation throughout a basin. Hence, significant correlation of
streamflow with low elevation areas may suggest the vulnerability of hydrology due to
land-use change in a basin. Similarly, the strong correlation of high elevation areas with
river discharge is likely to suggest vulnerabilities of land surface hydrology to possible
changes in snow cover due to climatic changes.
Distributed Deterministic M odel
We used the grid based deterministic Water Balance Model (WBM) to study the
land-use as well as climate change impact on hydrology. The model (Vorosmarty et al.,
1989; Vorosmarty & Moore, 1991; Vorosmarty et al., 1996) is based on explicit soil
moisture accounting for each grid. It computes runoff as a residual of the water balance
equation. The model uses monthly input information on precipitation, potential evapo
transpiration, temperature, soil texture, vegetation cover and DEM to compute runoff and
Reproduced with permission of the copyright owner. Further reproduction prohibited without permission.

69
its components. Total runoff for an individual month is computed as 50 per cent of the
detention storage of moisture in soil when precipitation and snowmelt do not meet soil
moisture deficit. If the moisture input to the soil exceeds field capacity then the model
uses the following equation (Equation V-17) to compute runoff.
ROi = 0.5 [Di + Pi(Pi + SRi - PET0], (V-17)
where RO[, Di, Pj, SRi, and PETi are runoff, detention storage, precipitation, snowmelt,
recharge, and potential evapotranspiration respectively for ith cell. The factor pi is
defined as:
(V ' 18)
The model accounts for snowmelt depending on the threshold air temperature of -
1° C. Vegetative cover plays a role in the model by influencing the total porosity of soil
for holding water. The water capacity, defined in the model as field capacity minus
wilting point, is calculated using the soil texture and rooting depth information. The
model considers the root depth for all types of vegetation in lithosol as 0.1 m. The root
depth of forest varies from 0.1 m for lithosol to 2.5 m for sandy soil. Root depth for
grassland varies from 0.1 m to 1.3 m, the latter being the root depth of grassland in silt
loam. Water holding capacity varies from 14 per cent for lithosol to 48.5 per cent for
clay (Vorosmarty et al., 1989).
Reproduced with permission of the copyright owner. Further reproduction prohibited without permission.

CHAPTER VI
ANTHROPOGENIC CHANGES
Anthropogenic changes, including land-use alterations, are the likely sources of
global climatic changes (Tolba, 1992). The land-use alterations are the direct impact of
food, fuel, and construction needs of population. Although quantitative estimates of these
population needs vary from author to author and from one region to another (Applegate &
Gilmour, 1987; Mahat, 1987), these are the major factors blamed for deforestation in Ne
pal (Chapter I & Chapter HI).
Population Pressure
Some recent and reasonable estimates of forest needs applicable to the Kosi basin
(Applegate & Gilmour, 1987; Mahat, 1987; Rieger, 1981; Bajracharya, 1985) show that
the per capita wood consumption exceeds one cubic meter in a year of which fuel wood
approaches 90 per cent of the total consumption. Mahat (1987) calculates a ratio of about
1:4 between agriculture and forest land to meet the basic requirements of the forest prod
ucts. Available information (Table VI-3 & Table VI-4) shows that the ratio between ag
ricultural land and forest land is about 1:2 which indicates the deficiency of forest to meet
basic requirements of the population.
Human Population
Figure VI-1 shows the trend of population in Nepal and in the Kosi basin obtained
from CBS data. Similarly, Table VI-1 presents population density and population growth
Reproduced with permission of the copyright owner. Further reproduction prohibited without permission.

71
rates for different districts in the Kosi basin. The table includes three surveys of the re
cent past.
(a ) POPULATION TREND: NEPAL
20,000,000 -
15.000.000 .
10.000.000 _5,000,000 ■------ ■
0 _______CMCD
Ocn07 m
coLO07 co07 fv.cn
ooCD
CDCD
(b) POPULATION TREND: KOSI BASIN
2.500.000,2.000.000 , 1,500,000-1,000,000-
500.000-0 -
oCMcn
cn07cnn- ld
O ) CDCO07 rs.
CDCDG7 (D07
Figure VI-1. Population trend in (a) Nepal and (b) the Kosi basin.
Figure VI-1 shows that the population remained almost static up to 1952. Annual
growth rate of population in Nepal started increasing rapidly exceeding two per cent per
annum in the following years. Despite such increase, the population growth rate in the
Kosi basin remained relatively low. National average increase of population in Nepal
exceeded two per cent per annum in both the decades considered in Table VI-1; whereas,
the compound growth rate was about one per cent per annum in the Kosi basin. A major
Reproduced with permission of the copyright owner. Further reproduction prohibited without permission.

72
reason behind the lower rate of population growth in the basin is believed to be the effect
of migration of people towards Tarai (low laying plain areas outside the Kosi basin con
sidered in this study) and cities. High population growth rates in Tarai indicate such
large scale migration (Gurung, 1991; CBS, 1987).
Table VI-1. Area and population density in the districts of Nepal and the Tibet autono-mous region of China that lie in the Kosi basin.
Area(km2)
Pop.Density
(Person/km2)1971
Pop.Density
(Person/km2)1981
Pop.Density
(Person/km2)1991
Pop.
1971-81
Growth
1981-91
Rate
1971-91
Taplejung 3646 23.2 33.1 32.9 3.63 -0.06 1.77Panchthar 1241 117.5 123.9 141.2 0.53 1.32 0.92Dhankuta 891 120.8 145.7 164.3 1.89 1.21 1.55Terhathum 679 175.7 136.2 151.5 -2.52 1.07 -0.74Sankhuwasabha 3480 32.8 37.2 40.8 1.26 0.93 1.09Bhojpur 1507 129.1 127.9 131.9 -0.10 0.31 0.11Solukhumbu 3312 31.8 26.6 29.3 -1.75 0.97 -0.40Okhaldhunga 1074 114.4 128.2 129.8 1.14 0.13 0.64Khotang 1591 102.6 133.6 135.7 2.68 0.16 1.41Ramechhap 1546 101.8 104.4 121.6 0.26 1.54 0.89Dolakha 2191 59.3 68.7 79.1 1.49 1.41 1.45Sindhupalchowk 2542 81.2 91.4 102.7 1.19 1.17 1.18Kavrepalanchowk* 1396 175.6 202.2 213.6 2.28 0.55 1.41Tibet** 29500 2.1 2.5 2.9 1.76 1.32 1.54
Kosi Basin 54000 37.1 41.5 45.5 1.15 0.91 1.03Nepal 147181 78.5 102.1 125.6 2.66 2.10 2.41
Data from CBS (1987, 1993) and The Population Atlas o f China (1987)* A small area o f Kavrepalanchowk (less than 10 %) does not lie in the Kosi basin. The other two districts (Sindhuli and Udaipur), not listed in the table, contribute some (less than five per cent each) drainage to the Kosi basin.
** The population for the Tibetan part of the Kosi basin is available only for 1982. Estimates o f population density for other years are based on the population growth rate o f the Tibetan autonomous region.
The density of population as well as population growth rate varies widely within
the basin (Table VI-1). The range of population density among districts lying in the Kosi
Reproduced with permission of the copyright owner. Further reproduction prohibited without permission.

73
basin in Nepal ranges from 29 persons/km2 (Solukhumbu district) to 232 persons/km2
(Kavrepalanchowk district). The density is only about 2 persons/km2 to 3 persons/km2 in
more than 50 per cent of the basin lying in Tibet Similarly, the population growth rate
within the basin varies from negative rates (as low as -2.52 per cent per annum in Ter-
hathum) in some of the districts to more than three per cent per annum (as high as 3.63
per cent per annum in Taplejung during 1971-81). Average compound growth rates for
the basin for 1971-81 and 1981-91 are 1.15 and 0.91 respectively. These rates are the
lowest when compared with the rates for similar regions in Nepal (Gurung, 1991).
Livestock Population
Livestock is a major component of agrarian socio-economy that dominates the
Kosi basin. An estimate made by Shrestha (1989) in a Haat (weekly market) of a district
head-quarter in the Kosi basin shows the product of animal origin exceeding quarter of
the value of all products.
Land-use products are used by livestock in different forms. Plants and agriculture
residue are used for fodder and grasslands are used for grazing. Livestock, hence, con
tributes to the depletion of forest and disturbance o f soil surfaces resulting in the changes
in surface and sediment characteristics (Lee, 1980). The livestock population becomes
more important in high elevation areas due to significantly higher humanrlivestock ratio
(Ekvall, 1968; Shrestha, 1989).
Unlike human population, information on livestock population is severely lack
ing. Not much historical information of livestock in Kosi basin is available. A recent
survey (1981-82) shows the following statistics (Table VI-2) of livestock in different po
litical division of the Kosi basin
Reproduced with permission of the copyright owner. Further reproduction prohibited without permission.

74
Table VI-2. Livestock population in the districts of Nepal and the Tibet autonomous re- gion of China that lie in the Kosi basin.D i s t r i c t s C a t t l e Y a k B u f f a l o e s G o a t s a n d
s h e e p
T o t a l R a t i o
U v e s t o c k : h u m a n :
Taplejung 82723 1382 22784 67080 173969 1.44Panchthar 70069 25151 86334 181554 1.18Dhankuta 56260 10600 76269 143129 1.10Terhathum 48166 14939 65379 128484 1.39Sankhuwasabha 115357 934 22708 83028 222027 1.72Bhojpur 118969 39895 96103 254967 1.32Solukhumbu 33307 8515 11445 18272 71539 0.81Okhaldhunga 64666 41746 61938 168350 1.22Khotang 134093 66961 93611 294665 1.39Ramechhap 66300 34276 91437 192013 1.19Dolakha 77960 17628 36909 129808 262305 1.74Sindhupalchowk 111816 2777 61378 124123 300094 1.29Kavrepalanchowk 124467 62992 132811 320270 1.13
Kosi in Nepal 1104153 31236 451784 1126193 2713366 1.29Kosi Basin 1104153 451784Nepal 6501577 55499 2379723 4320762 5071209 0.88
Data from CBS(1993)
Table VI-2 shows that the population of livestock exceeds human population in
almost all the mountainous districts of the Kosi basin. The only district with lesser live
stock than human population is Solukhumbu where the economy is strongly influenced
by tourism and mountaineering. The table also shows that the livestockrhuman ratio is
higher in the high mountain districts (Taplejung, Sankhuwasabha, Dolakha) than in the
middle mountain districts. Although no information is available for the Tibetan part of
the basin, studies in similar part of Tibet indicate the livestockihuman ratio as high as 6:1
(Rongzu, 1989). The ratios o f Table VI-2 can be used for an approximate estimate of the
historical trend of livestock changes over the districts; since similar trends can be ex
pected in the region as long as the socio-economy pattern does not change.
Reproduced with permission of the copyright owner. Further reproduction prohibited without permission.

75
Land-Use Changes
Lack of information on forest cover before the 1960s and the debate on the pattern
of land use change in mountainous areas of Nepal in the last four decades have already
been discussed in Chapter III. Considering these discussions, including our evaluation of
data sources, and an assessment of physiographic conditions of the basin, we derived
some conclusive facts as described in the following paragraphs.
Considering anthropogenic influence on land-use over the basin, the Kosi basin
can be divided into the following two major parts.
Higher Elevation Zone
Higher elevation zones, considered here, are the areas lying 4000 m above sea
level. As almost all the areas in this zone are inaccessible; there are negligible agriculture
and other human activities except in a small section of the Himalayas explored for tour
ism, such as, Sagarmatha National Park. This zone can be considered as an area free
from land use change for meso-scale hydrological and climatic modeling. About 55 per
cent o f the basin lies in this elevation zone (Figure II-3).
Lower Elevation Zone
Being a zone of agriculture, grazing, and timber harvesting, significant anthropo
genic influence on land-use pattern can be expected in this region. Lower elevation zone,
lying below 4000 m elevation occupies about forty-five per cent of the total basin area.
Except for a small corridor of the Arun valley in Tibet, almost all the areas of the basin
below 4,000 m lie in the southern part of the Himalayas in Nepal
The two major surveys carried out in the 1960s and 1970s in Nepal provide land-
use data on nationwide basis. The data from the first forest survey published in 1973
Reproduced with permission of the copyright owner. Further reproduction prohibited without permission.

76
(Department of Forest [DOF], 1973) indicate forest cover areas of 54.7% and grassland of
5.5%. Although the areas covered by the survey do not include all the study area, the
statistics can be assumed fairly representative for the hill areas and mountainous areas of
the Kosi basin. The map, presented in a DOF (1973, p. 9) publication, shows the forest
cover areas ranging from less than 25 per cent in eastern part of the basin to more than 75
per cent in some areas of the Mahabharat range. Most of the surveyed areas fall in the
class o f 50 per cent to 75 per cent forest cover.
The forest cover data, developed for the Kosi basin using recent survey (Survey
Department, 1984) in Nepal and published literature on land use in Tibet (Chapter III),
are presented in Figure IV-4. Table VI-3 presents the accumulated land use in different
classes. Table VI-4 presents the table of accumulated areas for the region below 4000 m.
Table VI-3. Land-use in the Kosi basin in the late 1970s.Classification Area (km Per centIntense Agriculture (75 to 100 %) 948 1.7M edium Agriculture (50 to 75 %) 4520 8.2Light Agriculture (25 to 50%) 1740 3.2Subtropical/Temperature grazing land 217 0.4C ool temperature/Sub-alpine grazing land 849 1.5A lpine 17800 32.3Rock/boulder 7170 14.8Ice/snow 8180 13.0Lake 90 0.2Shrub 1320 2.4Hardwood/mixed forest 11400 20.7Coniferous forest 947 1.7Total 55200 100
Data obtained from the reclassified map (Figure IV-4). Cell size used to derive the data is 111 m.
Reproduced with permission of the copyright owner. Further reproduction prohibited without permission.

77
Table VI-4. Land-use in the Kosi basin below 4000 m in the late 1970s.Classification Area (km%) Per centIntense Agriculture (75 to 100 %) 956 4.5Medium Agriculture (50 to 75 %) 4490 21Light Agriculture (25 to 50%) 174 0.8Subtropical/Temperature grazing land 213 1Cool temperature/Sub-alpine grazing land 661 3.1Alpine 350 1.6Rock/Boulder 576 2.7Ice/Snow 677 3.2Lake 0 0.0Shrub 1260 5.9Hardwood/Mixed forest 11200 52.4Coniferous forest 822 3.8Total 21400 100
The data are based on the reclassified land-use map (Figure IV-4) overlaid over the topography map (Figure II-3). Cell size of the grid used to derive the data is 1331 m.
Although Table VI-3 presents data for the whole basin, only the data presented in
Table VI-4 can be compared to the forest data of the basin prior to 1965. Even if the ar
eas considered are not exactly the same in these two cases, data presented in percentage
terms can be compared with enough confidence for the Mahabharat and the middle
mountain areas of Nepal. The following table (Table VI-5) presents the comparison of
forest and grassland estimates of the two major surveys.
Table VI-5. Comparison of forest cover in the Mahabharat and the middle mountain re-gion of the Kosi basin during 1964-65 and 1978-79.
Percentages o f Forest cover 1964-65
Percentage o f Forest Cover 1979-80
Forest Cover 54.7 56.2Shrub 5.9Grassland 5.5 4.1Total 60.2 66.1
Reproduced with permission of the copyright owner. Further reproduction prohibited without permission.

78
Table VI-5 indicates slightly higher forest area in recent period compared to the
past survey; nevertheless the quantity and quality of data are not enough to make conclu
sive remarks. Several limitations are likely to play their role in proper assessment of
land-use changes. The factors such as, differences in survey methods, data analyses pro
cedure, and presentation techniques may influence the outcomes besides some difference
in areas covered during the two surveys. Since the percentage data presented in the table
above (Table VI-5) are not much different, the information cannot be considered suffi
cient to reject the null hypothesis (no change in land-use). Lack of information about the
changes in forest density and inadequacy of data for statistical time series modeling con
strains the scope of our conclusions.
Discussion
Eradication of fatal diseases, such as malaria, and improvement in health sector in
Nepal resulted in a dramatic rise in population during the last 50 years. Since the popu
lation remained almost static in the earlier half of this century, the population explosion
can be considered a recent phenomenon. The average annual population growth rate of
about 2.1 per cent, observed in Nepal during 1981-91, is almost equal to the average of
less developed countries during 1985-90 (Bulatao, Bos, Stephens, & Vu, 1990). Consid
ering the fragile mountain environment of Nepal, the rate o f population growth has been a
major concern among planners because of considerable link between natural resources
and population factors.
Average population growth rate of about one per cent per annum in the Kosi basin
during the last two decades, indicates a modest population pressure. The rate is close to
the rate of population growth in the USA for the same period. Since the computation is
Reproduced with permission of the copyright owner. Further reproduction prohibited without permission.

79
not based on birth rates and death rates, the actual population growth rate can be expected
to be higher than one per cent as a significant migration trend exists in the region. Al
though the population growths indicate a modest rise, the pressure of livestock to forest
and grazing land is increasing at a rate higher than the pressure o f human population due
to high livestockihuman ratio.
A general assessment of the available information suggests that the population
pressure in Nepal, reflected by high population growth rates, is generating more impacts
in foothills, plain areas, and cities than in the mountainous region. For instance, the rec
ords of the Ramechhap district, in the central part of the Kosi basin, indicate the popula
tion growth rate of 0.53 per cent per annum during 1971- 81 (Table VI-1). Population
growth rate for the same period in an inner Tarai (Sub-Himalaya) district of Sindhuli,
south of Ramechhap, remained 2.2 per cent. The growth rate for that period was 8.2 per
cent per annum in Sarlahi, a Tarai (plain) district south of Sindhuli (CBS, 1987). During
the similar period, the plain areas of Nepal lost almost 24 per cent o f forest areas to agri
culture lands (Gilmour, 1991).
The distribution of Tarai and mountain population in Nepal was 35 per cent and
65 per cent, respectively in 1952/54. This proportion of population has changed to al
most 50 per cent in recent years. Economical opportunities and increasing communica
tion facilities in Tarai have encouraged the downward migration of m ountain and hill
people. Such migration trends are likely to continue and the existing trends of human and
livestock populations are likely to remain similar in the Kosi basin for several years to
come. Under the assumption of existing population growth rate, the present population of
the Kosi basin is likely to double in seventy to seventy-five years.
Reproduced with permission of the copyright owner. Further reproduction prohibited without permission.

80
A general evaluation of the requirement of land-use for the rising population and
livestock clearly shows pressure on forest and land resources which is less than sustain
able in a business as usual scenario. On the other hand, the land-use data based on two
extensive surveys of fifties and seventies do not show distinct trends in forest depletion.
Although the land-use data suffer from several sources of uncertainties with respect to
survey techniques, data processing techniques and the differences in areas covered, the
statistics clearly indicate that the deforestation rate in the mountainous areas of the Kosi
basin is not alarming. Some depletion of forest areas can be predicted for the future on
the basis o f population needs and the supply capacity of forest. Such predictions are,
nonetheless, subject to several uncertainties as the rate of deforestation is highly depend
ent on political factors, community afforestation programs, and public awareness besides
other natural processes.
Reproduced with permission of the copyright owner. Further reproduction prohibited without permission.

CHAPTER VII
HYDRO-CLIMATIC CHANGES
This chapter describes the statistical analyses of meteorological and hydrological
data carried out to examine hydro-climatic trends over the Kosi basin. Along with the
available data within the Kosi basin, we also analyzed the meteorological records of
Kathmandu. Kathmandu provides the longest meteorological time series in the area near
est to the region considered in this study.
Temperature Changes
Temperature Trends in Kathmandu
Although Kathmandu does not lie in the study area, it is the closest location of the
Kosi basin with long term climatological data. Station No. 1014, located at the Indian
Embassy in Kathmandu, is the only station with a 50 plus years regular temperature rec
ords in Nepal. The temperature records for this station are available from 1921 through
1975. DHM discontinued the publication of climatologic records for this station from
1975. We used the data available from the aeronautical meteorological station located at
Kathmandu airport to supplement these records. Figure VII-1(a) and Figure VII- 1(b) pre
sent the monthly time series of average maximum temperature for Station No. 1014 and
Station No. 1030 respectively by separating the series into trend-cycle component, sea
sonal component and irregular component using X-l 1 method. Similarly, Figure VII-1(f)
and Figure VII-1(g) present these time series components of minimum temperature for
Reproduced with permission of the copyright owner. Further reproduction prohibited without permission.

82
the same stations. Out of these figures, only the maximum temperature records at Station
No. 1030 show a distinctly rising trend of temperature since the start of its records in
1968.
Application of Student’s t statistics on the long term means of temperature data
recorded at Station No. 1014 and at Station No. 1030 in Kathmandu show that the two
data series cannot be considered as belonging to the same population. Hence, the tem
perature records collected from these two stations are treated separately for statistical
analysis.
Figure VII-2 shows the temperature anomaly of two stations in Kathmandu val
ley. The period of reference mean is 1951 to 1975 which is the period considered by
Vinikov, Groisman, and Lugina (1994) for the computation of global climatic trend. The
reference mean period for Kathmandu airport is from 1968 to 1975.
Comparison of the anomalies between the two stations during overlapping period
from 1968 to 1975 shows a similar pattern (Figure VII- 4). Hence, despite the significant
difference in long term mean, we combined the records of these two stations to obtain the
long term series of temperature anomaly covering the period from 1921 through 1992.
A combined picture of the anomalies of the two stations (Figure VII-2) shows that
Kathmandu experienced a long term decreasing trend of temperature from 1921 to mid-
1960s followed by an increasing trend until only recently. The patterns of trends, how
ever, are not the same between maximum and minimum temperature. Statistical analyses
of the trend of maximum and minimum temperature for these two stations are presented
in Table VII-1.
Reproduced with permission of the copyright owner. Further reproduction prohibited without permission.

83
Table VII-1. Statistical significance of maximum temperature trend in Kathmandu at twolocations during two different periods.
Station: Y ear:
10141921-1975
Station:Year:
10301968-92
Parametric Nonparametric Parametric NonparametricJan ns ns +1% +1%Feb ns ns +1% +1%mar ns -5% ns nsApr ns ns ns ns
May ns ns ns nsJun -5% -5% +1% +1%Jul -1% -1% +5% +5%
Aug -1% -1% +1% +1%Sep -5% -1% +1% +1%Oct ns ns +1% +1%
Nov ns ns +1% +1%Dec +5% +5% +1% +1%Ann -5% -1% +1% +1%
Table VII-2: Statistical significance of minimum temperature trend in Kathmandu at two locations during two different periods.
Station:Year:
10141921-75
Station:Year:
1030 1968 -92
Parametric Nonparametric Parametric NonparametricJan ns ns ns nsFeb -1% -1% ns nsMar ns ns ns nsApr ns ns ns ns
May ns -5% ns nsJun ns ns ns nsJul -1% -1% ns ns
Aug -1% -1% ns nsSep -5% -5% ns nsOct ns ns ns ns
Nov ns ns ns nsDec -1% -1% ns nsAnn -1% -1% ns ns
Assessment of temperature anomaly (Figure VII-2) and statistics of trend (Table
VII-1 and Table VII-2), leads to the following observations:
• Overall decreasing trend of temperature from 1921 to 1967.
• Overall increasing trend of temperature from 1968 to near-present.
Reproduced with permission of the copyright owner. Further reproduction prohibited without permission.

84
• The increasing trend of average temperature from 1968 to 1992 is primarily
due to the increasing trend of maximum temperature as there is no increasing
trend of minimum temperature in this period. This observation is not similar
to the observation prior to 1968 when both the maximum and minimum tem
peratures show a decreasing trend.
The highest maximum temperature anomaly recorded so far is 2.2 °C above refer
ence temperature, recorded in 1989. The average temperature anomaly for the same year
is 0.90 °C above reference temperature. The average temperature anomaly of 1989, how
ever, is not much different from the anomalies observed in 1928 (0.81 °C), 1931 (0.75
°C), and 1932 (0.86 °C).
Since Kathmandu is a city of rapidly increasing urbanization, the increasing trend
of maximum temperature may be attributed to the heat island effect (Dingman, 1994).
Since the minimum temperature does not confirm the rising trend o f temperature, the null
hypothesis of insignificant trend of temperature change cannot be rejected.
Temperature Trend in the Kosi Basin
Out of ten climatological stations in the Kosi basin, only three stations, located at
Okhaldhunga, Chainpur and Taplejung, maintained fairly regular climatological records
for period exceeding 30 years. Figure VII-l(c to e) presents the trend-cycle component,
seasonal component and irregular component of maximum temperature for stations lo
cated at Okhaldhunga, Chainpur, and Taplejung (1206, 1303, and 1405) respectively.
Similarly, Figure VII-l(h to j) presents these components for minimum temperature for
the same stations: 1206, 1303 and 1405 respectively. Figure VII-3 illustrates the tem
Reproduced with permission of the copyright owner. Further reproduction prohibited without permission.

85
perature anomalies whereas Table VII-3 and Table VII-4 present the statistics of the sig
nificance o f trends for monthly and annual values for these three stations.
Table VII-3. Statistical significance of maximum temperature in three selected locations in the Kosi basin. Period of record is from 1962 through 1993 for stations 1206 and 1303. The period of record for Station No. 1405 is from 1962 through 1992.__________
Station: Parametric
1206Nonparametric
Station:Parametric
1303Nonparametric
Station:Parametric
1405Nonparametric
Jan ns ns ns ns ns nsFeb ns ns ns ns ns nsMar ns ns ns ns ns nsApr ns ns ns ns ns ns
May ns ns ns ns ns nsJun ns ns ns ns ns nsJul -5% ns ns ns ns ns
Aug -5% ns +5% ns ns nsSep -5% -5% +1% +5% ns nsOct ns ns +5% +5% ns ns
Nov ns ns +5% +5% ns nsDec ns ns +5% +5% ns nsAnn ns -1% +5% +1% ns ns
Table VII-4. Statistical significance of minimum temperature trend in three selected locations in the Kosi basin. Period of record is from 1962 through 1993 for stations 1206 and 1303. The period of record is 1962 through 1992 for station 1405.
Station: 1206 Station: 1303 Station: 1405Parametric Nonparametric Parametric Nonparametric Parametric Nonparametric
Jan +1% +1% ns ns ns nsFeb +5% ns ns ns ns nsMar ns ns ns ns ns nsApr ns ns ns ns ns ns
May ns ns ns ns ns nsJun +1% +1% ns ns ns nsJul +1% +1% ns ns ns ns
Aug +1% +1% ns ns ns nsSep +1% +1% ns ns ns nsOct +1% +5% ns ns ns ns
Nov +1% +1% ns ns ns nsDec +1% +1% ns ns ns nsAnn +1% +1% ns ns ns ns
Reproduced with permission of the copyright owner. Further reproduction prohibited without permission.

86
The plot of temperature anomalies (Figure VII-3) indicates a consistent pattern for
all the three stations from 1962 to the early 1970s and from late 1980s to the early 1990s.
The earlier period does not show a trend. A slight increasing trend exists during mid-
1980s to late-1980s. The records of recent years (early 1990s) show some decrease. Al
though the positive trend of maximum temperature at Station No. 1303 and the positive
trend of minimum temperature at Station No. 1206 are statistically significant at 5% and
1% level of significance (Table VII-3 and Table VII-4), tests for an overall trend for the
whole basin were not conclusive.
Figure VII-4 compares the average temperature anomaly for the Kosi basin and
eastern Nepal with the global average (Vinikov et al., 1994). The average for the Kosi
basin is the average o f stations 1206, 1303, and 1405 while average for the eastern Nepal
is computed by including the stations 1014 and 1030 in the above list. The pattern is
similar, especially, in the period after 1960 compared to the pattern of earlier periods.
Although the global average temperature anomaly during the period from 1920 to 1960
shows a slightly increasing trend, the records of Nepal indicate a decreasing trend for the
same period.
Table VII-5, below, presents the overall trends of average temperature obtained by
nonparametric method for major climatological stations over the basin. The table also
includes the trend of annual temperature obtained by parametric method for comparison
for the stations with relatively long record lengths.
Reproduced with permission of the copyright owner. Further reproduction prohibited without permission.

87
Table VII-5. Statistical significance of the trend of average temperature in the Kosi basin for selected stations.
Station No. Period Parametric Nonparametric1036 1978-92 ns1103 1971 -92 + 1%1206 1963 - 93 +5% ns1209 1962 - 75 ns1220 1971 -93 + 1%1303 1962 - 93 ns + 1%1304 1976 - 93 + 1%1307 1973 - 93 + 1% + 5%1310 1962 - 76 + 5% + 1%1318 1971-84 + 5%1405 1962 - 76 ns + 5%
Figure VII-5 and Figure VII-6 present parametric and nonparametric trend of the
maximum temperature for each month. Similarly, the trends of minimum temperature are
given in Figure VII-7 and Figure VII-8. A general review of these figures and Table VII-
5 reveal the following nature of trends.
• As expected both the parametric and nonparametric methods lead to similar
results in most of the cases.
• Most of the stations do not show a significant trend.
• In contrast to the result of monthly trend indicated by monthly data, more sta
tions show positive overall trend (Figure VII-17) when nonparametric statis
tics are used.
Although the application of parametric statistics in the analyses revealed several
characteristics of trends in different locations of the basin, we used nonparametric statis
tics to obtain overall trend for the whole basin. Computation of overall trend is based on
assessment of the homogeneity of trend with respect to season and site as described in
Reproduced with permission of the copyright owner. Further reproduction prohibited without permission.

88
Chapter V. The choice of nonparametric statistics against parametric statistics is based
on the following criteria:
• Although most of the data used in parametric statistics are normally distrib
uted, some data deviate from normal distribution.
• Time series records of only few stations extend to more than thirty years.
Most of the available regular records are available for less than 15 years.
• Time series of several stations suffer from missing records. Nonparametric
statistics are less sensitive to missing values (Hirsch & Slack, 1984).
Table VII-6 shows the results of the homogeneity assessment of trend applying Z-
statistics. Appendix N gives the details of the computed Z-statistics for each month and
for all the stations used to compute the heterogeneity.
Table VII-6. Statistical significance: heterogeneity of basinwide nonparametric maximum temperature, minimum temperature, and average temperature trend in the Kosi basin.
MaximumTemperature
MinimumTemperature
AverageTemperature
Type Expression for df / a X* a 1? a
Seasonm
« £ (Z , - z . . ) !/«I
II 25 p<0.01 11 ns 15 ns
Sitem
1=112 110 p<0.005 191 p<0.005 31 p<0.005
Site-Season
m n
£ X ( z , - z , - 2 , - z . r1=1 y=i
132 233 p<0.005 118 ns 111 ns
Reproduced with permission of the copyright owner. Further reproduction prohibited without permission.

Reproduced
with perm
ission of the
copyright ow
ner. Further
reproduction prohibited
without
permission.
Maximum Temperature in Kathmandu (I.E.)Teiperature
ICelsiosiosj
j i i r i i j i i i i i | i i i i -> | i i i i i | » i i i t | i i > i i j
JAH20 OEC29 DEO) DEC 19 DEO) DEC 5 9 DEC79
Stalinn Hi) 1011
Seasonal Component
■10 .) , , ■ ■ i - 1—i i i i i j i o- i 7 ~ r ;- f
JAH20 DEO) DEC)) DEO)■ T J T T T T r p - 1—I I I |—
DEO) DEC6) DEO)
-PUtina. Ha-lflU
Trend Cycle Component
| r -i i i i 1 \ i i i i i | i i i i i | i i f n - j - i o m \ r i ' i \
JAN2D DEC2) DEO) DEO) DEO) DEO) DEO)
Station Ho. IQH
Irregular Component
■| -r i i-r -i | r i i i i | i i i i i | i-i h i |-t i* i r —i |- i - r i ■ i —
JAN20 DEC29 DEO) DEO) DEO) DEO) DEO)
F ig u r e V II—1. O r i g i n a l t im e s e r i e s o f m o n th ly maximum and minimum t e m p e r a t u r e and t h e i r s e a s o n a l , t r e n d c y c l e , and i r r e g u l a r com ponen ts .(a) Maximum temperature in Kathmandu (Indian Embassy, Station No. 1014) 00
vo

Reproduced
with perm
ission of the
copyright ow
ner. Further
reproduction prohibited
without
permission.
Maximum Temperature in Kathmandu (A.R)
m i DEC? 7
J jU L ia n J lf t.- lJM )
Seasonal Component
DEC?? DEC!?
Trend Cycle Component
JAHil- r — i------ (----
DEC? 7— I— >~
DECI7 DEC97
. Irregular Component
JAHil DEC77 DECI7 DEC91
________ SLdLioo-Ko_lAlfl
(b) Maximum temperature in Kathmandu (Airport, Station No. 1030)VOo

Reproduced
with perm
ission of the
copyright ow
ner. Further
reproduction prohibited
without
permission.
Maximum Temperature in OkhaldhungaTeioerature
(Celsius
JAM2 DEC1I-T— F-p-r
DECI1 DECJI-t—j—DEC01
_SLaLionJo._12Qf
Seasonal Component
I 1 ' l I i | i— l — i— r— I— |— I— i— i— i— i— j— i— i— ,— ,— ,— |—
■IMi DEC11 DEC!) DEC91 OEC01
Station J o . J2DI
Trend Cycle Component
f—t—r-JAW62
-I— T—TDEC71
-i—i—|—i—r-0EC61
-i—l—t—rDEC91
—iDEC01
StatknJiiJlM
Irregular Component
■j ,— i i— |— ,— |— ,— r i-
JAH62 DEC?I DEWi—r-r DEC91
(c) Maximum temperature in Okhaldhunga (Station No. 1206)
—i—i—i-DECOI
_StatiorUDu_L2lli

92
Reproduced with permission of the copyright owner. Further reproduction prohibited without permission.
(d)
Max
imum
te
mpe
ratu
re
in C
hain
pur
(Sta
tion
No
. 13
03)

Reproduced
with perm
ission of the
copyright ow
ner. Further
reproduction prohibited
without
permission.
Maximum Temperature in TaplejungTeaperature
(CelsiusU
ii
■)— i— l — i— i— i— |— i— i— 1— 1— i— |— r ~
DEC 61 DEC71 DECS!
]------1-----1 r - l ( 1 1 1 r~—I 1 1 r
DEC61 DEC71 DECI1
T TDEC?! DEC01
i—j—i—i—.—i—i—rDEC?I DECOI
_SLaLiMJt(L_Uli
Trend Cycle Component
If
i- 'DEC61
-r—f—r
DEC7I■i— |— I— i— r-
DECI1T I r
DEC?!- i — r - [ ~
DECOI
SUtiaa Ha. UP?
Irregular Component
~r ~>—j—*—i—i—i—i—|—i—i—i—i—i—p
DEC6I DEC71 DECI1 DEC)! DECOI
StaLion Do. H D ?(e) Maximum temperature in Taplejung (Station No. 1405)
vo

Reproduced
with perm
ission of the
copyright ow
ner. Further
reproduction prohibited
without
permission.
TeipeiatuieICelsius)
w m
' I r iM-fl I' I I I I '|T H -l11) | ‘f-| ITT |T» I I I | • l~l—I
JAN20 OEC29 DEC)) DEC49 DECS) DECS) DEC!)
JSU tion Up . 1011
Seasonal Component
JAN2D DEC29 DEC!) DEC!) DECS) DECS) DEC!)
.Station tin. 1D14
Trend Cycle Component
■ p - r r i 'T |T i r n - | i i i t—1‘ ; 1 f ■ -i i~r | -1- i ‘i-r- i p i ’i i i |—
JMI20 DEO) DEO) DEO) DECS) DEO) DEC?)
.Station Hn. 1011
Irregular Component
} » i » i i | i '? i~ r ‘i ’[ i r i i- i | i > i -r i~y > i t i i p i i r i i~ |
JAII20 DEC2) DEO) DEO) DECS) DECi) DEC?)
^ U L i n n J l a . J O l i(f) Minimum temperature in Kathmandu (Indian Embassy, Station No. 1014)
VO-p-
45

Reproduced
with perm
ission of the
copyright ow
ner. Further
reproduction prohibited
without
permission.
Minimum Temperature in Kathmandu (A.R)Teaperature
i—>—1—r_ JANS8
I I 1--1--- 1---1---1 \--1---1---1---1---1 \—DEC17 OEC87 DEC?)
Trend Cycle Component
J A M S-<— i— j—
DEC 7 7 DECI7I 1 - > I ' '
OEC97
JUlian. to-1030
Seasonal Component Irregular Component
hU H
i—'—>—■—'—<—i—JAMS DEC77
~~i------r— i------ j i----t— “t~
DECS7 DEC971—f
JAIKS-I 1--------1--------r — I------ r -
DEC17—i—i—i—.—i—i—rDEC97 DEC97
(g) Minimum temperature in Kathmandu (Airport, Station No. 1030)VOC n

Reproduced
with perm
ission of the
copyright ow
ner. Further
reproduction prohibited
without
permission.
Minimum Temperature in Okhaldhunga
I8
DEC61 DEC? I DEC81 DEC91 DECOI
_£Uli(uUI(L_110E
Seasonal Component
iif
-[—i—i—i—i—i—|—i—i—i—o—i—I—r-DECEl DEC71 DEC81
l i f t I rDEC91
-T-i—rDECOI
JiULion llo. .1208
Trend Cycle Component
1 , , , , | 1 , 1 1 , 1 j , ! 1 1 , j f
DECEI 0EC71 DECOI DEC9I DECOI
SUtinn Mil. 170E
Irregular Component
]— r— i— i— i— i— |— r —i— i— i— i— |— r
DECEI DEC71 DEC81 DEC9I DECOI
(h) Minimum temperature in Okhaldhunga (Station No. 1206)VOON

Reproduced
with perm
ission of the
copyright ow
ner. Further reproduction
prohibited w
ithout permission.
Minimum Temperature in ChainpurTeoperature
(Celsius)
“J—i—i—i—i—i—|—i—i—i—i—i—|—i—i—i—i—i—j—r—i—i—i—i—p-
DECK 0CCT1 DECEI DEC91 DECOI
Seasonal Component
DECS 1I '
DECK—i— i— i— i— |— r~
DECI1i— |— i— i— i— i— r —I
DEC)) DECOI
Trend Cycle Component
1—i—•—»—i—•—"1—i—i—i—i—i—|—i—r—r—i—r—pDECS! DECK DECEI DEOl
I— o— i— i— r~
DECOI
SUlina Do. 1303
Irregular Component
1 r DECS 1 DECK
*1— i— i— r
DECEI-I 1 1 1 1 1 1 1 1—
DEC91 DECOI
-Sladan-PfL-liOl(i) Minimum temperature in Chainpur (Station No. 1303)
VO

98
Reproduced with permission of the copyright owner. Further reproduction prohibited without permission
(j)
Min
imum
te
mpe
ratu
re
in T
aple
jung
(S
tati
on
No.
14
05)

99
Minimum Temperature Anomalyd e g r e e sC e l s i u s
1980 19901960 19701940 1950
c q o Kathmandu IE■*-* Kathmandu A?LOCATION
Maximum Temperature Anomalyd e c r e e sC e l s i u s
a jsu _Gj asJSs? ̂ ;
1920 1940 1960
o—e—s Kathmandu IEKathmandu APLOCATION
Average Temperature Anomalyd e g r e e sC e l s i u s
1920 1940 1960 1980
LOCATION Kathmandu A? ° ' ° Kathmandu IE
F ig u re V I I - 2 . Minimum, maximum, and a v e r a g e te m p e ra tu re anom aly i n K athm andu.
Reproduced with permission of the copyright owner. Further reproduction prohibited without permission.

100
Minimum Temperature Anomalyd e g r e e sC e l s i u s
3 ■2 •
-2■3 1
19 7 C 2 0 3;
LOCATION e. c h a m o u r 0 -0 u O ku a lc n u n ca l. cj- li Tanie'urc
Maximum Temperature Anomaly
I9 6 0 1970 1980 1990 2 0 0 0
LOCATION “ - - Cha inpur O'- 0 - 0 Okha l dh un ga s - - T a p l e j u n g
--------------■----------------------------------------------------------------------yns7 BasinAverage Temperature Anomaly
d e g r e e s C e l s i u s
3 2 1- 0 ■
-1 ■ -2 -3
-sr
1960 1970 1980 1990 2 0 0 0
LOCATION * Chainpur 9—9—9 Ok ha ldhunga ~ T a p l e j u n g
F ig u re V I I—3 . C om parision o f m in imum, maximum, and a v e ra g e tem p er a t u r e a n o m a lie s f o r C h a in p u r, O k h a ld h u n g a , and T a p le ju n g .
Reproduced with permission of the copyright owner. Further reproduction prohibited without permission.

101
Average Temperature Anomalyd e g r e e sC e l s i u s
V A AY A V \ As \ pkfi A & AA
£
1920 193 0 1940 1950 1950 1970 1980 1990 2 0 00
iAREA a- a - a Ea s t N ep a l o—o--e Gl ob e |
Average Temperature Anomalyd e g r e e sC e i s i u s
P <2PS2&Srft. ft) 4 A ^
1920 1930 1940 1950 1960 1970 1980 1990 2000
a r e a o o o Globe K o s i B a s i n
Average Temperature Anomalyd e g r e e sC e l s i u s
- 1 - 0 ' W - ^ - ■ m■ ■ ■ 1.• ■ ■— —r— '——■—i i—< ■ ■ , ---- ;— ------ -1920 1930 19 4 C 1950 19 60 1970 1980 1990 2000
AREA e—s—e Globe *—* —* Kathmandu
F ig u re V I I -4 . C o m p a ris io n o f a v e ra g e t e m p e r a tu r e anom aly o f K athmandu, th e e a s t e r n N e p a l , th e K osi b a s in , and th e g lo b e .
Reproduced with permission of the copyright owner. Further reproduction prohibited without permission.

102
MONTHLY MAXIMUM TEMPERATURE TREND: PARAMETRIC
1i
MarFebJani
Apr JunMayI
*Jul SepAug
Oct Nov Dec
• Nonsignificant • Increasing a Decreasing
F ig u re V I I - 5 . T re n d o f m o n th ly maximum te m p e r a tu r e in th e K o s i b a s in com puted u s in g p a r a m e t r ic m ethod.
Reproduced with permission of the copyright owner. Further reproduction prohibited without permission.

L03
l! MONTHLY MAXIMUM TEMPERATURE TREND: NONPARAMETRICi !
ii
JanI MarFeb
!I
Apr JunMay
I
I
Jul
Oct
SepAug
DecNov
• Nonsignificant * Increasing 0 Decreasing
F ig u re V I I - 6 . T ren d o f m o n th ly maximum te m p e ra tu re i n th e K o s i b a s in com puted u s in g n o n p a ra m e tr ic m ethod .
Reproduced with permission of the copyright owner. Further reproduction prohibited without permission.

104
MONTHLY MINIMUM TEMPERATURE TREND: PARAMETRIC
i
••i
Jan
••
• -HMar
••
Feb
••
i
••
JunMay
••
«—UtSep
••
I!
JulI
Oct
••
DecNov
• Nonsignificant • Increasing Q Decreasing
F ig u re V II -7 . T ren d o f m o n th ly minimum te m p e ra tu re i n th e K o s i b a s in com puted u s in g p a r a m e t r ic m eth o d .
Reproduced with permission of the copyright owner. Further reproduction prohibited without permission.

105
MONTHLY MINIMUM TEMPERATURE TREND: NONPARAMETRIC
il
Jan Feb Mar
May Jun
I
I Apr1
ii
Jul Aug Sepi
I
Oct Nov Dec
• Nonsignificant * Increasing 0 Decreasing
i____________________
F ig u r e V I I -8 . T rend o f m o n th ly minimum te m p e ra tu re in th e K osi b a s in u s in g n o n p a ra m e tr ic m eth o d .
Reproduced with permission of the copyright owner. Further reproduction prohibited without permission.

106
Table VII-6 shows that the basinwide increasing trend of average temperature is
homogeneous with respect to season but nonhomogenous with respect to sites. The re
sults, hence, do not indicate the existence of a statistically significant homogeneous trend
in temperature over the basin. Furthermore, the tendency of increasing temperature is
less homogeneous in the case o f maximum temperature. Although statistically insignifi
cant, the Table VII-6 shows the higher increasing tendency of basinwide minimum tem
perature, a similar pattern observed in the global climatic data (Karl et al., 1995).
Precipitation Changes
Changes in precipitation can be expected as a result of climatic changes and land
use changes. Analyses of precipitation trend are, hence, useful not only to evaluate the
characteristics of long term precipitation pattern over the basin but also to assess the cli
matic changes. Basic advantage in analysis of precipitation over temperature is that the
precipitation data usually covers a wider area with denser network, longer time period
and fairly complete records (fewer missing values). The density of the precipitation net
work in the Kosi basin is more than three times the density of the temperature network.
There are 21 precipitation stations in the Kosi basin with record lengths exceeding thirty
years which represent a number seven times greater than the number of temperature sta
tions in the basin with 30 years o f records.
Precipitation Trend in Kathmandu
The precipitation station located at Indian Embassy (Station No. 1014) in Kath
mandu is the only station with the significantly long precipitation records available in an
area closest to the Kosi basin. Since the publication of the records for this station was
discontinued in 1975, we combined the data recorded at Station No. 1030 to make a pre
Reproduced with permission of the copyright owner. Further reproduction prohibited without permission.

107
cipitation series from 1921 through 1992. Before combining the records, we applied the
Student’s t test to the long term average of these two stations and confirmed that the aver
ages were not significantly different from each other. Figure VII-9 exhibits the original
series along with its seasonal, trend cycle and irregular components.
Since monthly precipitation data are not normally distributed, we only used the
nonparametric method to test the trend for individual months. We used the parametric
method by combining the monthly data into dry (October to May) and wet (June to Sep
tember) seasons. Statistics of most of the annual and seasonal data confirmed a normal
distribution.
Application of student’s t test to the trend of seasonal data indicates nonsignifi
cant trend. We obtained the same result when the test was applied to annual data.
Precipitation Trend in the Kosi basin
Figure VII-10 (a to t) illustrates the trend cycle components of the long term pre
cipitation data for stations with relatively long period of records. The parametric trend of
annual precipitation and the overall nonparametric trend based on monthly values for
these stations are given in Table VII-7.
Table VII-7. Statistical significance of the trend of precipitation in the Kosi basin at sta- tions with relatively long record length.
Station no. Period Parametric nonparametric1006 1947- 93 + 1% ns1008 1959- 93 ns ns1023 1947- 93 ns + 5%1102 1959- 93 -5% -5%1104 1959-93 ns ns1202 1949-94 ns + 5%1203 1948-94 ns ns
Reproduced with permission of the copyright owner. Further reproduction prohibited without permission.

10S
Table VII-7 continuedStation no. Period Parametric nonparametric
1204 1948-94 ns ns1206 1948-93 ns ns1211 1959- 93 ns ns1301 1959- 93 ns + 5%1303 1947- 93 ns + 1%1306 1947- 93 ns ns1307 1947- 92 ns + 1%1308 1947- 93 ns + 1%1309 1948- 93 ns ns1316 1948- 93 ns ns1325 1949-93 ns ns1403 1947-93 ns + 1%1404 1947-93 + 1% ns
As in the last section, statistical analyses of monthly data for all the stations in the
basin indicated that precipitation data are not normally distributed in most of the cases.
The data are positively skewed with high values of skewness and kurtosis. We analyzed
the precipitation trend combining monthly values into seasonal data by dividing a year
into dry (October to May) and wet (June to September) seasons. Figure VII-11 shows the
trend of dry season and wet season precipitation at different stations over the basin. Only
five stations, out of 57 stations, show statistically significant increasing trend of precipi
tation whereas only one station shows decreasing trend of precipitation during the wet
season (summer monsoon). Only three stations show positive trend of dry season pre
cipitation. The parametric statistics hence indicate a lack of statistically significant trend
in both seasons in more than 85 per cent of the cases. The analysis of annual data also
shows a similar result (Figure VII-16).
We also used nonparametric statistics for the analysis of monthly and overall
trend based on monthly precipitation data. The results of the analysis for different
Reproduced with permission of the copyright owner. Further reproduction prohibited without permission.

months are presented in Figure VII-12 and the overall precipitation trends for each station
are presented in Figure VII-17.
The nonparametric method indicates an increasing trend of precipitation in many
more stations compared to the parametric method. Nonetheless, the number of stations
showing nonsignificant trend far exceeds the number of stations showing statistically sig
nificant precipitation trend. Only a few stations show a negative trend of precipitation in
the monsoon and post monsoon period (Figure VII-12) with only one station showing an
overall decreasing trend of precipitation (Figure VII-17).
As in the case of temperature, we used the procedure described by Belle and
Hughes (1984) to obtain homogeneity of trend over the basin and season. Table VII-8
presents the result of the analysis. Appendix N gives the details of the computed Z-
statistics for each month and for all the stations used to compute the heterogeneity.
Table VII-8. Statistical significance: heterogeneity of basinwide nonparametric precipi- tation trend in the Kosi basin._________________________________________________
Type Expression for y2 T df Sienificat
Seasonal n £ ( Z , - Z . y/=1
220 11 < 0.005
Site m£ ( z j - z ->*i=i
168 54 < 0.005
Site-season £ £ ( Z s - Z , - Z J + Z . . f/= 1 7=1
558 594 ns
The above table and computation show that the trend is neither homogeneous in
terms of season nor in terms of sites. Consequently, the hypothesis of homogeneous pre
cipitation trend over the basin cannot be established.
Reproduced with permission of the copyright owner. Further reproduction prohibited without permission.

Reproduced
with perm
ission of the
copyright ow
ner. Further
reproduction prohibited
without
permission
Precipitation in KathmanduPrecipitation
l!ii00 00 00 00 00 00 0 1 1 1 I n I IT . - 1 1- p n ■ | - | I I I i 1 1 I I t t t t t | n ■ n !
JAN21 DEC30 DBC40 DEC50 “ OEC70 DECIO DECIO DEC00
Station Ho. 1014 and U U P
Trend Cycle Component
- r i r j i r i i t | ■ . . . . , . . . . . | ............................................. | ............................ .....
JAN21 OBC30 DEC40 DEC50 DECiO DEC70 DEC00 OECIO DEC00
-SLaLion.MQ.-lOli and 1030
Seasonal Component Irregular Component
rT'11"1 ' i ■ ■ JAH21 OECIO
t ~ i r - j - t n i t | r n i i | m n ' i p i r i i p i i i i | n i i n —
DECOO DECIO DECSO OEC70 DECIO DECIO DEC00
Station Mo. 1011 aoil H I D
100300100100
0100200300 1 i i i i i j o- i i n [ - n - n i - p - m T p r n i p 1 i T n j r n - n ’ i ' t ' iT n i" '
JAK21 DECIO DECIO DEC50 DECOO DEC10 DECIO DECIO DECOO
..SUtina En.101Lani.1030
F ig u re V I I -9 . O r ig in a l tim e s e r i e s o f p r e c i p i t a t i o n in Kathmandu and i t s s e a s o n a l , t r e n d c y c le , and i r r e g u l a r com ponen ts .
110
47
535353484823485353484853235348535353232353

Reproduced
with perm
ission of the
copyright ow
ner. Further
reproduction prohibited
without
permission.
Precipitation(11)soi
<00
300
200
100
Trend Cycle ComponentPreclpilolion In Gumlhong
Precipitation
'"12102(02102202001001(01(0
Trend Cycle ComponentPreclpltallon in Nawalpur
Mil? DIC5( DECK DECK DECK DECK
(a)Station Ho. t00(
JAN47 DECK DECK DECK OECK DECK
(b)Station lo ..1001
Precipitation
t y1(0140120100to-(040
Trend Cycle ComponentPreclpilolion In Dololghol
PrecipitationI»12402202001001(01(0120100
Trend Cycle ComponentPreclpltallon In Charikot
AIM DECK DECK DECK DECK DECK
f ^ ̂ Station Ho. 1023
m i DECK DECK DECK DECOi DECK
^ ................. Station.Ho. .1102F ig u re V II -1 0 . T rend c y c le com ponent o f m o n th ly p r e c i p i t a t i o n : ( a ) Gumthang (b ) Na' w a lp u r (c ) D o la lg h a t (d ) C h a r ik o t 111

Reproduced
with perm
ission of the
copyright ow
ner. Further
reproduction prohibited
without
permission.
F ig u re V I I -1 0 . C o n td ..
Trend Cycle ComponentPreclpilolion in Chourikhorko
Trend Cycle ComponentPrecipitation In Melung
PrecipitationPrecipitation
DECKDECKDECKDECKDECK
Trend Cycle ComponentPreclpilolion in Aiselukhorko
Trend Cycle ComponentPreclpilolion in Pokornos
Precipitationl»»)2001101 ( 01101 2 0100
DECKDECKDECKDECKDECKDECK DECK
Station.ilo.J20t
(e ) M elung ( f ) C h a u r ik h a rk a (g ) P a k a rn a s (h ) A is e lu k h a rk a 112

Reproduced
with perm
ission of the
copyright owner.
Further reproduction prohibited
without perm
ission.
Trend Cycle ComponentPreclpilolion In Okholdhungo
Precipitationin)io4HO1(014012010000
t
[TTf -r »—| - r r - i i - i | »— i - r » - i * j —»■ i ~ i - i i | i n n ■]—
JM41 DECS! DECK DECK DECK DECK
( i ) _StationJo.J20(
Trend Cycle Component
Precipitation
Tl 00 00 00 00 00 0
100 f r r r r r p-i i-i i |"i »• i o i‘| r rrrt-;' v i-i o-i )JAN47 DECK DECK DECK DECK DECK
(k)-StationJo.JJOl
Figure VII-10. Contd.Trend Cycle Component
Preclpilolion In Kholong Bozar
Precipitation
'III120100(0(0(020
JENtl
( j ) JtationJo_12U
Trend Cycle ComponentPreclpilolion In Cholnpur
Precipitation
1001(0ItO12010010(0 ■I i i r i po-i T-T-i y i i i i i \ i >’ i i o~|"i i ‘i i"» r"
JAN11 DECK DECK DEC7i DECK DECK
111 _Station.Ho... 1)01
(i) Okhaldhunga (j) Khotang Bazar (k) Num (1) Chainpur 113
^

Reproduced
with perm
ission of the
copyright ow
ner. Further
reproduction prohibited
without
permission.
Figure VII-10. Contd..
Trend Cycle ComponentPrec ip ita tion In Mungo
2001101(01(012010010(0(0
DOCKMU
(ml_Station_Wo lJIlt
Trend Cycle ComponentPreclpilolion in Mulghal
PrecipitationI»1120110100000010(0SO(0 | ‘ i n r r p v f t »“ | r i o i i | o’ o - i - r i - p i - i r - o i | ■
JEHU DECK DBCii DICK D8CH DEC96
(o) .Station.Ho..1)08
Trend Cycle ComponentPrec ip ita tion in D honkula
Precipitation
'ill10000(0(020
I r i t —i t —-p »— r i »~ i y i i i i i \ i i » r i \ " i t o i i ' \
JAH41 D8CS8 DtC(( DECK DECOi DECK
(n) J tation J (Q ,J l(ll
Trend Cycle ComponentP rec lp ilo lion In Tribenl
Precipitation("1220200ISO1(01(012010010 I i o i i i I i - r r r i - | i - i i »~o f i i T
mu DECK DECK DEC76 DECK DECSS
(Pi Station Ho. 1105
(m) Munga (n ) D hanku ta (o ) M ulghat (p ) T r ib e n l 114

Reproduced
with perm
ission of the
copyright ow
ner. Further
reproduction prohibited
without
permission.
Figure VII-10. Contd.
Trend Cycle Component. P reclpilo lion In Chaloro
Precipitation (■■I240 220 200 110 1(0 140 120 100 00 p n ' n ‘1 | i i f n p 'l-T r n '( r i i i i1 | ~» i r i~ r | "
DECHJM4? 0BCS6 DIC(( DOCK DECK
lq)Station.Ho.JlK
Trend Cycle ComponentPrecipitation in lunglhung
Precipitation
'iii2 (0 2 (0 220 200 100 1 (0 140 120 100 I " t t i- r r j ‘-F ~ri~ T r ("i r n r \"i r o k - i t v t ' i” f -
JEH41 DECK DEC(( DECK DECOO DECK
s)_Statlon.Ho.J403
Trend Cycle ComponentP rec lp ilo lion in Dingla
1001(014012010000
DECK
(r).Statioo.Ho.J12S
Trend Cycle ComponentP reclp ilo lion In T aplethok
Precipitation
2(02402202001001(0140
DEC0(DECK DECK DECK
( t ) .Station .Ho..1404
(q ) C h a ta ra ( r ) D in g la ( s ) L ungthung ( t ) T a p le th o k 115

116
PRECIPITATION TREND: PARAMETRIC
Wet Season (June - September)
Dry Season (October to May)
• Nonsignificant ► Increasing Q Decreasing
F ig u re V I I - 1 1 . T re n d o f s e a s o n a l p r e c i p i t a t i o n i n th e K osi b a s in com puted u s in g p a ra m e tr ic m ethod .
Reproduced with permission of the copyright owner. Further reproduction prohibited without permission.

117
MONTHLY PRECIPITATION TREND: NONPARAMETRIC
m
• •
Mar
• •
Feb
I
• •• >
Jan
•3
Jun
\
I
MayApr
l
SepJul Aug
Nov DecOct
• Nonsignificant » Increasing 0 Decreasing
F ig u re V II—12. T ren d o f m o n th ly p r e c i p i t a t i o n i n t h e K o si b a s in computed u s in g n o n p a ra m e tr ic m ethod .
Reproduced with permission of the copyright owner. Further reproduction prohibited without permission.

118
River Discharge Changes
River discharge is an important integrated measure of climate, land cover, and
human activities that influence the hydrologic cycle over a drainage basin. The station
(Station No. 695) located on the mainstem of the Kosi River at Chatara provides the
longest discharge records available in Nepal. Discharge records for Stations 695 and
Station No. 690 are available from 1947 and 1948 respectively. Figure VII-13 (a to e)
illustrates the trend-cycle component, seasonal component and irregular component of
discharge time series for hydrometric stations with relatively long time series. Table VII-
9 below presents the results of the parametric and nonparametric statistics applied to the
monthly discharge time series data for the stations 690 and 695.
Table VII-9. Statistical significance of trend for discharge recorded on the Kosi River and the Tamor River.
Parametric Nonparametric
Station 695 Station 690 Station 695 Station 690Jan - 5% 1% -5% - 1%Feb - 5% 1% -5% - 1%Mar ns ns -5% nsApr ns ns ns nsMay ns ns ns nsJun ns ns ns nsJul ns ns ns nsAug ns ns ns nsSep ns ns ns nsOct ns ns ns nsNov ns 1% ns -1%Dec ns 1% ns -1%Ann ns ns ns - 1%
Figure VTI-14 illustrates the trend for all the stream gauging stations in the Kosi
basin analyzed by parametric statistics using monthly data. The results of the analysis by
Reproduced with permission of the copyright owner. Further reproduction prohibited without permission.

119
nonparametric method using monthly data are presented in Figure VII-15. The paramet
ric and nonparametric trends of annual discharge are illustrated in Figure VTI-16 and Fig
ure VII-17 respectively. Examinations of these figures indicate decreasing trend of dis
charge on mainstem and major tributaries particularly during low-flow season. The
analysis of overall river discharge trends for their heterogeneity over the basin in terms of
site, season and their combinations is given in Table VII-10. Appendix N gives the de
tails of the computed Z-statistics for each month and for all the stations used to compute
the heterogeneity.
Table VII-10. Statistical significance: heterogeneity of basinwide nonparametric discharge trend in the Kosi basin._______________________________________________ Type_______ Expression for y2_______________ df_____Significance
mSeasonal « ^ ( Z , - Z . .)2 10.4 11 ns
<=i
Site m £ ( Z j - Z . . ) 2 217 12 p< 0.005
m nSite-season - Z ' - Z j + Z . . ) 2 122 132 ns
;=i 7=1
The above table (Table VII-10) shows that the trend is homogeneous in terms of
season but not in terms of sites. For that reason, we cannot substantiate a basinwide dis
charge trend in the Kosi basin.
Reproduced with permission of the copyright owner. Further reproduction prohibited without permission.

Reproduced
with perm
ission of the
copyright ow
ner. Further
reproduction prohibited
without
permission.
Kosi River at ChataraDischarge
'■‘1 ODD
000 000 000 000
000
0T T
JAM7 oecsc OICOO1 ........... >DICK DOCK
1 1 iDECK
S ta t io n No. US
Trend Cycle Component210020 0 0190010001700100010001100130012001100 v “I—i—i—i—i—|—i—i—i—r~
JAH47 DECOO DECOO DECK- i - 1—i- r
DECIOT -r-t-T
DECK
. Station Bo. 090
Seasonal Component Irregular Component(000
1000
2000
1000
01000
2000
JAN4T DECOO1 ■ ' i ■
DECOO
3000
2000
1000
0
1000
2000
DECK DECK DEC90]—i—i—i—i—i—j—i—i—r i’ -i"i— i "i—j—r-
J0N11 DECOO DECOO DECKI 1 1 1 ' 1 I
DECK DECK
.Stationio. .090 SI a l l nn tin SOS
F ig u re V II -1 3 . O r ig in a l tim e s e r i e s o f d i s c h a r g e and i t s s e a s o n a l , t r e n d c y c le , and i r r e g u l a r com ponen ts: (a ) K osi r i v e r a t C h a ta ra
120
01000100013101310131010201000131013101310102013101
45815

Figu
re
VII
-13.
C
ontd
121
Reproduced with permission of the copyright owner. Further reproduction prohibited without permission.
(b)
Tam
or
rive
r a
t Mu
1 g
hat

Figu
re
VII
-13.
C
ontd
.
122
Reproduced with permission of the copyright owner. Further reproduction prohibited without permission.
(c)
Dud
hkos
i at
Rab
uwa

Reproduced
with perm
ission of the
copyright ow
ner. Further
reproduction prohibited
without
permission.
Figure VII-13. Contd..
Sunkosi at Kampughat Trend Cycle ComponentDischarge
J/sl3000 1000
000too2000
1000
0 1 I ! I | I "I I 1
OEC66 DECK DECK
S t a t i o n Hn. ME
Seasonal Component Irregular Component2000 1000
too(00
1000 400100
0•2 0 0-400-(00-1 0 0 0 t-T
JEN41t—i—i—i—|—i—r
DECKT—I—I—(—I—I—I—T
DECKDEC7( DECK DECK
(d ) S u n k o si a t Kampughat 123
49^529746925099419944971

Figu
re
VII
-13.
C
ontd
124
Reproduced with permission of the copyright owner. Further reproduction prohibited without permission.
(e)
Bal
ephi
K
hola
at
Jalb
ire

125
MONTHLY DISCHARGE TREND: PARAMETRIC
ii
Ii
t
• -
Feb
I
Jan MartII
Ii!I
Apr
•M
JunMayiii
\1i
i
SepJul Aug
II Oct Nov Dec
• Nonsignificant * Increasing Q Decreasing
F ig u re V I I -1 4 . T re n d o f m on th ly d i s c h a r g e i n th e K o si b a s in comput e d u s in g p a r a m e t r ic m ethod.
Reproduced with permission of the copyright owner. Further reproduction prohibited without permission.

126
MONTHLY DISCHARGE TREND: NONPARAMETRIC
i
FebJan
I\
MayApr
I
I
Jul Aug
___ ^
. Oct Nov
Mar
Jun
Sep
Dec
Nonsignificant * Increasing 0 Decreasing
F ig u re V I I -1 5 . T ren d o f m o n th ly d is c h a rg e i n th e K o s i b a s in com puted u s in g n o n p a ra m e tr ic m e th o d .
Reproduced with permission of the copyright owner. Further reproduction prohibited without permission.

127
!
ANNUAL HYDRO-CLIMATIC TREND: PARAMETRIC
I
1Ii
Minimum TemperatureMaximum Temperature
i
V
DischargePrecipitation
• Nonsignificant * Increasing Q Decreasing
F ig u re V I I - 1 6 . T rend o f a n n u a l t e m p e r a t u r e , a n n u a l p r e c i p i t a t i o n , and a n n u a l d i s c h a r g e i n th e K o s i b a s i n com puted u s i n g p a r a m e t r i c method.
Reproduced with permission of the copyright owner. Further reproduction prohibited without permission.

ANNUAL HYDRO-CLIMATIC TREND: NONPARAMETRIC
i
i
Maximum Temperature Minimum Temperature
ii
•a
i
Precipitation Discharge
Nonsignificant • Increasing Q Decreasing
F ig u r e V I I -1 7 . O v e r a l l t r e n d o f t e m p e r a t u r e , p r e c i p i t a t i o n , and d i s c h a r g e in th e K o s i b a s i n com puted u s in g n o n p a r a m e t r i c m ethod .
Reproduced with permission of the copyright owner. Further reproduction prohibited without permission.

129
Discussion
Analysis o f climatic changes in the Kosi basin reveals significantly increasing
temperature and precipitation in some areas within the basin; yet most of the stations do
not show any trend resulting in nonsignificant basinwide trend. The higher number of
stations showing increasing temperature and precipitation trends as compared to fewer
stations showing decreasing trends indicate that we need to pay special attention towards
careful monitoring o f climatic variables in future.
Contrary to the findings of more stations showing increasing trend of precipita
tion, more streamflow stations show decreasing trend of discharge. Significant negative
trend shown by most of the snow fed rivers against positive trend shown by few gauged
rainfed rivers indicate the role of snow covered high elevation areas. A plausible expla
nation to such observation could be the depleting snow cover areas and receding Himala
yan glaciers as reported by some researchers (Chapter III). Although nonsignificant at
basin scale, a general tendency of increasing temperature also justifies the higher evapo-
transpiration loss from the basin leading to overall decreasing tendency of the river dis
charges. Although the discharge trends are found to be homogeneous in terms of seasons,
it is still nonsignificant in terms of sites indicating lack of basinwide trend.
Although few climatic stations have records extending to thirty years, most of the
records used in the nonparametric statistical analysis have shorter lengths varying from
10 years to 30 years. Longer lengths of records provide not only long term climatic trend
but also reduce the influence of irregular components and errors. To increase the confi
dence in the results o f the statistical analysis, the hydrometeorological services of the re
gion should give emphasis to the existing network for a long period of time with minimal
Reproduced with permission of the copyright owner. Further reproduction prohibited without permission.

130
loss of information. This recommendation is equally valid for temperature, precipitation,
and river discharge. Chapter XII deals with the aspects related to river sediment dis
charges in more details.
Reproduced with permission of the copyright owner. Further reproduction prohibited without permission.

CHAPTER VIII
MODELING HYDROMETEOROLOGIC CHARACTERISTICS
Understanding the spatial variation of major hydrological variables has been a
major component of recent water balance and hydrological modeling experiments
(Grayson, Moore, & McMahon, 1992; Vorosmarty et al., 1996). This chapter gives an
analysis of major hydrometeorological variables: precipitation, temperature, and evapo-
transpiration operating in the Kosi basin. The purpose of this chapter is to examine the
individual components of the hydrological cycle for modeling hydrological responses in
the Kosi basin to different scenarios of climatic and land-use changes (Chapter IX &
Chapter X). We put more effort on establishing the relationships between these variables
and topographical variation as topography is a dominating characteristic of the Himala
yan basins.
Modeling Precipitation
Precipitation is the major forcing function of any hydrologic system. Under
standing its temporal as well as spatial distribution over a basin is the key to the success
of any hydrological modeling exercise. Modeling precipitation distribution over a basin
is required for water balance computations, and for modeling other hydrological vari
ables, such as, evapotranspiration and runoff.
All the major hydrological regimes of the world are influenced by the variability
of precipitation. The variability is extreme in heterogeneous areas, such as, the Himala
Reproduced with permission of the copyright owner. Further reproduction prohibited without permission.

132
yas where there is the influence of both high topographic variation and monsoon climate.
The role of Himalayan topography is not only limited to local scale variations but also to
regional scale precipitation distribution. For instance, the Himalayan region receives
some of the heaviest precipitation of the world although the region lies in a geographical
belt where general atmospheric circulation supports persistent subsidence (Black, 1991).
Influence of topography on precipitation and, notably, the general trend of in
creasing precipitation pattern with respect to increasing elevation has been recognized for
many years. Such facts have been demonstrated with mathematical formulations (Donley
& Mitchell, 1939) or graphical relationships (Barrows, 1933). Some of the notable
studies, considering additional topographic factors other than elevation, include the work
of Spreen (1947). The study shows that the inclusion of topographical factors, such as,
slope, orientation, and aspect, besides elevation, bring significant improvements in the
estimation of precipitation.
Figure VIII-1 illustrates an example of the variation o f precipitation observed
along a longitudinal transect of the Kosi basin. The cross-section covers part of the
southern plain, the Mahabharat mountain, the Tamor valley and the southern section of a
middle mountain. Although several large scale factors and local factors influence the
precipitation, the figure shows that the topographical variations play crucial role in the
Himalayan environment.
Reproduced with permission of the copyright owner. Further reproduction prohibited without permission.

133
ALTITUDINAL VARIATION OF MONSOON PRECIPITATION
2500-
^ 2000
5 1000
[y 500 -
o o a o L n t O Q O r - ' ^ a o t o n c o o ' r o L O Q oC v J C l n n ’ T ’ T ' T ' T l f l i n t D U O l D t O
D istance (km)
ALTITUDINAL VARIATION OF ANNUAL PRECIPITATION
2500 - 2500
_ 2000 E^ 1500 o5 1000 • . 1000
Ui 500
o oo o in co oo csi n n n
i - ^ oo (O ^
4 \ . 2000 ■ =A - 1500 | ?
.9- Eu 0)CL
Distance (km)
Elevation (m) Annual precipitation (mm)
Figure VIII-1. Longitudinal profile of precipitation (monsoon and annual) and elevation in north-south direction in the southern part of the Kosi basin (Biratnagar to Basantapur). The area considered in this figure extends beyond 45 km to the South from the study area.
Modeling precipitation over the Himalayas is one of the most challenging aspects
of hydrological modeling over the basin. Several factors such as physiographic heteroge-
Reproduced with permission of the copyright owner. Further reproduction prohibited without permission.

134
neity, climatic heterogeneity and inadequacy of the precipitation gauging network influ
ence the analysis of precipitation pattern. We used a statistical approach to analyze the
role of several locational and topographical variables that influence the spatial distribu
tion of precipitation in the basin. Univariate statistics of locational predictors selected for
this purpose are given in Table VIII-1. We used monthly precipitation data (Sharma,
1996) for deriving correlation coefficients and their level of significance (p-value).
Appendix C contains the monthly precipitation data used in this exercise.
Table VIII-1. Univariate statistics of locational and topographical variables used in multivariate regression with precipitation._______________________
Variable Symbol Mean Std. Deviation Minimum MaximumLatitude (DD) LAT 27.46 0.33 26.87 28.43Longitude (DD) LON 86.75 0.77 85.50 87.98Elevation (m) ELV 1816 1043 143 4340Grid Elevation (m) GELV 1767 1097 183 4878Slope-Area Index (-) SAINDX 99 39 0 177Slope (degree) SLOPE 9 5 1 26Aspect (degree) ASPECT 187 90 9 358
Table VIII-2 presents the coefficients of determination and p-values for selected
potential predictor variables (Table VIII-1) and the mean monthly precipitation over the
basin. The table also includes average annual precipitation amount and seasonal precipi
tation amount for the summer and winter monsoon months.
Examination of the Table VIII-2 and plots of the average annual and monthly pre
cipitation values (Figure VIII-2 & Figure VTII-3) indicates the differential control of
topographical influences for the winter and summer monsoon seasons. Table VIII-2
indicates insignificant influence of topographical variables on precipitation during
summer months when all the precipitation data are used in a multiple regression. We
Reproduced with permission of the copyright owner. Further reproduction prohibited without permission.

135
further examined the correlation by dividing the samples into two groups. The division is
based on the visual assessment of Figure VIII-2 and Figure VIII-3. The first group
includes precipitation values for observation stations located below 2800 m and the other
group includes stations located above 2800 m. Table VIII-3 presents the coefficients of
determination and p-values for the stations included in the first group.
Table VIII-2. Coefficient of determination and p-values for potential predictors (appliedindividually), and mean monthly and seasonal precipitation over the Kosi basin
G E L V A S P E C T S L O P E S A I N D X E L V L A T L O N
Jan R2 0.38 -0.08 0.39 0.3 0.48 0.47 -0.01P 0.003 0.53 0.002 0.02 0.0001 0.0002 0.92
Feb R2 0.54 -0.07 0.4 0.28 0.55 0.61 0.15P 0.0001 0.58 0.002 0.03 0.0001 0.0001 0.25
Mar R2 0.39 -0.05 0.47 0.37 0.4 0.44 0.29P 0.002 0.68 0.0002 0.004 0.002 0.0004 0.03
Apr R2 -0.07 0.09 0.25 0.27 -0.1 0.05 0.36P 0.61 0.47 0.06 0.03 0.43 0.71 0.004
May R2 -0.28 0.08 0.19 0.24 -0.28 -0.09 0.22P 0.03 0.56 0.14 0.06 0.03 0.5 0.09
Jun R2 -0.08 -0.12 0.15 0.15 -0.07 0.25 0.23P 0.56 0.37 0.26 0.26 0.62 0.06 0.08
Jul R2 -0.03 -0.17 0.14 0.11 -0.02 0.33 -0.4P 0.82 0.19 0.28 0.4 0.88 0.009 0.001
Aug R2 0.046 -0.2 0.11 0.07 0.06 0.45 -0.43P 0.73 0.12 0.39 0.57 0.67 0.0003 0.0006
Sep R2 -0.04 -0.25 0.19 0.16 -0.04 0.31 -0.27P 0.77 0.06 0.15 0.21 0.78 0.02 0.04
Oct R2 0.004 -0.13 0.2 0.21 -0.013 0.13 0.01P 0.97 0.31 0.12 0.11 0.93 0.31 0.92
Nov R2 0.33 0.01 0.28 0.27 0.38 0.37 0.31P 0.009 0.92 0.03 0.04 0.003 0.004 0.015
Dec R2 0.38 0.04 0.16 0.13 0.43 0.53 -0.16P 0.003 0.78 0.23 0.33 0.0006 0.0001 0.23
Summer R2 -0.02 -0.19 0.15 0.12 -0.008 0.36 -0.36Monsoon P 0.89 0.15 0.27 0.36 0.95 0.005 0.005
Winter R2 0.03 0.004 0.32 0.32 0.02 0.18 0.23Monsoon P 0.84 0.98 0.01 0.01 0.85 0.16 0.07
Annual R2 -0.01 -0.16 0.19 0.17 -0.002 0.35 -0.27P 0.94 0.21 0.14 0.2 0.99 0.006 0.04
Reproduced with permission of the copyright owner. Further reproduction prohibited without permission.

Reproduced
with perm
ission of the
copyright ow
ner. Further
reproduction prohibited
without
permission.
3 0 0 0 -■
■ ■i
2 0 0 0 -
■
■■
1 0 0 0 - m■
4 0 0 0E l e v a t i o n (m)
F ig u re V I I I - 2 . R e l a t i o n b e tw een a n n u a l p r e c i p i t a t i o n and e l e v a t i o n i n th e K o s i b a s i n . The c r o s s sym bols i n d i c a t e th e v a l u e s e x c lu d e d i n c o m p u ta t io n .
136

Reproduced
with perm
ission of the
copyright ow
ner. Further
reproduction prohibited
without
permission.
JANUARY
50
40
30
20
10
0
X X X X « _ * *
1 1 1 1---------- 1
0 1000 2000 3000 4000 5000ELEVATION (m)
_ 4000 E| 3000 o| 2000
<3 1000 0?a o
ANNUAL
* *
~ - F -F - F1000 2000 3000 4000 5000
ELEVATION (m)
JULY
1000
800
600
400
200
0
X X X
X X
- i 1
1000 2000 3000 4000 5000ELEVATION (m)
SUMMER MONSOON
zop
w
E
3500300025002000 X1500 -X1000 -X500
0
* x ,
x **#**
-t- — i — i- -i1000 2000 3000 4000 5000
ELEVATION (m)
OCTOBER
250 T I 200I 150
It 100CLO£a.
50
0
X * X
O p*- F - F
X x X«K
XX
— f------ 11000 2000 3000 4000 5000
ELEVATION (m)
WINTER MONSOON
_ 1200 1 1000§II
800600400200
0« *
- F - F - F - F -I1000 2000 3000 4000 5000
ELEVATION (m)
F ig u re V I I I - 3 . V a r i a t i o n o f m on th ly ( s e l e c t e d m o n th s ) , a n n u a l , and s e a s o n a l p r e c i p i t a t i o n i n t h e K o s i b a s i n w i th r e s p e c t t o e l e v a t i o n .
137

Reproduced
with perm
ission of the
copyright ow
ner. Further
reproduction prohibited
without
permission.
JULY
E 200
o 150
t 100
200 -
SLOPE
SUMMER MONSOON WINTER MONSOON
4000 E 3500
3000 o 2500ij 2000£ 1500
1000 500
0
3500 3000 2500 2000 1500 1000 500
0
>1 I 1000
a& 400
S 200
F ig u re V I I I - 4 . V a r i a t i o n o f m o n th ly ( s e l e c t e d m o n th s ) , a n n u a l , and s e a s o n a l p r e c i p i t a t i o n i n t h e K o s i b a s i n w i th r e s p e c t to s l o p e .
138

139
Table VIII-3. Coefficient of determination and p-values for potential predictors (applied individually), and mean monthly and seasonal precipitation over the Kosi basin for observation stations lying below 2800 m._______________________________________
G R D E L V A S P E C T S L O P E S A I N D X E L V L A T L O N
Jan R2 0.29 0.02 0.26 0.15 0.38 0.34 -0.16P 0.04 0.89 0.07 0.29 0.007 0.02 0.26
Feb R2 0.39 0.08 0.34 0.23 0.44 0.62 -0.14P 0.007 0.57 0.02 0.119 0.002 0.0001 0.35
Mar R2 0.4 0.09 0.47 0.38 0.45 0.5 0.08P 0.004 0.55 0.0008 0.007 0.001 0.0003 0.6
Apr R2 0.17 0.12 0.33 0.31 0.22 0.22 0.39P 0.26 0.4 0.02 0.03 0.13 0.13 0.006
May R2 0.06 0.1 0.27 0.26 0.18 0.16 0.32P 0.7 0.48 0.06 0.07 0.22 0.29 0.03
Jun R2 0.21 -0.09 0.15 0.08 0.33 0.44 -0.19P 0.14 0.54 0.32 0.6 0.02 0.002 0.2
Jul R2 0.27 -0.15 0.14 0.02 0.38 0.53 -0.38P 0.06 0.29 0.34 0.92 0.008 0.0001 0.008
Aug R2 0.31 -0.17 0.07 -0.05 0.4 0.64 -0.42P 0.04 0.24 0.64 0.76 0.004 0.0001 0.003
Sep R2 0.22 -0.23 0.17 0.07 0.3 0.49 -0.23P 0.13 0.12 0.25 0.64 0.04 0.0005 0.12
Oct R2 0.11 -0.13 0.13 0.11 0.14 0.18 0.03P 0.47 0.39 0.39 0.48 0.35 0.22 0.85
Nov R2 0.25 0.15 0.22 0.23 0.35 0.3 0.21P 0.09 0.32 0.14 0.12 0.015 0.04 0.16
Dec R2 0.49 0.15 0.27 0.19 0.53 0.59 -0.33P 0.0004 0.32 0.06 0.19 0.0001 0.0001 0.02
Summer R2 0.27 -0.17 0.13 0.02 0.37 0.55 -0.33Monsoon P 0.07 0.26 0.38 0.9 0.009 0.0001 0.02
Winter R2 0.19 0.06 0.31 0.28 0.28 0.3 0.21Monsoon P 0.18 0.67 0.03 0.06 0.05 0.04 0.15
Annual R2 0.27 -0.13 0.17 0.07 0.38 0.54 -0.25P 0.06 0.38 0.24 0.63 0.008 0.0001 0.09
Examination of colinearity among different predictors showed that elevation and
latitude are significantly correlated as the gradient o f the Himalayas increases from south
to north until the Himalayas meet the Tibetan plateau. Since GRDELV (elevation of
station on DEM grid) and ELV (elevation of precipitation station) are the same variable
in different format, a high correlation between them is obvious. Although SAINDX
(Slope Area Index) is derived from slope and aspect obtained from DEM, we did not find
Reproduced with permission of the copyright owner. Further reproduction prohibited without permission.

140
significant colinearity between SAINDX and ASPECT; however, SLOPE is significantly
correlated with SAINDX.
In the background of above discussions, correlation Figures (Figure VIII-2 & Fig
ure VIII-3) and correlation tables (Table VIII-2 and Table VIII-3), we divided the spatial
pattern of precipitation into two major regions: higher mountains (elevation > 2800 m)
and lower mountains and valleys (elevation < 2800 m). The characteristics of precipita
tion in these two divisions for three major types of climatic systems were as follows.
i) Summer monsoon precipitation: Precipitation rises with increasing elevation up
to an average elevation of about 2800 m. The increasing precipitation gradient reverses
or loses its trend with increasing elevation above 2800 m. Such pattern can be seen up to
an elevation of 3800 m. Reversed trend of precipitation in high elevation zones have also
been reported in other part of the Himalayas (Bagchi, 1982) and in the Khumbu Himala
yas of the Kosi basin (Higuchi, Ageta, Yasunari, & Inoue, 1982); but the data to support
the decreasing trend of precipitation are not adequate. Furthermore, precipitation data
collected during the monsoon of 1991 at four locations with elevation ranging from 1800
m to 4100 m in an area of the Indrawati basin (SMEC, 1992) show similar precipitation
amount and similar precipitation pattern at all locations. Hence, the low precipitation
amount in high elevation areas could be a result of biases in sampling with most of the
high elevation stations representing relatively low precipitation zones of the basin. Four
of the nine stations above 3000 m are located in the Tamor basin, three in the Dudhkosi
basin and two in Tibet.
Information available above the level of 3800 m is scant to assess the nature of
precipitation trend. A general assessment of some data collected for short duration during
Reproduced with permission of the copyright owner. Further reproduction prohibited without permission.

141
expeditions (LIGG/WECS/NEA, 1988) show no significant precipitation gradient above
the level of 3800 m during monsoon.
ii) Winter Precipitation: Topographical gradient of precipitation in winter months
(October-March) under the influence of western disturbance is more distinct and statisti
cally more significant when compared with the pattern during the monsoons (Figure VIII-
3). A similar precipitation gradient exists over the whole range of topography for which
the data are available. For the areas above 3800 m, however, we could not study the
pattern of trend because of inadequate information. Besides, the few scattered data on
precipitation above 3800 m do not confirm any trend as in the case of monsoon precipita
tion described in the preceding paragraphs.
iii) Transition Period: April-May, also known as pre-monsoon, is the transition
period of atmospheric circulation from westerly dominated weather system to summer
monsoon system. Similarly, October, considered as post-monsoon month, brings the
transition from summer monsoon to winter monsoon. Precipitation patterns in all these
transitional months lack statistically significant topographical precipitation pattern.
Differences in precipitation features can be attributed to differences in the nature
of weather systems for different periods described above. Weather systems during the
influence of western disturbances are usually associated with well-established weather
system (trough) with fairly widespread spatial coverage. Since localized influences such
as convective activities, are less dominant, a better spatial pattern can be expected in such
weather system compared to the monsoonal precipitation in which local systems are often
embedded into large scale monsoon circulation.
Reproduced with permission of the copyright owner. Further reproduction prohibited without permission.

142
Since the western disturbances enter into the Kosi basin from higher latitude in
the West, the height of rain producing medium clouds can be expected to be higher than
similar monsoon clouds developed in a weather system originating in a lower latitude.
These factors, we believe, are the major reasons behind different precipitation gradient in
high elevation areas during winter and summer. A detailed investigation of these mete
orological processes is beyond the scope of this study; however, such studies are likely to
contribute towards improving precipitation modeling in high elevation zones.
Table VIII-4 presents simple statistical models based on the correlation presented
in Tables VIII-2 and VIII-3 applicable for different months.
Table VIII-4. Statistical models for topographical variation of average precipitation over the Kosi basin.
M o d e l N R 2 P > F A p p l i c a b i l i t y
Jan P = 6.8 + 0.44 * SLOPE + 0.0035 * ELV 61 0.36 0.0001 Range of Data UsedFeb P = 1.8 + 0.73 * SLOPE + 0.0068 * ELV 61 0.44 0.0001 Range of Data UsedMarAprMay
P = 11.8 + 1.65 * SLOPE + 0.0075 * ELV 61 0.34 0.0001 Range of Data Used
June P = 198 + 0.07* ELV 52 0.15 0.0050 Up to 2800 mJul P = 263 + 0.14 * ELV 52 0.19 0.0011 Up to 2800 mAug P = 196+ 0.15* ELV 52 0.22 0.0004 Up to 2800 mSep P = 168 + 0.07* ELV 52 0.14 0.0054 Up to 2800 m
OctNov P = 4.8 + 0.33 * SLOPE + 0.0025 * ELV 61 0.18 0.0032 Range of data usedDec P = 5.6 + 0.0029 * ELV 61 0.23 0.0001 Range of data used
Ann P = 1120 + 0.50* ELV 52 0.20 0.0010 Up to 2800 m
Analysis of multicolinearity between slope and elevation in all the bivariate equa
tions showed that these two variables were not significantly correlated. The variation
inflation factors in all the cases were less than 1.1. Elevation and slope were the main
Reproduced with permission of the copyright owner. Further reproduction prohibited without permission.

143
variables influencing the distribution of precipitation over the basin (Tables VII-2 to VII-
4). Unlike the results obtained by Spreen (1947), we found that the aspect was the least
important predictor of precipitation in the Kosi basin. Biases in the location of stations
with respect to aspect could be a reason behind the lack of correlation between precipita
tion and aspect but this needs further examination with site-based information or with
higher resolution DEMs. The influence of slope was significant only for winter precipi
tation. The regression equations excluding slope, obtained for winter months, are pre
sented in Table VIII-5 below.
Table VIII-5. Alternate statistical models for topographical variation of average precipitation over the Kosi basin for winter months.
M o n t h M o d e l N R 2 p > F A p p l i c a b i l i t y
Jan P = 10.2 + 0.0038 * ELV 61 0.26 0.0001 Range of Data UsedFeb P = 7.40 + 0.0076 * ELV 61 0.35 0.0001 Range of Data UsedMar P = 24.4 + 0.0089 * ELV 61 0.18 0.0008 Range of Data Used
Nov P = 7.3 0 + 0.0028 * ELV 61 0.13 0.004 Range of Data Used
Data are given in Appendix C.
The inclusion of slope as one of the predictors in winter months greatly improved
the equation for predicting precipitation in terms o f the coefficients of determination
along with p-values as shown by the difference of statistical indicators in Table VIII-4
and Table VIII-5.
Reproduced with permission of the copyright owner. Further reproduction prohibited without permission.

Reproduced
with perm
ission of the
copyright ow
ner. Further
reproduction prohibited
without
permission.
TEMPERATURE
Figure VIII-5. Average annual temperature in the Kosi basin based on an average annual lapse rate of 5.9 degree Celsius per kilometer (see Table VIII-6).

145
Modeling Temperature
Temperature influences water balance of a basin by directly influencing evapo-
transpiration and snowmelt. As discussed in earlier chapters, it plays a significant role
throughout the basin in the case of evapotranspiration whereas its influence is limited to
potential melt areas and snow covered areas in the case of snowmelt. Temperature
distribution over the basin is directly related to season and altitude.
We examined the latitudinal variation of temperature over the Kosi basin by ex
trapolating station temperature into sea level temperature and regressing the extrapolated
temperature to latitude. The regression analysis indicated no significant latitudinal
variation of temperature. Regression equations of temperature with respect to elevation
for different months are presented in Table VIII-6.
Table VIII-6. Monthly temperature models for the Kosi basin.M o d e l R 2 p > F
Jan T= 21 .3 -0 .0066* ELV 0.93 0.0001Feb T = 23.1 -0 .0066* ELV 0.94 0.0001Mar T = 27.0 - 0.0070 * ELV 0.97 0.0001Apr T = 29 .6 -0 .0067* ELV 0.97 0.0001
May T = 29 .8 -0 .0060* ELV 0.93 0.0001Jun T = 29 .2 -0 .0050* ELV 0.88 0.0001Jul T = 28.9 - 0.0047 * ELV 0.88 0.0001
Aug T = 28.5 -0 .0047* ELV 0.83 0.0001Sep T = 2 8 .8 -0 .0053* ELV 0.91 0.0001Oct T = 27 .7 -0 .0060* ELV 0.95 0.0001Nov T = 24 .9 -0 .0064* ELV 0.98 0.0001Dec T = 21 .8 -0 .0062* ELV 0.96 0.0001
Ann T = 26.7 - 0.0059 * ELV 0.96 0.001
Data are given in Appendix D (n = 20)
Table VIII-6 shows that the average monthly temperature is significantly related
to elevation with lapse rate varying from 4.7 °C/km in wet months to 7.0 °C/km in dry
Reproduced with permission of the copyright owner. Further reproduction prohibited without permission.

146
months. The vertical temperature gradients during active monsoon months are, hence,
less than saturated adiabatic lapse rate (6.5 °C/km) indicating highly moist condition of
atmosphere near land surface and high influence of warm monsoon winds during this
period. The highest average lapse rates of about 7.0 °C observed in dry months are close
to the average environmental lapse rate observed in lower troposphere (Linsley, Kohler,
& Paulhus, 1988). Figure VIII-5 presents annual average temperature obtained for the
basin by using extrapolated temperature values based on annual temperature lapse rate
(Table VIII-6) and DEM.
Modeling Evapotranspiration
Reliable estimation of evapotranspiration is a critical aspect in hydrological mod
eling as it is the major component of hydrological cycle that is not measured directly on
operational basis. Although several methods are available for its estimation, the reliabil
ity of the results is always questionable. Lee (1980, p. 180) summarizes such difficulties
as, “There is no reliable method for estimating evapotranspiration rates based on weather
element data or potential evaporation.”
We compared evaporation and evapotranspiration estimates using three methods
for a selected location in the Kosi basin. The chosen methods include: water balance
method, empirical equations, and pan-based method.
Water Balance
The water balance is one of the most widely used methods for estimating evapo
transpiration. The method based on longer term balance of hydrological cycle has several
problems related to accuracy of rainfall and runoff data including assumptions of soil
water storage. Nonetheless, Hewlett (1982, p. 89) says, “At present the safest approach to
Reproduced with permission of the copyright owner. Further reproduction prohibited without permission.

147
its (evapotranspiration) estimation for the purpose of making decision about forest and
wildlands is undoubtedly the water balance and the catchment experiment.”
Empirical Equations
Out of several available empirical equations, we selected the following equations
for the purpose of this study.
Temperature-Based Method. It is probably the most widely used method as tem
perature is the only required climatic data in this method. This method, originally
developed by Thomthwaite, has been satisfactorily applied in many parts of the world in
its original as well as simplified forms (Dingman, 1994; Ward & Robinson, 1990). We
used the following equation (Malmstorm, 1969) to compute potential evapotranspiration
using temperature data.
PET = * 25, (VIII-1)eA°)
where PET is the potential evapotranspiration (mm), es(T) is the saturation vapor pressure
(mb) at temperature T (°C) for a given month and e^(0) is the saturation vapor pressure
(mb) at 0 °C.
Hargreaves Equation. On the basis of theoretical aspects included in this empiri
cal equation and on the basis of several comparative results, it is one o f the most recom
mended equations in places where temperature is the only available data (Hargreaves,
Hargreaves & Riley, 1985; Shuttleworth, 1993). The equation can be expressed as:
PET = 0.0023Soa°rJ(T +17.8), (VIII-2)
Reproduced with permission of the copyright owner. Further reproduction prohibited without permission.

148
where PET, S0, oj, and T are potential evapotranspiration (mm), water equivalent of
extraterrestrial radiation (mm day'1) at temperature T, and mean monthly air temperature
(°C) respectively.
Penman Equation-Based Method. The Penman method, based on energy balance
and aerodynamics, is the most well known and probably the best method for the estima
tion of evapotranspiration (Dingman, 1994). Although the method needs several weather
variables, such as, radiation, vapor pressure, temperature and wind, most of them are
regularly measured in several climatological stations. Assumptions are usually involved
for evaluating radiation term in the Penman equation as radiation measuring stations are
rare.
Since the climatic stations within the Kosi basin are few and since the computa
tion of evapotranspiration must be extrapolated to wider areas of the basin, we used a
regional elevation based method developed by Lambert and Chitrakar (1989) for Nepal.
The regression based potential evapotranspiration equation for a given elevation can be
presented in the following format:
PET=A + B*Z, (VIII-3)
where PET is the potential evapotranspiration (mm) and Z is the elevation (m). A and B
are the coefficients obtained by linear regression. The values o f A and B are different for
different months.
Pan Based Method
Although technology is available for the measurement of evapotranspiration
(Ward & Robinson, 1990), this is the only available method for estimating evapotranspi-
Reproduced with permission of the copyright owner. Further reproduction prohibited without permission.

149
ration on a regular basis with direct evaporation measurement of water contained in a pan.
Potential evapotranspiration is estimated by applying a suitable coefficient. This method
has been described as one of the preferred methods by Shuttleworth (1993) with results
falling within the error margin of 10 to 15 per cent in relatively humid regions.
Comparison
Table VHI-7 below compares the estimates of monthly evapotranspiration made
by different methods described above for a location at about 1700 m. The comparison
shows that the subannual patterns of estimates are similar giving higher values in summer
and lower Values in winter.
Table VIII-7. Average monthly Class A pan evaporation and potential evapotranspiration at 1700 m estimated by different methods.
C l a s s A P a n
E v a p o r a t i o n
( m m )
P e n m a n M e t h o d
B a s e d P o t e n t i a l
E v a p o t r a n s p i r a t i o n
( m m )
T e m p e r a t u r e H a r g r e a v e s
B a s e d P o t e n t i a l P o t e n t i a l E v a p o t r a n -
E v a p o t r a n s p i r a t i o n s p i r a t i o n
( m m ) ( m m )
Jan 62 36 49 52Feb 76 56 54 59Mar 144 97 69 90Apr 155 121 86 110
May 121 130 91 118Jun 88 106 99 108Jul 73 93 99 105
Aug 74 93 89 100Sep 64 76 94 89Oct 76 74 82 82Nov 73 46 66 62Dec 64 33 53 51
Ann 1068 963 932 1027
As demonstrated by Table VIII-7, all the methods overestimate potential evapo
transpiration for summer monsoon months (June to September) compared with class A
pan evaporation. In general, the potential evapotranspiration values obtained from the
Reproduced with permission of the copyright owner. Further reproduction prohibited without permission.

150
Hargreaves method are the closest to the values obtained from the pan based method.
Table VIII-7 also indicates that the differences of annual estimates among different
methods are small and that the potential evapotranspiration is close to the Class A pan
evaporation.
Variation of evapotranspiration in mountainous environment is one of the least
understood aspects of regional hydrology. Available studies do not confirm the expected
significant relationship between evapotranspiration and elevation. Available surveys of
experimental results show inconclusive and contrasting outcomes (Barry, 1981; Peck &
Pfankuch, 1963). Lack of correlation between elevation and evaporation has also been
reported for the Himalayan region on the basis of evaporation data from eastern Nepal
(Alford, 1992). Moreover, all the temperature-based empirical evapotranspiration
methods predict none or negative evaporation (condensation) below certain point in
temperature scale.
Class A pan evaporation data are available only for three stations in southern side
of the Himalayas and two stations in the northern side in the Kosi basin. The altitude of
the stations in the southern side ranges from 1595 m to 1810 m within the basin. Figure
Vm-6 illustrates the temporal pattern of pan evaporation in southern side (Okhaldhunga)
and northern side (Tingri) in the Kosi basin. One more station (Tarahara), located at
about 200 m, close to the basin, is included in the figure to compare the pattern with low
elevation areas.
Reproduced with permission of the copyright owner. Further reproduction prohibited without permission.

151
CLASS A PAN EVAPORATION
"g 400 _
~ 300 ± e200 _
o 100 * o- *5 o ?
CD
2
■Q0)U.c3 Q .VO)3 o >o3
Tarahara Okhaldhunga _*_T ingri
Figure VIII-6. Monthly class A pan evaporation at Tarahara (200 m), Okhaldhunga (1720 m), and Tingri (4300 m).
The figure shows that the pan evaporation pattern between Tarahara (200 m) and
Okhaldhunga (1810 m) is similar with the low elevation station recording higher evapo
ration particularly during the monsoon and post-monsoon period. The pan evaporation in
the Tibetan part, on the other hand, is significantly high in all the months in a year despite
the location of sites in the high elevation zone at 4300 m (Figure VIII-6).
Some additional studies in other parts of Tibet are available that confirms the high
rate of evaporation in high elevation areas of Tibet. Some of these studies show the pan
evaporation and saturated soil evaporation rates exceeding nine millimeters on some dry
days of summer at an elevation of 5260 m (Xingcheng & Yingqin, 1989). Based on 14-
day observations in summer, Ohata et al. (1991) report the snow evaporation rates
varying from 0.81 mm of condensation to 3.58 mm of evaporation at 5170 m high
location.
The available pan evaporation data within the basin are inadequate to assess the
altitudinal variation of evaporation over the basin. We examined the relation on the basis
Reproduced with permission of the copyright owner. Further reproduction prohibited without permission.

152
of evaporation data from 17 stations located in different parts of Nepal. The elevation in
this data set ranges from 93 m to 1810 m (Figure VIII-7).
ALT1TUDINAL VARIATION OF EVAPORATION
2000 -
♦
| 1500 -
1 1000 *
0 ___________________________________________0 500 1000 1500 2000 2500
Elevation (m)
Figure VIII-7. Relation between elevation and Class A pan evaporation recorded in different parts of Nepal.
Regression analysis of these data shows statistically significant trend of decreas
ing evaporation with respect to increasing altitude. Analysis using monthly data, how
ever, shows that the relation between evaporation and elevation is not significant in
winter months. Table VIII-8 below shows the statistically significant relationships for
monthly as well as annual evaporation. The relations, obtained using Penman method
based computation (Lambert & Chitrakar, 1989), are also included in the table for com
parison. Figure VIII-6 exemplifies the relation between annual pan evaporation and
elevation in the mountains of the southern Himalayas.
Reproduced with permission of the copyright owner. Further reproduction prohibited without permission.

153
Table VIII-8. Relation between elevation and monthly and annual evaporationC l a s s A p a n e v a p o r a t i o n p > F R 2 P e n m a n P E T
Jan PET = 50 - 0.008 * ELVFeb PET = 74-0.010 * ELVMar PET = 125-0.017 * ELVApr E = 203 - 0.036 * ELV 0.003 0.45 PET =158 - 0.022 * ELVMay E = 231 - 0.061 * ELV 0.0001 0.69 PET =177 - 0.028 * ELVJun E = 187 - 0.048 * ELV 0.002 0.48 PET = 152 -0 .027 * ELVJul E = 1 4 6 -0 .028 * ELV 0.025 0.29 PET = 135 - 0.025 * ELVAug E = 143 - 0.022 * ELV 0.04 0.24 PET = 134-0 .024 * ELVSep E = 123 - 0.024 * ELV 0.007 0.39 PET =114 - 0.023 * ELVOct PET = 102-0.017 * ELVNov PET = 68-0 .013 * ELVDec PET = 47-0 .008 * ELVAnn E = 1544 - 0.219* ELV 0.003 0.46 PET = 1333-0.22 * ELV
The equations of Table VIII-8 are based on the evaporation and climatic data re
corded in the lower elevation and relatively more humid areas of the southern Himalayas.
Available information is not sufficient to validate them in high elevation areas and semi-
arid lands of the northern Himalayas. For instance, these equations indicate condensation
instead of evaporation (sublimation) in areas above 6000 m. Similarly, the value of
annual evapotranspiration given by the above equation for Tingri in Tibet (4300 m) is
about 400 mm. On the other hand, the recorded pan evaporation at Tingri shows the
average annual evapotranspiration of about 2400 mm (Appendix F) which is 800 mm
more than the value we might expect even with the lowest pan coefficient of 0.35 re
ported in literature (Shuttleworth, 1993). Hence, for the modeling of high elevation
evapotranspiration, we assumed the applicability of elevation based equations up to the
elevation of 3000 m and further assumed a constant evapotranspiration rate above this
elevation, a pattern similar to the areas in the Rocky mountains (Barry, 1981). Table
VIII-8 also indicates that the annual evapotranspiration is about 86 per cent of class A
pan evaporation.
Reproduced with permission of the copyright owner. Further reproduction prohibited without permission.

154
Discussion
The major limitation of this study is the lack of information available for the Ti
betan part and the high Himalayan zones of the basin. Although temperature can be
extrapolated over the basin with greater confidence by using the lapse rates, the extrapo
lation of precipitation and evapotranspiration are likely to suffer from higher levels of
uncertainty. Notwithstanding, analysis of hydrometeorological characteristics of the Kosi
basin using the available information show two major facts: 1) Himalayan topography
plays a significant role, and 2) hydrometeorological characteristics of the Kosi basin in
the south of the Himalayas are different from the characteristics of the basin in the north
in many respects.
Since only one station located at Tingri represents the Tibetan part of the basin,
we do not have adequate information to establish a hydrometeorological pattern over the
northern parts. Some available studies made in similar areas of Tibet do not provide
consistent conclusions. For instance, Ohata, Takahashi, and Xiangcheng (1989) find
significantly higher precipitation in the higher elevation zones than in adjacent valleys of
the Kunlun mountains of Tibet. On the other hand Ohata et al. (1991) do not find such
altitudinal increase in precipitation in the Tanggula mountains of the Tibetan plateau.
High values of class A pan evaporation in Tibet but relatively dry land-surface
and atmospheric conditions with low temperature bring higher uncertainties (due to
higher range in possible rates) in the estimation of actual evapotranspiration over these
areas. What is the nature of actual evapotranspiration in the snow covered high elevation
areas of the Himalayas? The lack of satisfactory answer to this question is not limited to
Reproduced with permission of the copyright owner. Further reproduction prohibited without permission.

155
the Himalayas but also to most of the snow covered areas in the world (Barry, 1981).
Available information is little, scattered, and the reported values are highly variable. This
area is likely to remain a great challenge among scientists for the years to come.
Reproduced with permission of the copyright owner. Further reproduction prohibited without permission.

CHAPTER IX
WATER BALANCE
The use of a regional water balance assessment was explored as an additional ap
proach to assess hydrologic response of the Kosi watershed to potential land-use and
climatic changes. The equation for long-term water balance can be expressed in its
simplest form as:
R = P - ET, (IX-1)
where R, P and ET are runoff, precipitation and evapotranspiration of a basin respec
tively.
As previously mentioned, obtaining a reliable water balance of the Kosi basin and
its sub-basins is a formidable task due to the extreme physiographic variation within the
basin. In addition, the long-term and regular precipitation network does not exist for
areas 4500 m above sea level which represents more than half of the Kosi basin. The
highest station with regular and up-to-date data is the station located in Chialsa at 2770
m. Nine other stations operated from few months to few years provide some information
on precipitation up to an elevation of 4300 m. The meteorological station of Tingri,
located at 4300 m is the only station with long-term data in the northern part of the basin.
It is the sole station representing the whole area o f the Tibetan plateau in the Kosi basin
that covers slightly less than half of the area considered in this study.
Reproduced with permission of the copyright owner. Further reproduction prohibited without permission.

157
Our attempt to obtain precipitation distributions over the basin by gridding the av
erage precipitation using widely-used interpolation techniques, such as, inverse distance
weighted interpolation (Bonham-Carter, 1994), spheremap interpolation (Wilmott, Rowe
& Philpot, 1985) and kriging (Isaaks & Srivastava, 1989) did not yield reasonable pre
cipitation patterns over the basin. Computation of water balance using such data shows
the average annual runoff values higher than the average annual precipitation. Addition
ally, we believe that the poor rain gauge network in higher elevation areas plus the
complexity of the topography are the major reasons behind significant underestimation of
basin precipitation. The average elevation of rain gauge stations, including all the
stations up to 4300 m, is about 1740 m. On the other hand, the average elevation of the
whole basin is 3840 m. Average elevation of the basin in southern side of the Himalayas,
covered by a better meteorological network, is about 2500 m. Only about 15 per cent of
the stations represent the area between 2000 m to 3000 m which is a relatively high
precipitation zone (Chapter VII).
To improve the precipitation field over the basin, we used the elevation based sta
tistical relationships developed in the previous chapter (Chapter VII). Unfortunately, the
results were still not satisfactory due to heterogeneity and disparity in the rain gauge
network. We, hence, used a great deal of judgment in selecting representative stations for
each sub-basin using information on location of stations and the precipitation characteris
tics and the knowledge of field setting. Other considerations for estimating areal average
precipitation over the basin and sub-basins included: use of interpolated values for the
Tibetan sub-basins with some judgment based estimates for the northern side of the
Himalayas. We further assumed that the average precipitation values of high elevation
Reproduced with permission of the copyright owner. Further reproduction prohibited without permission.

158
stations are applicable to the entire range of southern Himalayas in the basin above
2800m.
Appendix 0 gives the details of selected representative sites for particular sub
basins, the computation and the adjustments of basin precipitation. Table IX-1 below
presents the average annual water balance we obtained for the Kosi basin and its major
sub-basins.
Table IX-1. Average annual water balance of the Kosi River and its major tributaries.Station Precipitation (P)
(mm)Runoff (R)
(mm)Evaporation (E = P - R)
(mm)600 536 358 178602 2345 1804 541605 689 498 191610 1309 1063 246620 3170 2675 494627 3748 3265 484629 2523 2114 409630 1890 1498 392640 1684 1129 555647 1915 1572 343652 1896 1443 453660 2206 1781 424670 1792 1693 99680 1833 1179 656690 1984 1731 280695 1288 919 369
Due to inconsistent and unreliable values, we excluded two stations (606 and 650)
in water balance computation. Examination of discharge data for these two stations
showed several inconsistencies particularly during the high flow period.
Using Table DC-1 and area of the sub-basins, we can get the area-weighted annual
water budget of the basin. Water balance, based on average runoff and average precipita
Reproduced with permission of the copyright owner. Further reproduction prohibited without permission.

159
tion obtained at the catchment and sub-catchment level computations are given in Table
IX-2 below. Figure IX-1 illustrates the seasonal water budget pattern of the Kosi basin
and its dry north and humid south.
Table EX-2. Long-term water balance of the Kosi basin and its northern dry area and southern humid area.
Precipitation(mm)
P
Runoff(mm)
R
Evapotranspiration (mm)
ET = P -RArea weighted average of sub-basins within Kosi basin
1296 935 361
Kosi basin 1288 919 369
North Himalayan dry area of the Kosi basin
536 358 178
South Himalayan humid area of the Kosi basin: area weighted average of gauged sub-catchments
1875 1333 542
South Himalayan humid area on the basis of Kosi basin
1931 1424 507
The Table DC-2, presented above, describes water balance o f the basin that is
based on long-term observed precipitation and actual discharge. The accuracy of the
water balance primarily depends on the accuracy of these variables. Although individual
discharge is measured with great accuracy (2 to 10 per cent error) in most of the cases, its
overall accuracy can be much less than this percentage. Several sources of error are
likely to be introduced while obtaining and processing discharge data, for example, the
errors in gauge height measurement and the uncertainties in stage discharge relation. The
accuracy of discharge data can be much less during flood period when measurements are
Reproduced with permission of the copyright owner. Further reproduction prohibited without permission.

160
difficult and less accurate. Similarly, the precipitation estimation for the basin has
several sources of error in measurement and in gridding procedures.
As a simple examination of the water balance presented in table (Table DC-2), we
used the values of potential evapotranspiration for an elevation of about 1700 m (average
elevation of three class A pan evaporation stations) for the Kosi basin in Nepal using
Penman equation based computation (Chapter VIII) and the measured pan evaporation
data. In addition, we included the evapotranspiration values based on Temperature
(Table VIII-7)
Table EX-3. Comparison of the estimates of average annual evapotranspiration or evapo- ration for a selected location in the Kosi basin using different methods.________________
Estimated Evapotranspi-Method ration/Evaporation
(mm)Evapotranspiration based on water balance (Table IX-2) 507Potential evapotranspiration based on Penman method 963Potential evapotranspiration based on temperature data 932Potential evapotranspiration based on Hargreaves method 1027Average class A pan evaporation (Appendix F) 1068
The Class A pan evaporation, presented above, is the average for three locations
with elevation varying from 1595 m to 1720 m. The average elevation of these three
stations is 1665m. Comparison of the pan evaporation and potential evapotranspiration
computed by different methods shows that PET is about 90 per cent of the class A pan
evaporation. The table also shows that the net annual water loss of the basin is about 50
per cent of the annual potential if the annual PET computed for 1700 m is assumed to be
applicable for the basin.
Reproduced with permission of the copyright owner. Further reproduction prohibited without permission.

161
(a )Monthly W ater Budget
E 600 7500 |
3 400 T os
PrecipitationRunoff£ 300o
200 -
100 -
§o.usa. ca c3 a .
© ts >o o©a
(b) Monthly W ater Budget
E 6 0 0 -i 500 -f | 400 -i “- 300 }
1 200 -
■Precipitation■Runoff
3 100 +
Monthly W ater Budget(c )
"E 600 -
500 |c o c 400 |3KEO552
PrecipitationRunoff
300 |200 -
I ioo -S0.
T5 Su .re CL OL©
X )©U. recre 3
F ig u re I X - 1. A v e ra g e m o n th ly p r e c i p i t a t i o n and r u n o f f b u d g e t f o r : (a) t h e humid s o u t h o f t h e K o s i b a s i n , (b) th e d r y n o r t h o f t h e Kosi b a s i n , a n d (c ) a v e r a g e f o r th e K osi b a s i n .
Reproduced with permission of the copyright owner. Further reproduction prohibited without permission.

162
Available information is inadequate to estimate the basinwide PET. Although the
high Himalayan and Tibetan highlands provide a conducive environment for evapotran
spiration with high solar energy and winds, the process of evaporation over snow is more
complex to make reasonable estimates. As shown by the Class A pan evaporation data
from Tibetan region (Figure VIII-6), almost half of the rain-shadow area of the Kosi basin
has high potential for evapotranspiration. The observed rate of evaporation at two
stations in Tibet, however, may not be extrapolated to the glacial areas as the pattern of
evapotranspiration is influenced by high condensation rates over snow covered areas
(Lang, 1981) and low albedo. Furthermore, available technology for measurement of
evaporation over snow surface is not satisfactory (WMO, 1971).
Discussion
Planning of hydrological and meteorological networks in the region, so far, is
based on obtaining climatic information. Hence, the existing data base is a good source
for obtaining long-term climatology and is reasonably good for studying climatic trends
(Chapter VII). Since the areal extent does not cover the major hydrologically-important
high elevation areas of the Himalayan basins, the information is deficient for scientific
assessment of hydrological processes that occur at the basin scale. Despite detailed
consideration of altitudinal variation of precipitation and despite careful judgment in
selecting representative stations, the estimations of water balance at sub-catchment level
of the Kosi basin show significant disparities. Even for the meteorologically homogene
ous areas of the south Himalayas, the computed evapotranspiration varies from 99 mm to
656 mm. The average values presented in Table IX-2, here, are likely to be more reliable
than the values obtained for individual sub-catchments (Table IX -1).
Reproduced with permission of the copyright owner. Further reproduction prohibited without permission.

163
A review o f the disparities in water balance computation shows that the existing
precipitation gauging network underestimates the basinwide precipitation (compare Table
IX-1 and Table X-2) in most of the instances. It indicates that the existing precipitation
gauging network is not adequate to represent the increasing pattern of precipitation with
respect to altitude. Inadequate sampling of the hydrological and meteorological variables
in high elevation areas has already been discussed in Chapter IV. The pattern of underes
timated precipitation is further illustrated in Chapter XI (see Table XI-2 where all the
precipitation values are adjusted with weights higher than one) considering the case of a
sub-basin with relatively dense network. Strengthening of the existing hydrological and
meteorological network in high elevation areas is hence essential for proper quantifica
tion of the variables in water balance equation.
In the backdrop of inadequate information and in the absence of a framework for
such studies, our assessment of water balance for the Kosi basin should be considered as
approximate. Nevertheless, it utilizes the available spatial hydrological, meteorological,
and topographical information to the highest degree currently possible. The study clearly
shows the limitations of the existing hydrometeorological monitoring system in the
region and provides a backdrop for further scientific studies.
Reproduced with permission of the copyright owner. Further reproduction prohibited without permission.

CHAPTER X
HYDROLOGIC RESPONSE
As described in Chapter III, a general consensus exists regarding the issue of
monsoon intensification as a result of enhanced global wanning. The scale of expected
increase in precipitation and evapotranspiration varies depending on models used, type of
monsoon activities (strong vs. weak), and uncertainties in the level of predictions
(Bhaskaran, Mitchell, Lavery & Lai, 1995; Houghton, 1991; Meehl & Washington,
1993). In this chapter, we assess potential impacts due to alternate scenarios of precipita
tion and evapotranspiration changes as a result of possible land-use and climatic changes
in the Kosi basin.
Scenarios
Temperature Scenarios
A general review of the literature shows that three approaches are in use to predict
future temperatures: paleoanalogue method based on paleoclimatic evidence of similar
period (Budyko, 1991; Houghton, 1991), extrapolation of recently observed trend
(Budyko, 1991), and modeling the global climate using GCMs (Houghton, 1991).
Dining the second quarter of the 21st century, in a scenario of doubled carbon dioxide
(Schimel et al., 1995), the expected rises in global temperature by these three methods are
2.5° C, 2.0° C, and 1.8° C respectively. The range of predicted changes, however, varies
Reproduced with permission of the copyright owner. Further reproduction prohibited without permission.

165
globally from -3.0° C to 10° C (Schneider & Norman, 1989) depending on method used
and region considered.
Predicted rise of temperature in areas close to the Kosi basin in south Asia varies
from 1.0 to 4.0 degree Celsius (Bhaskaran et al. 1995; Houghton, 1991; Schneider &
Norman, 1989). Uncertainties in these predicted temperatures may range from -30 per
cent to +50 per cent (Houghton, 1991). Hence, possible scenarios for the case of doubled
carbon dioxide may include almost nonsignificant temperature change to temperature
increases by 6° C. We used four likely scenarios including 1° C, 2° C, 3° C, 4° C, and 5° C
for the assessment of the impact on precipitation, evapotranspiration and runoff over the
basin.
Precipitation Scenarios
As previously discussed, most global warming studies show an increase in pre
cipitation over the south Asian region as a result o f increase in land-sea temperature
gradient due to enhanced global warming. Quantification of such increase is mainly a
meteorological aspect for which hydrologist must rely on GCM outputs. The expected
increases in precipitation over the Indian sub-continent vary from three per cent to twenty
per cent (Bhaskaran et al., 1995; Houghton, 1991). Increases at the local level in the
vicinity of the Kosi basin can be interpolated to be as high as 50 per cent (Bhaskaran,
1995). In view of these estimates, we considered a scenario of no precipitation change
and the four scenarios of increase in annual precipitation including: 5 per cent, 10 per
cent, 20 per cent, and 50 per cent.
Reproduced with permission of the copyright owner. Further reproduction prohibited without permission.

166
Evapotranspiration Scenarios
Considering its practicability and better conceptuality, we selected Penman equa
tion based method for the purpose of water balance computation of the Kosi basin. We
used the elevation-based regression equations (Table VII-8) derived from the method
based on Penman equation for the mountains of Nepal. Out of the fourteen stations used
to derive the equations by Lambert and Chitrakar (1989) four are located in the moun
tainous areas of the Kosi basin.
Using elevation-based temperature and evaporation equations (Table VII-6 & Ta
ble VII-8), temperature change scenarios can directly be transformed to evapotranspira
tion change scenarios. For example, rise of two degrees Celsius in annual temperature is
equivalent to a shift of 339 m in elevation origin of the elevation based annual evapotran
spiration equations (Table VII-6). This change may increase annual potential evapotran
spiration by about six per cent when we use annual evapotranspiration and evaporation
equations presented in Table VII-8. This value is comparable to the GCM based esti
mates of Bhaskaran et al. (1995) and Meehl and Washington (1993) which are about five
to nine per cent.
Land-use Change Scenarios
As described in Chapter VI, about 25 per cent of the Kosi basin is covered by
forest, the rest being agriculture, grazing land and rocky areas. The forest cover is about
50 per cent if only the south Himalayan part of the basin is considered. Although the
perception of rapid deforestation exists in the region, no distinct trend could be estab
lished using the available information (Chapter VI). To include major possible scenarios
Reproduced with permission of the copyright owner. Further reproduction prohibited without permission.

167
of land-use changes over the basin we included four hypothetical scenarios of forest
cover, given as: 100 per cent, 50 per cent, 25 per cent, and complete deforestation.
Water Balance under Changed Scenarios
We used the following equation (Chapter V) along with the scenarios described
earlier to assess runoff changes as a result of expected changes in climate and land-use.
p - e ( \ - w )r = —— i-----S (X-l)
w
where r, p, and e are the runoff change, precipitation change, and evaporation change
respectively expressed as fractional change or percentage change. The runoff ratio (w) is
defined as the ratio of long-term precipitation to long-term discharge.
Changes in climate and land-use influence precipitation as well as evapotranspi
ration in Equation (X-l). As described in the sections dealing with the scenarios we used
five different scenarios of temperature change and four different scenarios of precipitation
change in four different conditions of land-use. The runoff ratio (w) for the Kosi Basin is
about 0.72 (Table VIII-2). In addition, we also analyzed the water balance for runoff
ratios of 0.67 and 0.82. The value of 0.67 is the runoff ratio of the Arun River basin
(Station No. 600) with most of the drainage area lying in Tibetan Plateau. Runoff ratio of
0.82 is the average for rivers originating mainly in the South facing drainage of the
Himalayas.
Appendix P contains the details of the computation of fractional change in evapo
transpiration (e) due to changes in temperature, C 02, and forest. Computation of evapo
transpiration change is based on the measured evaporation data of the Kosi Basin. We
computed the evapotranspiration changes due to C 02 using an approximate relation given
Reproduced with permission of the copyright owner. Further reproduction prohibited without permission.

168
by Equation V-16. We used Calder-Newson semi-empirical model (Equation V-15) for
the computation of fractional evapotranspiration change due to change in forest cover.
Since the model is based on data from the United Kingdom, we evaluated the coefficients
considering the local conditions o f the Kosi basin.
Table X-l illustrates the result of expected runoff changes under different climate
change and land-use change scenarios in the Kosi basin. The illustration is divided into
three parts: the relatively dry area of the Kosi basin in the Tibetan plateau, the Kosi basin,
and the southern part of the Himalayas.
The figures show that the response of the basin is not dramatic to the changes in
temperature and land-use. However, a significant impact can be expected in a climatic
scenario of significant change in precipitation. A five per cent increase in precipitation
can result in an increase of ten per cent runoff in a scenario of fifty per cent forest cover.
Additional remarks that can be drawn from the Table X-l are:
• Runoff is more sensitive to change in land-use than change in temperature.
• Runoff decreases with increasing temperature.
• Drier areas are hydrologically more responsive than humid areas. The re
sponse of dry areas of the Kosi basin exceeds by one to three per cent the re
sponse of wet areas under the scenarios of no precipitation change. The dif
ference is more than 15 per cent under the scenario of 50 per cent change in
precipitation.
Reproduced with permission of the copyright owner. Further reproduction prohibited without permission.

0)w.3eo
cfiecX)
O
c
o
fcocsc
C«Q.
aJo. > £ <ua>
Vi_ 1 -O £O V.•r= «cacVo91-*-*C£
«Sc
osocC3.e
xtU
3
£ -S' e S
-O o>
u
203.OCO
Sfa.O
.—. cs t"o 'II£ .— '
c c .£ o05 '-3U <U 2— 60 g
oO
.£ fc" o e5
cco x: o <u«? 2PCO JZ
' E- V >05 *<o -a oq cC CO CO
o t> VO
<u —: 05 T?- ? >° -6 >■a c2 — ̂« -o S.
*oc.2 ^
v i « S • & ©<o .t f
1 8 t— Q.
$o
© ^ r> ’ f ’ f ‘ 2
GOOtl
o coCOCMCMin q q q q q
o r*- r- COinCM CMCMCMCMCM»«•
o min COCO»■*
m 05«0GON. N-o o o o o o
o COCMCMo o o o q o
T-■
e- CM CO toO
CM
oii$
oq TTq COq COP-.*“ »«
oCM COcoCMcoq oq 05CM
© 0) COp«*CDm
*- *-mq CM>r“ o 05o
COo*“ T*»
oo ino o COo CMq o*■*
CMCO"Tin
o o 05 N. CDq q q q q q
o COm CMY-*«s q q q q q*-
o o 0) N» COq q
Q.T—
in CM o 0)o q o
o COIf) CMCMq q o o o o
CMCO in
cooa$
oinu
s .CMq CMq q oq oq # oin CMq q q oq oq
inCM
*■»
oq inq inq mq q COq0U»
oq COq inq q q COq*“ 2o 'r“
O CO CO CM CMLL.
O CO CO CM
O .r *
inq N.o N.o COo CDo inq inq s.o COq coo ino inq■*" *“ e“
oq o o oo oq 0505 oo o oo oo 0505 0505o
CMGOo
T— T“ d oCM CO in CM CO in
CMh-oft5
* u _ ^ _on o in ifl ^ ^ n"5J CM CM CM CM CM CM
oH-
oq CMq N oq O)q 00q
oq oq O)q coq h»q COq■*“ •*
o CO m •O' CO CM■*“
ino 05o GOo r»*o COo ino■*”
oo CMo CMo oo 0505 000>o o
vr- CMCO-o- m fwoa$
a$
O
O 1- O O <35 coO O O O 05 05i-' w ^ W d o
oii
?CM CO i nO
om q oq 05q eoq h«.q oq q oq 0)q GOq r»*q■*“ ■*“ ■*” ■*“ o1*
ooq O(O 05q N.q COq mq
n«?
oq 05q COq q COq inq*” So *“
o CO m ■O’ CMCM o in CMT~
CLino 05o GOo fs.o 8
ino ino coq h*o rs.o ino qtJ ■*“ s— S“
oq CMo o oo GO05 CO0) oo CMo 8 oo GO05
pv05
CM CO
o o
in 0.72
CM CO
o
T
o
in
oq 00q fwq inq q CMq * oq N.q COq q COq CMq*“ inCM
oq COq CMq o« 05q r-qD%
oq CMq « 05q GOq h-qT— T— O
oT“
o GOh- m ■M*CM u . o h- CD COCMT"” T— e“ *— X e->T—e—
a Q.ino o 05q 00q CDo ino ino o GOo s COo •O’o
oo o CMo oo 8 GO03 oo CMq q o GO05 r̂ .05o o f»-co
dr_ *• T" O o
—CM CO■M* in CM COV in
n$
£oD
2o
U .
©n
o f̂ . in T̂COq q q q q q+- **
o CMo 05ooCOq COq q q qT—
o P- in COCM
*"in 05GON. COTTo o q o o o•*“* ■*“o CM o GO?s.o o o q 0505T-” o o
r“ CMCOO’ inU
Reproduced with permission of the copyright owner. Further reproduction prohibited without permission.
fracti
onal
Incr
ease
In pr
ecip
itatio
n, w
= ru
noff
coeff
icien
t, and
T
= tem
pera
ture

170
• Runoff ratios smaller than one (decreasing runoff) can be expected in a sce
nario of temperature rise exceeding four degrees Celsius with insignificant
change in precipitation pattern in areas with less than 50 per cent forest cover.
Statistical Assessment
We used monthly precipitation and catchment characteristics, such as land-use and
hypsometric division of the basin, to evaluate the influence of these variables and pa
rameters on the hydrology of the basin. Influence of each parameter and variables are
assessed by statistical approach evaluating their relation to runoff. Table X-2 contains the
major classification of land-use distribution and hypsometric division over the Kosi basin
and its tributaries. Similarly, Table X-3 provides the wetness index of the basin. Wet
ness index is the average monthly precipitation in the basin or the sub-basin obtained by
spheremap interpolation (Wilmott, Rowe, & Philpot, 1985) on long-term average pre
cipitation data. Instead of basin precipitation, we used the term ‘wetness index’ as the
amount does not represent the basin precipitation as described in the last chapter showing
precipitation lower than runoff in several sub-basins.
Correlation of annual and monthly runoff with catchment characteristics showed
high correlation of river discharge with total basin area, area of different hypsometric
classes and different land-use classes. Surprisingly, the correlation of annual and
monthly discharge with precipitation was insignificant even during the monsoon months.
Monsoon discharges were, however, significantly related to monsoon precipitation.
Table X-4 presents the nature of the correlation of discharge with basin characteristics.
Reproduced with permission of the copyright owner. Further reproduction prohibited without permission.

Reproduced
with perm
ission of the
copyright ow
ner. Further
reproduction prohibited
without
permission
Table X-2. Land-use and hysometric data o f the Kosi basin and its major gauged tributaries.
MAJOR LAND-USES (km2) ELEVATION ZONES (km2)
S t n . I A M A L A SG CG A G R B I S L s H F C F E L V L T 5 0 0 K M 1 K M 2 K M 3 K M 4 K M 5 K M 6 K M 9 T o t a l
600 0 0 1624 85 515 14422 3766 4637 20 20 307 50 4868 0 0 80 365 757 14395 8729 1121 25447602 0 71 0 2 0 0 39 11 0 0 278 9 1609 11 117 167 78 28 9 0 0 409605 28 123 1624 100 519 14462 4108 4833 20 20 1208 197 4744 16 174 475 792 1017 14662 8897 1208 27241606 55 917 1624 114 531 14459 4146 4864 20 20 2563 220 4485 188 755 1545 1207 1061 14671 8897 1208 29532610 0 2 0 0 4 1212 283 347 0 235 233 75 4583 0 0 105 190 223 824 969 78 2388620 0 9 0 0 53 66 115 39 0 0 182 129 3356 0 9 101 144 124 135 71 11 594627 0 0 0 0 0 0 8 83 0 15 8 0 4098 0 0 0 11 35 55 12 0 113629 41 511 22 0 0 0 20 183 0 93 374 93 2156 0 186 615 211 152 142 32 0 1338630 82 636 41 0 57 1281 419 568 0 347 1067 406 3541 0 305 1183 634 521 1100 1072 89 4904640 0 28 12 0 0 0 0 0 0 0 28 0 1854 0 0 0 50 19 0 0 0 69647 0 35 0 0 67 602 824 469 0 80 610 60 4141 0 11 289 432 469 663 943 142 2948650 0 0 0 0 0 19 18 11 0 16 220 46 2815 0 0 27 195 81 23 4 0 330652 260 1361 60 0 124 1903 1263 1049 0 578 2600 943 3304 7 687 2691 1626 1095 1786 2018 230 10141660 0 174 0 0 53 35 94 87 0 19 450 9 2874 0 55 225 296 174 62 58 51 921670 90 218 0 0 149 268 1017 482 0 165 1208 53 3786 0 96 482 845 572 602 670 383 3650680 416 2388 89 0 340 2207 2378 1620 0 889 6190 1076 3192 225 1715 4860 3084 1848 2450 2746 664 17593690 466 985 12 100 4 121 1630 318 0 39 2238 34 2854 46 572 1816 1230 652 732 602 298 5948695 957 4466 1727 213 875 16803 8153 6835 20 948 11363 1330 3839 608 3276 8447 5528 3561 17853 12246 2170 53689
IA = Intense Agriculture (75-100 %) MA = Medium Agriculture (50-75 %) LA = Light agriculture (25-50 %)SG = Subtropical/Temperate
Grass Land CG = Cold Area Grass Land AG = Arctic Grass Land
RB = Rock and Boulders IS = Ice and Snow L = Lake S = ShrubHF = Hardwood and
Mixed Forest CF = Coniferous Forest
ELV = Average Altide of Basin (m) LT500m = Area with Altitude < 500 m KM1 = Area with Altitude 500m to 1km KM2 = Area with Altitude 1 to 2 km KM3 = Area with Altitude 2 to 3 km.
KM4 = Area with Altitude 3 to 4 km KM5 = Area with Altitude 4 to 5 km KM6 = Area with Altitude 5 to 6 km KM9 = Area with Altitude 6 to 9 km
171

172
Table X-3. Wetness index obtained by gridding the point precipitation values over the basin and sub-basinsBasin Jan Feb Mar Apr May Jun Jui Aug Sep Oct Nov Dec AnnArun u/s of 600 7 10 18 24 40 86 130 123 75 28 5 4 536Sabhaya u/s of 602 18 23 45 117 246 379 444 402 322 131 20 11 2417Arun u/s of 605 8 12 20 30 53 107 154 145 93 35 6 5 650Arun u/s of 606 8 12 21 33 61 118 166 155 102 39 6 5 719Bhotekosi u/s of 610 24 38 52 59 82 198 310 285 191 83 12 18 1309Balephi u/s of 620 26 34 55 74 135 388 648 594 367 109 17 17 2464Melamchi u/s of 627 29 37 60 74 157 544 1025 890 489 97 13 19 3454Indrawati u/s of 629 22 27 43 63 130 418 751 691 380 86 12 15 2662Sunkosi u/s of 630 22 32 49 64 108 299 505 465 279 86 12 16 1922Roshi u/s of 640 17 18 31 57 101 255 415 378 200 68 7 7 1561Tamakosi u/s of 647 18 27 42 61 103 241 380 355 218 75 11 13 1560Khimti u/s of 650 13 20 39 74 142 341 533 512 286 71 13 11 2069Sunkosi u/s of 652 19 27 43 63 110 274 449 414 249 78 11 14 1752Likhu u/s of 660 14 18 32 58 111 275 437 403 242 65 10 9 1662Dudhkosi u/s of 670 15 18 29 44 29 240 396 370 217 71 9 9 1493Sunkosi u/s of 680 17 22 37 57 107 264 426 386 235 74 10 12 1650Tamoru/s of 690 17 25 54 90 150 250 350 307 220 74 16 11 1577Saptakosi u/s of 695 12 17 30 49 87 183 277 251 160 56 9 8 1125
Data from DHM (various years).
Table X-4. Hypsometric and land-use classes of the basin having the highest correlation with discharge.______________________ ________ ______
Two best correlated Two best correlated land- Forest Agricultural Totalhypsometric divisions use divisions land Area
Jan 3-4 km 2-3 kirt HF RB(0.983) (0.948) (0.945) (0.928) (0.943) (0.988) (0.932)
Feb 3-4 km 2-3 km RB HF(0.975) (0.926) (0.946) (0.923) (0.920) (0.984) (0.952)
Mar 6-9 km 3-4 km RB CG(0.951) (0.943) (0.964) (0.937) (0.870) (0.967) (0.973)
Apr 6-9 km 3-4 km RB CG(0.958) (0.946) (0.975) (0.936) (0.872) (0.972) (0.976)
May 3-4 km 6-9 km RB SG(0.952) (0.938) (0.964) (0.908) (0.890) (0.979) (0.956)
Jun 3-4 km 2-3 km RB HF(0.979) (0.938) (0.949) (0.932) (0.926) (0.987) (0.940)
Jul 3-4 km 2-3 km HF MA(0.992) (0.967) (0.962) (0.940) (0.961) (0.988) (0.912)
Aug 3-4 km 2-3 km HF MA(0.983) (0.958) (0.955) (0.938) (0.954) (0.984) (0.906)
Reproduced with permission of the copyright owner. Further reproduction prohibited without permission.

173
Table X-4 continuedTwo best correlated hypsometric divisions
Two best correlated land- use divisions
Forest Agriculturalland
TotalArea
Sep 3-4 km 2-3 km HF MA(0.988) (0.968) (0.966) (0.945) (0.963) (0.990) (0.909)
Oct 3-4 km 2-3 km HF MA(0.990) (0.972) (0.969) (0.950) (0.967) (0.989) (0.903)
Nov 3-4 km 2-3 km HF MA(0.983) (0.962) (0.961) (0.942) (0.958) (0.988) (0.908)
Dec 3-4 km 2-3 km HF MA(0.979) (0.949) (0.949) (0.926) (0.945) (0.988) (0.924)
Ann 3-4 km 2-3 km HF MA(0.987) (0.959) (0.956) (0.934) (0.953) (0.99) (0.921)
(Values in the parentheses indicate correlation coefficient. The abbreviations are defined in Table X-2.)
Table X-4 above shows that the areas of the watershed between two to three kilo
meters were the most sensitive for hydrologic response. This is the dominant area that
contributes to seasonal snowmelt runoff. The high correlation of rocky area to discharge
further suggests that the role of groundwater contribution from rocky areas of the Hima
layas was also an important determinant of runoff. Although both the agriculture areas
and the forest areas were highly correlated with discharge, the correlation coefficients of
agriculture areas were higher than the coefficients of forest areas of the basins.
Discussion
In the context of a sparse hydrometeorological network, the water balance based
method is probably the best conceptual approach to evaluate hydrological responses to
climatic and land-use changes over a basin. Due to several uncertainties in the prediction
of climatic and land-use scenarios, we used the water balance based approach with
several possible scenarios including some extreme cases. Since the methods used are
Reproduced with permission of the copyright owner. Further reproduction prohibited without permission.

174
based on relative changes instead of absolute changes, the predicted relative responses
can be considered fairly reliable when the whole basin is considered as an aggregate unit.
Comparison of Table X-4 with the results of discharge trend computed in Chapter
VI shows that we need to pay more attention to the assessment of the areas between two
to three kilometers. The statistical assessment which shows high significance of the areas
in the range of seasonal snowmelt might have been influenced by the climatic changes
resulting in reduced snowmelt runoff during melt seasons.
The statistical analysis indicates that the hydrological response of the basins is less
sensitive to the change in precipitation as compared to its response to the basin charac
teristics under the conditions tested. Since most of the basin characteristics (basin area,
geology, soil etc.) are less likely to change with respect to the changes in climate and
vegetation, a dramatic impact of such changes on hydrology of the basin is, hence, less
likely.
The approaches used to examine hydrological response, here, are based on basic
and simple principles. These methods cannot be applied to analyze the changes in
different parts of basin which are found in actual situations. We deal this aspect of
modeling hydrological response using a conceptual distributed hydrological model in the
following chapter.
Reproduced with permission of the copyright owner. Further reproduction prohibited without permission.

CHAPTER XI
HYDROLOGICAL MODELING
Assessment of water balance in the Kosi basin (Chapter EX) indicated several de
ficiencies in the supporting data base. Although estimates were made for some locations
in the data deficient high Tibetan plateau of the basin for annual average values (Chapter
IX), no such estimates were practicable for modeling at higher temporal and spatial
resolution. We, therefore, selected the Tamor River basin, a sub-basin o f the Kosi basin
for the purpose to apply distributed hydrological modeling at a monthly time step. The
basin, draining the third highest mountain peak in the world, lies entirely in the southern
side of the Himalayan range. It is the only basin lying entirely in Nepal with long hy
drological records (1948-1994).
Model Parameters
Chapter V provides a brief description of the Water Balance Model (WBM) used
to ihodel the water balance of the Tamor basin. The model consists of five major input
variables and parameters including: soil texture, land cover, elevation, temperature and
precipitation.
Soil Texture
No soil texture map is available for the basin at useful resolution for grid-based
modeling. The available low resolution soil texture map (Food and Agriculture Organi
zation [FAO], 1974) classifies not only the whole area of the Tamor basin but also the
Reproduced with permission of the copyright owner. Further reproduction prohibited without permission.

176
largest subbasin of the Kosi basin having lithosols group of soil. On the other hand, a
significant variation of soil is found in the northern part as well as southern part of the
Himalayan region in terms of texture, mineral content, depth and other characteristics
(Ghildyal, 1981; Pandey, 1987; Shah, 1985; Wenhua, 1993).
Soil layers in the high mountain areas are relatively thin due to the influence of a
rocky landscape and steep slope. Lower elevation areas are dominated by granular sandy
soil mixed with gravel. Similarly, the valleys in high elevation areas consist of glacial
coarse soil whereas the low elevation valleys are dominated by sandy loam and silty clay.
Since no soil texture map is available for the basin and since the soil characteris
tics are highly influenced by the altitudinal variations, we used the following simple soil
texture classification based on elevation zones (Table XI-1) for modeling water balance
using WBM.
Table XI-1. Classification of soil texture for WBM input.Elevation Zone Soil Texture Code for WBMArea above 5000 m Lithosol 8Area between 3000 m to 5000 m Sandy Loam 4Area below 3000 m Mixed texture 7
Considering the classification of Table XI-1, major part of the basin (about 62 per
cent) contains sandy loam (Figure XI-1). About 23 per cent and about 15 per cent of the
areas are covered by lithosol and mixed texture respectively.
Reproduced with permission of the copyright owner. Further reproduction prohibited without permission.

177
HCD
6zS
* i
r j*3 i
&■3131e
I 1l1
□ i
&3wX4>
-ac«
a.2.QO8.O
£V>»3
3-D
V>*C
6 a s 61 I I 1
H D DS E E S
I I § § 1n ri i< ^
£
£
304c
300E
Reproduced with permission of the copyright owner. Further reproduction prohibited without permission.

178
10 la IO C 20 to IO C
PRECIPITATION: Jan PRECIPITATION: Jul
POTENTIAL EVAFOTRANSPIRATION: Jan POTENTIAL EVAPOTRANSPIRATION: Jul
25-50 mm I f l SO-lOOmm 100-200 mm 200-100 mm 400600 nu n fOO-OOOmm
Figure XI-2. WBM input for the Tamor river basin: layers of temperature, precipitation, and potential evapotranspiration for a selected dry and a selected wet month.
Reproduced with permission of the copyright owner. Further reproduction prohibited without permission.

Vegetative Cover
We reclassified the available detailed vegetation map (Chapter IV, Figure FV-3) of
the Tamor basin into the major groups of vegetative cover used in WBM (Figure XI-2).
The reclassified land-use map of the Tamor River basin for the late 1970s shows the
following major land-use distribution: conifer forest (0.6 per cent), broad-leaf and mixed
forest (37.4 per cent), shrub-Iand (0.6 per cent), grassland (3.7 per cent), tundra (27.8),
cultivation (24.5 per cent) and rocks (5.4 per cent).
Since the changes in vegetation and its impact on hydrology are the major issues
considered in this study, we used the following scenarios in WBM model:
a) Present land-use (38 per cent forest)
b) Conversion of all the broad leaf forest area into cultivation (0.6 per cent forest)
c) Conversion of all cultivation land into forest (62 per cent forest)
d) Conversion of all forest, shrub and grass land below 4000 m into cultivation
(0.1 percent forest)
e) Conversion of all cultivation, shrub, and grass-land below 4000 m into forest
(73 per cent forest)
Temperature
Temperature layer, used as input in WBM, is the average temperature recorded at
four climatological stations in the Tamor basin: 1307, 1401, 1404, and 1405 (Figure VI-
1; Appendix D). We distributed the average temperature over the basin using the
monthly lapse rate values (Table VI-5) and DEM 30 (DEM with 30 arc-sec resolution).
Figure XI-2 includes the average temperature map obtained for the Tamor basin with
these procedures for two selected months.
Reproduced with permission of the copyright owner. Further reproduction prohibited without permission.

180
We used the following scenarios in WBM to assess the possible hydrological im
pact of enhanced global wanning:
a) Present temperature
b) Modest rise in temperature (1 °C and 2 °C)
c) Expected maximum rise in temperature in a scenario of doubled carbon dioxide
(4 °C and 5 °C, see Chapter IX)
Precipitation
The density of rain gauges in the basin is about 450 km2 per station which is the
highest for similar basins in Nepal. Since most of the stations are located in low eleva
tion areas or valleys in the basin, the estimates o f basin precipitation are low. We, hence,
used the following weights (Table XI-2) for correcting monthly precipitation. The
weights are computed using the information of elevation represented by a station, relation
between precipitation and elevation (Chapter VII) and the average water balance of the
Tamor basin. Average precipitation obtained for two selected months is included in
Figure XI-2.
Table XI-2. Weights used for individual stations to compute basin precipitationJan Feb Mar Apr May Jun Jul Aug Sep Oct Nov Dec
1307 2.2 1.8 2.0 1.3 1.3 2.2 2.2 2.9 2.7 1.3 2.2 1.81308 2.2 1.8 2.0 1.3 1.3 2.2 2.2 2.9 2.7 1.3 2.2 1.81401 1.3 1.3 1.3 1.3 1.3 1.3 1.3 1.3 1.3 1.3 1.3 1.31402 1.3 1.3 1.3 1.3 1.3 1.3 1.3 1.3 1.3 1.3 1.3 1.31403 1.3 1.3 1.3 1.3 1.3 1.3 1.3 1.3 1.3 1.3 1.3 1.31404 1.3 1.3 1.3 1.3 1.3 1.3 1.3 1.3 1.3 1.3 1.3 1.31405 1.3 1.3 1.3 1.3 1.3 1.3 1.3 1.3 1.3 1.3 1.3 1.31406 1.3 1.3 1.3 1.3 1.3 1.3 1.3 1.3 1.3 1.3 1.3 1.31413 1.3 1.3 1.3 1.3 1.3 1.3 1.3 1.3 1.3 1.3 1.3 1.31414 1.3 1.3 1.3 1.3 1.3 1.3 1.3 1.3 1.3 1.3 1.3 1.31418 1.3 1.3 1.3 1.3 1.3 1.3 2.2 2.1 2.1 1.3 1.3 1.31419 1.3 1.3 1.3 1.3 1.3 2.2 1.7 1.8 1.7 1.3 1.3 1.31420 1.3 1.3 1.3 1.3 1.3 1.6 1.8 1.7 1.6 1.3 1.3 1.3
Reproduced with permission of the copyright owner. Further reproduction prohibited without permission.
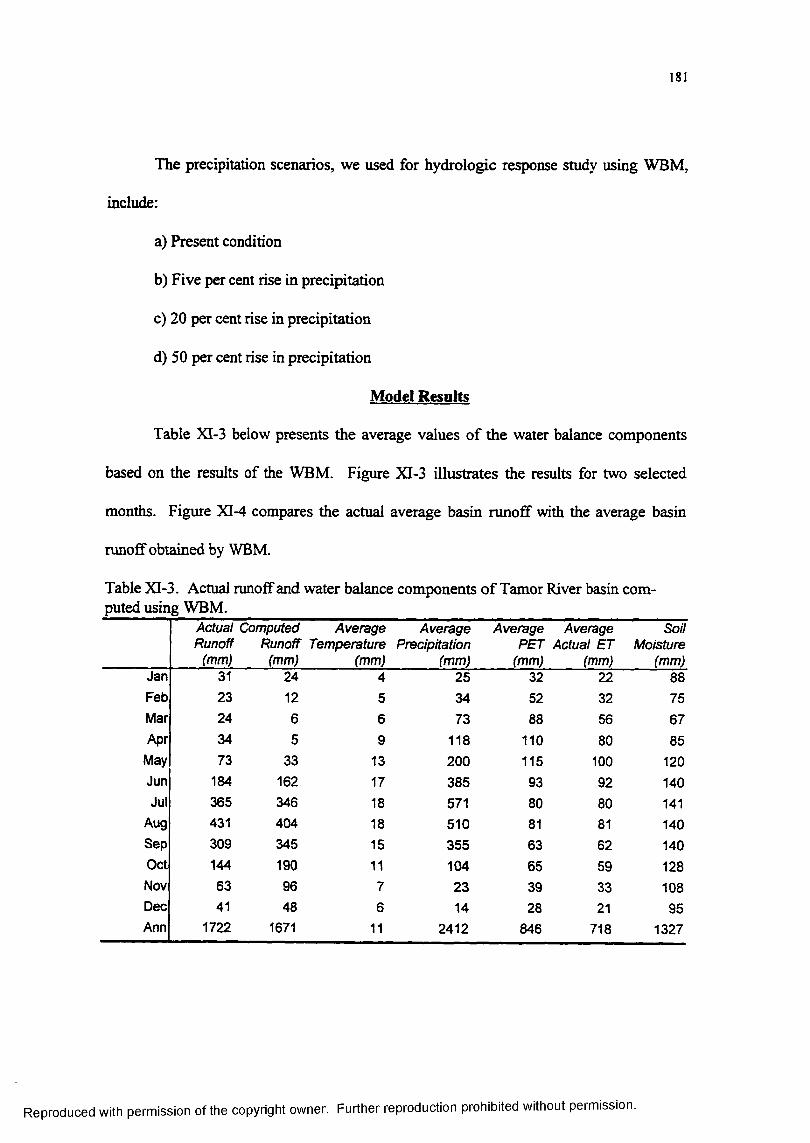
181
The precipitation scenarios, we used for hydrologic response study using WBM,
include:
a) Present condition
b) Five per cent rise in precipitation
c) 20 per cent rise in precipitation
d) 50 per cent rise in precipitation
Model Results
Table XI-3 below presents the average values of the water balance components
based on the results of the WBM. Figure XI-3 illustrates the results for two selected
months. Figure XI-4 compares the actual average basin runoff with the average basin
runoff obtained by WBM.
Table XI-3. Actual runoff and water balance components o f Tamor River basin com-puted using WBM.
A c t u a l C o m p u t e d A v e r a g e
R u n o f f R u n o f f T e m p e r a t u r e
( m m ) ( m m ) ( m m )
A v e r a g e
P r e c i p i t a t i o n
( m m )
A v e r a g e A v e r a g e
P E T A c t u a l E T
( m m ) ( m m )
S o i l
M o i s t u r e
( m m )
Jan 31 24 4 25 32 22 88Feb 23 12 5 34 52 32 75Mar 24 6 6 73 88 56 67Apr 34 5 9 118 110 80 85
May 73 33 13 200 115 100 120Jun 184 162 17 385 93 92 140Jul 365 346 18 571 80 80 141
Aug 431 404 18 510 81 81 140Sep 309 345 15 355 63 62 140Oct 144 190 11 104 65 59 128Nov 63 96 7 23 39 33 108Dec 41 48 6 14 28 21 95Ann 1722 1671 11 2412 846 718 1327
Reproduced with permission of the copyright owner. Further reproduction prohibited without permission.

182
ACTUAL EVAPOTRANSPIRATION: Jan ACTUAL EVAPOTRANSPIRATION: Jul
SOIL MOISTURE: Jan SOIL MOISTURE: Jul
RUNOFF: Jan RUNOFF: Jul
025 nun 25*50 mm 100*200 oun 400400 mm
Figure XI-3. WBM output for the Tamor river basin: layers of actual evapotranspiration, soil moisture, and runoff for a selected dry and a selected wet month.
Reproduced with permission of the copyright owner. Further reproduction prohibited without permission.

183
ACTUAL AND COMPUTED RUNOFF
450 - 400 ,
^ 350 i E* 300 _
250 i *§ 200 .1 § 150 - E 100 .
50 _ 0 i i
oo a)u_
| Actual Runoff (mm) ■ Computed Runoff (mm)
Figure XI-4. Actual average runoff and the runoff computed by WBM for the Tamor River basin.
Figure XI-4 indicates that the average basin runoff estimated by WBM compares
well with the actual discharge of the river during wet periods of the year. WBM under
estimates the discharge during low flow season. The average annual basin runoff com
puted by WBM (1671 mm) is only three per cent less than the actual average annual basin
runoff (1722 mm).
Figure XI-5 illustrates the hydrologic response of the Tamor River basin for se
lected dry month and wet month of a year in different hypothetical scenarios of tempera
ture, precipitation, and land-use. Land-use and precipitation pattern remaining the same,
the figure shows that the annual runoff may decrease by 9.0 per cent under the scenario of
rise in temperature by five degrees Celsius.
Reproduced with permission of the copyright owner. Further reproduction prohibited without permission.

184
RUNOFF CHANGE
80iuOz<zoIUo<
60
t 40 O| 20
oocIU0. -20 -
0 1 2
TEMPERATURE RISE(C)
ui(9z<Z u .
UJ z2 = <CKzIUo0CUi0.
80604020
-A -
1 2 4
TEMPERATURE RISE(C)
ui©zZ u.° f eUi z
zUioDCUi0.
80
60
40
20 —
0 t-20 —
-f-
TEMPERATURE RISE(C)
■ p=0% ■ p=5% — p=20% —A— p=50%
Figure X-5. Expected runoff change in the Tamor river basin in different scenarios of temperature and precipitation: (a) Existing land-use (b) Change of all lands below 4000 m into forest cover (c) Change o f all lands below 4000 m into agricultural land, p indicates increase in precipitation.
Reproduced with permission of the copyright owner. Further reproduction prohibited without permission.

185
Changing all agricultural land below 4000 m into forest reduces the runoff by 1.3
per cent of the original value in the model at the existing temperature and precipitation
conditions. Similarly, conversion of all agricultural land below 4000 m into forest may
result in a runoff decrease of about 11.8 per cent in a scenario of 5 °C rise in temperature.
It is the maximum reduction obtained among selected scenarios.
Among the several scenarios of temperature, precipitation and land-use, the
maximum increase in annual runoff (71 per cent) was obtained with the following combi
nation: 50 per cent increase in precipitation, conversion of all forest into agriculture, and
no change in temperature pattern. The model results also demonstrate that the forest has
a significant role in influencing hydrologic response of the basin in lower precipitation
scenarios.
Discussion
Results obtained for different scenarios of possible climate and land-use changes
are similar to the results obtained for the Kosi basin using water balance approach
(Chapter VIII). The major difference between these two approaches is the degree of
response. The WBM based approach shows the higher degree of watershed response to
land use and climatic changes compared to lumped water balance approach.
Lumped water balance is a simple approach that can be applied with relatively lit
tle information. Lumped water balance is probably the only approach that can be applied
for the studies of data deficient area, such as the Kosi basin. This approach can also be
useful for obtaining first approximate values for data-rich areas.
Application of lumped water balance approach is logical for the Kosi basin as the
application of distributed deterministic models requires numerous assumptions to substi
Reproduced with permission of the copyright owner. Further reproduction prohibited without permission.

186
tute for unavailable data. We, hence, applied the lumped approach for the Kosi basin as a
whole and distributed deterministic approach to a sub-basin of the Kosi basin. Use o f a
plant efficiency factor to the evapotranspiration rate due to increased level of CO, is a
favorable feature in the lumped water balance approach. WBM does not include the
effect of C02 on plant physiology.
Reproduced with permission of the copyright owner. Further reproduction prohibited without permission.

CHAPTER XII
IMPACT ON SEDIMENT FLUX
The Kosi River is considered as one of the most notorious rivers of the region not
only for its frequent disastrous floods but also for the sediment the floods transport
downstream. Primarily, because of heavy sediment deposition in downstream plain areas,
the river has shifted over 115 km during the last 200 years (Gole & Chitale, 1966)
destroying several thousand kilometers of land in Nepal and India (Alam, 1980). On the
basis of unpublished data, Ives and Messerli (1989) rank the Kosi River among the
highest sediment yielding rivers of the world.
The role of vegetative cover in controlling soil erosion has been recognized for
centuries with several experiments and studies for quantifying such effects over the last
several decades (Lee, 1980). Vegetative covers are likely to reduce direct impact of
rainfall in washing away soil on the surface. Such covers also reduce surface water
movement by facilitating water loss through interception and evapotranspiration and
through induced infiltration. The vegetative component is one of the six major factors
used in the Universal Soil Loss Equation, USLE (Wischmeier & Smith, 1978). Because
of such relations, human activities are usually blamed for the massive sediment delivered
by the Kosi basin to the Ganges plain and further downstream to the Bay of Bengal
(Chapter III). One of the major solutions proposed for sediment control of the Kosi River
includes upstream watershed management (WEC, 1979; Zollinger, 1979).
Reproduced with permission of the copyright owner. Further reproduction prohibited without permission.

1S8
Among several factors, controlling the erosion and sedimentation processes in the
Himalayas, topography and precipitation are the most influential. Actively uplifting steep
topography and intense monsoon precipitation are the major forces controlling sediment
dynamics. More than 80 per cent of annual precipitation falling during four months of
summer monsoon provides conducive environment for surface mass wasting (Carson,
1985). Frequent intense convective precipitation events during premonsoon as well as
summer monsoon periods cause extensive surface erosion.
The records of extreme precipitation in Nepal show that most of the stations lo
cated above 2000 m have recorded daily precipitation amount exceeding 300 mm
(Department of Hydrology & Meteorology [DHM], Various Years). The records show
the extreme daily precipitation amount as high as 505 mm at a location in the Kosi basin.
Similarly, the topography of some of the northern parts and all the southern part of the
basin is characterized by moderate to steep slopes. Analysis of DEM30 (Figure II-3)
shows that more than 65 per cent of the basin areas have slope in the range of five to
fifteen degrees. Although about 25 per cent of the basin areas have slope less than 5
degrees, most of the areas in this range lie in the Tibetan plateau. Such areas with mild
slope in the southern Himalayas of the basin are less than two per cent. Hence, the
southern part of the basin is more prone to water-induced soil erosion and sediment
discharge than the areas lying in the Tibetan plateau.
How much of the sediment delivered by the Kosi River to the Ganges plain is
contributed by land-use and climatic changes? Despite the effort of several researchers,
no reliable estimate is available to answer this question. Estimates vary from negligible
impact to as high as 40 per cent out of the total sediment delivered by the basin (Carson,
Reproduced with permission of the copyright owner. Further reproduction prohibited without permission.

189
1985; WEC, 1979). Ramsay (1986) and Ives and Messerli (1989) have given a descrip
tive summary of several studies based on satellite imagery, reconnaissance survey,
landslide observations, field studies, and plot studies in Nepal. These studies, although,
show the significance of soil erosion in two basic forms: sheet or rill erosion and mass
wasting, no study provides adequate information to divide the process into natural and
anthropogenic. Mass transport of sediment to downstream areas by occasional Glacier
Lake Outburst Floods (GLOF, WECS, 1987) and natural dam breaks (Sharma, 1988) add
further complications in assessing human impact on sediment.
Sediment Information
DHM operates sediment sampling stations on two major tributaries of the Kosi
basin: Sunkosi at Kampughat and Tamor at Mulghat. Although DHM follows the
standard WMO procedures to compute sediment concentration using the filtration tech
nique, our assessment indicated that the data were usable neither for time series analysis
nor for modeling sediment transport. The reasons are: irregular data, poorly maintained
stations, and poorly trained personnel for field and laboratory work. In summary, sedi
ment monitoring does not have due priority. Non-existence of bed load sampling, poor
sediment discharge relationships, and difficult conditions for sampling sediment during
floods are additional reasons behind poor quality of sediment data.
In contrast to the standard sediment measurement and laboratory procedures of
the DHM, a station on the Kosi River maintained by CWC, India, operates using more
simple procedures. A full-time observer collects the sediment sample by dipping a
metallic bottle type sampler at five points at a cross-section. The observer analyses the
sample for size as well as weight at the sampling site using simple drying and weighing
Reproduced with permission of the copyright owner. Further reproduction prohibited without permission.

190
techniques. Correction factors are applied to obtain the average for the cross section
(Rao, 1956). Although the procedure and instrumentation are not adequate for obtaining
accurate data, timely processing and regular observations make the CWC data more
informative than the DHM data.
Data collected by CWC was available only for the Kosi river from 1948 to 1977.
Our analysis o f sediment trends for the Kosi basin is, hence, based on the observation of a
single location; for that reason the analysis lacked information on spatial characteristics
of trend.
Figure XII-1 below presents the data of total annual sediment load available for
the Kosi River at Chatara from 1948 through 1977. The patterns of sediment load,
although very high in some years, did not show any distinct trend.
Analysis of Trend
Sediment T ransport
09E 250 .u
■ § 200 _ u! 150 - /, 1 100/ \e / \| 50 . V \
Figure XII-1. Annual sediment load measured on the Kosi River at Chatara
Data from CWC (1981)
Reproduced with permission of the copyright owner. Further reproduction prohibited without permission.

191
Table XII-1 below presents the statistics of parametric and nonparametric tests
applied to the time series o f suspended sediment load presented in Figure XII-1. The
table shows a slightly negative trend of sediment over the period of record; but the trend
is insignificant in terms of parametric statistics as well as nonparametric statistics.
Table XII-1. Parametric and nonparametric trend of sediment load on the Kosi River at Chatara.
Nonparametric ParametricSediment Load Z-statistics Z-critical p-value Slope R* F-statistics p-valueNormal Scale -1.80 0.964 0.072 -1.18 0.05 1.4 0.25Logarithmic -1.93 0.973 0.054 -0.005 0.07 2.0 0.17Scale
Response to Land-use and Climatic Changes
Abundant literature is available dealing with the role of vegetation in controlling
soil erosion; but most of them, including the most well known USLE (Wischmeier &
Smith, 1978) and its modified forms (Onstad, 1984), are applicable only for plot or field
scale. Although the USLE-type of equations have been used to model erosion in some
basins (Ferro & Minacapilli, 1995), such an approach is almost meaningless in the
Himalayan region where mass wasting in the form of landslides and debris flow is the
significant source of sediment (Carson, 1985; WEC, 1987).
Reported sediment delivery rate of the three major tributaries: Sunkosi, Arun, and
Tamor are 135 tons/ha, 45 tons/ha, and 240 tons/ha (Sharma, 1988). We assessed the
landslide area using land-use data (Survey Department, 1984) for these three basins. The
landslide areas are 0.09 per cent in the Sunkosi basin, 0.02 per cent in the Arun basin and
0.14 per cent in the Tamor basin. Although the computations do not include Tibetan part,
Reproduced with permission of the copyright owner. Further reproduction prohibited without permission.

192
and although these values are lower than the values reported in some publications
(Shrestha, 1989), the figures suggest that the sediment delivery of the basins is highly
related to mass wasting. Such relation can be expected to be more significant for medium
sized basins. Based on three years of observation in a small catchment (110 km2) in the
middle mountain of the Kosi basin, ICIMOD (1995) reports “... between 55 and 80 per
cent of the annual loss of soil occurred in two storms ... during the pre-monsoon season
The Regression approach that relates sediment delivery to basin characteristics
and climatic characteristics (Walling & Webb, 1983) is probably the best option available
considering the type of available information and nature of processes at work in the basin.
Not much information is available even for the statistical modeling of sediment at the
basin level for the Kosi basin. We hence reviewed the regression equations developed by
Sharma and Kansakar (1992) using most of the available suspended sediment data in the
Himalayan basins of Nepal. These regressions of sediment delivery dependent on land-
use, hypsometry, river characteristics, and precipitation indicate that sediment delivery is
significantly related to river discharge, area of rock and meadow, area below 2000 m,
monsoon precipitation, and agriculture area. Similarly, the annual sediment yield is
negatively related to river length, forest area, and snow area.
The Sharma and Kansakar (1992) model relating sediment delivery to snow area,
and agriculture area and monsoon precipitation can be expressed as:
Sy = [-0.89 + 0.47 * Vq - 0.059 *VlS]2 (XII-1)
Sy = [-3.91 + 0.071 * VAA + 0.058 * VRB + 0.101 VMP]2 (XII-2)
Reproduced with permission of the copyright owner. Further reproduction prohibited without permission.

193
Where, Sy, Q, IS, AA, RB, and MP are sediment yield (million ton), discharge
(m3/s), ice and snow area (km2), agriculture area (km2), rock and boulder (includes
meadow in this expression) area (km2), and monsoon precipitation at the basin centroid
(mm) respectively. Since the predictors of Equation XI-1 and Equation XI-2 differ from
the available classification of land-use (Table IX-1), we used seventy-five per cent of the
alpine and cool temperate grazing land as meadow. Equation XII-1 and Equation XII-2
compute a sediment load equal to 164 million tons and 170 million tons respectively
under the existing condition of land-use and climate. Considering the accuracy of data
and model, these figures compare reasonably well with the sediment transport figure of
about 135 million tons/yr (1.4 times the reported value of 95.4 million cubic meters/yr)
reported in CWC (1982).
Concerning land-use and climatic changes, the expected changes, in the variables
described above, are the changes in forest area, agriculture area, snow area and precipita
tion. Both the changes in snow area (due to change in temperature) and changes in
precipitation pattern are likely to influence the sediment delivery of the catchment.
Under the different scenarios of change in snow area and monsoon precipitation, the
expected changes of sediment delivery given by the Equation XII-1 and the equation XII-
2, are shown in Figure XII-2.
Figure XII-2 shows that 50 per cent increase in agriculture area is likely to in
crease sediment transport by about 15 per cent to 20 per cent. A similar type of response
can be expected if the snow-covered area decreases significantly in the predicted scenar
ios of enhanced global warming.
Reproduced with permission of the copyright owner. Further reproduction prohibited without permission.

194
S E D I M E N T DELI VERY
250 _ 200 ■ -
iu g <0 150 ri z v 1 0 0 -H f t 5 0 -
H 0 -5 10 20 50
INCREASE IN PRECIPITATION (%)
-*— Present Agriculture — ■— 50 % Increase in Area Agriculture Area
(a)
S E D I M E N T DELI VERY
250
H £ ~ 200 *2 2 (fl| g < o 1 5 0 -
5 z £ 10° •5 0 -
0 10 20 50DECREASE IN SNOW AREA (%)
(b)Figure XII-2. Predicted change in sediment delivery of the Kosi basin in possible scenarios of (a) change in precipitation and agriculture area and (b) change in snow area.
Since floods are the major source of sediment transport, the monsoon plays a sig
nificant role. Although the intensity of precipitation is usually more important in eroding
soil and causing flash floods, seasonal totals can also be critical as they influence the
volume of flood flows. Figure XII-2 indicates that an increasing seasonal precipitation
Reproduced with permission of the copyright owner. Further reproduction prohibited without permission.

195
amount up to 20 per cent resulted in a moderate rise in sediment load. The increase in
precipitation by more than 20 per cent is likely to cause significant increase in sediment
delivery rate of the basin. More than 20 per cent increase in annual sediment yield can be
expected in a scenario of 50 per cent increase in annual precipitation amount; land-use
remaining the same. Similar effects can be expected with the increase in cultivated area.
Discussion
Soil erosion, sediment transport, and sediment deposition are important geomor-
phologic processes of the Himalayan environment driven by precipitation and resulting
streamflows over the watershed. Assessment of sediment movement over watersheds
provides a useful indication of changes in land-use, precipitation pattern, and streamflow
pattern. In addition, assessment of erosion and sedimentation has a significant economi
cal value as the rates of soil erosion in the Himalayas and siltation over the Gangetic plain
are some of the major concerns of the region (Chapter III).
Assessment of available sediment data over the Kosi basin does not indicate a
significant trend of sediment discharge from 1948 to 1977. This finding indicates that the
climatic changes and land-use changes of the past were insignificant to bring noticeable
changes in sediment characteristics of the basin. It supports the findings of Chapter VII
which shows that the basinwide trends of hydrological and meteorological characteristics
are insignificant over the Kosi basin.
Since the long-term time series data on sediment are available for a single location
in the Kosi basin, we can not make definitive assessment. Moreover, the data are inter
mittent without complete information from 1977.
Reproduced with permission of the copyright owner. Further reproduction prohibited without permission.

196
Several meteorological, hydrological, geological, and land-use variables influence
sediment transport. Since the sediments are carried away by rivers, river discharge can be
expected to have the best relation to sediment concentration. On the other hand, the
scatter diagrams of sediment concentration versus discharge for most of the rivers in
Nepal are highly scattered (WEC, 1987). It exemplifies the complexities involved in
erosion and sedimentation processes in the Himalayas. Conceptual modeling of the
erosion and sedimentation process is, hence, likely to be speculative because o f inade
quate data and because of high degree of inherent complexity. Since long-term sediment
data for the Kosi basin is available for only one location, spatial modeling approach is
impractical. Hence, we analyzed the basin response to different land-use and climate
change scenarios by extrapolating the regional sediment model of Nepal. Considering
these limitations, the outcomes of this study should be considered as approximate and
first order.
Reproduced with permission of the copyright owner. Further reproduction prohibited without permission.

CHAPTER XIII
STRATEGY FOR MONITORING HIMALAYAN HYDROLOGY
Chapter VII shows that the existing hydrological and meteorological network is
fairly good for assessing climate change in the lower elevation areas of the Himalayas.
Long-term data for high elevation areas, which occupy a significant portion of the Hima
layas, are severely lacking for proper climate change assessment. Establishment, opera
tion, and maintenance of such networks in these areas are extremely difficult due to
remoteness of the sites, high operational cost, and the lack of necessary logistic support.
In addition, technological development and technical expertise needed to monitor the
complex hydrological and meteorological processes under the influence of snow, ice, and
glacier physics are not adequate in the region.
Existing Infrastructure
Despite the arduous task, the network initiated for the Kosi basin in the 1940s in
cluded high elevation precipitation stations. As described in Chapter IV, eight precipita
tion gauging stations were established 3000 m above sea level, out of which two stations
were located above 4000 m. Most of these stations were closed after few years of opera
tion limiting an important information source on Himalayan hydrology.
Excluding the few observational attempts described above, the Himalayan hydrol
ogy in Nepal did not receive serious attention from the scientific community until the
1960s. Japanese scientists developed a long-term research program called “Glaciological
Reproduced with permission of the copyright owner. Further reproduction prohibited without permission.

198
Expedition in Nepal” (GEN) in collaboration with the government of Nepal in 1973
(Higuchi, 1992). Three phases of the expedition were able to produce a series of refer
ences on mass balance, heat balance, and geochemical analyses of several glaciers. The
importance of the studies of the Himalayan environment was recognized by several other
international scientific communities in the 1970s and 1980s as indicated by a series of
symposiums and seminars on mountain hydrology of the Himalayas in the region and
elsewhere in the world (Adhikary, 1993).
The central Himalayas of Nepal were considered as ‘one of special interest’ by the
Man and Biosphere Program (MAB) of UNESCO as early as 1973 for the studies of
human-environment relations (UNESCO, 1973). Despite several seminars and symposi
ums that followed these recommendations, the status of long-term data collection systems
in the high Himalayan region has not improved as indicated by the closure of several high
altitude stations. Similarly, the water balance of the Himalayan region cannot now be
quantified properly due to lack of hydrological and meteorological information.
Realizing the importance of hydrological and meteorological studies of the high
Himalayan region, the government of Nepal established the Snow and Glacier Hydrology
Unit (GHU) under the Department of Hydrology and Meteorology in 1987. The unit,
with the German Technical Assistance (GTZ), has established hydrological and mete
orological stations at six locations covering different parts of the Himalayas in Nepal for
regular hydrological and meteorological observations. Two of the stations established by
the unit lie in the Kosi basin.
Recently, UNH has initiated a program in collaboration with DHM for scientific
research of the high Himalayan areas. The program, initiated in 1993, involves scientists
Reproduced with permission of the copyright owner. Further reproduction prohibited without permission.

199
from DHM and UNH for carrying out research works. The hydrologists and glaciologists
of both institutes are involved in studies related to hydrology, meteorology, chemistry,
and other environmental and paleoenvironmental aspects of the high elevation areas in
the Nepali Himalayas.
Shortcomings
The major shortcoming of the hydrological researches in the Himalayas are the
unavailability of hydro-meteorological information for long-term monitoring of climate
and for modeling watershed processes. For instance, the researches carried out under
GEN are primarily focused on small catchments for a certain duration of a season. The
12 months record of 1985-86, recorded at an elevation of 3920 m in the Langtang Hima
layas of central Nepal, is the longest continuous record obtained under GEN. All the
studies carried out under GEN are based on either site-specific analyses or catchment-
scale analyses with catchment size not exceeding 340 km2.
The efforts of DHM to obtain long term hydro-meteorological data at six loca
tions in different parts of the Himalayas above 3000 m have been partially successful for
precipitation. No continuous records of discharge data are published and evaporation
measurements do not exist. These data are hence insufficient for time series analysis,
water balance studies, and streamflow modeling.
The hydrometeorological infrastructure developed so far in the Himalayas can
be considered good for obtaining accurate data for some hydro-meteorological variables
at a few locations. Except in a few instances, such as the year-long records of Langtang
station recorded under GEN, the quality as well as quantity of data is poor for proper
Reproduced with permission of the copyright owner. Further reproduction prohibited without permission.

200
water balance studies and is inadequate for time series analyses. Although the GEN data
base, developed for a small watershed in the Langtang region of the central Nepal, are
reasonably good; they are still inadequate for obtaining reliable water balances. The
available information can be used to partially answer the question of precipitation over
the basin but not the evapotranspiration. Besides, these data are too short for time series
analyses with a time frame extending beyond the length of one year. One major point is
that the collection of good quality continuous hydrometeorological data for the whole
year was possible due to the direct supervision of Japanese scientists for almost the whole
period of data collection. Unavailability of such backing on long-term basis is one more
shortcoming for the development of a Himalayan hydrology monitoring program.
Strategy
Any strategy to make a successful hydrological monitoring and investigation pro
gram should consider the constraints imposed by nature in the Himalayas. Moreover, the
technology needs to be simple enough so that information can be acquired with the
minimum loss of data.
We propose a strategy to start with simple water balance questions:
• How much precipitation falls over the basin?
• How much water flows out of the basin?
• How much water returns to the atmosphere by evapotranspiration?
• How much sediment do the rivers carry with them?
For obtaining an answer to these questions, we should consider the following
facts:
Reproduced with permission of the copyright owner. Further reproduction prohibited without permission.

201
• Regular monitoring of hydrometeorological variables is almost impossible
beyond certain elevation (above 4000-5000 m).
• Monitoring of hydrometeorological variables in snow and ice conditions
requires a specialized and higher level of training and may require nontra-
ditional approaches.
Accurate answers to all these questions will require many measurements
and studies. Hence the strategy should aim at reasonable answers that can be sup
ported with the measured data directly, to minimize many adjustments required in this
study. Since the monitoring of large watersheds for hydrology and meteorology re
quires enormous technical and economical resources, we propose a hydrological re
search program in a modest sized (meso-scale) watershed with the following strate
gies.
1. Intensive monitoring of river and sediment discharge (few stations but details and
higher accuracy of data) and extensive monitoring of precipitation, evaporation,
and temperature (several stations but simple methods).
2. Periodic (at least once a year) monitoring of areal extent and characteristics of
snow using remote sensing techniques.
3. Periodic (every five to ten year intervals) monitoring of land-use over the whole
basin using remote sensing techniques.
4. Exploitation of the best available sites for establishing primary stations.
Reproduced with permission of the copyright owner. Further reproduction prohibited without permission.

202
5. Development of selected primary stations into bench-mark stations for monitoring
long-term hydrology and development of model stations for experiments with hy
drological variables and technologies.
6. Development of infrastructure to facilitate scientific communities of the universi
ties and relevant organizations to carry out of experiments and researches.
7. Application of the straight forward and least sophisticated methods so that the
failure of instruments and the problem o f highly trained personnel can be mini
mized.
8. Priority to the measurement of seasonal totals of precipitation and evaporation at
most of the sites with the help of a cumulative type of measurement system, such
as, storage rain gauge.
9. Priority to the re-establishment of closed stations and upgrading the existing
network.
10. Operation of backup (secondary) gauging sites for the primary gauging stations.
11. Real-time or almost real-time processing of observations and measurements.
12. Higher level of supervision and monitoring.
13. Extension of hydro-meteorological and Iand-use monitoring programs to include
the monitoring of several components of environmental and biogeochemical cy
cle, such as, demography, socio-economy, socio-culture, biology, nitrogen cycle,
carbon cycle, phosphorous cycle and so on, so that a link can be established
among ecological, biogeochemical and hydrological cycles.
Since the development of Himalayan hydrology by including the whole Himala
yan region is a major task that demands the cooperation of several countries sharing the
Reproduced with permission of the copyright owner. Further reproduction prohibited without permission.

203
Himalayas, a better strategy (relative to the current situation) would be to isolate a
suitable and representative watershed for the studies. The program should then be
extended to other watersheds utilizing the experiences gained from the studied water
sheds.
Appendix P contains a brief description of the Tamor River basin. We propose
this river basin for initiating detailed studies of the Himalayan hydrology with the strate
gies described in this chapter. Tamor River system lying entirely in Nepal and bordering
India and China is a suitable river basin in terms of its size, location, and representation
of the Himalayan environment. The river basin drains the watershed of the mount
Kanchanjangha, the third highest peak of the world. The river, presently gauged at
Station 690 (Figure IV-2), has the steepest river profile among seven major tributaries of
the Kosi basin (Figure II-3) and probably the highest annual sediment yield among
similar basins in the world (Ives & Messerli, 1989).
DISCUSSION
High degrees of uncertainty in the process evaluation of the Himalayan environ
ment have already caused great confusion among the concerned people and planners of
the region. Our attempts at basin-scale hydrological studies in the Himalayan region have
brought to light several shortcomings. There are, hence, urgent requirements to upgrade
basin-scale studies in the region at higher resolution to reduce the level o f existing
uncertainties.
Since the scope of basin-scale studies is extensive, the best approach is to focus
on few moderately sized basins with proper hydro-meteorological monitoring systems.
Besides the representation of a region in the Himalayas, the moderately sized basins have
Reproduced with permission of the copyright owner. Further reproduction prohibited without permission.

204
a great deal of importance for vertical representation that may include the whole tro
pospheric depth. The other major advantages of studies in such basins are the existence
of all types of climate, vegetation, and biogeochemical processes found on earth within
limited areas. Untouched by the modem industrial revolution, most of the Himalayan
basins and sub-basins are intact with little direct anthropogenic impacts m aking them
ideal as bench mark against which future changes can be assessed.
Reproduced with permission of the copyright owner. Further reproduction prohibited without permission.

CHAPTER XIV
CONCLUSIONS AND RECOMMENDATIONS
Human and livestock interactions with forest and agriculture are central to the
agrarian population living in the Himalayan mountains. Such interactions have existed in
the region for centuries but with little concern as the anthropogenic changes in the region
remained insignificant for a long period. The population growth rate in the region
changed from almost negligible to more than two percent per annum since the middle of
the 20th century. Increasing population pressure on land resources and global climatic
changes have added a complex dimension to the existing interactions among population,
environment, and land resources.
We explored the extent of the problems in terms of environmental indicators, such
as meteorological and hydrological variables. We examined hydro-climatic trends and
analyzed hydrologic response o f the Himalayan basin to expected land-use and climate
change scenarios considering the case of the Kosi basin. The Kosi basin, lying in the
central Himalayas, has a meso-scale dimension.
Assessment o f anthropogenic information available for the basin showed the
existence of a modest population pressure with a growth rate of about one percent per
annum over the basin during the last four decades. Comparison of land-use data of the
1960s (and earlier period) with the data of the late 1970s did not reveal noticeable
differences within the basin.
Reproduced with permission of the copyright owner. Further reproduction prohibited without permission.

206
Analysis of the existing hydrometeorological data for the last four decades
showed some evidence of increasing temperature as well as precipitation similar to that
predicted under the scenarios of enhanced global warming by GCM. The computed
trends, although statistically significant for some localized areas, were not significantly
homogeneous over the Kosi basin.
Although spatially heterogeneous, the decreasing trends of discharge, particularly
during low-flow season, shown by the mainstem river and its major tributaries need
careful additional considerations. In the background of increasing precipitation and
increasing temperature in some areas, such decreasing trends of discharge are likely to
indicate one or more of the following factors: decreasing snow-cover areas as a result of a
rise in snowline, negative annual mass balance of snow, increasing evapotranspiration
losses, and decreasing winter precipitation in high elevation areas. Proper assessment of
these likely phenomena needs careful assessment of the hydro-meteorology of high
elevation areas of the Himalayan basins on a long-term basis.
We examined the hydrological sensitivity of the basin to the possible land-use
change and climate change scenarios using several approaches: water balance, statistical
correlation, and distributed deterministic modeling. Results of all the approaches
indicated a strong influence of basin characteristics compared to monthly climatic
characteristics. Among the climatic variables, hydrologic response was much more
sensitive to the changes in precipitation; the response being more significant in the drier
areas of the basin.
A scenario of temperature rise by 4 °C caused a two to eight percent decrease in
runoff depending upon the model used. The percentage change in runo f f was in general
Reproduced with permission of the copyright owner. Further reproduction prohibited without permission.

207
higher than the percentage of expected precipitation change in a scenario applying
existing temperature. Based on the sensitivity of sediment transport to the precipitation
and land-use, we found that the sediment yield of the basin may increase by about 20
percent in a scenario of 50 percent rise in precipitation. The predicted increase was 15 to
20 percent in a scenario of 50 percent increase in cultivated areas.
Assessment of the hydrological response of the Himalayan basin to expected
climatic changes have more scientific importance than operational value as the results are
based on scenarios with high degree of uncertainties and models with inadequate
validation. Close monitoring of hydrological and meteorological variables in the
Himalayan region with emphasis on regular data collection in the high elevation zones is
the major prerequisite for evaluating and modeling climatic and anthropogenic changes
over the region. Implementation of such a recommendation may need the evaluation of
non-traditional methods besides traditional techniques considering the remoteness of
most of the areas of the Himalayan basins.
The study presented in this dissertation shows a general picture of the Himalayan
hydrology including its relation to the atmospheric and geographic environment. No
attempts have been made to go into the details of specific hydrological processes as each
process has its own dimension of complexity forced upon by the Himalayan diversities.
We consider that the present work is an essential pioneering step for advancing and
developing the knowledge of the Himalayan hydrology. We hope that this study will
provide a satisfactory impetus to improve the data base system and will provide a general
background for more specific studies of key hydrological variables and their
interrelations.
Reproduced with permission of the copyright owner. Further reproduction prohibited without permission.

208
Existing hydrometry in the region showed deficient infrastructure for basin scale
scientific studies. Standard operational hydrological procedures are inadequate to
understand the temporal and spatial behavior of hydrological variables. We, hence,
recommend the establishment of a moderately-sized (few thousand square kilometers)
benchmark basin in the Himalayas for the study of basin-scale hydrological processes.
Such a basin will help to monitor climatic and land-use trends and to develop appropriate
hydrological technologies for the Himalayan environment. Monitoring of sediment
transport and deposition processes should also be an integral part of such an exercise with
its scope to include other biogeochemical variables.
Most of the Himalayan basins are untouched by the modem industrial revolutions
and attendant water resources development. Most of the high elevation areas of the
basins are intact with no significant direct anthropogenic influence. These characteristics
make them ideal for developing bench-mark basin to monitor global climatic and other
environmental changes. Moreover, the existence of all types of geographical conditions
and biogeochemical processes within a moderately sized basin makes it suitable as a
hydrological laboratory to test and develop new hydrological monitoring technologies
and gain insights into hydrological processes.
Reproduced with permission of the copyright owner. Further reproduction prohibited without permission.

REFERENCES
Adhikary, S. P. (1993). Snow and Glaciers of the Himalayas. In G. J. Young (Ed.), International Symposium on Snow and Glacier Hydrology (pp. x-xiv). Kathmandu: International Association of Scientific Hydrology.
Alam, A. M. (1980). Certain aspects of geomorphometric features of the Kosi drainage basin and need for international technical collaboration in watershed management practices. Symposium on Hydrology in Water Resources Development (pp. 55-59). New Delhi: CBRI.
Alford, D. (1992). Hydrological aspects o f the Himalayan Region (ICIMOD Occasional Paper No. 18). International Centre for Integrated Mountain Development, Kathmandu.
Anthes, R. A. (1984). Enhancement of convective precipitation by mesoscale variation in vegetative covering in semiarid region. Journal of Climate and Applied Meteorology. 23(4), 541-554.
Applegate, G. B., & Gilmour, D. A. (1987). Operational experiences in forest management development in the hills of Nepal (ICIMOD Occasional Paper No. 6). International Centre for Integrated Mountain Development, Kathmandu.
Bagchi, A. K. (1982). Orographic variation of precipitation in a high-rise Himalayan basin. In J. W. Glen (Ed.), Hydrological Aspects o f Alpine and High Mountain Areas (pp. 3-9). Exeter: International Association of Hydrological Sciences.
Bajracharya, D. (1983). Fuel, food or forest? dilemmas in a Nepali village. World Development. H(12), 1057-1074.
Bajracharya, M. K. (1985). Forests. In T. C. Majupuria (Ed.), Nepal nature's paradise (pp. 112-129). Bangkok: White Lotus Co. Ltd.
Barrows, H. K. (1933). Precipitation and runoff and altitude relations for Connecticut river. American Geophysical Union Transaction. 14.396-406.
Barry, R. G. (1981). Mountain weather and climate. London: Methuen.
Barry, R. G. (1990). Changes in mountain climate and glacio-hydrological responses. Mountain Research and Development. 12(1). 71-83.
Reproduced with permission of the copyright owner. Further reproduction prohibited without permission.

210
Barry, R. G. (1992). Mountain climatology and past and potential future climatic changes in mountainous region: a review. Mountain Research and Development. 12(1), 71- 83.
Belle, G. V,, & Hughes, J. P. (1984). Nonparametric tests for trend in water quality. Water Resources Research. 20(11.127-136.
Bhaskaran, B., Mitchell, J. F. B., Lavery, J. R., & Lai, M. (1995). Climatic response of the Indian subcontinent to doubled CO, concentrations. International Journal of Climatology. 15(8). 873-892.
Bista, H. B. (1992). Ban Ra Batabaran. Kathmandu: Nepal Batabaran Patrakar Samuha.
Black, P. E. (1991). Watershed Hydrology. Englewood, NJ: Prentice Hall.
Bonham-Carter, G. F. (1994). Geographic information systems for geoscientists: modeling with GIS. New York: Pergamon.
Bosch, J. M., & Hewlett, J. D. (1982). A review of catchment experiment to determine the effect of vegetation changes on water yield and evapotranspiration. Journal of Hydrology. 105. 157-172.
Brammer, H. (1990). Floods in Bangladesh II. Flood mitigation and environmental aspects. Geographical Journal. 156.158-165.
Brooks, C. E. P. (1928). The influence of forests on rainfall and runoff. Quarterly Journal of Roval Meteorological Society. 54(225). 1-9.
Bruce, J. P., & Clark, R. H. (1966). Introduction to hydrometeorology. Oxford: Pergamon Press.
Bruijnzeel, L. A., & Bremmer, C. N. (1989). Highland lowland interaction in the Ganges Brahmaputra river basin - a review of published literature (ICIMOD Occasional Paper No. 11). International Centre for Itegrated Mountain Development,Kathmandu.
Bruijnzeel, L. A. (1990). Hydrology of moist tropical forests and effects of conversion: a state of knowledge review. Amsterdam: Free University.
Budyko, M. I. (1991). Climate prediction based on past and current analogues. In J. Jager, & H. L. Ferguson (Ed.), Climate change: science, impacts and policy (pp. 225-229). Cambridge: Cambridge University Press.
Bulatao, R. A., Bos, E., Stephens, P. W., & Vu, M. T. (1990). World population proiections( 1989-90 ed.). Baltimore: The John Hopkins University Press.
Reproduced with permission of the copyright owner. Further reproduction prohibited without permission.

211
Calder, I. R., & Newson, M. D. (1979). Land-use and upland water resources in Britain - a strategic look. Water Resources Bulletin. 15(6), 1628-1639.
Calder, I. R. (1993). Hydrologic effects of land-use change. In D. R. Maidment (Ed.), Handbook of hydrology (pp. 13.1-13.50). New York: McGraw-Hill.
Carson, B. (1985). Erosion and sedimentation processes in the Nepalese Himalaya (ICIMOD Occasional Paper No. 1). International Centre for Integrated Mountain Development.
Carson, B., Nield, R., Amataya, D. B., & Hildreth, G. (1986). Present landuse and the potential for improvement. Renting Earth Sciences Limited.
Carter, A. S., & Gilmour, D. A. (1989). Increase in tree cover on private farm land in central Nepal. Mountain Research and Development. 9(4), 381-391.
Central Bureau of Statistics. Population monograph of Nepal. Kathmandu: Author, 1987.
Central Bureau of Statistics. Statistical year book of Nepal. Kathmandu: Author, 1993.
Central Water Commission. Feasibility study on Koshi high dam. New Delhi: Author, 1981.
Chang, D. H. S. (1981). The vegetation zonation of the Tibetan Plateau. Mountain Research and Development. 1(1), 29-48.
Claire, S. (1976,4). Nepal. Atlantic Monthly, pp. 14-25.
Collier, J. V. (1928). Appendix XIX. InLandon, P. (Author), Nepal. London: Constable.
Dahal, D. R. (1994). A review o f forest user groups: case studies from eastern Nepal. International Centre for Integrated Mountain Development
Defence Mapping Agency Aerospace Center. Series PN C . Sheet N um ber 9 . St. Louis: Author, 1986.
Denniston, D. (1993,). Saving the Himalayas. World Watch, pp. 10-21.
Department of Forest. Forest statistics for the hill region. Kathmandu: Author, 1973.
Department of Hydrology & Meteorology. Climatological records of Nepal. Kathmandu: Author, various years.
Reproduced with permission of the copyright owner. Further reproduction prohibited without permission.

212
Dhar, O. N., & Narayanan, J. (1966). A study of rainspell associated with the unprecedented flood in the Kosi river in August 1954. Indian Journal of Meteorology and Geophysics. 17.37-42.
Dhar, O. N., Soman, M. K., & Mulye, S. S. (1982). Distribution of rainfall in the Himalayan and Sub-Himalayan region during 'breaks' in monsoon. International Symposium on Hydrological Aspects of Mountainous Watersheds (pp. 122-126). Roorkee: Manglik Prakashan, Saharanpur, India.
Dickinson, R. E., & Henderson-Seller, A. (1988). Modelling tropical deforestation: a study of GCM land-surface parameterizations. Quarterly Journal of Roval Meteorological Society. 114(B), 439-462.
Dickson, R. R. (1984). Eurasian snow cover versus Indian monsoon rainfall - an extension of the Hahn-Shukla results. Journal of Climate. 23(1). 171-173.
Dingman, S. L. (1994). Physical hydrology. New York: Macmillan Publishing Company.
Domroes, M. (1979). Temporal and spatial variations of rainfall in the Himalaya with particular reference to mountain ecosystem. Journal of the Nepal Research Centre. 2/3.49-66.
Donley, D. E., & Mitchell, R. L. (1939). The relation of rainfall to elevation in the southern Appalachian region. American Geophysical Transactions. 4, 711-721.
Eckholm, E. P. (1975). The deterioration of mountain environment ecological stress in the highlands of Asia, Latin America,, and Africa takes a mounting toll. Science. 189. 764-770.
Eckholm, E. P. (1976). Losing ground: ecological stress and world food products. New York: Norton.
Edwards, M. 0. (1992). Global gridded elevation and bathymetry (ETOPQ5). Digital raster data on a 5-minute Geographic (lat/long) 2160 X 4320 (centroid-registered) grid. Boulder: NOAA National Geophysical Data Center.
Ekvall, R. B. (1968). Fields on the roof: Nexus of Tibetan nomadic pastoralism. New York: Holt, Rinehart and Winston.
Environmental Systems Research Institute. Digital Chart of the World. Redlands, CA: Author, 1992a.
Environmental Systems Research Institute. Cell-based modeling with grid. Redlands, CA: Author, 1992b.
Reproduced with permission of the copyright owner. Further reproduction prohibited without permission.

Ferro, V., & Minacapilli, M. (1995). Sediment delivery processes at basin scale. Hydrological Sciences Journal. 40(6), 703-717.
Food and Agriculture Organization / Complex Systems Research Center. Soil map of the world 1:5M. Paris, UNESCO. Half degree digitization by Complex Systems Research Center, University of New Hampshire, Durham, NH: Author, 1985.
Fox, J. (1993). Forest resources in a Nepali village in 1980 and 1990: the positive influence of population growth. Mountain Research and Development 13(1). 89-98.
Fuller, W. A. (1976). Introduction to statistical time series. New York: Wiley.
Ghildyal, B. P. (1981). Soils of the Garhwal and Kumaun Himalaya. In J. S. Lall (Ed.), The Himalaya: aspect of change (pp. 120-137). Delhi: Oxford University Press.
Gilmour, D. A. (1991). Trends in forest resources and management in the middle mountains of Nepal. Soil Fertility and Erosion Issues in the Middle Mountains of Nepal (pp. 33-46). Dhulikhel: Integrated Survey Section.
Gole, C. V., & Chitale, S. V. (1966). Inland delta building activity of Kosi river. Journal of the Hydraulic. Proceedings of the American Society of Civil Engineers. HY2. 111-126.
Grayson, R. B., Moore, I. D., & McMahon, T. A. (1992). Physically based hydrologic modeling, 2. Is the concept realistic. Water Resources Research. 26(10), 2659-2666.
Gurung, H. B. (1991, November 7). Population of Nepal 1991: towards the tarai and towns. Spotlight pp. 27-29.
Haan, C. T. (1977). Statistical methods in hydrology. Ames: Iowa State University Press.
Hahn, D. G., & Manabe, S. (1975). The role of mountains in the Asian monsoon circulation. Journal of the Atmospheric Sciences. 32(8), 1515-1541.
Hagen, T. (1980). Nepal. New Delhi: Oxford and IBH Printing Press.
Hansen, J., Fung, I., Lacis, A., Rind, D., Lebedeff, S., Ruedy, R., & Russell, G. (1988). Global climate changes as forecast by Goddard Institute for Space Studies: Three- dimensional model. Journal of Geophysical Research. 93(D8), 9341-9364.
Hargreaves, G. L., Hargreaves, G. H., & Riley, J. P. (1985). Agriculture benefits for Senegal river basin. Journal of Irrigation and Drainage F.npineerinp 1_U(2), 113-124.
Helsel, D. R., & Hirsch, R. M. (1992). Statistical methods in water resources. New York: Elsevier.
Reproduced with permission of the copyright owner. Further reproduction prohibited without permission.

214
Henderson-sellers, A., Dickinson, R. E., Durbidge, T. B., Kennedy, P. J., McGuffie, K., & Pitman, A. J. (1993). Tropical deforestation: modeling local- to regional-scale climate change. Journal of Geophysical Research. 98(D4), 7289-7351.
Higuchi, K., Ageta, Y., Yasunari, T., & Inoue, J. (1982). Characteristics of precipitation during the monsoon season in high-mountain areas of the Nepal Himalaya. In J. W. Glen (Ed.), Hydrological Aspect of Alpine and High Mountain Areas (vol. IAHS Publ. no. 138, pp. 21-30). Exeter: International Association of Scientific Hydrology.
Higuchi, K. (1992). Nepal-Japan cooperation in research on glaciers and climates of the Nepal Himalaya . In G. J. Young (Ed.), International Symposium on Snow and Glacier Hydrology (pp. 29-36). Kathmandu: International Association of Hydrological Sciences.
Hingane, L. S., Kumar, K. R., & Murty, B. V. R. (1985). Long-term trends of surface air temperature in India. Journal of Climatology. 5, 521-528.
Hingane. (1996). Is a signature of socio-economic impact written on the climate. Climate Change. 32.91-102.
Hirsch, R. M., & Slack, J. R. (1984). A nonparametric trend test for seasonal data with serial dependence. Water Resources Research. 20(6), 727-732.
Holmes, A. (1965). Principles of physical geology. New York: Ronald Press Co.
Houghton, J. T. (1991). Scientific assessment of climate change: summary of the IPCC working group I report. In J. Jager, & H. L. Ferguson (Ed.), Climate change: science. impacts and policy (pp. 23-44). Cambridge: Cambridge University Press.
House, H. P. (1976). Atlas of world water balance. USSR committee for the International Hydrometeorological Service of the USSR. Hydrometeorological Publishing House. The UNESCO Press.
International Centre for Integrated Mountain Development. Annual report 1995. Kathmandu: Author, 1995.
Isaaks, E. H., & Srivastava, R. M. (1989). An introduction to applied geostatistics. New York: Oxford University Press.
Ives, J. D., Messerli, B., & Thompson, M. (1987). Research strategy for the Himalayan region - conference conclusions and overview. Mountain Research and Development. 7(3), 332-344.
Reproduced with permission of the copyright owner. Further reproduction prohibited without permission.

215
Ives, J. D. (1987). The theory of Himalayan environmental degradation: its validity and application challenged by recent research. Mountain Research and Development 7(3), 189-199.
Ives, I. D., & Messerli, B. (1989). The Himalayan dilemma, reconciling development and conservation. London: Routledge.
Jacobsen, J. L. (1988). Recent floods are unnatural disasters. World Watch. 1(6), 46-47.
Japan International Cooperation Agency. Report on master plan study on the Koshi river water resources development. Kathmandu: Author, 1985.
Jhingran, A. G. (1981). Geology of the Himalaya. In J. S. Lall (Ed.), The Himalav: aspect of change (pp. 77-98). Delhi: Oxford University Press.
Ju, J., & Slingo, J. (1995). The Asian summer monsoon and ENSO. Quarterly Journal of Roval Meteorological Society. 121(525). 1133-1168.
Kadota, T., & Ageta, Y. (1992). On the relation between climate and retreat of glacier AX010 in the Nepal Himalaya from 1978 to 1989. Bulletin of Glacier Research. 10. 1- 10.
Karan, K. P. (1987). Population Characteristics of the Himalayan region. Mountain Research and Development 7(3), 271-274.
Karl, T. R., Jones, P. D., Knight, R. W., Kukla, G., Plummer, N., Razuvayev, V., Gallo,K. P., Lindesay, J., & Charlson, T. C. (1995). Asymmetric treds of daily maximum and minimum temperature: empirical evidence and possible causes. In Climate Research Committee, National Research Council (Ed.), Natural climate variability on decade-to-centurv time scales (pp. 80-96). Washington, D.C.: National Academy Press.
Kattlemann, R. (1987). Uncertainty in assessing Himalayan water Resources. Mountain Research and Development. 7(3), 279-286.
Kattlemann, R. (1990). Conflicts and cooperation over floods in the Himalayas-Ganges region. Water International. 15(), 189-194.
Kendall, M., & Ord, J. K. (1990). Time series. Kent: Edward Arnold.
Kimball, B. A., Mauney, J. R., Nakayama, F. S., & Idso, J. B. (1993). Effect of elevated CO, and climate variables on plants. Journal of Soil and Water Conservation. 48(1), 9-14.
Reproduced with permission of the copyright owner. Further reproduction prohibited without permission.

216
Kirschbaum, M. U. F. (1996). Ecophysiological, ecological, and soil processes in terrestrial ecosystems: a primer on general concepts and relationships. In R. T. Watson, M. C.
Kite, G. W. (1993). Application of a land class hydrological model to climate change. Water Resources Research. 29(7). 2377-2384.
Kothyari, U. C., & Singh, V. P. (1996). Rainfall and temperature trends in India. Hydrological Processes. 10.357-372.
Lai, B. (1993). Trend and periodicities of surface air temperature of Delhi. Mausam. 44(1), 35-38.
Lall, J. S. (Eds.). (1981). The Himalaya: aspect of change . Delhi: Oxford University Press.
Lamb, P. J. (1987). On the development of regional climatic scenarios for policy oriented climate impact assessment. Bulletin of American Meteorological Society. 68. 1116- 1123.
Lambert, L., & Chitrakar, B. D. (1989). Variation of potential evapotranspiration with elevation in Nepal. Mountain Research and Development 9(2), 145-152.
Landon, P. (1928). Nepal. London: Constable.
Lang, H. (1981). Is evaporation an important component in high alpine hydrology? Nordic Hydrology. J 2 ,217-223.
Lee, R. (1980). Forest hydrology. New York: Columbia University Press.
Lesack, L. F. W. (1993). Water balance and hydrologic characteristics of a rain forest catchment in the central Amazon basin. Water Resources Research. 29(3), 759-773.
LIGG/WECS/NEA. (1988). Report on first expedition to glaciers and glacier lakes in the Pumqu (Aran) and Poiqu (Bhote-SunkosD river basins. XizangfTibetL China . Lanzhou Institute of Glaciology and Geocryology, China; Water and Energy Commission, Nepal; Nepal Electricity Authority, Nepal.
Linsley, R. K. J., Kohler, M. A., & Paulhus, J. L. H. (1988). Hydrology for EngineersfST Metric ed.). London: McGraw-Hill Book Company.
Lionel, C. (1970). Land and social change in east Nepal. Berkley: University of California Press.
Reproduced with permission of the copyright owner. Further reproduction prohibited without permission.

217
Mahat, T. S. (1987). forestry - farming linkages in the mountains (ICIMOD Occassional Paper No. 7). International Centre for Integrated Mountain Development, Kathmandu.
Majupuria, T. C. (Eds.). (1985). Nepal - Nature's Paradise . Bangkok: White Lotus Co. Ltd
Malmstorm, V. H. (1969). A new approach to the classification of climate. Journal Of Geography. 68. 351-357.
Mayewski, P. A., & Jeschke, P. A. (1979). Himalayan and trans-Himalayan glacier fluctuations since AD 1812. Arctic and Alpine Research. 11(3). 267-287.
Meehl, G. A., & Washington, W. M. (1993). South Asian summer monsoon variability in a model with doubled carbondioxide concentration. Science. 260. 1101-1103.
Meehl, G. A. (1994). Influence of the land surface in the Asian summer monsoon: external conditions versus internal feedbacks. Journal of Climate. 7, 1033-1049.
Meher-homji, V. M. (1991). Probable impact of deforestation on hydrological processes. Climate Change. 19.163-173.
Messerschmidt, D. A. (1987). Conservation and society in Nepal: traditional forest management and innovative development. In P. D. Little, & M. M. Horowitz (Ed.), Lands at risk in the third world: local-level perspective (pp. 373-397). Boulder: Westview Press.
Metz, J. J. (1989). Himalayan economy: more myths in the closet? Mountain Research and Development 9(2). 175-186.
Meybeck, M. (1988). How to establish and use world budgets of riverine materials. In A. Lerman, & M. Meybeck (Ed.), Physical and chemical weathering in geochemical cycles (pp. 247-272). Dordrecht: Kluwer Academic Publisher.
Milliman, J. D., & Syvitski, J. P. M. (1992). Geomorphic/tectonic control of sediment discharge to the ocean: the importance o f small mountainous rivers. The Journal of Geology. 100. 525-544.
Mitchell, J. M., Dzerdzeevskii, B., Flohn, H., Hofineyr, W. L., Lamb, H. H., Rao, K. N., & Wallen, C. C. (1966). Climate Change (Technical Note No. 79). World Meteorological Organization.
Mitchell, J. F. B., Johns, T. C., Gregory, J. M., & Tett, S. F. B. (1995, ). Climate response to increasing levels of greenhouse gases and sulphate aerosols. Nature, pp. 501-504.
Reproduced with permission of the copyright owner. Further reproduction prohibited without permission.

218
Mitchell, J. F. B., & Qingcun, Z. (1991). Climate change prediction. In J. Jager, & H. L. Ferguson (Ed.), Climate change: science, impacts and policy (pp. 60-70). Cambridge: Cambridge University Press.
Moddie, A. D. (1981). Himalayan environment. In J. S. Lall (Ed.), The Himalaya: aspect of change (pp. 342-350). Delhi: Oxford University Press.
Mooley, D. A., & Parthasarathy, B. (1984). Fluctuations in all-India summer monsoon rainfall during 1871-1978. Climate Change. 6.287-301.
Mooney, H. A., Drake, B. G., Luxmoore, R. J., Oechel, W. C., & Pitelka, L. F. (1991). Predicting ecosystem responses to elevated C02 concentrations. BioScience. 41(21. 96-104.
Morrison-Kundesen Engineers. Upper Arun hydroelectric project (Vol. I). Kathmandu: Author, 1991.
Murakami, T. (1987). Orography and monsoons. In J. S. Fein, & P. L. Stephens (Ed.), Monsoons (pp. 331-364). New York: John Wiley and Sons.
Myers, N. (1986). Environmental repercussions of deforestation in the Himalayas. Journal of World Forest Resource Management 2,63-72.
Myers, N. (1988). Tropical deforestation and climate change. Environmental Conservation. 15(4), 293-298.
Nelson, D. O., Laban, P., Shrestha, B. D., & Kandel, G. P. (1980). A reconnaissance inventory of the major ecological land units and their watershed condition in Nepal (Project Field Document WP/17 FO: NEP/74/020). Integrated Watershed Management, Torrent Control and Land Use Development Project, Department of Soil Conservation and Watershed Management / Food and Agriculture Organi2 ation, United Nations Development.
Nikolaidis, N. P., Hu, H.-L., Ecsedy, C., & Lin, J. D. (1993). Hydrologic response of freshwater to climatic variability: model development. Water Resources Research. 29(10), 3317-3328.
Nonhebel, S. (1996). Effects of temperature rise and increase in C 02 concentration on simulated wheat yields in Europe. Climatic Change. 34(1), 73-90.
Ohata, T., Takahasi, S., & Xiangcheng, K. (1989). Meteorological conditions of the west Kunlun mountains in the summer of 1987. Bulletin of Glacier Research. 7,67-76.
Ohata, T., Motoyama, H., & Iida, H. (1990). Snow surveys on the north facing slope of Langtang valley, Nepal Himalayas. Bulletin of Glacier Research. 8, 29-30.
Reproduced with permission of the copyright owner. Further reproduction prohibited without permission.

219
Ohata, T., Yasunari, T., Ohta, T., Ohno, H., Zhengtang, C., Lianfu, D., & Yingsheng, Z.(1991). Glaciological studies on Qingzang plateau. Bulletin of Glacier Research. 9, 33-49.
Onstad, C. A. (1984). Sediment yield modeling. In R. F. Hadley, & D. E. Walling (Ed.), Erosion and sediment yield: some methods of measurement and modelling (pp. 71- 89). Cambridge: University Press.
Panagoulia. (1991). Hydrological response of medium sized mountainous catchment to climate change. Hydrological Sciences Journal. 36(6), 525-547.
Pande, R. K. (1987). Altitude Geography: Effects of altitude on the geography of Nepal. Kathmandu: Center for Altitude Geography.
Pande, V. S., & Goel, P. (1992). Mahakosi: Ek sanskritik sarbechhen. Patna, India: Janaki Prakasan.
Parthasarathy, B., & Mooley, D. A. (1978). Some features of a long homogeneous series of Indian summer monsoon rainfall. Monthly Weather Review. 106. 771-781.
Peck, E. L., & Pfankuch, D. J. (1963). Evaporation rates in mountainous terrain, (vol. Publication No. 62, pp. 267-278). Gentbrugge, Belgium: International Association of Scientific Hydrology.
Pioneering study of 8 Asian nations examines implications o f climate change for region. (1994,4). Climate Alert, pp. 1,3.
Population Atlas of China. (1987). Hongkong: Oxford University Press.
Ramsay, W. J. H. (1986). Erosion problems in the Nepal Himalaya. In S. C. Joshi (Ed.), Nepal Himalaya: geoecological perspective (pp. 359-395). Nainital, India: Himalayan Research Group.
Rao, K. L. (1956). Stabilizing the regime of the wandering Kosi. Regional Technical Conference on Water Resources Development in Asia and the Far East (pp. 308- 314). Bangkok: ECAFE, United Nations.
Rieger, H. C. (1981). Man versus mountain: the destruction of the Himalayan Ecosystem. In J. S. Lall (Ed.), The Himalaya: aspects of change (pp. 341-376). New Delhi: Oxford University Press.
Rind, D., Rosenzweig, C., & Goldberg, R. (1992). Modelling the hydrological cycle in assessment o f climate change. Nature. 358.119-121.
Rogers, P., & Fiering, M. (1989). Climate change: do we know enough to act? . Forum for Applied Research and Public Policy.
Reproduced with permission of the copyright owner. Further reproduction prohibited without permission.

220
Rogers, P., Lydon, P., & Seckler, D. (1989). Eastern waters study: strategies to manage flood and drought in the Ganges-Brahmaputra basin. Arlington, USA: Irrigation Support Project for Asia and the Near East.
Rongzu, Z. (1989). Case study on mountain environmental management: Nvemo Countv (ICIMOD Occassional Paper No. 13). International Centre for Integrated Mountain Development, Kathmandu.
SAS. (1993). SAS/ETS User's Guide Version 6. Cary, USA: SAS Institute Inc.
Schimel, D., Enting, I. G., Heimann, M., Wigley, T. M. L., Raynaud, D., Alves, D., & Siegenthaler, U. (1995). C 02 and the carbon cycle. In J. T. Houghton, L. G. M. Filho, J. Bruce, H. Lee, B. A. Callander, E. Haites, N. Harris, & K. Maskell (Ed.), Climate chanee 1994: radiative forcing of climate change and an evaluation of the IPCCIS92 emission scenarios (pp. 35-71). Cambridge: Cambridge University Press.
Schneider, S. H., & Norman, R. J. (1989). The greenhouse effect: its causes, possible impacts, and associated uncertainties. In N. J. Rosenberg, W. E. Easterling III, P. R. Crossan, & J. Darmstadter (Ed.), Greenhouse warming: abatement and adaptation (pp. 7-34). Washington: Resources for the Future.
Schreier, H., Brown, S., Kennedy, G., & Shah, P. (1991). Food, feed, and fuelwood resources of Nepal: a GIS evaluation. Environmental Management. 15(1). 815-822.
Schreier, H., Brown, S., Schmidt, M., Shah, P., Shrestha, B., Nakarmi, G., Subba, K., & Wymann, S. (1994). Gaining forests but losing ground: a GIS evaluation in a Himalayan watershed. Environmental Management. 18(1), 139-150.
Shah, R. (1985). Soils, their problems and management. In T. C. Majupuria (Ed.), Nepal nature's paradise (pp. 64-68). Bangkok: White Lotus Co. Ltd.
Sharma, C. K. (1977). River systems of Nepal. Kathmandu: Sangeeta Sharma.
Sharma, C. K. (1977). Natural hazards and man made impacts in the Himalaya. Kathmandu: Pushpa Sharma.
Sharma, C. K. (1990). Geology of Nepal Himalaya and adjacent countries. Kathmandu: Sangeeta Sharma.
Sharma, K. P. (1982). A study of severe rainstorms over northwest Utter Pradesh. M. Tech., University of Roorkee.
Reproduced with permission of the copyright owner. Further reproduction prohibited without permission.

221
Sharma, K. P., & Kansakar, S. R. (1992). Suspended sediment yield estimation model for Nepalese watersheds. Regional Seminar on Mathematical Modeling of Alluvial Rivers Kathmandu: Department of Hydrology and Meteorology.
Sharma, K. P. (1993). Role of meltwater in major river systems of Nepal. In G. J. Young (Ed.), International Symposium on Snow and Glacier Hydrology Kathmandu: International Association of Scientific Hydrology.
Sharma, K. P. (1994). Program for monitoring the sediment transport by major rivers of Nepal and the precipitation in high mountainous areas. Unpublished manuscript, ESCI/EOS, UNH and DHM, Kathmandu.
Sharma, K. P. (1996). Climatological and hydrological data base of the Kosi basin. Unpublished manuscript, Complex Systems Research Center, UNH, Durham.
Shreshtha, B. P. (1967). The economy of Nepal. Bombay: Vora & Co.
Shrestha, T. B. (1989). Development ecology of the Arun river basin in Nepal. Kathmandu: International Centre for Integrated Mountain Development.
Shukla, J., & Mintz, Y. (1982). Influence of land-surface evapotranspiration on the earth's climate. Science. 215(4539), 1498-1501.
Shukla, J. (1987). Interannual variability of monsoons. In J. S. Fein, & P. L. Stephens (Ed.), Monsoons (pp. 399-463). New York: John Wiley and Sons.
Shukla, J., Nobre, C., & Sellers, P. (1990). Amazon deforestation and climate change. Science. 247.1322-1325.
Shuttleworth, W. J. (1993). Evaporation. In D. R. Maidment (Ed.), Handbook of hydrology (pp. 4.1-4.53). New York: McGraw-Hill.
SMEC. (1992). Hydrology. Draft final report. Vol. 3. Greater Kathmandu Water Supply Project.
Smith, R. A., Hirsch, R. M., & Slack, J. R. (1982). A study of trends in total phosphorus measurement at NASOAN station (Water Supply Paper No. 2190). United States Geological Survey.
Smith, W. E. (1988, September 18). A country under water. Time, pp. 30-31.
Songqiao, Z. (1986). Physical Geography of China. Beijing: Science Press.
Spreen, W. C. (1947). A determination of the effect o f topography upon precipitation. American Geophysical Union Transaction. 28(2). 285-290.
Reproduced with permission of the copyright owner. Further reproduction prohibited without permission.

Srivastava, H. N., Dewan, B. N., Dikshit, S. K., Rao, G. S. P., Singh, S. S., & Rao, K. R.(1992). Decadal trends in climate over India. Mausam. 43(1), 7-20.
Survey Department. Land utilization map. Kathmandu: Author, 1984
Swaminathan, M. S. (Eds.). (1987). Abnormal monsoons and economic consequences: the Indian experiences . New York: John Wiley and Sons.
Tolba, M. K. (1992). Saving our planet: challenges and hopes. London: Chapman & Hall.
Trewartha, G. T. (1954). An introduction to climate. New York: McGraw-Hill.
UNEP/GRID (1996). Environment assessment: north American global resources information data base Sioux Fall: United Nations Environmental Program.
UNESCO. (1973). Expert panel on project 6: impact of human activities on mountain ecosystem (MAB report series No. 8). UNESCO.
User group restore greenery around valley. (1995,4 Nov 1995). Kathmandu Post, pp. 1.
Van der Leeden, F., Troise, F. F., & Todd, D. K. (1990). The water encyclopedia. Michigan: Lewis Publishers.
Vinikov, Y. K., Groisman, P. Y., & Lugina, K. M. (1994). Global and hemispheric temperature anomalies from instrumental surface air temperature records, in T. A. Boden, D. P. Kaiser, R. J. Sepanski, & F. W. Stoss (Ed.), Trend '93: a compendium of data on global change. ORNL/CDIAC -65 (pp. 615-627). Oak Ridge, Tenn, USA: Carbon Dioxide Information Analysis Center, Oak Ridge National Laboratory.
Vorosmarty, C. J., Moore III, B., Grace, A. L., Gildea, M. P., Melillo, J. M., Peterson, B. J., Rastetter, E. B., & Steudler, P. A. (1989). Continental scale models of water balance and fluvial transport: an application to south America. Global Biogeochemical Cycles. 3(3), 241-265.
Vorosmarty, C. J., Willmott, C. J., Choudhury, B. J., Schloss, A. L., Steams, T. K., Robeson, S. M., & Dorman, T. J. (1996). Analyzing the discharge regime of a large tropical river through remote sensing, ground-based climate data, and modeling.Water Resources Research. 32UOL 3137-3150.
Vorosmarty, C. J., & Moore III, B. (1991). Modeling basin-scale hydrology in support of physical climate and global biogeochemical studies: an example using the Zambezi river. Surveys in Geophysics. 12. 271-311.
Wager, L. R. (1937). The Arun drainage pattern and the rise of the Himalaya. Geographical Journal. 89, 239-250.
Reproduced with permission of the copyright owner. Further reproduction prohibited without permission.

223
Walling, D. E., & Webb, B. W. (1983). Patterns of sediment yield. In K. J. Gregory (Ed.), Background to Palaeohvdrologv (pp. 69-99). Chichester: John Wiley & Sons Ltd.
Walsh, J. E. (1995). Continental snow cover and climate variability. In E. Committee (Ed.), Natural climate variability on decade-to-centurv time scales (pp. 49-59). Washington, D. C.: National Academy Press.
Wards, R. C., & Robinson, M. (1990). Principles of Hvdrology(Third ed.). London: McGraw-Hill Book Company.
Water & Energy Commission. Sapt Kosi river assessment of erosion sedimentation and flooding potential, its mitigation and recommendations for further studies (4/1/221179/1/1 seq.10). Ministry of Water Resources, HMG/Nepal, Kathmandu: Author, 1979.
Water & Energy Commission. Hydrological studies of Nepal . Ministry of Water Resources, HMG/Nepal, Kathmandu: Author, 1982.
Water and Energy Commission. Erosion and sedimentation in the Nepal Himalaya (4/3/010587/1/1 seq. 259). Ministry of Water Resources, HMG/Nepal, Kathmandu: Author, 1987.
Wenhua, L. (1993). Forests of the Himalavan-Hengduan mountains of China and Strategies for their sustainable development . Kathmandu: International centre for Integrated Mountain Development.
Whitehead, P. G., & Robinson, M. (1993). Experimental basin studies-an international and historical perspective of forest impacts. Journal of Hydrology. 145.217-230.
Wigley, T. M. L., & Jones, P. D. (1985). Influence of precipitation changes and direct C02 effects on streamflow. Nature. 314.149-152.
Wilmott, C. J., Rowe, C. M., & Philpot, W. D. (1985). Small-scale climate maps: a sensitivity analysis of some common assumptions associated with grid-point interpolation and contouring. The American Cartographer. 12(1), 5-16.
Wischmeier, W. H., & Smith, D. D. (1965). Predicting rainfall-erosion losses from cropland east of the rocky mountains (282). US Department of Agriculture.
World Bank (1984). World Development Report 1984. New York: Oxford University Press.
World Meteorological Organization. Guide to meteorological instrument and observing practicesfFourth ed.). WMO-No. 8. TP. 3. Geneva: Author, 1971.
Reproduced with permission of the copyright owner. Further reproduction prohibited without permission.

224
World Meteorological Organization. Guide to hydrological practicesfFourth ed.). WMO- No.168, Vol I and II. Geneva: Author, 1981.
World Weather Record. (Various years). Washington D. C: Environmental Science Services Administration, Envirinmental Data Services.
Xingcheng, K., & Yingqin, X. (1989). The character of the weather and climate in the west Kunlun mountains area in summer, 1987. Bulletin o f Glacier Research. 7, 77- 81.
Yamada, T., Takayuki, S., Hajime, I., Kadota, T., Watanabe, T., Rana, B., Ageta, Y., & Fushimi, H. (1992). Fluctuations of the glaciers from the 1970s to 1989 in the Khumbu, Shorong and Langtang regions, Nepal Himalayas. Bulletin of Glacier Research. 10.11-19.
Zollinger, F. (1979). The Sapt Kosi: Unsolved Problems of Flood Control in the Nepalese Terai (IWM/WP No. 11). Integrated Watershed Management, Torrent Control and Land Use Development Project, Department of Soil and Water Conservation, Ministry of Forest.
Reproduced with permission of the copyright owner. Further reproduction prohibited without permission.

APPENDICES
Reproduced with permission of the copyright owner. Further reproduction prohibited without permission.
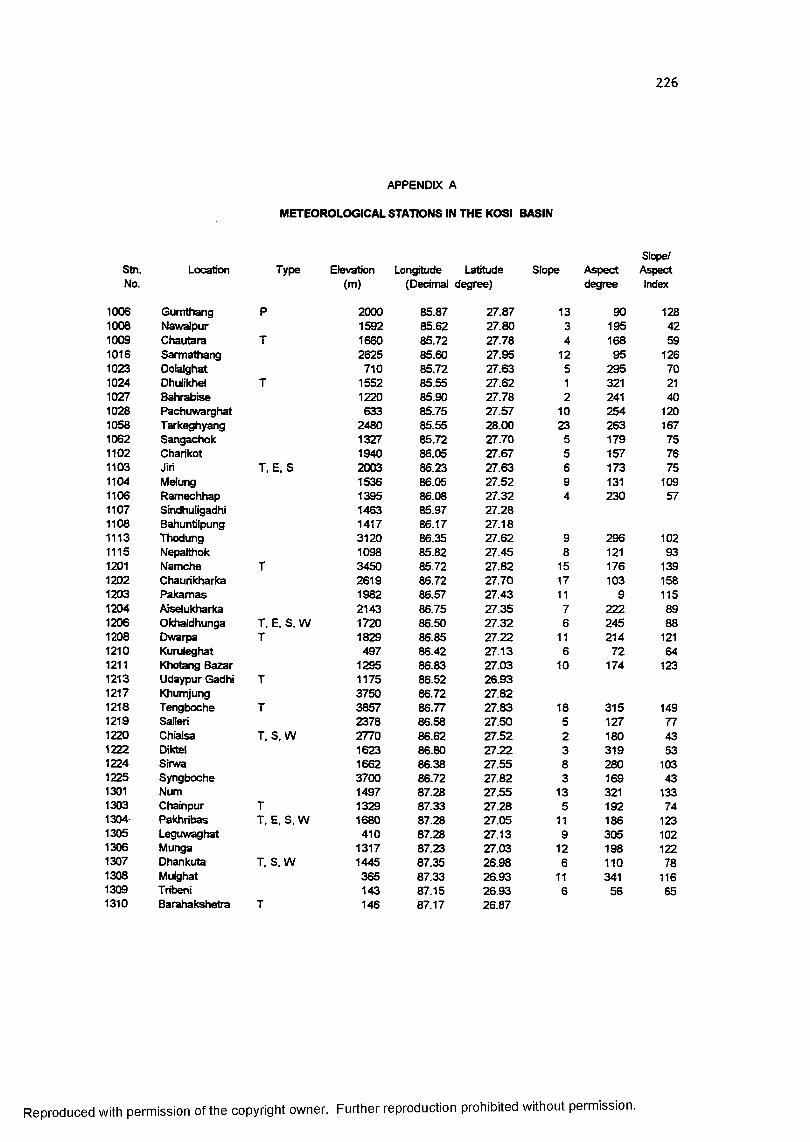
226
APPENDIX A
METEOROLOGICAL STATIONS IN THE KOSI BASIN
Stn. Location Type Elevation Longitude Latitude Slope AspectSlope/Aspect
No.
1006 Gumthang P
(m)
2000
(Decimal degree)
85.87 27.87 13
degree
90
Index
1281008 Nawalpur 1592 85.62 27.80 3 195 421009 Chautara T 1660 85.72 27.78 4 168 591016 Sarmathang 2625 85.60 27.95 12 95 1261023 Dolalghat 710 85.72 27.63 5 295 701024 Dhulikhel T 1552 85.55 27.62 1 321 211027 Bahrabise 1220 85.90 27.78 2 241 401028 Pachuwarghat 633 85.75 27.57 10 254 1201058 Tarkeghyang 2480 85.55 28.00 23 263 1671062 Sangachok 1327 85.72 27.70 5 179 751102 Charikot 1940 86.05 27.67 5 157 761103 Jiri T, E, S 2003 86.23 27.63 6 173 751104 Melung 1536 86.05 27.52 9 131 1091106 Ramechhap 1395 86.08 27.32 4 230 5711071108 1113
SindhuligadhiBahuntilpungThodung
146314173120
85.9786.1786.35
27.2827.1827.62 9 296 102
1115 Nepafthok 1098 85.82 27.45 8 121 931201 Namche T 3450 85.72 27.82 15 176 1391202 Chaurikharka 2619 86.72 27.70 17 103 1581203 Pakamas 1982 86.57 27.43 11 9 1151204 Aisetukharka 2143 86.75 27.35 7 222 891206 Okhaldhunga T. E, S, W 1720 86.50 27.32 6 245 881208 Dwarpa T 1829 86.85 27.22 11 214 1211210 Kuruleghat 497 86.42 27.13 6 72 641211 Khotang Bazar 1295 86.83 27.03 10 174 123121312171218
Udaypur GadhiKhumjungTengboche
T
T
117537503857
86.5286.7286.77
26.9327.8227.83 18 315 149
1219 Salieri 2378 86.58 27.50 5 127 771220 Chialsa T. S. W 2770 86.62 27.52 2 180 431222 Diktel 1623 86.80 27.22 3 319 531224 Sirwa 1662 86.38 27.55 8 280 1031225 Syngboche 3700 86.72 27.82 3 169 431301 Num 1497 87.28 27.55 13 321 1331303 Chainpur T 1329 87.33 27.28 5 192 741304- Pakhribas T. E, S, W 1680 87.28 27.05 11 186 1231305 Leguwaghat 410 87.28 27.13 9 305 1021306 Munga 1317 87.23 27.03 12 198 1221307 Dhankuta T, S, W 1445 87.35 26.98 6 110 781308 Mulghat 365 87.33 26.93 11 341 1161309 Tribeni 143 87.15 26.93 6 56 651310 Barahakshetra T 146 87.17 26.87
Reproduced with permission of the copyright owner. Further reproduction prohibited without permission.

227
Appendix A Continue
Slope/Stn. Location Type Elevation Longitude Latitude Slope Aspect AspectNo. (m) DD DD Degree Index
1314 Terhathum T 1633 87.55 27.13 13 62 1291315 Kharelalantar T 541 87.25 27.25 9 189 1061316 Chatara 183 87.17 26.821317 Chepuwa 2590 87.42 27.77 18 166 1551318 Paripatie (Horti.) T 1364 87.30 27.02 13 273 1351322 Machuwaghat 158 87.17 26.97 5 211 731324 Bhojpur T, E. S, W 1595 87.05 27.18 8 215 1051325 Dingia 1190 87.15 27.37 12 31 1141401 Olangchunggola T 3119 87.78 27.68 26 65 1771402 Pangthumdoma 2818 87.82 27.68 12 212 1211403 Lungthung 1780 87.78 27.55 15 79 1441404 Taplethok 1383 87.78 27.48 14 358 1311405 Taplejung T. S 1732 87.67 27.35 15 213 1371406 Memengjagat 1830 87.93 27.20 7 219 891413 Kamachin 4242 87.98 27.73 6 142 761414 Nup 4000 87.87 27.72 2 150 281418 Angbung 1219 87.72 27.27 8 338 1001419 Phidim T 1205 87.78 27.13 18 352 1481420 Dovan 763 87.60 27.35 14 43 1292001 Tingri T, E 4300 87.13 28.72 11 162 1242002 Nyalam T, E 3750 85.92 28.18 6 219 02003 Gyangtse * T 4040 89.60 28.922004 Phari Dzong * T 4300 89.08 27.732005 Xigaze * T 3836 88.88 29.252006 Yadong * T 4300 88.89 27.45
Note: T = TemperatureE = Class A pan evaporation S = Sunshine duration W = Wind
All stations record 24-hour precipitation.
* Stations are outside the Kosi basin in Tibet We used the data for these stations only to interpolate average precipitation over the Tibetan part of the basin.
Reproduced with permission of the copyright owner. Further reproduction prohibited without permission.

Reproduced
with perm
ission of the
copyright ow
ner. Further
reproduction prohibited
without
permission.
APPENDIX B
HYDROMETRIC STATIONS IN THE KOSI BASIN
Stn. Name of river Name of site Longitude Latitude Stn. Elv. Ave. Elv. Area Length Stream OrderNo. (Decimal degree) (m) (m) (km2) (km) Strahler Schreve
600 Arun Uwagaon 87.33 27.60 1294 4868 25447 371 5 95602 Sabhayakhola Tumlingtar 87.20 27.31 450 1609 409 35 1 1605 Arun Turkeghat 87.19 27.32 414 4744 27241 419 5 101606 Arun Simle 87.15 26.93 180 4485 29532 473 5 110610 Bhotekosi Barabise 85.89 27.79 840 4583 2388 108 3 8620 Balephikhola Jalbire 85.77 27.80 793 3356 594 53 2 2627 Melamchikhola Helambu 85.53 28.02 1820 4098 113 18 1 1629 Indrawati Dolalghat 85.71 27.63 750 2156 1338 46 2 6630 Sunkosi Pachuwarghat 85.75 27.55 589 3541 4904 146 3 17640 Rosikhola Panauti 85.51 27.58 1480 1854 69 13 1 1647 Tamakosi Bust! 86.09 27.62 849 4141 2948 99 3 11650 Khimtikhola Rasnalu 86.21 27.58 1520 2815 330 35 1 1652 Sunkosi Khurkot 86.01 27.32 455 3304 10141 189 4 35660 Likhukhola Sangutar 86.22 27.34 543 2874 921 67 2 2670 Dudhkosi Rabuwa 86.65 27.26 460 3786 3650 112 3 12680 Sunkosi Kampughat 86.82 26.88 200 3192 17593 302 4 55690 Tamor Mulghat 87.32 2 6 .93 276 2854 5948 166 3 21695 Saptakosi Chatara 87.17 26.89 140 3839 53689 477 5 187
Note: Some of the latitude and longitude records obtained from DHM data base areedited to bring the location on simulated river channel. Average elevation data are based on DEM30. DEM30 is also the source of the computed drainage area.
IroN>oo

229
APPENDIX C
AVERAGE MONTHLY AND ANNUAL PRECIPITATION (mm)
Stn. Jan Feb Mar Apr May Jun
1006 22 33 64 95 190 5881008 15 22 33 62 120 3931009 13 20 33 56 116 3031016 26 34 45 69 154 5941023 11 13 29 48 80 1801024 18 19 32 58 101 2531027 13 25 55 104 179 4671028 10 12 24 43 89 1511058 33 42 72 80 166 5491062 11 14 25 61 134 1951102 15 24 41 69 147 3161103 16 22 44 83 153 3731104 15 18 35 73 145 3031106 18 14 24 47 75 1501107 27 17 43 96 199 4471108 17 17 36 73 188 3421115 14 12 28 46 76 1371201 33 20 32 27 44 1381202 15 23 40 54 105 3131203 16 15 32 44 87 2581204 19 12 29 76 193 4391206 16 15 29 60 141 3181208 11 7 41 75 135 3381210 13 11 25 45 71 1411211 13 13 26 39 103 2001213 17 15 25 53 157 3301217 18 24 28 29 39 1311218 16 24 30 27 28 1411219 15 16 30 50 88 2451220 10 13 29 50 95 2871222 10 16 24 59 146 2711224 11 17 32 63 125 2991225 21 22 24 25 30 1291301 32 46 84 187 379 6341303 11 12 29 80 180 2071304 11 15 27 54 137 2481305 6 7 21 66 133 1311306 14 10 29 49 102 2111307 9 14 27 48 83 1791308 9 11 21 44 104 1711309 16 14 20 51 125 2871310 19 14 33 57 123 441
Jul Aug Sep Oct Nov Dec Ann
959 883 563 156 23 13 3498649 663 349 86 11 13 2410531 557 312 64 10 12 2055
1074 992 543 110 21 12 3760286 268 141 43 7 9 1130410 374 196 68 8 8 1533779 737 396 86 11 17 2868234 191 144 47 5 15 971
1060 877 484 92 10 26 3491364 366 239 63 9 16 1514535 526 303 86 14 12 2098589 576 301 74 15 13 2196424 415 217 59 8 11 1737257 203 111 39 8 7 969686 581 428 151 17 11 2722520 383 307 103 12 14 2017255 181 142 63 5 14 1005226 220 151 69 13 18 1042591 563 326 76 13 11 2127478 464 262 71 7 7 1741598 527 319 114 16 12 2352447 399 235 74 11 9 1776336 323 200 96 14 6 1577259 189 132 40 5 7 939318 197 160 46 6 7 1133512 421 349 124 15 9 2042196 190 109 44 6 11 841265 259 127 65 7 2 1034470 437 255 61 7 9 1636522 487 278 83 11 8 1888370 305 230 66 6 13 1505448 410 265 65 10 9 1734236 220 141 68 7 17 971668 570 462 217 40 22 3345310 274 198 63 15 6 1372426 334 216 63 11 18 1559191 168 111 42 8 3 875315 251 170 61 6 7 1220253 163 107 55 5 7 940285 180 133 47 8 6 1035490 365 286 84 7 4 1754678 606 438 149 7 1 2540
Reproduced with permission of the copyright owner. Further reproduction prohibited without permission.

230
Appendix C continued
Stn. Jan Feb Mar Apr M a y J u n Jul Aug Sep Oct Nov Dec Ann
1316 17 16 23 56 144 373 573 467 342 134 13 7 21661317 45 74 129 153 244 417 496 439 361 152 40 21 25881318 14 10 28 56 106 210 311 119 133 64 6 8 10541322 12 13 22 49 116 258 378 260 184 66 8 3 13751324 22 10 32 66 146 232 294 220 173 77 16 9 12991325 14 15 33 74 179 291 406 418 346 106 10 9 19121401 28 47 94 54 109 247 353 364 249 89 19 8 17131402 24 33 73 78 95 230 404 303 178 80 27 14 15411403 19 31 66 94 132 367 521 493 357 104 19 10 22051404 16 27 66 113 200 408 596 572 392 125 26 10 25511405 19 23 56 125 232 315 426 403 301 83 14 10 20021406 15 21 50 124 219 328 483 394 286 104 16 10 20421413 29 44 54 89 101 192 222 263 207 92 30 30 11681414 15 40 86 53 83 174 203 173 97 24 20 6 10151418 21 12 47 124 234 276 258 233 158 60 16 2 13941419 14 19 38 81 152 167 347 261 200 45 8 13 13551420 11 16 45 116 205 260 344 301 226 51 11 10 15802001 32 55 63 49 30 66 90 86 85 80 12 26 674
2002 0 0 0 3 8 36 93 111 28 4 0 1 2842003 0 0 2 2 14 49 84 92 44 5 1 0 2932004 4 5 19 24 25 47 102 100 51 29 3 1 4102005 0 0 1 2 15 70 131 146 59 6 1 0 4312006 12 46 46 86 88 129 150 146 99 45 9 8 864
Reproduced with permission of the copyright owner. Further reproduction prohibited without permission.

231
APPENDIX D
AVERAGE MONTHLY AND ANNUAL TEMPERATURE (°C)
Stn. Jan Feb Mar Apr May Jun Jul Aug Sep Oct Nov Dec Ann
1009 11.8 14.1 17.2 20.8 22.6 21.6 22.5 22.2 21.8 19.7 15.9 13.4 18.61036 13.4 17.1 18.1 22.3 25.1 26.8 27.0 26.9 25.8 22.3 17.8 13.8 21.41103 6.2 7.9 11.4 14.7 16.7 19.4 19.9 19.9 18.5 15.2 10.6 7.3 14.01201 0.0 0.7 3.9 8.1 10.2 14.3 13.5 12.0 10.7 7.1 2.7 1.2 7.01206 9.5 11.1 15.0 18.2 19.3 20.5 20.3 20.4 19.4 17.5 14.1 11.1 16.41209 10.2 12.2 16.1 19.2 19.9 20.8 21.1 21.2 20.3 18.4 14.8 11.8 17.21218 -2.9 -2.2 0.8 4.2 6.6 8.9 9.4 8.9 7.3 5.5 1.0 -0.9 3.91220 2.7 3.9 7.8 10.7 12.4 14.7 15.3 15.2 14.0 10.8 6.8 3.8 9.81225 -3.5 -2.3 0.7 4.0 6.3 8.5 9.5 9.1 7.3 4.6 1.3 -1.5 3.71303 13.3 15.1 19.1 21.9 22.8 24.0 23.9 24.0 23.0 21.0 17.8 14.6 20.01304 9.6 11.1 15.1 18.3 19.1 20.4 20.3 20.6 19.5 17.3 14.2 11.0 16.41307 18.1 18.6 19.1 19.4 19.3 19.1 18.7 18.1 17.3 16.4 15.6 15.4 17.91310 17.0 19.4 23.9 27.9 28.6 28.0 27.5 27.5 27.0 25.3 21.7 18.3 24.31318 10.9 12.7 16.9 19.6 20.7 21.9 22.0 22.3 21.3 18.9 15.5 12.5 17.91324 9.8 11.2 14.4 18.2 19.2 20.5 20.8 15.5 20.0 17.9 14.1 10.5 16.01401 0.5 0.8 3.5 6.7 8.0 10.7 11.6 11.4 10.4 7.2 4.6 3.3 6.61404 12.2 13.9 17.4 20.1 21.3 22.7 22.7 22.4 21.7 19.9 16.4 13.5 18.71405 8.9 10.4 14.1 17.2 18.2 20.7 21.0 20.9 19.9 17.0 13.2 10.2 16.02001 -8.5 -4.7 -2.8 2.4 6.6 11.4 12.0 12.1 9.1 3.2 -3.2 -7.3 2.52002 -5.7 -2.0 -1.4 2.6 5.8 9.5 10.9 10.7 8.4 3.7 -0.9
00 3.2
Reproduced with permission of the copyright owner. Further reproduction prohibited without permission.

232
APPENDIX E
AVERAGE MONTHLY AND ANNUAL DISCHARGE (m?s)
tn. Jan Feb Mar Apr May Jun
600 72.3 73.8 88.3 108 162 418602 6.02 5.12 4.76 7 15.9 30.8605 111 111 128 162 248 608606 162 151 184 208 294 609610 23.2 20.4 19.3 23.9 34.8 85.4620 12.4 10.7 10.1 11.4 15.3 47.2627 3.16 2.76 2.96 2.73 3.93 8.18629 20.4 17.2 15.3 17 24.7 88.2630 58.6 49.3 47 48.6 71.8 216640 1.29 1.1 0.98 0.88 0.94 1.81647 30.5 25.5 24.2 29.6 52.5 167650 5.9 5.1 4.5 5 7.7 27.6652 110 92 84.5 93.7 141 438660 14.4 11.9 10.9 12.6 16.9 48.3670 45.6 38.1 36.7 42.8 69.3 234680 158 136 124 135 192 623690 68.6 55.8 53.3 77.6 163 423695 362 304 307 392 719 1800
Jul Aug Sep Oct Nov Dec Ann
740 800 562 246 119 82.3 28954.7 55.8 49.6 25.3 12.5 8.04 231080 1140 867 393 192 136 4311540 2040 1360 576 305 223 638
189 261 162 77.4 41.5 27.9 80130 161 116 49.8 24.2 16.5 50
31.1 36.3 26.9 12.7 6.06 4.1 12243 277 215 87.8 43.2 27 90607 771 509 226 119 77.2 233
4.64 6.04 4.93 3.4 2.03 1.58 2431 465 309 129 62 40.2 147
67.9 69.4 45.9 21.2 11.1 7.3 231230 1580 964 469 226 144 464135 158 114 55.4 28 18.7 52551 586 412 194 90.1 57.9 196
1790 2040 1510 676 306 201 658810 957 708 320 145 90.5 323
3950 4540 3510 1590 812 499 1565
Note: DHM station numbers 600.1, 604.5, and 627.5 are reported and used as 600, 605, and 627 respectively in this study for simplicity in processing Station Id.
Reproduced with permission of the copyright owner. Further reproduction prohibited without permission.

233
APPENDIX F
AVERAGE MONTHLY AND ANNUAL CLASS A PAN EVAPORATION RATE (mm/day)
Stn. Jan Feb Mar Apr May Jun Jul Aug Sep Oct Nov Dec Ann
1206 1.8 2.8 4.9 5.9 4.8 3.8 3.5 3.3 2.8 2.7 2.3 1.9 3.41304 2.0 2.5 4.4 4.6 4.4 3.4 2.6 2.6 2.4 2.8 2.5 2.0 3.01324 2.2 2.8 4.6 5.0 2.6 1.6 0.9 1.3 1 2 1.9 2.5 2.3 2.42001 3.9 5.4 6.8 8.5 102 10.4 7.9 6.4 6.5 6.0 4.6 3.8 6.72002 2.9 3.0 3.6 4.5 5.6 5.6 5.3 5.0 4.0 3.7 3.4 3.3 4.2
APPENDIX G
AVERAGE MONTHLY AND ANNUAL SUNSHINE DURATION (hr/day)
Stn. Jan Feb Mar Apr May Jun Jul Aug Sep Oct Nov Dec Ann
1036 6.6 7.4 8.7 7.8 5.7 4.4 4.4 6.6 5.5 7.9 8.7 7.7 6.81103 6.6 6.9 7.3 7.1 6.4 4.0 2.6 3.4 3.8 5.9 6.7 6.5 5.61206 7.1 7.4 8.3 8.3 7.1 4.7 3.2 4.2 4.1 6.7 7.6 7.4 6.31304 6.1 6.3 7.2 6.9 6.3 3.0 1.9 2.4 2.9 5.2 6.0 5.9 5.01307 7.6 7.8 8.1 8 2 7.1 5.0 3.1 4.4 4.9 7.8 8.1 7.8 6.71324 7.2 6.8 7.0 7.3 6.5 5.1 2.9 5.0 4.6 7.1 8.2 7.7 6.31405 6.3 7.0 6.9 6.8 6.6 5.4 3.4 5.9 4.8 7.3 7.0 6.2 6.1
APPENDIX H
AVERAGE MONTHLY AND ANNUAL WIND SPEED (km/hr)
Stn. Jan Feb Mar Apr May Jun Jul Aug Sep Oct Nov Dec Ann
1206 7.0 10.1 12.8 14.8 11.9 9.5 8.0 7.4 7.7 6.6 6.2 5.9 8.91304 6.7 6.6 7.8 8.1 7.6 6.4 5.6 5.7 4.0 6.1 6.7 6.5 6.61307 7.8 8.7 8.6 8.6 8.2 8.2 7.6 7.7 7.5 7.3 7.4 7.4 7.91324 3.0 3.3 4 2 3.9 3.1 2.6 2.0 2.1 2.1 2.4 2.8 2.8 2.9
Reproduced with permission of the copyright owner. Further reproduction prohibited without permission.

234
w ( D O { ' I ^ O O C D ^ ’ O D ^ u - » » » - . • „ w w w _ , . ,e o ^ i ? ) © c M ^ c o o o ® ,» c D f » i o o © © c * * p ' » c o ® < D C M i n c M C M C O f ' - r » - © i f 5 © c o N N N N N N N N n N N N N ( M P 3 N N N N N N N « N N n N N N N N P ) N
8 0 < P t l f l ® N p T f f l ^ N l O f l 5 ( N N ( M O f f l S C B O t 0 ^ l O O O O S N ^ O N W D f i N N n N f N N Q O N f i C M N i n V N S C O I A e D ^ r N Q l O N l O w n o S f f l N - O N O N n o T N O n t t N t n S N N t t t ^ o i O N p f f l
^ N N N ^ N N N N N r t N N N N N N N N N N « « * ^ » * » ‘ * * N N N N N ^
© c o c - c o o c M c o © c p r ' - © c o ^ — ^ c M © c o c o ® i r ) e o c o i n ® c o © N > ,T © ^ o o N M 1 O N # N C M l S ^ 5 ^ ^ ( 0 t i 5 l 0 O » ' O 9 « ® Q » * r N ® Q t J t ^ r w o o r - < D c o ^ r 5 0 * - c D a © o u * > O t o r « - o ? « < N > o r - S a > » “ C O p g i o i ? ) o ^ o
O N t t t f ^ N Q o t o r t N C ) N ^ o © C J N e o N - ' r t ^ f f l n o o a e o ! 2 N NN c o N < o n o n o ^ r * N T a i o p * v o « N < , ) i o n i f l ^ N « O N » * < o g j0 > N ^ < 0 f f l O W O O C * * W ( , ) N r - > - N W t ^ O » - N N N ^ f l 5 N r * ^ O 0• • N N N N N N N ^ ^ W N W N N W N ^ N ' - N ^ e S N ^ - N ^ N N W ^ N
N S N i f l r v a o t o O h O i A n K a i N O K N o i n o t o t N e o M n n N0 i o N ( O f > a o > T N v c i M o a ) O ( 0 O t o i a 3 O Q 0 g i o a Q « ( D C i N O «a > o a > c * > o © o © o r i» © o r * > t » > t < » r ) © ^ ^ r > ^ v t * > o o n ( o n © r ,> » © © o o
<D © * - » - CM
© a o c M O m o o ^
^ © c o w » t / ) r - ’ r>i» c - » ^ - C M ~ ' a D ^ - ( A a o © a 3
X5zUJQ.CL<
( 0zoK
5( 0
oUJ
eo
zo
0 .oUJea.
z<
CO
s
C O C O O r * e » T N O N W f ) f f l ^ n c D » m t N O O r N ' ' t n O ’ ’ O l f l r t SN e < * r ) e 0 N c o ( o ( M O A n N N O M Q a a i o N n o o ( D O * o r ) i o t ^> A o O 9 e f i O N a i « 9 o ( O * > N N a a f i o a ) a ) r » o N O 0 i u ) ^ N ^ o o
( N A n n o s n N ^ O t f i f l v n y N e B i o o i O N e t i a n i A M a N d N O i f l( O T N N N n v N ^ ^ s e o e o o n ^ N ^ N n f M D N O N O i t o n i A nN » - N N » * * * ^ » - « j ^ » - ^ o n T » n t - O i n ^ ^ ^ O O N O » - n » “ N N O a
N ^ * > 9 t r > n n T « N O O ( _ , » - C M e M C O C N . © © ® C 0 ©, , . N ^ N v i o ^ i o o r t a ' - ^ c i P r ' f l N
n n c y o t O N v o o ^ N i A N v v o ^ o
© © © s s s
O l A O ( 0 G 3 0 ) i n * ‘ O l f l N O N N n O ( P I O Q N O S 3 ( M O t D ^ ' - ( D > n O ^ ^ ■ ▼ N N ^ V ( O w o < e o N i f l r « . n o i D i S » ' » - « 9 N O N i f l N ( a © n o N N ^ ( D N o n o t N ( 0 ( 0 M T « ) n ( s Q a ) o o o N i A a Q ( 0 r t < o * r N * - c n f l ^ n ^ ^ ^ N N n » o ^ v t O ^ « v W N n r ) v n n n n i * < » » v
c o © t f 5 w c M c o c o < M ^ c D © ~ * © c o c N © ^ © c N ^ O ' r r « - © < o r - * “ « r « — c m ^ c o c ;-- -• - • - — — — -------- 55 «o — — — ---------------— ^ — — — — — — ~ ~ — — — — —l A N N N S t O e t O V i
r » ^ f > « . e M v f t * < r © « M © ' T M i c M © © © t D e M © * - i n © 5 * » ^ * » n © ^ © c o c ~ i n © © i - i a o n 8> d > c m * - m ^ ' » n » - n e o N v i D v ^ M O O M A O N ! D n ? g ' - o « ~ a > o ^ ' < 0 a 3 r » © o o o e > < c o o m < D © ^ c M r > » ^ > c o ^ r r > » < D o r >» i f t r >< » o c o r - v
a 3 v n i o * ' 8 3 N N ^ o r ) N < c o f f l * - N i o i f l Q n v T e v N O » ' C 5 r t i n * * « Ti n o o © c o * - r » » r < » C D C o c 0 ^ r » r ' » > o r > » i n < D v t f i c 0 © i A r < ' » < o © c o Q © Q c o ^ c Mr t v n o o ^ N i O f “ N w < M r > ^ v » - * - ^ * - ^ ^ N T N V N » - v - o n ’- * -N N N r j ^ N N - O N n w ^ W N N N r - N N M - ^ M C J N N N N N N M N
a O O ( V I A ^ 8 ) O I ^ N V I A r > « n « * ‘ r > N i A 8 > N { D Q n N 0 ( n ( Q Q K 8 > Nc o e o ^ ^ « T r t t D » ^ ^ © « M r “ ^ © © t f > C M e O t f > ® © * “ ^ c D c o ^ © © © ^ < o * “r » Q ( D N i A « i s i | ) 0 ( O C > 0 ) N ^ N a 3 ( D i A O N i n o t s c o ^ c 0 7 N a N O U )
i 0 N N N 0 ) V Q ^ ( 0 M 0 « i 0 N « 0 Q d ) 0 i 0 ) o n i n ” i A N ^ n N f N 0 e r « . N O N f r t i n ( D ^ n n n o o n » - o e o o » * N f f l a s i n o f N * * i n » T s
N N n o r - « « D ( ' 4 f v © o » - f f l O ^ ^ » * N ( O o » - N ( X ) o r j m c D ( n o i o t n N♦ N N N N ^ - ^ W ^ * » N N * * N N C ' I
O c n i A C O h - © © © © o e o o m o o ^ t o n f f i N C o o o . , ^ i n N » r - o o ^ N n o a o o N » -c M c o r > » . t o © c Q < D O ( S c o c M c o © c o c o < & o ^ i f >
© C M O n 9 « - c M ^ t n t t © c o © f » © 0 'N ^ ( O i n o w ) Q T n o > ( o ^ i A 0 r t c < i u . ................ _ . . ..O l A N N i o u l O N O N N I O t f O n i a v n S N N S X D N O O l O g O f e i f l e
n n n CD O ' N O N N 1cm a n 5 * - cm >
© © CD m > © ’r i n n n n v ) o i _ . . . ______________________
f ' - ^ * » © c n * - ^ © C M © v c p r - ^ e o p « . r * w f » « n ^ c o ^ c D © « n © i ...................O n N t t i Q O o M A N f n h i n i A O O O i n O O Q N N N ^ O O O i O Q i . _ « > © < M © ( » . © © r o © r > « O C M © © © o ^ © © © < o © o s o r > » r a> v - r < » r a» © r » ©C M C M < M C M C M ^ * ^ ^ ' C M ^ * C M « M * - C M v » C M C M * - C 4 ^ C M ^ » - ^ * C M t M ^ C M » - « - » - * * ^
N t > o i f l o t B N i n i e f 6 ) ^ N N O « 0 ' * 0 ) O i A ( p Q n t M D o i A a ;
N O N * - I A ^ t * 0 0 ' * 0 0
«>eONCOtQNONniANniA<DnNiACDNoou)flDiAnMOinio^nvN O C C l O n * , T 9 s ^ M M l A C O N f i l O 0 N ^ I O N » ‘ n i D e T N f l N N M nN n N N O ^ a n t O N Q > Q v ) t 9 c o n o * a n f l N ( s r t ^ v n N N i A O oC M C M C M C M C M C M « > C M C M C M < M C M v - C M C M C M C M C M C O C M C M C M C M C M C M C O C M C M C M C M < M C M C M
( O O N C O T O i n N l A C S C M N n N N N O Y C O ~ ' “ z i N < o o n i n e n a i v T O ( O i f l ^
n n c M r t M T M O v ' C N n c N n
O C D 0 N O V C D S N I A N N Oe o c M M v i r c M N n a a a i n c oi D N « n < O N e n c D N i f l i o ^c m c m c O c o c o c o c o c o c o c o c o c o c o
O O O N C D t i
5 c p ^ © © «o C co co co co ▼ iCO l A < O O N C D l A C O M O O T Q Q O < S t ' A O (>l ( D Y |O ^ M t t ) C O N N N I 0 C D N a 9 O M D * ’ l o a ) O O O ( y i > O NO C D l S n N O t f N I A a Q N N d N W q i O N N n N M N N a O N a N S C O l O M N O S l D C D ^ ^ N a i A N I O N^ © N ^ t M ^ - M C N r t N O ^ O N W O O C D N ^ O N O C ' c n i D ' C N O r t M T N T O O N N f t V ^ O t f N l D O O* - N N N N N C N N N N N N » » * * N N « » * N N N N N n N ( M N N C N { N N N N N N ^ ^ t - * - ^ N N N C M « ^ ’-
O « - f l D « l A O a t ^ > O k O O N G > O ^ N O l D C D n N O > N * > 0 > O O N . I D ( M i - c * ) N Q ) n o e D O ( D N a M N ^ n © c o s ^ i o © » © © ^ c o r » 2 © n © © © v r < » r w ^ © © r » ^ © < M c o © c o © ^ > r o . © © r < « . ^ - v © © « ' * No a } <s er ^a 9 a NON^^o o >o u) na Yv * i Anh>N^NNTT‘ (Ov*NNN^coM^Ma30
9 CD O « ■ ©CO ® — —© CM _ _v - CM CM CM CM *— I ^ C M C M * » ^ » C M * - C M C M C M C M C M C M C M ^ ' C M C M C M C M C M C M C M ^ - C M v - i » - C N C M r - » - N ^ N C V N » - C M
Q N i O N « ) 0 M N B a i u ) s ^ « * O ) * * ' n n t < A N o e a© r * - c M f ^ . » - ^ © ® 0 « 0 © ^ T - ^ © ^ ' r ^ f * - ^ « n ^ r * « . S oK C 0 a n 9 N O Q O N * * N n N t C t ^ ( O n ^ 8 N C O
S i A c o s n o o ^ N n< f i t a < & $ O O N K N N
( 9 O) Q Q 0 0 © © ©
s © o « - C M e o w - i n © N ® a o « - c MSMniniAiniAininiAiAinSecD 0 0 O 0 0 O O O Q 0 Q
n r t N f f l ^ O N M © « ^ N W N M ^ ® * * 0 » -
^ Wl Ul W# I M «W W» W M# W W W W < W < W W < W < w w w w w w w W w W 0 © © © © © t'. ' © © © © © © © © © © U J W UJ
Reproduced with permission of the copyright owner. Further reproduction prohibited without permission.

235
APPENDIX J
ANNUAL TEMPERATURE ( ‘t ) FOR SELECTED STATIONS
Station Station StationYear 1206 1303 1405
Max. Min. Max. Min. Max. Min.
1962 19.7 12 22.0 15.3 20.3 11.61963 19.7 11.7 23.0 15.3 20.4 11.61964 20.7 12.0 24.7 15.6 20.6 11.81965 20.3 11.4 24.6 15.1 20.0 11.21966 20.4 11.4 25.0 15.7 21.2 11.91967 20.7 11.5 24.0 15.0 20.1 11.01968 20.9 11.6 24.4 15.3 20.3 11.21969 21.5 12.1 24.9 15.5 20.7 12.01970 21.3 11.9 24.8 15.6 20.8 11.81971 20.5 11.6 24.5 14.8 19.9 11.51972 20.9 12.0 24.7 14.6 20.3 11.81973 20.5 12.8 25.1 15.3 20.6 11.91974 20.1 12.7 24.9 15.2 19.5 11.91975 20.4 12.7 25.6 15.3 19.5 11.71976 20.0 12.5 25.6 15.4 20.2 11.81977 20.2 12.6 25.4 14.5 20.3 11.71978 19.8 12.5 25.2 14.8 20.3 12.01979 20.6 13.0 25.2 15.3 20.6 11.91980 20.4 12.9 25.4 14.7 20.3 12.01981 19.9 12.5 26.4 15.1 20.0 11.71982 20.0 12.7 26.5 14.9 19.8 11.61983 19.7 12.5 25.8 14.8 20.0 11.11984 19.9 12.8 26.1 15.3 20.1 11.71985 20.0 13.0 25.5 15.3 20.1 12.01986 19.7 12.7 25.3 15.0 20.1 11.51987 20.2 13.3 24.9 15.1 20.5 12.11988 20.8 13.3 25.5 15.8 20.8 12.31989 20.1 12.6 24.3 15.2 20.0 11.51990 20.1 12.8 25.0 15.4 20.2 12.11991 20.4 12.8 25.1 15.1 20.3 11.71992 20.6 12.5 24.8 14.8 20.4 11.51993 20.5 12.6 24.0 14.6 20.3 11.6
Reproduced with permission of the copyright owner. Further reproduction prohibited without permission.

APPENDIX K
3ANNUAL DISCHARGE (m Is) FOR SELECTED STATIONS
Station Station Station Station StationYear 620 670 680 690 695
1948 706 336 18541949 918 397 18271950 745 285 16421951 775 292 11541952 727 323 13571953 684 287 13211954 717 422 18911955 621 314 13271956 629 313 13071957 641 322 13191958 645 290 15371959 678 291 14201960 801 280 16081961 626 322 15141962 760 354 17451963 727 384 16841964 685 310 15831965 658 411 13481966 740 337 15811967 595 427 15051968 46.7 205 882 357 18641969 42.4 204 786 337 14391970 50.5 205 590 338 20141971 61.4 278 734 291 20001972 49.1 177 734 343 15791973 55.7 217 754 376 16911974 54.1 223 668 335 18481975 50.4 212 618 300 17021976 42.9 194 774 315 20431977 47.9 205 770 325 14901978 53.6 233 323 16701979 40.7 195 303 14101980 41.9 202 302 18701981 46.2 203 235 18201982 48.8 186 272 12301983 74 196 155 14101984 56.1 233 272 15801985 75 223 317 17301986 67.4 • 176 408 11901987 51 185 365 16101988 57.6 197 391 17201989 56.1 191 346 17301990 54.9 205 384 17501991 46.7 190 266 17501992 36.6 141 330 13201993 49.5 178 249 15701994 324 1350
Reproduced with permission of the copyright owner. Further reproduction prohibited without permission.

237
APPENDIX L
DOUBLE-MASS CURVE OF PRECIPITATION (1948-1993) FOR SELECTED STATIONS
’REC
IPIT
ATI
ON
(m
m):
St
atio
n N
o. 1
403
M O)
09 O
O
O O
O O
O
O O
O O
O
O O
O O
3
0 0
0 0
0i
i i
i i
i
r i l lUi v n
C1 1 V ’ - ■■ - - —1
) 20000 40000 60000 80000
PRECIPITATION (m m ): S ta tio n No. 1303
•REC
IPIT
ATI
ON
(m
m):
St
atio
n N
o. 1
403
M oi
a o
o
o o
o o
o
o o
o o
o
o o
o o
3
0 0
0 0
0k
1 %
1
1 »
Ui w
) 20000 40000 60000 80000 100000
PRECIPITATION (m m ): S ta tio n No. 1316
100000 -E2 " 80000 -
§ 5 60000 -
t o 40000 -
o | 20000 -
£ 0 -q. w ic1-1 I I i I
20000 40000 60000 80000
PRECIPITATION (m m ): S ta tio n No. 1303
Reproduced with permission of the copyright owner. Further reproduction prohibited without permission.

238
APPENDIX M
DOUBLE MASS CURVE OF DISCHARGE FOR SELECTED STATIONS
DOUBLE-MASS CURVE (1948-1994)
w
«
ow
80000 je 70000 -atto 60000 -o 50000 -iSe 40000 -o 30000 --
S 20000 --10000 -
o M5000 10000 15000
D ischarge (m3/s): S ta tion No. 695
20000
DO
12000 -
o 10000 -
E z 8000 -^ oSi \ 6000 - <5 o2 s 4000 -o «5 <0 2000 -
n -
UBLE-MASS CURVE (1948-1977)
«)rr
* ■ ! I I I I£
I I I I I) 5000 10000 15000 20000 25000
Discharge (m3/s): S ta tion No. 680
Reproduced with permission of the copyright owner. Further reproduction prohibited without permission.

239
Appendix M continued
DOUBLE-MASS CURVE (1968-1993)
1400 -i f o 1200 -1 • 1000 ^
oo ZS’ c « oJS «so m
200 -
rX*
800 - 600 - 400 -
,X *
fX ** X * * X4*
X*
X *x * J
1000 2000 3000 4000 5000
Discharge (m3/s): Station No. 670
6000
DOUBLE-MASS CURVE (1968-1993)
«-■ 1500 -JO oCMCOCO£, o 1000 -d> zS3 _<5#«
o.5Id500 -
w(0 raCO5 0 - x * £x* x * *X*x**~'
-X * X*xXX*
2000 4000 6000 8000
Discharge (m3/s): Station No. 690
10000
S fc 5000 -6000
- © r»c ®
& 6 4000 -g, * 3000 - J o 2000 -g S 1000 - 5 W
DOUBLE-MASS CURVE (1968-1993)
*x*
0 4-*x*JrX* X*X *X *J r
fX * X * X *'
2000 4000 6000 8000
Discharge (m3/s): Station No. 690
10000
Reproduced with permission of the copyright owner. Further reproduction prohibited without permission.

240
APPENDIX N
Z-STATISTICS OF MONTHLY AND ANNUAL NONPARAMETRIC TRENDS
N - l . M axim um tem peratureJ a n F e b M a r A p r M a y J u n J u l A u g S e p O c t N o v D e c A n n Z - j
1036 1.00 -0.12 0.52 1.11 1.15 2.29 1.25 0.50 2.31 0.30 0.18 0.00 3.17 0.871103 0.91 -0.34 -0.70 1.17 1.33 3.93 3.45 3.91 3.37 2.28 2.12 1.65 7.01 1.921201 -0.76 0.00 -1.17 -0.41 0.00 0.67 1.22 1.29 1.84 -0.18 -0.80 -0.86 0.26 0.071206 -1.70 -1.04 -1.05 0.66 -0.37 0.25 -1.85 -1.84 -1.99 -0.93 0.29 -1.30 -3.17 -0.S11209 -1.53 -1.11 0.49 0.00 -0.98 -1.66 -0.80 -0.11 -2.31 -0.83 0.27 -1.59 -3.01 -0.841220 1.09 0.56 -0.60 0.75 1.99 1.79 0.00 0.28 0.06 -0.06 0.88 0.72 2.11 0.621303 1.68 1.39 1.10 -0.17 -0.79 1.20 0.73 1.67 2.28 2.13 2.02 2.25 4.62 1.291304 0.00 0.00 -0.40 1.34 1.24 1.44 1.15 0.99 1.14 1.29 1.68 0.59 3.08 0.871307 -0.21 -1.54 -2.08 -0.91 -0.48 0.15 -0.94 -0.58 -0.79 0.00 0.33 0.82 -1.83 -0.521310 -0.20 -1.84 1.64 -0.25 -0.25 -1.59 0.00 0.22 -1.60 -1.15 1.04 -1.65 -1.68 -0.471318 -0.62 -0.18 -0.24 0.88 1.16 2.15 1.54 2.43 0.86 2.14 1.71 0.37 3.75 1.011404 -0.25 0.10 1.39 1.39 -0.25 -0.65 0.00 -0.50 -1.24 1.16 1.73 0.00 0.82 0.241405 -0.81 -1.19 -0.75 -0.22 -0.64 1.38 0.18 0.95 -0.66 0.22 0.68 -0.91 -0.42 -0.15
Z i . -0.11 -0.41 -0.14 0.41 0.24 0.88 0.46 0.71 0.25 0.49 0.93 0.01 0.31
N -2. M inim um tem peratureJ a n F e b M a r A p r M a y J u n J u l A u g S e p O c t N o v D e c A n n Z J
1036 1.50 0.50 -0.15 -1.70 0.00 -1.36 -0.75 -2.04 -1.23 1.00 -1.80 -0.89 -2.29 -0.581103 -1.48 0.00 -0.79 -3.96 -1.32 -1.17 0.74 1.63 0.49 -2.77 -2.51 -0.74 -3.45 -0.991201 0.27 3.11 0.00 0.93 1.18 0.86 1.52 0.87 1.68 -0.72 0.00 -0.12 3.06 0.801206 2.93 1.67 1.86 1.68 0.78 2.86 3.51 3.85 3.76 2.42 3.25 4.14 9.51 2.731209 -0.16 -1.54 0.44 0.27 0.66 -0.62 -0.44 -0.39 -1.67 1.49 -0.28 0.00 -0.64 -0.191220 2.31 2.25 1.55 0.84 1.15 2.55 2.70 2.67 2.29 1.84 2.88 2.24 7.41 2.111303 -1.84 -1.67 0.02 -0.05 -0.71 -0.14 -0.05 0.55 0.53 -0.16 -1.11 -1.57 -1.82 -0.521304 -0.04 0.62 -0.60 0.32 0.27 0.64 -0.45 -0.50 0.61 0.70 -1.18 -0.23 0.04 0.011307 0.52 -0.64 -1.54 -1.00 -1.60 -0.49 -0.24 0.18 0.09 -0.24 -0.67 0.88 -1.40 -0.401310 2.88 0.74 2.98 2.03 0.80 -0.95 1.60 2.38 2.15 2.28 2.60 1.99 6.31 1.791318 -0.47 -0.90 -0.62 -0.24 -0.11 -0.71 0.22 1.23 -0.28 1.32 1.16 -0.14 0.11 0.041404 0.60 -0.30 0.74 0.40 0.05 -0.90 -1.21 -1.20 -1.00 0.30 -0.25 -0.05 -0.83 -0.241405 1.11 0.87 0.95 0.23 0.81 1.17 1.86 1.61 0.94 0.61 -0.73 -0.45 2.61 0.75
Z i . 0.62 0.36 0.37 -0.02 0.15 0.13 0.69 0.83 0.64 0.62 0.11 0.39 0.41
Reproduced with permission of the copyright owner. Further reproduction prohibited without permission.

241
Appendix N continued
N-3. Average temperatureStn Jan Feb Mar Apr May Jun Jul Aug Sep Oct Nov Dec Ann z.j
1036 1.37 0.87 0.30 -0.75 0.37 0.00 0.00 -1.10 0.64 1.06 -2.25 -1.44 -0.69 -0.081103 -0.65 0.60 -0.50 -2.07 -0.37 1.94 2.18 4.01 2.40 0.28 -0.62 1.17 2.82 0.701201 -0.24 0.60 -0.37 025 -0.25 0.99 0.42 1.38 1.53 0.00 -0.12 -0.34 1.47 0.321206 0.31 0.22 0.27 1.00 -0.09 1.63 -0.14 -0.38 0.16 1.29 2.20 0.14 1.92 0.551209 -0.31 -1.04 0.75 0.31 0.12 -1.95 -0.74 0.00 -2.14 0.22 0.39 -1.10 -1.53 -0.461220 1.52 -0.21 0.46 1.22 1.40 2.53 1.97 1.56 2.12 1.30 2.03 1.09 5.16 1.421303 0.54 0.02 0.53 -0.25 -0.94 0.75 0.74 1.52 2.34 1.56 0.90 1.27 2.75 0.751304 0.05 0.32 -0.55 0.79 1.19 1.13 0.44 0.50 1.00 1.10 0.59 0.45 2.14 0.581307 -0.01 -0.08 -0.10 -0.08 -0.02 0.00 -0.02 -0.01 0.00 0.00 0.00 0.03 -0.02 -0.021310 0.94 -0.45 2.09 0.65 0.25 -1.50 0.75 0.99 -0.10 1.95 2.33 -0.45 2.19 0.621318 -0.70 -0.69 -0.48 0.31 0.50 0.22 0.99 2.62 0.76 1.45 2.02 0.00 2.30 0.581404 -0.25 0.00 1.29 1.34 0.00 -0.74 -0.20 -0.85 -1.29 1.29 1.19 -0.33 0.38 0.121405 0.40 -0.10 0.33 -0.22 -0.09 1.49 1.42 1.00 -0.24 0.68 0.26 -0.91 1.19 0.33
Zi. 0.23 0.01 0.31 0.19 0.16 0.50 0.60 0.87 0.55 0.94 0.69 -0.03 0.42
N-4. PrecipitationStn Jan Feb M ar A p r M ay Jun Jul A ug S e p O ct N o v Dec Ann z.j
1006 0.29 1.63 0.75 1.51 1.11 -2.20 -1.12 0.12 -0.04 1.27 0.98 1.47 1.62 0.481008 0.06 0.42 0.39 0.67 2.03 -0.87 1.99 -1.01 -0.24 -0.64 0.47 2.58 1.66 0.491009 -0.36 0.01 -0.06 0.38 2.45 1.24 0.10 -1.13 -0.69 -1.71 0.96 1.79 0.88 0.251016 -1.09 -0.77 -1.18 -1.40 -1.28 -1.89 0.12 0.00 1.03 -0.91 -1.63 0.11 -2.68 -0.741023 0.55 2.21 0.86 1.39 2.91 0.08 1.09 -0.80 1.31 1.07 1.71 3.79 4.60 1.351024 -0.85 -0.41 0.27 1.68 0.03 0.38 0.28 -1.22 1.06 0.57 -0.91 1.88 0.79 0.231027 0.36 1.70 0.00 0.73 2.21 0.57 0.93 0.81 0.93 -2.03 -0.74 0.59 1.79 0.511028 -1.09 0.77 0.65 -0.77 1.69 -0.61 0.59 -0.10 0.25 -0.27 -0.23 1.80 0.73 0.231062 -0.14 1.17 0.34 -0.55 0.48 -1.44 -0.89 0.89 -0.08 -0.41 -0.64 0.35 -0.26 -0.081102 -0.54 -0.82 -0.06 0.78 0.73 -1.52 -1.17 -3.28 -2.25 -1.84 0.23 3.15 -2.05 -0.551103 -0.07 1.09 -0.63 1.63 1.22 -0.45 -0.95 -1.20 -0.68 -2.00 0.22 2.30 -0.02 0.041104 0.61 -0.42 0.22 0.37 1.37 -1.01 1.29 -1.51 -0.57 -1.93 0.00 2.30 0.17 0.061106 -0.26 1.16 0.96 0.00 2.45 -0.81 0.95 0.00 2.87 0.42 -0.09 2.42 2.86 0.841107 -0.45 1.90 -0.29 0.54 0.74 0.84 1.90 0.55 2.96 1.96 0.58 0.69 3.50 0.991108 -0.09 1.17 -0.11 0.53 0.37 -1.50 0.71 -0.02 0.16 0.53 0.36 1.51 1.00 0.301115 0.11 1.69 0.02 -0.53 1.14 -0.40 1.09 -1.07 0.65 0.12 -0.16 1.58 1.17 0.361116 -0.34 -0.53 0.23 -0.79 0.15 -2.08 -1.41 -0.37 0.03 -1.04 0.87 2.03 -1.34 -0.271201 -0.36 -0.09 0.08 -0.45 0.22 -0.57 0.78 1.57 0.62 0.46 0.30 -0.63 0.60 0.161202 2.21 3.71 -0.38 1.33 0.16 -0.51 -0.14 -0.54 0.06 -1.29 0.52 1.81 2.02 0.581203 0.16 1.49 -0.22 0.78 1.56 1.27 1.14 -2.40 -1.07 -0.68 1.91 2.39 1.83 0.531204 0.81 1.53 1.65 -0.65 -0.20 -1.52 0.80 -1.89 0.22 -0.40 1.65 1.53 0.94 0.291206 -0.72 -0.21 -0.88 -0.65 0.91 0.14 1.77 -2.42 0.93 0.11 -1.03 2.43 0.10 0.031208 0.34 0.00 0.00 1.89 -0.95 0.04 0.12 -0.25 -1.13 1.19 2.78 0.15 1.12 0.351210 0.03 1.09 -0.13 -1.26 1.89 -1.28 0.34 -0.44 1.70 0.52 0.30 2.09 1.31 0.411211 0.48 0.91 -1.08 0.37 0.49 -0.44 0.23 -1.45 0.62 -1.72 0.97 2.92 0.56 0.191213 -1.45 1.41 0.75 1.06 1.68 -1.01 1.41 -1.97 1.27 -0.79 -0.71 1.93 1.00 0.30
Reproduced with permission of the copyright owner. Further reproduction prohibited without permission.

242
Appendix N-4 continuedStn Jan F eb Mar Apr M ay Jun Ju l A ug S ep Oct N ov D ec Ann z.j
1217 0.30 1.27 2.38 1.72 0.80 0.08 0.77 1.22 -0.42 -0.73 0.51 1.73 2.83 0.801218 2.00 1.02 0.39 -0.81 0.00 -0.92 -1.65 -0.49 2.02 1.40 -0.38 -0.47 0.45 0.181219 -0.11 -0.47 -1.04 0.25 -0.17 -0.40 -1.22 -1.76 -1.60 0.00 -0.70 1.59 -1.73 -0.471220 -0.66 2.25 -1.34 -1.47 1.40 -0.75 1.17 -0.68 0.64 0.84 0.22 2.08 1.14 0.311222 -0.24 0.57 0.14 -0.85 -0.26 -0.19 -0.51 1.39 0.69 -2.39 0.16 1.08 -0.11 -0.031224 -0.32 0.72 1.71 2.92 1.59 1.94 2.59 0.99 0.09 1.07 1.48 1.18 4.71 1.331301 -0.26 1.55 0.33 0.76 0.13 1.19 3.04 1.95 1.56 -0.13 -2.24 -0.40 2.21 0.621303 0.95 1.02 1.57 1.53 1.74 -0.08 0.35 -0.97 1.76 0.35 2.10 1.83 3.51 1.011304 -0.45 0.00 -0.60 -1.09 -0.30 -0.74 -0.10 0.25 1.09 -0.49 -1.23 0.61 -0.95 -0.251305 -0.63 3.11 1.12 2.04 0.98 -0.57 -0.09 -1.43 0.15 -0.09 0.92 1.93 2.12 0.621306 0.21 3.23 -0.31 1.55 1.72 -0.89 -0.11 -0.44 -0.63 -0.01 -0.09 2.39 1.82 0.551307 2.29 2.97 -0.29 0.40 3.09 -0.99 0.42 -0.44 3.01 0.95 2.08 2.64 4.58 1.351308 0.42 3.14 -0.50 2.36 3.34 0.20 0.73 -0.44 2.41 0.14 1.12 1.74 4.23 1.221309 -0.33 0.67 0.56 1.34 1.44 -0.58 -0.02 -1.78 -0.07 0.37 1.71 2.67 1.53 0.501310 0.40 -0.12 -0.57 0.79 0.65 1.90 2.33 -2.15 1.07 0.32 0.44 0.18 1.56 0.441316 0.27 0.87 -0.11 0.87 1.91 -1.11 -0.64 -1.47 0.45 0.64 0.79 2.19 1.21 0.391317 0.57 1.23 -1.18 1.56 1.60 0.66 -0.28 0.02 2.Co 0.15 -0.57 1.91 2.26 0.641318 -0.08 0.00 -0.49 0.14 0.56 -1.16 0.39 0.67 1.31 1.81 0.00 2.09 1.42 0.441322 -1.12 0.53 -1.13 0.91 1.33 -0.84 -0.28 -1.98 -0.39 -0.01 1.14 1.31 -0.27 -0.041324 -0.73 2.53 0.35 1.96 2.36 -2.42 0.46 -1.06 1.80 -0.13 1.83 2.29 2.63 0.771325 0.19 0.41 1.89 1.90 2.59 -0.11 1.13 -1.03 0.33 -0.58 1.72 1.69 2.91 0.841401 0.21 0.87 0.20 -1.09 -1.38 -0.27 -0.56 0.58 -0.40 -1.16 0.20 -1.61 -1.19 -0.371402 -2.50 0.21 -0.77 -0.48 0.00 -1.24 -2.36 0.00 -1.43 -0.40 -1.05 -0.64 -3.10 -0.891403 0.43 1.42 -1.50 2.09 0.52 0.15 -0.09 -0.38 -1.82 -0.53 -0.47 1.50 0.33 0.111404 0.31 1.53 -0.81 1.71 1.29 1.52 2.55 1.80 2.04 0.05 0.88 2.96 4.59 1.321405 -1.17 1.05 0.24 0.75 1.96 -0.83 0.56 -1.89 0.53 0.46 -0.09 1.53 0.87 0.261414 -1.01 0.73 0.24 -0.51 0.24 0.73 -1.34 0.00 -1.50 -1.72 -0.55 0.00 -1.69 -0.391418 1.28 -1.78 0.84 -0.71 2.21 0.36 -0.58 0.00 0.72 0.41 -0.38 0.76 0.95 0.261420 -0.46 1.67 1.13 -0.23 0.23 -1.22 -1.22 -0.68 -0.14 -0.41 -0.45 -1.05 -0.84 -0.23
Zi. -0.04 0.98 0.08 0.53 1.04 -0.40 0.32 -0.53 0.46 -0.17 0.32 1.47 0.34
N-5. DischargeStn
Jan Feb MarApr
May JunJul Aug Sep Oct Nov Dec Ann
z./602 2.01 2.45 3.01 0.03 -0.42 -0.36 0.83 2.77 2.17 2.04 1.95 1.72 5.24 1.52605 -2.64 -2.14 -2.23 -1.31 -1.86 -1.29 0.91 0.61 -0.98 -1.97 -3.33 -3.18 -5.64 -1.62610 1.13 1.78 1.82 1.23 1.23 -1.01 -0.26 1.21 0.54 0.39 0.88 1.82 3.14 0.90620 1.72 1.68 1.68 1.20 2.28 1.39 0.77 1.64 1.05 0.59 1.37 1.77 5.00 1.43630 -0.24 -0.53 -0.85 -0.71 0.42 0.43 -0.13 -2.02 -0.83 -0.68 -0.86 -0.86 -2.07 -0.57640 0.74 1.27 1.01 1.24 0.37 0.22 -0.50 -0.82 0.48 1.06 0.82 1.35 2.09 0.60647 0.23 1.13 0.87 0.21 -1.52 0.17 1.69 -1.44 0.12 -0.29 -1.11 -0.41 -0.11 -0.03650 1.41 1.24 1.54 1.36 2.53 2.57 4.84 3.62 3.62 1.58 1.94 2.21 8.40 2.37652 -0.54 -0.07 -0.09 -0.66 -0.65 -1.19 -1.51 -0.21 0.44 -0.86 -1.26 -0.88 -2.20 -0.62660 -0.96 -1.65 -1.50 -0.95 0.19 0.69 0.02 -1.98 -2.25 -1.92 -0.58 -0.06 -3.15 -0.91670 -1.91 -1.44 -1.29 -1.39 -0.18 -0.28 -0.77 -0.62 0.75 -1.41 -2.61 -2.34 -3.98 -1.12690 -0.82 -1.02 0.13 -1.61 -2.39 -2.34 -1.09 0.11 0.41 -0.82 -2.09 -1.52 -3.79 -1.09695 -2.04 -2.44 -2.20 -0.79 0.60 0.38 0.80 0.33 0.96 -0.42 -0.34 -1.89 -2.03 -0.59
Zi. -0.15 0.02 0.15 -0.17 0.05 -0.05 0.43 0.25 0.50 -0.21 -0.40 -0.18 0.02
Reproduced with permission of the copyright owner. Further reproduction prohibited without permission.

Reproduced
with perm
ission of the
copyright ow
ner. Further
reproduction prohibited
without
permission
APPENDIX O
COMPUTATION OF AVERAGE BASIN PRECIPITATION
S t n . A v e E l e v t n * R e p r e s e n t a t i v e P r e c i p i t a t i o n S t a t i o n s A v e r a g e A v e r a g e E l e v a t i o n A d j u s t e d A v e r a g e B a s i n
N o . * ( m ) P r e c i p i t a t i o n E l e v a t i o n o f D i f f e r e n c e P r e c i p i t a t i o n P r e c i p i t a t i o n * * *
* ( m m ) P r e c i p i t a t i o n
S t a t i o n s .
( m )
( 2 ) - ( 5 ) o r
2 8 0 0 - ( 5 )
( 4 ) + 0 . 5 * ( 6 ) ( m m ) *
( D ( 2 ) ( 3 ) ( 4 ) ( 5 ) ( 6 ) * * ( 7 ) ( 8 )
600 4868 Based on gridded data with interpolation 536 536602 1609 1301, 1303, 1325 2210 1339 270 2345 2345605 2948 1301, 1303, 1325 2210 1339 1461 2940.5 689606 1354 1301, 1304, 1306, 1309 1759 1065 289 1903.5 817610 4583 Based on gridded data with interpolation 1309 1309620 3356 1006,1008,1009 2645 1751 1049 3169.5 3170627 4098 1016, 1058 3625 2553 247 3748.5 3748629 1986 1016, 1023, 1024, 1058, 1062 2286 1739 247 2409.5 2523630 1573 1023, 1024, 1028 1211 965 603 1515 1890640 1854 1024 1533 1552 302 1684 1684647 4141 1102, 1103, 1104, 2002 1676 2322 473 1915 1915650 2815 1103, 1104, 1224, 1225 1889 1734 106(5 2422 2422652 1451 1104, 1106, 1107, 1115 1608 1373 78 1647 1896660 2874 1103, 1104, 1206, 1219, 1220 1847 2081 719 2206.5 2206670 3786 1201, 1203, 1204, 1206, 1218, 1219, 1220 1699 2615 185 1791.5 1792680 1243 1108, 1206, 1210,1211, 1213, 1222 1569 1288 -46 1546.5 1833690 2854 1307, 1308, 1401,1402,1403,1404,1405,
1413, 1414, 1418,419, 14201580 1992 806I 1984 1984
695 895 1211, 1307, 1308, 1309, 1310, 1322 1463 592 303 1614.5 1288Excludes the area covered by upstream stream gauging station Column (3) is used if the elevation on column (3) is not more than 2800 m.Area weighted average prcipitation o f the whole basin measured at the give Station No.
243

244
APPENDIX P
COMPUTATION OF EVAPOTRANSPIRATION CHANGES DUE TO CHANGE IN CLIMATE AND LAND-USE
1) Evapotranspiration change due to change in forest area. Ce,')
The Calder-Newson model (Calder & Newson, 1979; Calder, 1994) is given as:
E = ET + f (a? - bET), (P-l)
where, E = Total annual loss including interception.f = Fraction of catchment with full canopy = .66 * forest area, a = Interception ratio = 0.35 to 0.40 for P > 1000mm.P = Annual precipitation (mm) = 1270b = Fraction of year when canopy in wet = 0.000122 P = 0.000122 * 1270 = 0.15
Also the number of rainy days in the Kosi basin as given in DHM climatological records = 100 days. Assuming wet canopy for one third of rainy days, we can compute b as follows (Calder & Newson, 1979):
b = 1.5 * (Number of rain hours per year/Number of hours in a year) (P-2)
b = (1.5*100*8)/8760 = 0.14
ET = Evapotranspiration in unlimited water supply condition.
Annual Penman potential evapotranspiration is equal to 0.86 times the Class A pan evaporation (Table VIII-8). lope of the elevation vs. annual pan evaporation/potential evapotranspiration relation is also almost equal in both of the cases (Table Vffl-8) Hence, Measured values of annual pan evaporation (Appendix F) is used for this term with application of a factor of 0.86 for the southern Himalayan region and 0.35 for the northern Himalayan region. Note that no attempt is made for accurate computation of evapotranspiration under unlimited water supply condition. Recorded evaporation data are used without altitudinal correction. Therefore, the computation in this exercise is more like evaporation index. Since only the ratios are used for hydrological impact assessment, we argue that the accuracy of these estimates cannot have a significant influence on results.
Evapotranspiration rate in Tibet = (4.2 + 6.7)*0.35*365/2 = 696 mm/yr Evapotranspiration rate in Nepal = (3.4 + 3.0 + 2.4)*0.86*365/3 = 921 mm/yr
Reproduced with permission of the copyright owner. Further reproduction prohibited without permission.

245
Average for the Kosi basin = (696 * 25447 + 921 * 28242)/53689 = 814 mm/yr
Substituting the values in Equation P -l:
For 100% forest, E = 814 + 0.66 *( 1270 *0.35 - 0.15 *814)= 1027 mm/yrFor 50% forest, E = 814 + 0.66 *0.50 (1270 *0.35 - 0.15 *814)= 920 mm/yrFor 25% forest, E = 814 + 0.66 * 0.25(1270 *0.35 - 0.15 *814)= 867 mm/yrFor 0% forest, E = 814
Present forest cover = 25%
If forest increased to 100% e, = 1027/867 = 1.18If forest increased to 50% e, = 920 / 867 = 1.06If forest remained same e, = 1If forest decreased to 0% e, = 814/867 = 0.94
(2) Evaootranspiration change due to change in temperature
From Table VI- 5
T = 26.7 - 0.0059 * ELV E = (1544 -0.28* ELV)* 0.86
where ELV is the elevation in Km.
Combining Equation (P-3) with Equation (P-4)
E = [1544 - 0.22 * £ 6 - ~ f t ]*0.86 0.0059
For present sea level temperature of 26.7 C, E = 1328 mm/yr l°c temperature rise, E = 1359 mm/yr 2°c temperature rise, E = 1392 mm/yr 3° c temperature rise, E = 1424 mm/yr 4° c temperature rise, E = 1456 mm/yr 5°c temperature rise, E = 1488 mm/yr
For rise of l°c, % = 1359/ 1328 = 1.02For rise of 2° c, e2 = 1392/1328 = 1.05For rise of 3° c, e2 = 1424/1328 = 1.07For rise of 4°c, e2 = 1456/ 1328 = 1,10Forriseof 5°c, e2 = 1488/ 1328 = 1.12
(P-3)(P-4)
(P-5)
Reproduced with permission of the copyright owner. Further reproduction prohibited without permission.

246
31 Evapotranspiration change due to co, change (e.,)
e5 = 1-0.3 d,
where d is the fraction of forest which is 1.0 for the 100% forest (Wigley and Jones, 1985).
For 100% forest cover, e3 = 1- 0.3 x 1 = 0.70For 50% forest cover, e3 = 1- 0.3 x 0.5 = 0.85For 25% forest cover, e3 = 1- 0.3 x 0.25 = 0.925For 0% forest cover, e3 = 1- 0.3 x 0= 1
Reproduced with permission of the copyright owner. Further reproduction prohibited without permission.

247
APPENDIX Q
OUTLINE: PROPOSED HIMALAYAN BENCH-MARK BASIN
Proposed Basin: Tamor River Basin
Primary Objective:Develop benchmark stations for long term monitoring of hydrological and meteorological variables for assesing climatic changes
Secondary Objective:1) Basin-scale studies of hydrological processes and their
link to ecological and biogeochemical processes.2) Develop models and experimental stations for research
on hydrological processes and hydrological technologies
Features of the Basin:
Existing Facilities:
Research Strategy:
Basin Location:
Basin Characteristics:
Area = 6000 km2 Elevation = 150 m to 8598 m Average Annual Discharge = 323 m3/s Estimated Sediment Yield = 7100 tons/km2
Precipitation Network =16 stations = 375 km2 per station Climatological Network = 5 stations = 1200 km2 per station Synoptic Station = 1 station = 1 station per 6000 km2 Primary Streamflow Gauging Station = 1 Secondary Streamflow Gauging Station = 1
See Chapter XIII
See Figure IV-2
See Chapter II, Chapter XI
Reproduced with permission of the copyright owner. Further reproduction prohibited without permission.
Related Documents


