IMPACT OF KARASEK JOB DEMAND CONTROL MODEL ON THE JOB SATISFACTION OF THE EMPLOYEES OF NADRA Nehal hussain Muhammad Ali Jinnah University Islamabad Pakistan E-mail: [email protected] Tel: +92-333-5711764 Kanwal Khalid Muhammad Ali Jinnah University Islamabad Pakistan E-mail: [email protected] 1

IMPACT OF KARASEK JOB DEMAND CONTROL MODEL ON THE JOB SATISFACTION OF THE EMPLOYEES OF NADRA
Jan 13, 2015
Welcome message from author
This document is posted to help you gain knowledge. Please leave a comment to let me know what you think about it! Share it to your friends and learn new things together.
Transcript
IMPACT OF KARASEK JOB DEMAND CONTROL MODEL ON THE JOB SATISFACTION OF THE EMPLOYEES OF NADRA
Nehal hussain Muhammad Ali Jinnah University Islamabad Pakistan
E-mail: [email protected]: +92-333-5711764
Kanwal Khalid Muhammad Ali Jinnah University Islamabad Pakistan
E-mail: [email protected]
1
ABSTRACT
In this study, Karasek JDC model has been applied to check the impact in the employees of NADRA. As NADRA is one of the organizations that is running successfully in this era of recession, the study focused on the factors of the employee Job Satisfaction. Questionnaire has been used as the data collecting instrument. The sample of 200 employees was given the questionnaire which was divided into four sub-groups: Job-Demand, Job-Control, Social-Support and Job Dissatisfaction. Job Demand was calculated on Qualitative Demand, Employee Demand, Workload Demand and Conflict Demand. Similarly, Job Control was measured through Qualitative Control, Employee Control, Workload Control and Conflict Control. Linear Regression and Correlation was the statistical tolls that measured the data by using SPSS and MS Excel. According to the results, low demand, low control and low social support are the factors for Job satisfaction among the employees of NADRA The unusual response from the study may be a platform for future research to be carried out in this respect.
Key Words: Job-Demand, Job-Control, Social-Support, Job Dissatisfaction Linear Regression and Correlation
1. INTRODUCTION:
The ultimate end of education is happiness or a good human life, a life enriched by the possession of every kind of good, by the enjoyment of every type of satisfaction. The relation between life satisfaction and job satisfaction was firstly searched by Wilensky at 1960's. Satisfaction in one domain of individual's life extends into other areas. The relationship between job satisfaction and performance has so many issues. This is a long debate whether good performance of the employee leads to employee’s job satisfaction or job satisfaction leads to employee’s good performance. But the end result is employee’s good performance leads to good organizational productivity.
The term Job Satisfaction means satisfaction of the employee from the product of different aspects affecting the job. The organization is consists of the number of employees. It is the organization’s duty to provide facilities and benefits to employees so that their employees become Satisfy from the job. Job satisfaction of the employee helps the organization to perform well, because the happy and satisfy employee work better than the depressed and dissatisfied employee. It is believed and proved through various researches that the productivity of an organization is directly associated with the satisfied employees. If the employees of the organization are satisfied from their jobs, they will have positive feelings for the organization and they will perform well. If the employee is dissatisfied from the job, it leads to the stress.
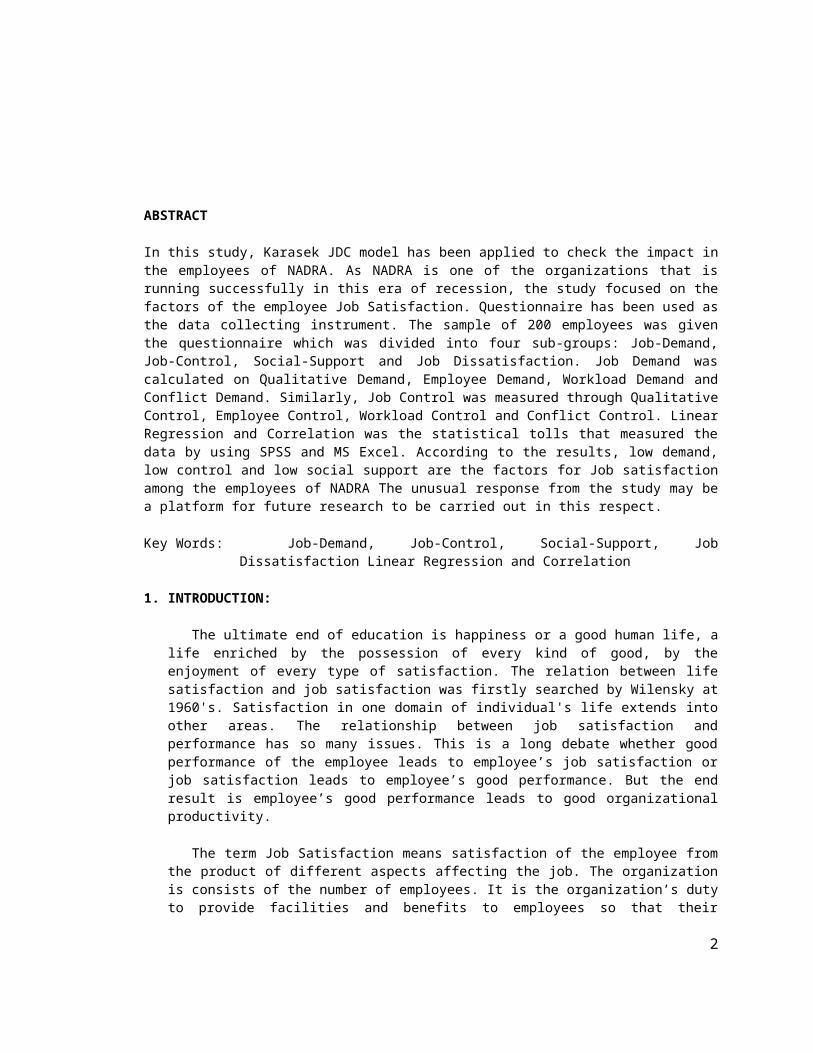
Among the numerous problems employees face due to job stress, the most significant one relate to job dissatisfaction and low (marginal) job performance. Karasek worked on a model and gave three dimensions of job satisfaction. Job demands that leads to stressors, job control and social support. Job stress is the state of mind that impede anyone's routine activities and situation appears threatening due to factors like Job pressure, Job Control, Conflict at work, Employment opportunity and Company environment. The relationship between job stress and employee productivity is of inverted U shape. It shows that initially increase in job stress positively affects the employee's productivity but later on, higher levels of job stress or even lower stress levels prevailing for longer time frames decreases the productivity of employees.
2
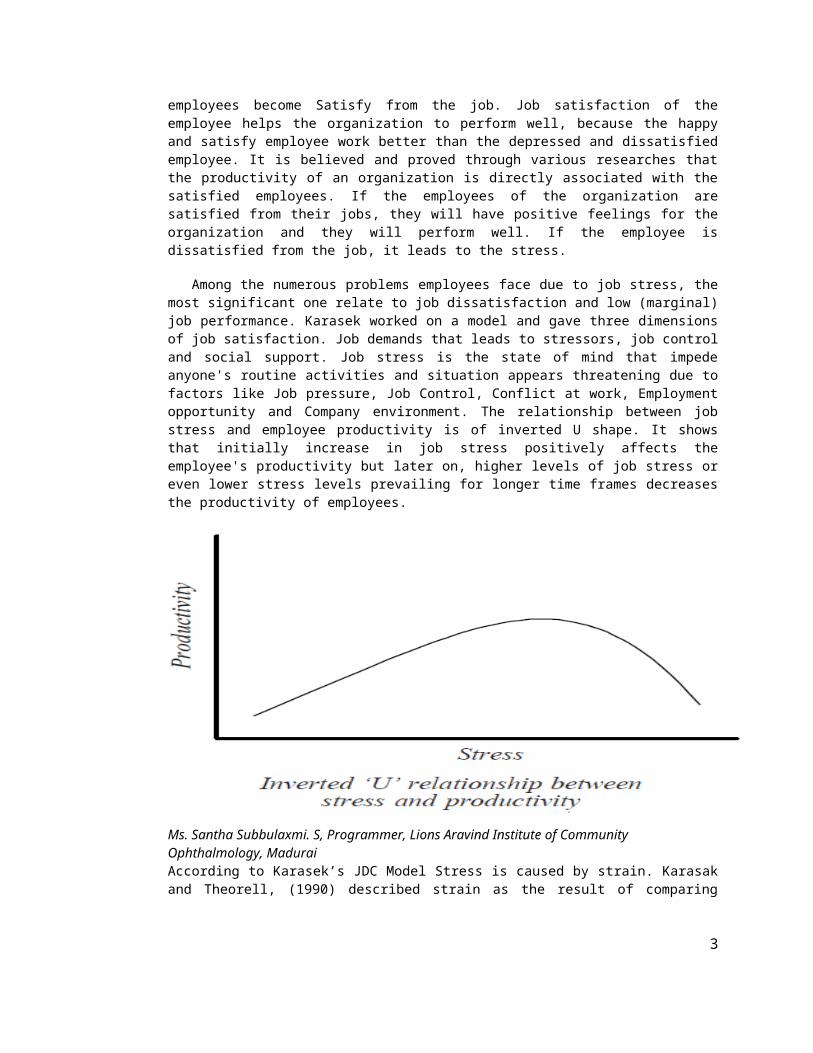
Ms. Santha Subbulaxmi. S, Programmer, Lions Aravind Institute of Community Ophthalmology, MaduraiAccording to Karasek’s JDC Model Stress is caused by strain. Karasak and Theorell, (1990) described strain as the result of comparing demands that the job has on the employee to the control the employee has over the job. Plotted on a Matrix, the job types are 4.
The ‘high-strain jobs’ result in the highest job performance. Karasak’s demand/ control model of determining stress is highly credible, but it lacks certain variables; which gave evolved over time, as he did his initial work in late 1960’s. Since then, many factors have been added to the work environment such as improving quality and productivity, improving people’s skills, managing workforce diversity, responding to Globalization, empowering people, stimulating innovation and change, dealing with “Temporariness”, decreasing employee loyalty and improving ethical behaviour etc.
3
This research is undertaken to study the impact of Karasek model of Job Demand-Control on the Job Satisfaction of the employees of NADRA.
1.1 OPERATIONAL DEFINITIONS
1.1.1 Job SatisfactionDifferent authors gave various definitions of job satisfaction. Some of them are taken from the
book of D.M. Pestonjee “Motivation and Job Satisfaction” which are given below:According to Weiss, Job satisfaction is defined as a pleasurable, emotional, state resulting from appraisal of one’s job. An effective reaction to one’s job.Blum and Naylor also defined Job satisfaction as general attitude, which is the result of many specific attitudes in three areas namely:
Specific job factors Individual characteristics Group relationship outside the job
According to Glimmer, Job satisfaction is defined, as it is result of various attitudes the person hold towards the job, towards the related factors and towards the life in general. Job satisfaction is defined as “any contribution, psychological, physical, and environmental circumstances that cause a person truthfully say, ‘I am satisfied with my job.”Locke defined Job satisfaction as a pleasurable or positive state of mind resulting from appraisal of one’s job or job experiences.
1.1.2 Job demandKarasek, notified job demands as a division of all potential work stressors, particularly
“psychological stressors involved in accomplishing the work load, stressors related to unexpected tasks and stressors of job-related personal conflict”. Furthermore, job demands refer to the amount of workload or responsibilities or perquisites placed on an individual to work under these.
1.1.3 Job ControlBasically, job control refers to the extent to which an individual has a capability to exercise
authority over one or all potential and actual stressors of job. Job control and how individual or group of workers are completing are another factors closely associated to the development of stress (Kompier & Levi, 1993). Job control includes the worker’s abilities and skills for coping with demands and the latitude to decide how a specific task should be accomplished.
1.1.4 Social SupportJob support, the last measurement of the Karasek’s (1979) model, looks at the level and nature of backing
given by the management or the supervisors or colleagues or subordinates to the employee.
1.2 Models of job satisfaction
1.2.1 Affect TheoryThe most famous job satisfaction model is given by Edwin A. Locke which is known as Affect
theory. The main point of this model is determined by what you expect from the job and what you are getting from the job. This theory also states the factors affecting the work and the level of satisfaction or dissatisfaction about the particular factor. Further, the theory states that how much one values a given facet of work (e.g. the degree of autonomy in a position) moderates how satisfied/dissatisfied one becomes when expectations are/aren’t met. When a person values a particular facet of a job, his satisfaction is more greatly impacted both positively (when expectations are met) and negatively (when expectations are not met), compared to one who doesn’t value that facet. To illustrate, if Employee A values autonomy in the workplace and Employee B is indifferent about autonomy, then Employee A would be more satisfied in a position that offers a high degree of autonomy and less satisfied in a
4
position with little or no autonomy compared to Employee B. This theory also states that too much of a particular facet will produce stronger feelings of dissatisfaction the more a worker values that facet.
1.2.2 Dispositional TheoryAnother well-known job satisfaction theory is the Dispositional Theory Template: Jackson April
2007. It is a very general theory that suggests that people have inborn nature that source them to have trend toward a certain level of satisfaction, regardless of one’s job. This approach became a prominent explanation of job satisfaction in light of evidence that job satisfaction tends to be stable over time and across careers and jobs. Research also indicates that identical twins have similar levels of job satisfaction. A significant model that narrowed the scope of the Dispositional Theory was the Core Self-evaluations Model, proposed by Timothy A. Judge in 1998. Judge argued that there are four Core Self-evaluations that determine one’s disposition towards job satisfaction: self-esteem, general self-efficacy, locus of control, and neuroticism. This model states that higher levels of self-esteem (the value one places on his/her self) and general self-efficacy (the belief in one’s own competence) lead to higher work satisfaction. Having an internal locus of control (believing one has control over her\his own life, as opposed to outside forces having control) leads to higher job satisfaction. Finally, lower levels of neuroticism lead to higher job satisfaction.
1.2.3 Two-Factor Theory (Motivator-Hygiene Theory)Frederick Herzberg’s Two factor theory (also known as Motivator Hygiene Theory) attempts to
explain satisfaction and motivation in the workplace. This theory states that satisfaction and dissatisfaction are driven by different factors – motivation and hygiene factors, respectively. An employee’s motivation to work is continually related to job satisfaction of a subordinate. Motivation can be seen as an inner force that drives individuals to attain personal and organizational goals (Hoskinson, Porter, & Wrench, p.133). Motivating factors are those aspects of the job that make people want to perform, and provide people with satisfaction, for example achievement in work, recognition, promotion opportunities. These motivating factors are considered to be intrinsic to the job, or the work carried out. Hygiene factors include aspects of the working environment such as pay, company policies, supervisory practices, and other working conditions. While Hertzberg's model has stimulated much research, researchers have been unable to reliably empirically prove the model, with Hackman & Oldham suggesting that Hertzberg's original formulation of the model may have been a methodological artifact. Furthermore, the theory does not consider individual differences, conversely predicting all employees will react in an identical manner to changes in motivating/hygiene factors. Finally, the model has been criticized in that it does not specify how motivating/hygiene factors are to be measured.
1.2.4 Job Characteristics ModelHackman & Oldham proposed the Job Characteristics Model, which is widely used as a
framework to study how particular job characteristics impact on job outcomes, including job satisfaction. The model states that there are five core job characteristics (skill variety, task identity, task significance, autonomy, and feedback) which impact three critical psychological states (experienced meaningfulness, experienced responsibility for outcomes, and knowledge of the actual results), in turn influencing work outcomes (job satisfaction, absenteeism, work motivation, etc.). The five core job characteristics can be combined to form a motivating potential score (MPS) for a job, which can be used as an index of how likely a job is to affect an employee's attitudes and behaviors. A meta-analysis of studies that assess the framework of the model provides some support for the validity of the JCM.
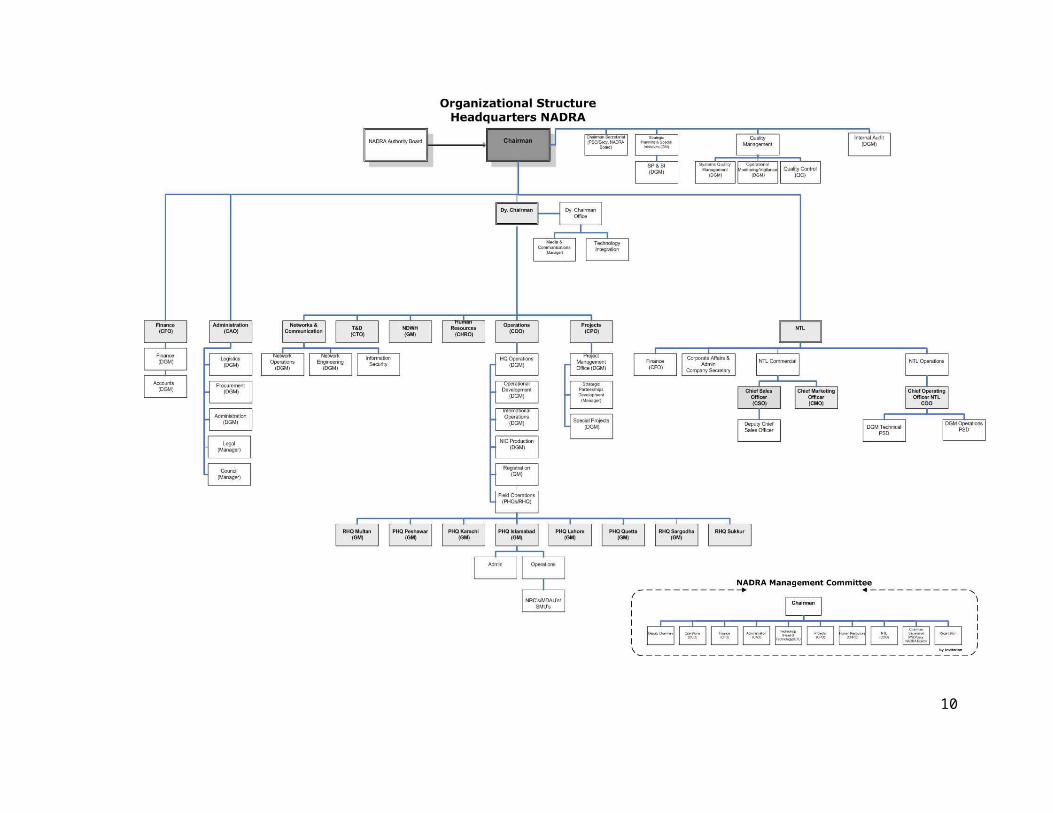
1.3 Our Organization:NADRA is one of the largest organizations in the country. NADRA is an organization working for the issuance of NIC to the citizens of Pakistan. NADRA employs a highly skilled workforce of more than
5
11,000 technical and management personnel having more than 400 domestic offices and five international offices.
National Database & Registration Authority (NADRA) has gained international recognition for its success in providing solutions for identification, e-governance and secure documents that deliver multi-pronged goals of mitigating identity theft, safe-guarding the interests of our clients, and facilitating the public. In-depth Research and Development efforts have enabled NADRA to become the trailblazer in the area of Software Integration, Data Warehousing, Network Infrastructure Development and Project Management.
6
1.3.1 Organizational Chart
7

1.3.2 Achievements: NADRA has been placed amongst the Top 50 e-Passport Technology Suppliers for 5 consecutive years
in ID World Magazine, for 2005, 2006, 2007, 2008 and 2009 published by Wise Media, Italy. NADRA is amongst the 3 companies selected from Asia and Africa on the list. NADRA was honored with the “Outstanding Achievement Award” at CARDEX Middle East in Cairo, Egypt in May, 2007.
NADRA has been awarded The Merit Exporter Award by Federation of Pakistan Chambers of Commerce & Industry (FPCCI) in 2006 for achieving export of homeland security solutions in the international market.
NADRA’s Chief Technology Officer was awarded the “ID Talent Award” in November, 2007 at the ID World International Congress held in Milan, Italy. He was recently awarded Tamgah-e-Imtiaz in 2009 for his services rendered to the state.
Deputy Chairman NADRA was awarded ID Outstanding Achievement Award on November 3, 2009 in Milan at an exclusive ceremony during the eighths ID WORLD International Congress, the Global Summit on Automatic Identification.
The objective behind selecting this organization was, in 2011 most of the organizations are not performing well due to certain reasons including political influences and worldwide recession. But NADRA was one of the organizations who have maintained their position which showed the good performance of their employees.
1.4 Statement of the Problem
It was commonly believed that in Pakistan most of the organizations were not performing well due to certain reasons including political influences and worldwide recession. But NADRA was one of the organizations which had maintained its position.
After exploring the above mentioned problem through interviews, literature review of NADRA and pilot study the researcher intends:
To investigate the impact of Karasek’s Job Demand-Control Model on Job Satisfaction among the employees of NADRA.
In the current study, a number of variables were critical that have been taken into account in the study. These comprised Job Demand, Job Control and Social & Colleague Support.
1.5 Objective of the study1. To study the impact of Karasek JDC model on Job satisfaction of the employees of NADRA.2. To explore the factors of Job satisfaction3. To find out the relationship between job demand and job satisfaction4. To examine the impact of job control on job satisfaction5. To determine whether job control and social support moderate the relationship between job
demands and job dissatisfaction
1.6 Significance of the study
Job satisfaction is frequently studied concept in the disciplines of management sciences, psychology, sociology and economics. This is mainly due to the fact that job satisfaction leads to influence the performance of the organization. No doubt, this is much debated issue but researchers have related it to current liquidity crunch in financial sector. The Economic slump has created high uncertainty among the people especially employees. This study was crucial to scrutinize the relation of job satisfaction with respect to the demand and control over the job.
The results of the study facilitate supervisor to analyze possible reasons for change in employee productivity. It further helped them to improve work environment conditions, create a better job
8
description, create innovative ways of assigning tasks to employees, and manage a flexible work environment to facilitate employees to create a balance between personal and professional life. The study further help managers to better match the task demands to the employees' capabilities and work load.
The study also helps future researchers to suggest and further develop mechanisms and tools to help managers cope with the issue of declining employee productivity. The study can also help future researchers to undertake a comparative study and analyze the role of these variables and their relation with respect to the future better economic conditions of the market. Most importantly this study gave guidelines to NADRA, and other organizations similar to NADRA, how to enhance the productivity of the organization by improving the work environment and gives proper support in respect of mentor and sub ordinate and peer to peer.
1.7 Hypothesis
According to the objectives of our study researcher predicted the following six hypotheses: H1-Job Demands are positively associated with Job Dissatisfaction;
H2-Job Control is negatively associated with Job Dissatisfaction;H3-Social Support is negatively related to Job Dissatisfaction;
9
10
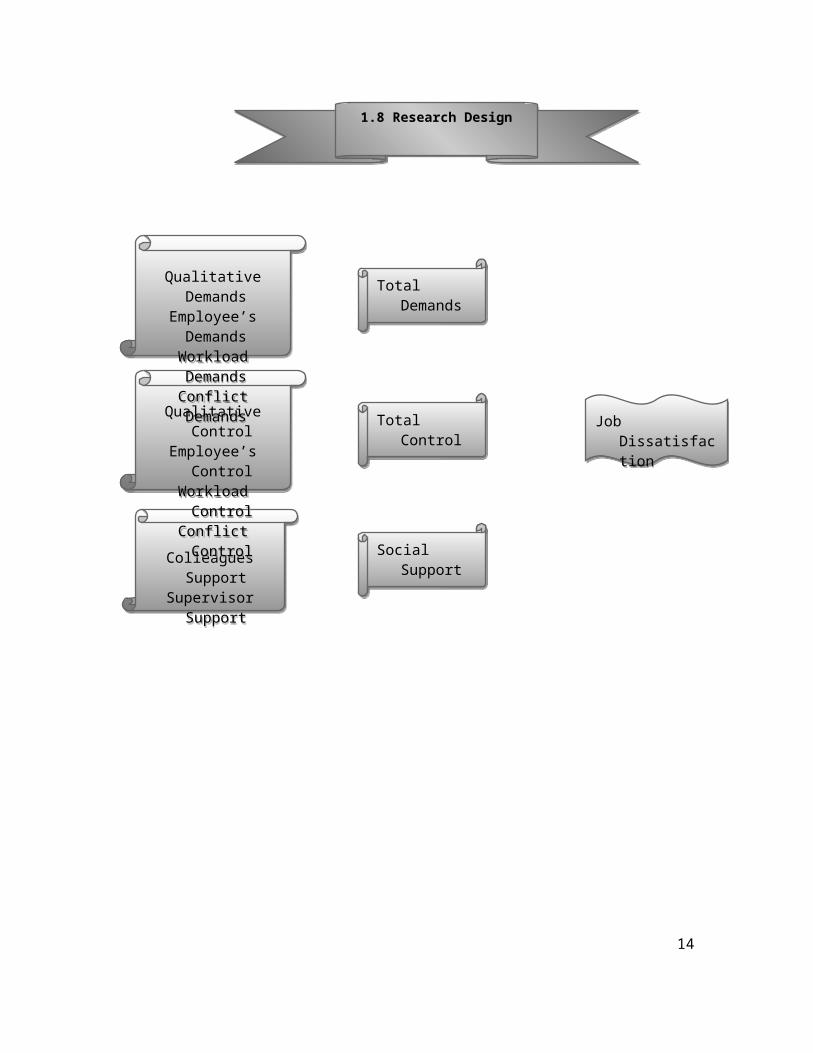
Colleagues SupportSupervisor SupportColleagues SupportSupervisor Support
Qualitative ControlEmployee’s ControlWorkload ControlConflict Control
Qualitative ControlEmployee’s ControlWorkload ControlConflict Control
Qualitative DemandsEmployee’s DemandsWorkload DemandsConflict Demands
Qualitative DemandsEmployee’s DemandsWorkload DemandsConflict Demands
1.8 Research Design1.8 Research Design
Total DemandsTotal Demands
Total ControlTotal Control
Social SupportSocial Support
Job DissatisfactionJob Dissatisfaction
2. LITERATURE REVIEW
2.1 Job satisfaction and Job Performance:
Karasek’s Job Demand-Control model has a vast literature to work on. In this research, the researcher tends to find out the influence of demand and control of job along with social support on job satisfaction which ultimately leads to life satisfaction. The relation between life satisfaction and job satisfaction was firstly searched by Wilensky at 1960's. (Dolan and Gosselin, 2000; Smulders, 1983, 285). Satisfaction in one domain of individual's life extends into other areas. (Loscocco and Roschelle, 1991; Elizur, 1991, 313; Iverson and Maguire, 2000; O'Driscoll, 1996, 281; Greenhaus and Beutell 1985, 76-88). The relationship between job satisfaction and performance has so many issues. This is a long debate whether good performance of the employee leads to employee’s job satisfaction or job satisfaction leads to employees’ good performance (Kadence Buchanan). But the end result is employee’s good performance leads to good organizational productivity.
Hawthorne studies have a strong connection between employee attitudes and performance. These studies (1924-1933), mainly recognized to Elton Mayo of the Harvard Business School, were introduced to find the relationship between different factors on the employee productivity. This connection was studied and seriously considered in 1930’s (Roethlisberger, 1941). According to Hawthorne study human relations movement deepens the interest in the relationship. After these studies Brayfield and Crockett (1955) has studied the same relationship between job satisfaction and job performance, and also these studies shows the relationship with other behavioral outcomes (accidents, absence and turnover).
2.2 Job Satisfaction:
Hoppock (1935) has coined a term job satisfaction by reviewing 35 studies on satisfaction. These studies were carried out to observe the job satisfaction which shows that job satisfaction is the mixture of different condition like environmental, mental and the functions of growth and development. But the nature of job cannot be measured through the number of different variables that directly effecting the satisfaction of the individual. This finding provided strong evidence that people work for purposes other than pay, which paved the way for researchers to investigate other factors in job satisfaction. Khan (2006) reveals in his study that Hoppock (1935) brought Job satisfaction to lime light. He observed job satisfaction in the combination of psychological and environmental circumstances that cause person to fully say, “I am satisfied with my job”.
In the field of job satisfaction, some studies suggest that employees are satisfied when they get good remuneration. This suggestion is very helpful for the organizations and they implement different wage payments system along with other incentives, allowances and non-monetary benefits (Aswathappa, 2003). According to him, he explained three theories of remuneration
1. Reinforcement and expectancy theory2. Equity theory3. Agency theory
When we talk about Job Satisfaction, it diverts the attention towards the organizational psychology because job satisfaction is the end result in most of the studies. This is one of the affective finding in anyone’s job.
2.3 Job Demand-Control model:
The Job Demands-Control model dates back to the late 1970’s, when Karasek a North America scholar with a background in industrial sociology (1979), presented a job strain model according to which mental
11
stress and strain result from the interaction of job demands and job control. This model predicts that mental strain and job dissatisfaction are the combination of high job demands with low job control. Therefore, four types of jobs predicts through this model which might result from different combinations of job demands and job control: passive jobs (low demands and low job control), low strain jobs (low demands and high job control), high strain jobs (high job demands and low job control), and active jobs (both high demands and high job control).
Job Demand Control (JDC) model was given by a scholar of industrial sociology named Karasek in 1979. This model is mainly focused on the stress that employees face in their occupation. Stress is one of the most serious work hazards of the Present times (Darley & Parfitt, 1996; Jamal 7 Baba 1992). The effect of work-related stress on employees is severe with 50-80% of all diseases having a stress related nature (Dotard & Wine field, 1996; Jamal & Badawi, 1993). Among the numerous problems employees face due to job stress, the most significant ones relate to job dissatisfaction, burn out, high absenteeism, high turnover, low organizational commitment, and low (marginal) job performance (Jamal 1984; Jamal 1985; Jamal and Baba 1997; Jamal Badawi 1995; Westman & Eden 1996). Matterson and Ivancevich (1987) estimated that stress cause 50% of absenteeism, 40% of turnover and 5% of total lost productivity due to preventable job stress.
Organizations have begun to realize that the job stress of their employees is costing the organization. This realization has fueled research into the cause and effects of stress. Stress is caused by strain (Karasak 1990). Karasak and Theorell, (1990) described strain as the result of comparing demands that the job has on the employee to the control the employee has over the job. Plotted on a Matrix, the job types are 4. (Lu 1999)
The ‘high-strain jobs’ result in the highest job result (Karasak & Theorell, 1990). Karasak’s demand/ control model of determining stress is highly credible, but it lacks certain variables; which gave evolved over time. (Lu 1999) Karasak did his initial work in late 1960’s. Since then, many factors have been added to the work environment such as improving quality and productivity, improving people’s skills, managing workforce diversity, responding to Globalization, empowering people, stimulating innovation and change, dealing with “Temporariness”, decreasing employee loyalty and improving ethical behavior etc. (Edwards 1979; Robbins 1993). Karasek et al.’s (1982) has worked on to investigate the connection among job demands, job control and support. Therefore, this research and several more recent studies adopting a similar approach (Carrere et al., 1991; Kawakami et al., 1997; Unden, 1996). Strong support comes from just two studies (Landsbergis et al., 1992; Parkes et al., 1994), with diverse findings in two others.
Job stress can be viewed as an individual’s reaction to work environment characteristics that approach threatening. It generally indicates a poor fit between the individual and work abilities and work environment. (Jamal, 1999)
Another model of understanding job stress is the P-E fit model given by Caplan, Cobb, French, Harrison, & Pinneau, 1982 and Jamal and Ahmad, 1985. This model describes that stress results from a poor fit between an individual’s abilities and the work environment. Either the environment may make regular, excessive demands on the individual or the individual’s abilities may fall short of the environment’s requirements. The types of stress identified are 1) Chronic Stress and 2) Acute Stress. Dwyer and Ganster (1991) made difference between psychological demands of job (e.g., vigilance and precision requirements) and physical demands of job (e.g., muscular exertion, exposure to job hazards), in the areas of manufacturing organizations.
2.4 Job Demand-Control-Support Model:
The model which has three variables is known as three-way interactive model. It is evolved from two way interaction of demand control then social support was added to make it three-way interaction model. Mainly, the model showed the fair effects of control on the demand-strain relationship will be found
12

only when support is high. When we talk about three-way interaction model, researchers have found that the addition of support is an important expansion of two-way model (Johnson, and Hall, 1988; Winnubst, and Schabracq, 1996).
Johnson & Hall (1988) tells us that social support plays a vital role in the interaction between job demand and job control. Wong et al. (2007) mentioned that negative strain should be very low when job demands and role clarity is high because every employee knows what to and how to do the tasks which effects in strain which is negative in type. On the other hand when the employees don’t know how to do the task and they are expected to do all the tasks then it results in strain which is high in nature. So it can be derived that the link between role clarity and demand depends on condition where role clarity moderates the demand-strain relationship.
Karasek gave another form to his model by adding supervisory support where supervisory support has a influence on his or her well-being, then many researches have taken place to study the level of supervisory support within a group. Some studies show the relationship between supervisory support and occupational stress (Leather, Lawrence, and Dickson, 1998; Winnubst, and Schabracq, 1996), while Carl Andrew et al. (2000) gave the other approach. According to them high job demands and role clarity is effective in the case where employee is also the member of supportive leaders because the link with support is more significant than the interactive effect of job control. Johnson and Hall (1988) found that there is lack of social support that can beat the buffering effects of job control.
Karasek’s model basically found the relationship between job demand and job control on strain. Bradley (2004) attempted to produce findings from the studies published between 1979 and 2003 and he identified that many studies supported that job control buffers the job demands-strain relationship. The test which he used to validate his studies is ANOVA.
This is for sure that the interaction between job demands and job control leaves a physiological, affective and behavioral strain. Van der Doef and Maes (1999) found that the outcome of the “job control buffering” was physiological well-being, job satisfaction or job related well-being. Social support did not fluctuate significantly by sample characteristics in many studies (de Jonge, Dollard, Dormann, & Houtman, 2000).
Vermeulen and Mustard (2000) interviewed thousands of workers regarding effect of job factors on strain. The results were stronger for males. Warr (1990) and Wall et al. (1996) found the impact of job demands and job control on physiological features among different samples of 1000 workers. Warr suggested these interactions as non-significant whereas Wall et al., (1996) recommended them as significant. Strain hypothesis has been approved but not the buffer hypothesis (e.g. Pelfrene, Vlerick, Kittel, Mak, Kornitzer & de Backer, 2002; Rafferty, Friend & Landsbergis, 2001; Van der Doef et al., 2000; Verhoeven, Maes, Kraaij & Joekes, 2003).
De Jonge, Reuvers, et al. (2000) concluded on the factors that involved in the interaction of three variables among 1739 employees that absenteeism is not included in the combination with other skill related variables. De Jonge et al. (1996) observed that support, but not job control, predicted emotional exhaustion. Mitchell and some others studied the relationship of job demand and support and they found that the interaction is true for only some sort of stressors, types of support and strain outcomes. Some researcher Morrison et al. (2001) suggested that job satisfaction can be gained when they analyze the data individually exclusive of the work environment factor and they do not predict the general health scores.
Pomaki and Anagnostopoulou’s (2001) studies and prepared a report on Greek teachers and concluded that social support does not support the strain outcome measured and job control has no additional effect. Tetrick and La Rocco (1987) figured out that the relationship between role stressors and job satisfaction was moderated by job control, but job control did not moderate the relationship between stressors and psychological state of happiness. Chay (1993) studied JDC model and concluded that when
13
one of the two job factors was present, the other was unnecessary. Bromet et al. (1988) found that job demands and job control interacted to predict alcohol problems and physical symptoms. He used longitudinal data which he obtained from medical interviews. Buffering effects of social support on strain are measured by Repetti (1993) and he suggested that the effect is weak and unconvincing. Buunk and Peeters (1994) suggested that these effects are rarely found more than expected by chance. On the other hand to above views, Dollard and Winefield (1995) found that social support did not have a moderating effect upon general mental health status, whereas Greller et al. (1992) reported that this effect was significant in predicting psychosomatic complaints in police officers. The reason behind is that Dollard and Winefield job controlled for negative affectivity, whereas Greller at al. did not do so. Rau et al. (2001) found that the interaction of job control and colleague support predicted several measures of heart rate, but not of blood pressure.
LaRocco et al. (1980) found that role of social support is the outcome of relationship among demand and such signs of strain and it does not have any significant response on demand and satisfaction association. On the other hand, Beehr (1985) gave a line that different types of support have differential effects. Exclusively, active support have a reasonable effect upon strain by minimizing the harmful response of job stressors, whereas emotional support was thought to have two effects - it directly reduces strain as well as moderating the demand-strain linkage at workplace. These conflicting investigations are due to involvement of many numbers of variables. Some researchers (e.g., Daniels & Guppy, 1994; Fusilier, Ganster, & Mayes, 1987; Lefcourt et al., 1984; Rodriguez et al., 2001) said that the impact of social support is different for different measures if internal control. Social support is given on the basis of other variables as well. Cohen and Wills (1985) suggested that social support varies on the basis of person interaction within social group. Conversely, the moderating effect of social support is proposed to fulfill the requirements of stressed employees (Beehr et al., 2003, and Winnubst & Schabracq, 1996). The moderating impact of social support on stress is not direct. According to stress matching theory, there are some complications. To resolve this complex mechanism, Bradley, (2004) drawn a conclusion from the vast body of research.
2.5 JDC Model and Social Support
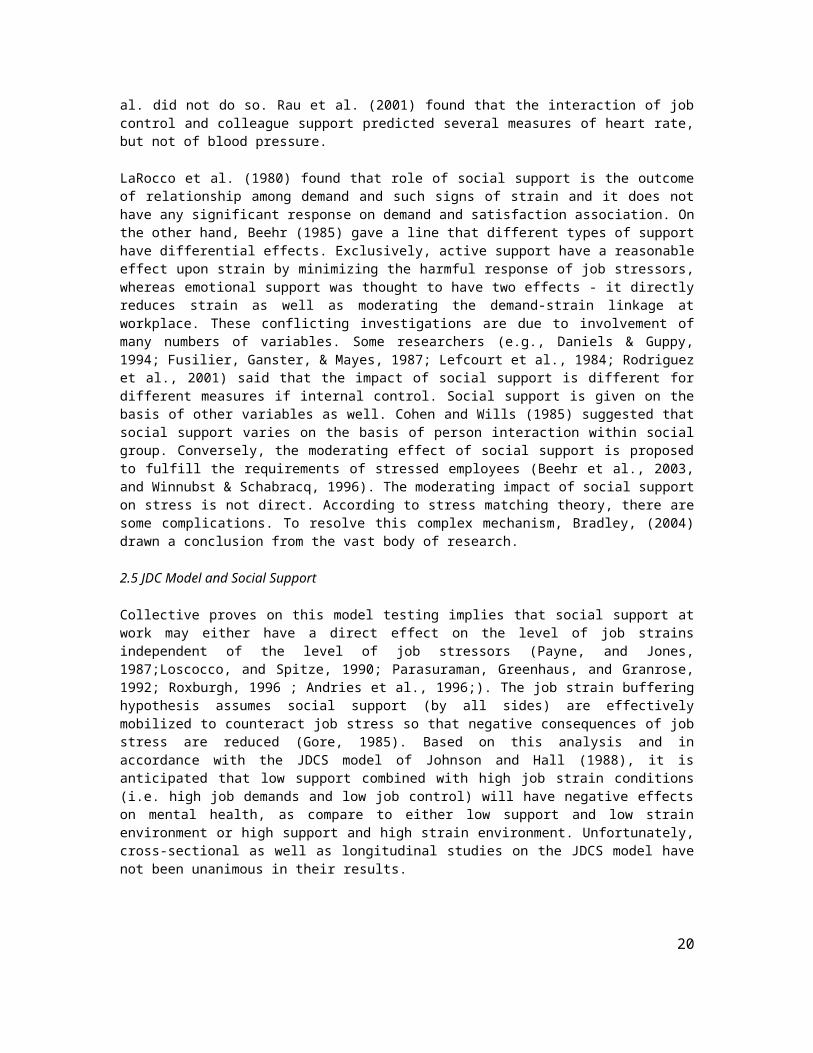
Collective proves on this model testing implies that social support at work may either have a direct effect on the level of job strains independent of the level of job stressors (Payne, and Jones, 1987;Loscocco, and Spitze, 1990; Parasuraman, Greenhaus, and Granrose, 1992; Roxburgh, 1996 ; Andries et al., 1996;). The job strain buffering hypothesis assumes social support (by all sides) are effectively mobilized to counteract job stress so that negative consequences of job stress are reduced (Gore, 1985). Based on this analysis and in accordance with the JDCS model of Johnson and Hall (1988), it is anticipated that low support combined with high job strain conditions (i.e. high job demands and low job control) will have negative effects on mental health, as compare to either low support and low strain environment or high support and high strain environment. Unfortunately, cross-sectional as well as longitudinal studies on the JDCS model have not been unanimous in their results.
14
Researches on the Karasek’s original JDC model, predicted results are obtained particularly with cardiovascular disease (Johnson, 1986; Astrand, Hanson, and Isacson, 1989; Johnson, and Hall, 1988; Johnson et al., 1989), whereas for somatic complaints and psychological strain, results are contradictory. Andries et al. (1996) claimed to support the JDCS model, they merely compared different combinations of the three variables and did not specifically test the 3-way multiplicative interaction relationship. Nevertheless, the stress moderating role of social support at workplace was not found in other studies (Melamed et al, 1991; Fahtera et al., 1996). On the other side of picture the results of the study by Parkes et al. (1994) were mixed; the models `worked’ for somatic symptoms but not for job satisfaction or improve productivity.
Landsbergis et al. (1992) established a important interaction between job demands, job control and social support but did not reproduce the expected stress moderating effect of social support. The results of their study showed that in active jobs that are characterized by high job demands and high job control, poor social support was related to job dissatisfaction. Similar results were found by Schaubroeck, and Fink (1998), who suggested that workers facing high demanding job situations coupled with high job control and low support, or low job control and high support will tend to experience difficulties in coping because one key ingredient for successful coping is required the equality of job control and social support.
3. METHODOLOGIES
3.1 Population
For the purpose of the research, all the employees of NADRA Head quarters, Islamabad, Pakistan were considered as population. NADRA employs a highly skilled workforce of more than 11,000 technical and management personnel.
3.2 Sample
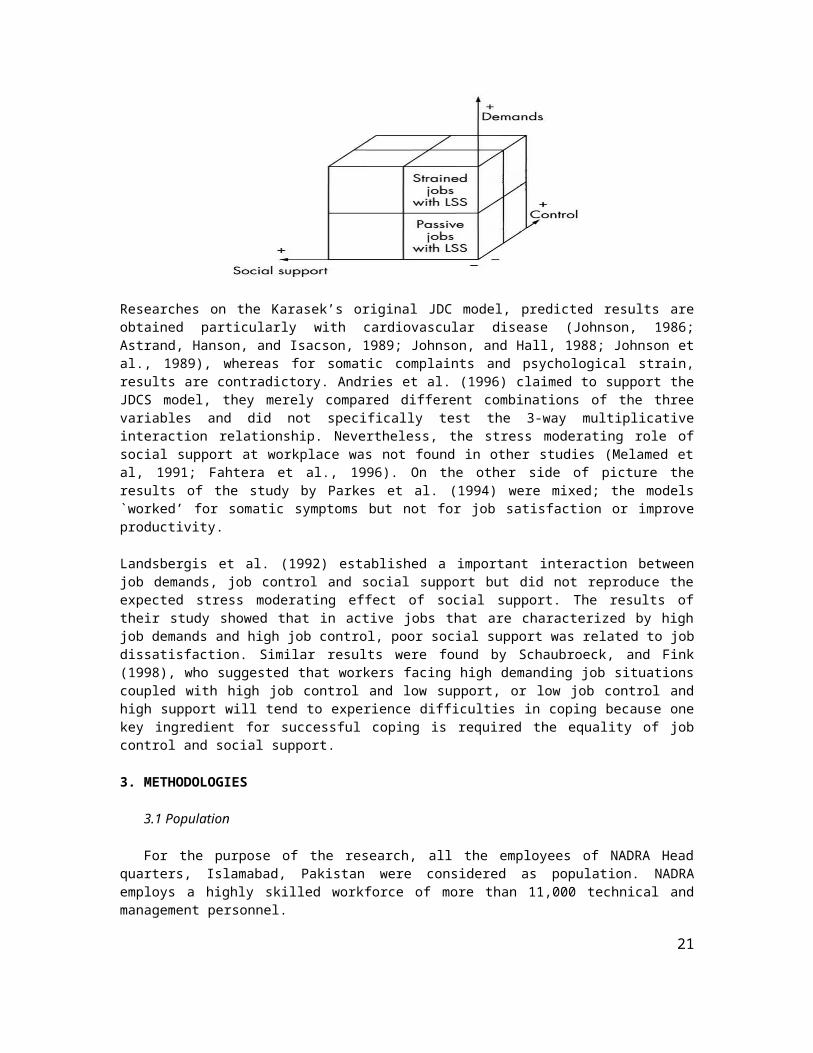
In order to carry out the research, a sample of 200 employees was chosen from NADRA. Questionnaires were personally distributed among them. 163 male and 37 female were included in the sample.
Distributed Complete ReceivedMale Female Total Male Female Total
09-11 55 7 62 12 5 1712-16 42 20 62 23 11 3417-20 66 10 76 50 5 55
163 37 200 85 21 106
3.3 Instrument:
Questionnaire has been used for the purpose of data collection by keeping following advantages in mind.
In Questionnaires the responses are gathered in a standardized way, that why questionnaires are more objective than interviews. Generally it is relatively quick to collect information using a questionnaire. However in some situations they can take a long time not only to design but also to apply and analyze.
15
Potentially information can be collected from a large portion of a group. This potential is not often realized, as returns from questionnaires are usually low. However return rates can be dramatically improved if the questionnaire is delivered and responded to in bounded time.
3.3.1 Designing Questionnaire:
In order to qualitatively analyze the relationship between the factors under study, researchers made the use of structured questionnaire, which comprised 51 questions. Further, the questionnaire was divided into 5 parts according to the variables. For the first variable, Job Demand, 16 questions were asked based on the 5 point likert scale ranging from 1= “Completely False” to 5= “Strongly True”. Same number of questions were asked for the Job Control variable by using 5 point liker scale ranging from 1= “Virtually No Control” to 5= “Complete Control”. Then 11 questions were asked for the Job Dissatisfaction variable on the basis of 5 point likert scale ranging from 1= “Strongly Disagree” to 5= “Strongly Agree”. Then 8 questions were for Social Support. Same 5 point likert scale was used ranging from 1= “Not at All” to 5= “Very Much”. Questionnaire attached at Annex ‘A’.
3.3.2 Job Demand:
Job Demands (JD) refers to the amount of workload or responsibilities or perquisites placed on an individual to work under these. It was measured by taking Job Content Survey. The variable has four facets: Qualitative Demands, Employee Demands, Workload Demands and Conflict Demands. Job Demand was taken as first variable and it was grouped in first part namely “A”. It consisted of 16 questions measured on 5 point likert scale. Q1, Q7, Q11 and Q13 were asked for Qualitative Demands (QD). Q4, Q14, Q15 and Q16 were asked to measure Employee demands (ED). Furthermore; Q2, Q3, Q6 and Q12 were measured for Workload Demands (WD) and lastly, Q5, Q8, Q9 and Q10 were asked for Conflict Demands (CD).
3.3.3 Job Control:
Basically, Job Control (JC) refers to the extent to which an individual has a capability to exercise authority over one or all potential and actual stressors of job. It was second part in questionnaire represented by “B”. Researcher used Ganster’s (1989) validated measure of job control. Total 16 questions were asked on 5 point Likert scale. Job control was further divided into four main facets: Qualitative Control (QC), Employee Control (EC), Workload Control (WC) and Conflict Control (CC). QC was measured through Q1, Q7, Q11 and Q13 of part “B”. EC was measured through Q4, Q14, Q15 and Q16 of same part. Q2, Q3, Q6 and Q12 of part “B” were taken to measure WC and CC was measured through Q5, Q8, Q9 and Q10.
3.3.4 Job Dissatisfaction:
Employee’s job satisfaction was measured by a four-item scale from Caplan et al. (1975), with some minor changes in scale which ended up to 11 items. Each item was scored on a 5-point Likert scale. The particular part was represented by “C”. All 11 questions were based on Employee Job Dissatisfaction (JDis).
3.3.5 Social Support:
Job support (JS), the last measurement of the Karasek’s (1979) model, looks at the level and nature of backing given by the management or the supervisors or colleagues or subordinates to the employee. Social Support was measured using Bradley, (2004), Caplan, Cobb, French, Van Harrison, and Pinneau's (1975) Social Support Scale and revised social support scale. Because that measure includes two subscales: social support from supervisor (Part D) and social support from work colleagues (Part E). Both parts had 4 questions each based on 5 point Likert Scale.
16
3.4 Data Collection:
The number of male respondents was 85 while female respondents were 21 (Table 3.1). Thus, among the 200 questionnaires distributed, with one follow up, 106 completed questionnaires were returned, yielding a response rate of 53 %. Rest 94 questionnaires were either incomplete or they did not respond Those employees lied in the grade between BPS-09 to BPS 20. All other positions were excluded for the purpose of research, because the content of questionnaire was not easily understandable to all of the employees of NADRA. From BPS-09 to BPS-11, the researcher considers them low level employees. Middle level employees were from BPS-12 to BPS-16 while top level or officers were from BPS-17 to BPS-20.
The respondents who completed the questionnaires are 106. Among 106, 85 were male and 21 were female. From BPS-09 to BPS-11, 12 males responded and 5 females replied which means, total 17 employees responded from BPS-09 to BPS-11. From BPS-12 to BPS-16, 23 males responded and 11 females replied which means, total 34 employees responded from BPS-12 to BPS-16 and from last group which was BPS-17 to BPS-20, total 55 employees responded, among 55, 50 were male and 5 were females. The number of questionnaires returned incomplete or not replied was 96. 78 males and 16 females returned incomplete questionnaires.
The Non probabilistic sampling technique was used. And sample was selected based on convenient sampling. As the subject of the study were top, middle and low level employees, therefore, a sample of 200 employees was fairly justifiable as the sample had homogenous characteristics and that it was a true representative of the original population.
4. DATA ANALYSIS
Data analysis is a process of transforming the collected data into useful information. This is an important phase of research process. There are two types of data; one is qualitative and other is quantitative. It provides us to explore the data into textual, tabular and graphical form by using some statistical tools.
This research was based on qualitative data. For the purpose of this research study, the researcher had analyzed the data descriptively in which frequencies were shown for the independent variables i.e Job-Demand, Job-Control and Social-Support and dependant Variable which was Job-Dissatisfaction. These frequencies were shown in table 4.1, 4.2, 4.3 and 4.4 respectively. The graphical representation of these variables was shown in the form of bar charts.
For the purpose of analysis, SPSS-17 was used. Linear Regression and correlation were analyzed through this software. Some descriptive statistical tests and Correlation matrix were performed on MS Excel as well.
17
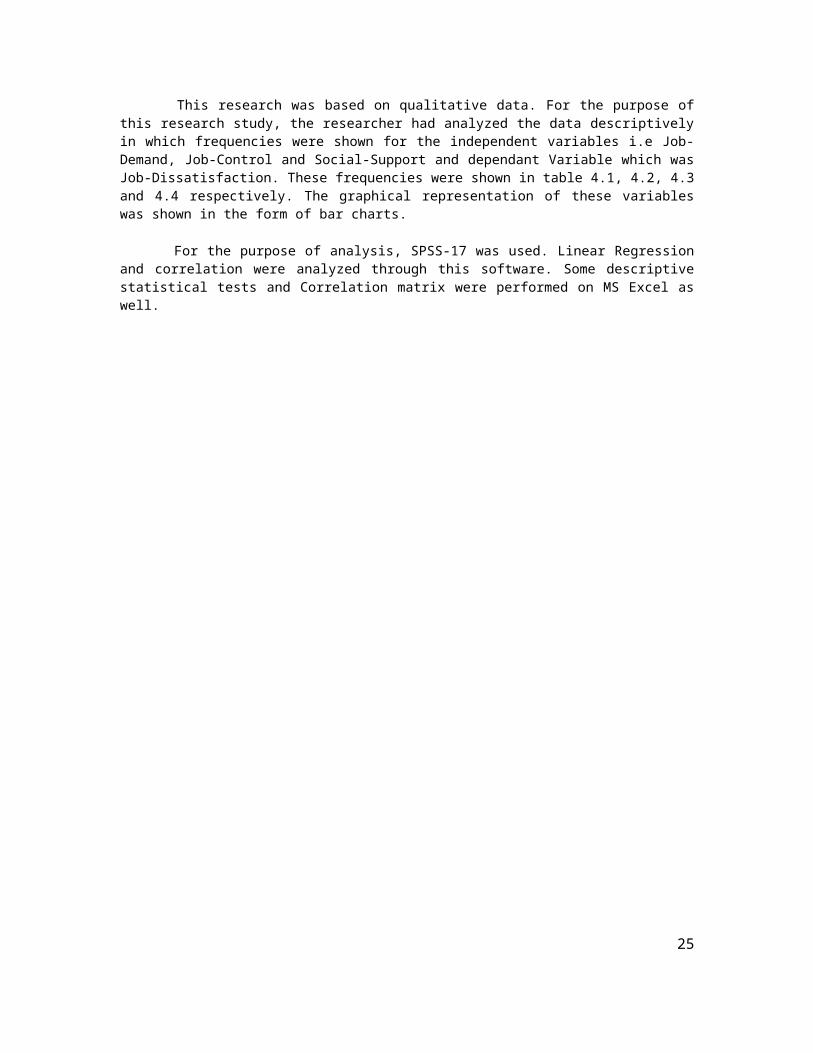
Frequency Distribution
Job-Demand
Frequency Percent Frequency Percent
1.81 1 .9 3.56 9 8.52.19 2 1.9 3.63 8 7.52.56 1 .9 3.69 8 7.52.94 4 3.8 3.75 8 7.53.00 3 2.8 3.81 3 2.83.06 1 .9 3.88 1 .93.13 5 4.7 3.94 3 2.83.19 7 6.6 4.00 2 1.93.25 3 2.8 4.13 1 .93.31 4 3.8 4.19 1 .93.38 17 16.0 4.38 2 1.93.44 10 9.4 4.94 1 .93.50 1 .9
Table 4.1 shows the frequency distribution for the independent variable Job-Demand
Fig 4.1 Bar Chart for table 4.1
4.94
4.38
4.19
4.13
4.00
3.94
3.88
3.81
3.75
3.69
3.63
3.56
3.50
3.44
3.38
3.31
3.25
3.19
3.13
3.06
3.00
2.94
2.56
2.19
1.81
15
10
5
0
JobDemand
18

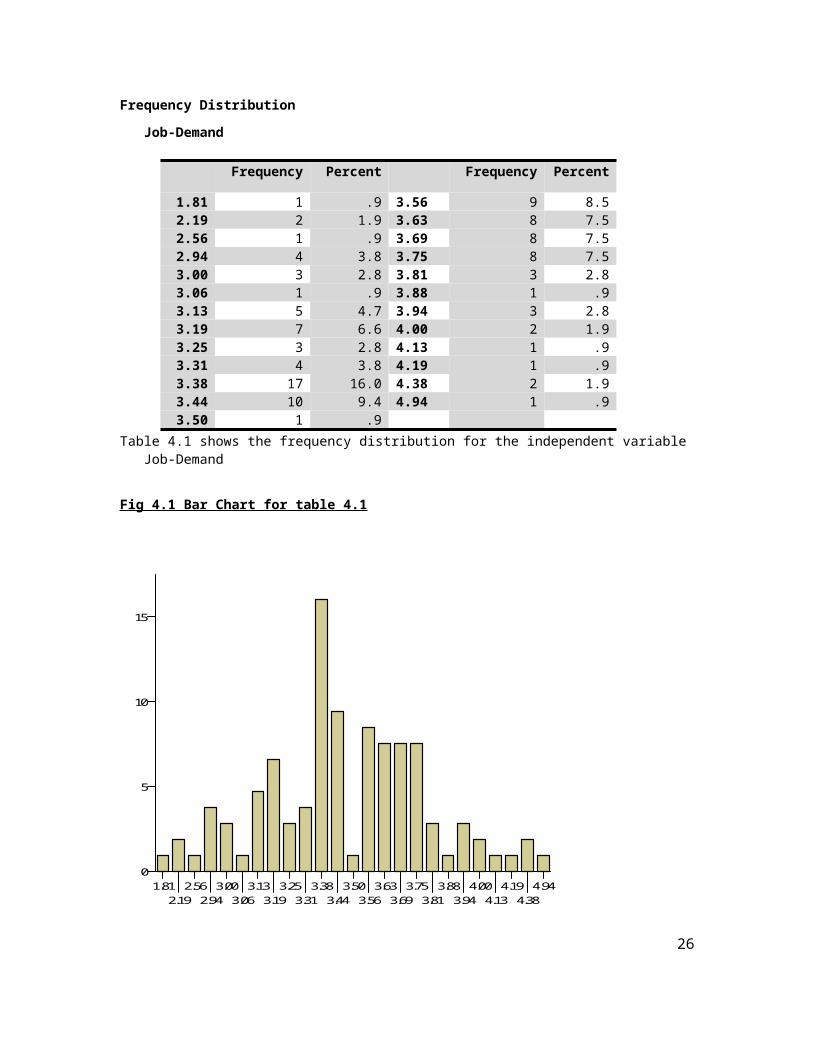
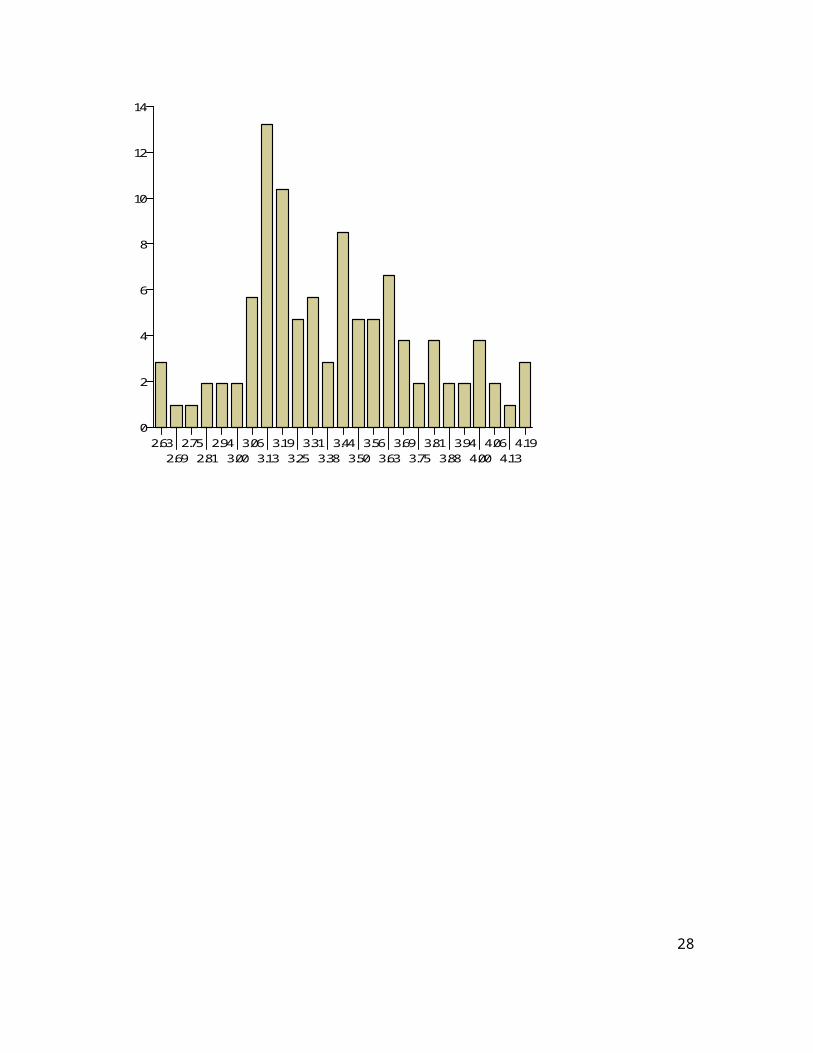
Frequency distribution:Job-Control
Frequency Percent Frequency Percent
2.63 3 2.8 3.50 5 4.72.69 1 .9 3.56 5 4.72.75 1 .9 3.63 7 6.62.81 2 1.9 3.69 4 3.82.94 2 1.9 3.75 2 1.93.00 2 1.9 3.81 4 3.83.06 6 5.7 3.88 2 1.93.13 14 13.2 3.94 2 1.93.19 11 10.4 4.00 4 3.83.25 5 4.7 4.06 2 1.93.31 6 5.7 4.13 1 .93.38 3 2.8 4.19 3 2.83.44 9 8.5
Table 4.2 shows the frequency distribution for the independent variable Job-Control
Fig 4.2 Bar-Chart for table 4.2
4.19
4.13
4.06
4.00
3.94
3.88
3.81
3.75
3.69
3.63
3.56
3.50
3.44
3.38
3.31
3.25
3.19
3.13
3.06
3.00
2.94
2.81
2.75
2.69
2.63
14
12
10
8
6
4
2
0
JobControl
19
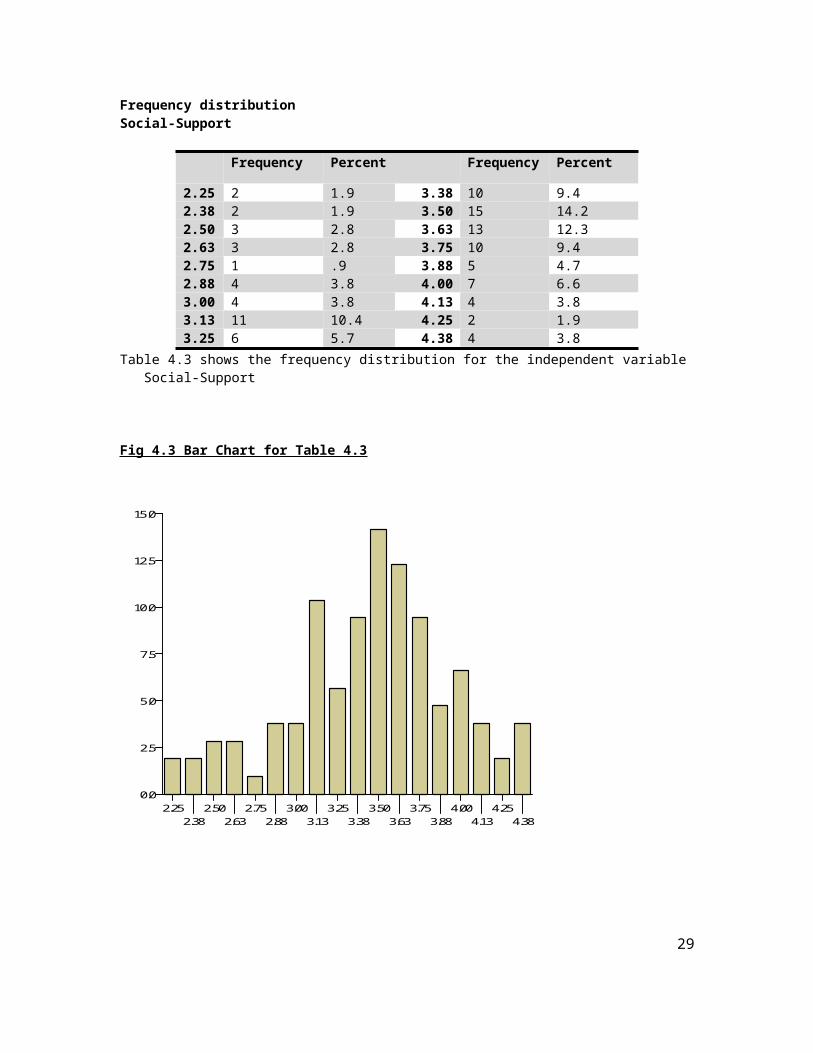
Frequency distributionSocial-Support
Frequency Percent Frequency Percent
2.25 2 1.9 3.38 10 9.42.38 2 1.9 3.50 15 14.22.50 3 2.8 3.63 13 12.32.63 3 2.8 3.75 10 9.42.75 1 .9 3.88 5 4.72.88 4 3.8 4.00 7 6.63.00 4 3.8 4.13 4 3.83.13 11 10.4 4.25 2 1.93.25 6 5.7 4.38 4 3.8
Table 4.3 shows the frequency distribution for the independent variable Social-Support
Fig 4.3 Bar Chart for Table 4.3
4.38
4.25
4.13
4.00
3.88
3.75
3.63
3.50
3.38
3.25
3.13
3.00
2.88
2.75
2.63
2.50
2.38
2.25
15.0
12.5
10.0
7.5
5.0
2.5
0.0
SocialSupport
20
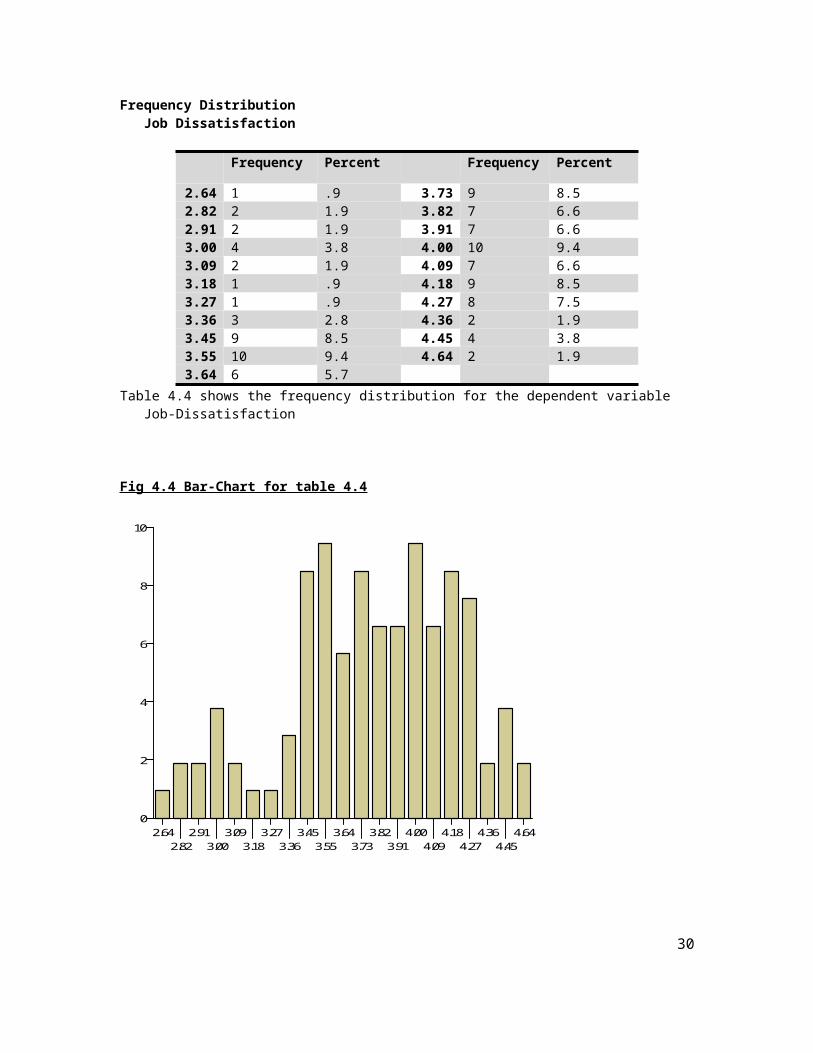
Frequency DistributionJob Dissatisfaction
Frequency Percent Frequency Percent
2.64 1 .9 3.73 9 8.52.82 2 1.9 3.82 7 6.62.91 2 1.9 3.91 7 6.63.00 4 3.8 4.00 10 9.43.09 2 1.9 4.09 7 6.63.18 1 .9 4.18 9 8.53.27 1 .9 4.27 8 7.53.36 3 2.8 4.36 2 1.93.45 9 8.5 4.45 4 3.83.55 10 9.4 4.64 2 1.93.64 6 5.7
Table 4.4 shows the frequency distribution for the dependent variable Job-Dissatisfaction
Fig 4.4 Bar-Chart for table 4.4
4.64
4.45
4.36
4.27
4.18
4.09
4.00
3.91
3.82
3.73
3.64
3.55
3.45
3.36
3.27
3.18
3.09
3.00
2.91
2.82
2.64
10
8
6
4
2
0
JDis
21
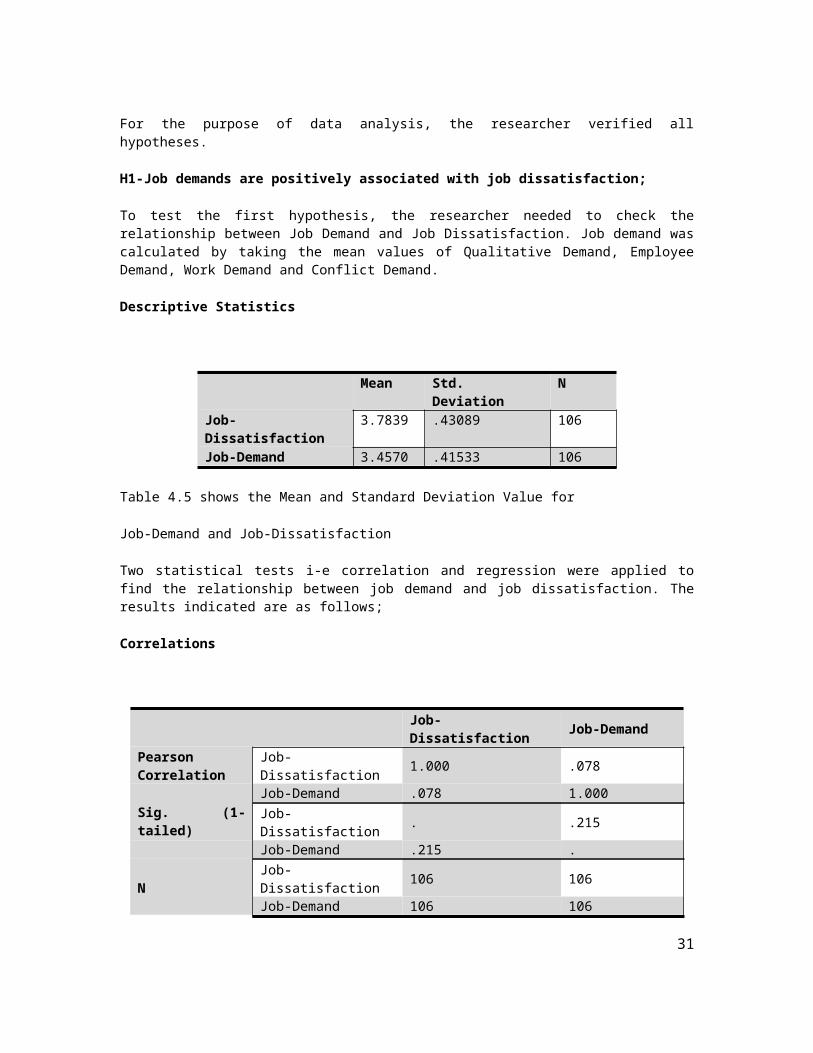
For the purpose of data analysis, the researcher verified all hypotheses.
H1-Job demands are positively associated with job dissatisfaction;
To test the first hypothesis, the researcher needed to check the relationship between Job Demand and Job Dissatisfaction. Job demand was calculated by taking the mean values of Qualitative Demand, Employee Demand, Work Demand and Conflict Demand.
Descriptive Statistics
Mean Std. Deviation NJob-Dissatisfaction 3.7839 .43089 106Job-Demand 3.4570 .41533 106
Table 4.5 shows the Mean and Standard Deviation Value for
Job-Demand and Job-Dissatisfaction
Two statistical tests i-e correlation and regression were applied to find the relationship between job demand and job dissatisfaction. The results indicated are as follows;
Correlations
Job-Dissatisfaction Job-DemandPearson Correlation
Job-Dissatisfaction 1.000 .078
Sig. (1-tailed)Job-Demand .078 1.000Job-Dissatisfaction . .215
Job-Demand .215 .
NJob-Dissatisfaction 106 106Job-Demand 106 106
Table 4.6 shows the correlation between Job-Demand and Job-Dissatisfaction
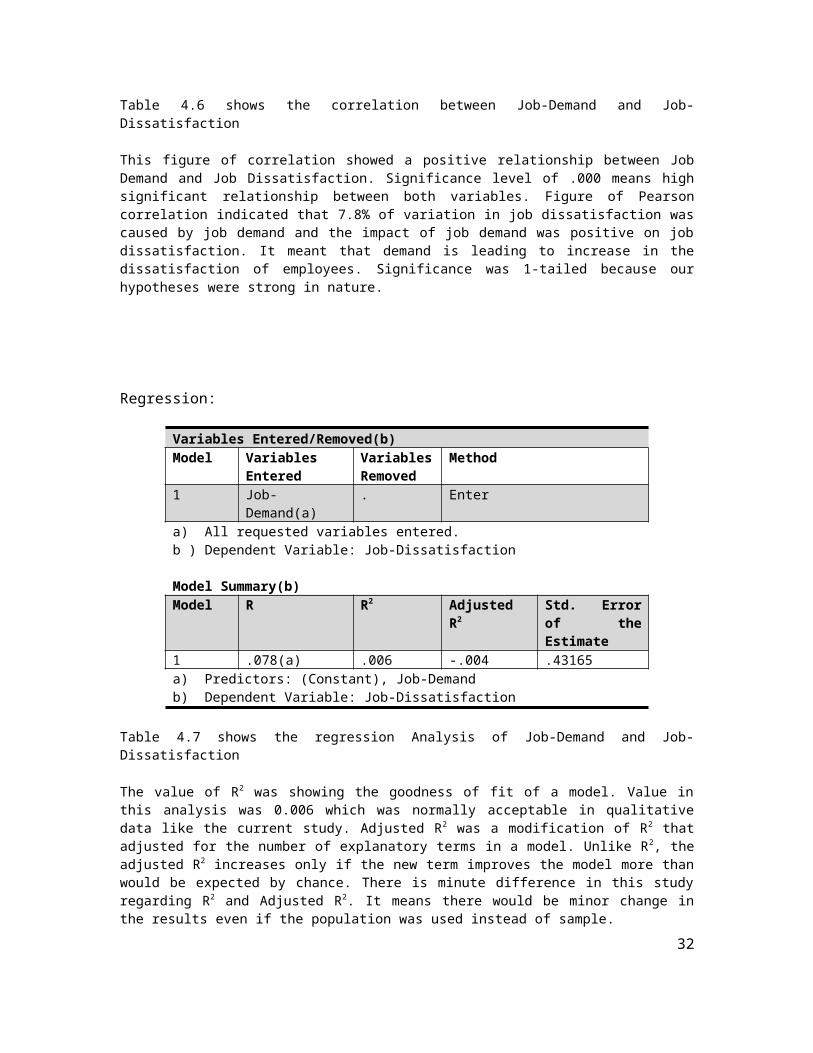
This figure of correlation showed a positive relationship between Job Demand and Job Dissatisfaction. Significance level of .000 means high significant relationship between both variables. Figure of Pearson correlation indicated that 7.8% of variation in job dissatisfaction was caused by job demand and the impact of job demand was positive on job dissatisfaction. It meant that demand is leading to increase in the dissatisfaction of employees. Significance was 1-tailed because our hypotheses were strong in nature.
22
Regression:
Variables Entered/Removed(b)Model Variables
EnteredVariables Removed
Method
1 Job-Demand(a) . Entera) All requested variables entered.b ) Dependent Variable: Job-Dissatisfaction
Model Summary(b)Model R R2 Adjusted R2 Std. Error of the
Estimate1 .078(a) .006 -.004 .43165a) Predictors: (Constant), Job-Demandb) Dependent Variable: Job-Dissatisfaction
Table 4.7 shows the regression Analysis of Job-Demand and Job-Dissatisfaction
The value of R2 was showing the goodness of fit of a model. Value in this analysis was 0.006 which was normally acceptable in qualitative data like the current study. Adjusted R2 was a modification of R2 that adjusted for the number of explanatory terms in a model. Unlike R2, the adjusted R2 increases only if the new term improves the model more than would be expected by chance. There is minute difference in this study regarding R2 and Adjusted R2. It means there would be minor change in the results even if the population was used instead of sample.
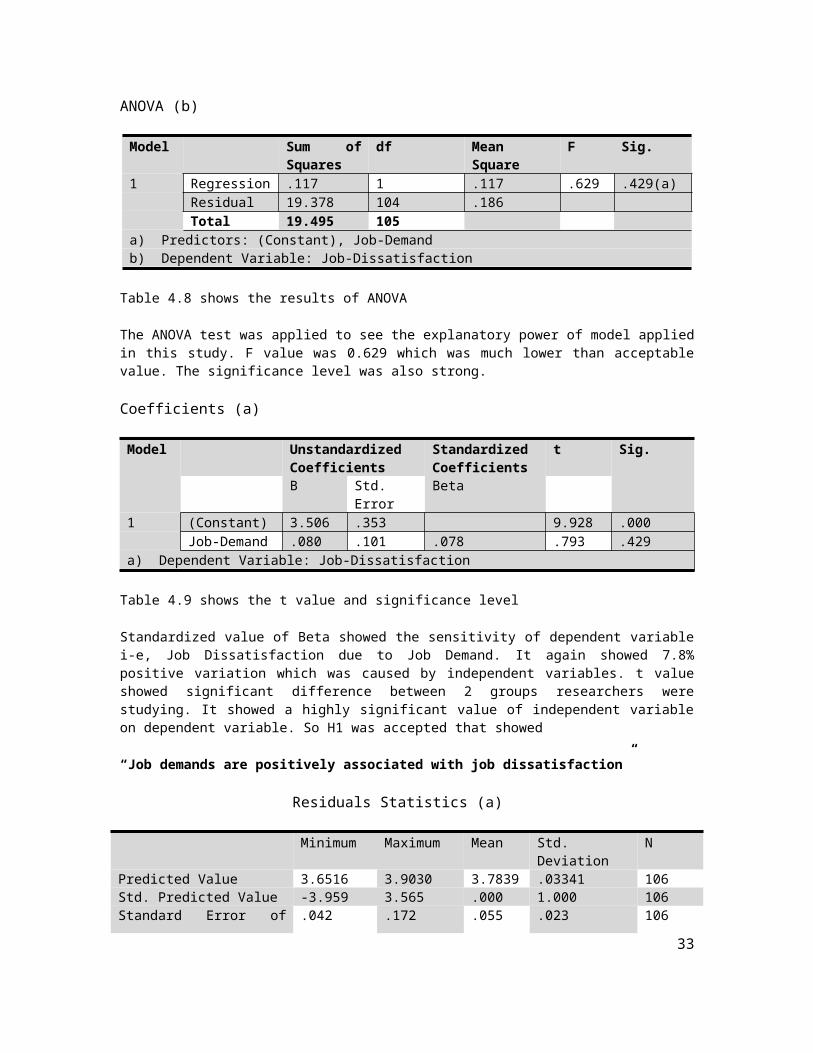
ANOVA (b)
Model Sum of Squares
df Mean Square F Sig.
1 Regression .117 1 .117 .629 .429(a) Residual 19.378 104 .186 Total 19.495 105 a) Predictors: (Constant), Job-Demandb) Dependent Variable: Job-Dissatisfaction
Table 4.8 shows the results of ANOVA
The ANOVA test was applied to see the explanatory power of model applied in this study. F value was 0.629 which was much lower than acceptable value. The significance level was also strong.
Coefficients (a)
Model Unstandardized Coefficients
Standardized Coefficients
t Sig.
B Std. Error Beta
1 (Constant) 3.506 .353 9.928 .000 Job-Demand .080 .101 .078 .793 .429a) Dependent Variable: Job-Dissatisfaction
23
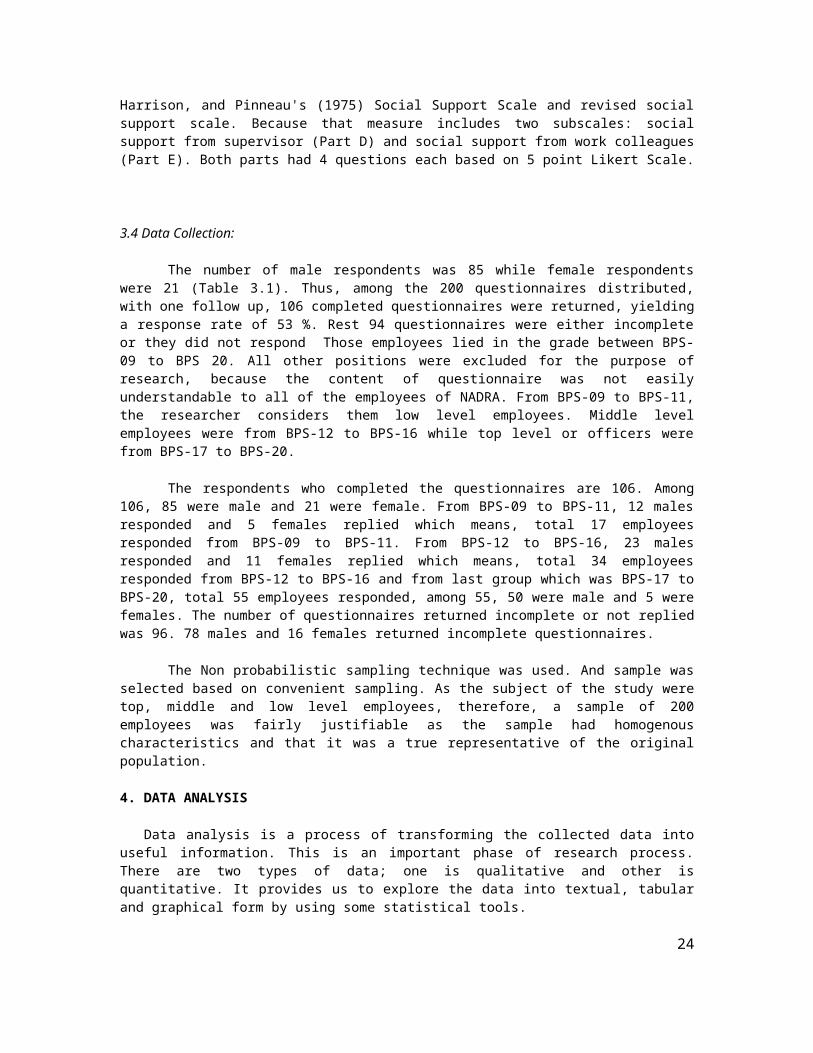
Table 4.9 shows the t value and significance level
Standardized value of Beta showed the sensitivity of dependent variable i-e, Job Dissatisfaction due to Job Demand. It again showed 7.8% positive variation which was caused by independent variables. t value showed significant difference between 2 groups researchers were studying. It showed a highly significant value of independent variable on dependent variable. So H1 was accepted that showed
“Job demands are positively associated with job dissatisfaction”
Residuals Statistics (a)
Minimum Maximum Mean Std. Deviation NPredicted Value 3.6516 3.9030 3.7839 .03341 106Std. Predicted Value -3.959 3.565 .000 1.000 106Standard Error of Predicted Value
.042 .172 .055 .023 106
Adjusted Predicted Value 3.5344 4.0112 3.7839 .04382 106Residual -1.07555 .81383 .00000 .42959 106Std. Residual -2.492 1.885 .000 .995 106Stud. Residual -2.561 1.907 .000 1.007 106Deleted Residual -1.13648 .83229 .00000 .44039 106Stud. Deleted Residual -2.633 1.932 -.002 1.016 106Mahal. Distance .002 15.677 .991 2.388 106Cook's Distance .000 .241 .013 .037 106Centered Leverage Value .000 .149 .009 .023 106a) Dependent Variable: Job-Dissatisfaction
Table 4.10 shows the difference between the sample and the estimated function value.
Histogram:
210-1-2-3
Regression Standardized Residual
20
15
10
5
0
Fre
quency
Mean =-4.93E-15Std. Dev. =0.995
N =106
Dependent Variable: JDis
Histograms were used to represent the data in distributions.
Scatter Plot/Diagram:
24
2.50.0-2.5
Regression Standardized Predicted Value
2
0
-2
Regre
ssio
n S
tandard
ized R
esid
ual
Dependent Variable: JDis
Scatter Plots (also called scatter diagrams) were used to investigate the possible relationship between two variables
H2-Job control is negatively associated with job dissatisfaction;
To test this hypothesis, the researcher needed to check the relationship between Job Control and Job Dissatisfaction. Job Control was calculated by taking the mean of Qualitative Control, Employee Control, Work Control and Conflict Control.
Descriptive Statistics
Mean Std. Deviation NJob-Dissatisfaction 3.7839 .43089 106Job-Control 3.3945 .36651 106
Table 4.11 shows the Mean and Standard Deviation Value for
Job-Control and Job-Dissatisfaction
Two statistical tests i-e correlation and regression were applied to find the relationship between Job Control and Job Dissatisfaction. The results indicated were as follow;
Correlations
25
Fig 4.6
Job-Dissatisfaction Job-ControlPearson Correlation
Job-Dissatisfaction 1.000 .272Job-Control .272 1.000Job-Dissatisfaction . .002
Sig. (1-tailed) Job-Control .002 .
N Job-Dissatisfaction 106 106 Job-Control 106 106
Table 4.12 shows the correlation between Job-Control and Job-Dissatisfaction
This figure of correlation showed a positive relationship between Job Control and Job Dissatisfaction. Significance level of .000 means high significant relationship between both variables. Figure of Pearson correlation indicated that 27% of variation in job dissatisfaction was caused by job control and the impact of Job Control was positive on Job Dissatisfaction. It meant that’s when there was increase in Job Control there was an increase in the Dissatisfaction of employee as well. Significance was 1-tailed because our hypotheses were strong in nature.
Regression:
Variables Entered/Removed(b)Model Variables Entered Variables Removed Method1 Job-Control(a) . Entera) All requested variables entered.b) Dependent Variable: Job-Dissatisfaction
Model Summary(b)Model R R2 Adjusted R2 Std. Error of the
Estimate1 .272(a) .074 .065 .41665a) Predictors: (Constant), Job-Controlb) Dependent Variable: Job-Dissatisfaction
Table 4.13 shows the regression Analysis of Job-Control and Job-Dissatisfaction
The value of R2 was showing the goodness of fit of a model. Value in this analysis was 0.074 which was normally acceptable in qualitative data like the current study. Adjusted R2 was a modification of R2 that adjusted for the number of explanatory terms in a model. Unlike R2, the adjusted R2 increased only if the new term improved the model more than would be expected by chance. There was minute difference in this study regarding R2 and Adjusted R2. It means there was less change in the results even if the population was used instead of sample.
ANOVA (b)
26
Model Sum of Squares
df Mean Square F Sig.
1 Regression 1.441 1 1.441 8.301 .005(a) Residual 18.054 104 .174 Total 19.495 105 a) Predictors: (Constant), Job-Controlb) Dependent Variable: Job-Dissatisfaction
Table 4.14 shows the results of ANOVA
The ANOVA test was applied to see the explanatory power of model applied in this study. F value was 8.301. The significant level was very strong.
Coefficients (a)
Model Unstandardized Coefficients
Standardized Coefficients
t Sig.
B Std. Error Beta
1 (Constant) 2.699 .379 7.126 .000 Job-Control .320 .111 .272 2.881 .005a) Dependent Variable: Job-Dissatisfaction
Table 4.15 shows the t value and significance level
Standardized value of Beta showed the sensitivity of dependent variable i-e, Job Dissatisfaction was due to Job Control. It again showed 27% positive variation which was caused by independent variables. t value showed significant difference between 2 groups researchers were studying. It showed a highly significant value of independent variable on dependent variable. So H2 was rejected which was;
“Job control is negatively associated with job dissatisfaction;”
Residuals Statistics (a)
Minimum Maximum Mean Std. Deviation
N
Predicted Value 3.5379 4.0374 3.7839 .11715 106Std. Predicted Value -2.099 2.164 .000 1.000 106Standard Error of Predicted Value
.041 .097 .055 .016 106
Adjusted Predicted Value 3.5129 4.0551 3.7845 .11775 106Residual -.91952 .77880 .00000 .41466 106Std. Residual -2.207 1.869 .000 .995 106Stud. Residual -2.222 1.882 -.001 1.005 106Deleted Residual -.95043 .78922 -.00066 .42262 106Stud. Deleted Residual -2.265 1.905 -.003 1.012 106Mahal. Distance .003 4.682 .991 1.264 106Cook's Distance .000 .134 .010 .017 106
27
Centered Leverage Value .000 .045 .009 .012 106a) Dependent Variable: Job-Dissatisfaction
Table 4.16 shows the difference between the sample and the estimated function value.
The residual of a sample was the difference between the sample and the estimated function value.
Histogram
210-1-2-3
Regression Standardized Residual
20
15
10
5
0
Fre
quency
Mean =-4.4E-15Std. Dev. =0.995
N =106
Dependent Variable: JDis
Histograms were used to represent the data in distributions.
Scatter Plot/Diagram:
28
Fig 4.7
2.50.0-2.5
Regression Standardized Predicted Value
2
0
-2
Reg
ress
ion
Sta
ndar
dize
d Res
idua
l
Dependent Variable: JDis
Scatter Plots (also called scatter diagrams) were used to investigate the possible relationship between two variables
H3-Social Support is negatively related to Job Dissatisfaction;
To test the last hypothesis, the researcher needed to check the relationship between Social Support and Job Dissatisfaction. Supervisor Support and Colleague Support were taken to calculate the Social Support by taking their Mean values.
Descriptive Statistics
Mean Std. Deviation NJob-Dissatisfaction 3.7839 .43089 106Social-Support 3.4481 .48699 106
Table 4.17 shows the Mean and Standard Deviation Value for
Social-Support and Job-Dissatisfaction
Two statistical tests i-e correlation and regression were applied to find the relationship between Social Support and Job Dissatisfaction. The results indicated were as follow;
29
Fig 4.8
Correlations
Job-Dissatisfaction Social-SupportPearson Correlation
Job-Dissatisfaction 1.000 .198
Social-Support .198 1.000
Sig. (1-tailed) Job-Dissatisfaction . .021 N Social-Support .021 .
Job-Dissatisfaction 106 106Social-Support 106 106
Table 4.18 shows the correlation between Social-Support and Job-Dissatisfaction
This figure of correlation showed a positive relationship between Social Support and Job Dissatisfaction. Significance level of .000 means high significant relationship between both variables. Figure of Pearson correlation indicated that 19% of variation in Job Dissatisfaction was caused by Social Support and the impact of Social Support was positive on Job Dissatisfaction. It means increase in Social Support increases the Job Dissatisfaction. Significance was 1-tailed because our hypotheses were strong in nature.
Regression:
Variables Entered/Removed(b)Model Variables Entered Variables
RemovedMethod
1 Social-Support (a) . Entera) All requested variables entered.b ) Dependent Variable: Job-Dissatisfaction
Model Summary(b)Model R R2 Adjusted R2 Std. Error of the
Estimate1 .198(a) .039 .030 .42436a) Predictors: (Constant), Social-Supportb) Dependent Variable: Job-Dissatisfaction
Table 4.19 shows the regression Analysis of Social-Support and Job-Dissatisfaction
The value of R2 was showing the goodness of fit of a model. Value in this analysis was 0.030 which was normally acceptable in qualitative data like the current study. Adjusted R2 was a modification of R2 that adjusted for the number of explanatory terms in a model. Unlike R2, the adjusted R2 increased only if the new term improved the model more than would be expected by chance. There was minute difference in this study regarding R2 and Adjusted R2. It meant that there was less change in the results even if the population was used instead of sample.
30
ANOVA (b)
Model Sum of Squares df Mean Square F Sig.
1 Regression .766 1 .766 4.255 .042(a) Residual 18.729 104 .180 Total 19.495 105 a) Predictors: (Constant), Social-Supportb) Dependent Variable: Job-Dissatisfaction
Table 4.20 shows the results of ANOVA
The ANOVA test was applied to see the explanatory power of model applied in this study. F value was 4.255 which was much lower than acceptable value of 20. The significant level was very strong.
Coefficients (a)
Model Unstandardized Coefficients
Standardized Coefficients
T Sig.
B Std. Error
Beta
1 (Constant) 3.179 .296 10.736 .000 Social-Support .175 .085 .198 2.063 .042a) Dependent Variable: Job-Dissatisfaction
Table 4.21 shows the t value and significance level
Standardized value of Beta showed the sensitivity of dependent variable i-e, Job Dissatisfaction due to Social Support. It again showed 19% positive variation which was caused by independent variables. t value showed significant difference between 2 groups researchers were studying. It showed a highly significant value of independent variable on dependent variable. So H3 was rejected which was;
“Social Support is negatively related to Job Dissatisfaction;”
Residuals Statistics (a)
Minimum Maximum Mean Std. Deviation
N
Predicted Value 3.5737 3.9465 3.7839 .08542 106Std. Predicted Value -2.460 1.903 .000 1.000 106Standard Error of Predicted Value
.041 .110 .056 .017 106
Adjusted Predicted Value 3.5557 3.9691 3.7841 .08550 106Residual -1.09083 .73375 .00000 .42234 106Std. Residual -2.571 1.729 .000 .995 106Stud. Residual -2.588 1.754 .000 1.007 106Deleted Residual -1.10590 .75476 -.00024 .43249 106Stud. Deleted Residual -2.663 1.772 -.002 1.015 106
31
Mahal. Distance .011 6.053 .991 1.378 106Cook's Distance .000 .095 .012 .020 106Centered Leverage Value .000 .058 .009 .013 106a) Dependent Variable: Job-Dissatisfaction
Table 4.22 shows the difference between the sample and the estimated function value.
5. Conclusion:
This research was an attempt to find out the impact of Karasek’s (1979; Karasek & Theorell, 1990) models of job strain and work environment. The data was analyzed by Statistical Package for Social Sciences (SPSS) 17. It showed that Job-Demand was positively associated with Job-Dissatisfaction and Job-Control and Social-Support were negatively associated with Job-Dissatisfaction. According to literature review, the researcher figured out that Job-Demands are positively associated with Job-Dissatisfaction and Job-Control and Social-Support are negatively associated with Job-Dissatisfaction. The first part is verified and other two are not. So
H1 Job demands are positively associated with job dissatisfaction AcceptedH2 Job control is negatively associated with job dissatisfaction RejectedH3 Social support is negatively related to job dissatisfaction Rejected
In NADRA employee are very satisfied as their organization is performing quite well from past years. The researcher concluded that low Job-Demands, low Job-Control and low Social Support gives employees better satisfaction. According to Fox et al., the degree of control was mainly affected by the individual properties like some people have less expectations from them and they don’t want to have much power for decision plus some people are shy and they don’t want to interfere in someone’s else work so the social support part is different for different people. The result showed that employees of NADRA were not very authoritative that’s why they were satisfied and performed really well. Their mental approach and authorities are stuck. S.S Wong et al., proved that the interdependencies of manager and employees increase with the increase in demand. The results also showed that the employees of NADRA had less demands and that’s why the relationships between employee and manager were weak.
Refrences:
[1] Andries, Kompier, & Smulders, (1996). Topic-Do you think that your health or safety is at risk because of your work? A European study on psychological and physical work demands. Work and Stress.
[2] Astrand, Hanson, & Isacsson, (1989). Job demands, job decision latitude, job supports, and social network factors as predictors of mortality in a Swedish paper company. British Journal of Industrial Medicine.
[3] Barnett & Brennan, R. T. (1995). The relationship between job experiences and psychological distress: Journal of Organizational Behavior.
[4] Beehr, T. A. (1985). The role of social support in coping with stress. Human stress and cognition in organizations: An integrated perspective. New York: Wiley.
32
[5] Beehr, T. A., Glaser, Canali, K. G., & Wallwey (2001). Back to basics: Re-examination of demand-Control Theory of occupational stress. Work and Stress.
[6] Beehr, T. A. & McGrath (1992). Social supports, occupational stress and job anxiety. Job anxiety, job stress and coping.
[7] Bradley, G. (2004). A Test of Demands-Control- Support Model. Job Strain and healthy work. Journal of Applied Psychology: Griffith University, Australia.
[8] Bromet, J., Dew, A., Parkinson, D. K., & Schulberg, (1988). Predictive effects of occupational stress on the mental health of a male workforce. Journal of Organizational Behavior.
[9] Buunk & Peeters, (1994). Stress at work, social support and companionship: Towards an event-contingent recording approach. Work and Stress.
[10] Caplan, R., Cobb, S., & French, J., Van Harrison, R., & Pinneau, S., (1975). Job demands and worker health. Washington D. C.: Institute for Social Research, University of Michigan/ National Institute of Occupational Safety and Health.
[11] Carayon, P., & Zijlstra, F. (1999). Relationship between job control, work pressure and job strain: Studies in the USA and in Netherlands. Work and Stress.
[12] Carrere, S., Evans, G. Palsane, & Rivas, M. (1991). Job strain and occupational stress among urban public transit operators. Journal of Occupational Psychology.
[13] Chay, Y. (1993). Social support, individual differences and well-being: A study of small business entrepreneurs and employees. Journal of Occupational and Organizational Psychology.
[14] Christine Oughton Jonathan Michie, Yvonne Bennion (Nov, 2002).Employee ownership, motivation and Productivity.
[15] Cohen, S., & Wills, T. A. (1985). Stress, social support, and the buffering hypothesis. Psychological Bulletin.
[16] Cook, J. D., Hepworth, S. J., Warr, T. D., & Warr, P. B. (1981). The experience of work: London Academic Press.
[17] Cooper, C. L. (1998). Theories of organizational stress. Oxford: Oxford University Press.
[18] Constantine Kontogiorghes, Robert Gudgel.(2004) Investigating the relationship between Productivity and Quality performance in two manufacturing settings.
[19] Daniels, K., & Guppy, A. (1997). Stressors, locus of control, and social support as consequences of affective psychological well-being. Journal of Occupational Health Psychology.
[20] De Croon, M., Van Der Beek, A. J., Blonk, R. W. B., & Frings-Dresen, M. H. W. (2000). Job stress and psychosomatic health complaints among truck drivers: A re-evaluation of Karasek’s interactive job demands-control model. Stress Medicine.
33
Related Documents


