Scientific Journal of Silesian University of Technology. Series Transport Zeszyty Naukowe Politechniki Śląskiej. Seria Transport Volume 113 2021 p-ISSN: 0209-3324 e-ISSN: 2450-1549 DOI: https://doi.org/10.20858/sjsutst.2021.113.4 Journal homepage: http://sjsutst.polsl.pl Article citation information: Dhonde, B., Patel, C. Impact of industrial freight flows on the overall traffic in Surat city, India. Scientific Journal of Silesian University of Technology. Series Transport. 2021, 113, 45-59. ISSN: 0209-3324. DOI: https://doi.org/10.20858/sjsutst.2021.113.4. Bhavesh DHONDE 1 , Chetan PATEL 2 IMPACT OF INDUSTRIAL FREIGHT FLOWS ON THE OVERALL TRAFFIC IN SURAT CITY, INDIA Summary. Surat is one of the major textile manufacturing hubs in India, having 40% of the synthetic fabric produced in the country. The textile industry in the city has witnessed tremendous growth in the last decade, leading to many transportation-related changes within it. Textile manufacturing has different phases like weaving, processing, value addition and trading or distribution. These phases are located as clusters or pockets in different parts of the city. The scattered nature of the industry generates numerous freight trips. This study focuses on characterizing and estimating textile freight trips in the city. Establishment survey data was collected from production units located in various clusters. A multi-linear regression model for freight trips generated using the quantity of cloth produced was developed for the estimation of the total textile freight trips. Thus, this study will help the planner identify the strategic location of the textile and its allied industries as well as for freight infrastructure in the city. More so, it would help in understanding the impacts of textile freight movement on the city’s overall traffic. Keywords: urban freight; textile; traffic, industry 1 Government Engineering College, Daman, Mota Falia Daman - 396 210, U.T of Dadra & Nagar Haveli and Daman & Diu. India. Email: [email protected]. ORCID: https://orcid.org/0000-0002-7362-1153 2 Sardar Vallabhbhai National Institute of Technology, Surat, Ichchhnath, Surat - 395 007, Gujarat, India. Email: [email protected]. ORCID: https://orcid.org/0000-0003-3395-7856

Welcome message from author
This document is posted to help you gain knowledge. Please leave a comment to let me know what you think about it! Share it to your friends and learn new things together.
Transcript
Scientific Journal of Silesian University of Technology. Series Transport Zeszyty Naukowe Politechniki Śląskiej. Seria Transport
Volume 113 2021
p-ISSN: 0209-3324
e-ISSN: 2450-1549
DOI: https://doi.org/10.20858/sjsutst.2021.113.4
Journal homepage: http://sjsutst.polsl.pl
Article citation information:
Dhonde, B., Patel, C. Impact of industrial freight flows on the overall traffic in Surat city,
India. Scientific Journal of Silesian University of Technology. Series Transport. 2021, 113,
45-59. ISSN: 0209-3324. DOI: https://doi.org/10.20858/sjsutst.2021.113.4.
Bhavesh DHONDE1, Chetan PATEL2
IMPACT OF INDUSTRIAL FREIGHT FLOWS ON THE OVERALL
TRAFFIC IN SURAT CITY, INDIA
Summary. Surat is one of the major textile manufacturing hubs in India, having
40% of the synthetic fabric produced in the country. The textile industry in the city
has witnessed tremendous growth in the last decade, leading to many
transportation-related changes within it. Textile manufacturing has different phases
like weaving, processing, value addition and trading or distribution. These phases
are located as clusters or pockets in different parts of the city. The scattered nature
of the industry generates numerous freight trips. This study focuses on
characterizing and estimating textile freight trips in the city. Establishment survey
data was collected from production units located in various clusters. A multi-linear
regression model for freight trips generated using the quantity of cloth produced
was developed for the estimation of the total textile freight trips. Thus, this study
will help the planner identify the strategic location of the textile and its allied
industries as well as for freight infrastructure in the city. More so, it would help in
understanding the impacts of textile freight movement on the city’s overall traffic.
Keywords: urban freight; textile; traffic, industry
1 Government Engineering College, Daman, Mota Falia Daman - 396 210, U.T of Dadra & Nagar Haveli and
Daman & Diu. India. Email: [email protected]. ORCID: https://orcid.org/0000-0002-7362-1153 2 Sardar Vallabhbhai National Institute of Technology, Surat, Ichchhnath, Surat - 395 007, Gujarat, India.
Email: [email protected]. ORCID: https://orcid.org/0000-0003-3395-7856
46 B. Dhonde, C. Patel
1. INTRODUCTION
Urban freight transportation is entirely different from passenger transport, and significantly
affects the transportation system and environment [1-3]. The freight movement has gradually
become top on the priority list for all major transport researchers and stakeholders around the
world due to its unpredictable characteristic at the city level. Although remarkable research
studies have been carried out in the various areas of freight movement like urban, regional and
international freight movement and in technologically advanced nations like the U.S., U.K.,
Germany, Netherlands, Sweden, Japan, etc., it is still at a dormant stage in most developing
economies of the world including India. India is considered one of the fastest-growing major
economies in the world and it is expected to have at least 10 megacities by 2030. With its high
growth in industrialization and expanding city boundaries, the movement of goods in its cities
is becoming increasingly complex. Cities in India, like most developing nations, have a highly
heterogeneous traffic condition. Lane discipline and traffic sense are usually in a dismal state
in most Indian cities. In such a scenario, the goods vehicle movement often results in overall
speed reduction and acts as a hindrance to the flow of other private and public vehicles. The
current situation is bound to grow worse with increasing urbanization and cities getting denser.
Textile manufacturing is the second largest industry after agriculture, offering large-scale
employment to both skilled and unskilled workforce, with more than 35 million people in the
country directly engaged in it. In India, many cities like Surat, Kanpur, Ahmedabad, Mumbai,
Banaras, Mysore, Kolkata, Coimbatore and Madurai are hubs of textile manufacturing. The
urban freight movement resulting from the textile industry upsets the city traffic operation and
has great impacts on its congestion and pollution levels. The quantification of this congestion
and CO2 emission has prompted the need to control the chaotic movement of goods traffic. To
understand the quantum of trip generation of this industry, this study was conducted. Multi-
linear regression model for trips generated and quantity of cloth produced due to the weaving
unit in the study area was estimated.
2. STUDY AREA DETAILS
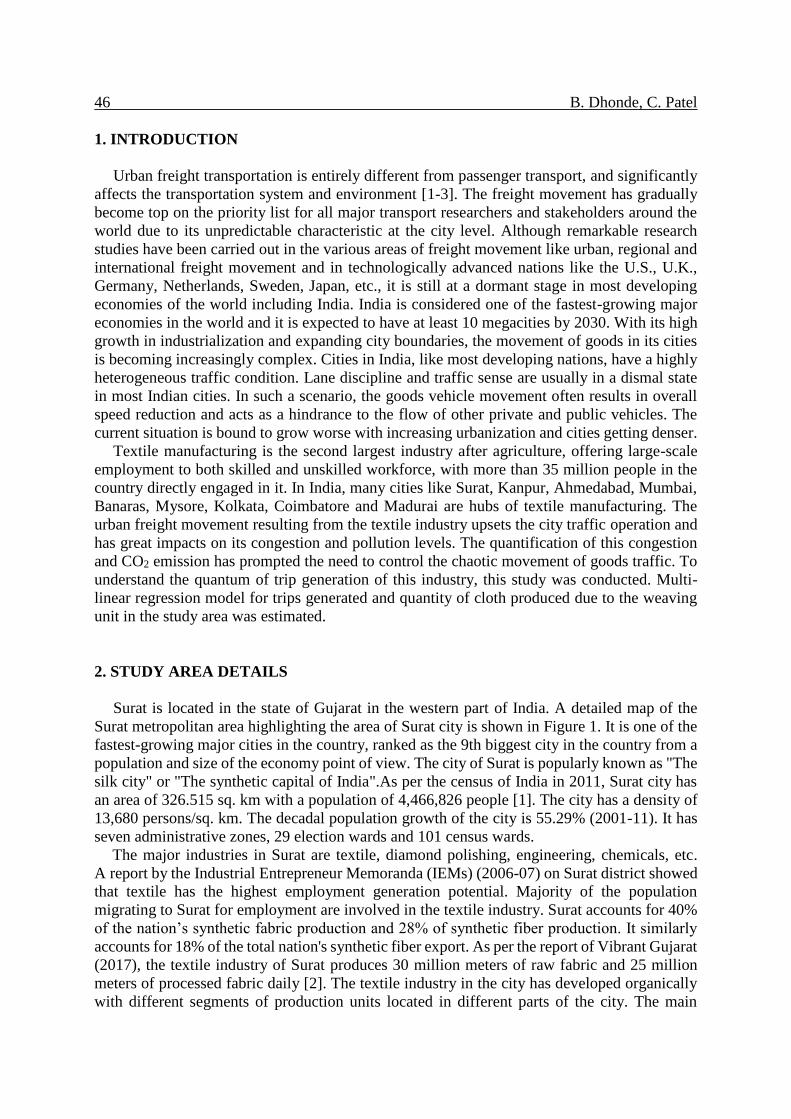
Surat is located in the state of Gujarat in the western part of India. A detailed map of the
Surat metropolitan area highlighting the area of Surat city is shown in Figure 1. It is one of the
fastest-growing major cities in the country, ranked as the 9th biggest city in the country from a
population and size of the economy point of view. The city of Surat is popularly known as "The
silk city" or "The synthetic capital of India".As per the census of India in 2011, Surat city has
an area of 326.515 sq. km with a population of 4,466,826 people [1]. The city has a density of
13,680 persons/sq. km. The decadal population growth of the city is 55.29% (2001-11). It has
seven administrative zones, 29 election wards and 101 census wards.
The major industries in Surat are textile, diamond polishing, engineering, chemicals, etc.
A report by the Industrial Entrepreneur Memoranda (IEMs) (2006-07) on Surat district showed
that textile has the highest employment generation potential. Majority of the population
migrating to Surat for employment are involved in the textile industry. Surat accounts for 40%
of the nation’s synthetic fabric production and 28% of synthetic fiber production. It similarly
accounts for 18% of the total nation's synthetic fiber export. As per the report of Vibrant Gujarat
(2017), the textile industry of Surat produces 30 million meters of raw fabric and 25 million
meters of processed fabric daily [2]. The textile industry in the city has developed organically
with different segments of production units located in different parts of the city. The main
Impact of industrial freight flows on the overall traffic in Surat city, India 47.
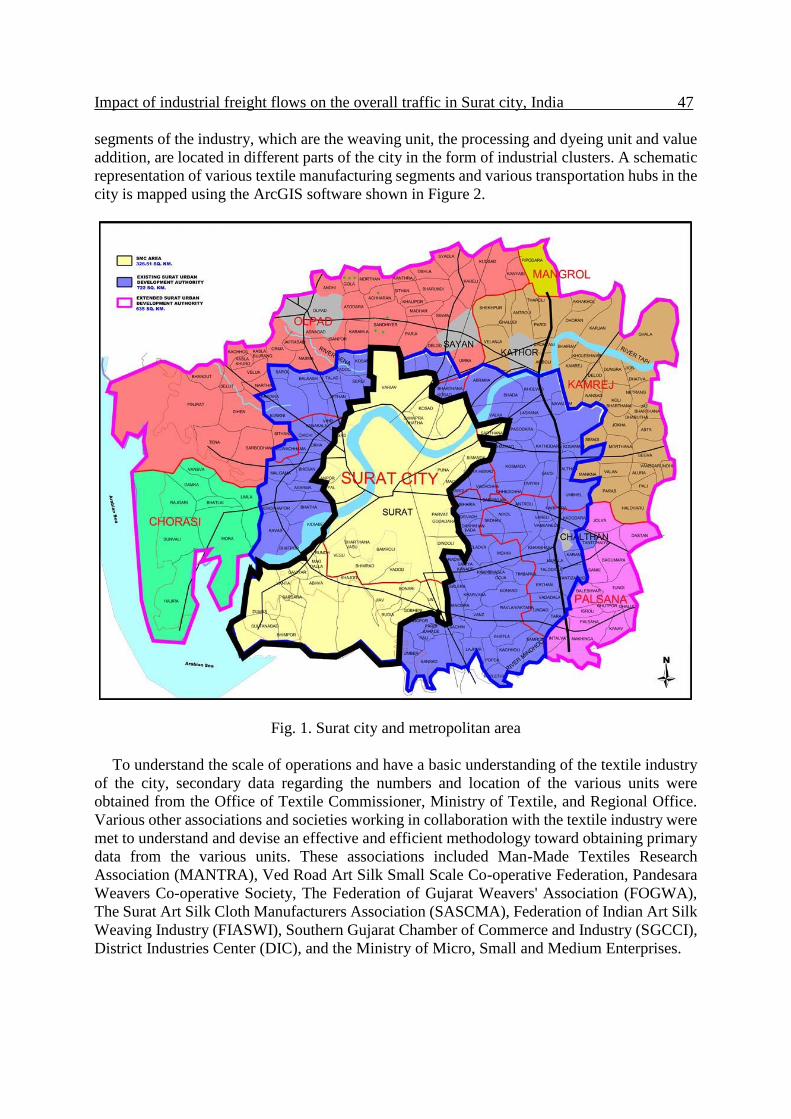
segments of the industry, which are the weaving unit, the processing and dyeing unit and value
addition, are located in different parts of the city in the form of industrial clusters. A schematic
representation of various textile manufacturing segments and various transportation hubs in the
city is mapped using the ArcGIS software shown in Figure 2.
Fig. 1. Surat city and metropolitan area
To understand the scale of operations and have a basic understanding of the textile industry
of the city, secondary data regarding the numbers and location of the various units were
obtained from the Office of Textile Commissioner, Ministry of Textile, and Regional Office.
Various other associations and societies working in collaboration with the textile industry were
met to understand and devise an effective and efficient methodology toward obtaining primary
data from the various units. These associations included Man-Made Textiles Research
Association (MANTRA), Ved Road Art Silk Small Scale Co-operative Federation, Pandesara
Weavers Co-operative Society, The Federation of Gujarat Weavers' Association (FOGWA),
The Surat Art Silk Cloth Manufacturers Association (SASCMA), Federation of Indian Art Silk
Weaving Industry (FIASWI), Southern Gujarat Chamber of Commerce and Industry (SGCCI),
District Industries Center (DIC), and the Ministry of Micro, Small and Medium Enterprises.
48 B. Dhonde, C. Patel
Fig. 2. Schematic location of segments of the textile industry in Surat
3. LITERATURE REVIEW
Ideally, like other passenger transport modes, freight transport equally follows the
conventional four-step modeling, that is, trip generation, trip distribution, mode choice and
route assignment. However, unlike passenger transportation wherein most of the decisions
concerning all four stages of the trip are believed to be rationally taken by the passenger himself,
the biggest challenge with freight transportation is that each stage involves multiple agents in
the decision-making process for the freight or goods transported. This is compounded by the
fact that they have their priorities and interests, which are diverging sometimes.
Impact of industrial freight flows on the overall traffic in Surat city, India 49.
3.1. Commodity flow surveys
The study for achieving harmonious freight flows started in the early '60s in Europe and the
U.S. Most researchers used different forecasting tools to project the freight generated using
different parameters like establishment size, number of employees, or industry attributes.
Several models have been proposed and used for freight generation in different states of the
U.S., which are synchronized with their state-level planning policies. Over time, freight studies
began to consider regional and interregional commodity flow for understanding freight flow
patterns. The major research contributions are; estimation of zonal commodity generation using
commodity-type specific growth rates [3], estimation of freight generation at the national level
[4], modeling of interregional commodity flows that incorporates regional flow relationships
and the corresponding transportation network flows [5]. Giuliano et al. (2010) estimated intra-
metropolitan freight flows on a highway network [6], use of input-output (IO) data with
employment and population information to estimate commodity production and attraction at
zonal level [7]. IO models took commodity flow surveys as their prime database. These models
are generally implemented for large-scale systems at the regional, national or international
level, as they require a great amount of data on regional economic activity and interregional
flows. The basic requirement of these types of models is that they require very rigorous
commodity flow data. While the commodity flow survey is fundamentally based on the number
of tons produced or attracted by a zone, enabling understanding of the prime economic activity
of the study area. The destinations to which these goods are transported give a distribution
pattern, which, indirectly, can be used to access the type and volume of vehicles depending on
the available modes. This method, however, does not explain the movement of empty trucks or
return trips generated after the delivery of goods. In addition, this method assumes that the
origin-destination pairs would naturally follow the shortest route, which is not always the case.
Besides, the data collection in this method of survey is very expensive and time-consuming,
making it less attractive among researchers.
In a country like India, such a system hardly exists, there are interzonal freight flow data
available for the rails but no such database for road movement. In this case, it becomes very
difficult to prepare commodity flow models in the Indian scenario. However, depending on the
type of industry, a strong commodity flow database can be developed by pooling the data of the
various commodity produced from the trade association or society, which manages a directory
of the list of producers in a particular region. For example, data related to the type and quantity
of a particular textile manufactured in a particular industrial clustered can be obtained from the
association of processing units or mills.
3.2. Vehicle trips surveys
The time being alternative to these commodity flow models for the Indian scenario is the
freight models based on vehicle trips. These models are widely used in countries like the
Netherlands, Germany, Italy, the U.K. and the U.S. These models focus on the movement of
freight vehicles between their origin and destination points thereby giving an idea of the freight
flow across the study area. The data for these models are obtained either from the origin-
destination points or from the field data using vehicle volume counts. Over the last two decades,
these models have been preferred for surveys at the city or metropolitan region level.
Researchers in the west have used different modeling techniques for forecast freight generation
(FG), or freight trip generation (FTG). The major contributions include the use of linear
regression [8], cross-classification and ordinary least square (OLS) for estimating disaggregated
50 B. Dhonde, C. Patel
freight trip delivery rates [9], analysis of trip generation characteristics for special land use truck
traffic [10]; and consideration of the supply chain decisions made by individual businesses [11].
The basic advantage of a vehicle trip-based survey is that it considers a freight vehicle as a unit,
and so a large amount of data can be obtained by various surveys related to the vehicle counts
like traffic volume study, screen counts and cordon study. In addition, while considering the
vehicle trip survey, considering the empty vehicle trip is not much of a problem as it observes
only a trip made by a goods vehicle in either of the direction, which means the return trip with
some other goods would be considered as a separate unit in the survey. Thus, data availability
is quite easy and at a lower cost using this method
Although the vehicle trip survey method is better compared to commodity flow, it also has
some disadvantages. First, it is unable to model any economic value for the study area based on
the vehicle trips survey. This is merely the number of trucks moving in the study area, relating
it to the amount of various production and consumption pattern is quite difficult. Further, the
use of this method becomes even more complicated when more than one mode of transport is
likely capable of movement of goods between a pair of locations, which is the usual real-life
scenario. Hence, this model alone is also unable to completely model the freight movement.
For understanding and modeling the actual freight movement, we need to understand the two
dimensions of it, that is, the volume or weight and the vehicle trips, which corresponds to the
freight generation and freight trip generation, respectively. Volume or weight of freight
generated can be well estimated using the commodity flow method, for forecasting the freight
trips generated from the vehicle trip-based models, would give better estimates. Combined
studies taking data both from commodity flow and vehicle trips can be modeled to get complete
freight flow models, which is probably the way forward.
3.3. End consumer goods movement study
Apart from the trip generation models at the establishment level of various types, another
area that is explored in freight studies is the end consumer goods movement. This can be defined
as the movement of goods from the retail outlets/points to the point where their end
consumption takes place. End consumer goods movement can be a conventional approach
wherein the consumer makes the trip for purchasing the goods, or internet or
telecommunication-based order is placed for a specific goods/commodity that has been
purchased. Estimation of the total number of housing shopping trips by using such variables as
household size, number of workers, number of licensed persons, and number of vehicles [12].
Further, a general transportation rates model to find the main factors that affect the total number
of shopping trips in North American metropolitan areas, adding to classical models some
hypothesized factors, which note the effects of new technologies, such as e-commerce,
teleshopping and grocery home delivery services [13]. Similar other studies have been
conducted by other researchers in different cities [14-16]. Recently, a study on economic and
policy analysis of e-commerce and traffic congestion was reported [17].
3.4. Online shopping and delivery pattern study
In the case of online shopping, the customer goes to a website/mobile application and
browses through the goods displayed via text and graphic information. After selecting, the
customer pays electronically either using a credit card or some other form of electronic payment
or even cash on delivery when the goods are shipped directly to the customer’s home [18].
While substantial literature is available on the impact of online shopping and travel behavior of
Impact of industrial freight flows on the overall traffic in Surat city, India 51.
the customers, there are two schools of thought, first is that the customer would first go to the
physical stores to make an actual selection of the goods, and then would browse for online
shopping, which would eventually increase the overall vehicle kilometers traveled (VKT) [19].
The second is that online shopping would gradually act as a complete replacement of the old
travel patterns and there would be consolidation of the city logistics [20, 21]. On the freight
side, among other things, the possibility of cheaper online goods due to economies of scale
would increase demand, which, in turn, would increase the number of deliveries made.
Additionally, online ordering increases the potential for goods to travel further as they can be
ordered from anywhere in the world. The combined outcome of all factors indicates that e-
shopping will reduce travel on the net. However, on the contrary, there may be negative impacts
due to increased travel, even if those impacts are likely to be localized and/or small in
magnitude for the most part [22].
In India, in the recent past, some researchers have worked to model freight transport for
urban areas as well as regional levels. Documented findings for the research in these areas
include the development of freight trip generation models for Chennai, India, with
disaggregated survey data at the establishment level [23]. Development of a static freight
distribution model of commodity flows over the city’s transport infrastructure using data
collected from a cordon survey of freight vehicles in Ahmedabad [24]. Analysis of the role of
Non-Motorized Transport (NMT) in goods movement both in core commercial areas as well as
in the old city in Delhi [25]. Inbound and outbound forecasting models for freight generation at
Mumbai port [26]. Recently, a study was conducted to access the transferability of freight
generation models for seven different cities in the state of Kerala, India [27].
4. DATA COLLECTION AND ANALYSIS
As per the data registered with the Office of Textile Commissioner for the year 2011-2012,
there are about 6.2 lac plain power loom machines, 513 processing units, 140 textile markets
and 8 textile parks in Surat. There are more than 60,000 traders associated with the industry
here. Recently, value addition units like embroidery and laces have grown and it is estimated
that there are more than 1.25 lacs of these machines currently installed in the city. The exact
number of the machines or units are not available as the industry is highly segmented and small-
scale operation makes it difficult to have exact data. The industry does not have any controlling
manufacturing policy; hence, the data obtained are only close estimates from the concerned
authorities. It was understood that after every segment of textile, goods travel to ring road
trading market area, making additional 4-5 trips of textile goods during the process of
manufacturing of finished goods from grey cloth.
From the literature review and meeting with personnel, factors were identified and a
questionnaire survey form was made. A survey was conducted by visiting the weaving units
located in different parts of the city. Two hundred and fifty weaving units were approached, of
which 122 owners agreed to the survey. The questionnaire survey form was divided into sub-
sections. The various subsections of the form are- establishment information, owner's
information, weaving machine details, building use and area details, cluster details, employee
details, work hours details, parking facility, cargo produced/received details, details of the trip
starting from the weaving unit, details of the trip ending at the weaving unit and establishment
related details.
52 B. Dhonde, C. Patel
From the data collected, it was understood that different machines require a different number
of employees and area, production varies as per machine type, work time, the method used for
manufacturing, even some machines produced finished goods (for example, jacquard machine
produced sari). As owners were reluctant to share data; some part of the data was not obtained
as required for establishing relationships for a trip generation while some data points were found
outlying the other data points. Some data points were not within the 95% confidence interval.
As the outcome of the textile industry is dependent on all these factors and deviation in these
factors causes deviation in the outcome. Such samples were considered as outliers and a
relationship was formed for data obtained for plain power loom machines only, as plain power
loom machines account for 96.57% of the total weaving machines in the study area. From the
122 samples, 42 samples were used for the trip generation model. It was observed from the
overall information obtained from the survey that the freight trip generation (FTG) and quantity
of cloth produced from a unit have a very strong positive correlation. Hence, the quantity of
cloth produced is considered as a surrogate measure for estimating FTG from the production
units. From the data analysis, it is observed that the quantity of cloth produced and termed as
output is largely dependent on three factors of production that are as follows,
Number of weaving machines installed
Number of employees at the unit
The total floor area of the unit.
Linear regression equations were derived for these factors toward understanding the effect
of these factors individually on trip generation and quantity of cloth produced by the plain
power loom machine. Figures 3 - 5 shows the linear regression results for trips generated and
the quantity of cloth produced. Other factors like road width, municipal facilities, and electricity
supply have a negligible impact on the production of textiles in the city
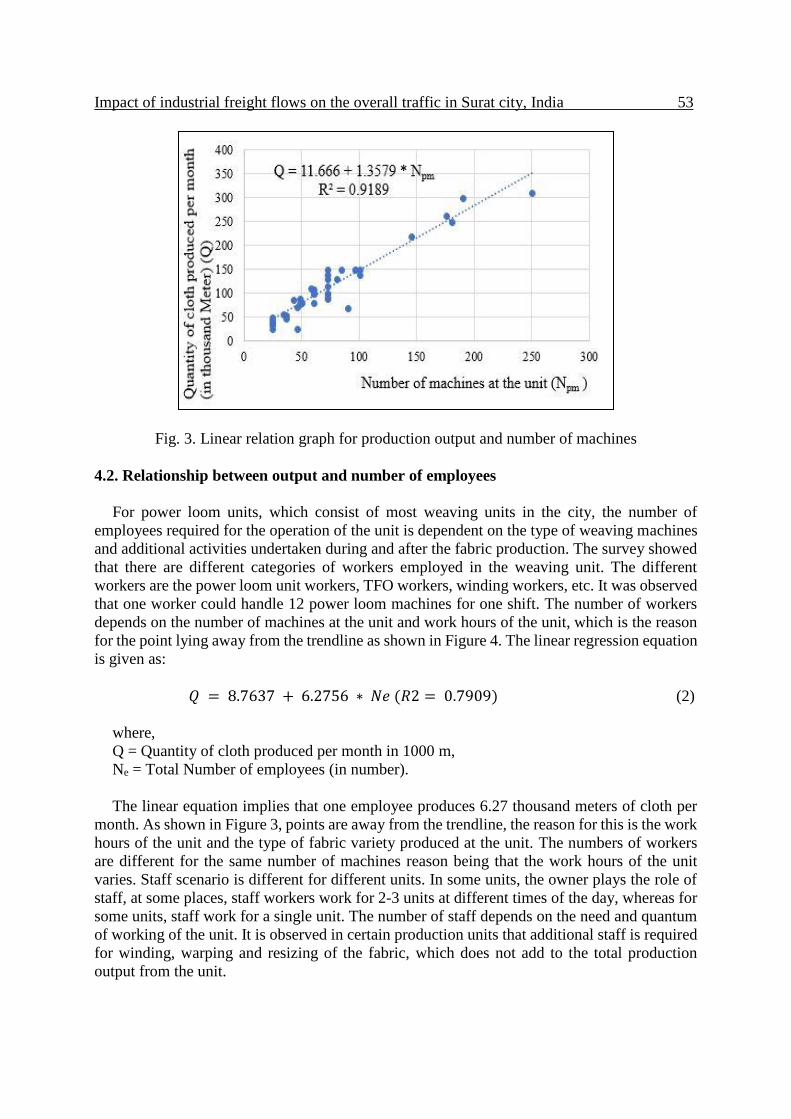
4.1. Relationship between output and number of weaving machines
In linear regression analysis, the quantity of cloth produced is a dependent factor and the
number of weaving machines installed at the establishment is an independent factor. Some units
have waterjet or rapier type of weaving machine, wherein area requirement is more as compared
to the regular power loom machines. As stated by the owners of the weaving unit, the quantity
of production varies from unit to unit due to the method of production adopted by the unit.
Figure 3 shows the graph for the 42 observations noted at the power loom units. The linear
regression equation is given as:
𝑄 = 11.666 + 1.3579 ∗ 𝑁𝑝𝑚(𝑅2 = 0.9189) (1)
where,
Q = Quantity of cloth produced per month in 1000 m,
Npm = Number of power loom machines at the unit (in number).
The linear equation implies that one machine can produce 1.35 thousand meters of cloth per
month. From Figure 2, it can be observed that the same number of machines produce different
amounts of cloth in some cases. Production is dependent upon the quality of raw material,
manufacturing techniques used for production and work hours of the machine. From the graph,
it is observed that the same number of machines have a variety of amount of cloth production
Impact of industrial freight flows on the overall traffic in Surat city, India 53.
Fig. 3. Linear relation graph for production output and number of machines
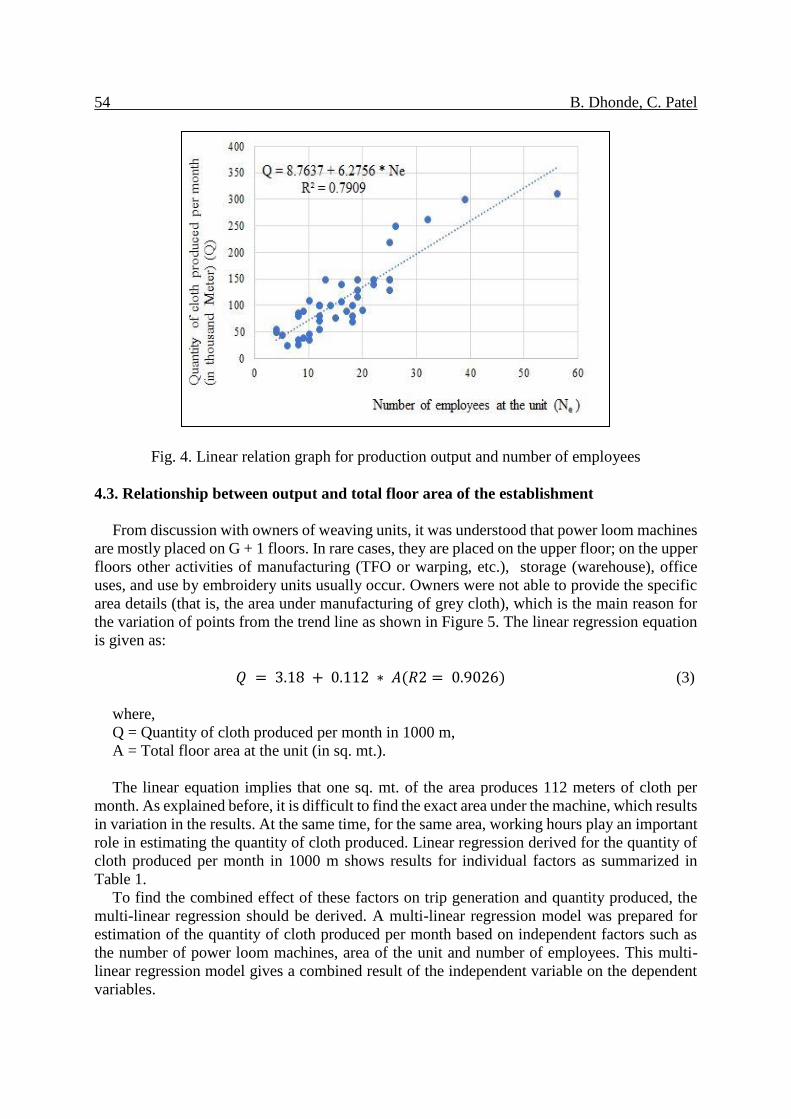
4.2. Relationship between output and number of employees
For power loom units, which consist of most weaving units in the city, the number of
employees required for the operation of the unit is dependent on the type of weaving machines
and additional activities undertaken during and after the fabric production. The survey showed
that there are different categories of workers employed in the weaving unit. The different
workers are the power loom unit workers, TFO workers, winding workers, etc. It was observed
that one worker could handle 12 power loom machines for one shift. The number of workers
depends on the number of machines at the unit and work hours of the unit, which is the reason
for the point lying away from the trendline as shown in Figure 4. The linear regression equation
is given as:
𝑄 = 8.7637 + 6.2756 ∗ 𝑁𝑒 (𝑅2 = 0.7909) (2)
where,
Q = Quantity of cloth produced per month in 1000 m,
Ne = Total Number of employees (in number).
The linear equation implies that one employee produces 6.27 thousand meters of cloth per
month. As shown in Figure 3, points are away from the trendline, the reason for this is the work
hours of the unit and the type of fabric variety produced at the unit. The numbers of workers
are different for the same number of machines reason being that the work hours of the unit
varies. Staff scenario is different for different units. In some units, the owner plays the role of
staff, at some places, staff workers work for 2-3 units at different times of the day, whereas for
some units, staff work for a single unit. The number of staff depends on the need and quantum
of working of the unit. It is observed in certain production units that additional staff is required
for winding, warping and resizing of the fabric, which does not add to the total production
output from the unit.
54 B. Dhonde, C. Patel
Fig. 4. Linear relation graph for production output and number of employees
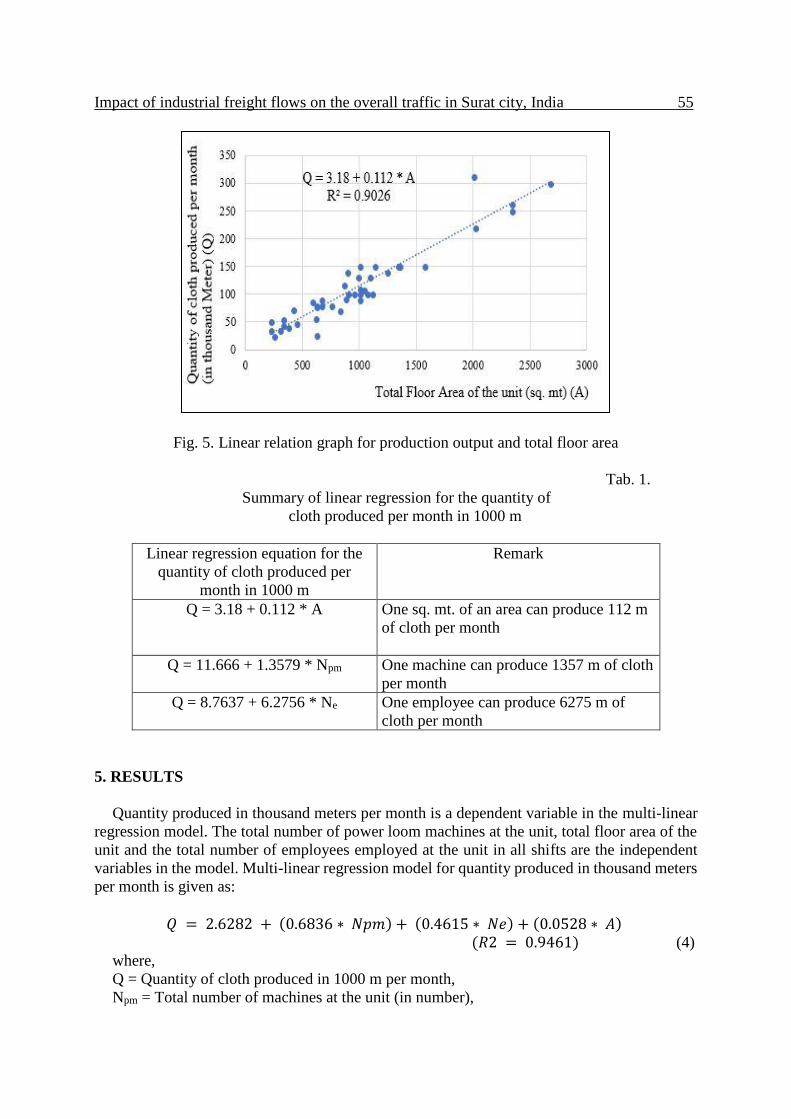
4.3. Relationship between output and total floor area of the establishment
From discussion with owners of weaving units, it was understood that power loom machines
are mostly placed on G + 1 floors. In rare cases, they are placed on the upper floor; on the upper
floors other activities of manufacturing (TFO or warping, etc.), storage (warehouse), office
uses, and use by embroidery units usually occur. Owners were not able to provide the specific
area details (that is, the area under manufacturing of grey cloth), which is the main reason for
the variation of points from the trend line as shown in Figure 5. The linear regression equation
is given as:
𝑄 = 3.18 + 0.112 ∗ 𝐴(𝑅2 = 0.9026) (3)
where,
Q = Quantity of cloth produced per month in 1000 m,
A = Total floor area at the unit (in sq. mt.).
The linear equation implies that one sq. mt. of the area produces 112 meters of cloth per
month. As explained before, it is difficult to find the exact area under the machine, which results
in variation in the results. At the same time, for the same area, working hours play an important
role in estimating the quantity of cloth produced. Linear regression derived for the quantity of
cloth produced per month in 1000 m shows results for individual factors as summarized in
Table 1.
To find the combined effect of these factors on trip generation and quantity produced, the
multi-linear regression should be derived. A multi-linear regression model was prepared for
estimation of the quantity of cloth produced per month based on independent factors such as
the number of power loom machines, area of the unit and number of employees. This multi-
linear regression model gives a combined result of the independent variable on the dependent
variables.
Impact of industrial freight flows on the overall traffic in Surat city, India 55.
Fig. 5. Linear relation graph for production output and total floor area
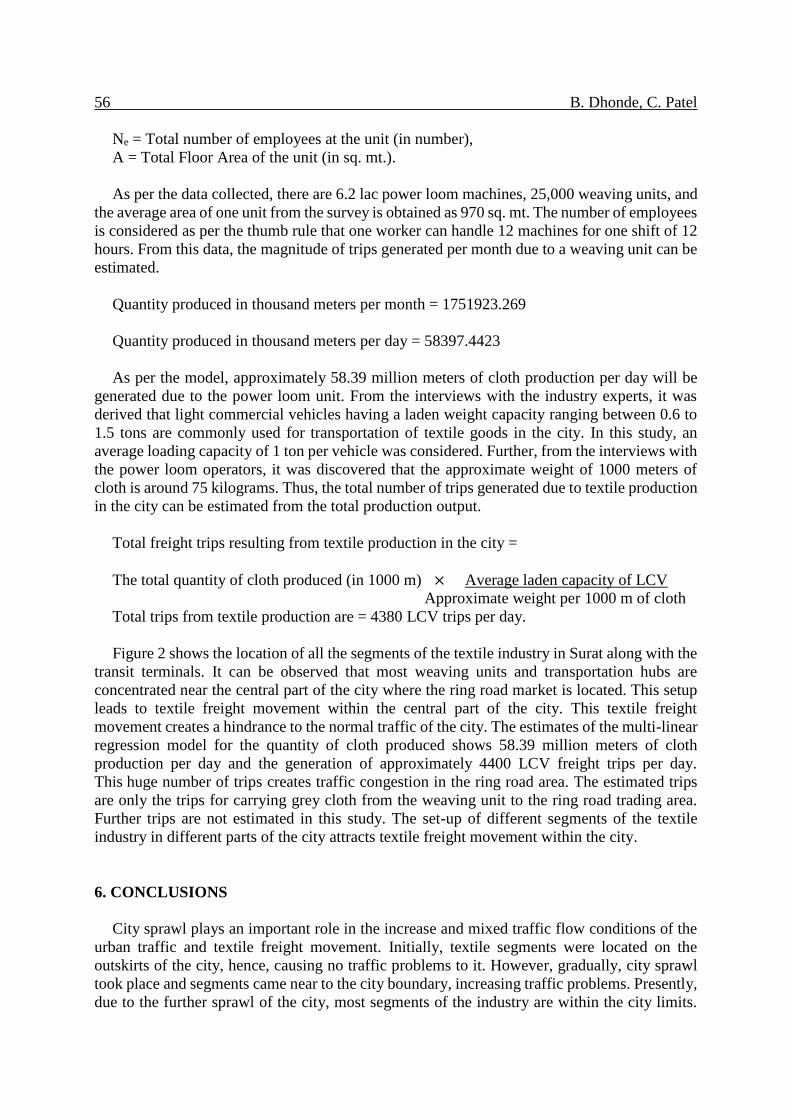
Tab. 1.
Summary of linear regression for the quantity of
cloth produced per month in 1000 m
Linear regression equation for the
quantity of cloth produced per
month in 1000 m
Remark
Q = 3.18 + 0.112 * A One sq. mt. of an area can produce 112 m
of cloth per month
Q = 11.666 + 1.3579 * Npm One machine can produce 1357 m of cloth
per month
Q = 8.7637 + 6.2756 * Ne One employee can produce 6275 m of
cloth per month
5. RESULTS
Quantity produced in thousand meters per month is a dependent variable in the multi-linear
regression model. The total number of power loom machines at the unit, total floor area of the
unit and the total number of employees employed at the unit in all shifts are the independent
variables in the model. Multi-linear regression model for quantity produced in thousand meters
per month is given as:
𝑄 = 2.6282 + (0.6836 ∗ 𝑁𝑝𝑚) + (0.4615 ∗ 𝑁𝑒) + (0.0528 ∗ 𝐴) (𝑅2 = 0.9461) (4)
where,
Q = Quantity of cloth produced in 1000 m per month,
Npm = Total number of machines at the unit (in number),
56 B. Dhonde, C. Patel
Ne = Total number of employees at the unit (in number),
A = Total Floor Area of the unit (in sq. mt.).
As per the data collected, there are 6.2 lac power loom machines, 25,000 weaving units, and
the average area of one unit from the survey is obtained as 970 sq. mt. The number of employees
is considered as per the thumb rule that one worker can handle 12 machines for one shift of 12
hours. From this data, the magnitude of trips generated per month due to a weaving unit can be
estimated.
Quantity produced in thousand meters per month = 1751923.269
Quantity produced in thousand meters per day = 58397.4423
As per the model, approximately 58.39 million meters of cloth production per day will be
generated due to the power loom unit. From the interviews with the industry experts, it was
derived that light commercial vehicles having a laden weight capacity ranging between 0.6 to
1.5 tons are commonly used for transportation of textile goods in the city. In this study, an
average loading capacity of 1 ton per vehicle was considered. Further, from the interviews with
the power loom operators, it was discovered that the approximate weight of 1000 meters of
cloth is around 75 kilograms. Thus, the total number of trips generated due to textile production
in the city can be estimated from the total production output.
Total freight trips resulting from textile production in the city =
The total quantity of cloth produced (in 1000 m) × Average laden capacity of LCV
Approximate weight per 1000 m of cloth
Total trips from textile production are = 4380 LCV trips per day.
Figure 2 shows the location of all the segments of the textile industry in Surat along with the
transit terminals. It can be observed that most weaving units and transportation hubs are
concentrated near the central part of the city where the ring road market is located. This setup
leads to textile freight movement within the central part of the city. This textile freight
movement creates a hindrance to the normal traffic of the city. The estimates of the multi-linear
regression model for the quantity of cloth produced shows 58.39 million meters of cloth
production per day and the generation of approximately 4400 LCV freight trips per day.
This huge number of trips creates traffic congestion in the ring road area. The estimated trips
are only the trips for carrying grey cloth from the weaving unit to the ring road trading area.
Further trips are not estimated in this study. The set-up of different segments of the textile
industry in different parts of the city attracts textile freight movement within the city.
6. CONCLUSIONS
City sprawl plays an important role in the increase and mixed traffic flow conditions of the
urban traffic and textile freight movement. Initially, textile segments were located on the
outskirts of the city, hence, causing no traffic problems to it. However, gradually, city sprawl
took place and segments came near to the city boundary, increasing traffic problems. Presently,
due to the further sprawl of the city, most segments of the industry are within the city limits.
Impact of industrial freight flows on the overall traffic in Surat city, India 57.
This results in the ring road textile market area acting as a central trading hub located centrally
within the city limits for the industry. Linear regression model for trips generated and quantity
of cloth produced showed a linear relationship between dependent and independent variables
satisfying the value of R2. A multi-linear regression model for Trips generated and quantity of
cloth produced by the plain power loom machine was formed. The estimates of the multi-linear
regression model for the quantity of cloth produced showed 58.39 million meters of cloth
production per day and generation of approximately 4400 trips per day (approximately 750-800
trips per hour for an average peak of 2.5-3 hours during morning and evening times).
Accordingly, these trips included trips from the weaving unit to the ring road market or export
(that is, single trip); further trips or the trips attracted for delivery of raw material to the weaving
unit are not included. There is a dearth of data in this sector due to its highly decentralized
nature, otherwise, there is wide scope for the study of the trips generated and attracted by the
setup of the textile industry in the city.
References
1. Davidich N., A. Galkin, V. Sabadash, I. Chumachenko, T. Melenchuk, Y. Davidich.
2020. “Projecting of Urban Transport Infrastructure Considering the Human Factor”.
Communications - Scientific Letters of the University of Zilina 22(1): 84-94.
2. Konstantinus A., M. Zuidgeest. 2019. “An investigation into the factors influencing inter-
urban freight mode choice decisions in the Southern African Development Community
region”. Journal of Transport and Supply Chain Management 13: 1-11.
3. Rossi R., M. Gastaldi, S. Nocera, R. Danielis (Eds.). 2010. “Freight Transport
Modeling”. European Transport \ Trasporti Europei 46(Special Issue). 13th Euro
Working Group on Transportation Meeting (EWGT2009). September 23-25, 2009 Padua
(Italy).
4. Census of India, 2011. Gujarat Series 25, Part XII-B, District census handbook, Surat.
Directorate of Census Operation, Gujarat, India. Available at:
https://censusindia.gov.in/2011census/dchb/2425_PART_B_DCHB_SURAT.pdf.
5. Vibrant Gujarat Summit. 2017. Vibrant Gujarat Global Summit Report. Government of
Gujarat. India.
6. Waliszewski Janine, Dike Ahanotu, Michael Fischer. 2004. “Comparison of Commodity
Flow Forecasting Techniques in Montana”. Transportation Research Record – Journal of
Transportation Research Board 1870(1): 1-9. DOI: 10.3141/1870-01.
7. Novak David, Chirstopher Hodgdon, Feng Guo, Lisa Aultman-Hall. 2011. “Nationwide
Freight Generation Models: A Spatial Regression Approach”. Networks and Spatial
Economics 11(1): 23-41. DOI: 10.1007/s11067-008-9079-2.
8. Boyce David. 2002. “Combined Model of Interregional Commodity Flows on a
Transportation Network”. In: Trade, Networks and Hierarchies. Edited by Hewings
Geoffrey, Michael Sonis, David Boyce. P. 29-40. Springer, Berlin, Heidelberg.
ISBN: 978-3-642-07712-8. DOI: 10.1007/978-3-662-04786-6_3.
9. Giuliano Genevieve, Peter Gordon, Qisheng Pan, Ji Young Park, Lan Lan Wang. 2010.
“Estimating Freight Flows for Metropolitan Area Highway Networks Using Secondary
Data Sources”. Networks and Spatial Economics 10: 73-91. DOI: 10.1007/s11067-007-
9024-9.
58 B. Dhonde, C. Patel
10. Al-Battaineh Omar, Islam Kaysi. 2005. “Commodity-Based Truck Origin-Destination
Matrix Estimation Using Input-Output Data and Genetic Algorithms”. Transportation
Research Record – Journal of Transportation Research Board 1923(1): 37-45.
DOI: 10.1177/0361198105192300105.
11. Iding Mirjam, Wilhelm Meester, Lori Tavasszy. 2002. “Freight trip generation by firms”.
In: 42nd Congress of the European Regional Science Association: From Industry to
Advanced Services - Perspectives of European Metropolitan Regions. European Regional
Science Association (ERSA). Dortmund, Germany. 27-31 August 2002. Dortmund,
Germany. Available at: http://hdl.handle.net/10419/115840.
12. Bastida Carlos, José Holguín-Veras. 2009. “Freight Generation Models: Comparative
Analysis of Regression Models and Multiple Classification Analysis”. Transportation
Research Record – Journal of Transportation Research Board 2097(1): 51-61.
DOI: 10.3141/2097-07.
13. Middleton Dan, John Jr Mason, Chavala Chira. 1988. “Trip Generation for Special-Use
Truck Traffic”. Transportation Research Record – Journal of Transportation Research
Board 1090: 8-13. Available at: http://worldcat.org/isbn/0309041104.
14. Kawamura Kazuya, Shin Hyeon-Shic, McNeil Sue. 2005. Business and Site-Specific Trip
Generation Methodology for Truck Trips. Midwest Regional University Transportation
Center, College of Engineering, Department of Civil and Environmental Engineering,
University of Wisconsin, Madison. 15. Badoe Daniel, Gerald Steuart. 1997. “Urban and travel changes in the Greater Toronto
Area and the transferability of trip-generation models”. Transportation Planning and
Technology 20(4): 267- 290. DOI: 10.1080/03081069708717594.
16. Cubukcu Mert. 2011. “Factors affecting shopping trip generation rates in metropolitan
areas”. Studies in Regional and Urban Planning 9: 51-67.
17. Ségalou Erwan, Christian Ambrosini, Jean-Louis Routhier. 2004. “The environmental
assessment of urban goods movement”. In: Logistics systems for sustainable cities.
Edited by Taniguchi Eiichi, Russell Thomson. P. 207-220. Emerald Group Publishing
Limited, Bingley. ISBN: 978-0-08-044260-0. DOI: 10.1108/9780080473222-015.
18. Toilier Florence, Jean-Louis Routhier. 2007. “FRETURB V3, A Policy oriented software
of modelling urban goods movement”. In: The 11th World Conference on Transport
Research - WCTR'07. 24-28 June 2007. Berkeley, USA. DOI: 10.13140/2.1.4872.4165.
19. Vickerman Roger, Tim Barmby. 1984. “The Structure of Shopping Travel: Some
Developments of the Trip Generation Model”. Journal of Transport Economics and
Policy 18(2): 109-121. Available at: http://www.jstor.org/stable/20052709.
20. Shao Jing, Hangjun Yang, Xiaoqiang Xing, Liu Yang. 2016. “E-commerce and traffic
congestion: An economic and policy analysis”. Transportation Research Part B:
Methodological 83: 91-103. DOI: 10.1016/j.trb.2015.11.003.
21. Anderson W., L. Chatterjee, T. Lakshmanan. 2003. “E‐ commerce, Transportation, and
Economic Geography”. Growth and Change 34(4): 415-432. DOI: 10.1046/j.0017-
4815.2003.00228.x.
22. Cairns Sally. 2005. “Delivering supermarket shopping: more or less shopping?”.
Transport Reviews 25(1): 51-84. DOI: 10.1080/0144164042000218391.
23. Visser Johan, Kim Hassall. 2005. “The future of city logistics: estimating the demand for
home delivery in urban areas”. In: 4th International Conference on City Logistics. P. 147-
162. Institute for City Logistics, Langkawi, Maleisië - Kyoto, Japan. 12-14 July 2005.
Langkawi, Maleisië - Kyoto, Japan. DOI: 10.13140/2.1.1125.2484.
Impact of industrial freight flows on the overall traffic in Surat city, India 59.
24. Triantafyllou Maria, Tom Cherrett, Michael Browne. 2014. “Urban Freight Consolidation
Centers: Case Study in the UK Retail Sector”. Transportation Research Record – Journal
of Transportation Research Board 2411(1): 34-44. DOI: 10.3141/2411-05.
25. Mokhtarian Patricia. 2004. “A conceptual analysis of the transportation impacts of B2C
e-commerce”. Transportation 31: 257-284.
DOI: 10.1023/B:PORT.0000025428.64128.d3.
26. Divya Priya, Gitakrishnan Ramadurai, Gayathri Devi. 2015. “Freight Trip Generation
Models for Chennai, India”. In: Transportation Research Board 94th Annual Meeting.
11-15 Jan 2015. Washington D. C., United States.
27. Swamy Shivanand, Deepak Baindur. 2014. “Managing urban freight transport in
an expanding city - Case study of Ahmedabad”. Research in Transportation Business &
Management 11: 5-14. DOI: 10.1016/j.rtbm.2014.06.010.
28. Gupta Sanjay. 2016. “Role of Non -Motorized Transport in Distribution of Goods in
the Metropolitan City of Delhi”. Transportation Research Procedia 25: 978-984.
DOI: 10.1016/j.trpro.2017.05.472.
29. Patil Gopal, Prasanta Sahu. 2016. “Estimation of freight demand at Mumbai Port using
regression and time series models”. KSCE Journal of Civil Engineering 20(5): 2022-
2032. DOI: 10.1007/s12205-015-0386-0.
30. Pani Agnivesh, Prasanta Sahu, Gopal Patil, Ashoke Sarkar. 2018. “Modelling urban
freight generation: A case study of seven cities in Kerala, India”. Transport Policy 69:
49-64. DOI: 10.1016/j.tranpol.2018.05.013.
Received 04.10.2021; accepted in revised form 12.11.2021
Scientific Journal of Silesian University of Technology. Series Transport is licensed under
a Creative Commons Attribution 4.0 International License
Related Documents