Impact of 2016 IMD Changes An evaluation of the impact of Institutions of Mental Disease changes in 2016 on treatment admissions in Minnesota Alcohol and Drug Abuse Division January 2017

Welcome message from author
This document is posted to help you gain knowledge. Please leave a comment to let me know what you think about it! Share it to your friends and learn new things together.
Transcript
Impact of 2016
IMD Changes
An evaluation of the impact of Institutions of Mental Disease
changes in 2016 on treatment admissions in Minnesota
Alcohol and Drug Abuse Division
January 2017

For more information contact:
Minnesota Department of Human Services
Alcohol and Drug Abuse Division
P.O. Box 64977
St. Paul, MN 55164-0977
(651) 431-2460
Printed with a minimum of 10 percent post-consumer material. Please recycle.

Minnesota Department of Human Services 1 January 2017
Summary At the end of 2015, it became clear that how programs were or were not identified as Institution for Mental Diseases (IMD) needed to be re-evaluated. As a result, more than 30 programs that were previously not considered to be an IMD are now considered to be an IMD.
The Alcohol and Drug Abuse Division (ADAD) of DHS is working to understand how treatment program admissions were affected by these changes. Two questions considered in this report are:
1. Have the programs that are newly considered to be IMDs suffered a decrease in referrals? 2. Did residential admissions decrease for IMDs or in general?
To find the answers to these questions, ADAD evaluated Drug and Alcohol Normative Evaluation System (DAANES) data. This review has found that:
The programs previously considered not to be IMDs suffered no discernable overall loss in referrals due to their now being considered IMDs.
There was an overall 4-percent increase in admissions (more than 500 admissions) to IMDs.
There was no significant decrease in admissions overall at residential programs due to changes in IMD designation.

Minnesota Department of Human Services 2 January 2017
Background In Minnesota, the state, counties and Medicaid dollars fund the Consolidated Chemical Dependency Treatment Fund (CCDTF). CCDTF pays for treatment services for people who are uninsured or under-insured. In 2016, 66 percent of the annual 56,843 SUD treatment admissions are publicly funded (42 percent through the CCDTF and 24 percent by state contracted managed care). The remaining 34 percent SUD treatment admissions is funded by commercial insurance or self-pay.
The federal government, through Medicaid, reimburses the state a percentage for some treatment services. However, the federal government does not allow Medicaid funds to be used for treatment at a chemical treatment program that is determined to be an Institution for Mental Diseases (IMD).
Determining IMD status can be complex. Federal law defines IMDs as programs that have more than 16 beds or have other characteristics that make a program “institutional.”
In 2015, an internal review raised concerns about how DHS has determined the eligibility of some Rule 31 chemical dependency treatment programs for Medicaid reimbursement. Therefore, DHS worked with providers, stakeholders, and the Centers for Medicare and Medicaid Services (CMS) in order to ensure alignment with federal rules.1
As a result, more than 30 programs formerly considered not to be IMDs are now considered IMDs.
The expected outcome for increasing the number of IMD treatment services were:
No changes for people seeking treatment services
Higher costs for the state and counties. CCDTF would continue to fund treatment services for public pay individuals, but the fund would not receive Medicaid reimbursement for services at the newly designated IMDs.
What seemed less clear was what, if any, affect this change would have on providers, the concern being that (despite being prohibited from doing so) placing authorities would refer fewer people to the now-designated IMD treatment programs or to IMDs in general.
1 See: ADAD distributed E-memo 15-57 Federal Medicaid Reimbursement Status for Certain Rule 31 Programs/IMD
Medicaid Manual. On 4/6/16 E-memo 16-15 provided this updated list of IMD providers. http://www.dhs.state.mn.us/main/groups/disabilities/documents/pub/dhs-285338.pdf

Minnesota Department of Human Services 3 January 2017
Impact Therefore, to gauge that impact on the treatment system of IMD changes, ADAD examines in this report how treatment admissions changed over the last year for residential IMD, Non- IMD, and Non-residential providers.
It is important to keep in mind that:
This report does not look at the experiences of individual providers, but offers only the overall statewide impact.
There is a good deal of variability in treatment admissions from year to year. IMD changes are but one variable affecting admissions in 2016.
Given these caveats, the conclusion of the evaluation is that:
For treatment funded through the CCDTF, those programs that are newly considered IMDs had 15 fewer admissions in 2016 from 2015, well within the usual variation from year-to-year. Therefore, the conclusion is that there is no discernable loss in referrals to these programs due to their reclassification as an IMD.
There was a .7 percent decrease in the number of total residential admissions at residential programs (both IMD and non-IMD), but a 2.0 percent increase at residential programs that were newly identified as an IMD a year ago. Therefore, there was no significant decrease in admissions overall at residential programs due to changes in IMD designation.
There was a 4-percent increase in admissions to all IMDs (more than 500 admissions).
Data The data for this report is taken from the Drug and Alcohol Normative Evaluation System (DAANES), to which licensed Substance Use Disorder treatment providers are required to submit admission data.
Following are data for all treatment admissions, CCDFT-funded admissions, and state contracted managed care organization admissions (also considered public pay). The IMD issue examined in this report does not affect non-residential (“outpatient”) treatment.
Non-IMD = treatment programs that are not considered an IMD
Old IMD Facility = treatment programs that have been considered IMDs since before late 2015
New IMD Facility = treatment programs that were formerly considered not IMDs but are now considered IMDs.
Minnesota Department of Human Services 4 January 2017
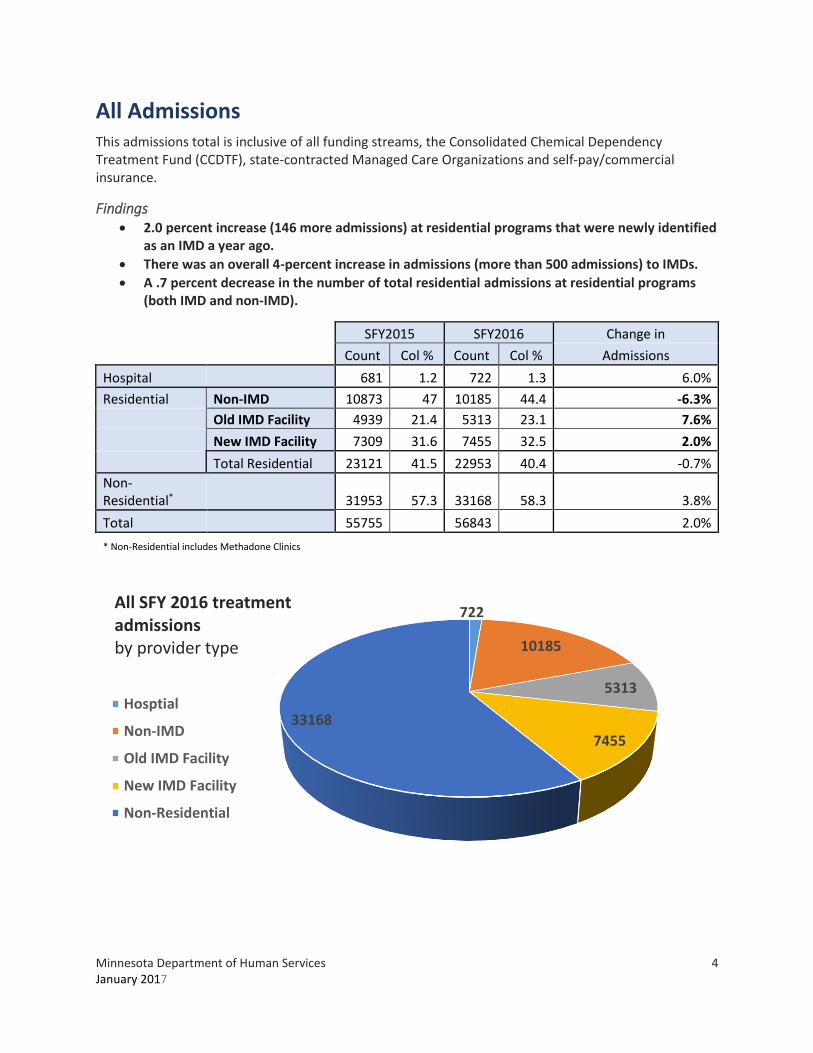
All Admissions This admissions total is inclusive of all funding streams, the Consolidated Chemical Dependency Treatment Fund (CCDTF), state-contracted Managed Care Organizations and self-pay/commercial insurance.
Findings 2.0 percent increase (146 more admissions) at residential programs that were newly identified
as an IMD a year ago.
There was an overall 4-percent increase in admissions (more than 500 admissions) to IMDs.
A .7 percent decrease in the number of total residential admissions at residential programs (both IMD and non-IMD).
SFY2015 SFY2016 Change in
Count Col % Count Col % Admissions
Hospital 681 1.2 722 1.3 6.0%
Residential Non-IMD 10873 47 10185 44.4 -6.3%
Old IMD Facility 4939 21.4 5313 23.1 7.6%
New IMD Facility 7309 31.6 7455 32.5 2.0%
Total Residential 23121 41.5 22953 40.4 -0.7%
Non-Residential* 31953 57.3 33168 58.3 3.8%
Total 55755 56843 2.0%
* Non-Residential includes Methadone Clinics
722
10185
5313
7455
33168
All SFY 2016 treatment admissionsby provider type
Hosptial
Non-IMD
Old IMD Facility
New IMD Facility
Non-Residential

Minnesota Department of Human Services 5 January 2017
CCDTF funded admissions CCDTF pays for treatment for people who are uninsured or underinsured and meet income eligibility guidelines. CCDTF is the most common payer of treatment services in Minnesota.
CCDTF-paid admissions are controlled by the county or tribal placing authority. Because Medicaid does not share in the cost of treatment at an IMD, when individuals enter treatment at an IMD, the county and state financial shares increase.
Findings 0.4 percent decrease (15 fewer admissions) at residential programs that were newly identified
as an IMD a year ago.
13.2 percent increase in admissions for existing IMDs.
Resulting 4.2 percent increase (423 admissions) in the number of total residential admissions (both IMD and non-IMD).
SFY2015 SFY2016 Change in
Count Col % Count Col % Admissions
Hospital 264 1.2 284 1.2 7.6%
Residential Non-IMD 3925 38.7 4044 38.3 3.0%
Old IMD Facilities 2416 23.8 2735 25.9 13.2%
New IMD Facilities 3806 37.5 3791 35.9 -0.4%
Total Residential 10147 46.2 10570 44.7 4.2%
Non-Residential* 11575 52.6 12792 54.1 10.5%
Total 21986 23646 7.6%
284
4044
2735
3791
12792
SFY 2016 CCDTF treatment admissions by provider type
Hosptial
Non-IMD
Old IMD Facilities
New IMD Facilities
Non-Residential*

Minnesota Department of Human Services 6 January 2017
State Contracted Managed Care Organization (MCO) Admissions
The treatment services are funded by state-contracted MCOs and are also considered public pay. The state pays for the related room and board costs, but there is no county share.
Findings 3.6 percent decrease (86 fewer admissions) at residential programs that were newly identified
as an IMD a year ago.
31.2 percent increase (351 more admissions) for existing IMDs
.6 percent decrease (36 fewer admissions) in the number of total residential admissions (both IMD and non-IMD).
SFY2015 SFY2016 Change in
Count Col % Count Col % Admissions
Hospital 104 0.8 116 0.9 11.5%
Residential Non-IMD 2504 41.6 2203 36.9 -12.0%
Old IMD Facility 1125 18.7 1476 24.7 31.2%
New IMD Facility 2384 39.6 2298 38.4 -3.6%
Total Residential 6013 44.8 5977 44.6 -0.6%
Non-Residential* 7319 54.5 7306 54.5 -0.2%
Total 13436 13399 -0.3%
116
2203
1476
2298
7306
SFY 2016 MHCP-PMAP treatment admissionsby provider type
Hosptial
Non-IMD
Old IMD Facility
New IMD Facility
Non-Residential

Minnesota Department of Human Services 7 January 2017
Trends The following tables looks at admission trends over a five-year span:
SUD Treatment Admissions by Treatment Environment SFY2012 - SFY2016
SFY2012 SFY2013 SFY2014 SFY2015 SFY2016
Treatment Environment Count Col % Count Col % Count Col % Count Col % Count Col %
Hospital 1802 3.4 1622 3 1167 2.2 681 1.2 722 1.3
Residential 21846 41.3 21939 40.6 22271 41.3 23121 41.5 22953 40.4
Non-Residential 26953 50.9 27691 51.2 27480 51 28286 50.7 29336 51.6
Methadone 2342 4.4 2838 5.2 2959 5.5 3667 6.6 3832 6.7
Total 52943 54090 53877 100 55755 56843
CCDTF Funded SUD Treatment Admissions by Treatment Environment SFY2012 - SFY2016
SFY2012 SFY2013 SFY2014 SFY2015 SFY2016
Treatment Environment Count Col % Count Col % Count Col % Count Col % Count Col %
Hospital 482 2.1 373 1.7 320 1.4 264 1.2 284 1.2
Residential 10521 45.3 10368 46 10590 46.6 10147 46.2 10570 44.7
Non-Residential 11059 47.6 10543 46.7 10511 46.3 10136 46.1 11460 48.5
Methadone 1170 5 1279 5.7 1297 5.7 1439 6.5 1332 5.6
Total 23232 22563 22718 21986 23646 100
MHCP-PMAP Funded SUD Treatment Admissions by Treatment Environment SFY2012 - SFY2016
SFY2012 SFY2013 SFY2014 SFY2015 SFY2016
Treatment Environment Count Col % Count Col % Count Col % Count Col % Count Col %
Hospital 336 4.5 306 3.4 254 2.5 104 0.8 116 0.9
Residential 3167 42.2 3905 44 4541 44.1 6013 44.8 5977 44.6
Non-Residential 3807 50.8 4519 50.9 5135 49.9 6358 47.3 6001 44.8
Methadone 186 2.5 141 1.6 356 3.5 961 7.2 1305 9.7
Total 7496 8871 10286 13436 13399
Source: Minnesota Department of Human Services, ADAD, DAANES (12/15/2016)

Minnesota Department of Human Services 8 January 2017
Residential SUD treatment providers October 2016

mn.gov/dhs
Related Documents