Impact of human land use on soils and landforms in cultural landscapes on aeolian sandy substrates (Maashorst, SE-Netherlands) J.M. van Mourik a, * , A.C. Seijmonsbergen a , R.T. Slotboom a , J. Wallinga b a University of Amsterdam, Institute for Biodiversity and Ecosystem Dynamics (IBED), Netherlands b Netherlands Centre for Luminescence dating (NCL), Delft University of Technology, Netherlands article info Article history: Available online 21 July 2011 abstract Pollen analysis, soil micromorphology and radiocarbon dating have been the main scientific tools to unlock palaeoecological information from palaeosols during the past decades. In recent years, the application of optically stimulated luminescence (OSL) dating on polycyclic driftsand profiles and plaggic deposits has been shown to be of great added value to understand the geochronology of the evolution of soils and landforms on sandy substrates. This paper presents the reconstruction of the evolution of cultural soils and landforms in the study area Maashorst (southern Netherlands), which is part of an extensive region in Northwestern Europe underlain by predominantly Late Glacial aeolian coversand deposits. Deforestation and soils acidification, related to human land use, started before 1750 BC. Based on radiocarbon dating, sedentary agriculture already started around 1000 BC, but OSL dates indicate that the accumulation of plaggic deposits did not start before the Late Middle Ages. The reconstructed evolution of cultural soils and landforms is based on information of scattered palaeosols, interpolated and extrapolated to a sequence of (palaeo) soil maps. Palaeopedological information is not included in regular soil maps because soil classifications are based on the diagnostic properties of actual soils and normally neglect relicts of preliminary steps in soil development. This is convenient for agricultural applications, but such soil maps are less useful for the presentation of long term soil development or as abiotical base for designs for restoration ecology. The results of this study include interpretive maps produced in a geographical information system of the soil patterns around 1500 AD and 2000 BC, based on the present soil map and the reconstruction of palaeoecological development during the Late Holocene. The time sequence of these historical inter- pretive soil maps reflects the impact of human land use on soils and landforms. Ó 2011 Elsevier Ltd and INQUA. All rights reserved. 1. Introduction During recent decades the interest and need for restoration ecology has increased on global and regional scale (Van Andel and Grootjans, 2006). In the Netherlands, a national ecological master structure was designed to improve the ecological quality and biodiversity (Bal et al., 2001) and in this context attention was paid on the preservation and restoration of driftsand habitats and landscapes (Koster, 2009, 2010). The Maashorst area was selected for the development of a natural park, that should be designed on the basis of available geomorphological and soil maps (Stichting voor Bodemkartering, 1976) and various landscape studies (Hendrikx, 1977). During prehistoric and early historic time, forest grazing, wood cutting and shifting cultivation gradually trans- formed the natural deciduous forest into heath land. The defores- tation accelerated soil acidification and affected the hydrology, resulting in wetting of depressions and seepage zones along fault escarpments and accumulation of peat. The use of the heath for the production of organic manure during the period of plaggen agri- culture from early Middle Ages to the introduction of chemical fertilizers around 1900 AC, subsequently resulted in local renewal of driftsand activity. Soil classifications are based on actual diag- nostic properties and normally neglect relicts of preliminary phases in soil and landscape development. Consequently, soil maps only show the actual distribution of soils and are thus less useful to fully understand the interference of natural and human processes. To overcome this gap in knowledge of long term impact of human land use on the development of landforms and soils, two innovative methods are introduced in this paper. Firstly, the application of OSL * Corresponding author. University of Amsterdam, Department of Palaeoecology, Institute for Biodiversity and Ecosystem Dynamics, Science Park 904, 1098XH Amsterdam, Netherlands. E-mail address: [email protected] (J.M. van Mourik). Contents lists available at SciVerse ScienceDirect Quaternary International journal homepage: www.elsevier.com/locate/quaint 1040-6182/$ e see front matter Ó 2011 Elsevier Ltd and INQUA. All rights reserved. http://dx.doi.org/10.1016/j.quaint.2011.06.053 Quaternary International 265 (2012) 74e89

Welcome message from author
This document is posted to help you gain knowledge. Please leave a comment to let me know what you think about it! Share it to your friends and learn new things together.
Transcript
at SciVerse ScienceDirect
Quaternary International 265 (2012) 74e89
Contents lists available
Quaternary International
journal homepage: www.elsevier .com/locate/quaint
Impact of human land use on soils and landforms in cultural landscapes onaeolian sandy substrates (Maashorst, SE-Netherlands)
J.M. van Mourik a,*, A.C. Seijmonsbergen a, R.T. Slotbooma, J. Wallinga b
aUniversity of Amsterdam, Institute for Biodiversity and Ecosystem Dynamics (IBED), NetherlandsbNetherlands Centre for Luminescence dating (NCL), Delft University of Technology, Netherlands
a r t i c l e i n f o
Article history:Available online 21 July 2011
* Corresponding author. University of Amsterdam, DInstitute for Biodiversity and Ecosystem DynamicsAmsterdam, Netherlands.
E-mail address: [email protected] (J.M. van M
1040-6182/$ e see front matter � 2011 Elsevier Ltd ahttp://dx.doi.org/10.1016/j.quaint.2011.06.053
a b s t r a c t
Pollen analysis, soil micromorphology and radiocarbon dating have been the main scientific tools tounlock palaeoecological information from palaeosols during the past decades. In recent years, theapplication of optically stimulated luminescence (OSL) dating on polycyclic driftsand profiles and plaggicdeposits has been shown to be of great added value to understand the geochronology of the evolution ofsoils and landforms on sandy substrates.
This paper presents the reconstruction of the evolution of cultural soils and landforms in the studyarea Maashorst (southern Netherlands), which is part of an extensive region in Northwestern Europeunderlain by predominantly Late Glacial aeolian coversand deposits. Deforestation and soils acidification,related to human land use, started before 1750 BC. Based on radiocarbon dating, sedentary agriculturealready started around 1000 BC, but OSL dates indicate that the accumulation of plaggic deposits did notstart before the Late Middle Ages. The reconstructed evolution of cultural soils and landforms is based oninformation of scattered palaeosols, interpolated and extrapolated to a sequence of (palaeo) soil maps.Palaeopedological information is not included in regular soil maps because soil classifications are basedon the diagnostic properties of actual soils and normally neglect relicts of preliminary steps in soildevelopment. This is convenient for agricultural applications, but such soil maps are less useful for thepresentation of long term soil development or as abiotical base for designs for restoration ecology. Theresults of this study include interpretive maps produced in a geographical information system of the soilpatterns around 1500 AD and 2000 BC, based on the present soil map and the reconstruction ofpalaeoecological development during the Late Holocene. The time sequence of these historical inter-pretive soil maps reflects the impact of human land use on soils and landforms.
� 2011 Elsevier Ltd and INQUA. All rights reserved.
1. Introduction
During recent decades the interest and need for restorationecology has increased on global and regional scale (Van Andel andGrootjans, 2006). In the Netherlands, a national ecological masterstructure was designed to improve the ecological quality andbiodiversity (Bal et al., 2001) and in this context attention was paidon the preservation and restoration of driftsand habitats andlandscapes (Koster, 2009, 2010). The Maashorst area was selectedfor the development of a natural park, that should be designed onthe basis of available geomorphological and soil maps (Stichtingvoor Bodemkartering, 1976) and various landscape studies
epartment of Palaeoecology,, Science Park 904, 1098XH
ourik).
nd INQUA. All rights reserved.
(Hendrikx, 1977). During prehistoric and early historic time, forestgrazing, wood cutting and shifting cultivation gradually trans-formed the natural deciduous forest into heath land. The defores-tation accelerated soil acidification and affected the hydrology,resulting in wetting of depressions and seepage zones along faultescarpments and accumulation of peat. The use of the heath for theproduction of organic manure during the period of plaggen agri-culture from early Middle Ages to the introduction of chemicalfertilizers around 1900 AC, subsequently resulted in local renewalof driftsand activity. Soil classifications are based on actual diag-nostic properties and normally neglect relicts of preliminary phasesin soil and landscape development. Consequently, soil maps onlyshow the actual distribution of soils and are thus less useful to fullyunderstand the interference of natural and human processes. Toovercome this gap in knowledge of long term impact of human landuse on the development of landforms and soils, two innovativemethods are introduced in this paper. Firstly, the application of OSL
J.M. van Mourik et al. / Quaternary International 265 (2012) 74e89 75
dating on newly investigated polycyclic soil profiles to improve thegeochronology of the phases in landscape evolution. Secondly it isshown how the complete package of palaeoecological informationcan be processed into soil maps of paleolandscapes usinga geographical information system.
2. Regional setting
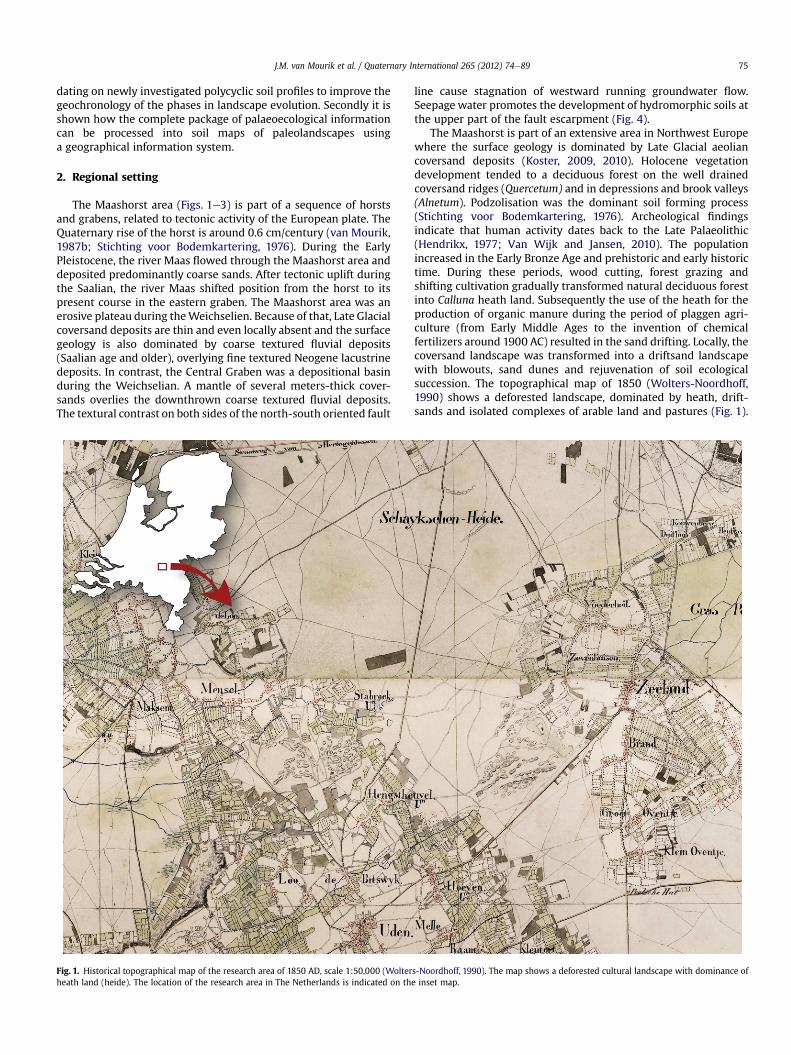
The Maashorst area (Figs. 1e3) is part of a sequence of horstsand grabens, related to tectonic activity of the European plate. TheQuaternary rise of the horst is around 0.6 cm/century (van Mourik,1987b; Stichting voor Bodemkartering, 1976). During the EarlyPleistocene, the river Maas flowed through the Maashorst area anddeposited predominantly coarse sands. After tectonic uplift duringthe Saalian, the river Maas shifted position from the horst to itspresent course in the eastern graben. The Maashorst area was anerosive plateau during theWeichselien. Because of that, Late Glacialcoversand deposits are thin and even locally absent and the surfacegeology is also dominated by coarse textured fluvial deposits(Saalian age and older), overlying fine textured Neogene lacustrinedeposits. In contrast, the Central Graben was a depositional basinduring the Weichselian. A mantle of several meters-thick cover-sands overlies the downthrown coarse textured fluvial deposits.The textural contrast on both sides of the north-south oriented fault
Fig. 1. Historical topographical map of the research area of 1850 AD, scale 1:50,000 (Wolterheath land (heide). The location of the research area in The Netherlands is indicated on th
line cause stagnation of westward running groundwater flow.Seepage water promotes the development of hydromorphic soils atthe upper part of the fault escarpment (Fig. 4).
The Maashorst is part of an extensive area in Northwest Europewhere the surface geology is dominated by Late Glacial aeoliancoversand deposits (Koster, 2009, 2010). Holocene vegetationdevelopment tended to a deciduous forest on the well drainedcoversand ridges (Quercetum) and in depressions and brook valleys(Alnetum). Podzolisation was the dominant soil forming process(Stichting voor Bodemkartering, 1976). Archeological findingsindicate that human activity dates back to the Late Palaeolithic(Hendrikx, 1977; Van Wijk and Jansen, 2010). The populationincreased in the Early Bronze Age and prehistoric and early historictime. During these periods, wood cutting, forest grazing andshifting cultivation gradually transformed natural deciduous forestinto Calluna heath land. Subsequently the use of the heath for theproduction of organic manure during the period of plaggen agri-culture (from Early Middle Ages to the invention of chemicalfertilizers around 1900 AC) resulted in the sand drifting. Locally, thecoversand landscape was transformed into a driftsand landscapewith blowouts, sand dunes and rejuvenation of soil ecologicalsuccession. The topographical map of 1850 (Wolters-Noordhoff,1990) shows a deforested landscape, dominated by heath, drift-sands and isolated complexes of arable land and pastures (Fig. 1).
s-Noordhoff, 1990). The map shows a deforested cultural landscape with dominance ofe inset map.
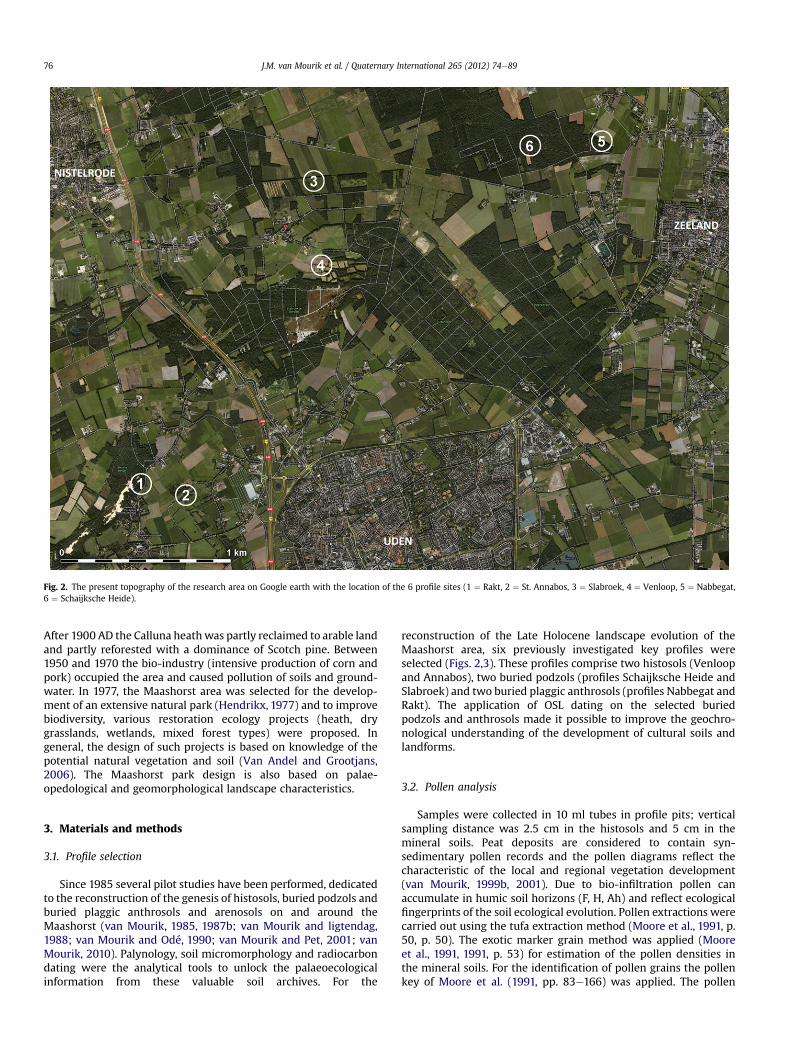
Fig. 2. The present topography of the research area on Google earth with the location of the 6 profile sites (1 ¼ Rakt, 2 ¼ St. Annabos, 3 ¼ Slabroek, 4 ¼ Venloop, 5 ¼ Nabbegat,6 ¼ Schaijksche Heide).
J.M. van Mourik et al. / Quaternary International 265 (2012) 74e8976
After 1900 AD the Calluna heathwas partly reclaimed to arable landand partly reforested with a dominance of Scotch pine. Between1950 and 1970 the bio-industry (intensive production of corn andpork) occupied the area and caused pollution of soils and ground-water. In 1977, the Maashorst area was selected for the develop-ment of an extensive natural park (Hendrikx, 1977) and to improvebiodiversity, various restoration ecology projects (heath, drygrasslands, wetlands, mixed forest types) were proposed. Ingeneral, the design of such projects is based on knowledge of thepotential natural vegetation and soil (Van Andel and Grootjans,2006). The Maashorst park design is also based on palae-opedological and geomorphological landscape characteristics.
3. Materials and methods
3.1. Profile selection
Since 1985 several pilot studies have been performed, dedicatedto the reconstruction of the genesis of histosols, buried podzols andburied plaggic anthrosols and arenosols on and around theMaashorst (van Mourik, 1985, 1987b; van Mourik and ligtendag,1988; van Mourik and Odé, 1990; van Mourik and Pet, 2001; vanMourik, 2010). Palynology, soil micromorphology and radiocarbondating were the analytical tools to unlock the palaeoecologicalinformation from these valuable soil archives. For the
reconstruction of the Late Holocene landscape evolution of theMaashorst area, six previously investigated key profiles wereselected (Figs. 2,3). These profiles comprise two histosols (Venloopand Annabos), two buried podzols (profiles Schaijksche Heide andSlabroek) and two buried plaggic anthrosols (profiles Nabbegat andRakt). The application of OSL dating on the selected buriedpodzols and anthrosols made it possible to improve the geochro-nological understanding of the development of cultural soils andlandforms.
3.2. Pollen analysis
Samples were collected in 10 ml tubes in profile pits; verticalsampling distance was 2.5 cm in the histosols and 5 cm in themineral soils. Peat deposits are considered to contain syn-sedimentary pollen records and the pollen diagrams reflect thecharacteristic of the local and regional vegetation development(van Mourik, 1999b, 2001). Due to bio-infiltration pollen canaccumulate in humic soil horizons (F, H, Ah) and reflect ecologicalfingerprints of the soil ecological evolution. Pollen extractions werecarried out using the tufa extraction method (Moore et al., 1991, p.50, p. 50). The exotic marker grain method was applied (Mooreet al., 1991, 1991, p. 53) for estimation of the pollen densities inthe mineral soils. For the identification of pollen grains the pollenkey of Moore et al. (1991, pp. 83e166) was applied. The pollen
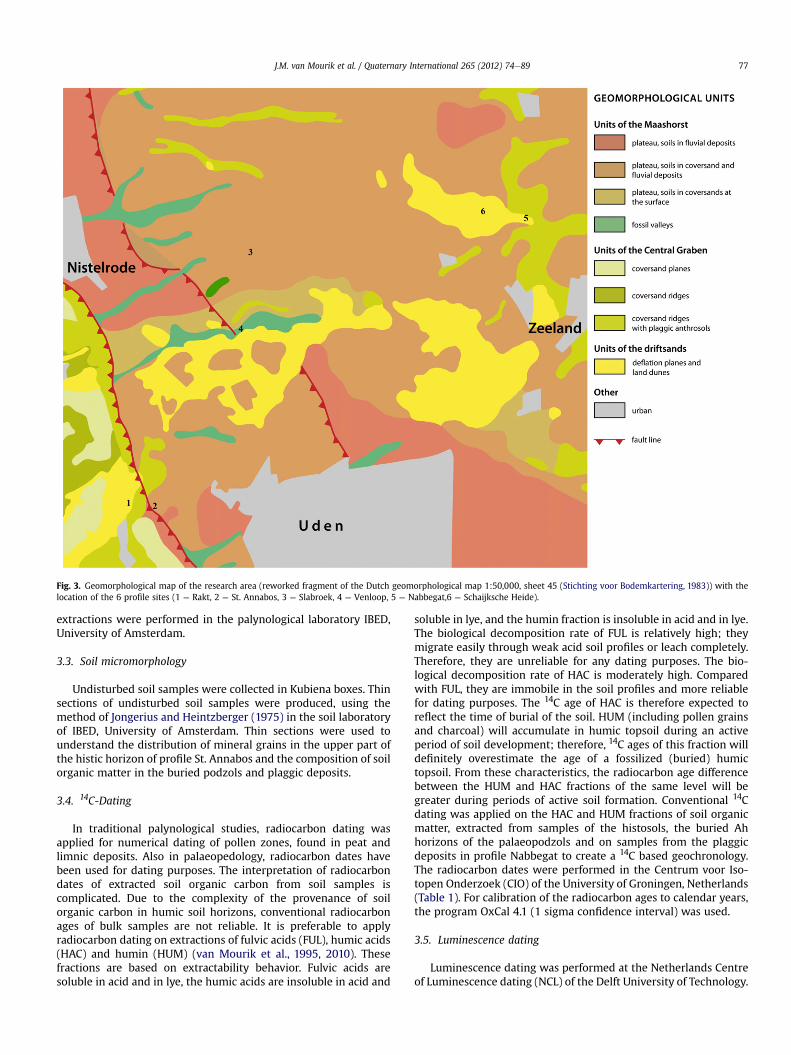
Fig. 3. Geomorphological map of the research area (reworked fragment of the Dutch geomorphological map 1:50,000, sheet 45 (Stichting voor Bodemkartering, 1983)) with thelocation of the 6 profile sites (1 ¼ Rakt, 2 ¼ St. Annabos, 3 ¼ Slabroek, 4 ¼ Venloop, 5 ¼ Nabbegat,6 ¼ Schaijksche Heide).
J.M. van Mourik et al. / Quaternary International 265 (2012) 74e89 77
extractions were performed in the palynological laboratory IBED,University of Amsterdam.
3.3. Soil micromorphology
Undisturbed soil samples were collected in Kubiena boxes. Thinsections of undisturbed soil samples were produced, using themethod of Jongerius and Heintzberger (1975) in the soil laboratoryof IBED, University of Amsterdam. Thin sections were used tounderstand the distribution of mineral grains in the upper part ofthe histic horizon of profile St. Annabos and the composition of soilorganic matter in the buried podzols and plaggic deposits.
3.4. 14C-Dating
In traditional palynological studies, radiocarbon dating wasapplied for numerical dating of pollen zones, found in peat andlimnic deposits. Also in palaeopedology, radiocarbon dates havebeen used for dating purposes. The interpretation of radiocarbondates of extracted soil organic carbon from soil samples iscomplicated. Due to the complexity of the provenance of soilorganic carbon in humic soil horizons, conventional radiocarbonages of bulk samples are not reliable. It is preferable to applyradiocarbon dating on extractions of fulvic acids (FUL), humic acids(HAC) and humin (HUM) (van Mourik et al., 1995, 2010). Thesefractions are based on extractability behavior. Fulvic acids aresoluble in acid and in lye, the humic acids are insoluble in acid and
soluble in lye, and the humin fraction is insoluble in acid and in lye.The biological decomposition rate of FUL is relatively high; theymigrate easily through weak acid soil profiles or leach completely.Therefore, they are unreliable for any dating purposes. The bio-logical decomposition rate of HAC is moderately high. Comparedwith FUL, they are immobile in the soil profiles and more reliablefor dating purposes. The 14C age of HAC is therefore expected toreflect the time of burial of the soil. HUM (including pollen grainsand charcoal) will accumulate in humic topsoil during an activeperiod of soil development; therefore, 14C ages of this fraction willdefinitely overestimate the age of a fossilized (buried) humictopsoil. From these characteristics, the radiocarbon age differencebetween the HUM and HAC fractions of the same level will begreater during periods of active soil formation. Conventional 14Cdating was applied on the HAC and HUM fractions of soil organicmatter, extracted from samples of the histosols, the buried Ahhorizons of the palaeopodzols and on samples from the plaggicdeposits in profile Nabbegat to create a 14C based geochronology.The radiocarbon dates were performed in the Centrum voor Iso-topen Onderzoek (CIO) of the University of Groningen, Netherlands(Table 1). For calibration of the radiocarbon ages to calendar years,the program OxCal 4.1 (1 sigma confidence interval) was used.
3.5. Luminescence dating
Luminescence dating was performed at the Netherlands Centreof Luminescence dating (NCL) of the Delft University of Technology.
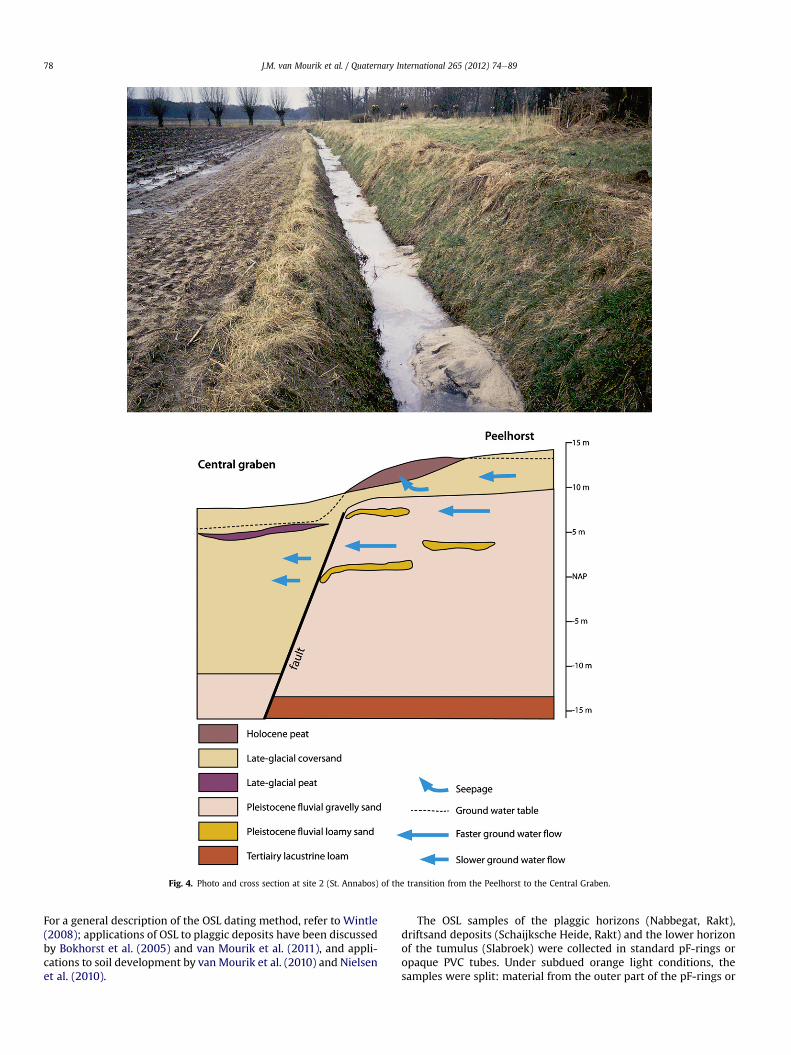
Fig. 4. Photo and cross section at site 2 (St. Annabos) of the transition from the Peelhorst to the Central Graben.
J.M. van Mourik et al. / Quaternary International 265 (2012) 74e8978
For a general description of the OSL dating method, refer to Wintle(2008); applications of OSL to plaggic deposits have been discussedby Bokhorst et al. (2005) and van Mourik et al. (2011), and appli-cations to soil development by van Mourik et al. (2010) and Nielsenet al. (2010).
The OSL samples of the plaggic horizons (Nabbegat, Rakt),driftsand deposits (Schaijksche Heide, Rakt) and the lower horizonof the tumulus (Slabroek) were collected in standard pF-rings oropaque PVC tubes. Under subdued orange light conditions, thesamples were split: material from the outer part of the pF-rings or
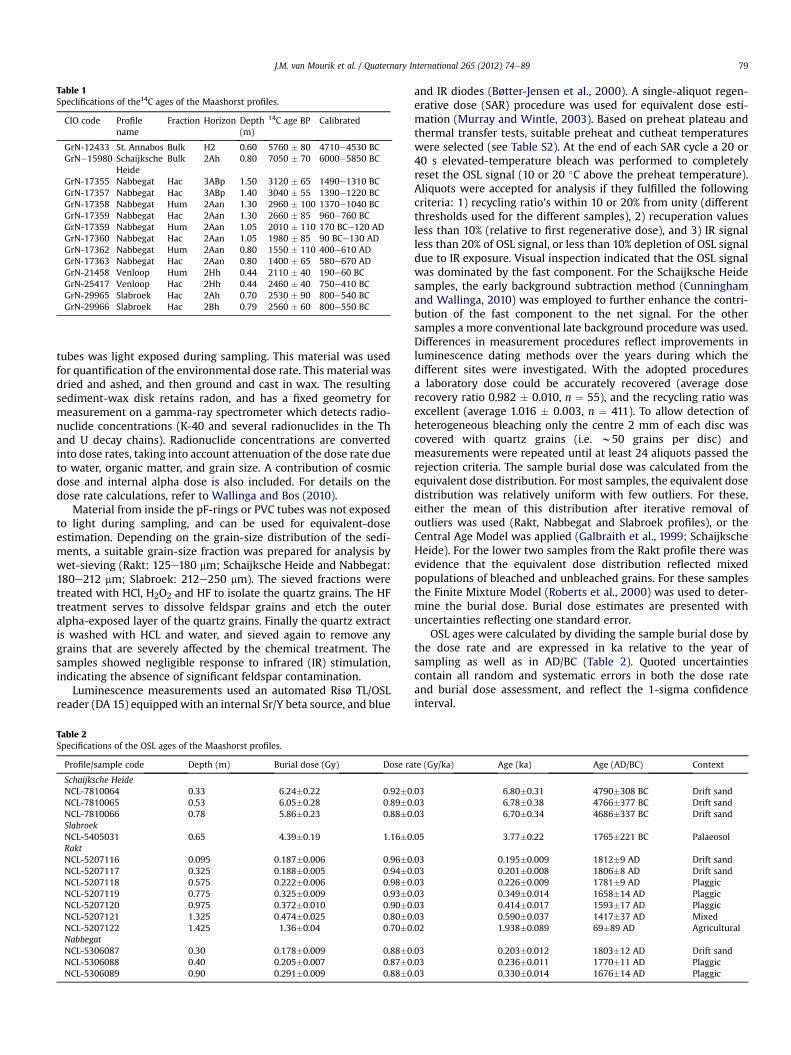
Table 1Speclifications of the14C ages of the Maashorst profiles.
CIO code Profilename
Fraction Horizon Depth(m)
14C age BP Calibrated
GrN-12433 St. Annabos Bulk H2 0.60 5760 � 80 4710e4530 BCGrNe15980 Schaijksche
HeideBulk 2Ah 0.80 7050 � 70 6000e5850 BC
GrN-17355 Nabbegat Hac 3ABp 1.50 3120 � 65 1490e1310 BCGrN-17357 Nabbegat Hac 3ABp 1.40 3040 � 55 1390e1220 BCGrN-17358 Nabbegat Hum 2Aan 1.30 2960 � 100 1370e1040 BCGrN-17359 Nabbegat Hac 2Aan 1.30 2660 � 85 960e760 BCGrN-17359 Nabbegat Hum 2Aan 1.05 2010 � 110 170 BCe120 ADGrN-17360 Nabbegat Hac 2Aan 1.05 1980 � 85 90 BCe130 ADGrN-17362 Nabbegat Hum 2Aan 0.80 1550 � 110 400e610 ADGrN-17363 Nabbegat Hac 2Aan 0.80 1400 � 65 580e670 ADGrN-21458 Venloop Hum 2Hh 0.44 2110 � 40 190e60 BCGrN-25417 Venloop Hac 2Hh 0.44 2460 � 40 750e410 BCGrN-29965 Slabroek Hac 2Ah 0.70 2530 � 90 800e540 BCGrN-29966 Slabroek Hac 2Bh 0.79 2560 � 60 800e550 BC
J.M. van Mourik et al. / Quaternary International 265 (2012) 74e89 79
tubes was light exposed during sampling. This material was usedfor quantification of the environmental dose rate. This material wasdried and ashed, and then ground and cast in wax. The resultingsediment-wax disk retains radon, and has a fixed geometry formeasurement on a gamma-ray spectrometer which detects radio-nuclide concentrations (K-40 and several radionuclides in the Thand U decay chains). Radionuclide concentrations are convertedinto dose rates, taking into account attenuation of the dose rate dueto water, organic matter, and grain size. A contribution of cosmicdose and internal alpha dose is also included. For details on thedose rate calculations, refer to Wallinga and Bos (2010).
Material from inside the pF-rings or PVC tubes was not exposedto light during sampling, and can be used for equivalent-doseestimation. Depending on the grain-size distribution of the sedi-ments, a suitable grain-size fraction was prepared for analysis bywet-sieving (Rakt: 125e180 mm; Schaijksche Heide and Nabbegat:180e212 mm; Slabroek: 212e250 mm). The sieved fractions weretreated with HCl, H2O2 and HF to isolate the quartz grains. The HFtreatment serves to dissolve feldspar grains and etch the outeralpha-exposed layer of the quartz grains. Finally the quartz extractis washed with HCL and water, and sieved again to remove anygrains that are severely affected by the chemical treatment. Thesamples showed negligible response to infrared (IR) stimulation,indicating the absence of significant feldspar contamination.
Luminescence measurements used an automated Risø TL/OSLreader (DA 15) equipped with an internal Sr/Y beta source, and blue
Table 2Specifications of the OSL ages of the Maashorst profiles.
Profile/sample code Depth (m) Burial dose (Gy) Dose ra
Schaijksche HeideNCL-7810064 0.33 6.24�0.22 0.92�0NCL-7810065 0.53 6.05�0.28 0.89�0NCL-7810066 0.78 5.86�0.23 0.88�0SlabroekNCL-5405031 0.65 4.39�0.19 1.16�0RaktNCL-5207116 0.095 0.187�0.006 0.96�0NCL-5207117 0.325 0.188�0.005 0.94�0NCL-5207118 0.575 0.222�0.006 0.98�0NCL-5207119 0.775 0.325�0.009 0.93�0NCL-5207120 0.975 0.372�0.010 0.90�0NCL-5207121 1.325 0.474�0.025 0.80�0NCL-5207122 1.425 1.36�0.04 0.70�0NabbegatNCL-5306087 0.30 0.178�0.009 0.88�0NCL-5306088 0.40 0.205�0.007 0.87�0NCL-5306089 0.90 0.291�0.009 0.88�0
and IR diodes (Bøtter-Jensen et al., 2000). A single-aliquot regen-erative dose (SAR) procedure was used for equivalent dose esti-mation (Murray and Wintle, 2003). Based on preheat plateau andthermal transfer tests, suitable preheat and cutheat temperatureswere selected (see Table S2). At the end of each SAR cycle a 20 or40 s elevated-temperature bleach was performed to completelyreset the OSL signal (10 or 20 �C above the preheat temperature).Aliquots were accepted for analysis if they fulfilled the followingcriteria: 1) recycling ratio’s within 10 or 20% from unity (differentthresholds used for the different samples), 2) recuperation valuesless than 10% (relative to first regenerative dose), and 3) IR signalless than 20% of OSL signal, or less than 10% depletion of OSL signaldue to IR exposure. Visual inspection indicated that the OSL signalwas dominated by the fast component. For the Schaijksche Heidesamples, the early background subtraction method (Cunninghamand Wallinga, 2010) was employed to further enhance the contri-bution of the fast component to the net signal. For the othersamples a more conventional late background procedure was used.Differences in measurement procedures reflect improvements inluminescence dating methods over the years during which thedifferent sites were investigated. With the adopted proceduresa laboratory dose could be accurately recovered (average doserecovery ratio 0.982 � 0.010, n ¼ 55), and the recycling ratio wasexcellent (average 1.016 � 0.003, n ¼ 411). To allow detection ofheterogeneous bleaching only the centre 2 mm of each disc wascovered with quartz grains (i.e. w50 grains per disc) andmeasurements were repeated until at least 24 aliquots passed therejection criteria. The sample burial dose was calculated from theequivalent dose distribution. For most samples, the equivalent dosedistribution was relatively uniform with few outliers. For these,either the mean of this distribution after iterative removal ofoutliers was used (Rakt, Nabbegat and Slabroek profiles), or theCentral Age Model was applied (Galbraith et al., 1999; SchaijkscheHeide). For the lower two samples from the Rakt profile there wasevidence that the equivalent dose distribution reflected mixedpopulations of bleached and unbleached grains. For these samplesthe Finite Mixture Model (Roberts et al., 2000) was used to deter-mine the burial dose. Burial dose estimates are presented withuncertainties reflecting one standard error.
OSL ages were calculated by dividing the sample burial dose bythe dose rate and are expressed in ka relative to the year ofsampling as well as in AD/BC (Table 2). Quoted uncertaintiescontain all random and systematic errors in both the dose rateand burial dose assessment, and reflect the 1-sigma confidenceinterval.
te (Gy/ka) Age (ka) Age (AD/BC) Context
.03 6.80�0.31 4790�308 BC Drift sand
.03 6.78�0.38 4766�377 BC Drift sand
.03 6.70�0.34 4686�337 BC Drift sand
.05 3.77�0.22 1765�221 BC Palaeosol
.03 0.195�0.009 1812�9 AD Drift sand
.03 0.201�0.008 1806�8 AD Drift sand
.03 0.226�0.009 1781�9 AD Plaggic
.03 0.349�0.014 1658�14 AD Plaggic
.03 0.414�0.017 1593�17 AD Plaggic
.03 0.590�0.037 1417�37 AD Mixed
.02 1.938�0.089 69�89 AD Agricultural
.03 0.203�0.012 1803�12 AD Drift sand
.03 0.236�0.011 1770�11 AD Plaggic
.03 0.330�0.014 1676�14 AD Plaggic
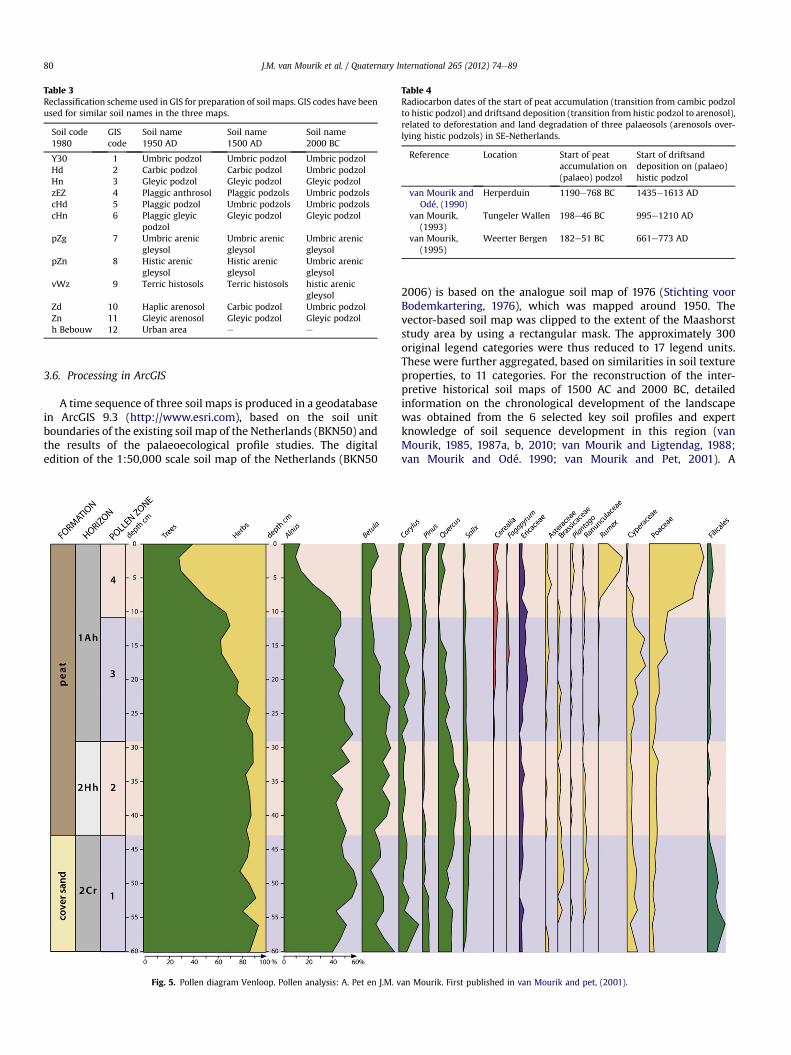
Table 3Reclassification scheme used in GIS for preparation of soil maps. GIS codes have beenused for similar soil names in the three maps.
Soil code1980
GIScode
Soil name1950 AD
Soil name1500 AD
Soil name2000 BC
Y30 1 Umbric podzol Umbric podzol Umbric podzolHd 2 Carbic podzol Carbic podzol Umbric podzolHn 3 Gleyic podzol Gleyic podzol Gleyic podzolzEZ 4 Plaggic anthrosol Plaggic podzols Umbric podzolscHd 5 Plaggic podzol Umbric podzols Umbric podzolscHn 6 Plaggic gleyic
podzolGleyic podzol Gleyic podzol
pZg 7 Umbric arenicgleysol
Umbric arenicgleysol
Umbric arenicgleysol
pZn 8 Histic arenicgleysol
Histic arenicgleysol
Umbric arenicgleysol
vWz 9 Terric histosols Terric histosols histic arenicgleysol
Zd 10 Haplic arenosol Carbic podzol Umbric podzolZn 11 Gleyic arenosol Gleyic podzol Gleyic podzolh Bebouw 12 Urban area e e
Table 4Radiocarbon dates of the start of peat accumulation (transition from cambic podzolto histic podzol) and driftsand deposition (transition from histic podzol to arenosol),related to deforestation and land degradation of three palaeosols (arenosols over-lying histic podzols) in SE-Netherlands.
Reference Location Start of peataccumulation on(palaeo) podzol
Start of driftsanddeposition on (palaeo)histic podzol
van Mourik andOdé, (1990)
Herperduin 1190e768 BC 1435e1613 AD
van Mourik,(1993)
Tungeler Wallen 198e46 BC 995e1210 AD
van Mourik,(1995)
Weerter Bergen 182e51 BC 661e773 AD
J.M. van Mourik et al. / Quaternary International 265 (2012) 74e8980
3.6. Processing in ArcGIS
A time sequence of three soil maps is produced in a geodatabasein ArcGIS 9.3 (http://www.esri.com), based on the soil unitboundaries of the existing soil map of the Netherlands (BKN50) andthe results of the palaeoecological profile studies. The digitaledition of the 1:50,000 scale soil map of the Netherlands (BKN50
Fig. 5. Pollen diagram Venloop. Pollen analysis: A. Pet en J.M. v
2006) is based on the analogue soil map of 1976 (Stichting voorBodemkartering, 1976), which was mapped around 1950. Thevector-based soil map was clipped to the extent of the Maashorststudy area by using a rectangular mask. The approximately 300original legend categories were thus reduced to 17 legend units.These were further aggregated, based on similarities in soil textureproperties, to 11 categories. For the reconstruction of the inter-pretive historical soil maps of 1500 AC and 2000 BC, detailedinformation on the chronological development of the landscapewas obtained from the 6 selected key soil profiles and expertknowledge of soil sequence development in this region (vanMourik, 1985, 1987a, b, 2010; van Mourik and Ligtendag, 1988;van Mourik and Odé. 1990; van Mourik and Pet, 2001). A
an Mourik. First published in van Mourik and pet, (2001).
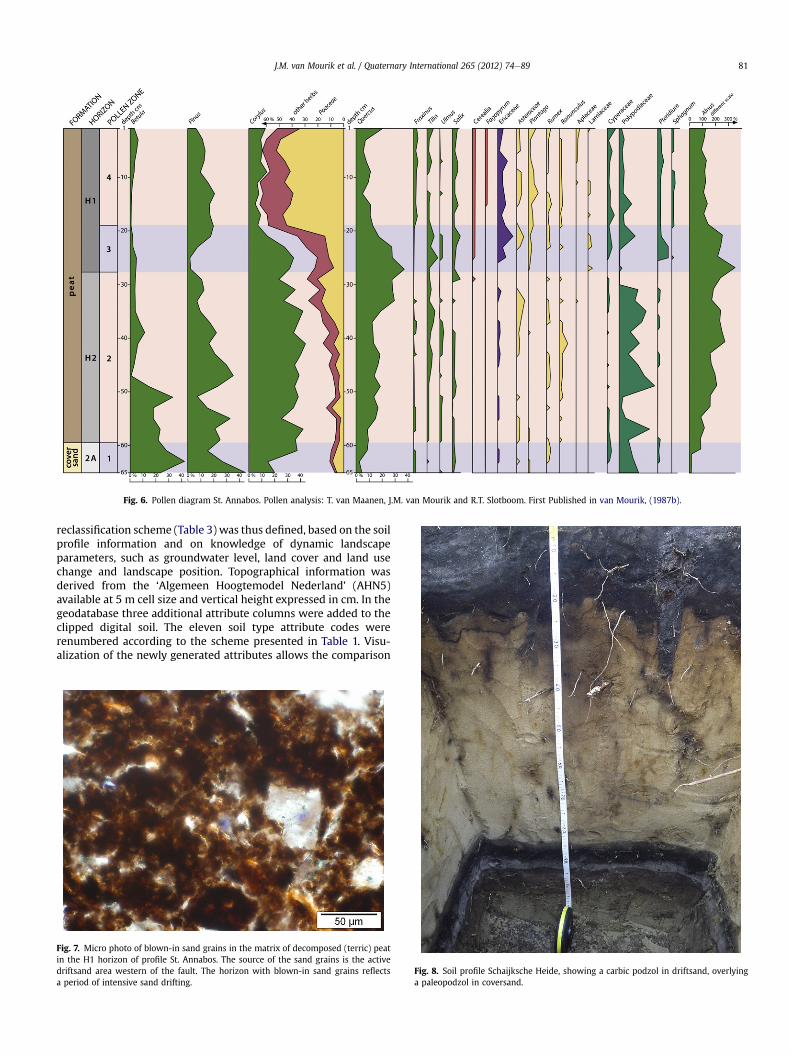
Fig. 6. Pollen diagram St. Annabos. Pollen analysis: T. van Maanen, J.M. van Mourik and R.T. Slotboom. First Published in van Mourik, (1987b).
J.M. van Mourik et al. / Quaternary International 265 (2012) 74e89 81
reclassification scheme (Table 3) was thus defined, based on the soilprofile information and on knowledge of dynamic landscapeparameters, such as groundwater level, land cover and land usechange and landscape position. Topographical information wasderived from the ‘Algemeen Hoogtemodel Nederland’ (AHN5)available at 5 m cell size and vertical height expressed in cm. In thegeodatabase three additional attribute columns were added to theclipped digital soil. The eleven soil type attribute codes wererenumbered according to the scheme presented in Table 1. Visu-alization of the newly generated attributes allows the comparison
Fig. 7. Micro photo of blown-in sand grains in the matrix of decomposed (terric) peatin the H1 horizon of profile St. Annabos. The source of the sand grains is the activedriftsand area western of the fault. The horizon with blown-in sand grains reflectsa period of intensive sand drifting.
Fig. 8. Soil profile Schaijksche Heide, showing a carbic podzol in driftsand, overlyinga paleopodzol in coversand.
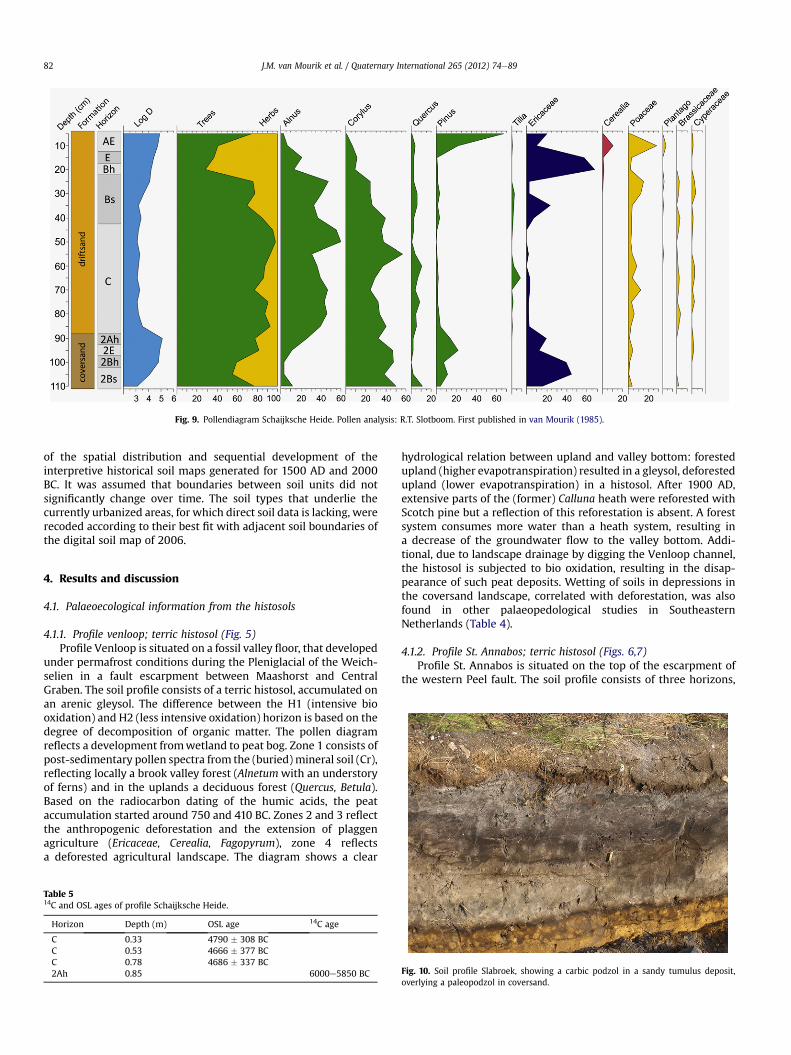
Fig. 9. Pollendiagram Schaijksche Heide. Pollen analysis: R.T. Slotboom. First published in van Mourik (1985).
J.M. van Mourik et al. / Quaternary International 265 (2012) 74e8982
of the spatial distribution and sequential development of theinterpretive historical soil maps generated for 1500 AD and 2000BC. It was assumed that boundaries between soil units did notsignificantly change over time. The soil types that underlie thecurrently urbanized areas, for which direct soil data is lacking, wererecoded according to their best fit with adjacent soil boundaries ofthe digital soil map of 2006.
4. Results and discussion
4.1. Palaeoecological information from the histosols
4.1.1. Profile venloop; terric histosol (Fig. 5)Profile Venloop is situated on a fossil valley floor, that developed
under permafrost conditions during the Pleniglacial of the Weich-selien in a fault escarpment between Maashorst and CentralGraben. The soil profile consists of a terric histosol, accumulated onan arenic gleysol. The difference between the H1 (intensive biooxidation) and H2 (less intensive oxidation) horizon is based on thedegree of decomposition of organic matter. The pollen diagramreflects a development fromwetland to peat bog. Zone 1 consists ofpost-sedimentary pollen spectra from the (buried)mineral soil (Cr),reflecting locally a brook valley forest (Alnetumwith an understoryof ferns) and in the uplands a deciduous forest (Quercus, Betula).Based on the radiocarbon dating of the humic acids, the peataccumulation started around 750 and 410 BC. Zones 2 and 3 reflectthe anthropogenic deforestation and the extension of plaggenagriculture (Ericaceae, Cerealia, Fagopyrum), zone 4 reflectsa deforested agricultural landscape. The diagram shows a clear
Table 514C and OSL ages of profile Schaijksche Heide.
Horizon Depth (m) OSL age 14C age
C 0.33 4790 � 308 BCC 0.53 4666 � 377 BCC 0.78 4686 � 337 BC2Ah 0.85 6000e5850 BC
hydrological relation between upland and valley bottom: forestedupland (higher evapotranspiration) resulted in a gleysol, deforestedupland (lower evapotranspiration) in a histosol. After 1900 AD,extensive parts of the (former) Calluna heath were reforested withScotch pine but a reflection of this reforestation is absent. A forestsystem consumes more water than a heath system, resulting ina decrease of the groundwater flow to the valley bottom. Addi-tional, due to landscape drainage by digging the Venloop channel,the histosol is subjected to bio oxidation, resulting in the disap-pearance of such peat deposits. Wetting of soils in depressions inthe coversand landscape, correlated with deforestation, was alsofound in other palaeopedological studies in SoutheasternNetherlands (Table 4).
4.1.2. Profile St. Annabos; terric histosol (Figs. 6,7)Profile St. Annabos is situated on the top of the escarpment of
the western Peel fault. The soil profile consists of three horizons,
Fig. 10. Soil profile Slabroek, showing a carbic podzol in a sandy tumulus deposit,overlying a paleopodzol in coversand.
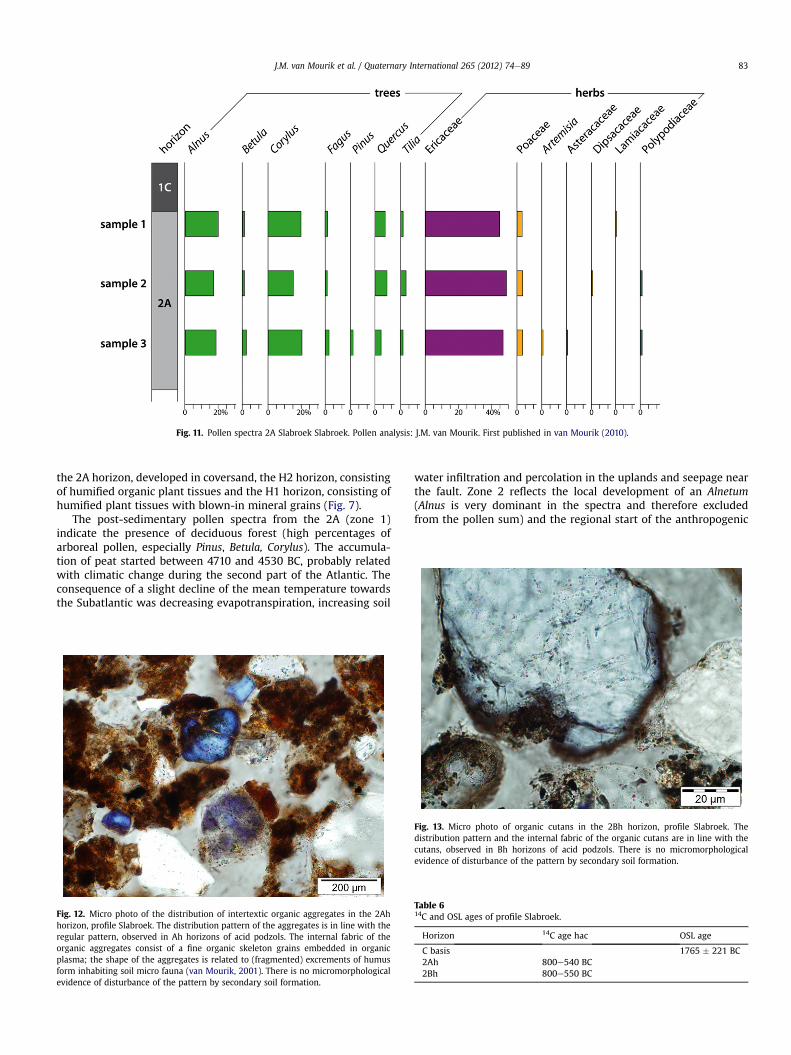
Fig. 11. Pollen spectra 2A Slabroek Slabroek. Pollen analysis: J.M. van Mourik. First published in van Mourik (2010).
J.M. van Mourik et al. / Quaternary International 265 (2012) 74e89 83
the 2A horizon, developed in coversand, the H2 horizon, consistingof humified organic plant tissues and the H1 horizon, consisting ofhumified plant tissues with blown-in mineral grains (Fig. 7).
The post-sedimentary pollen spectra from the 2A (zone 1)indicate the presence of deciduous forest (high percentages ofarboreal pollen, especially Pinus, Betula, Corylus). The accumula-tion of peat started between 4710 and 4530 BC, probably relatedwith climatic change during the second part of the Atlantic. Theconsequence of a slight decline of the mean temperature towardsthe Subatlantic was decreasing evapotranspiration, increasing soil
Fig. 12. Micro photo of the distribution of intertextic organic aggregates in the 2Ahhorizon, profile Slabroek. The distribution pattern of the aggregates is in line with theregular pattern, observed in Ah horizons of acid podzols. The internal fabric of theorganic aggregates consist of a fine organic skeleton grains embedded in organicplasma; the shape of the aggregates is related to (fragmented) excrements of humusform inhabiting soil micro fauna (van Mourik, 2001). There is no micromorphologicalevidence of disturbance of the pattern by secondary soil formation.
water infiltration and percolation in the uplands and seepage nearthe fault. Zone 2 reflects the local development of an Alnetum(Alnus is very dominant in the spectra and therefore excludedfrom the pollen sum) and the regional start of the anthropogenic
Fig. 13. Micro photo of organic cutans in the 2Bh horizon, profile Slabroek. Thedistribution pattern and the internal fabric of the organic cutans are in line with thecutans, observed in Bh horizons of acid podzols. There is no micromorphologicalevidence of disturbance of the pattern by secondary soil formation.
Table 614C and OSL ages of profile Slabroek.
Horizon 14C age hac OSL age
C basis 1765 � 221 BC2Ah 800e540 BC2Bh 800e550 BC
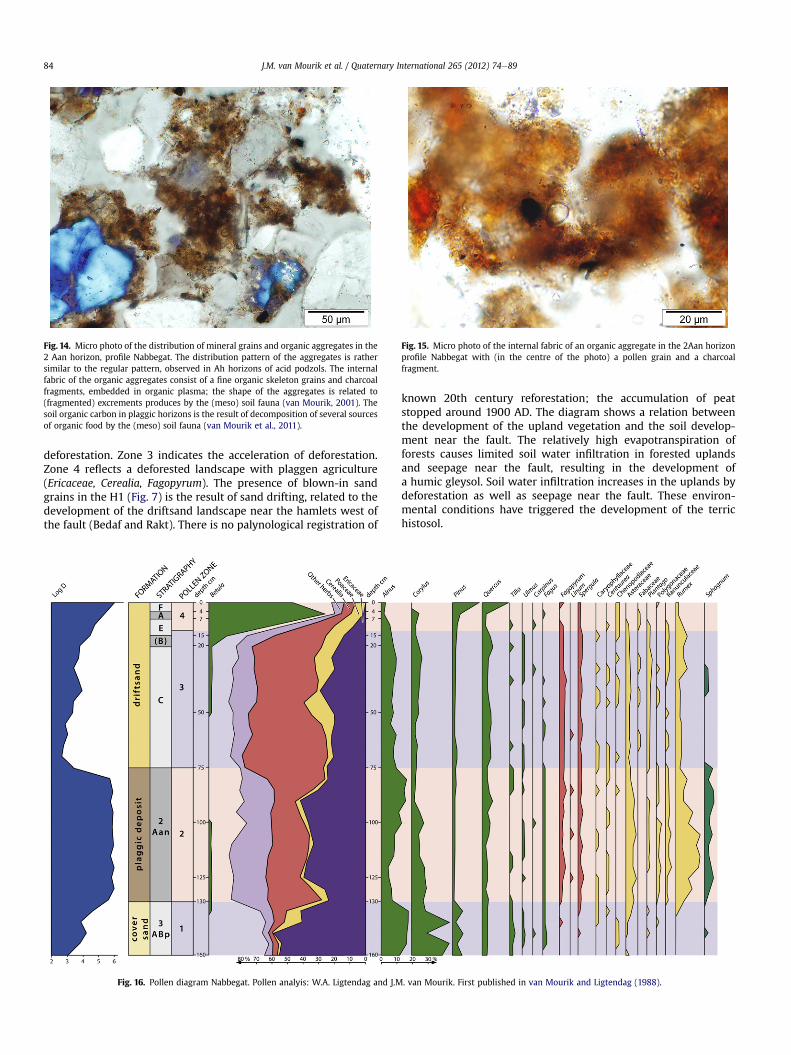
Fig. 15. Micro photo of the internal fabric of an organic aggregate in the 2Aan horizonprofile Nabbegat with (in the centre of the photo) a pollen grain and a charcoalfragment.
Fig. 14. Micro photo of the distribution of mineral grains and organic aggregates in the2 Aan horizon, profile Nabbegat. The distribution pattern of the aggregates is rathersimilar to the regular pattern, observed in Ah horizons of acid podzols. The internalfabric of the organic aggregates consist of a fine organic skeleton grains and charcoalfragments, embedded in organic plasma; the shape of the aggregates is related to(fragmented) excrements produces by the (meso) soil fauna (van Mourik, 2001). Thesoil organic carbon in plaggic horizons is the result of decomposition of several sourcesof organic food by the (meso) soil fauna (van Mourik et al., 2011).
J.M. van Mourik et al. / Quaternary International 265 (2012) 74e8984
deforestation. Zone 3 indicates the acceleration of deforestation.Zone 4 reflects a deforested landscape with plaggen agriculture(Ericaceae, Cerealia, Fagopyrum). The presence of blown-in sandgrains in the H1 (Fig. 7) is the result of sand drifting, related to thedevelopment of the driftsand landscape near the hamlets west ofthe fault (Bedaf and Rakt). There is no palynological registration of
Fig. 16. Pollen diagram Nabbegat. Pollen analyis: W.A. Ligtendag and J.M
known 20th century reforestation; the accumulation of peatstopped around 1900 AD. The diagram shows a relation betweenthe development of the upland vegetation and the soil develop-ment near the fault. The relatively high evapotranspiration offorests causes limited soil water infiltration in forested uplandsand seepage near the fault, resulting in the development ofa humic gleysol. Soil water infiltration increases in the uplands bydeforestation as well as seepage near the fault. These environ-mental conditions have triggered the development of the terrichistosol.
. van Mourik. First published in van Mourik and Ligtendag (1988).
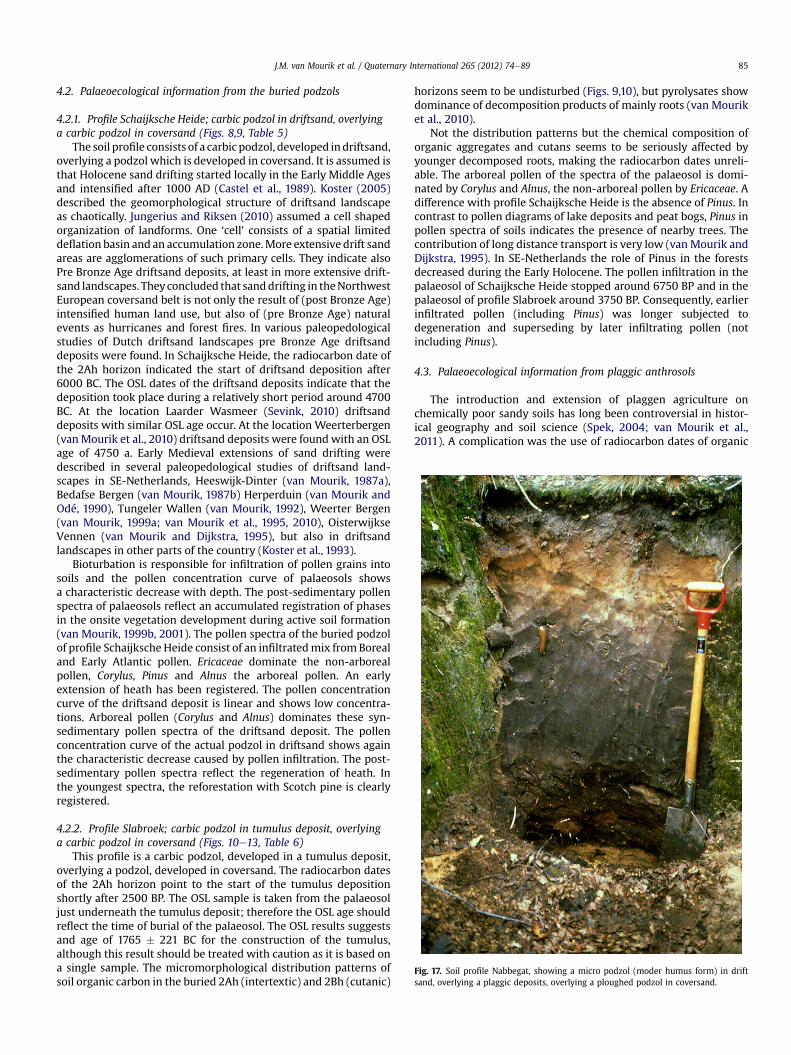
Fig. 17. Soil profile Nabbegat, showing a micro podzol (moder humus form) in driftsand, overlying a plaggic deposits, overlying a ploughed podzol in coversand.
J.M. van Mourik et al. / Quaternary International 265 (2012) 74e89 85
4.2. Palaeoecological information from the buried podzols
4.2.1. Profile Schaijksche Heide; carbic podzol in driftsand, overlyinga carbic podzol in coversand (Figs. 8,9, Table 5)
The soil profile consists of a carbic podzol, developed indriftsand,overlying a podzol which is developed in coversand. It is assumed isthat Holocene sand drifting started locally in the Early Middle Agesand intensified after 1000 AD (Castel et al., 1989). Koster (2005)described the geomorphological structure of driftsand landscapeas chaotically. Jungerius and Riksen (2010) assumed a cell shapedorganization of landforms. One ‘cell’ consists of a spatial limiteddeflation basin and an accumulation zone.More extensive drift sandareas are agglomerations of such primary cells. They indicate alsoPre Bronze Age driftsand deposits, at least in more extensive drift-sand landscapes. Theyconcluded that sanddrifting in theNorthwestEuropean coversand belt is not only the result of (post Bronze Age)intensified human land use, but also of (pre Bronze Age) naturalevents as hurricanes and forest fires. In various paleopedologicalstudies of Dutch driftsand landscapes pre Bronze Age driftsanddeposits were found. In Schaijksche Heide, the radiocarbon date ofthe 2Ah horizon indicated the start of driftsand deposition after6000 BC. The OSL dates of the driftsand deposits indicate that thedeposition took place during a relatively short period around 4700BC. At the location Laarder Wasmeer (Sevink, 2010) driftsanddeposits with similar OSL age occur. At the location Weerterbergen(vanMourik et al., 2010) driftsand deposits were found with an OSLage of 4750 a. Early Medieval extensions of sand drifting weredescribed in several paleopedological studies of driftsand land-scapes in SE-Netherlands, Heeswijk-Dinter (van Mourik, 1987a),Bedafse Bergen (van Mourik, 1987b) Herperduin (van Mourik andOdé, 1990), Tungeler Wallen (van Mourik, 1992), Weerter Bergen(van Mourik, 1999a; van Mourik et al., 1995, 2010), OisterwijkseVennen (van Mourik and Dijkstra, 1995), but also in driftsandlandscapes in other parts of the country (Koster et al., 1993).
Bioturbation is responsible for infiltration of pollen grains intosoils and the pollen concentration curve of palaeosols showsa characteristic decrease with depth. The post-sedimentary pollenspectra of palaeosols reflect an accumulated registration of phasesin the onsite vegetation development during active soil formation(van Mourik, 1999b, 2001). The pollen spectra of the buried podzolof profile Schaijksche Heide consist of an infiltratedmix from Borealand Early Atlantic pollen. Ericaceae dominate the non-arborealpollen, Corylus, Pinus and Alnus the arboreal pollen. An earlyextension of heath has been registered. The pollen concentrationcurve of the driftsand deposit is linear and shows low concentra-tions. Arboreal pollen (Corylus and Alnus) dominates these syn-sedimentary pollen spectra of the driftsand deposit. The pollenconcentration curve of the actual podzol in driftsand shows againthe characteristic decrease caused by pollen infiltration. The post-sedimentary pollen spectra reflect the regeneration of heath. Inthe youngest spectra, the reforestation with Scotch pine is clearlyregistered.
4.2.2. Profile Slabroek; carbic podzol in tumulus deposit, overlyinga carbic podzol in coversand (Figs. 10e13, Table 6)
This profile is a carbic podzol, developed in a tumulus deposit,overlying a podzol, developed in coversand. The radiocarbon datesof the 2Ah horizon point to the start of the tumulus depositionshortly after 2500 BP. The OSL sample is taken from the palaeosoljust underneath the tumulus deposit; therefore the OSL age shouldreflect the time of burial of the palaeosol. The OSL results suggestsand age of 1765 � 221 BC for the construction of the tumulus,although this result should be treated with caution as it is based ona single sample. The micromorphological distribution patterns ofsoil organic carbon in the buried 2Ah (intertextic) and 2Bh (cutanic)
horizons seem to be undisturbed (Figs. 9,10), but pyrolysates showdominance of decomposition products of mainly roots (van Mouriket al., 2010).
Not the distribution patterns but the chemical composition oforganic aggregates and cutans seems to be seriously affected byyounger decomposed roots, making the radiocarbon dates unreli-able. The arboreal pollen of the spectra of the palaeosol is domi-nated by Corylus and Alnus, the non-arboreal pollen by Ericaceae. Adifference with profile Schaijksche Heide is the absence of Pinus. Incontrast to pollen diagrams of lake deposits and peat bogs, Pinus inpollen spectra of soils indicates the presence of nearby trees. Thecontribution of long distance transport is very low (van Mourik andDijkstra, 1995). In SE-Netherlands the role of Pinus in the forestsdecreased during the Early Holocene. The pollen infiltration in thepalaeosol of Schaijksche Heide stopped around 6750 BP and in thepalaeosol of profile Slabroek around 3750 BP. Consequently, earlierinfiltrated pollen (including Pinus) was longer subjected todegeneration and superseding by later infiltrating pollen (notincluding Pinus).
4.3. Palaeoecological information from plaggic anthrosols
The introduction and extension of plaggen agriculture onchemically poor sandy soils has long been controversial in histor-ical geography and soil science (Spek, 2004; van Mourik et al.,2011). A complication was the use of radiocarbon dates of organic
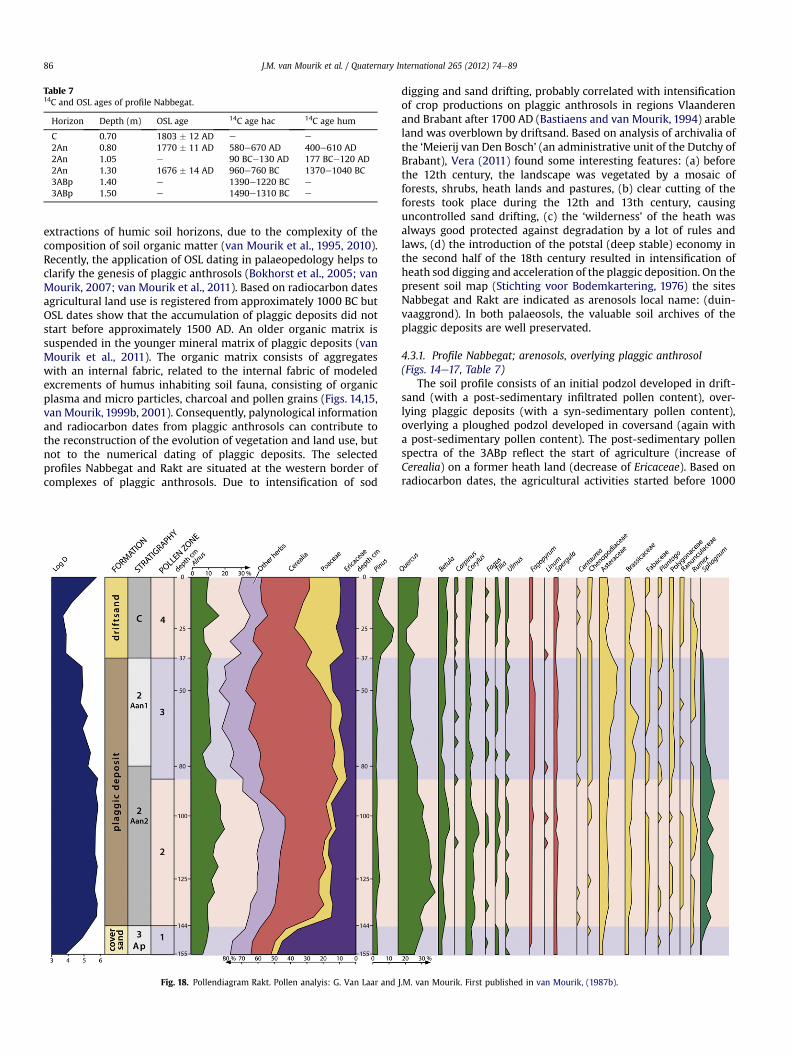
Table 714C and OSL ages of profile Nabbegat.
Horizon Depth (m) OSL age 14C age hac 14C age hum
C 0.70 1803 � 12 AD e e
2An 0.80 1770 � 11 AD 580e670 AD 400e610 AD2An 1.05 e 90 BCe130 AD 177 BCe120 AD2An 1.30 1676 � 14 AD 960e760 BC 1370e1040 BC3ABp 1.40 e 1390e1220 BC e
3ABp 1.50 e 1490e1310 BC e
J.M. van Mourik et al. / Quaternary International 265 (2012) 74e8986
extractions of humic soil horizons, due to the complexity of thecomposition of soil organic matter (van Mourik et al., 1995, 2010).Recently, the application of OSL dating in palaeopedology helps toclarify the genesis of plaggic anthrosols (Bokhorst et al., 2005; vanMourik, 2007; van Mourik et al., 2011). Based on radiocarbon datesagricultural land use is registered from approximately 1000 BC butOSL dates show that the accumulation of plaggic deposits did notstart before approximately 1500 AD. An older organic matrix issuspended in the younger mineral matrix of plaggic deposits (vanMourik et al., 2011). The organic matrix consists of aggregateswith an internal fabric, related to the internal fabric of modeledexcrements of humus inhabiting soil fauna, consisting of organicplasma and micro particles, charcoal and pollen grains (Figs. 14,15,van Mourik, 1999b, 2001). Consequently, palynological informationand radiocarbon dates from plaggic anthrosols can contribute tothe reconstruction of the evolution of vegetation and land use, butnot to the numerical dating of plaggic deposits. The selectedprofiles Nabbegat and Rakt are situated at the western border ofcomplexes of plaggic anthrosols. Due to intensification of sod
Fig. 18. Pollendiagram Rakt. Pollen analyis: G. Van Laar and
digging and sand drifting, probably correlated with intensificationof crop productions on plaggic anthrosols in regions Vlaanderenand Brabant after 1700 AD (Bastiaens and van Mourik, 1994) arableland was overblown by driftsand. Based on analysis of archivalia ofthe ‘Meierij van Den Bosch’ (an administrative unit of the Dutchy ofBrabant), Vera (2011) found some interesting features: (a) beforethe 12th century, the landscape was vegetated by a mosaic offorests, shrubs, heath lands and pastures, (b) clear cutting of theforests took place during the 12th and 13th century, causinguncontrolled sand drifting, (c) the ‘wilderness’ of the heath wasalways good protected against degradation by a lot of rules andlaws, (d) the introduction of the potstal (deep stable) economy inthe second half of the 18th century resulted in intensification ofheath sod digging and acceleration of the plaggic deposition. On thepresent soil map (Stichting voor Bodemkartering, 1976) the sitesNabbegat and Rakt are indicated as arenosols local name: (duin-vaaggrond). In both palaeosols, the valuable soil archives of theplaggic deposits are well preservated.
4.3.1. Profile Nabbegat; arenosols, overlying plaggic anthrosol(Figs. 14e17, Table 7)
The soil profile consists of an initial podzol developed in drift-sand (with a post-sedimentary infiltrated pollen content), over-lying plaggic deposits (with a syn-sedimentary pollen content),overlying a ploughed podzol developed in coversand (again witha post-sedimentary pollen content). The post-sedimentary pollenspectra of the 3ABp reflect the start of agriculture (increase ofCerealia) on a former heath land (decrease of Ericaceae). Based onradiocarbon dates, the agricultural activities started before 1000
J.M. van Mourik. First published in van Mourik, (1987b).
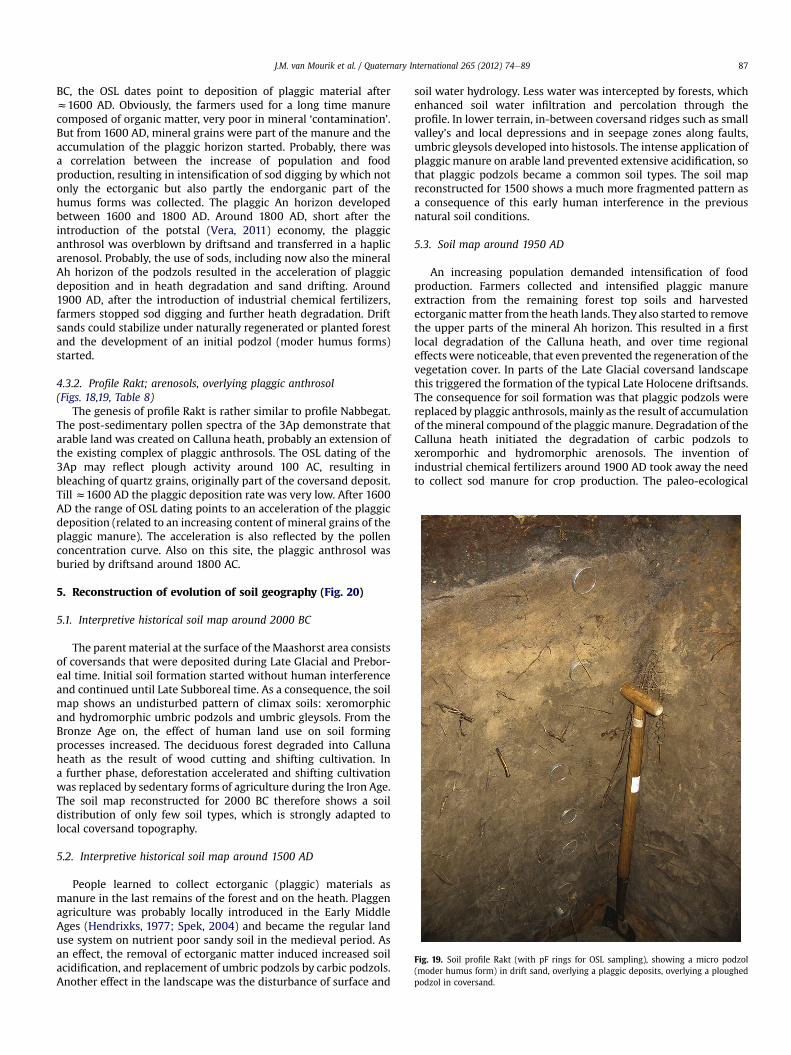
Fig. 19. Soil profile Rakt (with pF rings for OSL sampling), showing a micro podzol(moder humus form) in drift sand, overlying a plaggic deposits, overlying a ploughedpodzol in coversand.
J.M. van Mourik et al. / Quaternary International 265 (2012) 74e89 87
BC, the OSL dates point to deposition of plaggic material afterz1600 AD. Obviously, the farmers used for a long time manurecomposed of organic matter, very poor in mineral ‘contamination’.But from 1600 AD, mineral grains were part of the manure and theaccumulation of the plaggic horizon started. Probably, there wasa correlation between the increase of population and foodproduction, resulting in intensification of sod digging by which notonly the ectorganic but also partly the endorganic part of thehumus forms was collected. The plaggic An horizon developedbetween 1600 and 1800 AD. Around 1800 AD, short after theintroduction of the potstal (Vera, 2011) economy, the plaggicanthrosol was overblown by driftsand and transferred in a haplicarenosol. Probably, the use of sods, including now also the mineralAh horizon of the podzols resulted in the acceleration of plaggicdeposition and in heath degradation and sand drifting. Around1900 AD, after the introduction of industrial chemical fertilizers,farmers stopped sod digging and further heath degradation. Driftsands could stabilize under naturally regenerated or planted forestand the development of an initial podzol (moder humus forms)started.
4.3.2. Profile Rakt; arenosols, overlying plaggic anthrosol(Figs. 18,19, Table 8)
The genesis of profile Rakt is rather similar to profile Nabbegat.The post-sedimentary pollen spectra of the 3Ap demonstrate thatarable land was created on Calluna heath, probably an extension ofthe existing complex of plaggic anthrosols. The OSL dating of the3Ap may reflect plough activity around 100 AC, resulting inbleaching of quartz grains, originally part of the coversand deposit.Till z1600 AD the plaggic deposition rate was very low. After 1600AD the range of OSL dating points to an acceleration of the plaggicdeposition (related to an increasing content of mineral grains of theplaggic manure). The acceleration is also reflected by the pollenconcentration curve. Also on this site, the plaggic anthrosol wasburied by driftsand around 1800 AC.
5. Reconstruction of evolution of soil geography (Fig. 20)
5.1. Interpretive historical soil map around 2000 BC
The parentmaterial at the surface of theMaashorst area consistsof coversands that were deposited during Late Glacial and Prebor-eal time. Initial soil formation started without human interferenceand continued until Late Subboreal time. As a consequence, the soilmap shows an undisturbed pattern of climax soils: xeromorphicand hydromorphic umbric podzols and umbric gleysols. From theBronze Age on, the effect of human land use on soil formingprocesses increased. The deciduous forest degraded into Callunaheath as the result of wood cutting and shifting cultivation. Ina further phase, deforestation accelerated and shifting cultivationwas replaced by sedentary forms of agriculture during the Iron Age.The soil map reconstructed for 2000 BC therefore shows a soildistribution of only few soil types, which is strongly adapted tolocal coversand topography.
5.2. Interpretive historical soil map around 1500 AD
People learned to collect ectorganic (plaggic) materials asmanure in the last remains of the forest and on the heath. Plaggenagriculture was probably locally introduced in the Early MiddleAges (Hendrixks, 1977; Spek, 2004) and became the regular landuse system on nutrient poor sandy soil in the medieval period. Asan effect, the removal of ectorganic matter induced increased soilacidification, and replacement of umbric podzols by carbic podzols.Another effect in the landscape was the disturbance of surface and
soil water hydrology. Less water was intercepted by forests, whichenhanced soil water infiltration and percolation through theprofile. In lower terrain, in-between coversand ridges such as smallvalley’s and local depressions and in seepage zones along faults,umbric gleysols developed into histosols. The intense application ofplaggic manure on arable land prevented extensive acidification, sothat plaggic podzols became a common soil types. The soil mapreconstructed for 1500 shows a much more fragmented pattern asa consequence of this early human interference in the previousnatural soil conditions.
5.3. Soil map around 1950 AD
An increasing population demanded intensification of foodproduction. Farmers collected and intensified plaggic manureextraction from the remaining forest top soils and harvestedectorganicmatter from the heath lands. They also started to removethe upper parts of the mineral Ah horizon. This resulted in a firstlocal degradation of the Calluna heath, and over time regionaleffects were noticeable, that even prevented the regeneration of thevegetation cover. In parts of the Late Glacial coversand landscapethis triggered the formation of the typical Late Holocene driftsands.The consequence for soil formation was that plaggic podzols werereplaced by plaggic anthrosols, mainly as the result of accumulationof themineral compound of the plaggic manure. Degradation of theCalluna heath initiated the degradation of carbic podzols toxeromporhic and hydromorphic arenosols. The invention ofindustrial chemical fertilizers around 1900 AD took away the needto collect sod manure for crop production. The paleo-ecological
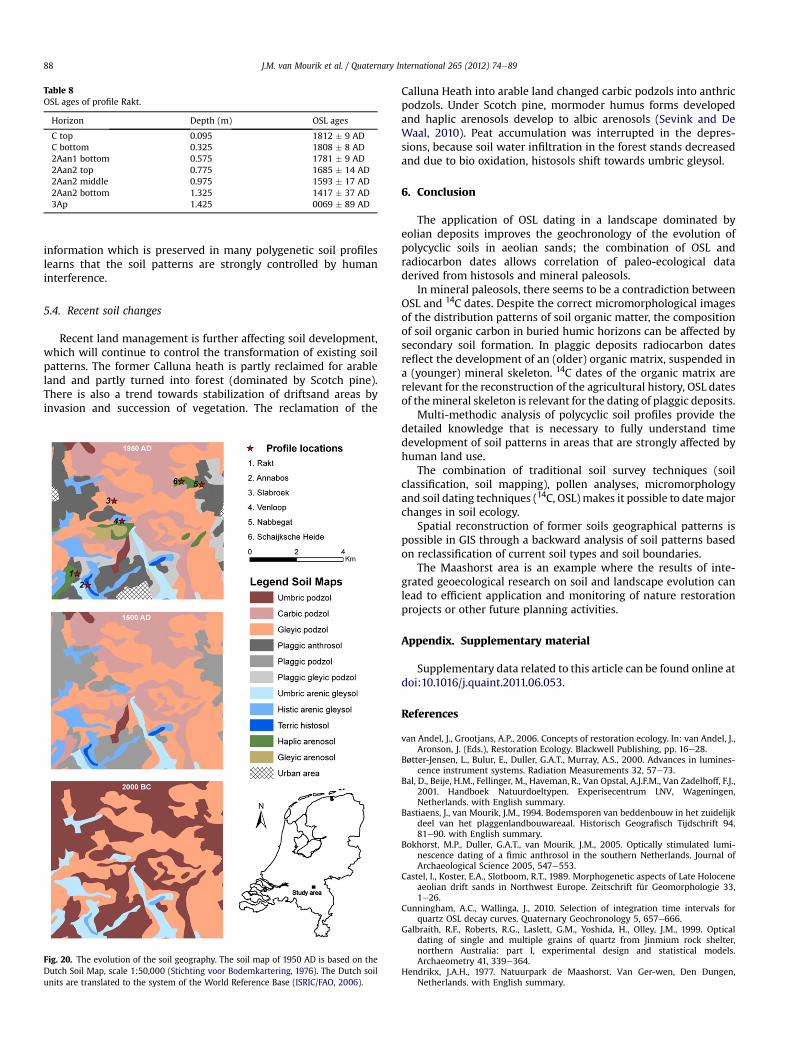
Table 8OSL ages of profile Rakt.
Horizon Depth (m) OSL ages
C top 0.095 1812 � 9 ADC bottom 0.325 1808 � 8 AD2Aan1 bottom 0.575 1781 � 9 AD2Aan2 top 0.775 1685 � 14 AD2Aan2 middle 0.975 1593 � 17 AD2Aan2 bottom 1.325 1417 � 37 AD3Ap 1.425 0069 � 89 AD
J.M. van Mourik et al. / Quaternary International 265 (2012) 74e8988
information which is preserved in many polygenetic soil profileslearns that the soil patterns are strongly controlled by humaninterference.
5.4. Recent soil changes
Recent land management is further affecting soil development,which will continue to control the transformation of existing soilpatterns. The former Calluna heath is partly reclaimed for arableland and partly turned into forest (dominated by Scotch pine).There is also a trend towards stabilization of driftsand areas byinvasion and succession of vegetation. The reclamation of the
Fig. 20. The evolution of the soil geography. The soil map of 1950 AD is based on theDutch Soil Map, scale 1:50,000 (Stichting voor Bodemkartering, 1976). The Dutch soilunits are translated to the system of the World Reference Base (ISRIC/FAO, 2006).
Calluna Heath into arable land changed carbic podzols into anthricpodzols. Under Scotch pine, mormoder humus forms developedand haplic arenosols develop to albic arenosols (Sevink and DeWaal, 2010). Peat accumulation was interrupted in the depres-sions, because soil water infiltration in the forest stands decreasedand due to bio oxidation, histosols shift towards umbric gleysol.
6. Conclusion
The application of OSL dating in a landscape dominated byeolian deposits improves the geochronology of the evolution ofpolycyclic soils in aeolian sands; the combination of OSL andradiocarbon dates allows correlation of paleo-ecological dataderived from histosols and mineral paleosols.
In mineral paleosols, there seems to be a contradiction betweenOSL and 14C dates. Despite the correct micromorphological imagesof the distribution patterns of soil organic matter, the compositionof soil organic carbon in buried humic horizons can be affected bysecondary soil formation. In plaggic deposits radiocarbon datesreflect the development of an (older) organic matrix, suspended ina (younger) mineral skeleton. 14C dates of the organic matrix arerelevant for the reconstruction of the agricultural history, OSL datesof themineral skeleton is relevant for the dating of plaggic deposits.
Multi-methodic analysis of polycyclic soil profiles provide thedetailed knowledge that is necessary to fully understand timedevelopment of soil patterns in areas that are strongly affected byhuman land use.
The combination of traditional soil survey techniques (soilclassification, soil mapping), pollen analyses, micromorphologyand soil dating techniques (14C, OSL) makes it possible to datemajorchanges in soil ecology.
Spatial reconstruction of former soils geographical patterns ispossible in GIS through a backward analysis of soil patterns basedon reclassification of current soil types and soil boundaries.
The Maashorst area is an example where the results of inte-grated geoecological research on soil and landscape evolution canlead to efficient application and monitoring of nature restorationprojects or other future planning activities.
Appendix. Supplementary material
Supplementary data related to this article can be found online atdoi:10.1016/j.quaint.2011.06.053.
References
van Andel, J., Grootjans, A.P., 2006. Concepts of restoration ecology. In: van Andel, J.,Aronson, J. (Eds.), Restoration Ecology. Blackwell Publishing, pp. 16e28.
Bøtter-Jensen, L., Bulur, E., Duller, G.A.T., Murray, A.S., 2000. Advances in lumines-cence instrument systems. Radiation Measurements 32, 57e73.
Bal, D., Beije, H.M., Fellinger, M., Haveman, R., Van Opstal, A.J.F.M., Van Zadelhoff, F.J.,2001. Handboek Natuurdoeltypen. Experisecentrum LNV, Wageningen,Netherlands. with English summary.
Bastiaens, J., van Mourik, J.M., 1994. Bodemsporen van beddenbouw in het zuidelijkdeel van het plaggenlandbouwareaal. Historisch Geografisch Tijdschrift 94,81e90. with English summary.
Bokhorst, M.P., Duller, G.A.T., van Mourik, J.M., 2005. Optically stimulated lumi-nescence dating of a fimic anthrosol in the southern Netherlands. Journal ofArchaeological Science 2005, 547e553.
Castel, I., Koster, E.A., Slotboom, R.T., 1989. Morphogenetic aspects of Late Holoceneaeolian drift sands in Northwest Europe. Zeitschrift für Geomorphologie 33,1e26.
Cunningham, A.C., Wallinga, J., 2010. Selection of integration time intervals forquartz OSL decay curves. Quaternary Geochronology 5, 657e666.
Galbraith, R.F., Roberts, R.G., Laslett, G.M., Yoshida, H., Olley, J.M., 1999. Opticaldating of single and multiple grains of quartz from Jinmium rock shelter,northern Australia: part I, experimental design and statistical models.Archaeometry 41, 339e364.
Hendrikx, J.A.H., 1977. Natuurpark de Maashorst. Van Ger-wen, Den Dungen,Netherlands. with English summary.
J.M. van Mourik et al. / Quaternary International 265 (2012) 74e89 89
ISRIC-FAO, 2006. World Reference Base for Soil Recourses 2006. World soilresources reports 103.
Jongerius, A., Heintzberger, G., 1975. Methods in Soil Micromorphology. Soil SurveyPapers 10, Wageningen, Netherlands.
Jungerius, P.D., Riksen, M.J.P.M., 2010. Contribution of laser altimetry images to thegeomorphology of the Late Holocene inland drift sands of the European sandbelt. Baltica 23, 59e70.
Koster, E.A., 2005. Aeolian environments. In: Koster, E.A. (Ed.), The Physical Geog-raphy of Western Europe. Oxford Regional Environments. Oxford UniversityPress, pp. 139e160.
Koster, E.A., 2009. The European aeolian sand belt: geoconservation of drift sandlandscapes. Geoheritage 1, 93e1120.
Koster, E.A., 2010. Origin and development of Late Holocene drift sands. In: Fanta, J.,Siepel, H. (Eds.), Inland Drift Sand Landscapes. KNVV Publishing, Zeist,Netherlands, pp. 25e48.
Koster, E.A., Castel, I.I.Y., Nap, R.L., 1993. In: Peye, K. (Ed.), The Dynamics andEnvironmental Context of Aeolian Sedimentary Systems. Geological SocietySpecial Publication, vol. 72, pp. 247e267.
Moore, P.D., Webb, J.A., Collinson, M.E., 1991. Pollen Analyses. Blackwell ScientificPublications, Oxford.
van Mourik, J.M., 1985. Een eeuwenjong podzolprofiel op de Schaijksche Heide.Geografisch Tijdschrift XIX-2, 105e112. with English summary.
van Mourik, J.M., 1987. Het stuifzand van Heeswijk-Dinther. Geografisch TijdschriftXXI-4, 327e337. with English summary.
van Mourik, J.M., 1987. Laat glaciaal veen en holoceen stuif-zand bij de Peelbreuktussen Nistelrode en Uden. Geografisch Tijdschrift XXI, 421e436. with Englishsummary.
van Mourik, J.M., 1992. Het ontstaan van de Tungeler Wallen. Weerter Jaarboek1993, 88e102.
van Mourik, J.M., 1999. Het aardkundig erfgoed van de Weerter Bergen. Weerter-jaarboek 2000, 103e113.
van Mourik, J.M., 1999. The use of micromorphology in soil pollen analysis. Catena35, 239e257.
van Mourik, J.M., 2001. Pollen and spores, preservation in ecological settings. In:Briggs, E.G., Crowther, P.R. (Eds.), Palaeobiology II. Blackwell Science,pp. 315e318.
van Mourik, J.M., 2007. Toepassing van optisch gestimuleerde luminescentiedater-ingen op enkdekken. In: Beenakker, J.J.M., Hortsen, F.H., De Kraker, A.M.J.,Renes, H. (Eds.), Landschap in ruimte en tijd. Askant, Amsterdam, pp. 263e277.
van Mourik, J.M., 2010. Resultaten van het dateringsonderzoek van grafheuvel 39 opde Slabroekse Heide. In: van Wijk, I.M., Jansen, R. (Eds.), Het urnenveld Slab-roekse Heide op de Maashorst. Archol 72, Leiden, Netherlands, pp. 67e73.
van Mourik, J.M., Dijkstra, E.F., 1995. Geen inheemse dennen rond de Oisterwijkschevennen; een palyno-ecologische studie. Nederlands Bosbouwtijdschrift 67e2,51e59. with English summary.
van Mourik, J.M., Ligtendag, W.A., 1988. De overstoven enk van Nabbegat. Geo-grafisch Tijdschrift XXIIe5, 412e420. with English summary.
van Mourik, J.M., Odé, B., 1990. Het Herperduin. Geografisch Tijdschrift XXIVe2,160e167. with English summary.
van Mourik, J.M., Pet, A., 2001. Broekbos of Ecobeek? Natuurontwikkeling in het dalvan de Venloop. Nederlands Bosbouw Tijdschrift 2001e4, 12e16. with Englishsummary.
van Mourik, J.M., Wartenbergh, P.E., Mook, W.J., Streur-man, H.J., 1995. Radiocarbondating of palaeosols in eolian sands. Mededelingen Rijks Geologische Dienst 52,425e439.
van Mourik, J.M., Nierop, K.G.J., Vandenberghe, D.A.G., 2010. Radiocarbon andoptically stimulated luminescence dating based chronology of a polycyclicdriftsand sequence at Weerterbergen (SE Netherlands). Catena 80, 170e181(2010).
van Mourik, J.M., Slotboom, R.T., Wallinga, J., 2011. Chronology of plaggic deposits;palynology, radiocarbon and optically stimulated luminescence dating of thePosteles (NE-Netherlands). Catena 84, 54e60.
Murray, A.S., Wintle, A.G., 2003. The single aliquot regenera0tive dose protocol:potential for improvements in reliability. Radiation Measurement 37, 377e381.
Nielsen, A.H., Elberling, B., Pejrup, M., 2010. Soil development rates from an opti-cally stimulated luminescence-dated beach ridge sequence in Northern Jutland,Denmark. Canadian Journal of Soil Science 90, 295e307.
Roberts, R.G., Galbraith, R.F., Yoshida, H., Laslett, G.M., Olley, J.M., 2000. Dis-tinguishing dose populations in sediment mixtures: a test of single-grainoptical dating procedures using mixtures of laboratory-dosed quartz. Radia-tion Measurements 32, 459e465.
Sevink, J., 2010. Precisiewerk bij bodemsanering. Vakblad natuur, bos, landschap,26e29. november 2010.
Sevink, J., De Waal, R.W., 2010. Soil and humus development in drift sands. In:Fanta, J., Siepel, H. (Eds.), Inland Drift sand Landscapes. KNVV Publishing, Zeist,Netherlands, pp. 107e134.
Spek, T., 2004. Het Drentse esdorpenlandschap, een historisch geografische studie.Matrijs, Utrecht, Chapter 5. (with English summary).
Stichting voor Bodemkartering, 1976. Bodemkaart van Nederland blad 45-oost mettoelichting, ’s-Hertogenbosch. Pudoc, Wageningen, Netherlands.
Stichting voor Bodemkartering, 1983. Geomorfologische kaart van Neder-land.schaal 1:50.000, blad 45. Pudoc, Wageningen, Netherlands.
Vera, H., 2011. ‘dat men het goed vande ongeboornen niet mag verkoopen’; Gemenegronden in de Meierij van Den Bosch tussen hertog en hertgang 1000 e 2000.Uitgeverij BOXpress, Oisterwijk, netherlands (with English summary).
Wallinga, J., Bos, I.J., 2010. Optical dating of fluvio deltaic clastic lake-fill sed-imentsda feasibility study in the Holocene Rhine delta (western Netherlands).Quaternary Geochronology 5, 602e610.
van Wijk, I.M., Jansen, R. (Eds.), 2010. Het urnenveld Slabroekse heide op de Maa-shorst. Archol 72, Leiden, Netherlands.
Wintle, A.G., 2008. Luminescence dating: where it has been and where it is going.Boreas 37, 471e482.
Wolters-Noordhoff, 1990. Grote Historische Atlas van Nederland 1:50000. 4 Zuid-Nederland, 1838e1857.
Related Documents