Impact of Global Warming on Snow in Ski Areas: A Case Study Using a Regional Climate Simulation over the Interior Western United States CHRISTIAN PHILIPP LACKNER, a,b BART GEERTS, a AND YONGGANG WANG c a Department of Atmospheric Science, University of Wyoming, Laramie, Wyoming b Institute for Atmospheric Physics, Johannes Gutenberg University, Mainz, Germany c Department of Atmospheric and Geological Sciences, State University of New York at Oswego, Oswego, New York (Manuscript received 11 July 2020, in final form 10 February 2021) ABSTRACT: A high-resolution (4 km) regional climate simulation conducted with the Weather Research and Forecasting Model is used to investigate potential impacts of global warming on skiing conditions in the interior western United States (IWUS). Recent-past and near-future climate conditions are compared. The past climate period is from November 1981 to October 2011. The future climate applies to a 30-yr period centered on 2050. A pseudo–global warming approach is used, with the driver reanalysis dataset perturbed by the CMIP5 ensemble mean model guidance. Using the 30-yr retrospective simulation, a vertical adjustment technique is used to determine meteorological parameters in the complex terrain where ski areas are located. For snow water equivalent (SWE), Snowpack Telemetry sites close to ski areas are used to validate the technique and apply a correction to SWE in ski areas. The vulnerability to climate change is assessed for 71 ski areas in the IWUS considering SWE, artificially produced snow, temperature, and rain; 20 of the ski areas will tend to have fewer than 100 days per season with sufficient natural and artificial snow for skiing. These ski areas are located at either low elevations or low latitudes, making these areas the most vulnerable to climate change. Throughout the snow season, natural SWE decreases significantly at the low elevations and low latitudes. At higher elevations, changes in SWE are predicted to not be significant in the midseason. In mid-February, SWE decreases by 11.8% at the top elevations of ski areas and decreases by 25.8% at the base elevations. KEYWORDS: Snowpack; Climate change; Adaptation 1. Introduction Snow is a valuable resource that supports many industries. Thus, there is a need to evaluate how changing snow cover due to climate change will impact these industries (Sturm et al. 2017). The skiing industry is one such industry that heavily relies on snow to ensure operations. Therefore, it can be con- sidered vulnerable to climate change. Years with early melting periods and inadequate snow cover will become more common in the Northern Hemisphere toward the late twenty-first century (Rhoades et al. 2018), and economic distress from low snow years might increase within the next three decades (Diffenbaugh et al. 2013). Ski resorts in the western United States can be ex- pected to be affected by these changes caused by warmer tem- peratures and decreases in the snow-to-precipitation ratio (Ashfaq et al. 2013). The impact may vary regionally; for in- stance, in maritime regions the sensitivity of the snow-cover duration to global warming was higher than in continental re- gions (Brown and Mote 2009). Considering these future changes in snow cover, the vul- nerability of the skiing industry to climate change has been shown in many studies in different parts of the world. Different areas include but are not limited to Australia (e.g., Hennessy et al. 2008), Austria (e.g., Steiger 2010), France (e.g., Pons et al. 2015), and Switzerland (e.g., Koenig and Abegg 1997). The various studies project decreased natural snow amounts, in- creased requirements, and challenges for snowmaking and shortened and more variable ski seasons lengths (Steiger et al. 2019). Low-elevation ski areas are most impacted by snow- deficient winters, causing less demand for skiing there (e.g., Koenig and Abegg 1997). High-elevation ski areas may profit from the decreased demand in low-elevation ski areas and experience increasing demand, consistent with observations in Austria that winters with poor snow conditions tend to de- crease (increase) demand in low-elevation (high elevation) ski areas (Töeglhofer et al. 2011). Snow conditions in the context of climate change in ski areas in North America have been investigated in different regions. Studies focusing on Ontario (Scott et al. 2003, 2019), the northeastern United States (e.g., Scott et al. 2007; Beaudin and Huang 2014; Scott et al. 2019), Arizona (Bark et al. 2010), and the whole contiguous United States (CONUS) (Wobus et al. 2017) concur that potential season lengths are decreasing and that snowmaking is gaining interest as an adaption technique to mitigate the effects of climate change. Warm winters have impacted the ski industry in the United States in the past. The winter of 2011/12 was one of the warmest on record in the CONUS and, as a result, saw the fewest ski visits (51 million) in the period from 1992/93 to 2019/20 (NSAA 2021). Beaudin and Huang (2014) found that in New England climate change may already have significantly contributed to changes in the local ski industry. Scott et al. (2003) pointed out the particular im- portance of snowmaking in studies on climate impacts in ski areas to display skiing operations realistically. The objective of this study is to compare downhill skiing conditions in recreational ski areas in the interior western United States (IWUS) under past and future climate conditions. Corresponding author: Bart Geerts, [email protected] MAY 2021 LACKNER ET AL. 677 DOI: 10.1175/JAMC-D-20-0155.1 Ó 2021 American Meteorological Society. For information regarding reuse of this content and general copyright information, consult the AMS Copyright Policy (www.ametsoc.org/PUBSReuseLicenses). Unauthenticated | Downloaded 06/03/22 04:52 PM UTC

Welcome message from author
This document is posted to help you gain knowledge. Please leave a comment to let me know what you think about it! Share it to your friends and learn new things together.
Transcript

Impact of Global Warming on Snow in Ski Areas A Case Study Using a Regional ClimateSimulation over the Interior Western United States
CHRISTIAN PHILIPP LACKNERab BART GEERTSa AND YONGGANG WANGc
aDepartment of Atmospheric Science University of Wyoming Laramie Wyomingb Institute for Atmospheric Physics Johannes Gutenberg University Mainz Germany
cDepartment of Atmospheric and Geological Sciences State University of New York at Oswego Oswego New York
(Manuscript received 11 July 2020 in final form 10 February 2021)
ABSTRACT A high-resolution (4 km) regional climate simulation conducted with theWeather Research and Forecasting
Model is used to investigate potential impacts of global warming on skiing conditions in the interior western United States
(IWUS) Recent-past and near-future climate conditions are compared The past climate period is from November 1981 to
October 2011 The future climate applies to a 30-yr period centered on 2050 A pseudondashglobal warming approach is used
with the driver reanalysis dataset perturbed by the CMIP5 ensemble mean model guidance Using the 30-yr retrospective
simulation a vertical adjustment technique is used to determinemeteorological parameters in the complex terrain where ski
areas are located For snow water equivalent (SWE) Snowpack Telemetry sites close to ski areas are used to validate the
technique and apply a correction to SWE in ski areas The vulnerability to climate change is assessed for 71 ski areas in the
IWUS considering SWE artificially produced snow temperature and rain 20 of the ski areas will tend to have fewer than
100 days per season with sufficient natural and artificial snow for skiing These ski areas are located at either low elevations
or low latitudes making these areas the most vulnerable to climate change Throughout the snow season natural SWE
decreases significantly at the low elevations and low latitudes At higher elevations changes in SWE are predicted to not be
significant in the midseason In mid-February SWE decreases by 118 at the top elevations of ski areas and decreases by
258 at the base elevations
KEYWORDS Snowpack Climate change Adaptation
1 Introduction
Snow is a valuable resource that supports many industries
Thus there is a need to evaluate how changing snow cover due
to climate change will impact these industries (Sturm et al
2017) The skiing industry is one such industry that heavily
relies on snow to ensure operations Therefore it can be con-
sidered vulnerable to climate change Years with early melting
periods and inadequate snow cover will becomemore common
in theNorthernHemisphere toward the late twenty-first century
(Rhoades et al 2018) and economic distress from low snow
yearsmight increase within the next three decades (Diffenbaugh
et al 2013) Ski resorts in the western United States can be ex-
pected to be affected by these changes caused by warmer tem-
peratures and decreases in the snow-to-precipitation ratio
(Ashfaq et al 2013) The impact may vary regionally for in-
stance in maritime regions the sensitivity of the snow-cover
duration to global warming was higher than in continental re-
gions (Brown and Mote 2009)
Considering these future changes in snow cover the vul-
nerability of the skiing industry to climate change has been
shown in many studies in different parts of the world Different
areas include but are not limited to Australia (eg Hennessy
et al 2008) Austria (eg Steiger 2010) France (eg Pons et al
2015) and Switzerland (eg Koenig and Abegg 1997) The
various studies project decreased natural snow amounts in-
creased requirements and challenges for snowmaking and
shortened and more variable ski seasons lengths (Steiger et al
2019) Low-elevation ski areas are most impacted by snow-
deficient winters causing less demand for skiing there (eg
Koenig and Abegg 1997) High-elevation ski areas may profit
from the decreased demand in low-elevation ski areas and
experience increasing demand consistent with observations in
Austria that winters with poor snow conditions tend to de-
crease (increase) demand in low-elevation (high elevation) ski
areas (Toumleglhofer et al 2011)Snow conditions in the context of climate change in ski areas
in North America have been investigated in different regions
Studies focusing on Ontario (Scott et al 2003 2019) the
northeastern United States (eg Scott et al 2007 Beaudin and
Huang 2014 Scott et al 2019) Arizona (Bark et al 2010) and
the whole contiguous United States (CONUS) (Wobus et al
2017) concur that potential season lengths are decreasing and
that snowmaking is gaining interest as an adaption technique to
mitigate the effects of climate change Warm winters have
impacted the ski industry in the United States in the past The
winter of 201112 was one of the warmest on record in the
CONUS and as a result saw the fewest ski visits (51 million) in
the period from 199293 to 201920 (NSAA 2021) Beaudin and
Huang (2014) found that in New England climate change may
already have significantly contributed to changes in the local
ski industry Scott et al (2003) pointed out the particular im-
portance of snowmaking in studies on climate impacts in ski
areas to display skiing operations realistically
The objective of this study is to compare downhill skiing
conditions in recreational ski areas in the interior western
United States (IWUS) under past and future climate conditionsCorresponding author Bart Geerts geertsuwyoedu
MAY 2021 LACKNER ET AL 677
DOI 101175JAMC-D-20-01551
2021 American Meteorological Society For information regarding reuse of this content and general copyright information consult the AMS CopyrightPolicy (wwwametsocorgPUBSReuseLicenses)
Unauthenticated | Downloaded 060322 0452 PM UTC
In the winter of 201819 over 41 of the 593 million ski visits in
the United States were in the Rocky Mountain region (NSAA
2021) making it the most visited skiing region in the country
The Rocky Mountains have diverse climate conditions varying
orography and few studies have looked at ski areas in this region
(eg Zimmerman et al 2006 Bark et al 2010 Battaglin et al
2011Wobus et al 2017) Thus combinedwith the importance of
the skiing industry in the region it is of interest to assess the
vulnerability of the local skiing industry to climate change This
study focuses on vulnerability in the sense of exposure to envi-
ronmental stress caused by climate change and adaptive capacity
to mitigate this stress (Adger 2006) For instance exposure to
environmental stress for ski areas could be decreasing natural
snow amounts or rising temperatures negatively impacting ski-
ing operations in the futureArtificial snowmaking is an adaptive
capacity ski areas have to cope with this exposure A regional
climate simulation over the IWUS conducted with the Weather
Research and Forecasting (WRF)Model is used in this study In
the analysis of skiing conditions we examine natural snowfall
snowmaking potential excessive temperature and rain
Additionally so-called snow indicators as suggested by
Abegg et al (2021) will be used for this analysis
Section 2 will describe the methods of this study including
the regional climate simulation determination validation and
correction of meteorological parameters in the ski areas and
definitions of snow indicators Section 3 will present the results
from the analysis of natural snowfall thresholds for tempera-
ture and rain changes in production potential for artificial
snow and the snow indicators In section 4 implications and
limitations of this study are discussed and choices of certain
parameters are justified The main findings will be summarized
in section 5
2 Methods
a WRF regional climate simulation over the IWUS
This study uses a high-resolution (4km) convection-permitting
regional climate simulation over the IWUS conducted with the
WRF Model (Skamarock et al 2019) For details on the model
configuration see Table 1 More details can be found in Wang
et al (2018) The 4-km resolution and similar WRF physics
choices were used inRasmussen et al (2011 2014) who show that
such setup captures the cold-season precipitation distribution and
amount over the Colorado Headwaters region well with a bias
of 10ndash15 compared to Snowpack Telemetry (SNOTEL)
measurements Because of this good performance in simulating
orographic precipitation over complex terrain similar WRF
simulations have been used to assess changes in orographic pre-
cipitation in a changing global climate For instance Li et al
(2019) and Newman et al (2021) both use convection-permitting
4-km WRF simulations to explore the sensitivity of precipitation
and snowpack to climate change in western Canada and Alaska
respectively Liu et al (2017) extended a 4-kmWRF simulation to
cover the entire contiguous United States although over fewer
years than our simulation The surface temperature and pre-
cipitation for the simulation used in our study have been vali-
dated byWang et al (2018) The cold-season precipitation over
the mountains in the IWUS was validated by Jing et al (2017)
Comparing 10 years of model data against SNOTEL data
across the IWUS Jing et al (2017) find a correlation coefficient
of 095 a mean bias of213mm and root-mean-square bias of
65mm of water-equivalent precipitation in the winter (DJF)
They conclude that simulated seasonal precipitation over
mountains can be more accurate than the numerous gridded
gauge-based precipitation datasets in existence [seeHenn et al
(2018) for a discussion of these datasets] a statement con-
firmed in a broader study by Lundquist et al (2019) Thus
these high-resolution regional climate models of the recent
past are almost equivalent to reanalysis data but of sufficient
resolution to capture finescale orographic snowfall patterns
The model output is used to investigate the skiing condi-
tions both in the recent past and the near future The retro-
spective simulation spans the period from November 1981 to
October 2011 This retrospective climate will be referred to as
historic climate To examine the same patterns in the near-
future climate YWang et al (2020 unpublished manuscript)
used a pseudondashglobal warming (PGW) approach with the
driver dataset perturbed by the CMIP5 ensemble mean
model guidance for 2050 under the representative concen-
tration pathway (RCP) 85 (Pachauri et al 2014) The basic
idea of the PGW approach is to apply the guidance from
global climate models (in this case the ensemble mean CMIP5
climate change signal) to the driver dataset of the regional
climate model (Schaumlr et al 1996) This approach has been
used widely including in studies of changes in orographic
precipitation in the Colorado Headwaters (Rasmussen et al
2011 2014 Eidhammer et al 2018) Thus the historic and
future climate conditions correspond to 1990s and 2050s
conditions The use of 30 years of simulations builds statistical
significance in terms of the mean and the spread of snow
years at any ski resort
Relevant for this study are the hourly model output of sur-
face air temperature rain and snow water equivalent (SWE)
Modeled SWE was chosen over modeled snow depth since it
more accurately describes the total amount of available snow
Furthermore wet-bulb temperature is needed to incorporate
production potential for artificial snow (Olefs et al 2010)Wet-
bulb temperature is calculated using air temperature and rel-
ative humidity (Sadeghi et al 2013) The relative humidity is
TABLE 1 Model configurations
Model parameter Model configuration
Spatial resolution 4 km 3 4 km (420 3 410 grid points)
Vertical levels 51 (topped at 50 hPa)
Driver dataset NCEP Climate Forecast System
Reanalysis (Saha et al 2010)
Microphysics Thompson scheme (Thompson et al 2008)
Radiation Rapid Radiative Transfer Model for
GCMs (Iacono et al 2008)
Planetary
boundary layer
Yonsei University scheme (Hong and
Pan 1996)
Surface layer Revised MoninndashObukhov scheme
(Jimeacutenez et al 2012)Land surface Noah-MP scheme (Niu et al 2011 Yang
et al 2011)
678 JOURNAL OF APPL IED METEOROLOGY AND CL IMATOLOGY VOLUME 60
Unauthenticated | Downloaded 060322 0452 PM UTC
calculated from gridpoint pressure temperature and water
vapor mixing ratio
b Ski areas and SNOTEL sites
Skiing conditions are investigated in different ski areas
throughout the IWUS Snow amounts measured by SNOTEL
stations (Serreze et al 1999) operated by the Natural
Resources Conservation Service (NRCS) are used to vali-
date modeled snow amounts in the ski areas All investigated
ski areas and SNOTEL sites are shown in Fig 1a
A total of 71 ski areas across eight different states (Table 2)
are part of the final study With 22 and 13 ski areas Colorado
andUtah have themost whileArizona and SouthDakota have
only one Not all ski areas within the domain are investigated
Very small ski areas and ski areas closer than 10 grid points to
the edge of the model domain buffer zone were left out
Furthermore seven ski areas where the historic simulation did
not validate well against proximity SNOTEL data were re-
moved from the analysis and are not part of the 71 ski areas
presented in the study
With the help of the online software Google Maps a coor-
dinate close to the spatial midpoint of the ski areas was de-
termined by handMinimum andmaximum elevation of the ski
areas were retrieved from the areasrsquo websites These elevations
will be referred to as base and top these elevations are shown
in Figs 1c and 1d and can be found in Table 2 Ski areas have
the highest elevations in Colorado with top elevations up to
4000m Elevations decrease to the northwest with ski areas in
Idaho having bottom elevations and sometimes also top ele-
vations below 2000m
Each ski area was assigned a SNOTEL site for the validation
of modeled SWE The SNOTEL sites were chosen based on
proximity (close to the ski areas) elevation (between the base
and top elevations) and data completeness (the full 30 years of
the historic climate simulation) On average the SNOTEL sites
were slightly closer to the top elevation (305m below) than the
base elevation (383m above) Only 61 SNOTEL sites were
used since some ski areas are so close to each other that the
same SNOTEL site is used In some cases where no other close
SNOTEL site was found we used a SNOTEL site whose ele-
vation was slightly outside the elevation range of the ski area
which was the case for 10 ski areas or whose data record did not
cover the full 30 years which was the case for 29 ski areas al-
though only for 4 of those it was less than 15 years The ele-
vations of the SNOTEL sites are shown in Fig 1b SNOTEL
data for all sites including elevation coordinates and daily
SWE was retrieved from the NRCS Report Generator 20
(NRCS 2020)
c Meteorological parameters covering the elevation rangeof ski areas
Ski areas are in regions with complex terrain The 4-km
resolution of the model cannot capture all features of the ter-
rain well especially high peaks on which ski areas are often
FIG 1 Study area (a) Red circles indicate ski areas blue triangles indicate select SNOTEL sites (b) Elevations
of SNOTEL sites (c) Base elevations of ski areas (d) Top elevations of ski areas In these maps and in the maps
shown below three clusters of ski areas are zoomed into with insert maps All ski areas are listed in Table 2
MAY 2021 LACKNER ET AL 679
Unauthenticated | Downloaded 060322 0452 PM UTC
TABLE 2 All ski resorts with base and top elevation and median total ski days
Median total ski days
State Ski resort Base elev (m) Top elev (m) Historic Future
AZ Arizona Snowbowl 28040 35050 150 114
CO Arapahoe Basin 32063 39774 216 194
CO Aspen Highlands 24505 37769 176 148
CO Aspen Mountain 24215 34173 161 131
CO Beaver Creek Resort 24688 34867 167 141
CO Breckenridge Ski Resort 29259 39616 200 176
CO Buttermilk Ski Area 23987 30174 134 95
CO Copper Mountain 29601 37528 199 179
CO Crested Butte 28574 37068 192 172
CO Eldora Mountain Resort 28040 32307 183 153
CO Keystone Resort 28284 37818 181 154
CO Loveland Ski Area 32917 39653 225 202
CO Monarch Ski Area 32886 36428 200 173
CO Powderhorn Mountain Resort 24992 30021 143 111
CO Purgatory Resort 26800 32984 160 124
CO Ski Cooper 32002 35660 205 179
CO Snowmass Ski Area 24700 38129 175 147
CO Steamboat Ski Resort 21030 32210 163 139
CO Sunlight Mountain Resort 24032 30158 144 115
CO Telluride Ski Resort 26593 40079 186 157
CO Vail Ski Resort 24749 35264 173 147
CO Winter Park Resort 27431 36757 202 178
CO Wolf Creek Ski Area 31393 36282 214 184
ID Brundage Mountain 17927 23782 186 156
ID Kelly Canyon 17068 20116 107 63
ID Lookout Pass 13715 17220 176 128
ID Pebble Creek 19384 28257 134 92
ID Pomerelle 23651 26705 160 120
ID Schweitzer Mountain 12191 19506 172 134
ID Silver Mountain 12496 19201 142 72
ID Soldier Mountain 17531 21874 124 78
ID Sun Valley 17525 27888 135 105
ID Tamarack 14934 23468 151 97
MT Big Sky 20725 34032 192 169
MT Blacktail Mountain 15959 20347 139 95
MT Bridger Bowl Ski Area 18592 26821 161 130
MT Discovery 20878 24840 193 167
MT Great Divide 17464 22045 145 94
MT Lost Trail 19506 24992 181 155
MT Maverick Mountain 19811 25145 164 142
MT Montana Snowball 15178 23103 177 146
MT Red Lodge Mountain 21384 28699 186 145
MT Showdown 20725 24992 187 162
MT Whitefish Mountain 13606 20777 168 120
NM Angel Fire Resort 26212 32542 126 87
NM Pajarito Mountain 27431 31820 118 80
NM Red River Ski Area 26669 31545 114 77
NM Sipapu 24992 28208 98 58
NM Ski Santa Fe 31545 36803 171 136
NM Taos Ski Valley 28040 38040 164 137
SD Terry Peak 17982 21640 127 93
UT Alta 25998 33734 214 184
UT Beaver Mountain 21823 27004 169 136
UT Brian Head Ski Resort 29259 33435 178 147
UT Brighton Ski Resort 26669 32002 208 175
UT Cherry Peak Resort 17601 21487 120 83
UT Deer Valley 20024 29168 139 99
UT Eagle Point Ski Resort 27735 32307 172 145
680 JOURNAL OF APPL IED METEOROLOGY AND CL IMATOLOGY VOLUME 60
Unauthenticated | Downloaded 060322 0452 PM UTC
located However the elevation dependency of temperature
and snow amounts is an important factor influencing skiing
conditions Therefore a vertical adjustment technique (VAT)
of these parameters was used A 5 3 5 box of grid points
around the grid point closest to the coordinate of each ski area
was determined At these 25 grid points the values of tem-
perature wet-bulb temperature and SWE are used for a linear
regression against elevation For the temperatures this is done
hourly and for SWE daily The linear regression for SWE only
uses each of the 13 grid points with the lowest elevations when
these have above zero SWE This is done since on many days
there is no snow at low elevations and much snow at high el-
evations Thus using the grid points with zero SWE at low
elevations would skew the linear regression to lower SWE
values and the values at higher elevations might be under-
estimated by the linear regression The 12 grid points with the
higher elevations are always used even if SWE at these grid
points is zero to retain information about the elevation of the
snow line Using this technique an approximate value of these
parameters can be determined at every elevation in the area of
the box
Rain in the ski areas is determined by the mean over a 33 3
box of grid points around the grid point closest to the ski area
coordinate Using rain amounts the number of days exceeding
rain of 1mm (lsquolsquowet daysrsquorsquo for simplicity) in each ski area can be
determined This is of interest since wet days might have a
decreased demand for skiing due to the negative impacts of
rain on snow quality for skiing
d Validation and correction of SWE values
While it can be assumed that temperature and wet-bulb
temperature have a linear lapse rate with height this might not
be the case for snow parameters It can be expected that snow
amounts have a positive elevation gradient (eg Lehning et al
2011 Gruumlnewald et al 2013) however the technique using a
linear regression should be validated The VAT is applied to
different SNOTEL sites the same way as described before For
each day of the historic climate simulation the simulated SWE
amount at the elevation of each SNOTEL site is compared to
the measured SWE value at the same time This is illustrated in
Fig 2a showing the SNOTEL site Tower which is the site used
for the ski area Steamboat Ski Resort Colorado Since very
small snow amounts are not of interest in this study only days
are compared on which both the SNOTEL value and the
modeled value exceeded 1mm of SWE At all sites the model
has an overall negative mean bias underestimating the snow-
pack compared to SNOTEL as is the case for SNOTEL site
Tower (Fig 2a) For this reason a correction is applied to the
modeled daily SWE values SWEWRF Since the relative bias is
increasing the lower the SWE values are this correction is
applied in bins of 100mm of SWE The correction is a mean
bias correction (Maraun 2016) First the means of SWE cal-
culated with theVAT SWEWRFbin are determined for each bin
Thereafter the SNOTEL SWE values measured on the same
days as the values in each SWEWRFbin are used to calculate the
corresponding SWESNOTELbin These two means are used to
determine a correction factor for every bin By multiplying
each model value SWEWRF with the correction factor of its
corresponding bin corrected SWE values SWEWRFcorr are
obtained
SWEWRFcorr
5 SWEWRF
3SWE
SNOTELbin
SWEWRFbin
(1)
The results of this correction are illustrated for the same
SNOTEL site in Fig 2b Because of the nature of the correc-
tion themean bias of SWEWRFcorr is 0 Averaged over all sites
the model underestimated SWE by 1431mm relative to
SNOTEL meaning the correction adds on average this value
to the model values Next a linear regression is applied to the
corrected SWE values If the correlation squared R2 is below
01 the ski area corresponding to the SNOTEL site is elimi-
nated from the study due to the insufficient validation of the
simulation This was the case for seven ski areas in the IWUS
(Bogus Basin Idaho Lee Canyon Nevada Nordic Valley
Utah three ski areas in eastern Washington and Hogadon
Wyoming) There are different reasons why the model might
not validate well against SNOTEL at certain sites In
Washington the reason is likely the proximity to the up-
stream boundary where precipitation in the simulation has a
TABLE 2 (Continued)
Median total ski days
State Ski resort Base elev (m) Top elev (m) Historic Future
UT Park City Mountain Resort 20725 30558 151 115
UT Powder Mountain 21039 28717 171 142
UT Snowbasin Resort 19659 28848 122 84
UT Snowbird 23651 33526 202 171
UT Solitude Mountain Resort 24365 31966 197 167
UT Sundance Resort 18592 25145 101 62
WY Grand Targhee 22578 30058 213 184
WY Jackson Hole 19235 31850 179 154
WY Pine Creek 20802 25069 122 91
WY Sleeping Giant Ski Resort 20174 22639 125 96
WY Snow King Mountain 19009 23798 127 95
WY Snowy Range 27431 30479 183 152
WY White Pine 25754 28955 184 162
MAY 2021 LACKNER ET AL 681
Unauthenticated | Downloaded 060322 0452 PM UTC
strong dry bias (Wang et al 2018) For the other sites the
reason might be related to local terrain features influencing
precipitation that are not captured well by the model
For all other 71 ski areas the corrections from the SNOTEL
sites were applied individually to the daily SWE values in the ski
areas assigned to each site Moreover the correction is used in
both historic and future climates Figure 3 shows theR2 for all ski
areas given by their SNOTEL site 52 of the ski areas and all ski
areas in Colorado have R2 values above 05 whereas 13 have
values below 03 including all ski areas in New Mexico The
results at those locations potentially have a larger uncertainty
e Artificial snow
To realistically capture the potential for skiing operations it is
important to consider artificial snow in a climate vulnerability
study (eg Scott et al 2003 Steiger et al 2019) Since artificially
made snow is not modeled in the land surface model it must be
accounted for differently Here the snowmaking production
potential as defined by Olefs et al (2010) will be used From
data from snow gunmanufacturers Olefs et al (2010) calculated
how much snow could be artificially produced by a snow gun
depending on the ambient wet-bulb temperature Tw They gave
values for so-called fan guns and airndashwater guns For simplicity
we use the average of the two with an estimated loss of 10
from sublimation and loss through wind (Olefs et al 2010)
Other than weather (Tw) the production potential is only lim-
ited bywater availability The production potential pp of snow in
cubic meters per hour per gun is given by
pp5 09(24385Tw2 0145) (2)
This equation is valid for 2148C Tw 228C The produced
snow has a density of 400 kgm23 (Olefs et al 2010) Daily
production potential dpp can be calculated from the sum of the
individual hours on the same day
Since artificial snow is not physically modeled it must be
estimated We define artificially provided SWE SWEAPd to
estimate how much artificial snow is on the surface on a given
day Thus this parameter does not describe howmuch artificial
snow is produced on a day SWEAPd is defined as the mean of
the daily production potential over an area of 1000m2 inte-
grated over the previous 7 days
SWEAPd
5dppd27d21
3400 kgm23
1000m2(3)
This area is comparatively small For instance the new snow-
making facilities of Vail Mountain in Colorado have 421 snow
FIG 3 Correlation (R2) between the corrected modeled SWE
values and SWE values measured at the proximity SNOTEL site
FIG 2 SWE validation and correction The red dashed line indicates the 11 line and the red solid line is the linear regression line
Shown are (a) uncorrected and (b) corrected daily SWE values from the VAT at the SNOTEL site against daily SWE values measured by
the same SNOTEL site (Tower Colorado)
682 JOURNAL OF APPL IED METEOROLOGY AND CL IMATOLOGY VOLUME 60
Unauthenticated | Downloaded 060322 0452 PM UTC
guns serving an area of more than 500 acres (Vail Mountain
2020) This means that one snow gun must on average provide
snow for roughly 5000m2 of terrain The small area is chosen to
account for previously produced artificial snow that is still on
the surface Recent snowmaking conditions are accounted for
by the 7-day mean The selection of the area will be discussed
further in section 4
f Snow indicators
To assess the skiing conditions in the different climates a
few specific snow indicators are examined Our approach is
guided by Abegg et al (2021) another climate study focusing
on ski areas The snow indicators used here can be found in
Table 3 For these snow indicators a so-called snow day
(Abegg et al 2021) must be defined where a certain threshold
of natural andor artificial snow is present on the ground and
skiing would be possible To avoid confusion with other cli-
matological terms in the literature we use the term ski day
instead of snow day In this study a ski day is defined as a day
on which the sum of artificially provided SWE SWEAP and
modeled SWE from precipitation SWEWRF exceeds 20 cm
20 cm of SWE correspond to 50-cm snow depth at a snow
density of 400 kgm23 which is a typical value for groomed ski
slopes (Olefs et al 2010) Other studies use 30 cm of snow
depth for this threshold (eg Scott et al 2003 Steiger 2010)
Durand et al (2009) describe 30 cm of snow cover as margin-
ally sufficient for skiing and 50 cm as good SWE is analyzed in
this study instead of snow depth since the modeled snow depth
does not account for compaction of snow on ski slopes
For ski areas with large vertical extents as in this study
skiing conditions should be evaluated at the mean elevation of
the skiable terrain (Scott et al 2017) For simplicity the base
elevation plus one-third of the vertical extent of the ski area is
used as an approximation of themean elevation This elevation
will be referred to as the investigated elevation The higher
50-cm snow-depth threshold is chosen to balance that skiing
conditions at the base elevation are not directly evaluated
Furthermore a key period especially important for the skiing
industry from 15 November to 15 April is examined In other
studies this core season starts on 1 December (eg Koenig and
Abegg 1997) but it is extended here to include the Thanksgiving
holiday period in the United States in late November A mini-
mum of 100 and 120 ski days in the core season have been used
as thresholds indicating the possibility of commercially viable ski
operations from a snow-cover perspective However it should
be mentioned that commercial viability can depend on other
factors than snow cover (Abegg et al 2021) For the interpre-
tation of the snow indicators median values of ski days will be
analyzed since they are more representative of the year-to-year
conditionsMean values of ski days can be strongly influencedby
outlier years in the 30-yr climatology Twomore snow indicators
concern the Christmas (late December) and Thanksgiving (late
November) periods These periods are important for ski areas
because of increased demand for skiing
Aside from these snow indicators we also examine changes
in wet days and days exceeding a mean temperature of 08C(lsquolsquowarm daysrsquorsquo for simplicity) Both parameters are important
as they impact snow conditions and thus skier decisions More
rain on snow and higher temperatures may deteriorate snow
quality
3 Results
a Natural snow
Natural snow amounts in the form of SWE are experiencing
changes between the historic and the future climate As an
example for this Fig 4 shows SWE values at top and base el-
evations of Steamboat Ski Resort for both climates Steamboat
is the northernmost ski resort in Colorado (see Fig 1) With 18
lifts and roughly 12 km2 of skiable terrain it is one of the
largest Top and base elevations are chosen to show the ex-
tremes throughout the ski area In both climates at the top
elevation SWE starts to accumulate in October and reaches its
maximum in April or May in most years The median seasonal
peak in SWE at the top elevation is similar in both climates
about 1200mm However this is reached in late April in the
future climate as compared to mid-May in the historic climate
The time with above zero median SWE is shorter in the future
climate than in the historic climate in October it starts one
week later in June it ends two weeks earlier From January to
March absolute values of SWE are comparable between both
climates Changes are more pronounced at Steamboatrsquos base
elevation Most years only have snow in the months from
November to March in both climates In the historic climate
there is a continuous period of above zero median SWE from
mid-December to late February giving 16 weeks with snow
cover This number halves to 8 in the future climate and the
median in these weeks is always lower than in the historic
climate
For further investigation Fig 5a shows the difference be-
tween Figs 4b and 4a A Studentrsquos t test was conducted to
determine if the means of the weekly SWE distributions be-
tween both climates have a statistically significant difference
from each other on a confidence level of 95 Figure 5a shows
that at the base elevation the mean and median differences are
TABLE 3 Snow indicators and their description
Snow indicator Description
Start date snow period Start date of the longest continuous period
of ski days
End date snow period End date of the longest continuous period
of ski days
Length snow period No of days in the longest continuous
period of ski days
Core-season ski days No of ski days in the core season (15Novndash
15 Apr)
Total ski days No of ski days in a year starting on 15 Sep
Natural ski days No of ski days without artificial
snowmaking in a year starting on
15 Sep
Snow years
Thanksgiving
period
Percentage of years with at least 8 ski days
between 22 Nov and 1 Dec (10 days)
Snow years Christmas
period
Percentage of years with at least 8 ski days
between 23 Dec and 1 Jan (10 days)
MAY 2021 LACKNER ET AL 683
Unauthenticated | Downloaded 060322 0452 PM UTC
always negative This means that there is less snow at the base
elevation in the future climate in most years Furthermore the
negative differences between themeans are significant in almost
all weeks except one frommid-November to mid-March At the
top elevation the differences between future climate and his-
toric climate are not comparable to the base elevation While
there is less snow inmost years inNovember andDecember and
after early April the mean and median differences are close to
zero (not significant) from late December to early April These
differences can be positive in some weeks in January February
and March In two weeks in March this positive difference is
statistically significant The negative difference is largest in late
May and early Junewhich can be explainedwith an earlier onset
of strong melting in the future climate
For comparison with a lower-elevation ski area Fig 5b shows
the difference of SWEbetween the future andhistoric climates for
Whitefish Mountain the northernmost ski area in Montana It is
chosen to compare with Steamboat because both are comparable
in size yet Whitefish Mountain is at a considerably lower eleva-
tion on average In this ski area there is significantly less snow in
all weeks between November and May at both top and base el-
evations The comparison indicates that lower elevations aremore
vulnerable to climate change since the natural snow amounts
decrease at all elevations of this ski area Comparisons between
the base and top elevations at other ski areas (not shown) indicate
that the impact of climate change on natural snow is most severe
at the ski areasrsquo base In other words the lack of snow at the base is
expected to increasingly become a bottleneck to ski operations
FIG 4 Box-and-whisker plots of weekly averaged SWE at the Steamboat Ski Resort ski area containing all 30 years of each simulation
Black lines indicate the median and red diamonds are the mean The boxes include values between the lower quartile (25th percentile)
and upper quartile (75th percentile) Whiskers extend up to 15 times the interquartile range Outliers are indicated by circles Shown are
SWE at top and base elevation for the (a) historic and (b) future climates
FIG 5 As in Fig 4 but for the difference between SWE in the future climate SWEfut and historic climate SWEhis at (a) Steamboat Ski
Resort and (b) Whitefish Mountain Red boxes indicate that the difference between the weekly means of both climates is significant as
based on a Studentrsquos t test
684 JOURNAL OF APPL IED METEOROLOGY AND CL IMATOLOGY VOLUME 60
Unauthenticated | Downloaded 060322 0452 PM UTC
Figure 6 shows the relative change of median SWE for all ski
areas at base and top elevations in three select weeks between
historic and future climates December February and April
weeks were chosen as examples for early mid and late-season
weeks The decrease is larger at the base elevations of the ski
areas compared to the top elevations in all weeks shown In
most cases where snow decreases the relative difference is
larger in the weeks in December and April relative to the
February week Averaged over all ski areas the decrease is
118 at the top elevation and 258 at the base elevation in
the February week In the December week the numbers are
146 and 262 in the April week 315 and 318 This
indicates that snow at lower elevations and early and late-
season snow is impacted more by climate change The largest
relative decrease is found in ski areas in Idaho northwestern
Montana and northern Utah where the ski areas have the
lowest elevations In the February week (Fig 6c) SWE in-
creases at most of the high top elevations (over 3000m) in
central Colorado Montana and Wyoming In some ski areas
this increase is also present in the April week No such increase
materializes near the top of ski areas in Arizona southern
Colorado New Mexico and Utah several of which also have
top elevations over 3000m Although the relative decrease is
lower compared to lower-elevation ski areas other factors than
elevation for example latitude may play a major role in the
reduced snow cover in these areas in the future climate
b Temperature rain and snowmaking potential
Figure 7a shows the absolute change in mean warm days at
the investigated elevation in the core season (15 November to
15 April) In the future climate the number of these days is
larger throughout the domain The smallest absolute increase
is in ski areas where both the investigated elevation is over
3000m and the latitude is north of 378N especially in central
Colorado In Loveland Ski Area Colorado the increase is the
smallest from amean of 1 warm day in the historic climate to a
mean of 4 warm days in the future climate With an investi-
gated elevation of 3516m Loveland is the highest of all ski
areas in the domain The largest increase in warm days is found
in ski areas in Idaho and New Mexico The ski areas with the
largest increases are Soldier Mountain Idaho and Sipapu
New Mexico where the mean number of days increases from
43 to 71 and from 50 to 78 respectively The highest total
number of above-freezing days (86 in total) in the future cli-
mate is found in the ski area Sundance Resort Utah Ski areas
in Arizona New Mexico and southern Utah have a larger
increase in above-freezing days than ski areas in Colorado
Montana and Wyoming with comparable investigated eleva-
tions This might be a reason why in the previous section a
difference between these areas in the change in median SWE
was found despite the similar elevations
Figure 7b presents the absolute change in mean wet days
in the core season In Arizona Colorado New Mexico and
high elevations in Utah (investigated elevation over 2600m)
the number of wet days increases on average by only 2 days
Farther northwest this change is larger In Idaho and
Montana the number of wet days increases on average by
8 days The largest increase is found in the ski area Lookout
Pass in northern Idaho The mean number of wet days in the
core season there used to be 21 while it is 35 in the future
climate Wet days are encountered most frequently at
Schweitzer Mountain Idaho in both climates (39 days in the
future increasing from 28 in the historic climate) The in-
crease in wet days and warm days impacts not only SWE
(less snow through melting) but also snow lsquolsquoqualityrsquorsquo for
skiing Since the increase in those days is lower at higher
FIG 6 Relative difference between the median weekly averaged SWE in all ski areas in the historic and future climates during three
different weeks for (a)(c)(e) top elevations and (b)(d)(f) base elevations for the same weeks Black crosses indicate that median SWE is
zero in both climates
MAY 2021 LACKNER ET AL 685
Unauthenticated | Downloaded 060322 0452 PM UTC
elevations snow amounts and snow quality are less af-
fected there
Figures 7c and 7d show the change in mean snowmaking
production potential for two different periods October to
December and January to March While during the first
period the production potential decreases between 4
(Loveland) and 35 (Silver Mountain Idaho) in all ski
areas during the second period production potential in-
creases in 7 very high-elevation ski areas (investigated ele-
vations over 3100 m) in Colorado by up to 14 (Loveland)
The reason for this is that the wet-bulb temperature at these
high elevations was below the lower threshold of 2148C for
snowmaking more often In a warmer climate snowmaking
will become more difficult and the decrease in production
potential is larger early in the season (OctoberndashDecember)
than later (JanuaryndashMarch) This challenge compounds the
decrease in natural snow in a warmer climate snowmaking
is especially important in the early season when only small
accumulations of natural snowfall must be balanced by ar-
tificial snow production to ensure skiing operations Overall
high-elevation ski areas in Colorado have the smallest de-
creases in production potential (or increases in the second
period as mentioned) while low-elevation ski areas in Idaho
northwestern Montana and Utah have a larger decrease
c Snow indicators
Figure 8a shows the first 6 snow indicators from Table 3 for
Steamboat Themedians of all snow indicators have fewer days
in the future climate and the median start date of the snow
period is later while the end date is earlier The median start
date of the snow period used to be 16 November it is antici-
pated to be 11 days later (27 November) in the future climate
The median end date falls on 15 April in the historic climate
and on 2 April in the future climate Consequently the median
snow period length decreases by 22 days from 149 to 127 days
Similar conclusions apply to the number of ski days in the core
season (decreasing from 145 to 132 days median values) the
number of total ski days (decreasing from 163 to 139 days) and
the number of natural ski days (decreasing from 142 to
118 days) The low difference between total and core-season
ski days in the future climate means that ski days will be almost
exclusively confined to the core season The decreasing amount
of natural ski days signifies the increased importance of
snowmaking in the future climate Furthermore the difference
FIG 7 (a) Total change in days exceeding a mean temperature of 08C at the investigated elevation (b) Total
change in days exceeding rain amount of 1mm over the ski area (c)(d) Change in total production potential in two
different periods
686 JOURNAL OF APPL IED METEOROLOGY AND CL IMATOLOGY VOLUME 60
Unauthenticated | Downloaded 060322 0452 PM UTC
betweenmaximum andminimum values increases in the future
climate indicating that there might be more interannual vari-
ability in the snow indicators
For comparison with a lower-elevation ski area Fig 8b
shows Whitefish Mountain In this ski area changes are
stronger than for Steamboat While in the historic climate the
median snow indicators all have higher values at Whitefish
Mountain compared to Steamboat (except natural ski days)
they are all lower in the future climate For instance the me-
dian number of core-season ski days decreases by 31 days from
147 to 116 days Median natural ski days decrease by 60 days
from 111 to 51 days This indicates that at this location (and
other similar low-elevation ski areas) a sufficient amount of ski
days (at least 100 days) cannot be achieved without consider-
able snowmaking efforts in the future The comparison of these
two cases shows again that lower-elevation ski areas such as
Whitefish Mountain are more vulnerable to climate change
than higher-elevation areas such as Steamboat
Figure 9 presents the median number of ski days in the core
season for the historic and future climates and the absolute
change of this snow indicator In the historic climate 18 ski
areas (most at high elevation 10 in Colorado 4 in Utah 2 in
Montana and 1 each in Idaho andWyoming) have a median of
152 core-season ski days meaning that all days in this period
are ski days In the future climate only 3 ski areas achieve this
distinction (2 in Colorado 1 in Wyoming) In Colorado and
some ski areas with high elevations in Montana Utah and
Wyoming the decrease in ski days in the core season is lower
compared to Arizona Idaho and New Mexico ski areas The
ski area with the largest decrease is Silver Mountain where the
median number of core-season ski days almost halves from 135
to 71 days The lowest median number of ski days can be found
at Sipapu ski area with 96 and 58 ski days in the historic and
future climate respectively In the historic climate the 100-day
threshold for median core-season ski days is reached in 70 ski
areas and the 120-day threshold in 61 ski areas In the future
climate these numbers decrease to 51 and 44 Table 4 shows
the average median core-season ski days by states in both cli-
mates Idaho has the largest decrease with 24 and Colorado
the lowest decrease with 7 In Montana Utah and South
DakotaWyoming the decreases are all comparable with 13
Based on a Studentrsquos t test the change in all snow indicators is
significant on a 95confidence level except for a few ski areas for
the start date (7) and core-season ski days (2) Comparingmedian
core-season ski days with the total number of ski days (Table 2)
the number of ski areas where ski days are almost exclusively in
the core season increases in a warmer climate a minority of ski
areas (31) have at least 10 ski days outside the core season in the
future climate whereas most of them (52) did in the past
Figure 9d displays the absolute decrease in median core-
season ski days against the investigated elevation with an in-
dication of the latitude It corroborates that low-elevation and
low-latitude ski areas are most vulnerable to climate change A
relation between elevation and decrease in ski days could be
inferred but is not clear since latitude plays a role as well for
comparable investigated elevations ski areas with lower lati-
tudes have larger decreases For comparable decreases the ski
areas with higher investigated elevations are at lower latitudes
The elevation dependency becomes clearer when only com-
paring ski areas with similar latitudes With a few exceptions
ski areas with higher investigated elevations have smaller de-
creases than ski areas of comparable latitude with lower in-
vestigated elevations The exceptions imply that there are
other factors such as the local terrain that could influence the
vulnerability of ski areas to climate change
To signify the increased importance of snowmaking in the
future Fig 10 shows the median natural ski days Averaged
over all ski areas the number of median natural ski days de-
creases from 107 to 76 days between the two climates In the
future climate only 22 ski areas have more than 100 median
natural ski days Therefore the majority of ski areas will need
snowmaking to sustain sufficiently long ski seasons in the fu-
ture Similar to Fig 9d Fig 10d shows that there is a relation
between the decrease in natural ski days elevation and lati-
tude Note that a low decrease in natural ski days can be caused
by an already low amount in the historic climate
The last two snow indicators from Table 3 concern the
Christmas period and the Thanksgiving period Figure 11
FIG 8 Various snow indicators in both climates for (a) Steamboat Ski Resort and (b) Whitefish Mountain For each pair the left box-
and-whisker plot is for the historic climate and the right box-and-whiskers plot is for the future climate The box-and-whiskers plots have
same definitions as in Fig 4
MAY 2021 LACKNER ET AL 687
Unauthenticated | Downloaded 060322 0452 PM UTC
shows the percentage of the 30 years in both simulations that
have at least 8 ski days in each 10-day period These snow in-
dicators quantify the fraction of years when ski operations are
possible during the defined periods Ski operations during the
Thanksgiving period become more difficult or impossible in a
warmer climate (Figs 11ab) The largest decrease is found at
Schweitzer Mountain with a decrease from 87 to 43 of
the years with enough natural or artificial snow around
Thanksgiving Three ski areas used to reach 100 (every
Thanksgiving was skiable) Loveland and Arapahoe Basin
have the highest percentage in the future climate with 93
Sipapu has the lowest percentages in both climates with 37
in the historic and 13 in future climate In the historic cli-
mate 48 ski areas had at least 70 of the years reach the
threshold of 8 days Compared to this only 15 ski areas reach
70 in the future climate 11 of which are in Colorado and 2
each in Wyoming and Montana Averaged over all ski areas
the percentage drops from 77 of the years to 50 These
numbers indicate that in most years in the future climate
skiing will be confined to fewer and higher-elevation ski areas
during the Thanksgiving period
The Christmas period (Figs 10cd) looks better not all ski
areas have a decreasing percentage of years with at least 8 ski
days in the period In 23 ski areas the percentage does not
decrease (for 7 of those ski areas it increases in the future cli-
mate) These 23 ski areas are in Colorado (15) Utah (4)
Montana (2) and Wyoming (2) 15 of these have an investi-
gated elevation of at least 2800m the lowest of them is Lost
Trail Montana For all other ski areas the percentage of good
years decreases around Christmas by up to 47 at Silver
Mountain (93 of the years reached the threshold in the his-
toric climate compared to 46 of the years in the future cli-
mate) In the historic climate 67 ski areas reached the 8-day
threshold in at least 90 of the years This number decreases
to 38 in the future climate most of which are in Colorado (18)
Montana (5) Utah (8) or Wyoming (4) Averaged over all ski
areas the percentage of years with adequate snow around
Christmas drops from 95 of the years to 86 This decrease
is not as large as during the Thanksgiving period The per-
centage of years only decreases substantially at low elevations
(mostly Idaho) and the low latitudes of Arizona and New
Mexico At higher elevations the Christmas period sees no or
FIG 9 Map with all ski areas showing median core-season ski days for (a) the historic climate and (b) the future
climate along with (c) the absolute difference between (b) and (a) The range in which the investigated elevation
falls is indicated by the shape of the symbols Also shown is a plot of the absolute difference between (b) and (a) vs
investigated elevation with an indication of the state(symbol shapes) and latitude (color shades)
688 JOURNAL OF APPL IED METEOROLOGY AND CL IMATOLOGY VOLUME 60
Unauthenticated | Downloaded 060322 0452 PM UTC
little change between the climates Overall Christmas skiing
could become more challenging in the future but is not as im-
pacted as the Thanksgiving period
4 Discussion
The results presented herein have implications for the future
of the skiing industry Themost serious implication is that 20 of
the ski areas fall below a median of 100 core-season ski days
and an additional 7 ski areas fall below 120 such days If the
applied emissions scenario (RCP85) materializes insufficient
amounts of snow pose risks to the viable operations of those ski
areas Moreover the increased interannual variability of ski
days mentioned in section 3c will make it harder for ski areas to
consistently plan their ski season ahead of time Ski areas could
try to further expand their snowmaking capabilities adjust
their lift infrastructure to be less dependent on lower terrain or
expand into higher terrain (Scott et al 2006) to counter climate
impacts The possibility that these ski areasmight have to cease
operating could seriously impact local economies and com-
munities through lost revenue and lost employment The ski
industry directly and indirectly (eg hotels restaurants retail
travel) is of great importance to the economies of many
mountain communities in the IWUS (Burakowski and
Magnusson 2012) These communities largely depend on the
employment tied to the skiing industry or the proximity to a
ski area for leisure purposes For these reasons closures of
ski areas could threaten the existence of whole mountain
communities as economic alternatives are limited (Steiger
et al 2019)
Snowmaking is critical in achieving a sufficient number of ski
days for most ski areas in this study If the production potential
can be completely utilized 44 ski areas still have over 120
median core-season ski days Furthermore ski areas that fall
below that threshold could increase snowmaking capabilities
TABLE 4 Average (by state) median core-season ski days
State(s) Historic climate Future climate
AZNM 123 95 (223)
CO 148 137 (27)
ID 133 101 (224)
MT 145 126 (213)
SDWY 135 118 (213)
UT 138 120 (213)
FIG 10 As in Fig 9 but for natural ski days
MAY 2021 LACKNER ET AL 689
Unauthenticated | Downloaded 060322 0452 PM UTC
to achieve more ski days Many ski areas in the domain such as
Vail (Vail Mountain 2020) have recently made improvements
to their snowmaking facilities or are planning to make im-
provements in the near future However snowmaking is not
only limited by the production potential but also by costs and
water availability (Scott et al 2017) Thus ski areas may not be
able to fully develop their production potential since the costs
of producing enough snowmight be too high to reach economic
viability or water availability might be limited Water avail-
ability might be limited for different reasons For instance the
risk of severe droughts in the Southwest United States will
increase during the twenty-first century (eg Ault et al 2016)
limiting water availability physically Water availability for
snowmaking may also be limited legislatively given the tightly
restricted water use rights in the IWUS especially in the
Colorado River basin The Colorado River has to provide
water for irrigation and around 40 million people in the
southwestern United States (Udall and Overpeck 2017)
Snowmaking may also be restricted due to environmental
concerns (eg Baron et al 2000)
Studies in other regions have identified three behaviors of
tourists responding to marginal snow conditions or ski area
closures (eg Behringer et al 2000 Dawson and Scott 2010
Rutty et al 2015 Steiger et al 2019) The most common be-
havior is spatial substitution (skiing somewhere else) as
compared to temporal substitution (skiing at a different time)
or activity substitution (replacing skiing with a different ac-
tivity) This means that in the future many skiers might travel
to the ski areas that remain in operation increasing the number
of visitors there These ski areas could profit economically from
the increased demand but could also face challenges caused by
overcrowding (Steiger et al 2019) The increasing demand and
requirements for snowmaking might lead to an increase in lift
ticket prices at these locations making skiing affordable for
fewer people
Recently Scott et al (2019) investigated ski season length
changes in Ontario and Quebec Canada and the northeastern
United States They project that under theRCP85 midcentury
ski season lengths in these regions will be 15ndash22 shorter
compared to a baseline climate from 1981 to 2010 This is very
FIG 11Mapwith all ski areas showing the percentage of years having at least 8 ski days in the (top) Thanksgiving
period from 22 Nov to 1 Dec and (bottom) the Christmas period from 23 Dec to 1 Jan for the (a)(c) historic and
(b)(d) future climate periods The range in which the investigated elevation falls is indicated by the shape of the
symbols
690 JOURNAL OF APPL IED METEOROLOGY AND CL IMATOLOGY VOLUME 60
Unauthenticated | Downloaded 060322 0452 PM UTC
similar to the 24and 23decrease inmedian core-season ski
days found for Idaho and ArizonaNew Mexico It can be in-
ferred that these states have a similar vulnerability to climate
change as the regions in Scott et al (2019) Colorado is less
vulnerable with a decrease of only 7 Wobus et al (2017)
investigated ski areas in the CONUS which includes ski areas
investigated in our study Under the same emission scenario
the authors predict a 19 decrease of mean ski season lengths
in Colorado and a 47 decrease in Idaho by 2050 These are
much higher decreases than the decreases we found for mean
core-season ski days in these two regions which are the same as
for median core-season ski days (7 and 24) A reason for
the difference might be their definition of a ski season their
season starts when either 10 cm of SWE or 450 h of snow-
making conditions (Tw 228C) are reached at the base ele-
vation of a ski area and ends when SWE falls below 10 cm at the
top elevation of a ski area While snowmaking plays a role in
initiating a season the lack of snowmaking during the season is
likely the reason why Wobus et al (2017) found much higher
decreases Because of that lack of representation of snow-
making they likely overestimate the decrease in ski season
length Furthermore it should be mentioned that they over-
estimate ski season length in general since their criterion for
the end of the season only accounts for snow at the top ele-
vations which ignores the possible lack of snow at lower
elevations
In the following paragraphs we list a few caveats of this
study First the parameter SWEAP (artificially provided SWE)
is defined the same for every ski area However this parameter
likely differs between ski areas since ski areas have different
snowmaking facilities and capabilities Therefore the area of
1000m2 in Eq (3) is a factor that could be defined individually
for every ski area To test the sensitivity to changes of this
parameter results were also examined for areas of 500 and
2000m2 Generally these changes produce more (500m2) or
fewer (2000m2) ski days For 500m2 the 100- and 120-day
thresholds are reached in 69 and 62 ski areas in the future cli-
mate This is not much different from the 70 and 61 ski areas
that reach the thresholds for 1000m2 in the historic climate
This highlights the importance and potential of snowmaking as
an adaption technique to mitigate the impacts of climate
change and to increase the number of ski days The choice fell
on 1000m2 since at 500m2 many ski days with no or little
natural snow occur The Tw can be close to the upper threshold
for snowmaking (228C) and enough snow for a ski day can be
produced For 2000m2 the opposite is trueTwmust be close to
the lower limit for snowmaking (2148C) for an extended pe-
riod and the number of ski days is not influenced much by the
addition of snowmaking Another simplification with snow-
making is that it is always applied This might not be in line with
typical operations at ski areas
Second the investigated elevationmaynot be the best choice for
all ski areas This elevationwas chosen as an approximation of the
mean elevation of the skiable terrain However suitable eleva-
tions for thismight differ between ski areasA similar point can be
made for the threshold of 200mm of SWE for a ski day since the
amount of snow required for skiing could differ between ski areas
depending on the terrain and underlying soil cover
For the above two reasons the results of this study should
not be understood to accurately display the vulnerability of
each individual ski area with their own specifications for
snowmaking snow requirements and elevation Rather this
study provides an overview of how vulnerable ski areas in the
IWUS are in general with predefined specifications depending
on their location Thus for some ski areas the presented
numbers of ski days might differ substantially from real-world
values depending especially on the ski arearsquos snowmaking
capabilities
Third the snowmaking capabilities are assumed to remain
unchanged This neglects that there might be advances in
snowmaking technology in the future Also snowmaking was
not as widespread in the historic climate (1981ndash2011) Thus the
historic climate snow indicators describe the possibilities under
these climate conditions with current snowmaking technology
While the wet-bulb temperature threshold of 228C is a basic
physical condition advances in snowmaking technology are
possible but it is not possible to estimate to which extent
Fourth the future climate simulation itself has uncertainties
The PGW technique has been used before to investigate
changes in orographic precipitation and snowpack in the
IWUS region in a warming climate (eg Rasmussen et al 2011
2014 Eidhammer et al 2018) The PGW technique assumes
that essential weather patterns (such as the midlatitude storm
track) and low-frequency global atmospheric variability do not
change (Schaumlr et al 1996) While this assumption remains
uncertain there is evidence that thermodynamic changes (ie
the warming and moistening of winter storms) in a globally
warming climate overwhelm sustained changes driven by in-
ternal climate variability (Scalzitti et al 2016) Furthermore
only one RCP (RCP85) is examined in this study referring to
conditions in the mid-twenty-first century or later (if green-
house gas emissions are cut more drastically) The RCP85
scenario implies relatively little action on reducing greenhouse
gas emissions compared to other RCP scenarios This sce-
nario often referred to as the lsquolsquobusiness as usualrsquorsquo scenario in
terms of greenhouse gas emissions may prove to exaggerate
the rate of global warming (Hausfather and Peters 2020) in
which case the lsquolsquofuturersquorsquo climate conditions depicted here may
apply not around 2050 but rather a few decades later Those
interested in a detailed assessment of snow conditions specifi-
cally around 2050 for example for infrastructure planning
purposes are encouraged to compare results with those from
other RCPs such as RCP45 for circa 2050
Fifth while the regional climate model used here estimates
the seasonal snowfall quite well (Jing et al 2017) the seasonal
SWE tends to be underestimated possibly on account of the
land surface scheme (Wang et al 2018) We corrected this
SWE bias (section 2d) but this neglects possible measurement
errors and biases in the SNOTEL data themselves and the
different validations of the simulation depending on the lo-
cation For instance in New Mexico the R2 values were lower
than in most other areas Consequently the snow indicators
have a larger uncertainty in NewMexico ski areas and other ski
areas with equally low R2
Sixth the artificial snow is not incorporated in the simula-
tionrsquos surface model More detailed studies could explicitly
MAY 2021 LACKNER ET AL 691
Unauthenticated | Downloaded 060322 0452 PM UTC
model the interactions between natural and artificial snow
making the definition of artificially provided SWE redundant
However this is beyond the scope of this study
5 Conclusions
The results of this study are in line with findings from pre-
vious studies on the vulnerability of ski areas to climate change
in the sense that snow conditions for skiing generally are
negatively impacted by climate change This study examines 71
ski areas in the interior western United States and finds that
these impacts are larger at relatively low elevationslatitudes
This applies to all parameters investigated herein
d Natural SWE decreases significantly at low elevations and in
the early and late season at most locations At high eleva-
tions (over 3000m) in Colorado Montana and Wyoming
decreases in SWE are not significant in the midseason
(mainly JanuaryndashMarch) and at a few places there is a ro-
bust signal of midseason SWE increase in a warmer climate
At low latitudes in Arizona New Mexico and Utah the
decrease can be significant despite high elevations Averaged
over all ski areas SWE decreases by 118 at the top eleva-
tions and by 258 at the base elevation in mid-February
(midseason) in the future climate In late December (early
season) the decreases are 146 and 262 and in early April
(late season) they are 315 and 318d Similar findings apply to the number of warm days in the
core season which increase more at lower elevations and
latitudes In high-elevation ski areas in Colorado the in-
crease can be as low as 3 days For ski areas with low lati-
tudes or low elevations the increase can be as high as
28 daysd The number of days with rain on snow increases especially at
low elevations in the northwest of the domain In Idaho and
Montana ski areas the number of these days increases on
average by 8 days while in Arizona Colorado NewMexico
and high-elevation ski areas in Utah the average increase is
only 2 daysd Production potential for snowmaking decreases in every ski
area between 4 and 35 from October to December
when artificial snowmaking is especially important From
January to March decreases are lower and production
potential in this time frame could increase at the very highest
elevations in Colorado by up to 14 Again the decrease is
larger at lower elevationlatitude ski areasd Fewer ski areas reach the 100- and 120-day thresholds of
median core-season ski days in the future climate In the his-
toric climate 70 and 61 ski areas reach these thresholds as
compared to 51 and 44 in the future climate The ski areas that
do not reach the thresholds are at the low elevationslatitudes
of the domaind Skiing during the Thanksgiving period decreases substan-
tially throughout the domain In the future climate only 15
ski areas (a decrease of 33) have enough snow for skiing
during this period in at least 70 of the years 11 of those 15
ski areas are in Colorado Thus regular skiing during the
Thanksgiving period might be mostly limited to high eleva-
tions in Colorado
d The Christmas period is not impacted as much as the
Thanksgiving period Averaged over all ski areas the per-
centage of years with adequate snow for skiing during
Christmas decreases from 95 to 86 as compared to
77 to 50 for the Thanksgiving period At high elevations
in Colorado Montana northern Utah and Wyoming the
Christmas period is not affected Larger changes between the
climates are limited to lower elevations Overall Christmas
skiing might become more challenging in the future in some
years however it should still be possible in most of the
domain in most years
In summary the low-elevation ski areas in Idaho and north-
westernMontana and the low-latitude ski areas of Arizona and
New Mexico are most vulnerable Most ski areas in Colorado
and the high-elevation areas in Montana Utah and Wyoming
are less vulnerable
Acknowledgments Thanks are given to Corrine Knapp Jeff
Snider Holger Tost Thomas Mazzetti Coltin Grasmick
Robert Capella and Martin Espitalie for their comments and
insights during the course of this research project This work
was funded by theWyomingWater Development Commission
and the US Geological Survey under the auspices of the
University of Wyoming Water Research Program
Data availability statement The WRF Model data are avail-
able from httpsdoiorg105065D6MK6B4K The IWUSmodel
output for the retrospective climate is available from https
doiorg105281zenodo1157112 The future climate data are
available from httpsdoiorg105281zenodo3934896
REFERENCES
Abegg B S Morin O Demiroglu H Franccedilois M Rothleitner
and U Strasser 2021 Overloaded Critical revision and a new
conceptual approach for snow indicators in ski tourism Int
J Biometeor httpsdoiorg101007s00484-020-01867-3 in
press
Adger W N 2006 Vulnerability Global Environ Change 16
268ndash281 httpsdoiorg101016jgloenvcha200602006
Ashfaq M S Ghosh S-C Kao L C Bowling P Mote
D Touma S A Rauscher and N S Diffenbaugh 2013 Near-
term acceleration of hydroclimatic change in the western US
J Geophys Res Atmos 118 10 676ndash10 693 httpsdoiorg
101002jgrd50816
Ault T R J S Mankin B I Cook and J E Smerdon 2016
Relative impacts of mitigation temperature and precipita-
tion on 21st-century megadrought risk in the American
Southwest Sci Adv 2 e1600873 httpsdoiorg101126
sciadv1600873
Bark R B Colby and FDominguez 2010 Snowdays Snowmaking
adaptation and the future of low latitude high elevation skiing in
Arizona USA Climatic Change 102 467ndash491 httpsdoiorg
101007s10584-009-9708-x
Baron J D Theobald and D Fagre 2000 Management of land
use conflicts in the United States Rocky Mountains Mt Res
Dev 20 24ndash27 httpsdoiorg1016590276-4741(2000)020
[0024MOLUCI]20CO2
Battaglin W L Hay andM Steve 2011 Simulating the potential
effects of climate change in two Colorado basins and at two
692 JOURNAL OF APPL IED METEOROLOGY AND CL IMATOLOGY VOLUME 60
Unauthenticated | Downloaded 060322 0452 PM UTC
Colorado ski areas Earth Interact 15 httpsdoiorg101175
2011EI3731
Beaudin L and J-C Huang 2014Weather conditions and outdoor
recreation A study of New England ski areas Ecol Econ 106
56ndash68 httpsdoiorg101016jecolecon201407011
Behringer J R Buumlrki and J Fuhrer 2000 Participatory inte-
grated assessment of adaptation to climate change in Alpine
tourism and mountain agriculture Integr Assess 1 331ndash338
httpsdoiorg101023A1018940901744
Brown R and P Mote 2009 The response of Northern Hemisphere
snow cover to a changing climate J Climate 22 2124ndash2145
httpsdoiorg1011752008JCLI26651
Burakowski E andMMagnusson 2012 Climate impacts on the
winter tourism economy in the United States Natural
Resources Defense Council Rep 32 pp httpswwwnrdcorg
sitesdefaultfilesclimate-impacts-winter-tourism-reportpdf
Dawson J and D Scott 2010 Systems analysis of climate
change vulnerability for the US Northeast ski sector
Tourism Hospitality Plann Dev 7 219ndash235 httpsdoiorg
1010801479053X2010502383
Diffenbaugh N M Scherer and M Ashfaq 2013 Response of
snow-dependent hydrologic extremes to continued global
warming Nat Climate Change 3 379ndash384 httpsdoiorg
101038nclimate1732
Durand Y G Giraud M Laternser P Etchevers L Meacuterindoland B Lesaffre 2009 Reanalysis of 47 years of climate in the
French Alps (1958ndash2005) Climatology and trends for snow
cover J Appl Meteor Climatol 48 2487ndash2512 https
doiorg1011752009JAMC18101
Eidhammer T V Grubisic R Rasmussen and K Ikdea 2018
Winter precipitation efficiency of mountain ranges in the
Colorado Rockies under climate change J Geophys Res
Atmos 123 2573ndash2590 httpsdoiorg1010022017JD027995
Gruumlnewald T and Coauthors 2013 Statistical modelling of the snow
depth distribution in openAlpine terrainHydrol Earth Syst Sci
17 3005ndash3021 httpsdoiorg105194hess-17-3005-2013
Hausfather Z and G Peters 2020 EmissionsmdashThe lsquobusiness as
usualrsquo story ismisleadingNature 577 618ndash620 httpsdoiorg
101038d41586-020-00177-3
Henn B A J Newman B Livneh C Daly and J D Lundquist
2018 An assessment of differences in gridded precipitation
datasets in complex terrain J Hydrol 556 1205ndash1219 https
doiorg101016jjhydrol201703008
Hennessy K P Whetton K Walsh I Smith J Bathols
M Hutchinson and J Sharples 2008 Climate change effects
on snow conditions in mainland Australia and adaptation at
ski resorts through snowmaking Climate Res 35 255ndash270
httpsdoiorg103354cr00706
Hong S-Y and H-L Pan 1996 Nonlocal boundary layer vertical
diffusion in amedium-range forecastmodelMonWeaRev 124
2322ndash2339 httpsdoiorg1011751520-0493(1996)1242322
NBLVDI20CO2
Iacono M J J S Delamere E J Mlawer M W Shephard S A
Clough and W D Collins 2008 Radiative forcing by long-
lived greenhouse gases Calculations with the AER radiative
transfermodels J Geophys Res 113 D13103 httpsdoiorg
1010292008JD009944
Jimeacutenez P A J Dudhia J F Gonzaacutelez-Rouco J Navarro J P
Montaacutevez andEGarciacutea-Bustamante 2012 A revised scheme
for the WRF surface layer formulation Mon Wea Rev 140
898ndash918 httpsdoiorg101175MWR-D-11-000561
Jing X B Geerts Y Wang and C Liu 2017 Evaluating seasonal
orographic precipitation in the interior western United States
using gauge data gridded precipitation estimates and a re-
gional climate simulation J Hydrometeor 18 2541ndash2558
httpsdoiorg101175JHM-D-17-00561
Koenig U andBAbegg 1997 Impacts of climate change onwinter
tourism in the Swiss Alps J Sustainable Tourism 5 46ndash58
httpsdoiorg10108009669589708667275
Lehning M T Gruumlnewald and M Schirmer 2011 Mountain
snow distribution governed by an altitudinal gradient and
terrain roughness Geophys Res Lett 38 L19504 https
doiorg1010292011GL048927
Li Y Z Li Z Zhang L Chen S Kurkute L Scaff andX Pan 2019
High-resolution regional climate modeling and projection over
western Canada using a weather research forecasting model
with a pseudo-global warming approachHydrol Earth Syst Sci
23 4635ndash4659 httpsdoiorg105194hess-23-4635-2019Liu C and Coauthors 2017 Continental-scale convection-
permitting modeling of the current and future climate of
North America Climate Dyn 49 71ndash95 httpsdoiorg
101007s00382-016-3327-9
Lundquist J M Hughes E Gutmann and S Kapnick 2019 Our
skill in modeling mountain rain and snow is bypassing the skill
of our observational networks Bull Amer Meteor Soc 100
2473ndash2490 httpsdoiorg101175BAMS-D-19-00011
Maraun D 2016 Bias correcting climate change simulationsmdashA
critical review Curr Climate Change Rep 2 211ndash220 https
doiorg101007s40641-016-0050-x
Newman A AMonaghanM Clark K Ikeda L Xue E Gutmann
and J Arnold 2021 Hydroclimatic changes in Alaska portrayed
by a high-resolution regional climate simulation Climatic
Change 164 17 httpsdoiorg101007s10584-021-02956-x
Niu G-Y and Coauthors 2011 The community Noah land sur-
face model withmultiparameterization options (Noah-MP) 1
Model description and evaluation with local-scale measure-
ments J Geophys Res 116 D12109 httpsdoiorg101029
2010JD015139
NRCS 2020 NRCS Report Generator 20 USDA accessed
11 April 2020 httpswccscegovusdagovreportGenerator
NSAA 2021 Kottke national end of season survey 201920 Final
report National Ski Areas Association Rep (Appendix B
Skier visit detail by region Table 10) 1 p httpsnsaaorg
webdocsMedia_PublicIndustryStatsHistorical_Skier_Days_
1979_1920pdf
Olefs M A Fischer and J Lang 2010 Boundary conditions
for artificial snow production in the Austrian Alps J Appl
Meteor Climatol 49 1096ndash1113 httpsdoiorg101175
2010JAMC22511
Pachauri R K and Coauthors 2014Climate Change 2014 Synthesis
Report CambridgeUniversity Press 151 pp httpswwwipccch
siteassetsuploads201802SYR_AR5_FINAL_fullpdf
Pons M J Loacutepez-Moreno M Rosas-Casals and E Jover 2015
The vulnerability of Pyrenean ski resorts to climate-induced
changes in the snowpack Climatic Change 131 591ndash605
httpsdoiorg101007s10584-015-1400-8
Rasmussen R and Coauthors 2011 High-resolution coupled
climate runoff simulations of seasonal snowfall over Colorado
A process study of current and warmer climate J Climate 24
3015ndash3048 httpsdoiorg1011752010JCLI39851
mdashmdash and Coauthors 2014 Climate change impacts on the water
balance of the Colorado Headwaters High-resolution regional
climate model simulations J Hydrometeor 15 1091ndash1116
httpsdoiorg101175JHM-D-13-01181
Rhoades A P Ullrich and C Zarzycki 2018 Projecting 21st
century snowpack trends in western USA mountains using
MAY 2021 LACKNER ET AL 693
Unauthenticated | Downloaded 060322 0452 PM UTC
variable-resolution CESM Climate Dyn 50 261ndash288 https
doiorg101007s00382-017-3606-0
Rutty M D Scott P Johnson E Jover M Pons and R Steiger
2015 Behavioural adaptation of skiers to climatic variability
and change in Ontario Canada J Outdoor Recreat Tourism
11 13ndash21 httpsdoiorg101016jjort201507002
Sadeghi S-H R Peters D Cobos H Loescher and C Campbell
2013 Direct calculation of thermodynamic wet-bulb temper-
ature as a function of pressure and elevation J Atmos
Oceanic Technol 30 1757ndash1765 httpsdoiorg101175
JTECH-D-12-001911
Saha S andCoauthors 2010 TheNCEPClimate Forecast System
Reanalysis Bull Amer Meteor Soc 91 1015ndash1058 https
doiorg1011752010BAMS30011
Scalzitti J C Strong and A Kochanski 2016 Climate change
impact on the roles of temperature and precipitation in
western US snowpack variability Geophys Res Lett 43
5361ndash5369 httpsdoiorg1010022016GL068798
Schaumlr C C Frei D Luumlthi and H Davies 1996 Surrogate
climate-change scenarios for regional climate models
Geophys Res Lett 23 669ndash672 httpsdoiorg101029
96GL00265
Scott D G McBoyle and B Mills 2003 Climate change and the
skiing industry in southern Ontario (Canada) Exploring the
importance of snowmaking as a technical adaptation Climate
Res 23 171ndash181 httpsdoiorg103354cr023171mdashmdashmdashmdashAMinogue and BMills 2006 Climate change and the
sustainability of ski-based tourism in eastern North America
A reassessment J Sustainable Tourism 14 376ndash398 https
doiorg102167jost5500
mdashmdash J Dawson and B Jones 2007 Climate change vulnerability
of the US Northeast winter recreationndashtourism sector Mitig
Adapt Strategies Global Change 13 577ndash596 httpsdoiorg
101007s11027-007-9136-z
mdashmdash R Steiger M Rutty M Pons and P Johnson 2017 The
differential futures of ski tourism in Ontario (Canada)
under climate change The limits of snowmaking adapta-
tion Curr Issues Tourism 22 1327ndash1342 httpsdoiorg
1010801368350020171401984
mdashmdash mdashmdash N Knowles and Y Fang 2019 Regional ski tourism
risk to climate change An inter-comparison of eastern
Canada andUSNortheastmarkets J Sustainable Tourism 28
568ndash586 httpsdoiorg1010800966958220191684932
Serreze M C M P Clark R L Armstrong D A McGinnis and
R S Pulwarty 1999 Characteristics of the western United
States snowpack from Snowpack Telemetry (SNOTEL) data
Water Resour Res 35 2145ndash2160 httpsdoiorg101029
1999WR900090
Skamarock W C and Coauthors 2019 A description of
the Advanced Research WRF version 4 NCAR Tech
Rep NCARTN-5561STR 145 pp httpsdoiorg105065
1dfh-6p97
Steiger R 2010 The impact of climate change on ski season length
and snowmaking requirements in Tyrol AustriaClimate Res
43 251ndash262 httpsdoiorg103354cr00941
mdashmdashD Scott B AbeggM Pons and C Aall 2019 A critical review
of climate change risk for ski tourism Curr Issues Tourism 22
1343ndash1379 httpsdoiorg1010801368350020171410110
Sturm M M A Goldstein and C Parr 2017 Water and life from
snow A trillion dollar science question Water Resour Res
53 3534ndash3544 httpsdoiorg1010022017WR020840
Thompson G P R Field RMRasmussen andWDHall 2008
Explicit forecasts of winter precipitation using an improved
bulk microphysics scheme Part II Implementation of a new
snow parameterization Mon Wea Rev 136 5095ndash5115
httpsdoiorg1011752008MWR23871
Toumlglhofer C F Eigner and F Prettenthaler 2011 Impacts of
snow conditions on tourism demand in Austrian ski areas
Climate Res 46 (1) 1ndash14 httpsdoiorg103354cr00939
Udall B and J Overpeck 2017 The twenty-first century Colorado
River hot drought and implications for the futureWaterResour
Res 53 2404ndash2418 httpsdoiorg1010022016WR019638
Vail Mountain 2020 Vail Mountain Snow Enhancement Project
Accessed 19 June 2020 httpswwwvailcomexplore
snowmakingaspx
Wang Y B Geerts and C Liu 2018 A 30-year convection-
permitting regional climate simulation over the interior western
United States Part I Validation Int J Climatol 38 3684ndash3704
httpsdoiorg101002joc5527
Wobus C and Coauthors 2017 Projected climate change impacts
on skiing and snowmobiling A case study of theUnited States
Global Environ Change 45 1ndash14 httpsdoiorg101016
jgloenvcha201704006
Yang Z-L and Coauthors 2011 The community Noah land
surface model with multiparameterization options (Noah-
MP) 2 Evaluation over global river basins J Geophys
Res 116 D12110 httpsdoiorg1010292010JD015140
Zimmerman G C OrsquoBrady and B Hurlbutt 2006 Climate change
Modeling a warmer Rockies and assessing the implications The
2006 Colorado College State of the Rockies Report Card
Colorado College Publ 89ndash102 httpswwwcoloradocollege
edudotAsseta68bd37f-4ca0-472a-bb73-69ab7e4941aepdf
694 JOURNAL OF APPL IED METEOROLOGY AND CL IMATOLOGY VOLUME 60
Unauthenticated | Downloaded 060322 0452 PM UTC
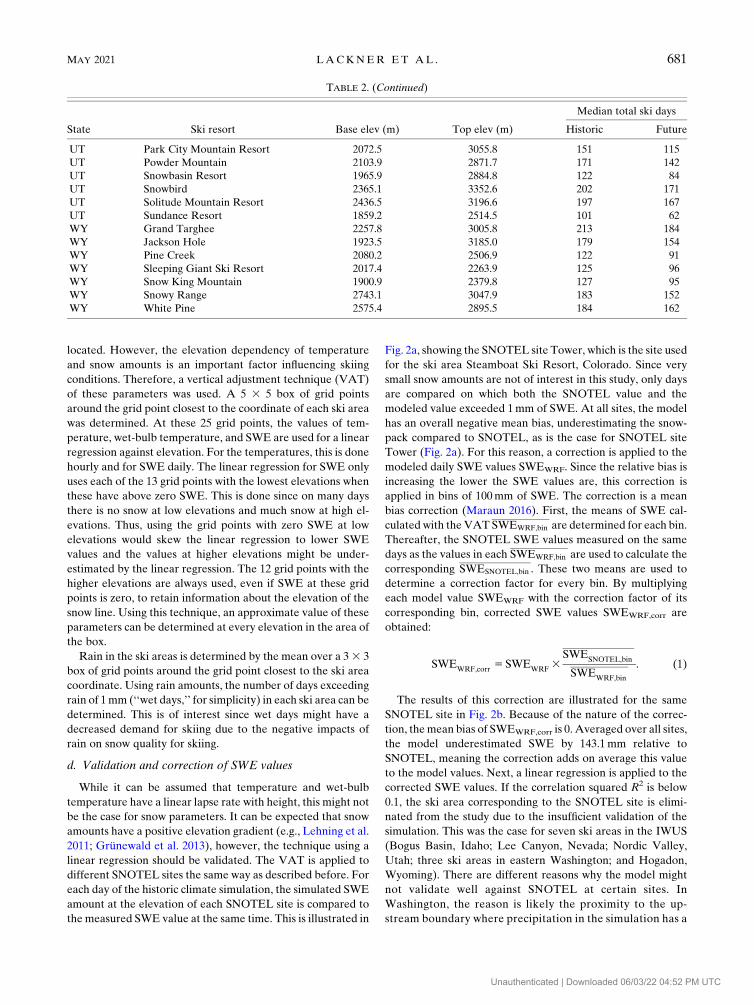
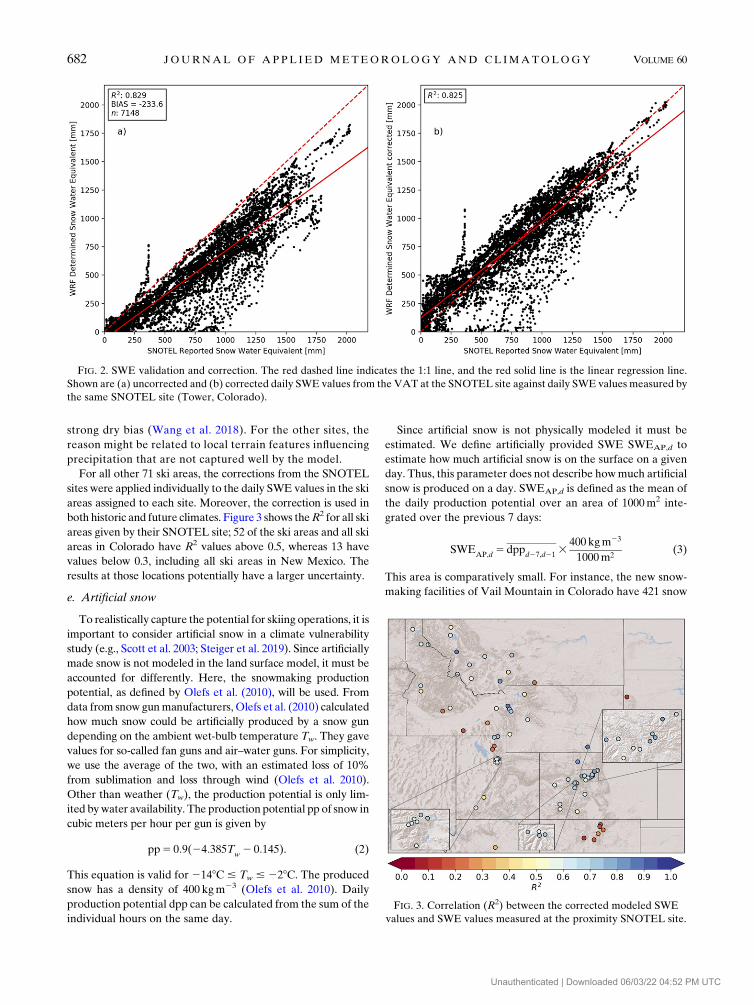
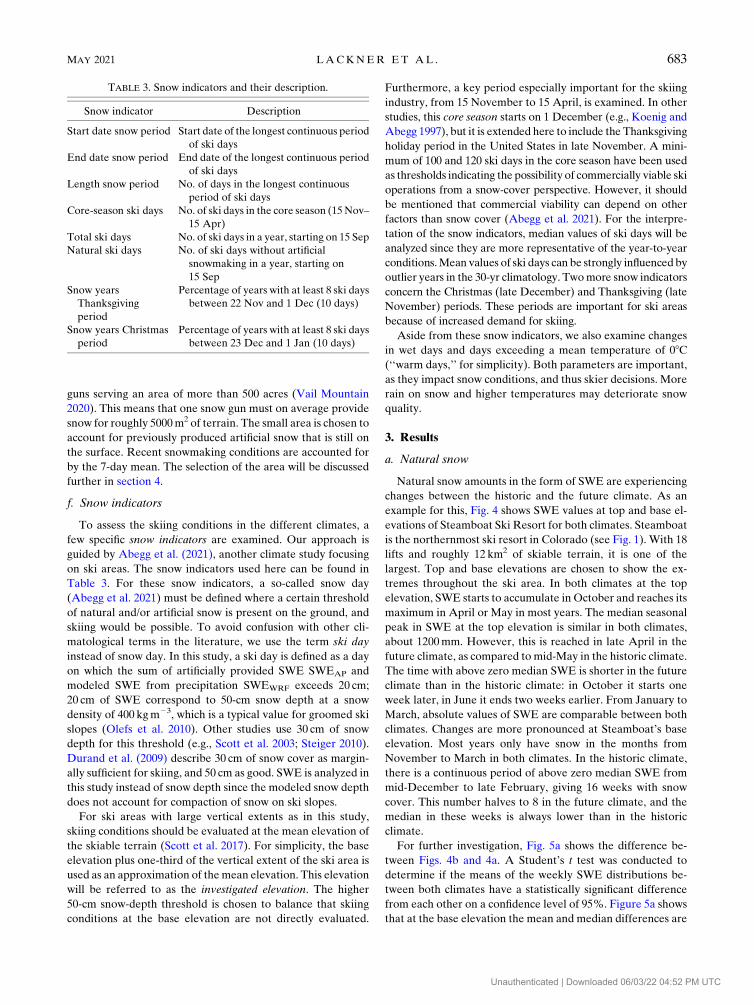
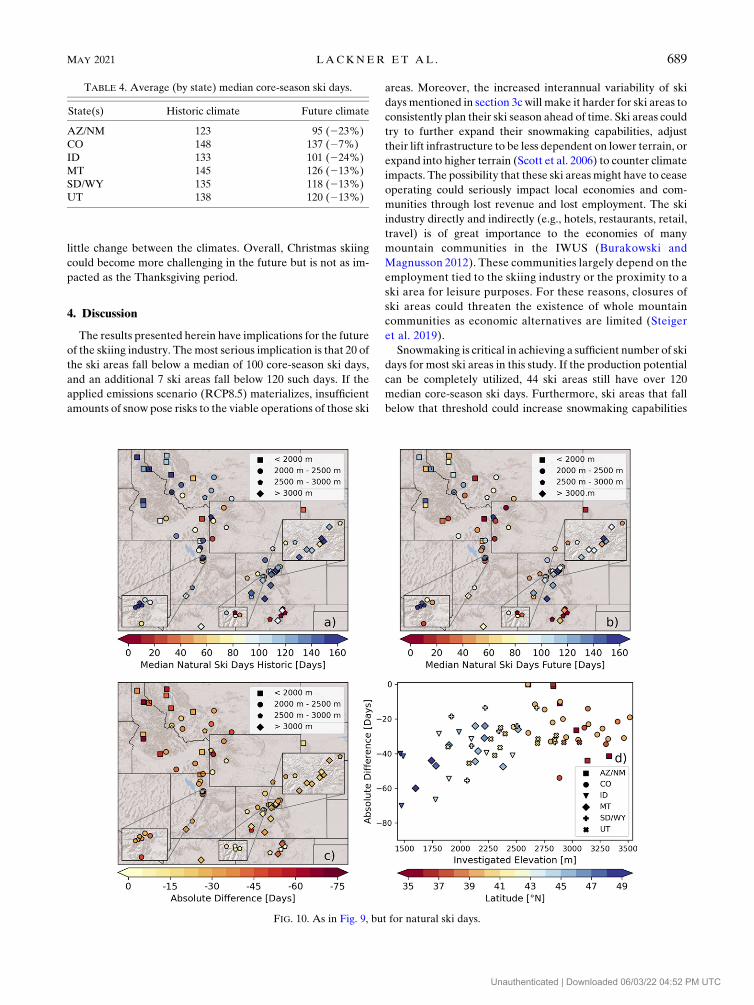
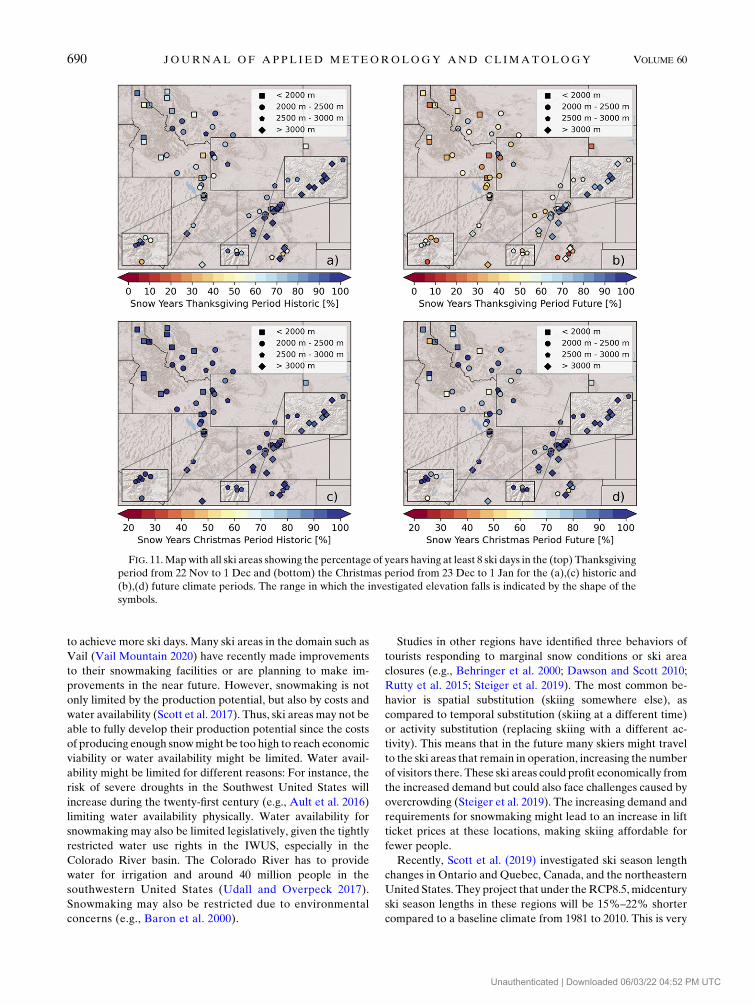
Related Documents