Citation: Prieto-Patron, A.; Detzel, P.; Ramayulis, R.; Sudikno; Irene; Wibowo, Y. Impact of Fortified Infant Cereals on the Burden of Iron Deficiency Anemia in 6- to 23-Month-Old Indonesian Infants and Young Children: A Health Economic Simulation Model. Int. J. Environ. Res. Public Health 2022, 19, 5416. https://doi.org/10.3390/ ijerph19095416 Academic Editor: Tara Zolnikov Received: 11 March 2022 Accepted: 20 April 2022 Published: 29 April 2022 Publisher’s Note: MDPI stays neutral with regard to jurisdictional claims in published maps and institutional affil- iations. Copyright: © 2022 by the authors. Licensee MDPI, Basel, Switzerland. This article is an open access article distributed under the terms and conditions of the Creative Commons Attribution (CC BY) license (https:// creativecommons.org/licenses/by/ 4.0/). International Journal of Environmental Research and Public Health Article Impact of Fortified Infant Cereals on the Burden of Iron Deficiency Anemia in 6- to 23-Month-Old Indonesian Infants and Young Children: A Health Economic Simulation Model Alberto Prieto-Patron 1, * , Patrick Detzel 1 , Rita Ramayulis 2 , Sudikno 3 , Irene 4 and Yulianti Wibowo 4 1 Nestle Research, 1000 Lausanne, Switzerland; [email protected] 2 Indonesian Sport Nutritionist Association, Jakarta 10270, Indonesia; [email protected] 3 Center for Research and Development of Public Health Efforts, Ministry of Health, Jakarta 10560, Indonesia; [email protected] 4 Nestle Nutrition Institute Indonesia, Jakarta 12520, Indonesia; [email protected] (I.); [email protected] (Y.W.) * Correspondence: [email protected] Abstract: Iron deficiency and iron deficiency anemia (IDA) are highly prevalent among Indonesian infants and young children (IYC). Severe IDA hampers mental development in young children and is linked to lower quality of life and lower productivity as adults. The consumption of fortified infant cereals (FIC) increases iron intake during the weaning period, thus reducing the social burden of IDA. In this manuscript, we aimed to assess the impact of FIC on the burden of IDA on IYC in Indonesia. We analyzed data for IYC aged 6–23 months from the fifth wave (2014–2015) of the Indonesia Family Life Survey (IFLS) and the Indonesia Demographic and Health Survey 2017 (IDHS-17). We adapted a health economic simulation model to estimate the impact of FIC that accounted for lifetime health and cost consequences in terms of reduced future income and DALYs. The mean Hb level was 10.5 ± 1.4 g/dL. Consumers of FIC had a reduced burden of disease (43,000 DALYs; USD 171 million) compared with non-consumers. The consumption of fortified infant cereals plays an important role in reducing the burden of IDA, and it might complement the available strategy of nutritional interventions to address this problem in Indonesian IYC. Keywords: iron deficiency anemia; fortified infant cereals; infants and young children; health economics 1. Introduction In many parts of Southeast Asia, iron deficiency and iron-deficiency anemia (IDA) among infants and young children (IYC) is a widespread public health problem [1,2]. In children, IDA is associated with decreased cognitive performance and delayed motor and cognitive development; in adults, this is manifested as decreased physical performance and quality of life [3]. Current evidence indicates that IYC below 2 years of age are at very high risk of iron deficiency [4]. The South East Asian Nutrition Survey (SEANUTS) in Indonesia showed that the prevalence of anemia was around 55% in children aged 6–23 mo [5]. Despite positive trends in the reduction in micronutrient deficiencies due to nutritional programs, the percentage of children below the Indonesian nutrient intake recommendations across age groups remains high [5]. Beyond the age of 6 months, an infant’s iron needs begin to exceed that provided by breast milk. Analysis of the adjusted linear regression showed decreased iron status indicators, such as ferritin (16%) and iron (3%), after 3 to 6 mo of age [6,7]. The amount of iron provided in the breast milk may become insufficient even before 6 mo, especially when infants have suboptimal iron reserves at birth [8], which may cause an iron gap. Therefore, during the weaning period, additional sources of iron are needed in order to meet the infant’s growing iron requirements [9]. Furthermore, the complementary feeding period spans more than half of the critical first 1000 days of life [9]. Int. J. Environ. Res. Public Health 2022, 19, 5416. https://doi.org/10.3390/ijerph19095416 https://www.mdpi.com/journal/ijerph

Welcome message from author
This document is posted to help you gain knowledge. Please leave a comment to let me know what you think about it! Share it to your friends and learn new things together.
Transcript
Citation: Prieto-Patron, A.; Detzel, P.;
Ramayulis, R.; Sudikno; Irene;
Wibowo, Y. Impact of Fortified Infant
Cereals on the Burden of Iron
Deficiency Anemia in 6- to
23-Month-Old Indonesian Infants
and Young Children: A Health
Economic Simulation Model. Int. J.
Environ. Res. Public Health 2022, 19,
5416. https://doi.org/10.3390/
ijerph19095416
Academic Editor: Tara Zolnikov
Received: 11 March 2022
Accepted: 20 April 2022
Published: 29 April 2022
Publisher’s Note: MDPI stays neutral
with regard to jurisdictional claims in
published maps and institutional affil-
iations.
Copyright: © 2022 by the authors.
Licensee MDPI, Basel, Switzerland.
This article is an open access article
distributed under the terms and
conditions of the Creative Commons
Attribution (CC BY) license (https://
creativecommons.org/licenses/by/
4.0/).
International Journal of
Environmental Research
and Public Health
Article
Impact of Fortified Infant Cereals on the Burden of IronDeficiency Anemia in 6- to 23-Month-Old Indonesian Infantsand Young Children: A Health Economic Simulation ModelAlberto Prieto-Patron 1,* , Patrick Detzel 1, Rita Ramayulis 2, Sudikno 3 , Irene 4 and Yulianti Wibowo 4
1 Nestle Research, 1000 Lausanne, Switzerland; [email protected] Indonesian Sport Nutritionist Association, Jakarta 10270, Indonesia; [email protected] Center for Research and Development of Public Health Efforts, Ministry of Health, Jakarta 10560, Indonesia;
[email protected] Nestle Nutrition Institute Indonesia, Jakarta 12520, Indonesia; [email protected] (I.);
[email protected] (Y.W.)* Correspondence: [email protected]
Abstract: Iron deficiency and iron deficiency anemia (IDA) are highly prevalent among Indonesianinfants and young children (IYC). Severe IDA hampers mental development in young children and islinked to lower quality of life and lower productivity as adults. The consumption of fortified infantcereals (FIC) increases iron intake during the weaning period, thus reducing the social burden of IDA.In this manuscript, we aimed to assess the impact of FIC on the burden of IDA on IYC in Indonesia.We analyzed data for IYC aged 6–23 months from the fifth wave (2014–2015) of the Indonesia FamilyLife Survey (IFLS) and the Indonesia Demographic and Health Survey 2017 (IDHS-17). We adapted ahealth economic simulation model to estimate the impact of FIC that accounted for lifetime healthand cost consequences in terms of reduced future income and DALYs. The mean Hb level was10.5 ± 1.4 g/dL. Consumers of FIC had a reduced burden of disease (43,000 DALYs; USD 171 million)compared with non-consumers. The consumption of fortified infant cereals plays an importantrole in reducing the burden of IDA, and it might complement the available strategy of nutritionalinterventions to address this problem in Indonesian IYC.
Keywords: iron deficiency anemia; fortified infant cereals; infants and young children; health economics
1. Introduction
In many parts of Southeast Asia, iron deficiency and iron-deficiency anemia (IDA)among infants and young children (IYC) is a widespread public health problem [1,2]. Inchildren, IDA is associated with decreased cognitive performance and delayed motor andcognitive development; in adults, this is manifested as decreased physical performance andquality of life [3]. Current evidence indicates that IYC below 2 years of age are at very highrisk of iron deficiency [4]. The South East Asian Nutrition Survey (SEANUTS) in Indonesiashowed that the prevalence of anemia was around 55% in children aged 6–23 mo [5]. Despitepositive trends in the reduction in micronutrient deficiencies due to nutritional programs,the percentage of children below the Indonesian nutrient intake recommendations acrossage groups remains high [5]. Beyond the age of 6 months, an infant’s iron needs begin toexceed that provided by breast milk. Analysis of the adjusted linear regression showeddecreased iron status indicators, such as ferritin (16%) and iron (3%), after 3 to 6 mo ofage [6,7]. The amount of iron provided in the breast milk may become insufficient evenbefore 6 mo, especially when infants have suboptimal iron reserves at birth [8], whichmay cause an iron gap. Therefore, during the weaning period, additional sources of ironare needed in order to meet the infant’s growing iron requirements [9]. Furthermore, thecomplementary feeding period spans more than half of the critical first 1000 days of life [9].
Int. J. Environ. Res. Public Health 2022, 19, 5416. https://doi.org/10.3390/ijerph19095416 https://www.mdpi.com/journal/ijerph

Int. J. Environ. Res. Public Health 2022, 19, 5416 2 of 18
Attention should therefore be paid to the type and quality of complementary foods offeredto IYC during this critical stage, in order to prevent disorders associated with deficienciesin iron and other essential micronutrients [9].
A major cause of anemia among Indonesian children is low dietary iron intake [10],and intake of nutrients that support its absorption, such as vitamin C [5]. Results from theSEANUTS study in Indonesia revealed that the prevalence of anemia in IYC aged 6 to 23 mois more than 50%; this prevalence is significantly lower for older children aged 2 to 4.9 years,which has been estimated at 11% and 17% in urban and rural areas, respectively [5]. Irondeficiency was present in 10% and 15% of 2 to 4.9 years old children in urban and ruralareas, respectively. SEANUTS did not report on iron deficiency in children below theage of 2. However, in the literature, for children below the age of two, between 25% and67% of anemia can be attributed to iron deficiency [1,11]. Additionally, a high percentageof children have dietary intakes of energy, protein, vitamin A, and vitamin C below theIndonesian recommended dietary allowance (RDA) [5]. There is evidence suggesting thatcomplementary feeding practices in Indonesia are sub-optimal, particularly among poorerhouseholds, where IYC are fed a limited and inadequate range of complementary foods,i.e., rice-based staple foods, a low intake of animal protein, and a low intake of nutrientswhich support the absorption of iron [12,13]. Severe anemia may require blood transfusions,and the management of blood transfusions needs to be carefully handled to ensure safety.Hazards associated with blood transfusion and risk of allogeneic outcomes are especiallyof concern in children [14].
Food-based strategies have been shown to be safe and effective at addressing ironand other micronutrient deficiencies in the general population, including IYC [15]. Localregulations require that iron be added to infants’ complementary products. The min-imum requirement for iron in complementary foods for infants aged 6–12 months is3.56 mg/100 kcal [16]. Data from the FITS study indicated that iron-fortified infant cerealis a primary source of non-heme iron among U.S. infants aged 6–11.9 months [17]. Thesefindings echo those obtained from a recent meta-analysis of 18 randomized controlled trials(including 5468 children aged 6 months to 5 years), which showed that children who con-sume micronutrient-fortified milk and cereal-based products have improved hemoglobin(Hb) levels (an increase of 0.87 g/dL) and a 57% lower risk of anemia compared withchildren who consume similar non-fortified items [18]. These findings are consistent withthose obtained from other datasets around the world, including the NHANES study [19]and other randomized controlled trials [20,21] as well as those performed in developingcountries such as India [22,23], Bangladesh [24], the Ivory Coast [25], Cameroon, and Viet-nam [26]. Taken together, these studies suggest that fortified infant cereals are a potentialsource of iron for this subgroup of children in developed and developing countries.
Although fortified infant cereals are a feasible and promising vehicle for addressingiron deficiency, there is a lack of empirical data on how the consumption of fortified infantcereals may ameliorate the burden of iron deficiency in Indonesia. A nutritional assessmentof complementary feeding of infants aged 6 to 12 months using the national IndividualFood Consumption Survey (IFCS) in 2014 indicated that the iron, zinc, and calcium intakeof Indonesian infants was mainly from manufactured complementary foods (CF), but theamount of manufactured CF was very small compared with homemade complementaryfoods that were largely vegetable based [27]. Understanding the importance of fortifiedinfant cereals in reducing the risk of IDA, and working with local policy makers andhealthcare practitioners to incorporate them into local complementary feeding practices isessential. The goal of this study was to explore the potential contribution of fortified infantcereals to ameliorating the burden of IDA in Indonesian children aged 6–23 months. Ouranalyses were based on data from the Indonesian Family Life Survey (IFLS) [28] and theIndonesia Demographic and Health Survey 2017 (IDHS-17) [29]. We estimated the currentlevels of Hb in Indonesian children aged 6–23 months, and from there we generated amodel to evaluate the potential impact of fortified infant cereals on alleviating the burdenof IDA.
Int. J. Environ. Res. Public Health 2022, 19, 5416 3 of 18
2. Materials and Methods2.1. Data Source and Study Population
Two Indonesian national data sources were combined for this study. The first datasource originated from the fifth wave of the IFLS 2014–15 [28]. The second was from theIDHS-17 [9]. The IFLS is an ongoing, large-scale, longitudinal socioeconomic and healthsurvey that has been gathering data for 21 years. The survey covers many aspects of thephysical and social environment, including extensive measures of health status. Datagathered include self-reported measures of general health status, symptoms, physician-diagnosed chronic conditions, physical activities, and biomarker measurements (includingbut not limited to physical measurements such as height and weight, blood pressure, pulse,Hb level, and lung capacity) [8]. The IDHS-17 was carried out by the National Populationand Family Planning Board (BKKBN), Statistics Indonesia (BPS), and the Ministry ofHealth (Kemenkes), and funded by the Indonesian government. Technical assistance wasprovided by the U.S. Agency for International Development [29]. The IDHS-17 is theeighth demographic survey in Indonesia conducted under the Demographic and HealthSurveys (DHS) Program, with the aim of providing current data on the basic indicatorsof demography and health across all Indonesian provinces [29]. The rationale for usingthese two national surveys is the availability of variables required from both surveys forthe health economic simulation, in order to meet the objectives of this study. Although thetwo surveys have different study designs, they were able to be combined using children’ssocioeconomic strata and mother’s education levels to link percentages of fortified infantcereals consumption and hemoglobin status by SES.
The sample used for our estimation of the average Hb concentrations according tosocioeconomic group consisted of 767 IYC aged 6–23 months within the IFLS, while data onthe current consumption of fortified infant cereals according to socioeconomic stratificationand age (in months) included 4982 IYC from the IDHS-17. The population was stratifiedinto socioeconomic status (SES) based upon the distribution of educational attainment andwealth indices across households from the IFLS and IDHS-17 datasets, as previously doneby Wieser et al. [30].
2.2. Estimating the Burden of IDA and the Effect of Fortified Infant Cereals
To estimate the effects of fortified infant cereals on the burden of IDA, we devel-oped a health economic simulation model that considered lifetime health and the costconsequences, predominantly in terms of reduced future income, due to IDA in IYC aged6–23 months. This model is similar to one developed in a previously published studyperformed in 6–59-month-old Pakistani infants, adapted to the context of Indonesia [29].Figure 1 provides an overview of the main steps used in performing the calculations in thismodel. Further details of the model are explained in Appendix A.
As a first step, we used the delta method approximation from a regression modelon Hb concentration and the share of anemia attributed to iron deficiency to estimatethe prevalence of IDA across all socioeconomic groups. The prevalence of anemia wascalculated based on the altitude-adjusted Hb values reported in the IFLS [10]. Then, usinga systematic review of the prevalence of anemia due to iron deficiency for the South EastAsia region and age group, we estimated which proportion of anemia was due to irondeficiency [11].
Next, we modeled the relationship between IDA and different scenarios with con-sumption of fortified infant cereals. We first projected a hypothetical Hb distribution at thepopulation level in IYC aged 6–23 months, if fortified infant cereals were not consumed.Under this hypothetical scenario, we estimated the burden of disease using the comparativerisk assessment model previously described by Wieser et al., which was used to estimatethe costs of micronutrient deficiencies in Filipino children aged 6 months to 5 years [31]. Weestimated the reduction in the prevalence of anemia due to consumption of fortified infantcereals by modeling the Hb trajectories and age of the children consuming fortified infantcereals, alongside their duration of consumption, compared with not consuming fortified

Int. J. Environ. Res. Public Health 2022, 19, 5416 4 of 18
infant cereals (Figure 2). We assumed a maximum effect after 6 months of consumption of0.87 g/dL, as reported in a previously published systematic review by Eichler et al. [17].The average estimates that we obtained in the 6- to 23-month-period was lower becausewe took into consideration a time lag between the intake of fortified infant cereals and theresulting increase in Hb.
Int. J. Environ. Res. Public Health 2022, 19, x FOR PEER REVIEW 4 of 18
Figure 1. Structure of the simulation model.
Next, we modeled the relationship between IDA and different scenarios with con-sumption of fortified infant cereals. We first projected a hypothetical Hb distribution at the population level in IYC aged 6–23 months, if fortified infant cereals were not con-sumed. Under this hypothetical scenario, we estimated the burden of disease using the comparative risk assessment model previously described by Wieser et al., which was used to estimate the costs of micronutrient deficiencies in Filipino children aged 6 months to 5 years [31]. We estimated the reduction in the prevalence of anemia due to consumption of fortified infant cereals by modeling the Hb trajectories and age of the children consum-ing fortified infant cereals, alongside their duration of consumption, compared with not consuming fortified infant cereals (Figure 2). We assumed a maximum effect after 6 months of consumption of 0.87 g/dL, as reported in a previously published systematic review by Eichler et al. [17]. The average estimates that we obtained in the 6- to 23-month-period was lower because we took into consideration a time lag between the intake of fortified infant cereals and the resulting increase in Hb.
Figure 2. Modeling of the hemoglobin concentration trajectory according to the duration of con-sumption of fortified infant cereals.
Figure 1. Structure of the simulation model.
Int. J. Environ. Res. Public Health 2022, 19, x FOR PEER REVIEW 4 of 18
Figure 1. Structure of the simulation model.
Next, we modeled the relationship between IDA and different scenarios with con-sumption of fortified infant cereals. We first projected a hypothetical Hb distribution at the population level in IYC aged 6–23 months, if fortified infant cereals were not con-sumed. Under this hypothetical scenario, we estimated the burden of disease using the comparative risk assessment model previously described by Wieser et al., which was used to estimate the costs of micronutrient deficiencies in Filipino children aged 6 months to 5 years [31]. We estimated the reduction in the prevalence of anemia due to consumption of fortified infant cereals by modeling the Hb trajectories and age of the children consum-ing fortified infant cereals, alongside their duration of consumption, compared with not consuming fortified infant cereals (Figure 2). We assumed a maximum effect after 6 months of consumption of 0.87 g/dL, as reported in a previously published systematic review by Eichler et al. [17]. The average estimates that we obtained in the 6- to 23-month-period was lower because we took into consideration a time lag between the intake of fortified infant cereals and the resulting increase in Hb.
Figure 2. Modeling of the hemoglobin concentration trajectory according to the duration of con-sumption of fortified infant cereals. Figure 2. Modeling of the hemoglobin concentration trajectory according to the duration of consump-
tion of fortified infant cereals.
2.3. Costs of the Health Consequences of IDA
We modeled the lifetime costs of IDA in our study sample of IYC aged 6–23 monthswho were exposed to IDA during this period. Production losses that may arise due tolowered future earnings in IYC affected by impaired cognitive or physical developmentwere measured as future losses to gross income, based on the wages specific to their SES.Current wages according to the International Labor Organization were extrapolated tothe future by assuming an income growth equal to the yearly average in the previousdecade. Production losses were discounted to present values with a discount rate of3%, and converted to U.S. dollars with the mean exchange rate of 2020. The life yearslived with IDA-associated disabilities and lost due to premature death were measured indisability-adjusted life years (DALYs).
2.4. Sensitivity Analysis
To explore the robustness of the estimated burden, we ran the model 10,000 times toconstruct synthetic confidence intervals for each scenario. In Appendix B, we reported the

Int. J. Environ. Res. Public Health 2022, 19, 5416 5 of 18
model parameters, confidence intervals, and assumed distributions based on the referencepublications. Based on the nature of the parameters, we assumed an underlying theoreticaldistribution. For the sensitivity analysis, we followed a similar approach to that previouslypublished by Wieser et al. [30].
3. Results
The baseline population considered in the model was the 2017 cohort of babies bornin Indonesia. Table 1 summarizes three basic characteristics of the population by socioeco-nomic decile: number of births, average hemoglobin concentration, and household incomedistribution. These inputs are key in the determination of the burden of IDA and the impactof fortified infant cereals on reducing the burden. Appendix B presents a list of parameterswith their references and the assumed distribution for probabilistic sensitivity analysis.
Table 1. Baseline characteristics of the population in the model by socioeconomic decile 1 to 10.
1 2 3 4 5 6 7 8 9 10
Number of births in 2017 (in thousands) * 436 427 418 413 400 376 371 370 357 355
Average Hb in g/dL children 6 to 23 mo ** 10.4 10.4 10.5 10.6 10.8 10.9 11.1 11.1 11.2 11.2
Household income distribution *** 1.92 3.21 4.23 5.18 6.28 7.6 9.29 11.6 15.9 34.8
Note: * Estimated using population weights from DHS-17. ** Average hemoglobin concentration estimated fromthe IFLS using a delta method approximation technique. *** Household income distribution reported by WIID,the World Income Inequality Database; UNU-WIDER.
3.1. Baseline Hb Levels and Prevalence of IDA in the Study Sample
The estimated mean (± standard deviation) Hb level in our study sample of 6 to23-month-old Indonesian children from the IFLS was 10.8 (±1.4) g/dL. The percentage ofchildren with anemia was highest in the lowest SES (26.1% with mild, 38.3% with moderate,and 1.2% with severe anemia). This proportion decreased gradually from the lowest to thewealthiest households, where the percentage of children with mild, moderate, and severeanemia were 26.1%, 17.7%, and 0.1%, respectively (Figure 3). In the overall study sample,these percentages were 30.4%, 31.4%, and 1.3% with mild, moderate, and severe anemia,respectively. A total of 37% were not anemic.
Int. J. Environ. Res. Public Health 2022, 19, x FOR PEER REVIEW 6 of 18
Figure 3. Percentage of 6 to 23-month infants and young children with anemia across the 10 socio-economic strata (SES).
3.2. Estimated Level and Duration of Consumption of Fortified Infant Cereals in 6 to 23-Month-Old Indonesian Children
A total of 74% of the children in our study sample consumed fortified infant cereals; 26% had never consumed them. The median duration of consumption was 5 months, with most of the subjects being short-term consumers (17% consumed fortified infant cereals for <3 months, 21% from 3–5 months). The duration of consumption was between 6–11 months for 25% of the IYC, and only 11% consumed them for 12 months or longer. When calculating the theoretical consumption of fortified infant cereals based on the recom-mended two servings per infant per day, we calculated a theoretical volume of approxi-mately 30,000 tons of cereals. However, Euromonitor (a company providing aggregated sales data on a global scale) provided an estimated actual consumption volume of 15,000 tons. Altogether, these results suggest that the actual consumption of fortified infant cere-als in our study sample is one serving per day. This assumption has been confirmed by internal consumer research data pointing to the dominant habit of serving fortified infant cereals as a breakfast only (not shown), and by the analysis of the IFCS 2014 showing that less than a quarter of infants aged 9 to 12 months were fed fortified infant cereals [32].
We analyzed the average Hb levels in these IYC throughout the 6 to 23-month period, according to the reported duration of consumption of fortified infant cereals (Figure 4). Hb levels increased with increasing duration of consumption of fortified infant cereals. In non-consumers (0 months; Figure 4), the average Hb levels were the lowest at 10.7 g/dL. The average levels increased to 10.8 g/dL in infants who consumed fortified infant cereals for 3 months, and to 11.15 g/dL in those who consumed fortified infant cereals for 9 months (Figure 4).
Figure 3. Percentage of 6 to 23-month infants and young children with anemia across the 10 socio-economic strata (SES).

Int. J. Environ. Res. Public Health 2022, 19, 5416 6 of 18
3.2. Estimated Level and Duration of Consumption of Fortified Infant Cereals in 6 to23-Month-Old Indonesian Children
A total of 74% of the children in our study sample consumed fortified infant cereals;26% had never consumed them. The median duration of consumption was 5 months, withmost of the subjects being short-term consumers (17% consumed fortified infant cereals for<3 months, 21% from 3–5 months). The duration of consumption was between 6–11 monthsfor 25% of the IYC, and only 11% consumed them for 12 months or longer. When calculatingthe theoretical consumption of fortified infant cereals based on the recommended twoservings per infant per day, we calculated a theoretical volume of approximately 30,000 tonsof cereals. However, Euromonitor (a company providing aggregated sales data on a globalscale) provided an estimated actual consumption volume of 15,000 tons. Altogether, theseresults suggest that the actual consumption of fortified infant cereals in our study sample isone serving per day. This assumption has been confirmed by internal consumer researchdata pointing to the dominant habit of serving fortified infant cereals as a breakfast only(not shown), and by the analysis of the IFCS 2014 showing that less than a quarter of infantsaged 9 to 12 months were fed fortified infant cereals [32].
We analyzed the average Hb levels in these IYC throughout the 6 to 23-month period,according to the reported duration of consumption of fortified infant cereals (Figure 4).Hb levels increased with increasing duration of consumption of fortified infant cereals. Innon-consumers (0 months; Figure 4), the average Hb levels were the lowest at 10.7 g/dL.The average levels increased to 10.8 g/dL in infants who consumed fortified infant cerealsfor 3 months, and to 11.15 g/dL in those who consumed fortified infant cereals for 9 months(Figure 4).
Int. J. Environ. Res. Public Health 2022, 19, x FOR PEER REVIEW 7 of 18
Figure 4. Effect of the duration of consumption of fortified infant cereals on hemoglobin levels in infants and young children aged 6–23 months.
Next, we asked whether income status affected the consumption of fortified infant cereals within the 6 to 23-month period. Figure 5 depicts the percentage of children who consumed fortified infant cereals for each month, for the whole study sample as well as for the sample divided according to wealth group (low, middle, and high income). At around 6 months, less than half of the overall study sample (46%) consumed fortified in-fant cereals. The consumption reached a peak at 7 months (63%), with consumption levels in the overall sample dropping rapidly beyond this timepoint, to 25% at 12 months, 13% at 18 months, and 9% at 23 months (Figure 5). A higher proportion of infants in the wealth-iest subgroup consumed fortified infant cereals, compared with those in the lower wealth subgroups: at 6 months, these were 39%, 49%, and 52%, dropping to 18%, 26%, and 28% at 12 months in the lowest, middle, and wealthiest subgroups, respectively. These differ-ences between the wealth subgroups persisted up to around 20 months, but by 23 months the differences in consumption between the three wealth groups narrowed (6%, 9%, and 10% in the lowest, middle, and highest wealth subgroups, respectively).
Figure 5. Consumption of fortified infant cereals according to wealth group.
Figure 4. Effect of the duration of consumption of fortified infant cereals on hemoglobin levels ininfants and young children aged 6–23 months.
Next, we asked whether income status affected the consumption of fortified infantcereals within the 6 to 23-month period. Figure 5 depicts the percentage of children whoconsumed fortified infant cereals for each month, for the whole study sample as well as forthe sample divided according to wealth group (low, middle, and high income). At around6 months, less than half of the overall study sample (46%) consumed fortified infant cereals.The consumption reached a peak at 7 months (63%), with consumption levels in the overallsample dropping rapidly beyond this timepoint, to 25% at 12 months, 13% at 18 months,and 9% at 23 months (Figure 5). A higher proportion of infants in the wealthiest subgroupconsumed fortified infant cereals, compared with those in the lower wealth subgroups: at6 months, these were 39%, 49%, and 52%, dropping to 18%, 26%, and 28% at 12 months in

Int. J. Environ. Res. Public Health 2022, 19, 5416 7 of 18
the lowest, middle, and wealthiest subgroups, respectively. These differences between thewealth subgroups persisted up to around 20 months, but by 23 months the differences inconsumption between the three wealth groups narrowed (6%, 9%, and 10% in the lowest,middle, and highest wealth subgroups, respectively).
Int. J. Environ. Res. Public Health 2022, 19, x FOR PEER REVIEW 7 of 18
Figure 4. Effect of the duration of consumption of fortified infant cereals on hemoglobin levels in infants and young children aged 6–23 months.
Next, we asked whether income status affected the consumption of fortified infant cereals within the 6 to 23-month period. Figure 5 depicts the percentage of children who consumed fortified infant cereals for each month, for the whole study sample as well as for the sample divided according to wealth group (low, middle, and high income). At around 6 months, less than half of the overall study sample (46%) consumed fortified in-fant cereals. The consumption reached a peak at 7 months (63%), with consumption levels in the overall sample dropping rapidly beyond this timepoint, to 25% at 12 months, 13% at 18 months, and 9% at 23 months (Figure 5). A higher proportion of infants in the wealth-iest subgroup consumed fortified infant cereals, compared with those in the lower wealth subgroups: at 6 months, these were 39%, 49%, and 52%, dropping to 18%, 26%, and 28% at 12 months in the lowest, middle, and wealthiest subgroups, respectively. These differ-ences between the wealth subgroups persisted up to around 20 months, but by 23 months the differences in consumption between the three wealth groups narrowed (6%, 9%, and 10% in the lowest, middle, and highest wealth subgroups, respectively).
Figure 5. Consumption of fortified infant cereals according to wealth group. Figure 5. Consumption of fortified infant cereals according to wealth group.
3.3. Increasing the Consumption of Fortified Infant Cereals: Effects on IDA
The estimated mean (±sd) Hb level in our study sample of 6 to 23-month-old Indone-sian children from the IFLS was 10.5 (±1.4) g/dL. The percentage of children with anemiawas highest in the lowest SES (26.1% with mild, 38.3% with moderate, and 1.2% withsevere anemia). This proportion decreased gradually from the poorest to the wealthiesthouseholds, where the percentages of children with mild, moderate, and severe anemiawere 26.1%, 17.7%, and 0.1%, respectively (Figure 3). In the overall study sample, these per-centages were 30.4%, 31.4%, and 1.3% with mild, moderate, and severe anemia, respectively.A total of 37% were not anemic.
We analyzed the average Hb levels in the IYC in the 6 to 23-month period accordingto the reported duration of consumption of fortified infant cereals (Figure 4). Hb levelsincreased with increasing duration of consumption of fortified infant cereals. In non-consumers (0 months; Figure 4), the average Hb levels were the lowest at 10.7 g/dL. Theaverage levels increased to 10.8 g/dL in infants who consumed fortified infant cereals for3 months, and to 11.2 g/dL in those who consumed fortified infant cereals for 9 months(Figure 4).
Next, we considered whether income status affects the consumption of fortified infantcereals within the 6 to 23-month period. Figure 5 depicts the percentage of children whoconsumed fortified infant cereals for each month, for the whole study sample as well as forthe sample divided according to wealth group (low, middle, and high income). At around6 months, less than half of the overall study sample (46%) consumed fortified infant cereals.The consumption reached a peak at 7 months (63%), with consumption levels in the overallsample dropping rapidly beyond this timepoint, to 25% at 12 months, 13% at 18 months,and 9% at 23 months (Figure 5). A higher proportion of infants in the wealthiest subgroupconsumed fortified infant cereals, compared with those in the lower wealth subgroups: at6 months, these were 39%, 49%, and 52%, dropping to 18%, 26%, and 28% at 12 months inthe lowest, middle, and wealthiest subgroups, respectively. These differences between thewealth subgroups persisted up to around 20 months, but by 23 months the differences in

Int. J. Environ. Res. Public Health 2022, 19, 5416 8 of 18
consumption between the three wealth groups narrowed (6%, 9%, and 10% in the lowest,middle, and highest wealth subgroups, respectively).
To estimate the impact of fortified infant cereals on reducing the burden of IDA inthis population, we performed several calculations based on hypothetical scenarios ofconsumption of fortified infant cereals. The first possible scenario was to maintain thepeak level of consumption (as seen at 7 months; Figure 5) over a duration of 3 months, i.e.,to increase the duration of consumption by 2 months in those who currently consumedfortified infant cereals for only a short duration (1–2 months). The second scenario was toraise the level of consumption in the lowest wealth tertile to that of the middle tertile.
As a first step, we calculated the current impact of consuming one serving per dayof fortified infant cereals in our study sample, in terms of production losses and DALYs(Table 2). This was compared against the effect of not consuming fortified infant cereals toobtain the magnitude of the effect size. Table 2 summarizes the results of these calculations,with production losses arising from impaired physical activity, cognitive impairment,mortality, and in total, in terms of U.S. dollars and DALYs. The results showed that theconsumption of fortified infant cereals yielded a reduction in production losses due tocognitive impairment and mortality (a difference of 8.5% and 13.4%, respectively, comparedwith not consuming fortified infant cereals; overall difference 8.5%, or USD 171 million). Interms of DALYs, the consumption of fortified infant cereals ameliorated the DALYs dueto impaired physical activity, cognitive impairment, and mortality (a difference of 7.9%,7.8%, and 12.9%, respectively, compared with non-consumers; overall difference 7.9%, or43,000 DALYs).
Table 2. Impact of the consumption of fortified infant cereals versus non-consumption on the burdenof IDA in infants and young children aged 6–23 months.
Production Losses (Millions of U.S. Dollars)
Cognitive impairment Mortality Total
With current level of consumption and fortification 2005.2 4.7 2009.9
Without fortification of infant cereals 2175.3 5.3 2180.6
Difference (%) 170 (8.5%) 0.6 (13.4%) 171 (8.5%)
DALYs (thousands)
Impaired physical activity Cognitive impairment Mortality Total
With current level of consumptionand fortification 51.9 495.5 5.5 552.9
Without fortification of infant cereals 56 534.1 6.2 596
Difference (%) 4 (7.9%) 39 (7.8%) 0.7 (12.9%) 43 (7.9%)
DALYs, disability-adjusted life years; IDA, iron-deficiency anemia.
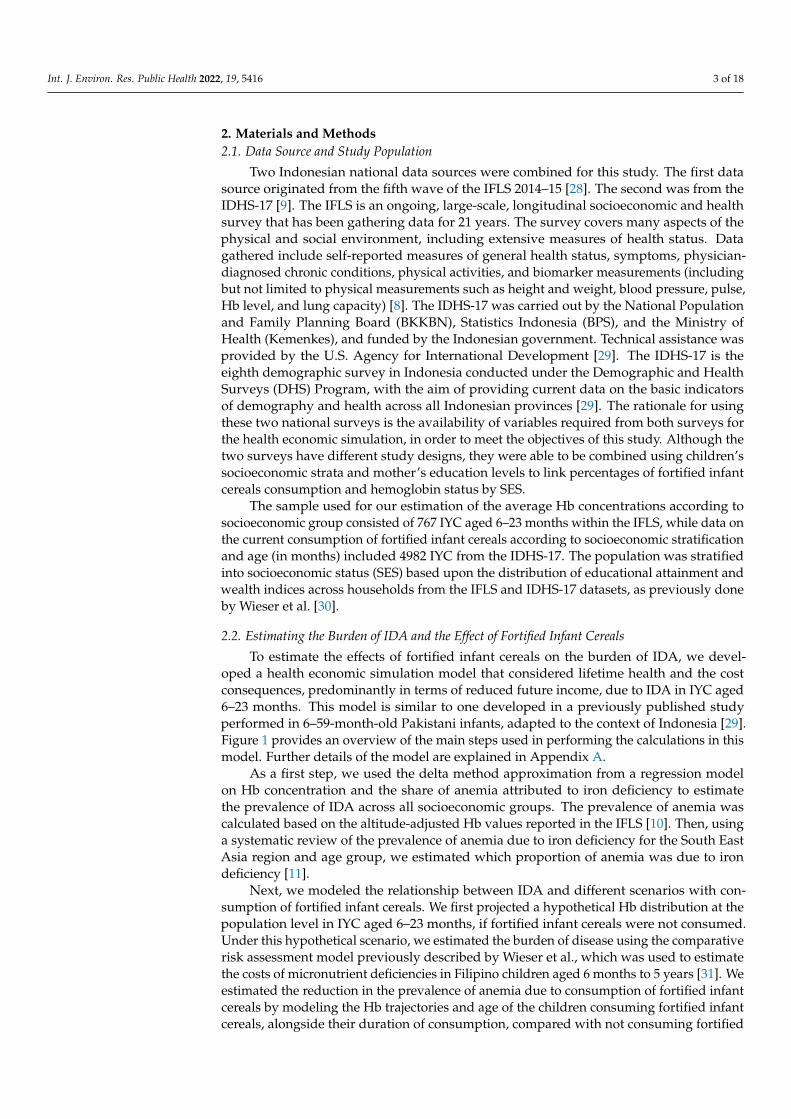
The next step was to estimate the effects of increasing the duration of consumption offortified infant cereals by 2 months in those children who were short-term consumers. Thiswas compared against the current level of consumption, and the magnitude of the effectsize was calculated in terms of U.S. dollars and DALYs (Table 2). The results indicate thatincreasing the duration of consumption would result in an improvement in productionlosses due to cognitive impairment and mortality of 1.8% and 2.8%, respectively (overalldifference 1.8%, or USD 37 million). The improvements in DALYs that would result fromimpaired physical activity, cognitive impairment, and mortality were 1.7%, 1.7%, and 2.5%,respectively (overall difference 1.7% or 9000 DALYs; Table 3).
Int. J. Environ. Res. Public Health 2022, 19, 5416 9 of 18
Table 3. Impact of increasing the duration of consumption of fortified infant cereals by 2 months onthe burden of IDA in infants and young children with a short duration of consumption.
Production Losses (Millions of U.S. Dollars)
Cognitive impairment Mortality Total
Current consumption 2005.2 4.7 2009.9
Increased duration of consumption 1968.7 4.6 1973
Difference (%) 37 (1.8%) 0.1 (2.8%) 37 (1.8%)
DALYs (thousands)
Impaired physical ability Cognitive impairment Mortality Total
Current consumption 51.9 495.5 5.5 552.9
Increased duration of consumption 51 487.2 5.4 543.6
Difference (%) 0.9 (1.7%) 8.3 (1.7%) 0.1 (2.5%) 9.3 (1.7%)
DALYs, disability-adjusted life years; IDA, iron-deficiency anemia.
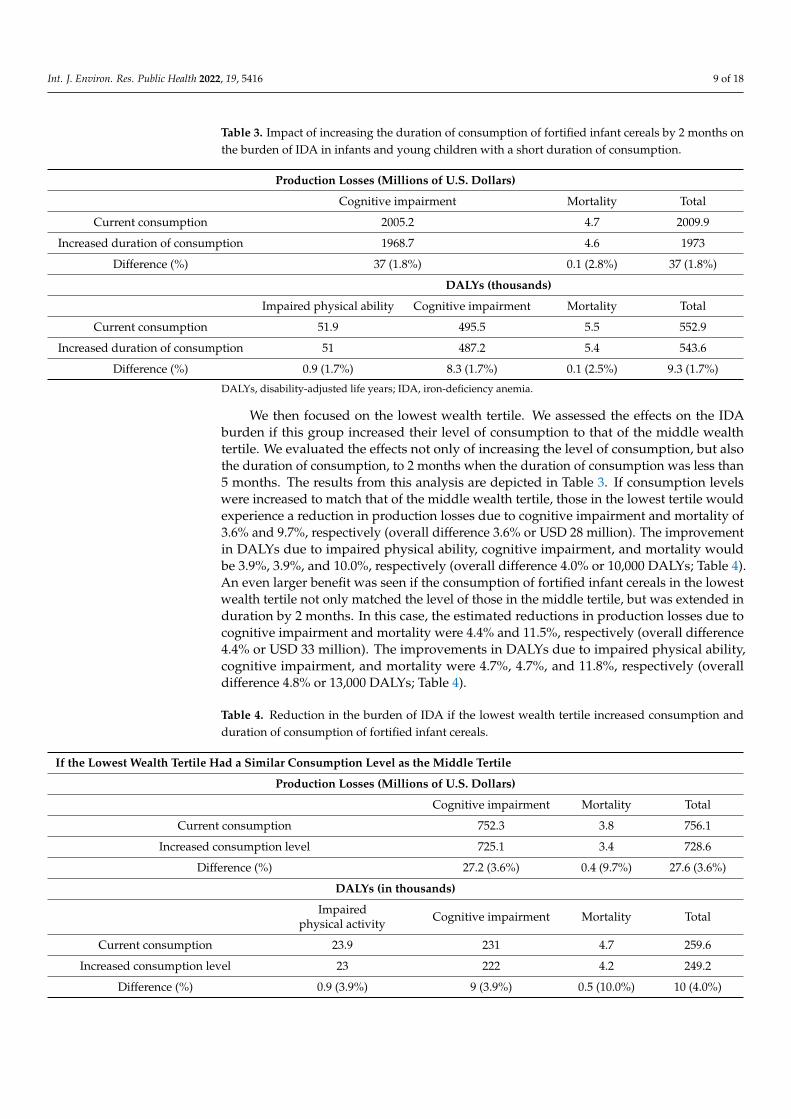
We then focused on the lowest wealth tertile. We assessed the effects on the IDAburden if this group increased their level of consumption to that of the middle wealthtertile. We evaluated the effects not only of increasing the level of consumption, but alsothe duration of consumption, to 2 months when the duration of consumption was less than5 months. The results from this analysis are depicted in Table 3. If consumption levelswere increased to match that of the middle wealth tertile, those in the lowest tertile wouldexperience a reduction in production losses due to cognitive impairment and mortality of3.6% and 9.7%, respectively (overall difference 3.6% or USD 28 million). The improvementin DALYs due to impaired physical ability, cognitive impairment, and mortality wouldbe 3.9%, 3.9%, and 10.0%, respectively (overall difference 4.0% or 10,000 DALYs; Table 4).An even larger benefit was seen if the consumption of fortified infant cereals in the lowestwealth tertile not only matched the level of those in the middle tertile, but was extended induration by 2 months. In this case, the estimated reductions in production losses due tocognitive impairment and mortality were 4.4% and 11.5%, respectively (overall difference4.4% or USD 33 million). The improvements in DALYs due to impaired physical ability,cognitive impairment, and mortality were 4.7%, 4.7%, and 11.8%, respectively (overalldifference 4.8% or 13,000 DALYs; Table 4).
Table 4. Reduction in the burden of IDA if the lowest wealth tertile increased consumption andduration of consumption of fortified infant cereals.
If the Lowest Wealth Tertile Had a Similar Consumption Level as the Middle Tertile
Production Losses (Millions of U.S. Dollars)
Cognitive impairment Mortality Total
Current consumption 752.3 3.8 756.1
Increased consumption level 725.1 3.4 728.6
Difference (%) 27.2 (3.6%) 0.4 (9.7%) 27.6 (3.6%)
DALYs (in thousands)
Impairedphysical activity Cognitive impairment Mortality Total
Current consumption 23.9 231 4.7 259.6
Increased consumption level 23 222 4.2 249.2
Difference (%) 0.9 (3.9%) 9 (3.9%) 0.5 (10.0%) 10 (4.0%)

Int. J. Environ. Res. Public Health 2022, 19, 5416 10 of 18
Table 4. Cont.
If the lowest wealth tertile had a similar consumption level as the middle tertile and increased duration of consumption
Production losses (millions of U.S. dollars)
Cognitive impairment Mortality Total
Current consumption 752.3 3.8 756.1
Increased consumption level and duration 719.4 3.4 722.8
Difference (%) 32.9 (4.4%) 0.4 (11.5%) 33.3 (4.4%)
DALYs (in thousands)
Impairedphysical ability Cognitive impairment Mortality Total
Current consumption 23.9 231 4.7 259.6
Increased consumption level andduration 22.8 220.2 4.1 247.1
Difference (%) 1.1 (4.7%) 10.8 (4.7%) 0.6 (11.8%) 12.5 (4.8%)
DALYs, disability-adjusted life years; IDA, iron-deficiency anemia.
Finally, we estimated the burden of IDA if all children aged 6–23 months consumedtwo servings per day of fortified infant cereals, increasing the duration of consumptionof fortified infant cereals by 2 months in those children who were short-term consumers(Table 4). Here, the estimated reductions in production losses due to cognitive impair-ment and mortality were 8.0% and 11.7%, respectively (overall difference 8.0% or USD161 million). The improvements in DALYs due to impaired physical ability, cognitiveimpairment, and mortality were 7.4%, 7.4%, and 11.4%, respectively (overall difference7.4% or 41,000 DALYs; Table 5).
Table 5. Impact on the burden of IDA if all 6–23-month infants and young children consumed twoservings per day of fortified infant cereals.
Production Losses (Millions of U.S. Dollars)
Cognitiveimpairment Mortality Total
Current consumption 2 005.2 4.7 2 009.9
Two servings per day 1 844.5 4.1 1 848.7
Difference (%) 161 (8.0%) 1 (11.7%) 161 (8.0%)
DALYs (in thousands)
Impairedphysical ability
Cognitiveimpairment Mortality Total
Current consumption 51.9 495.5 5.5 552.9
Two servings per day 48.1 458.9 4.9 511.9
Difference (%) 3.8 (7.4%) 36.6 (7.4%) 0.6 (11.4%) 41 (7.4%)DALYs, disability-adjusted life years; IDA, iron-deficiency anemia.
3.4. Probabilistic Sensitivity Analysis
We performed a multivariate probabilistic sensitivity analysis (PSA) to generate asynthetic confidence interval for the baseline estimation of the current burden of IDA. Wegenerated additional graphs, not displayed in the manuscript, for each of the scenariosconsidered. However, we considered that there was limited added value from the graphsas the variability was more or less in the same proportion as the base case scenario. Theparameters with their assumed distributions are shown in Appendix B. Figure 6 displaysthe probabilistic sensitivity analysis by economic and health burden in DALYs (disability-

Int. J. Environ. Res. Public Health 2022, 19, 5416 11 of 18
adjusted life years) with 10,000 runs. The 95% confidence interval of the results of the modelruns were between USD 0.97 and 3.64 billion of production losses and between 510 and590 thousand estimated DALYs. We observed much wider variability in the economiclosses than in the intangible cost (DALYs), as in addition to the uncertainty of the healthconsequences of IDA, the economic parameters play an important role.
Int. J. Environ. Res. Public Health 2022, 19, x FOR PEER REVIEW 12 of 18
Figure 6. Probabilistic sensitivity analysis by economic and health burden in DALYs (disability-adjusted life years). The lines represent 95% confidence intervals.
4. Discussion Iron has been consistently identified as one of the key lacking nutrients in Indonesian
infants and children [33]. A high prevalence of anemia has been reported in Indonesian children under 2 years of age [10], underscoring the importance of this subgroup as a tar-get for interventions. Targeting children below 2 years of age, however, poses several challenges. After 6 months of age children’s nutritional requirements, alongside their lim-ited gastric capacity, underscore the importance of providing nutrient-dense foods in ad-dition to breast milk [34,35]. Complementary feeding is therefore of utmost importance during this critical period; any inadequacies in the nutrient content and low quality of complementary foods rapidly manifest as micronutrient deficiencies, infectious illnesses, and growth faltering [36]. A high proportion (63%) of our study population was anemic, as seen in the baseline Hb levels. The mean Hb level in our study population was 10.5 ± 1.4 g/dL, consistent with levels previously reported in the 2011 SEANUTS study [10]. Not surprisingly, the highest percentage of anemia was observed in the lowest SES group.
A large body of research suggests that the use of fortified complementary foods, in-cluding fortified infant cereals, is a safe and effective strategy for meeting the nutritional needs of young children during this critical period [36,37]. A main goal of our study was to evaluate the current consumption of fortified infant cereals in 6 to 23-month-old Indo-nesian children, in order to understand the impact on Hb levels and extrapolate the effects on the burden of iron deficiency. Our findings suggested that the overall consumption of fortified infant cereals only occurs for a short period of time in some children under 2 years of age. This is consistent with consumer insights that tend to show a rather low awareness of the health benefits of infant cereals and use of the product for satiety, con-venience, and safety reasons, and with the IFCS 2014.
Next, we explored the relationship between Hb levels and the consumption of forti-fied infant cereals. Our results showed that Hb levels increased with increasing duration of consumption. In non-consumers, average Hb levels were the lowest at 10.71 g/dL, com-pared with 10.86 g/dL in infants who consumed fortified infant cereals for 3 months, and 11.15 g/dL in those who consumed fortified infant cereals for 9 months. It should be noted that our analysis did not account for other factors that may influence Hb levels, such as maternal iron status, or additional dietary components, such as animal products. Since the Hb levels in our study population also appeared to correlate with SES, it is likely that the family’s wealth status also plays a role in shaping the child’s diet (increased dietary di-versity index with wealth, better access to sanitation, etc.). Nevertheless, the results from our analysis are aligned with previously published findings linking the consumption of fortified foods with higher Hb levels in children [17,26,38,39].
Considering these main findings, we evaluated several hypothetical intervention sce-narios based on the consumption of fortified infant cereals and possible outcomes in terms
Figure 6. Probabilistic sensitivity analysis by economic and health burden in DALYs (disability-adjusted life years). The lines represent 95% confidence intervals.
4. Discussion
Iron has been consistently identified as one of the key lacking nutrients in Indonesianinfants and children [33]. A high prevalence of anemia has been reported in Indonesian chil-dren under 2 years of age [10], underscoring the importance of this subgroup as a target forinterventions. Targeting children below 2 years of age, however, poses several challenges.After 6 months of age children’s nutritional requirements, alongside their limited gastriccapacity, underscore the importance of providing nutrient-dense foods in addition to breastmilk [34,35]. Complementary feeding is therefore of utmost importance during this criticalperiod; any inadequacies in the nutrient content and low quality of complementary foodsrapidly manifest as micronutrient deficiencies, infectious illnesses, and growth faltering [36].A high proportion (63%) of our study population was anemic, as seen in the baseline Hblevels. The mean Hb level in our study population was 10.5 ± 1.4 g/dL, consistent withlevels previously reported in the 2011 SEANUTS study [10]. Not surprisingly, the highestpercentage of anemia was observed in the lowest SES group.
A large body of research suggests that the use of fortified complementary foods,including fortified infant cereals, is a safe and effective strategy for meeting the nutritionalneeds of young children during this critical period [36,37]. A main goal of our study was toevaluate the current consumption of fortified infant cereals in 6 to 23-month-old Indonesianchildren, in order to understand the impact on Hb levels and extrapolate the effects on theburden of iron deficiency. Our findings suggested that the overall consumption of fortifiedinfant cereals only occurs for a short period of time in some children under 2 years of age.This is consistent with consumer insights that tend to show a rather low awareness of thehealth benefits of infant cereals and use of the product for satiety, convenience, and safetyreasons, and with the IFCS 2014.
Next, we explored the relationship between Hb levels and the consumption of fortifiedinfant cereals. Our results showed that Hb levels increased with increasing durationof consumption. In non-consumers, average Hb levels were the lowest at 10.71 g/dL,compared with 10.86 g/dL in infants who consumed fortified infant cereals for 3 months,and 11.15 g/dL in those who consumed fortified infant cereals for 9 months. It should benoted that our analysis did not account for other factors that may influence Hb levels, suchas maternal iron status, or additional dietary components, such as animal products. Sincethe Hb levels in our study population also appeared to correlate with SES, it is likely that
Int. J. Environ. Res. Public Health 2022, 19, 5416 12 of 18
the family’s wealth status also plays a role in shaping the child’s diet (increased dietarydiversity index with wealth, better access to sanitation, etc.). Nevertheless, the results fromour analysis are aligned with previously published findings linking the consumption offortified foods with higher Hb levels in children [17,26,38,39].
Considering these main findings, we evaluated several hypothetical interventionscenarios based on the consumption of fortified infant cereals and possible outcomes interms of production losses due to IDA-related cognitive impairment and mortality. Ourresults showed that children who consumed one serving per day of fortified infant cerealshad a reduction in future production losses due to cognitive impairment and mortality(overall difference 8.5%, or USD 171 million, equivalent to 43,000 DALYs), compared withnon-consumers. If children in the lowest SES increased their level of consumption to matchthose in the middle wealth subgroup and prolonged their duration of consumption by2 months, the overall difference in production losses due to cognitive impairment andmortality was 13,000 DALYs (representing a savings of USD 33 million). The largest benefitswere seen if all children aged 6–23 months consumed two servings per day; in this case,the estimated reduction in production losses was 41,000 DALYs (representing a savings ofUSD 161 million).
This study has three major limitations: First, there are only a few studies assessingthe long-term consequences of Iron Deficiency Anemia. Although the mechanism of alack of iron is widely understood, we acknowledge the link between iron deficiency inearly childhood and health economic outcomes throughout the individual’s entire lifespandoes not account for the potential influence of other factors. Second, there is an overlapbetween micronutrient deficiencies and health outcomes. Therefore, adding up burden ofmicronutrient deficiencies from individual studies may lead to an overestimation. Third,there is uncertainty as to the share of anemia due to iron deficiency, which directly affectsthe estimates of the model. Despite the abovementioned limitations, a health modelingapproach provides a practical alternative to help guide public health actors to assess theeffectiveness and cost-effectiveness of interventions.
Improper complementary feeding practices are a common problem in developingcountries. A recent cross-sectional study was performed with 392 Indonesian IYC aged6–23 months, with the goal of analyzing complementary feeding practices and nutritionalstatus. Results from this study indicated that complementary feeding practices were sub-optimal, particularly with respect to minimal dietary diversity, hygiene practices, and theconsumption of foods rich in iron and vitamin A. Of note, the study was performed in AcehBesar, a province with one of the highest prevalence rates of underweight and stunting inIndonesia [40]. Another study indicated that the extent of dietary inadequacy in Indonesianchildren varies with age, geographic region, and socioeconomic status [41]. A small cross-sectional study of 36 infants aged 7–8 months in 2018 in Indonesia indicated that IYC fedwith homemade complementary foods had lower hemoglobin (10.82 g/dL + 1.20 SD) thanthose fed with fortified complementary foods (11.48 g/dL ± 0.85 SD) (p < 0.03) [42]. In astudy assessing the societal costs of micronutrient deficiencies (iron, iodine, vitamin A, andzinc) in 6 to 59-month-old Pakistani children, the most severe cost consequences resultedfrom iron deficiency [30], underscoring the importance of iron as a target for intervention.
In its Global Strategy for Infant and Young Child Feeding, the WHO/UNICEF rec-ommend the use of affordable and locally available foods [43]. In an Indonesian studyassessing the effectiveness of complementary feeding recommendations (CFRs) in improv-ing maternal knowledge, feeding practices, and child intake of key nutrients, includingiron, Fahmida et al. found that a major limiting factor was economic access to nutrient-dense foods [33]. Similar to many rural Indonesian families, poverty and household foodinsecurity were prevalent in the study population. This suggests that cost is an importantfactor that shapes child feeding practices, particularly among lower-income populations.
Another concern is that the commonly used local foods are not always able to supplyadequate levels of key micronutrients. In a study conducted in the Bogor Selatan subdistrictof Bogor, West Java, Indonesia, an area categorized as nutritionally vulnerable due to the

Int. J. Environ. Res. Public Health 2022, 19, 5416 13 of 18
high prevalence of malnutrition, survey data from three local markets indicated thattheoretical iron requirements could not be achieved from local food sources. A theoreticallyoptimized diet based on these local source foods would provide a maximum of 63% of dailyiron requirements, but a worst-case scenario calculation indicated that this would supplyonly 26% of iron requirements. The levels of other micronutrients such as niacin, zinc, andcalcium also fell short [12]. Similar nutritional inadequacies have also been found in thebaseline diets of children in other developing countries [41]. Taken together, these findingssuggest that for iron and other key micronutrients, complementary feeding regimens basedsolely on local foods may not be sufficient to ensure dietary adequacy [12], underscoringthe need for alternative strategies. The fortification of widely-used complementary foodsprovides a means to circumvent these problems [36]. Improvements in manufacturingtechniques and the local production of fortified blended cereal products have lowered costsand made these foods more affordable for low-income families [37]. Compared with otherstrategies, such as micronutrient supplementation, the use of food-based strategies hasbeen shown to be more sustainable over the long term [11]. There are several advantagesof fortified complementary foods such as infant cereals, including the ability to providean appropriate balance of nutrients, the potential for minimizing microbial contaminationcompared with home-prepared foods, and time savings for caregivers [37]. Furthermore,the longer shelf-life of these foods renders them a practical alternative for rural familieswho live far from markets, and who are unable to obtain fresh nutrient-dense foods on aregular basis [33]. The Global Alliance for Improved Nutrition (GAIN) identifies fortifiedinfant cereals as an important vehicle for combating micronutrient deficiencies in infantsand young children [44]. In low-resource settings, improving the quality of complementaryfeeding has been ranked second only to improving the rates of exclusive breastfeedingto prevent deaths in young children [8,34,35,45]. The period of complementary feedingoverlaps with at least half of the critical first 1000 days of life, a time when nutritional andbiological factors play an essential role in shaping future health. The use of fortified infantcereals can be part of a comprehensive, food-based approach to address deficiencies in ironand other micronutrients in this vulnerable subgroup of children.
5. Conclusions
The findings from this study suggest that the consumption of fortified infant cereals(1 or 2 serving/day) could be a potential strategy for reducing the burden of IDA inIndonesian IYC aged 6–23 months, and extending the consumption period would generateconsiderable health and economic societal benefits. A combination of improved accessto fortified infant cereals with nutrition education and nutritious homemade food mightprovide the most beneficial impact.
Author Contributions: Conceptualization, A.P.-P. and P.D.; methodology, A.P.-P. and P.D.; modeldevelopment coding and statistical analysis, A.P.-P.; formal analysis, A.P.-P. and P.D.; writing—reviewand editing, A.P.-P., P.D., R.R., S., I. and Y.W.; project administration, A.P.-P., P.D. and Y.W. All authorshave read and agreed to the published version of the manuscript.
Funding: This research was funded by Nestle Infant Nutrition Indonesia and Nestle Research.
Institutional Review Board Statement: This publication did not include primary data collection.
Informed Consent Statement: Not applicable.
Data Availability Statement: Raw data for The Fifth Wave of the Indonesia Family Life Survey andthe Indonesia Demographic and Health Survey 2017 are available from their respective websites: theRAND Corporation (https://www.rand.org/ (accessed on 1 March 2021)) and The DemographicHealth Survey Program (https://dhsprogram.com/ (accessed on 28 February 2021)).
Acknowledgments: We thank Dantong Wang from Nestle Research Switzerland for reading themanuscript and providing suggestions for improvements.

Int. J. Environ. Res. Public Health 2022, 19, 5416 14 of 18
Conflicts of Interest: Prieto Patron and Yulianti Wibowo are employees of Nestlé. Patrick Detzeland Irene were previous employee of Nestlé when the manuscript was drafted. Nestlé is a companyselling Fortified Infant Cereals.
Appendix A. Additional Information on the Model Estimation
Figure A1 provides additional explanation of the model. The model considered a one-year cohort of Indonesian newborns (2017) and estimated the health and economic burdenfrom six months to the end of life. Some of the health consequences are reversible oncehemoglobin levels are restored, while others are permanent, such as cognitive impairment.In terms of mortality, studies have shown higher mortality for children suffering frommoderate to severe anemia. In the model, this was parametrized using the populationattributable fraction that considers the prevalence of IDA and child mortality, attributing afraction of child mortality to this health condition. The critical window for interventionis 6 to 23 months old, which was the period observed in this study, when fortified infantcereals could have an impact. The impact of infant cereals was estimated by the adaptationof a systematic review on fortified child food by the duration of consumption.
The model was based on the epidemiological frameworks of health consequences dueto IDA, as described in Figure 1. The model was based on a literature review for the healthconsequences. For the estimation of the prevalence of Iron Deficiency Anemia we estimatedas follows. First, we estimated the Hb concentration by socioeconomic decile using thedelta method approximation from a regression model on Hb concentration data from thefifth wave of the IFLS 2014–15. Then, using the standard deviation of the Hb concentration,we estimated the prevalence of anemia by SES group. The share of anemia attributed toiron deficiency was used to estimate the prevalence of IDA across all socioeconomic groupsfrom the Systematic Review of Kassebaum et al., 2014.
Int. J. Environ. Res. Public Health 2022, 19, x FOR PEER REVIEW 15 of 18
Appendix A. Additional Information on the Model Estimation Figure A1 provides additional explanation of the model. The model considered a
one-year cohort of Indonesian newborns (2017) and estimated the health and economic burden from six months to the end of life. Some of the health consequences are reversible once hemoglobin levels are restored, while others are permanent, such as cognitive im-pairment. In terms of mortality, studies have shown higher mortality for children suffer-ing from moderate to severe anemia. In the model, this was parametrized using the pop-ulation attributable fraction that considers the prevalence of IDA and child mortality, at-tributing a fraction of child mortality to this health condition. The critical window for in-tervention is 6 to 23 months old, which was the period observed in this study, when for-tified infant cereals could have an impact. The impact of infant cereals was estimated by the adaptation of a systematic review on fortified child food by the duration of consump-tion.
The model was based on the epidemiological frameworks of health consequences due to IDA, as described in Figure 1. The model was based on a literature review for the health consequences. For the estimation of the prevalence of Iron Deficiency Anemia we estimated as follows. First, we estimated the Hb concentration by socioeconomic decile using the delta method approximation from a regression model on Hb concentration data from the fifth wave of the IFLS 2014–15. Then, using the standard deviation of the Hb concentration, we estimated the prevalence of anemia by SES group. The share of anemia attributed to iron deficiency was used to estimate the prevalence of IDA across all socio-economic groups from the Systematic Review of Kassebaum et al., 2014.
Figure A1. Explanation on the model time frame to estimate temporary and permanent conse-quences of IDA in a birth cohort.
Appendix B. Model Parameters
Table A1. Share of anemia due to iron deficiency and health consequences of IDA.
Parameters Baseline Values 95% CI Distribution References
Share of anemia due to IDA in preschool age children 64% (0.57:0.70) Beta Kassebaum, et al. [11]
Health consequences of IDA
Relative risk of mortality 2.19 (1.68:3.36) Lognormal Brabin, et al. [46] IQ loss due to IDA (points) 9 (5.1:13.4) Gamma Lozoff, et al. [47]
Figure A1. Explanation on the model time frame to estimate temporary and permanent consequencesof IDA in a birth cohort.

Int. J. Environ. Res. Public Health 2022, 19, 5416 15 of 18
Appendix B. Model Parameters
Table A1. Share of anemia due to iron deficiency and health consequences of IDA.
Parameters BaselineValues 95% CI Distribution References
Share of anemia due to IDA inpreschool age children 64% (0.57:0.70) Beta Kassebaum, et al. [11]
Health consequences of IDARelative risk of mortality 2.19 (1.68:3.36) Lognormal Brabin, et al. [46]
IQ loss due to IDA (points) 9 (5.1:13.4) Gamma Lozoff, et al. [47]Reduced physical activity
(tiredness/irritability) 1 Murray, et al. [48]
Table A2. Measurement on the impact of IDA in quality of life (disability weights).
Disability Weight Baseline Values 95% CI Distribution References
Anemia mild 0.005 (0.002:0.023) BetaWieser et al.
Murrayet al.
[31,48]
Anemia moderate 0.058 (0.038:0.086) BetaAnemia severe 0.164 (0.112:0.228) BetaIntellectual disability mild 0.031 (0.018:0.049) BetaIntellectual disability moderate 0.08 (0.053:0.114) Beta
Table A3. Economic and sociodemographic parameters.
Parameters BaselineValues 95% CI Distribution References
Life expectancy (years) 71.1 (68.8:73.4) Gamma World Bank [49]Working life begins (years) 17 (14.5:19.1) Gamma World Bank [49]Working life ends (years) 65 (60.6:71.4) Gamma World Bank [49]Labor force participation % 55 (0.497:0.571) Beta World Bank [49]Projected income growth % 3.5 (0.039:0.031) Normal World Bank [49]Interest rate % 3 (0.034:0.026) Normal Smith [50]Mean monthly wage in USD 255 (215:283) Gamma World Bank [49]Impact of IQ losses on wages % 8 (0.05:0.01) Beta Psacharopoulos [51]Intergenerational incomecorrelation 0.55 (0.50:0.59) Beta Black, Solon [52,53]
Table A4. Iron intake requirements and the impact of fortified infant cereals on hemoglobin concentration.
Parameter Value 95% CI Reference
Recommended nutrient intakes (RNIs)and fortification
RNI iron 6–23M in mg/day 7.2–11 WHO/FAO [54]Iron (mg) per serving in fortified infant cereals 5 NestleIncrease in hemoglobin due to additionaliron intake∆ Hb g/L in from fortified infant cereals3 months one serving Based on Eichler K
et al. [18]∆ Hb g/L in from fortified infant cereals3 months two servings∆ Hb g/L in from fortified infant cereals3 months three servings

Int. J. Environ. Res. Public Health 2022, 19, 5416 16 of 18
References1. Petry, N.; Olofin, I.; Hurrell, R.F.; Boy, E.; Wirth, J.P.; Moursi, M.; Angel, M.D.; Rohner, F. The Proportion of Anemia Associated
with Iron Deficiency in Low, Medium, and High Human Development Index Countries: A Systematic Analysis of NationalSurveys. Nutrients 2016, 8, 693. [CrossRef] [PubMed]
2. World Health Organization (WHO). The Global Prevalence of Anemia in 2011; World Health Organization: Geneva, Switzerland, 2015.3. Cappellini, M.D.; Musallam, K.M.; Taher, A.T. Iron deficiency anaemia revisited. J. Intern. Med. 2020, 287, 153–170.
[CrossRef] [PubMed]4. Burke, R.M.; Leon, J.S.; Suchdev, P.S. Identification, prevention and treatment of iron deficiency during the first 1000 days.
Nutrients 2014, 6, 4093–4114. [CrossRef] [PubMed]5. Sandjaja, S.; Budiman, B.; Harahap, H.; Ernawati, F.; Soekatri, M.; Widodo, Y.; Sumedi, E.; Rustan, E.; Sofia, G.; Syarief, S.N.; et al.
Food consumption and nutritional and biochemical status of 0·5-12-year-old Indonesian children: The SEANUTS study. Br. J.Nutr. 2013, 110, S11–S20. [CrossRef]
6. Burke, R.M.; Rebolledo, P.A.; Aceituno, A.M.; Revollo, R.; Iñiguez, V.; Klein, M.; Drews-Botsch, C.; Leon, J.S.; Suchdev, P.S. Effectof infant feeding practices on iron status in a cohort study of Bolivian infants. BMC Pediatr. 2018, 18, 107. [CrossRef] [PubMed]
7. Castenmiller, J.; de Henauw, S.; Hirsch-Ernst, K.I.; Kearney, J.; Knutsen, H.K.; Maciuk, A.; Mangelsdorf, I.; McArdle, H.J.; Naska,A.; Pelaez, C.; et al. Appropriate age range for introduction of complementary feeding into an infant’s diet. EFSA J. 2019,17, e05780.
8. Dewey, K.G. Nutrition, growth, and complementary feeding of the breastfed infant. Ped. Clin. North Am. 2001, 48,87–104. [CrossRef]
9. Krebs, N.F. Food Based Complementary Feeding Strategies for Breastfed Infants: What’s the Evidence that it Matters? Nutr. Today2014, 49, 271–277. [CrossRef]
10. Kurniawan, Y.A.; Muslimatun, S.; Achadi, E.L.; Sastroamidjojo, S. Anaemia and iron deficiency anaemia among young adolescentgirls from the peri urban coastal area of Indonesia. Asia Pac. J. Clin. Nutr. 2006, 15, 350–356.
11. Kassebaum, N.J.; Jasrasaria, R.; Naghavi, M.; Wulf, S.K.; Johns, N.; Lozano, R.; Regan, M.; Weatherall, D.; Chou, D.P.; Eisele, T.P.;et al. A systematic analysis of global anemia burden from 1990 to 2010. Blood 2014, 123, 615–624. [CrossRef]
12. Fahmida, U.; Santika, O. Development of complementary feeding recommendations for 12-23-month-old children from low andmiddle socio-economic status in West Java, Indonesia: Contribution of fortified foods towards meeting the nutrient requirement.Br. J. Nutr. 2016, 116, S8–S15. [CrossRef]
13. Santika, O.; Fahmida, U.; Ferguson, E.L. Development of food-based complementary feeding recommendations for 9- to11-month-old peri-urban Indonesian infants using linear programming. J. Nutr. 2009, 139, 135–141. [CrossRef]
14. Bolcato, M.; Russo, M.; Trentino, K.; Isbister, J.; Rodrguez, D.; Aprile, A. Patient blood management: The best approach totransfusion medicine risk management. Transfus. Apher. Sci. 2020, 59, 102779. [CrossRef]
15. Mannar, V.; Gallego, E.B. Iron fortification: Country level experiences and lessons learned. J. Nutr. 2002, 132, 856S–858S. [CrossRef]16. Indonesian Food and Drug Administration (BPOM). Indonesian FDA Regulation no 24 Year 2020 on Monitoring of Food Products for
Medical Purposes; BPOM: Jakarta, Indonesia, 2020.17. Finn, K.; Callen, C.; Bhatia, J.; Reidy, K.; Bechard, L.J.; Carvalho, R. Importance of Dietary Sources of Iron in Infants and Toddlers:
Lessons from the FITS Study. Nutrients 2017, 9, 733. [CrossRef]18. Eichler, K.; Wieser, S.; Rüthemann, I.; Brügger, U. Effects of micronutrient fortified milk and cereal food for infants and children:
A systematic review. BMC Public Health 2012, 12, 506. [CrossRef]19. Nicklas, T.A.; O’Neil, C.E.; Fulgoni, V.L. Nutrient intake, introduction of baby cereals and other complementary foods in the diets
of infants and toddlers from birth to 23 months of age. AIMS Public Health 2020, 7, 123–147. [CrossRef]20. Ziegler, E.E.; Fomon, S.J.; Nelson, S.E.; Jeter, J.M.; Theuer, R.C. Dry cereals fortified with electrolytic iron or ferrous fumarate are
equally effective in breast-fed infants. J. Nutr. 2011, 141, 243–248. [CrossRef]21. Atkins, L.A.; McNaughton, S.A.; Campbell, K.J.; Szymlek-Gay, E.A. Iron intakes of Australian infants and toddlers: Findings
from the Melbourne Infant Feeding, Activity and Nutrition Trial (InFANT) Program. Br. J. Nutr. 2016, 115, 285–293. [CrossRef]22. Fotedar, A.; Bhasin, J.S.; Chakravarty, A.; Kulkarni, A.; Bhalla, G.; Anwar, F.; Rao, S. Effectiveness of iron-fortified infant cereals
on hemoglobin levels of children aged 12–24 months: A cross-sectional study from New Delhi, India. J. Fam. Med. Prim. Care2018, 7, 77–80.
23. Awasthi, S.; Reddy, N.U.; Mitra, M.; Singh, S.; Ganguly, S.; Jankovic, I.; Grathwohl, D.; Cercamondi, C.I.; Ghosh, A. Micronutrient-fortified infant cereal improves Hb status and reduces iron-deficiency anaemia in Indian infants: An effectiveness study. Br. J.Nutr. 2020, 123, 780–791. [CrossRef] [PubMed]
24. Davidsson, L.; Sarker, S.A.; Jamil, K.A.; Sultana, S.; Hurrell, R. Regular consumption of a complementary food fortified withascorbic acid and ferrous fumarate or ferric pyrophosphate is as useful as ferrous sulfate in maintaining hemoglobin concentrations>105 g/L in young Bangladeshi children. Am. J. Clin. Nutr. 2009, 89, 1815–1820. [CrossRef] [PubMed]
25. Glinz, D.; Wegmüller, R.; Ouattara, M.; Diakité, V.G.; Aaron, G.J.; Hofer, L.; Zimmermann, M.B.; Adiossan, L.G.; Utzinger, J.;N’goran, E.K.; et al. Iron Fortified Complementary Foods Containing a Mixture of Sodium Iron EDTA with Either FerrousFumarate or Ferric Pyrophosphate Reduce Iron Deficiency Anemia in 12- to 36-Month-Old Children in a Malaria Endemic Setting:A Secondary Analysis of a Cluster-Randomized Controlled Trial. Nutrients 2017, 9, 759.

Int. J. Environ. Res. Public Health 2022, 19, 5416 17 of 18
26. Phu, P.V.; Hoan, N.V.; Salvignol, B.; Treche, S.; Wieringa, F.T.; Khan, N.C.; Tuong, P.D.; Berger, J. Complementary foods fortifiedwith micronutrients prevent iron deficiency and anemia in Vietnamese infants. J. Nutr. 2010, 140, 2241–2247.
27. Egayanti, Y.; Sri Palupi, N.; Prangdimurti, E. Profile of complementary food consumption during the first year of life based onIndonesian Individual Food Consumption Survey 2014. Mal. J. Nutr. 2018, 24, 53–61.
28. Strauss, J.; Witoelar, F.; Sikoki, B. The Fifth Wave of the Indonesia Family Life Survey: Overview and Field Report; RAND Corporation:Santa Monica, CA, USA, 2016; Volume 1.
29. National Population and Family Planning Board (BKKBN); Statistics Indonesia (BPS); Ministry of Health (Kemenkes); ICF.Indonesia Demographic and Health Survey 2017; BKKBN: Jakarta, Indonesia; BPS: Jakarta, Indonesia; Kemenkes: Jakarta, Indonesia;ICF: Jakarta, Indonesia, 2018.
30. Wieser, S.; Brunner, B.; Tzogiou, C.; Plessow, R.; Zimmermann, M.B.; Farebrother, J.; Soofi, S.; Bhatti, Z.; Ahmed, I.; Bhutta, Z.A. So-cietal Costs of Micronutrient Deficiencies in 6- to 59-month-old Children in Pakistan. Food Nutr. Bull. 2017, 38, 485–500. [CrossRef]
31. Wieser, S.; Plessow, R.; Eichler, K.; Malek, O.; Capanzana, M.V.; Agdeppa, I.; Bruegger, U. Burden of micronutrient deficiencies bysocio-economic strata in children aged 6 months to 5 years in the Philippines. BMC Public Health 2013, 13, 1167. [CrossRef]
32. Ekowati, I.N.; Nestle Indonesia. Internal Summary Sales Report Consumer Research Nestle Indonesia. 2020; unpublished data.33. Fahmida, U.; Kolopaking, R.; Santika, O.; Sriani, S.; Umar, J.; Htet, M.K.; Ferguson, E. Effectiveness in improving knowledge, prac-
tices, and intakes of “key problem nutrients” of a complementary feeding intervention developed by using linear programming:Experience in Lombok, Indonesia. Am. J. Clin. Nutr. 2015, 101, 455–461. [CrossRef]
34. Bhutta, Z.A.; Ahmed, T.; Black, R.E.; Cousens, S.; Dewey, K.; Giugliani, E.; Haider, B.A.; Kirkwood, B.R.; Morris, S.S.; Sachdev,H.P.S.; et al. What works? Interventions for maternal and child undernutrition and survival. Lancet 2008, 371, 417–440. [CrossRef]
35. Gould, J.F. Complementary Feeding, Micronutrients and Developmental Outcomes of Children. Nestle. Nutr. Inst. Workshop Ser.2017, 87, 13–28.
36. Dewey, K.G.; Adu-Afarwuah, S. Systematic review of the efficacy and effectiveness of complementary feeding interventions indeveloping countries. Matern. Child Nutr. 2008, 4 (Suppl. 1), 24–85. [CrossRef]
37. Dewey, K.G.; Brown, K.H. Update on technical issues concerning complementary feeding of young children in developingcountries and implications for intervention programs. Food Nutr. Bull. 2003, 24, 5–28. [CrossRef]
38. Prieto-Patron, A.; Van der Horst, K.; Hutton, Z.V.; Detzel, P. Association between Anaemia in Children 6 to 23 Months Old andChild, Mother, Household and Feeding Indicators. Nutrients 2018, 10, 1269. [CrossRef]
39. Faber, M.; Kvalsvig, J.D.; Lombard, C.J.; Benadé, A.J. Effect of a fortified maize-meal porridge on anemia, micronutrient status,and motor development of infants. Am. J. Clin. Nutr. 2005, 82, 1032–1039. [CrossRef]
40. Ahmad, A.; Madanijah, S.; Dwiriani, C.M.; Kolopaking, R. Complementary feeding practices and nutritional status of children6-23 months old: Formative study in Aceh, Indonesia. Nutr. Res. Pract. 2018, 12, 512–520. [CrossRef]
41. Fahmida, U.; Santika, O.; Kolopaking, R.; Ferguson, E. Complementary feeding recommendations based on locally availablefoods in Indonesia. Food Nutr. Bull. 2014, 35, S174–S179. [CrossRef]
42. Kartika, H.H.; Gurnida, D.A.; Primadi, A. Comparison of Hemoglobin level in infants fed with factory made and home madecomplementary food. Sari Pediatri. 2019, 20, 276–282. [CrossRef]
43. WHO/UNICEF. Global Strategy for Infant and Young Child Feeding. Geneva. 2003. Available online: https://www.who.int/publications/i/item/9241562218?msclkid=3996d55fc60311ec84d87785d6646b29 (accessed on 20 February 2021).
44. Moench-Pfanner, R.; Van Ameringen, M. The Global Alliance for Improved Nutrition (GAIN): A decade of partnerships toincrease access to and affordability of nutritious foods for the poor. Food Nutr. Bull. 2012, 33, S373–S380. [CrossRef]
45. Jones, G.; Steketee, R.W.; Black, R.E.; Bhutta, Z.A.; Morris, S.S. How many child deaths can we prevent this year? Lancet 2003, 362,65–71. [CrossRef]
46. Brabin, B.J.; Premji, Z.; Verhoeff, F. An analysis of anemia and child mortality. J. Nutr. 2001, 131, 636S–645S, discussion646S–648S. [CrossRef]
47. Lozoff, B.; Jimenez, E.; Smith, J.B. Double burden of iron deficiency in infancy and low socioeconomic status: A longitudinalanalysis of cognitive test scores to age 19 years. Arch. Pediatr. Adolesc. Med. 2006, 160, 1108–1113. [CrossRef] [PubMed]
48. Murray, C.J.; Lopez, A.D.; World Health Organization. The Global Burden of Disease: A Comprehensive Assessment of Mortality andDisability from Diseases, Injuries, and Risk Factors in 1990 and Projected to 2020: Summary; Harvard University Press: Cambridge,MA, USA, 1996.
49. World Bank, World Development Indicators World Data Bank. 2020. Available online: https://databank.worldbank.org/source/world-development-indicators/preview/on (accessed on 20 July 2020).
50. Smith, D.; Gravelle, H. The practice of discounting economic evaluation of health care interventions. In International Journalof Technology Assessment in Health Care; University of York, Centre for Health Economics: York, UK, 2000; pp. 236–243. ISSN0266-4623.
51. Psacharopoulos, G.; Patrinos, H.A. Returns to investment in education: A further update. Educ. Econ. 2004, 12,111–134. [CrossRef]
52. Black, S.E.; Devereux, P.J. Recent developments in intergenerational mobility. In Handbook of Labor Economics, Vol. 4; O. Ashenfelter,O., Card, D., Eds.; Elsevier: Amsterdam, The Netherlands, 2011; Chapter 16; pp. 1487–1541.

Int. J. Environ. Res. Public Health 2022, 19, 5416 18 of 18
53. Solon, G. Cross-country differences in intergenerational earnings mobility. J. Econ. Perspect. 2002, 16, 59–66. [CrossRef]54. World Health Organization and Food and Agriculture Organization. Vitamin and Mineral Requirements in Human Nutrition: Report
of a Joint FAO/WHO Expert Consultation; World Health Organization: Geneva, Switzerland, 2005.
Related Documents