1 No. 30 May 2011 Yasuyuki Todo and Ryo Takahashi Impact Evaluation Analyses for the JICA Projects Impact of Farmer Field Schools on Agricultural Income and Skills: Evidence from an Aid-Funded Project in Rural Ethiopia

Welcome message from author
This document is posted to help you gain knowledge. Please leave a comment to let me know what you think about it! Share it to your friends and learn new things together.
Transcript
1
No. 30 May 2011
Yasuyuki Todo and Ryo Takahashi
Impact Evaluation Analyses for the JICA Projects
Impact of Farmer Field Schools on Agricultural Income and Skills: Evidence from an Aid-Funded Project in Rural Ethiopia
Use and dissemination of this working paper is encouraged; however, the JICA
Research Institute requests due acknowledgement and a copy of any publication for
which this working paper has provided input. The views expressed in this paper are
those of the author(s) and do not necessarily represent the official positions of either the
JICA Research Institute or JICA.
JICA Research Institute
10-5 Ichigaya Honmura-cho
Shinjuku-ku
Tokyo 162-8433, JAPAN
TEL: +81-3-3269-3374
FAX: +81-3-3269-2054
Copyright ©2011 Japan International Cooperation Agency Research Institute
All rights reserved.

1
Impact of Farmer Field Schools on Agricultural Income and Skills:
Evidence from an Aid-Funded Project in Rural Ethiopia
Yasuyuki Todo* and Ryo Takahashi†
Abstract
This study estimates the effect of farmer field schools in rural Ethiopia on income from
agriculture. The farmer field schools were established in association with participatory forest
management associations for forest protection funded by Japanese aid. We employ a
difference-in-differences propensity score matching approach to correct for possible biases due
to selection of participants. We find that by participating in the farmer field schools,
agricultural households increased their real income per worker by about 60-160 US dollars on
average, which is equivalent to, or even more than, the average income per worker before the
project. We also find evidence that the large increase in income is due to the use of new
agricultural practices, such as new varieties, taught and promoted in the farmer field schools.
Keywords: impact evaluation, poverty alleviation, farmer field school, Ethiopia
* Corresponding author. Department of International Studies, University of Tokyo /Visiting Fellow, JICA Research Institute ([email protected]) † Department of International Studies, the University of Tokyo. This research was conducted as part of the research project “Impact Evaluation of Aid Projects of Japan International Cooperation Agency” in JICA Research Institute. The authors would like to thank Yasuyuki Sawada (the project leader) and Keiichi Tsunekawa (former Director of JICA Research Institute) for providing us the opportunity to engage in this research. The authors also thank Naoki Ando, Takahiro Nakamura, Koji Noda, Fumiaki Saso, Hideki Watanabe, and, in particular, Toru Inada and Tsutomu Nishimura for their great help in data collection, and also two anonymous referees, Terefe Degefa, and participants at the AAU-UT joint workshop “Sustainable Development in Ethiopia” for helpful comments. The opinions expressed and arguments employed in this paper are the sole responsibility of the authors and do not necessarily reflect those of JICA, JICA Research Institute, or any institution the authors are related to.

2
1. Introduction
A striking amount of deforestation has been occurring in tropical forests in less
developed countries (Achard et al. 2002). In Ethiopia, for example, forests accounted for 35
percent of the total land area in the early twentieth century, but this proportion had drastically
declined to 16 percent by the early 1950s (Ethiopian Forestry Action Programme 1994, cited in
Urgessa 2003). More recently, 15.9 percent of Ethiopia’s total forest area was destroyed during
the period 1990-2005, further lowering the proportion of forested land from 13.8 percent in
1990 to 12.7 percent in 2005 (United Nations Statistical Division 2010).
One of the major driving forces of deforestation in less developed countries is poverty,
as asserted by the World Commision on Environment and Development (1987), known as the
Brundtland Report, and at the United Nations Conference on Environment and Development
Summit in Rio de Janeiro in 1992. Poor farmers who do not have any income opportunities
other than small-scale agriculture are inclined to clear forest areas for agricultural use.
Extraction of wood for sale is another means of generating income, and leads to deforestation.
Many studies have shown evidence of a relationship between poverty and deforestation (Myers
1993; Rock 1996; Rudel and Roper 1997; Deininger and Minten 1999). According to a
meta-analysis by Geist and Lambin (2001), poverty was reported as a social factor contributing
to deforestation in 64 of the 152 sub-national cases of deforestation in tropical forests they
examined. Therefore, improving the income of poor residents near or in forests can promote
forest protection by providing opportunities for income generation.
To prevent deforestation and promote reforestation, the Ethiopian government has
implemented many projects, which are sometimes supported by foreign governments and
institutions such as the World Bank, Japan International Cooperation Agency (JICA), and
Germany’s GTZ. In addition, in recognition of the role of poverty alleviation in forest
protection, the projects of the Ethiopian government and foreign institutions often incorporate
programs for improving income, such as technical assistance programs for farmers.

3
This study focuses on one of these projects, the Participatory Forest Management
Project in the Belete-Gera Regional Forest Priority Area (hereafter, “the project”), to quantify
the impact of the project on improving farmers’ income. The project was implemented by JICA
and Oromia Forest and Wildlife Enterprise, a public institution in charge of forest preservation
in the Oromia Region, and commenced in October 2003. The project had three major
components: establishing community-driven forest management associations (Waldaa
Bulchinsaa Bosonaa, or WaBuBs); improving agricultural technologies and practices through
farmer field schools, or WaBuB Field Schools; and livelihood support through the Forest
Coffee Certification Program.
Using panel data for 269 households collected by the project in the pre- and
post-program periods, this study specifically examines the impact of the farmer field schools
on improving income and agricultural practices. Among the policy instruments in the project,
we choose to focus on farmer field schools for the following two reasons. First, although
community-driven forest management is potentially pro-poor, its major objective is forest
conservation, and hence its impact on poverty alleviation is unclear (Sunderlin et al. 2005;
Mahanty et al. 2006). By contrast, farmer field schools aim to directly improve farmers’
livelihoods, and their impact should be more visible. Second, although the Forest Coffee
Certification Program also targets poverty reduction, the program began to function only
recently, and not much certified forest coffee has been sold so far. Therefore, the impact of the
certification program may not be clear at the present time.
Extension of agricultural technologies using farmer field schools has been promoted
by the Food and Agriculture Organization (FAO) (Nelson et al. 2001) and implemented in
many less developed countries. However, the effects of farmer field schools are unclear
(Quizon et al. 2001). For example, an empirical study in the Peruvian Andes by Godtland et al.
(2004) finds that participants in farmer field schools become more knowledgeable about
agriculture than non-participants after participation, and improve productivity in potato

4
production. On the other hand, Feder et al. (2004) conclude that farmer field schools have no
impact on improving economic performance in the case of Indonesia.
One possible reason for these mixed results is the difficulty in estimating the impact of
farmer field schools, or of the impact of development projects in general. When participants in
a development project are not selected randomly, differences between participants and
non-participants after the project may not indicate the effects of the project, but may simply
reflect potential differences between the two groups. To alleviate selection biases in project
impact evaluations, some recent studies such as Miguel and Kremer (2004) utilized
randomized experiments in which participants and non-participants were randomly chosen.
However, such randomized experiments are often difficult to implement for political and
ethical reasons (for example, see Deaton 2007). Therefore, econometric methods to correct for
selection biases are still important tools in evaluating the impact of development projects.
Among those methods, propensity score matching is one of the methods most widely used in
the literature (Jalan and Ravallion 2003; White and Masset 2007; and Todo 2011). In the
literature on the impact of farmer field schools, Godtland et al. (2004) employ propensity score
matching estimations, while Feder et al. (2004) rely on difference-in-differences estimations, in
which potential selection biases may be corrected for to a lesser extent than in propensity score
matching estimations.
In the project examined in this paper, randomized experiments were not carried out,
possibly because JICA was not familiar with such experiments in 2003, when the project
started.1 Therefore, following Godtland et al. (2004) to minimize biases due to participant
selection, we employ propensity score matching methods, and find that participants in the
farmer field schools increased their real income by about 60-160 dollars per worker on average.
The size of the effect is quite large, since the average initial income per worker is about 60
dollars. We also find evidence that the large increase in income is due to the use of new
1. To the authors’ best knowledge, JICA’s first randomized experiment was implemented in 2010.

5
agricultural practices, such as new varieties, taught and promoted in the farmer field schools.
2. Description of the project2
2.1 Project area
The Belete-Gera Regional Forest Priority Area (RFPA) is located in Gera District
(“Woreda” in the local language) and Shabe Sombo District in Oromia Region in the
southwestern part of Ethiopia. The total forest area is about 1,500 square kilometers, an area
more than twice as large as Singapore. There are 30 villages and 80 sub-villages in Gera
District and 14 villages and 46 sub-villages in Shabe Sombo District (Figure 1A). The
Belete-Gera forest is unique in that it produces wild forest coffee as well as regular garden
coffee. “Wild forest coffee” refers to coffee that grows spontaneously in the local forest, and
which is genetically distinct from commercial varieties. In fact, the Belete-Gera forest is one of
the major candidates for being the ultimate origin of coffee. Thus, the forest area can be
divided into two types: the coffee forest area, and the highland forest area without coffee
(Figure 1B). In both types of forest, the residents are mostly farmers, producing cereals, such
as wheat, barley, and teff, vegetables, honey, and milk. In addition, farmers produce coffee in
the coffee forest area.
Estimation using satellite images indicates that the forest area in Gera and Shabe
Sombo Districts decreased by 40 percent during the period 1985-2010. In the project area,
forests are mostly used by local residents, and large-scale commercial logging is not present.
Project managers stressed three reasons for the rapid deforestation in the area: expansion of
farmland into the forest; wood extraction for home consumption and commercial sales of
firewood and timber; and illegal settlement by migrants from other regions of Ethiopia due to
the country’s growing population. Although wood extraction is illegal in the forest area, which
is owned by the government, it was difficult to prevent, as there had been no active system or
2. This section is mostly based on internal project documents and interviews with project managers.

6
institution for forest management, either community- or government-driven, before the project
was implemented.
2.2 Project outline
To prevent deforestation and promote reforestation, the project was initiated in 2003
by Oromia Forest and Wildlife Enterprise and JICA, a Japanese public institution responsible
for administering foreign aid. The project was in two phases, and the second phase was
completed in September 2010.
The major component of the project was to establish participatory forest management
associations at the sub-village level. Once a forest management association was established,
the border between homestead/farmland and forest was identified and marked off with paint.
After this point, expanding farmland into the registered forest area and extracting wood in the
forest area were strictly prohibited, except for necessary thinning and permitted harvesting of
wood for home construction. Members of the associations regularly monitored and evaluated
conditions in the forest.
In return, members of the forest management association were given the official right
to live in the forest area, to use non-timber forest products, and to produce coffee and honey in
the forest area. In addition, the project provided two channels of income generation to the
members of the associations in order to alleviate deforestation due to poverty. First, farmer
field schools (WaBuB Field Schools) were established together with the forest management
associations to provide agricultural skills training to association members. Second, the WaBuB
Forest Coffee Certification Program supported producers of forest coffee in obtaining forest
coffee certification from the Rainforest Alliance, a US-based NGO. The price of certified
coffee at the farm gate is 15-20 percent higher than the regular price.
Table 1 shows the number of forest management associations established by year.
Preparation for establishing an association usually started in October, and was completed
7
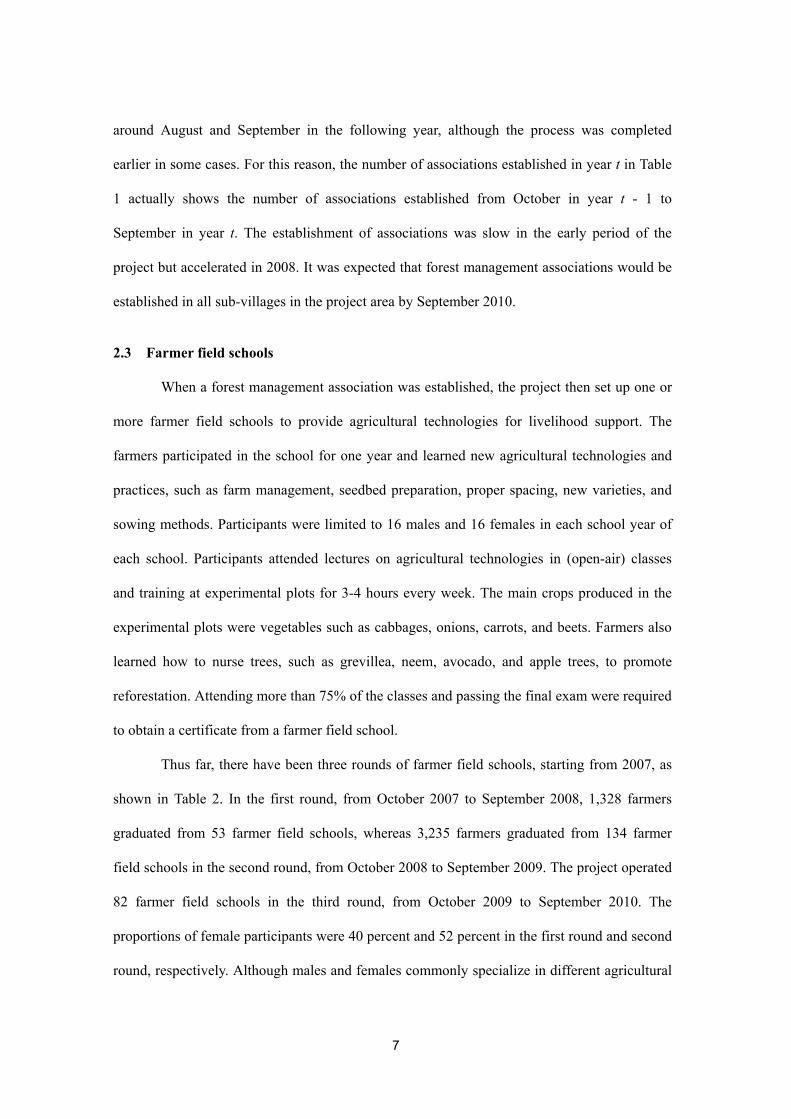
around August and September in the following year, although the process was completed
earlier in some cases. For this reason, the number of associations established in year t in Table
1 actually shows the number of associations established from October in year t - 1 to
September in year t. The establishment of associations was slow in the early period of the
project but accelerated in 2008. It was expected that forest management associations would be
established in all sub-villages in the project area by September 2010.
2.3 Farmer field schools
When a forest management association was established, the project then set up one or
more farmer field schools to provide agricultural technologies for livelihood support. The
farmers participated in the school for one year and learned new agricultural technologies and
practices, such as farm management, seedbed preparation, proper spacing, new varieties, and
sowing methods. Participants were limited to 16 males and 16 females in each school year of
each school. Participants attended lectures on agricultural technologies in (open-air) classes
and training at experimental plots for 3-4 hours every week. The main crops produced in the
experimental plots were vegetables such as cabbages, onions, carrots, and beets. Farmers also
learned how to nurse trees, such as grevillea, neem, avocado, and apple trees, to promote
reforestation. Attending more than 75% of the classes and passing the final exam were required
to obtain a certificate from a farmer field school.
Thus far, there have been three rounds of farmer field schools, starting from 2007, as
shown in Table 2. In the first round, from October 2007 to September 2008, 1,328 farmers
graduated from 53 farmer field schools, whereas 3,235 farmers graduated from 134 farmer
field schools in the second round, from October 2008 to September 2009. The project operated
82 farmer field schools in the third round, from October 2009 to September 2010. The
proportions of female participants were 40 percent and 52 percent in the first round and second
round, respectively. Although males and females commonly specialize in different agricultural

8
activities in rural Ethiopia, both males and females were expected to benefit from the field
schools, because instruction at the schools covered diversified agricultural technologies.
In the first round of the farmer field schools, all instructors were agricultural extension
agents in the village, locally called development agents (the first column of Table 2). In
Ethiopia, there are three extension agents in each village, who are selected and employed by
the Ministry of Agriculture and Rural Development. Most extension agents receive training in
an Agricultural Technical Vocational Education and Training College for three years prior to
their appointments, and so they are skilled in agricultural technologies and practices. However,
as shown in Table 2, about one third of the farmer field schools in the second round were not
taught by extension agents, but mostly by local farmers who volunteered to teach. In the third
round, there were no schools with instruction by extension agents. Although the farmer
instructors (farmer facilitators) received training for five days from project workers, the
training focused on how to facilitate and organize meetings in the field schools, and no training
on agricultural technologies was given. Therefore, the quality of the farmer field schools with
instruction by extension agents should have been higher than the quality of those led by farmer
facilitators, due to the higher level of agricultural skill and knowledge of the extension agents.
The effect of the farmer field schools in the first round would thus have been higher on average
than their effect in the later rounds. We will return to this issue later, in Section 5.4.
3. Empirical framework
This section provides an overview of the framework of the empirical methodology
employed in this study. Details of the estimation procedure will be explained in Section 5,
together with the estimation results.
This paper specifically examines the average effect of treatment on the treated (ATT),
defined as follows:

9
( (1) (0) 1 )= − | = , ,i i i iATT E Y Y D X (1)
where Di is a dummy variable indicating household i’s participation in any farmer field school,
Yi is the outcome variable of household i, or total income from agriculture, as a function of Di,
and Xi denotes characteristics of household i in the pre-program period. More precisely, ATT is
the average difference between the income of participants and their counter-factual income if
they had not participated in the program.
To identify ATT, strong ignorability, i.e., unconfoundedness and overlap, is assumed
(Rosenbaum and Rubin 1983):
(1) (0)Y Y D X, | , (2)
and
0 Pr( 1 ) ( ) 1.D X P X< = | ≡ < (3)
The unconfoundedness assumption given by equation (2) implies that given a set of observable
characteristics X, potential outcomes are independent of treatment assignment. The overlap
assumption given by (3) ensures a positive probability of participation and non-participation.
To estimate ATT, this study employs propensity score matching (PSM) methods
developed by Rosenbaum and Rubin (1983).3 Given strong ignorability, Rosenbaum and
Rubin (1983) show that potential outcomes are also independent of treatment, conditional on
the probability that the farmer participates in a farmer field school, or the propensity score
P(X), and hence that ATT in equation (1) becomes
( (1) 1 ( )) ( (0) 0 ( ))= | = , − | = , .i i i i i iATT E Y D P X E Y D P X (4)
An estimate of the first term of the right-hand side of equation (4) can be the average of actual
outcomes of participants. An estimate of the second term, the expected outcome of participants
3. Other methods to estimate ATT include Mahalanobis-metric matching (Rubin 1980) and weighting by the inversed propensity score (Hirano, Imbens and Ridder 2003). This study employs PSM, because this is the most widely used in the literature.

10
if they had not participated, is the average outcome of the non-participants who are matched
with participants in the program according to their propensity scores.
When panel data are available, as in the case of this paper, a difference-in-differences
(DID) PSM estimator of the ATT can be employed, as proposed by Heckman, Ichimura and
Todd (1997, 1998), to examine the treatment effect on the change in the outcome measure. An
advantage of using DID-PSM estimation is that it can eliminate time-invariant effects on the
outcome variable. Heckman, Ichimura and Todd (1997, 1998) and Smith and Todd (2005) find
that DID estimators perform better than matching estimators without using DID. Formally, the
DID-PSM estimator used in this paper is defined as
( )1 0
1(1) ( ) ( ) (0)
∈ ∈
− = Δ − , Δ ,
i i j ji I j I
DID PSM Y W P X P X YN
(5)
where Δ ≡ −i it isY Y Y and t and s are the post- and the pre-program period. I1 and I0 are
respectively the treatment and the matched control group, and N is the number of observations
in the treatment group. W is a weight determined by the distance between propensity scores of
the treated and the matched control observations.
4. Data
4.1 Household surveys
The data used in this study are based on household-level surveys conducted by JICA in
March 2008 and in March 2010. The first round was done in collaboration with the FAO.
Although the data from the surveys are confidential and only for internal use within JICA, the
authors were granted access to the data for the purpose of impact evaluation.
In the first round, in 2008, 24 sub-villages were selected from the forest area located in
Gera and Shabe Sombo Districts, and 468 households were chosen and interviewed in 2008. In
2010, a subset of 431 of the 468 households were interviewed again. Out of these 24
11
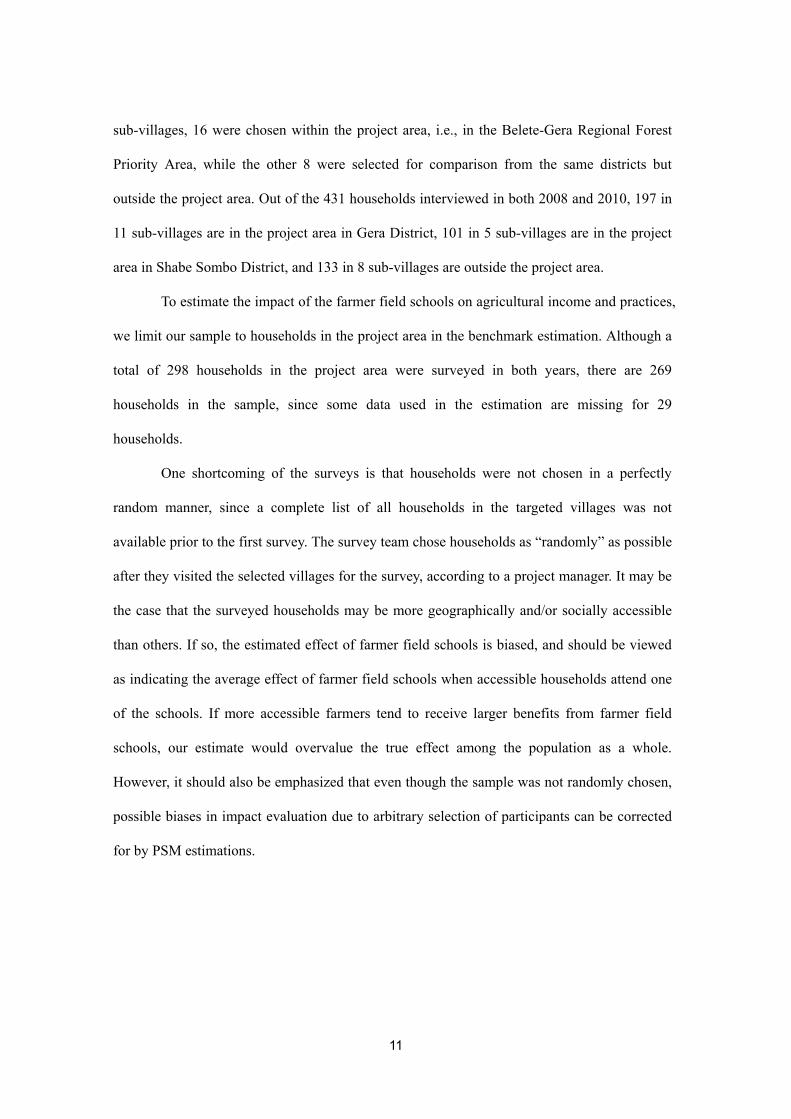
sub-villages, 16 were chosen within the project area, i.e., in the Belete-Gera Regional Forest
Priority Area, while the other 8 were selected for comparison from the same districts but
outside the project area. Out of the 431 households interviewed in both 2008 and 2010, 197 in
11 sub-villages are in the project area in Gera District, 101 in 5 sub-villages are in the project
area in Shabe Sombo District, and 133 in 8 sub-villages are outside the project area.
To estimate the impact of the farmer field schools on agricultural income and practices,
we limit our sample to households in the project area in the benchmark estimation. Although a
total of 298 households in the project area were surveyed in both years, there are 269
households in the sample, since some data used in the estimation are missing for 29
households.
One shortcoming of the surveys is that households were not chosen in a perfectly
random manner, since a complete list of all households in the targeted villages was not
available prior to the first survey. The survey team chose households as “randomly” as possible
after they visited the selected villages for the survey, according to a project manager. It may be
the case that the surveyed households may be more geographically and/or socially accessible
than others. If so, the estimated effect of farmer field schools is biased, and should be viewed
as indicating the average effect of farmer field schools when accessible households attend one
of the schools. If more accessible farmers tend to receive larger benefits from farmer field
schools, our estimate would overvalue the true effect among the population as a whole.
However, it should also be emphasized that even though the sample was not randomly chosen,
possible biases in impact evaluation due to arbitrary selection of participants can be corrected
for by PSM estimations.

12
4.2 Construction of income variables
We compute income from agriculture for each household, using information on the
price and quantity of the harvest for each agricultural product reported by the household.
Agricultural products include cereals, such as wheat, barley, maize, and teff (the staple food in
Ethiopia), vegetables, fruits, garden and forest coffee, and honey. One problem is that prices
reported by households vary substantially for the same products. For example, the price of
sun-dried garden coffee per kilogram in 2010 varies from 3 to 500 birr, with a median of 8
birr.4 The 500 birr amount is obviously incorrect, probably due to input error or confusion
between the unit used in the survey (kilograms) and the unit ordinarily used by the household.
We therefore use the product-level median price for the product of all households. Coffee, in
particular, we divide into four types, according to whether it is sun-dried or red cherry and
garden or forest coffee. Furthermore, since the quality of coffee may vary across villages, and
since the price may vary accordingly, we use the median price of each type of coffee within a
village.5 We then multiply the total quantity of the harvest for each product, including
self-consumed quantities, by the median price to obtain the revenue from the product. Finally,
we take the sum of the revenues from cereals, vegetables, fruits, coffee, and honey to estimate
the total income from agriculture.
In addition, we compute real income from nominal income in the following two ways.
First, we deflate income in 2010 simply using the rate of change in the consumer price index
(CPI) taken from the CIA World Factbook, which is 17.2 percent for 2008 and 44.4 percent for
2009. Real income from agriculture in 2010 is given as nominal income divided by 1.172 ×
4. 1 birr was equal to 0.06 US dollars as of March 11, 2011. 5. In the survey in 2010, the unit for the quantity of all products was kilograms. However, in the survey in 2008, except for coffee, households could choose the unit for the quantity of each product, including locally used units such as fersulas and sacks. Since we do not know exact kilogram equivalents for each of these units (the weight of the same unit may vary across products), we actually use the median price of each product among households using the same unit. If we had taken the median price among households using the same unit within the same village, because the number of such households is often very small, possible biases due to misreporting prices could have been quite large. For this reason, for products other than coffee, we do not use the median price within a village.

13
1.444 = 1.692. Second, we use the median price for each product in 2008 to compute real
income in 2010 as the sum of the quantity produced in 2010 multiplied by the median price in
2008 across all products.
4.3 Summary statistics
Among the 269 households, 181, or 67 percent, are located in Gera District, and 224,
or 83 percent, are Muslim, as indicated in Table 3. In 240 households, or 96 percent, the
household head in 2010 is a male. The percentage of literate heads of households increases
from 42 percent in 2008 to 49 percent in 2010. Summary statistics of the key variables used in
the estimation are shown in Table 4. The average nominal income from agriculture increased
substantially from 2,978 birr in 2008 to 7,461 birr in 2010, partly due to high inflation during
the same period. The increase in average real income was smaller than the increase in average
nominal income: real income in 2010 based on the CPI was 4,409 birr, and that based on
median output prices in the area was 6,625 birr. In per worker terms, the average real income
was 958 birr, or about 60 US dollars, in 2008 and 1,218 (CPI-based) or 1,891 (output
prices-based) in 2010.
4.4 Timing of program implementation and data collection
The timing of the data collection and of the treatment (training in the farmer field
schools in this study) is important in program evaluation studies, since data for both pre- and
post-program periods should be collected. In this study, the timing is appropriate, as explained
below and illustrated in Figure 2.
The household surveys were conducted in March 2008 and March 2010, and asked
about the harvest in the preceding 12 months. Since September is the biggest harvesting season
and there is no major harvest from January to March, income from agriculture estimated from
the data mostly consists of income from the harvest in the year before the survey year. Farmer
field schools were open from October to September, starting from October 2007, and thus

14
income estimated from the survey in 2008, which is actually income mostly earned in
September 2007, was not affected by the establishment of any farmer schools. Income from the
survey in 2008 can therefore be considered to be the outcome before the treatment for any
household.
For the same reason, income estimated from the survey in 2010, or income mostly
earned in September 2009, can be considered to be the outcome after the treatment for
participants in the farmer field schools in the first round, from October 2007 to September
2008. For households that participated in the farmer field schools in the second round, from
October 2008 to September 2009, income estimated from the survey in 2010 includes the
harvest in September 2009, at the very end of the treatment. Therefore, the income according
to the survey in 2010 can be taken as the outcome after the treatment for the second-round
participants. However, it may also be possible that the farmer field schools in the second round
had a weak effect on the harvest in September 2009, because it may require time to apply new
practices learned in a farmer field school to a household’s own farmland.
Based on the above reasoning, the treatment group used in our benchmark estimations
in Sections 5.1 to 5.3 consists of households that participated in the farmer field schools in the
first round. In the extended estimation in Section 5.4, we estimate the effect of the
second-round farmer field schools, creating the treatment group from the second-round
participants, and comparing it with the effect of the first round.
5. Estimation results
5.1 Matching procedure
For the benchmark estimation, we define treatment as participation in the farmer field
schools from October 2007 to September 2008 and estimate the impact of the treatment on
changes in income from agriculture from 2007 to 2009.
To obtain the DID-PSM estimator of the impact of the treatment, we first examine how

15
participation in the farmer field schools is determined, using a probit model. The covariates
used in the probit estimation are the following variables in the pre-program period: years of
schooling of the household head; the number of household members aged from 15 to 65; real
income from agriculture; the area of agricultural land; the area of forest with and without
coffee; the total amount of borrowing in the last three years; the dummy variable for Muslim
households; and the dummy variable for Gera District.
The estimation results presented in column 1 of Table 5 indicate that only three among
the nine variables significantly affect participation in the project’s farmer field schools. Years
of schooling of the household head has a positive and significant effect, implying that more
educated households are more likely to participate in farmer field schools. In addition,
households with a larger forest with coffee are more likely to participate, indicating a positive
effect of wealth on participation. Finally, Muslim households are more likely to participate in
farmer field schools, probably because Muslims, the dominant religious group in the region,
have greater opportunities due to larger social networks based on religion.
To prevent possible biases due to inclusion of unnecessary covariates into the first-stage
estimation, we drop the statistically insignificant variables in column 1 of Table 5 from the
probit estimation and use the results in the second stage. The results using the three covariates
are shown in column 2 of Table 5. Although the effect of years of schooling of the household
head is now not statistically significant, we do not drop this from the set of covariates, as we can
infer a possible significant effect of education from the result in column 1.6
Based on the propensity score from the probit estimation, we create a new control
group using kernel matching, so that the treatment group and the new control group after
matching have similar characteristics. We impose a common support condition to satisfy the
overlap assumption (equation [3]), dropping observations in the treatment group whose
6. As a robustness check, we experimented with estimations without the years of schooling of the household head in the set of covariates, finding results very similar to the baseline results. In fact, the significance level of the treatment effect was generally higher when we dropped the education variable.

16
propensity scores are higher than the maximum or lower than the minimum score among
observations in the control group. Each treated observation is matched with the weighted
average of all control observations in the common support region. In the weight function W in
equation (5), we use the Epanechnikov kernel function and set the bandwidth at 0.06.
After the matching, the treatment and the control group should have similar
characteristics in the pre-program period. To check whether this is the case, we employ two
types of balancing test. First, a simple t test is used to examine whether the mean of each
covariate differs between the treatment and the control group after matching. The results of the
simple t tests, presented in the upper rows of Table 6, indicate that the mean of each covariate
for the treatment group and its mean for the control group are sufficiently similar in all cases
after matching, although these are substantially different in most cases before matching.
Second, we run probit using the sample after matching and compare the pseudo-R2
with that obtained from the probit estimation using the sample before matching. In addition, a
likelihood-ratio test is performed to check whether all the estimated coefficients from the
after-matching probit estimation are zero. These tests are as proposed by Sianesi (2004). If
matching is successful, the after-matching probit should have no explanatory power, so that the
pseudo-R2 should be low and the estimated coefficients should be close to zero. The results
shown in the lower rows of Table 6 indicate that all of these tests find no systematic difference
between the treatment and the after-matching control group.
5.2 Effect of farmer field schools on changes in income
Given that the treatment and the control group pass the balancing tests, we compute
the DID-PSM estimator using equation (5). The standard error of the DID-PSM estimator is
obtained by bootstrapping based on 100 replications, following Smith and Todd (2005). Most
existing studies use bootstrapping standard errors for PSM estimators, since multiple steps in
PSM estimation, including estimation of propensity scores and matching procedures, lead to

17
larger variation in PSM estimators than standard estimators with only one step.7
For reference, we start with the results from Ordinary Least Squares (OLS) before
matching, presented in rows 1 and 2 of Table 7. The OLS results indicate that, between the
treated households (i.e., households that participated in the farmer field schools in 2007-2008)
and the untreated households before matching, the differences in the increase in income from
agriculture in terms of nominal income, real income based on CPI, and real income based on
output prices are 3,234, 1,905, and 5,688 birr, respectively. The difference is highly significant
in all three cases. However, these OLS results may be biased because treated households were
found to be more educated and wealthier than the untreated households.
We now turn to the results from DID-PSM estimation, shown in the lower rows of
Table 7. The differences in income from agriculture between the treated and the matched
control group in terms of nominal income, real income based on CPI, and real income based on
output prices are 2,237, 1,355, and 4,879 birr, respectively (rows 4-6). The difference is
smaller than in the OLS results, confirming possible selection biases in the OLS estimation,
and is significant at the 10-percent level in the former two cases8 and at the 5-percent level in
the last case. Since the average of income from agriculture in 2008 is 2,978 birr (Table 4), we
conclude that by participating in the farmer field schools, households increased their income
by 46-164 percent. In short, the effect of the farmer field schools on agricultural income is
quite large.
Since the number of members varies across households (Table 4), we also estimate the
effect on income per worker in agriculture. The number of workers in agriculture is defined as
the number of members aged from 15 to 65 less the number of members engaged in nonfarm
activities. Income per worker is a better measure for agricultural productivity than total income
7. In practice, these estimation procedures are performed using Stata’s commands based on psmatch 2 of Leuven and Sianesi (2003). 8. We realize that the 10-percent level of significance is not very high in these cases. However, as we will see later, the significance level is at least 5 percent in any other specification, including the one using real income based on output prices, those using income per worker (see rows 6-7 in Table 7), and those not using the education level of the household head as a covariate (see footnote 5).

18
from agriculture. The results from DID-PSM are presented in rows 7-9 of Table 7. The
difference between the treated and the matched control group is significant at the 1-percent
level in the three cases. The difference in real income per worker based on CPI and output
prices is 1,037 and 2,687 birr, or about 60 and 160 US dollars, respectively. Since the average
income per worker in 2008 is 958 birr (Table 4), the results imply that income more than
doubles with participation in the farmer field schools.
In addition, we test whether labor inputs changed after participation in farmer field
schools. Row 10 in Table 7 shows that there is a noticeable increase in person-days per area for
farming in both the treatment and the control group, but the difference in the increase between
the two groups is not statistically significant. Although the number of observations is very low
(i.e., 48), this evidence suggests that the higher income per worker for participant farmers
compared to non-participants is due to a relative increase in labor productivity, rather than an
increase in labor inputs.
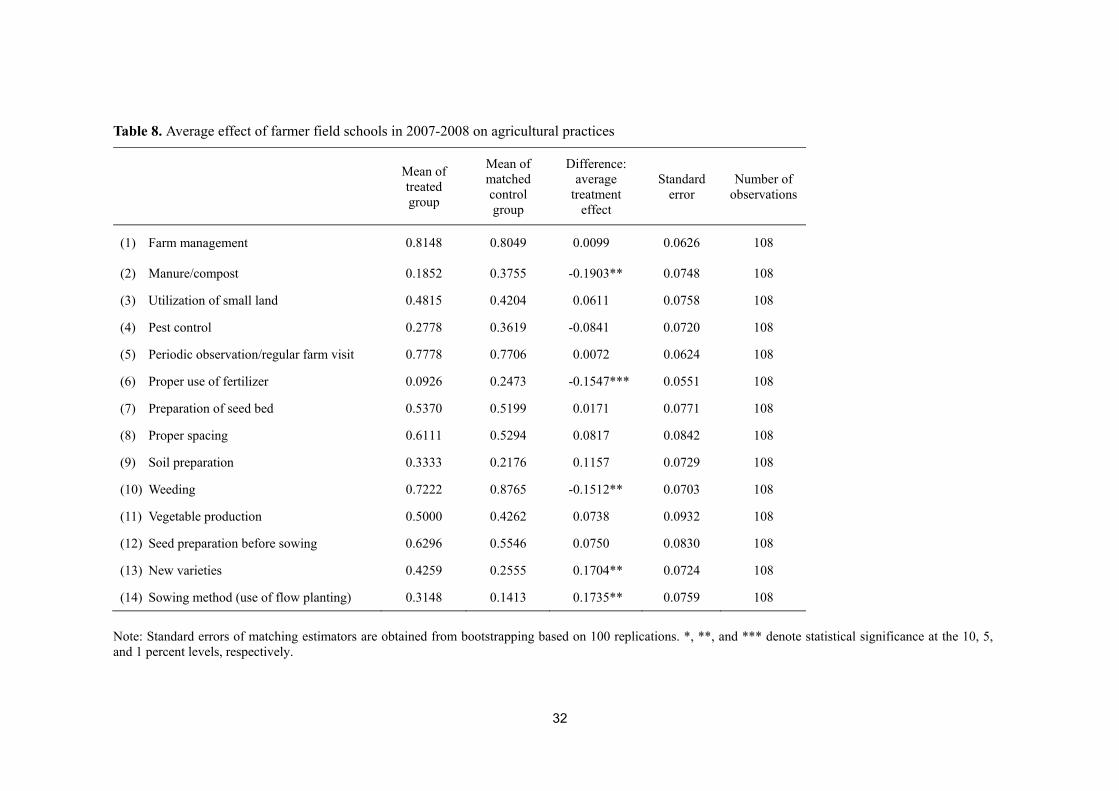
5.3 Effect of farmer field schools on agricultural practices
The large effect of the farmer field schools should be due to the fact that participant
farmers learn new agricultural technologies, skills, and practices in the schools. In the survey
in 2010, the households were asked whether they use each of the agricultural practices listed in
Table 8, such as manure/compost, pest control, new varieties, soil preparation, seed preparation,
and sowing using flow planting. We test whether the use of each practice is significantly higher
for participant households than for non-participants, using PSM estimation. Note that since the
information on the use of these agricultural practices is available only in the survey in 2010,
we cannot employ the difference-in-differences estimator here.
The results presented in Table 8 indicate a positive and significant effect of the farmer
field schools on the use of two practices: by participating in the farmer field schools, farmers
become 17 percent more likely to use new varieties and the sowing method using flow planting

19
than if they had not participated. The positive effect on the use of new varieties is particularly
consistent with the fact that new varieties were intensely promoted in the farmer field schools.
However, the farmer field schools seem to negatively affect three practices: use of
manure/compost, proper use of fertilizer, and weeding. Since the use of fertilizer including
manure and compost was also promoted in the farmer field schools, the results are puzzling.
One possible reason for these puzzling results is that we did not employ the DID approach in
the estimation for agricultural practices due to insufficient data on adoption of agricultural
practices in the first survey. In other words, it is possible that participants are more likely than
non-participants to be located in areas in which manure/compost, fertilizer, or weeding are
relatively less necessary, but we cannot correct for these possible biases due to the limitations
of the data.
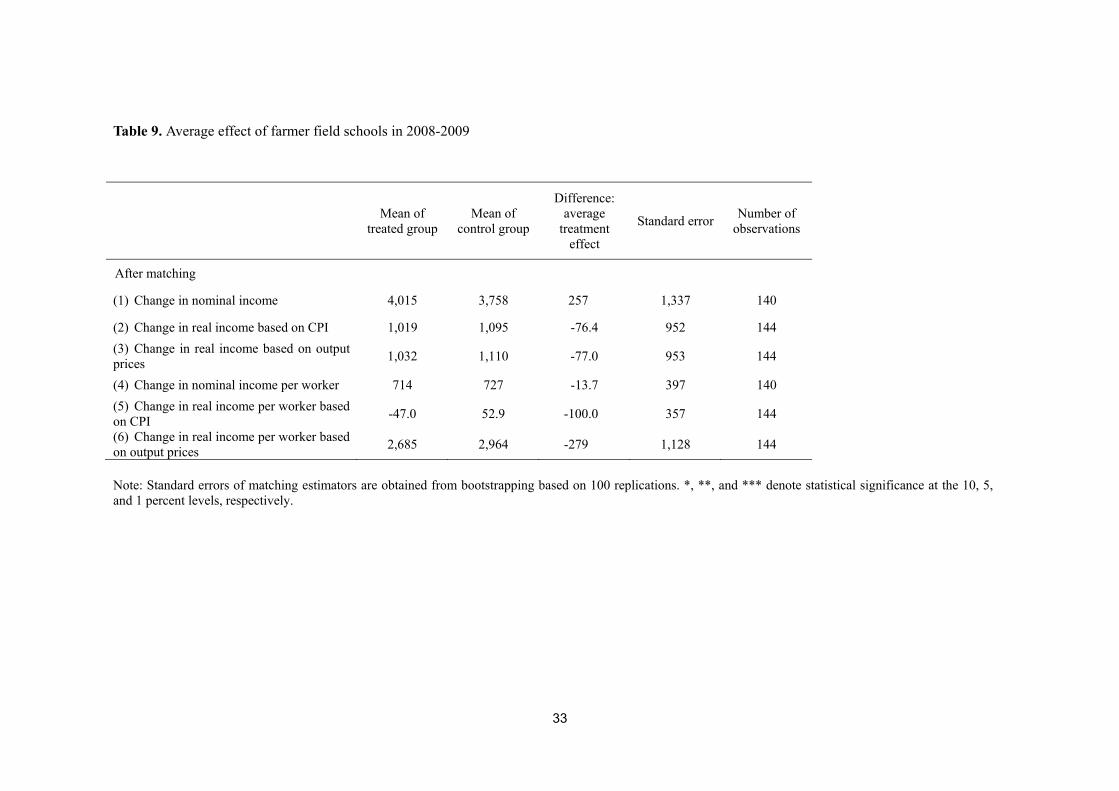
5.4 Effect of farmer field schools in the second round
So far, we have examined effects of the farmer field schools in the first round, from
October 2007 to September 2008, based on the line of reasoning outlined in Section 4.4. Now,
we turn to effects of the farmer field schools in the second round, from October 2008 to
September 2009. The estimation procedure is basically the same as before, but here we exclude
participants in the first round of the farmer field schools from the control groups.
Table 9 presents the results from the DID-PSM estimation. Using any outcome
variable, the difference between the treatment and the matched control group is not statistically
significant. The results clearly show that the second-round farmer field schools did not affect
income, although the first-round schools had a significant effect.
There are two possible reasons for this insignificant effect. First, as we explained in
Section 4.4, it may take some time for the effect of the farmer field schools to be realized. It is
likely that participant farmers learn new agricultural practices in the schools and then apply
these practices to their own farmland after graduation. Second, the quality of the farmer field

20
schools in the second round may have been inferior to those in the first round, since instructors
in some of the second-round schools were local farmers, although all instructors in the first
round were highly-educated extension agents (see Section 2.3). In fact, this inference on the
quality of the schools in the second round is supported by the observations of some project
managers, as obtained in interviews with the managers. However, using the data in hand, it is
impossible to distinguish between these two possibilities, and so this issue requires further
research.
6. Summary and conclusions
This study estimates the effect of farmer field schools in rural Ethiopia on income
from agriculture. The farmer field schools were established in a participatory management
project for forest protection funded by Japanese aid. We employ a difference-in-differences
propensity score matching approach to correct for possible biases due to selection of
participants. We find that by participating in the farmer field schools, agricultural households
increased their real income per worker by about 60-160 US dollars on average, which is
equivalent to, or even larger than, the average income per worker before the project. We also
find evidence that the large increase in income is due to the use of new agricultural practices,
such as new varieties, taught and promoted in the farmer field schools. Although we have no
direct evidence of the impact of the farmer field schools on reforestation, because many
existing studies argue for the role of poverty alleviation in forest protection and show empirical
evidence in support of their claims (see the Introduction), our results indicate that this project
potentially helped to alleviate deforestation through improving the incomes of local farmers in
the area.9
9. Takahashi and Todo (2010), a companion paper of the present study, found that the establishment of a participatory forest management association by the same project increased the forest area over a two year period by 5 percent more than when forest associations were not established.

21
References
Achard, F., H. Eva, H. Stibig, P. Mayaux, J. Gallego, T. Richards, and J. Malingreau. 2002. Determination of deforestation rates of the world’s humid tropical forests. Science 297 (5583): 999.
Deaton, A. 2007. Forum. In Making aid work, ed. A. V. Banerjee. Boston: The MIT Press. Deininger, K. W., and B. Minten. 1999. Poverty, policies, and deforestation: The case of Mexico.
Economic Development and Cultural Change 47 (2): 313-44. Ethiopian Forestry Action Programme. 1994. The challenge for development: Final report. Addis Ababa. Feder, G., R. Murgai, and B. Quizon. 2004. Sending farmers back to school: The impact of farmer field
schools in Indonesia. Review of Agricultural Economics 26 (1): 45-62. Geist, H. J., and E. F. Lambin. 2001. What drives tropical deforestation? A meta-analysis of proximate
and underlying causes of deforestation based on subnational case study evidence. LUCC Report Series No. 4, LUCC International Project Office, University of Louvain.
Godtland, E. M., E. Sadoulet, A. de Janvry, R. Murgai, and O. Ortiz. 2004. The impact of farmer-field-schools on knowledge and productivity: A study of potato farmers in the Peruvian Andes. Economic Development and Cultural Change 53 (1): 63-92.
Heckman, J. J., H. Ichimura, and P. Todd. 1997. Matching as an econometric evaluation estimator: Evidence from evaluating a job training programme. Review of Economic Studies 64 (4): 605-54.
―――. 1998. Matching as an econometric evaluation estimator. Review of Economic Studies 65 (2): 261-94.
Hirano, K., G. W. Imbens, and G. Ridder. 2003. Efficient estimation of average treatment effects using the estimated propensity score. Econometrica 71 (4): 1161-89.
Jalan, J., and M. Ravallion. 2003. Does piped water reduce diarrhea for children in rural India? Journal of Econometrics 112 (1): 153-73.
Leuven, E., and B. Sianesi. 2003. PSMATCH2: Stata module to perform full mahalanobis and propensity score matching, common support graphing, and covariate imbalance testing. Statistical Software Components. S432001.
Mahanty, S., J. Gronow, M. Murse, and Y. Malla. 2006. Reducing poverty through community based forest management in Asia. Journal of Forest and Livelihood 5 (1): 78-89.
Miguel, E., and M. Kremer. 2004. Worms: Identifying impacts on education and health in the presence of treatment externalities. Econometrica 72 (1): 159-217.
Myers, N. 1993. Tropical forests: The main deforestation fronts. Environmental Conservation 20 (1): 9-16.
Nelson, R. J., R. Orrego, O. Ortiz, M. Mundt, M. Fredix, and N. V. Vien. 2001. Working with resource-poor farmers to manage plant diseases. Plant Disease 85 (7): 684-95.
Quizon, J., G. Feder, and R. Murgai. 2001. Fiscal sustainability of agricultural extension: The case of the farmer field school approach. Journal of International Agricultural and Extension Education 8 (1): 13-24.
Rock, M. T. 1996. The stork, the plow, rural social structure and tropical deforestation in poor countries? Ecological Economics 18 (2): 113-31.
Rosenbaum, P. R., and D. B. Rubin. 1983. The central role of the propensity score in observational studies for causal effects. Biometrika 70 (1): 41-55.
Rubin, D. B. 1980. Bias reduction using Mahalanobis-metric matching. Biometrika 36 (2): 293-98. Rudel, T., and J. Roper. 1997. The Paths to rain forest destruction: Crossnational patterns of tropical
deforestation, 1975-90. World Development 25 (1): 53-65. Sianesi, B. 2004. An evaluation of the active labour market programmes in Sweden. Review of
Economics and Statistics 86 (1): 133-55. Smith, J. A., and P. Todd. 2005. Does matching overcome LaLonde’s critique of nonexperimental
estimators? Journal of Econometrics 125 (1-2): 305-53. Sunderlin, W. D., A. Angelsen, B. Belcher, P. Burgers, R. Nasi, L. Santoso, and S. Wunder. 2005.
Livelihoods, forests, and conservation in developing countries: An overview. World Development 33 (9): 1383-1402.
Takahashi, R., and Y. Todo. 2010. Impact of community management on forest protection in Ethiopia. Unpublished manuscript.
Todo, Y. 2011. Impacts of aid-funded technical assistance programs: Firm-level evidence from the Indonesian foundry industry. World Development 39 (3): 351-62.
United Nations Statistical Division. 2010. Environmental indicators, http://unstats.un.org/unsd/environment/forestarea.htm.

22
Urgessa, K. 2003. Perceptions of forest cover and tree planting and ownership in Jimma Zone, Ethiopia. Unasylva 54: 18-22.
White, H., and E. Masset. 2007. Assessing interventions to improve child nutrition: A theory-based impact evaluation of the Bangladesh integrated nutrition project. Journal of International Development 19 (5): 627-52.
World Commission on Environment and Development. 1987. Our common future. Oxford: Oxford University Press.

23
Figure 1. Maps of the project area
(A) Project area
(B) Coffee forest and highland forest
Source: Internal project documents

24
Figure 2. Timing of data collection and treatment
Sep. 2007 Sep. 2008 Mar. 2008 1st survey Sep. 2009
Mar. 20102nd survey Sep. 2010
Farmer field schools (1st round)
Farmer field schools (2nd round)
Farmer field schools (3rd round)
Major harvest covered
in 1st survey
Major harvest covered
in 2nd survey

25
Table 1. Establishment of forest management associations
Number of sub-villages in the project
area
Number of associations established
2007 2008 2009 2010
Gera District 80 2 19 36 23
Shabe Sombo District
45 2 12 22 9
Total 125 4 31 58 32
Note: The forest management associations were established at the sub-village level. Therefore, the number of sub-villages is equal to the total number of associations. The number of associations established in 2010 includes several cases that were to be established in August-September, 2010.

26
Table 2. Description of farmer field schools
Number of farmer field schools
Number of
graduates
Instruction by
extension
agents
Instruction by
farmers/othersTotal
Oct. 2007–Sep. 2008
Gera District 36 0 36 872
Shabe Sombo District 17 0 17 456
Total 53 0 53 1,328
Oct. 2008–Sep. 2009
Gera District 63 29 92 2,267
Shabe Sombo District 30 12 42 970
Total 93 41 134 3,237
Oct. 2009–Sep. 2010
Gera District 0 46 46 NA
Shabe Sombo District 0 36 36 NA
Total 0 82 82 NA
Note: The number of observations is based on an internal report prepared by JICA.

27
Table 3. Summary statistics (1)
2008 2010
Number of
households
Percentage in 269
households
Number of
households
Percentage in 269
households
Gera District 181 67.3 181 67.3
Muslim 224 83.6 224 83.6
Male head 265 98.5 240 95.6
Literate head 112 41.8 128 49.2

28
Table 4. Summary statistics (2)
N = 269 2008 2010
Mean S.D. Min Max. Mean S.D. Min Max.
Years of schooling of the head 1.93 2.69 0 12 1.98 2.57 0 12
Number of members 6.54 2.76 1 17 6.62 2.74 1 17
Number of members aged from 15 to 65 2.94 1.49 1 11 3.14 1.57 1 10
Agricultural land (fachasa)* 9.25 8.22 1 50 6.73 4.32 0 30
Forest land (fachasa)* 5.43 9.83 0 80 4.49 6.40 0 40
Forest land with coffee (fachasa)* 3.94 8.15 0 64 3.60 5.81 0 40
Forest land without coffee (fachasa)* 1.50 3.66 0 40 0.89 2.69 0 20
Labor inputs in agriculture per area (person-days)
62.5 51.5 2 337 90.0 137.8 4 1,305
Number of cattle owned 5.93 4.60 1 46 NA NA NA NA
Amount of borrowing in the last 3 years (birr) 241 685 0 5,000 NA NA NA NA
Income from crop production (birr) 1,975 3,273 0 45,375 4,871 6,258 0 63,450
Income from fruit production (birr) 104 515 0 6,312 91 471 0 6,350
Income from coffee production (birr) 449 1,577 0 20,800 1,670 3,183 0 25,500
Income from honey production (birr) 502 1,065 0 10,980 829 1,321 0 7,200
Income from nonfarm activities (birr) 1,000 1,506 0 9,125 NA NA NA NA
Income from agriculture (birr)
Nominal income 2,978 3,850 0 45,385 7,461 7,305 0 63,450
Change in --- 4,483 7,898 -37,985 60,903
Nominal income per worker 9,58 1,769 0 22,693 2,061 2,203 0 19,000
Change in --- 1,092 2,725 -18,993 17,678
Real income based on CPI 2,978 3,850 0 45,385 4,409 4,316 0 37,491
Change in --- 1,431 5,479 -41,012 34,945
Real income per worker based on CPI 958 1,769 0 22,693 1,218 1,302 0 11,227
Change in --- 250 2,123 -20,506 9,905
Real income based on output prices 2,978 3,850 0 45,385 6,625 8,336 0 78,108
Change in --- 3,647 9,213 -41,012 77,248
Real income per worker based on output prices (birr)
958 1,769 0 22,693 1,891 2,765 0 19,527
Change in --- 927 3,315 -20,506 19,312
Note: 1 fachasa is equal to 0.25 hectare.

29
Table 5. Results from probit estimation
(1) (2)
Years of schooling of the head 0.0597* 0.0522
(0.0352) (0.0339)
Number of members aged from 15 to 65 -0.0416
(0.0622)
Real income from agriculture -4.82e-06
(3.08e-05)
Agricultural land -0.00367
(0.0130)
Forest area with coffee 0.0227** 0.0271***
(0.0107) (0.00962)
Forest area without coffee 0.0247
(0.0300)
Amount of borrowing -9.94e-05
(0.000159)
Dummy for Muslims 0.995*** 0.938***
(0.361) (0.336)
Dummy for Gera District 0.110
(0.216)
Constant -1.861*** -1.886***
(0.435) (0.348)
Observations 265 269
Log likelihood -124.1 -127.0
Note: Standard errors are in parentheses. *, **, and ** indicate statistical significance at the 10, 5, and 1 percent levels, respectively.

30
Table 6. Balancing tests
Sample before
matching Sample after
matching
Years of schooling of the head
Mean (treatment) 2.26 2.21
Mean (control) 1.86 2.18
t test (p value) 0.309 0.964
Forest area with coffee
Mean (treatment) 6.75 6.00
Mean (control) 3.16 4.68
t test (p value) 0.002 0.449
Dummy for Muslims
Mean (treatment) 0.945 0.943
Mean (control) 0.800 0.955
t test (p value) 0.010 0.788
Pseudo R2 0.068 0.004
LR test (p value) 0.000 0.895
N (treatment) 55 53
N (control) 214 53

31
Table 7. Average effect of farmer field schools in 2007-2008
Mean of treated group
Mean of control group
Difference: average treatment
effect
Standard error
Number of observations
Before matching
(1) Change in nominal income 7,057 3,822 3,234*** 1,180 269
(2) --- real income based on CPI 2,946 1,041 1,905** 822 269
(3) --- real income based on output prices 8,172 2,484 5,688*** 1,351 269
After matching
(4) Change in nominal income 6,956 4,718 2,237* 1,287 106
(5) --- real income based on CPI 2,892 1,538 1,355* 802 106
(6) --- real income based on output prices 7,731 2,852 4,879** 2,220 106
(7) --- nominal income per worker 2,646 950 1,696*** 568 106
(8) --- real income per worker based on CPI 1,210 172 1,037*** 355 106
(9) --- real income per worker based on output prices 3,178 491 2,687*** 697 106
(10) --- person-days per area for farming 3.26 2.80 0.469 4.82 48
Note: Standard errors of matching estimators are obtained from bootstrapping based on 100 replications. *, **, and *** denote statistical significance at the 10, 5, and 1 percent levels, respectively.
32
Table 8. Average effect of farmer field schools in 2007-2008 on agricultural practices
Mean of treated group
Mean of matched control group
Difference: average
treatment effect
Standard error
Number of observations
(1) Farm management 0.8148 0.8049 0.0099 0.0626 108
(2) Manure/compost 0.1852 0.3755 -0.1903** 0.0748 108
(3) Utilization of small land 0.4815 0.4204 0.0611 0.0758 108
(4) Pest control 0.2778 0.3619 -0.0841 0.0720 108
(5) Periodic observation/regular farm visit 0.7778 0.7706 0.0072 0.0624 108
(6) Proper use of fertilizer 0.0926 0.2473 -0.1547*** 0.0551 108
(7) Preparation of seed bed 0.5370 0.5199 0.0171 0.0771 108
(8) Proper spacing 0.6111 0.5294 0.0817 0.0842 108
(9) Soil preparation 0.3333 0.2176 0.1157 0.0729 108
(10) Weeding 0.7222 0.8765 -0.1512** 0.0703 108
(11) Vegetable production 0.5000 0.4262 0.0738 0.0932 108
(12) Seed preparation before sowing 0.6296 0.5546 0.0750 0.0830 108
(13) New varieties 0.4259 0.2555 0.1704** 0.0724 108
(14) Sowing method (use of flow planting) 0.3148 0.1413 0.1735** 0.0759 108
Note: Standard errors of matching estimators are obtained from bootstrapping based on 100 replications. *, **, and *** denote statistical significance at the 10, 5, and 1 percent levels, respectively.
33
Table 9. Average effect of farmer field schools in 2008-2009
Mean of
treated groupMean of
control group
Difference: average
treatment effect
Standard errorNumber of
observations
After matching
(1) Change in nominal income 4,015 3,758 257 1,337 140
(2) Change in real income based on CPI 1,019 1,095 -76.4 952 144
(3) Change in real income based on output prices
1,032 1,110 -77.0 953 144
(4) Change in nominal income per worker 714 727 -13.7 397 140
(5) Change in real income per worker based on CPI
-47.0 52.9 -100.0 357 144
(6) Change in real income per worker based on output prices
2,685 2,964 -279 1,128 144
Note: Standard errors of matching estimators are obtained from bootstrapping based on 100 replications. *, **, and *** denote statistical significance at the 10, 5, and 1 percent levels, respectively.

34
Abstract (in Japanese)
要約
この論文は、エチオピアにおいて JICA が実施した「ベレテゲラ参加型森林管理」プロジ
ェクトの一環として設立された農民学校が、農業所得に与えた効果を推計したものである。
しばしばインパクト評価において問題になることであるが、農民学校の参加者が恣意的に
選ばれたことによって、参加者と非参加者との単純な比較では、効果の推計に偏りが生じ
る可能性が大きい。したがって、この論文では、propensity score matching と difference
in differences を組み合わせた手法により、そうした偏りを修正した。その結果、農民学校
に参加することによって、年間の実質農業収入が平均的に 60~160 ドル程度増加したとの
結果を得た。この増加額は、農民学校設立前の平均的な農業収入総額と同程度、あるいは
それを上回るものであった。また、これらの所得の増加が、農民学校で教えられたいくつ
かの技術の習得によるものであることを示唆する実証的な結果も得られた。
Related Documents


![[Tsutomu and Kayoko Okamoto] Development of Gait B(BookZa.org)](https://static.cupdf.com/doc/110x72/577c7f761a28abe054a4adff/tsutomu-and-kayoko-okamoto-development-of-gait-bbookzaorg.jpg)