Status Report: Impact of Climate Change on Horticulture in Himachal Pradesh – District Kullu 1 Impact of Climate Change Assessment on Horticulture Sector in District Kullu Himachal Pradesh Status Report STATE CENTRE ON CLIMATE CHANGE Himachal Pradesh Council for Science, Technology & Environment (HIMCOSTE) Vigyan Bhawan, Bemloe, Shimla-1 Himachal Pradesh

Welcome message from author
This document is posted to help you gain knowledge. Please leave a comment to let me know what you think about it! Share it to your friends and learn new things together.
Transcript
Status Report: Impact of Climate Change on Horticulture in Himachal Pradesh – District Kullu
1
Impact of Climate Change
Assessment on Horticulture
Sector in District Kullu
Himachal Pradesh Status Report
STATE CENTRE ON CLIMATE CHANGE
Himachal Pradesh Council for Science, Technology & Environment (HIMCOSTE)
Vigyan Bhawan, Bemloe, Shimla-1 Himachal Pradesh
Status Report: Impact of Climate Change on Horticulture in Himachal Pradesh – District Kullu
2
Editor-in Chief
Sh. KUNAL SATYARTHI
(Member Secretary)
Compiled and Edited by:
Dr. SS Randhawa Principal Scientific Officer
Dr. YP Sharma Consultant
Dr. Pratima Vaidya Consultant
Ms. Neha Chakarbarty Consultant
Ms. Shubhra Randhawa Scientific Professional
Ms. Kiran lata Scientific Professional
Dr. Priyanka Sharma Scientific Professional
Mr. Ritesh kumar Scientific Professional
Mr. Harish Bharti Scientific Professional
Mrs Pooja Rana Scientific Professional
Status Report: Impact of Climate Change on Horticulture in Himachal Pradesh – District Kullu
3
ACKNOWLEDGEMENT
The State Centre on Climate Change under the aegis of the HP Council for Science
Technology & Environment (HIMCOSTE) acknowledges the assistance provided by the
HIMCOSTE in the preparation of this report on Kullu district. Also express deep sense of
gratitude and regards to Member Secretary (EC),HIMCOSTE for his inspiring guidance,
constant encouragement, valuable suggestions, indefatigable supervision. Climate Change
Centre extend deep gratitude towards Dr.Manmohan Sigh Sandhu, Regional Director IMD,
Shimla and Horticulture Department for providing necessary data for achieving the objectives
of status report.
Special thanks to Dr Kartar S. Verma, Former director of research Dr YSP univ of Hort &
Forestry, Solan and Dr. Suresh Upadhyay, Professor and Head Department of Horticulture
CSK HPKV, Palampur for evaluating the report and giving their valuable comments.

Status Report: Impact of Climate Change on Horticulture in Himachal Pradesh – District Kullu
4
CONTENTS
Table of Figures ...... . . . . . . . . . . . . . . . . . . . . . . . . . . . . . . . . . . . . . . . . . . . . . . . . . . . . . . . . . . . . . . . . . . . . . . . . . . . . . . . . . . . . . . . . . . . . . . . . . . . . . . . . . 5
Table of Tables ...... . . . . . . . . . . . . . . . . . . . . . . . . . . . . . . . . . . . . . . . . . . . . . . . . . . . . . . . . . . . . . . . . . . . . . . . . . . . . . . . . . . . . . . . . . . . . . . . . . . . . . . . . . . 5
Exeutive Summary ....... . . . . . . . . . . . . . . . . . . . . . . . . . . . . . . . . . . . . . . . . . . . . . . . . . . . . . . . . . . . . . . . . . . . . . . . . . . . . . . . . . . . . . . . . . . . . . . . . . . . . 6
Chapter 1 - Introduction ...... . . . . . . . . . . . . . . . . . . . . . . . . . . . . . . . . . . . . . . . . . . . . . . . . . . . . . . . . . . . . . . . . . . . . . . . . . . . . . . . . . . . . . . . . . . . . 9
Climate and Horticulture ........................................................................................................................................ 9
The Himalayas and Climate Change Vulnerability .............................................................................................. 11
Setting the Scene .................................................................................................................................................. 13
Organisation of Status Report ............................................................................................................................... 18
Chapter 2 – Assessment Framework ....... . . . . . . . . . . . . . . . . . . . . . . . . . . . . . . . . . . . . . . . . . . . . . . . . . . . . . . . . . . . . . . . . . . . . . . . . 19
Climate Trend Assessment ................................................................................................................................... 19
Perception-based Vulnerability Assessment ......................................................................................................... 21
Chapter 3 - Pilot Case And Methods ...... . . . . . . . . . . . . . . . . . . . . . . . . . . . . . . . . . . . . . . . . . . . . . . . . . . . . . . . . . . . . . . . . . . . . . . . . . 27
District Kullu – A Background ............................................................................................................................. 27
Kullu and the Climate ........................................................................................................................................... 28
Methods ................................................................................................................................................................ 29
Chapter 4 – Climate Trend and Horticulture: District Kullu ...... . . . . . . . . . . . . . . . . . . . . . . . . . . . . . . . . . . . . 32
Current Climate Trends –District Kullu ............................................................................................................... 32
Fruit Crop Productivity – District kullu ................................................................................................................ 39
Acreage, Production, Productivity Assessment of Major Horticulture Crops ...................................................... 39
Climate- Fruit Crop Juxtaposition ........................................................................................................................ 43
Chapter 5 – Climate Change Vulnerability: Case Study, District Kullu ...... . . . . . . . . . . . . . . . . . . . . 48
Temporal Variations ............................................................................................................................................. 49
Shifting Cropping Patterns – Reasons and Response ........................................................................................... 51
Perception-based Vulnerability Assessment ......................................................................................................... 53
Chapter 6 – Conclusion & Recommendations ...... . . . . . . . . . . . . . . . . . . . . . . . . . . . . . . . . . . . . . . . . . . . . . . . . . . . . . . . . . . . 62
Bibliography ....... . . . . . . . . . . . . . . . . . . . . . . . . . . . . . . . . . . . . . . . . . . . . . . . . . . . . . . . . . . . . . . . . . . . . . . . . . . . . . . . . . . . . . . . . . . . . . . . . . . . . . . . . . . . 66
Appendix A ....... . . . . . . . . . . . . . . . . . . . . . . . . . . . . . . . . . . . . . . . . . . . . . . . . . . . . . . . . . . . . . . . . . . . . . . . . . . . . . . . . . . . . . . . . . . . . . . . . . . . . . . . . . . . . . 70
Appendix B ....... . . . . . . . . . . . . . . . . . . . . . . . . . . . . . . . . . . . . . . . . . . . . . . . . . . . . . . . . . . . . . . . . . . . . . . . . . . . . . . . . . . . . . . . . . . . . . . . . . . . . . . . . . . . . . 76

Status Report: Impact of Climate Change on Horticulture in Himachal Pradesh – District Kullu
5
TABLE OF FIGURES
Figure 1: Horticulture and Climate Change Impact 10 Figure 2: Geographical Representation of the Indian Himalayas 12 Figure 3: Himachal Pradesh Agro-Ecological Zones 16 Figure 4: Map of District Kullu, Himachal Pradesh 27 Figure 5: Study Area with Villages surveyed in Five Development Blocks, District Kullu, HP 31 Figure 6: Variations in Climatic Parameters- Minimum T, Maximum T, Diurnal T, Rainfall, and Rainy Days
during pre-flowering, flowering, and fruit setting stages (1990-2016), District Kullu, HP 33 Figure 7: SAI for Mean Maximum Temperature during pre-flowering, flowering, and fruit setting stages (1990-
2016), District Kullu, HP 35 Figure 8: SAI for Mean Minimum Temperature during pre-flowering, flowering, and fruit setting stages (1990-
2016), District Kullu, HP 35 Figure 9: SAI for Mean Diurnal Temperature during pre-flowering, flowering, and fruit setting stages (1990-
2016), District Kullu, HP 36 Figure 10: SAI for Mean Annual Rainfall during pre-flowering, flowering, and fruit setting stages (1990-2016),
District Kullu, HP 37 Figure 11: SAI for Mean Annual Rainy Days during pre-flowering, flowering, and fruit setting stages (1990-
2016), District Kullu, HP 37 Figure 12: Variations in Annual Acreage, Production, Productivity – Apple (1980-2016), District Kullu, HP 40 Figure 15: Variations in Annual Acreage, Production, and Productivity – Other Temperate Fruits: Plum, Peach,
Apricot, Pear (1980-2016), District Kullu, HP 40 Figure 16: Variations in Annual Acreage, Production, and Productivity – Dry Fruits: Almond, Walnut, Picanut
(1980-2016), District Kullu, HP 41 Figure 17: Acreage under different Fruit Crops, Field Survey, District Kullu, HP 49 Figure 18: Block-wise Acreage under different Fruit Crops, Field Survey, District Kullu, HP 50 Figure 19: Intervening Factors for Shifting Cropping Patterns for Individual Blocks and District Kullu, HP 51 Figure 18: Block-wise Vulnerability Index–Exposure, Sensitivity and Adaptive Capacity, District Kullu, HP 58
TABLE OF TABLES
Table 1: Climate Change Impact and Phenological Stages .................................................................................. 11 Table 2: Agro-Ecological (new) Classification, Himachal Pradesh ..................................................................... 15 Table 3: Measurement Matrix for Exposure, Sensitivity, and Adaptive Capacity Indicators ............................... 26 Table 4: Himachal Pradesh: Horticulture Profile .................................................................................................. 28 Table 5: Mann Kendall Test Results – Climatic Trends for pre-flowering, flowering and fruit setting seasons
(1990-2016) .......................................................................................................................................................... 32 Table 6: SAI for Mean Annual Maximum, Minimum, Diurnal Temperature, Rainfall, Rainy Days from (1990 -
2016), District Kullu, HP ...................................................................................................................................... 34 Table 7: Mann Kendall Test Results – Crop Yields for Fruit Crops (1990-2016) ................................................ 41 Table 8: Multivariate Linear Regression Analysis – Crop Yields and Climatic Parameters, (1999- 2016) ......... 46 Table 9: Socio-Economic Profile Interviewed Farmer Community, District Kullu, HP ...................................... 48 Table 10: Shifting Cropping Patterns – Reasons and Response, Field Survey, District Kullu, HP ...................... 51 Table 11: Block-wise scores and variations in Exposure Indicator, District Kullu, HP ....................................... 53 Table 12: Block-wise scores and variations in Sensitivity Indicator, District Kullu, HP ..................................... 54 Table 13 : Block-wise scores and variations in Adaptive Capacity Indicator, District Kullu, HP........................ 56 Table 14: Block-wise Composite Scores and Variations in Adaptive Capacity Indicator, District Kullu ............ 57 Table 15: Block-wise Vulnerability Index – Exposure, Sensitivity and Adaptive Capacity, District Kullu, HP . 58 Table 16: Climate Change Adaptation Strategies, Field Survey, District Kullu, HP ............................................ 60
Status Report: Impact of Climate Change on Horticulture in Himachal Pradesh – District Kullu
6
EXEUTIVE SUMMARY
Climate change has emerged as a real
concern for the horticulture sector with
visible changes in productivity, quality of
crop yields, and acreage already being
reported around the globe. Crop
production systems in South Asia and sub-
Saharan Africa are observed to be at
undisputable climatic exposure, where
temperature increase is already closer to or
beyond the threshold, which is having a
limiting impact on overall vegetative
growth. A far greater impact of extreme
dry and wet spells compared to changes in
long-term mean precipitation is also being
reported on fruit crop productivity.
Particularly, in the fragile
Himalayan eco-system, where over 72
million people survive and thrive on hill-
agriculture based livelihood, the increasing
pressure from burgeoning population
combined with global climate change is
rendering the occupation challenging and
un-fruitful. The Himalayan ecosystem
offers an enabling environment
characterised with favourable micro-
climatic conditions for cultivation of a
wide range of horticulture crop such as
apples, plums, peaches, bananas, mangoes,
pineapples, citrus fruits, walnuts and more.
Fruits and vegetables cover around 16 per
cent of the total crop land in Indian
Himalayan Region, with the western
Himalayas accounting for around 20 per
cent of farmlands, and the central and
eastern Himalayas with only 5 per cent. In
Himachal Pradesh, which is known as the
fruit bowl of India, around 71 per cent of
the 6.86 million people are dependent on
the agriculture / horticulture sector for
employment and income sources. There is
heightened exposure to climate change
induced vulnerability on sector’s and
individual crop’s sustainability.
To this effect, a status study was
conducted with a view to ascertain the
impact of climate change on horticulture
sector in the state with a pilot study in
District Kullu - one of the 12 districts
nestled in the Pir Panjal range of the
western Himalayas. Seasonal trends on
climatic variables i.e. minimum,
maximum, and diurnal temperatures, and
rainfall patterns (quantity and rainy days)
were conjugated with a standardised
anomaly index, and a multivariate
regression analysis was conducted to
unearth the climate and crop yield
relationship as per the phenological stages
of pre-flowering, flowering, and fruit
setting and development. Further, the study
employed evidence from household
surveys conducted in five blocks (Kullu,

Status Report: Impact of Climate Change on Horticulture in Himachal Pradesh – District Kullu
7
Naggar, Anni, Banjar, and Nirmand) in
District Kullu, to qualify the perceived
validity of outcomes of Climate-Fruit Crop
yield regression analysis. The later part of
the study focused on assessing the
vulnerability of target population for their
exposure and sensitivity to current and
historic climate risks. The assessment
frameworks, both statistical and perception
based Vulnerability Assessment, have
scalable modalities that can be adapted to
other districts.
The growing share of literature is
essentially focused on assessment of
historic and current weather parameter
such as precipitations and temperature vis-
à-vis horticulture productivity with limited
and under-theorised discourse on farmers’
perceptions on their exposure, sensitivity,
and adaptive capacity to climate change in
tandem with observed changes in climatic
parameters.
Based on the assessment of the
statistical and perceptive impact of climate
change in district Kullu, both approaches
identified climate change as an
instrumental component in observed shifts
in cropping patterns and productivity.
Higher variability in climatic variables of
temperature and rainfall was observed
during the flowering period as compared
to pre-flowering and fruit setting and
development phenological stages from
1990 to 2016. During flowering period
minimum and maximum temperature
increased by 0.04°C, 0.12°C per year and
rainfall decreased by 6.17mm per year.
Meanwhile, the maximum temperature
increased by 0.04°C per year during the
pre-flowering period. Higher anomalies in
maximum and minimum temperature were
reported during all three phenological
stages indicating an overall warming trend.
Meanwhile, variations in rainy days
showed significant variations during fruit
setting and development stage only i.e.
May to August (an increase of 0.17).
The statistical assessment of
variations in climatic parameters of
temperature and rainfall with changes in
horticulture productivity registered
maximum impact during the pre-flowering
phenological stage with observed
statistical correlation in maximum
temperature, diurnal temperature and
rainfall parameters. i.e. for four fruit crops
– Apple (with maximum and diurnal
temperature, rainfall), Pear (with
maximum and diurnal temperature,
rainfall), Cherry (with minimum
temperature), and Almond (with maximum
temperature and rainfall) variations in
productivity exhibited statistically
significant correlation with changes in
considered climatic parameters of
temperature and rainfall during pre-
Status Report: Impact of Climate Change on Horticulture in Himachal Pradesh – District Kullu
8
flowering stage; while for flowering stage
and fruit setting stage fewer cases of
statistically significant correlation was
witnessed between fruit crops productivity
and climatic parameters. Rainy days
variations did not hold statistically
significant relationship with productivity
for any of the fruit crops.
Apple productivity showed
maximum sensitivity to climatic variations
during all three stages (31%, 19%, 21%)
with significant correlation observed for
Pear (35%, 9%, 10%), Almond (20%,
13%, 27%), Plum (19%, 18%, 1%),
Pomegranate (6%, 8%, 24%), Apricot
(3%, 14%, 29%), and Cherry (13%, 16%,
8%). With respect to individual crops, this
means that the observed stagnation/gradual
decline in productivity for Apple crop
from 1990-2016 is explained by the
variations in climatic parameters only to
the extent of 31 % during pre-flowering
stage, 19% during the flowering stage, and
21% during the fruit setting and
development stage. Similar interpretations
are valid for Pear, Almond, Plum,
Pomegranate, Apricot, and Cherry.
Meanwhile, the productivity of Walnut
was least influenced by the changes in
climatic parameters across all phenological
stages (2% at pre-flowering stage; 3% at
flowering; and 15% at the fruit setting and
development stage).
The farm-level perception-based
vulnerability assessment helped in
extracting other plausible intervening
factors responsible for variations in
cropping patterns. The in-depth interviews
with 210 farming households from the five
blocks in District Kullu indicated a nearly
three folds increase in total fruits acreage
during the last 30 year. These shifts were
driven by comparable influences from
changing climatic conditions, vermin
menace, financial outputs, and access to
better farm practices. Further, the
vulnerability index, created on perceptions
of farming HHs on exposure and
sensitivity to climate change net of their
adaptive capacities (human, natural,
financial, and physical), positioned District
Kullu on the lower spectrum of
vulnerability and risk.
The outcomes from this status
study will anchor a new resolve for
outlining overreaching policy interventions
to better equip the horticulture sector for
climate change adaptation. Further, it will
serve as a starting point to out-scale
study’s assessment framework and
outcomes for implementation in other
districts as well.

Status Report: Impact of Climate Change on Horticulture in Himachal Pradesh – District Kullu
9
CHAPTER 1 - INTRODUCTION
CLIMATE AND HORTICULTURE
Horticulture is a vibrant sister sector of Agriculture, distinguished by scale of production and
commercialisation, and assumes a pivotal role to foster food, economic, and nutritional
security, globally. India is the second largest contributor to world’s horticulture produce,
where it accounted for a record 307.16 MT of production in 2017-18 (IBEF, 2018).
Nonetheless, this high contributing sector has a wider exposure to climate change when
compared to its close associate Agriculture sector, but with a relatively smaller carbon
footprint. In India, 8.71 per cent of carbon emissions came from the Agriculture, Food, and
Land-use in 2013 (WRI, 2018); however, the carbon sequestration quotient from a mixture of
perennial horticulture crops such as tree fruits, tree nuts, vine fruits, and seasonal vegetables,
herbs offering carbon storage above the ground, net offs the sector’s carbon footprint.
Climate Change, defined as climate variability induced by direct or indirect
anthropogenic activities in addition to natural climate variations causing alterations in
composition of global atmosphere observed over comparable time periods has observed
manifestation in the horticulture sector through two parameters – erratic precipitation (rains
and snowfall), and uncertain spells of temperature rise that has unpredictable impact on fruit
crop productivity. Loss in vigour, fruit bearing ability, reduction in fruit size, and increase in
pest attack eventually result in low production and poor quality of temperate fruit crops such
as apple, peach, plum and more. Various exploratory studies have analysed the potential
impact of climate variability on horticulture productivity, especially in the context of
developing countries.
Crop production systems in South Asia and sub-Saharan Africa are observed to be at
the receiving end of undisputable climatic exposure. Located in lower altitudes, these
developing countries are already experiencing temperatures closer to or beyond the threshold
thereby any increase in mean temperatures is bound to negatively impact horticulture crop
productivity (Malhotra, 2017). Samedi and Cochran (1976) highlight the role of rising
temperature in limiting vegetative growth, and affecting fruit setting especially of citrus fruits
which is visible through burning or scorching of blossoms in higher plains, a phenomenon
generally seen in desert areas. Meanwhile, higher temperatures are also expected to alter
precipitation rates leading to changes in both frequency and intensity of droughts and floods.
Status Report: Impact of Climate Change on Horticulture in Himachal Pradesh – District Kullu
10
In South Asia, a median 11 per cent change in precipitation is expected by the end of 21st
century, with decrease in dry seasons and an increase throughout the year (IPCC, 2007). In
India, mean temperatures are likely to rise by 3-4 °C by the end of 21st century, as per IPCC
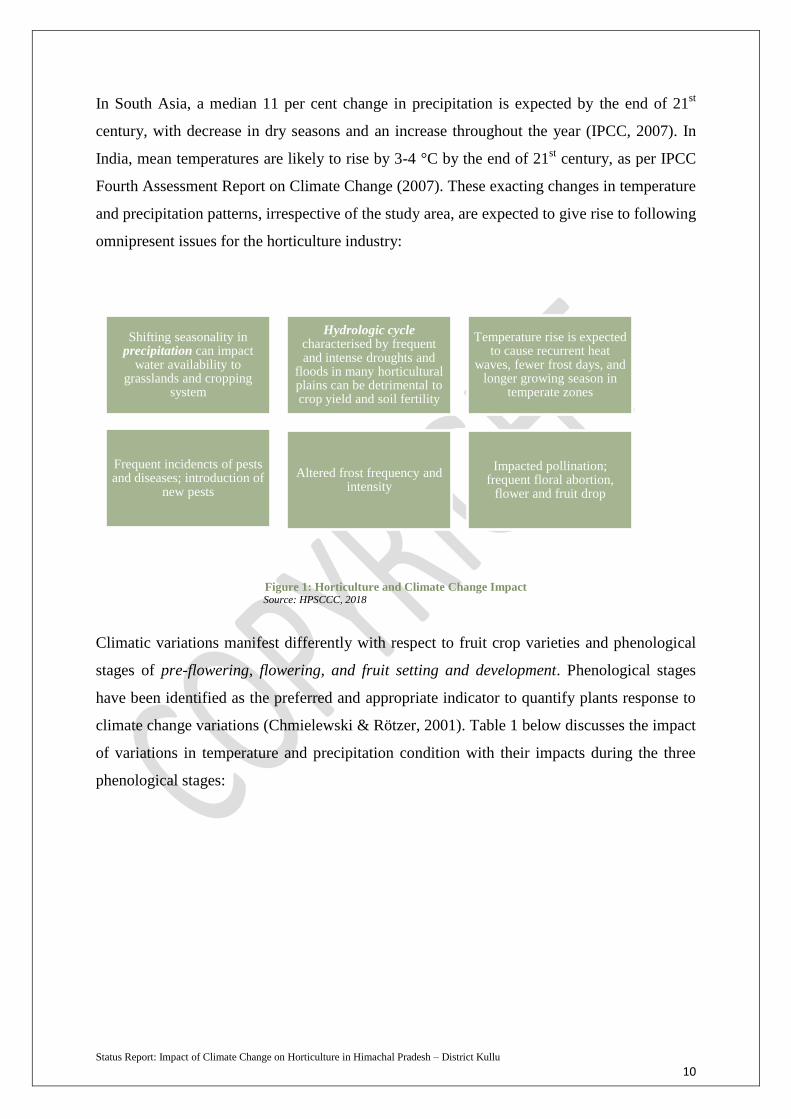
Fourth Assessment Report on Climate Change (2007). These exacting changes in temperature
and precipitation patterns, irrespective of the study area, are expected to give rise to following
omnipresent issues for the horticulture industry:
Figure 1: Horticulture and Climate Change Impact Source: HPSCCC, 2018
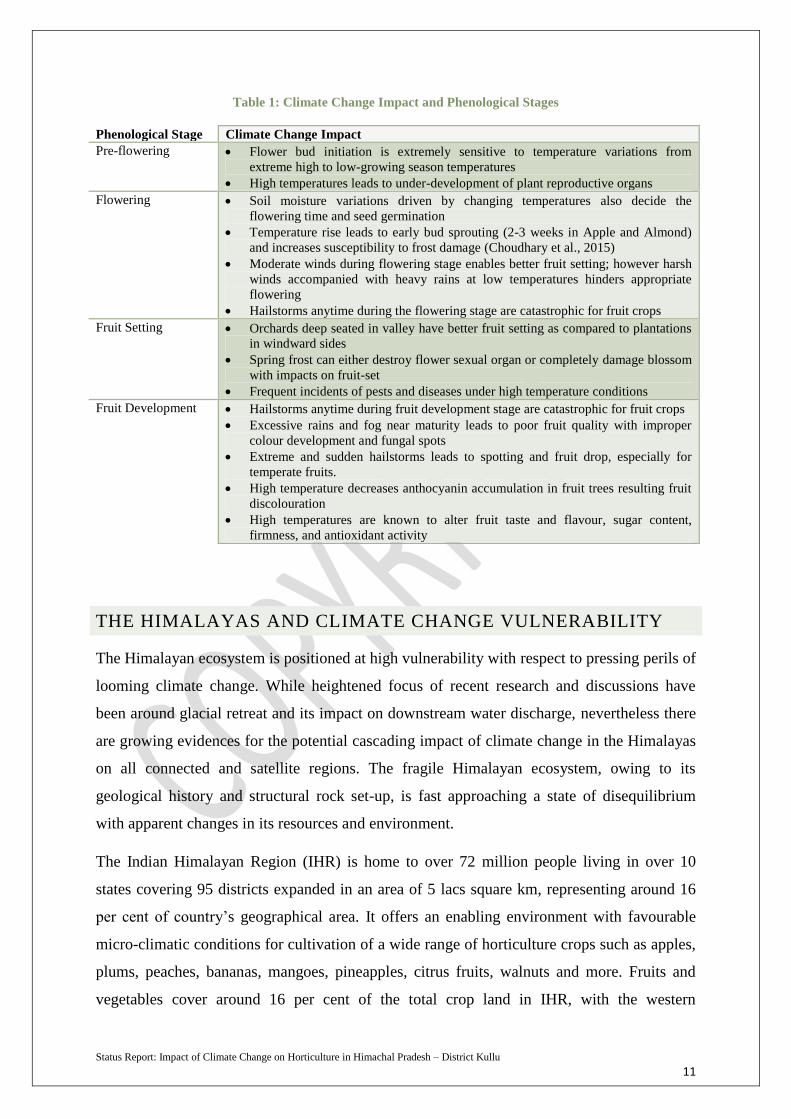
Climatic variations manifest differently with respect to fruit crop varieties and phenological
stages of pre-flowering, flowering, and fruit setting and development. Phenological stages
have been identified as the preferred and appropriate indicator to quantify plants response to
climate change variations (Chmielewski & Rötzer, 2001). Table 1 below discusses the impact
of variations in temperature and precipitation condition with their impacts during the three
phenological stages:
Shifting seasonality in precipitation can impact
water availability to grasslands and cropping
system
Hydrologic cycle characterised by frequent and intense droughts and
floods in many horticultural plains can be detrimental to crop yield and soil fertility
Temperature rise is expected to cause recurrent heat
waves, fewer frost days, and longer growing season in
temperate zones
Frequent incidencts of pests and diseases; introduction of
new pests
Altered frost frequency and intensity
Impacted pollination; frequent floral abortion,
flower and fruit drop
Status Report: Impact of Climate Change on Horticulture in Himachal Pradesh – District Kullu
11
Table 1: Climate Change Impact and Phenological Stages
Phenological Stage Climate Change Impact
Pre-flowering Flower bud initiation is extremely sensitive to temperature variations from
extreme high to low-growing season temperatures
High temperatures leads to under-development of plant reproductive organs
Flowering Soil moisture variations driven by changing temperatures also decide the
flowering time and seed germination
Temperature rise leads to early bud sprouting (2-3 weeks in Apple and Almond)
and increases susceptibility to frost damage (Choudhary et al., 2015)
Moderate winds during flowering stage enables better fruit setting; however harsh
winds accompanied with heavy rains at low temperatures hinders appropriate
flowering
Hailstorms anytime during the flowering stage are catastrophic for fruit crops
Fruit Setting Orchards deep seated in valley have better fruit setting as compared to plantations
in windward sides
Spring frost can either destroy flower sexual organ or completely damage blossom
with impacts on fruit-set
Frequent incidents of pests and diseases under high temperature conditions
Fruit Development Hailstorms anytime during fruit development stage are catastrophic for fruit crops
Excessive rains and fog near maturity leads to poor fruit quality with improper
colour development and fungal spots
Extreme and sudden hailstorms leads to spotting and fruit drop, especially for
temperate fruits.
High temperature decreases anthocyanin accumulation in fruit trees resulting fruit
discolouration
High temperatures are known to alter fruit taste and flavour, sugar content,
firmness, and antioxidant activity
THE HIMALAYAS AND CLIMATE CHANGE VULNERABILITY
The Himalayan ecosystem is positioned at high vulnerability with respect to pressing perils of
looming climate change. While heightened focus of recent research and discussions have
been around glacial retreat and its impact on downstream water discharge, nevertheless there
are growing evidences for the potential cascading impact of climate change in the Himalayas
on all connected and satellite regions. The fragile Himalayan ecosystem, owing to its
geological history and structural rock set-up, is fast approaching a state of disequilibrium
with apparent changes in its resources and environment.
The Indian Himalayan Region (IHR) is home to over 72 million people living in over 10
states covering 95 districts expanded in an area of 5 lacs square km, representing around 16
per cent of country’s geographical area. It offers an enabling environment with favourable
micro-climatic conditions for cultivation of a wide range of horticulture crops such as apples,
plums, peaches, bananas, mangoes, pineapples, citrus fruits, walnuts and more. Fruits and
vegetables cover around 16 per cent of the total crop land in IHR, with the western
Status Report: Impact of Climate Change on Horticulture in Himachal Pradesh – District Kullu
12
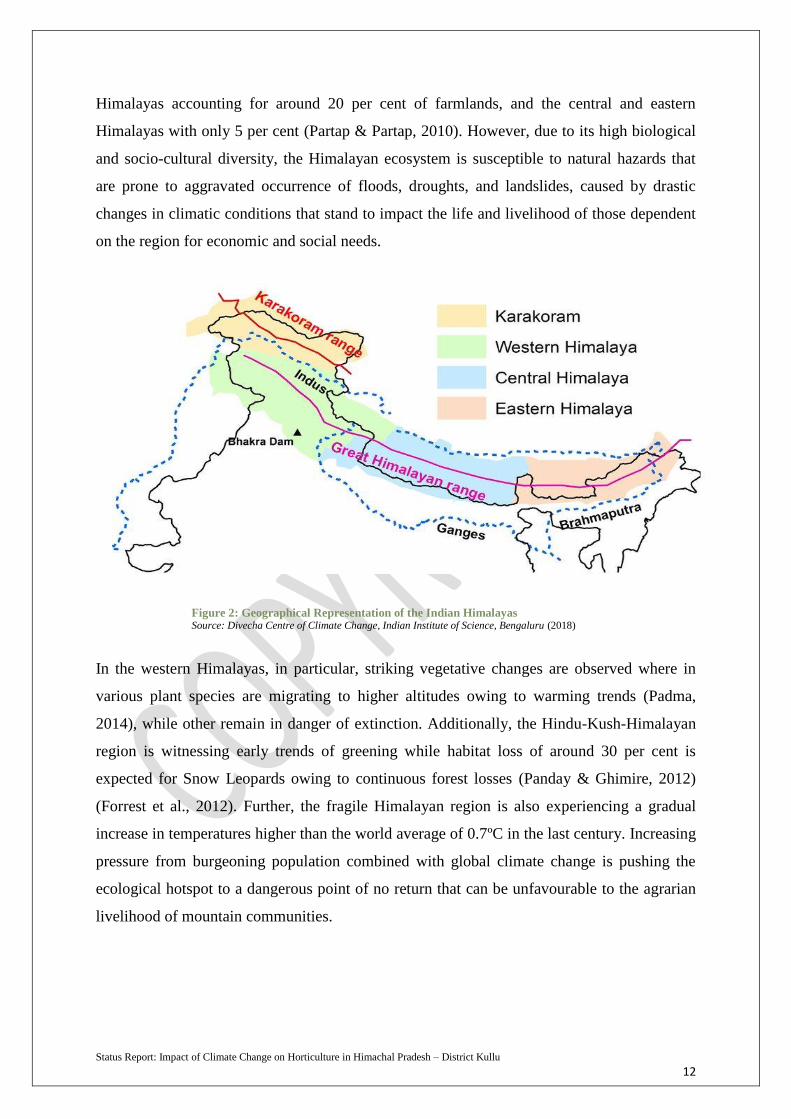
Himalayas accounting for around 20 per cent of farmlands, and the central and eastern
Himalayas with only 5 per cent (Partap & Partap, 2010). However, due to its high biological
and socio-cultural diversity, the Himalayan ecosystem is susceptible to natural hazards that
are prone to aggravated occurrence of floods, droughts, and landslides, caused by drastic
changes in climatic conditions that stand to impact the life and livelihood of those dependent
on the region for economic and social needs.
Figure 2: Geographical Representation of the Indian Himalayas Source: Divecha Centre of Climate Change, Indian Institute of Science, Bengaluru (2018)
In the western Himalayas, in particular, striking vegetative changes are observed where in
various plant species are migrating to higher altitudes owing to warming trends (Padma,
2014), while other remain in danger of extinction. Additionally, the Hindu-Kush-Himalayan
region is witnessing early trends of greening while habitat loss of around 30 per cent is
expected for Snow Leopards owing to continuous forest losses (Panday & Ghimire, 2012)
(Forrest et al., 2012). Further, the fragile Himalayan region is also experiencing a gradual
increase in temperatures higher than the world average of 0.7ºC in the last century. Increasing
pressure from burgeoning population combined with global climate change is pushing the
ecological hotspot to a dangerous point of no return that can be unfavourable to the agrarian
livelihood of mountain communities.
Status Report: Impact of Climate Change on Horticulture in Himachal Pradesh – District Kullu
13
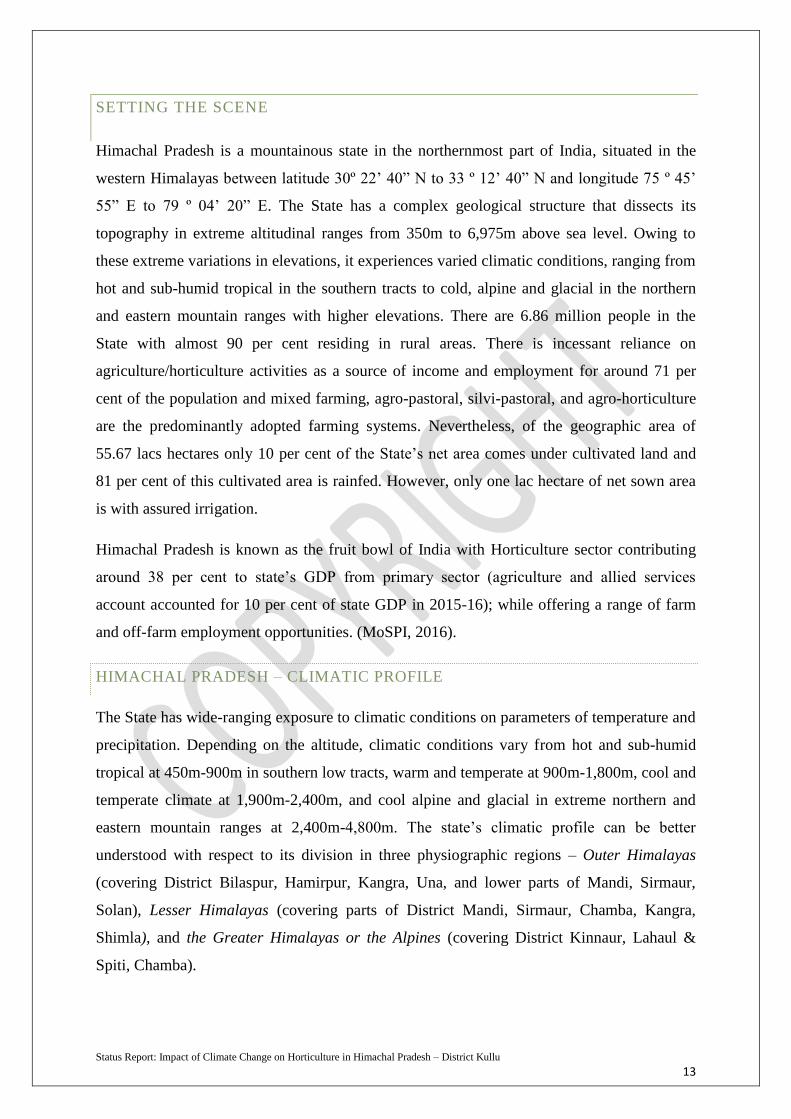
SETTING THE SCENE
Himachal Pradesh is a mountainous state in the northernmost part of India, situated in the
western Himalayas between latitude 30º 22’ 40” N to 33 º 12’ 40” N and longitude 75 º 45’
55” E to 79 º 04’ 20” E. The State has a complex geological structure that dissects its
topography in extreme altitudinal ranges from 350m to 6,975m above sea level. Owing to
these extreme variations in elevations, it experiences varied climatic conditions, ranging from
hot and sub-humid tropical in the southern tracts to cold, alpine and glacial in the northern
and eastern mountain ranges with higher elevations. There are 6.86 million people in the
State with almost 90 per cent residing in rural areas. There is incessant reliance on
agriculture/horticulture activities as a source of income and employment for around 71 per
cent of the population and mixed farming, agro-pastoral, silvi-pastoral, and agro-horticulture
are the predominantly adopted farming systems. Nevertheless, of the geographic area of
55.67 lacs hectares only 10 per cent of the State’s net area comes under cultivated land and
81 per cent of this cultivated area is rainfed. However, only one lac hectare of net sown area
is with assured irrigation.
Himachal Pradesh is known as the fruit bowl of India with Horticulture sector contributing
around 38 per cent to state’s GDP from primary sector (agriculture and allied services
account accounted for 10 per cent of state GDP in 2015-16); while offering a range of farm
and off-farm employment opportunities. (MoSPI, 2016).
HIMACHAL PRADESH – CLIMATIC PROFILE
The State has wide-ranging exposure to climatic conditions on parameters of temperature and
precipitation. Depending on the altitude, climatic conditions vary from hot and sub-humid
tropical at 450m-900m in southern low tracts, warm and temperate at 900m-1,800m, cool and
temperate climate at 1,900m-2,400m, and cool alpine and glacial in extreme northern and
eastern mountain ranges at 2,400m-4,800m. The state’s climatic profile can be better
understood with respect to its division in three physiographic regions – Outer Himalayas
(covering District Bilaspur, Hamirpur, Kangra, Una, and lower parts of Mandi, Sirmaur,
Solan), Lesser Himalayas (covering parts of District Mandi, Sirmaur, Chamba, Kangra,
Shimla), and the Greater Himalayas or the Alpines (covering District Kinnaur, Lahaul &
Spiti, Chamba).

Status Report: Impact of Climate Change on Horticulture in Himachal Pradesh – District Kullu
14
Climate change does not have even and uniform impact on any region and with these
topographical and varied climate classifications in Himachal Pradesh, the vulnerability and
risk quotient becomes significant and tends to vary from one region to another. There is
substantial literature and research to support the expected varied impact of climate change in
Himachal Pradesh. Based on the findings of short-term analysis at different altitudes,
Bhutiyani et al. (2007) observed a significantly higher temperature variation in the north
western Himalayan region when compared to the global average in the last century, and
concluded that rate of increase in maximum temperature changes is directly linked to the
changes in altitudes. Bhan and Manmohan (2011) predicted a shortening of seasons by 10-12
days per decade based on assessment of precipitation data for 20 years. Kumar et al. (2009)
and Shrestha et al. (2012) reported an average increase of 1.52°C in annual minimum
temperature (Kullu Valley, 1962-2004), and 1.5 °C in annual mean temperature (25 years) in
the State respectively. With reference to precipitation, Himachal Pradesh is witnessing a
period of uncertain and untimely rainfalls and snowfalls, which is likely to impact water
availability and replenishment of snow fed gravity channels (kuhls), thus affecting irrigation
support to agriculture and horticulture sector. As per the estimates from Himachal Pradesh
State Action Plan on Climate Change (2012), a 40 per cent reduction in rainfall has been
observed in last 25 years. In nutshell, annual temperatures are expected to rise for all seasons
with significant decline in snowfall in mid-hills temperate wet agro-ecological zones. The
frequency of rains is expected to increase but with diminished average intensity creating
drought conditions in some pockets and accelerated summer flows in the north-western part
of the State.
Status Report: Impact of Climate Change on Horticulture in Himachal Pradesh – District Kullu
15
STATE’S AGRO-ECOLOGICAL PROFILE
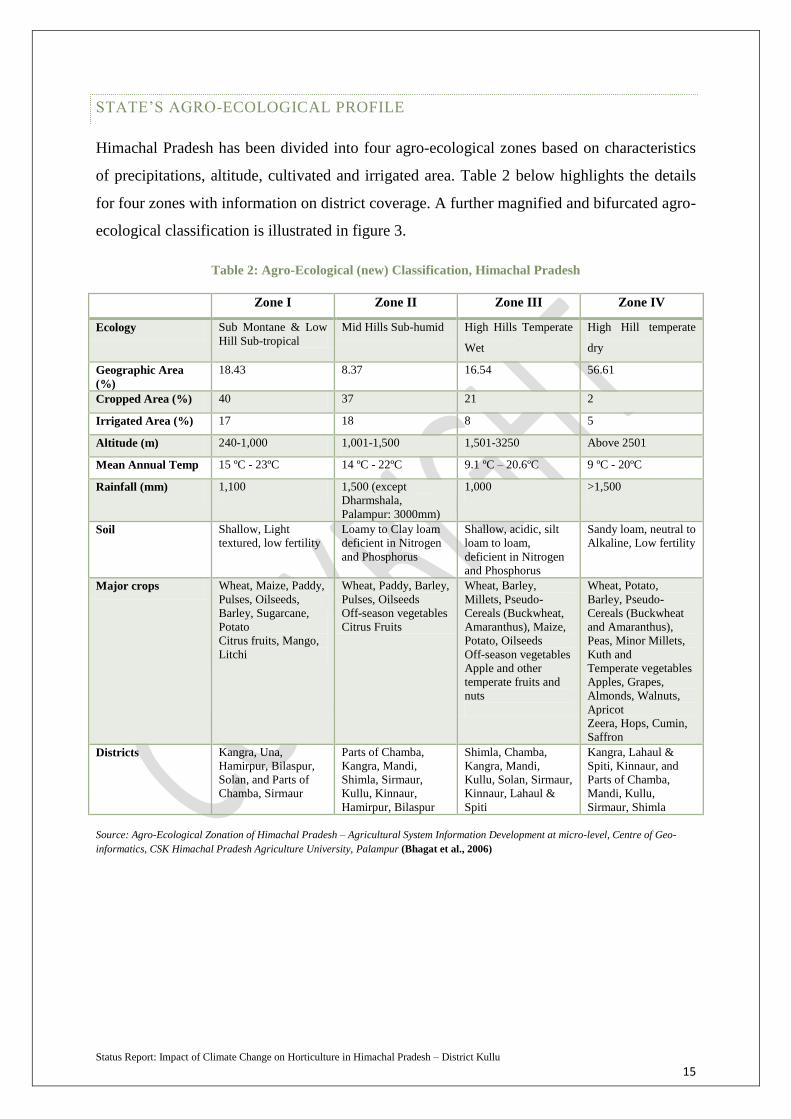
Himachal Pradesh has been divided into four agro-ecological zones based on characteristics
of precipitations, altitude, cultivated and irrigated area. Table 2 below highlights the details
for four zones with information on district coverage. A further magnified and bifurcated agro-
ecological classification is illustrated in figure 3.
Table 2: Agro-Ecological (new) Classification, Himachal Pradesh
Zone I Zone II Zone III Zone IV
Ecology Sub Montane & Low
Hill Sub-tropical
Mid Hills Sub-humid High Hills Temperate
Wet
High Hill temperate
dry
Geographic Area
(%)
18.43 8.37 16.54 56.61
Cropped Area (%) 40 37 21 2
Irrigated Area (%) 17 18 8 5
Altitude (m) 240-1,000 1,001-1,500 1,501-3250 Above 2501
Mean Annual Temp 15 ºC - 23ºC 14 ºC - 22ºC 9.1 ºC – 20.6ºC 9 ºC - 20ºC
Rainfall (mm) 1,100 1,500 (except
Dharmshala,
Palampur: 3000mm)
1,000 >1,500
Soil Shallow, Light
textured, low fertility
Loamy to Clay loam
deficient in Nitrogen
and Phosphorus
Shallow, acidic, silt
loam to loam,
deficient in Nitrogen
and Phosphorus
Sandy loam, neutral to
Alkaline, Low fertility
Major crops Wheat, Maize, Paddy,
Pulses, Oilseeds,
Barley, Sugarcane,
Potato
Citrus fruits, Mango,
Litchi
Wheat, Paddy, Barley,
Pulses, Oilseeds
Off-season vegetables
Citrus Fruits
Wheat, Barley,
Millets, Pseudo-
Cereals (Buckwheat,
Amaranthus), Maize,
Potato, Oilseeds
Off-season vegetables
Apple and other
temperate fruits and
nuts
Wheat, Potato,
Barley, Pseudo-
Cereals (Buckwheat
and Amaranthus),
Peas, Minor Millets,
Kuth and
Temperate vegetables
Apples, Grapes,
Almonds, Walnuts,
Apricot
Zeera, Hops, Cumin,
Saffron
Districts Kangra, Una,
Hamirpur, Bilaspur,
Solan, and Parts of
Chamba, Sirmaur
Parts of Chamba,
Kangra, Mandi,
Shimla, Sirmaur,
Kullu, Kinnaur,
Hamirpur, Bilaspur
Shimla, Chamba,
Kangra, Mandi,
Kullu, Solan, Sirmaur,
Kinnaur, Lahaul &
Spiti
Kangra, Lahaul &
Spiti, Kinnaur, and
Parts of Chamba,
Mandi, Kullu,
Sirmaur, Shimla
Source: Agro-Ecological Zonation of Himachal Pradesh – Agricultural System Information Development at micro-level, Centre of Geo-
informatics, CSK Himachal Pradesh Agriculture University, Palampur (Bhagat et al., 2006)
Status Report: Impact of Climate Change on Horticulture in Himachal Pradesh – District Kullu
16
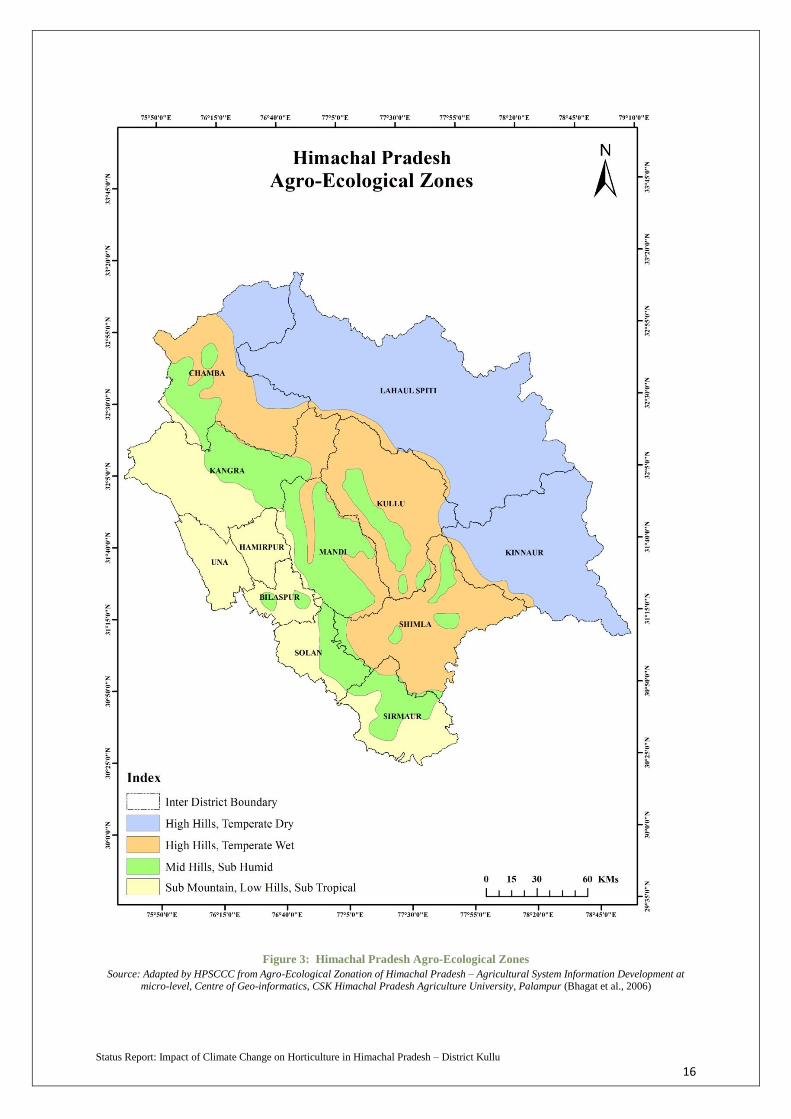
Figure 3: Himachal Pradesh Agro-Ecological Zones Source: Adapted by HPSCCC from Agro-Ecological Zonation of Himachal Pradesh – Agricultural System Information Development at
micro-level, Centre of Geo-informatics, CSK Himachal Pradesh Agriculture University, Palampur (Bhagat et al., 2006)

Status Report: Impact of Climate Change on Horticulture in Himachal Pradesh – District Kullu
17
As noticeable from above, a majority of horticulture exposure is spread across Zone
III and IV in the State which has significant share of land under apple and other temperate
fruits cultivation. Nevertheless, each zone and each district is characterised with different
soil, climatic, and precipitations pattern. Human managed ecosystems such as food
production and livelihood sustenance are found to be highly vulnerable to climate change in
Asia. Jindal et al (2001) while assessing the five-year fruit production and meteorological
data highlighted the instrumental role of abnormal climatic factors during the flowering and
fruit development stages causing reduction in apple productivity. The said study also
underscored the presence of other factors such as monoculture of Delicious varieties,
compromised standards of orchard management, amongst others being detrimental to fruit
crop productivity. Meanwhile, Crepinsek and Bogataj (2004) discussed the impact of rising
temperatures (per degree) on faster occurrence of leaf and fruit ripening by 2 days in apple
and plum crops. Interestingly, there have been a few perception based assessments that have
concluded the perceived role of climate change in altering the blossoming, bearing, and
productivity of apple crop. Vedwan and Rhoades (2001) reported a remarked shift of apple
belt in Kullu valley along with a significant gap in flowering periods of male and female
trees. Nevertheless, the growing share of literature is essentially focused on an assessment of
historic and current weather parameter such as precipitations and temperature vis-à-vis
horticulture productivity with limited and under-theorised discourse on farmers’ perceptions
on their exposure, sensitivity, and adaptive capacity to climate change in tandem with
observed changes in climatic parameters.
To bridge this gap, a status study was conducted with a view to ascertain the impact
of climate change on horticultural sector in the state with a pilot study in District Kullu - one
of the 12 districts nestled in the Pir Panjal range of the western Himalayas. Seasonal trends
on climatic variables of minimum, maximum, and diurnal temperatures, and rainfall patterns
were conjugated with a standardised anomaly index and a multivariate regression analysis
was conducted to establish the climate and crop yield relationship during the phenological
stages of pre-flowering, flowering, and fruit setting and development. Further, the study
employed evidence from the household surveys conducted in five blocks (Kullu, Naggar,
Anni, Banjar, and Nirmand) in District Kullu to qualify the perceived validity of outcomes of
multivariate linear regression analysis. Essentially, the later part of the study focused on
assessing the vulnerability of target population owing to their exposure and sensitivity to
current and historic climate risks.
Status Report: Impact of Climate Change on Horticulture in Himachal Pradesh – District Kullu
18
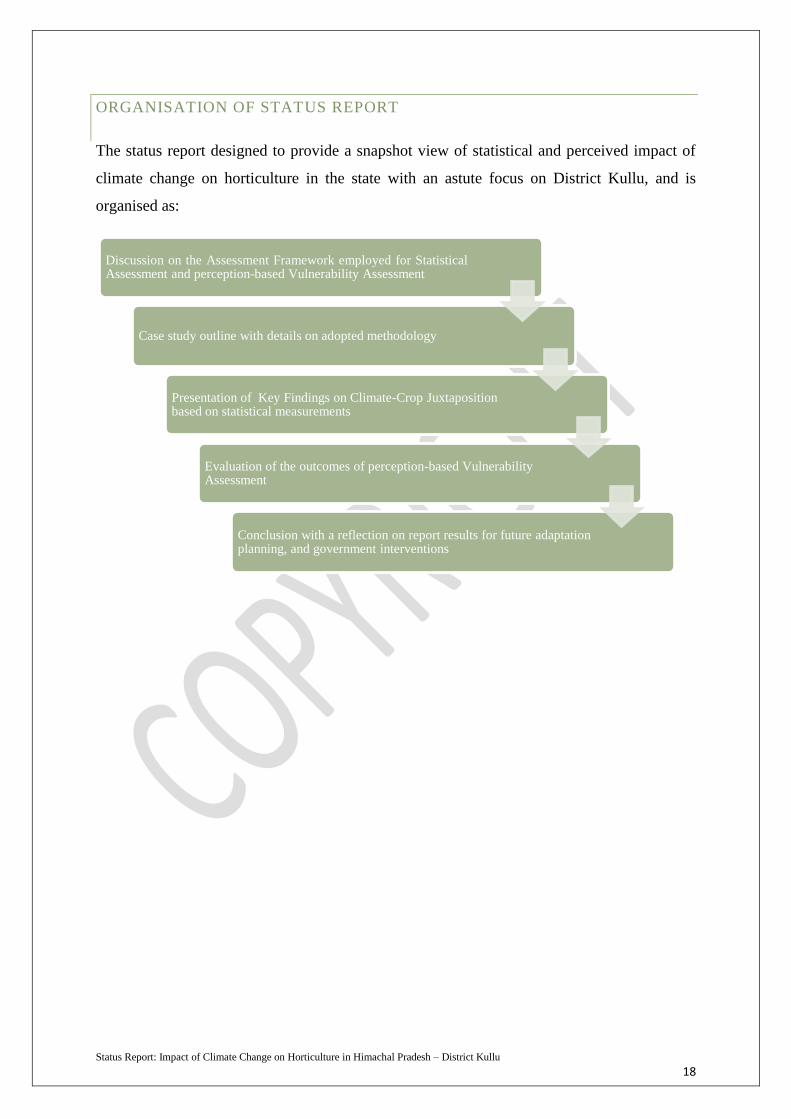
ORGANISATION OF STATUS REPORT
The status report designed to provide a snapshot view of statistical and perceived impact of
climate change on horticulture in the state with an astute focus on District Kullu, and is
organised as:
Discussion on the Assessment Framework employed for Statistical Assessment and perception-based Vulnerability Assessment
Case study outline with details on adopted methodology
Presentation of Key Findings on Climate-Crop Juxtaposition based on statistical measurements
Evaluation of the outcomes of perception-based Vulnerability Assessment
Conclusion with a reflection on report results for future adaptation planning, and government interventions
Status Report: Impact of Climate Change on Horticulture in Himachal Pradesh – District Kullu
19
CHAPTER 2 – ASSESSMENT FRAMEWORK
Since the study aims to assess two different discourses on climate change vulnerability of the
horticulture sector, it is imperative to elucidate assessment frameworks adopted for each
objective.
CLIMATE TREND ASSESSMENT
To better understand the impact of climate change variable of temperature and precipitation
(rainfall) vis-à-vis parameters of horticulture productivity, the following statistical measures
were employed.
TREND ANALYSIS
Seasonal trends on climatic variables such as minimum, maximum, and diurnal temperatures,
and rainfall (quantity and days) were conducted using the Mann Kendall Test – a widely
accepted statistical test for analysis of trend in climatologic and hydrologic time series
(Pohlert, 2018). This statistical test comes with two-fold advantages – first, being a non-
parametric test it does not require the master data to be normally distributed. Second, the test
shows low sensitivity to abrupt data breaks and inhomogeneous time series. Therefore, data
gaps are plugged by assigning a common value smaller than the smallest measure value in the
master data set. The Mann Kendall Test works on the basic null hypothesis Ho of no trend i.e.
data is independent with a random order that is tested against the alternative hypothesis H1.
The test follows a time series of n data points with Ti and Tj as two subsets of data where i =
1,2,3,…, n-1 and j = i+1, i+2, i+3, …, n.
In the ordered time series, each data point is compared with the subsequent data point,
and in case the subsequent data point is of higher value, the statistic S is incremented by 1, for
a lower value of subsequent data point, S gets decremented by 1. The net results of all
iterations give the final value of S i.e. Mann Kendall S statistic
Status Report: Impact of Climate Change on Horticulture in Himachal Pradesh – District Kullu
20
Where Tj and Ti are the annual values in years j and i, j > i, respectively
A positive (negative) value of S indicates an upward (downward) trend.
Magnitude of the trend is determined by Sen’s Slope, which essentially computes the
linear rate of change and intercept. First, a set of linear slopes is ascertained, and then the
Sen’s Slope is calculated as the median from all linear slopes that gives the magnitude of the
observed seasonal trend. Another statistics linked to the Mann Kendall test is the p-value.
Smaller the p-value (smaller than 0.05), greater is the weight of evidence against the null
hypothesis of no trend.
For this study, the statistical Mann Kendall test is carried on software XLSTAT2017.
The null hypothesis is tested at 95% confidence level for minimum, maximum, and diurnal
temperate, and rainfall (quantity and days) for the time period 1990-2016. Further, annual
trends were conducted for productivity of apple, pear, plum, peach, apricot, cherry,
pomegranate, walnut, and almond crops
STANDARDIZED ANOMALY INDEX (SAI)
SAI is a commonly used index used for regional climate change studies that can be premeditated
by subtracting the long term mean value of temperature and rainfall data set from individual
value and dividing by their standard deviation (Koudahe et al., 2017). In this manner
standardized temperature indices for mean minimum, maximum and diurnal temperature of
horticulture (for three phonological stages) were computed for the study area. Similarly, the
standardized precipitation indices were also calculated for the pre-flowering (November-
February), flowering (March-April), and fruit-setting and development stages (May- August).
MULTIVARIATE LINEAR REGRESSION MODEL
To ascertain the climate-crop yield relationship, linear multivariate regression statistical
measure is selected. In multivariate linear regression model, a dependent variable is guided
by multiple independent variables and hence, multiple coefficients are determined. Key to a

Status Report: Impact of Climate Change on Horticulture in Himachal Pradesh – District Kullu
21
successful outcome is associated with a careful selection of independent variables for which a
correlation matrix is created. In this study, Pearson’s correlation coefficient was used to
measure the strength of association between climatic variables and crop productivity. For
interpretation purposes, a correlation coefficient of -1 indicates perfectly negative linear
relation; a correlation of 0 indicates no linear relationship between the two variables (but
possibly a non-linear relationship); and, a correlation coefficient of 1 shows a perfectly
positive linear relation. The value of correlation coefficient can never be less than -1 or more
than 1.
Here, the regression analysis helped to confirm the contribution of anomalies in
studied climatic parameters on crop productivity, which can be explained by following linear
model:
∆P= constant + (α x ∆Tmin) + (β x ∆Tmax) + (γ x ∆Tdt) + (δ x ∆R) + (ε x ∆Rd)
Where, ∆P is the observed change in the productivity due to minimum, maximum,
diurnal temperature, and rainfall in the respective phenological stages of the fruit crops.
Coefficients α, β, γ, and δ are the coefficients of minimum, maximum, diurnal temperature
and rainfall, respectively. ∆Tmin, ∆Tmax, Tdt, ∆R, and ∆Rd are the observed changes in
minimum, maximum, diurnal temperature, rainfall and rainy days respectively for the
cropping seasons during the study period.
PERCEPTION-BASED VULNERABILITY ASSESSMENT
WHAT IS VULNERABILITY?
Vulnerability as a concept is a non-observable and non-measurable extent to which a system
is likely to be affected on exposure to a hazard or risk. IPCC identifies vulnerability as a
predisposition of an ecosystem or a socio-economic system to be adversely affected in face of
a stressor. While there are numerous definitions and views on defining vulnerability (Hinkel,
2011), it is conceptualized as an intrinsic property with manifestation in existence of adaptive
capacity and sensitivity of a system vis-à-vis its exposure to a hazard or a stressor.
Nevertheless, four consistent themes are observed across a range of literature aimed at
defining vulnerability, which are:

Status Report: Impact of Climate Change on Horticulture in Himachal Pradesh – District Kullu
22
It is a spatial concept and contextual to inherent characteristic of the effected
community and/or region
Being a theoretical construct, vulnerability is deductively assessed and its
quantification through a single metric remains a challenge.
Vulnerability is dynamic and changes in accordance with developments in socio-
economic factors of the affected and changes in climatic and physical conditions.
Finally, and exposure to external stressor doesn’t always lead to vulnerability
IPCC identifies vulnerability as a function of presence/absence of (adaptive) capacity to
respond positively or negatively (sensitivity) in face of an exposure to external stress or
hazard. Over the years the discourse on vulnerability has undergone significant changes.
IPCC Fourth Assessment Report (2007) synthesised vulnerability as a resultant of exposure,
sensitivity, and adaptive capacity. Meanwhile, IPCC Fifth Assessment Report (2014)
prescribed ‘vulnerability independent of physical events’ concept where vulnerability is taken
as a system property with sensitivity and adaptive capacity as the only cofactors, and
exposure is considered as an external agent.
WHY ASSESS VULNERABILITY?
Vulnerability Assessment has been central to IPCC endorsed approach to effective climate
change adaptation planning. Over the years the discourse on vulnerability definition and
assessment has undergone significant changes with shifting views on its intrinsic and
extrinsic determinants, as discussed above.
While vulnerability is defined by the predisposition of a system to external stresses, it
is the preparedness of the system that actually determines the aftermath situation in case of an
interaction with a hazard or risk. This need for awareness and preparedness is what sets the
premise for vulnerability assessment. The rationale for the need to conduct a vulnerability
assessment is discussed below:

Status Report: Impact of Climate Change on Horticulture in Himachal Pradesh – District Kullu
23
Quantification of vulnerability through a single metric is neither straightforward nor
recommended as it may diminish the inherent complexity and multi-dimensionality
associated with each cofactor and vulnerability assessment (Alwang et al., 2001). Hence,
Vulnerability Index is considered as a proxy indicator to streamline discussion on
vulnerability assessment in terms of a single meter.
This study employed the vulnerability framework prescribed in IPCC 2007 Working Group II
Assessment Report as opposed to the IPCC 2014 framework, for the following reasons:
- IPCC 2014 framework provides an assessment of the overall exposure-independent
vulnerability of a system (intrinsic to a system) i.e. with or without climate change in
the future, whereas the older framework considers both current vulnerability and
vulnerability under climate change scenario. Since, this study’s key objective to
juxtapose vulnerability assessment with the statistically observed changes in the
climatic parameters of temperature and precipitation, the IPCC 2007 framework was
selected.
- Secondly, IPCC 2007 framework is considered to be a quick method to identify
current drivers of vulnerability without extensive data requirements on socio-
economic, bio-physical, and institutional indicators as prescribed under IPCC 2014
VA framework. Since, our study’s inherent limitation is availability of latest data
across all variables, the said method was deemed appropriate by authors.
Preparedenss
- to deal with unaticipated events
- to identify vulnerable communities, areas and mitigation targets
- to raise awareness on exposure to hazards and risks
Prioritisation
- of adaptation initiatives
- of fund allocations and utilisation at all levels
- of mitigation targets and research
Planning
- of adaptation policies for development programmes and projects
- for monitoring of adptation policies
- vulnerability profile development
Proposals
- for adaptation to interntional funding from global, bilateral agencies etc.
- to update existing action plans and frameworks
VA Rationale
Status Report: Impact of Climate Change on Horticulture in Himachal Pradesh – District Kullu
24
- Finally, IPCC 2014 framework poses a risk of mal-adaptation i.e. adaptation measures
taken solely on basis of risk assessment, which are avoided in the IPCC 2007
framework as proposed interventions will be specific and directed to strengthen
vulnerable aspects and areas.
Therefore, to corroborate and substantiate the outcomes of climate trend assessment on
historic and current data, a Perception-based Vulnerability Assessment was conducted in
District Kullu of Himachal Pradesh.
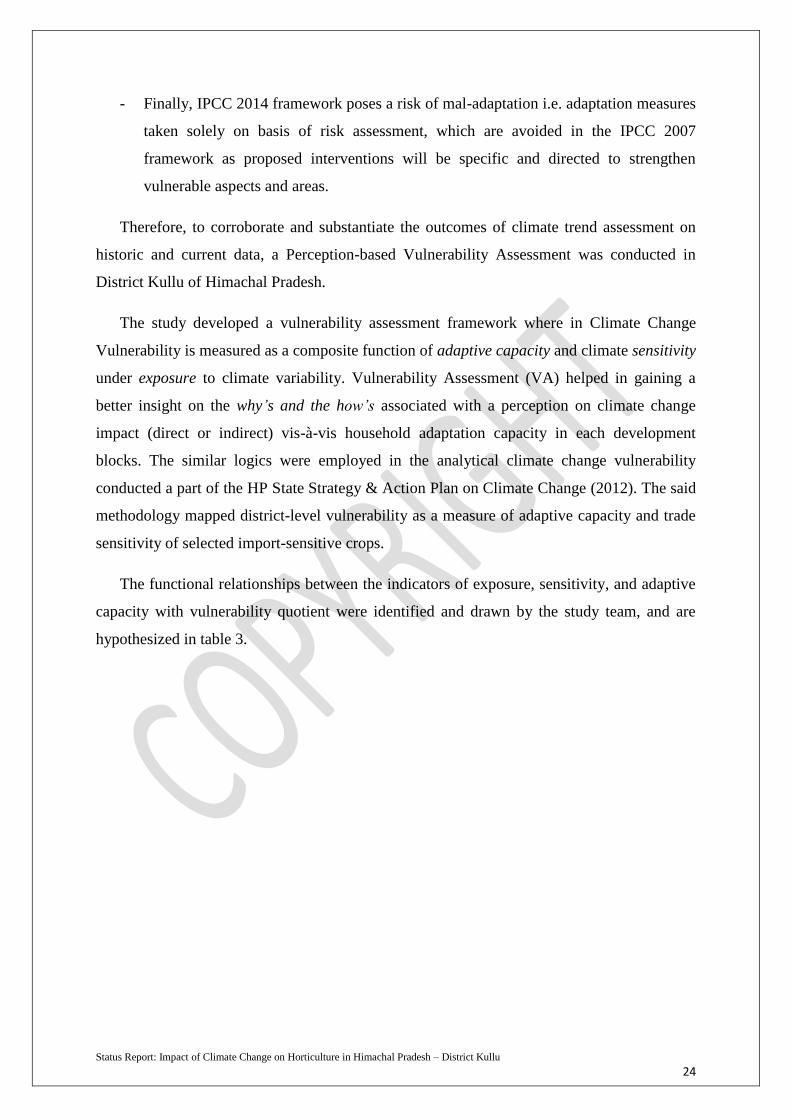
The study developed a vulnerability assessment framework where in Climate Change
Vulnerability is measured as a composite function of adaptive capacity and climate sensitivity
under exposure to climate variability. Vulnerability Assessment (VA) helped in gaining a
better insight on the why’s and the how’s associated with a perception on climate change
impact (direct or indirect) vis-à-vis household adaptation capacity in each development
blocks. The similar logics were employed in the analytical climate change vulnerability
conducted a part of the HP State Strategy & Action Plan on Climate Change (2012). The said
methodology mapped district-level vulnerability as a measure of adaptive capacity and trade
sensitivity of selected import-sensitive crops.
The functional relationships between the indicators of exposure, sensitivity, and adaptive
capacity with vulnerability quotient were identified and drawn by the study team, and are
hypothesized in table 3.

Status Report: Impact of Climate Change on Horticulture in Himachal Pradesh – District Kullu
25
Source: HPSCCC, 2018
Vulnerability is defined as a function of character, magnitude, and rate of variation
in a system, climatic exposure, its sensitivity, and adaptive capacity
Exposure: These are extrinsic factors that stimulate a direct or indirect impact and
are represented by character, magnitude, and rate of change in the system
Sensitivity: Refers to the degree to which a system is affected by internal or
external disturbances. These are the innate characteristics of a system that can be
represented by changes in temperature, rainfall, floods, fires and more. For this
study, sensitivity was indicated by impacts of climate change and extreme events on
agriculture land, irrigation sources, diseases and pest incidences for different
agricultural crops.
Adaptive Capacity: Reflects the system’s ability to modify its characteristics or
behaviour to better manage its response to existing and/or anticipated external
stresses (Brooks, 2003). Appropriate adaptive capacity is essential to ensure
effective design and implementation of adaptation strategies for reduction in the
likelihood and magnitude of environmental impact. For the study, adaptive capacity
of farming household is considered on four livelihoods related assets- physical,
human, natural, and financial.
Status Report: Impact of Climate Change on Horticulture in Himachal Pradesh – District Kullu
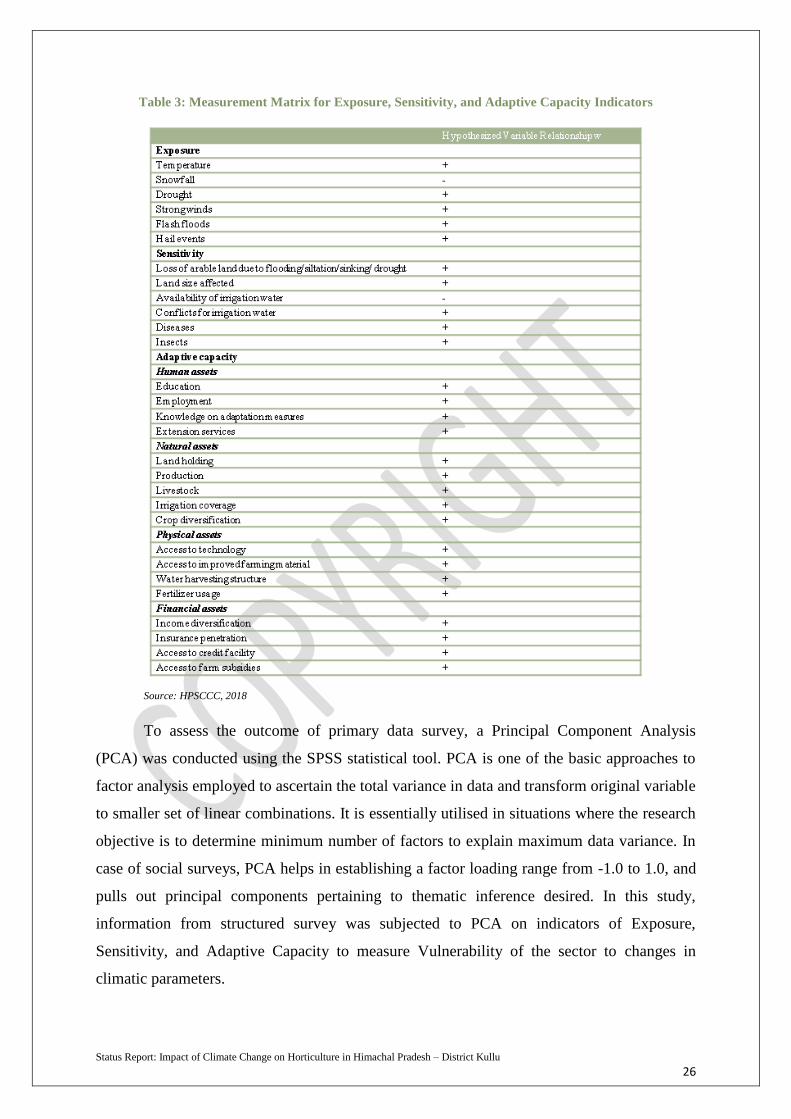
26
Table 3: Measurement Matrix for Exposure, Sensitivity, and Adaptive Capacity Indicators
Source: HPSCCC, 2018
To assess the outcome of primary data survey, a Principal Component Analysis
(PCA) was conducted using the SPSS statistical tool. PCA is one of the basic approaches to
factor analysis employed to ascertain the total variance in data and transform original variable
to smaller set of linear combinations. It is essentially utilised in situations where the research
objective is to determine minimum number of factors to explain maximum data variance. In
case of social surveys, PCA helps in establishing a factor loading range from -1.0 to 1.0, and
pulls out principal components pertaining to thematic inference desired. In this study,
information from structured survey was subjected to PCA on indicators of Exposure,
Sensitivity, and Adaptive Capacity to measure Vulnerability of the sector to changes in
climatic parameters.
Status Report: Impact of Climate Change on Horticulture in Himachal Pradesh – District Kullu
27
CHAPTER 3 - PILOT CASE AND METHODS
DISTRICT KULLU – A BACKGROUND
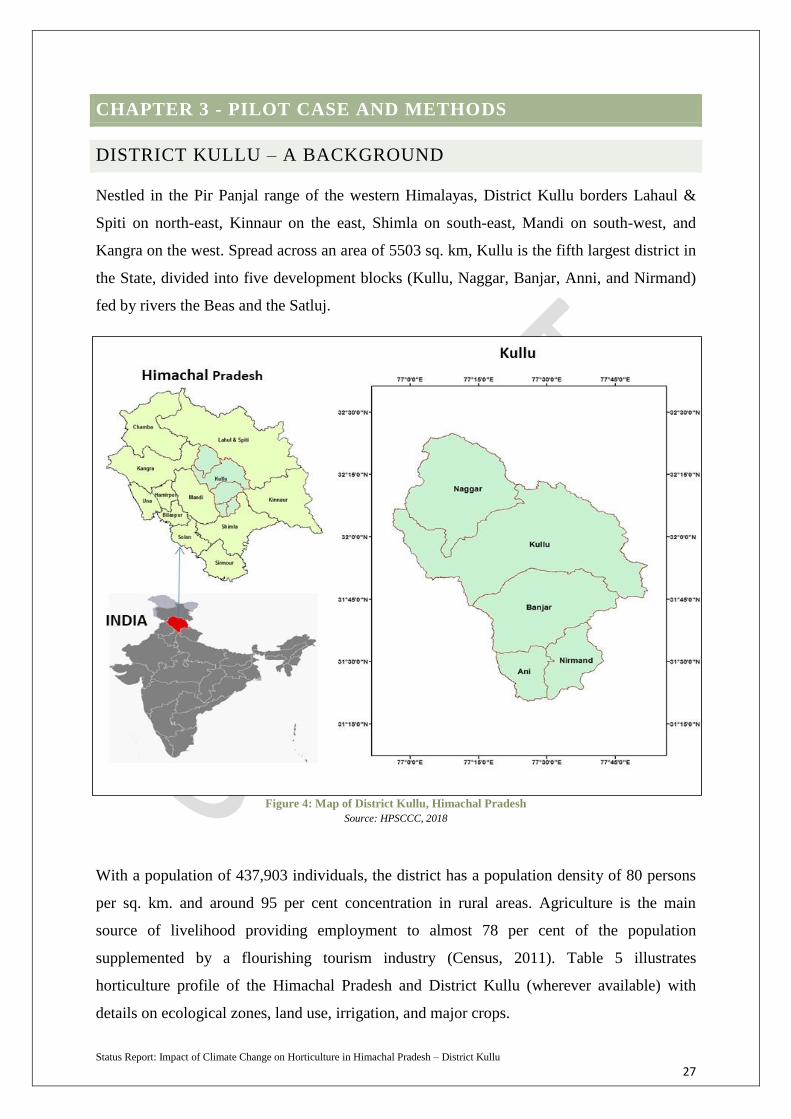
Nestled in the Pir Panjal range of the western Himalayas, District Kullu borders Lahaul &
Spiti on north-east, Kinnaur on the east, Shimla on south-east, Mandi on south-west, and
Kangra on the west. Spread across an area of 5503 sq. km, Kullu is the fifth largest district in
the State, divided into five development blocks (Kullu, Naggar, Banjar, Anni, and Nirmand)
fed by rivers the Beas and the Satluj.
Figure 4: Map of District Kullu, Himachal Pradesh
Source: HPSCCC, 2018
With a population of 437,903 individuals, the district has a population density of 80 persons
per sq. km. and around 95 per cent concentration in rural areas. Agriculture is the main
source of livelihood providing employment to almost 78 per cent of the population
supplemented by a flourishing tourism industry (Census, 2011). Table 5 illustrates
horticulture profile of the Himachal Pradesh and District Kullu (wherever available) with
details on ecological zones, land use, irrigation, and major crops.
Status Report: Impact of Climate Change on Horticulture in Himachal Pradesh – District Kullu
28
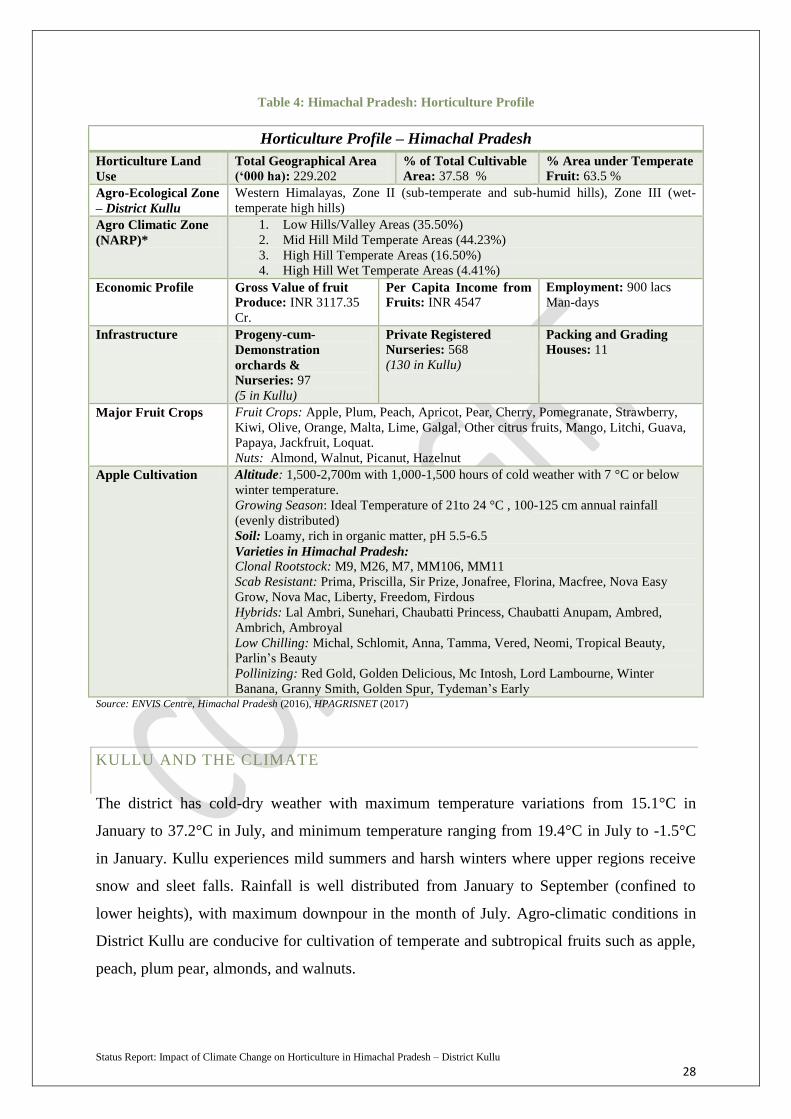
Table 4: Himachal Pradesh: Horticulture Profile
Horticulture Profile – Himachal Pradesh
Horticulture Land
Use
Total Geographical Area
(‘000 ha): 229.202 % of Total Cultivable
Area: 37.58 % % Area under Temperate
Fruit: 63.5 %
Agro-Ecological Zone
– District Kullu
Western Himalayas, Zone II (sub-temperate and sub-humid hills), Zone III (wet-
temperate high hills)
Agro Climatic Zone
(NARP)*
1. Low Hills/Valley Areas (35.50%)
2. Mid Hill Mild Temperate Areas (44.23%)
3. High Hill Temperate Areas (16.50%)
4. High Hill Wet Temperate Areas (4.41%)
Economic Profile Gross Value of fruit
Produce: INR 3117.35
Cr.
Per Capita Income from
Fruits: INR 4547
Employment: 900 lacs
Man-days
Infrastructure Progeny-cum-
Demonstration
orchards &
Nurseries: 97
(5 in Kullu)
Private Registered
Nurseries: 568
(130 in Kullu)
Packing and Grading
Houses: 11
Major Fruit Crops Fruit Crops: Apple, Plum, Peach, Apricot, Pear, Cherry, Pomegranate, Strawberry,
Kiwi, Olive, Orange, Malta, Lime, Galgal, Other citrus fruits, Mango, Litchi, Guava,
Papaya, Jackfruit, Loquat.
Nuts: Almond, Walnut, Picanut, Hazelnut
Apple Cultivation Altitude: 1,500-2,700m with 1,000-1,500 hours of cold weather with 7 °C or below
winter temperature.
Growing Season: Ideal Temperature of 21to 24 °C , 100-125 cm annual rainfall
(evenly distributed)
Soil: Loamy, rich in organic matter, pH 5.5-6.5
Varieties in Himachal Pradesh:
Clonal Rootstock: M9, M26, M7, MM106, MM11
Scab Resistant: Prima, Priscilla, Sir Prize, Jonafree, Florina, Macfree, Nova Easy
Grow, Nova Mac, Liberty, Freedom, Firdous
Hybrids: Lal Ambri, Sunehari, Chaubatti Princess, Chaubatti Anupam, Ambred,
Ambrich, Ambroyal
Low Chilling: Michal, Schlomit, Anna, Tamma, Vered, Neomi, Tropical Beauty,
Parlin’s Beauty
Pollinizing: Red Gold, Golden Delicious, Mc Intosh, Lord Lambourne, Winter
Banana, Granny Smith, Golden Spur, Tydeman’s Early Source: ENVIS Centre, Himachal Pradesh (2016), HPAGRISNET (2017)
KULLU AND THE CLIMATE
The district has cold-dry weather with maximum temperature variations from 15.1°C in
January to 37.2°C in July, and minimum temperature ranging from 19.4°C in July to -1.5°C
in January. Kullu experiences mild summers and harsh winters where upper regions receive
snow and sleet falls. Rainfall is well distributed from January to September (confined to
lower heights), with maximum downpour in the month of July. Agro-climatic conditions in
District Kullu are conducive for cultivation of temperate and subtropical fruits such as apple,
peach, plum pear, almonds, and walnuts.
Status Report: Impact of Climate Change on Horticulture in Himachal Pradesh – District Kullu
29
However, exposure to natural events such as flash floods, cloudburst, and droughts are
common and frequent compared to the other districts in the state. As per the findings from
climate change hazards and risks assessment conducted by the Indian Himalayas Climate
Adaptation Programme, over the time period of 1950-2014, Kullu accounted for over 40 per
cent of the recorded flood events, and had maximum exposure of agricultural land to glacial
lake outburst floods in the State (IHCAP, 2015). This increased exposure and sensitivity to
extreme variations in climatic parameters and inherently diverse climatic profile, renders
District Kullu an interesting and appropriate character to pilot an assessment of climate
change impact on horticulture productivity in Himachal Pradesh.
METHODS
Within the context of collocation of climate variability and agriculture productivity in District
Kullu, Himachal Pradesh, a pilot study was designed 1) to determine the statistical impact of
variations in climatic parameters (temperature and rainfall) vis-à-vis horticulture crop
productivity; 2) to conduct a perception–based climate change vulnerability assessment of
farmers’ community on key parameters of risk exposure, sensitivity, and adaptive capacity.
To that effect, the study methodology was divided for primary and secondary data
assessments in accordance with the above mentioned study objectives.
SECONDARY DATA SOURCES AND TECHNIQUE
The study employs three different statistical measures viz. trend analysis based on Mann
Kendall Test, Standardized Anomaly Index, and Multivariate Linear Regression Analysis to
ascertain the impact of variation in climatic parameters on horticulture sector pertaining to
phonological stages of pre-flowering, flowering and fruit-setting and development.
CLIMATE DATASETS
The mean minimum, maximum, diurnal temperatures, and rainfall data for Kullu District was
collected from India Meteorological Department (IMD), Shimla covering a time period of
1990-2016. Datasets were further categorised for different phenological stages i.e. pre
flowering, flowering, and fruit setting and development stages from November to February,
March to April and May to August respectively.

Status Report: Impact of Climate Change on Horticulture in Himachal Pradesh – District Kullu
30
HORTICULTURAL DATASETS
Apple, Pear, Plum, Peach, Apricot, Cherry, Pomegranate, Walnut and Almonds horticulture
crops acreage and production data was collected from the Directorate of Horticulture,
Himachal Pradesh, covering the time period 1980 to 2016.
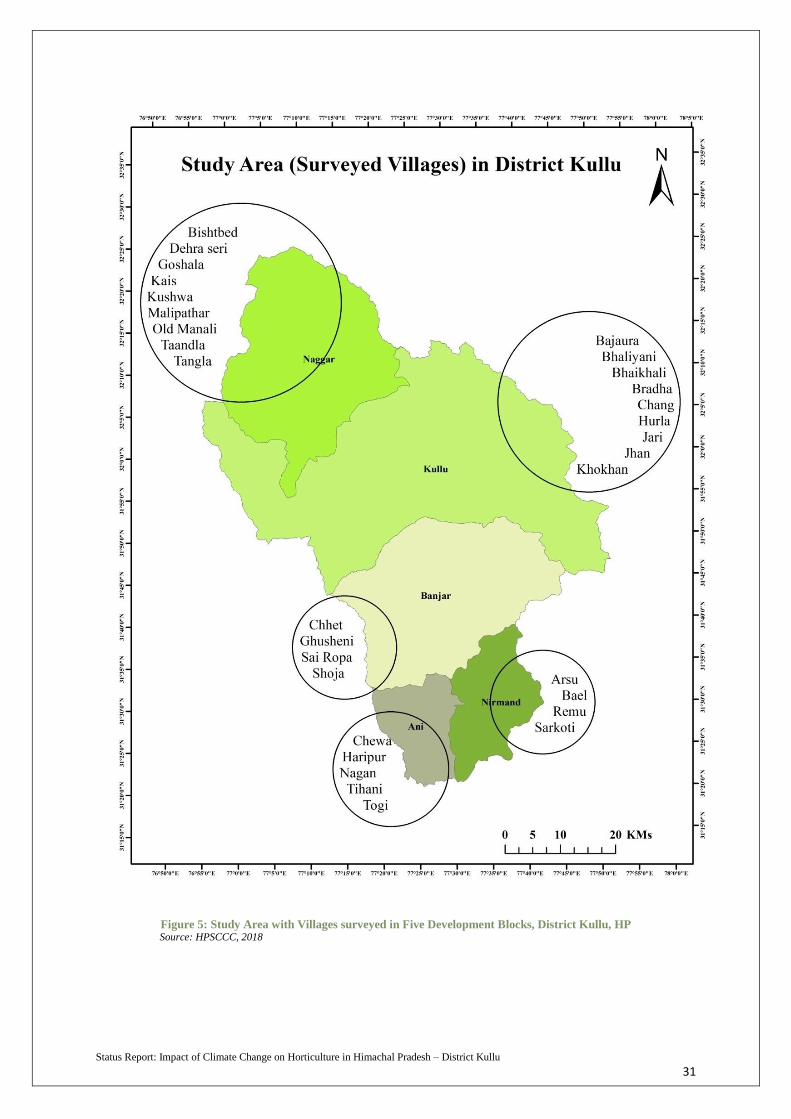
PRIMARY DATA PROCESS
Primary observations were collected between September 2017 and February 2018 by a team
of 6 experienced surveyors in District Kullu district. Structured interviews were administered
in five development block viz. Kullu, Naggar, Banjar, Anni, and Nirmand to elicit responses
qualifying the attributes of the proposed vulnerability assessment framework viz. exposure,
sensitivity, and adaptive capacity to climate change. A total of 210 farmer households were
selected following a random selection process of taking 10 HHs from 10% of panchayats
from each of the five blocks (Kullu 70 HH, Naggar 40 HH, Banjar 40 HH, Anni 30 HH,
Nirmand 30 HH). Nevertheless, due relevance was given to selection of villages that
represent extreme altitude gradient of the district (1,089-6,632m), thus ensuring
representation of different crop cultivations. The map below lists the 31 villages surveyed in
the five development block. Detailed information on village and block profile with
demographic and agricultural profile and the questionnaire are attached in Appendix A and B,
respectively.
METHODOLOGY CONSTRAINTS
Nevertheless, the study should be viewed with its intrinsic shortcomings. The data on acreage
and production of horticulture crops had several gaps and outlier values that were correct
using estimates of historic data trend and mean values. Similar data gaps were observed in
temperature and rainfall figures that were addressed using the above mentioned
approximations. Finally, the study should be taken as a case study assessment, prima facie,
and not as estimation for the entire state. For the primary study, interview outcomes are
subject to response bias1, where respondents could have given socially desirable and obvious
answers.
1Response bias are systematic tendencies of respondents to give socially and/or politically desirable answers that lead to halo effects or
severity/leniency bias
Status Report: Impact of Climate Change on Horticulture in Himachal Pradesh – District Kullu
31
Figure 5: Study Area with Villages surveyed in Five Development Blocks, District Kullu, HP Source: HPSCCC, 2018

Status Report: Impact of Climate Change on Horticulture in Himachal Pradesh – District Kullu
32
CHAPTER 4 – CLIMATE TREND AND HORTICULTURE:
DISTRICT KULLU
CURRENT CLIMATE TRENDS –DISTRICT KULLU
To capture the nerve of climatic changes in the district, temperature (min, max, diurnal), and
rainfall (quantity and days) are considered as explanatory indicators. Based on the statistical
analysis, Mann Kendall trend test, a highly significant change in climatic variables was
observed in flowering season from March to April in comparison to pre-flowering and fruit
setting season. Table 5 exhibits the results of Mann Kendall test at 95% confidence level for
minimum, maximum, and diurnal temperate, and rainfall for the time period 1990-2016.
Table 5: Mann Kendall Test Results – Climatic Trends for pre-flowering, flowering and fruit setting
seasons (1990-2016)
Mean Sen’s slope p-value
Pre Flowering (November- February)
Av. Max Temperature 18.77 0.04 0.04
Av. Min. Temperature 3.08 0.01 0.52
Diurnal Temperature 15.69 15.69 0.19
Total Rainfall 216.39 -2.58 0.20
Rainy Days 4.28 -0.07 0.28
Flowering (March – April)
Av. Max. Temperature 24.74 0.12 0.01
Av. Min. Temperature 8.27 0.04 0.00
Diurnal Temperature 16.47 0.07 0.06
Total Rainfall 176.65 -6.17 0.00
Rainy Days 9.73 -0.04 0.51
Fruit- Setting (May- August)
Av. Max. Temperature 31.49 0.03 0.23
Av. Min. Temperature 17.66 0.02 0.29
Diurnal Temperature 13.82 0.01 0.76
Total Rainfall 360.35 0.98 0.76
Rainy Days 12.97 0.17 0.00
Source: HPSCCC, 2018
As per the analysis, both the average maximum and minimum temperatures
registered an inclining trend progressing at a rate of 0.12°C and 0.04°C per year between
1990 and 2016 (as exhibited by Sen’s slope), while the rainfall quantity exhibited a
significant decline of 6.17 mm per year, during the flowering-season i.e. between March and
April. During the pre-flowering season i.e. November to February, the mean maximum
temperature increased by 0.04°C per year. Further, to better understand the variations in
precipitation, changes in rainy days were analysed, which exhibited statistically significant
Status Report: Impact of Climate Change on Horticulture in Himachal Pradesh – District Kullu
33
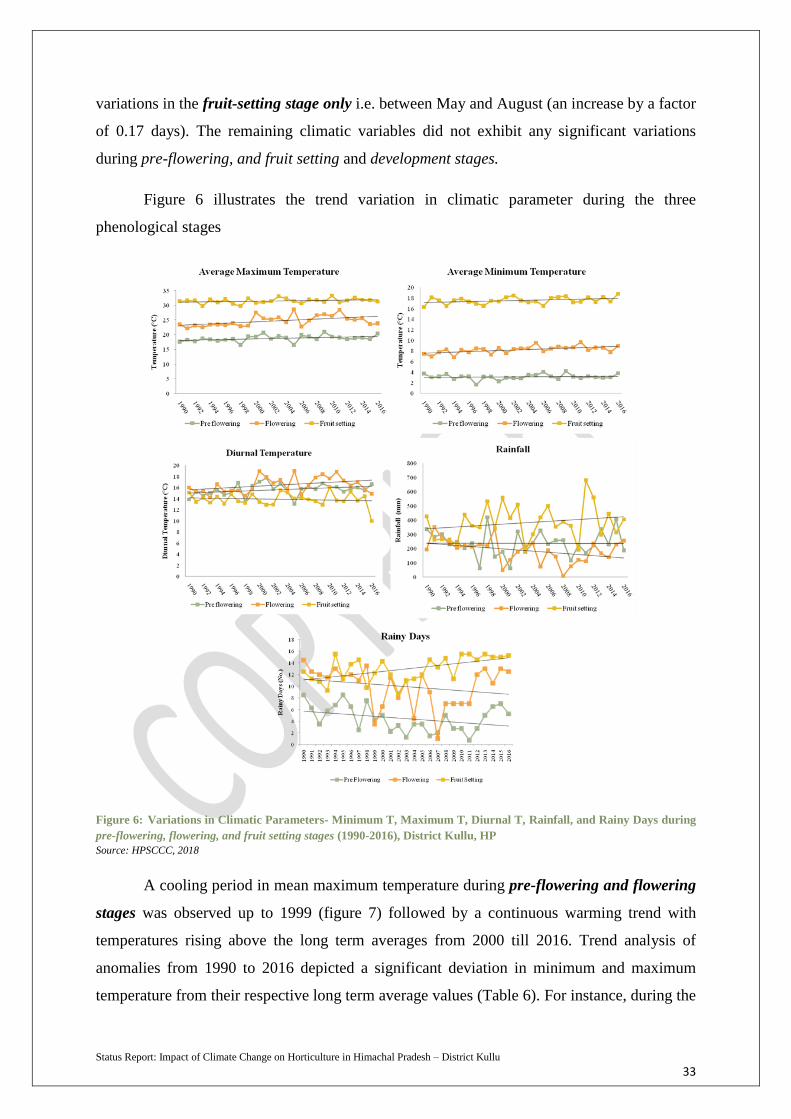
variations in the fruit-setting stage only i.e. between May and August (an increase by a factor
of 0.17 days). The remaining climatic variables did not exhibit any significant variations
during pre-flowering, and fruit setting and development stages.
Figure 6 illustrates the trend variation in climatic parameter during the three
phenological stages
Figure 6: Variations in Climatic Parameters- Minimum T, Maximum T, Diurnal T, Rainfall, and Rainy Days during
pre-flowering, flowering, and fruit setting stages (1990-2016), District Kullu, HP
Source: HPSCCC, 2018
A cooling period in mean maximum temperature during pre-flowering and flowering
stages was observed up to 1999 (figure 7) followed by a continuous warming trend with
temperatures rising above the long term averages from 2000 till 2016. Trend analysis of
anomalies from 1990 to 2016 depicted a significant deviation in minimum and maximum
temperature from their respective long term average values (Table 6). For instance, during the

Status Report: Impact of Climate Change on Horticulture in Himachal Pradesh – District Kullu
34
flowering and pre-flowering season the mean maximum temperature was higher than the
flowering and pre-flowering season the mean maximum temperature was higher than the long
term averages, post 2000. For fruit setting and development stages, 9 out of 14 warming
years were recorded after 2000 (figure 7).
Table 6: SAI for Mean Annual Maximum, Minimum, Diurnal Temperature, Rainfall, and Rainy days
from (1990 -2016), District Kullu, HP
Mean Sen’s slope p-value
Pre Flowering (November- Feb)
Av. Max Temp 18.77 0.04 0.04
Av. Min. Temp 3.08 0.01 0.54
Diurnal Temp 15.69 0.03 0.19
Total Rainfall 216.39 -3.00 0.96
Rainy Days 4.28 -0.04 0.19
Flowering (March – April)
Av. Max. Temp 24.74 0.07 0.00
Av. Min. Temp 8.27 0.06 0.00
Diurnal Temp 16.47 0.01 0.76
Total Rainfall 176.65 -0.006 0.07
Rainy Days 9.73 -0.02 0.19
Fruit- Setting (May- August)
Av. Max. Temp 31.49 0.04 0.24
Av. Min. Temp 17.66 0.03 0.30
Diurnal Temp 13.82 0.01 0.76
Total Rainfall 360.35 0.03 0.20
Rainy Days 12.97 0.07 0.01 Source: HPSCCC, 2018
The anomalies in the annual mean minimum temperature exhibited the similar
pattern expect for the pre-flowering stage (figure 8), where from 1990 to 2002, minimum
temperature remained below the long term averages with intermittent respites in pre
flowering, flowering and fruit setting and development stages. Across all phenological stages,
minimum temperature rose steadily from 2002 to 2016, with 6, 3, and 7 breaks from warming
for the three stages chronologically. Nevertheless, the most significant incline in mean
minimum temperature for was observed during the flowering period (Table 6). Variations in
diurnal temperature from the long term averages were not found to be of any statistical
significant for all phenological stages.

Status Report: Impact of Climate Change on Horticulture in Himachal Pradesh – District Kullu
35
Figure 7: SAI for Mean Maximum Temperature during pre-flowering, flowering, and fruit setting stages (1990-2016),
District Kullu, HP
Source: HPSCCC, 2018
Figure 8: SAI for Mean Minimum Temperature during pre-flowering, flowering, and fruit setting stages (1990-2016),
District Kullu, HP
Source: HPSCCC, 2018

Status Report: Impact of Climate Change on Horticulture in Himachal Pradesh – District Kullu
36
Figure 9: SAI for Mean Diurnal Temperature during pre-flowering, flowering, and fruit setting stages (1990-2016),
District Kullu, HP
Source: HPSCCC, 2018
Rainfall pattern during the phenological stages of pre-flowering, and fruit setting and
development stages did not show any variation over the long term averages, except during the
flowering stage where rainfall registered a decreasing trend post 2002, with small spikes in
2003, 2004, 2012, 2015, 2016 (figure 10). Meanwhile for rainy days patterns during pre-
flowering season, there was a consistent decline from 2002 to 2012, there after small peaks in
2014 and 2015 (figure 11). Similarly, during the flowering season, 2001 onward consistent
decline in rainy days was witnessed till 2012, post which rainy days increased till 2015.
Statistically significant variations are observed during the fruit setting stage only (table 6),
where 2005 onwards there was increase in rainy days with a small dip in 2009.

Status Report: Impact of Climate Change on Horticulture in Himachal Pradesh – District Kullu
37
Figure 10: SAI for Mean Annual Rainfall during pre-flowering, flowering, and fruit setting stages (1990-2016), District
Kullu, HP
Source: HPSCCC, 2018
Figure 11: SAI for Mean Annual Rainy Days during pre-flowering, flowering, and fruit setting stages (1990-2016),
District Kullu, HP
Source: HPSCCC, 2018

Status Report: Impact of Climate Change on Horticulture in Himachal Pradesh – District Kullu
38
The discussed variations in temperature and rainfall patterns are not confined to
District Kullu but are corroborated by observations from other studies in the Himalayan
region. Poudel and Shaw (2016) observed an increase of 0.07°C in minimum temperature and
0.02°C in maximum temperature from 1980 to 2010 in Nepal bound Himalayan region, while
comparing minimum annual temperatures with maximum temperatures. Shekhar et al.
(2010), in their assessment of climatic variations in the mountain ranges of the western
Himalaya viz. Pir Panjal, Shamshawari, Greater Himalaya, and Karakoram, recorded increase
in seasonal mean, maximum, and minimum temperatures by 2.0°C, 2.8°C, and 1°C,
respectively. Meanwhile, Bhutiyani et al. (2007) reported a significant increase in
temperature in the north-west Himalayas by about 1.6°C with faster pace of winter warming.
Specifically in Himachal Pradesh, the rate of increase in maximum temperature was observed
to vary with altitudinal zones (higher altitudes registered higher rate of increase). Erratic
precipitation patterns have been reported during different phenological stages by other studies
as well. In district Kullu, Vishvakarma et al. (2003) reported 7 cm decrease in rainfall, 12 cm
decrease in snowfall, and an increase of 0.25-1°C increase in mean maximum and minimum
temperatures.
Status Report: Impact of Climate Change on Horticulture in Himachal Pradesh – District Kullu
39
FRUIT CROP PRODUCTIVITY – DISTRICT KULLU
ACREAGE, PRODUCTION, PRODUCTIVITY ASSESSMENT OF MAJOR
HORTICULTURE CROPS
In District Kullu, the acreage under orchards has increased sharply from 675 ha in
1965 to 9,477 ha in 2010, registering a growth of 1,304 per cent. To get a better overview in
this growth trajectory, temporal trend of changes in acreage, production, and productivity for
Apple, and other fruit crops viz. Plum, Peach, Apricot and Pear in Kullu district were studied.
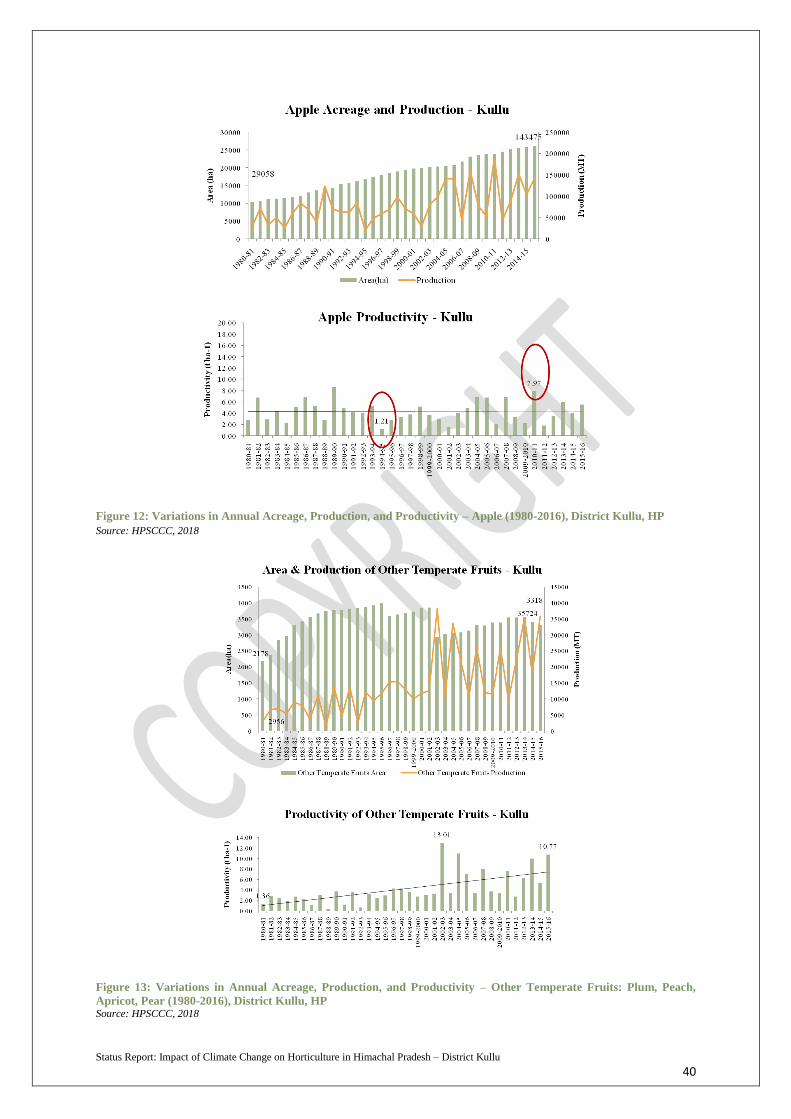
Acreage under apple cultivation increased from 10,264 ha in 1980 to 26,029 ha in
2015 (an increase of 153.59 per cent) and the production surged from 29,058 MT to 143,474
MT (1980-2015), as illustrated in Figure 12. Nonetheless, productivity of Apple did not
register any statistically significant variations, with minimum productivity of 1.21 t ha-1 in
1994 and maximum of 7.97 t ha-1 in 2010 there after declining to 5.51 t ha-1 by 2016.
For other temperate fruits, the composite acreage increased by 52.34 per cent (2,178
ha in 1980 to 3,318 ha in 2015), the total production surged by 1108.42 per cent (2,956 MT in
1980 to 35,724 MT in 2015), and productivity increased from 1.36 to 10.77 t ha-1
in past 35
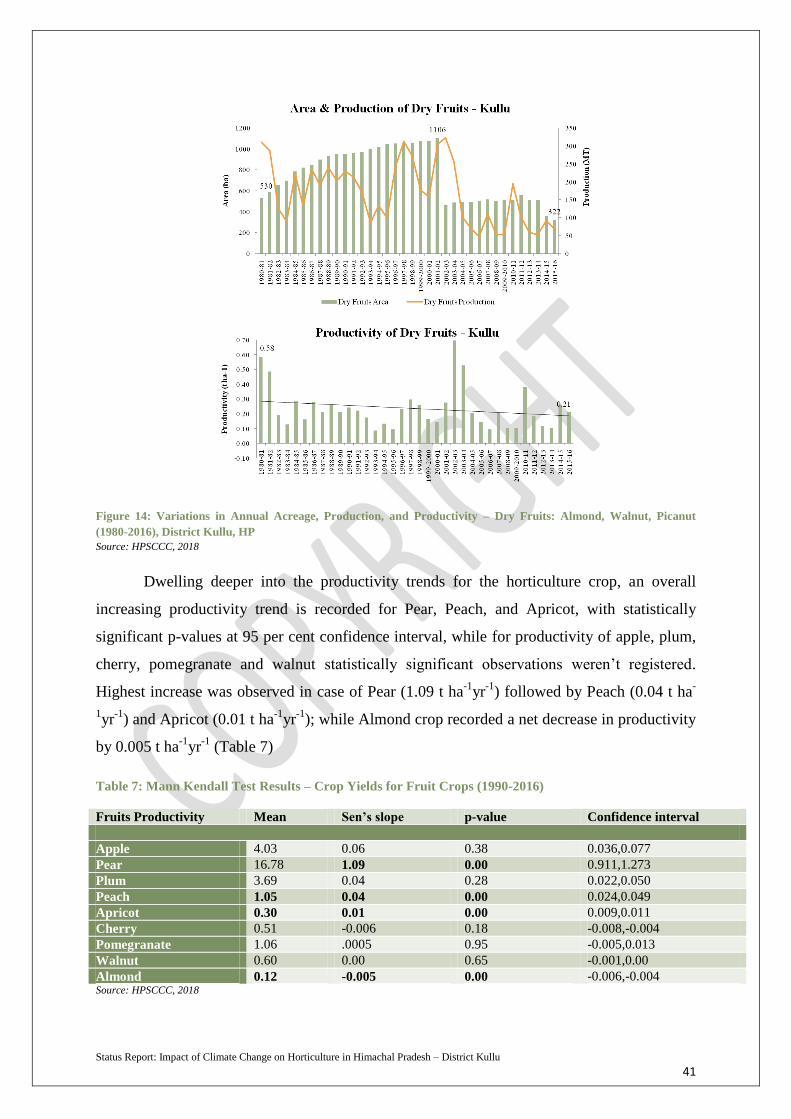
years (Figure 13). Composite area under dry fruits i.e. Almond, Walnut, and Picanut
increased by 108 per cent from 530 ha to 1106 ha till 2001, thereafter declined to 322 ha by
the end of 2015. While, production of dry fruits registered a similar trend, productivity
showed consistent decline, moving from 0.58 t ha-1
in 1980 to 0.21t ha-1
in 2015 (Figure 14).
Status Report: Impact of Climate Change on Horticulture in Himachal Pradesh – District Kullu
40
Figure 12: Variations in Annual Acreage, Production, and Productivity – Apple (1980-2016), District Kullu, HP
Source: HPSCCC, 2018
Figure 13: Variations in Annual Acreage, Production, and Productivity – Other Temperate Fruits: Plum, Peach,
Apricot, Pear (1980-2016), District Kullu, HP Source: HPSCCC, 2018
Status Report: Impact of Climate Change on Horticulture in Himachal Pradesh – District Kullu
41
Figure 14: Variations in Annual Acreage, Production, and Productivity – Dry Fruits: Almond, Walnut, Picanut
(1980-2016), District Kullu, HP
Source: HPSCCC, 2018
Dwelling deeper into the productivity trends for the horticulture crop, an overall
increasing productivity trend is recorded for Pear, Peach, and Apricot, with statistically
significant p-values at 95 per cent confidence interval, while for productivity of apple, plum,
cherry, pomegranate and walnut statistically significant observations weren’t registered.
Highest increase was observed in case of Pear (1.09 t ha-1
yr-1
) followed by Peach (0.04 t ha-
1yr
-1) and Apricot (0.01 t ha
-1yr
-1); while Almond crop recorded a net decrease in productivity
by 0.005 t ha-1
yr-1
(Table 7)
Table 7: Mann Kendall Test Results – Crop Yields for Fruit Crops (1990-2016)
Fruits Productivity Mean Sen’s slope p-value Confidence interval
Apple 4.03 0.06 0.38 0.036,0.077
Pear 16.78 1.09 0.00 0.911,1.273
Plum 3.69 0.04 0.28 0.022,0.050
Peach 1.05 0.04 0.00 0.024,0.049
Apricot 0.30 0.01 0.00 0.009,0.011
Cherry 0.51 -0.006 0.18 -0.008,-0.004
Pomegranate 1.06 .0005 0.95 -0.005,0.013
Walnut 0.60 0.00 0.65 -0.001,0.00
Almond 0.12 -0.005 0.00 -0.006,-0.004 Source: HPSCCC, 2018

Status Report: Impact of Climate Change on Horticulture in Himachal Pradesh – District Kullu
42
Trend data in tandem with the outcomes of Mann Kendall Test results hint toward a
shift in focus from Apple crop to other stone crop and a consistent decline in dry fruit, solely
in terms of productivity. Consistent trends have been reported by different research studies
upholding the role of climate change in impacting the productivity of apple and other
temperate fruits in Himachal Pradesh. While, Singh (2003) discussed the role of changing
weather patterns such as reduced annual snowfall and fluctuating temperatures during
flowering period in determining the success of apple crop in Himachal Pradesh; Gautam et al.
(2004) unearthed the factors of reduction in natural pollinating agents, inadequate winter
chilling, frequent spring frosts and hails, droughts as reasons for poor fruit setting in
Delicious variety. Therefore, at this stage it becomes imperative to get a better insight into
factors leading to this supposed transition with specific role of climate change led variations
in individual crop productivity. The next section explores the juxtaposition of horticulture
crop productivity with respect to climate change variations, through a multivariate regression
analysis.

Status Report: Impact of Climate Change on Horticulture in Himachal Pradesh – District Kullu
43
CLIMATE- FRUIT CROP JUXTAPOSITION
To determine the relationship between climatic variables during phenological periods and
productivity of temperate fruit crops, a correlation analysis was performed. Highly significant
correlation between climate variability and productivity was observed during the pre-
flowering stages, with a predominant impact on the productivity of Apple, Pear, and Almond
crops (table 8). Apple productivity exhibited strong negative correlation with maximum and
diurnal temperatures during the pre-flowering period with coefficient values of -0.47 and -
0.40 respectively. That means with an increase in mean maximum and diurnal
temperatures, during the pre-flowering stages, apple productivity declines. These results are
in accordance with the works of Sharma et al., (2013) who observed a negative but
significant correlation between maximum temperature and productivity during different
stages of fruit growth and development of apple in Shimla. Productivity of Pear and
Almonds, too had a negative correlation of -0.40, -0.34 respectively with variations in
maximum temperature during the study period.
With reference to variations in mean minimum temperature, only Cherry crop
showed significant positive correlation of 0.33 during the pre-flowering season. That is with
slight increase in minimum temperature, cherry crops shows increased productivity. This is in
consonance with the expected ideal conditions for cherry crop that is observed to be highly
susceptible to frost damage and during bud development requires temperatures no lower than
- 6°C (Lang, 2001).
For rainfall variations during the pre-flowering season, statistically significant
positive correlation was observed for the productivity of apple, pear and almond (0.51, 0.56
and 0.32, respectively) i.e. with increased in rainfall during the pre-flowering period, these
crops stand a chance to benefit through better productivity. During the pre-flowering seasons
soil is expected to be moist and soft to facilitate the development of early root system, hence
evenly spread rainfall is considered a beneficial factor for these crops. Yet, a weather extreme
during the pre-flowering stage could wipe-out the entire plantation. With reference to
variations in rainfall days, none of the fruit crops showed significant correlation in
productivity, during the pre-flowering stage.
During the flowering period, apple productivity assumed a positive correlation with
variations in mean minimum temperature (0.35). The results are supported by Caprio and
Status Report: Impact of Climate Change on Horticulture in Himachal Pradesh – District Kullu
44
Quamme (2005) who linked warmer weather during spring as a beneficial factor for
pollination and fruit set, thus favouring overall productivity of crop.
Meanwhile, Plum crop yield showed maximum sensitivity to variations in climatic
parameters of mean maximum and diurnal temperatures, and rainfall during the flowering
stages with a negative correlation of -0.38 and -0.40 with maximum and diurnal temperatures
respectively; and a positive correlation of 0.34 with rainfall. This means, with an increase in
mean maximum temperature during the flowering stages, the plum crop yield declines, while
an increase in rainfall supports the fruit productivity. Higher temperatures during the
flowering stages of plum fruit are observed to fasten the flowering process that impacts the
overall productivity (Cosmulescu et al., 2010). With reference to variations in rainy days,
none of the fruit crops showed significant correlation in productivity, during the flowering
stage.
For the fruit setting and development stages, productivity of pomegranate and
almond crops were positively correlated with the diurnal temperature (0.34 and 0.45); and
almond productivity was positively correlated with mean maximum temperature (0.33). Rest
of the crops did not show any statistically significant productivity changes in response to
variations in temperatures at 95 per cent confidence interval. With changes in quantity of
rainfall, apple, apricot and pomegranate productivity exhibited an indirect relationship with
the correlation coefficient values of -0.31, -0.35 and -0.33 respectively.
Pomegranate fruit flourishes in hot and dry climate during the fruit setting and
development stages. Pomegranate and Almonds are observed to be tolerant to fluctuations in
diurnal temperatures, which support the outcomes of our study. Meanwhile, the prescribed
negative correlation with rainfall variations for apple, apricot, and pomegranate during the
fruit development stages is supported by the findings of Kwon et al., (2008), who reported
compromised fruit quality due to heavy precipitation during the later stages of fruit
development. Wetter weather during the stage of fruit setting and development stages are
found to result in increased losses from rain-induced fruit drop and cracking in temperate
fruits. For instance, in case of pomegranate, rainfall during the fruit maturation stage leads to
rapid fruit cracking and significantly lower productivity. With reference to variations in rainy
days, none of the fruit crops showed significant correlation in productivity, during the fruit
setting stage.
Status Report: Impact of Climate Change on Horticulture in Himachal Pradesh – District Kullu
45
To summarise the above discussion on the regression outcomes of detrended 2
climatic variables of minimum, maximum, diurnal temperature, rainfall, and rainy days with
the productivity of selected crops of apple, pear, plum peach, apricot, cherry, pomegranate,
walnut, and almond. Of the three phenological stages, maximum impact of climatic
parameters was observed during the pre-flowering stage i.e. the contribution of climatic
variables in impacting the productivity of Apple, Pear, Cherry, Pomegranate, and Almond
crops. R-squared statistics is used to ascertain the percentage of variation in productivity
(positive or negative) that is explained by variations in minimum, maximum, diurnal
temperature and rainfall. Therefore, during the pre-flowering stage, climatic factors
accounted for 35 per cent of the increase in Pear productivity, 31 per cent variation in Apple
productivity, 13 per cent of productivity decline in Cherry, and 20 per cent decline in the
Almond crop productivity. For the phenological stages of flowering stage, variations in
climatic parameters of temperature and rainfall accounted for 19 per cent of the variability in
Apple productivity, 18 per cent (increase) in Plum, and 16 per cent (decline) in productivity
of Cherry; and during the fruit setting and development stages 29 per cent variations
(increase) in Apricot productivity, 24 per cent in Pomegranate, 21 per cent variations in
Apple, and 27 per cent of decline in Almond productivity are explained by the considered
climatic parameters. Factors of quality planting material and better orchard management
practices are touted to be the explanatory reasons for remainder variations in fruit crop yield
(Jindal & Chauhan, 2001).
In nutshell, amongst all the studied crops, Apple productivity showed maximum
sensitivity to climatic variations during all three stages (31%, 19%, 21%) with significant
correlation observed for Pear (35%, 9%, 10%), Almond (20%, 13%, 27%), Plum (19%, 18%,
1%), Pomegranate (6%, 8%, 24%), Apricot (3%, 14%, 29%), and Cherry (13%, 16%, 8%).
With respect to individual crops, this means that the observed variations in productivity for
Apple crop from 1990-2016 is explained by the variations in climatic parameters only to the
extent of 31 % during pre-flowering stage, 19% during the flowering stage, and 21% during
the fruit setting and development stage. Similar interpretations are valid for Pear, Almond,
Plum, Pomegranate, Apricot, and Cherry. Meanwhile, the productivity of Walnut was least
influenced by the changes in climatic parameters across all phenological stages (2% at pre-
flowering stage; 3% at flowering; and 15% at the fruit setting and development stage).
2 Climate and productivity data was detrended by computing the difference in values from one year to the next.
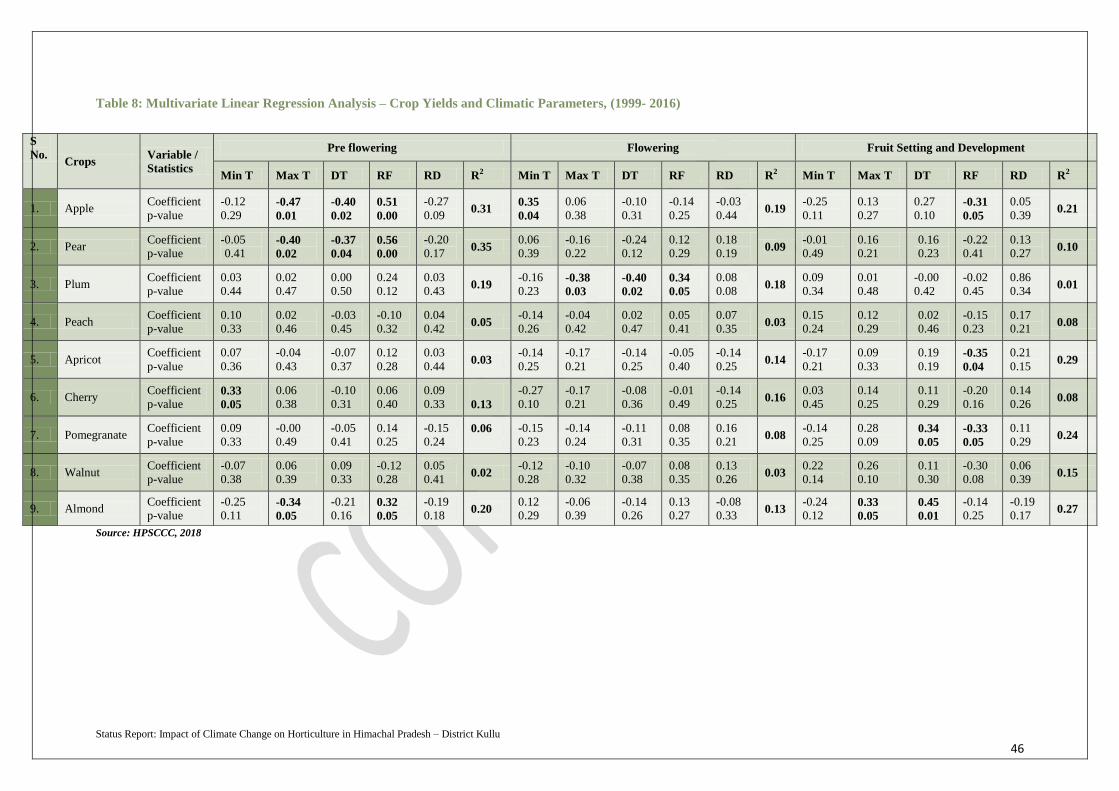
Status Report: Impact of Climate Change on Horticulture in Himachal Pradesh – District Kullu
46
Table 8: Multivariate Linear Regression Analysis – Crop Yields and Climatic Parameters, (1999- 2016)
Source: HPSCCC, 2018
S
No. Crops
Variable /
Statistics
Pre flowering Flowering Fruit Setting and Development
Min T Max T DT RF RD R2 Min T Max T DT RF RD R2 Min T Max T DT RF RD R2
1. Apple Coefficient
p-value
-0.12
0.29 -0.47
0.01
-0.40
0.02
0.51
0.00
-0.27
0.09 0.31
0.35
0.04
0.06
0.38
-0.10
0.31
-0.14
0.25
-0.03
0.44 0.19
-0.25
0.11
0.13
0.27
0.27
0.10 -0.31
0.05
0.05
0.39 0.21
2. Pear Coefficient
p-value
-0.05
0.41 -0.40
0.02
-0.37
0.04
0.56
0.00
-0.20
0.17 0.35
0.06
0.39
-0.16
0.22
-0.24
0.12
0.12
0.29
0.18
0.19 0.09
-0.01
0.49
0.16
0.21
0.16
0.23
-0.22
0.41
0.13
0.27 0.10
3. Plum Coefficient
p-value
0.03
0.44
0.02
0.47
0.00
0.50
0.24
0.12
0.03
0.43 0.19
-0.16
0.23 -0.38
0.03
-0.40
0.02
0.34
0.05
0.08
0.08 0.18
0.09
0.34
0.01
0.48
-0.00
0.42
-0.02
0.45
0.86
0.34 0.01
4. Peach Coefficient
p-value
0.10
0.33
0.02
0.46
-0.03
0.45
-0.10
0.32
0.04
0.42 0.05
-0.14
0.26
-0.04
0.42
0.02
0.47
0.05
0.41
0.07
0.35 0.03
0.15
0.24
0.12
0.29
0.02
0.46
-0.15
0.23
0.17
0.21 0.08
5. Apricot Coefficient
p-value
0.07
0.36
-0.04
0.43
-0.07
0.37
0.12
0.28
0.03
0.44 0.03
-0.14
0.25
-0.17
0.21
-0.14
0.25
-0.05
0.40
-0.14
0.25 0.14
-0.17
0.21
0.09
0.33
0.19
0.19 -0.35
0.04
0.21
0.15 0.29
6. Cherry Coefficient
p-value 0.33
0.05
0.06
0.38
-0.10
0.31
0.06
0.40
0.09
0.33
0.13
-0.27
0.10
-0.17
0.21
-0.08
0.36
-0.01
0.49
-0.14
0.25 0.16
0.03
0.45
0.14
0.25
0.11
0.29
-0.20
0.16
0.14
0.26 0.08
7. Pomegranate Coefficient
p-value
0.09
0.33
-0.00
0.49
-0.05
0.41
0.14
0.25
-0.15
0.24 0.06
-0.15
0.23
-0.14
0.24
-0.11
0.31
0.08
0.35
0.16
0.21 0.08
-0.14
0.25
0.28
0.09 0.34
0.05
-0.33
0.05
0.11
0.29 0.24
8. Walnut Coefficient
p-value
-0.07
0.38
0.06
0.39
0.09
0.33
-0.12
0.28
0.05
0.41 0.02
-0.12
0.28
-0.10
0.32
-0.07
0.38
0.08
0.35
0.13
0.26 0.03
0.22
0.14
0.26
0.10
0.11
0.30
-0.30
0.08
0.06
0.39 0.15
9. Almond Coefficient
p-value
-0.25
0.11 -0.34
0.05
-0.21
0.16 0.32
0.05
-0.19
0.18 0.20
0.12
0.29
-0.06
0.39
-0.14
0.26
0.13
0.27
-0.08
0.33 0.13
-0.24
0.12 0.33
0.05
0.45
0.01
-0.14
0.25
-0.19
0.17 0.27

Status Report: Impact of Climate Change on Horticulture in Himachal Pradesh – District Kullu
47
CONCLUDING POINTERS
Crop Variations:
Pear, Peach and Apricot crops should statistically significant increase in productivity as per
Mann Kendal test results
Productivity of Apple, Plum, Cherry, Pomegranate and Walnut did not show any statistically significant changes from 1990-2016 as per results of Mann Kendall Test
Apple Crop - minimum productivity of 1.21 t ha-1 in 1994 and maximum of 7.97 t ha-1 in 2010,
there after declining to 5.51 t ha-1 in 2016.
Climatic Variations:
Higher variability in temperature and rainfall parameters observed during flowering period as
compared to pre-flowering and fruit setting period from 1990 to 2016
Flowering period - minimum and maximum temperature increased by 0.04°C, 0.12°C per year
respectively, and rainfall decreased by 6.17 mm per year
Pre-Flowering period - Maximum temperature increased by 0.04°C per year from 1990 to 2016
Fruit-setting period – Rainy days increased by 0.17 from 1990-2016
Higher anomalies in maximum and minimum temperature reported during all three
phenological stages indicating a warming trend
Climate Crop Juxtaposition:
Strong relationship between climate variability and productivity of fruit crops during pre-
flowering period in comparison to rest of two phenological stages i.e. for four fruit crops – Apple (with maximum and diurnal temperature, rainfall), Pear (with maximum and diurnal
temperature, rainfall), Cherry (with minimum temperature), and Almond (with maximum
temperature and rainfall) variations in productivity exhibited statistically significant correlation
with changes in considered climatic parameters of temperature and rainfall during pre-
flowering stage; while for flowering stage and fruit setting stage fewer statistically significant
correlation was witnessed between fruit crops productivity and climatic parameters.
Amongst all temperate fruit crops, Apple found to be most vulnerable to impact of climatic
variability at all three phenological stages while Walnut was least vulnerable

Status Report: Impact of Climate Change on Horticulture in Himachal Pradesh – District Kullu
48
CHAPTER 5 – CLIMATE CHANGE VULNERABILITY: CASE
STUDY, DISTRICT KULLU
The outcomes from the statistical analysis only give a plausible variation in horticultural
productivity vis-à-vis changes in climatic parameters of temperature and rainfall, owing to
statistical and data limitations of time period, gaps, and statistical relevance of sample space
and absence of scientific validation. Therefore, individual farm data from five blocks of
Kullu district was collected and analysed to conduct a perception-based Vulnerability
Assessment.
Literally transcribed information from all the interviews was tabularized to feed in the
PCA, as highlighted in earlier section. Table 9 below gives details on socio-economic status
of farmers in District Kullu.
Table 9: Socio-Economic Profile Interviewed Farmer Community, District Kullu, HP
No. of Farming HH Interviewed 210
Female : Male 29:71
Percentage of traditional cultivators 89%
Farm Experience Blocks District
Average Kullu Naggar Banjar Anni Nirmand
<10 years 2.9 0 4.8 0 4.0 2.34
10-20 years 5.7 7.3 7.1 10.3 12.0 8.48
>30 years 91.4 92.7 88.1 89.7 84.0 89.18
Land Holding Blocks District
Average Kullu Naggar Banjar Anni Nirmand
Marginal (<6 bigha) 40.0 56.1 69.0 37.9 36.0 47.8
Small(6-12 bigha) 32.9 34.1 16.7 20.7 36.0 28.1
Semi-Medium(12-24
bigha) 25.7 7.3 9.5 37.9 20.0 18.7
Medium(24-60 bigha) 1.4 2.4 4.8 3.4 8.0 4.0
Large(>60 bigha) 0 0 0 0 0 0
Source: Field Survey, HPSCCC, 2018
From above data it is evident that of the surveyed farmers, less than 3 per cent had
less than 10 years of farming experience, thus almost all can be categorized as experienced
farmers. Additionally, in terms of land holding, agriculture is dominated by marginal farmers
(47.8%) followed by small (28.1%), semi-medium (18.7%) and large (4%). Population of
farmers with marginal holding was highest in block Banjar (69%) followed by Naggar
(56.1%), Kullu (40%), Anni (37.9 %) and Nirmand (36%). None of the interviewed farmers
had land holdings greater than 60 bighas.
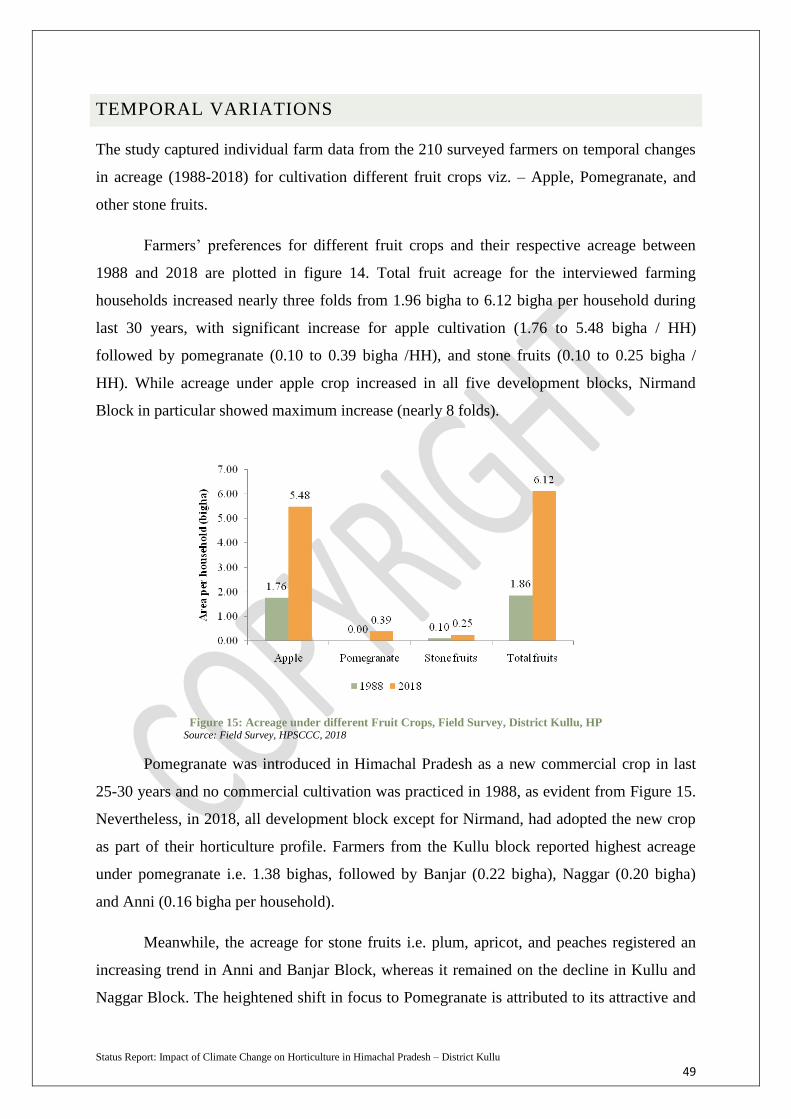
Status Report: Impact of Climate Change on Horticulture in Himachal Pradesh – District Kullu
49
TEMPORAL VARIATIONS
The study captured individual farm data from the 210 surveyed farmers on temporal changes
in acreage (1988-2018) for cultivation different fruit crops viz. – Apple, Pomegranate, and
other stone fruits.
Farmers’ preferences for different fruit crops and their respective acreage between
1988 and 2018 are plotted in figure 14. Total fruit acreage for the interviewed farming
households increased nearly three folds from 1.96 bigha to 6.12 bigha per household during
last 30 years, with significant increase for apple cultivation (1.76 to 5.48 bigha / HH)
followed by pomegranate (0.10 to 0.39 bigha /HH), and stone fruits (0.10 to 0.25 bigha /
HH). While acreage under apple crop increased in all five development blocks, Nirmand
Block in particular showed maximum increase (nearly 8 folds).
Figure 15: Acreage under different Fruit Crops, Field Survey, District Kullu, HP Source: Field Survey, HPSCCC, 2018
Pomegranate was introduced in Himachal Pradesh as a new commercial crop in last
25-30 years and no commercial cultivation was practiced in 1988, as evident from Figure 15.
Nevertheless, in 2018, all development block except for Nirmand, had adopted the new crop
as part of their horticulture profile. Farmers from the Kullu block reported highest acreage
under pomegranate i.e. 1.38 bighas, followed by Banjar (0.22 bigha), Naggar (0.20 bigha)
and Anni (0.16 bigha per household).
Meanwhile, the acreage for stone fruits i.e. plum, apricot, and peaches registered an
increasing trend in Anni and Banjar Block, whereas it remained on the decline in Kullu and
Naggar Block. The heightened shift in focus to Pomegranate is attributed to its attractive and

Status Report: Impact of Climate Change on Horticulture in Himachal Pradesh – District Kullu
50
competitive market price, less chilling requirements, better shelf life, and ongoing shifting of
apple line to higher altitudes (2200-3000 msl) due to warming trends at 1,500 to 1,800 meters
above mean sea level (Parmesan & Yohe, 2003) (Partap & Partap, 2002).
Figure 16: Block-wise Acreage under different Fruit Crops, Field Survey, District Kullu, HP
Source: Field Survey, HPSCCC, 2018
Similar to the case of transition from grain crops to high-value cash crops such as carrots,
spinach, and garlic, initial adoption amongst the farmers was due to the demonstration effect3
rather than result based outcomes. However, with the rising challenges of apple cultivation at
existing altitudes and under current climatic situations, stark acceptance of pomegranate is
being witnessed. Statistically, between 1990 and 2016, acreage under pomegranate increased
from 2 ha to 358 ha in Kullu District, as per data from the Department of Horticulture,
Himachal Pradesh. Therefore, at this stage it is fare to say that both the economic and
climatic parameters are influencing the farmers to alter their crop choices and patterns. The
next section explores this perceived shift in detail.
3 Demonstration or Duesenberry effect is the effect on individual behaviour driven by observation of actions of the community and the
consequences faced by them. The term is often used in political science and sociology to describe the role of development/adoption by one place/individual as a catalyst for another place/individual.
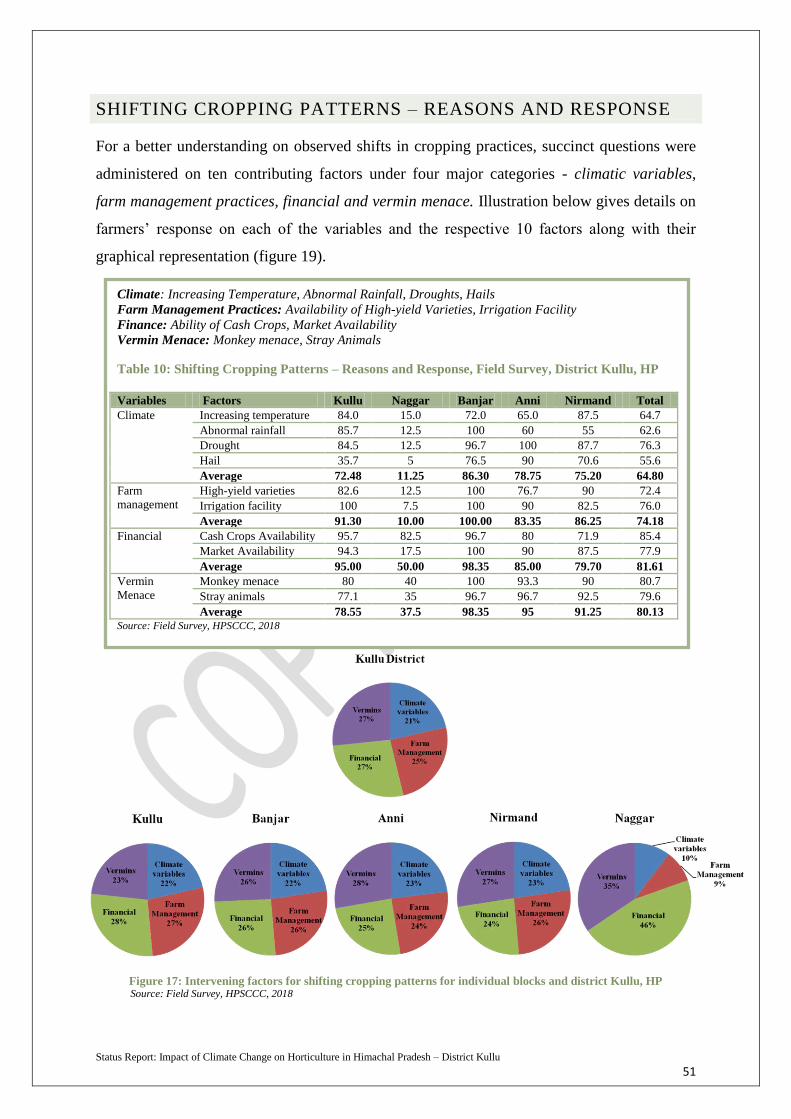
Status Report: Impact of Climate Change on Horticulture in Himachal Pradesh – District Kullu
51
SHIFTING CROPPING PATTERNS – REASONS AND RESPONSE
For a better understanding on observed shifts in cropping practices, succinct questions were
administered on ten contributing factors under four major categories - climatic variables,
farm management practices, financial and vermin menace. Illustration below gives details on
farmers’ response on each of the variables and the respective 10 factors along with their
graphical representation (figure 19).
Figure 17: Intervening factors for shifting cropping patterns for individual blocks and district Kullu, HP Source: Field Survey, HPSCCC, 2018
Climate: Increasing Temperature, Abnormal Rainfall, Droughts, Hails
Farm Management Practices: Availability of High-yield Varieties, Irrigation Facility
Finance: Ability of Cash Crops, Market Availability
Vermin Menace: Monkey menace, Stray Animals
Table 10: Shifting Cropping Patterns – Reasons and Response, Field Survey, District Kullu, HP
Variables Factors Kullu Naggar Banjar Anni Nirmand Total
Climate Increasing temperature 84.0 15.0 72.0 65.0 87.5 64.7
Abnormal rainfall 85.7 12.5 100 60 55 62.6
Drought 84.5 12.5 96.7 100 87.7 76.3
Hail 35.7 5 76.5 90 70.6 55.6
Average 72.48 11.25 86.30 78.75 75.20 64.80
Farm
management
High-yield varieties 82.6 12.5 100 76.7 90 72.4
Irrigation facility 100 7.5 100 90 82.5 76.0
Average 91.30 10.00 100.00 83.35 86.25 74.18
Financial Cash Crops Availability 95.7 82.5 96.7 80 71.9 85.4
Market Availability 94.3 17.5 100 90 87.5 77.9
Average 95.00 50.00 98.35 85.00 79.70 81.61
Vermin
Menace
Monkey menace 80 40 100 93.3 90 80.7
Stray animals 77.1 35 96.7 96.7 92.5 79.6
Average 78.55 37.5 98.35 95 91.25 80.13
Source: Field Survey, HPSCCC, 2018

Status Report: Impact of Climate Change on Horticulture in Himachal Pradesh – District Kullu
52
The field survey for both horticulture and agriculture crops was conducted with same
210 farming households on same parameters, as almost all farmers were found to engage in
agro-horti mixed farming approach. Therefore, the outputs for this study shares similarity
with the field survey conducted for the agriculture sector in District Kullu.
Within climatic patterns, droughts were cited as the major reason for a shift in
cropping patterns for farmers across the five blocks in District Kullu, followed by increasing
temperatures, abnormal rainfalls, and hailstorms. However, for the farmers in the Naggar
block the predominant factor for changing cropping patterns was availability of cash crops
i.e. increased uptake of (cash) fruit crop – Apple. With the gradual and consistent shift of
apple line in district Kullu (as discussed in the earlier sections), respondents from Naggar
block acknowledged the greater acceptance of Apple as a preference over other traditional
crops that reaps better economic return through easy market access (tourist and commercial)
and a better price.
Collectively, there was comparable distribution of factors leading to shift in cropping
patterns at the district level in the order - Vermin menace (27%), Financial (27%), Farm
Management Practices (25%), and Climate variable (21%) (Figure 16). As also observed
from the outcomes of statistical assessment – multivariate linear regression analysis, climatic
variations had limited explanatory power for variations in crop productivity, additionally, in
social studies, interview outcomes are subject to response bias where the respondents tend to
give desirable and/or most obvious response.
Nevertheless, the study was extended to assess the perceived vulnerability of sampled farmer
community in conjugation with their exposure, sensitivity, and adaptive capacity against
climate variability.

Status Report: Impact of Climate Change on Horticulture in Himachal Pradesh – District Kullu
53
PERCEPTION-BASED VULNERABILITY ASSESSMENT
The synthesized case study findings from District Kullu were appraised against the
measurement matrix on Exposure, Sensitivity, and Adaptive Capacity outlined in the
development of perception-based vulnerability assessment framework21
and discussed below.
EXPOSURE:
Exposure is the measure of spatial and temporal magnitude and extent of exposure of a
community to climate change. To measure the exposure of farming community to climate
change, their perception on climate variables viz. temperature, rainfall, snowfall, drought,
strong winds, flash floods and hail frequency was measured in all five block of District Kullu.
Farmers were found to assume an acute observation on changes in climatic patterns with
capabilities to engage in an informed discussion. Table 11 summarises the output of PCA for
block-wise variations in Exposure indicator.
Table 11: Block-wise scores and variations in Exposure Indicator, District Kullu, HP
Exposure Indicator Scores Kullu Naggar Banjar Anni Nirmand p-value
Temperature 0.20 0.03 0.02 -0.005 -0.06 -0.02 0.37
Rainfall 0.50 0.07 -0.19 -0.17 0.17 0.08 0.004
Snowfall 0.47 0.13 -0.23 -0.16 0.18 -0.05 0.00
Drought 0.45 0.12 0.08 -0.23 -0.17 -0.10 0.002
Strong Winds 0.56 0.004 0.17 -0.14 -0.19 0.07 0.04
Flash flood frequency 0.64 0.45 0.05 -0.48 -0.28 -0.27 0.00
Hail frequency 0.53 0.05 0.06 -0.07 0.04 -0.12 0.40
Source: Field Survey, HPSCCC, 2018
The weights obtained from PCA analysis for the indicators of exposure ranged from
0.20 (temperature) to 0.64 (flash flood frequency) and followed the order Temperature (0.20)
< Drought (0.45) < Snowfall (0.47) < Rainfall (0.50) < Hail frequency (0.53) < Strong Winds
(0.56) < Flash flood frequency (0.64). All the weights of climate variables were positive
thereby indicating a direct relationship with the overall exposure index and showing a
perceived exposure of surveyed population to increased frequency of climatic events –
floods, hail, rainfall, snowfall, and droughts. A further investigation revealed statistically
significant variation in exposure indicators across the district, except for temperature rise and
hail events (based on interpretation of p-values).
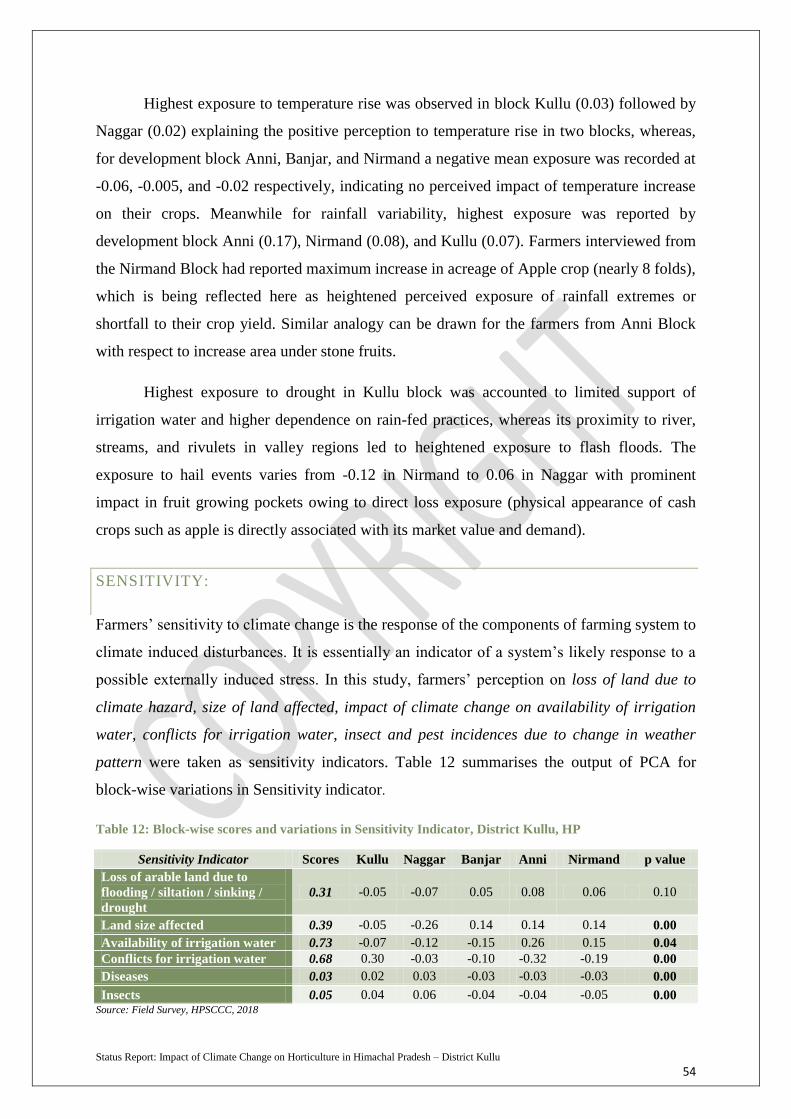
Status Report: Impact of Climate Change on Horticulture in Himachal Pradesh – District Kullu
54
Highest exposure to temperature rise was observed in block Kullu (0.03) followed by
Naggar (0.02) explaining the positive perception to temperature rise in two blocks, whereas,
for development block Anni, Banjar, and Nirmand a negative mean exposure was recorded at
-0.06, -0.005, and -0.02 respectively, indicating no perceived impact of temperature increase
on their crops. Meanwhile for rainfall variability, highest exposure was reported by
development block Anni (0.17), Nirmand (0.08), and Kullu (0.07). Farmers interviewed from
the Nirmand Block had reported maximum increase in acreage of Apple crop (nearly 8 folds),
which is being reflected here as heightened perceived exposure of rainfall extremes or
shortfall to their crop yield. Similar analogy can be drawn for the farmers from Anni Block
with respect to increase area under stone fruits.
Highest exposure to drought in Kullu block was accounted to limited support of
irrigation water and higher dependence on rain-fed practices, whereas its proximity to river,
streams, and rivulets in valley regions led to heightened exposure to flash floods. The
exposure to hail events varies from -0.12 in Nirmand to 0.06 in Naggar with prominent
impact in fruit growing pockets owing to direct loss exposure (physical appearance of cash
crops such as apple is directly associated with its market value and demand).
SENSITIVITY:
Farmers’ sensitivity to climate change is the response of the components of farming system to
climate induced disturbances. It is essentially an indicator of a system’s likely response to a
possible externally induced stress. In this study, farmers’ perception on loss of land due to
climate hazard, size of land affected, impact of climate change on availability of irrigation
water, conflicts for irrigation water, insect and pest incidences due to change in weather
pattern were taken as sensitivity indicators. Table 12 summarises the output of PCA for
block-wise variations in Sensitivity indicator.
Table 12: Block-wise scores and variations in Sensitivity Indicator, District Kullu, HP
Sensitivity Indicator Scores Kullu Naggar Banjar Anni Nirmand p value
Loss of arable land due to
flooding / siltation / sinking /
drought
0.31 -0.05 -0.07 0.05 0.08 0.06 0.10
Land size affected 0.39 -0.05 -0.26 0.14 0.14 0.14 0.00
Availability of irrigation water 0.73 -0.07 -0.12 -0.15 0.26 0.15 0.04
Conflicts for irrigation water 0.68 0.30 -0.03 -0.10 -0.32 -0.19 0.00
Diseases 0.03 0.02 0.03 -0.03 -0.03 -0.03 0.00
Insects 0.05 0.04 0.06 -0.04 -0.04 -0.05 0.00 Source: Field Survey, HPSCCC, 2018

Status Report: Impact of Climate Change on Horticulture in Himachal Pradesh – District Kullu
55
All the indicators had a positive relationship with the sensitivity index. According to
respective weights gathered from PCA, availability of irrigation water (0.73) emerged as the
most influential parameter succeeded by water related conflicts (0.68), affected land size
(0.39), loss of agricultural land to natural hazard (0.31), insect (0.05), and pest infestations
(0.03). In details, highest loss of arable land was observed in Anni (0.08) then Nirmand
(0.06), Banjar (0.05), Kullu (-0.05) and Naggar (-0.07). Changes in land size due to changes
in climatic conditions reported same trend across the five development blocks. Index value
for conflicts for irrigation water was highest in Naggar (0.30) where in other blocks no
influence was perceived for the same. Diseases and insect incidences highly influenced the
sensitivity index of the farmers of Naggar (0.03, 0.06) and Kullu blocks (0.02, 0.04), these
are the blocks with significant acreage under apple and pomegranate which are susceptible to
pest incidences and infestations such as fruit root rots, woolly aphid, etc. Climate change
(temperature and precipitation) induced sensitivities on parameters of heightened crop
diseases and insects have been found in other studies as well (Mboup et al., 2012) (Coakley et
al., 1999).
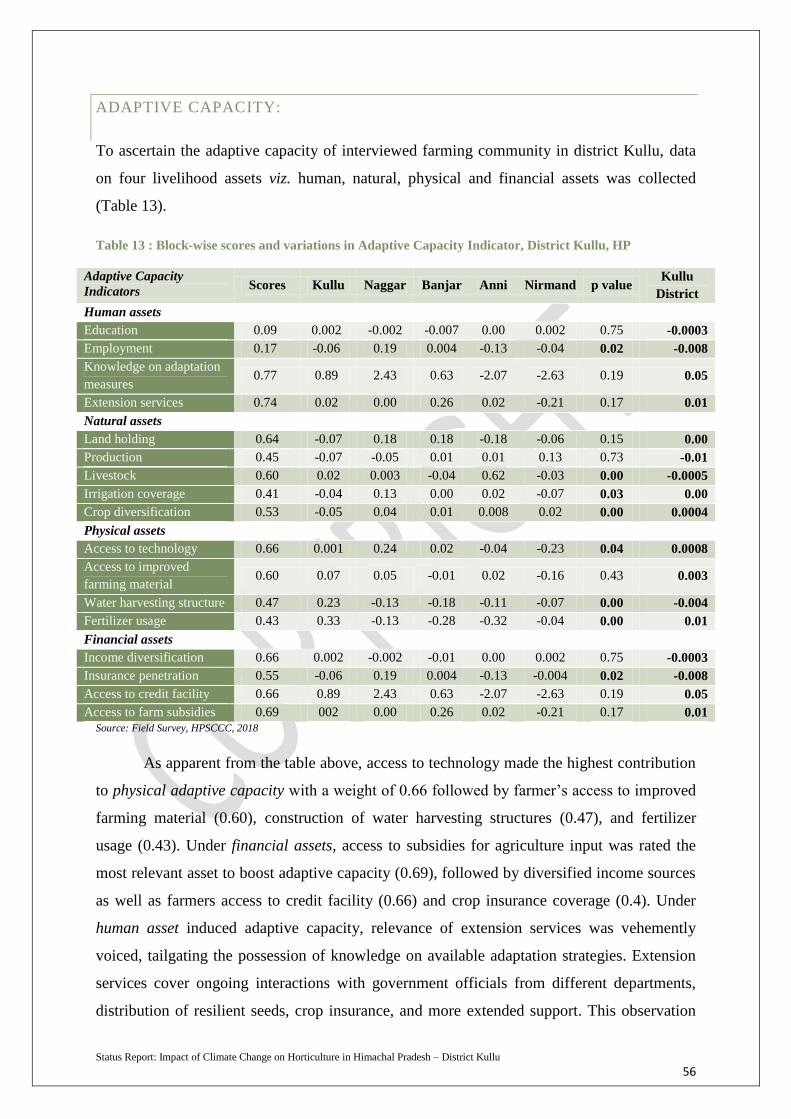
Status Report: Impact of Climate Change on Horticulture in Himachal Pradesh – District Kullu
56
ADAPTIVE CAPACITY:
To ascertain the adaptive capacity of interviewed farming community in district Kullu, data
on four livelihood assets viz. human, natural, physical and financial assets was collected
(Table 13).
Table 13 : Block-wise scores and variations in Adaptive Capacity Indicator, District Kullu, HP
Adaptive Capacity
Indicators Scores Kullu Naggar Banjar Anni Nirmand p value
Kullu
District
Human assets
Education 0.09 0.002 -0.002 -0.007 0.00 0.002 0.75 -0.0003
Employment 0.17 -0.06 0.19 0.004 -0.13 -0.04 0.02 -0.008
Knowledge on adaptation
measures 0.77 0.89 2.43 0.63 -2.07 -2.63 0.19 0.05
Extension services 0.74 0.02 0.00 0.26 0.02 -0.21 0.17 0.01
Natural assets
Land holding 0.64 -0.07 0.18 0.18 -0.18 -0.06 0.15 0.00
Production 0.45 -0.07 -0.05 0.01 0.01 0.13 0.73 -0.01
Livestock 0.60 0.02 0.003 -0.04 0.62 -0.03 0.00 -0.0005
Irrigation coverage 0.41 -0.04 0.13 0.00 0.02 -0.07 0.03 0.00
Crop diversification 0.53 -0.05 0.04 0.01 0.008 0.02 0.00 0.0004
Physical assets
Access to technology 0.66 0.001 0.24 0.02 -0.04 -0.23 0.04 0.0008
Access to improved
farming material 0.60 0.07 0.05 -0.01 0.02 -0.16 0.43 0.003
Water harvesting structure 0.47 0.23 -0.13 -0.18 -0.11 -0.07 0.00 -0.004
Fertilizer usage 0.43 0.33 -0.13 -0.28 -0.32 -0.04 0.00 0.01
Financial assets
Income diversification 0.66 0.002 -0.002 -0.01 0.00 0.002 0.75 -0.0003
Insurance penetration 0.55 -0.06 0.19 0.004 -0.13 -0.004 0.02 -0.008
Access to credit facility 0.66 0.89 2.43 0.63 -2.07 -2.63 0.19 0.05
Access to farm subsidies 0.69 002 0.00 0.26 0.02 -0.21 0.17 0.01
Source: Field Survey, HPSCCC, 2018
As apparent from the table above, access to technology made the highest contribution
to physical adaptive capacity with a weight of 0.66 followed by farmer’s access to improved
farming material (0.60), construction of water harvesting structures (0.47), and fertilizer
usage (0.43). Under financial assets, access to subsidies for agriculture input was rated the
most relevant asset to boost adaptive capacity (0.69), followed by diversified income sources
as well as farmers access to credit facility (0.66) and crop insurance coverage (0.4). Under
human asset induced adaptive capacity, relevance of extension services was vehemently
voiced, tailgating the possession of knowledge on available adaptation strategies. Extension
services cover ongoing interactions with government officials from different departments,
distribution of resilient seeds, crop insurance, and more extended support. This observation
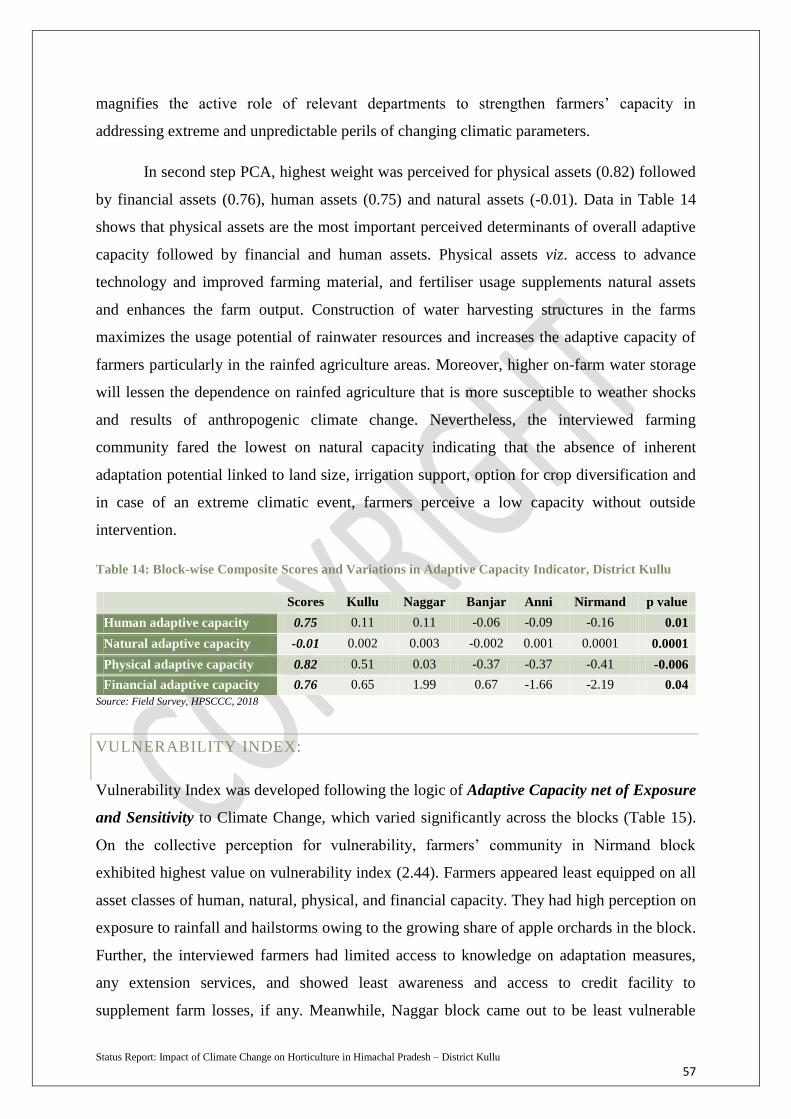
Status Report: Impact of Climate Change on Horticulture in Himachal Pradesh – District Kullu
57
magnifies the active role of relevant departments to strengthen farmers’ capacity in
addressing extreme and unpredictable perils of changing climatic parameters.
In second step PCA, highest weight was perceived for physical assets (0.82) followed
by financial assets (0.76), human assets (0.75) and natural assets (-0.01). Data in Table 14
shows that physical assets are the most important perceived determinants of overall adaptive
capacity followed by financial and human assets. Physical assets viz. access to advance
technology and improved farming material, and fertiliser usage supplements natural assets
and enhances the farm output. Construction of water harvesting structures in the farms
maximizes the usage potential of rainwater resources and increases the adaptive capacity of
farmers particularly in the rainfed agriculture areas. Moreover, higher on-farm water storage
will lessen the dependence on rainfed agriculture that is more susceptible to weather shocks
and results of anthropogenic climate change. Nevertheless, the interviewed farming
community fared the lowest on natural capacity indicating that the absence of inherent
adaptation potential linked to land size, irrigation support, option for crop diversification and
in case of an extreme climatic event, farmers perceive a low capacity without outside
intervention.
Table 14: Block-wise Composite Scores and Variations in Adaptive Capacity Indicator, District Kullu
Scores Kullu Naggar Banjar Anni Nirmand p value
Human adaptive capacity 0.75 0.11 0.11 -0.06 -0.09 -0.16 0.01
Natural adaptive capacity -0.01 0.002 0.003 -0.002 0.001 0.0001 0.0001
Physical adaptive capacity 0.82 0.51 0.03 -0.37 -0.37 -0.41 -0.006
Financial adaptive capacity 0.76 0.65 1.99 0.67 -1.66 -2.19 0.04
Source: Field Survey, HPSCCC, 2018
VULNERABILITY INDEX:
Vulnerability Index was developed following the logic of Adaptive Capacity net of Exposure
and Sensitivity to Climate Change, which varied significantly across the blocks (Table 15).
On the collective perception for vulnerability, farmers’ community in Nirmand block
exhibited highest value on vulnerability index (2.44). Farmers appeared least equipped on all
asset classes of human, natural, physical, and financial capacity. They had high perception on
exposure to rainfall and hailstorms owing to the growing share of apple orchards in the block.
Further, the interviewed farmers had limited access to knowledge on adaptation measures,
any extension services, and showed least awareness and access to credit facility to
supplement farm losses, if any. Meanwhile, Naggar block came out to be least vulnerable

Status Report: Impact of Climate Change on Horticulture in Himachal Pradesh – District Kullu
58
block of the district with minimum exposure and sensitivity and higher adaptive capacity
followed by Banjar and Kullu, whereas, Nirmand and Anni blocks were observed with high
perceived vulnerability due to low adaptive capacity (figure 18)
To conclude, District Kullu had low exposure (-0.002), sensitivity (-0.01) and
marginal adaptive capacity (0.04) to climate change induced variations with respect to
horticulture activity (similar to agriculture), thus fared toward the lower spectrum of
vulnerability index. The output is supported by the results of district-level mapping in the
State’s Action Plan on Climate Change, (2012), which reported low to medium level
exposure and sensitivity on observed climate data with low adaptation capacity for the
district. The report rates District Kullu on medium level of vulnerability based on1960-1990
database at global level.
Table 15: Block-wise Vulnerability Index – Exposure and Sensitivity net of Adaptive Capacity, District
Kullu, HP
Kullu Naggar Banjar Anni Nirmand District
Exposure 0.86 -0.05 -1.26 -0.16 -0.41 -0.002
Sensitivity 0.19 -0.52 -0.18 0.01 0.10 -0.01
Adaptive capacity 1.27 2.13 0.25 -2.13 -2.75 0.04
Vulnerability Index -0.22 -2.70 -1.69 1.98 2.44 -0.052
Source: Field Survey, HPSCCC, 2018
Figure 18: Block-wise Vulnerability Index – Exposure and Sensitivity net of Adaptive Capacity, District Kullu, HP Source: Field Survey, HPSCCC, 2018
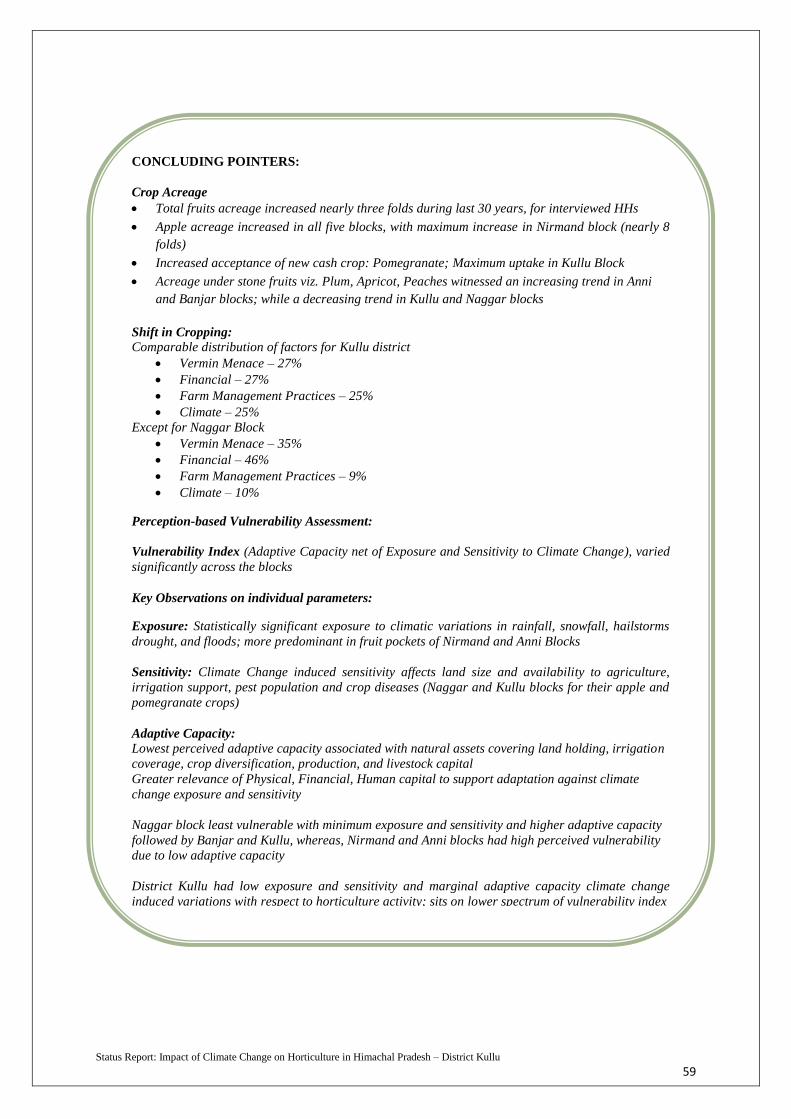
Status Report: Impact of Climate Change on Horticulture in Himachal Pradesh – District Kullu
59
CONCLUDING POINTERS:
Crop Acreage
Total fruits acreage increased nearly three folds during last 30 years, for interviewed HHs
Apple acreage increased in all five blocks, with maximum increase in Nirmand block (nearly 8
folds)
Increased acceptance of new cash crop: Pomegranate; Maximum uptake in Kullu Block
Acreage under stone fruits viz. Plum, Apricot, Peaches witnessed an increasing trend in Anni
and Banjar blocks; while a decreasing trend in Kullu and Naggar blocks
Shift in Cropping:
Comparable distribution of factors for Kullu district
Vermin Menace – 27%
Financial – 27%
Farm Management Practices – 25%
Climate – 25%
Except for Naggar Block
Vermin Menace – 35%
Financial – 46%
Farm Management Practices – 9%
Climate – 10%
Perception-based Vulnerability Assessment:
Vulnerability Index (Adaptive Capacity net of Exposure and Sensitivity to Climate Change), varied
significantly across the blocks
Key Observations on individual parameters:
Exposure: Statistically significant exposure to climatic variations in rainfall, snowfall, hailstorms
drought, and floods; more predominant in fruit pockets of Nirmand and Anni Blocks
Sensitivity: Climate Change induced sensitivity affects land size and availability to agriculture,
irrigation support, pest population and crop diseases (Naggar and Kullu blocks for their apple and
pomegranate crops)
Adaptive Capacity:
Lowest perceived adaptive capacity associated with natural assets covering land holding, irrigation
coverage, crop diversification, production, and livestock capital
Greater relevance of Physical, Financial, Human capital to support adaptation against climate
change exposure and sensitivity
Naggar block least vulnerable with minimum exposure and sensitivity and higher adaptive capacity
followed by Banjar and Kullu, whereas, Nirmand and Anni blocks had high perceived vulnerability
due to low adaptive capacity
District Kullu had low exposure and sensitivity and marginal adaptive capacity climate change
induced variations with respect to horticulture activity; sits on lower spectrum of vulnerability index
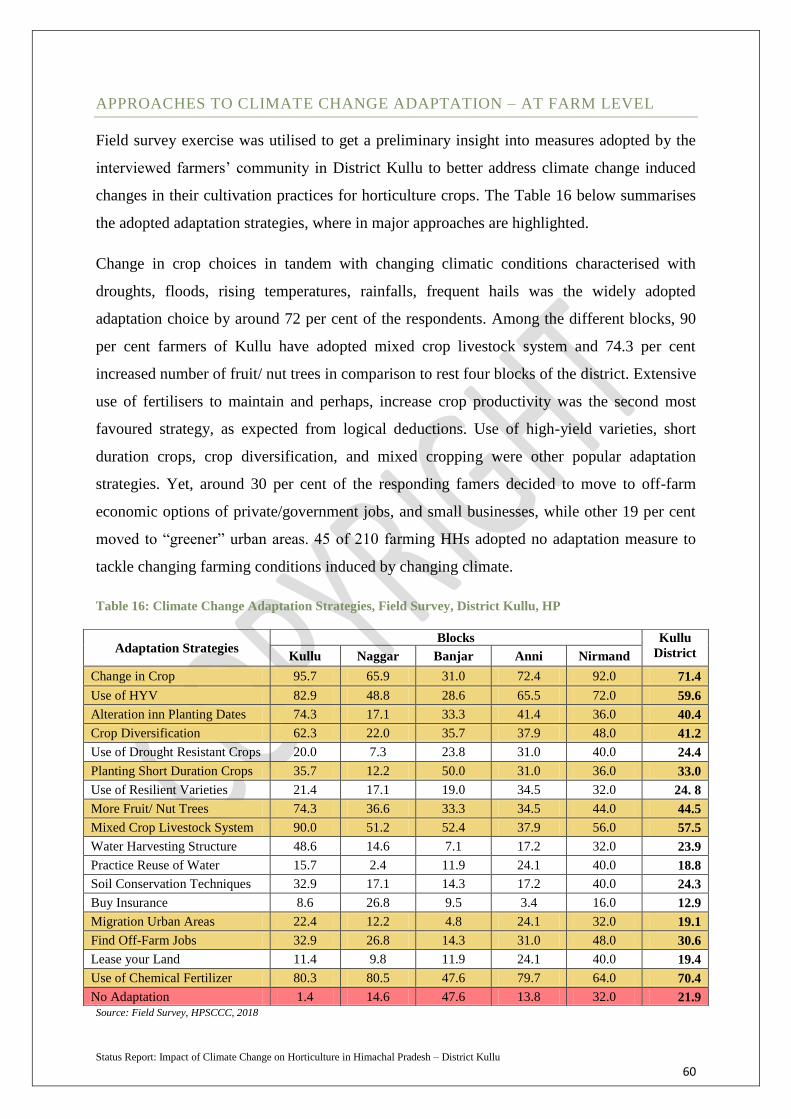
Status Report: Impact of Climate Change on Horticulture in Himachal Pradesh – District Kullu
60
APPROACHES TO CLIMATE CHANGE ADAPTATION – AT FARM LEVEL
Field survey exercise was utilised to get a preliminary insight into measures adopted by the
interviewed farmers’ community in District Kullu to better address climate change induced
changes in their cultivation practices for horticulture crops. The Table 16 below summarises
the adopted adaptation strategies, where in major approaches are highlighted.
Change in crop choices in tandem with changing climatic conditions characterised with
droughts, floods, rising temperatures, rainfalls, frequent hails was the widely adopted
adaptation choice by around 72 per cent of the respondents. Among the different blocks, 90
per cent farmers of Kullu have adopted mixed crop livestock system and 74.3 per cent
increased number of fruit/ nut trees in comparison to rest four blocks of the district. Extensive
use of fertilisers to maintain and perhaps, increase crop productivity was the second most
favoured strategy, as expected from logical deductions. Use of high-yield varieties, short
duration crops, crop diversification, and mixed cropping were other popular adaptation
strategies. Yet, around 30 per cent of the responding famers decided to move to off-farm
economic options of private/government jobs, and small businesses, while other 19 per cent
moved to “greener” urban areas. 45 of 210 farming HHs adopted no adaptation measure to
tackle changing farming conditions induced by changing climate.
Table 16: Climate Change Adaptation Strategies, Field Survey, District Kullu, HP
Source: Field Survey, HPSCCC, 2018
Adaptation Strategies Blocks Kullu
District Kullu Naggar Banjar Anni Nirmand
Change in Crop 95.7 65.9 31.0 72.4 92.0 71.4
Use of HYV 82.9 48.8 28.6 65.5 72.0 59.6
Alteration inn Planting Dates 74.3 17.1 33.3 41.4 36.0 40.4
Crop Diversification 62.3 22.0 35.7 37.9 48.0 41.2
Use of Drought Resistant Crops 20.0 7.3 23.8 31.0 40.0 24.4
Planting Short Duration Crops 35.7 12.2 50.0 31.0 36.0 33.0
Use of Resilient Varieties 21.4 17.1 19.0 34.5 32.0 24. 8
More Fruit/ Nut Trees 74.3 36.6 33.3 34.5 44.0 44.5
Mixed Crop Livestock System 90.0 51.2 52.4 37.9 56.0 57.5
Water Harvesting Structure 48.6 14.6 7.1 17.2 32.0 23.9
Practice Reuse of Water 15.7 2.4 11.9 24.1 40.0 18.8
Soil Conservation Techniques 32.9 17.1 14.3 17.2 40.0 24.3
Buy Insurance 8.6 26.8 9.5 3.4 16.0 12.9
Migration Urban Areas 22.4 12.2 4.8 24.1 32.0 19.1
Find Off-Farm Jobs 32.9 26.8 14.3 31.0 48.0 30.6
Lease your Land 11.4 9.8 11.9 24.1 40.0 19.4
Use of Chemical Fertilizer 80.3 80.5 47.6 79.7 64.0 70.4
No Adaptation 1.4 14.6 47.6 13.8 32.0 21.9

Status Report: Impact of Climate Change on Horticulture in Himachal Pradesh – District Kullu
61
ADAPTATION STRATEGIES CONSTRAINTS– FARM LEVEL PERCEPTIONS
With an idea to capture ground reality in policy recommendations to be furnished from this
status report, farmers were asked to elucidate on challenges faced in their adaptation to
climate change. Interestingly, it was the role of government as an enabler that emerged as a
unanimous category of concern reflected in – absence (no-awareness) of government policy
on climate change, insufficient reach of extension services to enable knowledge on
adaptation measures, credit facilities, and government subsidies. Additionally, lack of access
to appropriate technology and its misfit with indigenous methods of cultivation, and
perceived high cost of adaptation measures compared to farmer’s marginalised socio-
economic profile, difficult operational terrain and inability to access climate resilient and
pocket friendly crop varieties were some of the other cited concerns.

Status Report: Impact of Climate Change on Horticulture in Himachal Pradesh – District Kullu
62
CHAPTER 6 – CONCLUSION & RECOMMENDATIONS
The status report was designed to elucidate statistical and perceptive impact of climate
change in Himachal Pradesh with a study focused in District Kullu. Both approaches
identified climate change as an instrumental component in observed shift in cropping patterns
and productivity, nevertheless its absolute impact could perhaps be ascertained through field
experiments and in-situ simulation studies, which was not within the scope of the study.
Higher variability in climatic parameters of temperature and rainfall was observed
during the flowering period as compared to pre-flowering and fruit setting and development
phenological stages from 1990 to 2016. During flowering period mean minimum and
maximum temperature increased by 0.04°C, 0.12°C per year respectively and rainfall
decreased by 6.17 mm per year. Meanwhile, the mean maximum temperature increased by
0.04°C per year during the pre-flowering period. Higher anomalies in maximum and
minimum temperature were reported during all three phenological stages indicating an
overall warming trend. Meanwhile, variations in rainy days showed significant increase of
0.17 during fruit setting and development stage only i.e. May to August.
The statistical assessment of variations in climatic parameters of temperature and
rainfall with changes in horticulture productivity registered maximum impact during the pre-
flowering phenological stage i.e. for four fruit crops – Apple (with maximum and diurnal
temperature, rainfall), Pear (with maximum and diurnal temperature, rainfall), Cherry (with
minimum temperature), and Almond (with maximum temperature and rainfall) variations in
productivity exhibited statistically significant correlation with changes in considered climatic
parameters of temperature and rainfall during pre-flowering stage; while for flowering stage
and fruit setting stage fewer statistically significant correlation was witnessed between fruit
crops productivity and climatic parameters. Rainy days variations did not hold statistically
significant relationship with productivity of any of the fruit crops during any of the
phenological stages.
Amongst all studied crops, Apple productivity showed maximum sensitivity to
climatic variations during all three stages (31%, 19%, 21%) with significant correlation
observed for Pear (35%, 9%, 10%), Almond (20%, 13%, 27%), Plum (19%, 18%, 1%),
Pomegranate (6%, 8%, 24%), Apricot (3%, 14%, 29%), and Cherry (13%, 16%, 8%). With
respect to individual crops, this means that the observed variations in productivity for Apple
Status Report: Impact of Climate Change on Horticulture in Himachal Pradesh – District Kullu
63
crop from 1990-2016 is explained by the changes in climatic parameters only to the extent of
31 % during pre-flowering stage, 19% during the flowering stage, and 21% during the fruit
setting and development stage. Similar interpretations are valid for Pear, Almond, Plum,
Pomegranate, Apricot, and Cherry. Meanwhile, the productivity of Walnut was least
influenced by the changes in climatic parameters across all phenological stages (2% at pre-
flowering stage; 3% at flowering; and 15% at the fruit setting and development stage).
Remaining variability can be attributed to other factors of farming techniques, orchard
management, vermin menace, etc.
The farm-level perception-based vulnerability assessment helped in extracting other
plausible intervening factors responsible for variations in cropping patterns. These in-depth
interviews with the farming community from the five blocks in District Kullu indicated an
increase in total fruits acreage nearly three folds (1.96 bigha to 6.12 bigha per household)
during last 30 years. For the interviewed farming HHs, apple acreage increased in all five
blocks, with maximum increase in Nirmand block (nearly 8 folds); while, an increased
acceptance of pomegranate was also registered with maximum uptake in Kullu Block.
Acreage under stone fruits viz. plum, apricot, peaches also increased but only in Anni and
Banjar Blocks of District Kullu. These shifts in crop cultivation were driven by comparable
influences from changing climatic conditions, vermin menace, financial outputs, and access
to better farm practices. This outcome is in sync with the findings from the statistical analysis
that gave limited explanatory quotient to varying climatic patterns. The vulnerability index,
created on perceptions of interviewed 210 farming HHs on exposure and sensitivity to
climate change net of their adaptive capacities (human, natural, financial, and physical),
positioned District Kullu on the lower spectrum of vulnerability and risk.
The study qualified the results of statistical trend of climatic variables during the three
phenological stages vis-à-vis horticulture crop productivity juxtaposed with a perception-
based assessment, however, it demands field based experimental validation and simulation
exercises to plug-in data gaps, inaccuracies, inconsistencies, and a large scale assessment of
population capturing varying altitude gradient in the state.
Status Report: Impact of Climate Change on Horticulture in Himachal Pradesh – District Kullu
64
POLICY RECOMMENDATIONS:
RESEARCH:
Coordinated efforts are suggested to government agencies operating at interplay of
horticulture, science & technology, and environmental concerns to fund and support field
level experiments and simulation studies for a better understanding on direct and indirect
impact of changing climatic parameters on cropping patterns. Strategic research is advised on
development of resilient crop varieties, appropriate soil conservation and water management
measures with specific focus on elevation extremes in the State.
GOVERNMENT SUPPORT:
Continuous access to extension services is critical for ensuring robust and resilient farm level
adaption to climate change. While farmers improvise indigenous techniques in response to
changing climatic conditions (often misunderstood as weather patterns), they unequivocally
and vehemently voice the need for sustained government support for clarity on policies and
schemes, latest technology and crop varieties, subsidies and credit facilities. Departments are
urged to apply accountable checks and balances in assessing the reach (impact) of their
interventions and if required adopt a hand-holding approach to help farmers integrate resilient
techniques in their farming practice.
CAPACITY BUILDING:
In addition to the farming community, sensitisation and skill development is imperative for
the field level and local extension officers by engaging them in a wider range of initiation
topics of cultivation practices, seeds selection, soil and water management, and more
importantly skills to capture and internalise farmers’ sentiments and perceptions into climate
change policy and interventions.
ANIMAL MENACE:
Crop damage by vermin especially monkeys is one of the biggest crop damage exposure for
farmers in the State. As per estimates of the Department of Agriculture, and Horticulture,
Status Report: Impact of Climate Change on Horticulture in Himachal Pradesh – District Kullu
65
around 1.56 lacs ha of cultivated area is affected by this detrimental menace, representing up
to 89 per cent of yield loss in extreme cases. Unfortunately, prevalent practice of manual
guarding does not provide complete protection and other devised strategies of simians
sterilisation also remain ineffective. Thus, it was cited as the top reason for shifting crop
varieties in District Kullu. Coordinated state government intervention is desired for effective
implementation and adoption of different schemes such as Mukhya Mantri Khet Sanrakhan
Yojana designed to subsidise installation of solar and regular electric fencing.

Status Report: Impact of Climate Change on Horticulture in Himachal Pradesh – District Kullu
66
BIBLIOGRAPHY
AGRICOOP, 2012. Agriculture Contingency Plan for District: KULLU. [Online] Available at:
http://agricoop.nic.in/sites/default/files/HP5-Kullu-31.12.2012.pdf [Accessed 25 September 2018].
Alwang, J., Siegel, P.B. & L., J.S., 2001. Vulnerability: A View from Different Disciplines. Discussion Paper
Series No. 0115. Washington DC: World Bank Social Protection Unit.
Anon., n.d.
Ashutosh, K. et al., 2018. Policy Brief: State of Himalayan glaciers and future projections. [Online] Available
at:
https://www.researchgate.net/publication/323991338_Policy_Brief_State_of_Himalayan_glaciers_and_future_p
rojections [Accessed 24 September 2018].
Bhagat, R.M., Singh, S. & Kumar, V., 2006. Agro-Ecological Zonation of Himachal Pradesh - Agricultural
System Information Development at Micro-Level. Study Report. Palampur: Centre for Geo-informatics, CSK
Himachal Pradesh Agricultural University.
Bhutiyani, M.R., Kale, V.S. & Pawar, N.J., 2007. Long Term Trends in Maximum, Minimum and Mean Annual
Air Temperature across the North-western Himalayas During the Twentieth Century. Climatic Change, 85(1-2),
pp.159-77.
Brooks, N., 2003. Vulnerability, risk and adaptation: A conceptual framework. Tyndall Centre for Climate
Change Research, Working Paper No. 38.
Brooks, N., Adger, N. & Kelly, P., 2005. The determinants of vulnerability and adaptive capacity at the national
level and the implications for adaptation. Global Environmental Change, 15(2), pp.151-63.
Bruijnzeel, L.A., 2004. Hydrological functions of tropical forests: not seeing the soil for the trees? Agriculture,
Ecosystems & Environment, September. pp.185-228.
Caprio, J.M. & Quamme, H.A., 2005. Influence of Weather on Apricot, Peach, and Sweet Cherry Production in
the Okanagan Valley of British Columbia. Canadian Journal of Plant Sciences, 86, pp.259-67.
Census, 2011. District Census Handbook - Kullu. [Online] Available at:
http://censusindia.gov.in/2011census/dchb/0204_PART_A_DCHB_KULLU.pdf [Accessed 24 September
2018].
Chmielewski, F.M. & Rötzer, T., 2001. Response of tree phenology to climate change across Europe.
Agricultural and Forest Meteorology, 108, pp.101-12.
Choudhary, M.L., Patel, V.B., Siddiqui, M.W. & Mahsi, S.S., 2015. Climate Dynamics in Horticultural Science,
Volume One: Principles and Applications. 1st ed. Apple Academic Press.
Climate Change R, n.d. [Online].
Coakley, S.M., Scherm, H. & Chakraborty, S., 1999. Climate change and plant disease management. Annual
Review of Phytopathology, 37, pp.399-426.
Cosmulescu, S., Baciu, A., Cichi, M. & Gruia, M., 2010. The Effect of Climate Changes on Phenological
Phases in Plum Tree (Prunus domestica L.) in South-Western Romania. South Western Journal of Horticulture,
Biology and Environment, 1(1), pp.9-20.
Crepinsek, Z. & Bogataj-Kajfez, L., 2004. Effect of air temperature increase on changes in temperatures and
length of growing season. In Hudina, D.M., Colaric, M. & Trobec, M., eds. International Slovenian Fruit
Congress. Ljubljana, 2004. Experimental Fruit Growing Association of Slovenia.
Status Report: Impact of Climate Change on Horticulture in Himachal Pradesh – District Kullu
67
DESTHP, 2012. State Strategy & Action Plan on Climate Change. Status Report. Department of Environment,
Science & Technology, Government of Himachal Pradesh.
Economic Survey, 2018. Climate, Climate Change, and Agriculture. [Online] Available at:
http://mofapp.nic.in:8080/economicsurvey/pdf/082-101_Chapter_06_ENGLISH_Vol_01_2017-18.pdf
[Accessed 24 September 2018].
ENVIS Centre, Himachal Pradesh, 2016. Horticulture. [Online] Available at:
http://hpenvis.nic.in/Database/Horticulture_4022.aspx [Accessed 22 October 2018].
Forrest, J. et al., 2012. Conservation and Climate Change: Assessing the Vulnerability of Snow Loepard Habitat
to Treeline Shift in the Himalaya. Biological Conservation, 150(1), pp.129-35.
Gammans, M., Mérel, P. & Ortiz-Bobea, A., 2017. Negative Impacts of Climate Change on Cereal Yields:
Statistical Evidence from France. Environmental Research Letters, 12(5).
Gautam, D., Sharma, G. & Jindal, K., 2004. Fruit Setting Problems of Apples under changing climatic scenario
of north-western Himalayas of India. ISHS Acta Horticulturae 662: VII International Symposium on Temperate
Zone Fruits in the Tropics and Subtropics., pp.435-41. DOI: 10.17660/ActaHortic.2004.662.66.
Gornall, J. et al., 2010. Implications of climate change for agricultural productivity in the early twenty-first
century. Philosophical Transactions of the Royal Society B. Biological Sciences, 365(1554), pp.2973-89.
Goswami, S., 2017. Climate change impact on agriculture leads to 1.5 per cent loss in India’s GDP. [Online]
Available at: https://www.downtoearth.org.in/news/climate-change-causes-about-1-5-per-cent-loss-in-india-s-
gdp-57883 [Accessed 24 September 2018].
Hinkel, J., 2011. indicators of Vulnerability and Adaptive Capacity: Towards a clarification of the science-
policy interface. Global Environmental Change, 21(1), pp.198-208.
HPAGRISNET, 2017. HORTICULTURE DEVELOPMENT IN HIMACHAL PRADESH AT A GLANCE.
[Online] Available at: http://hpagrisnet.gov.in/hpagris/Horticulture/Default.aspx?SiteID=5&PageID=1219
[Accessed 22 October 2018].
IBEF, 2018. Indian Agriculture Industry Analysis. [Online] IBEF Available at:
https://www.ibef.org/industry/agriculture-presentation [Accessed 22 October 2018].
IHCAP, 2015. Vulnerability, Hazards and Risk: An Integrated Pilot Study in Kullu District, Himachal Pradesh.
Status Report. Indian Himalayas Climate Change Adaptation Programme.
IPCC, 2007. Climate Change 2007: Impacts, Adaptation and Vulnerability. UK: Cambridge University Press
IPCC.
IPCC, 2007. IPCC Fourth Assessment Report: Climate Change 2007. [Online] Available at:
https://www.ipcc.ch/publications_and_data/ar4/wg1/en/ch11s11-4-3.html [Accessed 22 October 2018].
IPCC, 2014. Climate Change 2014: Impacts, Adaptation, and Vulnerability. UK: Cambridge University Press
IPCC.
Jindal, K.K. & Chauhan, P.S.a.M.M.S., 2001. Apple productivity in relations to Environmental Components. In
K.K. Jindal & D.R. Gautam, eds. Productivity of temperate fruits. pp.12-20.
Joshi, N.P., Maharajan, K.L. & Piya, L., 2011. Effects of Climate Variables on Yield of Major Food Crops in
Nepal: A Time Series Analysis. Journal of Contemporary Indian Studies: Space and Society, Hiroshima
University, 1, pp.19-26.
Kaur, P. et al., 2011. Quantitative Evaluation of Weather Variability and Rice Yields in Punjab – A Case Study.
Journal of Research, Punjab University, 48(1-2), pp.5-15.
Kelly, P. & Adger, W., 2000. Theory and Pactice in Assessing Vulnerability to Climate Change and Facilitating
Adaptation. Climatic Change, 47, pp.325-52.
Status Report: Impact of Climate Change on Horticulture in Himachal Pradesh – District Kullu
68
Klein, T., Holzkämper, A. & Calanca, P.e.a., 2014. Adaptation options under climate change for multifunctional
agriculture: a simulation study for western Switzerland. Regonal Environmental Change, 14(1), pp.167-84.
Koudahe, K. et al., 2017. Trend Analysis in Standardized Precipitation Index and Standardized Anomaly Index
in the Context of Climate Change in Southern Togo. Atmospheric and Climate Science, 7, pp.401-23.
https://doi.org/10.4236/acs.2017.74030.
Kumar, K. & Parikh, J., 2001. Indian agriculture and climate sensitivity. Global Environmental Change, 11,
pp.147-54.
Kumar, P.R. et al., 2009. Impact of Climate Change on Seed Production of Cabbage in North Western
Himalayas. World Journal of Agricultural Sciences, 5(1), pp.18-26.
Kwon, J.H., Park, H.Y., Jun, J.H. & Lee, H.J., 2008. Changes of sugar composition and related enzyme
activities of ‘Kansuki Hakuto’ and ‘Kurakatawase’ peach after rainfall. Horticulture Environment
Biotechnology, 49, pp.85-89.
Lang, G.A., 2001. Intensive Sweet Cherry Orchard Systems – Rootstocks, Vigor, Precocity, Productivity and
Management. The Compact Fruit Tree , 34(1), pp.23-26.
Malhotra, S., 2017. Horticultural crops and climate change: A review. Indian Journal of Agricultural Sciences,
87(1), pp.12-22.
Mboup, M. et al., 2012. Genetic structure and local adaptation of European wheat yellow rust populations: The
role of temperature-specific adaptation. Evolutionary Applicatoins, 5(4), pp.341-52.
Mendelsohn, R. & Dinar, A., 1999. Climate change, agriculture, and developing countries: Does adaptation
matter? The World Bank Research Observer, 14, pp.277-93.
Mendelsohn, R., Dinar, A. & Sanghi, A., 2011. The effect of development on the climate sensitivity of
agriculture. Environment and Development Economics, 6, pp.85-101.
Mishra, S.K. et al., 2015. Sensitivity Analysis of Four Wheat Cultivars to Varying Photoperiod and Temperature
at Different Phenological Stages using WOFOST Model. Jpurnal of Agrometeorology, 17(1), pp.74-79.
MoSPI, 2016. Success Story & Policy Issues of Farmer's Welfare (Horticulture Sector) in Himachal. [Online]
Available at: http://mospi.nic.in/sites/default/files/cocsso/2_HimachalPradesh.pdf [Accessed 22 October 2018].
Padma, T.V., 2014. Himalayan Plants Seek Cooler Climes. Nature: International Weekly Journal of Science,
512(7515), p.359. Available at:
https://www.nature.com/polopoly_fs/1.15771!/menu/main/topColumns/topLeftColumn/pdf/512359a.pdf.
Panday, P. & Ghimire, B., 2012. Time-series Analysis of NDVI fro AVHRR Data over the Hindu Kush-
Himalayan Region for the period 2008-2006. International Journal of Remote Sensing, 33(21), pp.6710-21.
Parmesan, C. & Yohe, G., 2003. A globally coherent fingerprint of climate change impacts across natural
systems. Nature, 421, pp.37-42.
Partap, U. & Partap, T., 2002. Warning Signals from the Apple Valleys of the Hindu Kush-Himalayas-
Productivity Concerns and Pollination Problems. Kathmandu, Nepal: International Centre for Integrated
Mountain Development.
Partap, T. & Partap, B., 2010. Mountain Farmers Adaptive Strategies in Response to Impact of Climate Change
on their Livelihood Options. In International Symposium on Benefitting from Earth Observation: Bridging the
Data Gap for Adaptation to Climate Change in the HKH Region. Kathmandu, Nepal, 2010. International Centre
for Integrated Mountain Development (ICIMOD). held during October 4-6, 2010.
PI, 2009. FAO says Food Production must Rise by 70%. [Online] Available at:
https://www.populationinstitute.org/resources/populationonline/issue/1/8/ [Accessed 24 September 2018].
Pidwirny, M., 2006. Climate Classification and Climatic Regions of the World. [Online] Available at:
http://www.physicalgeography.net/fundamentals/7v.html [Accessed 25 September 2018].
Status Report: Impact of Climate Change on Horticulture in Himachal Pradesh – District Kullu
69
Pohlert, T., 2018. Non-Parametric Trend Tests and Change-Point Detection. Technical Report.
Poudel, S. & Shaw, R., 2016. Relationship between Climate Variability and Crop Yield in a Mountaineous
Environment: A Case Study in Lamjung District, Nepal. Climate, 4(1), p.13.
Samedi, M. & Cochran, L.C., 1976. Horticulture Science, pp.10-593.
Sanchez, P., 2000. Linking climate change research with food security and poverty reduction in the tropics.
Agriculture, Ecosystemes & Enivronment, 82(1-3), pp.371-83.
Saseendran, S.A. et al., 2000. Effects of Climate Change on Rice Production in the Tropical Humid Climate of
Kerala, India. Climate Change, 44(4), pp.495-514.
Sharma, H.R., 2011. Crop Diversification in Himachal Pradesh: Patterns, Determinants and Challenges. Indian
Journal of Agricultural Economics, 66(1), pp.97-114.
Sharma, N., SD, S., S, V. & CL, S., 2013. Impact of Changing Climate on Apple Production in Kotkhai area of
Shimla District, Himachal Pradesh. International Journal of Farm Sciences, 3(1), pp.81-90.
Shekhar, M.S. et al., 2010. Climate-change studies in the western Himalaya. Annals of Glaciology, 51(54),
pp.105-12.
Shrestha, U.B., Gautam, S. & Bawa, K.S., 2012. Widespread Climate Change in the Himalayas and Associated
Changes in Local Ecosystems. [Online] Available at: https://doi.org/10.1371/journal.pone.0036741 [Accessed
22 October 2018].
Singh, J., 2003. Low productivity trends in the apple growing state of India. Himachal Pradesh: contributing
factors.. In K.K. Jindal, R. Bawa & T. Partap, eds. Apple Farming and Livelihoods in Himalayas. pp.43-58.
Singh, K.K. et al., 2015. Assessment of Climate Change Impact on Productivity of Different Crops in Varanasi,
India. Journal of Agrometeorology, 17(2), pp.179-84.
Siwar, C., Ahmed, F. & Begum, R.A., 2013. Climate change, agriculture and food security issues: Malaysian
perspective. Journal of Food, Agriculture and Environment, 11(2), pp.1118-23.
Vedwan, N. & Robert, E.R., 2001. Climate Change in the Western Himalayas of India: A Study of Local
Perception and Response. Climate Research, 19, pp.109-17.
Vishvakarma, S.C.R., Kuniyal, J.C. & Rao, K.S., 2003. Climate change and its impact on apple cropping in
Kullu Valley, North-West Himalaya. In 7th International Symposium on Temperate Zone Fruits in the Tropics
and Subtropics, 14-18 October 2003. Nauni-Solan, HP, 2003. Dr. Y.S. Parmar University of Horticulture and
Forestry.
Walker, B. & Steffen, W., 1997. An Overview of the Implications of Global Change for Natural and Managed
Terrestial Ecosystems. [Online] Available at:
https://dlc.dlib.indiana.edu/dlc/bitstream/handle/10535/3389/30.pdf?sequence=1&isAllowed=y [Accessed 24
September 2018].
Walthall, C.L. et al., 2012. Climate Change and Agriculture in United States: Effects and Adaptation. USDA
Technical Bulletin 1935, Washington. DC, p.186.
WRI, 2014. Everything You Need to Know About Agricultural Emissions. [Online] Available at:
https://www.wri.org/blog/2014/05/everything-you-need-know-about-agricultural-emissions [Accessed 24
September 2018].
WRI, 2018. By the Numbers: New Emissions Data Quantify India’s Climate Challenge. [Online] Available at:
https://www.wri.org/blog/2018/08/numbers-new-emissions-data-quantify-indias-climate-challenge [Accessed
25 October 2018].
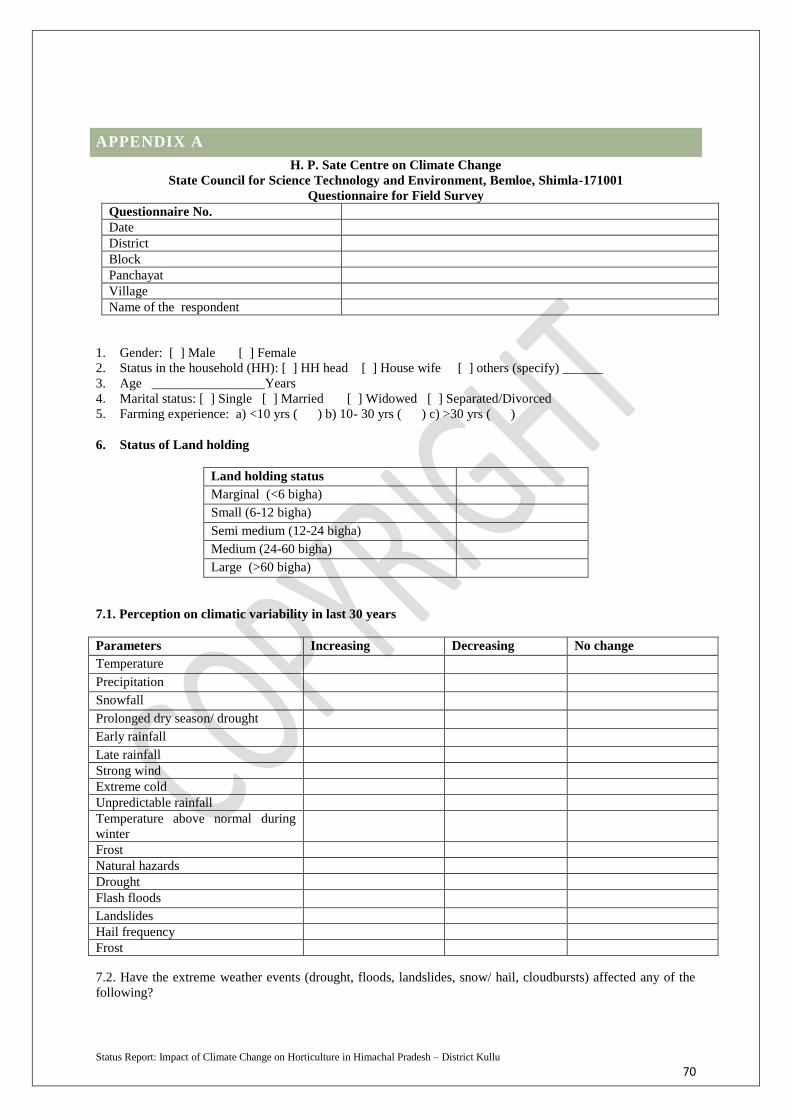
Status Report: Impact of Climate Change on Horticulture in Himachal Pradesh – District Kullu
70
APPENDIX A
H. P. Sate Centre on Climate Change
State Council for Science Technology and Environment, Bemloe, Shimla-171001
Questionnaire for Field Survey
Questionnaire No.
Date
District
Block
Panchayat
Village
Name of the respondent
1. Gender: [ ] Male [ ] Female
2. Status in the household (HH): [ ] HH head [ ] House wife [ ] others (specify) ______
3. Age _________________Years
4. Marital status: [ ] Single [ ] Married [ ] Widowed [ ] Separated/Divorced
5. Farming experience: a) <10 yrs ( ) b) 10- 30 yrs ( ) c) >30 yrs ( )
6. Status of Land holding
Land holding status
Marginal (<6 bigha)
Small (6-12 bigha)
Semi medium (12-24 bigha)
Medium (24-60 bigha)
Large (>60 bigha)
7.1. Perception on climatic variability in last 30 years
Parameters Increasing Decreasing No change
Temperature
Precipitation
Snowfall
Prolonged dry season/ drought
Early rainfall
Late rainfall
Strong wind
Extreme cold
Unpredictable rainfall
Temperature above normal during
winter
Frost
Natural hazards
Drought
Flash floods
Landslides
Hail frequency
Frost
7.2. Have the extreme weather events (drought, floods, landslides, snow/ hail, cloudbursts) affected any of the
following?
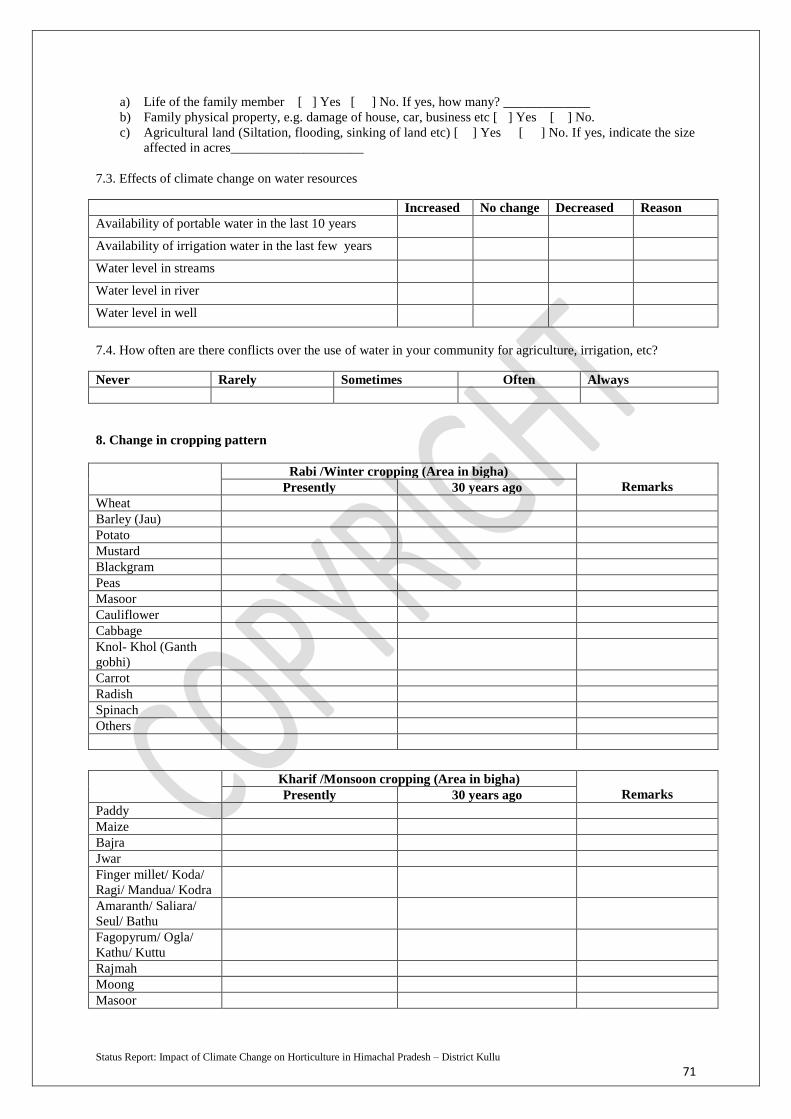
Status Report: Impact of Climate Change on Horticulture in Himachal Pradesh – District Kullu
71
a) Life of the family member [ ] Yes [ ] No. If yes, how many? _____________
b) Family physical property, e.g. damage of house, car, business etc [ ] Yes [ ] No.
c) Agricultural land (Siltation, flooding, sinking of land etc) [ ] Yes [ ] No. If yes, indicate the size
affected in acres____________________
7.3. Effects of climate change on water resources
Increased No change Decreased Reason
Availability of portable water in the last 10 years
Availability of irrigation water in the last few years
Water level in streams
Water level in river
Water level in well
7.4. How often are there conflicts over the use of water in your community for agriculture, irrigation, etc?
Never Rarely Sometimes Often Always
8. Change in cropping pattern
Rabi /Winter cropping (Area in bigha)
Remarks Presently 30 years ago
Wheat
Barley (Jau)
Potato
Mustard
Blackgram
Peas
Masoor
Cauliflower
Cabbage
Knol- Khol (Ganth
gobhi)
Carrot
Radish
Spinach
Others
Kharif /Monsoon cropping (Area in bigha)
Remarks Presently 30 years ago
Paddy
Maize
Bajra
Jwar
Finger millet/ Koda/
Ragi/ Mandua/ Kodra
Amaranth/ Saliara/
Seul/ Bathu
Fagopyrum/ Ogla/
Kathu/ Kuttu
Rajmah
Moong
Masoor

Status Report: Impact of Climate Change on Horticulture in Himachal Pradesh – District Kullu
72
Kulthi
Ginger
Turmeric
Chillies
Tomato
Capsicum
Brinjal
Beans
Soybean
Others
9a. Reason for change in cropping pattern
Reason √
Climate change
Increased Temperature
Excessive Rainfall
Monsoon failure
Drought
Hailing
Technical reasons
Small land holding
Lack of irrigation facilities
Market availability
Preferences for cash crops
If Yes, Specify the crops
Others
Availability of food grains in PDS
Monkey menace
Wild pig/ stray animal menace
Availability of high yielding varieties
9b. Reasons for low acreage under traditional crops (millets, kodo, bathu, ragi, chulai etc.)
√ Remarks
Changing food preferences
Non availability of market
Difficulty in processing
Non availability of seed
Non diversification of traditional recipes
Others
10. Effect of climate related variables on:
Increased Decreased Same Don’t know
Production
Quality of produce
Insect pest attack
Disease incidences
Pollinator population
11. Disease/ pest incidences
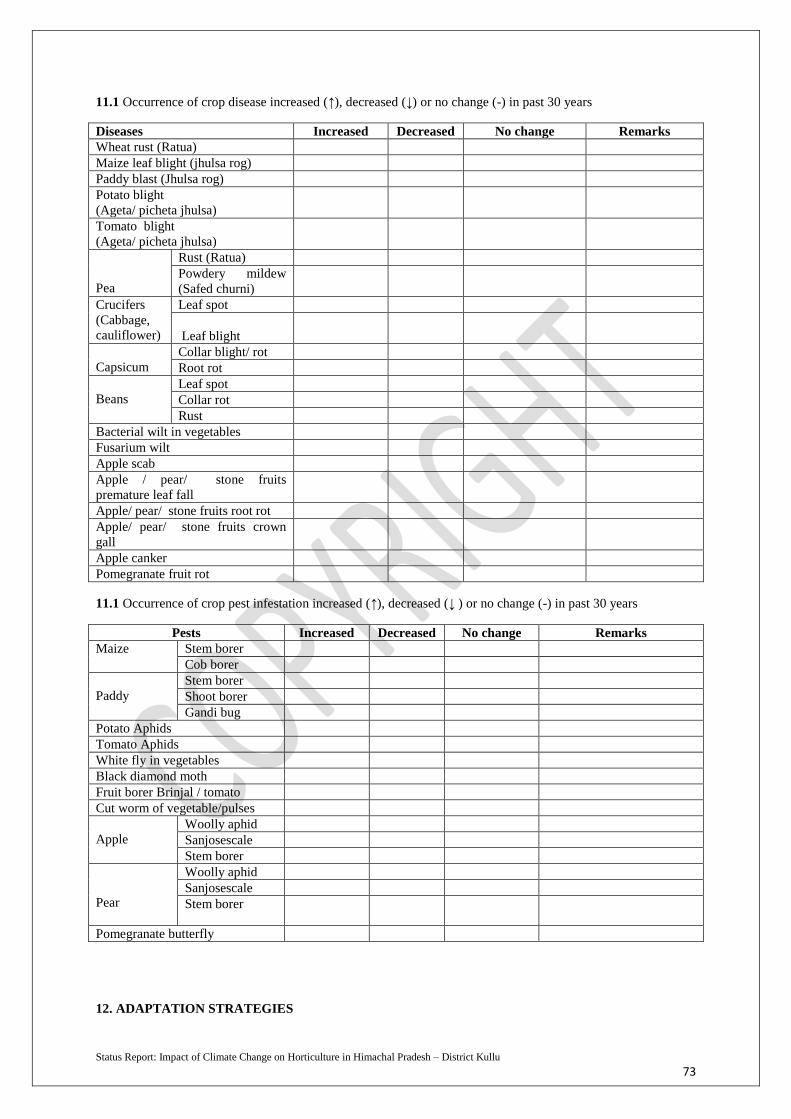
Status Report: Impact of Climate Change on Horticulture in Himachal Pradesh – District Kullu
73
11.1 Occurrence of crop disease increased (↑), decreased (↓) or no change (-) in past 30 years
Diseases Increased Decreased No change Remarks
Wheat rust (Ratua)
Maize leaf blight (jhulsa rog)
Paddy blast (Jhulsa rog)
Potato blight
(Ageta/ picheta jhulsa)
Tomato blight
(Ageta/ picheta jhulsa)
Pea
Rust (Ratua)
Powdery mildew
(Safed churni)
Crucifers
(Cabbage,
cauliflower)
Leaf spot
Leaf blight
Capsicum
Collar blight/ rot
Root rot
Beans
Leaf spot
Collar rot
Rust
Bacterial wilt in vegetables
Fusarium wilt
Apple scab
Apple / pear/ stone fruits
premature leaf fall
Apple/ pear/ stone fruits root rot
Apple/ pear/ stone fruits crown
gall
Apple canker
Pomegranate fruit rot
11.1 Occurrence of crop pest infestation increased (↑), decreased (↓ ) or no change (-) in past 30 years
Pests Increased Decreased No change Remarks
Maize Stem borer
Cob borer
Paddy
Stem borer
Shoot borer
Gandi bug
Potato Aphids
Tomato Aphids
White fly in vegetables
Black diamond moth
Fruit borer Brinjal / tomato
Cut worm of vegetable/pulses
Apple
Woolly aphid
Sanjosescale
Stem borer
Pear
Woolly aphid
Sanjosescale
Stem borer
Pomegranate butterfly
12. ADAPTATION STRATEGIES

Status Report: Impact of Climate Change on Horticulture in Himachal Pradesh – District Kullu
74
a) Have you changed the types of crops grown in your farm in the last 10 years?
[ ] Yes [ ] No
b) If yes, which of the following reasons could be the cause?
[ ] lack of sufficient moisture in the soil [ ] declining soil fertility [ ] Need to increase revenue [ ]
availability of cheap alternative crop varieties [ ] Other (specify) ___________
13.1 Which of the following adaptation strategies have you adopted in your HH?
13.2 Which of the following factors are the most important hindrances to your adaptation to climate
change?
S No. Factor Ranks
1 2 3
1. Lack of access to early warning information
2. Unreliability of seasonal forecast
4. High cost of adaptation
5. Lack of credit facilities
6. Inability to access improved crops varieties/ seeds
7. Ineffectiveness of indigenous methods
8. Lack of government subsidy on farm inputs
9. Limited knowledge on adaptation measures
10. Absence of government policy on climate change
11. Lack of extension services
S No Adaptation options Adopted?
Yes or No
Reasons for not adopting 1: lack of money, 2: lack of
information, 3: shortage of labour, 4. Lack of access to
farm inputs. 5. Lack of access to water. 6. Shortage of
land. 7.Other
1. Change in crop
2. Change in crop variety
3. Change of planting dates
4. Crop diversification
5. Use of drought resistant crops
6. Planting short season crops
7. Use of resilient crop varieties
8. Planting fruit/ nut trees
9. Mixed crop livestock system
10. Build a water-harvesting
scheme
11. Practice reuse of water
12. Implement soil conservation
Techniques
13. Buy insurance
14. Put trees for shading
15. Irrigate more
16. Migrate to urban area
17. Find off-farm job
18. Lease your land
19. Use of chemical fertilizer
20. Seeking support from veterinary
officers
21. No adaptation

Status Report: Impact of Climate Change on Horticulture in Himachal Pradesh – District Kullu
75
12. Lack of labour
13. Lack of access to water
14. Shortage of land
15. Insecure property rights
16. Lack of access to irrigation facilities
17. Lack of access to technology
18. No barriers
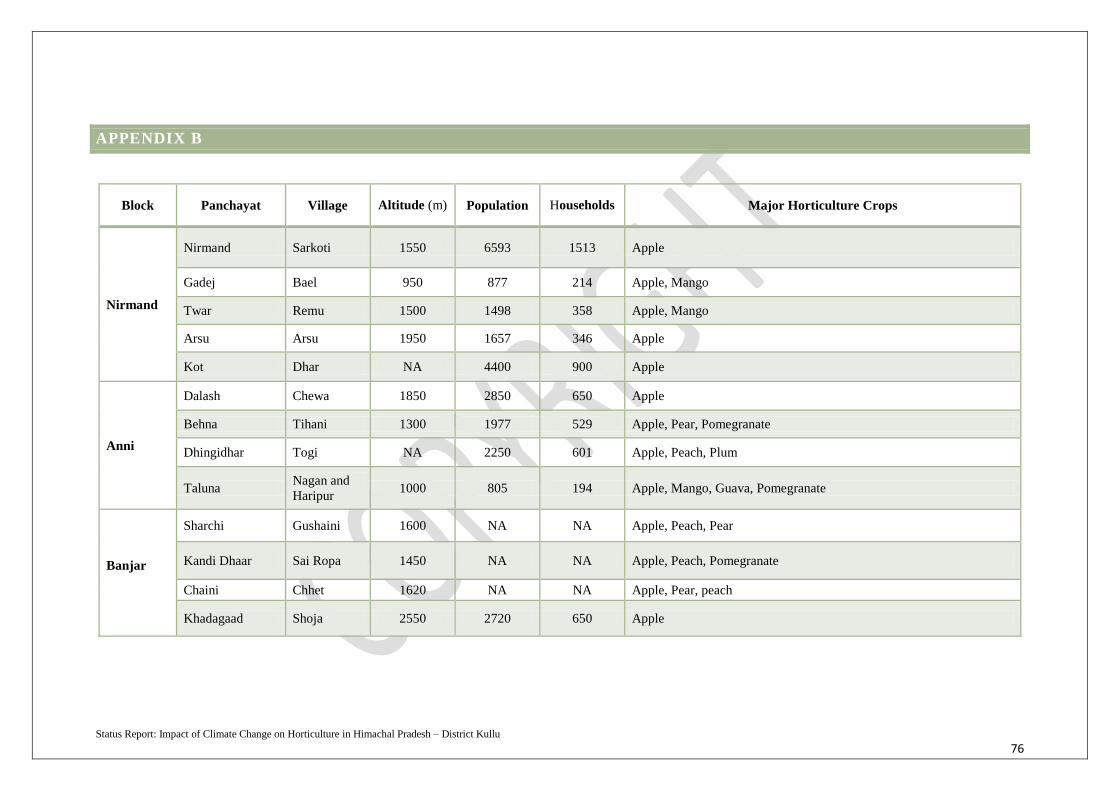
Status Report: Impact of Climate Change on Horticulture in Himachal Pradesh – District Kullu
76
APPENDIX B
Block Panchayat Village Altitude (m) Population Households Major Horticulture Crops
Nirmand
Nirmand Sarkoti 1550 6593 1513 Apple
Gadej Bael 950 877 214 Apple, Mango
Twar Remu 1500 1498 358 Apple, Mango
Arsu Arsu 1950 1657 346 Apple
Kot Dhar NA 4400 900 Apple
Anni
Dalash Chewa 1850 2850 650 Apple
Behna Tihani 1300 1977 529 Apple, Pear, Pomegranate
Dhingidhar Togi NA 2250 601 Apple, Peach, Plum
Taluna Nagan and
Haripur 1000 805 194 Apple, Mango, Guava, Pomegranate
Banjar
Sharchi Gushaini 1600 NA NA Apple, Peach, Pear
Kandi Dhaar Sai Ropa 1450 NA NA Apple, Peach, Pomegranate
Chaini Chhet 1620 NA NA Apple, Pear, peach
Khadagaad Shoja 2550 2720 650 Apple

Status Report: Impact of Climate Change on Horticulture in Himachal Pradesh – District Kullu
77
Kullu
Bhaliyani Bhaliyani 6360 2600 526 Apple, Pomegranate
NA Madgaon NA NA NA Apple, Pomegranate
Koti Sari Bhaikhali NA 2100 550 Apple, Pomegranate
Khokhan Khokhan 7923 3193 692 Apple
Hurla Hurla 7601 1805 400 Apple, Pomegranate
Jari Jari 4991 2725 584 Apple
NA Jhan NA NA NA Apple
Jha Bradha 8168 2619 527 Apple
Haat Bajaura 3625 5852 1255 Apple
NA Phatnaal NA NA NA Apple
Chang Chang NA 1900 441 Apple, Pomegranate
Ratocha Ratocha 6525 1468 265 Apple
Karzan Sajla 6039 622 144 Apple
Naggar
Kais Bishtbed NA NA NA Apple
Kais Taandla NA NA NA Apple
Shanag Goshala 5493 850 181 Apple, Pomegranate
NA Kushwa 6719 NA NA Apple
Manali Old Manali 6530 831 178 Apple, Pomegranate
Benchi Malipathar NA 2102 559 Apple
Raison Dehra Seri NA 1061 NA Apple, Plum (senta rosa)
Malipathar Malipathar NA NA NA Apple
NA Tangla NA NA NA Apple
Related Documents