THE IMPACT OF ATMOSPHERIC AEROSOL FROM BIOMASS BURNING ON AMAZON DRY-SEASON DROUGHT Suzanne L. Bevan 1 , Peter R. J. North 1 , William M. F. Grey 2 , Sietse O. Los 1 , and Stephen E. Plummer 3 1 School of the Environment and Society, Swansea University, Singleton Park, Swansea, SA2 8PP, UK, Email: [email protected] 2 Met Office, FitzRoy Road, Exeter, Devon, EX1 3PB, UK 3 International Geosphere Biosphere Programme-European Space Agency Joint Projects Office, European Space Agency, European Space Research Institute, 00044 Frascati, Italy ABSTRACT It is increasingly apparent that the future of the Amazon rainforest is under threat from both climate change and agricultural practices. Here we use a 13-year time series of (A)ATSR derived aerosol optical depth (AOD) mea- surements to examine the role of aerosols in the interac- tion between deforestation, biomass burning and drought over the Amazon. The seasonal cycle of AOD shows peaks in September and March correlated with local and more remote biomass burning, respectively. A decreas- ing trend in dry-season AOD between 1995 and 2000 and a subsequent increase from 2000 to 2004 can be ex- plained by deforestation practices driven by economic forces. Throughout the time series dry-season AODs are inversely correlated with dry-season precipitation sug- gesting a positive feedback between aerosols and drought that may contribute to enhanced drought under climate change. Key words: Aerosol; Amazon; (A)ATSR; Biomass burn- ing. 1. INTRODUCTION The Amazon rainforest plays a major role in regulating the Earth’s climate via the exchange of water, momentum and carbon between biosphere and atmosphere. However, the Amazon rainforest is under threat from both defor- estation and the effects of climate change [1, 2]. Uncer- tainties in predicting the future of the Amazon rainfor- est include anthropogenic influences such as deforesta- tion and fire [3, 4, 5]. The neglect of fire disturbance in dynamic vegetation models is likely to overestimate the robustness of tropical forests to warming and drying [1]. Forest fires increase atmospheric aerosol concentrations and these can have both regional and global impacts on the solar heating of the surface and atmosphere, and on the hydrological cycle [6, 7]. In the Amazon deforestation and biomass burning can trigger a positive feedback cycle of increased fire distur- bance and local drought conditions, amplifying drought linked to both anthropogenic global climate change and natural climate variability [8]. Two causes of drought am- plification are: 1) a reduction in moisture recirculation by a reduction in evapotranspiration and 2) rain suppression caused by elevated atmospheric aerosol concentrations. 25 to 35% of the moisture for Amazon precipitation is contributed by regional recycling [9] and modelled defor- estation leads to a significant reduction in Amazon sum- mer rainfall [7]. The aerosol effect is less clear cut. During the dry season, enhanced atmospheric aerosol concentrations are a di- rect manifestation of biomass burning — remotely sensed aerosol optical depths (AODs) averaged over a wide area in the Amazon are strongly correlated with fire activity [10]. It is these fire-associated aerosols that have the potential to affect precipitation processes. During the rainy season a positive feedback process connects warm- process precipitation wash-out of aerosol, cleaner air, fewer condensation nuclei and faster droplet coalescence [11]. In contrast, during the dry season, biomass-burning enhanced aerosol concentrations can delay the onset of precipitation to higher elevations and suppress low-level washout processes [11]. Countering this positive feed- back hypothesis is the possibility that although warm-rain processes are suppressed, biomass burning may enhance convection and intensify cold-rain processes leading to a local increase in precipitation [12]. A number of global-scale studies report a positive cor- relation between cloud fraction and AOD [13, 14, 15], however, over the Amazon region a negative correlation has also been observed [16] and modelled [17]. Evi- dence of the effect of aerosols on precipitation is much sparser [18]. In this study we generate a time series of AODs over the Amazon region from Along Track Scan- ning Radiometer (ATSR) top of atmosphere (TOA) radi- ance measurements. We analyse the seasonal signal and multi-year trends in conjunction with a regional firecount product and measured precipitation. The aim is to inves- tigate the possibility of a synergistic effect between de- _________________________________________ Proc. of the '2nd MERIS / (A)ATSR User Workshop', Frascati, Italy 22–26 September 2008 (ESA SP-666, November 2008)

Welcome message from author
This document is posted to help you gain knowledge. Please leave a comment to let me know what you think about it! Share it to your friends and learn new things together.
Transcript
THE IMPACT OF ATMOSPHERIC AEROSOL FROM BIOMASS BURNING ONAMAZON DRY-SEASON DROUGHT
Suzanne L. Bevan1, Peter R. J. North1, William M. F. Grey2, Sietse O. Los1, and Stephen E. Plummer3
1School of the Environment and Society, Swansea University, Singleton Park, Swansea, SA2 8PP, UK, Email:[email protected]
2Met Office, FitzRoy Road, Exeter, Devon, EX1 3PB, UK3International Geosphere Biosphere Programme-European Space Agency Joint Projects Office, European Space Agency,
European Space Research Institute, 00044 Frascati, Italy
ABSTRACT
It is increasingly apparent that the future of the Amazonrainforest is under threat from both climate change andagricultural practices. Here we use a 13-year time seriesof (A)ATSR derived aerosol optical depth (AOD) mea-surements to examine the role of aerosols in the interac-tion between deforestation, biomass burning and droughtover the Amazon. The seasonal cycle of AOD showspeaks in September and March correlated with local andmore remote biomass burning, respectively. A decreas-ing trend in dry-season AOD between 1995 and 2000and a subsequent increase from 2000 to 2004 can be ex-plained by deforestation practices driven by economicforces. Throughout the time series dry-season AODs areinversely correlated with dry-season precipitation sug-gesting a positive feedback between aerosols and droughtthat may contribute to enhanced drought under climatechange.
Key words: Aerosol; Amazon; (A)ATSR; Biomass burn-ing.
1. INTRODUCTION
The Amazon rainforest plays a major role in regulatingthe Earth’s climate via the exchange of water, momentumand carbon between biosphere and atmosphere. However,the Amazon rainforest is under threat from both defor-estation and the effects of climate change [1, 2]. Uncer-tainties in predicting the future of the Amazon rainfor-est include anthropogenic influences such as deforesta-tion and fire [3, 4, 5]. The neglect of fire disturbance indynamic vegetation models is likely to overestimate therobustness of tropical forests to warming and drying [1].Forest fires increase atmospheric aerosol concentrationsand these can have both regional and global impacts onthe solar heating of the surface and atmosphere, and onthe hydrological cycle [6, 7].
In the Amazon deforestation and biomass burning cantrigger a positive feedback cycle of increased fire distur-bance and local drought conditions, amplifying droughtlinked to both anthropogenic global climate change andnatural climate variability [8]. Two causes of drought am-plification are: 1) a reduction in moisture recirculation bya reduction in evapotranspiration and 2) rain suppressioncaused by elevated atmospheric aerosol concentrations.25 to 35% of the moisture for Amazon precipitation iscontributed by regional recycling [9] and modelled defor-estation leads to a significant reduction in Amazon sum-mer rainfall [7].
The aerosol effect is less clear cut. During the dry season,enhanced atmospheric aerosol concentrations are a di-rect manifestation of biomass burning — remotely sensedaerosol optical depths (AODs) averaged over a wide areain the Amazon are strongly correlated with fire activity[10]. It is these fire-associated aerosols that have thepotential to affect precipitation processes. During therainy season a positive feedback process connects warm-process precipitation wash-out of aerosol, cleaner air,fewer condensation nuclei and faster droplet coalescence[11]. In contrast, during the dry season, biomass-burningenhanced aerosol concentrations can delay the onset ofprecipitation to higher elevations and suppress low-levelwashout processes [11]. Countering this positive feed-back hypothesis is the possibility that although warm-rainprocesses are suppressed, biomass burning may enhanceconvection and intensify cold-rain processes leading to alocal increase in precipitation [12].
A number of global-scale studies report a positive cor-relation between cloud fraction and AOD [13, 14, 15],however, over the Amazon region a negative correlationhas also been observed [16] and modelled [17]. Evi-dence of the effect of aerosols on precipitation is muchsparser [18]. In this study we generate a time series ofAODs over the Amazon region from Along Track Scan-ning Radiometer (ATSR) top of atmosphere (TOA) radi-ance measurements. We analyse the seasonal signal andmulti-year trends in conjunction with a regional firecountproduct and measured precipitation. The aim is to inves-tigate the possibility of a synergistic effect between de-
_________________________________________ Proc. of the '2nd MERIS / (A)ATSR User Workshop', Frascati, Italy 22–26 September 2008 (ESA SP-666, November 2008)
forestation, biomass burning and climate-change induceddrought over the region.
2. METHOD AND DATA
The 13-year time series of AODs over the Amazon re-gion (30◦–70◦W, 0◦–15◦S) at a resolution of 10× 10 kmwas generated using ATSR-2 and AATSR TOA radiancemeasurements. The AODs are validated via a compari-son with shorter time series of in-situ AERosol ROboticNETwork (AERONET) measurements and MODIS re-trievals. A correlation analysis is performed betweenmonthly composites of AODs, ATSR World Fire Atlasdata, and monthly precipitation anomalies and a regionaltrend analysis of AOD is carried out.
2.1. Aerosol optical depths from (A)ATSR
Aerosol optical depth or thickness is an integration of thecolumn concentration of aerosol and describes how solarradiation is attenuated by the aerosol [18]; it is thereforea dimensionless parameter that has a wavelength depen-dence. A number of methods exist to determine AODover land, from a variety of remote sensing instruments[18, 19]. Here we exploit a 13-year time series of TOAradiance measurements collected by the ATSR series ofinstruments, and an algorithm developed by [20], imple-mented as described by [21]. Some validation of the al-gorithm has already been performed [21, 19]; additionalvalidation for the Amazon region is presented here.
Aerosol optical depths are retrieved at 550 nm fromATSR-2 (1995–2002, on ERS-2) and AATSR (2002–2007, on ENVISAT) TOA radiances. The multi-angle,multi-channel observing capability of (A)ATSR com-bined with a physical model of the spectral change withview angle of surface reflectance allows estimates to bemade of the AOD, if assumptions are made regardingother aerosol optical properties such as phase functionand single-scattering albedo. Simultaneously, the surfacebidirectional reflectance is retrieved at both viewing an-gles and all four optical wavebands, using a look-up table(LUT) parameterised by the 6S model [22, 23].
The method used to retrieve atmospheric aerosol proper-ties is based on a physical model of light scattering, andrequires no a-priori information about the land surfacespectral properties [24]. Instead, the dual-view capabil-ity of the sensor is used to separate the contribution ofsurface from atmospheric scattering, allowing AOD to beestimated over a wide range of surfaces, with results rel-atively unaffected by changes in surface brightness. Inaddition to retrieving AOD, the method is also able toidentify the best aerosol model from five candidate mod-els.
(A)ATSR radiances are retrieved at a spatial resolution of1×1 km but groups of 10×10 pixels are averaged before
processing in order to reduce noise and minimise errorsin coregistration between the forward and nadir images.At this latitude repeat coverage time for the A(ATSR) in-struments is about every 6 days, however, in order to gen-erate as complete an image as possible, i.e. to minimisethe number of missing pixels due to cloud, the results arespatially and temporally composited. The resulting im-ages are georeferenced, reprojected monthly mean com-posites with a spatial resolution of 0.1◦.
2.2. Intercomparison with AERONET and MODIS
Retrieved AOD measurements from (A)ATSR are com-pared with in-situ AOD measurements and with othersatellite retrievals of AOD. The in-situ data consist ofsun-photometer measurements from three AERONETstations. The other satellite-retrieved AODs are fromMODIS on board the Terra satellite [25]. The time se-ries of (A)ATSR AOD data points used for the compari-son consist of the means of all retrievals per orbit that liewithin 0.15◦ of the AERONET site, this may consist ofup to 9 observations per AERONET data point.
The three AERONET stations selected for the inter-comparison are Alta Floresta (56.10◦W, 9.87◦S), Abra-cos Hill (62.36◦W, 10.76◦S) and Rio Branco (67.87◦W,9.96◦S). Note that Alta Floresta was one of the stationsincluded in the initial AATSR AOD validation exerciseby [21]. AERONET sun-photometer measurements arenot made at a wavelength of 550 nm, therefore, in order tomake a direct comparison with (A)ATSR measurementsit was necessary to interpolate the 440 nm and 670 nmAERONET AOD estimates. The optical depth parame-ter β, and the Angstrom exponent, α, are calculated bysolving τλ = βλα, where τλ is the optical depth at wave-length λ, using the AODs at 440 nm and 670 nm. TheAOD at 550 nm is then calculated using these β and αvalues.
Intercomparisons with Terra MODIS AOD retrievalswere also made at the locations of the three AERONETsites, for the years 2002 to 2006 inclusive. The MODISretrievals have a spatial resolution of 10 × 10 km, there-fore, any pixel which overlaps the AERONET site is in-cluded in the comparison.
2.3. Precipitation data
Global Precipitation Climatology Project (GPCP) precip-itation data at 2.5◦ spatial resolution were used to inves-tigate the relation between precipitation and AOD. Thedata are a combined product of gauge analyses and satel-lite estimates based on microwave, infrared, and sounderinstruments [26]. Monthly data were oversampled to pro-duce a grid of 0.1◦ resolution to match that of the re-motely sensed AOD, and monthly anomalies were calcu-lated as departures from the 1995–2007 13-year mean.
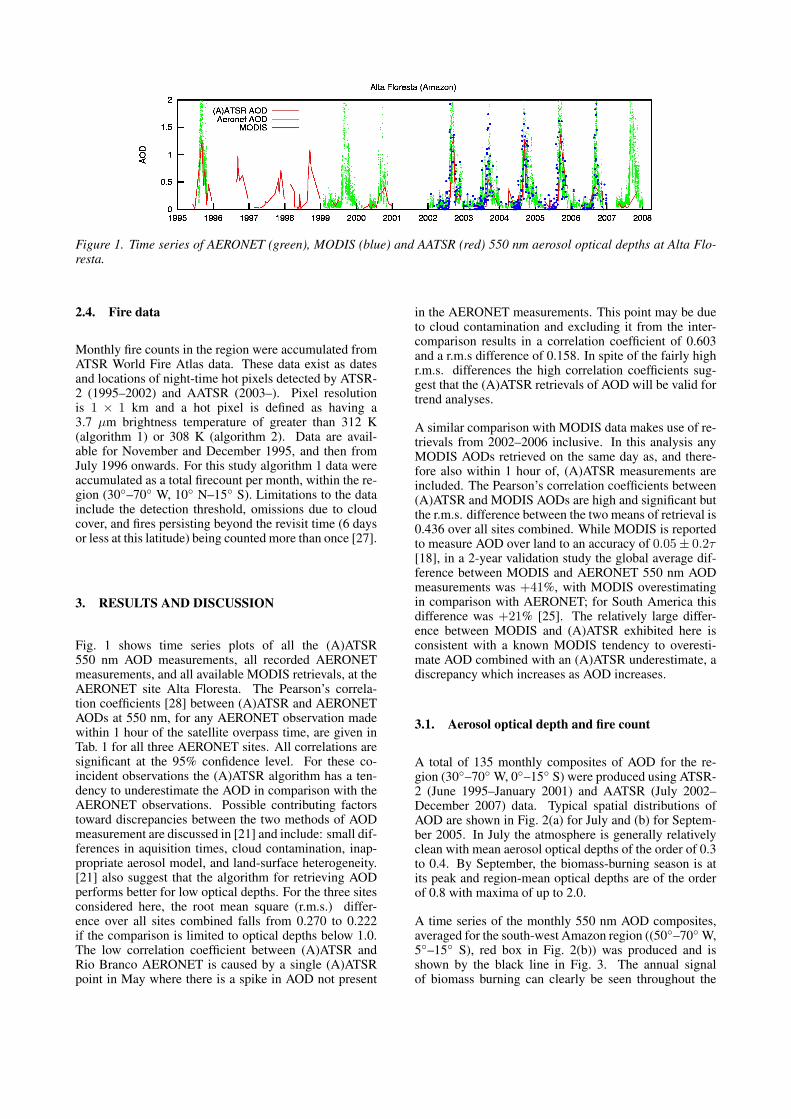
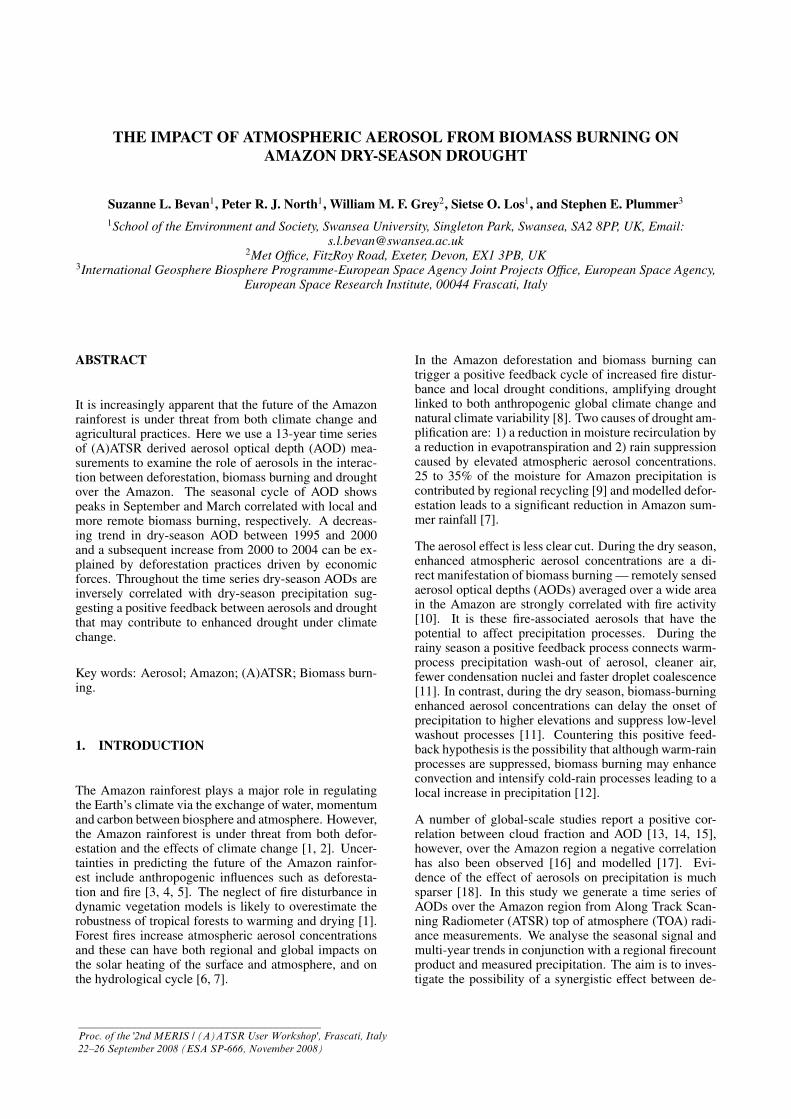
Figure 1. Time series of AERONET (green), MODIS (blue) and AATSR (red) 550 nm aerosol optical depths at Alta Flo-resta.
2.4. Fire data
Monthly fire counts in the region were accumulated fromATSR World Fire Atlas data. These data exist as datesand locations of night-time hot pixels detected by ATSR-2 (1995–2002) and AATSR (2003–). Pixel resolutionis 1 × 1 km and a hot pixel is defined as having a3.7 µm brightness temperature of greater than 312 K(algorithm 1) or 308 K (algorithm 2). Data are avail-able for November and December 1995, and then fromJuly 1996 onwards. For this study algorithm 1 data wereaccumulated as a total firecount per month, within the re-gion (30◦–70◦ W, 10◦ N–15◦ S). Limitations to the datainclude the detection threshold, omissions due to cloudcover, and fires persisting beyond the revisit time (6 daysor less at this latitude) being counted more than once [27].
3. RESULTS AND DISCUSSION
Fig. 1 shows time series plots of all the (A)ATSR550 nm AOD measurements, all recorded AERONETmeasurements, and all available MODIS retrievals, at theAERONET site Alta Floresta. The Pearson’s correla-tion coefficients [28] between (A)ATSR and AERONETAODs at 550 nm, for any AERONET observation madewithin 1 hour of the satellite overpass time, are given inTab. 1 for all three AERONET sites. All correlations aresignificant at the 95% confidence level. For these co-incident observations the (A)ATSR algorithm has a ten-dency to underestimate the AOD in comparison with theAERONET observations. Possible contributing factorstoward discrepancies between the two methods of AODmeasurement are discussed in [21] and include: small dif-ferences in aquisition times, cloud contamination, inap-propriate aerosol model, and land-surface heterogeneity.[21] also suggest that the algorithm for retrieving AODperforms better for low optical depths. For the three sitesconsidered here, the root mean square (r.m.s.) differ-ence over all sites combined falls from 0.270 to 0.222if the comparison is limited to optical depths below 1.0.The low correlation coefficient between (A)ATSR andRio Branco AERONET is caused by a single (A)ATSRpoint in May where there is a spike in AOD not present
in the AERONET measurements. This point may be dueto cloud contamination and excluding it from the inter-comparison results in a correlation coefficient of 0.603and a r.m.s difference of 0.158. In spite of the fairly highr.m.s. differences the high correlation coefficients sug-gest that the (A)ATSR retrievals of AOD will be valid fortrend analyses.
A similar comparison with MODIS data makes use of re-trievals from 2002–2006 inclusive. In this analysis anyMODIS AODs retrieved on the same day as, and there-fore also within 1 hour of, (A)ATSR measurements areincluded. The Pearson’s correlation coefficients between(A)ATSR and MODIS AODs are high and significant butthe r.m.s. difference between the two means of retrieval is0.436 over all sites combined. While MODIS is reportedto measure AOD over land to an accuracy of 0.05± 0.2τ[18], in a 2-year validation study the global average dif-ference between MODIS and AERONET 550 nm AODmeasurements was +41%, with MODIS overestimatingin comparison with AERONET; for South America thisdifference was +21% [25]. The relatively large differ-ence between MODIS and (A)ATSR exhibited here isconsistent with a known MODIS tendency to overesti-mate AOD combined with an (A)ATSR underestimate, adiscrepancy which increases as AOD increases.
3.1. Aerosol optical depth and fire count
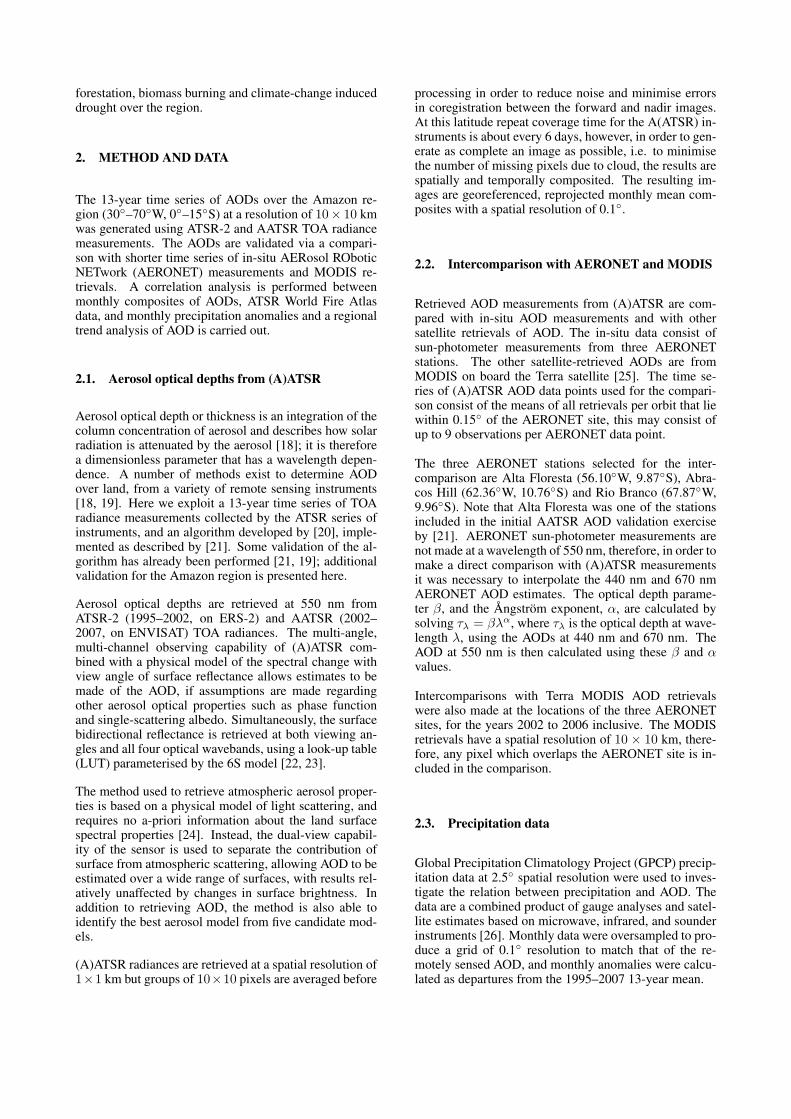
A total of 135 monthly composites of AOD for the re-gion (30◦–70◦ W, 0◦–15◦ S) were produced using ATSR-2 (June 1995–January 2001) and AATSR (July 2002–December 2007) data. Typical spatial distributions ofAOD are shown in Fig. 2(a) for July and (b) for Septem-ber 2005. In July the atmosphere is generally relativelyclean with mean aerosol optical depths of the order of 0.3to 0.4. By September, the biomass-burning season is atits peak and region-mean optical depths are of the orderof 0.8 with maxima of up to 2.0.
A time series of the monthly 550 nm AOD composites,averaged for the south-west Amazon region ((50◦–70◦ W,5◦–15◦ S), red box in Fig. 2(b)) was produced and isshown by the black line in Fig. 3. The annual signalof biomass burning can clearly be seen throughout the
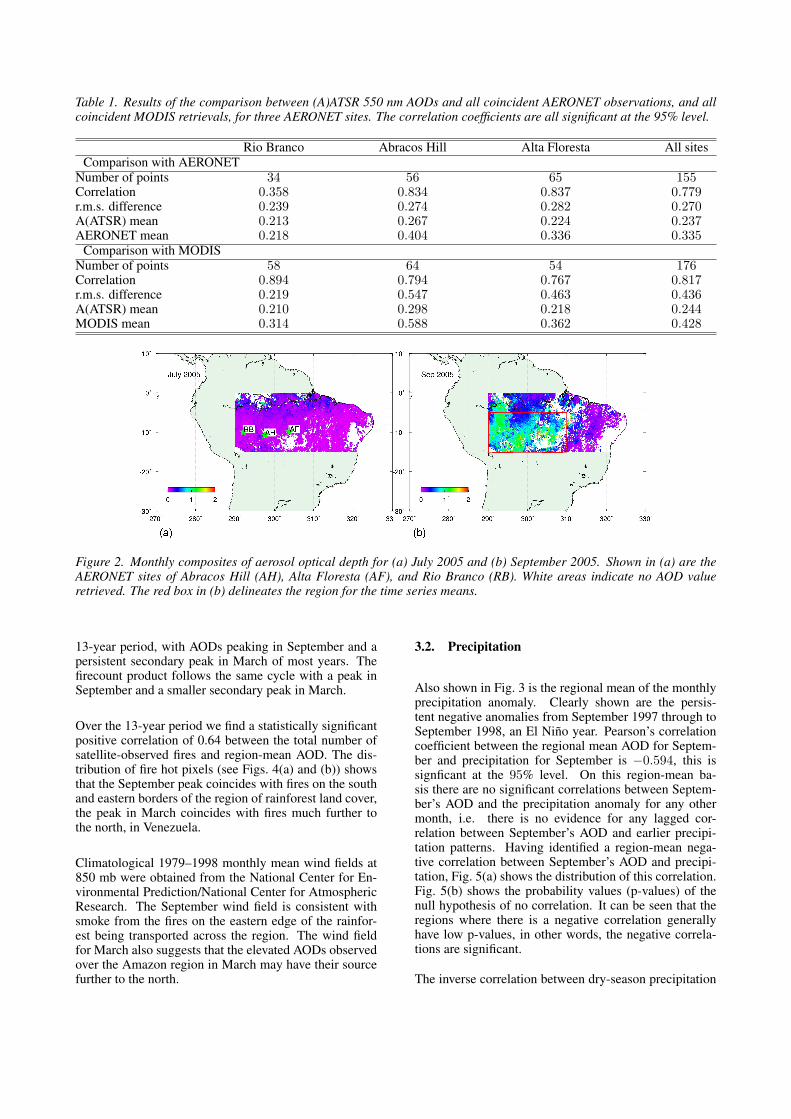
Table 1. Results of the comparison between (A)ATSR 550 nm AODs and all coincident AERONET observations, and allcoincident MODIS retrievals, for three AERONET sites. The correlation coefficients are all significant at the 95% level.
Rio Branco Abracos Hill Alta Floresta All sitesComparison with AERONET
Number of points 34 56 65 155Correlation 0.358 0.834 0.837 0.779r.m.s. difference 0.239 0.274 0.282 0.270A(ATSR) mean 0.213 0.267 0.224 0.237AERONET mean 0.218 0.404 0.336 0.335
Comparison with MODISNumber of points 58 64 54 176Correlation 0.894 0.794 0.767 0.817r.m.s. difference 0.219 0.547 0.463 0.436A(ATSR) mean 0.210 0.298 0.218 0.244MODIS mean 0.314 0.588 0.362 0.428
Figure 2. Monthly composites of aerosol optical depth for (a) July 2005 and (b) September 2005. Shown in (a) are theAERONET sites of Abracos Hill (AH), Alta Floresta (AF), and Rio Branco (RB). White areas indicate no AOD valueretrieved. The red box in (b) delineates the region for the time series means.
13-year period, with AODs peaking in September and apersistent secondary peak in March of most years. Thefirecount product follows the same cycle with a peak inSeptember and a smaller secondary peak in March.
Over the 13-year period we find a statistically significantpositive correlation of 0.64 between the total number ofsatellite-observed fires and region-mean AOD. The dis-tribution of fire hot pixels (see Figs. 4(a) and (b)) showsthat the September peak coincides with fires on the southand eastern borders of the region of rainforest land cover,the peak in March coincides with fires much further tothe north, in Venezuela.
Climatological 1979–1998 monthly mean wind fields at850 mb were obtained from the National Center for En-vironmental Prediction/National Center for AtmosphericResearch. The September wind field is consistent withsmoke from the fires on the eastern edge of the rainfor-est being transported across the region. The wind fieldfor March also suggests that the elevated AODs observedover the Amazon region in March may have their sourcefurther to the north.
3.2. Precipitation
Also shown in Fig. 3 is the regional mean of the monthlyprecipitation anomaly. Clearly shown are the persis-tent negative anomalies from September 1997 through toSeptember 1998, an El Nino year. Pearson’s correlationcoefficient between the regional mean AOD for Septem-ber and precipitation for September is −0.594, this issignficant at the 95% level. On this region-mean ba-sis there are no significant correlations between Septem-ber’s AOD and the precipitation anomaly for any othermonth, i.e. there is no evidence for any lagged cor-relation between September’s AOD and earlier precipi-tation patterns. Having identified a region-mean nega-tive correlation between September’s AOD and precipi-tation, Fig. 5(a) shows the distribution of this correlation.Fig. 5(b) shows the probability values (p-values) of thenull hypothesis of no correlation. It can be seen that theregions where there is a negative correlation generallyhave low p-values, in other words, the negative correla-tions are significant.
The inverse correlation between dry-season precipitation
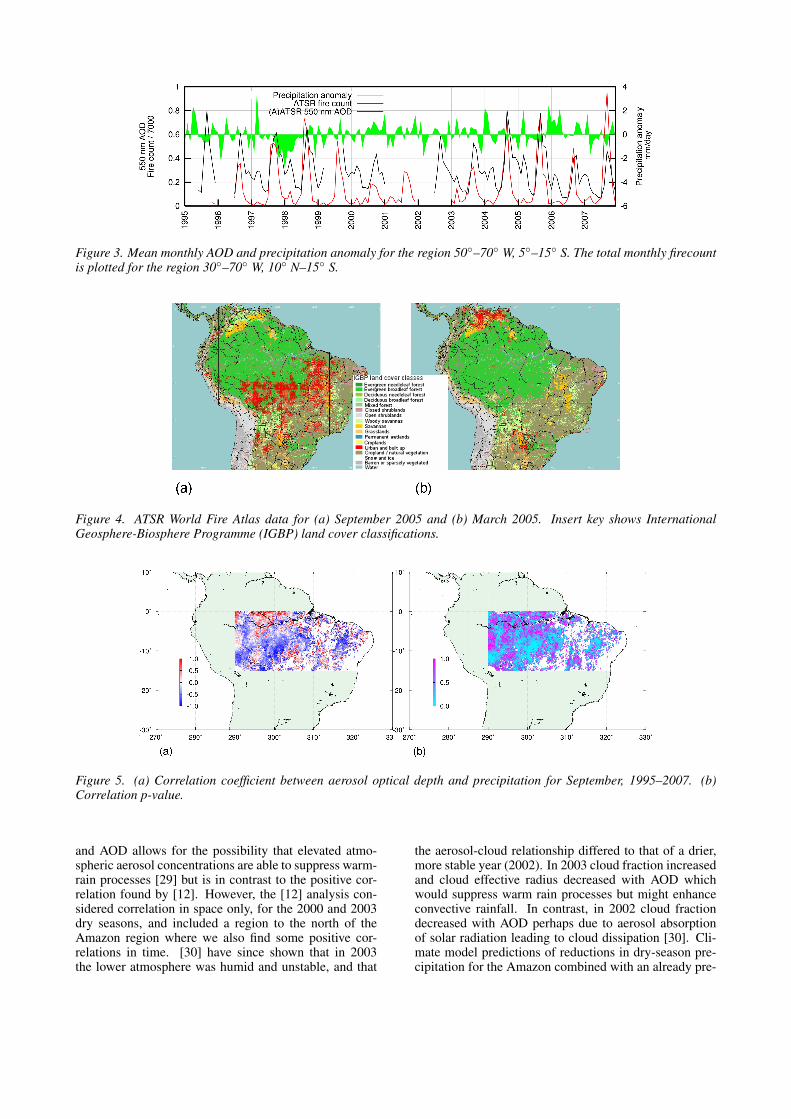
Figure 3. Mean monthly AOD and precipitation anomaly for the region 50◦–70◦ W, 5◦–15◦ S. The total monthly firecountis plotted for the region 30◦–70◦ W, 10◦ N–15◦ S.
Figure 4. ATSR World Fire Atlas data for (a) September 2005 and (b) March 2005. Insert key shows InternationalGeosphere-Biosphere Programme (IGBP) land cover classifications.
Figure 5. (a) Correlation coefficient between aerosol optical depth and precipitation for September, 1995–2007. (b)Correlation p-value.
and AOD allows for the possibility that elevated atmo-spheric aerosol concentrations are able to suppress warm-rain processes [29] but is in contrast to the positive cor-relation found by [12]. However, the [12] analysis con-sidered correlation in space only, for the 2000 and 2003dry seasons, and included a region to the north of theAmazon region where we also find some positive cor-relations in time. [30] have since shown that in 2003the lower atmosphere was humid and unstable, and that
the aerosol-cloud relationship differed to that of a drier,more stable year (2002). In 2003 cloud fraction increasedand cloud effective radius decreased with AOD whichwould suppress warm rain processes but might enhanceconvective rainfall. In contrast, in 2002 cloud fractiondecreased with AOD perhaps due to aerosol absorptionof solar radiation leading to cloud dissipation [30]. Cli-mate model predictions of reductions in dry-season pre-cipitation for the Amazon combined with an already pre-
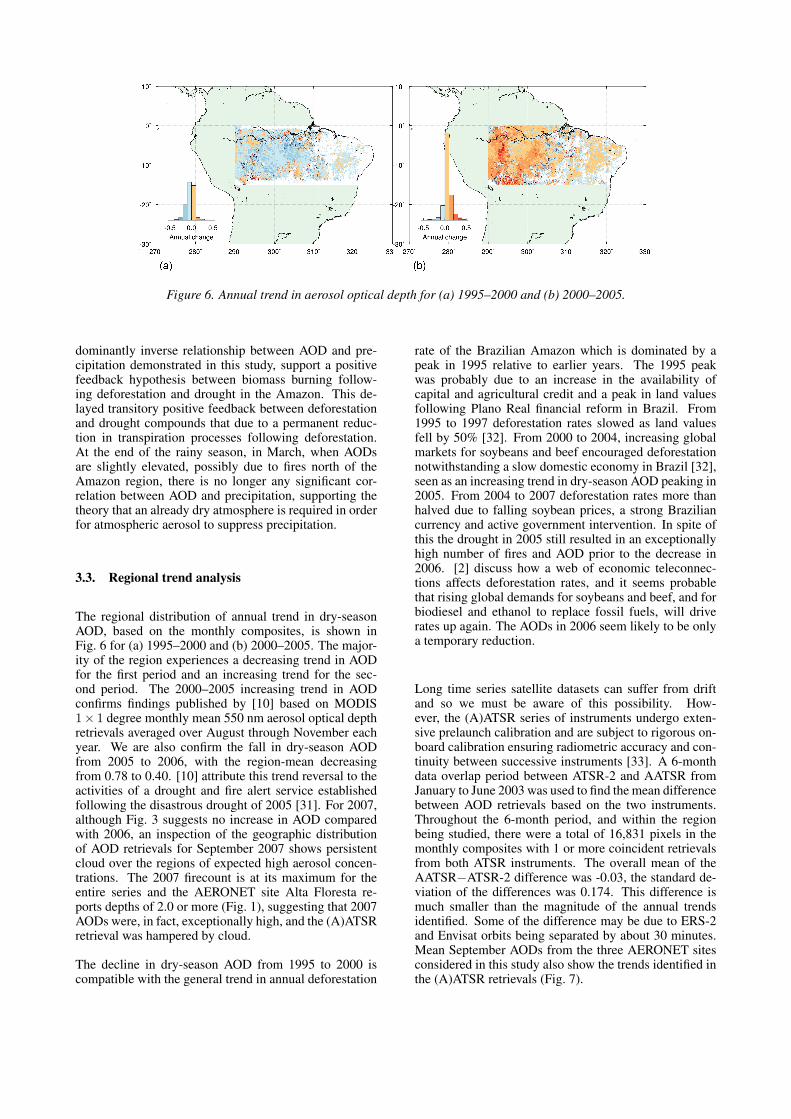
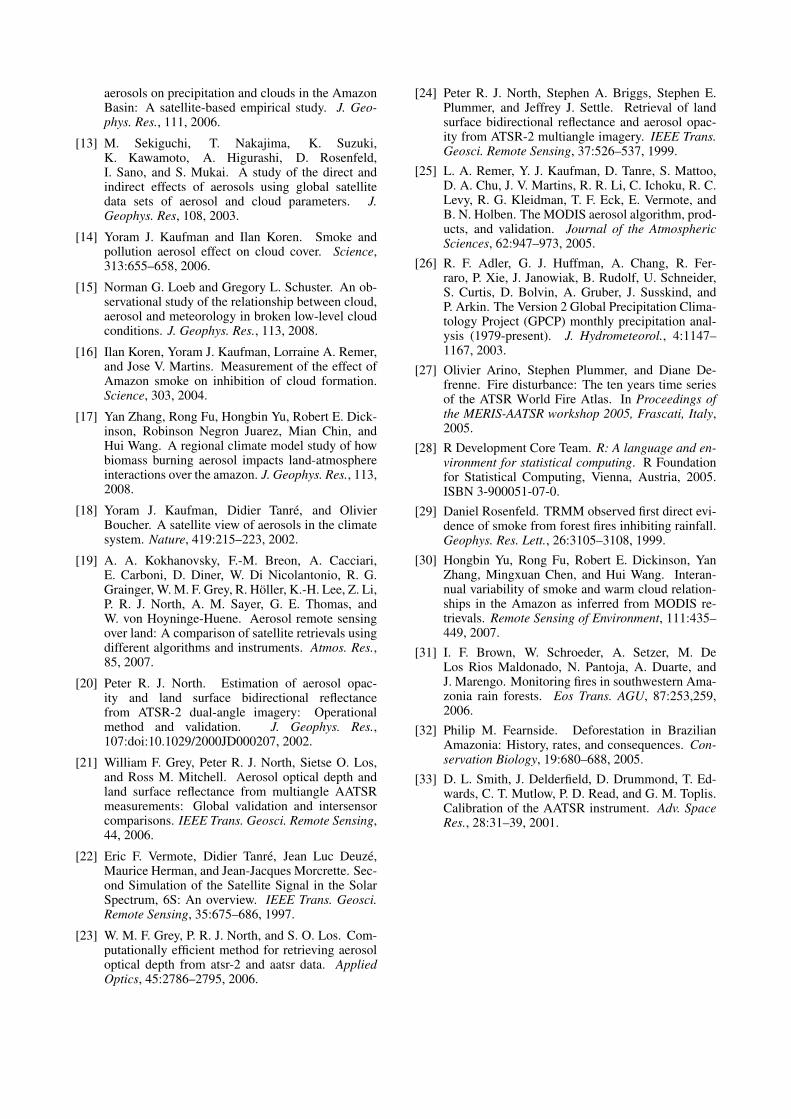
Figure 6. Annual trend in aerosol optical depth for (a) 1995–2000 and (b) 2000–2005.
dominantly inverse relationship between AOD and pre-cipitation demonstrated in this study, support a positivefeedback hypothesis between biomass burning follow-ing deforestation and drought in the Amazon. This de-layed transitory positive feedback between deforestationand drought compounds that due to a permanent reduc-tion in transpiration processes following deforestation.At the end of the rainy season, in March, when AODsare slightly elevated, possibly due to fires north of theAmazon region, there is no longer any significant cor-relation between AOD and precipitation, supporting thetheory that an already dry atmosphere is required in orderfor atmospheric aerosol to suppress precipitation.
3.3. Regional trend analysis
The regional distribution of annual trend in dry-seasonAOD, based on the monthly composites, is shown inFig. 6 for (a) 1995–2000 and (b) 2000–2005. The major-ity of the region experiences a decreasing trend in AODfor the first period and an increasing trend for the sec-ond period. The 2000–2005 increasing trend in AODconfirms findings published by [10] based on MODIS1× 1 degree monthly mean 550 nm aerosol optical depthretrievals averaged over August through November eachyear. We are also confirm the fall in dry-season AODfrom 2005 to 2006, with the region-mean decreasingfrom 0.78 to 0.40. [10] attribute this trend reversal to theactivities of a drought and fire alert service establishedfollowing the disastrous drought of 2005 [31]. For 2007,although Fig. 3 suggests no increase in AOD comparedwith 2006, an inspection of the geographic distributionof AOD retrievals for September 2007 shows persistentcloud over the regions of expected high aerosol concen-trations. The 2007 firecount is at its maximum for theentire series and the AERONET site Alta Floresta re-ports depths of 2.0 or more (Fig. 1), suggesting that 2007AODs were, in fact, exceptionally high, and the (A)ATSRretrieval was hampered by cloud.
The decline in dry-season AOD from 1995 to 2000 iscompatible with the general trend in annual deforestation
rate of the Brazilian Amazon which is dominated by apeak in 1995 relative to earlier years. The 1995 peakwas probably due to an increase in the availability ofcapital and agricultural credit and a peak in land valuesfollowing Plano Real financial reform in Brazil. From1995 to 1997 deforestation rates slowed as land valuesfell by 50% [32]. From 2000 to 2004, increasing globalmarkets for soybeans and beef encouraged deforestationnotwithstanding a slow domestic economy in Brazil [32],seen as an increasing trend in dry-season AOD peaking in2005. From 2004 to 2007 deforestation rates more thanhalved due to falling soybean prices, a strong Braziliancurrency and active government intervention. In spite ofthis the drought in 2005 still resulted in an exceptionallyhigh number of fires and AOD prior to the decrease in2006. [2] discuss how a web of economic teleconnec-tions affects deforestation rates, and it seems probablethat rising global demands for soybeans and beef, and forbiodiesel and ethanol to replace fossil fuels, will driverates up again. The AODs in 2006 seem likely to be onlya temporary reduction.
Long time series satellite datasets can suffer from driftand so we must be aware of this possibility. How-ever, the (A)ATSR series of instruments undergo exten-sive prelaunch calibration and are subject to rigorous on-board calibration ensuring radiometric accuracy and con-tinuity between successive instruments [33]. A 6-monthdata overlap period between ATSR-2 and AATSR fromJanuary to June 2003 was used to find the mean differencebetween AOD retrievals based on the two instruments.Throughout the 6-month period, and within the regionbeing studied, there were a total of 16,831 pixels in themonthly composites with 1 or more coincident retrievalsfrom both ATSR instruments. The overall mean of theAATSR−ATSR-2 difference was -0.03, the standard de-viation of the differences was 0.174. This difference ismuch smaller than the magnitude of the annual trendsidentified. Some of the difference may be due to ERS-2and Envisat orbits being separated by about 30 minutes.Mean September AODs from the three AERONET sitesconsidered in this study also show the trends identified inthe (A)ATSR retrievals (Fig. 7).
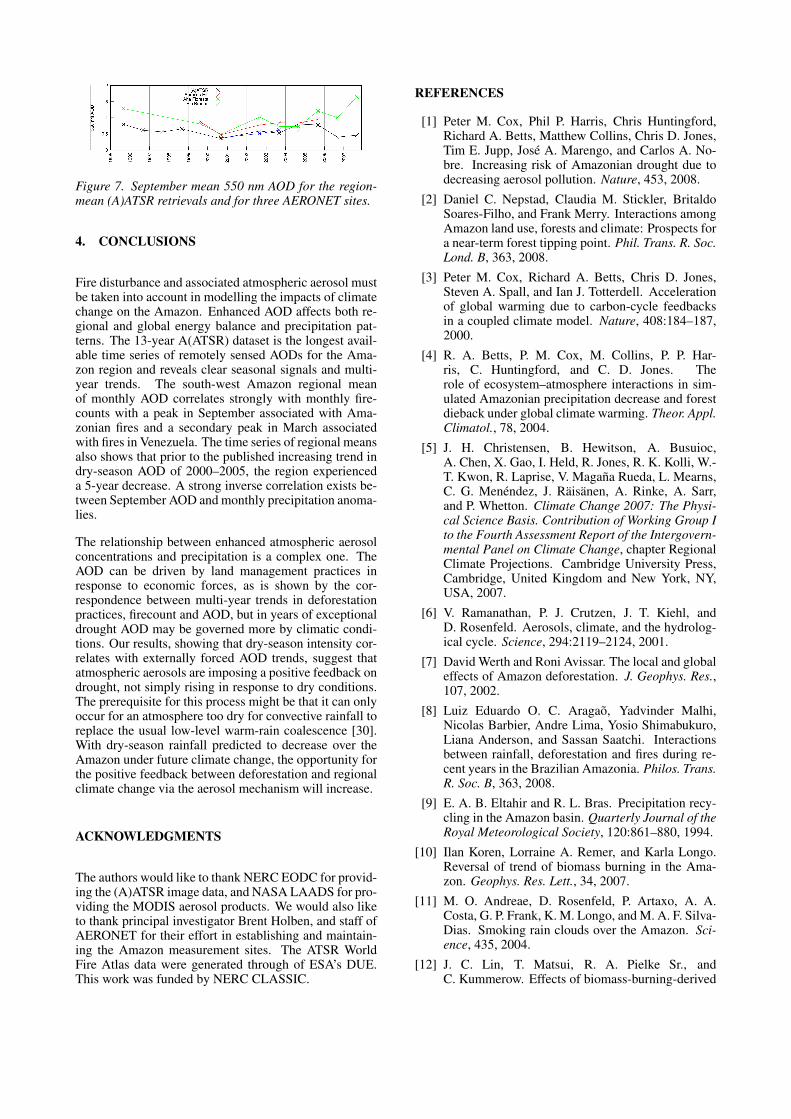
Figure 7. September mean 550 nm AOD for the region-mean (A)ATSR retrievals and for three AERONET sites.
4. CONCLUSIONS
Fire disturbance and associated atmospheric aerosol mustbe taken into account in modelling the impacts of climatechange on the Amazon. Enhanced AOD affects both re-gional and global energy balance and precipitation pat-terns. The 13-year A(ATSR) dataset is the longest avail-able time series of remotely sensed AODs for the Ama-zon region and reveals clear seasonal signals and multi-year trends. The south-west Amazon regional meanof monthly AOD correlates strongly with monthly fire-counts with a peak in September associated with Ama-zonian fires and a secondary peak in March associatedwith fires in Venezuela. The time series of regional meansalso shows that prior to the published increasing trend indry-season AOD of 2000–2005, the region experienceda 5-year decrease. A strong inverse correlation exists be-tween September AOD and monthly precipitation anoma-lies.
The relationship between enhanced atmospheric aerosolconcentrations and precipitation is a complex one. TheAOD can be driven by land management practices inresponse to economic forces, as is shown by the cor-respondence between multi-year trends in deforestationpractices, firecount and AOD, but in years of exceptionaldrought AOD may be governed more by climatic condi-tions. Our results, showing that dry-season intensity cor-relates with externally forced AOD trends, suggest thatatmospheric aerosols are imposing a positive feedback ondrought, not simply rising in response to dry conditions.The prerequisite for this process might be that it can onlyoccur for an atmosphere too dry for convective rainfall toreplace the usual low-level warm-rain coalescence [30].With dry-season rainfall predicted to decrease over theAmazon under future climate change, the opportunity forthe positive feedback between deforestation and regionalclimate change via the aerosol mechanism will increase.
ACKNOWLEDGMENTS
The authors would like to thank NERC EODC for provid-ing the (A)ATSR image data, and NASA LAADS for pro-viding the MODIS aerosol products. We would also liketo thank principal investigator Brent Holben, and staff ofAERONET for their effort in establishing and maintain-ing the Amazon measurement sites. The ATSR WorldFire Atlas data were generated through of ESA’s DUE.This work was funded by NERC CLASSIC.
REFERENCES
[1] Peter M. Cox, Phil P. Harris, Chris Huntingford,Richard A. Betts, Matthew Collins, Chris D. Jones,Tim E. Jupp, Jose A. Marengo, and Carlos A. No-bre. Increasing risk of Amazonian drought due todecreasing aerosol pollution. Nature, 453, 2008.
[2] Daniel C. Nepstad, Claudia M. Stickler, BritaldoSoares-Filho, and Frank Merry. Interactions amongAmazon land use, forests and climate: Prospects fora near-term forest tipping point. Phil. Trans. R. Soc.Lond. B, 363, 2008.
[3] Peter M. Cox, Richard A. Betts, Chris D. Jones,Steven A. Spall, and Ian J. Totterdell. Accelerationof global warming due to carbon-cycle feedbacksin a coupled climate model. Nature, 408:184–187,2000.
[4] R. A. Betts, P. M. Cox, M. Collins, P. P. Har-ris, C. Huntingford, and C. D. Jones. Therole of ecosystem–atmosphere interactions in sim-ulated Amazonian precipitation decrease and forestdieback under global climate warming. Theor. Appl.Climatol., 78, 2004.
[5] J. H. Christensen, B. Hewitson, A. Busuioc,A. Chen, X. Gao, I. Held, R. Jones, R. K. Kolli, W.-T. Kwon, R. Laprise, V. Magana Rueda, L. Mearns,C. G. Menendez, J. Raisanen, A. Rinke, A. Sarr,and P. Whetton. Climate Change 2007: The Physi-cal Science Basis. Contribution of Working Group Ito the Fourth Assessment Report of the Intergovern-mental Panel on Climate Change, chapter RegionalClimate Projections. Cambridge University Press,Cambridge, United Kingdom and New York, NY,USA, 2007.
[6] V. Ramanathan, P. J. Crutzen, J. T. Kiehl, andD. Rosenfeld. Aerosols, climate, and the hydrolog-ical cycle. Science, 294:2119–2124, 2001.
[7] David Werth and Roni Avissar. The local and globaleffects of Amazon deforestation. J. Geophys. Res.,107, 2002.
[8] Luiz Eduardo O. C. Aragao, Yadvinder Malhi,Nicolas Barbier, Andre Lima, Yosio Shimabukuro,Liana Anderson, and Sassan Saatchi. Interactionsbetween rainfall, deforestation and fires during re-cent years in the Brazilian Amazonia. Philos. Trans.R. Soc. B, 363, 2008.
[9] E. A. B. Eltahir and R. L. Bras. Precipitation recy-cling in the Amazon basin. Quarterly Journal of theRoyal Meteorological Society, 120:861–880, 1994.
[10] Ilan Koren, Lorraine A. Remer, and Karla Longo.Reversal of trend of biomass burning in the Ama-zon. Geophys. Res. Lett., 34, 2007.
[11] M. O. Andreae, D. Rosenfeld, P. Artaxo, A. A.Costa, G. P. Frank, K. M. Longo, and M. A. F. Silva-Dias. Smoking rain clouds over the Amazon. Sci-ence, 435, 2004.
[12] J. C. Lin, T. Matsui, R. A. Pielke Sr., andC. Kummerow. Effects of biomass-burning-derived
aerosols on precipitation and clouds in the AmazonBasin: A satellite-based empirical study. J. Geo-phys. Res., 111, 2006.
[13] M. Sekiguchi, T. Nakajima, K. Suzuki,K. Kawamoto, A. Higurashi, D. Rosenfeld,I. Sano, and S. Mukai. A study of the direct andindirect effects of aerosols using global satellitedata sets of aerosol and cloud parameters. J.Geophys. Res, 108, 2003.
[14] Yoram J. Kaufman and Ilan Koren. Smoke andpollution aerosol effect on cloud cover. Science,313:655–658, 2006.
[15] Norman G. Loeb and Gregory L. Schuster. An ob-servational study of the relationship between cloud,aerosol and meteorology in broken low-level cloudconditions. J. Geophys. Res., 113, 2008.
[16] Ilan Koren, Yoram J. Kaufman, Lorraine A. Remer,and Jose V. Martins. Measurement of the effect ofAmazon smoke on inhibition of cloud formation.Science, 303, 2004.
[17] Yan Zhang, Rong Fu, Hongbin Yu, Robert E. Dick-inson, Robinson Negron Juarez, Mian Chin, andHui Wang. A regional climate model study of howbiomass burning aerosol impacts land-atmosphereinteractions over the amazon. J. Geophys. Res., 113,2008.
[18] Yoram J. Kaufman, Didier Tanre, and OlivierBoucher. A satellite view of aerosols in the climatesystem. Nature, 419:215–223, 2002.
[19] A. A. Kokhanovsky, F.-M. Breon, A. Cacciari,E. Carboni, D. Diner, W. Di Nicolantonio, R. G.Grainger, W. M. F. Grey, R. Holler, K.-H. Lee, Z. Li,P. R. J. North, A. M. Sayer, G. E. Thomas, andW. von Hoyninge-Huene. Aerosol remote sensingover land: A comparison of satellite retrievals usingdifferent algorithms and instruments. Atmos. Res.,85, 2007.
[20] Peter R. J. North. Estimation of aerosol opac-ity and land surface bidirectional reflectancefrom ATSR-2 dual-angle imagery: Operationalmethod and validation. J. Geophys. Res.,107:doi:10.1029/2000JD000207, 2002.
[21] William F. Grey, Peter R. J. North, Sietse O. Los,and Ross M. Mitchell. Aerosol optical depth andland surface reflectance from multiangle AATSRmeasurements: Global validation and intersensorcomparisons. IEEE Trans. Geosci. Remote Sensing,44, 2006.
[22] Eric F. Vermote, Didier Tanre, Jean Luc Deuze,Maurice Herman, and Jean-Jacques Morcrette. Sec-ond Simulation of the Satellite Signal in the SolarSpectrum, 6S: An overview. IEEE Trans. Geosci.Remote Sensing, 35:675–686, 1997.
[23] W. M. F. Grey, P. R. J. North, and S. O. Los. Com-putationally efficient method for retrieving aerosoloptical depth from atsr-2 and aatsr data. AppliedOptics, 45:2786–2795, 2006.
[24] Peter R. J. North, Stephen A. Briggs, Stephen E.Plummer, and Jeffrey J. Settle. Retrieval of landsurface bidirectional reflectance and aerosol opac-ity from ATSR-2 multiangle imagery. IEEE Trans.Geosci. Remote Sensing, 37:526–537, 1999.
[25] L. A. Remer, Y. J. Kaufman, D. Tanre, S. Mattoo,D. A. Chu, J. V. Martins, R. R. Li, C. Ichoku, R. C.Levy, R. G. Kleidman, T. F. Eck, E. Vermote, andB. N. Holben. The MODIS aerosol algorithm, prod-ucts, and validation. Journal of the AtmosphericSciences, 62:947–973, 2005.
[26] R. F. Adler, G. J. Huffman, A. Chang, R. Fer-raro, P. Xie, J. Janowiak, B. Rudolf, U. Schneider,S. Curtis, D. Bolvin, A. Gruber, J. Susskind, andP. Arkin. The Version 2 Global Precipitation Clima-tology Project (GPCP) monthly precipitation anal-ysis (1979-present). J. Hydrometeorol., 4:1147–1167, 2003.
[27] Olivier Arino, Stephen Plummer, and Diane De-frenne. Fire disturbance: The ten years time seriesof the ATSR World Fire Atlas. In Proceedings ofthe MERIS-AATSR workshop 2005, Frascati, Italy,2005.
[28] R Development Core Team. R: A language and en-vironment for statistical computing. R Foundationfor Statistical Computing, Vienna, Austria, 2005.ISBN 3-900051-07-0.
[29] Daniel Rosenfeld. TRMM observed first direct evi-dence of smoke from forest fires inhibiting rainfall.Geophys. Res. Lett., 26:3105–3108, 1999.
[30] Hongbin Yu, Rong Fu, Robert E. Dickinson, YanZhang, Mingxuan Chen, and Hui Wang. Interan-nual variability of smoke and warm cloud relation-ships in the Amazon as inferred from MODIS re-trievals. Remote Sensing of Environment, 111:435–449, 2007.
[31] I. F. Brown, W. Schroeder, A. Setzer, M. DeLos Rios Maldonado, N. Pantoja, A. Duarte, andJ. Marengo. Monitoring fires in southwestern Ama-zonia rain forests. Eos Trans. AGU, 87:253,259,2006.
[32] Philip M. Fearnside. Deforestation in BrazilianAmazonia: History, rates, and consequences. Con-servation Biology, 19:680–688, 2005.
[33] D. L. Smith, J. Delderfield, D. Drummond, T. Ed-wards, C. T. Mutlow, P. D. Read, and G. M. Toplis.Calibration of the AATSR instrument. Adv. SpaceRes., 28:31–39, 2001.
Related Documents


