Date of Experiment: Report due date: Report submission date: Checked by: Item/marks Format/10 Abstract and Introduction/10 Figures and Diagrams/15 Materials and Method/10 Results Discussions/45 References/10 Total Impact of a Jet Student Name: Mohd Kamarul Yusri Bin Yusof Group Members: Nikki Hills, Baapu Seeraj, Lau Siang Yang, Chin Di Yuan School of Engineering Taylor’s University Malaysia 7 th November 2011

Welcome message from author
This document is posted to help you gain knowledge. Please leave a comment to let me know what you think about it! Share it to your friends and learn new things together.
Transcript

Date of Experiment: Report due date: Report submission date: Checked by:
Item/marks Format/10 Abstract and Introduction/10 Figures and Diagrams/15 Materials and Method/10 Results Discussions/45 References/10 Total
Impact of a Jet
Student Name: Mohd Kamarul Yusri Bin Yusof
Group Members: Nikki Hills, Baapu Seeraj, Lau Siang Yang, Chin Di Yuan
School of Engineering
Taylor’s University
Malaysia
7th November 2011

School of Engineering Taylor’s University
2
Table of Content
Abstract 3
1.0 Introduction 3
2.0 Experiment Design 4
2.1 Materials 5
2.2Methods 5
2.3 Procedure 6
3.0 Result and Discussions 7-10
3.1 Table results from experiment 7-8
3.2 Graph of force on vane (N) against rate of delivery of momentum ṁuo (kgm/s2) 8
3.3 Discussions 9-12
4.0 Conclusions/ Recommendations 13
References 14
School of Engineering Taylor’s University
3
Abstract
The impact of a jet experiment is used to investigate the force created by the impact of a jet
on vanes of different shapes. In the experiment, 3 different vanes consisting of a Flat Plate,
Conical Cup, and Hemispherical Cup are tested to 4 different flow rates. The distance
between the center of the jockey weight and the pivot are measured by using the principal
of moment of a force. The product of the clockwise force and the perpendicular distance
will equal the product of the anti clockwise force and its perpendicular distance. In a
whole, the hemispherical cup vane will have the largest force created by impact of the jet.
1.0 Introduction
Throughout the years, engineers have found many ways to use the force that can be
imparted by a jet of fluid on a surface diverting the flow. For example, firemen can make
use of the kinetic energy stored in a water jet to deliver water above the level in the nozzle
to extinguish fires in high-rise building. This enormous amount of kinetic energy produce
by water jets is also used in the industry for cutting metals and debarring. There’s a lot of
technological importance of the water jet that can be cited through its application. This
experiment aims at assessing the different forces exerted by the same water jet on a
different type of vanes. The experiment uses the principal of moment of force to help
measure the force of impact of the water jet by using the product of the clockwise force
and the perpendicular distance will equal the product of the anti clockwise force and its
perpendicular distance and thus the force can be determined. Besides that, the experiment
will help the students compared the results obtained from the experiment with the
theoretical calculations.

School of Engineering Taylor’s University
4
2.0 Experiment Design
Aim: To measure the force generated by impact of the jet on vanes of different shapes and
to compare the results taken from the experiments with the theoretical calculations.
Figure 1. Jet Impact Apparatus
School of Engineering Taylor’s University
5
2.1 Materials
A Jet Impact Apparatus is used for this experiment. In addition, a Volumetric Hydraulic
Bench is also used to investigate the forced generated by the jet of water on 3 different
shapes of vanes that is the Flat Plate, the Conical Cup and the Hemispherical Cup. Lastly, a
stopwatch and a thermometer is used to measure the time and temperature of water
respectively.
2.2 Methods
Measuring the distance of the jockey weight from its zero position (y) and the time taken
(t) for the water to fill up the tank up to 35l, 25l and 15l depending on the rate of water
flow are the method used in this experiment. The data obtained from the experiment is then
tabulated in the “table of results of experiment”. Next, a graph of force of vanes against
rate of delivery of momentum is then plot from the data given in the “table of results of
experiment”. The experimental graph and the theoretical calculations graph are then
compared. A conclusion can then be made through all the data given.
School of Engineering Taylor’s University
6
2.3 Procedure
A flat plate vane is used by screwing it with the Retaining Screw that is located on the
top part of the Jet Impact Apparatus. The weigh beam is then balanced by adjusting the
position of the jockey weight until the tally reaches its balanced position. The jockey
weight is considered to be at its zero position. Water is then supplied through the bench
supply valve followed by switching on the water pump. The rate of water flow is then
increased to the maximum and the force of the water jet will shift the lever, which will
then be maintained, back to its balanced position by adjusting the jockey weight on the
weight beam. The new position of the jockey weight from the pivot to center of the jockey
weight is measured and recorded. Next, the outlet of the weighing tank is clogged and the
stopwatch is started almost simultaneously. The time taken for the water to fill up the
weighing tank at 35l, 25l, 15l, and 5l subject to the rate of water flow is recorded. The time
taken for the water to fill up the tank is taken again and the average of both recorded data
is obtained to reduce the error in the experiment. Next, 3 different position of the jockey
weight from the pivot to its center are then obtained and recorded by lowering the flow rate
of the water. The experiment is then repeated with the conical cup and the hemispherical
cup.
School of Engineering Taylor’s University
7
3.0 Results and Discussions
3.1 Table of results of experiment
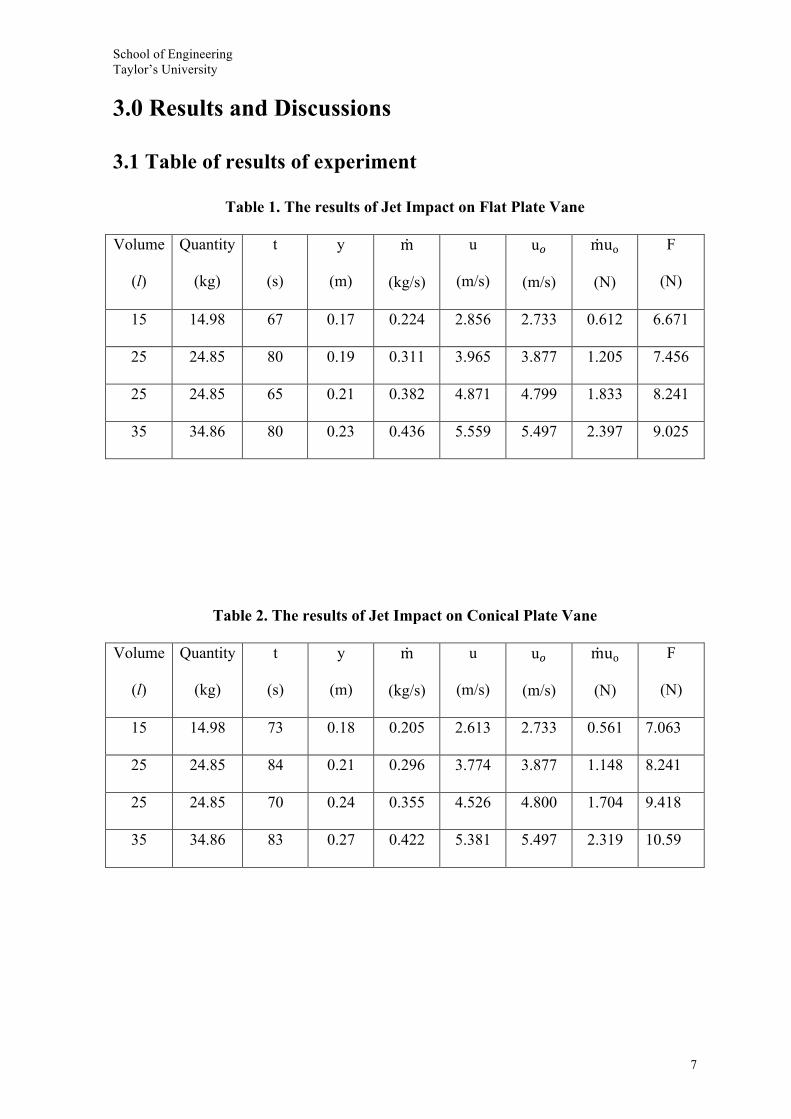
Table 1. The results of Jet Impact on Flat Plate Vane
Volume
(l)
Quantity
(kg)
t
(s)
y
(m)
m
(kg/s)
u
(m/s)
u!
(m/s)
muo
(N)
F
(N)
15 14.98 67 0.17 0.224 2.856 2.733 0.612 6.671
25 24.85 80 0.19 0.311 3.965 3.877 1.205 7.456
25 24.85 65 0.21 0.382 4.871 4.799 1.833 8.241
35 34.86 80 0.23 0.436 5.559 5.497 2.397 9.025
Table 2. The results of Jet Impact on Conical Plate Vane
Volume
(l)
Quantity
(kg)
t
(s)
y
(m)
m
(kg/s)
u
(m/s)
u!
(m/s)
muo
(N)
F
(N)
15 14.98 73 0.18 0.205 2.613 2.733 0.561 7.063
25 24.85 84 0.21 0.296 3.774 3.877 1.148 8.241
25 24.85 70 0.24 0.355 4.526 4.800 1.704 9.418
35 34.86 83 0.27 0.422 5.381 5.497 2.319 10.59
School of Engineering Taylor’s University
8
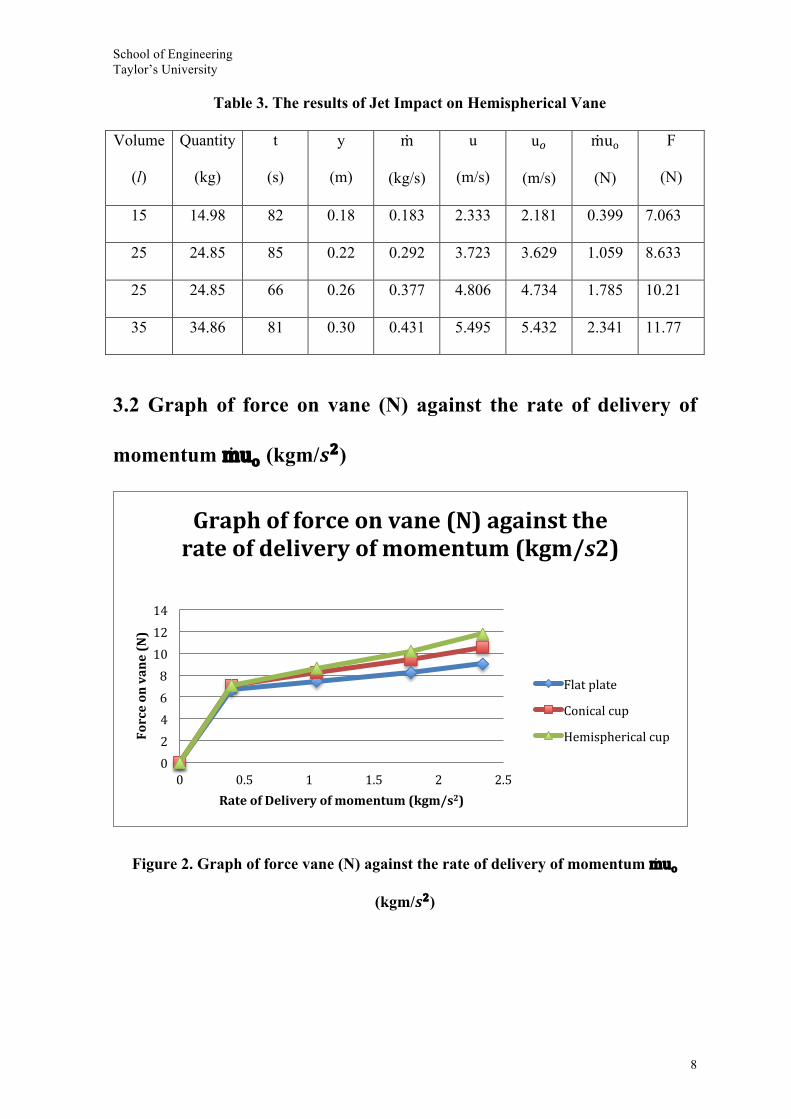
Table 3. The results of Jet Impact on Hemispherical Vane
Volume
(l)
Quantity
(kg)
t
(s)
y
(m)
m
(kg/s)
u
(m/s)
u!
(m/s)
muo
(N)
F
(N)
15 14.98 82 0.18 0.183 2.333 2.181 0.399 7.063
25 24.85 85 0.22 0.292 3.723 3.629 1.059 8.633
25 24.85 66 0.26 0.377 4.806 4.734 1.785 10.21
35 34.86 81 0.30 0.431 5.495 5.432 2.341 11.77
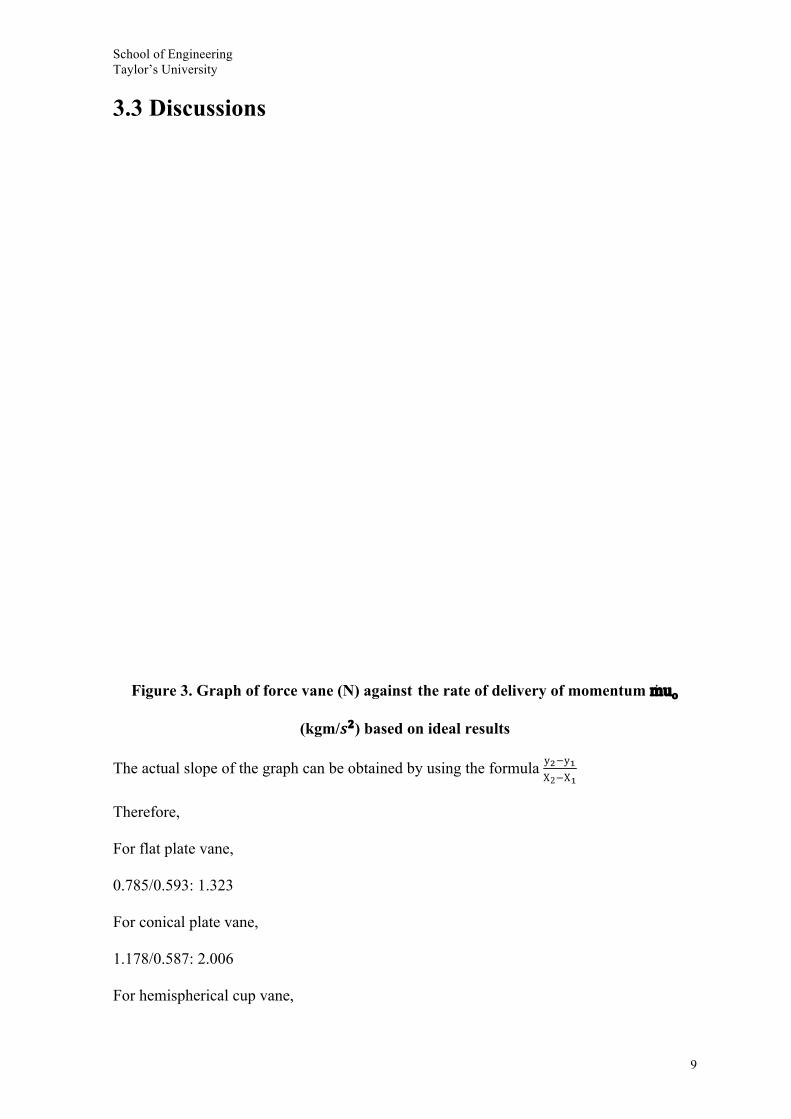
3.2 Graph of force on vane (N) against the rate of delivery of
momentum muo (kgm/!2)
Figure 2. Graph of force vane (N) against the rate of delivery of momentum muo
(kgm/!2)
0 2 4 6 8 10 12 14
0 0.5 1 1.5 2 2.5
Force on vane (N)
Rate of Delivery of momentum (kgm/s2)
Graph of force on vane (N) against the rate of delivery of momentum (kgm/s2)
Flat plate
Conical cup
Hemispherical cup
School of Engineering Taylor’s University
9
3.3 Discussions
Figure 3. Graph of force vane (N) against the rate of delivery of momentum muo
(kgm/!2) based on ideal results
The actual slope of the graph can be obtained by using the formula y!!y!X2!X!
Therefore,
For flat plate vane,
0.785/0.593: 1.323
For conical plate vane,
1.178/0.587: 2.006
For hemispherical cup vane,
School of Engineering Taylor’s University
10
1.57/0.66: 2.38
To measure the deviation from real flow from ideal flow,
Actual value/ Ideal value
For flat plate vane,
1.323/1 x100% = 132%
For conical plate vane,
2.006/1.5 x 100% = 134%
For hemispherical vane,
2.38/2.00 x 100% = 119%
1. By adding a small plastics ball into the volume-measuring device the water level at the
indicator can be accurately obtained. Next, the tally and the weigh beam should be lowered
at eye level so that parallax error can be prevented when balancing the jet impact force.
The central part of the jockey weight should be clearly marked so that it is easier to obtain
an accurate distance between the position of center of jockey weight and pivot. Another
thing is allowing the water to fill up just before starting the stopwatch then compare it with
the volume filled up before starting the stopwatch can reduce the error caused by the
reaction time of the stopwatch. Finally, the accurateness of the experiment can be
improved by repeating the step a couple of times.
2. Moment: Force x Perpendicular Distance
Force: Mass x Acceleration
Therefore,
Moment: 0.6 x 9.81 x 0.17: 1.0
a) (0.6 + 0.001) x 9.81 x 0.17: 1.002
School of Engineering Taylor’s University
11
1.002-1.000: 0.002
The difference is negligible because there is small difference.
b) 0.6 x 9.81 x (0.17 + 0.001): 1.006
1.006-1.000: 0.006
The difference is negligible because there is small difference.
3. A real jet has a velocity distribution maximum at the center and zero distribution at the
edge because of the viscosity of the fluid. No slip condition is occurred because of the
viscosity of the fluid. This is because the no slip condition will cause the fluid to have no
velocity relative to the boundary therefore will cause the real jet to have the zero
distribution at the edge. The opening nozzle of the jet is bigger than the walls of the nozzle
because of no slip condition only occurs at the surface around the walls of the nozzle. The
center of the jet has a maximum velocity; the average velocity of the jet will remain
unchanged, uo.
4. The speed of the jet nozzle is u=!/996.5 x 78.5 x 10-6
u=0.224/996.5 x 78.5 x 10-6 = 2.86 m/s
uo = (2.86)2- 0.687=2.73 m/s
When jet has 10% greater area,
78.5 x 110% = 86.4
u=2.54m/s
When jet is 10% slower at vane,
2.73 x 90% = 2.457
u= 2.54m/s
Therefore when the area of the jet is increase by 10% the jet will be 10% slower at the
vane. This can be concluded by the exit speed of the jet is both the same in both
calculations.
School of Engineering Taylor’s University
12
5. When the cone and the hemisphere are faced on the opposite way, the ideal force would
be lower. This is because when both the cone and hemisphere are faced oppositely, there
would be a tip at the center of the vane thus there wills stagnation point at the center of the
vane streamline, which will cause the force to be lower. Momentum theory cannot predict
the actual result due to the theory does not take into account the no slip condition, the
water viscosity, friction between the air particles and lastly the energy that is loss due to
heating. It is only taken account of ideal flow when the momentum of the fluid is
conserved.
6. The water jet will go through the air before hitting the vane. The water molecules will
collide with the air particles causing friction between both molecules and particles. The air
friction will convert the potential energy of the water jet into heat because of friction.
School of Engineering Taylor’s University
13
4.0 Conclusion/ Recommendations
In conclusion, the hemispherical cup vane generates the highest force of the impact of
the jet compared to conical cup vane and the flat plate vane as seen from Figure 2. The
graph on Figure 2 deduced that the force on vane (N) for hemispherical cup vane is the
highest when the rate of delivery of the momentum muo (kgm/s2) is max. The
complications faced during the experiment are the difficulty in obtaining the reading of the
volume on the weighing tank because of the Volumetric Hydraulic Bench is not well
maintained thus the volume-measuring device is foggy. In order to improve this
experiment, a small plastics ball should be put inside the volume-measuring device so that
the indication of water level is much more clear. Next, there is a time delay between the
clogging of the weighing tank and before the stopwatch is start. This can be solved by
filling up the whole weighing tank first and get the volume reading and start the stopwatch
right before the flushing of the water thus producing a much more accurate reading.
School of Engineering Taylor’s University
14
References
1. Frederick Institute Of Technology, undated, Impact of a Jet, 8th November 2011,
http://staff.fit.ac.cy/eng.fm/classes/amee202/Fluids%20Lab%20Impact%20of%20a%20Jet.
pdf .
2. Volunteer State Community College, 14th June 2008, Density of Water (g/mL) vs.
Temperature(oC),8thNovember2011,
http://www2.volstate.edu/CHEM/Density_of_Water.htm.
3. Taylor’s School of Engineering, 2011/2012, Lab Handbook (Impact of Jet), 8th
November 2011.
4. Eric W.Weisstein, 1996-2007, No Slip Condition, 8th November 2011,
http://scienceworld.wolfram.com/physics/NoSlipCondition.html
5. Tom Benson, 11th July 2008, Mass Flow Rate, 8th November 2011,
http://www.grc.nasa.gov/WWW/k-12/airplane/mflow.html
6. R.C. Hibbeler, 2010,Engineering Statics Twelfth Edition, Moment (Chapter 4-Force
Resultant System), 8th November 2011.
Related Documents


