IMO activities on control of IMO activities on control of GHG emissions from ships GHG emissions from ships Eivind S. Vagslid Head, Chemical and Air Pollution Prevention Section Marine Environment Division - IMO

Welcome message from author
This document is posted to help you gain knowledge. Please leave a comment to let me know what you think about it! Share it to your friends and learn new things together.
Transcript

IMO activities on control of IMO activities on control of
GHG emissions from ships GHG emissions from ships
Eivind S. VagslidHead, Chemical and Air Pollution Prevention Section
Marine Environment Division - IMO
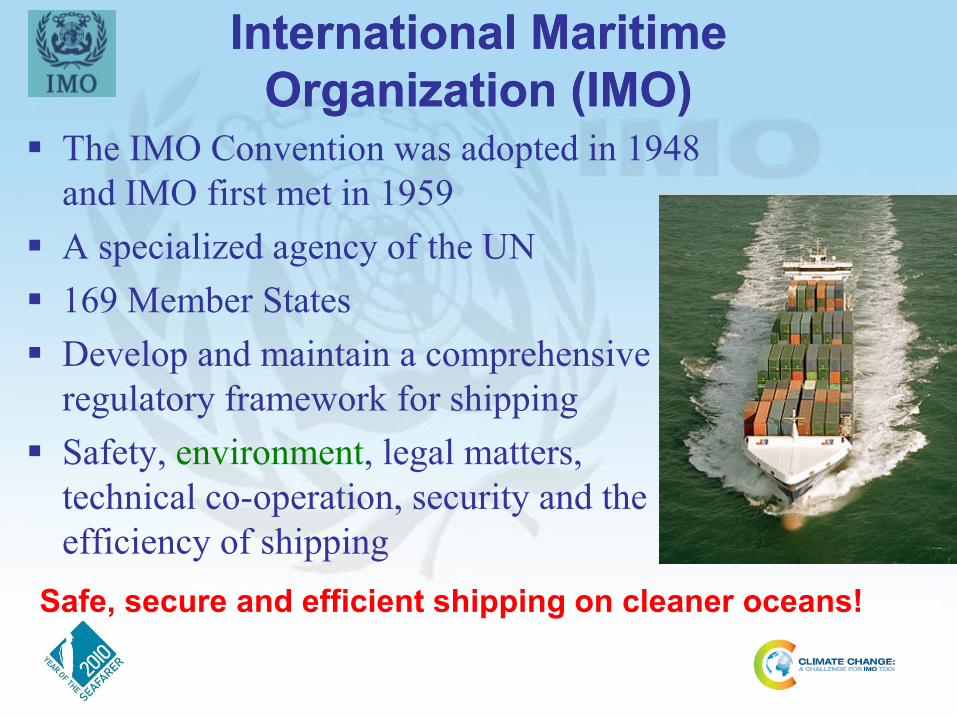
International Maritime International Maritime
Organization (IMO)Organization (IMO) The IMO Convention was adopted in 1948
and IMO first met in 1959
A specialized agency of the UN
169 Member States
Develop and maintain a comprehensive
regulatory framework for shipping
Safety, environment, legal matters,
technical co-operation, security and the
efficiency of shipping
Safe, secure and efficient shipping on cleaner oceans!

Ship emissions one of the last major Ship emissions one of the last major
ship pollutants to be regulatedship pollutants to be regulatedWork started at IMO in the late 1980’s
Annex VI adopted in 1997, in force in May 2005,
revised 2005 – 2008
Revised Annex VI in force 1 July 2010
Prohibits ODS in line with the
Montreal Protocol
Regulates exhaust gas: NOx &
SOx (PM), and cargo vapours
from tankers (VOC)
Energy Efficiency or CO2
emissions not covered

Resolution A.963(23)Resolution A.963(23)
IMO Policies and Practices Related to the Reduction of Greenhouse Gas
Emissions from Ships, adopted by Assembly 23 in December 2003
IMO’s GHG Work has three distinct routes:
A.963(23) requests MEPC to:
− develop a work plan with timetable – (technical/operational culminated at
MEPC 59, the work plan for MBIs culminates at MEPC 62 (Assembly 27))
− establishment of GHG baseline and develop CO2
indexing methodology
Technical - mainly applicable
to new ships - EEDI,
Operational - applicable to all
ships in operation – SEEMP
and EEOI, and
Market-based Measures
(MBM) – carbon price for
shipping, incentive, may
generate funds.

Second IMO GHG Study 2009Second IMO GHG Study 2009
Scenarios for CO2 emissions from International Shipping from
2007 to 2050 in the absence of climate policies
0
1000
2000
3000
4000
5000
6000
7000
8000
2000 2010 2020 2030 2040 2050
CO
2 e
mis
sio
ns fro
m s
hip
s (
millio
n to
ns C
O2
/ y
r) '
A1FI
A1B
A1T
A2
B1
B2
Max
Min
B2
B1
A2
A1T
A1B
A1F
I
Other
Bulk
General Cargo
Container
RoRo /Vehicle
Ropax Cruise
Tank
0 50 100 150 200 250
CO 2 emissions (million tons / yr)
Deep sea ships
Regional ships
Other
Bulk
General Cargo
Container
RoRo /Vehicle
Ropax Cruise
Tank
Other
BulkBulk
General CargoGeneral Cargo
ContainerContainer
RoRo /VehicleRoRo /Vehicle
Ropax CruiseRopax Cruise
TankTank
0 50 100 150 200 250
CO 2 emissions (million tons / yr)
Deep sea ships
Regional ships
0 50 100 150 200 250
CO 2 emissions (million tons / yr)
Ocean going
Coastwise
2007 shipping CO2 emissions 870 million tons
Future CO2 emissions: Significant increase predicted – 200 300%
by 2050 in the absence of regulations
Demand is the primary driver
Technical and operational efficiency
measures can provide significant
improvements but will not be able to
provide real reductions if demand continues
Manufacturing
Industries and
Construction
18,2 %
Other Energy
Industries
4,6 %
Unallocated
Autoproducers
3,7 %
Main Activity
Electricity and
Heat Production
35,0 %Transport
21,7 %
Other Sectors
11,6 %
International
Shipping
2,7 %
International
Aviation
1,9 %
Domestic
shipping &
fishing
0,6 %

Source: Fearnley's Review
World seaborne trade 1968World seaborne trade 1968--2008 2008
Baseline efficiency improvement in historic prespective
0
40
80
1950 1970 1990 2010 2030 2050
Year of construction
g C
O2
/ to
n-n
m (
ind
ica
tive
va
lue
) '
Gen cargo
Container
Bulk
Tanker
0
50
100
150
200
250
300
350
400
450
1950 1960 1970 1980 1990 2000 2010
Fu
el C
on
su
mptio
n (
Mill
ion
to
ns)
This study
IMO Expert Group (Freight-Trend), 2007
Endresen et al., JGR, 2007
Endresen et al (Freight-Trend)., JGR, 2007
EIA Total marine fuel sales
Point Estimates from the Studies
This study (Freight trend)
Efficiency improvements
Fuel Consumption World Fleet

Flag States Number of ships GT DW
Annex I 33.4% 26.1% 22.82%
Non-Annex I 66.6%) 73.9% 77.18%
Distribution of the world fleet March 2008Distribution of the world fleet March 2008ships above 400 GT
Lloyd‟s Register Fairplay
Article 1(b) of the IMO Convention
Encourage removal of discriminatory
actions …. promote the availability of
shipping without discrimination …… not be
based on measures designed to restrict the
freedom of shipping of all flags ….;
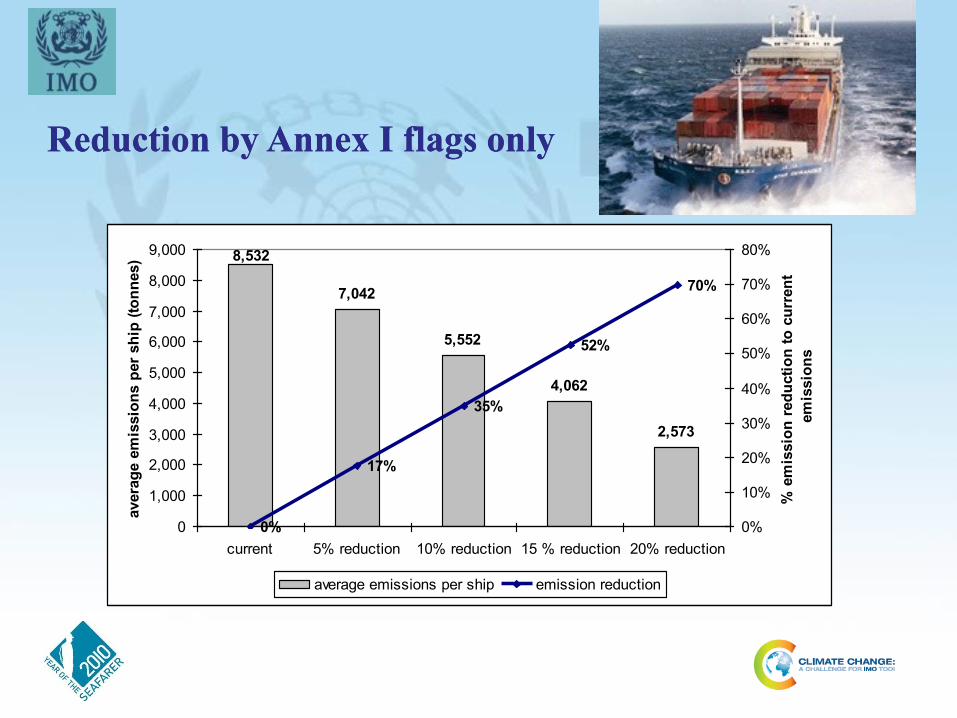
Reduction by Annex I flags only Reduction by Annex I flags only
7,042
5,552
4,062
2,573
8,532
0%
17%
35%
52%
70%
0
1,000
2,000
3,000
4,000
5,000
6,000
7,000
8,000
9,000
current 5% reduction 10% reduction 15 % reduction 20% reduction
avera
ge e
mis
sio
ns p
er
sh
ip (
ton
nes)
0%
10%
20%
30%
40%
50%
60%
70%
80%
% e
mis
sio
n r
ed
ucti
on
to
cu
rren
t
em
issio
ns
average emissions per ship emission reduction

Potential Potential reductions of CO2 emissionsreductions of CO2 emissions
DESIGN (New ships)
Saving of
CO2/tonne-
mile
Combined
Concept, speed & capability 2% to 50%+
Hull and superstructure 2% to 20%
Power and propulsion
systems 5% to 15%
Low-carbon fuels 5% to 15%*
Renewable energy 1% to 10%
Exhaust gas CO2 reduction 0%
10% to 50%+
OPERATION (All ships)
Fleet management, logistics
& incentives 5% to 50%+
Voyage optimization 1% to 10%
Energy management 1% to 10%
10% to 50%+

Technical and Technical and operationaloperationalmeasures agreed at MEPC 59measures agreed at MEPC 59
Energy Efficiency Design Index (EEDI) for new ships – MEPC.1/Circ.681
Voluntary verification of the EEDI –MEPC.1/Circ.682
Ship Energy Efficiency Management Plan (SEEMP) – MEPC.1/Circ.683
Energy Efficiency Operational Indicator (EEOI) –MEPC.1/Circ.684

societyforBenefit
ttalEnvironmenEEDI
cos
Energy Efficiency Design Index Energy Efficiency Design Index --EEDIEEDI
Cost: Emissions of CO2
Benefit: Cargo capacity & transport work
Complex formula to accommodate most ship types and sizes

12
Ship Energy Efficiency Ship Energy Efficiency Management Plan Management Plan -- SEEMPSEEMP
Onboard management tool to include:
Improved voyage planning (Weather routeing/Just in time)
Speed and power optimization
Optimized ship handling (ballast/trim/use of rudder and autopilot)
Improved fleet management
Improved cargo handling
Energy management

Energy Efficiency Operational Energy Efficiency Operational Indicator Indicator -- EEOIEEOI
An efficiency indicator for all ships (new and existing) obtained from fuel consumption, voyage (miles) and cargo data (tonnes)
Cargo OnboardCargo Onboard x x (Distance traveled)(Distance traveled)
Fuel Consumption in OperationFuel Consumption in Operation=
Actual FuelActual FuelConsumptionConsumption
IndexIndex

EEDI and SEEMP EffectsEEDI and SEEMP Effects
0
500
1000
1500
2000
2500
3000
3500
4000
2010 2015 2020 2025 2030 2035 2040 2045 2050
Mt
CO
2
Technical measures
Operational measures
Alternative fuels
EEDI 10%SEEMP 11%
Scenario: A1B Low uptake

EEDI and SEEMP EffectsEEDI and SEEMP EffectsScenario: A1B Optimistic
0
500
1000
1500
2000
2500
3000
3500
4000
2010 2015 2020 2025 2030
2035 2040 2045 2050
Technical measures
Operational measures
Alternative fuels EEDI 39%
SEEMP 28%
MBM
Mt
CO
2

MEPC 61 MEPC 61 –– 27 September to 1 October27 September to 1 October
Further progress made on all three elements of IMO’s GHG work
Technical and operational measuresIntersessional meeting on energy efficiency measures (June/July 2010)
Regulatory text on EEDI and SEEMP finalized
Adoption by MEPC 62 (July 2010)?
In force 1 January 2013?
Market-based measuresReport by MBM Expert Group
Intersessional meeting in March/April 2011

Ship type Cut-off limit
Estimated
CO2
emissions
(tonnes)
Contribution
ratio from
same ship
type
Contribution
ratio to total
CO2 emissions
Bulk carrier 10,000 DWT 175,520,816 98.52% 15.70%
Gas tanker 2,000 DWT 46,871,129 98.50% 4.19%
Tanker 4,000 DWT 213,145,106 95.72% 19.06%
Container ship 10,000 DWT 254,812,434 96.54% 26.07%
General cargo ship
(Including combination
carrier)
3,000 DWT 87,274,101 90.00% 7.80%
Refrigerated cargo
carrier3,000 DWT 18,767,755 97.64% 1.68%
Total coverage --- 796,391,341 96.11% 71.22%

190 190 –– 240 million 240 million tonnestonnes CO2 reduced annually CO2 reduced annually
compared with BAU by 2030compared with BAU by 2030
-
50
100
150
200
250
300
2013 2015 2020 2025 2030
An
nu
al t
on
nes
CO
2 r
edu
ced
Estimated CO2 emission reduction [mill tonnes].
A1B B2


MBM Expert Group established by MEPC 60MBM Expert Group established by MEPC 60
The Experts‟ analysis of the proposed MBM should
address the following nine criteria:
.1 Environmental effectiveness
.2 Cost-effectiveness and potential impact on trade and
sustainable development
.3 The potential to provide incentives to technological change
and innovation
.4 Practical feasibility of implementing MBM
.5 The need for technology transfer to and capacity building
within developing countries, in particular the least developed
countries (LDCs) and the small island development states
(SIDS)

MBMMBM--EGEG
.6 The relation with other relevant conventions (UNFCCC,
Kyoto Protocol and WTO) and the compatibility with
customary international law
.7 The potential additional administrative burden and the
legal aspects for National Administrations to implement
and enforce MBM
.8 The potential additional workload, economic burden and
operational impact for individual ships, the shipping
industry and the maritime sector as a whole, of
implementing MBM
.9 The compatibility with the existing enforcement and
control provisions under the IMO legal framework.

Options reviewed by the MBMOptions reviewed by the MBM--EGEG
Ten MBM proposals were analyzed by the Experts.
These were:
An International Fund for Greenhouse Gas emissions from
ships (GHG Fund) proposed by Cyprus, Denmark, the
Marshall Islands, Nigeria and IPTA (MEPC 60/4/8)
Leveraged Incentive Scheme (LIS) to improve the energy
efficiency of ships based on the International GHG Fund
proposed by Japan (MEPC 60/4/37)
Achieving reduction in greenhouse gas emissions from
ships through port-State arrangements utilizing the ship
traffic, energy and environment model, STEEM (PSL)
proposed by Jamaica (MEPC 60/4/40)

Options reviewed by the MBMOptions reviewed by the MBM--EG (2)EG (2)
The United States proposal to reduce greenhouse gas
emissions from international shipping, the Ship Efficiency
and Trading(SECT) (MEPC 60/4/12)
Vessel Efficiency System (VES) proposed by World
Shipping Council (MEPC 60/4/39)
The Global Emission Trading System (ETS) for international
shipping proposed by Norway (MEPC 60/4/22)
Global Emissions Trading System (ETS) for international
shipping proposed by the United Kingdom (MEPC 60/4/26)
Further elements for the development of an Emissions
Trading System (ETS) for international shipping proposed
by France (MEPC 60/4/41)
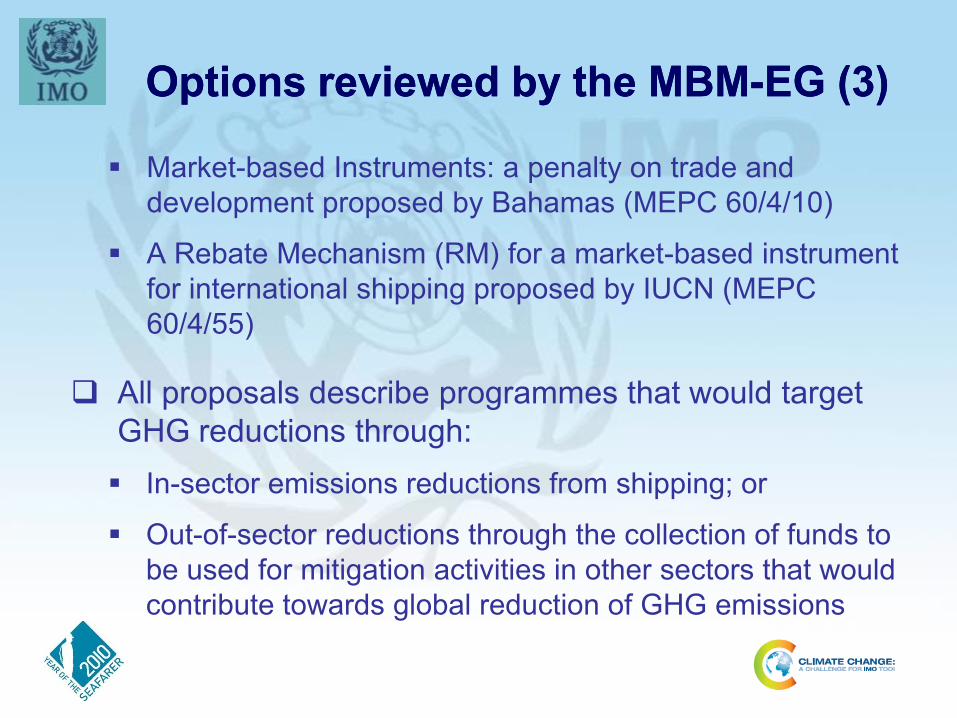
Options reviewed by the MBMOptions reviewed by the MBM--EG (EG (33))
Market-based Instruments: a penalty on trade and
development proposed by Bahamas (MEPC 60/4/10)
A Rebate Mechanism (RM) for a market-based instrument
for international shipping proposed by IUCN (MEPC
60/4/55)
All proposals describe programmes that would target
GHG reductions through:
In-sector emissions reductions from shipping; or
Out-of-sector reductions through the collection of funds to
be used for mitigation activities in other sectors that would
contribute towards global reduction of GHG emissions

ChallengesChallenges
Time constraints
simplified assumptions had to be made when modelling
the MBM
Different levels of maturity of proposals
environmental effectiveness is more easily assessed for
proposals with clearly defined policy objectives
environmental effectiveness of some proposals is
contingent on further policy development

ScenariosScenarios
Modelling scenarios (agreed by EG):
two growth rates (1.65% and 2.8%)
three targets lines /caps for GHG Fund and ETS (0%,
10% and 20% below 2007 level)
28% revenue used for mitigation for Rebate Mechanism
and 25%, 50%, and 75% revenue refunded for LIS
low, medium and high stringency standards for VES and
SECT
two carbon price scenarios (medium and high) and two
fuel price scenarios (reference and high)

Emission reductions in 2030 Emission reductions in 2030 Modelled emission reductions across various scenarios
SECT VES Bahamas GHG
Fund
LIS PSL ETS (Norway
France)
ETS
(UK)
RM
Mandatory
EEDI (Mt)
123 -
299
123 -
299
123 -
299*
MBM In sector
(Mt)
106 -
142
14 -
45
1 -
31
32 -
153
29 -
119
27 -
114
27 -
114
29 -
68
MBM Out of
Sector (Mt)
152 -
584
190 -
539
190 -
539
124 -
345
Total
reductions (%
BAU)
19 -
31%
13 -
23%
10 -
20%
13 -
40%
3 -
10%
2 -
8%
13 -
40%
13 -
40%
13 -
28%
Potential
supplementary
reductions (Mt)
45 -
454
104 -
143
232 -
919
917 -
1232
696 -
870
187 -
517
* Included if the mandatory EEDI is adopted by the committee
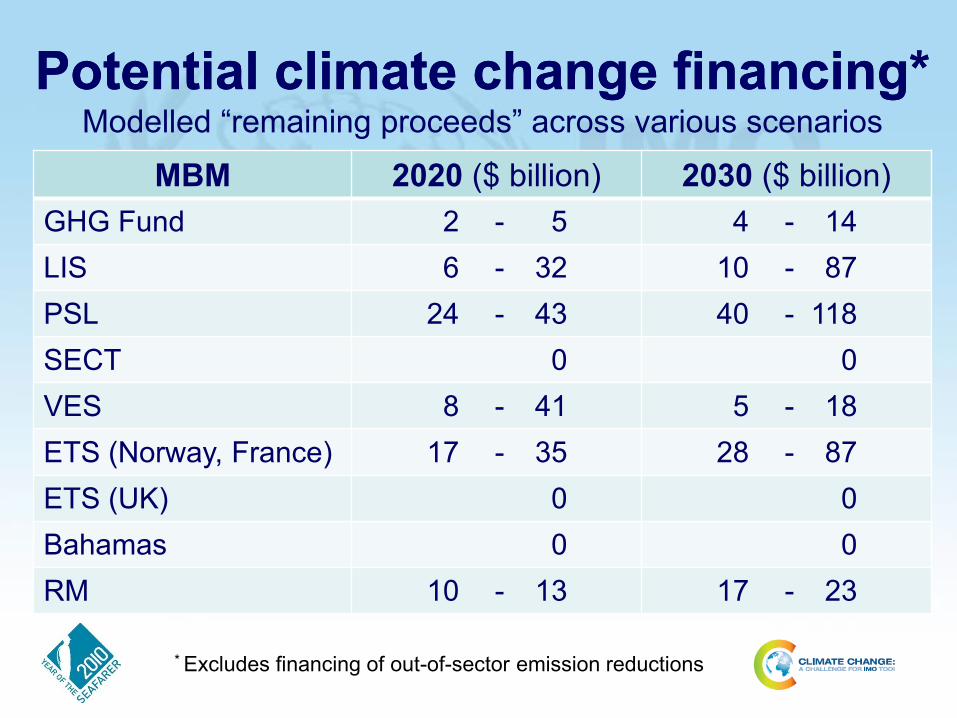
Potential climate change financing* Potential climate change financing* Modelled “remaining proceeds” across various scenarios
MBM 2020 ($ billion) 2030 ($ billion)
GHG Fund 2 - 5 4 - 14
LIS 6 - 32 10 - 87
PSL 24 - 43 40 - 118
SECT 0 0
VES 8 - 41 5 - 18
ETS (Norway, France) 17 - 35 28 - 87
ETS (UK) 0 0
Bahamas 0 0
RM 10 - 13 17 - 23
* Excludes financing of out-of-sector emission reductions

CertaintyCertainty
GHG Fund and ETS(x3) proposals would constrain “net
emissions” to a agreed level
SECT proposal aims for certainty over a relative
efficiency target but absolute emissions would depend
on sector growth
Other proposals do not aim to deliver strict certainty
over a relative or absolute target
polices that guide revenue use could have a
significant influence on the certainty of outcome

Impacts on consumersImpacts on consumers
The larger the market share of domestic
producers, the less likely it is that an exporter
can pass on an increase in transportation costs
to end consumers.
If the good has a high value-to-weight ratio, less
of the increase in freight costs will be passed on
to end consumers.

Impact on ship operators and Impact on ship operators and
technology transfer needstechnology transfer needs
All proposals provide some form of incentives – price or
performance standard – to improve ships technically or
operational efficiencies.
A number of measures could result in fuel savings, but
there may be hurdles to adoption, including access to
technologies or finance.
There could therefore be a need for technology transfer
to help improve ship and operational efficiencies.

Impacts on developing Impacts on developing
countriescountries
Analysis showed impacts will vary by country,
independent of level of economic development
As a result, developing countries, especially SIDS and
LDCs, should not be treated as a collective bloc in
assessing impacts
Those that are closer to their trading partners or have
large exporters will, in general, be less affected than
countries that are further away or have many small
exporters

Example of tradeExample of trade--weighted distances weighted distances
Countries in the SIDS group have both the largest
and the smallest nautical distances weighted by
trade.
LDC
LDC
LDC
LDC
LDC
LDC
LDC
LDC
LDC
LDC
LDC
LDC
LDC
LDC
LDC
SIDS
SIDS
SIDS
SIDS
SIDS
SIDS
SIDS
SIDS
SIDS
SIDS
SIDS
SIDS
SIDS
SIDS
SIDS
SIDS
SIDS
SIDS
SIDS
0 2,000 4,000 6,000 8,000
French Polynesia
New Caledonia
Chile
South Africa
Australia
Brazil
Bangladesh
New Zealand
Nigeria
Madagascar
Qatar
Argentina
Ghana
Mauritius
Togo
Peru
Saudi Arabia
United Arab Emirates
China
Japan
Bolivia
Niger
India
Sri Lanka
Pakistan
Thailand
Korea
Israel
Kenya
Uruguay
Tanzania, United Rep. of
Oman
Fiji
Ethiopia
Malaysia
Sudan
Yemen
Philippines
Guinea
Viet Nam
Singapore
Côte d'Ivoire
Macau (Aomen)
United States of America
Mozambique
Senegal
Mali
Solomon Islands
Namibia
Malawi
Lebanon
Jordan
Costa Rica
Burundi
Ecuador
Venezuela
Rwanda
Guyana
Panama
Armenia
Finland
Vanuatu
Germany
Czech Republic
Malta
Austria
Turkey
Azerbaijan
Hong Kong
Barbados
United Kingdom
Nicaragua
Hungary
Switzerland
Algeria
El Salvador
Iceland
Maldives
Cape Verde
Poland
Cyprus
Italy
Georgia
Guatemala
Syrian Arab Republic
Colombia
Mexico
Greece
Slovakia
Ireland
Sweden
Trinidad and Tobago
Dominican Republic
Spain
Jamaica
Morocco
Moldova, Rep.of
Aruba
Belize
Netherlands
Honduras
Denmark
Bulgaria
Croatia
Estonia
Dominica
Norway
France
Serbia
Mongolia
Belgium
Slovenia
Montserrat
Canada
Macedonia (the …
Portugal
Tunisia
Belarus
Bosnia and Herzegovina
Russian Federation
Albania
Latvia
Lithuania
Luxembourg
Bahamas
nautical miles
Nautical Distance Weighted by Bilateral Trade
Source: Dr Andre Stochniol
Source: Dr. Andre Stochniol
LDC
LDC
LDC
LDC
LDC
LDC
LDC
LDC
LDC
LDC
LDC
LDC
LDC
LDC
LDC
SIDS
SIDS
SIDS
SIDS
SIDS
SIDS
SIDS
SIDS
SIDS
SIDS
SIDS
SIDS
SIDS
SIDS
SIDS
SIDS
SIDS
SIDS
SIDS
0 2,000 4,000 6,000 8,000
French Polynesia
New Caledonia
Chile
South Africa
Australia
Brazil
Bangladesh
New Zealand
Nigeria
Madagascar
Qatar
Argentina
Ghana
Mauritius
Togo
Peru
Saudi Arabia
United Arab Emirates
China
Japan
Bolivia
Niger
India
Sri Lanka
Pakistan
Thailand
Korea
Israel
Kenya
Uruguay
Tanzania, United Rep. of
Oman
Fiji
Ethiopia
Malaysia
Sudan
Yemen
Philippines
Guinea
Viet Nam
Singapore
Côte d'Ivoire
Macau (Aomen)
United States of America
Mozambique
Senegal
Mali
Solomon Islands
Namibia
Malawi
Lebanon
Jordan
Costa Rica
Burundi
Ecuador
Venezuela
Rwanda
Guyana
Panama
Armenia
Finland
Vanuatu
Germany
Czech Republic
Malta
Austria
Turkey
Azerbaijan
Hong Kong
Barbados
United Kingdom
Nicaragua
Hungary
Switzerland
Algeria
El Salvador
Iceland
Maldives
Cape Verde
Poland
Cyprus
Italy
Georgia
Guatemala
Syrian Arab Republic
Colombia
Mexico
Greece
Slovakia
Ireland
Sweden
Trinidad and Tobago
Dominican Republic
Spain
Jamaica
Morocco
Moldova, Rep.of
Aruba
Belize
Netherlands
Honduras
Denmark
Bulgaria
Croatia
Estonia
Dominica
Norway
France
Serbia
Mongolia
Belgium
Slovenia
Montserrat
Canada
Macedonia (the …
Portugal
Tunisia
Belarus
Bosnia and Herzegovina
Russian Federation
Albania
Latvia
Lithuania
Luxembourg
Bahamas
nautical miles
Nautical Distance Weighted by Bilateral Trade
LDC
LDC
LDC
LDC
LDC
LDC
LDC
LDC
LDC
LDC
LDC
LDC
LDC
LDC
LDC
SIDS
SIDS
SIDS
SIDS
SIDS
SIDS
SIDS
SIDS
SIDS
SIDS
SIDS
SIDS
SIDS
SIDS
SIDS
SIDS
SIDS
SIDS
SIDS
0 2,000 4,000 6,000 8,000
French Polynesia
New Caledonia
Chile
South Africa
Australia
Brazil
Bangladesh
New Zealand
Nigeria
Madagascar
Qatar
Argentina
Ghana
Mauritius
Togo
Peru
Saudi Arabia
United Arab Emirates
China
Japan
Bolivia
Niger
India
Sri Lanka
Pakistan
Thailand
Korea
Israel
Kenya
Uruguay
Tanzania, United Rep. of
Oman
Fiji
Ethiopia
Malaysia
Sudan
Yemen
Philippines
Guinea
Viet Nam
Singapore
Côte d'Ivoire
Macau (Aomen)
United States of America
Mozambique
Senegal
Mali
Solomon Islands
Namibia
Malawi
Lebanon
Jordan
Costa Rica
Burundi
Ecuador
Venezuela
Rwanda
Guyana
Panama
Armenia
Finland
Vanuatu
Germany
Czech Republic
Malta
Austria
Turkey
Azerbaijan
Hong Kong
Barbados
United Kingdom
Nicaragua
Hungary
Switzerland
Algeria
El Salvador
Iceland
Maldives
Cape Verde
Poland
Cyprus
Italy
Georgia
Guatemala
Syrian Arab Republic
Colombia
Mexico
Greece
Slovakia
Ireland
Sweden
Trinidad and Tobago
Dominican Republic
Spain
Jamaica
Morocco
Moldova, Rep.of
Aruba
Belize
Netherlands
Honduras
Denmark
Bulgaria
Croatia
Estonia
Dominica
Norway
France
Serbia
Mongolia
Belgium
Slovenia
Montserrat
Canada
Macedonia (the …
Portugal
Tunisia
Belarus
Bosnia and Herzegovina
Russian Federation
Albania
Latvia
Lithuania
Luxembourg
Bahamas
nautical miles
Nautical Distance Weighted by Bilateral Trade

OUTCOMES (MEPC 61/INF.2)OUTCOMES (MEPC 61/INF.2)
All proposals could be implemented in a practical and
feasible manner notwithstanding the challenges
associated with the introduction of new measures.
Policy sensitivities identified vis-à-vis compatibility with
UNFCCC and KP.
Administrative requirements vary, but all proposals will
incur some additional administrative burden.

FOR FURTHER CONSIDERATIONFOR FURTHER CONSIDERATION
Establishment of a supranational administrative body
(paragraphs 8.49 to 8.51)
„carbon leakage‟ (paragraph 8.53)
„CO2 as a pollutant‟ (paragraph 8.67)
Collection of „international‟ contributions being
consistent with national law (paragraph 8.68).

MBMMBM--EG ConclusionsEG Conclusions
In order to elaborate a full comparative analysis, there is
the need for further elaboration and development of
some elements of the proposed measure.
All proposals address the reduction of GHG emissions
from shipping.
Some proposals also put forward a mechanism that
provides for substantial financial contribution to address
the adverse effects of Climate Change.

MBMMBM--EG Conclusions (2)EG Conclusions (2) The proposals suggested different ways of reducing
GHG emissions, some focus on “in-sector” reductions
and others in “out-of-sector” reductions.
Cost effective operational and technical emission
reduction measures are available to the shipping sector,
however, barriers exist in the uptake of many of these
measures.
This study identified that the implications of
implementing the different MBM proposals for
international shipping are directly related to the
stringency of the proposed measures.

MBMMBM--EG Conclusions (3)EG Conclusions (3)
Nevertheless, this study concludes that all proposals
could be implemented notwithstanding the challenges
associated with the introduction of new measures.
The assessment of the impacts of an increase in bunker
fuel prices and freight costs showed that implementation
of the proposed measures would affect some countries
and products more than others.
Some of the proposed measures include mechanism
aiming to provide means to mitigate negative impacts.

MBMMBM--EG Conclusions (EG Conclusions (44))
The proposals lack, to various degrees, sufficient details
for the necessary evaluation of issues such as:
international harmonization in implementation;
carbon leakage;
fraud; and
traffic of vessels between non-party states.
The above issues require further policy considerations
in order to be properly addressed.
Related Documents