Immunosignature of Alzheimer's Disease by Lucas Restrepo Jimenez A Dissertation Presented in Partial Fulfillment of the Requirements for the Degree Doctor of Philosophy Approved October 2011 by the Graduate Supervisory Committee: Stephen Johnston, Chair Eric Reiman Yung Chang Michael Sierks ARIZONA STATE UNIVERSITY December 2011

Welcome message from author
This document is posted to help you gain knowledge. Please leave a comment to let me know what you think about it! Share it to your friends and learn new things together.
Transcript

Immunosignature of Alzheimer's Disease
by
Lucas Restrepo Jimenez
A Dissertation Presented in Partial Fulfillment of the Requirements for the Degree
Doctor of Philosophy
Approved October 2011 by the Graduate Supervisory Committee:
Stephen Johnston, Chair
Eric Reiman Yung Chang
Michael Sierks
ARIZONA STATE UNIVERSITY
December 2011

i
ABSTRACT
The goal of this thesis is to test whether Alzheimer‘s disease (AD) is
associated with distinctive humoral immune changes that can be detected in
plasma and tracked across time. This is relevant because AD is the principal
cause of dementia, and yet, no specific diagnostic tests are universally
employed in clinical practice to predict, diagnose or monitor disease
progression. In particular, I describe herein a proteomic platform developed
at the Center for Innovations in Medicine (CIM) consisting of a slide with
10.000 random-sequence peptides printed on its surface, which is used as
the solid phase of an immunoassay where antibodies of interest are allowed
to react and subsequently detected with a labeled secondary antibody. The
pattern of antibody binding to the microarray is unique for each individual
animal or person. This thesis will evaluate the versatility of the microarray
platform and how it can be used to detect and characterize the binding
patterns of antibodies relevant to the pathophysiology of AD as well as the
plasma samples of animal models of AD and elderly humans with or without
dementia. My specific aims were to evaluate the emergence and stability of
immunosignature in mice with cerebral amyloidosis, and characterize the
immunosignature of humans with AD. Plasma samples from
APPswe/PSEN1-dE9 transgenic mice were evaluated longitudinally from 2
to 15 months of age to compare the evolving immunosignature with non-
transgenic control mice. Immunological variation across different time-points

ii
was assessed, with particular emphasis on time of emergence of a
characteristic pattern. In addition, plasma samples from AD patients and
age-matched individuals without dementia were assayed on the peptide
microarray and binding patterns were compared. It is hoped that these
experiments will be the basis for a larger study of the diagnostic merits of the
microarray-based immunoassay in dementia clinics.

iii
To Dawn

iv
ACKNOWLEDGEMENTS
My studies were funded by grants from the Arizona Alzheimer‘s
Consortium and the Alzheimer's Drug Discovery Foundation (ADDF). I am
indebted to Dr Alex Roher, Dr Bao-Xi Qu and Dr Roger N. Rosenberg for
providing the plasma samples used in most of my experiments, and Kathy
Goehring and Dr Stephen W. Coons for their assistance with
immunohistochemistry. I also acknowledge Dr Bart Legutki, Rebecca
Halperin and John Lainson for their help developing the immunoassay and
for the production and quality-control of microarray slides. Finally, I am
indebted to Drs Phillip Stafford and Kewei Chen for their statistical advice.

v
TABLE OF CONTENTS
Page
LIST OF TABLES ......................................................................................... vii
LIST OF FIGURES ...................................................................................... viii
CHAPTER
1 INTRODUCTION .................................................................................... 1
Frequency of Alzheimer‘s disease ................................................. 1
Symptoms of Alzheimer‘s disease ................................................. 2
Pathophysiology of Alzheimer‘s disease ........................................ 6
Challenges in the diagnosis of Alzheimer‘s disease ...................... 8
Current standard of therapy ......................................................... 13
Inflammatory changes in Alzheimer‘s disease ............................. 14
Humoral autoimmunity in Alzheimer‘s disease ............................ 16
Immunotherapy for cerebral amyloidosis ..................................... 18
Animal models of Alzheimer‘s disease ........................................ 21
Proteomics and protein microarrays ............................................ 25
Types of microarrays .................................................................... 27
Profiling of humoral responses ..................................................... 30
Future directions of protein microarrays ...................................... 31
The CIM random-sequence peptide platform .............................. 31
2 SIGNATURE OF PURIFIED ANTIBODIES AND MURINE PLASMA .. 33
Introduction ................................................................................... 33

vi
CHAPTER Page
Methods ........................................................................................ 35
Results ......................................................................................... 37
Discussion .................................................................................... 59
3 ANTIBODY SIGNATURE OF ALZHEIMER'S DISEASE ..................... 65
Introduction ................................................................................... 65
Methods ........................................................................................ 66
Results ......................................................................................... 68
Discussion .................................................................................... 84
Closing Remarks .......................................................................... 87
REFERENCES .......................................................................................... 90
APPENDICES
A EXPLORING PREDOMINANT FORM OF Aβ IN PLASMA............. .104
B Testing ANTI-Aβ ANTIBODIES IN HUMAN PLASMA ...................... 107

vii
LIST OF TABLES
Table Page 1. Antibody-based therapies for AD in on-going Clinical Trials ............ 21
2. Antibodies analyzed with the microarray platform ............................ 38
3. Clinical and Neuropathological characteristics of patients. ............... 69
4. AD-predicting peptides with alternative statistical techniques..……..83

viii
LIST OF FIGURES
Figure Page 1. Gradual change in paintings by C. Horn. ............................................ 5
2. Appearance of microarray after immunoassay................................. 39
3. Heatmap of different anti-Aβ and anti-tau antibodies. ...................... 40
4. Signatures of affinity-purified antibodies and plasma ....................... 42
5. Histopathological changes in mice. .................................................. 46
6. Immunosignature of transgenic mice................................................ 47
7. Principal component analysis of plasma signature in mice .............. 48
8. Immunosignature changes with Aβ 1-42 immunization. .................. 49
9. Principal component analysis of mice signatures. ............................ 50
10. Changes in mice immunosignature across time. ............................ 51
11. Differences in mice signature according to life stages. .................. 56
12. Classification performance of late mice signatures. ....................... 57
13. Human immunosignature. .............................................................. 70
14. Blocking experiments with Aβ 1-40 beads. .................................... 73
15. Fluorescence of array peptides blocked by Aβ 1-40. ..................... 75
16. Cross-reactivity of different plasma samples .................................. 76
17. Print-run variability……………………………………………………79
18. Stability of human immunosignature. ............................................. 81
19. Stability of immunosignature in principal component analysis ....... 82

1
Chapter 1
INTRODUCTION
Frequency of Alzheimer‘s Disease
Dementia literally means ―losing the mind.‖ It is a term used in
clinical practice to describe the progressive loss of cognitive ability and
related behavioral changes. AD is the principal cause of dementia and a
frequent medical problem. World-wide, it is estimated that 24 million
people are afflicted with AD [1]. In the United States, about 4.5 million
people have diagnosis of AD, a figure that is projected to quadruple by the
middle of the 21st century [2,3]. Although dementia can affect individuals of
all ages, it is more frequent in the elderly, hence the term ―senile‖
dementia. This term, however, has been abandoned; its clinical utility
derived from the distinction between psychiatric diseases seen in young
people, or ―dementia praecox‖ (now called schizophrenia), and the organic
psychosis seen in elderly individuals. AD affects 1/8 of people at age 65
and almost 1/3 of octogenarians [2,3]. The costs to American health care
related to AD approach 100 billion dollars every year [4]. Disease
progression is slow, inexorably advancing over the course of many years.
It is believed that by the time of symptom onset a significant burden of
neuropathology and irreversible neurological damage has already

2
occurred: these presymptomatic neuropathological changes are also
thought to silently evolve over the course of over two decades [5]. Subtle
cognitive problems are very common in elderly individuals without
limitation of activities of daily living; in some instances, these symptoms
may represent the prodromal stages of AD. Such cases of non-disabling
memory and behavioral complaints without sufficient clinical criteria for the
diagnosis of AD (referred to as mild cognitive impairment, or MCI) are at
high risk of developing dementia, converting to frank AD at a rate of 15-
17% per year [3,6-8]. The long prodromal stage of AD presents an
opportunity to detect individuals who are pre-symptomatic or minimally
impaired.
Symptoms of Alzheimer‘s disease
AD can affect any part of the brain, although the most typical
involvement is the hypoccampal formation, amygdala, nucleus basalis of
Meynert, and entorhynal cortex [9]. This localization explains in part the
initial symptomatology of the disease. The most typical presentation is an
amnestic syndrome with subtle progression, reflecting ―to a certain
degree― a predominance of bilateral medial temporal lobe dysfunction
[8,9]. Many patients and family members confuse these initial symptoms
with the manifestation of normal aging. However, AD can sometimes have

3
a non-amnestic presentation, which may become a source of clinical
confusion with other types of dementia. This presentation may feature
language problems, particularly word-finding difficulties (called ―anomia‖),
visuo-spatial deficits involving spatial cognition, (i.e., ―agnosia‖; this may
involve impaired identification of things, places and even faces ―which is
called ―prosopagnosia‖) and difficulties reading or writing (called ―alexia‖
and ―agraphia‖). Finally, AD can present with ―executive dysfunction,‖
featuring difficulties making sound decisions (i.e., financially or personally)
and solving problems. Subsequently, cognitive and behavioral changes,
―which mainly reflect a more global frontal and temporal lobe
dysfunction― may ensue, with apathy, change in interest in usual
activities, poor judgment, derangement of introspection, and speech
difficulties. Other common symptoms with advanced stages of AD are
confusion, wandering, perceptual limitation (visual and auditory),
depression, hallucinations and paranoid delusions, which greatly
complicate the care and social life of AD patients and their families.
Hence, AD eventually leads to a broad ―organ failure,‖ with drastic
intellectual deterioration, personality changes and severe limitation of
activities of daily living, which render patients largely dependent on care-
takers. During these stages, patients are also prone to accidents, infection
(pneumonia and urinary tract) and may experience serious neurological
side-effects from commonly-prescribed medications.

4
The global brain derangement caused by AD is illustrated by the
case of a famous graphic artist, Carolus Horn [10]. Horn was active,
preserving until the end of his life the discipline of daily painting. He used
in his paintings recurrent themes that offer a glimpse into the sequential
changes of visual perception and constructional praxis that he confronted
when working on a familiar subject. Figure 1 shows six different depictions
of a Horn‗s favorite theme, the old bridge in Venice. Strikingly, there is an
initial change in the choice of colors, transitioning from dark hues to a
more lively variety of yellows, as well as a progressive abandonment of
detail and perspective that are hardly attributable to a change of style or
taste. Horn‘s last drawing displays the same artistic dexterity of a four
year-old boy.

5
Figure 1: Gradual change in the quality of paintings by C. Horn.
Fig. 1. Progression of Alzheimer‘s disease reflected on C. Horn‘s visual art.

6
Pathophysiology of Alzheimer‘s Disease.
AD is an age-related disorder characterized by the abundant
deposition of the β-amyloid (Aβ) peptide in the brain parenchyma and
cerebral vasculature. Aβ is generated from the cleavage of the amyloid
precursor protein (APP) by the sequential processing of β-secretase
cleaving enzyme 1 (BACE) and gamma-secretase. Studies of patients
with trisomy 21 and families with pre-senile dementia suggest that Aβ
plays a pivotal role in AD pathogenesis [11]. However, genetic mutations
account for merely 1% of AD cases. The two most important risk factors
associated with the disease are advanced age and the Є4 allele of
apolipoprotein E (apo E) [5,8]. Apo E is a lipid transport protein produced
in the nervous system predominantly by glia; humans possess a
combination of two of the following alleles: 2, 3 and 4. However, the
presence of Є4 allele by itself does not lead to AD, given that roughly one-
third of AD patients lack the gene and some homozygotes may not
develop AD. Put differently, the factors leading to AD are not understood
in 99% of cases. Thus, the cause of sporadic AD is intricate and multi-
factorial, with contributions from inherited and environmental factors.
Aβ deposition in the extracellular space of the brain is considered a
fundamental feature of AD pathology. However, the production of Aβ is not

7
limited to the central nervous system, and the peptide circulates in plasma
preferentially bound to several carrier proteins, including albumin, α-2
microglobulin, apo E, apolipoprotein J, Imunoglobulin G and fibrinogen.
The predominant laboratory method used for Aβ detection in body fluids is
an immunoassay, ―double-sandwich‖ ELISA, in which plates are coated
with anti-Aβ antibodies, then samples are added and finally, another
antibody directed against Aβ is added; this can be detected with a
secondary antibody labeled with horseradish peroxydase. This technology
is not easy to interpret, as the immunological properties of Aβ change as it
polymerizes.
Most studies suggest that Aβ 1-42 levels in the cerebro-spinal fluid
(CSF) of AD patients detected (using double-sandwich ELISA techniques)
are lower, on average, than those of control individuals [5]. This is
attributed to the depletion of the monomeric form of Aβ as its
polymerization occurs in the brain parenchyma. On the other hand, most
reports show no differences in plasma Aβ levels between sporadic AD
cases and non-demented controls, although total plasma Aβ and Aβ 1-42
levels are increased in cases of familial AD with presenilin or amyloid-
precursor protein gene mutations, as well as in trisomy 21 [11]. However,
it is presently unclear whether there is a predominant form of Aβ 1-40 and
Aβ 1-42 that circulates in plasma (i.e., monomer, oligomer or fibrillary). It is

8
argued that the discrepancy across studies of Aβ plasma levels is due to
the different populations tested, duration of studies, intensity of follow-ups,
and variability of analytical tools used. In addition, differences in carrier
protein expression appear to influence Aβ levels in plasma and their
immunoreactivity, since the interaction between Aβ and transport proteins
could potentially hide epitopes recognized by antibodies used in double-
sandwich ELISAs [12]. Finally, Aβ oligomers have different immunological
behavior compared to monomers and fibrils [13].
Current challenges in the diagnosis of Alzheimer‘s Disease
No specific tests exist currently for the diagnosis of most types of
dementia, including AD. The gold standard of AD diagnosis is its
characteristic neuropathology described more than 100 years ago by Alois
Alzheimer, which consists of senile plaques, neurofibrillary tangles and
astrogliosis. This information is rarely available for treating physicians,
who may corroborate or discard the diagnosis only through autopsy, when
the information is hardly relevant. In the absence of a histopathology
report, AD is a diagnosis of exclusion. Contrary to other medical
conditions that are evaluated with specific tests (i.e., acute ischemic stroke
is confirmed with diffusion-weighted magnetic resonance imaging, or
MRI), the typical diagnostic work-up of dementia does not test directly for

9
AD. Instead, physicians test for other neurological diseases that can lead
to dementia, including stroke, syphilis, hypothyroidism and vitamin B12
deficiency, leaving AD as a probability. The recent revision of the 1984
criteria for AD diagnosis by the National Institute on Aging and the
Alzheimer‘s Association still reflects tremendous diagnostic uncertainty,
which is patent even at the semantic level [14]. For instance, the
diagnostic categories include: ―probable,‖ ―possible‖ and ―probable AD
with evidence of the AD pathophysiological process.‖ This is in spite of the
important advances in molecular and radiological diagnostics that we have
discussed. Although AD is a reasonable assumption in suitable clinical
scenarios, this judgment is prone to error. In fact, the diagnosis of
―probable‖ AD during life is corroborated in 65-80% of cases submitted to
autopsy under ideal conditions, i.e., when the diagnosis is made by a
dementia specialist. In other words, under the best circumstances, 1 out of
every 5 patients currently receives an incorrect diagnosis of AD.
Correct disease classification is imperative for many reasons:
firstly, some dementias do not respond to the usual symptomatic
treatment recommended for AD (i.e., cholinesterase inhibitors) or may
even become worse with it. Secondly, the prognosis of several dementias
is substantially different from AD; for instance, prion diseases have a rapid
progression in a few weeks, whereas AD evolves over the course of years

10
or even decades. Lastly, clinical trials involving patients with AD can not
be considered definitive considering that about 20-25% of enrolled
subjects may not have the disease. On the other hand, correct prediction
of AD in persons presenting with vague cognitive complaints (i.e., MCI)
may present opportunities to slow the progression of neurological decline.
Therefore, a diagnostic test that helps refine the classification of AD will
have a very positive impact on patient care.
Many therapeutic strategies for AD have emerged recently, holding
the promise of altering disease course. These include inhibitors of the
amyloid precursor protein (APP) cleaving enzymes [16] or tau protein
aggregation [7], as well passive immunization with specific anti-amyloid
antibodies and pooled human gamma globulin [17], which will be
discussed in more detail later on. As these approaches to treatment move
forward to phase 3 clinical trials, the need for reliable tests to diagnose AD
will only become more relevant. It is equally important that new diagnostic
options are practical and inexpensive, particularly whenever pre-
symptomatic diagnosis is concerned. In this regard, it is important to
consider that positron-emission tomography (PET) is not universally
available, MRI is expensive and has contraindications (such as the
presence of implanted metal devices), while the measurement of proteins

11
in the cerebrospinal fluid requires a lumbar puncture, which is an invasive
procedure.
There is a long list of potential biomarkers for AD; however, of
many surveyed to date, none is used routinely in dementia clinics.
Historically, AD biomarkers have derived from the amyloid cascade,
cytokine signaling and neurotubule biology. These tests include: genetic
testing on selected cases (i.e., Є4 allele), measurement of Aβ 1-42, total
tau, and hyperphosphorylated tau (181p) in cerebrospinal fluid;
assessment of cerebral glucose metabolism with FDG-PET; imaging
cerebral Aβ deposition using PET with Pittsburgh-B compound (PIB, which
binds to amyloid); estimating hippocampal volume using MRI; and
standard memory performance tests [7,18]. The present section will briefly
describe some of them.
Currently, PIB is the only amyloid imaging test. It has the drawback
of a very short half-life (only 20 minutes), requiring that the compound be
made on site with a cyclotron. This is hardly practical, as this is available
in only 20 centers nation-wide. A new radiotracer with a longer half-life
was recently developed by Eli Lily, 18F florbetapir (Amyvid), and may
become available for clinical use in 2012 [18]. The problems associated
with PET are the exposure to radioactive tracers, which make the

12
technology unsuitable for frequent follow-up imaging; in addition, the
anatomical definition of images is far from that obtained with MRI. It is also
clear that many people with abnormal PET (PIB and FDG) do not have AD
or may even lack symptoms of dementia, suggesting that PET techniques
lack specificity for AD. Decreased total apo E plasma levels and low apo
E4 have been detected in AD patients, particularly in individuals with the
Є4 allele. These low plasma levels were inversely correlated with cerebral
load of Aβ estimated by PIB [19].
Perhaps the most promising biomarker to date is the CSF signature
of Aβ 1-42, total tau, and phosphotau (phosphorylated at threonine 181).
The concentration of these biomarkers is done simultaneously with a
multiplex immunoassay using the xMAX Luminex platform with 3 specific
capture monoclonal antibodies. Using CSF from 56 autopsy-confirmed AD
patients as gold standard, the measurement of Aβ 1-42, levels in CSF
provided a diagnostic sensitivity of 96.4% on a cohort of 100 AD patients
and 114 age-matched controls [5]. A very promising aspect of this set of
biomarkers is that a profile consistent with AD (low Aβ 1-42, high tau) can
be used to predict conversion of MCI to frank AD with a high degree of
accuracy.

13
Current Standard of Therapy
Several pharmaceuticals are approved by the FDA for AD
treatment, although none of these can modify the course of the disease,
and are mainly used to improve cognitive symptoms and functional scores
[19,20]. No medications are routinely used to decrease neuroinflammation
or decrease the bulk of cerebral amyloidosis. The principal drugs currently
used in dementia patients are the acetyl-cholinesterase inhibitors, which
increase the concentration of acetylcholine in the postsynaptic cleft in the
central nervous system. Donepezil, rivastigmine, tacrine and galantamine
are all acetyl-cholinesterase inhibitors [19,20]. Of these, donepezil is the
most used agent, in part because is well tolerated and can be used once
per day. N-methyl-D-aspartate (NMDA) antagonists are also frequently
used in dementia. This type of drug is exemplified by memantine, which
reduces glutamate-mediated neuro-toxicity. Many patients with AD require
other psycho-tropic medications to modify behavior and improve affect.
Many medications need be used in combination, in order to attain a
desired effect. A common combination that has been proven beneficial in
clinical trials is the addition of memantine to donepezil. Unfortunately,
these medications do not alter neurological progression. Finally, careful
modification of cardio-vascular risk factors and keeping overall a good
state of health may also be relevant to slow disease progression. Several
new drugs are being tested for safety and efficacy. To date, emphasis has

14
been on strategies to manipulate Aβ production, but other mechanisms
targeted in phase III trials include: inhibition of Aβ aggregation,
antioxidants, γ-Secretase modulation (including 3-hydroxy-3-methyl-
glutaryl-CoA reductase inhibitors, or statins), nerve growth factor mimics,
and peroxisome-proliferator activated receptor γ (PPARγ) agonists [19].
Inflammatory Changes in Alzheimer‘s Disease
Although AD is considered primarily a neurodegenerative disease,
a constant finding in affected individuals is inflammation, which is
demonstrable in the central nervous system as well as plasma [21-23]. It
is well known that antigen-presenting cells such as astrocytes and
microglia are recruited to areas of senile plaque deposition and various
cytokines are upregulated in brain and plasma of AD cases [23]. The
immune system‘s participation in AD pathophysiology has different facets
that can be deemed either favorable or detrimental [21]. For instance, the
phagocytic clearance of highly insoluble proteins from the extracellular
space, as well as removal of cellular debris, can be construed as
beneficial aspects of neuro-inflammation. On the other hand, cytokines
released by activated microglia and complement activation can promote
cytotoxicity and accelerate neuronal degeneration [21]. The importance of
systemic inflammation in AD is such that a characteristic cytokine

15
expression pattern in plasma has been used as a potential diagnostic tool
for this kind of dementia. Indeed, a study [22] showed that a 120-protein
double-sandwich ELISA microarray of plasma cytokines can be used to
classify blinded samples from patients with clinical diagnosis of AD,
vascular dementia, and non-demented controls with almost 90% accuracy.
Furthermore, 18 over-expressed cytokines identified MCI cases that
converted to AD.
The premise of a beneficial neuroinflammatory response has
promoted research aiming at harnessing the immune system for the sake
of clearing cerebral amyloid deposits [17-19]. The aim of this strategy is to
modify the natural course of AD. Several studies using transgenic mice
bearing human mutations leading to AD show that active immunization
with Aβ can indeed clear plaques from the brain of treated animals [17-
19]. This information seemed compelling enough to justify a human trial in
which AD patients were vaccinated with synthetic Aβ 1-42. [17]. This trial
had to be stopped prematurely during its phase 2 because of a 6%
incidence of T-cell mediated encephalitis in the active treatment arm.
However, vaccinated individuals who developed measurable anti-Aβ
immunoreactivity in plasma experienced clinical improvement. The post-
mortem examination of a few vaccinated patients showed inconspicuous
senile plaques within the brain parenchyma despite otherwise typical

16
findings of AD, including prominent amyloid angiopathy [17]. Alternative
immunotherapeutic strategies have emerged, including passive
immunization with amyloid-binding antibodies, which can also clear
plaques in transgenic mice, as we will discuss later.
Evidence of humoral auto-immunity in Alzheimer‘s Disease
Both plasma and cerebrospinal fluid contain naturally-occurring
anti-Aβ antibodies in normal and pathological conditions [24-26]. However,
many other antibodies targeting self-antigens are encountered in
neurodegenerative diseases [27,28]. It is possible that the
neurodegenerative process of AD offers a growing assortment of epitopes
to the immune system, which may predate the symptomatic stage. The
potential exposure of brain antigens to immune surveillance is facilitated
by the progressive derangement of the blood-brain barrier that
accompanies AD. Virus-transformed B cells from demented individuals
have been shown to produce anti-Aβ antibodies [29], while sera from
normal individuals contain antibodies that bind fibrils of amyloidogenic
proteins, such as Aβ1-40, serum amyloid A, islet amyloid polypeptide, and
transthyretin [30]. The latter antibodies do not cross-react with their
respective monomers and inhibit fibrillogenesis in vitro. This may
represent a physiological anti-amyloidogenic function (or misfolded protein

17
fail-safe mechanism) of immunoglobulins. In fact, anti-Aβ antibodies
purified from immunoglobulin preparations can prevent amyloid fibril
formation and thwart Aβ neurotoxicity [26]. This, however, is in contrast
with a report showing that serum from APP transgenic mice augmented
Aβ toxic effects on cultured hyppocampal neurons [31]. Pharmacological
immunoglobulin preparations (IVIG) used for common neurological
diseases can bind Aβ in vitro and decrease total Aβ and Aβ1-42 levels in
the cerebrospinal fluid [24]. Studies using ELISA platforms with synthetic
Aβ monomers have revealed that AD patients have anti-Aβ antibody titers
that may be elevated [31,32], low [25], or similar [23] to those detected in
controls without dementia. Another study using ELISA plates coated with
oligomeric cross-linked β-amyloid protein species (CAPS) showed that
anti-CAPS antibodies were reduced in AD patients compared to non-
demented controls, suggesting that these antibodies may alter the
susceptibility to developing AD [33]. It is unknown why normal individuals
have anti-Aβ antibodies, although exposure to environmental mimotopes
of Aβ, such as the potato virus Y has been proposed [34]. On the other
hand, a recent report revealed that both AD patients and healthy elderly
individuals possess circulating antibodies that react against tau protein
(unphosphorylated and hyperphosphorylated) [35]. Some of these
antibodies were of the IgM class, indicating an acute immune process.

18
As we mentioned, many auto-antibodies commonly detected in
auto-immune diseases are frequently found both in patients with AD and
seemingly normal elderly individuals. For instance, the anti-nuclear
antibodies are found in about 30% of normal elderly individuals at low
titers (i.e., about 1:80) [27]. Many patients with AD test positive for anti-
nuclear, anti-parietal cell and anti-thyroid microsomal antibodies [27,28]. It
is presently unclear whether the titer of circulating antibodies against Aβ,
tau and other relevant antigens changes overtime and whether these
changes, if any, may correlate with different clinical stages of the disease
(for instance, the transition from normal cognition to MCI and finally, to
frank dementia). Results of experiments carried out to evaluate the
presence of anti-Aβ antibodies in human plasma samples are presented in
Appendix 2.
Immunotherapy for Cerebral Amyloidosis
Immunotherapy for cerebral amyloidosis can be divided into active
and passive. The earliest report of active immunotherapy in mouse
models of AD was by Schenk and colleagues [36], who vaccinated a
group of transgenic mice with aggregated Aβ. The mice used in these
experiments had a mutation in the APP gene leading to a phenotype that
featured progressive cerebral amyloidosis. Aβ1−42 vaccination both

19
before and after the expected onset of cerebral amyloidosis resulted in
extensive clearing of plaque pathology. Other investigations showed
similar results, with pathological and neurological improvement of treated
animals [37,38].
These results served as the basis for a phase 1 study in patients
with AD [39]. The study enrolled 80 elderly individuals who were randomly
assigned to either aggregated Aβ1−42 (called AN1792) or placebo
delivered intramuscularly 4 times over 6 months. A phase 2 trial followed,
which had to be stopped prematurely because of 18 / 298 instances of
subacute meningoencephalitis (6% of patients), [40] a predominantly T-
cell inflammatory disease that did not correlate with anti-Aβ antibody titers.
Mirroring effects on vaccinated TG mice, antibodies developed by AD
patients preferentially targeted Aβ‘s amino-terminus, binding monomers
and fibrils alike [41]. However, significant antibody titers were detected in
about 20% of patients, underscoring the technical difficulties of the
employed detection system (ELISA) and overall lack of suitable biomarker
availability in AD clinical trials. Although clinicopathological reports [42] of
vaccinated subjects suggest some clearing or redistribution of senile
plaques, this did not seem to translate into measurable cognitive
improvement.

20
Passive vaccination is another strategy aimed at counteracting
cerebral amyloidosis. Injection of monoclonal antibodies produce marked
neurological improvement in mice, even if plaque pathology or brain Aβ
levels were not significantly affected [43-45]. This apparent ―dissociation‖
between effects on behavior and effects on plaques is not explained
entirely by neutralization of Aβ in the brain, although it is possible that
certain forms of Aβ deemed more toxic, such as oligomers, have not been
always reported, or measured with techniques with debatable merit. Brody
and Holzman, [46] on the other hand, aptly point out that ―a fundamental
issue that complicates interpretation of all these results is that we do not
know whether behavioral abnormalities seen in TG mice are analogous to
any of the cognitive deficits seen in humans with AD.‖ A potential problem
with passive immunization is intra-parenchymal brain hemorrhages
associated with amyloid angiopathy. It is possible that mobilization of Aβ
out of the brain elicited by therapy may exacerbate amyloid deposition in
arterioles, a finding that is common in mouse models and almost universal
in AD patients. Notwithstanding these caveats, a single dose of a
humanized monoclonal antibody (LY2062430, or solanezumab) as
potential AD treatment did not result in significant side-effects in 19
patients [47]. Treatment was not associated with meningo-encephalitis,
cerebral hemorrhage, or brain edema. Therapy led to dose-dependent
increases in Aβ levels in both plasma and CSF. Solanezumab is
undergoing two separate phase 3 trials: a placebo-controlled trial in Japan

21
(EXPEDITION, ongoing but no longer recruiting patients), and an open-
label trial which is currently enrolling patients [48]. Table 1 summarizes
current clinical trials of antibody-based therapies for AD.
Table 1
Antibody-based therapies for AD in on-going Clinical Trials
___________________________________________________________
Antibody Company Biomarker Stage
___________________________________________________________
Bapineuzumab Pfizer 11C-PIB Phase 3
Solanezumab Eli Lilly/Elan Plasma Aβ level Phase 3
Gantenerumab MorphoSys/Roche PIB Phase 2
Human IVIG Baxter None Phase 3
___________________________________________________________
Animal models of Alzheimer‘s disease
Central to the understanding of any human disease is the creation
of an animal model. Many animal models of AD have been developed to
date, with variable degrees of success at replicating the histopathology
and neurological impairment observed in humans. Needless to say, these

22
animal models are considered an approximation to the human problem.
Careless extrapolation from animal models to the highly complex and
often times messy circumstances of the average human patient, are
recipes for confusion and disappointment. Indeed, laboratory animals are
always raised and treated under controlled circumstances, offering a
―pure‖ and replicable phenotype, while human‘s phenotypes are the
product of many synergistic processes, some of which are entirely
fortuitous or unknown ―in short, patients are impure models.
An important step in the development of animal models of AD was
the application of recombinant technology to the creation of transgenic
animals with genes from humans with inherited forms of early-onset AD.
The first used gene was a mutant form of the APP [49,50]. However, these
early transgenic animals failed to express a meaningful AD-like
neuropathology. Subsequently, Games and colleagues [51] were able to
express elevated levels of the V717F mutant form of APP using a platelet-
derived growth factor (PDGF) mini-promoter. These mice, known as
PDAPP transgenics, recapitulate many pathological features of AD,
including broad Aβ extracellular accumulation (spreading from the
hippocampus and increasing with age), astrocytosis and neuritic
dystrophy. The PDAPP mice exhibit cognitive problems, although its
correlation with observed neuropathology is unclear.

23
The second set of mutant genes used to create transgenic mice is
the Presenilin-1 and -2. Deletion of Presenilin-1 in mice proved to be lethal
immediately after birth, leading to a severe phenotype featuring gross
skeletal deformities, impaired neurogenesis and intraventricular
hemorrhage, all in part attributable to the important role of Presenilin-1 in
embryo‘s Notch processing [52]. On the other hand, Presenilin-2 knockout
mice are viable, although they develop pulmonary fibrosis [53].
To increase production and, more importantly, cerebral deposition
of Aβ, some investigators pursued the idea of crossbreeding APP and
Presenilin-1 mutant mice. Indeed, transgenic animals co-expressing a
mutant Presenilin-1 gene (called A264E) together with a mutant APP gene
from a Swedish family (APP Swe) had higher Aβ levels in brain and
heavier plaque formation than mice carrying only one of the individual
mutations [54]. A similar phenotype was obtained with mice carrying the
Presenilin-1 M146L mutation and the APP Tg2576 mutation [55]. Although
plaque formation begins at 6 months of age in these mice, cognitive
problems are observed as early as 3 months of age.
Finally, transgenic mice have been engineered with 3 mutations
involving Presenilin-1 (M146I gene), APP (SW) and tau (P301L),

24
controlled by the mThy1.2 promoter [56]. This triple transgenic mice model
leads to overproduction of tau compared to mice with single tau mutations,
developing amyloid-laden plaques at 6 months of age and subsequent
neurofibrillary tangle formation scattered through the hippocampal and
cortical regions, resembling human AD pathology. Interestingly, ApoE null
mice do not have plaque deposition or a discernible neurological
phenotype; these mice, however, develop severe atherosclerosis,
particularly affecting the aorta [57]. Nevertheless, mutant APP expression
on apoE knockout mice significantly reduced (but did not abolish) cerebral
plaque formation [58].
Many animal species other than mice have been used for the study
of AD. These include non-human primates, the fruit fly Drosophila, the
sea lamprey, and the nematode Caenorhabditis elegans. Each of these
animal models possesses a set of advantages, although ultimately, all
share the same disadvantage: fundamental differences in anatomy,
physiology and cognition compared to humans with dementia. For further
details about animal models of neurodegenerative diseases, the reader is
referred to the two extensive reviews by Götz and colleagues [49,50] As
we will see in Chapter 1, we used TG mice bearing two mutations from
patients with familial AD (APPswe/PSEN1-1dE9) to track age-related
changes in their humoral immune repertoire.

25
Proteomics and Protein Microarrays
Proteins, to use Virginia Espina‘s expression, are ―the verbs of the
cell‖ [59]. Proteomics, then, is the analysis of cellular grammar: the make-
up of a biological system and the changes that occur not only in response
to physiological and pathological conditions, but also as result of different
manipulations (i.e., pharmacological, physical, etc.). It is expected that the
knowledge derived from such analyses may lead to diagnostic tests, and
that important insights into specific molecular mechanisms of disease may
lead to novel therapies. The decoding of the genome of numerous
species, including humans, has been the stepping stone of proteome
mining, because the knowledge of species-specific gene sequences
allows the projection of the amino acid constitution of peptidic chains [59-
61]. Such wealth of information permits the identification of important
components of cells, tissues, and body fluids. It is also hoped that
proteomics may help select individuals who are likely to benefit from
therapies or monitor response to therapy or disease course [60-61].
Traditional proteomic procedures rely on protein separation to
facilitate analysis. These procedures include SDS-PAGE and two-
dimensional gels, which can subsequently be analyzed with mass
spectrometry. Needless to say, many limitations have become apparent

26
with these approaches; the main problem being the small amount of
relevant protein available in a biological sample. It is clear that gene
transcription and protein expression are not well correlated [60-61]. In
addition, genomic arrays cannot convey information about post-
translational protein modifications or protein–protein interactions. Many
times, highly expressed proteins cloud the relative importance of other
proteins that are present in samples at much smaller concentrations [60-
61]. In addition, conventional analytical methods may be associated with
considerable cost and time consumption. These limitations provoked the
emergence of many new proteomic platforms, including protein
microarrays.
Microarrays permit the simultaneous analysis of several molecules
within the same experiment. Such molecules are spotted in parallel rows
and columns onto a solid support, and then allowed to react with samples
containing other binding molecules. The location and intensity of binding
within each spot requires of sensitive detection systems, which are
generally based on mass spectrometry, radioactivity, electrochemistry,
chemiluminescence or fluorescence [62]. Since the location and
composition of each spot is known beforehand, signals indicative of
binding can be attributed to the interaction of a specific molecule in the
array, an identification which can be facilitated by software.

27
Types of microarrays
The first microarrays employed parallel synthesis of nucleotide
chains on cellulose discs contained in columns or plastic pins. An
important milestone was the subsequent development of the SPOT
method, in which peptides are synthesized in parallel on a solid platform
such as cellulose panes using droplets on a porous membrane‘s surface,
with an attached reactor for chemical synthesis. This became a popular
method because the relative simplicity of microarray manufacture and
detection. Nucleotide arrays enjoyed enthusiastic attention thereafter and
experienced vigorous development during the eighties and nineties, being
used for genotyping (of species, individuals, point mutations, single point
mutations, and short tandem repeats) and gene expression studies.
However, the development of protein arrays lagged for almost 2 decades,
in part because of the greater chemical complexity of polypeptide chains,
and also because of their greater structural frailty.
There are two broad approaches to protein microarray production:
(a) the so-called ―abundance‖-based array, in which capture molecules
(i.e., antibodies) are spotted on a solid phase; and (b) ―function‖-based
arrays, in which proteins are generated from cell-free expression systems
and printed on a slide‘s surface [63]. Several detection systems are

28
employed to detect the binding of relevant molecules to the arrays. For
instance, the features printed on the array can be labeled directly with
fluorescent molecules. Alternatively, ―sandwich‖ immunoassays can be
employed, in which analytes are captured by immobilized antibodies,
which in turn are detected with a labeled secondary antibody [22].
Monoclonal, polyclonal and recombinant antibodies can be printed on a
slide‘s surface and used to detect proteins from any source. Evidently,
antibodies will need to adhere preferentially to the microarray‘s solid
phase by the Fc portion, in order to have the hyper-variable regions
available for epitope capture. Different antibodies targeting different
proteins can be printed on pre-arranged spots with pre-set concentrations,
to allow the correct identification and quantification of binding. This
technology has been used to characterize the ―signature‖ of neoplastic,
autoimmune and infectious diseases [63].
In other microarrays, proteins are attached to the slide‘s surface
through a chemical linkage, i.e., a covalent bond, which is the
predominant type of microarray used at the CIM. Reverse phase protein
blot is another production strategy, in which a sample containing many
molecules is printed on a slide‘s surface and subsequently probed with a
particular detection reagent. Some techniques entail the design of
polypeptides featuring fusion tags (i.e., His or GST tags), which

29
respectively adhere to Nickel-coated slides or anti-GST antibodies. The
protein used on these arrays can be produced using cell-free expression
systems. Finally, ―self-assembling‖ protein microarrays have been
developed, in which proteins are produced in-situ [64]. This bypasses the
tedious protein purification steps usually required for most arrays, and
more importantly, helps prevent the decay of proteins prior to analysis
(i.e., during storage or handling), which is almost universally expected in
most endeavors involving proteomics. Self-assembling arrays are
produced by printing complementary DNA onto glass slides, which is
subsequently translated using eukaryotic retyculocyte lysates in situ.
Newly formed proteins are immobilized in the slides thanks to tags that are
captured by pre-spotted antibodies on the slides, and subsequently
detected with another antibody.
Different from other methods of microarray development, the
particle-based peptide array synthesis approach (or ―PepperPrint‖) uses
chargeable aminoacids directed sequentially on a microchip surface using
electric field patterns from separate pixel electrodes [65]. This type of
microarray considerably increases the array density and may be used for
high-throughput proteomic studies, such as humoral responses against a
pathogen‘s proteome.

30
Profiling of humoral responses
The traditional approach to antibody detection entails the
immobilization of a single antigen and subsequent probing with plasma or
serum, followed by a secondary antibody. This can be accomplished using
many techniques that are widely used, such as Western blot and enzyme-
linked immunosorbent assay (ELISA). However, there are increasingly
circumstances in which it becomes desirable to test the presence of
different antibodies, particularly when it is unclear what is the cause of an
individual‘s illness. In response to these needs, many antigens can be
printed on the surface of a slide, providing a multiplex platform for high
throughput analysis of complex biological samples, such as plasma [61].
Microarrays have been used for epitope mapping of auto-antibodies
and allergen detection (called ―antibodyome‖ by Andresen and Grötzinger)
[66]. Protein microarrays have been used for the discovery of novel cancer
antigens [67]. Some of these platforms detect autoantibodies at the
presymptomatic stage. For instance, a study using serum samples from
persons enrolled in the beta-Carotene and Retinol Efficacy Trial (CARET)
showed that some antigens targeted by autoantibodies in patients with
lung cancer (annexin I, PGP9.5, 14-3-3 theta and LAMR1) were bound by
sera from presymptomatic donors [68].

31
Future directions of protein microarrays
Since the human genome is composed by about 25.000 genes, an
extensive human proteomic microarray should at the very least be able to
accommodate as many individual proteins as possible on high-density
arrays. Obviously, this is a daunting task considering the desirable
dimensions of a practical platform. Some have proposed adopting
nanotechnology-based solutions, in other words, switching from
microarrays to nanoarrays. Promising designs include: planar, attovial-
based and nanowire array designs. Fortunately, there are existing
technologies for printing nanosized array features, including
nanodispensing, nanoimprint litography and dip-pen nanolithography. On
the other hand, there is interest in the development of label-free
microarray systems, because the use of labels can alter protein-to-protein
interactions and change protein structure and function. Some of these
label-free systems include: single plasmon resonance, nanohole array,
elipsometry, carbon nanotubes and nanowires, and interferometry [63].
The CIM Random-Peptide Microarray Platform
The CIM microarrays consist of maleimide slides with 10,000
random-sequence 20-mers printed on their surface. Two prototypes,

32
CIM1.0 and CIM2.0 (each with a different set of 10,000 peptides), were
tested in the experiments that I will describe in detail in subsequent
chapters. The peptides become covalently-attached to the slides through
the interaction of the amine-terminus of a Cysteine and the maleimide
surface. Succinimidyl-4-(N maleimidomethyl) cyclohexane-1-carboxylate
(SMCC), is used as amine-to-sulfhydryl cross linker. Peptide sequences
and location in the microarray are known beforehand. The peptides were
designed using a software that randomly picks 19 natural aminoacids
(except Cysteine) to build stochastic sequences consisting of 17 residues.
All peptides have Glycine-Serine-Cysteine linkers at either the carboxyl-
(CIM1.0) or amino- (CIM2.0) terminus, to space the main aminoacid
sequence from the slide.

33
Chapter 2
SIGNATURE OF AFFINITY-PURIFIED ANTIBODIES AND MURINE
PLASMA
Introduction
Why use an antibody assay for the assessment of a
neurodegenerative disease? In the introduction of this thesis I discussed
that currently, physicians have no accurate means to establish the
diagnosis of AD, except when an autopsy is carried out [1-5]. This
necessarily means that doctors base their diagnosis on the exclusion of
other neurological disorders, rather than testing directly for AD, which
misdiagnoses about 20% of patients [1-5]. Although new diagnostic
techniques are promising, such as the profiling of Aβ and tau in CSF, they
are not infallible and require a spinal tap, which is not a particularly
pleasurable experience. On the other hand, amyloid imaging techniques
such as PIB-PET are not universally available and may be abnormal in
patients without dementia [6]. Hence, substantial interest exists in the
development of alternative techniques that may help diagnosing AD. We
also discussed earlier that the diagnostic merits of auto-antibodies are the
focus of interest of recent research, because of the simplicity and wide
availability of the involved analytical techniques and relatively stability of

34
target analytes, antibodies [7-14]. Clearly, immuno-globulins are present in
senile plaques, and many individuals have circulating auto-antibodies
targeting different molecules that are relevant in the pathophysiology of
AD, including Aβ and tau [7-14]. It is also possible that the progressive
destruction of the cerebral cortex caused by AD unveils novel epitopes to
the immune system, and more importantly, this might actually predate the
symptomatic stage of AD by many years [15-21]. The de novo exposure of
brain antigens to immune surveillance is facilitated by the progressive
failure of the blood-brain barrier that accompanies neurodegenerative
processes, including AD [15]. Therefore, a test capable of assessing such
humoral response may be harnessed as a diagnostic platform.
In this section of the doctoral thesis, I will describe an
immunoassay that can be used to evaluate the signature of antibodies,
called ―Immunosignature,‖ which employs the random-peptide microarray
described in the previous chapter. It will be my purpose to describe how
the immunoassay works and show experiments with affinity-purified
antibodies as well as plasma from mice.

35
Methods
Description of the microarray-based immunoassay: After the
production of and storage of microarray slides, they are pre-washed for 5
minutes with a solution containing 33% isopropanol, 7.5% acetonitrile and
0.5% trifluroacetic acid in distilled water, then inserted in a TECAN
HS4800-Pro automated incubator (Männedorf, Switzerland). This machine
allows the programming of experiments with standardized incubation
times and washes (TBST followed by water), as well as controlling
temperatures. The first step of the process is blocking with 0.015%
mercaptohexanol / 3% BSA / 0.05% Tween 20 in PBS (pH 7.4) for 1 hour
at 20˚C, to decrease non-specific binding. Subsequently, the primary
antibody is incubated (typical concentration varies was 10-50 nM or
plasma at 1:500 dilution in 3% BSA / 0.05% Tween 20 in PBS) for 1 hour
at 37˚C. Next, biotinylated, species-specific antibodies (targeted against
rabbit, mouse, goat and human IgG, purchased from Bethyl, Montgomery,
TX) are incubated on the slides at 5 μM, also for 1 hour at 37˚C, followed
by Streptavidin conjugated to Alexa 647 or 555 (Invitrogen, Carlsbad, CA;
concentration was also 5 μM). The TECAN dries out the slides after
approximately 15 minutes and rings an alarm to indicate that the program
is complete.

36
Slides are then scanned with a Surescan high-definition laser
scanner (Agilent Technologies, Santa Clara, CA) to generate digital
images (TIFF files) which are subsequently processed with GenePix Pro
6.0 (Axon Instruments, Union City, CA). This is a rather tedious process
that requires the alignment of frames that convey the exact localization
and identification of each peptide in the microarray. Saved files can then
be used for data analysis.
Microarray analysis: Scanned data was loaded into GeneSpring
7.2.1 (Agilent Technologies, Santa Clara, CA) and analyzed. Signals were
deemed present when intensities were >1 standard deviation from mean
local background. Peptide identification was done using t-tests, Model I
(fixed effects) 1-way or multi-way ANOVA, and correlation to specific
expression patterns. Clustering techniques, including k-means,
hierarchical clustering, and Self-organizing Maps were used for identifying
antibody binding patterns. We screened for technically irreproducible
values during data pre-processing. Each peptide array replicate provides a
1.5-fold minimum average detectable fold change at α=0.05 and β=0.20.
Appropriate false-positive corrections were used.

37
Results
Binding patterns of affinity-purified antibodies against Aβ and tau:
First, I endeavored to determine whether specific antibodies targeting
peptides relevant to AD pathophysiology showed distinctive microarray
binding patterns. I analyzed the signature of 11 monoclonal or affinity-
purified antibodies: 7 against Aβ (4 monoclonal, 3 polyclonal) and 3
against tau (2 monoclonal, 1 polyclonal, summarized in Table 2). An anti-
human albumin polyclonal antibody raised in goat (A 7544, Sigma) was
used as control.
Each antibody bound different microarray peptides above median
signal threshold (3-sigma). Binding intensity and order in which reactive
peptides are ranked yielded specific information regarding each antibody.
Peptides bound by each antibody were distinct and formed a distinctive
pattern (Figure 2). The microarray segregated the signature of every
individual antibody from the secondary biotylinated antibody by itself (anti-
rabbit or anti-mouse) and from other monoclonal and polyclonal antibodies
(Figure 3). The signature of the secondary antibody can be subtracted
from the primary to enhance the specificity of patterns.

38
Table 2
Antibodies analyzed with the microarray platform
___________________________________________________________
Antibody Antigen Epitope Type Company
___________________________________________________________
4G8 Aβ residues 17-24 M Millipore
DE2 Aβ residues 1-16 M Millipore
2B9 Aβ residues 1-17 M Santa Cruz
BAM-10 Aβ residues 1-12 M Sigma
α-tau 421 tau Asp residue 421 M Millipore
α-tau 210 tau residues 210-241 M Millipore
α-Aβ 1-40 Aβ carboxyl-terminus P Calbiochem
α-Aβ 1-42 Aβ carboxyl-terminus P Sigma
α-Aβ oligo Aβ Aβ octamers P Biosource
α-phos tau tau 210-threonine 231 P Millipore
___________________________________________________________
Abbreviations: M= monoclonal; P=polyclonal (all raised in rabbit).
Figure 2 shows a scanned microarray after completing the assay of
3 rabbit polyclonal antibodies against Aβ. The white boxes represent
equivalent areas within the array, which are expanded above for greater
detail. Spots represent individual peptides organized in the array; white,

39
red and black colors indicate strong, medium and low antibody binding,
respectively.
Figure 2: Appearance of microarray after immunoassay
Fig. 2. Microarray signatures of anti-Aβ antibodies. Scanned image of peptide microarray hybridization of 3 rabbit polyclonal antibodies against Aβ. The white
boxes represent equivalent areas within the array, which are expanded above for greater detail. Spots represent individual peptides organized in the array; white,
red and black colors indicate strong, medium and low antibody binding, respectively.
Figure 3 (next page) shows a heatmap demonstrating high
correlation between antibodies targeting the carboxyl-terminus of Aβ,
amyloid oligomer and phosphotau. This particular heatmap features 93

40
peptides deemed informative by ANOVA. Polyclonal antibodies targeting
the carboxyl-terminus of Aβ shared binding pattern similarities with an
antibody that recognizes Aβ oligomers and an antibody raised against
phosphorylated tau. Other antibodies, mainly monoclonal IgG targeting the
amino-terminus of Aβ, shared no binding similarities.
Figure 3: Heatmap of different anti-Aβ and anti-tau antibodies.
Fig. 3. The heatmap demonstrates high correlation between antibodies targeting Aβ‘s carboxyl-terminus and anti-oligomer and anti-phosphotau antibodies. This heatmap features 93 peptides deemed informative by ANOVA. Each pattern is
represented in duplicate.

41
The carboxyl-terminus of Aβ is crucial for its polymerization, while
additional amino acid residues in this region translate into greater
aggregation potential, which provides a potential reason for the similarity
between the Aβ antibody binding patterns. However, the similarity with the
phosphotau antibody pattern is enigmatic. The phosphotau antibody used
in this study reacts with a form of tau that is prone to aggregation within
neurons. Although tau and Aβ do not share sequence similarity, it is
conceivable that aggregated tau may share a conformational epitope with
Aβ oligomers. Interestingly, the anti-Aβ oligomer used herein cross-reacts
with several amyloidogenic proteins, including α-synuclein, islet amyloid
polypeptide, prion protein, human insulin, lysozyme and polyglutamine,
suggesting a common conformation-dependent structure, regardless of
sequence.
In addition, I found differences between the signatures of the
secondary anti-rabbit antibody, sera from a rabbit immunized with a
control antigen (NMI), normal non-immunized rabbit sera and purified IgG
from normal rabbits (Figure 4). Results were reproducible, with good
agreement between duplicates run by the same individual (r=0.846-0.966)
and different operators (r=0.95 for first slide, 0.94 for second one). Taken
together, these experiments show that the microarray platform can detect
distinctive patterns of antibody reactivity, and that these patterns are
unique for each antibody, even if antibodies are raised against the same

42
target. Yet, some similarities are clearly noted, particularly if antibodies are
raised against monomers or polymers.
Figure 4: Signatures of affinity-purified antibodies and plasma
Fig. 4. Signature of anti-Aβ oligomer polyclonal antibody raised in rabbit. Heatmap of a select peptide array signature of anti-Aβ oligomer polyclonal
antibody raised in rabbit, using hierarchical clustering. The heatmap sets apart the antibody signature from the secondary anti-rabbit antibody, sera from a rabbit immunized with a control antigen (NMI), normal non-immunized rabbit sera and
purified IgG from normal rabbits.
Immunosignature of APPswe/PSEN1-1dE9 transgenic mice: As we
discussed in previous sections of this thesis, APPswe/PSEN1-1dE9 TG
mice are engineered with 2 human mutations found in familial AD,
affecting the amyloid precursor protein and presenilin-1 genes [22-27].
The resulting phenotype is well characterized, consisting of progressive
amyloidosis involving cerebral cortex, astrocytosis, and neurodegene-

43
ration beginning at about 6 months of age, while cognitive impairment is
noted around 9 months of age [22-27].
To investigate whether the immunosignature of TG mice differs
from littermates, we purchased TG mice from Jackson Laboratories (Bar
Arbor, ME), as well as non-transgenic controls (B6C3F1/J). In addition,
plasma from vaccinated TG mice was provided by Dr Roger N. Rosenberg
(Department of Neurology, University of Texas-Southwestern Medical
School, Dallas, TX). At Dr Rosenberg‘s laboratory, 5 TG mice were
vaccinated with a plasmid encoding Aβ 1-42, while 7 were vaccinated with
mock DNA. All plasmids were delivered through gene gun for 10 doses.
Two non-TG, non-immunized BALB/c mice were used as additional
controls. Plasma samples were obtained at the time mice were sacrificed
(15 months of age).
We used TG mice bearing two mutations from patients with familial
AD (APPswe/PSEN1-1dE9) to track age-related changes in their humoral
immune repertoire, which I will describe in detail later. A group of
B6C3F1/J non-TG mice was used as control. These animals were used
for regular plasma harvesting at monthly intervals until they were
sacrificed at 15 months of age. All mice were female, in order to facilitate

44
handling and housing. A total of 5 TG and 5 non-TG mice were purchased
(from Jackson Laboratories; Bar Arbor, ME) and housed with standard
chow and water provided ad libitum. All murine experiments were
conducted under a protocol reviewed and approved by the Arizona State
University Institutional Animal Care and Use Committee. Mice were
sacrificed at 15 months of age through intra-peritoneal injection of
tribromoethanol (5 mg) followed by intra-cardiac ex-sanguination and cold
PBS perfusion.
As we were interested in confirming the development of a
characteristic neuropathology described in TG mice, brains were carefully
dissected and removed from the skull after decapitation, rinsed
sequentially in cold water (to lyse erythrocytes), soaked in cold PBS, and
finally split across the mid-axial line. Samples were immediately fixed in
cold PBS-buffered 10% paraformaldehyde for 12 hours and then
embedded in paraffin for immuno-histochemistry. Every fifth section (with
a thickness of 5-μm), was stained with hematoxylin and eosin. The
Ventana automated slide preparation system was used for slide
processing. In brief, the Ventana system heats slides and treats them with
xylene, graded ethanols (100%, 95%, 75% and 50%), and distilled water.
For immunostaining, slides were washed in full-strength formic acid for 2
minutes for antigen retrieval and dehydrated through graded alcohols.

45
Amyloid staining was attained with NovoCastra NCL anti-Aβ antibodies at
1:50 dilution. GFAP staining used anti-GFAP polyclonal antibodies from
Athena Diagnostics, at 1:100 dilution. The secondary antibody was a
biotin-conjugated rabbit antibody incubated for 30 minutes at room
temperature, followed by incubation with streptavidin-peroxidase.
Peroxidase activity was detected with diaminobenzidine
tetrahydrochloride.
Although standardized cognitive tests were not performed, the TG
mice were clearly different from the control group: the former were much
more docile and easier to handle. TG mice had heavy cerebral amyloid
deposition and astrocytosis as compared to B6C3F1/J controls, which was
apparent on both Hematoxylin-Eosin staining and immunohistochemistry
(Figure 5). The microarray signature of plasma from 10-month old TG
mice (n=5) was different from 4 age-matched non-TG littermates
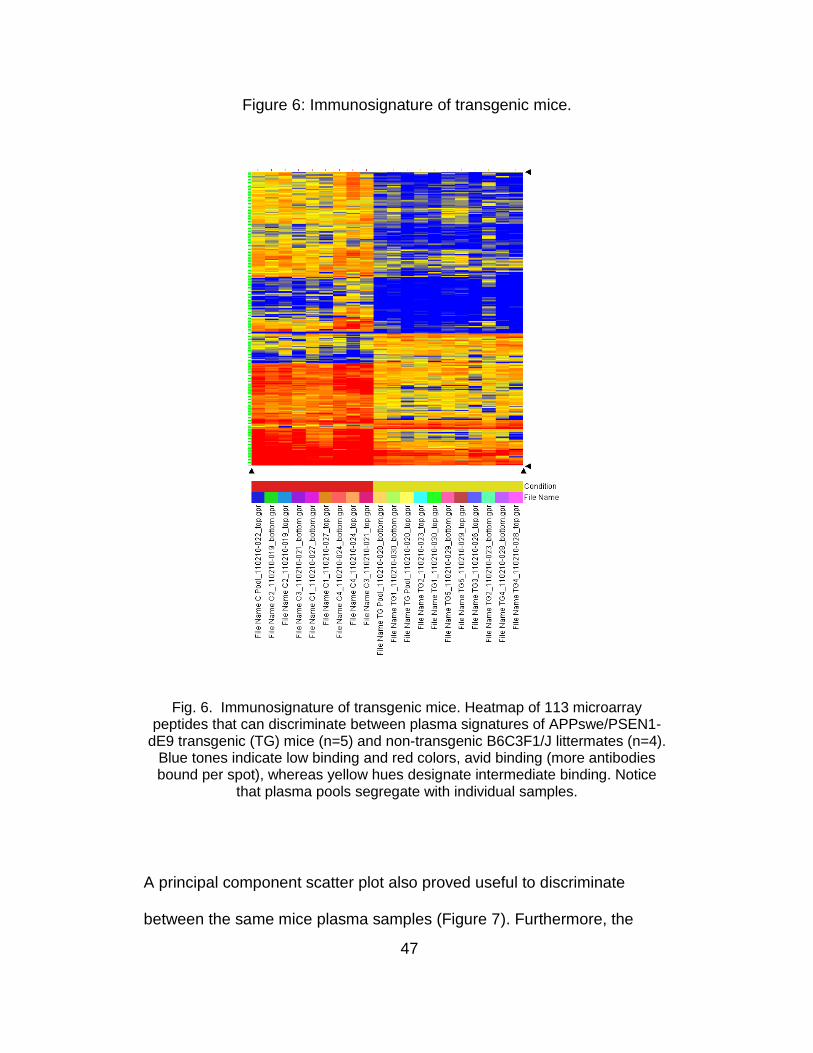
(B6C3F1/J). Figure 6 shows the heatmap of 113 microarray peptides
capable of discriminating between plasma signatures of APPswe/PSEN1-
1dE9 transgenic (TG) mice (n=5) and non-TG B6C3F1/J littermates (n=4).
In the heatmap, blue tones indicate low binding and red, avid binding
(which occurs when more antibodies bind to the spotted random-peptide),
whereas yellow designates intermediate binding. Plasma pools
segregated with their constituting samples.

46
Figure 5: Histopathological changes in mice.
Fig. 5. Hematoxylin-Eosin staining shows widespread cortical senile plaque formation (arrows) and astrocytosis in TG mice (A) but not in B6C3F1/J controls (B). Staining with anti-Aβ antibodies reveals extensive amyloidosis in TG mice
(C) but not in controls (D). Immunolabeling of glial fibrillary acidic protein (GFAP) showed dense astrocytosis. Stained cells were endowed with prominent fibrillary
processes (red arrowheads). Magnification: 400X (except D, which is 200X).
47
Figure 6: Immunosignature of transgenic mice.
Fig. 6. Immunosignature of transgenic mice. Heatmap of 113 microarray peptides that can discriminate between plasma signatures of APPswe/PSEN1-
dE9 transgenic (TG) mice (n=5) and non-transgenic B6C3F1/J littermates (n=4). Blue tones indicate low binding and red colors, avid binding (more antibodies bound per spot), whereas yellow hues designate intermediate binding. Notice
that plasma pools segregate with individual samples.
A principal component scatter plot also proved useful to discriminate
between the same mice plasma samples (Figure 7). Furthermore, the

48
microarray detected changes in the signature of TG mice immunized with
a plasmid coding for human Aβ 1-42. A heatmap encompassing the entire
10,000 peptide array signature of serum samples from 15 month-old TG
mice was generated (Figure 8), which sets apart 3 groups: on the far left,
TG vaccinated with mock DNA; center-right, TG mice vaccinated with a
plasmid coding for Aβ 1-42; and to the far right, serum samples from non-
transgenic non-vaccinated C57 mice (NTG).
Figure 7: Principal component analysis of plasma signature in mice.
Fig. 7. PCA plot showing same mice plasma samples as in figure 5. Transgenic (TG) mice are represented in yellow and non-TG controls in red.

49
Another principal component scatter plot is shown in Figure 9,
demonstrating segregation of plasma signature from mock DNA-treated,
Aβ 1-42 plasmid-treated TG and non-TG mice. Aβ immuno-histochemistry
revealed heavy amyloid deposition in the brain parenchyma of mock-
vaccinated TG mice, whereas TG mice treated with Aβ plasmid had
reduced amyloid deposits. Three microarray peptides avidly bound by
plasma from mice vaccinated with Aβ also were among the top binders of
the 7 commercial anti-Aβ antibodies that we discussed previously.
Figure 8: Immunosignature changes with Aβ1-42 immunization.
Fig. 8. Heatmap showing signature of plasma samples from 15 month-old TG mice. Three groups are noted: on the left, TG vaccinated with mock DNA; center-right, TG vaccinated with a plasmid coding for Aβ1-42; and to the far right, serum
samples from non-TG non-vaccinated C57 mice (NTG).

50
These experiments demonstrate that TG mice have a distinctive
immunosignature that can be altered by genetic immunization, although a
minimal component of the signature is shared with specific anti-Aβ
antibodies. However, the animal model used has limitations in that it does
not fully recapitulate all features of AD; in particular, APPswe/PSEN1-
1dE9 mice do not develop neurofibrillary tangles.
Figure 9: Principal component analysis of mice signatures.
Fig. 9. Segregation of plasma signature from mock DNA-treated, Aβ 1-42 plasmid-treated TG and non-TG mice. Principal component scatter plot demonstrating
segregation of plasma signature from mock DNA-treated, Aβ1-42 plasmid-treated TG and NTG mice.

51
Stability of murine immunosignature: the immunosignature platform
offers the opportunity of tracking the immuno-reactivity to different
peptides overtime. Looking for possible fluctuations of the signature over
time, I assayed plasma pools from APPswe/PSEN1-dE9 mice and
B6C3F1/J non-transgenic controls drawn monthly, starting at 2 months of
age and ending 13 months later (2-15 months).
Figure 10: Changes in immunosignature across time.
Fig. 10. Progressive build-up of signature in TG mice. Heatmap with 39 peptides with sustained immune-reactivity overtime in TG mice as compared with
B6C3F1/J controls. The y axis lists the different peptides, whereas the x axis depicts plasma pools from TG mice and age-matched controls.

52
A two-tailed t-test (P=6.6 x10⁻⁷ to 6.7 x10⁻⁵) was used to find
peptides that discriminated all TG mice from their non-TG controls,
yielding a total of 39 peptides (listed in Table 3). Although this was a two-
tailed t-test, these peptides showed higher binding in TG mice. The
signature was evident even at 2 months of life (Figure 10, above). Notably,
the immunoreactivity of these peptides became progressively stronger
with TG mice plasma, remaining low or becoming fainter with B6C3F1/J
plasma. Plasma samples highly correlated with replicates and other
samples obtained at different time-points. Using the ―Expression Profile‖
feature of Gene-Spring 7.3.1, which allows the detection of immuno-
reactivity patterns that correlate to arbitrary patterns drawn by the
operator, we noted that most microarray peptides have an intricate
immuno-reactivity pattern which moderately fluctuates overtime. Such
complexity is exemplified by the finding that only 2 out of 10.000 peptides
had a reactivity profile that highly correlated to a traced flat line (Pearson‘s
correlation coefficient >0.7). The differences in the immunosignature of
both mice groups changed at different time points, with the immune-
reactivity of many peptides exhibiting high immune-reactivity at 2 months
of age in TG mice (when cerebral amyloidosis first becomes apparent),
but declining thereafter. In contrast, an unrelated set of 24 peptides had a
similar trend in B6C3F1/J controls. The immune-reactivity of 17 additional
peptides peaked at age 6 months to decline thereafter in TG mice
(compared to 2 unrelated peptides in B6C3F1/J controls), whereas a

53
different set of peptides (n=77) had a steady reactivity decline in this mice
group (42 unrelated peptides followed a similar trend in B6C3F1/J
controls). These observations suggest that the plasma signature of TG
mice can be distinguished from that of B6C3F1/J controls, and that the
signature remains largely stable overtime or becomes better defined.
However, some peptides seem more reactive at different times in life,
suggesting that many possible epitopes are targeted by the immune
system as the underlying pathological process evolves. The antibody
signature of TG emerges early in life: incipient plasma reactivity against a
set of peptides was detected in TG mice as early as 2 months after birth,
before significant neuropathological or neurological signs are expected.
Although these animal experiments cannot rigorously be extrapolated to
humans, its relevance is that it is possible that an immunosignature, if
present in humans, may be detectable during the early or even pre-
symptomatic stages of disease, as humoral immune responses generally
predate the onset of pathological and clinical signs of many diseases.
Classification of young mice using late immunosignatures. It is
generally agreed in the literature that an effective AD therapy is likely to
depend upon early detection and treatment [15]. In spite of recent
advances [4-6], no specific tests are universally used to diagnose AD. As
the pathology slowly progresses for decades before the initial symptoms

54
emerge [16], and since the initial manifestations are generally subtle [17-
21], a potential diagnostic test for AD must be highly sensitive. Given that
future treatments are likely to target people with mild or no symptoms
[15,17,18], the test must also be highly specific. Considering the difficulties
and time involved in obtaining enough samples from subjects with early
AD stages, we used again the APPswe/PSEN1-dE9 mice, to explore the
possibility of developing an early stage diagnostic. Specifically, I asked
whether an immunosignature optimized to detect disease in older animals
can be used to diagnose the early phases of the disease? This would be
analogous to using late-stage AD human samples, to train a system to
detect presymptomatic AD. To answer this question, mice were divided
into three groups, according to age: early (2-5 months), mid (6-9 months)
and late (10-15 months). These time-points are biologically relevant in
APPswe/PSEN1-dE9 mice, considering that their neurocognitive function
begins deteriorating at 8 to 9 months of age and their characteristic
neuropathology (cortical senile plaque formation and astrocytosis) is first
observed from 6 to 7 months of age [22-27], while no neurocognitive or
pathological abnormalities are apparent before 4 months of age [22].
Figure 11 shows sequential heat maps separating TG and non-TG
mice at the early, mid and late time-points. Only 35 peptides were
selected in a t-test between APPswe/PSEN1-dE9 and B6C3F1/J mice at

55
each of the 3 time-points. This was done for 3 reasons: first, in all cases
there were at least 35 peptides that survived multiple-testing correction
(FWER=5%). Second, it is easier to demonstrate any overlap in peptides
from one time-point to another when a fixed number of peptides are used.
Third, the classifier we use (Linear Discriminant Analysis, LDA) works best
when less than 100 features are used, and 35 features suits this algorithm
well. The three 35-peptide sets chosen using a two tailed t-test (early
P<1.61x10⁻⁵, mid P<1.113x10⁻⁴, late P<8.73x10⁻⁵) readily separated TG
from non-TG mice at specific time-points, as is shown in Figure 10. Of
these optimal peptides, there were only 3 that overlapped between early
and mid-stages, and 8 that overlapped between mid and late signatures.
No peptides overlapped between the early and late stages, suggesting
differences in the ongoing pathological process through the different time-
points.
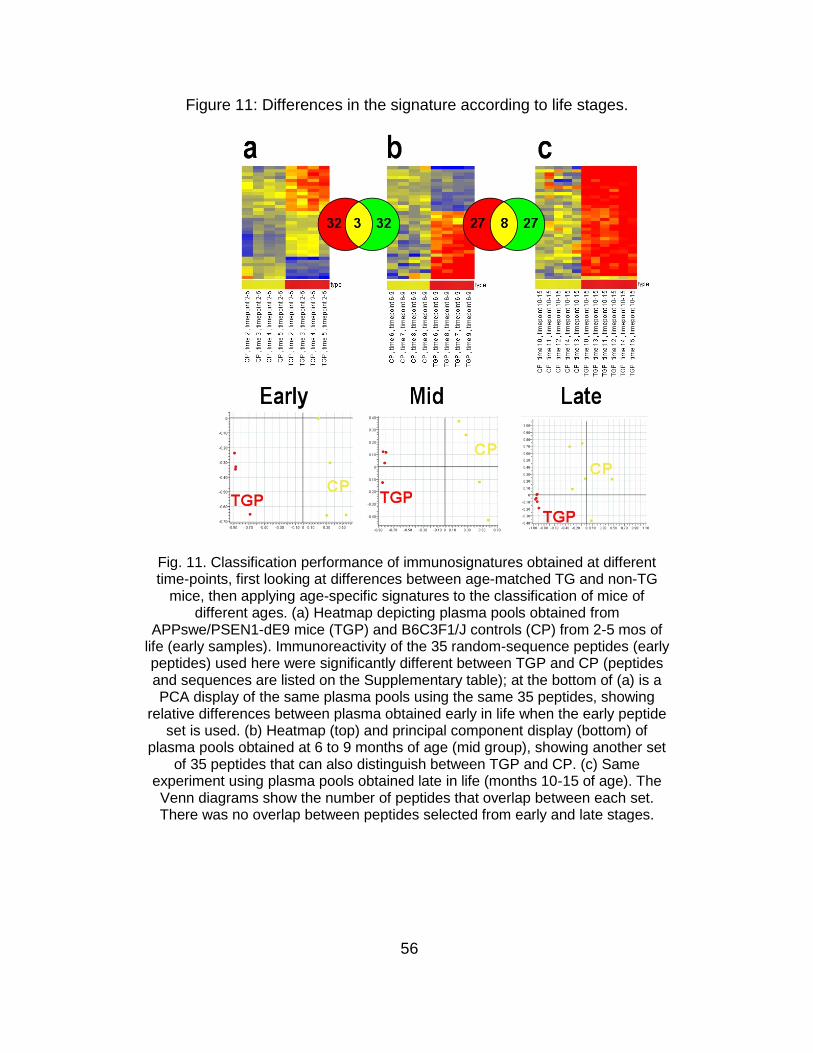
56
Figure 11: Differences in the signature according to life stages.
Fig. 11. Classification performance of immunosignatures obtained at different time-points, first looking at differences between age-matched TG and non-TG
mice, then applying age-specific signatures to the classification of mice of different ages. (a) Heatmap depicting plasma pools obtained from
APPswe/PSEN1-dE9 mice (TGP) and B6C3F1/J controls (CP) from 2-5 mos of life (early samples). Immunoreactivity of the 35 random-sequence peptides (early peptides) used here were significantly different between TGP and CP (peptides and sequences are listed on the Supplementary table); at the bottom of (a) is a PCA display of the same plasma pools using the same 35 peptides, showing
relative differences between plasma obtained early in life when the early peptide set is used. (b) Heatmap (top) and principal component display (bottom) of
plasma pools obtained at 6 to 9 months of age (mid group), showing another set of 35 peptides that can also distinguish between TGP and CP. (c) Same
experiment using plasma pools obtained late in life (months 10-15 of age). The Venn diagrams show the number of peptides that overlap between each set. There was no overlap between peptides selected from early and late stages.

57
I evaluated whether the 35 peptides distinguishing TG from non-TG
littermates late can differentiate the groups early. As shown in Figure 12,
late peptides discriminated early disease with a 21% error rate (via LDA,
Leave One Out Cross-validation). Mid stage peptides also separated
groups using plasma obtained at early stages with 18% error, while late
stage peptides distinguished the source of plasma drawn at mid stages
with 8% error. None of the 39 peptides shown in Figure 9 that generally
discriminate TG from non-TG mice across all time-points appeared in the
list of 35 optimized for each stage, suggesting that there are antibodies
specific to each disease stage. When asked to find antibodies present
throughout the entire disease, the array may have identified lower affinity
and lower specificity antibodies than the stage-specific ones.
Figure 12: Classification performance of late signatures.
Fig. 12. Accuracy of mouse classification using stage-specific signatures. Optimal peptide sets from early, mid and late life stages were used to classify
plasma obtained at different ages. (a) Late peptides discriminated early samples with 21% LDA error rate; (b) Mid peptides classified early samples with 18% LDA
error rate; and (c) Late peptides classified mid samples with 8% error rate.

58
I also investigated whether the resolving power of late stage
peptides on early stage samples could be improved by including more
peptides that were informative against late stage disease. The top 130
predictive peptides (p<0.000117) for late stage discrimination included
exactly all 35 early peptides. When these 130 peptides were used to
distinguish transgenic mice at early stages, the error rate was zero (even
so, the visual grouping by heatmap or PCA was noticeably worse than
using only the 35 early peptides). Since the late stage peptides had some
positive predictive power for early stage, we asked whether the 35 early
peptides could predict when mixed with non-informative peptides. We
added 95 randomly chosen peptides to the 35 early peptides to make a list
of 130 peptides; the LDA misclassification rate was 10%, suggesting that
the 35 early peptides could still perform fairly well even in the presence of
random noise but also that there was some predictive power for early
disease in the larger list of late-stage peptides.
Correlation between IgG purified from brain and plasma: finally, we
asked the question whether IgG present in the brain has a similar
signature to the one observed in plasma. Small amounts of IgG are
normally found in the brain, reflecting leaking from plasma as well as local
production. Additionally, IgG can be detected in senile plaques [28]. As we
discussed, TG mice had heavy cerebral amyloid deposition and
astrocytosis (Figure 5). We found a high correlation (r=0.96 to 0.998)

59
between binding patterns of brain-purified and plasma-purified IgG (n=4, 2
TG and 2 B6C3F1/J). The antibody signature was different for each
individual, but similarities were again noted between TG and controls.
There was a high correlation between the signatures of IgG and the whole
plasma from which it was purified (r=0.99). This similarity between the IgG
signature of murine brain and plasma suggests that the same assortment
of antibodies is being detected by the microarray platform. While cross-
contamination between blood and brain is possible during sample
processing, it is well known that IgG can cross the blood brain barrier. In
fact, the blood-brain barrier becomes more permeable to macromolecules
as individuals age, particularly in the setting of chronic neurodegeneration.
Discussion
Evaluating the potential of immunosignaturing as a diagnostic test
for early AD, I and my mentors at CIM first looked at the stability of the
signatures in mice. There appears to be a distinctive TG mouse signature,
which remains stable over time with some variation. The signature has
both a general group aspect and one that is individual, such that the
samples from the same mouse over time were very similar. Employing the
APPswe/PSEN1-dE9 mouse model and age-matched controls, blood was
collected from individual mice from months 2 to 15 of life. When

60
considering only TG and non-TG groups without incorporating the time of
collection, it was found that as few as 39 peptides could separate the two
groups of mice, with a signature that increased over time (in Figure 9 there
are ~8 peptides that seem to show a distinct increase in signal over time in
the heatmap). The mice were then divided by age into early, mid and late
stages. We selected 35 highly significant peptides using a standard t-test
between TG and non-TG mice at each stage. There was little overlap
between the sets of peptides characterizing each stage, and none at all
between late and early stages. The late stage peptides separated TG and
non-TG mice at early stages, but with a rather high error rate of 21%,
while mid-stage peptides performed better (18% error). Increasing the p-
value cutoff to 0.0001 for late peptides allowed 130 peptides to be
selected. This set of 130 peptides included the 35 highly selective early
peptides, and actually did classify the early peptides with 0% error. If
translated to a clinical setting, one would not know which peptides would
be best for early diagnostic, but since the early specific peptides were a
subset of a large set of late peptides, and given that highly specific early
peptides can still discriminate the disease state even when mixed with 95
randomly non-informative peptides, provides hope that a diagnostic for
early diagnosis can be done using conventional patient selection (i.e.,
confirmed diagnosis at late AD stages).

61
The patterns formed with antibody binding to microarrays may have
a diagnostic potential. However, the stability of signatures is important for
two reasons: first, if the variation caused by time is small, then larger
sample pools could be used without concerns about noise dampening the
signature out over time. Second, if there is a personal component of the
signature, it could be useful for monitoring disease progression or
response to treatment. TG signatures were highly distinguishable from
age-matched controls regardless of age. Relative to the second issue,
there was clearly an individual component observed in mice.
Mathematically, the two samples from the same individual were most
similar to each other.
Ideally, AD should be detected at the pre-symptomatic or early
symptomatic stages, when promising disease-modifying therapies are
expected to exert greatest benefits [15]. Unfortunately, these stages are
also the least understood aspects of the disease, and the most
susceptible to diagnostic misclassification with current standards [16-22].
For these reasons, we are interested in knowing whether the late stage
signatures can be used to guide an early stage diagnostic. We used the
APPswe/PSEN1-dE9 mouse model to address this issue. While there are
certainly concerns for the relevance of any mouse model to human
disease [27], our perspective relative to technology development is that if

62
one cannot demonstrate the feasibility of an approach in a well-controlled
model system, it is less likely to work in the complexity of humans.
The first issue is whether the TG mice are distinguishable by
immunosignaturing at an early stage of disease. When the
immunosignatures of all the TG mice were compared to the non-TG
littermates, 39 peptides clearly separated the two groups regardless of
age. Even mice at two months (when characteristic neuro-pathology is
not expected), had a distinguishable signature, although noticeably
weaker than in old mice. This signature became more intense over time,
implying that there is more antigen driving the antibody response.
Interestingly, 7 of the 39 peptides could also react with purified antibodies
against Aβ, the concentration of which progressively increases with age in
the brain and plasma of APPswe/PSEN1-dE9 TG mice. These changes in
the antibody repertoire of TG mice illustrate the complexity of their
pathological process, with amyloid overproduction setting off a cascade of
events where additional epitopes become targeted by the immune system
as animals grow older.
From the practical point of view of developing a human diagnostic
signature, it will be challenging in the short term to acquire samples from

63
all stages of human AD. Using the mouse model does not circumvent this
issue, but helped us to gain relevant insights. For instance, dividing the
mice into early, mid and late stage groups, we found peptides from each
life stage that separated transgenic from non-transgenic mice with 100%
accuracy. Of note, there was no overlap between the 35 peptides in the
late and early stages, and the late stage peptides classified the early
stage mice with 21% error. However, based on the mouse data, there
may be two solutions to this problem. We found that the informative 35
peptides for early stage were included in the top 130 late stage predictive
peptides (p<0.000117). These 130 peptides had a 0% error rate in
classifying early stage mice. Of course, this test is artificial in that we
knew where to draw the cut-off in order to include the 35 early stage
peptides. But it does indicate that an inclusive rather than exclusive
strategy for choosing late stage peptides for a diagnostic would more likely
succeed.
A second strategy may be based on using samples from people
with mild cognitive impairment who progressed to autopsy-confirmed AD.
While there was no overlap between early and late stage peptides in mice,
there was a 23% overlap between late and mid stage peptides and 9%
overlap between mid and early. Therefore, it may be useful to employ the

64
mild cognitive impairment samples to define the early stage peptides for
the diagnostic. Of course these two strategies are not mutually exclusive.
What are the implications of this analysis for developing a
diagnostic test for early stage AD? To the extent that the mouse model
and its associated caveats can guide this effort, it is encouraging in
implying that a signature of disease starts very early in life. However, this
work also implies that optimizing the diagnostic test using late or
minimally-symptomatic patients may not provide much overlap with the
optimal early stage signature. Although the optimal 35 peptides selected
in old mice were different from the 39 peptides that were useful at all the
time-points and the 35 optimal early-stage peptides, the last 2 sets of
peptides became again part of the signature when the p-value cutoff of the
late-stage comparison was relaxed. The implication is that late stage
immunosignatures should be used rather broadly when searching for an
early AD diagnostic. This has the shortcoming of introducing non-
informative peptides and subsequent noise in the analysis, but our
analysis on the mouse samples indicates this may not be prohibitive in
developing an accurate diagnostic test.

65
Chapter 3
ANTIBODY SIGNATURE OF PATIENTS WITH ALZHEIMER'S DISEASE
Introduction
The major theme of this doctoral thesis is that post-mortem
examination remains the gold standard of AD diagnosis, an option that is
rarely feasible or desirable. This has important implications for medical
practice and clinical trial design: to begin with, the prognosis of dementia
varies according to the underlying etiology; secondly, pharmaceuticals
used routinely for AD can exacerbate the symptoms of other types of
dementia (for instance, donepezil can exacerbate the motor impairment of
Progressive Supranuclear Palsy, or PSP) [1]; and lastly, clinical trials may
be distorted if a substantial proportion of enrolled subjects are expected to
have a wrong diagnosis. A pharmaceutical company conducting two
phase 3 clinical trials for AD is using a blend of biomarkers to document
disease progression, including neuro-imaging and Aβ measurements in
plasma and cerebro-spinal fluid [2-3]. This underscores the necessity to
develop alternative techniques to diagnose AD and monitor its course.

66
In the previous chapter, I described the application of our
microarray platform to the study of the binding patterns of affinity-purified
antibodies and plasma samples from transgenic mice with cerebral
amyloidosis. In this chapter, I will describe my efforts to develop a
diagnostic tool for AD based on immunosignatures. Some of these
experiments have been peer-reviewed and published [4].
Methods
Patient‘s Characteristics and plasma sample handling. Plasma from
12 patients with probable AD and 12 age-matched controls without
cognitive derangement were provided by Alex Roher (Banner‘s Sun
Health Research Institute, Phoenix, AZ). These patients were enrolled into
a brain-bank program. Postmortem examination was performed by a
neuropathologist on 9 patients (5 with and 4 without dementia). Samples
were acquired after written consent and approval of the Banner
Institutional Review Board (IRB). Profiling studies were approved by
ASU‘s IRB (protocol # 0912004625). In addition to these patients, we
obtained 100 plasma samples from the Alzheimer‘s Disease
Neuroimaging Initiative (ADNI). ADNI is a comprehensive multi-
institutional project funded in part by the NIH (P.I.: Dr Neil Buckholtz),
aiming to identify neuroimaging and biomarkers of the cognitive changes

67
associated with MCI and AD [5]. Data acquired through ADNI are made
available to the general scientific community and the entire repository of
clinical and imaging data collected is accessible to authorized
investigators after on-line application, which we submitted on 4-23-2009
and approved on 7-2-2009.
Microarray Platform and Immunoassay: the reader is referred to the
description on Chapter 1. Regarding Microarray analysis, scanned data
was loaded into GeneSpring 7.2.1 (Agilent Technologies, Santa Clara,
CA) and analyzed. Signals were deemed present when intensities were >1
standard deviation from mean local background. Peptide identification was
done using t-tests, Model I (fixed effects) 1-way or multi-way ANOVA, and
correlation to specific expression patterns. Clustering techniques,
including k-means, hierarchical clustering, and Self-organizing Maps were
used for identifying antibody binding patterns. We screened for technically
irreproducible values during data pre-processing. Each peptide array
replicate provides a 1.5-fold minimum average detectable fold change at
α=0.05 and β=0.20. Appropriate false-positive corrections were used.
Blocking experiments with Aβ-coated beads: synthetic Aβ 1-40
covalently attached to TantaGel S NH2 polystyrene beads (Advanced

68
ChemTech, Louisville, KY) were used, carrying approximately 0.2 mmol
antigen/gram. To decrease non-specific binding, various bead
concentrations ranging from 1-0.01 mM were pre-blocked with 5%BSA-
PBS. Beads were stored at 4°C overnight and rinsed with 3%BSA-PBS-
0.05%Tween20 prior to mixture with plasma pools dissolved 1:500 in
3%BSA-PBS-0.05%Tween20. This mixture was incubated at 37°C,
centrifuged, and the supernatant was assayed on microarray slides as
previously described. Blank beads similarly treated were used as
controls.
Results
On average, patients with dementia were older than the cognitively-
normal control (84.5±5.5 years old versus 72.6±7.8, respectively). This
difference had a trend toward statistical significance (p=0.08) using a t-
test. Most patients were women (7/12 in the AD group and 8/12 in the
control group, Table 3).

69
Table 3
Clinical and Neuropathological characteristics of patients.
___________________________________________________________
P# Age Sex Pathology Summary PT CERAD Braak 43 88 F Argyrophilic grains in mesial temporal
lobe; Lewi bodies; white matter rarefaction. Dx: PSP
14 Prob AD III
44 81 F -
48 87 M -
53 83 F Many plaques and tangles; white matter rarefaction
15 Def AD V
57 85 F Many plaques and tangles; Lewi bodies 11.2 Def AD V
59 81 F -
4 77 F -
8 80 M -
11 73 F -
15 89 M Many plaques and tangles; severe white matter rarefaction; 3 small old infarcts and 6 old microinfarcts
13 Prob AD V
24 90 M Many plaques and tangles, white matter rarefaction
11 Prob AD IV
26 76 M -
39 86 M -
40 83 F -
41 77 F -
45 81 F Some senile plaques and occasional tangles
10 Pos AD II
49 70 F -
50 73 M Some plaques and tangles, insufficient for AD Dx; mild amyloid angiopathy; white matter rarefaction; 1 small old infarct; many old microinfarcts
6.5 Not AD III
1 82 F Not available
13 60 F -
16 79 F -
29 79 F -
52 90 M Occasional plaques and tangles 4 Not AD III
56 76 M -
P# is patient ID number; PT= total senile plaque count; CERAD= pathology diagnosis (Consortium to Establish a Registry for Alzheimer's Disease); Prob= ―probable‖; Pos= ―possible‖; Def= ―definite‖; Braak are the Braak scores.

70
Figure 13: Human immunosignature.
Fig. 13. (a) Heatmap of 169 peptides that distinguished AD plasma from age-matched controls. Patients cluster into 3 patterns: AD-type, intermediate, and non-demented. Asterisks denote individuals who had autopsy. (b) Principal component scatter plot
analysis of same plasma samples, demonstrating that individual plasma samples from AD patients (red dots) cluster together, whereas samples from non-demented controls
(yellow) are widely scattered. (c) Plasma pools (arrow heads) from AD patients and cognitively normal controls are also correctly discriminated by the platform. The signature
of a patient with PSP on autopsy, migrated with the pattern of normal controls.

71
The immunosignatures of these patients formed three different
patterns: one distinctive of AD, another representative of the non-
demented controls and an intermediate pattern. The former pattern was
noted on 9 individuals, all with AD (except 1 normal control and the PSP
patient). The second pattern was seen in 4 cases, (3 controls, 1 AD). The
intermediate pattern was seen in 4 cases (3 non-demented, 1 with AD).
The asterisks in Figure 13 denote individuals who had autopsy, which
confirmed AD in patients # 1, 3, 4, and 7; patient # 8 was diagnosed with
PSP by the pathologist, whereas patients # 15 and 16 did not have
significant AD pathology. Panel b shows a principal component scatter
plot analysis, demonstrating that individual plasma samples from AD
patients (black dots) cluster together, whereas samples from controls
(grey) are widely scattered. The numbers near the dots represent patients
from panel A. Next, we assayed plasma pools from 5 patient groups:
autopsy-proven AD (n=4), clinical AD without autopsy (n=7), the PSP
patient, cognitively normal elderly controls without definitive signs of AD
on autopsy (n=4) and cognitively normal elderly controls without autopsy
(n=8). The principal component plot shown in panel c of Figure 13 also
demonstrates that the microarray platform can discriminate between
different pools, and also that AD patients with or without autopsy cluster
away from normal controls.

72
Using ClustalW 2.0, an automatic program for global multiple
alignment of aminoacid sequences [6], we found that none of the 50
higher ranking peptides bound by the autopsy-proven AD plasma pool had
sequence similarity with Aβ1-40 or Aβ 1-42. Eleven microarray peptides
highly bound by the AD autopsy plasma pool were also top binders of the
7 commercial anti-Aβ antibodies.
The predictive capacity of the immunosignature was assessed by
re-testing 8 random samples (5 with AD and 3 controls) in a blinded
fashion. Using the support vector machine algorithm of GeneSpring GX,
we established a learning data set using known binding patterns exhibited
by the complete sample set of human IgG. With this training set, blinded
samples were assigned to any pattern, which correctly recognized 4 AD
and 2 control cases but misclassified 2 samples (1 erroneously assigned
to AD). While these are early results, the data supports the concept that
different antibody binding patterns are detectable and reproducible, and
that the immunosignaturing technique could be developed to assist in the
classification of patients with dementia.
Blocking experiments with Aβ-coated beads: to determine whether
the immunosignatures observed in humans are partly due to Aβ
immunoreactivity, I carried blocking experiments using synthetic Aβ1-40

73
covalently attached to polystyrene beads to pre-treat plasma pools before
being assayed. Untreated plasma pools and pools treated with blank
beads were used as controls. The overall signature of plasma pools did
not change after blocking with the Aβ-coated beads. However, pre-
treatment with Aβ beads decreased the reactivity of 4 microarray peptides
as the concentration of Aβ 1-40 beads increased (Figure 14, panel a).
Figure 14: Blocking experiments with Aβ1-40 beads.
Fig. 14. Blocking of plasma immunoreactivity with Aβ-coated beads. Plasma pools from AD patients were treated with different concentrations of Tantagel
beads. (a) Fluorescence declined for a few array peptides as the concentration of Aβ 1-40 beads increased. (b) Effects of Aβ 1-40 bead treatment on fluorescence
intensity of the specific peptides shown above.

74
There was minimal variation with blank beads, whereas minimal
decline in fluorescence intensity was noted for a plasma pool from normal
cognitive controls. Panel b depicts a microarray scan showing the effects
of Aβ 1-40 bead treatment on fluorescence intensity of the specific peptides
shown above. The immunoreactivity of 2 of these peptides exhibited
marked decline after Aβ 1-40 treatment. Using ClustalW 2.0, I found no
sequence similarity between these peptides and human Aβ. Figure 3 is a
bar graph depicting the fluorescence intensity of the representative array
peptides blocked by Aβ 1-40 when probed with specific commercial
antibodies. Some of these peptides strongly bound polyclonal anti-Aβ 1-42,
anti-Aβ oligomer and anti-phosphotau antibodies.

75
Figure 15: Fluorescence of representative peptides blocked by Aβ 1-40.
Fig. 15. Bar graph depicting the fluorescence intensity of the representative array
peptides that were blocked by Aβ 1-40 when probed with specific commercial antibodies. Notice that only the anti-Aβ 1-42, anti-Aβ oligomer and anti-
phosphotau bound well to some of these peptides.
These experiments suggest that only a small portion of the
signature is driven by anti-Aβ antibodies, and that blocked microarray

76
peptides may behave as epitope mimetics, given the lack of sequence
homology with the blocking antigen. However, it is possible that an anti-Aβ
antibody that conveyed a small portion of the signature or one whose
removal was masked by binding of another antibody would not be
detected.
Cross reactivity between AD, TG mice and anti-Aβ oligomer antibodies: 33
peptides were preferentially bound by anti-oligomer antibodies and AD
plasma, whereas 19 peptides were specifically bound by plasma extracted
from AD patients and TG mice (Figure 16).
Figure 16: Venn Diagram peptide overlap.
Fig. 16. Venn diagram representing cross reactivity between different sera. (a) highest-ranking peptides bound by plasma from APPswe/PSEN1-dE9 mice, AD
patients, and the anti-Aβ oligomer antibody. (b) plasma pools from autopsy-proven AD, normal controls and plasma from a patient with PSP on autopsy.

77
Two random-sequence peptides were avidly bound by all groups:
KKNFKTFGFDPLVTWSWGSC and GLPWTLYYLWMRPTYVRGSC. The
probability of this occurring by chance is 8.894 x 10⁻⁶. Panel (a) of Figure 16
shows the number of highest-ranking peptides from the microarray bound by
sera from APPswe/PSEN1-dE9 transgenic mice, AD patients‘ plasma, and
the anti-Aβ oligomer antibody. Panel (b) of the same Figure shows a similar
exercise using pools of plasma from autopsy-proven AD, cognitively normal
controls without AD features on autopsy and plasma from a patient with
neuropathological signs of PSP. Inquiry with ClustalW 2.0 found no sequence
homology between these 2 peptides and human Aβ. Several peptides bound
predominantly plasma from the PSP patient (29 peptides), the autopsy-
confirmed AD plasma pool (22 peptides), and the plasma pool from elderly
controls without signs of AD on autopsy (34 peptides). The probability of this
occurring by chance is 1.25 x 10⁻⁷.
Influence of print run variability: it was a significant problem during
my experiments. This is partly explained by the fact that the microarray
platform was modified while I was standardizing the immunoassay (i.e.,
my initial experiments were done with a microarray with 4.000 random-
sequence peptides). Most of my experiments involved microarrays with a
solid phase consisting of 2 different sets of 10,000 random-sequence 20-
mers covalently attached to a glass slide‘s surface. The peptides on each

78
microarray were different, designed with Glycine-Serine-Cysteine linkers
at either the carboxyl (CIM1.0) or amino (CIM2.0) terminus for slide
adherence. Also, peptide synthesis and printing on the microarray was
different for both microarrays: CIM1.0 peptides were synthesized by Alta
Biosciences (Birmingham, UK) and spotted in duplicate using a NanoPrint
LM60 microarray printer (ArrayIt, Sunnyvale, CA), while CIM2.0 peptides
were synthesized by Sigma (St. Louis, MO) and printed by AMI (Tempe,
AZ) using a piezo printer. In addition, problems were detected as the
microarray was developed, including issues with peptide mixture, pH,
concentration, printing, and handling. As a result, the reproducibility of
results depended heavily on the print run. For instance, plasma sample
replicates had a high correlation (i.e., >0.8) if the same print run was used,
but less correlation (i.e., 0.4 or less) if different print runs were employed.
Furthermore, when many print runs are compared, the described AD
immunosignature became less defined or effaced altogether.
Similarly, if the training set of peptides that distinguished AD from
controls with the Banner-Sun Health samples does not work if samples
from the same or a different cohort (ADNI) are assayed on slides from
different print runs. Figure 17 (below) demonstrates this variability when
ADNI samples are run on slides printed at different times at our laboratory.

79
From these experiments, I learned that experiments required the same
print run in order to avoid problems with reproducibility.
Figure 17: Print-run variability.
Fig. 17. Variability of results because of utilization of multiple print runs.

80
Stability of human immunosignature: as I described in the previous
chapter, the immunosignature platform offers the opportunity of tracking
the immuno-reactivity of plasma against different microarray peptides
overtime. Finding whether a signature is stable overtime in humans is
relevant for two practical reasons: firstly, if the overall immuno-signature is
unstable, then the technique may not be suitable for future application as
a diagnostic test; conversely, if the signature is stable, then it becomes
pertinent to know at which point exactly it diverges from normal signature.
In order to explore whether an antibody signature in humans remains
constant overtime or disappears on follow-up, we assayed 2 plasma
samples obtained several months apart from 5 patients with AD (including
the 4 autopsy-proven cases), 6 normal elderly controls (including the 4
cases with autopsy) and the patient with diagnosis of PSP on post-mortem
examination. Figure 18 shows that, using a single print-run, plasma
samples taken at time zero strikingly align with their own follow-up
samples. Moreover, 53 microarray peptides are capable of discriminating
between AD and control plasma, whereas the PSP patient exhibits an
intermediate pattern. On a Principal Component Analysis (Figure 19), AD
plasma samples appear to aggregate away from controls, no matter if
samples were taken at time zero or thereafter. Conversely, no discernible
pattern was noted when time points (time zero versus follow-up) were
used as the clustering paradigm. Similar results were noted when the

81
same print run of a second microarray platform with 10.000 different
random-sequence peptides was used.
Figure 18: Stability of human immunosignature.
Fig. 18. Heatmap showing short-term stability of AD signature. Heatmap of plasma samples from AD and controls taken at time zero and follow-up (usually 6
mos).
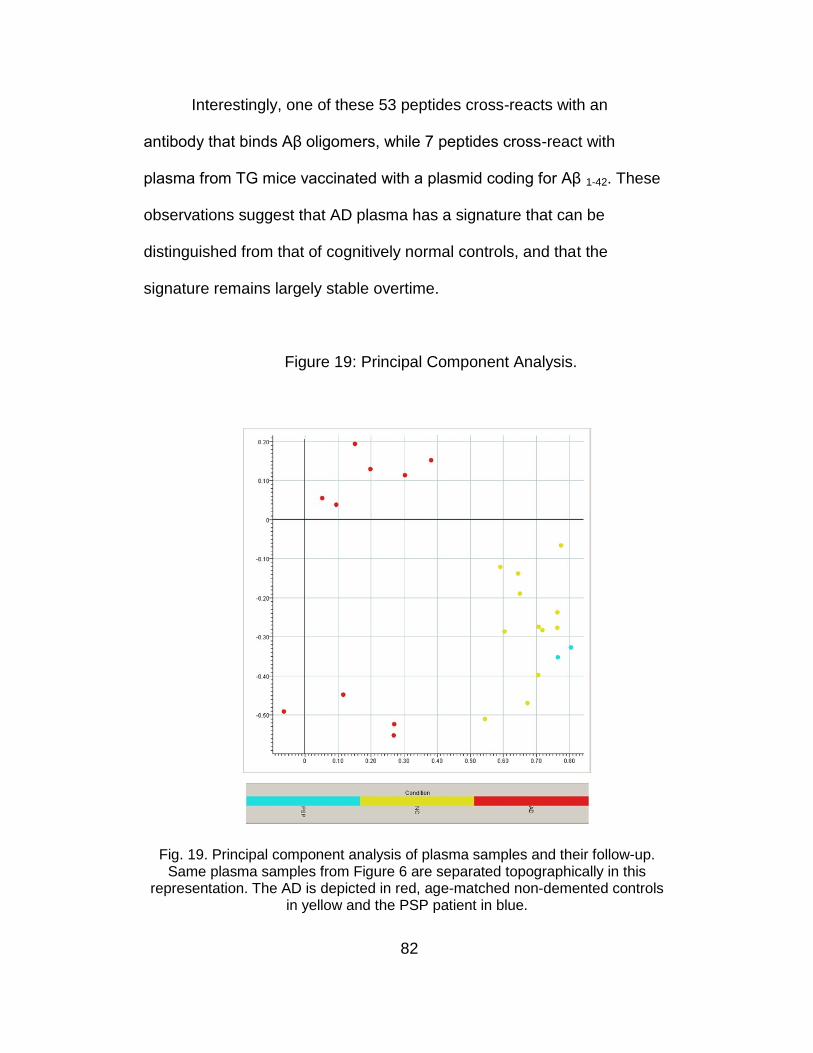
82
Interestingly, one of these 53 peptides cross-reacts with an
antibody that binds Aβ oligomers, while 7 peptides cross-react with
plasma from TG mice vaccinated with a plasmid coding for Aβ 1-42. These
observations suggest that AD plasma has a signature that can be
distinguished from that of cognitively normal controls, and that the
signature remains largely stable overtime.
Figure 19: Principal Component Analysis.
Fig. 19. Principal component analysis of plasma samples and their follow-up. Same plasma samples from Figure 6 are separated topographically in this
representation. The AD is depicted in red, age-matched non-demented controls in yellow and the PSP patient in blue.

83
Alternative methods of data-mining: several microarray peptides are
preferably bound by AD plasma, even if slides from different print runs
were used. Table 4 (below) shows a ranking of the top-10 peptides from a
total of 25 that were useful to distinguish AD plasma from elderly controls,
regardless of print-run.
Table 4
Top peptides predicting AD using other statistical techniques
Rank ES PEPTIDE SEQUENCE p Value
1 1.2731 KIAMFKWLMGDNFNWKKGSC
7.2e-006
2 1.2361 RRSVQQYNFYLSQMNQYGSC
1.2e-005
3 1.2018 HKEAWREPWEGKYPFMTGSC
1.9e-005
4 1.1841 HFGAWRFFGTAWYARNPGSC
2.5e-005
5 1.174 ITEETMVQYEYVRIKQDGSC
2.8e-005
6 1.1729 MWKFQPRSNDNPARWNDGSC
2.9e-005
7 1.172 GFHGPGMLGKTGRLSYGGSC
2.9e-005
8 1.1665 KIGKNIHHQQRTMTYTWGSC
3.1e-005
9 1.1597 ISYLKTALALYFIVQESGSC
3.4e-005
10 1.157 KDRFLQKGKQMFVPPWKGSC
3.6e-005
___________________________________________________________
Where ES equals effect size (intensity threshold of ≥1.1).

84
Using a multiple variable Receiver Operating Characteristic (ROC)
technique, 25 peptides (Table 2) provided efficient means to predict AD,
regardless of the print-run used, when the effect size (ES) threshold was
≥1.1. The combined partial least square (PLS) showed a highly significant
difference between AD and controls (p=0.000002). Using all of the top-10
selected peptides with Jackknife technique, an overall sensitivity and
specificity of 83% was found. Using the highest ranking peptide by itself,
sensitivity and specificity were 80%. When the 3 most significant peptides
were used, 87% sensitivity 87% and 77% specificity was attained. Using
the top 5 most significant peptides, the sensitivity was 90% and specificity
77%. Using the 8 most significant peptides, the sensitivity and specificity
were 87%.
Discussion
I have described herein a novel method to assess the
immunoreactivity patterns of humans with or without AD. The used
microarray platform features 10,000 random-sequence peptides that
appear to behave as mimetics of the original targets of tested antibodies. I
demonstrated that plasma of elderly patients with or without dementia
reacts with microarray peptides, and that this reaction takes the form of
different patterns that allowed us to discriminate, to certain degree,

85
between patients with or without disease. Furthermore, I showed that the
bulk of the immunosignature is independent of Aβ.
I also identified a set of random peptides from the array with the
highest binding by particular plasma samples, allowing plans for
development of arrays with reduced number of peptides, or individual
ELISAs using random peptides as antigen. This high-throughput screening
platform has been used for identifying surface-immobilized peptides which
specifically bind bacterial lipopolysaccharides [7-8], guiding production of
synthetic antibodies [9] and characterizing humoral response to infections
and vaccination [10], but not until now employed until now to evaluate a
chronic disease such as dementia.
In a different proteomic approach to the assessment of dementia, a
double-sandwich ELISA microarray featuring plasma cytokines was used
to classify blinded samples from patients with clinical diagnosis of AD with
almost 90% accuracy [11]. Compared to such platform, our microarray has
3 advantages: (a) it multiplies by 83.3 the number of analytes, (b) it assays
antibodies, as opposed to cytokines, which are very stable, and (c) it is
inexpensive, with average slide cost of about $50.

86
As previously said, AD diagnosis is an imprecise process of
exclusion of other neurological entities, as illustrated by the misdiagnosis
of the PSP patient. The gold standard of AD diagnosis is its characteristic
neuropathology, which is rarely available to clinicians. Correct disease
classification is imperative for obvious reasons; therefore, a simple test
that helps refine the classification of dementia is needed. Also, many auto-
antibodies, including anti-Aβ and anti-tau are found in normal elderly
individuals at low titers. However, it is unclear whether titers change
overtime or correlate with different clinical stages. I speculate that
autoantibodies react to the microarray peptides, accounting in part for the
observed signatures. This assertion is based on our finding of microarray
peptides that bound commercial anti-Aβ antibodies and AD plasma, while
a small portion of the AD immunosignature was blocked with Aβ.
Finally, I demonstrated that the antibody signature exhibited by
elderly human subjects with or without AD remains mostly stable over
time. Such antibody-binding pattern is different for each individual, in
effect resembling a fingerprint, but sharing commonality with other
individuals from the same group, an important effect when attempting to
classify disease status. This particular property of the microarray platform,
combined with its stability, suggests use as a diagnostic tool.

87
Without doubt, my studies have many limitations. Given the limited
patient cohort, these results should be considered preliminary, but a proof
of principle. I am currently assaying more plasma samples from AD
patients and normal elderly controls to answer whether our microarray
platform can be used to assist in the clinical classification of dementia. I
also wish to confirm with larger numbers whether an immunosignature
precedes the onset of cognitive impairment in humans. Given the slow
progression of AD pathology (thought to develop many years in advance
of symptom onset), an emerging humoral immune response, if any, could
be detected and tracked in plasma.
Closing remarks
The patterns formed with antibody binding to microarrays may have
potential as a diagnostic tool for many diseases, including AD.
Understanding the stability of these signatures over time is important
because if time-point variations are small, then larger sample pools could
be used without concerns about noise dampening the signature out over
time. Furthermore, if there is a personal component of the signature, it
could be useful for monitoring disease progression or response to
treatment. Relative to the first issue, AD signatures seem distinguishable
from age-matched controls regardless of whether they were early or late
88
samples. Relative to the second issue, there was clearly a personal
component. The two samples from the same individual, including the PSP
patient, were most similar to each other. This was also true for the non-AD
samples, indicating that each person may have a distinctive
immunosignature that is stable, analogous to a fingerprint.
The ability to create a signature for AD could have value in several
ways including confirmation of standard diagnosis, enrollment in clinical
trials and monitoring responses to treatment. Lacking practical tests to
diagnose AD is not only problematic for patient care, it also represents a
barrier for clinical trials, since many enrolled subjects will not have the
disease of interest and therefore would not expect benefit from the studied
intervention. Antibody-based diagnostic tests have experienced renewed
interest with the development of microarrays featuring plasma cytokines,
random-sequence peptides or peptoids. Surveying the antibody repertoire
of individuals with or without a disease has many advantages. There are
~109 estimated different antibody specificities, reflecting a history of
exposure to a variety of antigens [10]. Antibodies are produced early in
the course of diseases, amplify a signal, and are easily retrieved from
body fluids, including blood. Finally, antibodies are durable and can be
easily stored, making them suitable for retrospective analysis. Until
recently, immunoassays were limited by the traditional view that the

89
eliciting antigen needs to be known and immobilized to detect an antibody
response. However, we developed unbiased platforms to evaluate AD
using random-sequence peptides, which principally behave as mimetics of
unknown antigens.
Ideally, AD should be detected at the pre-symptomatic or early
symptomatic stages, when promising disease-modifying therapies are
expected to exert greatest benefits. Unfortunately, these stages are also
ill-defined aspects of the disease, susceptible to diagnostic
misclassification with current standards. In summary, the evaluation of
immunosignatures using random-sequence peptide arrays is a promising
technique that can be applied to AD research. Future studies with more
patients are needed to appraise the merits of immunosignaturing as a
potential diagnostic test.

90
REFERENCES
CHAPTER 1:
(1) Ferri CP, Prince M, Brayne C, et al. Global prevalence of dementia:
a Delphi consensus study. Lancet 2005; 366:2112-2117.
(2) Brookmeyer R, Grey S, Kawas CH: Projections of Alzheimer‘s disease in the United States and the public health impact of delaying disease onset. Am J Public Health 1998; 88:1337-1342.
(3) Kawas CH. Early Alzheimer‘s Disease. N Eng J Med 2003;
349:1056-1063. (4) Wimo A, Winblad B. Health economical aspects of Alzheimer
disease. Psychogeriatrics 2001;1:189-93. (5) Shaw LM, Vanderstichele H, Knapik-Czajka, et al. Cerebrospinal
fluid biomarker signature in Alzheimer‘s Disease Neuroimaging Initiative subjects. Ann Neurol 2009; 65: 403-413.
(6) Petersen RC, Smith GE, Waring SC, Ivnik RJ, Tangalos EG,
Kolmen E. Mild cognitive impairment: clinical characterization and outcome. Arch Neurol 1999: 56:760.
(7) Golde TE, Kukar TL. Medicine. Avoiding unintended toxicity.
Science 2009; 324: 603-604.
(8) Chui H, Lee AE. Clinical criteria for dementia subtypes. In:
Qizilbash N, Schneider L, Brodaty H, et al., eds. Evidence-based dementia practice. Oxford, England: Blackwell Science, 2002: 106-19.
(9) Arnold SE, Hyman BT, Flory J, Damasio AR, Van Hoesen GW. The
topographical and neuroanatomical distribution of neurofibrillary tangles and neuritic plaques in the cerebral cortex of patients with Alzheimer's disease. Cereb Cortex 1991;1 :103–16.

91
(10) Maurer K, Prvulovic D. Carolus Horn - When the images in the
brain decay. In: Bogousslavsky J, Boller F, eds. Neurological disorders in famous artists. Basel, Switzerland: Karger, 2005: 101-111.
(11) Scheuner D, Eckman C, Jensen M, Song X, Citron M, Suzuki N, et
al. Secreted amyloid beta-protein similar to that in the senile plaques of Alzheimer's disease is increased in vivo by the presenilin 1 and 2 and APP mutations linked to familial Alzheimer's disease. Nat Med 1996; 2: 864-70.
(12) Mehta PD, Pirttila T, Mehta SP, Sersen EA, Aisen PS, Wisniewski
HM. Plasma and cerebrospinal fluid levels of Amyloid β proteins 1-40 and 1-42 in Alzheimer disease. Arch Neurol 2000; 57:100-106.
(13) Kayed R, Head E, Thompson JL, Mcintire TM, Milton SC, Cotman
CW, Glabe CG. Common structure of soluble amyloid oligomers implies common mechanism of pathogenesis. Science 2003; 300:486-489.
(14) McKhann GM, Knopmanc DS, Chertkow H, et al. The diagnosis of
dementia due to Alzheimer‘s disease: Recommendations from the National Institute on Aging and the Alzheimer‘s Association workgroup. Alzheimer‘s & Dementia 2011;1:1–7.
(15) Serneels L, Van Biervliet J, Craessaerts K, et al. γ-Secretase
Heterogeneity in the Aph1 Subunit: Relevance for Alzheimer‘s Disease. Science 2009; 324: 639-642.
(16) Ghosh AK, Gemma S, Tang J. Beta-Secretase as a therapeutic
target for Alzheimer's disease. Neurotherapeutics 2008; 5:399-408.
(17) Patton RL, Kalback WM, Esh CL, Kokjohn TA, van Vickle GD,
Luehrs DC, et al. Amiloid-β peptide remnants in AN-1792-immunized Alzheimer‘s disease patients. Am J Pathol 2006, 169: 1048-1063.
92
(18) Sinha G. Peering inside Alzheimer‘s brains. Nature Biotech 2011; 29: 384-387.
(19) Robertson ED, Mucke L. 100 Years and Counting: Prospects for
Defeating Alzheimer's Disease. Science 2006; 314: 781-784. (20) Regelson W, Harkins SW. "Amyloid is not a tombstone"--a
summation. The primary role for cerebrovascular and CSF dynamics as factors in Alzheimer's disease (AD): DMSO, fluorocarbon oxygen carriers, thyroid hormonal, and other suggested therapeutic measures. Ann N Y Acad Sci. 1997; 26 (826):348-74.
(21) Wyss-Coray T. Inflammation in Alzheimer disease: driving force,
bystander or beneficial response? Nat Med. 2006; 12: 1005-1015. (22) Ray S, Britschgi M, Herbert C, et al. Classification and prediction of
clinical Alzheimer's diagnosis based on plasma proteins. Nat Med. 2007;13:1359-1362.
(23) Baril L, Nicolas L, Croisile B, et al. Immune response to Abeta-
peptides in peripheral blood from patients with Alzheimer's disease and control subjects. Neurosci Lett. 2004; 355: 226-230.
(24) Dodel R, Hampel H, Depboylu C, et al. Human antibodies against
amyloid beta peptide: a potential treatment for Alzheimer‘s disease. Ann Neurol 2002; 52: 253–256.
(25) Du Y, Dodel R, Hampel H, et al. Reduced levels of amyloid beta-
peptide antibody in Alzheimer disease. Neurology 2001; 57: 801–805.
(26) Du Y, Wei X, Dodel R, et al. Human anti-beta-amyloid antibodies
block beta-amyloid fibril formation and prevent beta-amyloid-induced neurotoxicity. Brain 2003; 126: 1935-1939.

93
(27) Lopez O, Rabin BS, Huff FJ, et al. Serum autoantibodies in patients with Alzheimer's disease and vascular dementia and in nondemented control subjects. Stroke 1992; 23: 1078-1083.
(28) Tan EM, Feltkamp TE, Smolen JS, et al. Range of antinuclear
antibodies in "healthy" individuals. Arthritis Rheum 1997; 40: 1601–11.
(29) Gaskin F, Kingsley BS, Fu SM. Autoantibodies to neurofibrillary
tangles and brain tissue in Alzheimer‘s disease. Epstein-Barr virus-transformed antibody-producing cell lines. J Exp Med 1987; 165: 245–250.
(30) O'Nuallain B, Hrncic R, Wall JS, et al. Diagnostic and Therapeutic
Potential of Amyloid-Reactive IgG Antibodies Contained in Human Sera. J Immunol. 2006; 176: 7071-7078.
(31) Nath A, Hall E, Tuzova M, et al. Autoantibodies to amyloid β-
peptide are increased in Alzheimer‘s disease patients and Aβ antibodies can enhance Aβ neurotoxicity. Neuromol Med 2003; 3: 29-39.
(32) Mruthini S, Buccafusco JJ, Hill WD, et al. Autoimmunity in
Alzheimer‘s disease: increased levels of circulating IgGs binding Aβ and RAGE peptides. Neurobiol Aging 2004; 25: 1023-1032.
(33) Moir R, Tseitlin KA, Soscia S, et al. Autoantibodies to redox-
modified oligomeric A{beta} are attenuated in the plasma of Alzheimer's disease patients. J Biol Chem 2005; 280: 17458-17463.
(34) Friedland R, Tedesco JM, Wilson AC, et al. Antibodies to Potato
Virus Y Bind the Amyloid {beta} Peptide: Immuno-histochemical and NMR studies. J Biol Chem 2008; 283: 22550-22556.
(35) Rosenmann H, Meiner Z, Geylis V, et al. Detection of circulating
antibodies against tau protein in its unphosphorylated and in its

94
neurofibrillary tangles-related phosphorylated state in Alzheimer's disease and healthy subjects. Neurosci Lett 2006; 410: 90-93.
(36) Schenk D, Barbour R, Dunn W, et al. Immunization with amyloid-
beta attenuates Alzheimer-disease-like pathology in the PDAPP mouse. Nature 1999; 400: 173–77.
(37) Janus C, Pearson J, McLaurin J, et al. Abeta peptide immunization
reduces behavioural impairment and plaques in a model of Alzheimer's disease. Nature 2000; 408: 979–82.
(38) Morgan D, Diamond DM, Gottschall PE, et al. Abeta peptide
vaccination prevents memory loss in an animal model of Alzheimer's disease. Nature 2000; 408: 982–85.
(39) Bayer AJ, Bullock R, Jones RW, et al. Evaluation of the safety and
immunogenicity of synthetic Abeta42 (AN1792) in patients with AD. Neurology 2005; 64: 94–101.
(40) Orgogozo JM, Gilman S, Dartigues JF, et al. Subacute
meningoencephalitis in a subset of patients with AD after Abeta42 immunization. Neurology 2003; 61: 46–54.
(41) Lee M, Bard F, Johnson-Wood K, et al. Abeta42 immunization in
Alzheimer's disease generates Abeta N-terminal antibodies. Ann Neurol 2005; 58: 430–35.
(42) Masliah E, Hansen L, Adame A, et al. Abeta vaccination effects on
plaque pathology in the absence of encephalitis in Alzheimer disease. Neurology 2005; 64: 129–31.
(43) Bard F, Cannon C, Barbour R, et al. 2000. Peripherally
administered antibodies against amyloid beta-peptide enter the central nervous system and reduce pathology in a mouse model of Alzheimer disease. Nat Med 2000; 6: 916–19.

95
(44) DeMattos RB, Bales KR, Cummins DJ, et al. Peripheral anti-Abeta antibody alters CNS and plasma Abeta clearance and decreases brain Abeta burden in a mouse model of Alzheimer's disease. Proc Natl Acad Sci USA 2001;98:8850–55.
(45) Hartman RE, Izumi Y, Bales KR, et al. Treatment with an amyloid-
beta antibody ameliorates plaque load, learning deficits, and hippocampal long-term potentiation in a mouse model of Alzheimer's disease. J Neurosci 2005;25:6213–20.
(46) Brody DL, Holzman DM. Active and Passive Immunotherapy for
Neurodegenerative Disorders. Ann Review Neurosci 2008; 31: 175-193.
(47) Siemers ER, Friedrich S, Dean RA, et al. Safety and changes in
plasma and cerebrospinal fluid Amyloid [beta] after a single administration of an Amyloid [beta] monoclonal antibody in subjects with Alzheimer Disease. Clin Neuropharmacol 2010;33:67-73.
(48) http://clinicaltrials.gov/ct2/results?term=Solanezumab, accessed
April 21, 2011. (49) Götz J, Streffer JR, David D, et al. Transgenic animal models of
Alzheimer's disease and related disorders: histopathology, behavior and therapy. Molecular Psychiatry 2004; 9: 664–683.
(50) Götz J, Ittner LM. Animal models of Alzheimer‘s disease and
frontotemporal dementia. Nature reviews 2008;9:532-543. (51) Games D, Adams D, Alessandrini R, et al. Alzheimer-type
neuropathology in transgenic mice overexpressing V717F beta-amyloid precursor protein. Nature 1995; 373: 523–527.
(52) Shen J, Bronson RT, Chen DF, et al. Skeletal and CNS defects in
presenilin-1-deficient mice. Cell 1997; 89: 629–639.

96
(53) Herreman A, Hartmann D, Annaert W, et al. Presenilin 2 deficiency causes a mild pulmonary phenotype and no changes in amyloid precursor protein processing but enhances the embryonic lethal phenotype of presenilin 1 deficiency. Proc Natl Acad Sci USA 1999; 96: 11872–11877.
(54) Borchelt DR, Thinakaran G, Eckman CB, et al. Familial Alzheimer's
disease-linked presenilin 1 variants elevate Abeta1-42/1-40 ratio in vitro and in vivo. Neuron 1996; 17: 1005–1013.
(55) Holcomb L, Gordon MN, McGowan E, et al. Accelerated Alzheimer-
type phenotype in transgenic mice carrying both mutant amyloid precursor protein and presenilin 1 transgenes. Nat Med 1998; 4: 97–100.
(56) Oddo S, Caccamo A, Shepherd JD, et al. Triple-transgenic model
of Alzheimer's disease with plaques and tangles. Intracellular abeta and synaptic dysfunction. Neuron 2003; 39: 409–421.
(57) Hofker MH, van Vlijmen BJ, Havekes LM. Transgenic mouse
models to study the role of APOE in hyperlipidemia and atherosclerosis. Atherosclerosis. 1998;137:1-11.
(58) Bales KR, Verina T, Dodel RC, et al. Lack of apolipoprotein E
dramatically reduces amyloid beta-peptide deposition. Nat Genet 1997; 17: 263–264.
(59) Espina V, Woodhouse EC, Wulfkuhle J, et al. Protein microarray
detection strategies: focus on direct detection technologies. J Immunol Methods 2004; 290: 121-133.
(60) Borrebaeck CAK, Christer Wingren C. Design of high-density
antibody microarrays for disease proteomics. J Proteomics 2009; 72:928-935.
97
(61) Burbelo PD, Ching KH, Bush ER, Han BL, Iadarola MJ. Antibody-profiling technologies for studying humoral responses to infectious agents. Expert Rev Vaccines 2010; 9:567-578.
(62) Katz C, Levy-Beladev L, Rotem-Bamberger S, et al. Studying
protein–protein interactions using peptide arrays. Chem Soc Rev 2011. DOI: 10.1039/c0cs00029a
(63) Ray S, Mehta G, Srivastava S. Label-free detection techniques for
protein microarrays: Prospects, merits and challenges. Proteomics 2010; 10:731-748.
(64) Ramachandran N, Hainsworth E, Bhullar B, et al. Self-assembling
protein microarrays. Science 2004; 305: 86-90. (65) Beyer M, Nesterov A, Block I, et al. Combinatorial synthesis of
peptide arrays onto a microchip. Science 2007; 318: 1888. (66) Andresen H, Grötzinger C. Deciphering the Antibodyome - Peptide
Arrays for Serum Antibody Biomarker Diagnostics. Current Proteomics 2009; 6: 1-12.
(67) Hanash SM, Baik CS, Kallioniemi O. Emerging molecular
biomarkers—blood-based strategies to detect and monitor cancer. Nature Reviews Clinical Oncology 2011: 8; 142-150.
(68) Qiu J, Choi G, Li L, et al. Occurrence of autoantibodies to annexin I,
14-3-3 theta and LAMR1 in prediagnostic lung cancer sera. J. Clin. Oncol. 2008; 26: 5060–5066.

98
CHAPTER 2:
(1) Ferri CP, Prince M, Brayne C, et al. Global prevalence of dementia:
a Delphi consensus study. Lancet 2005; 366: 2112-2117.
(2) Brookmeyer R, Grey S, Kawas CH: Projections of Alzheimer‘s
disease in the United States and the public health impact of delaying disease onset. Am J Public Health 1998; 88:1337-1342.
(3) Kawas CH. Early Alzheimer‘s Disease. N Eng J Med 2003; 349:1056-1063.
(4) Chui H, Lee AE. Clinical criteria for dementia subtypes. In:
Qizilbash N, Schneider L, Brodaty H, et al., eds. Evidence-based dementia practice. Oxford, England: Blackwell Science, 2002: 106-19.
(5) Shaw LM, Vanderstichele HKnapik-Czajka, et al. Cerebrospinal
fluid biomarker signature in Alzheimer‘s Disease Neuroimaging Initiative subjects. Ann Neurol 2009; 65: 403-413.
(6) Sinha G. Peering inside Alzheimer‘s brains. Nature Biotech 2011;
29: 384-387. (7) Wyss-Coray T. Inflammation in Alzheimer disease: driving force,
bystander or beneficial response? Nat Med 2006; 12:1005-1015. (8) Baril L, Nicolas L, Croisile B, et al. Immune response to Abeta-
peptides in peripheral blood from patients with Alzheimer's disease and control subjects. Neurosci Lett 2004; 355: 226-230.
(9) Dodel R, Hampel H, Depboylu C, et al. Human antibodies against
amyloid beta peptide: a potential treatment for Alzheimer‘s disease. Ann Neurol 2002;52:253–256.

99
(10) Du Y, Dodel R, Hampel H, et al. Reduced levels of amyloid beta-peptide antibody in Alzheimer disease. Neurology 2001; 57: 801–805.
(11) Du Y, Wei X, Dodel R, et al. Human anti-beta-amyloid antibodies
block beta-amyloid fibril formation and prevent beta-amyloid-induced neurotoxicity. Brain. 2003;126: 1935-1939.
(12) Friedland R, Tedesco JM, Wilson AC, et al. Antibodies to Potato
Virus Y Bind the Amyloid {beta} Peptide: Immuno-histochemical and NMR studies. J Biol Chem 2008; 283: 22550-22556.
(13) Gaskin F, Kingsley BS, Fu SM. Autoantibodies to neurofibrillary
tangles and brain tissue in Alzheimer‘s disease. Epstein-Barr virus-transformed antibody-producing cell lines. J Exp Med 1987;165:245–250.
(14) Moir R, Tseitlin KA, Soscia S, et al. Autoantibodies to redox-
modified oligomeric A{beta} are attenuated in the plasma of Alzheimer's disease patients. J Biol Chem. 2005; 280: 17458-17463.
(15) Buckholtz NS. In search of biomarkers. Nature 2011; 475 (7355): S8.
(16) Shaw LM, Vanderstichele H, Knapik-Czajka M, et al. Cerebrospinal Fluid Biomarker Signature in Alzheimer‘s Disease Neuroimaging Initiative Subjects. Ann Neurol 2009; 65: 403–413.
(17) Shaw LM, Korecka M, Clark CM, et al. Biomarkers of neurodegeneration for diagnosis and monitoring therapeutics. Nat Rev Drug Discovery 2007; 6: 295-303.
(18) Ewers M, Sperling RA, Klunk WE, et al. Neuroimaging markers for the prediction and early diagnosis of Alzheimer's disease dementia. Trends Neurosci 2011; 34 (8): 430-42.

100
(19) Morris JC, Storandt M, Miller JP, et al. Mild cognitive impairment
represents early-stage Alzheimer disease. Arch Neurol 2001; 58 (3): 397-405.
(20) Kawas CH. Early Alzheimer‘s Disease. N Eng J Med 2003; 349: 1056-1063.
(21) Grundman M, Petersen RC, Ferris SH, et al. Mild cognitive impairment can be distinguished from Alzheimer disease and normal aging for clinical trials. Arch Neurol 2004; 61 (1): 59-66.
(22) Jankowsky JL, Fadale DJ, Anderson J, Xu GM, Gonzales V, Jenkins NA, Copeland NG, Lee MK, Younkin LH, Wagner SL, Younkin SG, Borchelt DR. Mutant presenilins specifically elevate the levels of the 42 residue beta-amyloid peptide in vivo: evidence for augmentation of a 42-specific gamma secretase. Hum Mol Genet 2004; 13(2): 159-70.
(23) Reiserer RS, Harrison FE, Syverud DC, McDonald MP. Impaired spatial learning in the APPSwe + PSEN1DeltaE9 bigenic mouse model of Alzheimer's disease. Genes Brain Behav 2007; 6(1): 54-65.
(24) Qu B, Rosenberg RN, Li L, Boyer PJ, Johnston SA. Gene vaccination to bias the immune response to amyloid-beta peptide as therapy for Alzheimer disease. Arch Neurol 2004; 61(12): 1859-64.
(25) Qu B, Boyer PJ, Johnston SA, Hynan LS, Rosenberg RN. Abeta42 gene vaccination reduces brain amyloid plaque burden in transgenic mice. J Neurol Sci 2006; 244 (1-2): 151-8.
(26) Qu BX, Xiang Q, Li L, Johnston SA, Hynan LS, Rosenberg RN. Abeta42 gene vaccine prevents Abeta42 deposition in brain of double transgenic mice. J Neurol Sci 2007; 260 (1-2): 204-13.

101
(27) Gotz J IL. Animal models of Alzheimer‘s disease and frontotemporal dementia. Nature reviews 2008; 9: 532-543.
(28) Donahue JE, Johanson CE. Apolipoprotein E, amyloid-beta, and
blood-brain barrier permeability in Alzheimer disease. J Neuropathol Exp Neurol 2008; 67: 261-70.

102
CHAPTER 3:
1) Litvan I, Phipps M, Pharr VL, et al. Randomized placebo-controlled trial of donepezil in patients with progressive supranuclear palsy. Neurology 2001; 57: 467-73.
2) Miller G. Alzheimer‘s biomarker initiative hits its stride. Science 2009; 326: 386-9.
3) Siemers ER, Friedrich S, Dean RA, et al. Safety and changes in plasma and cerebrospinal fluid Amyloid [beta] after a single administration of an Amyloid [beta] monoclonal antibody in subjects with Alzheimer Disease. Clin Neuropharmacol 2010; 33: 67-73.
4) Restrepo L, Stafford P, Magee DM, et al. Application of Immunosignatures to the Assessment of Alzheimer's Disease. Ann Neurol 011;DOI:10.1002/ana.22405.
5) http://adni.loni.ucla.edu/ (accessed 5-20-2011)
6) Larkin M, Blackshields G, Brown NP, et al. ClustalW and ClustalX version 2. Bioinformatics 2007;23:2947-2948.
7) Morales Betanzos C, Gonzalez-Moa MJ, Boltz KW, et al. Bacterial glycoprofiling by using random sequence peptide microarrays. ChemBioChem. 2009; 10: 877-888.
8) Boltz K, Gonzalez-Moa MJ, Stafford P, et al. Peptide microarrays for carbohydrate recognition. Analyst. 2009; 134: 650-652.
9) Williams B, Diehnelt CW, Belcher P, et al. Creating protein affinity reagents by combining peptide ligands on synthetic DNA scaffolds. J Am Chem Soc 2009; 131: 17233-17241.

103
10) Legutki J, Magee DM, Stafford P, Johnston SA. A general method for characterization of humoral immunity induced by a vaccine or infection. Vaccine 2010; 28: 4529-4537.
11) Ray S, Britschgi M, Herbert C, et al. Classification and prediction of clinical Alzheimer's diagnosis based on plasma proteins. Nat Med 2007; 13: 1359-1362.

104
APPENDIX A
EXPLORING THE PREDOMINANT FORM OF Aβ IN PLASMA

105
Using SDS-PAGE followed by western blotting of plasma samples
from normal donors, I found that the predominant forms of circulating Aβ
1-40 and Aβ 1-42 are oligomers, constituted mainly by dodeca- and
hexamers (Figure 1). These oligomers can be detected with 4 different
mono- and polyclonal antibodies raised against Aβ 1-40 and Aβ 1-42 and
quantified using a densitometry software. The relevant bands are also
recognized by a specific anti-oligomer antibody. The pattern of band
immunoreactivity was replicated in 9 normal donors. I did not detect
circulating monomers or dimers, even after separating plasma fractions
using size-exclusion high performance liquid chromatography (HPLC).
Figure 1: Circulating forms of Aβ.
Fig. 1. Western blot of 3 plasma fractions separated using size-exclusion chromatography. There is a predominant 50 kDa band which roughly
corresponds to the Aβ dodecamer.

106
Based on this experiment, I postulate that individuals with AD (in
particular, those with mutations leading to cerebral amyloidosis) may have
circulating oligomers of different molecular weight compared to those in
normal donors. Furthermore, AD cases may exhibit circulating monomers
or dimers, while normal individuals do not. In other words, this very simple
and widely available technology could be used as a diagnostic tool, if AD
patients turn out to have a distinct pattern of immunoreactivity that sets
them apart from normal individuals.

107
APPENDIX B
TESTING ANTI-Aβ ANTIBODIES IN HUMAN PLASMA

108
To confirm whether Aβ antibodies are present in human plasma
samples, I developed an Enzyme-linked immunosorbent assay (ELISA) in
which polysterene plates were coated with Aβ (1-40 or 1-42), with a
concentration of 10 uM in Sodium Carbonate / Bicar-bonate buffer
(pH=11). Synthetic Aβ was purchased from AnaSpec Inc (San Jose,
California). The plates were blocked with 5% Bovine Serum Albumin in
PBS and 0.05% Tween 20 for 1 hour, followed by plasma from patients
dissolved at 1:100 in PBS. The primary antibody was detected with anti-
human antibodies conjugated to HRP (Pierce) and then a colorimetric
reaction was elicited by the addition of ABTS. Optic density was read at
405 nm with a spectrophoto-meter. The tested plasma came from patients
from the Brain-Bank at Sun Health Institute; Aβ levels were reported by Dr
Alex Roher, who measured levels using a double-sandwich ELISA
standardized in his laboratory.

109
Figure 2: Relationship between Aβ levels and anti-Aβ antibody titer
Fig. 2. Aβ levels decreased as anti-Aβ antibody titers rose in non-demented elderly subjects (i.e., negative correlation between Aβ levels and anti-Aβ
antibody titers; Parson‘s r= -0.475), whereas AD patients had a contrary trend (r=0.569). Although the number of samples is small (n=12 for each patient
group), this illustrates the point that in spite of testing the same antigen, the Aβ-binding antibodies may have different biological properties, depending on the
selected population.

Related Documents


