Antioxidants 2022, 11, 1283. https://doi.org/10.3390/antiox11071283 www.mdpi.com/journal/antioxidants Article Immunomodulatory Effects of Aronia Juice Polyphenols—Results of a Randomized Placebo‐Controlled Human Intervention Study and Cell Culture Experiments Sonja Lackner 1 , Tommaso Sconocchia 1,2 , Tobias Ziegler 1,3 , Christina Passegger 1 , Nathalie Meier‐Allard 1 , Elke Schwarzenberger 1 , Willibald Wonisch 4 , Theresa Lahousen 5 , Alexandra Kohlhammer‐Dohr 5 , Sabrina Mörkl 5 , Martina Derler 1,6 , Herbert Strobl 1 and Sandra Johanna Holasek 1, * 1 Division of Immunology and Pathophysiology, Otto Loewi Research Center, Medical University of Graz, 8010 Graz, Austria; [email protected] (S.L.); [email protected] (T.S.); [email protected] (T.Z.); [email protected] (C.P.); [email protected] (N.M.‐A.); [email protected] (E.S.); martina.derler@uni‐graz.at (M.D.); [email protected] (H.S.) 2 Division of Haematology, Department of Internal Medicine, Medical University of Graz, 8036 Graz, Austria 3 Juice Plus+ Science Institute, Collierville, TN 38017, USA 4 Division of Physiological Chemistry, Otto Loewi Research Center, Medical University of Graz, 8010 Graz, Austria; [email protected] 5 Department of Psychiatry and Psychotherapeutic Medicine, Medical University of Graz, 8036 Graz, Austria; [email protected] (T.L.); alexandra.kohlhammer‐[email protected] (A.K.‐D.); [email protected] (S.M.) 6 Department of Pharmacology and Toxicology, University of Graz, 8010 Graz, Austria * Correspondence: [email protected]; Tel.: +43‐316‐385‐71153 Abstract: Dietary polyphenols, which are present in Aronia melanocarpa, have been associated with various beneficial effects on human health including antioxidant, antiviral, and anti‐inflammatory activities. We aimed to investigate the immunomodulatory effects of aronia juice polyphenols in a randomized placebo‐controlled human intervention study and cell culture experiments. A total of 40 females were asked to consume either 200 mL of aronia juice or a placebo drink for six weeks and were investigated again after a washout period of another six weeks. We observed that only half of the participants tolerated the aronia juice well (Vt) and the other half reported complaints (Vc). The placebo (P) was generally tolerated with one exception (p = 0.003). Plasma polyphenol levels increased significantly in Vt after the intervention (p = 0.024) but did neither in P nor in Vc. Regulatory T cell (Treg) frequencies remained constant in Vt and P during the intervention, whereas Tregs decreased in Vc (p = 0.018). In cell culture, inhibiting effects of ferulic acid (p = 0.0005) and catechin (p = 0.0393) on the differentiation of Tregs were observed as well as reduced activation of CD4‐T cells in ferulic acid (p = 0.0072) and aronia juice (p = 0.0163) treated cells. Interestingly, a CD4 + CD25 ‐ FoxP3 + cell population emerged in vitro in response to aronia juice, but not when testing individual polyphenols. In conclusion, our data strengthen possible individual hormetic effects, the importance of the food matrix for bioactivity, and the need for further investigations on possible impacts of specific physiological features such as the gut microbiota in the context of personalized nutrition. Keywords: Aronia melanocarpa juice; polyphenols; regulatory T cells; tolerability; oxidative stress; bioavailability; hormesis; immunomodulation Citation: Lackner, S.; Sconocchia, T.; Ziegler, T.; Passegger, C.; Meier‐Allard, N.; Schwarzenberger, E.; Wonisch, W.; Lahousen, T.; Kohlhammer‐Dohr, A.; Mörkl, S.; et al. Immunomodulatory Effects of Aronia Juice Polyphenols—Results of a Randomized Placebo‐Controlled Human Intervention Study and Cell Culture Experiments. Antioxidants 2022, 11, 1283. https://doi.org/ 10.3390/antiox11071283 Academic Editor: Mario Allegra Received: 19 April 2022 Accepted: 24 June 2022 Published: 28 June 2022 Publisher’s Note: MDPI stays neutral with regard to jurisdictional claims in published maps and institutional affiliations. Copyright: © 2022 by the authors. Licensee MDPI, Basel, Switzerland. This article is an open access article distributed under the terms and conditions of the Creative Commons Attribution (CC BY) license (https://creativecommons.org/license s/by/4.0/).

Welcome message from author
This document is posted to help you gain knowledge. Please leave a comment to let me know what you think about it! Share it to your friends and learn new things together.
Transcript
Antioxidants 2022, 11, 1283. https://doi.org/10.3390/antiox11071283 www.mdpi.com/journal/antioxidants
Article
Immunomodulatory Effects of Aronia Juice
Polyphenols—Results of a Randomized Placebo‐Controlled
Human Intervention Study and Cell Culture Experiments
Sonja Lackner 1, Tommaso Sconocchia 1,2, Tobias Ziegler 1,3, Christina Passegger 1, Nathalie Meier‐Allard 1,
Elke Schwarzenberger 1, Willibald Wonisch 4, Theresa Lahousen 5, Alexandra Kohlhammer‐Dohr 5,
Sabrina Mörkl 5, Martina Derler 1,6, Herbert Strobl 1 and Sandra Johanna Holasek 1,*
1 Division of Immunology and Pathophysiology, Otto Loewi Research Center, Medical University of Graz,
8010 Graz, Austria; [email protected] (S.L.); [email protected] (T.S.);
[email protected] (T.Z.); [email protected] (C.P.);
[email protected] (N.M.‐A.); [email protected] (E.S.);
martina.derler@uni‐graz.at (M.D.); [email protected] (H.S.) 2 Division of Haematology, Department of Internal Medicine, Medical University of Graz, 8036 Graz, Austria 3 Juice Plus+ Science Institute, Collierville, TN 38017, USA 4 Division of Physiological Chemistry, Otto Loewi Research Center, Medical University of Graz,
8010 Graz, Austria; [email protected] 5 Department of Psychiatry and Psychotherapeutic Medicine, Medical University of Graz, 8036 Graz, Austria;
[email protected] (T.L.); alexandra.kohlhammer‐[email protected] (A.K.‐D.);
[email protected] (S.M.) 6 Department of Pharmacology and Toxicology, University of Graz, 8010 Graz, Austria
* Correspondence: [email protected]; Tel.: +43‐316‐385‐71153
Abstract: Dietary polyphenols, which are present in Aronia melanocarpa, have been associated with
various beneficial effects on human health including antioxidant, antiviral, and anti‐inflammatory
activities. We aimed to investigate the immunomodulatory effects of aronia juice polyphenols in a
randomized placebo‐controlled human intervention study and cell culture experiments. A total of
40 females were asked to consume either 200 mL of aronia juice or a placebo drink for six weeks
and were investigated again after a washout period of another six weeks. We observed that only
half of the participants tolerated the aronia juice well (Vt) and the other half reported complaints
(Vc). The placebo (P) was generally tolerated with one exception (p = 0.003). Plasma polyphenol
levels increased significantly in Vt after the intervention (p = 0.024) but did neither in P nor in Vc.
Regulatory T cell (Treg) frequencies remained constant in Vt and P during the intervention, whereas
Tregs decreased in Vc (p = 0.018). In cell culture, inhibiting effects of ferulic acid (p = 0.0005) and
catechin (p = 0.0393) on the differentiation of Tregs were observed as well as reduced activation of
CD4‐T cells in ferulic acid (p = 0.0072) and aronia juice (p = 0.0163) treated cells. Interestingly, a
CD4+CD25‐FoxP3+ cell population emerged in vitro in response to aronia juice, but not when testing
individual polyphenols. In conclusion, our data strengthen possible individual hormetic effects, the
importance of the food matrix for bioactivity, and the need for further investigations on possible
impacts of specific physiological features such as the gut microbiota in the context of personalized
nutrition.
Keywords: Aronia melanocarpa juice; polyphenols; regulatory T cells; tolerability; oxidative stress;
bioavailability; hormesis; immunomodulation
Citation: Lackner, S.; Sconocchia, T.;
Ziegler, T.; Passegger, C.;
Meier‐Allard, N.; Schwarzenberger,
E.; Wonisch, W.; Lahousen, T.;
Kohlhammer‐Dohr, A.; Mörkl, S.; et
al. Immunomodulatory Effects of
Aronia Juice Polyphenols—Results
of a Randomized Placebo‐Controlled
Human Intervention Study and Cell
Culture Experiments. Antioxidants
2022, 11, 1283. https://doi.org/
10.3390/antiox11071283
Academic Editor: Mario Allegra
Received: 19 April 2022
Accepted: 24 June 2022
Published: 28 June 2022
Publisher’s Note: MDPI stays
neutral with regard to jurisdictional
claims in published maps and
institutional affiliations.
Copyright: © 2022 by the authors.
Licensee MDPI, Basel, Switzerland.
This article is an open access article
distributed under the terms and
conditions of the Creative Commons
Attribution (CC BY) license
(https://creativecommons.org/license
s/by/4.0/).
Antioxidants 2022, 11, 1283 2 of 18
1. Introduction
Polyphenols are secondary plant nutrients, and major plant dyes and are responsible
for the plant’s flavor. They protect plants from herbivores and other environmental
stressors and attract insects and animals beneficial for reproduction. Polyphenols occur in
various fruits and vegetables, tea, coffee and cocoa, and herbs, whereas especially dark
berries have a high content of polyphenols [1]. Many hundreds of polyphenols exist.
According to their chemical structure, they can be allocated into two main categories: non‐
flavonoids (such as phenolic acid, stilbenes, coumarins, lignans, tannins) and flavonoids
(such as flavonols, flavononols, favones, flavanols, flavanones, anthocyanidins,
isoflavonoids) [2,3].
In recent years, plant polyphenols have been associated with various beneficial
effects on human health because of their antidiabetic, cardiovascular [4], neuroprotective
and antihypertensive [5] actions. Some evidence of their protective and therapeutic effects
on diseases that are closely connected to immune response such as inflammatory diseases,
allergic occurrences, or autoimmune diseases has been reported [6]. Further, antibacterial,
antiviral, and anti‐inflammatory activities of Aronia melanocarpa have been identified [7].
These positive health effects have mainly been attributed to the polyphenols’
antioxidant properties that counteract oxidative stress and chronic inflammation [8].
Moreover, the polyphenols’ involvement in immune metabolism has been the focus of
research as they have been shown to contribute to immune cell proliferation and
differentiation and modulate immune cell pathways [9,10]. Polyphenols inhibit
proinflammatory pathways, decrease proinflammatory cytokine production and promote
innate and acquired defense mechanisms [6]. Several phenolic compounds have been
reported to modulate the immune system in a biphasic manner [11,12].
Within the immune system, regulatory T cells (Tregs) are key components of
immunomodulation. Tregs are a subset of CD4+ T cells endowed with strong suppressive
abilities [13]. Tregs represent a specialized subset of T cells that are key players in the
regulation of self‐tolerance and homeostasis. These cells are characterized by constitutive
high expression of the interleukin 2 (IL‐2) receptor alpha chain (CD25) and by stable
expression of the Forkhead box P3 (FoxP3) transcription factor [14]. Treg cells can be
divided into natural thymus‐derived Tregs and induced Tregs. The former, as their name
suggests, develops in the thymus and the latter develops in peripheral tissues from naïve
CD4+ CD45RA+ T cells when exposed to TGF‐ β1 [15] and IL‐2 [16]. Tregs regulate the immune response by suppressing T cell activation and proliferation through contact‐
dependent and independent mechanisms and this ability is of crucial importance in order
to shut down inflammation and avoid an excessive inflammatory response, (i.e., following
exposure to pathogenic microorganisms or dietary substances) [17]. Thus, Tregs serve as
a marker of the immune response.
The polyphenols’ impact on human health is not only related to their amount and
qualities taken up by food [11] but also to the efficiency of their release from the food
matrix during digestion [18]. The bioactive compounds provided by natural plant food
are taken up embedded in a complex network of macromolecular structures such as
dietary fibers and other nutrients. They are commonly released during digestion
throughout the gastrointestinal tract; however, their absorption may also be altered by
accompanying dietary components [18]. This bioaccessibility strongly influences the
availability of the compounds for further metabolic processing and thus determines the
bioavailability and the metabolic fate of polyphenols [2].
Polyphenols have a bidirectional interaction with the gut microbiota. In addition to
the microbe’s enzymatic breakdown of the dietary components, polyphenols act as
prebiotics. They nourish the bacteria and promote the growth of certain bacterial strains
and thus modulate the microbial composition [19] which further promotes the immune
system through modulation of metabolism, integrity, and immune function of enterocytes
[20].

Antioxidants 2022, 11, 1283 3 of 18
Compared to other fruits and vegetables the berry Aronia melanocarpa also known as
chokeberry has very high polyphenol concentrations. It comprises a blend of different
polyphenols, whereas proanthocyanidins, anthocyanins and the phenolic acids
chlorogenic acid and neochlorogenic acids are the predominant polyphenols in aronia
berries [21,22]. Proanthocyanidins are condensed tannins and are responsible for the
astringent taste [23] while the high content of anthocyanins causes the dark blue color of
the berries [22]. The beneficial effects of aronia polyphenols on the immune system such
as the reduction in proinflammatory cytokines [7] and immunomodulation through
cellular pathways [6,24] have been revealed and also the beneficial effects on other health
outcomes in particular on oxidative stress, lipid metabolism, blood coagulation and
hypertension [5] have been explored, leading to proposed preventive effects on
cardiovascular diseases [25].
The great majority of publications report on the beneficial effects of aronia
polyphenols on health outcomes. However, controversial data have also been published.
Gajic et.al. [26] observed opposed effects on the immune response in mouse models.
In general, clinical data to explore the effects of aronia fruits on the immune system
are warranted. We investigated the effects of a six‐week intervention of aronia juice
polyphenols compared to a polyphenol‐free placebo drink on plasma polyphenol
concentrations, regulatory T cell (Treg) frequencies in blood, and oxidative stress.
Additionally, we tested the effects of individual polyphenols and aronia juice on T cell
activation and Treg differentiation in cell models. In total, we highlight the possible
hormetic effects of aronia juice polyphenols. Thereby, the hormetic doses may be
dependent on intra‐individual determinants which need to be explored further and may
be essential for personalized dietary approaches.
2. Materials and Methods
2.1. Study Design
We performed a blinded clinical placebo‐controlled intervention study to test the
effects of aronia juice polyphenols on plasma polyphenol levels, oxidative stress, and the
frequencies of regulatory T cells (Treg) in healthy females over a period of six weeks. For
another six weeks without intervention, the persistence of the effects of the polyphenols
was observed (Figure 1). The study protocol included three investigation time points: at
baseline (I), after the intervention (II), and after the washout period (III).
Figure 1. Study design: the participants were investigated at three time points at baseline (I), after
the intervention period of six weeks (II), and after another six weeks of washout (III) to observe any
potential persistent effects of the intervention. The participants were asked to consume 100 mL of
the aronia juice or the polyphenol‐free placebo drink, respectively, twice a day for six weeks.
The study participants were allocated randomly to the verum group (V) who drank
the aronia juice and the placebo group (P) who drank a completely polyphenol‐free
placebo drink. The aronia juice was derived from a local producer and the polyphenol‐
free placebo drink was prepared in accordance with a published recipe [27]. The nutrient
profile of the placebo drink was comparable to the natural juice except for the polyphenol
concentration. The average aronia juice macro‐ and micronutrients content was added to
Antioxidants 2022, 11, 1283 4 of 18
the placebo drink. It was colored with polyphenol‐free food dyes and bottled in the same
containers as the original juice.
The group allocation was blinded to the participants. For the randomization of the
group allocation, a central computerized randomization schedule (www.randomizer.at
(accessed on 25 February 2019), provided by the Institute of Medical Informatics, Statistics
and Documentation of the Medical University of Graz, Austria) stratified for age was ap‐
plied.
The participants were asked to drink a total of 100 mL of aronia juice or the polyphe‐
nol‐free placebo drink, respectively, twice a day in the morning and the evening prefer‐
entially. Thus, the total amount of juice consumed was 200 mL a day. This concentration
has been chosen following previous studies testing the effects of polyphenol‐rich drinks
[28–30].
At all three study visits, blood draws were performed on overnight fasted partici‐
pants, meaning the absence of food and drink intake of at least 12 h with the exception of
tap water. Plasma, serum, and whole blood samples were collected for further laboratory
analysis as described in Section 2.6.
2.2. Study Population
A total of 40 normal‐weight females aged between 18–40 years were enrolled in the
study. For recruitment, information on the study was spread via the local universities,
libraries, sports clubs, and word of the mouth advertisement. The participants were in‐
formed about the astringent taste of the study drinks in advance to ensure that their indi‐
vidual preferences met the specific taste of the intervention drinks.
The study participants had to meet the following inclusion criteria for enrolment:
premenopausal women aged between 18–40 years, normal body weight according to
WHO criteria, tolerability to astringent taste, and the absence of the defined exclusion
criteria. People with known fructose malabsorption and fructose intolerance, as well as
acute diseases within the previous two months or chronic diseases or infections (including
upper respiratory tract infections, fever, chronic inflammatory disorders, autoimmune
disorders), a history of digestive diseases such as inflammatory bowel disease and irrita‐
ble bowel syndrome, history of gastrointestinal surgery (other than appendectomy), preg‐
nancy and period of breastfeeding, were excluded from study participation. Furthermore,
antibiotic or antifungal treatment within the previous two months and daily or irregular
intake of supplemental prebiotics or probiotics within the previous two months (the in‐
take of yogurt and dairy products was permitted) were exclusion criteria.
The participants were asked to adhere to their regular dietary and lifestyle habits
during their study participation. Any smoking habits were evaluated by the Fagerström
test for nicotine dependency [31].
The ethical approval for this study was obtained by the Ethics Committee of the Med‐
ical University Graz (EK: 30‐009 ex 17/18) and the study was conducted in accordance
with the Declaration of Helsinki. All participants gave their written informed consent and
volunteered in this study.
2.3. Compliance Assessment and Gastrointestinal Symptoms Questionnaire
Contact was kept regularly with the study participants via phone calls and e‐mail to
ensure their motivation and compliance. Any questions and queries regarding the study
were discussed individually. The compliance was checked after the intervention at
timepoint II by weighing the returned juice containers. To check for the tolerability of the
intervention drinks the participants were asked to fill in a gastrointestinal symptoms
questionnaire (adapted from [32]) and to report on side effects associated with the study
drinks.

Antioxidants 2022, 11, 1283 5 of 18
2.4. Anthropometrics
Body height, body weight, and waist circumferences were measured in accordance
with the International Society for the Advancement of Kinanthropometry (ISAK) stand‐
ards [33] and the body mass index (BMI) was calculated according to the formula BMI =
body weight [kg]/body height [m]² [34].
2.5. Nutritional Intake
Dietary and nutrient intake were obtained with the Vienna Food Record [35] which
is based on a 4‐day food record and includes Austrian‐specific eating habits. The nutrient
intake was calculated by the Austrian‐specific nutritional software nut.s® v1.32.95
(www.nutritional‐software.at (accessed on 15 October 2021), dato Denkwerkzeuge, Vi‐
enna Austria). The participants reported on their diets the four days prior to each blood
draw.
2.6. Clinical Laboratory Parameters
Serum, plasma, and whole blood samples were taken from overnight fasted partici‐
pants. The plasma and serum tubes were centrifuged for 10 min at 3000× g and aliquoted
in 300 μL aliquots. The tubes were stored at −80 °C until analysis. Before starting the as‐
says, the samples were thawed and centrifuged for 5 min at 10,000× g. Whole blood sam‐
ples were analyzed within two hours after the blood was taken.
2.6.1. Total Polyphenols in Plasma
For the assessment of total plasma polyphenols, the microtiter‐formate Folin–Ciocal‐
teu method was applied [36]. The polyphenols‐microtitre (PPm) were determined with
the PPm® kit (Omnignostica GmbH, Höflein, Austria). The method is based on a colori‐
metric high‐throughput method for the measurement of polyphenolic compounds in hu‐
man samples and biological fluids. Polyphenols react with the transition metals of the
Folin–Ciocalteu reagents leading to a dark blue colored complex which can be measured
photometrically at 766 nm. For standardization, a serial dilution of gallic acid was used.
PPm values are presented as mmol/L. PPm determination was performed in duplicates.
2.6.2. Oxidative Stress Parameters
Total antioxidant capacity (TAC®) was measured by a colorimetric approach (Labor
Diagnostic Nord, Nordhorn, Germany). This method uses 3,5,3′5′‐tetra‐methylbenzidine
(TMB) as a colorimetric substrate to visualize the inhibition of radicals through antioxi‐
dants. Antioxidants in plasma or serum samples inhibit the effect of reactive oxygen spe‐
cies (ROS) on TMB that is associated with the colorimetric signal. After the incubation, the
color changes from blue to yellow upon the addition of the stop solution. Total peroxides
(TOC®) were similarly determined with a colorimetric assay (Labor Diagnostic Nord,
Nordhorn, Germany). Peroxides in serum and plasma samples react with horseradish pe‐
roxidase to give a blue to a green color to the chromogenic substrate TMB. The color turns
yellowish after the addition of the stop solution. Optical density for TAC and TOC was
performed at a wavelength of 450 nm (reference wavelength 620 nm). A linear standard
curve (up to 1 mM) was used for quantification of total peroxides [37]. TAC and TOC
measurements were performed in duplicates.
To assess the relation between pro‐ and antioxidant conditions, the oxidative stress
index (OSI) was calculated which is expressed in arbitrary units (AU) as the ratio of
TOC/TAC. The OSI is comparably high in cases with a predominance of ROS and higher
TOC compared to TAC indicating higher oxidative stress [38].
2.6.3. Plasma Vitamin C
Vitamin C concentrations in plasma were determined with high‐performance liquid
chromatography (HPLC) using ClinRep®complete Kit (Recipe, Munich, Germany). Since
Antioxidants 2022, 11, 1283 6 of 18
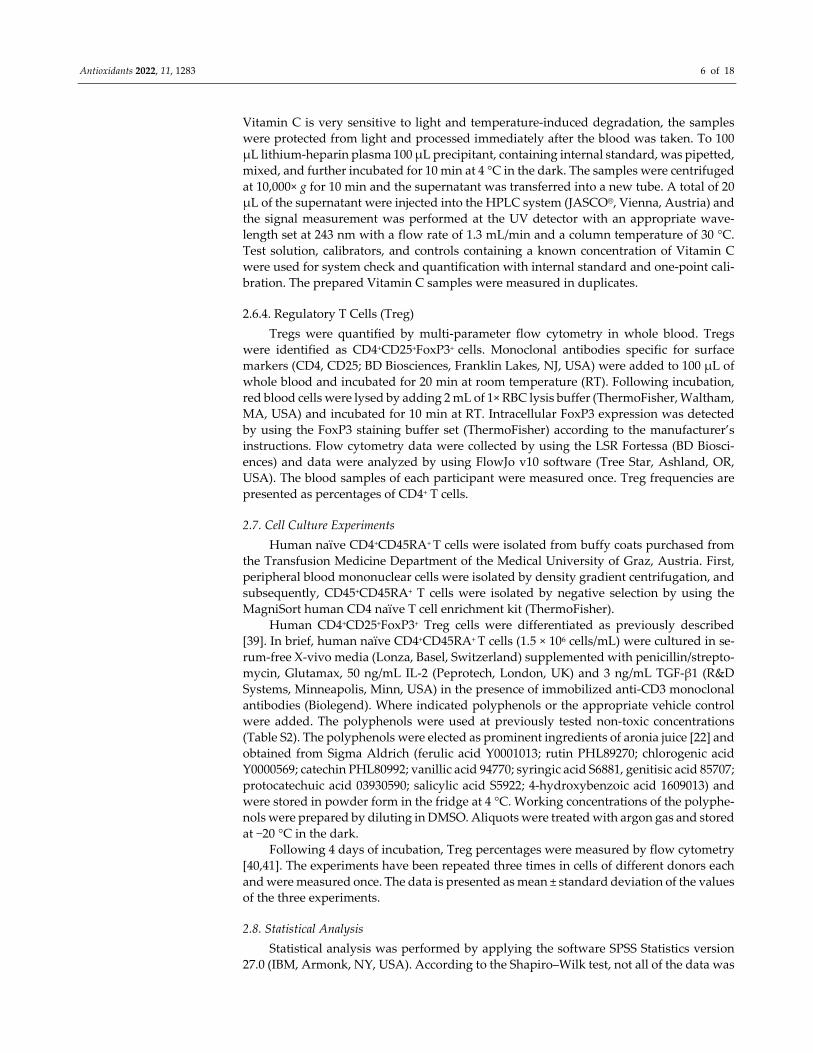
Vitamin C is very sensitive to light and temperature‐induced degradation, the samples
were protected from light and processed immediately after the blood was taken. To 100
μL lithium‐heparin plasma 100 μL precipitant, containing internal standard, was pipetted,
mixed, and further incubated for 10 min at 4 °C in the dark. The samples were centrifuged
at 10,000× g for 10 min and the supernatant was transferred into a new tube. A total of 20
μL of the supernatant were injected into the HPLC system (JASCO®, Vienna, Austria) and
the signal measurement was performed at the UV detector with an appropriate wave‐
length set at 243 nm with a flow rate of 1.3 mL/min and a column temperature of 30 °C.
Test solution, calibrators, and controls containing a known concentration of Vitamin C
were used for system check and quantification with internal standard and one‐point cali‐
bration. The prepared Vitamin C samples were measured in duplicates.
2.6.4. Regulatory T Cells (Treg)
Tregs were quantified by multi‐parameter flow cytometry in whole blood. Tregs
were identified as CD4+CD25+FoxP3+ cells. Monoclonal antibodies specific for surface
markers (CD4, CD25; BD Biosciences, Franklin Lakes, NJ, USA) were added to 100 μL of
whole blood and incubated for 20 min at room temperature (RT). Following incubation,
red blood cells were lysed by adding 2 mL of 1× RBC lysis buffer (ThermoFisher, Waltham,
MA, USA) and incubated for 10 min at RT. Intracellular FoxP3 expression was detected
by using the FoxP3 staining buffer set (ThermoFisher) according to the manufacturer’s
instructions. Flow cytometry data were collected by using the LSR Fortessa (BD Biosci‐
ences) and data were analyzed by using FlowJo v10 software (Tree Star, Ashland, OR,
USA). The blood samples of each participant were measured once. Treg frequencies are
presented as percentages of CD4+ T cells.
2.7. Cell Culture Experiments
Human naïve CD4+CD45RA+ T cells were isolated from buffy coats purchased from
the Transfusion Medicine Department of the Medical University of Graz, Austria. First,
peripheral blood mononuclear cells were isolated by density gradient centrifugation, and
subsequently, CD45+CD45RA+ T cells were isolated by negative selection by using the
MagniSort human CD4 naïve T cell enrichment kit (ThermoFisher).
Human CD4+CD25+FoxP3+ Treg cells were differentiated as previously described
[39]. In brief, human naïve CD4+CD45RA+ T cells (1.5 × 10⁶ cells/mL) were cultured in se‐
rum‐free X‐vivo media (Lonza, Basel, Switzerland) supplemented with penicillin/strepto‐
mycin, Glutamax, 50 ng/mL IL‐2 (Peprotech, London, UK) and 3 ng/mL TGF‐β1 (R&D
Systems, Minneapolis, Minn, USA) in the presence of immobilized anti‐CD3 monoclonal
antibodies (Biolegend). Where indicated polyphenols or the appropriate vehicle control
were added. The polyphenols were used at previously tested non‐toxic concentrations
(Table S2). The polyphenols were elected as prominent ingredients of aronia juice [22] and
obtained from Sigma Aldrich (ferulic acid Y0001013; rutin PHL89270; chlorogenic acid
Y0000569; catechin PHL80992; vanillic acid 94770; syringic acid S6881, genitisic acid 85707;
protocatechuic acid 03930590; salicylic acid S5922; 4‐hydroxybenzoic acid 1609013) and
were stored in powder form in the fridge at 4 °C. Working concentrations of the polyphe‐
nols were prepared by diluting in DMSO. Aliquots were treated with argon gas and stored
at −20 °C in the dark.
Following 4 days of incubation, Treg percentages were measured by flow cytometry
[40,41]. The experiments have been repeated three times in cells of different donors each
and were measured once. The data is presented as mean ± standard deviation of the values
of the three experiments.
2.8. Statistical Analysis
Statistical analysis was performed by applying the software SPSS Statistics version
27.0 (IBM, Armonk, NY, USA). According to the Shapiro–Wilk test, not all of the data was
Antioxidants 2022, 11, 1283 7 of 18
normally distributed. Thus, the data are presented as median (Md) and interquartile
ranges (IQR). The Mann–Whitney U test was applied for group comparisons at the three
time points of the investigation and the group comparison of delta that express the relative
change between the investigations. The Kruskal–Wallis test was applied for the compari‐
son of more than 2 groups and was followed by pairwise comparison in case the Kruskal–
Wallis test was significant. For non‐metric data, the chi‐square and the Fisher’s exact tests
were applied, respectively. For the assessment of the value progression over the course of
the study the Wilcoxon rank‐sum test and the Freidman’s test were applied, respectively.
Any p‐values below 0.05 were considered as significant and Bonferroni correction was
applied for multiple testing.
To the best of our knowledge, no previous randomized controlled trial (RCT) aiming
to find effects of nutritional interventions on the primary outcome Tregs was published
at the conceptual phase of this study. Therefore, we could not estimate effect size. As a
minimum number of 16 persons per group is needed to enable an effect of 1 standard
deviation to be detected at 2p = 0.05 and 80% power, we chose n = 40 as with 20 partici‐
pants per group sample size for this study. Other studies with similar interventions but
other primary outcomes had sample sizes between 20 and 66 persons [28,42,43].
Statistical analysis of cell culture results was performed by using a two‐tailed, un‐
paired t‐test with Welch’s correction. The confidence level was 95% and results were con‐
sidered significant with p‐values lower than 0.05. The analysis of cell culture results was
performed and the figures were created in GraphPad Prism version 9.0.0. (GraphPad Soft‐
ware, LLC. San Diego, CA, USA).
3. Results
3.1. Study Population
In total, 40 females were enrolled in the study of which 37 completed the intervention
(first follow‐up, V: 19; P: 18). A total of 35 participants (V:17, P:18) remained for the final
investigation after the washout period. The participants of V and P were comparable in
their main characteristics which are summarized in Table 1.
Anthropometric measures of the cohort were monitored throughout the study. The
median (Md) of weight change from baseline (I) to the final investigation (III) within the
whole cohort was 0.5 kg (Interquartile range (IQR): 1.6 kg) and the Md of the waist cir‐
cumference change was 0.5 cm (IQR: 2.9 cm) from I to III. The weight and waist circum‐
ference changes between V and P did not differ significantly at all three measurement
points.
Four participants of V and three participants of P reported smoking occasionally. The
Fagerström test for assessing smoking behavior revealed an Md score of 0 (max. 4) in V
and 0 (max. 2) in P, indicating no to low nicotine dependency.
Table 1. Study population characteristics. Data are presented as median (IQR). p‐values were de‐
rived from Mann–Whitney U test if not marked, from Fisher’s exact test if marked with Ɨ, and from
chi‐square test if marked with Ɨ Ɨ.
Study Population Characteristics Verum Placebo p‐Value
Number of participants (n) 20 20
Age (years) 25 (7) 24 (5) 0.142
Smokers 4 3 1.000 Ɨ
BMI (kg/m2) 21.2 (2.9) 21.6 (3.2) 0.841
Waist circumference (cm) 68.3 (9.3) 68.5 (4.8) 0.758
Drop out before first follow up 1 2 0.307 Ɨ Ɨ
Drop out before second follow up 2 0
Study drink tolerability
Tolerated (n) 9 17 0.003 Ɨ
Antioxidants 2022, 11, 1283 8 of 18
Complaints (n) 10 1
Dietary intake at baseline
Energy (kcal/day) 1974 (674) 1895 (643) 0.547
Fruits (g/day) 133 (214) 128 (178) 0.277
Vegetables (g/day) 202 (170) 114 (111) 0.072
Polyphenols (mg/day) 626 (506) 522 (600) 0.779
Vitamin C (mg/day) 96 (86) 85 (35) 0.398
Laboratory parameters at baseline
PPm (mmol/L) 11.0 (2.4) 11.4 (1.6) 0.495
OSI (AU) 0.051 (0.13) 0.048 (0.07) 0.925
Vitamin C (mg/L) 16.6 (4.7) 16.7 (3.9) 0.529
Vitamin C (μmol/L) 94.2 (26.4) 94.7 (22.3) 0.529
Treg (%) 4.8 (3.1) 5.3 (2.6) 0.738
3.2. Tolerability of the Study Drinks
A total of 94% of P and 47% of V tolerated the drinks well; however, 53% suffered
from gastrointestinal complaints such as nausea and vomiting, diarrhea, stomach ache,
cramps, and loss of appetite after aronia juice consumption. Thus, we additionally ana‐
lyzed the data according to tolerability and separated the V into the verum group that
tolerated the juice (Vt) and the verum group that reported on complaints after the juice
consumption (Vc).
3.3. Nutritional Intake Data
The Md of the average total energy intake at baseline of V was 1974 kcal (IQR: 674
kcal) per day and 1895 kcal (IQR: 643 kcal) in P. The diet’s macronutrients contribution of
total energy intake was similarly composed in both groups: 43% carbohydrates (IQR: 9%),
15% protein (IQR: 3%), 39% fat (IQR: 12%), and 1% alcohol (IQR: 3%) in V and 41% carbo‐
hydrates (IQR: 11%), 14% protein (IQR: 4%), 37% fat (IQR: 9%), and 2% alcohol (IQR: 5%).
V consumed an Md of 23 g fiber (IQR: 17 g) and P an Md of 19 g fiber (IQR: 8 g).
Regarding the consumption of important polyphenol sources also the fruits and veg‐
etable intake has been evaluated. The Md of fruits consumption was 133 g (IQR: 214 g) a
day in V and 128 g (IQR: 178 g) in P, and the Md of the vegetable consumption was 202 g
(IQR: 170 g) in V and 144 g (IQR: 111 g) in P. Dietary intakes did not change significantly
over the study period. Important key nutrients at the baseline of the study are summa‐
rized in Table 1 and further nutritional information is provided in Supplemental Table S1.
3.4. Plasma Polyphenol Levels
Plasma PPm did not differ significantly between V and P at baseline (p= 0.495); how‐
ever, when analyzed for tolerability groups plasma PPm was significantly lower in Vt
compared to Vc (p = 0.010) and remained significant after Bonferroni correction (p = 0.031)
and P (p = 0.019) which remained at least a trend after Bonferroni correction (p = 0.056).
Plasma PPm increased significantly in Vt after the intervention with aronia juice from 9.47
(4.8) mmol/L to 11.8 (0.9) mmol/L (p = 0.024) but did neither change significantly in Vc (p
= 0.480) nor in P (p = 0.230) from I to II. Plasma PPm decreased in the washout in all groups.
The progression of plasma PPm concentrations of the groups and the differences in
changes in PPm are depicted in Figure 2.
Antioxidants 2022, 11, 1283 9 of 18
(a) (b) (c)
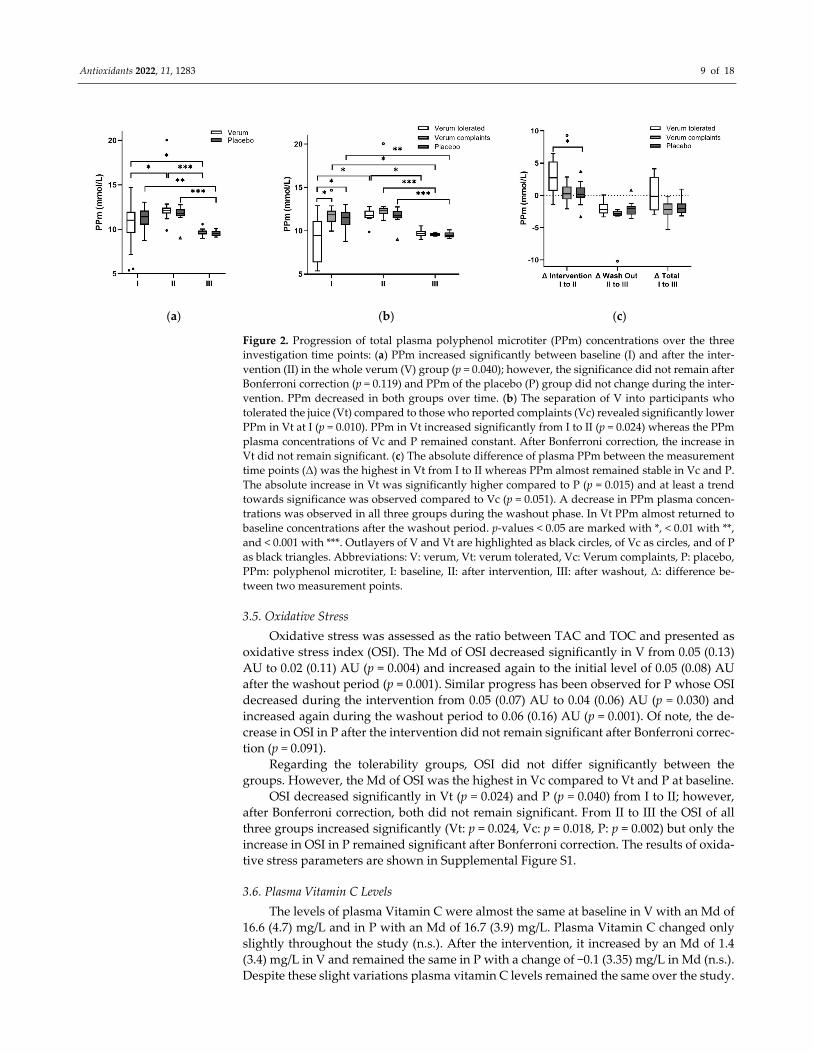
Figure 2. Progression of total plasma polyphenol microtiter (PPm) concentrations over the three
investigation time points: (a) PPm increased significantly between baseline (I) and after the inter‐
vention (II) in the whole verum (V) group (p = 0.040); however, the significance did not remain after
Bonferroni correction (p = 0.119) and PPm of the placebo (P) group did not change during the inter‐
vention. PPm decreased in both groups over time. (b) The separation of V into participants who
tolerated the juice (Vt) compared to those who reported complaints (Vc) revealed significantly lower
PPm in Vt at I (p = 0.010). PPm in Vt increased significantly from I to II (p = 0.024) whereas the PPm
plasma concentrations of Vc and P remained constant. After Bonferroni correction, the increase in
Vt did not remain significant. (c) The absolute difference of plasma PPm between the measurement
time points (Δ) was the highest in Vt from I to II whereas PPm almost remained stable in Vc and P.
The absolute increase in Vt was significantly higher compared to P (p = 0.015) and at least a trend
towards significance was observed compared to Vc (p = 0.051). A decrease in PPm plasma concen‐
trations was observed in all three groups during the washout phase. In Vt PPm almost returned to
baseline concentrations after the washout period. p‐values < 0.05 are marked with *, < 0.01 with **,
and < 0.001 with ***. Outlayers of V and Vt are highlighted as black circles, of Vc as circles, and of P
as black triangles. Abbreviations: V: verum, Vt: verum tolerated, Vc: Verum complaints, P: placebo,
PPm: polyphenol microtiter, I: baseline, II: after intervention, III: after washout, Δ: difference be‐
tween two measurement points.
3.5. Oxidative Stress
Oxidative stress was assessed as the ratio between TAC and TOC and presented as
oxidative stress index (OSI). The Md of OSI decreased significantly in V from 0.05 (0.13)
AU to 0.02 (0.11) AU (p = 0.004) and increased again to the initial level of 0.05 (0.08) AU
after the washout period (p = 0.001). Similar progress has been observed for P whose OSI
decreased during the intervention from 0.05 (0.07) AU to 0.04 (0.06) AU (p = 0.030) and
increased again during the washout period to 0.06 (0.16) AU (p = 0.001). Of note, the de‐
crease in OSI in P after the intervention did not remain significant after Bonferroni correc‐
tion (p = 0.091).
Regarding the tolerability groups, OSI did not differ significantly between the
groups. However, the Md of OSI was the highest in Vc compared to Vt and P at baseline.
OSI decreased significantly in Vt (p = 0.024) and P (p = 0.040) from I to II; however,
after Bonferroni correction, both did not remain significant. From II to III the OSI of all
three groups increased significantly (Vt: p = 0.024, Vc: p = 0.018, P: p = 0.002) but only the
increase in OSI in P remained significant after Bonferroni correction. The results of oxida‐
tive stress parameters are shown in Supplemental Figure S1.
3.6. Plasma Vitamin C Levels
The levels of plasma Vitamin C were almost the same at baseline in V with an Md of
16.6 (4.7) mg/L and in P with an Md of 16.7 (3.9) mg/L. Plasma Vitamin C changed only
slightly throughout the study (n.s.). After the intervention, it increased by an Md of 1.4
(3.4) mg/L in V and remained the same in P with a change of −0.1 (3.35) mg/L in Md (n.s.).
Despite these slight variations plasma vitamin C levels remained the same over the study.
Antioxidants 2022, 11, 1283 10 of 18
Additionally, within the tolerability groups, neither significant differences between the
groups nor changes over the course of the study have been observed. The results of
plasma vitamin C are shown in Supplemental Figure S2.
3.7. Regulatory T Cell (Treg) Frequencies
Treg frequencies did not differ significantly between V with an initial Md of 4.8
(3.1%) and P with an Md of 5.3 (2.6%). Tregs decreased in both groups over the course of
the study. During the intervention, Tregs decreased continuously in V to 4.5 (3.7%) (p =
0.016) and during the washout period to 4.3 (1.7%) (p = 0.006) and both changes remained
significant after Bonferroni correction. Despite a higher relative change of Tregs in P of
−1.1 (2.1%) from I to II, the Friedman test was not significant (p = 0.070). The Wilcoxon
rank‐sum test would have revealed a significant decrease in P (p = 0.022) from I to II but
no change from II to III or I to III was detected.
Strikingly, when analyzed separately for tolerability groups, Vc had significantly
higher Tregs initially compared to Vt (p = 0.005) and P (p = 0.017), whereas the significance
of P turned to a trend (p = 0.051) after Bonferroni correction. After the intervention Tregs
% decreased in Vc (p = 0.018) from I to III (p = 0.01), whereas the significance from I to II
turned to a trend after Bonferroni correction (p = 0.055). In Vt and P, Tregs remained al‐
most constant during the study (Figure 3). The Tregs frequencies of all three groups were
within reported reference ranges [44].
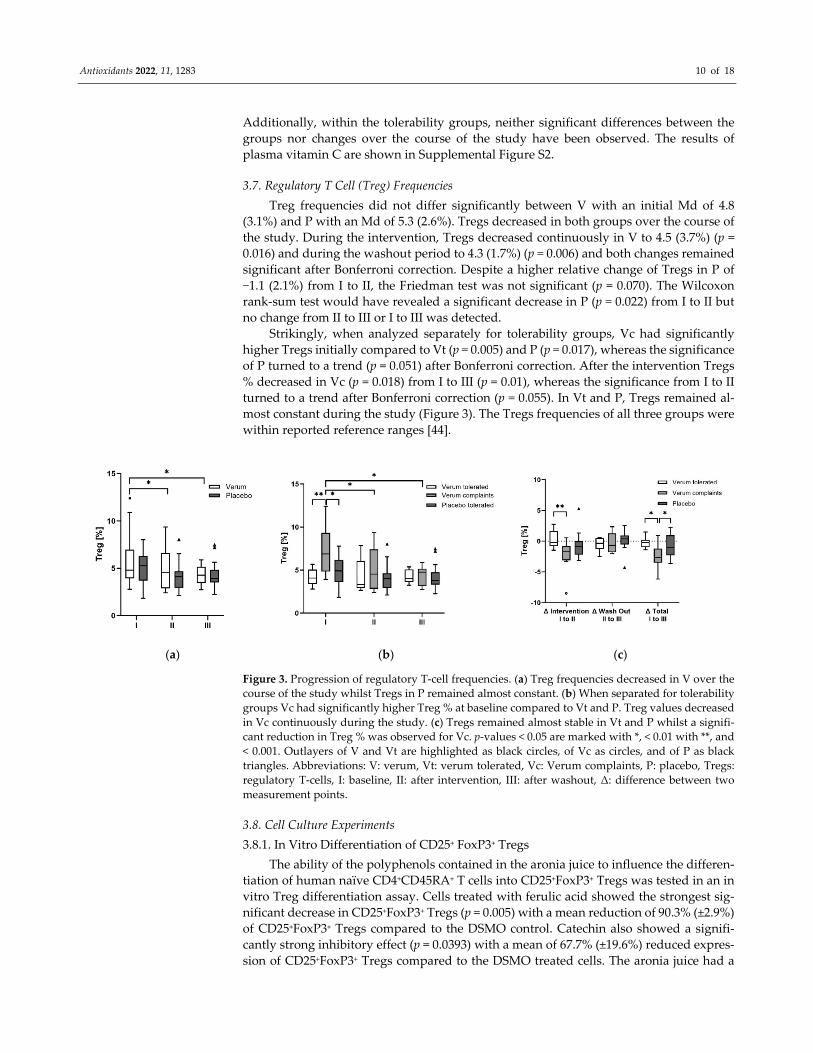
(a) (b) (c)
Figure 3. Progression of regulatory T‐cell frequencies. (a) Treg frequencies decreased in V over the
course of the study whilst Tregs in P remained almost constant. (b) When separated for tolerability
groups Vc had significantly higher Treg % at baseline compared to Vt and P. Treg values decreased
in Vc continuously during the study. (c) Tregs remained almost stable in Vt and P whilst a signifi‐
cant reduction in Treg % was observed for Vc. p‐values < 0.05 are marked with *, < 0.01 with **, and
< 0.001. Outlayers of V and Vt are highlighted as black circles, of Vc as circles, and of P as black
triangles. Abbreviations: V: verum, Vt: verum tolerated, Vc: Verum complaints, P: placebo, Tregs:
regulatory T‐cells, I: baseline, II: after intervention, III: after washout, Δ: difference between two
measurement points.
3.8. Cell Culture Experiments
3.8.1. In Vitro Differentiation of CD25+ FoxP3+ Tregs
The ability of the polyphenols contained in the aronia juice to influence the differen‐
tiation of human naïve CD4+CD45RA+ T cells into CD25+FoxP3+ Tregs was tested in an in
vitro Treg differentiation assay. Cells treated with ferulic acid showed the strongest sig‐
nificant decrease in CD25+FoxP3+ Tregs (p = 0.005) with a mean reduction of 90.3% (±2.9%)
of CD25+FoxP3+ Tregs compared to the DSMO control. Catechin also showed a signifi‐
cantly strong inhibitory effect (p = 0.0393) with a mean of 67.7% (±19.6%) reduced expres‐
sion of CD25+FoxP3+ Tregs compared to the DSMO treated cells. The aronia juice had a
Antioxidants 2022, 11, 1283 11 of 18
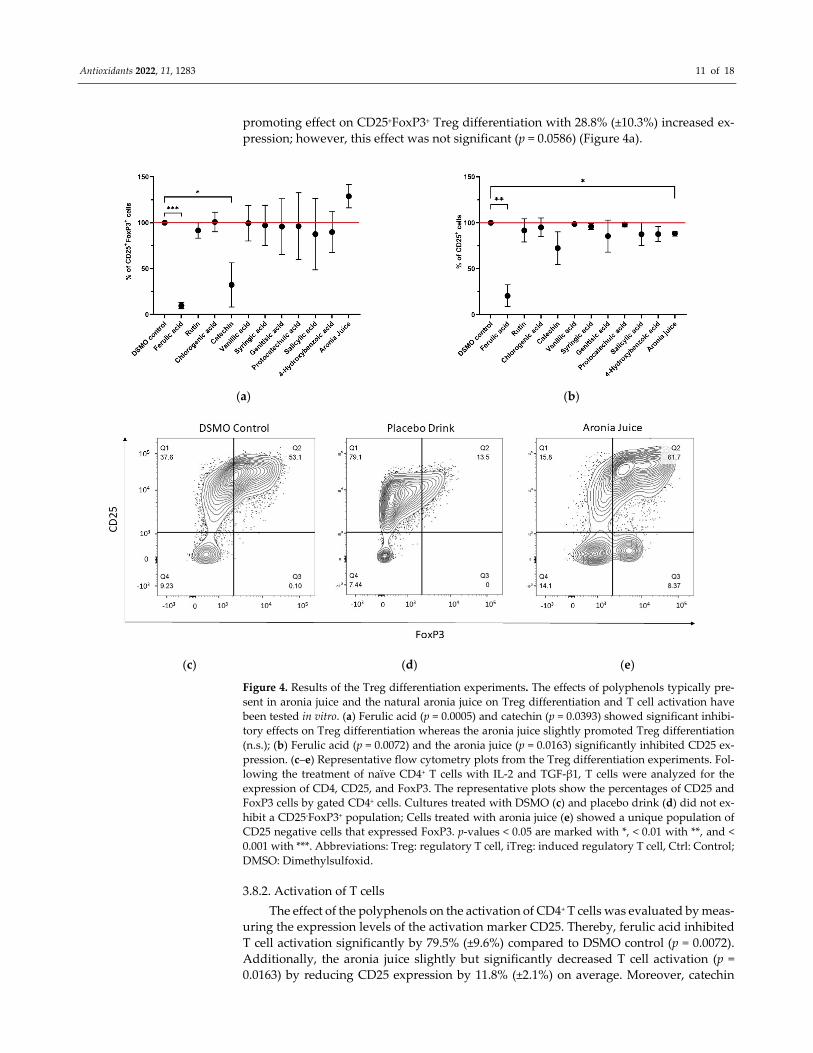
promoting effect on CD25+FoxP3+ Treg differentiation with 28.8% (±10.3%) increased ex‐
pression; however, this effect was not significant (p = 0.0586) (Figure 4a).
(a) (b)
(c) (d) (e)
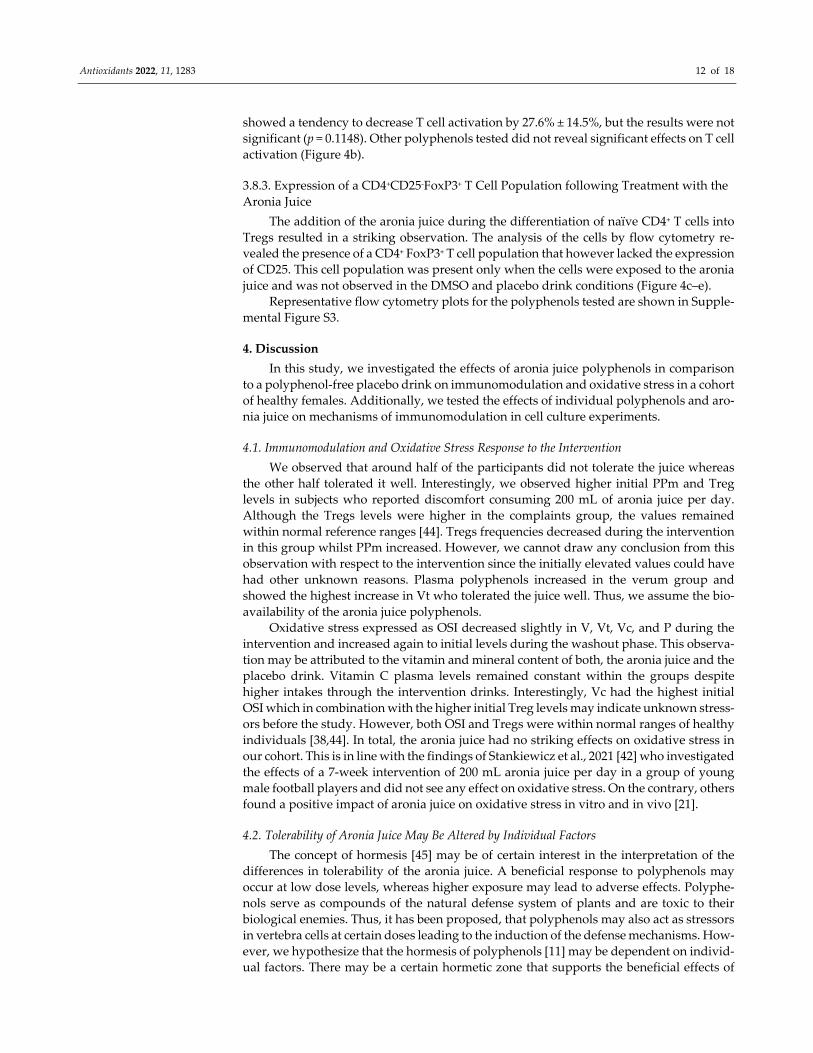
Figure 4. Results of the Treg differentiation experiments. The effects of polyphenols typically pre‐
sent in aronia juice and the natural aronia juice on Treg differentiation and T cell activation have
been tested in vitro. (a) Ferulic acid (p = 0.0005) and catechin (p = 0.0393) showed significant inhibi‐
tory effects on Treg differentiation whereas the aronia juice slightly promoted Treg differentiation
(n.s.); (b) Ferulic acid (p = 0.0072) and the aronia juice (p = 0.0163) significantly inhibited CD25 ex‐
pression. (c–e) Representative flow cytometry plots from the Treg differentiation experiments. Fol‐
lowing the treatment of naïve CD4+ T cells with IL‐2 and TGF‐β1, T cells were analyzed for the
expression of CD4, CD25, and FoxP3. The representative plots show the percentages of CD25 and
FoxP3 cells by gated CD4+ cells. Cultures treated with DSMO (c) and placebo drink (d) did not ex‐
hibit a CD25‐FoxP3+ population; Cells treated with aronia juice (e) showed a unique population of
CD25 negative cells that expressed FoxP3. p‐values < 0.05 are marked with *, < 0.01 with **, and <
0.001 with ***. Abbreviations: Treg: regulatory T cell, iTreg: induced regulatory T cell, Ctrl: Control;
DMSO: Dimethylsulfoxid.
3.8.2. Activation of T cells
The effect of the polyphenols on the activation of CD4+ T cells was evaluated by meas‐
uring the expression levels of the activation marker CD25. Thereby, ferulic acid inhibited
T cell activation significantly by 79.5% (±9.6%) compared to DSMO control (p = 0.0072).
Additionally, the aronia juice slightly but significantly decreased T cell activation (p =
0.0163) by reducing CD25 expression by 11.8% (±2.1%) on average. Moreover, catechin
Antioxidants 2022, 11, 1283 12 of 18
showed a tendency to decrease T cell activation by 27.6% ± 14.5%, but the results were not
significant (p = 0.1148). Other polyphenols tested did not reveal significant effects on T cell
activation (Figure 4b).
3.8.3. Expression of a CD4+CD25‐FoxP3+ T Cell Population following Treatment with the
Aronia Juice
The addition of the aronia juice during the differentiation of naïve CD4+ T cells into
Tregs resulted in a striking observation. The analysis of the cells by flow cytometry re‐
vealed the presence of a CD4+ FoxP3+ T cell population that however lacked the expression
of CD25. This cell population was present only when the cells were exposed to the aronia
juice and was not observed in the DMSO and placebo drink conditions (Figure 4c–e).
Representative flow cytometry plots for the polyphenols tested are shown in Supple‐
mental Figure S3.
4. Discussion
In this study, we investigated the effects of aronia juice polyphenols in comparison
to a polyphenol‐free placebo drink on immunomodulation and oxidative stress in a cohort
of healthy females. Additionally, we tested the effects of individual polyphenols and aro‐
nia juice on mechanisms of immunomodulation in cell culture experiments.
4.1. Immunomodulation and Oxidative Stress Response to the Intervention
We observed that around half of the participants did not tolerate the juice whereas
the other half tolerated it well. Interestingly, we observed higher initial PPm and Treg
levels in subjects who reported discomfort consuming 200 mL of aronia juice per day.
Although the Tregs levels were higher in the complaints group, the values remained
within normal reference ranges [44]. Tregs frequencies decreased during the intervention
in this group whilst PPm increased. However, we cannot draw any conclusion from this
observation with respect to the intervention since the initially elevated values could have
had other unknown reasons. Plasma polyphenols increased in the verum group and
showed the highest increase in Vt who tolerated the juice well. Thus, we assume the bio‐
availability of the aronia juice polyphenols.
Oxidative stress expressed as OSI decreased slightly in V, Vt, Vc, and P during the
intervention and increased again to initial levels during the washout phase. This observa‐
tion may be attributed to the vitamin and mineral content of both, the aronia juice and the
placebo drink. Vitamin C plasma levels remained constant within the groups despite
higher intakes through the intervention drinks. Interestingly, Vc had the highest initial
OSI which in combination with the higher initial Treg levels may indicate unknown stress‐
ors before the study. However, both OSI and Tregs were within normal ranges of healthy
individuals [38,44]. In total, the aronia juice had no striking effects on oxidative stress in
our cohort. This is in line with the findings of Stankiewicz et al., 2021 [42] who investigated
the effects of a 7‐week intervention of 200 mL aronia juice per day in a group of young
male football players and did not see any effect on oxidative stress. On the contrary, others
found a positive impact of aronia juice on oxidative stress in vitro and in vivo [21].
4.2. Tolerability of Aronia Juice May Be Altered by Individual Factors
The concept of hormesis [45] may be of certain interest in the interpretation of the
differences in tolerability of the aronia juice. A beneficial response to polyphenols may
occur at low dose levels, whereas higher exposure may lead to adverse effects. Polyphe‐
nols serve as compounds of the natural defense system of plants and are toxic to their
biological enemies. Thus, it has been proposed, that polyphenols may also act as stressors
in vertebra cells at certain doses leading to the induction of the defense mechanisms. How‐
ever, we hypothesize that the hormesis of polyphenols [11] may be dependent on individ‐
ual factors. There may be a certain hormetic zone that supports the beneficial effects of

Antioxidants 2022, 11, 1283 13 of 18
polyphenols on the immune system. Since we observed divergent effects in half of our
participants, this hormetic zone of aronia polyphenols is likely to be influenced by factors
such as the gut microbiome composition [1] or genetic variations of bitter receptors that
have been found along the whole gastrointestinal tract [46]. It has been proposed previ‐
ously that the physiological benefit of polyphenols may differ according to the individu‐
als` microbiome composition which may impact the bioavailability and functionality of
polyphenols in the human organism on the one hand [1,19] and may be influenced by the
individual dietary composition on the other hand [18,47].
4.3. Cell Culture Observation
4.3.1. Immunomodulatory Effects of Individual Aronia Juice Polyphenols
To assess the effects of aronia juice polyphenols on immunomodulation mechanisti‐
cally, in the first step individual polyphenolic compounds of the juice were investigated
in cell culture experiments, using an induced regulatory T cell model (iTreg). Thereby,
ferulic acid and catechin showed pronounced inhibitory effects on T cell activation and
Treg differentiation.
In the case of ferulic acid, this may be attributed to the suppression of NF‐κB signal‐
ing, being essential for Treg development, maintenance, and function [48]. A downregu‐
lation of NF‐κB expression and lowering of the intensity of prostaglandin E2 as well as
TNF‐α by ferulic acid has been reported [49]. Additionally, it was previously shown that
the treatment with ferulic acid ameliorated the inflammatory response induced by lipo‐
polysaccharide (LPS) in bovine endometrial epithelial cells, shown by a decrease in pro‐
inflammatory cytokines such as IL‐1β, IL‐6, IL‐8 and TNF‐α after pretreatment with feru‐
lic acid. Another anti‐inflammatory aspect of ferulic acid is its ability to inhibit the degra‐
dation of IκB, the inhibitor of NF‐κB, and to suppress the activation of MAPKs, which are
signal transducers in inflammation response [50]. Ferulic acid and downregulation of NF‐
κB signaling were also seen in the decrease in the receptor activator of nuclear factor κB
ligand (RANKL) mediated NF‐κB activation, as shown in a study investigating the effects
of ferulic acid in the context of bone erosion in rheumatoid arthritis [51]. In addition, its
inhibitory effects on the expression of IL‐1β, IL‐6, and TNF‐α via the modulation of NF‐
κB signaling, and ferulic acid have also been proven to attenuate the activation of the
NLRP3 inflammasome (nucleotide‐binding domain leucine‐rich repeat and pyrin do‐
main‐containing receptor 3). The NLRP3 inflammasome is a protein complex, expressed
in many cell types of the immune system such as monocytes, neutrophils, dendritic cells,
and lymphocytes in the cytoplasm of the cells, acting as a pattern recognition receptor for
inducing inflammatory response [52,53]. Ferulic acid was also reported to attenuate not
only the expression of proinflammatory cytokines but also lipid peroxidation and lysoso‐
mal enzymes, with possible additional anti‐oxidative properties. The same authors
pointed out the binding of ferulic acid of NF‐κB and NLRP3 proteins directly, which im‐
plies another potential mechanism of interaction [54]. Concerning the important modula‐
tion of TGF‐β signaling by ferulic acid, Smad 4 as an important key player, is prevented
from its nuclear translocation by ferulic acid and a decrease in phosphorylation of Smad
2/3 was observed [55]. TGF‐β signaling is very important in the development of iTregs, as
another possible mechanism of the inhibitory effect of ferulic acid [56].
Catechin and some of its derivatives have been postulated to interact with the DNA‐
binding site of NF‐κB, which suggests inhibitory effects on NF‐κB signaling as well [57].
Green tea catechins are also associated with an inhibition of NF‐κB signaling [58] and
suppression of proinflammatory cytokine expression and enzymes such as COX‐2 or the
inducible nitric oxide synthase (iNOS). Previously, not only the suppression of inflamma‐
tory mediators but also the enhancement of anti‐inflammatory cytokine production in‐
cluding IL‐4 and IL‐10 were found [59].
Most dietary polyphenols are processed by the colon microflora. The main products
reported in the literature are hydroxybenzoic acids and protocatechuic acid, which can
Antioxidants 2022, 11, 1283 14 of 18
originate from catechins, cinnamic acids such as ferulic acid, and many more [60]. Another
study reported the detection of protocatechuic acid and other metabolites in plasma after
consumption of aronia juice without any polyphenols that were initially present in the
juice [61]. Therefore, it is important to investigate polyphenol in vivo effects more closely
as non‐fiber prebiotics and their possible immune reactions in the context of microbiota.
In conclusion, many polyphenols, but most significantly ferulic acid and catechin ex‐
erted inhibitory effects on both T cell activation and Treg development. The results we
obtained indicated some anti‐inflammatory properties of certain polyphenols that should
be further investigated in the context of microbiota.
4.3.2. Immunomodulatory Effects of Aronia Juice
The second step in assessing the immunomodulatory mechanisms of aronia juice pol‐
yphenols was to test the whole juice in comparison to DSMO control and the placebo drink
to evaluate the impact of the food matrix and potential interaction of its nutritive compo‐
nents in the iTreg model. Thereby, the aronia juice revealed striking results in the iTreg
assay. Interestingly, CD4+CD25‐FoxP3+ cells emerged in response to aronia juice but not in
any of the other conditions tested. Since the placebo drink had a comparable nutrient pro‐
file including macro‐ and micronutrients such as sugars, vitamins, and minerals, this ob‐
servation may indicate the effects of the aronia polyphenols within the juice matrix. Note‐
worthy, in vivo the ingested juice is metabolized throughout various digestive processes
which changes the bioaccessibility of polyphenols and extracts them from the original
food matrix [62]. There are some approaches to predigest food for in vitro studies to mimic
the digestive steps through the mouth, stomach, and the small and large intestine. How‐
ever, it is known that the activity of bioactive compounds is different in in vitro and in
vivo conditions and the predigestion models face certain limitations themselves [63].
Thus, we tested undigested juice in comparison to single polyphenols and the placebo
drink as a model for the interactive effects of the food matrix and a polyphenol blend
(Figure S3).
The CD4+CD25‐FoxP3+ T‐cell population has been observed in inflammatory diseases
such as systemic lupus erythematosus [64,65] previously and was associated with rather
adverse immune outcomes. However, for this CD4 subset, no consensus has been reached
yet regarding its immunological functions [66].
Notably, we applied the juice at the maximum non‐toxic concentration for the cells.
This observation may support the hormesis hypothesis of polyphenols which suggests
detrimental effects of too high doses of polyphenols [11,45]. Since aronia juice comprises
multiple polyphenol classes, additive effects may contribute to pro‐inflammatory effects
at a certain level. However, this may be dependent on individual factors such as the mi‐
crobial ability to process polyphenols and thus influences the bioaccessibility of polyphe‐
nols, and the individual tolerability response to the juice that may be associated with ge‐
netic variations for bitter receptor expression along the gastrointestinal tract [67–69].
We acknowledge limitations to this study. We included females only. Female cohorts
have known variations in hormonal status over the course of the menstrual circle. Despite
collecting information on the menstrual status of the participants, statistical analysis could
not be adjusted for detailed menstrual circle information or hormonal variations. Since we
investigated the participants within their usual lifestyle, habits such as smoking or alcohol
consumption, stress, and other external factors may have influenced the outcome. Since
the study groups were further divided into tolerability groups, the number of participants
was small. The initially observed differences in the tolerability groups may have been at‐
tributed to other unknown factors. Thus, further studies need to investigate larger human
cohorts to confirm our observations and to test the hypothesis drawn here. Regarding the
methods applied, the analysis of total plasma polyphenols by a Folin–Ciocalteu approach
may have interfered with other bioactives. The analysis of polyphenols by mass spectros‐
copy should be applied preferentially in further studies and despite TAC, the investiga‐
tion of further antioxidant biomarkers (such as enzymes and endogenous compounds
Antioxidants 2022, 11, 1283 15 of 18
contributing to the redox system) may reveal a more detailed view of the individuals’
oxidant status. However, the strength of this study is the additional data from cell culture
experiments, which revealed striking effects of the aronia juice and its polyphenols on
immunomodulation.
5. Conclusions
Interestingly, we observed, that only half of the participants tolerated the adminis‐
tered aronia juice well. The tolerability was associated with lower initial plasma polyphe‐
nol and Treg frequencies, and the highest increase in plasma polyphenol concentrations.
Oxidative stress did not change notably over the study. In cell culture, the polyphenols
ferulic acid–a primary component of aronia juice and a degradation product of chloro‐
genic acid‐and catechin had inhibiting effects on T cell activation and Treg differentiation
and the aronia juice promoted the generation of a FoxP3+ cell population that lacked CD25.
The effects of aronia juice polyphenols on immunomodulation may be dependent on in‐
dividual factors. We propose that hormetic effects of polyphenols may be of certain inter‐
est in immunomodulation and hormesis may be influenced by individual factors such as
gut microbiome composition and extraoral bitter receptors which may alter the tolerabil‐
ity of high polyphenols intake.
To conclude, we hypothesize that the differences in tolerability of the aronia juice
may be attributed to hormesis effects. Thereby, the dose of aronia juice for optimized ben‐
efits may be dependent on intra‐individual factors such as the microbial composition of
the gut microbiome or the expression of bitter receptors along the gastrointestinal tract.
Further analysis of the data derived from this study will include the gut microbiome com‐
position, and metabolomics analysis to evaluate the metabolic turnover and outcome of
the polyphenols.
Supplementary Materials: The following supporting information can be downloaded at:
www.mdpi.com/article/10.3390/antiox11071283/s1, Figure S1: Progression of oxidative stress; Fig‐
ure S2: Progression of Vitamin C plasma levels; Figure S3: Representative flow cytometry plots from
the Treg differentiation experiments; Table S1: Nutrient profile of the study cohort at baseline; Table
S2: Concentrations of polyphenols.
Author Contributions: Conceptualization, S.J.H., H.S. and T.S.; methodology, M.D., W.W., N.M.‐
A., C.P. and E.S.; software, T.S., C.P., T.Z. and S.L.; validation, T.Z., T.S. and S.L.; formal analysis,
S.L., S.J.H. and T.S.; investigation, S.M., T.L. and A.K.‐D.; resources, S.J.H. and H.S.; data curation,
S.L. and T.Z.; writing—original draft preparation, S.L. and S.J.H.; writing—review and editing, T.S.
and S.M.; visualization, T.Z. and S.L.; supervision, S.J.H. and H.S.; project administration, S.J.H. and
S.L.; funding acquisition, S.J.H. and S.L. All authors have read and agreed to the published version
of the manuscript.
Funding: This research was supported by the Chamber of Agriculture of the State of Styria (IC 5512)
and the Medical Research in Graz Association (MEFO) (RF 6204).
Institutional Review Board Statement: The study was conducted in accordance with the Declara‐
tion of Helsinki, and approved by the Ethics Committee of the Medical University of Graz (EK: 30‐
009 ex 17/18).
Informed Consent Statement: Informed consent was obtained from all subjects involved in the
study.
Data Availability Statement: The raw data supporting the conclusions of this article will be made
available by the authors, without undue reservation.
Acknowledgments: We would like to thank all the participants who volunteered to drink the study
drinks for their participation and their compliance.
Conflicts of Interest: The authors declare no conflict of interest, except W.W. who is affiliated with
and employed at Omnignostica Ltd. where some of the kits were bought.
Antioxidants 2022, 11, 1283 16 of 18
References
1. Makarewicz, M.; Drożdż, I.; Tarko, T.; Duda‐Chodak, A. The Interactions between Polyphenols and Microorganisms, Especially
Gut Microbiota. Antioxidants 2021, 10, 188. https://doi.org/10.3390/antiox10020188.
2. Catalkaya, G.; Venema, K.; Lucini, L.; Rocchetti, G.; Delmas, D.; Daglia, M.; De Filippis, A.; Xiao, H.; Quiles, J.L.; Xiao, J.;
Capanoglu, E. Interaction of dietary polyphenols and gut microbiota: Microbial metabolism of polyphenols, influence on the
gut microbiota, and implications on host health. Food Front. 2020, 1, 109–133.
3. Panche, A.N.; Diwan, A.D.; Chandra, S.R. Flavonoids: An overview. J. Nutr. Sci. 2016, 5, e47.
4. Stojković, L.; Zec, M.; Zivkovic, M.; Bundalo, M.; Bošković, M.; Glibetić, M.; Stankovic, A. Polyphenol‐Rich Aronia melanocarpa
Juice Consumption Affects LINE‐1 DNA Methylation in Peripheral Blood Leukocytes in Dyslipidemic Women. Front. Nutr.
2021, 8, 689055.
5. Hawkins, J.; Hires, C.; Baker, C.; Keenan, L.; Bush, M. Daily supplementation with Aronia melanocarpa (chokeberry) reduces
blood pressure and cholesterol: A meta analysis of controlled clinical trials. J. Diet. Suppl. 2021, 18, 517–530.
6. Shakoor, H.; Feehan, J.; Apostolopoulos, V.; Platat, C.; Al Dhaheri, A.S.; Ali, H.I.; Ismail, L.C.; Bosevski, M.; Stojanovska, L.
Immunomodulatory Effects of Dietary Polyphenols. Nutrients 2021, 13, 728. https://doi.org/10.3390/nu13030728.
7. Jurendić, T.; Ščetar, M. Aronia melanocarpa Products and By‐Products for Health and Nutrition: A Review. Antioxidants 2021, 10,
1052. https://doi.org/10.3390/antiox10071052.
8. Afshari, K.; Haddadi, N.; Haj‐Mirzaian, A.; Farzaei, M.H.; Rohani, M.M.; Akramian, F.; Naseri, R.; Sureda, A.; Ghanaatian, N.;
Abdolghaffari, A.H. Natural flavonoids for the prevention of colon cancer: A comprehensive review of preclinical and clinical
studies. J. Cell. Physiol. 2019, 234, 21519–21546.
9. Yahfoufi, N.; Alsadi, N.; Jambi, M.; Matar, C. The Immunomodulatory and Anti‐Inflammatory Role of Polyphenols. Nutrients
2018, 10, 1618. https://doi.org/10.3390/nu10111618.
10. Ding, S.; Jiang, H.; Fang, J. Regulation of Immune Function by Polyphenols. J. Immunol. Res. 2018, 2018, 1264074.
11. Leri, M.; Scuto, M.; Ontario, M.L.; Calabrese, V.; Calabrese, E.J.; Bucciantini, M.; Stefani, M. Healthy Effects of Plant Polyphenols:
Molecular Mechanisms. Int. J. Mol. Sci. 2020, 21, 1250. https://doi.org/10.3390/ijms21041250.
12. Calabrese, E.J.; Agathokleous, E.; Calabrese, V. Ferulic acid and hormesis: Biomedical and environmental implications. Mech.
Ageing Dev. 2021, 198, 111544.
13. Sakaguchi, S.; Sakaguchi, N.; Asano, M.; Itoh, M.; Toda, M. Immunologic self‐tolerance maintained by activated T cells
expressing IL‐2 receptor alpha‐chains (CD25). Breakdown of a single mechanism of self‐tolerance causes various autoimmune
diseases. J. Immunol. 1995, 155, 1151–1164.
14. Fontenot, J.D.; Gavin, M.A.; Rudensky, A.Y. Foxp3 programs the development and function of CD4+CD25+ regulatory T cells.
Nat. Immunol. 2003, 4, 330–336.
15. Chen, W.; Jin, W.; Hardegen, N.; Lei, K.J.; Li, L.; Marinos, N.; McGrady, G.; Wahl, S.M. Conversion of peripheral CD4+CD25‐
naive T cells to CD4+CD25+ regulatory T cells by TGF‐beta induction of transcription factor Foxp3. J. Exp. Med. 2003, 198, 1875–
1886.
16. Zheng, S.G.; Wang, J.; Wang, P.; Gray, J.D.; Horwitz, D.A. IL‐2 is essential for TGF‐beta to convert naive CD4+CD25‐ cells to
CD25+Foxp3+ regulatory T cells and for expansion of these cells. J. Immunol. 2007, 178, 2018–2027.
17. Schmidt, A.; Oberle, N.; Krammer, P.H. Molecular mechanisms of treg‐mediated T cell suppression. Front. Immunol. 2012, 3, 51.
18. Liu, X.; Martin, D.A.; Valdez, J.C.; Sudakaran, S.; Rey, F.; Bolling, B.W. Aronia berry polyphenols have matrix‐dependent effects
on the gut microbiota. Food Chem. 2021, 359, 129831.
19. Mosele, J.I.; Macià, A.; Motilva, M.J. Metabolic and Microbial Modulation of the Large Intestine Ecosystem by Non‐Absorbed
Diet Phenolic Compounds: A Review. Molecules 2015, 20, 17429–17468.
20. Wan, M.L.Y.; Co, V.A.; El‐Nezami, H. Dietary polyphenol impact on gut health and microbiota. Crit. Rev. Food Sci. Nutr. 2021,
61, 690–711.
21. Denev, P.N.; Kratchanov, C.G.; Ciz, M.; Lojek, A.; Kratchanova, M.G. Bioavailability and Antioxidant Activity of Black
Chokeberry (Aronia melanocarpa) Polyphenols: In vitro and in vivo Evidences and Possible Mechanisms of Action: A Review.
Compr. Rev. Food Sci. Food Saf. 2012, 11, 471–489.
22. Sidor, A.; Gramza‐Michalowska, A. Black Chokeberry Aronia melanocarpa L.‐A Qualitative Composition, Phenolic Profile and
Antioxidant Potential. Molecules 2019, 24, 3710. https://doi.org/10.3390/molecules24203710.
23. Rauf, A.; Imran, M.; Abu‐Izneid, T.; Iahtisham‐Ul‐Haq; Patel, S.; Pan, X.; Naz, S.; Sanches Silva, A.; Saeed, F.; Rasul Suleria, H.A.
Proanthocyanidins: A comprehensive review. Biomed. Pharmacother. 2019, 116, 108999.
24. Gajić, D.; Saksida, T.; Koprivica, I.; Šenerović, L.; Morić, I.; Šavikin, K.; Menković, N.; Pejnović, N.; Stojanović, I.
Immunomodulatory activity and protective effects of chokeberry fruit extract on Listeria monocytogenes infection in mice. Food
Funct. 2020, 11, 7793–7803.
25. Kasprzak‐Drozd, K.; Oniszczuk, T.; Soja, J.; Gancarz, M.; Wojtunik‐Kulesza, K.; Markut‐Miotła, E.; Oniszczuk, A. The Efficacy
of Black Chokeberry Fruits against Cardiovascular Diseases. Int. J. Mol. Sci. 2021, 22, 6541. https://doi.org/10.3390/ijms22126541.
26. Gajic, D.; Saksida, T.; Koprivica, I.; Vujicic, M.; Despotovic, S.; Savikin, K.; Jankovic, T.; Stojanovic, I. Chokeberry (Aronia
melanocarpa) fruit extract modulates immune response in vivo and in vitro. J. Funct. Foods 2020, 66, 103836.
27. Kardum, N.; Konic Ristic, A.; Zec, M.; Kojadinovic, M.; Petrovic‐Oggiano, G.; Zekovic, M.; Kroon, P.A.; Glibetić, M. Design,
formulation and sensory evaluation of a polyphenol‐rich food placebo: An example of aronia juice for food intervention studies.
Int. J. Food Sci. Nutr. 2017, 68, 742–749.
Antioxidants 2022, 11, 1283 17 of 18
28. Mullan, A.; Delles, C.; Ferrell, W.; Mullen, W.; Edwards, C.A.; McColl, J.H.; Roberts, S.A.; Lean, M.E.; Sattar, N. Effects of a
beverage rich in (poly)phenols on established and novel risk markers for vascular disease in medically uncomplicated
overweight or obese subjects: A four week randomized placebo‐controlled trial. Atherosclerosis 2016, 246, 169–176.
29. Guo, H.; Ling, W. The update of anthocyanins on obesity and type 2 diabetes: Experimental evidence and clinical perspectives.
Rev. Endocr Metab. Disord. 2015, 16, 1–13.
30. Henning, S.M.; Yang, J.; Shao, P.; Lee, R.P.; Huang, J.; Ly, A.; Hsu, M.; Lu, Q.Y.; Thames, G.; Heber, D.; Li, Z. Health benefit of
vegetable/fruit juice‐based diet: Role of microbiome. Sci. Rep. 2017, 7, 2167.
31. Fagerstrom, K.O. Measuring degree of physical dependence to tobacco smoking with reference to individualization of treatment.
Addict. Behav. 1978, 3, 235–241.
32. Koloski, N.A.; Jones, M.; Hammer, J.; von Wulffen, M.; Shah, A.; Hoelz, H.; Kutyla, M.; Burger, D.; Martin, N.; Gurusamy, S.R.;
Talley, N.J.; Holtmann, G. The Validity of a New Structured Assessment of Gastrointestinal Symptoms Scale (SAGIS) for
Evaluating Symptoms in the Clinical Setting. Dig. Dis. Sci. 2017, 62, 1913–1922.
33. Stewart, A.; Marfell‐Jones, M.; Olds, T.; Deridder, H. International Standards for Anthropometric Assessment; International Society
for the Advancement of Kinanthropometry: Lower Hutt, New Zealand, 2011.
34. World Health Organization Body Mass Index—BMI. Available online: http://www.euro.who.int/en/health‐topics/disease‐
prevention/nutrition/a‐healthy‐lifestyle/body‐mass‐index‐bmi (accessed 31 August 2018).
35. Putz, P.; Kogler, B.; Bersenkowitsch, I. Reliability and validity of assessing energy and nutrient intake with the Vienna food
record: A cross‐over randomised study. Nutr. J. 2019, 18, 7–9.
36. Tatzber, F.; Wonisch, W.; Lackner, S.; Lindschinger, M.; Pursch, W.; Resch, U.; Trummer, C.; Murkovic, M.; Zelzer, S.; Holasek,
S.; Cvirn, G. A Micromethod for Polyphenol High‐Throughput Screening Saves 90 Percent Reagents and Sample Volume.
Antioxidants 2019, 9, 11. https://doi.org/10.3390/antiox9010011.
37. Lindschinger, M.; Tatzber, F.; Schimetta, W.; Schmid, I.; Lindschinger, B.; Cvirn, G.; Stanger, O.; Lamont, E.; Wonisch, W. A
Randomized Pilot Trial to Evaluate the Bioavailability of Natural versus Synthetic Vitamin B Complexes in Healthy Humans
and Their Effects on Homocysteine, Oxidative Stress, and Antioxidant Levels. Oxidative Med. Cell. Longev. 2019, 2019, 6082613.
38. Sánchez‐Rodríguez, M.A.; Mendoza‐Núñez, V.M. Oxidative Stress Indexes for Diagnosis of Health or Disease in Humans.
Oxidative Med. Cell. Longev. 2019, 2019, 4128152.
39. Sconocchia, T.; Hochgerner, M.; Schwarzenberger, E.; Tam‐Amersdorfer, C.; Borek, I.; Benezeder, T.; Bauer, T.; Zyulina, V.;
Painsi, C.; Passegger, C.; Wolf, P.; Sibilia, M.; Strobl, H. Bone morphogenetic protein signaling regulates skin inflammation via
modulating dendritic cell function. J. Allergy Clin. Immunol. 2021, 147, 1810–1822.e9.
40. Chatterjee, P.; Chiasson, V.L.; Bounds, K.R.; Mitchell, B.M. Regulation of the Anti‐Inflammatory Cytokines Interleukin‐4 and
Interleukin‐10 during Pregnancy. Front. Immunol. 2014, 5, 253.
41. Chanput, W.; Peters, V.; Wichers, H. THP‐1 and U937 Cells. In: The Impact of Food Bioactives on Health: In vitro and ex vivo models
[Internet]; Verhoeckx, K., Cotter, P., López‐Expósito, I., Kleiveland, C., Lea, T., Mackie, A., Requena, T., Swiatecka, D., Wichers,
H., Eds.; Springer: Cham, Switzerland, 2015; pp. 147–159.
42. Stankiewicz, B.; Cieślicka, M.; Kujawski, S.; Piskorska, E.; Kowalik, T.; Korycka, J.; Skarpańska‐Stejnborn, A. Effects of
antioxidant supplementation on oxidative stress balance in young footballers—A randomized double‐blind trial. J. Int. Soc.
Sports Nutr. 2021, 18, 44.
43. Istas, G.; Wood, E.; Le Sayec, M.; Rawlings, C.; Yoon, J.; Dandavate, V.; Cera, D.; Rampelli, S.; Costabile, A.; Fromentin, E.;
Rodriguez‐Mateos, A. Effects of aronia berry (poly)phenols on vascular function and gut microbiota: A double‐blind
randomized controlled trial in adult men. Am. J. Clin. Nutr. 2019, 110, 316–329.
44. Niu, H.Q.; Zhao, X.C.; Li, W.; Xie, J.F.; Liu, X.Q.; Luo, J.; Zhao, W.P.; Li, X.F. Characteristics and reference ranges of CD4(+)T
cell subpopulations among healthy adult Han Chinese in Shanxi Province, North China. BMC Immunol. 2020, 21, 44–49.
45. Calabrese, E.J. Hormesis: Path and Progression to Significance. Int. J. Mol. Sci. 2018, 19, 2871.
https://doi.org/10.3390/ijms19102871.
46. Tarragon, E.; Moreno, J.J. Polyphenols and taste 2 receptors. Physiological, pathophysiological and pharmacological
implications. Biochem. Pharmacol. 2020, 178, 114086.
47. Bohn, T. Dietary factors affecting polyphenol bioavailability. Nutr. Rev. 2014, 72, 429–452.
48. Grinberg‐Bleyer, Y.; Caron, R.; Seeley, J.J.; De Silva, N.S.; Schindler, C.W.; Hayden, M.S.; Klein, U.; Ghosh, S. The Alternative
NF‐κB Pathway in Regulatory T Cell Homeostasis and Suppressive Function. J. Immunol. 2018, 200, 2362–2371.
49. Chaudhary, A.; Jaswal, V.S.; Choudhary, S.; Sonika; Sharma, A.; Beniwal, V.; Tuli, H.S.; Sharma, S. Ferulic Acid: A Promising
Therapeutic Phytochemical and Recent Patents Advances. Recent. Pat. Inflamm. Allergy Drug Discov. 2019, 13, 115–123.
50. Yin, P.; Zhang, Z.; Li, J.; Shi, Y.; Jin, N.; Zou, W.; Gao, Q.; Wang, W.; Liu, F. Ferulic acid inhibits bovine endometrial epithelial
cells against LPS‐induced inflammation via suppressing NK‐κB and MAPK pathway. Res. Vet. Sci. 2019, 126, 164–169.
51. Doss, H.M.; Samarpita, S.; Ganesan, R.; Rasool, M. Ferulic acid, a dietary polyphenol suppresses osteoclast differentiation and
bone erosion via the inhibition of RANKL dependent NF‐κB signalling pathway. Life Sci. 2018, 207, 284–295.
52. Zahid, A.; Li, B.; Kombe, A.J.K.; Jin, T.; Tao, J. Pharmacological Inhibitors of the NLRP3 Inflammasome. Front. Immunol. 2019,
10, 2538.
53. Liu, T.; Zhang, L.; Joo, D.; Sun, S.C. NF‐kappaB signaling in inflammation. Signal. Transduct Target Ther. 2017, 2,
10.1038/sigtrans.2017.23.
Antioxidants 2022, 11, 1283 18 of 18
54. Doss, H.M.; Dey, C.; Sudandiradoss, C.; Rasool, M.K. Targeting inflammatory mediators with ferulic acid, a dietary polyphenol,
for the suppression of monosodium urate crystal‐induced inflammation in rats. Life Sci. 2016, 148, 201–210.
55. Mu, M.; Zuo, S.; Wu, R.M.; Deng, K.S.; Lu, S.; Zhu, J.J.; Zou, G.L.; Yang, J.; Cheng, M.L.; Zhao, X.K. Ferulic acid attenuates liver
fibrosis and hepatic stellate cell activation via inhibition of TGF‐β/Smad signaling pathway. Drug Des. Devel. Ther. 2018, 12,
4107–4115.
56. Zhang, S.; Liu, X.; Mei, L.; Wang, H.; Fang, F. Epigallocatechin‐3‐gallate (EGCG) inhibits imiquimod‐induced psoriasis‐like
inflammation of BALB/c mice. BMC Complement. Altern. Med. 2016, 16, 334–4.
57. Suhail, M.; Perveen, A.; Husain, A.; Rehan, M. Exploring Inhibitory Mechanisms of Green Tea Catechins as Inhibitors of a
Cancer Therapeutic Target, Nuclear Factor‐κB (NF‐κB). Biosci Biotech Res Asia 2019, 16, 715–723.
58. Ravindranath, N.H.; Ravindranath, M.H. Green tea catechins suppress NF‐κB‐mediated inflammatory responses: Relevance to
nutritional management of inflammation. Br. J. Nutr. 2011, 105, 1715–1717.
59. Cheng, A.W.; Tan, X.; Sun, J.Y.; Gu, C.M.; Liu, C.; Guo, X. Catechin attenuates TNF‐α induced inflammatory response via
AMPK‐SIRT1 pathway in 3T3‐L1 adipocytes. PLoS ONE 2019, 14, e0217090.
60. Williamson, G.; Clifford, M.N. Colonic metabolites of berry polyphenols: The missing link to biological activity? Br. J. Nutr.
2010, 104 (Suppl 3), 48.
61. Xie, L.; Lee, S.G.; Vance, T.M.; Wang, Y.; Kim, B.; Lee, J.Y.; Chun, O.K.; Bolling, B.W. Bioavailability of anthocyanins and colonic
polyphenol metabolites following consumption of aronia berry extract. Food Chem. 2016, 211, 860–868.
62. Di Lorenzo, C.; Colombo, F.; Biella, S.; Stockley, C.; Restani, P. Polyphenols and Human Health: The Role of Bioavailability.
Nutrients 2021, 13, 273. https://doi.org/10.3390/nu13010273.
63. Wojtunik‐Kulesza, K.; Oniszczuk, A.; Oniszczuk, T.; Combrzyński, M.; Nowakowska, D.; Matwijczuk, A. Influence of In Vitro
Digestion on Composition, Bioaccessibility and Antioxidant Activity of Food Polyphenols‐A Non‐Systematic Review. Nutrients
2020, 12, 1401. https://doi.org/10.3390/nu12051401.
64. Bonelli, M.; Göschl, L.; Blüml, S.; Karonitsch, T.; Steiner, C.W.; Steiner, G.; Smolen, J.S.; Scheinecker, C. CD4⁺CD25⁻Foxp3⁺ T
cells: A marker for lupus nephritis? Arthritis Res. Ther. 2014, 16, R104.
65. Yin, Z.J.; Ju, B.M.; Zhu, L.; Hu, N.; Luo, J.; He, M.; Feng, X.Y.; Lv, X.H.; Pu, D.; He, L. Increased CD4(+)CD25(‐)Foxp3(+) T cells
in Chinese systemic lupus erythematosus: Correlate with disease activity and organ involvement. Lupus 2018, 27, 2057–2068.
66. Zohouri, M.; Mehdipour, F.; Razmkhah, M.; Faghih, Z.; Ghaderi, A. CD4+CD25‐FoxP3+ T cells: A distinct subset or a
heterogeneous population? Int. Rev. Immunol. 2021, 40, 307–316.
67. Tuzim, K.; Korolczuk, A. An update on extra‐oral bitter taste receptors. J. Transl. Med. 2021, 19, 440.
68. Cavallo, C.; Cicia, G.; Del Giudice, T.; Sacchi, R.; Vecchio, R. Consumers’ Perceptions and Preferences for Bitterness in Vegetable
Foods: The Case of Extra‐Virgin Olive Oil and Brassicaceae‐A Narrative Review. Nutrients 2019, 11, 1164.
https://doi.org/10.3390/nu11051164.
69. Mezzavilla, M.; Notarangelo, M.; Concas, M.P.; Catamo, E.; Gasparini, P.; Grillotti, M.G.; Robino, A. Investigation of the link
between PROP taste perception and vegetables consumption using FAOSTAT data. Int. J. Food Sci. Nutr. 2019, 70, 484–490.
Related Documents