HAL Id: tel-03510182 https://tel.archives-ouvertes.fr/tel-03510182 Submitted on 4 Jan 2022 HAL is a multi-disciplinary open access archive for the deposit and dissemination of sci- entific research documents, whether they are pub- lished or not. The documents may come from teaching and research institutions in France or abroad, or from public or private research centers. L’archive ouverte pluridisciplinaire HAL, est destinée au dépôt et à la diffusion de documents scientifiques de niveau recherche, publiés ou non, émanant des établissements d’enseignement et de recherche français ou étrangers, des laboratoires publics ou privés. Immuno-modulatory functions of tenascin-C in a tumor progression model Devadarssen Murdamoothoo To cite this version: Devadarssen Murdamoothoo. Immuno-modulatory functions of tenascin-C in a tumor progression model. Immunology. Université de Strasbourg, 2018. English. NNT : 2018STRAJ049. tel-03510182

Welcome message from author
This document is posted to help you gain knowledge. Please leave a comment to let me know what you think about it! Share it to your friends and learn new things together.
Transcript
HAL Id: tel-03510182https://tel.archives-ouvertes.fr/tel-03510182
Submitted on 4 Jan 2022
HAL is a multi-disciplinary open accessarchive for the deposit and dissemination of sci-entific research documents, whether they are pub-lished or not. The documents may come fromteaching and research institutions in France orabroad, or from public or private research centers.
L’archive ouverte pluridisciplinaire HAL, estdestinée au dépôt et à la diffusion de documentsscientifiques de niveau recherche, publiés ou non,émanant des établissements d’enseignement et derecherche français ou étrangers, des laboratoirespublics ou privés.
Immuno-modulatory functions of tenascin-C in a tumorprogression model
Devadarssen Murdamoothoo
To cite this version:Devadarssen Murdamoothoo. Immuno-modulatory functions of tenascin-C in a tumor progressionmodel. Immunology. Université de Strasbourg, 2018. English. �NNT : 2018STRAJ049�. �tel-03510182�
1
ÉCOLE DOCTORALE des Sciences de la Vie et de la Santé
UMR_S INSERM 1109 (IRM – Group Tumor Microenvironment)
THÈSE présentée par :
Devadarssen MURDAMOOTHOO
soutenue le : 14 septembre 2018
pour obtenir le grade de : Docteur de l’université de Strasbourg
Discipline : Sciences de la Vie et de la Santé
Spécialité : Immunologie et Cancer
Immuno-modulatory functions of Tenascin-C in a tumor progression model
THÈSE dirigée par :
Dr OREND Gertraud Université de Strasbourg, France
Rapporteurs :
Pr HEROLD-MENDE Christel Université de Heidelberg, Allemagne Pr RÜEGG Curzio Université de Fribourg, Suisse
Examinateur interne:
Pr Kilhoffer Marie-Claude Université de Strasbourg, France
UNIVERSITÉ DE STRASBOURG

2
Acknowledgements
I would like to express my gratitude to my supervisor Dr Gertraud Orend for giving
me the opportunity to do my PhD studies in her research group. Thank you for your
trust right from the start, your support and your encouragement.
I would like to thank Pr Marie-Claude Kilhoffer, Pr Christel Herold-Mende and Pr
Curzio Rüegg for their interest in my work and for accepting to be part of my thesis
committee. I also like to thank Dr Dominique Guenot, Dr Olivier Lefebvre and Pr
Philippe Georgel, the members of my half term committee.
I wish to thank the Worldwide Cancer Research and “La foundation ARC” to have
funded my PhD project and allowed me to produce this scientific work.
I will now switch to French
Mes chers collègues de l’équipe GO, je tiens à tous vous remercier pour ces bons
moments passés en votre compagnie. La thèse est un long parcours, pas toujours
très simple mais avec vous à mes côtés ça l’était déjà un peu plus. Merci pour les
échanges scientifiques et les échanges « un peu moins scientifiques ». William,
Fanny, Alev, Chérine, Thomas, Mika et Rolando, je vous dis un énorme MERCI. Ça a
été un immense plaisir de travailler avec vous.
Je ne pourrais oublier ceux qui étaient présents dès le début :
Mes très chères Annick et Isabelle, Que de souvenirs mémorables avec vous ! Je
vous remercie de tout cœur pour votre bienveillance à mon égard.
Sun, Constance, Christiane, Patricia et Olivier. Un grand merci pour avoir partagé
vos connaissances respectives avec moi. Cela a été pour moi un privilège.
Aux membres de l’unité U1113 et en particulier Cyril, Radhia, Damien, Ahlam, Asma,
Elisabeth, Léo, Marine et Emilie… (Honnêtement je serais bien parti pour tous vous
citer mais j’ai peur d’en omettre quelques uns), Je vous remercie tous pour les bons
moments passés ensemble.
உ

3
Je souhaite également reconnaître la contribution des personnes « plus éloignées de
la science » à ce travail. Leurs soutiens a été pour moi un moteur essentiel à la
réalisation de ce projet.
Mes très chers parents Souba et Barlen, je ne sais pas par où commencer pour vous
exprimer mon infinie gratitude. Tous vos sacrifices à l’échelle d’une vie ont fait de moi
ce que je suis aujourd’hui. Vous n’imaginez même pas à quel point je suis fier d’être
votre fils. Merci d’avoir toujours été là pour moi et de m’avoir aidé à réaliser ce travail.
Nadia, Jayssen, Veena, Mam Vassen et Tatie Kam, je vous remercie d’avoir été
présents pour moi. Vos encouragements respectifs m’ont toujours aidé à aller de
l’avant.
Raphaële et Christian, tout comme pour mes parents, je ne saurais vous remercier
pour vos encouragements quotidiens. Vous avez été toujours formidables envers moi
et je souhaite vous en exprimer toute ma gratitude du plus profond de mon cœur.
Malika, Guillaume et Noah je vous remercie pour votre soutien et de m’avoir toujours
apporté le sourire.
Cid et Filoche…bien sûr que je ne vous ai pas oubliés ! Merci pour tout !!!
Rom, Tu as été un soutien incessant pour moi. Tu as toujours trouvé les bons mots
pour me remotiver et pour m’aider à aller de l’avant. Le fruit de ce long travail est en
très grande partie grâce à toi. Je ne pourrais jamais suffisamment te remercier pour
tout cela.
En relisant ces remerciements, je me rends compte que bien des mots reviennent
encore et encore. Ces répétitions montrent surtout que j’ai eu la chance de côtoyer
des personnes formidables au cours de ces dernières années…
4
Table of content
I. French abstract.................................................................................................. 7
II. Contribution to manuscripts .......................................................................... 14
III. Abbreviations .................................................................................................. 16
1. Introduction ..................................................................................................... 20
1.1. The Tumor Microenvironment ........................................................................ 22
1.1.1. The cancer cells ................................................................................................ 23
1.1.2. The stromal cells ............................................................................................... 25
1.1.2.1. The endothelial cells ................................................................................. 25
1.1.2.2. Cancer associated fibroblasts (CAF) ................................................... 26
1.1.2.3. Immune cells ............................................................................................... 27
1.1.2.4. Other cell types .......................................................................................... 27
1.1.3. Extracellular matrix (ECM) .............................................................................. 28
1.1.4. Soluble factors ................................................................................................... 29
1.2. Tenascin-C (TNC) ............................................................................................ 31
1.2.1. Structure and expression ............................................................................... 31
1.2.2. TNC sources in the TME .................................................................................. 33
1.2.3. TNC as ligand for cellular receptors ............................................................ 35
1.2.4. TNC and pathological cell responses .......................................................... 36
1.2.4.1. Cell adhesion .............................................................................................. 36
1.2.4.2. Cell proliferation ........................................................................................ 37
1.2.4.3. Cell migration and invasion .................................................................... 37
1.3. Cancer immunity ............................................................................................. 39
1.3.1. The Cancer-Immunity cycle ............................................................................ 39
1.3.2. The cancer immunoediting concept ............................................................ 40
1.3.3. The tumor immune microenvironment in breast cancer ........................ 42
1.3.3.1. Tumor infiltrating lymphocytes (TILs) .................................................. 43
5
1.3.3.2. Innate immune responses ....................................................................... 44
1.3.3.3. The immune contexture ........................................................................... 46
1.3.4. Immunomodulatory properties of TNC ....................................................... 47
2. Aims .................................................................................................................. 49
3. Manuscript ....................................................................................................... 50
3.1. Abstract ................................................................................................................... 52
3.2. Introduction ............................................................................................................ 53
3.3. Results ..................................................................................................................... 55
3.4. Discussion .............................................................................................................. 64
3.5. Material and methods .......................................................................................... 72
3.6. Figures ..................................................................................................................... 83
3.7. Supplementary figures ........................................................................................ 93
3.8. Supplementary tables ........................................................................................ 104
4. Discussion and perspectives ....................................................................... 141
4.1. The NT193 grafting model recapitulating the MMTV-NeuNT transgenic
model is a valid novel preclinical breast cancer model ...................................... 142
4.2. Tumor cell-derived TNC impacts tumor growth in the WT hosts .......... 144
4.3. Tumor cell-derived TNC upregulates an antigen presentation signature
(APS) in the host ............................................................................................................ 146
4.4. TNC impacts CD8+ T cell localization ........................................................... 148
4.5. TNC impacts CD8+ T cell adhesion and migration through CXCL12 ... 150
5. Summary ........................................................................................................ 153
6. References ..................................................................................................... 154
7. Appendix I : Role of Tenascin-C in promoting lung metastasis through
impacting vascular invasions..........................................................................183
8. Appendix II : Tenascin-C promotes tumorigenesis in oral squamous cell
carcinoma..........................................................................................................259
9. Appendix III : Tenascin-C promotes tumor cell migration and metastasis
through integrin α9β1–mediated YAP inhibition............................................311
6
10. Appendix IV : Tenascin-C orchestrates glioblastoma angiogenesis by
modulation of pro- and anti-angiogenic signaling........................................325
Table of figures
Figure 1: Next generation hallmarks of cancer .................................................... 21
Figure 2: Changes in the tumor microenvironment upon tumor growth.. ......... 23
Figure 3: Structure of TNC and binding partners ................................................ 32
Figure 4: TNC expression in lung metastasis ...................................................... 33
Figure 5: Integrins as TNC receptors in cancer ................................................... 36
Figure 6: Cancer-Immunity Cycle .......................................................................... 40
Figure 7: The cancer immunoediting concept ..................................................... 42
Figure 8: Summary figure illustrating the dual role of TNC during tumor
progression. .......................................................................................................... 153
7
I. French abstract
Introduction
Le cancer du sein demeure à ce jour l’une des causes de mortalité majeures chez la
femme et ce malgré un diagnostic et une prise en charge thérapeutique précoces
(Fitzmaurice et al. 2015). La principale cause de cette forte mortalité est le
développement de métastases se disséminant à des organes secondaires tels que
l’os, le cerveau et les poumons (Minn et al. 2005). Il est désormais bien établi que le
caractère invasif des tumeurs est déterminé non seulement par les caractéristiques
intrinsèques des cellules tumorales mais également par leurs interactions
dynamiques avec le microenvironnement tumoral (MET) (Bissell and Hines 2011).
La composante cellulaire de ce MET comprend les cellules tumorales, les
fibroblastes associés au cancer (CAF), les cellules endothéliales, les adipocytes et
les cellules immunitaires. Toutes ces cellules sont étroitement intriquées dans la
matrice extracellulaire (MEC), une composante déterminante du MET (Midwood et al.
2016). La MEC est constituée d’un réseau complexe de protéines telles que les
collagènes, les laminines et les glycoprotéines. Longtemps restreinte à un rôle de
soutien tissulaire, la MEC s’est révélée être un acteur dynamique dans l’homéostasie
tissulaire dans les conditions physiologiques (Frantz, Stewart, and Weaver 2010). En
effet, les protéines matricielles peuvent par exemple interagir activement avec les
cellules via des récepteurs de surface, aboutissant à l’activation de voies de
signalisations pouvant moduler le cycle cellulaire (Hynes 2009a). Lors de
phénomènes pathologiques tels que les cancers, l’homéostasie tissulaire est rompue
et la composition de la MEC est considérablement altérée (Bonnans, Chou, and
Werb 2014). La ténascine-C (TNC) est l’une des protéines dont l’expression est
considérablement modifiée lors de la tumorigenèse.
La TNC est une glycoprotéine matricellulaire physiologiquement exprimée lors du
développement embryonnaire mais absente ou faiblement exprimée dans les tissus
adultes. Toutefois, elle est de nouveau exprimée lors de processus cicatriciels et lors
de processus pathologiques tels que l’inflammation chronique et le cancer ( Midwood
et al. 2016). La TNC est surexprimée dans le cancer du sein et cette expression est
corrélée avec l’apparition précoce de métastases pulmonaires ainsi qu’un faible taux
8
de survie des patients (Oskarsson et al. 2011). De plus il a été observé qu’au sein de
la tumeur, la TNC est sécrétée non seulement par les cellules tumorales mais
également par les cellules du stroma, rendant les tumeurs encore plus agressives
(Ishihara et al. 1995). En effet dans des modèles cellulaires de tumeurs mammaires,
il a été montré que TNC augmente la malignité des cellules tumorales en favorisant
la survie cellulaire, la prolifération et la migration (W. Huang et al. 2001; Nagaharu et
al. 2011). L’impact de la TNC sur les cellules cancéreuses est donc relativement bien
décrit mais qu’en est-il de son impact sur les autres cellules du MET, notamment les
cellules immunitaires ?
Les cellules immunitaires jouent un rôle prépondérant dans l’homéostasie tissulaire
et à plus forte raison dans le MET où ils assurent l’immunité antitumorale. Toutefois,
cette réponse immunitaire antitumorale évolue au cours du temps et se divise en
trois phases dites des « 3E » pour Elimination, Equilibre et Echappement tumoral
(Schreiber, Old, and Smyth 2011). Durant la phase d’élimination, les cellules
immunitaires reconnaissent les cellules tumorales et les éliminent. Cependant,
certaines cellules tumorales peuvent persister et on voit apparaître un équilibre entre
la prolifération de ces dernières et la réponse antitumorale. La croissance tumorale
reste à ce stade sous le contrôle du système immunitaire. Cette phase d’équilibre
peut durer plusieurs années et engendre des mutations dans les cellules
cancéreuses qui leur permettent d’échapper aux cellules immunitaires.
Lors de processus inflammatoires, la TNC est fortement exprimée, notamment dans
l’arthrite rhumatoïde où elle promeut l’inflammation chronique par la voie de
signalisation du « Toll-like receptor 4 » (TLR4) (K. Midwood et al. 2009a).
L’hypothèse a alors été émise que la TNC pourrait être reconnue par le système
immunitaire comme une molécule associée au danger (DAMP). D’autre part, en
mesurant les cytokines sécrétées par les lymphocytes T comme l’IFNγ, des études
ont montré in vitro que la TNC peut inhiber l’activation de ces cellules immunitaires
(Parekh et al. 2005; Rüegg, Chiquet-Ehrismann, and Alkan 1989). Plus récemment,
une étude réalisée dans un modèle de cancer de la prostate a décrit que la TNC peut
inhiber l’activation des lymphocytes en inhibant la polymérisation des filaments
d’actine, corrompant ainsi leur cytosquelette (Jachetti et al. 2015). Les études
précédentes montrent que la TNC peut favoriser la tumorigenèse en inhibant la
réponse antitumorale médiée par les lymphocytes T. D’autre part, selon l’étude
9
d’Oskarsson et al., la TNC produite par les cellules cancéreuses favorise le
développement de métastases dans un modèle de cancer du sein (Oskarsson et al.
2011). Cependant cette étude a été réalisée dans un modèle immunodéprimé,
écartant ainsi la contribution d’une composante principale de la MET, les cellules
immunitaires.
Notre hypothèse est que dans le cancer du sein, la TNC peut avoir différents rôles
dans la réponse immunitaire antitumorale, en impactant distinctement les différentes
cellules immunitaires comme les lymphocytes, les macrophages ou encore les
cellules dendritiques. Le compartiment immunitaire étant très complexe et
dynamique, nous supposons que la TNC pourrait d’une part moduler le MET vers un
microenvironnement pro-tumoral en inhibant la réponse antitumorale. D’autre part, la
TNC pourrait être reconnue comme un DAMP et de ce fait générer un
microenvironnement antitumoral. Le but de ce travail de thèse a donc été de
déterminer comment la TNC peut impacter la réponse immunitaire antitumorale
en utilisant des modèles immunocompétents murins de cancer du sein.
Résultats
Pour ce travail de thèse, nous avons utilisé 2 modèles murins préalablement établis
dans le laboratoire. Le premier est un modèle génétique ErbB2-dépendant, le MMTV-
NeuNT (Muller et al. 1988), dont l’expression de la TNC a été invalidé au laboratoire.
Ce modèle génétique de carcinome mammaire génère des tumeurs multifocales et
des métastases pulmonaires au bout de 9 mois de développement. A partir d’une
tumeur primaire de ce dernier modèle, une lignée de cellules cancéreuses a été
établie, la lignée NT193. Afin de déterminer distinctement l’impact de la TNC
stromale ou tumorale dans la tumorigenèse et le développement de métastase, un
modèle de greffe syngénique orthotopique NT193 a été généré en modulant
l’expression de la TNC dans la lignée NT193 (shC ou shTNC) avant de les injecter
dans un hôte exprimant la TNC (WT) ou non (KO). Ce modèle de greffe génère une
tumeur primaire et des métastases pulmonaires au bout de 3 mois après la greffe.
L’analyse histologique comparative des tumeurs primaires issues des 2 modèles a
montré une organisation tissulaire très similaire, validant l’utilisation du modèle de
greffe comme un modèle pertinent.
10
Nous avons donc poursuivi avec la caractérisation de ce modèle de greffe NT193.
De façon intéressante, nous avons observé un rejet partiel, voire totale de la tumeur
lorsqu’on injecte des cellules cancéreuses exprimant la TNC (shC) dans des hôtes
exprimant également la TNC (WT). Ce rejet n’est observé que dans cette condition
précise et se produit au bout de 3 semaines après la greffe. 3 semaines plus tard, les
tumeurs ayant subi seulement un rejet partiel entament une nouvelle pousse
tumorale, s’accompagnant d’une croissance plus importante ainsi que d’un taux de
formation de métastases pulmonaires plus important que les autres conditions de
greffes étudiées. D’autre part, l’injection des cellules NT193 shC dans des hôtes
immunodéprimés ne présente pas de rejet, suggérant que la TNC produite par les
cellules cancéreuses pourrait être reconnue par le système immunitaire comme un
DAMP. Le séquençage de l’ARN provenant de tumeurs à 3 semaines de
développement dans des hôtes KO pour la TNC a révélé qu’en présence de TNC
produite par les cellules tumorales, il y avait surexpression de gènes impliqués dans
le traitement et la présentation d’antigènes. Cette signature de gènes est retrouvée
dans les hôtes exprimant la TNC. De façon intéressante, cette signature a été
corrélée à une meilleure survie des patientes atteintes de cancer du sein.
D’autre part nous avons étudié l’infiltration immunitaire dans le modèle de greffe
NT193. Comme nous venons de le voir, ce modèle présente un rôle duplice de la
TNC avec un rejet tumoral à un stade précoce (3 semaines) puis un fort taux de
métastases à un stade tardif (11 semaines). Nous avons réalisé une analyse
comparative de l’infiltrat immunitaire dans les tumeurs primaires par
immunomarquage (CD4, CD8, CD11c, F4/80, CD45) en fonction de l’expression de
la TNC et aux deux différents stades susnommés. Les différences majeures de cette
analyse concernent l’infiltration des lymphocytes T CD8+ dans les tumeurs. En effet,
au stade précoce, l’infiltration des lymphocytes T CD8+ est plus importante en
présence de TNC. L’infiltration au stade précoce est aussi plus importante qu’au
stade tardif. Cependant au stade tardif, en dépit du nombre réduit de cellules CD8+
infiltrées, ces dernières étaient préférentiellement localisées dans des réseaux
organisés de matrice en présence de TNC alors qu’en absence de TNC les
lymphocytes T CD8+ pouvaient envahir le lit tumoral. La distribution spatiale de
l’infiltrat immunitaire étant essentielle à une bonne réponse anti-tumorale (Fridman et
al. 2012), nous nous sommes intéressés aux raisons de cette localisation
11
préférentielle des cellules CD8+. Notre hypothèse était que les réseaux organisés de
TNC pouvaient attirer les lymphocytes CD8+ infiltrés dans la tumeur et les
séquestrer, les empêchant ainsi d’éliminer les cellules cancéreuses.
Afin d’obtenir des candidats moléculaires permettant d’expliquer cette distribution
préférentielle dans les réseaux de matrice, nous nous sommes basés sur une
analyse transcriptomique par puce Affymetrix réalisée sur des tumeurs MMTV-
NeuNT exprimant ou non la TNC. Les résultats de cette analyse ont révélé que sur
47 gènes significativement dérégulés en présence de la TNC, 13 présentent une
annotation liée au système immunitaire selon une analyse par Gene Ontology dont 2
chimiokines (CXCL12 et CCL21) décrites pour leur capacité à induire le
chimiotactisme des lymphocytes T CD8+ (Bonacchi et al. 2003; Okabe 2005). Nous
avons donc entrepris de valider cette signature immunitaire par RT-qPCR dans le
modèle de greffe NT193, avec une attention particulière pour le CXCL12 et le
CCL21. Les résultats ont montré que seulement la TNC produite par les cellules
tumorales régule à la hausse l’expression des 2 chimiokines. Ces résultats ont
également été confirmés au niveau protéique par des tests d’ELISA. La TNC ayant
été décrite comme pouvant lier certains facteurs solubles comme le TGFβ, nous
avons réalisé des analyses de spectrométrie de résonance plasmonique de surface
pour savoir si la TNC est capable d’interagir avec le CXCL12 et le CCL21 (De
Laporte et al. 2013). Les résultats ont démontré que la TNC peut lier in vitro les 2
chimiokines avec une forte affinité.
Nous nous sommes ensuite intéressés au pouvoir chimiotactique du CXCL12 et du
CCL21 envers les lymphocytes T CD8+ en présence de TNC. Pour ce faire nous
avons utilisé des chambres de migration dont les inserts ont été recouverts d’une
couche matricielle (fibronectine (FN), TNC ou collagène IV (Col IV)). Pour évaluer la
capacité de la TNC à agir comme une simple barrière mécanique à la migration des
lymphocytes, nous avons recouvert la face supérieure de l’insert de la couche
matricielle correspondante. A l’inverse, pour évaluer la capacité de la TNC à agir
comme un substrat chemo-attracteur/adhésif, nous avons recouvert la face
inférieure. Ces différents tests de migration ont montré qu’à l’inverse du CCL21, le
CXCL12 est un puissant chemo-attracteur pour les lymphocytes CD8+. De plus,
lorsque la couche de TNC est présente à la face inférieure de l’insert, il y a plus de
cellules adhérentes à cette face en présence de CXCL12. Sachant que la TNC peut
12
lier le CXCL12, ces résultats montrent que la TNC peut retenir les lymphocytes CD8+
en présence du CXCL12.
Nous avons ensuite voulu savoir quelle serait la source de CXCL12 dans le modèle
de greffe NT193. Sachant que la TNC produite par les cellules cancéreuses a
précédemment montré in vivo un impact sur la production de CXCL12, nous sommes
intéressés au sécrétome des cellules NT193. Un dosage protéique du milieu
conditionné des cellules NT193 par ELISA a montré que les cellules sécrètent le
CXCL12 et que cette expression est régulée à la hausse par la TNC endogène des
cellules. Nous avons ensuite évalué la capacité de ce sécrétome à induire la
migration des lymphocytes T CD8+ en utilisant le même procédé que précédemment
décrit. Le milieu conditionné des cellules NT193 shC était capable d’induire la
migration des lymphocytes ainsi que leur adhésion à la TNC. Afin de déterminer si
c’est le CXCL12 présent dans le sécrétome qui engendrait ces effets, nous avons
effectué ces expériences en présence de l’AMD3100, un inhibiteur non-peptidique du
CXCR4 qui est le récepteur du CXCL12. En présence de l’inhibiteur, les effets liés au
CXCL12 décrits précédemment sont abolis, confirmant ainsi qu’il s’agit bien du
CXCL12 présent dans le sécrétome des cellules tumorales qui permet le
chimiotactisme des lymphocytes T CD8+ et leur adhésion à la TNC.
Afin d’évaluer l’effet du chimiotactisme induit par le CXCL12 sur les lymphocytes T
CD8+ in vivo, nous avons inhibé l’axe de signalisation CXCR4-CXCL12 par des
injections péri-tumorale quotidienne de AMD3100 sur une durée de 5 semaines. Ceci
a provoqué une régression tumorale plus précoce avec des tumeurs de plus petites
tailles que le groupe contrôle à la fin de l’expérience. De plus, l’analyse histologique
des tumeurs a révélé un afflux plus important de lymphocytes T CD8+ dans le lit
tumoral des tumeurs traitées avec l’inhibiteur, s’accompagnant d’un index
apoptotique plus important que le groupe contrôle.
13
Conclusion
En utilisant un nouveau modèle immunocompétent de greffe syngénique, nous avons
montré que la TNC joue un rôle prépondérant dans la tumorigenèse mammaire,
notamment en impactant l’infiltrat immunitaire. Ceci se traduit d’une part par
l’induction d’un rejet tumoral à un stade précoce du développement tumoral. Ce rejet
s’accompagne d’un fort infiltrat de lymphocytes T CD8+ et de la surexpression de
gènes impliqués dans les voies de traitement et de présentation d’antigène. Ceci
suggère que la TNC produite par les cellules cancéreuses serait reconnu par le
système immunitaire comme un signal de danger ou DAMP comme cela avait
préalablement été décrit dans la polyarthrite rhumatoïde. De plus, nous avons pu
corréler cette signature de gènes avec un meilleur taux de survie chez des patientes
avec des cancers du sein au stade 3. Ces résultats suggèrent donc que lors des
phases précoces du développement tumoral, la TNC peut induire une réponse
immunitaire anti-tumorale efficace. Toutefois, lors de la progression tumorale
s’accompagnant d’une forte expression de la TNC, nous avons décrit que cette
dernière pouvait corrompre la réponse immunitaire anti-tumorale. En effet, nos
résultats montrent que la TNC peut séquestrer les lymphocytes T CD8+ dans des
réseaux de matrice par l’intermédiaire du CXCL12. L’inhibition du récepteur CXCR4
in vivo provoque un rejet partiel et surtout précoce de la tumeur avec un afflux
important de lymphocytes T CD8+. Ces résultats montrent que l’axe de signalisation
CXCR4-CXCL12 est important dans la régulation de la migration des lymphocytes T
cytotoxiques par la TNC au sein de la tumeur. A l’heure où les nouvelles
immunothérapies font face à des échecs thérapeutiques en raison d’un infiltrat
immunitaire insuffisante dans le lit tumoral, ces nouvelles données peuvent être
mises à profit pour établir des thérapies synergiques permettant à la fois de libérer
les cellules effectrices du système immunitaire du réseau de matrice et les activer
pour mieux détruire les cellules cancéreuses.
14
II. Contribution to manuscripts
Scientific articles
1) Combined action of host and tumor cell-derived Tenascin-C determines
breast tumorigenesis. (in preparation)
Murdamoothoo D*, Sun Z*, Velázquez-Quesada I, Deligne C, Yilmaz A, Erne W,
Cremel G, Dutreux F, Paul N, Mertz M, Van der Heyden M, Carapito R, Midwood
K and Orend G+, * equal contribution, + corresponding authors
2) Tenascin-C provides environmental cues that control macrophage
phenotypes in cancer. (in preparation)
Deligne C*, Murdamoothoo D*, Van der Heyden M, Orend G+ and Midwood K+,
* equal contribution, + corresponding authors
3) Tenascin-C promotes oral squamous cell carcinoma impacting immune cell
infiltration. (in preparation)
Spenlé C*, Loustau T*, Murdamoothoo D, Bourdely P, Erne W, Burckel H,
Mariotte A, Cremel G, Beghelli-de la Forest Divonne S, Sudaka A, Nouhen K,
Schaub S, Rekima S, Georgel P, van der Heyden M, Noel G, Anjuère F3+, Van
Obberghen-Schilling E+ and Orend G+, * equal contribution, + corresponding
authors
4) Role of Tenascin-C in promoting lung metastasis through impacting
vascular invasions. (submitted)
Sun Z*, Velázquez-Quesada I*, Murdamoothoo D, Averous G, Ahowesso C,
Yilmaz A, Erne W, Van der Heyden M, Spenlé C, Lefebvre O, Klein A,
Oberndorfer F, Oszwald A, Bourdon C, Mangin P, Mathelin C, Deligne C,
Midwood K, Chenard MP, Christofori G, Hussenet T, Kain R, Loustau T and
Orend G+, * equal contribution, + corresponding authors
5) Tenascin-C orchestrates tumor cell apoptosis by impacting TRAIL in
cancer. (in preparation)
Erne W, Murdamoothoo D, Yilmaz A, Van der Heyden M, Cremel G, Lefebvre O,
Orend G+
6) Sun, Z.*, Schwenzer, A.*, Rupp, T.*, Murdamoothoo, D., Vegliante, R., Lefebvre,
O., Klein, A., Hussenet, T., and Orend, G. (2017). Tenascin-C promotes tumor
cell migration and metastasis through integrin α9β1 -mediated YAP
inhibition. Cancer Research canres.1597.2017.
15
7) Platet, N., Hinkel, I., Richert, L., Murdamoothoo, D., Moufok-Sadoun, A., Vanier,
M., Lavalle, P., Gaiddon, C., Vautier, D., Freund, J.-N., et al. (2017). The tumor
suppressor CDX2 opposes pro-metastatic biomechanical modifications of
colon cancer cells through organization of the actin cytoskeleton. Cancer
Letters 386, 57–64.
8) Rupp, T., Langlois, B., Koczorowska, M.M., Radwanska, A., Sun, Z., Hussenet,
T., Lefebvre, O., Murdamoothoo, D., Arnold, C., Klein, A., et al. (2016).
Tenascin-C Orchestrates Glioblastoma Angiogenesis by Modulation of Pro-
and Anti-angiogenic Signaling. Cell Rep 17, 2607–2619.
Chapters
1) Murdamoothoo, D.*, Schwenzer, A.*, Kant, J., Rupp, T., Marzeda, A., Midwood,
K., and Orend, G. (2018). Investigating cell-type specific functions of
tenascin-C. In Methods in Cell Biology, (Elsevier), pp. 401–428.
2) Giblin, S.P.*, Murdamoothoo, D.*, Deligne, C.*, Schwenzer, A.*, Orend, G., and
Midwood, K.S. (2018). How to detect and purify tenascin-C. In Methods in
Cell Biology, (Elsevier), pp. 371–400.
Reviews
1) Impact of the tumor microenvironment on NKG2D immune checkpoint
control in cancer. (in preparation)
Murdamoothoo D., Carapito R., Bahram S., Orend G+.
16
III. Abbreviations
APC Antigen presenting cell
APS Antigen presenting signature
B2M Beta-2-microglobulin
BEC Blood endothelial cell
BRCA1 Breast cancer 1
BRCA2 Breast cancer 2
CAF Cancer associated fibroblast
CART chimeric antigen receptor T cell
CCL C-C motif chemokine
CCR C-C chemokine receptor
CD Cluster of differentiation
CIITA MHC class II transactivator
Col IV Collagen IV
CSF1 Colony-stimulating factor-1
CSF-1R Colony-stimulating factor-1 receptor
CSPG5 Chondroitin Sulfate Proteoglycan 5
CTGF Connective tissue growth factor
CTL Cytotoxic T lymphocytes
CTLA4 Cytotoxic T-lymphocyte-associated protein 4
CTSS Cathepsin S
CXCL C-X-C motif chemokine
CXCR C-X-C chemokine receptor
DAMP Danger associated molecular pattern
DC Dendritic cell
DCIS Ductal carcinomas in situ
DNA Deoxyribonucleic acid
ECM Extracellular matrix
EGF-L Epidermal growth factor-like
EMT Epithelial-to-mesenchymal transition
EndMT Endothelial-to-mesenchymal transition
17
ER Estrogen receptor
FAK Focal adhesion kinase
FAP Fibroblast activation protein
FGF Fibroblast growth factor
FN Fibronectin
FNIII Fibronectin type-III
GBM Glioblastoma
GTP Guanosine triphosphate
HER2 Human epidermal growth factor receptor 2
HGF Hepatocyte growth factor
HR Hazard ratio
IFNγ Interferon γ
IGF1 Insulin-like growth factor 1
IL Interleukin
JNK c-Jun N-terminal kinase
Kd Dissociation constant
KLRC1 Killer cell lectin like receptor C 1
LEC Lymphatic endothelial cell
LM Laminin
LMγ2 Laminin γ2
LOX Lysyl oxidase
MAP Mitogen-activated protein
MCS Mesenchymal stem cell
MDSC Myeloid-derived suppressor cell
MHC Major histocompatibility complex
MMP Matrix metalloproteinase
MMTV Mouse mammary tumor virus
mRNA Messenger Ribonucleic acid
Mφ Macrophage
NF-κB Nuclear factor-kappa B
NK Natural killer
NKT Natural killer T cell
NOS2 Nitric oxide synthase 2
18
OS Overall survival
OSCC Oral Squamous Cell Carcinoma
PD-1 Programmed cell death protein 1 receptor
PDGF Platelet-derived-growth factor
PDGFR Platelet-derived-growth factor receptor
PD-L1 Programmed death-ligand 1
PDX Patient-derived xenograft
PNET Pancreatic neuroendocrine tumor
POSTN Periostin
PR Progesterone receptor
PyMT polyomavirus middle T-antigen
RA Rheumatoid arthritis
RFS Relapse free survival
RhoA Ras homolog gene family, member A
RNA Ribonucleic acid
RNA seq RNA sequencing
ROS Reactive oxygen species
RPTPβζ Receptor-type protein tyrosine phosphatase beta zeta
SDF1 Stromal cell-derived factor 1
SPR Surface plasmon resonance
TAA Tumor associated antigen
TAM Tumor associated macrophage
TAP1 Antigen peptide transporter 1
TAP2 Antigen peptide transporter 2
TCR T cell receptor
TGFβ Transforming growth factor β
Th T helper
TIL Tumor infiltrating lymphocyte
TLR4 Toll-like receptor 4
TME Tumor microenvironment
TMT Tumor matrix track
TNBC Triple negative breast cancers
TNC Tenascin-C
19
TNCKO Tenascin C knock out
TNFα Tumor necrosis factor α
Treg Regulatory T cells
uPA Urokinase plasminogen activator
VEGF-A Vascular endothelial growth factor A
VEGF-C Vascular endothelial growth factor C
VEGF-D Vascular endothelial growth factor D
VEGFR2 Vascular endothelial growth factor receptor 2
VEGFR3 Vascular endothelial growth factor receptor 3
YAP Yes activating protein
αSMA α-smooth muscle actin
20
1. Introduction
Over the past fifty years, considerable advancement in the understanding of breast
cancer biology has transformed the current landscape of the disease management.
The new approaches include early diagnosis strategies to track the disease
progression, implementation of breast-conserving surgery techniques whenever
complete mastectomy can be avoided and development of targeted therapies
antagonizing the hormonal pathway and the human epidermal growth factor receptor
2 (HER2/neu) signaling pathway (Sledge et al. 2014). Indeed, since the
characterization of the steroid hormone receptors as critical prognostic markers in the
1960’s, the advent of anti-estrogen therapies have been a major breakthrough in ER-
positive breast cancer therapeutics and have even served as a paradigm for the
development of targeted therapies in the oncology field (Baum et al. 1983; Ke and
Shen 2017). In parallel, the development of the HER2-targeting monoclonal antibody
Trastuzumab revolutionized the management of patients with metastatic breast
cancer that overexpressed HER2 where it increased the clinical benefit of first-line
chemotherapy (Slamon et al. 2001). Altogether, this improvement of breast cancer
management has significantly contributed to a better prognosis for the patients with
breast cancer, where death rates decreased by 39% since 1989 (DeSantis et al.
2017). Nevertheless, still too many patients are concerned by this disease as e.g. in
2017, 58 968 women were expected to be affected by breast cancer in France with
11833 dying from the disease (Jéhannin-Ligier et al. 2017). Breast cancer remains
the most prevalent malignancy in women and the second most common cause of
cancer-related death worldwide (Siegel, Miller, and Jemal 2017; Cardoso et al. 2012).
There is therefore a strong need to better understand the molecular mechanisms
underlying this disease to develop novel treatment strategies to further improve
breast cancer patient survival.
For long, cancer research and particularly breast cancer research have been
focusing on the transformation of normal somatic cells into malignant tumor cells due
to genetic alterations of the tumor cells themselves. As a matter of fact, 5 out of the
first 6 hallmarks of cancer that have been described almost 20 years ago now,

21
emphasized the ability of tumor cells to evade regulatory mechanisms and cell death
while at the same time sustaining potent cell proliferation and invasion (Hanahan and
Weinberg 2000). Yet, now established evidence shows that cancers are not just
masses of neoplastic cells but also contain a significantly altered surrounding stroma
(greek: mat to lie on) forming the tumor microenvironment (TME) (Balkwill, Capasso,
and Hagemann 2012). The composition of the stroma representing itself as a
particular tumor ecosystem in a 3D context and its persistent interaction with the
tumor cells has profound effects on tumor growth and malignant progression. In fact,
there exists a dynamic reciprocity between the proliferating tumor cells and the
intricate stroma. The malignant cells not only respond to the stroma but also
modulate their environment. So much, that in 2011, by revisiting the hallmarks of
cancer, the authors included, after the vascular endothelial system, a second major
interacting component of the TME, the immune system (Hanahan and Weinberg
2011) (Fig 1).
Figure 1: Next generation hallmarks of cancer. Apart from intrinsic characteristics
of the malignant cells, the new hallmarks of cancer integrate the close interactions of
the tumor cells with the immune compartment, a key component of the TME. Adapted
from Hanahan and Weinberg (2011).
22
1.1. The Tumor Microenvironment
The tumor microenvironment (TME) is the ecosystem which defines the behavior of a
developing cancer, not only by the genetic alterations of the malignant cells but also
through their interaction with the surrounding milieu (Mbeunkui and Johann 2009).
This dynamic and collaborative network includes the tumor cells, stromal cells such
as fibroblasts, endothelial cells and infiltrating immune cells, soluble factors like
cytokines and an intricate extracellular matrix (ECM) that does not only provide
physical support but also actively participates in shaping the tumor ecosystem
(Hanahan and Coussens 2012) (Fig 2). Over the last two decades the TME and its
constituent stromal compartment have been the focus of numerous studies,
deciphering their functional role in tumorigenesis and metastasis formation (Witz and
Levy-Nissenbaum 2006; Hanahan and Coussens 2012). In breast cancer patients,
several studies also highlight the importance of the TME. For instance, whole-
genome analyses of breast cancer patients carrying the BRCA1/2 mutations
suggested that the accumulation of genomic instability in the stromal compartment
build up a TME that promotes genetic instability in the epithelial cells and therefore
promotes transformation in these cells (Weber et al. 2006). Another study was based
upon a retrospective cross-sectional analysis of DNA from the epithelium and stroma
of 220 primary sporadic invasive breast carcinomas (Fukino et al. 2007). There, the
authors looked for the relationship between genomic alterations (through loss of
heterozygocity / allelic imbalance) and clinicopathological features. There were more
correlations between the clinicopathological features and the genomic alterations in
the stroma than in the epithelial cells, suggesting a major contribution of the stroma
to the development of malignancies. Some aspects of the TME like angiogenesis and
ECM remodeling have been recognized as relevant in tumor progression since a long
time (J. Folkman 1971; Bissell, Hall, and Parry 1982). Yet, an integrated and
comprehensive loco-spatial understanding of the TME and its evolution over time as
well as the impact on the tumor cells is still missing.
23
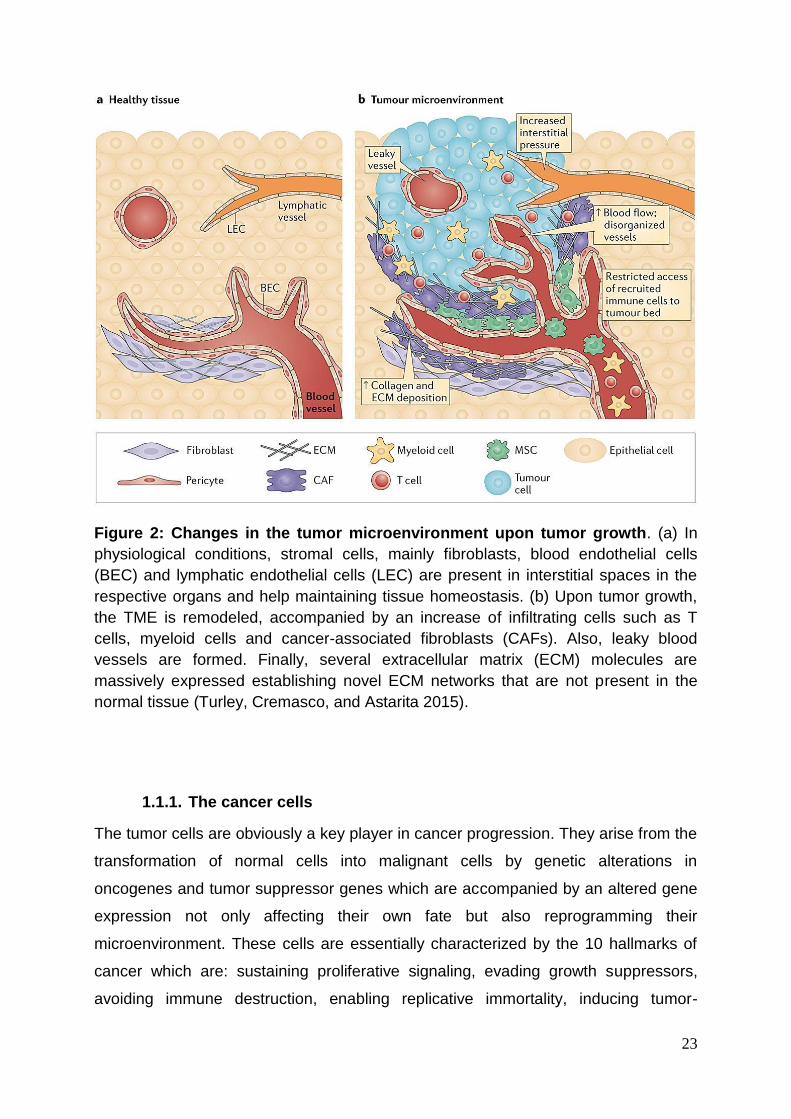
Figure 2: Changes in the tumor microenvironment upon tumor growth. (a) In
physiological conditions, stromal cells, mainly fibroblasts, blood endothelial cells
(BEC) and lymphatic endothelial cells (LEC) are present in interstitial spaces in the
respective organs and help maintaining tissue homeostasis. (b) Upon tumor growth,
the TME is remodeled, accompanied by an increase of infiltrating cells such as T
cells, myeloid cells and cancer-associated fibroblasts (CAFs). Also, leaky blood
vessels are formed. Finally, several extracellular matrix (ECM) molecules are
massively expressed establishing novel ECM networks that are not present in the
normal tissue (Turley, Cremasco, and Astarita 2015).
1.1.1. The cancer cells
The tumor cells are obviously a key player in cancer progression. They arise from the
transformation of normal cells into malignant cells by genetic alterations in
oncogenes and tumor suppressor genes which are accompanied by an altered gene
expression not only affecting their own fate but also reprogramming their
microenvironment. These cells are essentially characterized by the 10 hallmarks of
cancer which are: sustaining proliferative signaling, evading growth suppressors,
avoiding immune destruction, enabling replicative immortality, inducing tumor-
24
promoting inflammation, resisting cell death, inducing angiogenesis, activating
invasion and metastasis, deregulating cellular energetics in favor of malignant cell
proliferation and finally presence of genome instability and mutations (Hanahan and
Weinberg 2011) (Fig 1).
Besides these general features, breast cancer cells are particularly characterized by
an accumulation of multiple molecular alterations (Geyer et al. 2009; Simpson et al.
2005), some of which have subsequently been used as biomarkers for breast cancer
classification (Rakha, Reis-Filho, and Ellis 2010). Among the main biomarkers
routinely used for the characterization of breast cancers are the estrogen receptor
(ER), the progesterone receptor (PR) and human epidermal growth factor receptor 2
(HER2). ER-positive tumors (ER+) accounts for 75% of all breast cancer types
(Anderson et al. 2002). ER expression plays an important role in the breast
carcinogenic process and its inhibition through selective ER antagonists or
aromatase inhibitors still forms the backbone of breast cancer endocrine therapy
(Early Breast Cancer Trialists’ Collaborative Group 1988, 2015). On the other hand,
the PR gene is regulated by estrogen. Therefore, its expression is considered to
reflect an intact and functioning ER pathway (Horwitz, Koseki, and McGUIRE 1978).
Even though in breast cancer, ER expression is considered as the main determinant
of the patient’s response to hormonal therapy, ER+/PR− tumors are generally less
responsive than ER+/PR+ tumors to tamoxifen treatment (Bardou et al. 2003; Arpino
et al. 2005).
Last but not least, HER2 is a key determinant in breast cancer prognosis. HER2
belongs to the tyrosine kinase receptor family and mediates cell survival and
differentiation (Gschwind, Fischer, and Ullrich 2004). 15-25% of breast cancers are
associated with an overexpression of HER2 and correlate with aggressive behavior
of the malignant cells (Slamon et al. 2001). This particular characteristic of breast
cancer cells gave rise to the development of a humanized monoclonal antibody
directed against the extracellular domain of HER2, the Trastuzumab. Treatment with
trastuzumab after adjuvant chemotherapy significantly improved disease-free survival
among women with HER2-positive breast cancer (Piccart-Gebhart et al. 2005). On
the other hand, these 3 biomarkers also define a group of cancer patients as triple-
negative: ER-/PR-/HER2-. These patients comprise 10-15% of all breast cancers with
25
a relatively poor outcome since they don’t respond to endocrine therapies nor to
HER2-targeted therapies (Foulkes, Smith, and Reis-Filho 2010).
1.1.2. The stromal cells
As mentioned above, the stromal cells of the TME represent an integral part of the
tumor. The stromal cells include mainly the endothelial cells, the cancer associated
fibroblasts and the immune cells (Mueller and Fusenig 2004). There is an incessant
still poorly understood crosstalk existing between these cells and the tumor cells that
shapes tumor growth and metastasis formation. The relative contribution of these
stromal cells to tumor growth will be presented here.
1.1.2.1. The endothelial cells
It is now well established that endothelial cells play a crucial role in tumor progression
by generating novel support and dissemination routes as well as niches for cancer
stem cells (Ping, Zhang, and Bian 2016). Tumors require the formation of a complex
vascular network to meet the metabolic needs of the proliferating malignant cells. To
grow beyond a size of 1-2mm in diameter, the tumor needs to induce angiogenesis
(Judah Folkman 2003). This process requires the recruitment of vascular endothelial
cells, pericytes (to cover the endothelial tubes to promote vessel integrity) and bone
marrow-derived cells like macrophages, neutrophils and myeloid progenitors
(Zumsteg and Christofori 2009). Apart from the recruitment of these cells, tumor
vascularization is accompanied by an upregulation of soluble pro-angiogenic factors,
as e.g. the vascular endothelial growth factor A (VEGF-A) that directly acts on the
endothelial cells (Hanahan and Weinberg 2011). The in vivo pro-angiogenic
response to VEGF-A is mainly mediated through signaling by its receptor VEGFR2
which leads to endothelial cell survival, proliferation and migration (Claesson-Welsh
and Welsh 2013).
Together with blood endothelial cells, lymphatic endothelial cells (LEC) play also an
important role in tumor progression and metastasis formation. Lymphatic vessels
represent an alternate route for tumor cells to disseminate to different organs.
Lymphangiogenesis in primary tumors is mediated by the soluble factors VEGF-C
and VEGF-D that activate their receptor VEGFR3 (Joukov et al. 1996; Achen et al.
1998). Since the approval of the monoclonal antibody Bevacizumab as anti-
angiogenic therapy in breast cancer in 2004 (recently retracted due to lack of
26
efficiency(Zambonin et al. 2017)), many more drugs have successfully been
developed to target angiogenesis in tumor development with a mixed efficacy
(Vasudev and Reynolds 2014; Al-Husein et al. 2012). A new paradigm is not the
complete destruction of newly formed blood vessels but their normalization which
would reduce vessel leakiness and would provide a good route for drug delivery
(Stylianopoulos and Jain 2013).
1.1.2.2. Cancer associated fibroblasts (CAF)
The most abundant cell type in breast cancer stroma and in cancer stroma in general
is the fibroblast. In early stages of tumorigenesis and upon activation, resident
fibroblasts, differentiated into myofibroblasts, are able to inhibit tumor progression
through gap junctions between the fibroblasts and through secretion of IL-6 (Cornil et
al. 1991; Lu, Vickers, and Kerbel 1992). The origin of the CAFs in the TME is still
debated. During tumor progression, it is hypothesized that the fibroblasts are
corrupted by the tumor cells to being transformed into CAFs that exhibit
myofibroblastic properties. Other studies suggest that CAFs result from endothelial-
to-mesenchymal transition (EndMT) (Marsh, Pietras, and McAllister 2013). This
hypothesis is supported by lineage-tracing experiments performed in a B16F10
melanoma mouse model and in a Rip1-Tag2 spontaneous neuroendocrine
pancreatic carcinoma model that showed that CAFs derived from an endothelial
origin (Zeisberg et al. 2007).
In the TME, CAFs are abundantly present and can be distinguished from normal
resident fibroblasts by the upregulation of α-smooth actin (αSMA) and fibroblast
activation protein (FAP) (Shiga et al. 2015). Accumulation of CAFs in the TME has
often been correlated with bad prognosis in tumors like colorectal cancer (Tsujino et
al. 2007). Furthermore, CAFs have been shown to support cell transformation and
tumor growth. A key experiment has been performed by Olumi and colleagues where
the authors grafted CAFs or normal fibroblasts together with non-tumorigenic
immortalized prostatic epithelial cells. Only the CAFs promoted tumor formation yet
the normal fibroblasts did not (Olumi et al. 1999). These results suggest pro-
oncogenic properties of CAFs in the TME. This tumor-supporting role of CAFs has
been described to be mediated by the secretion of soluble factors acting directly on
the malignant cells. For example, CAFs secrete the hepatocyte growth factor (HGF)

27
and insulin-like growth factor 1 (IGF1) which support tumor cell proliferation (Willis,
Dubois, and Borok 2006; Spaeth et al. 2009). CAFs can also secrete chemokines
such as CXCL12 that can promote growth and survival of tumor cells (Orimo et al.
2005). Moreover, CAFs massively secrete ECM and ECM remodeling molecules
which play an important role in tumor growth and dissemination. This aspect will be
discussed in section 1.1.3.
1.1.2.3. Immune cells
The main physiological function of the immune cells is to maintain tissue
homeostasis, protect against foreign pathogens and eradicate damaged or
transformed cells. In the TME, the innate immune system (including macrophages,
neutrophils, mast cells, dendritic cells and natural killer cells) and the adaptive
immune system (T and B lymphocytes) interact with the tumor cells via a complex
interaction network. Initially thought to mediate only an anti-tumor response, it is now
accepted that immune cells can also contribute to tumor progression by establishing
a state of chronic inflammation (Grivennikov, Greten, and Karin 2010). Over the last
two decades, an increasing amount of data on tumor immunity has led to a radical
change in the understanding of the tumor immune landscape (Sharma and Allison
2015). The crucial role of the infiltrating immune cells in the TME and the therapeutic
implications will be addressed in more detail in section 1.3.
1.1.2.4. Other cell types
In breast cancer, stromal cells also include resident adipocytes. Until only recently,
the adipocytes were considered as mere providers of energy for the surrounding
tissue. However, there is now growing evidence that these cells can produce soluble
factors like cytokines, growth factors such as leptin that can stimulate tumor
progression through generating a pro-inflammatory microenvironment (Delort et al.
2015). Adipocytes have also been shown to increase tumor cell aggressiveness
through secretion of IL-6 (Dirat et al. 2011). Furthermore, adipocytes can promote
ovarian cancer metastasis to the omentum through IL-8 secretion (Nieman et al.
2011). Neuroendocrine cells present in the tumor microenvironment also interact with
the tumor cells and can influence tumor progression. In prostate cancer,
neurogenesis is correlated with tumor aggressiveness and recurrence (Ayala et al.
2008).
28
1.1.3. Extracellular matrix (ECM)
The extracellular matrix is a complex dynamic 3-dimensional network of
macromolecular fibrous proteins and non-fibrous proteoglycans that are present in
the stroma of all tissues. These ECM network can either be organized as thin
meshes as in the basement membranes or as loose fibril-like structures in the
interstitial matrix (Sorokin 2010). Initially thought to serve only as a physical scaffold,
the ECM comprising large macromolecules like collagens, fibronectin, laminins and
tenascins have been shown to affect cell behavior through regulation of cell shape,
proliferation and gene transcription (Ghajar and Bissell 2008; Bissell, Hall, and Parry
1982). The interaction between the ECM and the cells is largely mediated by the
integrins which are cell surface receptors interacting with the intracytoplasmic
compartment and the cytoskeleton (Teti 1992). The integrins can also act as
biomechanical sensors for the cells. Indeed, it is now clear that the stiffness and the
topography of the ECM surrounding the cells regulate integrin-mediated signaling
and subsequent cell behavior (Engler et al. 2006). The stiffness of the ECM is
affected by the composition and the organization of the ECM molecules.
In the TME, the ECM undergoes a profound remodeling thereby establishing a pro-
tumorigenic microenvironment (Hynes and Naba 2012). For instance, high deposit of
ECM molecules like collagen is correlated with mammographically dense breast
tissue, that is strongly associated with an increased risk of developing breast
carcinoma (Boyd et al. 2001; Ursin et al. 2005). Moreover, in vivo studies assessing
the role of ECM stiffening in a breast cancer model showed that lysyl oxidase (LOX)-
mediated collagen crosslinking promotes focal adhesion formation and subsequent
signaling involving PI3K thereby promoting tumor progression (Levental et al. 2009).
Similarly, high expression of fibronectin by cancer cells in invasive breast cancer
patients correlated with poor overall survival and disease-free survival (Bae et al.
2013). Matricellular proteins like tenascin-C (TNC) and periostin (POSTN) have also
been shown to be highly expressed in metastatic niches where they contribute to
tumor aggressiveness by multiple poorly understood mechanisms. What is known is
that TNC and POSTN activated Notch and Wnt signaling, respectively in the tumor
models (Oskarsson et al. 2011; Malanchi et al. 2011; Saupe et al., 2013).
29
High expression of ECM molecules in the TME is also often associated to high
enzymatic modifications of the cancer matrix. The importance of LOX family has
previously been described in collagen crosslinking, yet other ECM modifying
enzymes have been studied for their respective roles in cancer progression. These
enzymes involve the matrix metalloproteinases (MMPs), urokinase plasminogen
activator (uPA) system and cathepsins (Oskarsson 2013). For example, MMPs have
been described in facilitating tumor cell invasion through ECM degradation (Radisky
and Radisky 2015). However, MMPs can also act directly on the tumor cells and
trigger their invasiveness. In particular, it has been shown that MMP3 can trigger
epithelial-to-mesenchymal transition (EMT), both in vitro and in vivo in breast cancer
models, and to promote tumorigenicity (Sternlicht et al. 1999). In addition to the
previous contributions of the ECM to tumor progression, it has been widely described
that ECM molecules can bind soluble factors (Schultz and Wysocki 2009). These
soluble factors include growth factors like vascular endothelial growth factor (VEGF),
transforming growth factor β (TGFβ) and fibroblast growth factor (FGF) that have
been described for their pro-tumorigenic properties respectively (Wijelath et al. 2006;
Martino et al. 2013; Simian et al. 2001). Upon matrix remodeling these growth factors
are potentially released in the TME and contribute to a pro-tumorigenic phenotype
(Hynes 2009).
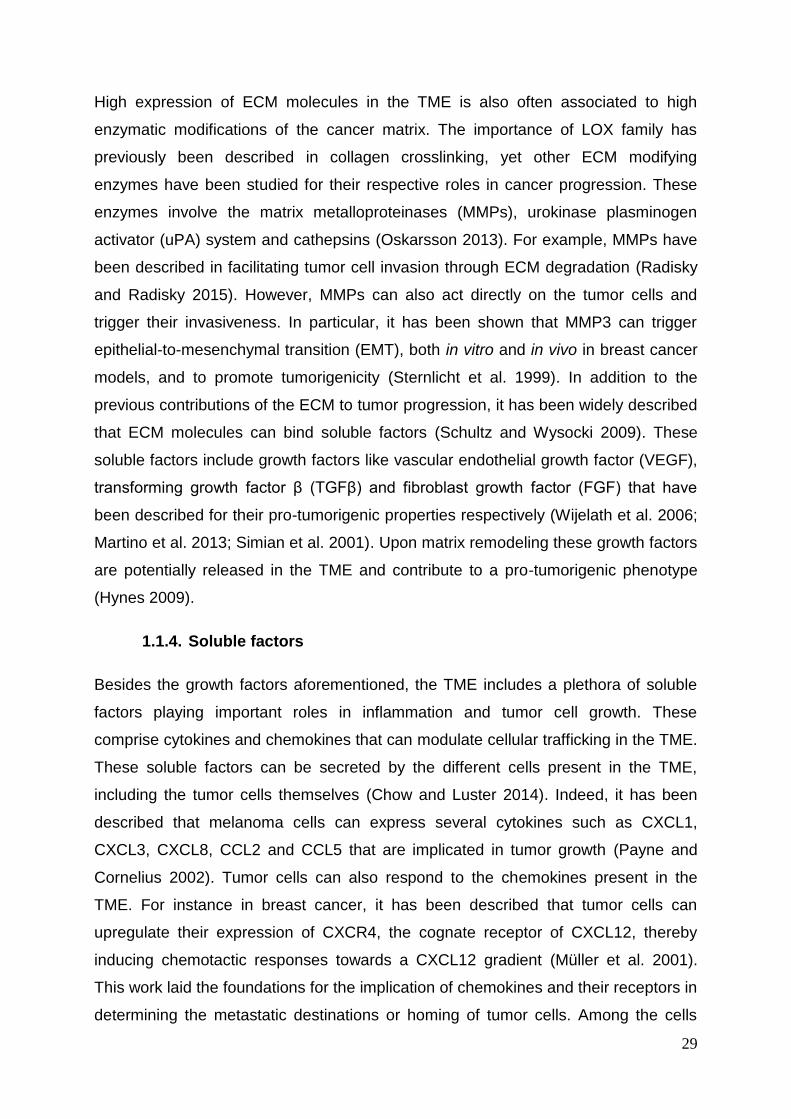
1.1.4. Soluble factors
Besides the growth factors aforementioned, the TME includes a plethora of soluble
factors playing important roles in inflammation and tumor cell growth. These
comprise cytokines and chemokines that can modulate cellular trafficking in the TME.
These soluble factors can be secreted by the different cells present in the TME,
including the tumor cells themselves (Chow and Luster 2014). Indeed, it has been
described that melanoma cells can express several cytokines such as CXCL1,
CXCL3, CXCL8, CCL2 and CCL5 that are implicated in tumor growth (Payne and
Cornelius 2002). Tumor cells can also respond to the chemokines present in the
TME. For instance in breast cancer, it has been described that tumor cells can
upregulate their expression of CXCR4, the cognate receptor of CXCL12, thereby
inducing chemotactic responses towards a CXCL12 gradient (Müller et al. 2001).
This work laid the foundations for the implication of chemokines and their receptors in
determining the metastatic destinations or homing of tumor cells. Among the cells
30
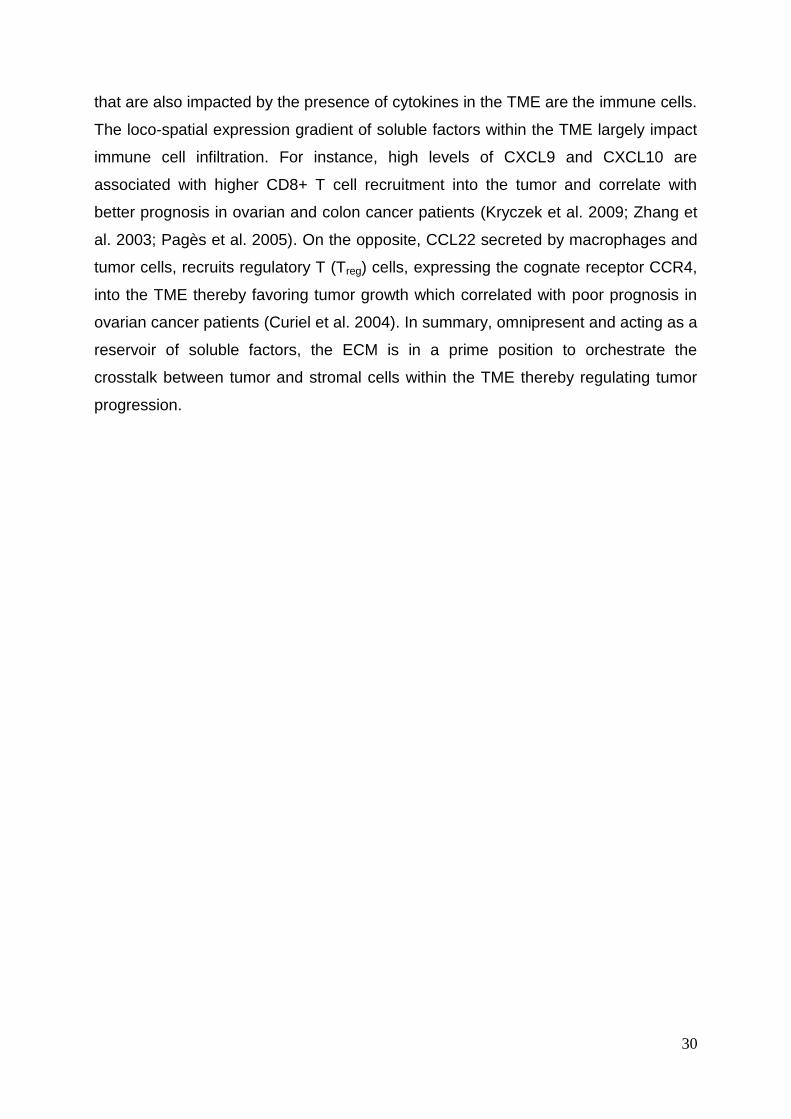
that are also impacted by the presence of cytokines in the TME are the immune cells.
The loco-spatial expression gradient of soluble factors within the TME largely impact
immune cell infiltration. For instance, high levels of CXCL9 and CXCL10 are
associated with higher CD8+ T cell recruitment into the tumor and correlate with
better prognosis in ovarian and colon cancer patients (Kryczek et al. 2009; Zhang et
al. 2003; Pagès et al. 2005). On the opposite, CCL22 secreted by macrophages and
tumor cells, recruits regulatory T (Treg) cells, expressing the cognate receptor CCR4,
into the TME thereby favoring tumor growth which correlated with poor prognosis in
ovarian cancer patients (Curiel et al. 2004). In summary, omnipresent and acting as a
reservoir of soluble factors, the ECM is in a prime position to orchestrate the
crosstalk between tumor and stromal cells within the TME thereby regulating tumor
progression.
31
1.2. Tenascin-C (TNC)
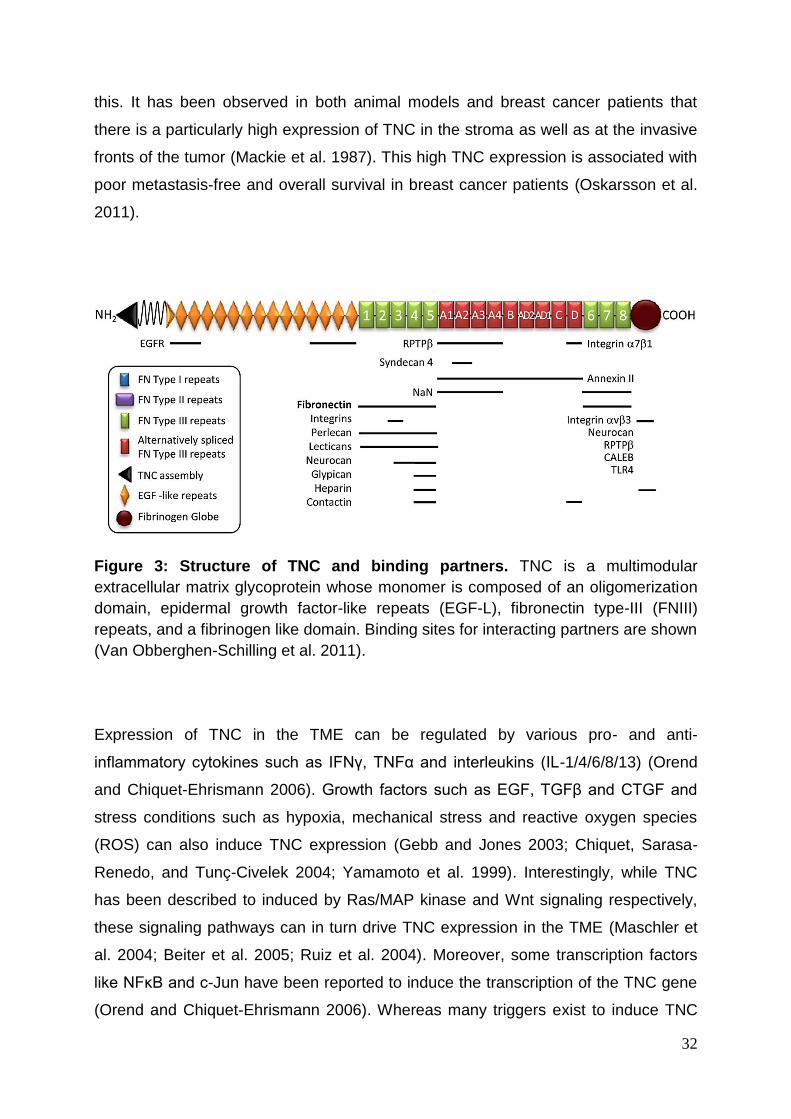
1.2.1. Structure and expression
TNC is a large extracellular matrix glycoprotein belonging to the tenascin family
together with tenascin-R, tenascin-W and tenascin-X (Chiquet-Ehrismann and Tucker
2011). The name was inspired by the fact that tenascin-C is expressed at two sites
under physiological conditions: in tendons (‘tenere’ to hold) and in embryonic tissue
(‘nasci’ to be born) (Ehrismann, Chiquet, and Turner 1981; K. Midwood et al. 2016).
The TNC molecule is composed of 6 huge monomers of approximately 300 kDa
each. Each monomer is composed of a N-terminal assembly domain, followed by 14
½ epidermal growth factor-like repeats (EGF-L), 8 constant and up to 9 alternatively
spliced fibronectin type-III (FNIII) repeats and a C-terminal fibrinogen-like globular
domain (Fig 3). In human TNC, FNIII 1-8 are conserved whereas the 9 additional
repeats (A1-D) are alternatively spliced in or out providing up to 511 theoretical
isoforms (K. Midwood et al. 2016).
The heptad repeats near the N-terminus can accommodate trimerization of the
monomers. Subsequently, 2 trimers can assemble together and give rise to a
hexamer. This hexameric form of TNC is the reason why TNC was initially named
“hexabrachion”. Due to its multimodular structure described previously, TNC is able
to interact with a plethora of binding partners (Fig 3). These include other ECM
molecules like fibronectin and perlecan as well as cell surface located receptors such
as integrins and toll-like receptor 4 (TLR4) (Orend and Chiquet-Ehrismann 2006; K.
Midwood et al. 2009)
TNC is highly expressed during embryonic development and its expression is
restricted in the adult organs to some connective tissues like tendons, stem cell
niches and reticular fibers in lymphoid organs. Furthermore, it is also expressed de
novo during wound healing, mammary gland involution or in pathological conditions
such as chronic inflammation and cancer. High expression of TNC in several types of
cancer has been associated with poor prognosis (K. Midwood et al. 2016). These
include melanoma, lung, head and neck and colorectal cancers respectively (Parekh
et al. 2005; Wang et al. 2010; Emoto et al. 2001). Breast cancer is of no exception to
32
this. It has been observed in both animal models and breast cancer patients that
there is a particularly high expression of TNC in the stroma as well as at the invasive
fronts of the tumor (Mackie et al. 1987). This high TNC expression is associated with
poor metastasis-free and overall survival in breast cancer patients (Oskarsson et al.
2011).
Figure 3: Structure of TNC and binding partners. TNC is a multimodular
extracellular matrix glycoprotein whose monomer is composed of an oligomerization
domain, epidermal growth factor-like repeats (EGF-L), fibronectin type-III (FNIII)
repeats, and a fibrinogen like domain. Binding sites for interacting partners are shown
(Van Obberghen-Schilling et al. 2011).
Expression of TNC in the TME can be regulated by various pro- and anti-
inflammatory cytokines such as IFNγ, TNFα and interleukins (IL-1/4/6/8/13) (Orend
and Chiquet-Ehrismann 2006). Growth factors such as EGF, TGFβ and CTGF and
stress conditions such as hypoxia, mechanical stress and reactive oxygen species
(ROS) can also induce TNC expression (Gebb and Jones 2003; Chiquet, Sarasa-
Renedo, and Tunç-Civelek 2004; Yamamoto et al. 1999). Interestingly, while TNC
has been described to induced by Ras/MAP kinase and Wnt signaling respectively,
these signaling pathways can in turn drive TNC expression in the TME (Maschler et
al. 2004; Beiter et al. 2005; Ruiz et al. 2004). Moreover, some transcription factors
like NFκB and c-Jun have been reported to induce the transcription of the TNC gene
(Orend and Chiquet-Ehrismann 2006). Whereas many triggers exist to induce TNC
33
only a few mechanism are known to downregulate TNC expression which include the
transcription factor GATA and anti-inflammatory corticosteroids (Tucker and Chiquet-
Ehrismann 2009).
1.2.2. TNC sources in the TME
As described previously, most solid tumors are accompanied by a high expression of
TNC. Yet, this TNC expression is not homogeneously distributed in the TME. For
instance, grade IV glioblastomas exhibited high TNC expression in perivascular
regions (Herold-Mende et al. 2002). On the other hand, in breast tumors and
melanomas, TNC is highly expressed at the invasive fronts in the primary tumor as
well as at the metastatic site (Fig 4) (Mackie et al. 1987; Ilmonen et al. 2004;
Oskarsson et al. 2011). This heterogeneous distribution suggests that TNC can be
expressed by different compartments of the TME. Indeed, TNC can be expressed by
both the stromal and the tumor cells during the different stages of tumor
development.
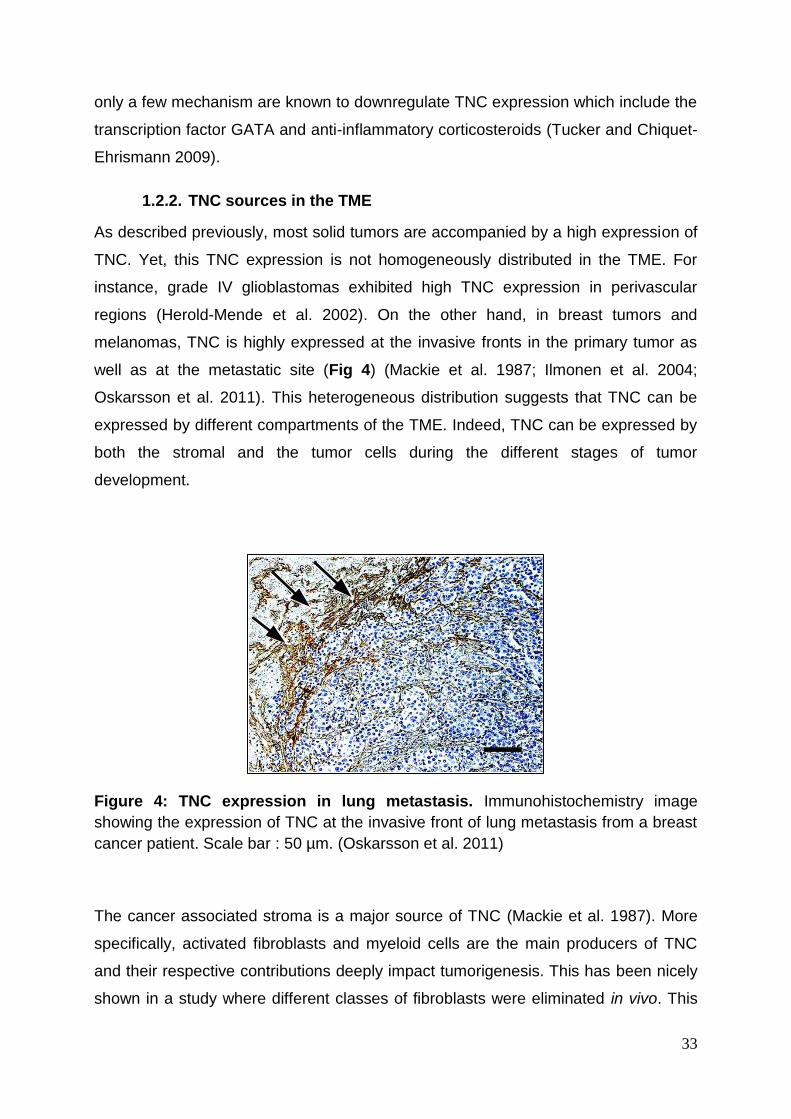
Figure 4: TNC expression in lung metastasis. Immunohistochemistry image
showing the expression of TNC at the invasive front of lung metastasis from a breast
cancer patient. Scale bar : 50 µm. (Oskarsson et al. 2011)
The cancer associated stroma is a major source of TNC (Mackie et al. 1987). More
specifically, activated fibroblasts and myeloid cells are the main producers of TNC
and their respective contributions deeply impact tumorigenesis. This has been nicely
shown in a study where different classes of fibroblasts were eliminated in vivo. This
34
study showed that whereas αSMA positive cells were not expressing TNC in tumors,
it was fibroblast-specific protein 1 (FSP1) positive cells mostly CAFs and myeloid
cells that expressed TNC (O’Connell et al. 2011). In a breast cancer orthotopic
grafting model, where 4T1 cells were injected into TNC wildtype and TNC knock out
mice, less metastatic nodules were found in absence of TNC from the stroma. In
addition, depletion of S100A4+ stromal cells (mainly fibroblasts) significantly
decreased the level of expression of TNC at the metastatic site (O’Connell et al.
2011). Together these data suggest that TNC produced by S100A4+ stromal/myeloid
cells are important for metastatic colonization. Another source of TNC in the TME is
the endothelial cells. In physiological conditions, resting endothelial cells do not
express TNC. However, in tumors, angiogenic tumor cells highly induce expression
of TNC (Zagzag et al. 1996; Seaman et al. 2007; Langlois et al. 2014). Moreover,
high perivascular expression of TNC in high grade brain tumors has been correlated
with glioma recurrence in patients, suggesting that TNC impacts tumor progression
through angiogenesis (Herold-Mende et al. 2002) as recently also shown in a
stochastic tumor model (Langlois et al. 2014; Saupe et al. 2013). TNC has a janus
function on endothelial cells where a direct contact with TNC causes cell rounding
and anoikis (involving inhibition of YAP and prosurvival factors), yet this interaction
also triggers endothelial cells to upregulate Wnt signaling (through inhibiting DKK1)
and express high levels of FN that is assembled into a protective pericellular FN
network coat around the TNC-exposed endothelial cells (Radwanska et al., 2017).
Besides the stromal compartment, tumor cells themselves may express high levels of
TNC. This has been described in several studies and in different types of tumors
including breast cancer, colon cancer and oral squamous cell carcinoma (T. Yoshida
et al. 1997; Hanamura et al. 1997; Hindermann et al. 1999). In addition,
immunohistochemical analysis and in situ hybridization carried out on human breast
cancers revealed that TNC is expressed by both stromal cells and tumor epithelial
cells and that tumor cell-derived TNC correlates with worsened survival (Ishihara et
al. 1995). The elevated expression of TNC during tumor progression certainly
impacts the different cellular components of the TME and this will be discussed in
section 1.2.4.
35
1.2.3. TNC as ligand for cellular receptors
The main interactions between TNC and cells in the TME are mediated through
integrins. They are a large family of cell surface receptors that bind to ECM
molecules (Desgrosellier and Cheresh 2010). The interaction of integrins with ECM
molecules gives rise to a number of intracellular signaling pathways involved in
important cell functions like proliferation, differentiation and motility. The repertoire of
integrins present at the surface of a particular cell will characterize the cellular
response to a given matrix molecule. Likewise, TNC has been described to bind to
several integrins such as α9β1, αVβ3 and α7β1 (Fig 5). For instance,
immunohistochemical analyses of primary gastric and colorectal cancers have shown
a co-localization of α9β1 integrin and TNC at the invasive fronts of the tumors
(Gulubova and Vlaykova 2006). In an orthotopic breast cancer model, α9β1 integrin
expressed by tumor cells promoted tumor growth and lymph node metastasis (Ota et
al. 2014). Interestingly, in basal-like breast cancer patients, the only breast cancer
subtype reported to express α9β1 integrin, the expression of the integrin was
correlated to poor overall survival (Allen et al. 2011). Moreover, while plating of
SV480 cells expressing α9β1 or αvβ3 integrins on recombinantly expressed TNC
FNIII3 domain molecules resulted in an enhanced cell proliferation, treatment of
tumor-derived cell lines with an αvβ3 antagonist showed an increase in the apoptotic
index (Yokosaki et al. 1996; Taga et al. 2002). Integrin αvβ3 is also known to be
expressed in various cell types including epithelial cells, fibroblasts and endothelial
cells, suggesting the possibility that interaction of these cells with TNC in the TME
could be mediated by these integrins (Toshimichi Yoshida, Akatsuka, and Imanaka-
Yoshida 2015). In addition to integrins, TNC modulates syndecan-4 function either by
competition or by binding (at least to a recombinantly expressed FNIIIA2 TNC
domain molecule) thereby affecting cell adhesion and matrix contraction (K. S.
Midwood et al. 2004; W. Huang et al. 2001; Orend et al. 2003). Other binding
partners described for TNC are the receptor-type protein tyrosine phosphatase beta
zeta (RPTPβζ), contactin, CSPG5 and glypican (K. Midwood et al. 2011) and the
ganglioside GM1(Angelov et al. 1998).
36
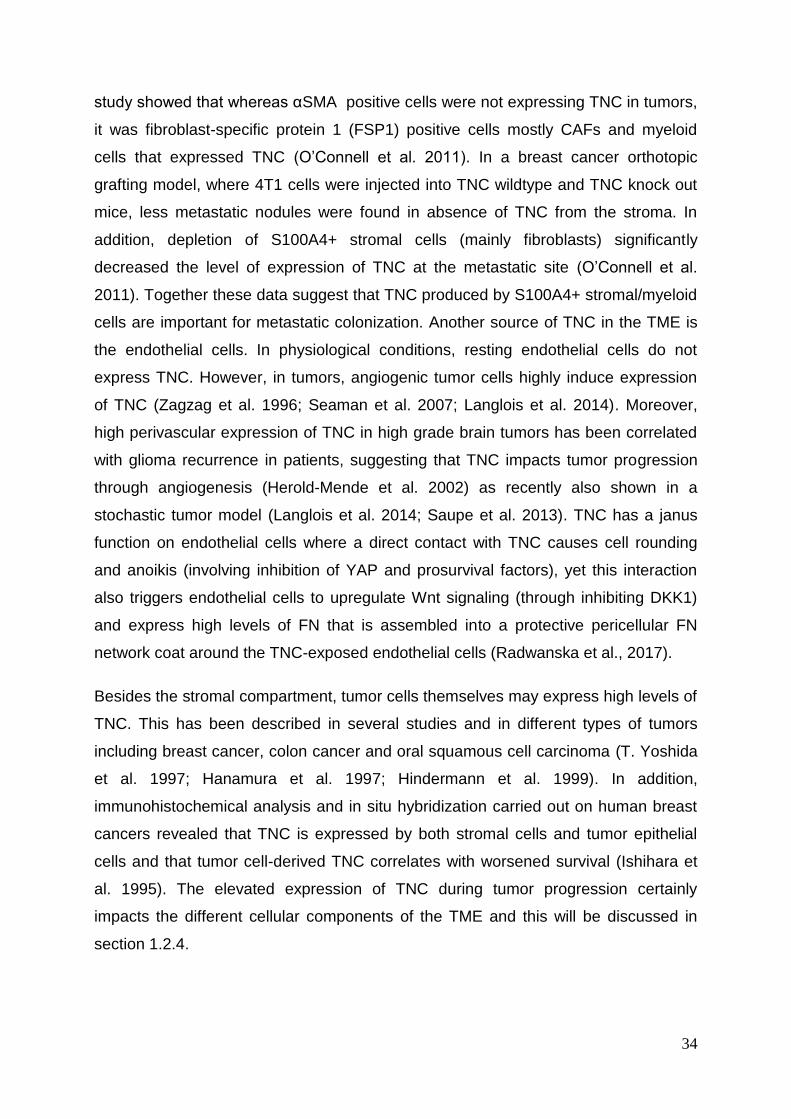
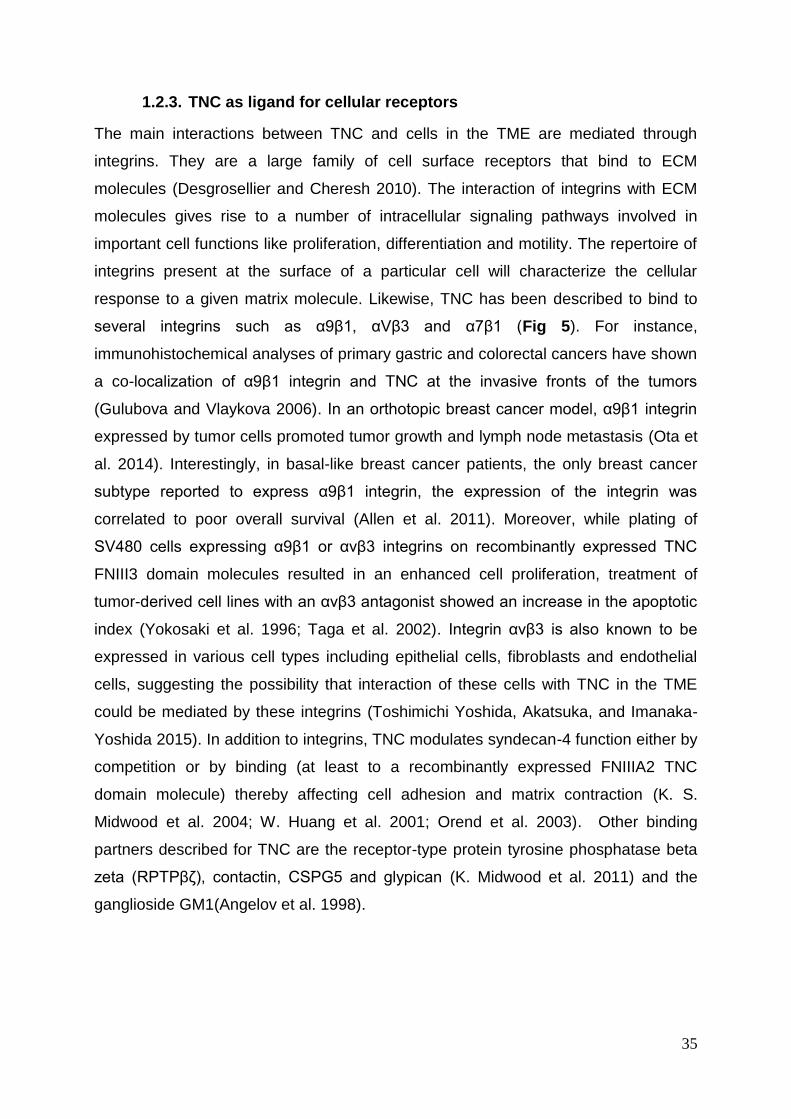
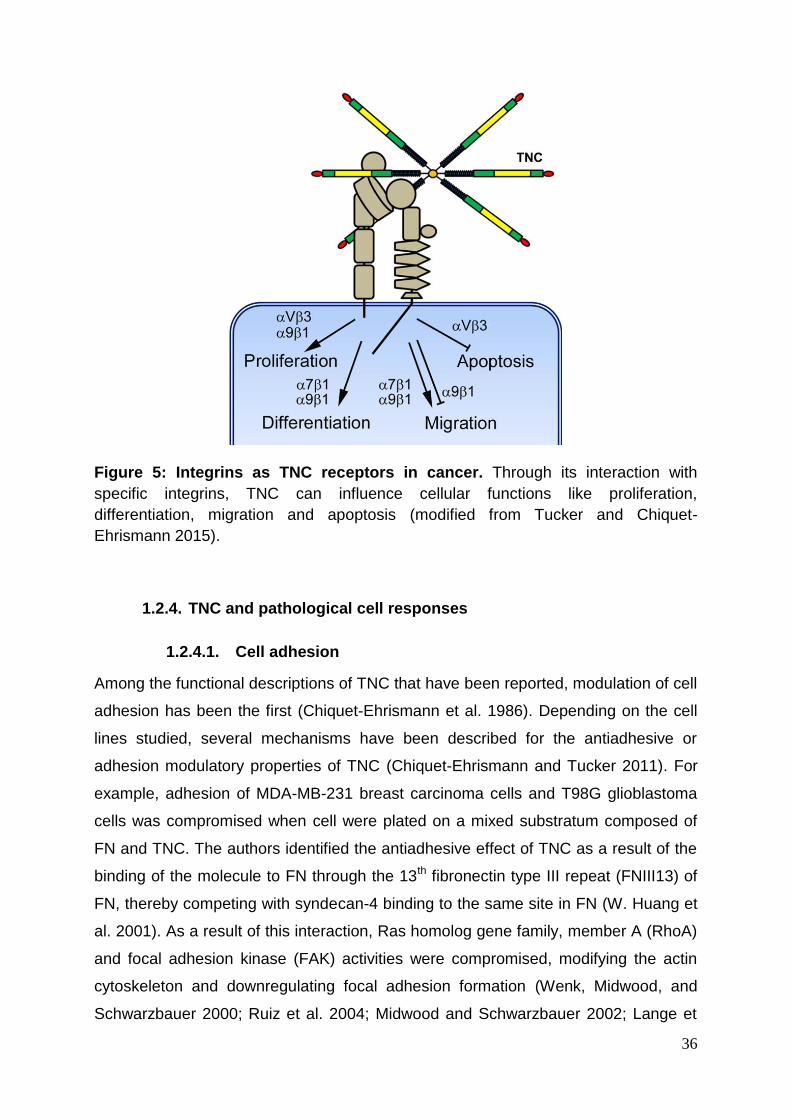
Figure 5: Integrins as TNC receptors in cancer. Through its interaction with
specific integrins, TNC can influence cellular functions like proliferation,
differentiation, migration and apoptosis (modified from Tucker and Chiquet-
Ehrismann 2015).
1.2.4. TNC and pathological cell responses
1.2.4.1. Cell adhesion
Among the functional descriptions of TNC that have been reported, modulation of cell
adhesion has been the first (Chiquet-Ehrismann et al. 1986). Depending on the cell
lines studied, several mechanisms have been described for the antiadhesive or
adhesion modulatory properties of TNC (Chiquet-Ehrismann and Tucker 2011). For
example, adhesion of MDA-MB-231 breast carcinoma cells and T98G glioblastoma
cells was compromised when cell were plated on a mixed substratum composed of
FN and TNC. The authors identified the antiadhesive effect of TNC as a result of the
binding of the molecule to FN through the 13th fibronectin type III repeat (FNIII13) of
FN, thereby competing with syndecan-4 binding to the same site in FN (W. Huang et
al. 2001). As a result of this interaction, Ras homolog gene family, member A (RhoA)
and focal adhesion kinase (FAK) activities were compromised, modifying the actin
cytoskeleton and downregulating focal adhesion formation (Wenk, Midwood, and
Schwarzbauer 2000; Ruiz et al. 2004; Midwood and Schwarzbauer 2002; Lange et
37
al. 2007). The antiadhesive properties of TNC can also be modulated through
external signaling pathways involving lysophosphatidic acid receptor (LPAR),
platelet-derived-growth factor receptor (PDGFR) and endothelin receptors (Lange et
al. 2007; Midwood et al. 2016). Since adhesion modulation is a known mechanism to
impact cellular functions like proliferation and migration, TNC has also been widely
investigated in this context.
1.2.4.2. Cell proliferation
In many malignant carcinomas, TNC expression co-localizes with Ki67 positively
stained cells, suggesting that TNC could promote cell proliferation (Vollmer 1997).
More specifically in breast cancer patients, high TNC expression was correlated to a
high proliferation index in the tumor cells (Tsunoda et al. 2003). Cell culture
experiments also demonstrated that TNC induces cell proliferation in several cancer
cell lines, including MDA-MB-231 cells, and smooth muscle cells (Chiquet-Ehrismann
et al. 1986; W. Huang et al. 2001; Orend and Chiquet-Ehrismann 2006). Through
binding to the FNIII3 repeat of FN, TNC stimulates proliferation in tumor cells. Yet,
not all cells respond in the same way to TNC. For instance, normal fibroblasts
displayed proliferation inhibition in presence of TNC (Crossin 1991; Orend et al.
2003).
1.2.4.3. Cell migration and invasion
TNC has been described to induce cell migration in several cell types. These include
tumor cells (Orend and Chiquet-Ehrismann 2006; Saupe et al. 2013; Tavazoie et al.
2008), fibroblasts (Wenk, Midwood, and Schwarzbauer 2000, 200; Tamaoki et al.
2005) and endothelial cells (Castellon et al. 2002; Rupp et al. 2016). The
mechanisms through which TNC mediates cell migration and subsequent invasive
properties are varied. For instance, in presence of TNC, pancreatic cancer cells
displayed enhanced migration and invasion through the JNK/c-Jun signaling pathway
(Cai et al. 2017). In osteosarcoma, in vitro and in vivo models, TNC was shown to
promote tumor cell migration and metastasis formation by acting on the actin
cytoskeleton through integrin α9β1-mediated yes activating protein (YAP) inhibition
(Sun et al. 2017). Moreover, TNC has been described to promote breast cancer cells
(MCF-7, T47D, MDA-MB-231 and MDA-MB-468) invasion through upregulation of
MMPs and most notably MMP-13 (Hancox et al. 2009). Interestingly, the addition of
38
TNC to MCF-7 cells induced an EMT-like phenotype in the cells, accompanied by the
delocalization of E-cadherin and β-catenin from the cell-cell contacts to the cytoplasm
(Nagaharu et al. 2011). The TNC-induced EMT-like phenotype also correlated with
FAK phosphorylation by SRC resulting in a loss of cell-cell adhesion and increased
migration. Here, binding to αVβ6 and αVβ1 integrins appears to mediate the pro-
migratory effect of TNC (Katoh et al. 2013).
39
1.3. Cancer immunity
Cancer is characterized by the unrestricted proliferation of cells accompanied by the
accumulation of genetic alterations (Tian et al. 2011). These mutations generate neo-
antigens at the surface of the malignant cells that can be detected by the immune
system. Though widely accepted now, the establishment of the cancer immunity
concept was the fruit of several age-old scientific contributions. The recognition of
malignant cells by the immune cells was first postulated by Paul Ehrlich more than a
century ago (Ehrlich 1909). He stated that the “organism’s positive mechanisms”
could restrain aberrant cells from becoming unusually common. After the first clear
demonstrations of the capacity of tumor cells to elicit an immune response by Gross
and Foley in 1953, notably with methylcholantrene-induced tumors, Thomas and
Burnet formulated the immune surveillance theory (Foley 1953; M. Burnet 1957; F.
M. Burnet 1970; Ribatti 2017). The authors hypothesized that neo-antigens at the
surface of malignant cells could induce an immune response against the tumor cells.
1.3.1. The Cancer-Immunity cycle
In order to mediate an effective killing of tumor cells, the antitumor immune response
exerts a series of stepwise events that Chen and Mellman have called the Cancer-
Immunity Cycle (Fig 6) (Chen and Mellman 2013). The first step that initiates this
cycle is the release of neo-antigen by the tumor cells as a result of an accumulation
of mutations in the cell’s genome. These tumor associated antigens (TAA) are then
captured and processed by the antigen presenting cells (APC), mainly dendritic cells
(DCs), and taken up to the lymphoid organs to be presented to the T cells through
the MHC class I/II molecules. This gives rise to the priming and activation of the
effector T cells directed against the cancer-specific antigens. This is a step of prime
importance since it will determine the nature of the immune response to be triggered.
Once activated, the effector T cells migrate towards their targeted tumor antigens
through the blood stream to the tumor site. The immune cells then infiltrate the tumor
bed and recognize the tumor cells through interaction of the T cell receptor (TCR)
with the tumor antigens towards which the immune reactions have been initiated.
Upon recognition of their targeted cells, the T cells mediate tumor cell killing through

40
secretion of cytokines and enzymes like granzyme B and perforin. Killing of the target
cells also generates more TAA in the TME which feeds back the loop of the Cancer-
Immunity Cycle.
Figure 6: Cancer-Immunity Cycle. T cell-mediated killing of tumor cells happens
through a cyclic process starting by the release of tumor associated antigens (TAA).
These antigens are taken up by dendritic cells (DCs) and presented to the T cells for
priming. The activated cells then migrate to the tumor cells and kill the target cells
(Chen and Mellman 2013).
1.3.2. The cancer immunoediting concept
In 2001 a conclusive experiment carried out in Robert Schreiber’s lab demonstrated
that tumors formed in mice lacking an intact immune system were more immunogenic
than tumors generated from immune competent hosts (Shankaran et al. 2001). This
brought out the notion that the immune system not only protects the host against
41
tumor formation through the process of cancer immunosurveillance but can also
modulate the immunogenicity of the malignant cells. This was the basis of the cancer
immunoediting concept (Dunn et al. 2002; Schreiber, Old, and Smyth 2011).
The cancer immunoediting concept postulates that tumor development in an
immunocompetent TME is the result of 3 distinct phases called “elimination”,
“equilibrium” and “escape”, respectively. In the elimination phase, the developing
tumor cells undergo killing through natural killer (NK) and T-cells (Fig 7). Tumor cells
that are able to survive the elimination phase enter into a state of functional
dormancy, the equilibrium phase (Mittal et al. 2014). Despite not being able to
eradicate the malignant cells completely, the immune system is able to restrict their
expansion and subsequent tumor progression. This has been shown to be mediated
by the adaptive immune system involving IL-12 and IFNγ (Koebel et al. 2007).
Being at that stage under persistent selection pressure against the immune
response, the malignant cells evolve to a less immunogenic phenotype and proceed
to the escape phase. Tumor cell escape can happen through different mechanisms
including decreased immune recognition and increased resistance to immune cell-
mediated killing (Vesely et al. 2011; Dunn et al. 2002). For instance malignant cells
can establish an immunosuppressive state in the TME through secretion of cytokines
like TGFβ, induction of high infiltration of regulatory T cells (Treg) and myeloid-derived
suppressor cells (MDSCs) and expression of negative costimulatory molecules such
as the Programmed death-ligand 1 (PD-L1) (Dunn, Old, and Schreiber 2004;
Reiman et al. 2007; Schreiber, Old, and Smyth 2011).
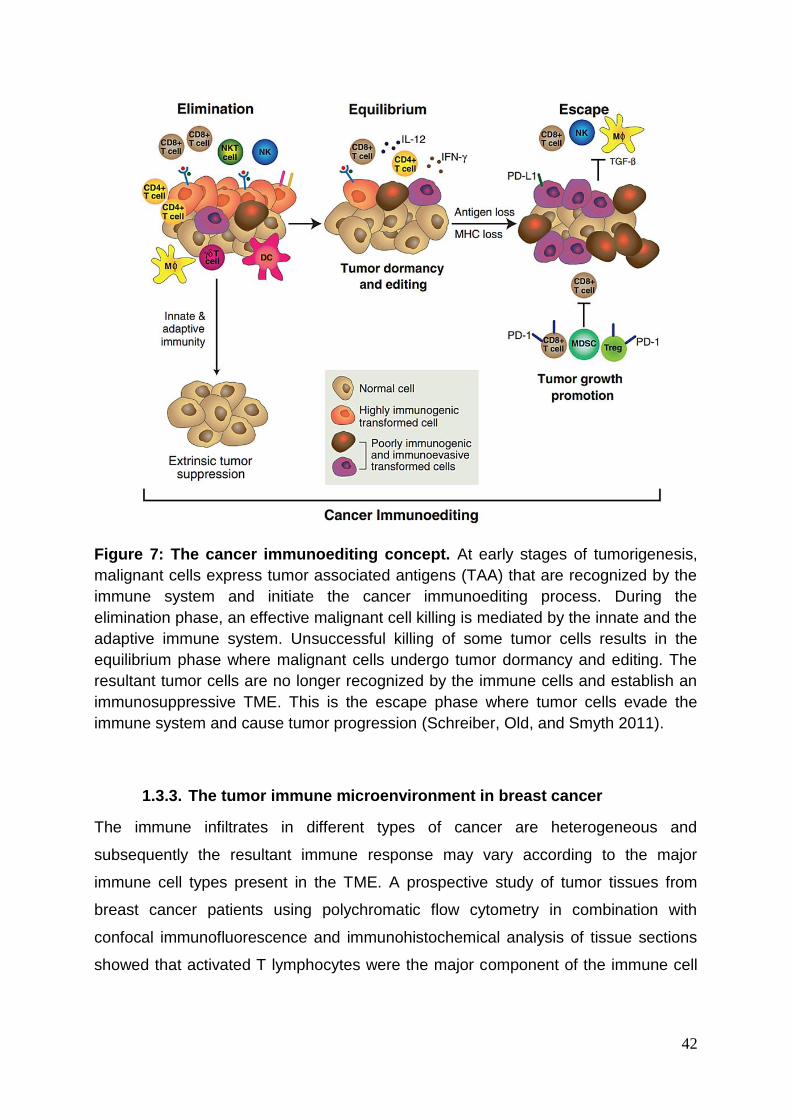
42
Figure 7: The cancer immunoediting concept. At early stages of tumorigenesis,
malignant cells express tumor associated antigens (TAA) that are recognized by the
immune system and initiate the cancer immunoediting process. During the
elimination phase, an effective malignant cell killing is mediated by the innate and the
adaptive immune system. Unsuccessful killing of some tumor cells results in the
equilibrium phase where malignant cells undergo tumor dormancy and editing. The
resultant tumor cells are no longer recognized by the immune cells and establish an
immunosuppressive TME. This is the escape phase where tumor cells evade the
immune system and cause tumor progression (Schreiber, Old, and Smyth 2011).
1.3.3. The tumor immune microenvironment in breast cancer
The immune infiltrates in different types of cancer are heterogeneous and
subsequently the resultant immune response may vary according to the major
immune cell types present in the TME. A prospective study of tumor tissues from
breast cancer patients using polychromatic flow cytometry in combination with
confocal immunofluorescence and immunohistochemical analysis of tissue sections
showed that activated T lymphocytes were the major component of the immune cell

43
infiltrate in the tumor (Ruffell et al. 2012). Interestingly, when compared to normal
breast tissue, infiltration of cells from the myeloid lineage was largely restricted.
1.3.3.1. Tumor infiltrating lymphocytes (TILs)
A major determinant of the successful control of the tumor expansion is the capacity
of the T cells to infiltrate the tumor. The correlation between high levels of TILs in
breast cancer and better prognosis in early stage breast cancer patients has now
been confirmed in large cohorts of patients (Ali et al. 2014; Whitford, George, and
Campbell 1992; Baxevanis et al. 1994). Furthermore, it has recently been shown that
high levels of TILs predict response of breast cancer patients to neoadjuvant
chemotherapy (Denkert et al. 2018). In this same study, increased TILs concentration
in HER2-positive and triple negative breast cancers (TNBC) was associated with
better patient’s overall survival. On the contrary, in luminal-HER2-negative breast
cancer, high T cell infiltration was correlated to worsened survival. These data
suggest that apart from the concentration of TILs, the biology of the immune infiltrate
needs particular attention.
TILs include essentially CD8+ cytotoxic T lymphocytes (CTLs) and CD4+ T helper
(Th) cells. CTLs are one of the main effectors of the antitumor immune response.
Upon activation of the TCR, they mediate tumor cells killing through release of
granzymes, perforin and other cytotoxins that induce apoptosis. In a study based
upon a cohort totaling more than 12000 breast cancer patients, it has been shown
that the presence of CD8+ T cells in breast cancer tissue is associated with better
overall survival in HER2-positive (both ER-negative and ER-positive) tumors (Ali et
al. 2014). Yet, despite the presence of these effector T cells in the TME, the tumors
do not regress, suggesting inhibitory mechanisms against the T cells response. An
important mechanism is described where inhibitory checkpoints like PD-1 and
cytotoxic T-lymphocyte-associated protein 4 (CTLA4) at the surface of the
lymphocytes are upregulated and inhibit the CD8+ T cell response (Pardoll 2012).
Activation of these pathways by the tumor cells suppresses the T cell antitumor
response through inhibiting proliferation, survival and cytokine production of the T
cells. Over the last decade, these checkpoint receptors have been of major interest
and their implication in the development of novel anti-cancer therapeutics will be
discussed later.
44
CD4+ T helper cells are also a major component of the antitumor immune response.
The main subtypes of Th cells that have been described include Th1, Th2, Th17 and
Treg cells. Th1 induced pathways are mediated by secretion of IL-2, IL-12 and IFNγ to
sustain the CTLs responses. On the other side, Th2 cells secrete cytokines like IL-13
and TGFβ, favoring tumor growth through inhibition of T cell-mediated immunity
(Kalams and Walker 1998; Ellyard, Simson, and Parish 2007). It is therefore not
surprising that Th1 and Th2 responses are inversely correlated, where the Th1
pathway is associated with lower risk of disease free survival in ER-negative breast
cancer patients (Teschendorff et al. 2010). The role of Th17 cells in cancer immunity
is less well studied. Yet, accumulating evidence suggests that intratumoral Th17 cell
infiltration can be associated with both good and bad prognosis, depending on the
cancer type (Guéry and Hugues 2015). Th17-derived cytokines can stimulate Th1
responses promoting antitumor responses as well as stimulating tumor promoting
processes like angiogenesis (Numasaki et al. 2003). Finally, the function of Treg is to
maintain a balance between effective cell-mediated killing and suppression of
autoimmune responses. In assessing the clinical significance of Treg infiltrates in
breast tumors, it was shown that Treg density was higher in invasive breast
carcinomas compared to ductal carcinomas in situ (DCIS) (Bates et al. 2006). In this
same study, high Treg infiltration was correlated to shorter relapse-free survival and
overall survival of patients with invasive tumors. Moreover, it was shown in Alexander
Rudensky’s lab that breast tumor-infiltrating Tregs exhibit a different phenotype as e.g.
through upregulation of the chemokine receptor CCR8, than Tregs found in normal
tissues (Plitas et al. 2016).
1.3.3.2. Innate immune responses
Tumor-associated macrophages (TAMs) have been associated with both antitumor
and pro-tumor responses (Allavena et al. 2008). This can be explained by the
remarkable plasticity of the TAMs that can respond to the TME signal and adapt
between an M1 and M2 phenotype (Murray et al. 2014; Biswas and Mantovani 2010).
M1 macrophages have been described as pro-inflammatory cells which was
accompanied by secretion of factors like IL-12, nitric oxide synthase 2 (NOS2) and
tumor necrosis factor α (TNFα) and to mediate Th1 responses (Allavena et al. 2008).
On the opposite, M2 macrophages have more an immunosuppressive phenotype as
they secrete high levels of IL-10 and TGFβ. M2 macrophages also suppress Th1
45
responses and promote angiogenesis. Given the high plasticity of macrophages and
the complex pool of cytokines in the TME, the clear-cut dichotomy between M1 and
M2 phenotype is probably an oversimplification.
Macrophages are recruited into tumors after activation of the colony-stimulating
factor-1 receptor (CSF-1R) by its ligands CSF1 or IL-34 (Chihara et al. 2010). In
breast cancer, high levels of CCL2 have also been described to recruit macrophages
(Qian et al. 2011; Soria and Ben-Baruch 2008). An early study looking for the clinical
impact of infiltrating TAMs in breast cancer showed that a high density of TAMs
correlated with poor disease-free survival and shorter overall survival (Leek et al.
1996). This was also associated with increased angiogenesis. Moreover, a recent
meta-analysis study covering a total of 4 541 breast cancer patients also correlated
the high density of TAMs to poor survival rates (Zhao et al. 2017). Interestingly, it was
observed that TAMs infiltration was inversely correlated to CD8+ T cells infiltration in
breast cancer patients and that a CD68low/CD4low/CD8high signature correlated with
better response to neoadjuvant chemotherapy (DeNardo et al. 2011).
In addition to macrophages, NK cells are key players of the innate immune response
in the TME. They are effector lymphocytes that can drive direct tumor cell killing
without any previous sensitization (Herberman, Nunn, and Lavrin 1975). Similarly to
CTLs, NK cells mediate target cell killing through secretion of perforin, granzymes
and TNFα (Trapani and Smyth 2002). Over the last 20 years, several studies have
put forward the fact that the density of NK cells infiltrating solid tumors such as
colorectal carcinoma, gastric carcinoma and squamous cell lung carcinoma
correlates with better prognosis for the patients (Coca et al. 1997; Takeuchi et al.
2001; Villegas et al. 2002). A recent study suggests that poor infiltration of NK cells
into breast tumor tissue might be predictive for chemotherapy treatment failure
(Mariel et al. 2018). Indeed in this study, tumor samples resistant to neoadjuvant
chemotherapy displayed a decrease in gene expression of cell-surface receptors
related to NK cells like killer cell lectin like receptor C 1-4 (KLRC1-4).
Dendritic cells (DCs) are a critical heterogeneous group of leukocytes that ensures
the link between the innate and the adaptive immunity. They are the most effective
antigen presenting cells (APCs) of the immune system and ensure effective T cell
activation through interaction of CD40 expressed on DCs and its cognate ligand
46
expressed on T cells (Turnis and Rooney 2010; Nencioni et al. 2008). During tumor
progression, the previous mechanisms can be hijacked in several ways like reduced
uptake and processing of antigen and lowered expression of costimulatory molecules
leading to a poor T cell activation (Ma et al. 2013). For instance, in a breast cancer
model it has been shown that T cells interact with DCs at the margins of the tumor
but yet they are not activated properly (Engelhardt et al. 2012). Furthermore, a
previous study assessing the immunological function of DCs in breast cancer patients
pointed out that peripheral and lymph nodal DCs were unable to induce a proper T
cell response due to a lowered expression of the a major histocompatibility class II
molecule (MCH II) as well as the costimulatory molecule CD86 (Satthaporn et al.
2004). Due to the recurring inefficient activation of T cells by DCs in several types of
cancer, one strategy has been to develop DCs vaccines (Lee et al. 2002). Briefly, this
consists of taking immature DCs from the patient and putting them in contact with the
TAAs ex vivo, ensuring a proper processing and presentation of the TAA by the DCs.
The latter are then injected back to the patient to elicit an efficient T cell response. A
pilot study of the use of DCs vaccines in breast cancer patients displayed a
successful CTLs response that lasted for more than 6 months (Brossart et al. 2000).
Similar results were observed in a larger cohort of ER/PR double negative breast
cancer patients (Qi et al. 2012).
1.3.3.3. The immune contexture
As described previously, each component of the immune system plays an important
role either in tumor surveillance or in tumor progression. Up to now, the role of each
immune subtype has been addressed separately. However, all these cells operate in
the same TME, interacting dynamically with the tumor cells, and the ECM
surrounding them. Putting back all these functional immune cells in the context of the
TME is a concept that has been coined “immune contexture” (Fridman et al. 2012).
Fridman and colleagues defined the immune contexture as the density, the
composition, the functional state and the organization of the leukocyte infiltrates in
the tumor. We can easily imagine that together with the total number of infiltrating
leukocytes, the representation of each cellular subtype with their respective functional
state will determine the net resulting effect on the proliferating tumors cells. However
the localization of the immune infiltrates is also of prime importance. For instance a
comprehensive analysis of a large cohort of colorectal cancers revealed that the
47
tumors were highly infiltrated with memory T cells and that this infiltration correlated
with better disease-free survival as well as overall survival (Pagès et al. 2005). Again
in colorectal cancer, it was observed that this high infiltration of T cells was not
homogeneous all around the tumor but in fact was preferentially localized in the
center and the invasive margin of the tumor nest, both localizations correlating with
good prognosis (J. Galon 2006). The immune contexture can be used not only to
predict clinical outcome in patients but also to predict response to therapies based
upon the accessibility of each cellular subtype which is applied in the so called
“immunoscore” (Fridman et al. 2012; Jérôme Galon et al. 2014, 2012; Angell and
Galon 2013).
1.3.4. Immunomodulatory properties of TNC
TNC is known to be highly induced in context of inflammation and to enhance chronic
inflammatory diseases such as rheumatoid arthritis. In this disease, TNC activated
toll like receptor 4 (TLR4) in macrophages and induced expression of several pro-
inflammatory cytokines like TNFα, IL-6 and IL-8 (Midwood et al. 2016, 2009b). A
similar effect was also seen involving TNC and integrin α9β1 (Asano et al. 2014).
Based on these and similar observations TNC is hypothesized to act as a danger
associated molecular pattern (DAMP) molecule (Goh et al. 2010; Midwood et al.
2011). Moreover, TNC is highly expressed in areas rich in CD4+ T cells and activated
DCs in the lymph nodes, suggesting a role of TNC in immunity (Chilosi et al. 1993;
Ocklind et al. 1993; Udalova et al. 2011). Several studies have shown that TNC
impact directly T cell behavior. In a bronchial asthma model using mice expressing
TNC or not, it was documented that TNC upregulates expression of IL-5 and IL-13
(Nakahara et al. 2006). This was confirmed in vitro where TNC stimulated secretion
of these cytokines as well as of IFNγ by spleen lymphocytes. In contrast, other
studies assessing the impact of TNC in vitro showed that TNC was able to block T
cell activation induced by a natural antigen or anti-CD3 antibodies co-immobilized
with FN (Rüegg, Chiquet-Ehrismann, and Alkan 1989; Hemesath, Marton, and
Stefansson 1994). This T cell inhibiting property of TNC has been mapped to the
alternatively spliced region TnFnIII A-D, with the minimum motif essential for this
activity being the TnFnIII A1A2 domains (Puente Navazo, Valmori, and Rüegg 2001).
These studies suggested a potential immunosuppressive activity of TNC, which was
further addressed by others.
48
Co-culture of TILs isolated from non-small cell lung cancer (NSCLC) with TNC
decreased significantly their IFNγ secretion capacity (Parekh et al. 2005). In a recent
study, Jachetti et al., (2015) used a prostate cancer model and observed that TNC
inhibited T-cell proliferation and IFN-γ secretion also in this model. To further
investigate the role of TNC in the interaction between cancer cells and T-cells, they
used fluorescent live cell imaging in order to visualize the interactions during the first
4 hours of co-culture of prostate cancer stem like cells and CD8 T-cells upon
silencing of TNC in the tumor cells. They observed that TNC significantly decreased
the duration of contacts between the two cell types (Jachetti et al. 2015).
Interestingly, the authors assessed whether TNC inhibits T-cell activation by blocking
the cytoskeletal organization based on the literature about TNC showing that TNC
suppresses Rho activation (Wenk, Midwood, and Schwarzbauer 2000; Woodside,
Wooten, and McIntyre 1998). It was found that the actin polymerization of T-cells was
inhibited when they were stimulated in presence of cancer cells expressing TNC or
were directly stimulated with TNC, whereas in presence of cancer cells that were
silenced for TNC, the actin polymerization was rescued in both CD4+ and CD8+ cells
(Jachetti et al. 2015). The results suggest that TNC blocks actin polymerization in
stimulated T-cells thus inhibiting their further proliferation.
Moreover, another study reported that high concentrations of TNC in glioma-
associated blood vessels inhibits migration of T-cells, resulting in an accumulation of
T cells in the peritumoral region (J.-Y. Huang et al. 2010). Silencing of TNC in glioma
cells significantly increased the transmigration rate of Jurkat cells and CD3/CD28
activated T-cells. Interestingly, this study also suggests that TNC influences the T
cells’ morphology from a rough to an amoeba-like phenotype, which was associated
with high migration.

49
2. Aims
High expression of the extracellular matrix molecule TNC correlates with worsened
metastasis-free survival in breast cancer patients (Oskarsson et al. 2011). Moreover,
expression of TNC by both stromal and cancer cells correlates with poor overall
survival (Ishihara et al. 1995). As a fact, the immune system plays an important role
in tumor progression and anti-cancer therapies. Despite some evidence for a role of
TNC in tumor immunity, there is poor mechanistic insight how TNC impacts on breast
cancer immunity, mainly due to the lack of relevant immunocompetent models.
In this thesis work, I used a novel orthotopic syngeneic breast cancer model that has
been established by former members of the laboratory. This grafting model is based
upon the stochastic MMTV-NeuNT breast cancer model (Muller et al. 1988). In this
model a constitutively active form of the rat homologue of ErbB2 (neu) is expressed
under the control of the mouse mammary tumor virus (MMTV) promoter, leading to
spontaneous breast tumor formation and lung metastasis. The NT193 breast tumor
cell line was established from a primary tumor of a MMTV-NeuNT mouse and its
expression of TNC was engineered before grafting cells into syngeneic mice
expressing or lacking the TNC protein. The resulting immunocompetent grafting
breast cancer model was used to address:
Aim 1: Identify the cellular and molecular mechanisms of the impact of TNC on
breast cancer progression.
Aim 2: Identify the role of tumor and host-derived TNC in breast tumor growth.
50
3. Manuscript
Combined action of host and tumor cell-derived Tenascin-C determines breast
tumorigenesis
Devadarssen Murdamoothoo*1, Zhen Sun*1, Ines Velázquez-Quesada*1, Claire
Deligne2, Alev Yilmaz1, William Erne1, Gérard Cremel1, Annick Klein1, Christiane
Arnold1, Fanny Wack1, Fabien Dutreux3, Nicodème Paul3, Michel Mertz1, Michael van
der Heyden1, Raphael Carapito3,4, Kim Midwood2 and Gertraud Orend1
* Equal contribution
Corresponding author : Gertraud Orend, INSERM U1109, ImmunoRhumatologie
Moléculaire (IRM), Hôpital civil, Institut d'Hématologie et d'Immunologie, 1, Place de
l'Hôpital, 67091 Strasbourg, France, phone (direct): 0033 (0) 3 68 85 39 96,
[email protected], https://u1109.wordpress.com/tumor-micro-environment/
1Université Strasbourg, INSERM U1109, MN3T and The Tumor Microenvironment
laboratory, Fédération de Médecine Translationnelle de Strasbourg (FMTS),
Strasbourg, France
2Kennedy Institute of Rheumatology, Oxford University, Oxford, UK
51
3 Laboratoire d’ImmunoRhumatologie Moléculaire, plateforme GENOMAX, INSERM
UMR_S 1109, Faculté de Médecine, Fédération Hospitalo-Universitaire OMICARE,
Fédération de Médecine Translationnelle de Strasbourg (FMTS), LabEx
TRANSPLANTEX, Université de Strasbourg, Strasbourg, France.
4 Service d’Immunologie Biologique, Plateau Technique de Biologie, Pôle de
Biologie, Nouvel Hôpital Civil, Strasbourg, France.
Keywords : tumor microenvironment, extracellular matrix, tenascin-C, CXCL12,
tumor immunity

52
3.1. Abstract
The extracellular matrix molecule tenascin-C (TNC) promotes tumor progression and
metastasis by poorly understood mechanisms. We used a novel mammary gland
tumor progression model based on a syngeneic orthotopic tumor cell grafting
approach with engineered levels of TNC in the tumor cells and the host, respectively
and, identified TNC as an important regulator of tumor growth. We document that
TNC promotes the battle between tumor regression and growth, where combined
expression of tumor cell- and host-derived TNC induces tumor cell rejection. Tumor
cell-derived TNC may elicit regression by induction of an antigen presenting
signature (APS) expressed by the host, which correlates with better breast cancer
patient survival. Tumor-cell derived TNC also triggers CXCL12 expression, thereby
causing trapping of CD8+ T cells in the surrounding TNC matrix tracks. TNC binds
CXCL12, and combined TNC/CXCL12 attracts and immobilizes CD8+ T cells.
Inhibition of the CXCL12 receptor CXCR4 causes tumor regression that is
accompanied by massive infiltration of CD8+ T cells and cell death inside the tumor
cell nests. Altogether, TNC-triggered CXCL12 signaling may dampen CD8+ T cell
function where physical trapping of CD8+ T cells in the TNC matrix may have
implications for immune cell therapies. Our results and new tumor model, offer novel
opportunities for preclinical cancer research and therapy of cancer patients by
triggering the “good” and blocking the “bad” actions of TNC. In particular, overcoming
the immune suppressive action of TNC, through inhibition of CXCR4, could be a
useful approach.
53
3.2. Introduction
The extracellular matrix (ECM) molecule tenascin-C (TNC) is a prominent component
of the tumor microenvironment (TME) and is highly expressed in tumor tissue
(Midwood et al. 2016). TNC plays multiple roles in cancer progression, as recently
demonstrated in a stochastic pancreatic neuroendocrine tumor (PNET) model with
abundant and no TNC. TNC was found to enhance survival, proliferation, invasion,
angiogenesis and lung metastasis (Saupe et al. 2013). Also in breast cancer models,
TNC was shown to play a role in promoting metastasis lung colonization (O’Connell
et al. 2011; Oskarsson et al. 2011) (Sun et al., submitted).
Cancers are often characterized by an early inflammatory state, followed by an
immune deserted TME which is weakly immunogenic, thus enhancing cancer
progression (Teng et al. 2015; Zitvogel, Tesniere, and Kroemer 2006). The impact of
the TME and in particular its ECM on tumor immunity is poorly known. As TNC is
highly expressed in the TME, TNC may play a role in tumor immunity. Yet, only a few
models are available to address the roles of TNC in tumor immunity and so far no
model existed to address the roles of tumor cell and host-derived TNC on
tumorigenesis in an immune competent host. Recently, TNC was shown to affect
CD8+ T cells in a prostate cancer model (Jachetti et al. 2015), but how TNC affects
CD8+ T cells in vivo is unknown. The possibility that TNC plays a role in tumor
immunity is supported by its role as a danger associated molecular pattern (DAMP)
molecule in other pathological conditions such as rheumatoid arthritis (RA) where
TNC is highly expressed and aggravates the pathology (Midwood et al. 2009).
54
By using our novel immune competent tumor models we identified a janus role of
TNC in tumorigenesis where TNC induces an antigen-presenting-signature (APS),
thus explaining tumor rejection induced by TNC. TNC also generates an immuno-
tolerogenic TME by upregulation of CXCL12 and trapping CD8+ T cells, thereby
promoting tumor growth. The balance between these two actions of TNC may largely
impact tumor growth. Both mechanisms offer novel targeting opportunities as high
expression of the antigen-presenting-signature APS correlates with better survival of
breast cancer patients. On the contrary, blocking CXCL12 signaling caused tumor
regression which could be suitable in treatment of human cancer patients.
55
3.3. Results
The syngeneic NT193 orthotopic grafting model phenocopies the genetic
MMTV-NeuNT model
We have established the cell line NT193 from a MMTV-NeuNT tumor (Arpel et al.
2016), and now show that NT193 cells induce a tumor that morphologically mimics
the anatomy of the genetic tumor upon orthotopic engraftment in the surgically
opened mammary gland of an immune competent female FVB mouse (Fig. S1A).
NT193 cells are a pool of mostly epithelial cells (E-cadherin+) that express low levels
of estrogen and progesterone, and persistent high levels of NeuNT (rat orthologue of
ErbB2) in cultured cells and all grafted tumors, respectively (Fig. S1B, S1C, S1E,
S1F, data not shown). Moreover, in NT193 tumors the stroma is similarly organized
into tumor matrix tracks (TMT) surrounding tumor cell nests, compared to MMTV-
NeuNT tumors (Fig. S1G). Like in other tumors, TNC is expressed together with
fibronectin (FN), laminin (LM) and collagen IV (Col IV) in parallel aligned fibrillary
networks (Spenlé et al. 2015). We have previously shown that NT193 tumor cells
spontaneously metastasize to the lung (Sun et al., submitted), thus the NT193
grafting model mimics the genetic model anatomically and functionally.
The cellular source of TNC impacts tumor growth
To address the contribution of tumor cell-derived TNC, we knocked down (KD) TNC
in NT193 cells by shRNA technology (Fig. S1D) and determined cell multiplicity in
culture. No difference was noted between control NT193 cells and TNC KD cells
(Fig. S2A). We already demonstrated that the TNC KD is preserved in vivo as NT193
shTNC cell-derived tumors express very little TNC (Sun et al., submitted). We
previously noticed that all end stage tumors had a similar volume independent of
56
TNC expression. In contrast, we found that host-derived TNC promotes lung
metastasis (Sun et al., submitted) suggesting that the cellular origin of TNC may
impact tumor progression. Now we wanted to know whether host and/or tumor cell-
derived TNC influenced the tumor growth kinetics. Therefore, we engrafted NT193
shC (sh control) and shTNC cells into a wildtype (WT) or TNC knockout (TNCKO)
host and determined the tumor growth over 11 weeks. We observed that all engrafted
cells induced tumors that grew exponentially in a TNCKO host similar to a WT host,
except for shC cells (Fig. 1A, B). These cells were completely rejected after 28 days
in half of the WT mice and shrank to a still palpable size in the other half of mice (Fig.
1B, S2B). The latter group of tumors started to regrow after 6 weeks and reached a
comparable volume as all other tumors at the end of the experiment (Fig. 1B, S2E).
Interestingly, neither shC cells were rejected in a TNCKO host, nor did shTNC cells
experience regression in a WT host (Fig. 1A, B). These observations suggest that
the cellular source of TNC matters and that combined expression of host- and tumor
cell-derived TNC is necessary to trigger tumor cell rejection. We used nude mice,
lacking B and T cells and, naturally expressing TNC, for engraftment and observed
no rejection of shC cells, suggesting that through B and/or T cells TNC may impact
tumor growth (Fig. S2C).
The observed tumor volumes may be due to a difference in apoptosis and/or
proliferation which we determined by tissue staining for cleaved caspase 3 (Casp3)
and Ki67, respectively. Indeed, apoptosis was highest and lowest in tumors of a WT
host engrafted with shC cells (WT/shC) at 3 (early stage) and 11 weeks (late stage),
respectively (Fig. 1C-F, Fig. S2F). Proliferation was slightly higher in WT/shC tumors
compared to TNCKO/shC (Fig. 1G-J, Fig. S2G). Thus, tumor cell-derived TNC
promotes apoptosis right upon engraftment, yet not anymore in the end stage tumors.
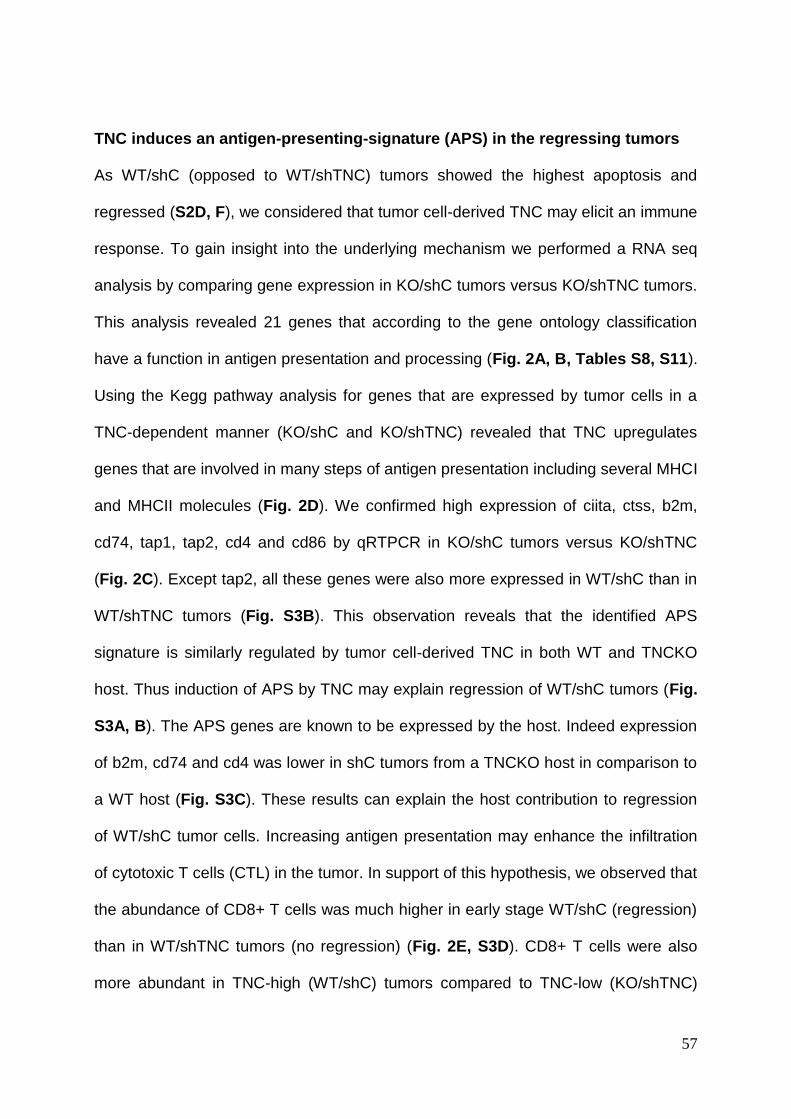
57
TNC induces an antigen-presenting-signature (APS) in the regressing tumors
As WT/shC (opposed to WT/shTNC) tumors showed the highest apoptosis and
regressed (S2D, F), we considered that tumor cell-derived TNC may elicit an immune
response. To gain insight into the underlying mechanism we performed a RNA seq
analysis by comparing gene expression in KO/shC tumors versus KO/shTNC tumors.
This analysis revealed 21 genes that according to the gene ontology classification
have a function in antigen presentation and processing (Fig. 2A, B, Tables S8, S11).
Using the Kegg pathway analysis for genes that are expressed by tumor cells in a
TNC-dependent manner (KO/shC and KO/shTNC) revealed that TNC upregulates
genes that are involved in many steps of antigen presentation including several MHCI
and MHCII molecules (Fig. 2D). We confirmed high expression of ciita, ctss, b2m,
cd74, tap1, tap2, cd4 and cd86 by qRTPCR in KO/shC tumors versus KO/shTNC
(Fig. 2C). Except tap2, all these genes were also more expressed in WT/shC than in
WT/shTNC tumors (Fig. S3B). This observation reveals that the identified APS
signature is similarly regulated by tumor cell-derived TNC in both WT and TNCKO
host. Thus induction of APS by TNC may explain regression of WT/shC tumors (Fig.
S3A, B). The APS genes are known to be expressed by the host. Indeed expression
of b2m, cd74 and cd4 was lower in shC tumors from a TNCKO host in comparison to
a WT host (Fig. S3C). These results can explain the host contribution to regression
of WT/shC tumor cells. Increasing antigen presentation may enhance the infiltration
of cytotoxic T cells (CTL) in the tumor. In support of this hypothesis, we observed that
the abundance of CD8+ T cells was much higher in early stage WT/shC (regression)
than in WT/shTNC tumors (no regression) (Fig. 2E, S3D). CD8+ T cells were also
more abundant in TNC-high (WT/shC) tumors compared to TNC-low (KO/shTNC)
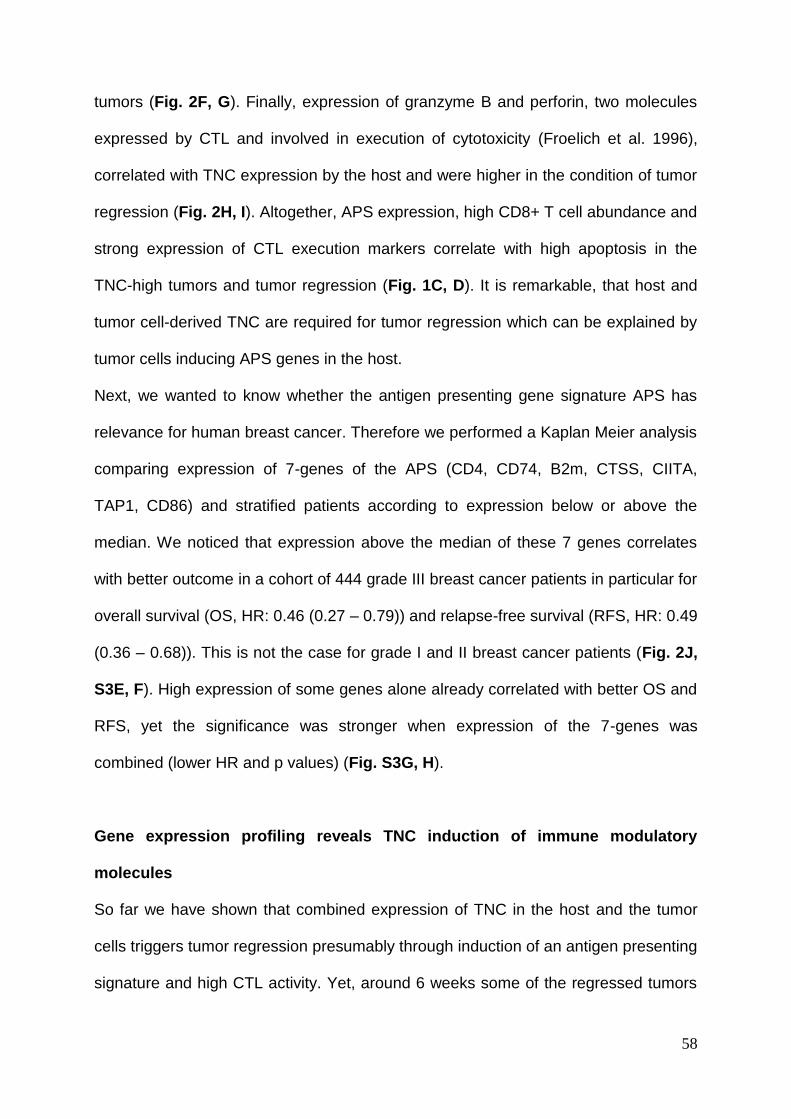
58
tumors (Fig. 2F, G). Finally, expression of granzyme B and perforin, two molecules
expressed by CTL and involved in execution of cytotoxicity (Froelich et al. 1996),
correlated with TNC expression by the host and were higher in the condition of tumor
regression (Fig. 2H, I). Altogether, APS expression, high CD8+ T cell abundance and
strong expression of CTL execution markers correlate with high apoptosis in the
TNC-high tumors and tumor regression (Fig. 1C, D). It is remarkable, that host and
tumor cell-derived TNC are required for tumor regression which can be explained by
tumor cells inducing APS genes in the host.
Next, we wanted to know whether the antigen presenting gene signature APS has
relevance for human breast cancer. Therefore we performed a Kaplan Meier analysis
comparing expression of 7-genes of the APS (CD4, CD74, B2m, CTSS, CIITA,
TAP1, CD86) and stratified patients according to expression below or above the
median. We noticed that expression above the median of these 7 genes correlates
with better outcome in a cohort of 444 grade III breast cancer patients in particular for
overall survival (OS, HR: 0.46 (0.27 – 0.79)) and relapse-free survival (RFS, HR: 0.49
(0.36 – 0.68)). This is not the case for grade I and II breast cancer patients (Fig. 2J,
S3E, F). High expression of some genes alone already correlated with better OS and
RFS, yet the significance was stronger when expression of the 7-genes was
combined (lower HR and p values) (Fig. S3G, H).
Gene expression profiling reveals TNC induction of immune modulatory
molecules
So far we have shown that combined expression of TNC in the host and the tumor
cells triggers tumor regression presumably through induction of an antigen presenting
signature and high CTL activity. Yet, around 6 weeks some of the regressed tumors
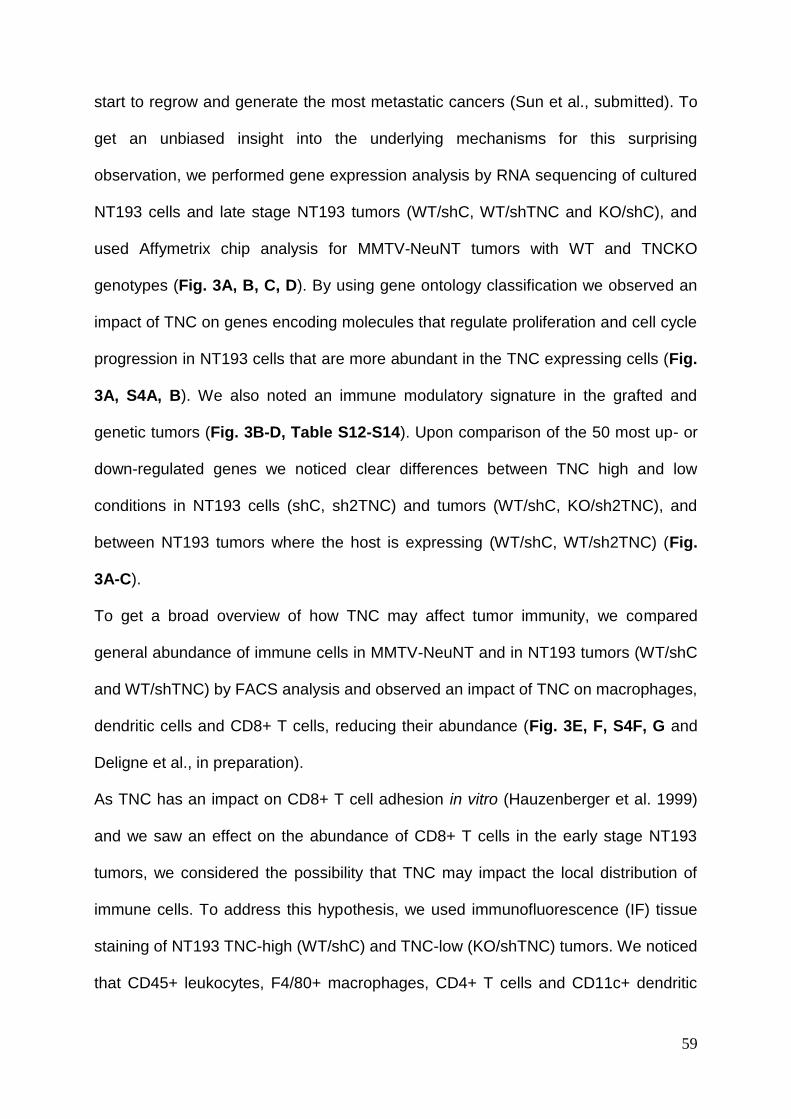
59
start to regrow and generate the most metastatic cancers (Sun et al., submitted). To
get an unbiased insight into the underlying mechanisms for this surprising
observation, we performed gene expression analysis by RNA sequencing of cultured
NT193 cells and late stage NT193 tumors (WT/shC, WT/shTNC and KO/shC), and
used Affymetrix chip analysis for MMTV-NeuNT tumors with WT and TNCKO
genotypes (Fig. 3A, B, C, D). By using gene ontology classification we observed an
impact of TNC on genes encoding molecules that regulate proliferation and cell cycle
progression in NT193 cells that are more abundant in the TNC expressing cells (Fig.
3A, S4A, B). We also noted an immune modulatory signature in the grafted and
genetic tumors (Fig. 3B-D, Table S12-S14). Upon comparison of the 50 most up- or
down-regulated genes we noticed clear differences between TNC high and low
conditions in NT193 cells (shC, sh2TNC) and tumors (WT/shC, KO/sh2TNC), and
between NT193 tumors where the host is expressing (WT/shC, WT/sh2TNC) (Fig.
3A-C).
To get a broad overview of how TNC may affect tumor immunity, we compared
general abundance of immune cells in MMTV-NeuNT and in NT193 tumors (WT/shC
and WT/shTNC) by FACS analysis and observed an impact of TNC on macrophages,
dendritic cells and CD8+ T cells, reducing their abundance (Fig. 3E, F, S4F, G and
Deligne et al., in preparation).
As TNC has an impact on CD8+ T cell adhesion in vitro (Hauzenberger et al. 1999)
and we saw an effect on the abundance of CD8+ T cells in the early stage NT193
tumors, we considered the possibility that TNC may impact the local distribution of
immune cells. To address this hypothesis, we used immunofluorescence (IF) tissue
staining of NT193 TNC-high (WT/shC) and TNC-low (KO/shTNC) tumors. We noticed
that CD45+ leukocytes, F4/80+ macrophages, CD4+ T cells and CD11c+ dendritic
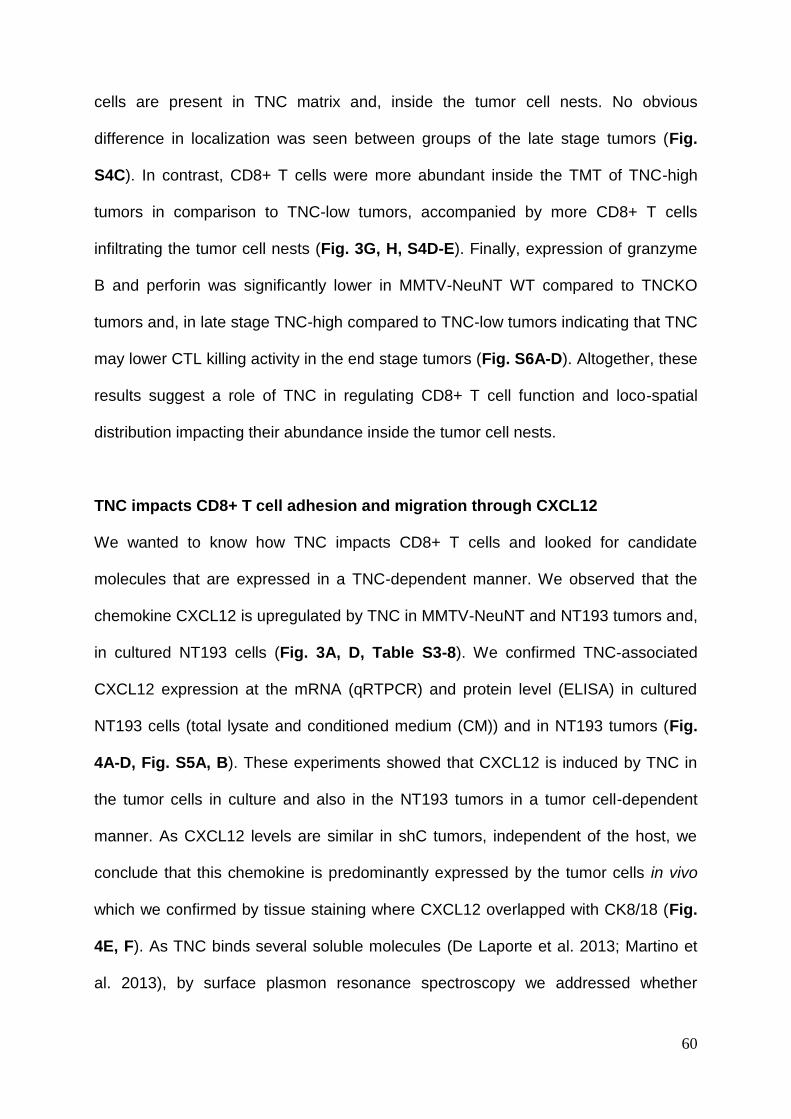
60
cells are present in TNC matrix and, inside the tumor cell nests. No obvious
difference in localization was seen between groups of the late stage tumors (Fig.
S4C). In contrast, CD8+ T cells were more abundant inside the TMT of TNC-high
tumors in comparison to TNC-low tumors, accompanied by more CD8+ T cells
infiltrating the tumor cell nests (Fig. 3G, H, S4D-E). Finally, expression of granzyme
B and perforin was significantly lower in MMTV-NeuNT WT compared to TNCKO
tumors and, in late stage TNC-high compared to TNC-low tumors indicating that TNC
may lower CTL killing activity in the end stage tumors (Fig. S6A-D). Altogether, these
results suggest a role of TNC in regulating CD8+ T cell function and loco-spatial
distribution impacting their abundance inside the tumor cell nests.
TNC impacts CD8+ T cell adhesion and migration through CXCL12
We wanted to know how TNC impacts CD8+ T cells and looked for candidate
molecules that are expressed in a TNC-dependent manner. We observed that the
chemokine CXCL12 is upregulated by TNC in MMTV-NeuNT and NT193 tumors and,
in cultured NT193 cells (Fig. 3A, D, Table S3-8). We confirmed TNC-associated
CXCL12 expression at the mRNA (qRTPCR) and protein level (ELISA) in cultured
NT193 cells (total lysate and conditioned medium (CM)) and in NT193 tumors (Fig.
4A-D, Fig. S5A, B). These experiments showed that CXCL12 is induced by TNC in
the tumor cells in culture and also in the NT193 tumors in a tumor cell-dependent
manner. As CXCL12 levels are similar in shC tumors, independent of the host, we
conclude that this chemokine is predominantly expressed by the tumor cells in vivo
which we confirmed by tissue staining where CXCL12 overlapped with CK8/18 (Fig.
4E, F). As TNC binds several soluble molecules (De Laporte et al. 2013; Martino et
al. 2013), by surface plasmon resonance spectroscopy we addressed whether
61
CXCL12 binds TNC. Indeed, we observed considerable binding of CXCL12 to TNC
with a Kd of 7,9 x 10⁻⁷ M, in a 35-fold lower range as to its receptor (Richter et al.
2014) (Fig. 4G).
As TNC can bind CXCL12, CXCL12 is induced by TNC in the tumors and CD8+ T
cell abundance and localization is regulated by TNC, we considered that TNC may
affect CD8+ T cell adhesion and migration. Therefore, we compared transwell
migration towards TNC with that towards fibronectin (FN) and collagen IV (Col IV), by
coating the ECM molecule on the lower surface of the insert, and then using
described attraction-supporting concentrations of CXCL10 (a well-known
chemoattractant (Liu et al., 2011)), CCL21 (another candidate molecule induced by
TNC, Fig. 3D) and CXCL12. We counted floating cells in the lower well by FACS or,
on the ECM coated lower surface upon paraformaldehyde (PFA) fixation (Fig. S5C-
F). These experiments revealed, that CXCL12 and CXCL10 attracted more cells
towards the lower well than CCL21 and, that TNC attracted significantly less cells to
float in the lower well than FN and Col IV (Fig. S5C, D). By measuring the cells that
were attached to the lower coated surface of the insert, TNC turned out to be the
most adhesive, in particular in combination with CXCL12 (Fig. S5E, F). Combining
the numbers of all cells, floating and adherent, TNC attracted the most cells, where
CXCL12 was highly active as chemoattractant (Fig. 4H). Altogether, these results
demonstrate that TNC/CXCL12 is attracting and binding CD8+ T cells which is in
contrast to FN or Col IV that also attract CD8+ T cell, but do not immobilize them.
As TNC increases CXCL12 expression in NT193 cells (Fig. 4C-F) we asked whether
the conditioned medium (CM) of shC cells has a similar effect as CXCL12. Therefore,
we measured floating and adherent cells in the lower well towards CM derived from
shC and shTNC cells, respectively. Indeed, only CM from shC cells attracted CD8+ T
62
cells and facilitated cell adhesion to TNC (Fig. 4I, J, S5G, H). To address whether
this effect is due to CXCL12 we used AMD3100 to block CXCR4, a receptor for
CXCL12 (Balabanian et al. 2005). Again, the cell attraction effect of the CM from shC
cells was blocked and reveals that CXCL12 is the major CD8+ T cell attracting factor
induced by TNC in the NT193 cells (Fig. 4I, J, S5G, H). This mechanism may be
relevant in tumors where tissue staining revealed co-localization of CD8+ T cells with
CXCL12 in the TNC matrix (Fig. 4F).
To address whether CXCL12 could impact tumor cell behavior in vivo we determined
expression of the two receptors CXCR4 and CXCR7 by qRTPCR in cultured tumor
cells and in the NT193 tumors. Both receptors are expressed in shC cells with
comparable levels in cultured cells (Fig. S5I). Whereas CXCR7 expression was
unaffected by TNC, CXCR4 levels were lower in shC compared to shTNC cells (Fig.
S5I). Regulation of CXCR4 by TNC was also seen in NT193 tumors where CXCR4
levels were the lowest when tumor cells expressed TNC (Fig. S5J). In 48h cell
culture experiments, shC and shTNC cell numbers increased similarly with and
without CXCL12 (Fig. S5K). Altogether, these results suggest that CXCL12 may
poorly affect the tumor cells in vivo but rather CD8+ T cells.
CXCR4 signaling regulates CD8+ T cell function in vivo
So far we have shown that TNC upregulates CXCL12, impacts CD8+ T cell adhesion
and migration and, CD8+ T cell loco-spatial distribution within the tumor. Therefore,
we considered that TNC-induced CXCL12 signaling may impact regrowth of WT/shC
tumors. We investigated this possibility by treating WT/shC tumor mice with the
CXCR4 antagonist AMD3100 starting 2 weeks after tumor cell engraftment and
measured the tumor volume over the next 5 weeks. Indeed, the tumor volume
63
immediately dropped and tumors only slowly started to regrow. This was clearly
different to control tumors that strongly expanded (Fig. 5A, B). As proliferation of
NT193 cells is not affected by CXCL12 (Fig. S5K) and CXCR4 is lowered by TNC
(Fig. S5J), AMD3100 may not directly target tumor cells but affect them through
CD8+ T cells. In support, by tissue staining for TNC and CD8, we observed that upon
AMD3100-treatment CD8+ T cells highly infiltrated the tumors which was
accompanied by many cells stained for cleaved caspase 3, indicating massive tumor
cell death (Fig. 5C-H). This resembled the early stage WT/shC tumor phenotype with
highly infiltrated CD8+ T cells and tumor regression. These results suggest that
inhibition of CXCR4 signaling overcomes the immune suppressive effect of TNC by
increasing CD8+ T cell infiltration, activating immune surveillance and triggering
tumor cell death.
In summary, our results have revealed two opposing activities of TNC in tumor
immunity (Fig. 5I), where TNC may act as “alarmin”, inducing an antigen-
presentating APS signature and triggering immune defense. In contrast, TNC may
also corrupt tumor surveillance through induction of CXCL12 causing immune
shielding of tumor cells by physically trapping CD8+ T cells in the TNC matrix. The
balance between these opposing TNC activities may determine whether tumor cells
get rejected or grow. This battle might be relevant in human breast cancer, where
high expression of the antigen presenting APS signature correlates with better
survival.
64
3.4. Discussion
Our study provides mechanistic insight in how TNC impacts tumor growth. TNC
modulates immunity and in particular the temporal and spatial localization of CD8+ T
cells. We describe a Janus role of TNC that is characterized by eliciting an immune
response and, also corrupting immune surveillance. This dual role of TNC in tumor
immunity has not been known so far and offers novel cancer targeting opportunities.
Tumor immunity is resurrecting as an important field in anti-cancer therapy where
activation of immune checkpoint regulators is a promising approach to block tumor
growth in some but not all patients (Sharma and Allison 2015). The response rates
should be better. A more in-depth knowledge is necessary to comprehend the
crosstalk of tumor cells with the immune system within the TME where the TME may
counteract the immune checkpoint therapies. Until today this question was difficult to
address as only a few models existed that allow to address how the TME, and in
particular the tumor relevant ECM, impacts the evolution of an immune response
during tumor onset and along tumor progression. Here, we have established a novel
syngeneic orthotopic mammary gland grafting model where the impact of the tumor
specific ECM on the evolution of tumor immunity can be analyzed thanks to growth of
the grafted tumor cells into a tumor over many weeks.
Whereas initial experiments in a PyMT model expressing or lacking the TNC protein
did not show a TNC-dependent effect on tumor growth nor lung metastasis (Talts et
al. 1999), a few other models support a metastasis enhancing role of TNC. In the first
stochastic PNET tumorigenesis model with engineered TNC expression, high TNC
levels correlated with enhanced lung metastasis (Saupe et al. 2013). In immune
compromised PDX (patient derived xenograft) tumors, using human breast cancer
65
cell lines (Oskarsson et al. 2011c; Minn et al. 2005), host-and tumor cell-derived TNC
was shown to be important for colonization of intravenously injected tumor cells
(Oskarsson et al. 2011). By grafting 4T1 cells into a syngeneic host expressing or
lacking the TNC protein, the authors also observed that host TNC was involved in
enhancing lung metastasis colonization (O’Connell et al. 2011). Now, by using the
MMTV-NeuNT model expressing or lacking TNC and by applying the NT193 grafting
model with engineered TNC levels, we have recently shown that again host-derived
TNC plays a role in promoting lung parenchymal metastasis formation (Sun et al.,
submitted). Altogether, we demonstrate that the NT193 grafting model is a relevant
surrogate model to recapitulate events driving tumor progression in the MMTV-
NeuNT model. Here, we show that this model is also relevant to address evolution of
tumor immunity.
We have thoroughly characterized our novel NT193 cell line derived from a MMTV-
NeuNT tumor (Arpel et al. 2016) that upon orthotopic engraftment into the mammary
epithelium of an immune competent mouse develops adenocarcinomas. In the
tumors, the tumor cells remain epithelial and maintain expression of the (NeuNT)
oncogene. This is opposed to a previously described MMTV-Neu model where
expression of another ErbB ortholog got lost and cells underwent EMT which may
have selected cells to grow (Kmieciak et al. 2007; Knutson et al. 2006). In the NT193
model we showed that over a period of 11 weeks tumor cells spontaneously
disseminate and form lung metastasis (Sun et al., submitted). Moreover, the general
organization of the arising NT193 adenocarcinomas is undistinguishable from MMTV-
NeuNT tumors. Furthermore, ECM including TNC is arranged into tumor matrix
66
tracks (TMT) in the NT193 grafted tumors similar to MMTV-NeuNT tumors where we
have described TMT for the first time in this model.
We engineered TNC expression in the NT193 tumor cells and noticed that upon
engraftment the TNC KD is stable in the arising tumors (Sun et al., submitted). This
model now allowed us to address cell type specific roles of TNC by using a WT or
TNCKO host for engraftment of shC or shTNC cells. We observed that tumor cell and
host-derived TNC have distinct effects on tumor growth. Unexpectedly, we observed
a transient tumor regression or complete rejection, when both the host and the tumor
cells expressed TNC. This was not seen when only the tumor cells or only the host
expressed TNC. We described that tumor cell-derived TNC induced an antigen-
presenting-signature APS in the host which could explain the combined actions of
both TNC sources in tumor cell rejection.
Interestingly, high expression of an APS signature correlates with better survival of
breast cancer patients which could have future diagnostic and therapeutic value. This
result also reveals that antigen presentation in breast cancer might have therapeutic
relevance which has not been known so far. In glioblastoma (GBM) patients, it was
recently shown that antibodies against TNC correlate with a longer survival (Mock et
al. 2015). Based on this observation, the company Immatics had developed an
immunization protocol for GBM patients where antigenic peptides from TNC are
included (reviewed in Spenlé et al. 2015). Our results suggest that a similar strategy
might also be useful in grade III breast cancer patients. We further noticed that
surgical wounding is essential to allow eliciting of an immune defense and to trigger
tumor cell rejection as, no rejection was seen when NT193 shC cells were engrafted
through the nipple (Deligne et al., in preparation). Maybe through wounding, the
67
immune system is alerted and innate immune cells can trigger a defense reaction
before a strong negative feedback loop sets in to inactivate the innate immune
response (Deligne et al., in preparation).
Certainly more work is needed to identify how TNC elicits an immune response. TNC
may induce a neoantigen in NT193 cells or, TNC could act as TAA itself. To address
whether TNC acts as TAA can be tested by immunization of a WT host with TNC and
then monitoring growth of engrafted shC cells which should be rejected. If rejection is
not increased, one or more molecules induced by TNC (in the shC cells) may serve
as TAA. Candidate molecules may be present in the list of genes that are expressed
in cultured shC cells but are lacking in shTNC cells. Analysis of our RNA seq data
revealed a difference in FNIII domains of TNC molecules that are expressed by the
host and the tumor cells (unpublished results), which suggests that a particular TNC
sequence may be antigenic in this model. This intriguing possibility has to be
investigated in more depth in the future. Also, it remains to be determined whether
glycosylation or, citrullination of particular sites in TNC generates antigenic sites as
antibodies against citrullinated TNC were identified in RA patients (Schwenzer et al.
2016). Also, cleavage of TNC may release cryptic antigenic sites (Midwood et al.
2016).
How does TNC act as alarmin or DAMP in cancer? From studies in RA patients it is
known that TNC enhances expression of pro-inflammatory cytokines in the
connective tissue of the joints through integrin α9β1 and TLR4 (Asano et al. 2014;
Midwood et al. 2009) . Whether this is also the case in our model has to be
68
addressed. Our unpublished data suggest a role of TRL4 in TNC corrupting tumor
immune surveillance in this model (Deligne et al., in preparation).
TNC may generate an immunotolerogenic TME by creating ECM-enriched tumor
matrix tracks (TMT) that have previously been described in other tumors and were
found to have structural and molecular similarities with reticular fibers in the thymus
(Drumea-Mirancea et al. 2006; Spenlé et al. 2015; Midwood et al. 2009). In human
and murine insulinoma and colon carcinoma we found fibroblasts inside the matrix
tracks and, expression of characteristic ECM molecules such as FN, LMγ2, Col IV
and TNC (Spenlé et al. 2015). It is remarkable that the expression of TNC in the adult
organism is largely regulated and restricted to only a few sites such as some stem
cell niches and noticeably, reticular fibers of lymphoid organs. The particular
expression in reticular fibers could be meaningful as immune cell education is
believed to occur in the reticular fibers (Fletcher et al., 2015). We had previously
speculated that in tumors the genetic program for reticular fibers is turned on to
trigger the formation of TMT (Midwood et al. 2009). TMT are bigger than reticular
fibers, where a not yet identified exhaustive number of ECM molecules is arranged in
aligned fibrillar arrays oriented parallel to the tumor cell nests (Spenlé et al. 2015).
Interestingly, TNC is a very prominent component of these TMT that we have seen in
insulinoma, colon carcinoma, glioblastoma and recently in head and neck squamous
cell carcinomas (Spenlé et al. 2015; Rupp et al. 2016, Sun et al., submitted, Spenlé,
Loustau et al., in prep). We now have shown that TMT are indeed formed in the
NeuNT and NT193 tumors where ECM expression resembles those of other tumors
(Spenlé et al. 2015) and considered that TMT in NT193 tumors may impact tumor
immunity. Whereas we found leukocytes enriched in TMT of insulinomas, in NT193
tumors we found CD8+ T cells sequestered in the TMT. The function of these TMT
69
appears to be different in the absence of TNC, as we saw less CD8+ T cells residing
in the TMT of tumors with low TNC expression. Instead, in the TNC-low tumors more
CD8+ T cells entered the tumor cell nests which correlates with enhanced apoptosis
and tumor regression.
One of the TNC-regulated genes was the chemokine CXCL12 that was upregulated
at mRNA and protein level in tumors with high TNC as well as in the secretome of
TNC expressing cells. CXCL12 was shown to regulate T lymphocyte migration
(Okabe 2005b) through CXCR4 (CXCR7) (Balabanian et al. 2005) and, at low and
high concentrations, acts as a chemoattractant or repellent (Poznansky et al. 2000).
CXCL12 is also known to be an important player in TME-driven immune exclusion
(Joyce and Fearon 2015). Thus, it is possible that through upregulation of CXCL12
by TNC tumor cells generate a CD8+ T cell repelling local milieu. Indeed, we showed
that inhibition of CXCR4 with AMD3100 caused massive infiltration of CD8+ T cells
into the tumors and their regression. As CXCL12 binds TNC we considered that TNC
also impacts CD8+ T cells by attraction and immobilization. Indeed, our cell culture
experiments confirmed that CXCL12 promotes attraction of CD8+ T cells towards
TNC where cells adhered to the usually poorly adhesive TNC substratum, thereby
causing their immobilization. Interestingly, CXCL12 is the major CD8+ T cell
attraction factor induced by TNC in this model, as CM from shC cells attracted CD8+
T cells which was not the case with CM from shTNC cells. Moreover, this attraction
was blocked upon inhibition of CXCR4. Thus, TNC may impact localization of CD8+
T cells away from the tumor cell nests by two mechanisms, first through induction of
CXCL12 generating a CD8+ T cell repelling local milieu and second by sequestering
CD8+ T cells inside the TMT, thereby keeping CD8+ T cells away from the tumor
70
cells. Whether TNC affects the cytotoxic function of CD8+ T cells is another important
question that we did not address in depth here as this is shown in another manuscript
(Deligne et al., in preparation). Our results suggest that TNC impairs CD8+ T cell
functions at multiple levels. Apparently, CXCR4 signaling is instrumental for tumor
growth as CXCR4 inhibition caused tumor regression. CD8+ T cells largely infiltrated
the tumor cell nests where apoptosis is highly elevated. These results suggest that
inhibition of CXCR4 signaling in CD8+ T cells causes their infiltration and, killing of
tumor cells. Future experiments have to address the exact mechanism. Do the levels
of CXCL12 indeed reach the CD8+ T cell repelling concentration in vivo? It remains
also to be seen whether the killing activity of CD8+ T cells is increased upon CXCR4
inhibition. This could be relevant for immune checkpoint and CART cell therapies as
TNC is highly expressed in established tumors. It is possible that restoration of
immune checkpoints may be hampered by TNC physically sequestering CD8+ T cells
away from the tumor cells. It is interesting to note that combining CXCR4 inhibition
with PD-1 blockade enforced tumor regression (Zboralski et al. 2017), thereby
potentially counteracting TNC. By orchestrating immune defense and immune
evasion TNC may fine-tune tissue immunity. This may also be relevant in wound
healing and inflammation thereby preventing overshooting of immune reactions that
would lead to chronically inflamed or autoimmune conditions. In cancer this balance
is obviously disturbed thereby promoting corruption of immune surveillance.
In summary, here we have established a powerful tumor grafting model that allowed
us to shed light on the roles of TNC on the evolution of tumor immunity. TNC may
locally orchestrate tumor and immune cell behavior where the cellular origin of TNC
is important. Tumor cell-derived TNC triggers expression of an antigen-presenting-
71
signature APS in the host causing tumor cell rejection. Tumor cells also increase
CXCL12 expression in a TNC dependent manner. Binding of CXCL12 to TNC
generates an adhesive substratum for CD8+ T cells thereby sequestering them away
from the tumor cells. An in-depth understanding of the balance between the “good”
and “bad” actions of TNC in cancer may open novel opportunities for future targeting
of cancer, thereby taking into account the temporal and loco-spatial organization of
the TME.
72
3.5. Material and methods
Experimental mice
MMTV-NeuNT female mice in FVB/NCrl (provided by Gerhard Christofori, University
of Basel, Switzerland) engineered to express a constitutive active form of the rat
ortholog of ErbB2 (NeuNT) under the mouse mammary tumor virus promoter develop
multifocal breast adenocarcinoma and lung metastasis (Muller et al. 1988b). TNC+/-
mice in the 129/sv genetic background (provided by Reinhard Fässler, Max Planck
Institute, Martinsried, Germany, Talts et al. 1999) were crossed consecutively for at
least ten times with FVB/NCrl mice (Charles River) before crossing TNC+/- FVB mice
with MMTV-NeuNT (FVB/NCrl) mice. All mice were housed and handled according to
the guidelines of INSERM and the ethical committee of Alsace, France (CREMEAS)
(Directive 2010/63/EU on the protection of animals used for scientific purposes).
To generate an orthotopic syngeneic model, FVB mice with TNC+/+ or TNC -/-
genotypes were grafted with 10x106 NT193 cells (Arpel, et al., 2014) in the surgically
opened left fourth mammary gland. Tumor growth was assessed by measuring the
tumor sizes every 3 or 7 days with a Vernier caliper and tumor volume was
determined using the following calculation V= (width)2 x length/2. Tumor bearing mice
were euthanized at indicated time points and breast tumors and lungs were
processed for subsequent analyses: tissues were frozen in liquid nitrogen for protein
and mRNA analysis or embedded in O.C.T (Sakura Finetek) and paraffin for
immunostainings. To assess the role of CXCL12 in tumorigenesis, tumor-bearing
mice (FVB/NCrl from Charles River) were treated with AMD3100 (Sigma) at 5
mg/kg/day in PBS. The CXCR4 inhibiting molecule was administered by peritumoral
injection as from day 15 after NT193 cells engraftment up to 7 weeks.

73
FACS analysis
The tumor tissue was cut into small pieces (<5mm3) and digested in PRMI medium
supplemented with 5 % of inactivated fetal bovine serum, penicillin (10 000 U/ml),
streptomycin (10 mg/ml), Liberase TM (500ug/ml) and DNAse (100ug/ml) for 30
minutes at 37°C under agitation. Cells were then separated through a 70µm cell
strainer and counted. Surface staining was performed according to standard
protocols and analysed with a LSR Fortessa machine (BD Biosciences, San Jose,
CA, USA). Antibodies used were anti-CD8α-Pacific Blue, anti-CD45-PE-Cy7 and
anti-CD3ε-Brillant Violet 785 from Biolegend. Dead cells were stained using
Live/Dead Fixable yellow dead cell stain kit from Thermofisher. FlowJo was used for
the data analysis.
Hematoxylin-Eosin staining (HE)
The paraffin embedded sections were dewaxed and rehydrated with 100% toluene (2
washes of 15 min) and 100%–70% alcohol (10 min each) before staining with
hematoxylin (Surgipath) and eosin (Harris) according to standard protocols (ref) and
embedding in Eukitt solution (Sigma).
Immunohistochemical staining (IHC)
Paraffin embedded sections (7 µm-thick) were rehydrated as described previously
and antigen retrieval was performed by boiling in 10 mM pH 6 sodium citrate solution
for 20 min. Cooled slides were then washed and incubated in peroxidase solution
(0.6% H2O2 in methanol) for 30 min. Slides were washed and incubated with a
blocking solution (5% normal goat serum in PBS) for 1 hour at room temperature to
block non-specific binding sites. Avidin/biotin receptors were blocked by using the
74
avidin/biotin blocking kit as recommended by the manufacturer (Vector). Slides were
incubated with the indicated primary antibody overnight at 4°C and then incubated
with the corresponding biotin-coupled secondary antibody for 1 hour at room
temperature. Peroxidase detection was performed using the Elite ABC system
(VECTASTAIN) with DAB (Vector) as substrate. Finally, tissue was stained with
hematoxylin, dehydrated and embedded in Eukitt solution (Sigma).
Immunofluorescence staining (IF)
O.C.T embedded tissue sections (7 µm-thick) were incubated with a blocking solution
(5% normal goat serum in PBS) for 1 hour at room temperature before incubation
with the indicated primary antibody overnight at 4°C. The slides were then washed
and incubated with the corresponding fluorophore-coupled secondary antibody for 1
hour at room temperature. The list of the different antibodies used is given in Table
S1. The slides were washed, stained with DAPI (Sigma) for 10 min at room
temperature washed and embedded with FluorSaveTM Reagent (Calbiochem). The
fluorescent signal was analyzed with a Zeiss Axio Imager Z2 microscope. The image
acquisition setting (microscope, magnification, light intensity, exposure time) was
kept constant per experiment and genetic conditions. Quantification of IF microscopic
images was done by the ImageJ (National Institutes of Health) software using a
constant threshold.
Fluorophore-labeled MTn12 antibody and IF
In order to be able to do costaining of TNC and immune cells on tissue sections, the
MTn12 antibody was labeled with DyLight 488 as recommended by the manufacturer
(Thermofisher). When using the DyLight 488-labeled MTn12 antibody, the previously
described IF protocol was adapted as follows: after the incubation of the sections with
75
the secondary antibodies, the slides were washed and incubated with the DyLight
488-labeled MTn12 antibody for 3 hours at room temperature. The slides were then
washed, DAPI stained and embedded as described above.
Real Time quantitative PCR (qPCR) analysis
Total RNA was prepared using TriReagent (Life Technologies) according to the
manufacturer’s instructions. RNA was treated with DNase I (Roche) at 0.5U/µg RNA.
After DNase I inactivation, RNA was reverse transcribed (MultiScribe reverse
transcriptase, Applied Biosystems) and qPCR was done on cDNA (diluted 1:5 in
water) on a 7500 Real Time PCR machine (Applied Biosystems) using SYBR green
reaction buffer or Taqman reaction buffer (Applied Biosystems). Data were
normalized by using a Taqman mouse GAPDH endogenous control (4333764T, Life
Technology) and fold induction was calculated using the comparative Ct method (-
ddCt). Primers used for qPCR are listed in the Table S2.
Analysis of protein expression
Tissue or cell lysates were prepared in lysis buffer (50 mM Tris-HCl pH 7.6, 150 mM
NaCl,1% NP-40, 0.5% sodium deoxycholate, 0.1% SDS) supplemented with
protease inhibitor (Roche) and Phosphatase Inhibitor Cocktail (Santa Cruz). The
protein concentration was determined by Bradford assay (BioRad). 20-30µg of
protein lysate was loaded in precasted 4-20% gradient gels (BioRad), together with
Laemmli buffer and separated by SDS-PAGE. The separated proteins were then
transferred onto nitrocellulose membranes (BioRad) using the TransBlot TurboTM
Transfer system (Biorad). Nitrocellulose membranes were then blocked with 5 %
Blocking-Grade blocker (Biorad) in 0.1% Tween-20 PBS and incubated with the
primary (overnight at 4°C) and secondary antibodies (1 hour at RT) in 1.5 %
76
Blocking-Grade Blocker in 0.1 %Tween-20 PBS. Antibodies used are listed in Table
S1. Protein bands were detected with the AmershamTM ECLTM Western Blotting
detection reagent (GE Healthcare) or SuperSignalTM West Femto Maximum
Sensitivity Substrate (ThermoFisher). CXCL12 expression was determined in tissue
and protein lysates using the mouse CXCL12/SDF-1 alpha Quantikine ELISA Kit
(R&D systems) according to the manufacturer’s instructions.
Cell culture
The NT193 cell line has been previously established in the laboratory from a primary
MMTV-NeuNT breast tumor (Arpel et al. 2014). NT193 cells were cultured in DMEM
with 4.5 g/L glucose (GIBCO) supplemented with 10 % of fetal bovine serum
(Invitrogen), penicillin (10 000 U/ml), streptomycin (10 mg/ml) (PenStrep, Dutscher)
and Gentamicin (40µg/ml) (ThermoFischer). Cells were maintained at 37°C in a
humidified atmosphere of 5 % CO2. Silencing of TNC in these cells was done by
short hairpin (sh) mediated gene expression knock down. Briefly, lentiviral particles
shRNA vectors (Sigma) encoding specific shRNAs for the knock down of TNC were
used: (sh1TNC: CCGGCCCGGAACTGA-
ATATGGGATTCTCGAGAATCCCATATTCAGTTCCGGGTTTTTG, sh2TNC: C-
CGGGCATCAACACAACCAGTCTAACTCGAGTTAGACTGGTTGTGTTGATGCTTT
TTG). Lentiviral particles encoding a non-targeting shRNA vector were used as
control (SHC202V, Sigma). The resulting transducedcellswereselectedwiththe
previously described culture mediumsupplementedwith10μg/mlpuromycin
(Thermofisher) andtheselectionpressurewaskeptinallinvitroexperiments.
To collect conditioned medium from NT193 cells, the cells were seeded in 10 cm cell
culture dishes in previously described culture medium, starved at confluence in
77
DMEM with 4.5 g/L glucose for 48 hours at 37°C. The resulting conditioned medium
was filtered at 0.22 µm and stored at -80°C for future use.
Cell multiplicity assay
Serum starved NT193 cells (both shC and shTNC) were plated into 96-well plates
(5000/well with 6 replicates for each time point). Cells were treated with recombinant
CXCL12 (500 ng/mL) (R&D Systems or not. MTS incorporation assay was done
using the CellTiter 96 aqueous non-radioactive cell proliferation assay (Promega)
after 4h, 24h, 48h when treated with CXCL12 and 24h, 48h, 72h, 96h when non-
treated.
CD8+ T cells isolation
Spleens of sacrificed mice were isolated and cut into small pieces on a 70 µm filter
with a syringe piston. After a wash with PBS, the red blood cells in the cell
suspension were lysed with potassium ammonium chloride lysing buffer
(Thermofisher). CD8+ T cells were sorted from the resulting cells by using the murine
CD8a+ T Cell Isolation Kit (Miltenyi Biotec) according to the manufacturer’s
instructions. After each CD8+ T cell sorting, the purity of the isolated cells was
assessed by FACS analysis (antibodies in Table S1).
CD8+ T cell migration assay
The CD8+ T cell migration assays were done in 5µm-pore size polycarbonate
membrane transwells (Costar). The lower surface of the transwells were first coated
with fibronectin (FN), TNC or collagen IV (Col IV) at a final concentration of 1 µg/cm2
and were incubated 1h at 37°C. The transwells were then washed with PBS and
blocked with 1% BSA overnight at 4°C. The following day, the transwells were

78
washed and air-dried. The lower chambers of the transwells were filled with
TexMACS medium (Miltenyi Biotec) containing chemokines as chemoattractant:
CXCL12 (1 µg/mL), CCL21 (1 µg/mL) or CXCL10 (500µg/mL) (R&D Systems). To
assess the migration of CD8+ T cells towards the secretome of the NT193 cells,
conditioned medium from NT193 shC or shTNC cells was placed in the lower
chamber. In order to block the chemotaxis of CD8+ T cells towards CXCL12, the
cells were incubated for 1 hour at 37°C with AMD3100 (Sigma) at a concentration of
5 µg/mL in TexMACS medium before seeding in the upper chamber. After 5 hours of
migration at 37°C, the medium in the lower chamber was collected and the number of
migrated cells was counted by FACS.
CD8+ T cell adhesion assay
The CD8+ T cell adhesion assays were done with the same set up described in the
migration experiment. After 5 hours of migration, the cells that were attached to the
lower surface of the transwells, were fixed in 4% PFA and stained with DAPI.
Pictures were taken and analyzed by the ImageJ software.
Surface Plasmon Resonance analysis
Surface plasmon resonance binding experiments were performed on a Biacore 2000
instrument (Biacore Inc.) at 25°C. TNC (Huang et al., 2001) was immobilized at high
surface density (around 7000 resonance units) on an activated CM5 chip (Biacore
Inc.) using a standard amine-coupling procedure according to the manufacturer's
instruction. Soluble molecules were added at a concentration of 10 μg/mL in 10 mM
sodium acetate, pH 5.0, and at a flow rate of 5 μL/min for 20 min before addition of 1
M ethanolamine. CXCL12 (from 0.6x10⁻⁷ M to 6x10⁻⁷ M) was added to the chip at pH
7.4 (10 mM HEPES, 150 mM sodium chloride, 0.005% (v/v) surfactant P20), at a flow
79
rate of 10 μL/min. A blank CM5 chip was used for background correction. 10 mM
glycine, pH 2.0, at 100 μL/min for 1 min was used to regenerate the chip surface
between two binding experiments. The dissociation constant (Kd) was determined
using the 1:1 Langmuir association model as described by the manufacturer.
Gene expression analysis
RNA integrity for NT193 shControl and shTNC cells (2 samples per group) was
assessed with the Agilent total RNA Pico Kit on a 2100 Bioanalyzer instrument
(Agilent Technologies). Ribosomal RNA was depleted with the Low Input
RiboMinus™ Eukaryote System v2 kit (ThermoFisher) following the manufacturer's
instructions. The sequencing library was prepared with the Ion Total RNA-seq kit v2
(ThermoFisher) according to the manufacturer's instructions. The libraries were
loaded two by two at a concentration of 20 pM on an Ion PI™ Chip using the Ion
Chef Instrument (ThermoFisher). Finally, the sequencing was performed on an Ion
Proton sequencer with the Ion PI™ Hi-Q™ Sequencing 200 Kit (ThermoFisher). The
transcriptome data were processed by the RNASeqAnalysis plugin from the Torrent
Suite Software 5.06. The approach is based on the Life Technologies Application
note: "Transcriptome sequencing using the Ion Proton System". The reads are
mapped on a two-step alignment scheme. They are first aligned to the reference
genome (mm10) using STAR (Dobin et al. 2013) to find full mappings and the
unmapped reads are mapped using the bowtie2 aligner to find partial mappings
(Langmead and Salzberg 2012). The total reads mapped are finally available in BAM
format for raw read counts extraction. Read counts are found by the htseq-count tool
of the Python package HTSeq (Anders, Pyl, and Huber 2015). Differential analyses
were performed by the DESEQ2 package of the Bioconductor framework (Love,
80
Huber, and Anders 2014). Up-regulated and down-regulated genes are selected
based on the adjusted p-value cutoff 10%.
RNA from MMTV-NeuNT WT and TNCKO mammary tumors (3 samples per group)
were used for the Microarray experiments, performed at the IGBMC Affymetrix Core
Facility (Illkirch, France). Biotinylated single strand cDNA targets were prepared by
using the Affymetrix GeneChip WT Terminal Labeling Kit (Affymetrix) according to
manufacturer`s recommendations. Following fragmentation and end-labelling, 2 μg of
cDNAs were hybridized for 16 hours at 45°C on GeneChip Human Gene 1.0 ST
arrays (Affymetrix) interrogating 28.869 genes represented by approximately 27
probes spread across the full length of the gene. The chips were washed and stained
in the GeneChip® Fluidics Station 450 (Affymetrix) and scanned with the GeneChip
Scanner 3000 7G (Affymetrix) at a resolution of 0.7 µm. Raw data (.CEL Intensity
files) were extracted from the scanned images using the Affymetrix GeneChip
Command Console (AGCC) version 3.1. CEL files were further processed with
Affymetrix Expression Console software version 1.1 to calculate probe set signal
intensities using Robust Multi-array Average (RMA) algorithms with default settings.
Deregulated gene expression analysis was performed using the PANTHER version
11 (Mi et al. 2017) and DAVID software (D. W. Huang, Sherman, and Lempicki
2009).
Patient survival data
Patient array data were obtained from and analyzed by Kaplan–Meier plotter tool
(kmplot.com) as described elsewhere (Györffy et al. 2010). The cohort was split by
median of corresponding gene expression (“High” and “Low,” respectively). Analysis
81
was performed for overall survival and relapse-free survival in the cohort of breast
cancer patients, stratified according to the tumor grade (Grade I, II, III).
Statistical analysis
Statistical analysis and graphical representations of data were done using GraphPad
Prism software. The Agostino-Pearson normality test was used to confirm the
normality of the data. The statistical difference of Gaussian data sets was analyzed
using the Student unpaired two-tailed t test, with Welch's correction in case of
unequal variances and, the one way ANOVA test followed by a Tukey's multiple
comparison post-test was used for multiple data comparison. For data not following a
Gaussian distribution, the permutation test was used and the one-way ANOVA test
followed by the permutation multiple comparisons post-test was used for multiple
data comparison. Graphs are represented as Mean +/- SEM unless stated otherwise.
Contingency was analyzed using the chi-square test. p-values smaller than 0.05 were
considered as significant (*, p<0.05, **, p < 0.01, ***, p < 0.001, ****, p < 0.0001).
82
Disclosure of potential conflict of interest
The authors declare no competing financial interests.
Authors contribution
DM, ZS and IVQ developed the genetic and orthotopic grafting model. DM, ZS, IVQ,
CD, AY, TH, WE, GC, FD, NP, MM and MvH performed experiments, analyzed and
interpreted the data. KM and RC critically reviewed the manuscript and interpreted
data. DM and GO wrote the manuscript. GO conceptualized and supervised this
study. Grants to GO and KM financed the study.
Acknowledgements
We are grateful for technical support by Olivier Lefebvre, Angélique Pichot and the
personnel of the animal facility. We also like to acknowledge the constructive scientific
input from Patricia Simon-Assmann. This work was supported by grants from Worldwide
Cancer Research/AICR (14-1070) to GO and KSM, and INCa (TENPLAMET), Ligue
Régional contre le Cancer, INSERM and University Strasbourg to GO, and fellowship
grants from the Chinese Scholarship Council (ZS), the French-Mexican scholarship
program Conacyt (IVQ), the French Ministry of Research MRT (AY, WE) and
Association pour la Recherche sur le Cancer ARC (DM). KSM is supported by
Arthritis Research UK.
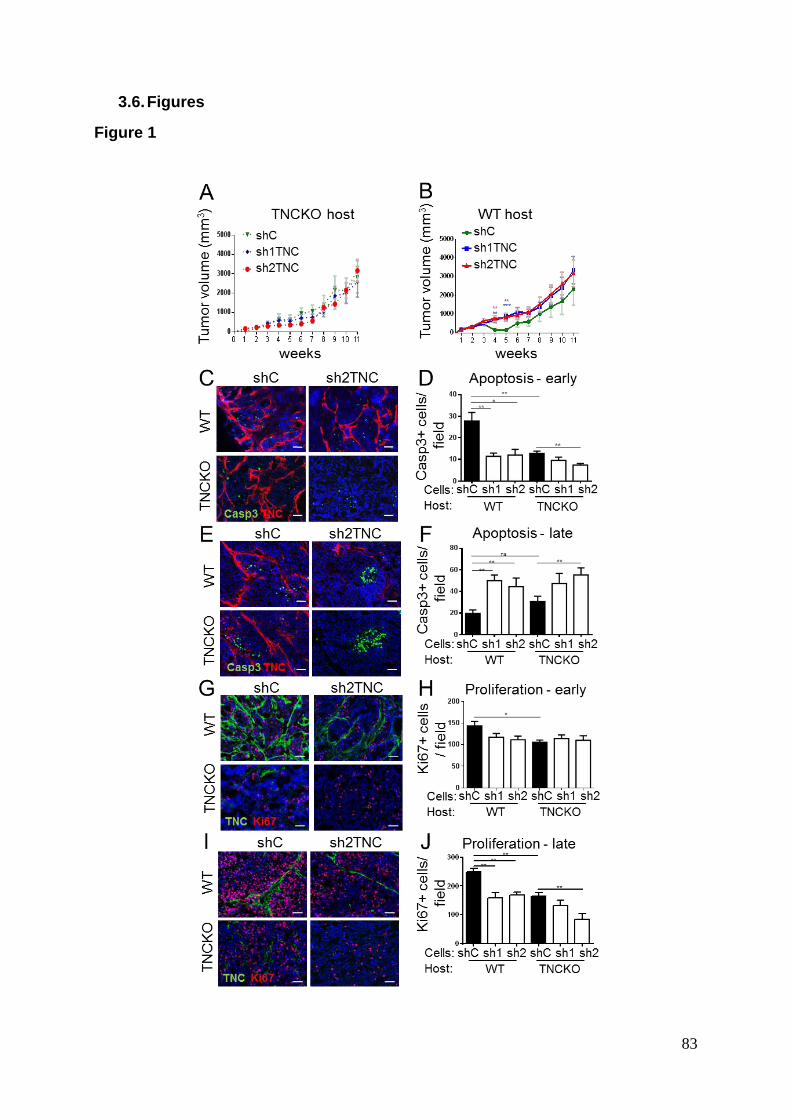
83
3.6. Figures
Figure 1
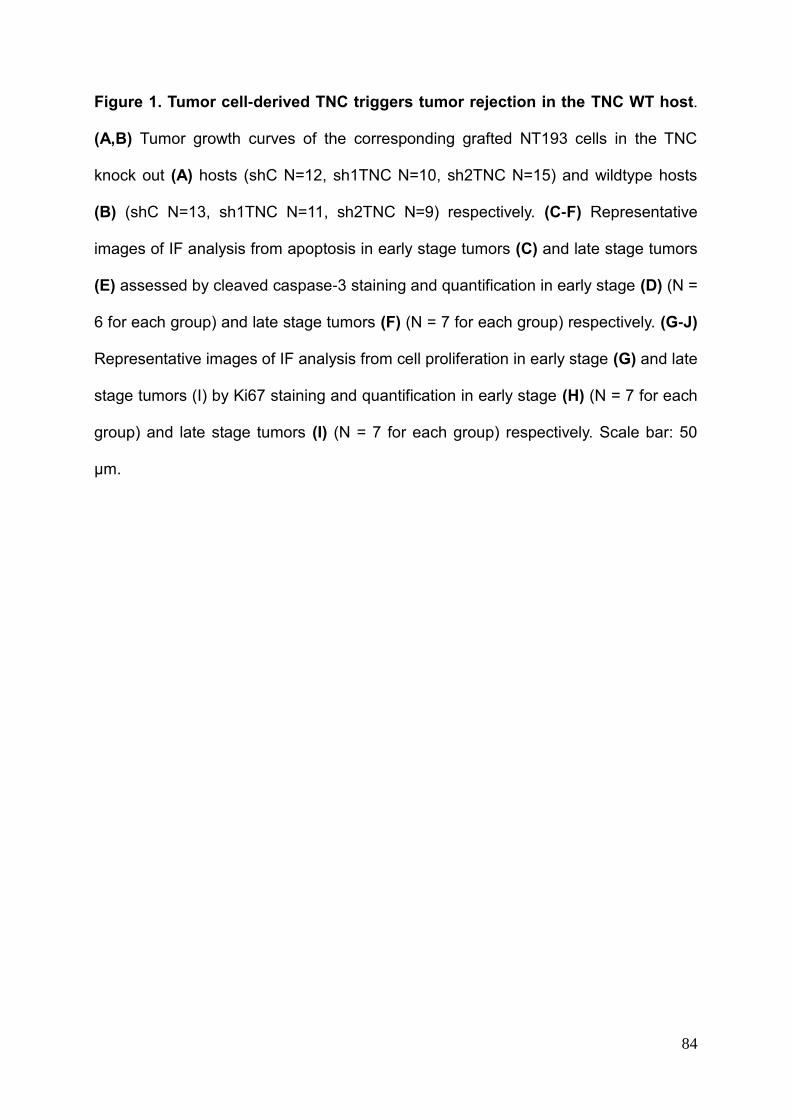
84
Figure 1. Tumor cell-derived TNC triggers tumor rejection in the TNC WT host.
(A,B) Tumor growth curves of the corresponding grafted NT193 cells in the TNC
knock out (A) hosts (shC N=12, sh1TNC N=10, sh2TNC N=15) and wildtype hosts
(B) (shC N=13, sh1TNC N=11, sh2TNC N=9) respectively. (C-F) Representative
images of IF analysis from apoptosis in early stage tumors (C) and late stage tumors
(E) assessed by cleaved caspase-3 staining and quantification in early stage (D) (N =
6 for each group) and late stage tumors (F) (N = 7 for each group) respectively. (G-J)
Representative images of IF analysis from cell proliferation in early stage (G) and late
stage tumors (I) by Ki67 staining and quantification in early stage (H) (N = 7 for each
group) and late stage tumors (I) (N = 7 for each group) respectively. Scale bar: 50
µm.
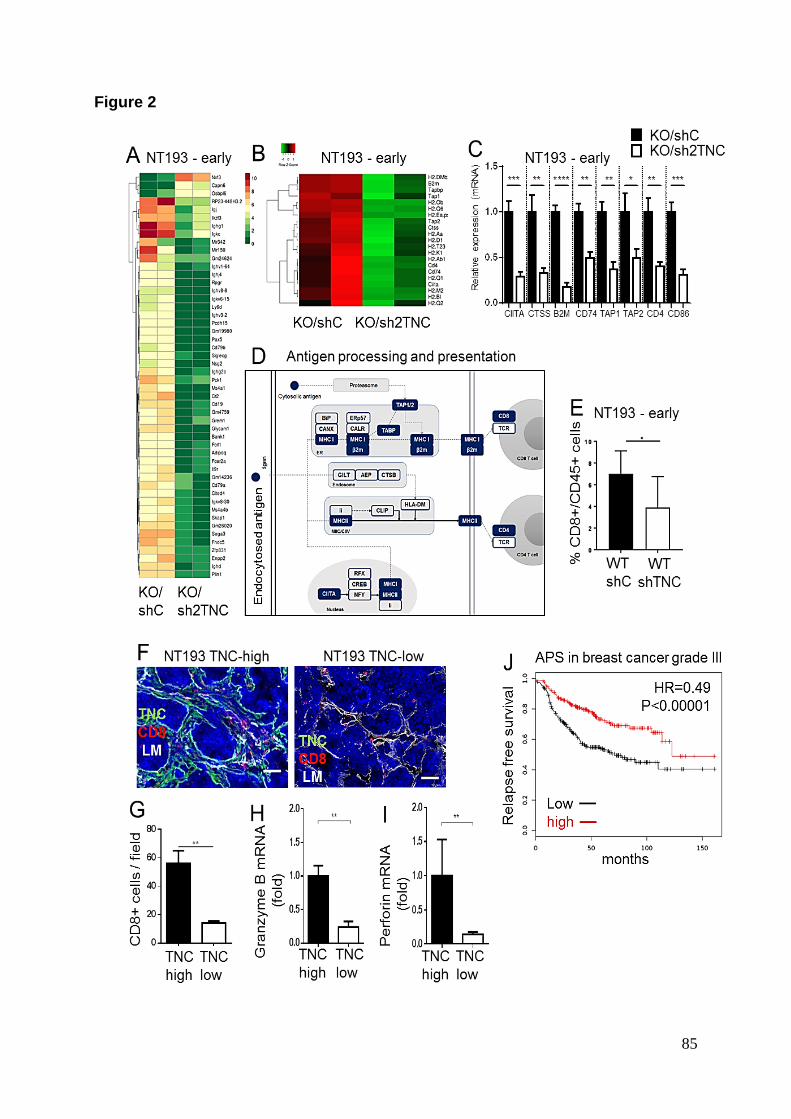
85
Figure 2
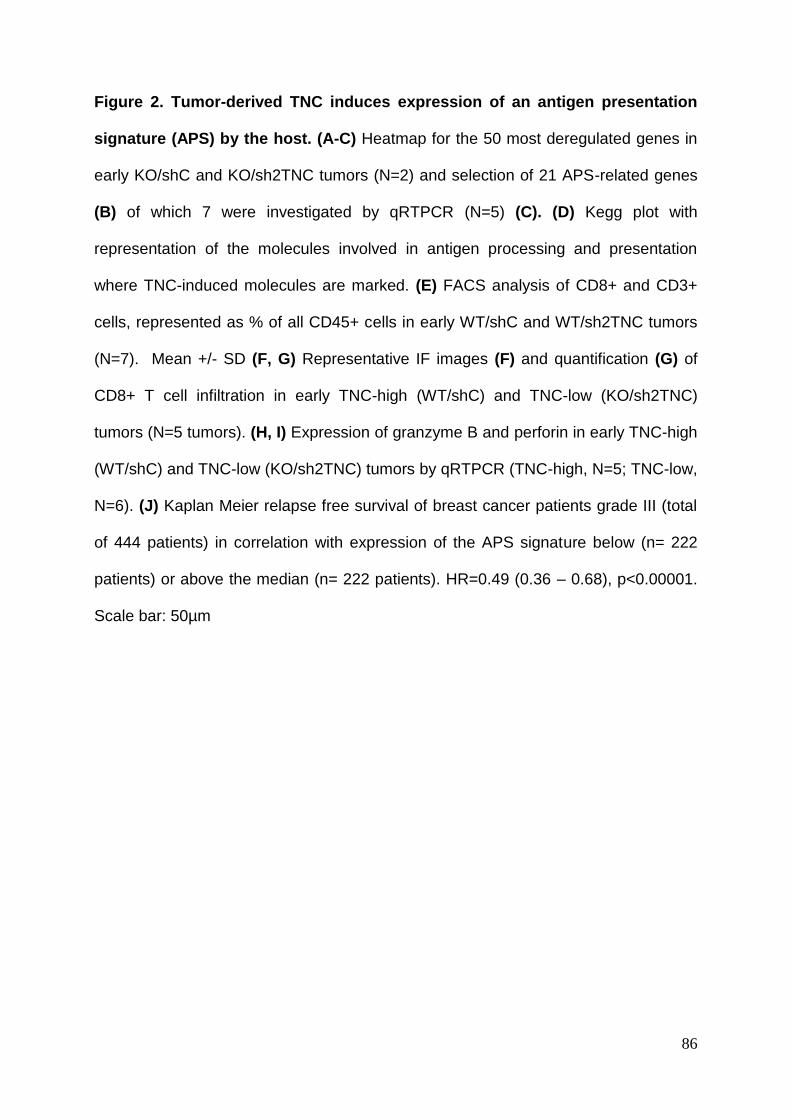
86
Figure 2. Tumor-derived TNC induces expression of an antigen presentation
signature (APS) by the host. (A-C) Heatmap for the 50 most deregulated genes in
early KO/shC and KO/sh2TNC tumors (N=2) and selection of 21 APS-related genes
(B) of which 7 were investigated by qRTPCR (N=5) (C). (D) Kegg plot with
representation of the molecules involved in antigen processing and presentation
where TNC-induced molecules are marked. (E) FACS analysis of CD8+ and CD3+
cells, represented as % of all CD45+ cells in early WT/shC and WT/sh2TNC tumors
(N=7). Mean +/- SD (F, G) Representative IF images (F) and quantification (G) of
CD8+ T cell infiltration in early TNC-high (WT/shC) and TNC-low (KO/sh2TNC)
tumors (N=5 tumors). (H, I) Expression of granzyme B and perforin in early TNC-high
(WT/shC) and TNC-low (KO/sh2TNC) tumors by qRTPCR (TNC-high, N=5; TNC-low,
N=6). (J) Kaplan Meier relapse free survival of breast cancer patients grade III (total
of 444 patients) in correlation with expression of the APS signature below (n= 222
patients) or above the median (n= 222 patients). HR=0.49 (0.36 – 0.68), p<0.00001.
Scale bar: 50µm
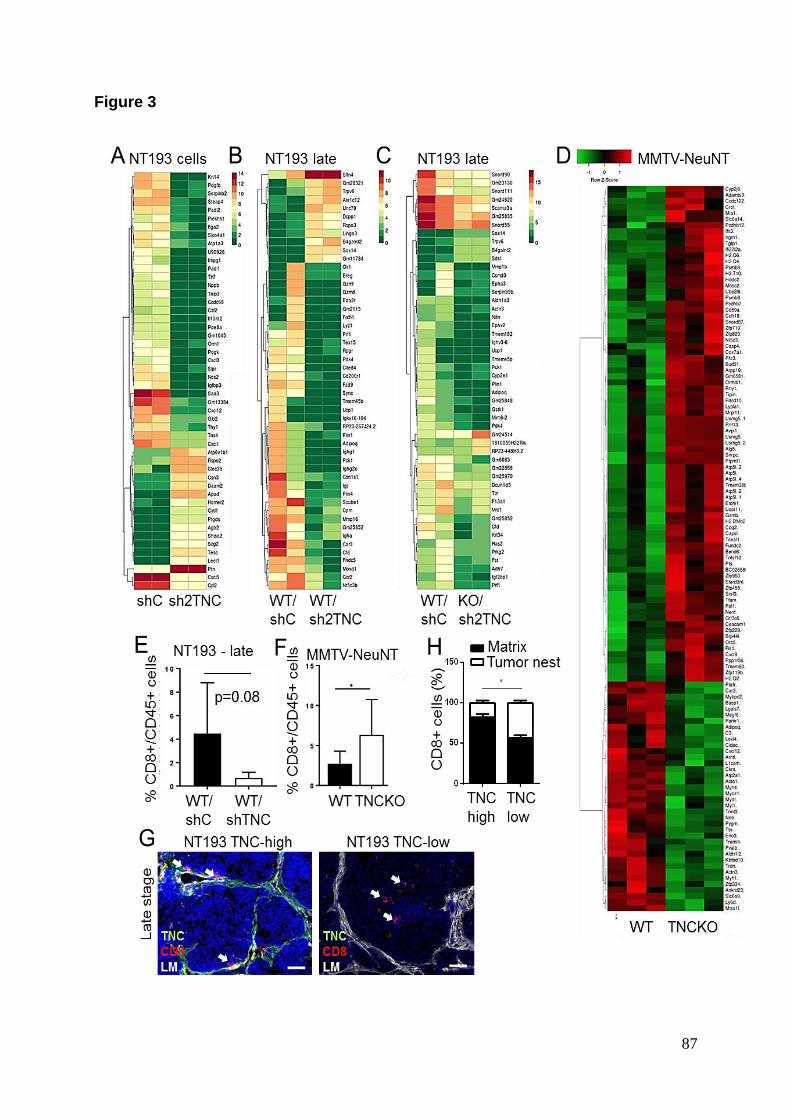
87
Figure 3
88
Figure 3. Differential gene expression and spatial distribution of CD8+ T cells in
late stage tumors (A-B) Heatmaps showing expression of the 50 most deregulated
genes (A-C) and all genes with a minimal fold change of 1.5 (D) in cultured NT193
shC and sh2TNC cells (A), late stage WT/shC and WT/sh2TNC tumors (B), WT/shC
and KO/sh2TNC tumor (C) (N=2) and MMTV-NeuNT WT and TNCKO tumors (N=3)
(D). (E-F) FACS analysis of CD8+ and CD3+ cells, represented as % of all CD45+
cells in late WT/shC (N=7) and WT/sh2TNC tumors (N=5) (E) and MMTV-NeuNT WT
(N=11) and TNCKO tumors (N=5) (F). Mean +/- SD (G, H) Loco-spatial distribution
and abundance of CD8+ T cells in late stage TNC-high (WT/shC) and TNC-low
(KO/sh2TNC) tumors upon IF staining (G) and quantification in matrix-rich areas and
tumor cell nests, respectively (H), N=5 tumors, 3 slides, 8 random fields per tumor).
Scale bar: 50 µm
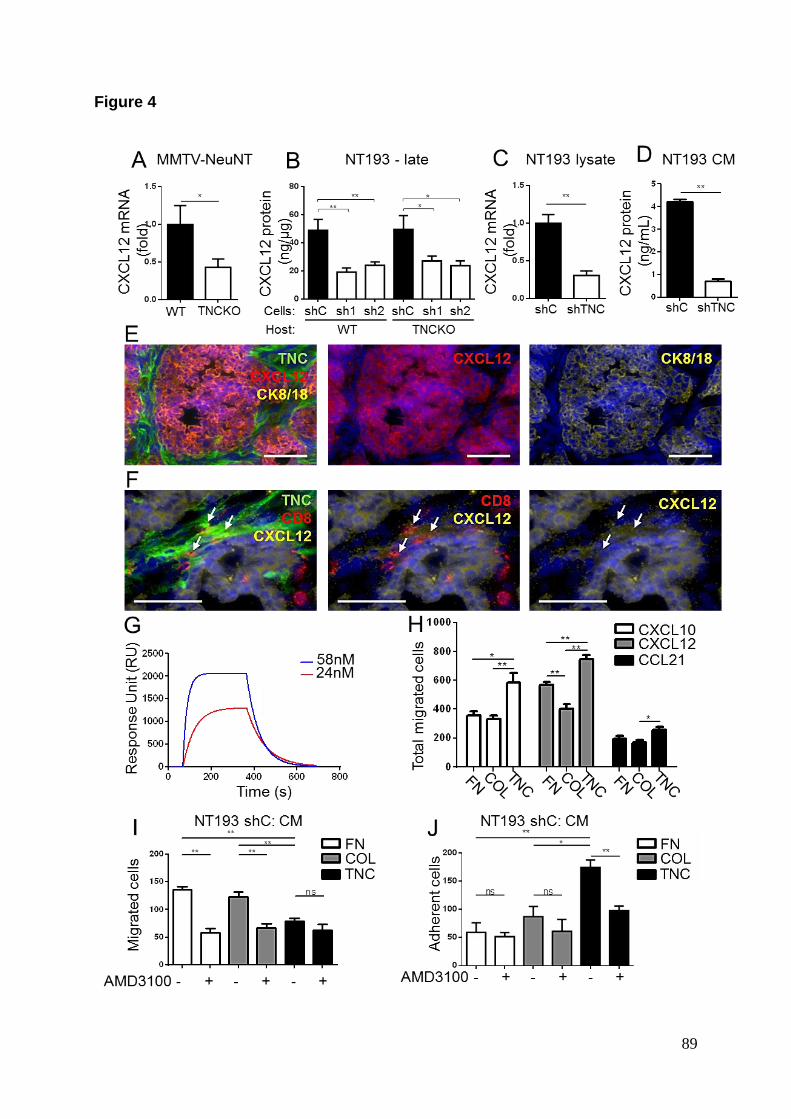
89
Figure 4
90
Figure 4. TNC-CXCL12 axis impacts CD8+ T cells (A-F) Expression of CXCL12 in
MMTV-NeuNT (WT, N=13; TNCKO, N=6) (A) late stage NT193 tumors (N=7 for each
group) (B), and in lysate (N=5) (C) and conditioned medium (CM) (N=6) (D) from
cultured NT193 cells (N=5) as assessed by qRTPCR (A-C) and ELISA (D). (E, F)
Representative IF image of CXCL12 expression in a late stage WT/shC tumor. Arrow
points at CD8+ T cells in close proximity to CXCL12 inside the TNC-rich TMT. Scale
bars = 50 µm. (G) Surface plasmon resonance binding assay on chip-immobilized
recombinant TNC with recombinant mouse CXCL12 at the indicated concentrations
(KD: 7.9E-07M). (H-J) Boyden chamber transwell migration assays with ECM coating
(FN, Col I, TNC) of the lower surface of the insert and the following chemoattractants,
CXCL10, CXCL12, CCL21 (H) and CM from NT193 shC cells (I, J). Floating (I) or
adherent CD8+ T cells (J) or the sum of both (H) upon addition of AMD3100 (I, J)
were assessed by FACS or, by counting upon fixation (I, J), respectively (N=3 in
duplicates).
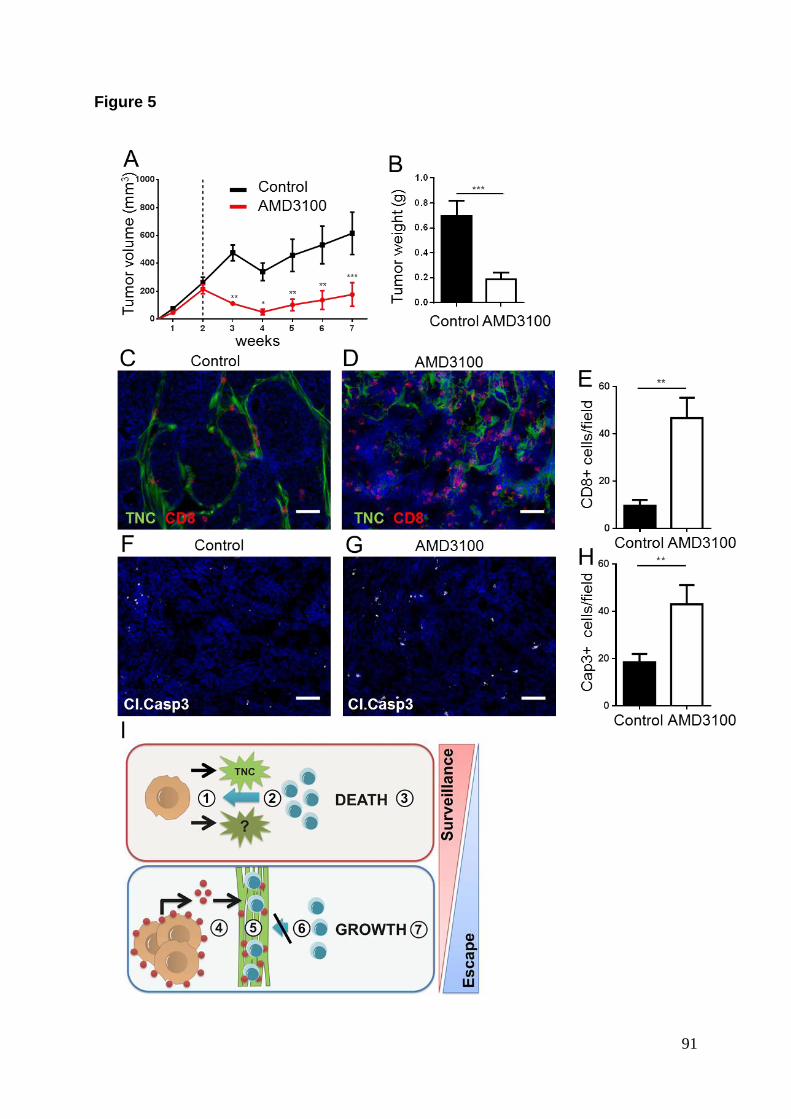
91
Figure 5
92
Figure 5. Inhibition of CXCR4 enhances tumor rejection. (A, B) Growth curve (A)
and final volume (B) of WT/shC tumors upon treatment with AMD3100 (5mg/kg/day)
or control solution for 5 weeks (N=20). (C, D) Representative IF images (C, D, F, G)
and quantification of CD8+ T cells (E) and apoptosis (Cl. caspase 3) (H) in control
and AMD3100 tumors (N=5). Scale bar: 50 µm. (I) Tumor cells express TNC or other
molecules in a TNC-dependent manner (1.) that are recognized by the host and elicit
expression of an antigen presenting signature APS, thereby presumably priming
CD8+ T cells. These primed CD8+ T cells are recruited into the tumor epithelium
where they kill the tumor cells (2.) thereby eliminating the cancer cells and providing
successful immune surveillance (3.). Escapers proliferate and express CXCL12 in a
TNC dependent manner. Here expression of CXCL12 induced by TNC in the tumor
cells might be instrumental. High CXCL12 concentrations may generate a repellent
shield for CD8+ T cells (4.). CXCL12 also binds to TNC in the tumor matrix tracks
where it attracts CD8+ T cells and immobilizes them (5.), thereby preventing their
entry into the tumor epithelial nests (6.). In consequence, tumor cells are protected
from killing by CD8+ T cells and continue to thrive (7.) and, form metastasis as
recently be shown (Sun et al.,submitted). In summary, TNC may be a critical player in
orchestrating the balance between surveillance and escape.
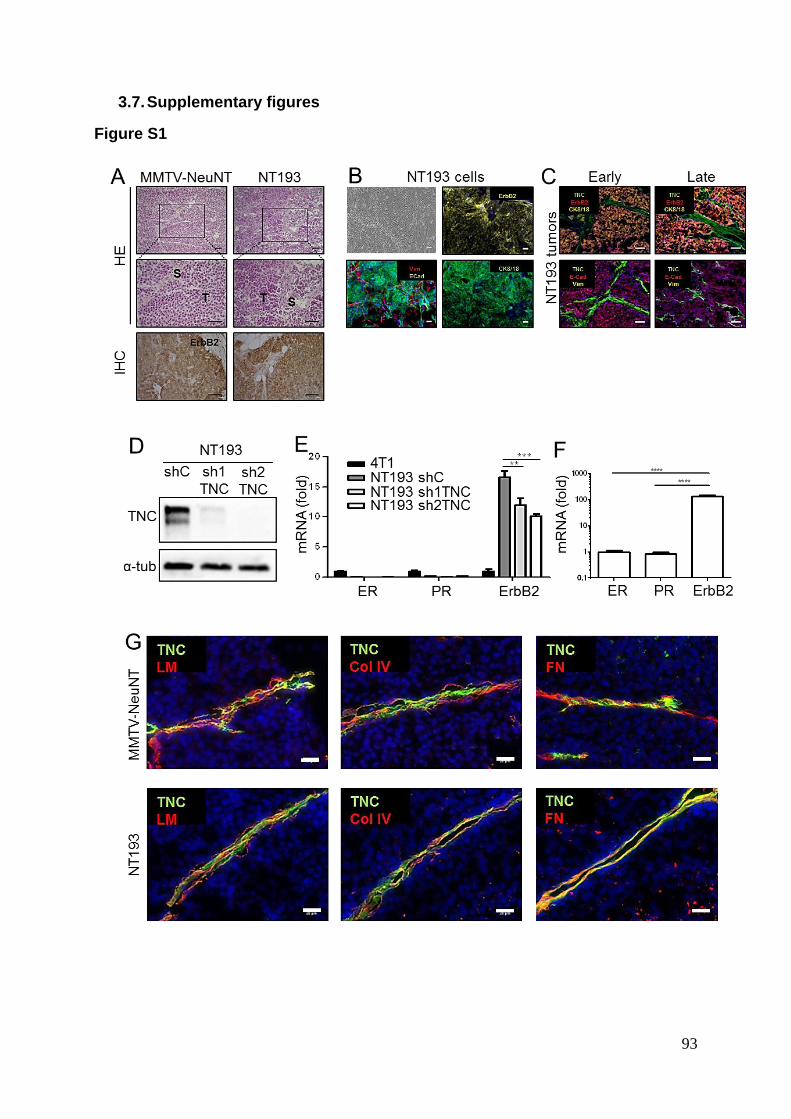
93
3.7. Supplementary figures
Figure S1
94
Figure S1. The NT193 orthotopic grafting model is a novel surrogate model to
the MMTV-NeuNT model. (A) Comparative histological analysis of the NT193
grafted tumors and MMTV-NeuNT tumors by HE staining and IHC for ErbB2
expression, S: stroma and T: tumor nest. (B) Characterization of the NT193 cells by
phase contrast and IF for ErbB2, vimentin, E-Cadherin and CK8/18 expression. (C)
IF analysis of NT193 tumors for the corresponding markers shows that upon grafting,
the NT193 cells generate epithelial tumors expressing ErbB2. This is the case both at
the early stage and the late stage of tumor growth. (D) Immunoblot showing the
knock down of TNC expression in NT193 cells with alpha tubulin as loading control.
(E) Comparison between NT193 cells and 4T1 cells, an established triple negative
cell line, at mRNA level shows that NT193 cells are ER-, PR-, and ErbB2+ (N=3).
Knock down of TNC in the NT193 cells (sh1TNC and sh2TNC) shows lowered levels
of ErbB2 compared to the control cells. (F) NT193 tumors express high level of
ErbB2 and low levels of ER and PR at mRNA level (N=7). (G) Characterization of the
tumor matrix tracks (TMT) in the MMTV-NeuNT and the NT193 tumors by IF for TNC,
laminin, collagen IV and fibronectin. Scale bar: 50 µm.
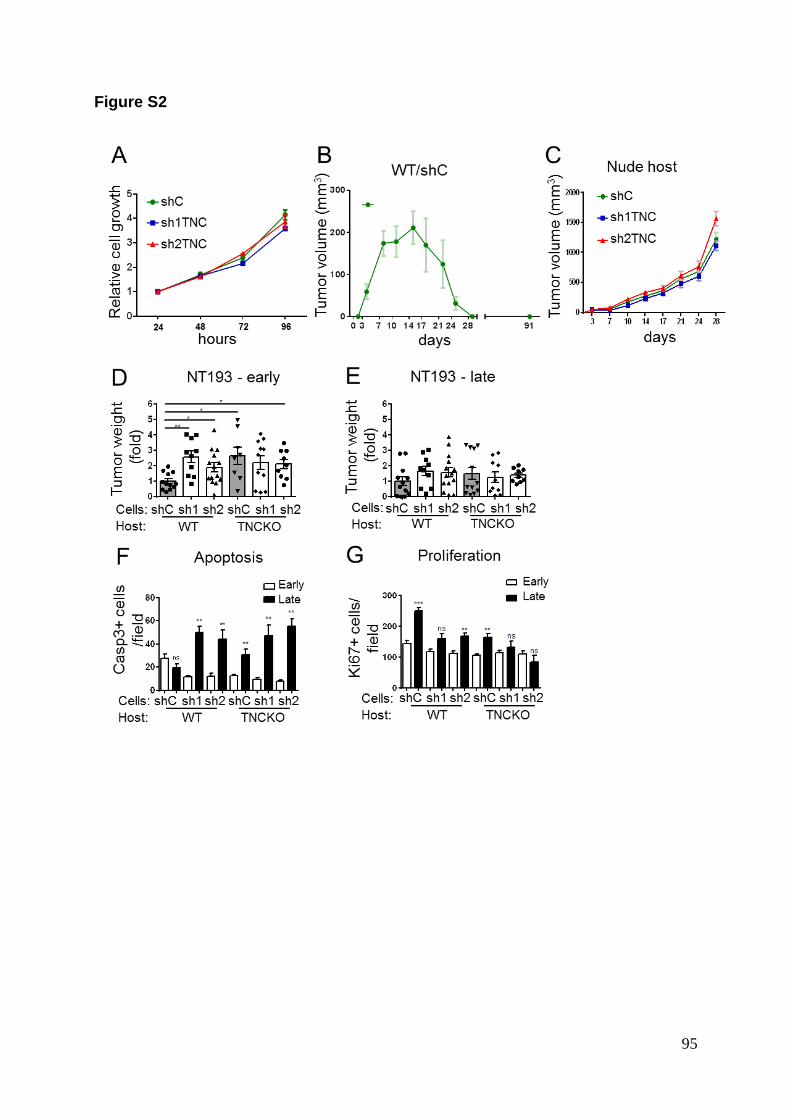
95
Figure S2

96
Figure S2. Characterization of NT193 tumors. (A) MTS multiplicity assay for
NT193 cells upon lowered expression of TNC (n=9, 3 independent experiments). (B)
Tumor growth curve for NT193 tumors that were completely rejected in the TNC WT
host (n=11). (C) Tumor growth curves of NT193 cells injected into a nude host (n=7).
(D, E) Relative tumor weight at early stage (3 weeks after tumor cell engraftment)
and late stage (11 weeks after tumor cell engraftment) respectively, (early stage
tumors: WT/shC, N = 12; WT/sh1TNC, N = 10; WT/sh2TNC, N = 14; KO/shC, N = 8;
KO/sh1TNC, N = 11; KO/sh2TNC, N = 9, late stage tumors: WT/shC, N = 12;
WT/sh1TNC, N = 10; WT/sh2TNC, N = 14; KO/shC, N = 12; KO/sh1TNC, N = 10;
WT/sh2TNC, N = 9. (F, G) Comparative levels of cleaved caspase-3 and Ki67 levels
in early and late stage tumors.
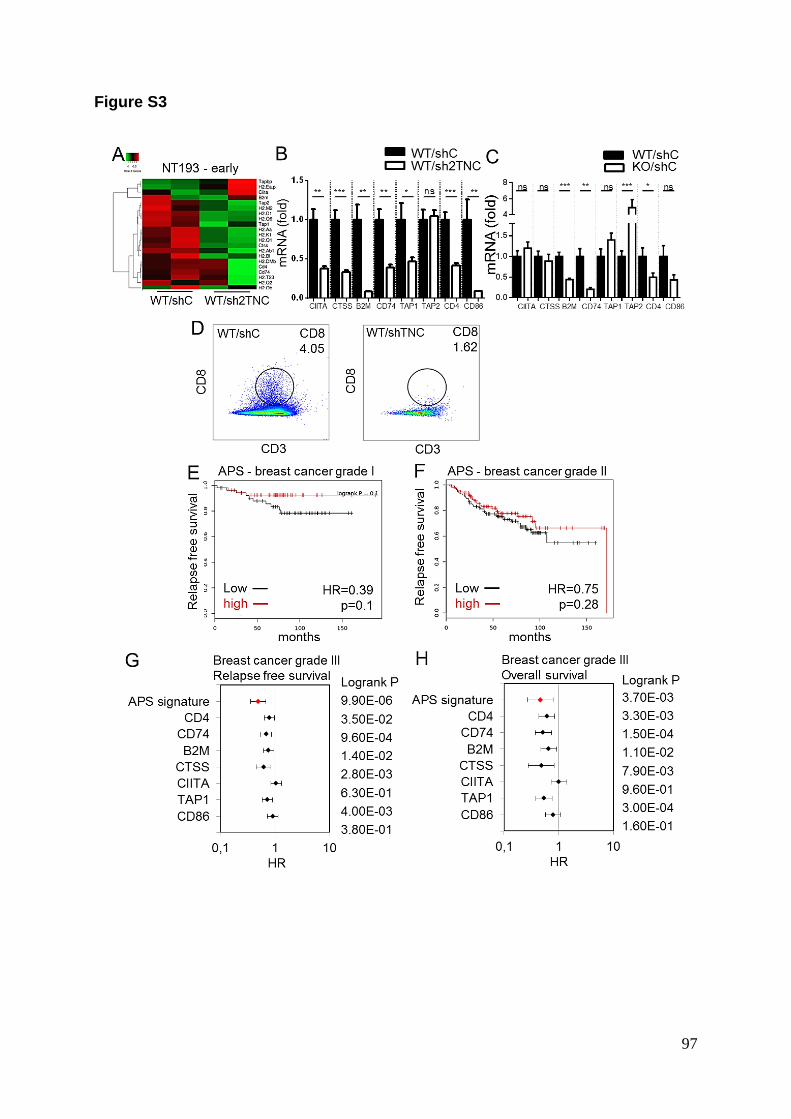
97
Figure S3
98
Figure S3. APS signature expression in murine tumors and breast cancer
patients. (A-C) Heatmap representing expression of the antigen processing and
presentation (APS)-related genes in early WT/shC and WT/sh2TNC tumors (N=2)
and comparative expression of selected genes in the chosen tumor groups (N=5) (B,
C). (D) Representative images of the FACS scatter plots of gated CD3+/CD8+ cells
in early WT/shC and WT/sh2TNC tumors. (E, F) Kaplan Meier relapse free survival
curves for expression of the APS signature below or above the median in breast
cancer patients with grade I (N=108 patients, HR=0.39, p=0.1) and grade II (N= 227
patients, HR=0.75, p=0.28) tumors. (G, H) Forest plots showing the hazard ratios for
expression of the APS signature (or single members of the signature) above the
median in breast cancer grade III patients and, in correlation to relapse free (F) or
overall survival (G), revealing the best HR value for the APS signature.

99
Figure S4
100
Figure S4. Characterization of late stage NT193 tumors (A, B) Comparative gene
ontology analysis of late stage WT/shC and WT/sh2TNC tumors showing the 10 most
significantly enriched gene annotations. (C, D) Representative single (C) or mosaic
(D) IF images of ECM and the indicated immune cells in late stage TNC-high
(WT/shC) and TNC-low (KO/sh2TNC) tumors (N=5). White arrows point at CD8+ T
cells present inside the tumor cell nest. Scale bar: 50 µm.
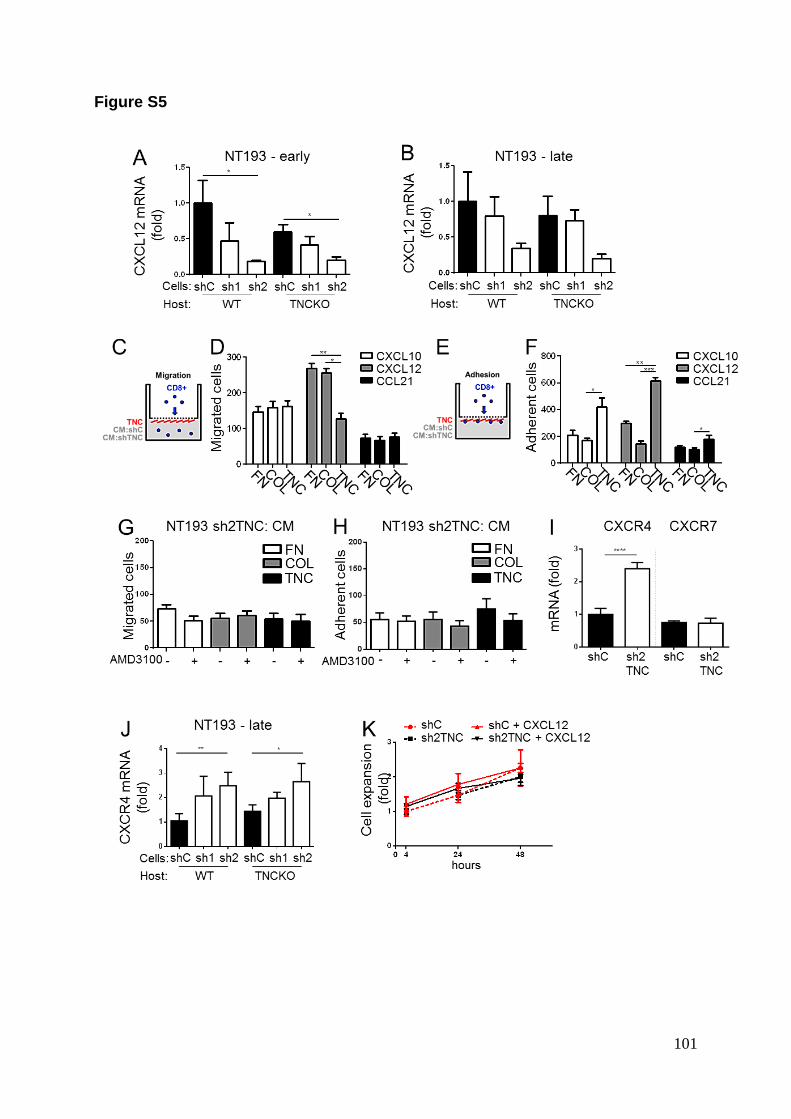
101
Figure S5

102
Figure S5. TNC upregulates expression of CXCL12 and impacts migration of
CD8+ T cells towards a CXCL12 gradient. (A, B) Expression of CXCL12 in early
(N=5) (A) and late (N=7) (B) NT193 tumors. (C-H) Boyden chamber transwell
migration assays of CD8+ T cells towards the corresponding chemokine gradient
(CXCL10, CXCL12, CCL21) (D, E) or CM from NT193:sh2TNC cells (G, H) and,
coating of the lower side of the insert by FN, Coll I and TNC, respectively (D, E). (C,
D) schematic representation of the experimental setup to determine the
attracted/floating and adherent cells towards a chemokine gradient (here depicted by
CM). Assessment of floating cells (C, D,G) and adherent cells (E, F, H) (N=3 in
duplicates). (I, J) Expression of CXCR4 (N=5) and CXCR7 (N=6) in cultured NT193
shC and sh2TNC cells (I) and in late stage NT193 tumors (J) by qRTPCR. (K) MTS
multiplicity assay for NT193 shC and sh2TNC cells upon treatment with recombinant
murine CXCL12 (N=3).
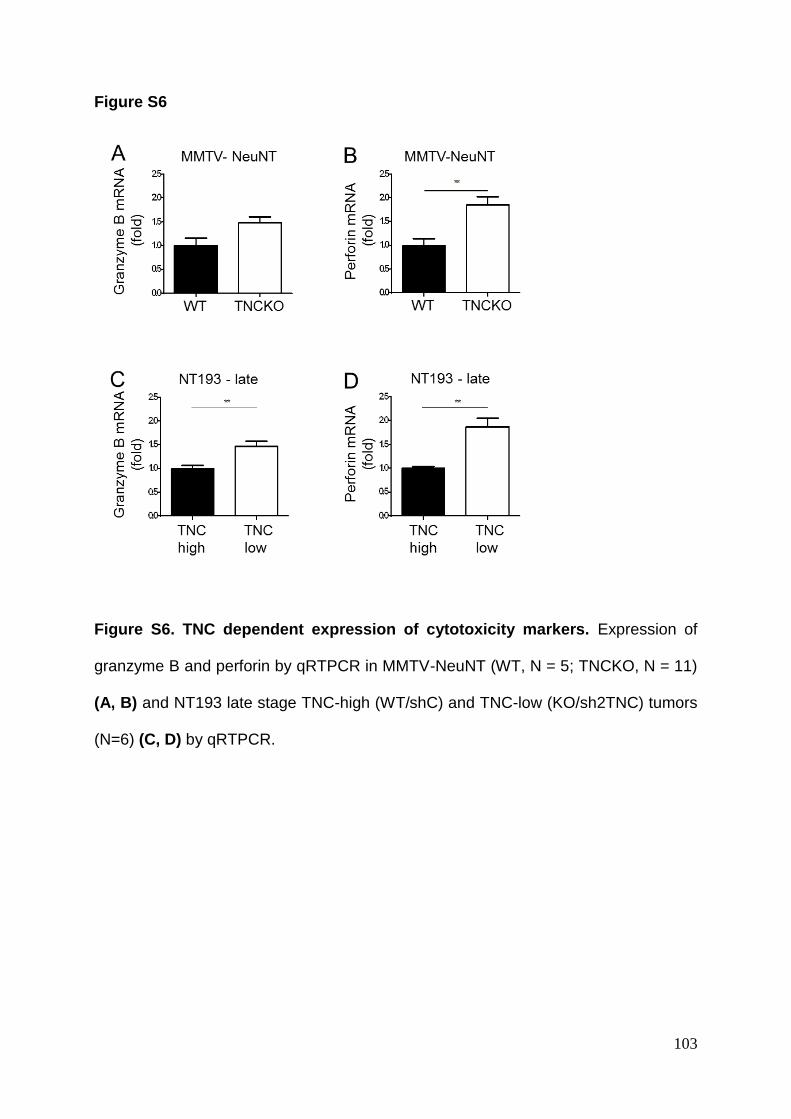
103
Figure S6
Figure S6. TNC dependent expression of cytotoxicity markers. Expression of
granzyme B and perforin by qRTPCR in MMTV-NeuNT (WT, N = 5; TNCKO, N = 11)
(A, B) and NT193 late stage TNC-high (WT/shC) and TNC-low (KO/sh2TNC) tumors
(N=6) (C, D) by qRTPCR.
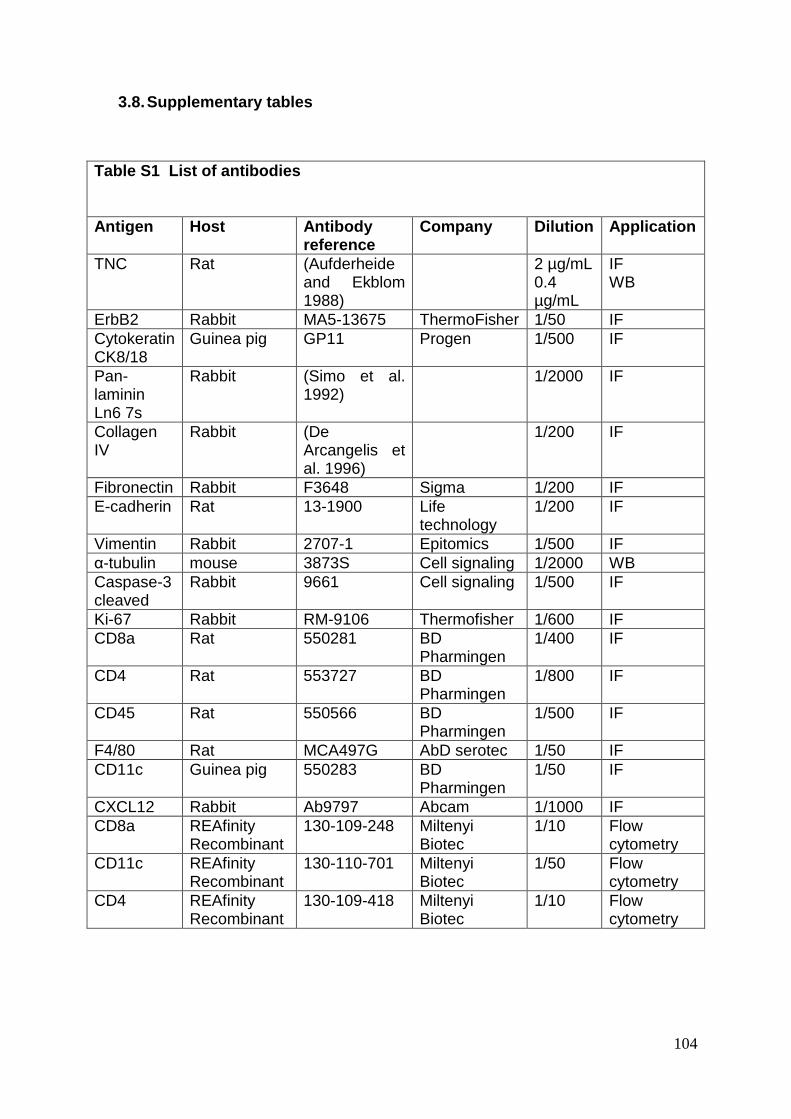
104
3.8. Supplementary tables
Table S1 List of antibodies
Antigen Host Antibody reference
Company Dilution Application
TNC Rat (Aufderheide and Ekblom 1988)
2 µg/mL 0.4 µg/mL
IF WB
ErbB2 Rabbit MA5-13675 ThermoFisher 1/50 IF
Cytokeratin CK8/18
Guinea pig GP11 Progen 1/500 IF
Pan-laminin Ln6 7s
Rabbit (Simo et al. 1992)
1/2000 IF
Collagen IV
Rabbit (De Arcangelis et al. 1996)
1/200 IF
Fibronectin Rabbit F3648 Sigma 1/200 IF
E-cadherin Rat 13-1900 Life technology
1/200
IF
Vimentin Rabbit 2707-1 Epitomics 1/500 IF
α-tubulin mouse 3873S Cell signaling 1/2000 WB
Caspase-3 cleaved
Rabbit 9661 Cell signaling 1/500 IF
Ki-67 Rabbit RM-9106 Thermofisher 1/600 IF
CD8a Rat 550281 BD Pharmingen
1/400 IF
CD4 Rat 553727 BD Pharmingen
1/800 IF
CD45 Rat 550566 BD Pharmingen
1/500 IF
F4/80 Rat MCA497G AbD serotec 1/50 IF
CD11c Guinea pig 550283 BD Pharmingen
1/50 IF
CXCL12 Rabbit Ab9797 Abcam 1/1000 IF
CD8a REAfinity Recombinant
130-109-248 Miltenyi Biotec
1/10 Flow cytometry
CD11c REAfinity Recombinant
130-110-701 Miltenyi Biotec
1/50 Flow cytometry
CD4 REAfinity Recombinant
130-109-418 Miltenyi Biotec
1/10 Flow cytometry
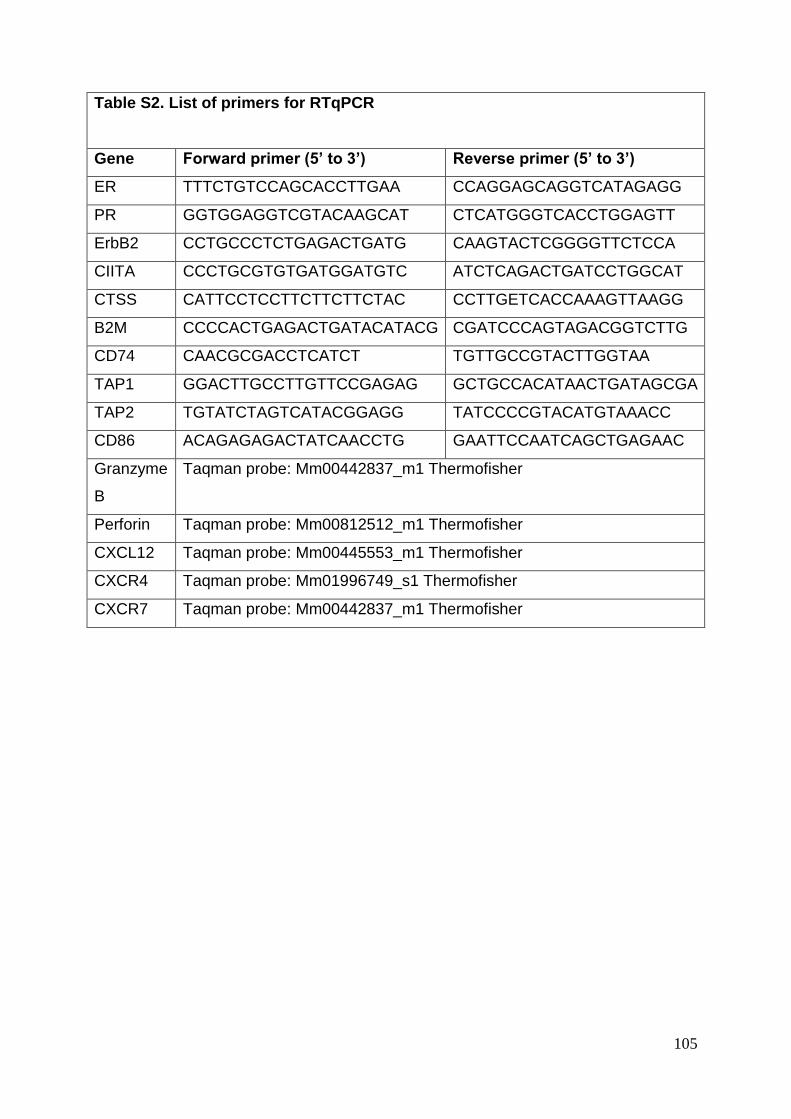
105
Table S2. List of primers for RTqPCR
Gene Forward primer (5’ to 3’) Reverse primer (5’ to 3’)
ER TTTCTGTCCAGCACCTTGAA CCAGGAGCAGGTCATAGAGG
PR GGTGGAGGTCGTACAAGCAT CTCATGGGTCACCTGGAGTT
ErbB2 CCTGCCCTCTGAGACTGATG CAAGTACTCGGGGTTCTCCA
CIITA CCCTGCGTGTGATGGATGTC ATCTCAGACTGATCCTGGCAT
CTSS CATTCCTCCTTCTTCTTCTAC CCTTGETCACCAAAGTTAAGG
B2M CCCCACTGAGACTGATACATACG CGATCCCAGTAGACGGTCTTG
CD74 CAACGCGACCTCATCT TGTTGCCGTACTTGGTAA
TAP1 GGACTTGCCTTGTTCCGAGAG GCTGCCACATAACTGATAGCGA
TAP2 TGTATCTAGTCATACGGAGG TATCCCCGTACATGTAAACC
CD86 ACAGAGAGACTATCAACCTG GAATTCCAATCAGCTGAGAAC
Granzyme
B
Taqman probe: Mm00442837_m1 Thermofisher
Perforin Taqman probe: Mm00812512_m1 Thermofisher
CXCL12 Taqman probe: Mm00445553_m1 Thermofisher
CXCR4 Taqman probe: Mm01996749_s1 Thermofisher
CXCR7 Taqman probe: Mm00442837_m1 Thermofisher
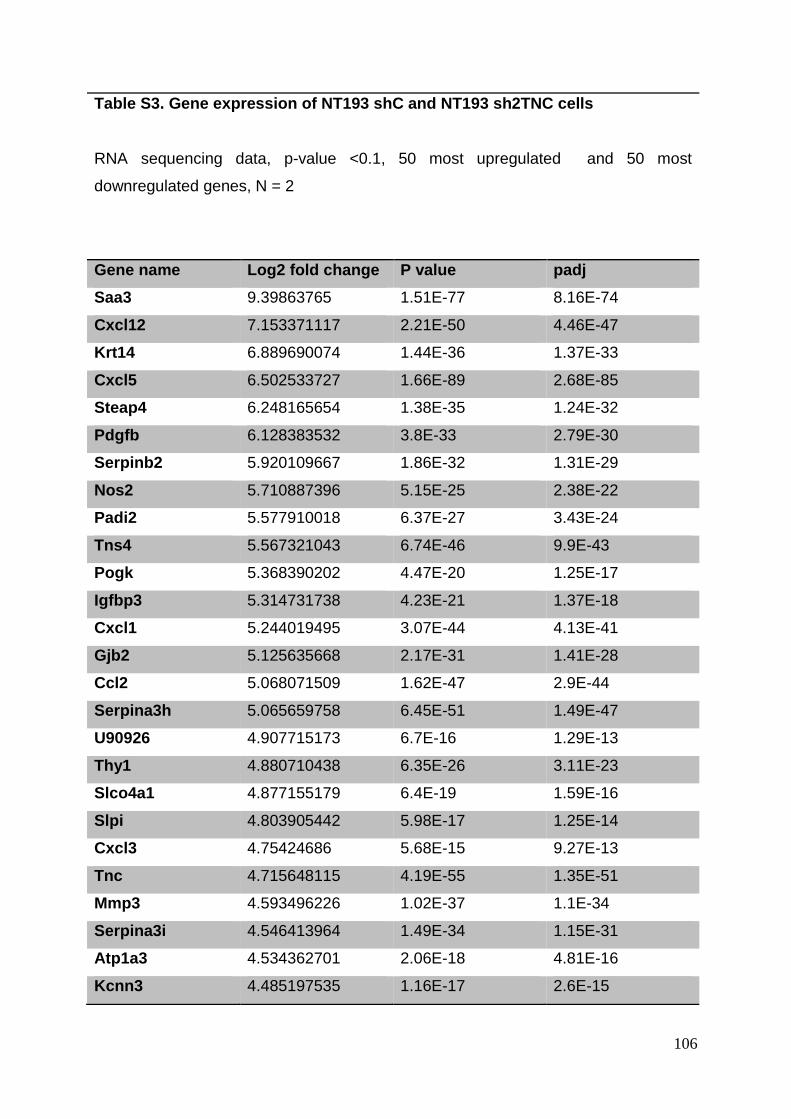
106
Table S3. Gene expression of NT193 shC and NT193 sh2TNC cells
RNA sequencing data, p-value <0.1, 50 most upregulated and 50 most
downregulated genes, N = 2
Gene name Log2 fold change P value padj
Saa3 9.39863765 1.51E-77 8.16E-74
Cxcl12 7.153371117 2.21E-50 4.46E-47
Krt14 6.889690074 1.44E-36 1.37E-33
Cxcl5 6.502533727 1.66E-89 2.68E-85
Steap4 6.248165654 1.38E-35 1.24E-32
Pdgfb 6.128383532 3.8E-33 2.79E-30
Serpinb2 5.920109667 1.86E-32 1.31E-29
Nos2 5.710887396 5.15E-25 2.38E-22
Padi2 5.577910018 6.37E-27 3.43E-24
Tns4 5.567321043 6.74E-46 9.9E-43
Pogk 5.368390202 4.47E-20 1.25E-17
Igfbp3 5.314731738 4.23E-21 1.37E-18
Cxcl1 5.244019495 3.07E-44 4.13E-41
Gjb2 5.125635668 2.17E-31 1.41E-28
Ccl2 5.068071509 1.62E-47 2.9E-44
Serpina3h 5.065659758 6.45E-51 1.49E-47
U90926 4.907715173 6.7E-16 1.29E-13
Thy1 4.880710438 6.35E-26 3.11E-23
Slco4a1 4.877155179 6.4E-19 1.59E-16
Slpi 4.803905442 5.98E-17 1.25E-14
Cxcl3 4.75424686 5.68E-15 9.27E-13
Tnc 4.715648115 4.19E-55 1.35E-51
Mmp3 4.593496226 1.02E-37 1.1E-34
Serpina3i 4.546413964 1.49E-34 1.15E-31
Atp1a3 4.534362701 2.06E-18 4.81E-16
Kcnn3 4.485197535 1.16E-17 2.6E-15

107
Tmem176b 4.456659166 3.11E-35 2.65E-32
Armcx4 4.442972183 2.67E-22 1E-19
Acap1 4.438714527 3.16E-17 6.71E-15
Mmp9 4.268628295 5.64E-23 2.4E-20
Klhdc8a 4.248934911 1.7E-15 3.09E-13
Stra6 4.238070222 8.16E-24 3.57E-21
Padi1 4.229427673 2.3E-12 2.66E-10
Itga2 4.177137739 3.28E-16 6.47E-14
Tnip3 4.169126714 3.39E-11 3.39E-09
Sod3 4.080621611 1.06E-36 1.07E-33
Lama3 4.072176543 8.99E-17 1.86E-14
Impg1 4.057481528 2.05E-10 1.75E-08
Ccdc68 4.053616554 1.47E-10 1.3E-08
Anxa8 3.980989005 6.27E-20 1.72E-17
Gria1 3.914980398 3.67E-13 4.95E-11
Bst1 3.893105957 2.58E-20 8.02E-18
Il13ra2 3.853183874 1.77E-09 1.26E-07
Epgn 3.831373897 1.59E-13 2.24E-11
Tlr7 3.817643962 9.43E-10 7.05E-08
Pde8a 3.811065211 2.78E-09 1.84E-07
Dapk1 3.80293621 6.63E-14 1E-11
Plekhs1 3.788679173 9.05E-11 8.17E-09
Slc16a2 3.771438654 2.76E-20 8.25E-18
Celsr1 3.767860636 1.92E-16 3.87E-14
Pik3r1 -0.740101131 0.014748 0.094116
Cpe -0.740300379 0.01319 0.086535
Sash1 -0.745227273 0.013369 0.087423
Egfr -0.746491969 0.012822 0.084945
Eef1a1 -0.748722012 0.014219 0.091587
Ndufb9 -0.761400241 0.013988 0.090413
Eps8 -0.762677013 0.014516 0.092896
Gas1 -0.762854031 0.010945 0.076393
Nt5dc2 -0.766239971 0.015742 0.098462
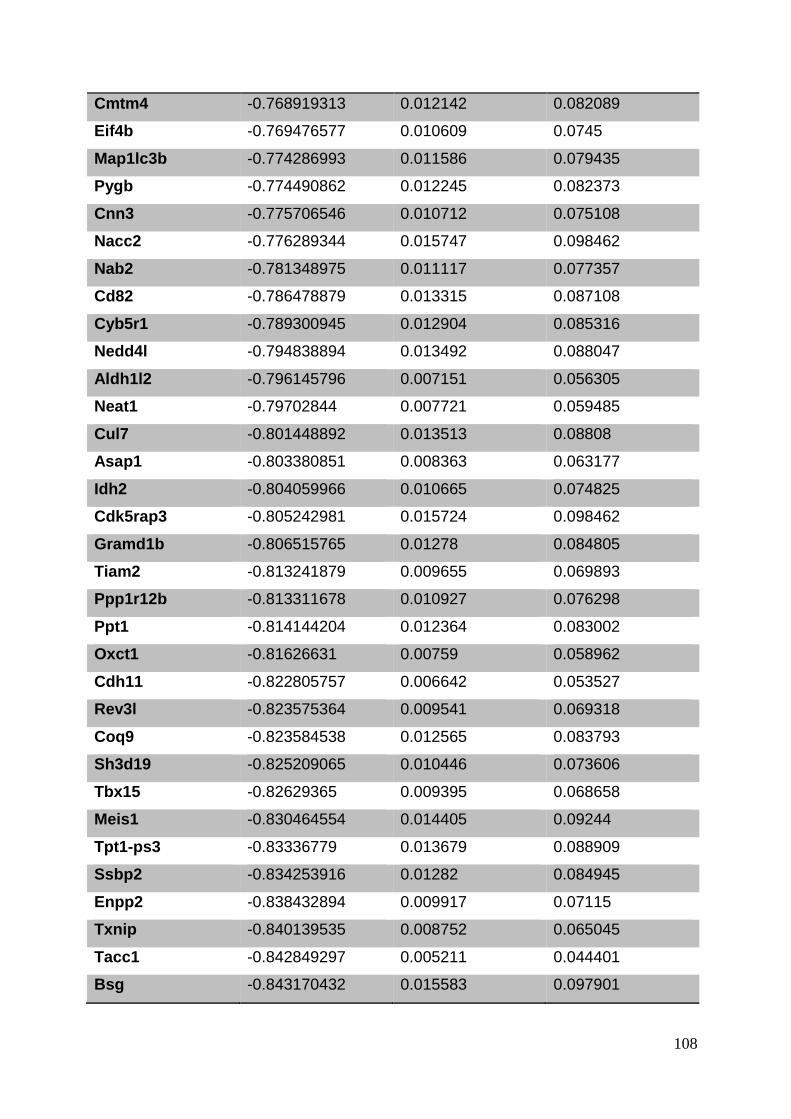
108
Cmtm4 -0.768919313 0.012142 0.082089
Eif4b -0.769476577 0.010609 0.0745
Map1lc3b -0.774286993 0.011586 0.079435
Pygb -0.774490862 0.012245 0.082373
Cnn3 -0.775706546 0.010712 0.075108
Nacc2 -0.776289344 0.015747 0.098462
Nab2 -0.781348975 0.011117 0.077357
Cd82 -0.786478879 0.013315 0.087108
Cyb5r1 -0.789300945 0.012904 0.085316
Nedd4l -0.794838894 0.013492 0.088047
Aldh1l2 -0.796145796 0.007151 0.056305
Neat1 -0.79702844 0.007721 0.059485
Cul7 -0.801448892 0.013513 0.08808
Asap1 -0.803380851 0.008363 0.063177
Idh2 -0.804059966 0.010665 0.074825
Cdk5rap3 -0.805242981 0.015724 0.098462
Gramd1b -0.806515765 0.01278 0.084805
Tiam2 -0.813241879 0.009655 0.069893
Ppp1r12b -0.813311678 0.010927 0.076298
Ppt1 -0.814144204 0.012364 0.083002
Oxct1 -0.81626631 0.00759 0.058962
Cdh11 -0.822805757 0.006642 0.053527
Rev3l -0.823575364 0.009541 0.069318
Coq9 -0.823584538 0.012565 0.083793
Sh3d19 -0.825209065 0.010446 0.073606
Tbx15 -0.82629365 0.009395 0.068658
Meis1 -0.830464554 0.014405 0.09244
Tpt1-ps3 -0.83336779 0.013679 0.088909
Ssbp2 -0.834253916 0.01282 0.084945
Enpp2 -0.838432894 0.009917 0.07115
Txnip -0.840139535 0.008752 0.065045
Tacc1 -0.842849297 0.005211 0.044401
Bsg -0.843170432 0.015583 0.097901
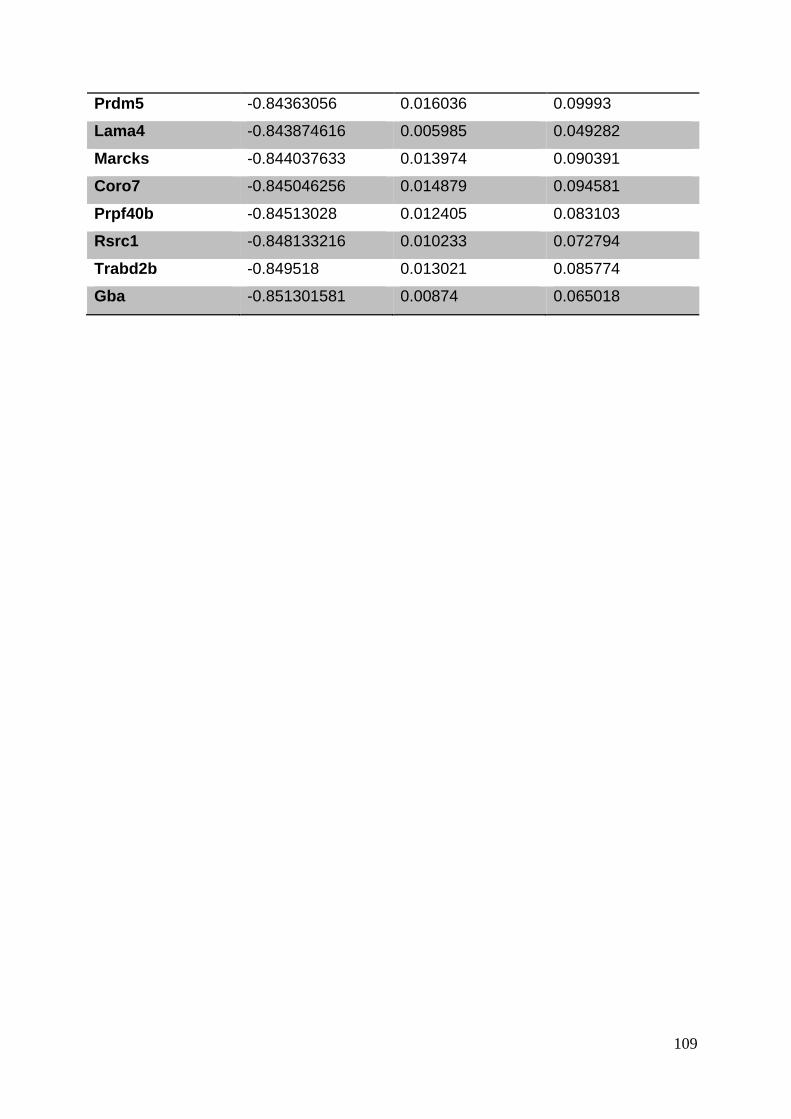
109
Prdm5 -0.84363056 0.016036 0.09993
Lama4 -0.843874616 0.005985 0.049282
Marcks -0.844037633 0.013974 0.090391
Coro7 -0.845046256 0.014879 0.094581
Prpf40b -0.84513028 0.012405 0.083103
Rsrc1 -0.848133216 0.010233 0.072794
Trabd2b -0.849518 0.013021 0.085774
Gba -0.851301581 0.00874 0.065018
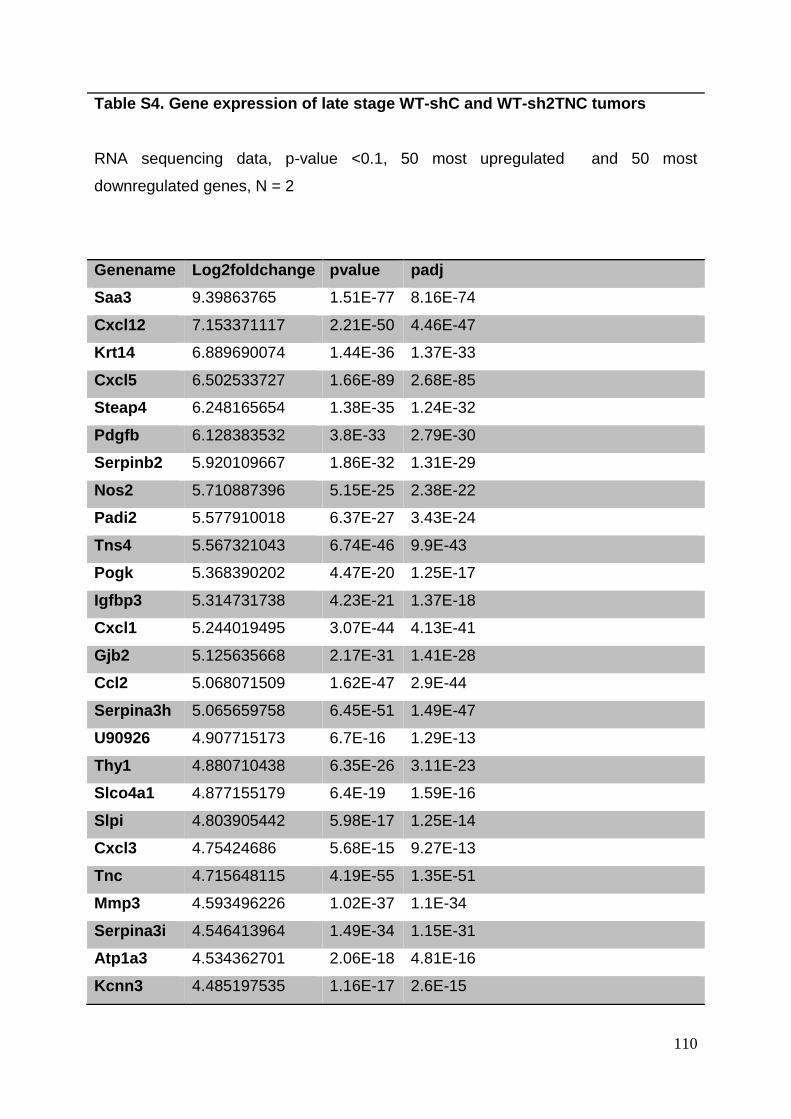
110
Table S4. Gene expression of late stage WT-shC and WT-sh2TNC tumors
RNA sequencing data, p-value <0.1, 50 most upregulated and 50 most
downregulated genes, N = 2
Genename Log2foldchange pvalue padj
Saa3 9.39863765 1.51E-77 8.16E-74
Cxcl12 7.153371117 2.21E-50 4.46E-47
Krt14 6.889690074 1.44E-36 1.37E-33
Cxcl5 6.502533727 1.66E-89 2.68E-85
Steap4 6.248165654 1.38E-35 1.24E-32
Pdgfb 6.128383532 3.8E-33 2.79E-30
Serpinb2 5.920109667 1.86E-32 1.31E-29
Nos2 5.710887396 5.15E-25 2.38E-22
Padi2 5.577910018 6.37E-27 3.43E-24
Tns4 5.567321043 6.74E-46 9.9E-43
Pogk 5.368390202 4.47E-20 1.25E-17
Igfbp3 5.314731738 4.23E-21 1.37E-18
Cxcl1 5.244019495 3.07E-44 4.13E-41
Gjb2 5.125635668 2.17E-31 1.41E-28
Ccl2 5.068071509 1.62E-47 2.9E-44
Serpina3h 5.065659758 6.45E-51 1.49E-47
U90926 4.907715173 6.7E-16 1.29E-13
Thy1 4.880710438 6.35E-26 3.11E-23
Slco4a1 4.877155179 6.4E-19 1.59E-16
Slpi 4.803905442 5.98E-17 1.25E-14
Cxcl3 4.75424686 5.68E-15 9.27E-13
Tnc 4.715648115 4.19E-55 1.35E-51
Mmp3 4.593496226 1.02E-37 1.1E-34
Serpina3i 4.546413964 1.49E-34 1.15E-31
Atp1a3 4.534362701 2.06E-18 4.81E-16
Kcnn3 4.485197535 1.16E-17 2.6E-15

111
Tmem176b 4.456659166 3.11E-35 2.65E-32
Armcx4 4.442972183 2.67E-22 1E-19
Acap1 4.438714527 3.16E-17 6.71E-15
Mmp9 4.268628295 5.64E-23 2.4E-20
Klhdc8a 4.248934911 1.7E-15 3.09E-13
Stra6 4.238070222 8.16E-24 3.57E-21
Padi1 4.229427673 2.3E-12 2.66E-10
Itga2 4.177137739 3.28E-16 6.47E-14
Tnip3 4.169126714 3.39E-11 3.39E-09
Sod3 4.080621611 1.06E-36 1.07E-33
Lama3 4.072176543 8.99E-17 1.86E-14
Impg1 4.057481528 2.05E-10 1.75E-08
Ccdc68 4.053616554 1.47E-10 1.3E-08
Anxa8 3.980989005 6.27E-20 1.72E-17
Gria1 3.914980398 3.67E-13 4.95E-11
Bst1 3.893105957 2.58E-20 8.02E-18
Il13ra2 3.853183874 1.77E-09 1.26E-07
Epgn 3.831373897 1.59E-13 2.24E-11
Tlr7 3.817643962 9.43E-10 7.05E-08
Pde8a 3.811065211 2.78E-09 1.84E-07
Dapk1 3.80293621 6.63E-14 1E-11
Plekhs1 3.788679173 9.05E-11 8.17E-09
Slc16a2 3.771438654 2.76E-20 8.25E-18
Celsr1 3.767860636 1.92E-16 3.87E-14
Pik3r1 -0.740101131 0.014748 0.094116
Cpe -0.740300379 0.01319 0.086535
Sash1 -0.745227273 0.013369 0.087423
Egfr -0.746491969 0.012822 0.084945
Eef1a1 -0.748722012 0.014219 0.091587
Ndufb9 -0.761400241 0.013988 0.090413
Eps8 -0.762677013 0.014516 0.092896
Gas1 -0.762854031 0.010945 0.076393
Nt5dc2 -0.766239971 0.015742 0.098462
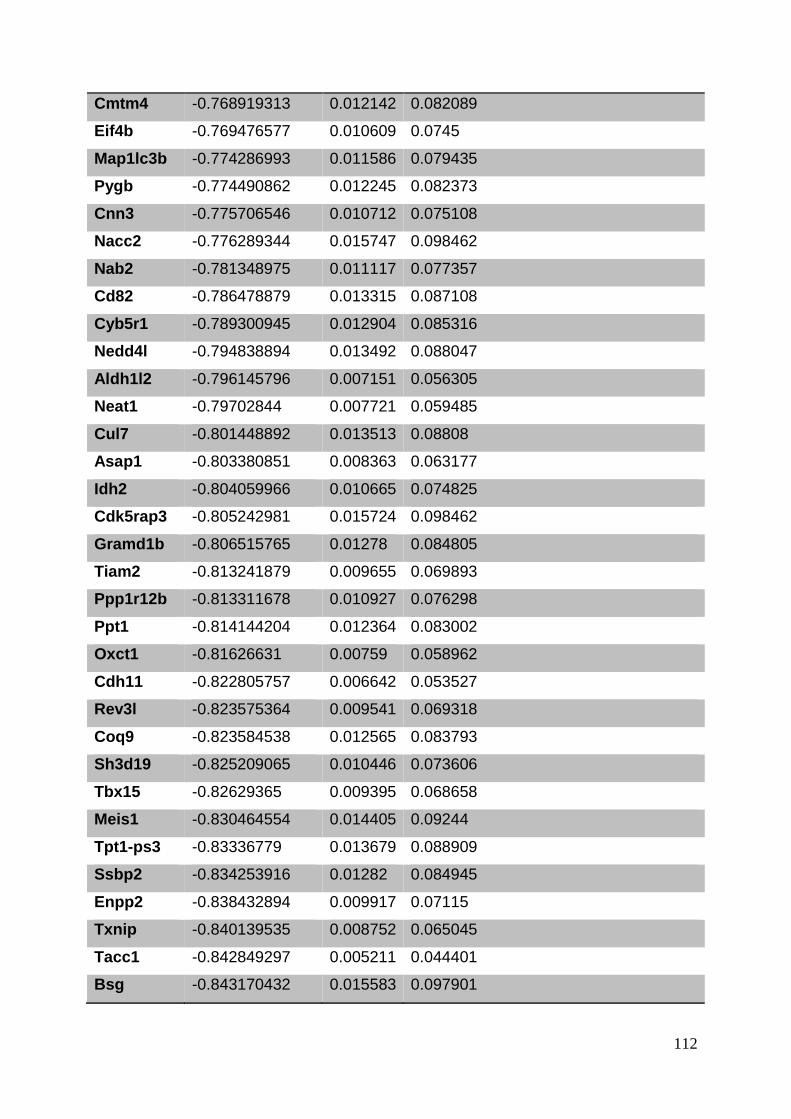
112
Cmtm4 -0.768919313 0.012142 0.082089
Eif4b -0.769476577 0.010609 0.0745
Map1lc3b -0.774286993 0.011586 0.079435
Pygb -0.774490862 0.012245 0.082373
Cnn3 -0.775706546 0.010712 0.075108
Nacc2 -0.776289344 0.015747 0.098462
Nab2 -0.781348975 0.011117 0.077357
Cd82 -0.786478879 0.013315 0.087108
Cyb5r1 -0.789300945 0.012904 0.085316
Nedd4l -0.794838894 0.013492 0.088047
Aldh1l2 -0.796145796 0.007151 0.056305
Neat1 -0.79702844 0.007721 0.059485
Cul7 -0.801448892 0.013513 0.08808
Asap1 -0.803380851 0.008363 0.063177
Idh2 -0.804059966 0.010665 0.074825
Cdk5rap3 -0.805242981 0.015724 0.098462
Gramd1b -0.806515765 0.01278 0.084805
Tiam2 -0.813241879 0.009655 0.069893
Ppp1r12b -0.813311678 0.010927 0.076298
Ppt1 -0.814144204 0.012364 0.083002
Oxct1 -0.81626631 0.00759 0.058962
Cdh11 -0.822805757 0.006642 0.053527
Rev3l -0.823575364 0.009541 0.069318
Coq9 -0.823584538 0.012565 0.083793
Sh3d19 -0.825209065 0.010446 0.073606
Tbx15 -0.82629365 0.009395 0.068658
Meis1 -0.830464554 0.014405 0.09244
Tpt1-ps3 -0.83336779 0.013679 0.088909
Ssbp2 -0.834253916 0.01282 0.084945
Enpp2 -0.838432894 0.009917 0.07115
Txnip -0.840139535 0.008752 0.065045
Tacc1 -0.842849297 0.005211 0.044401
Bsg -0.843170432 0.015583 0.097901
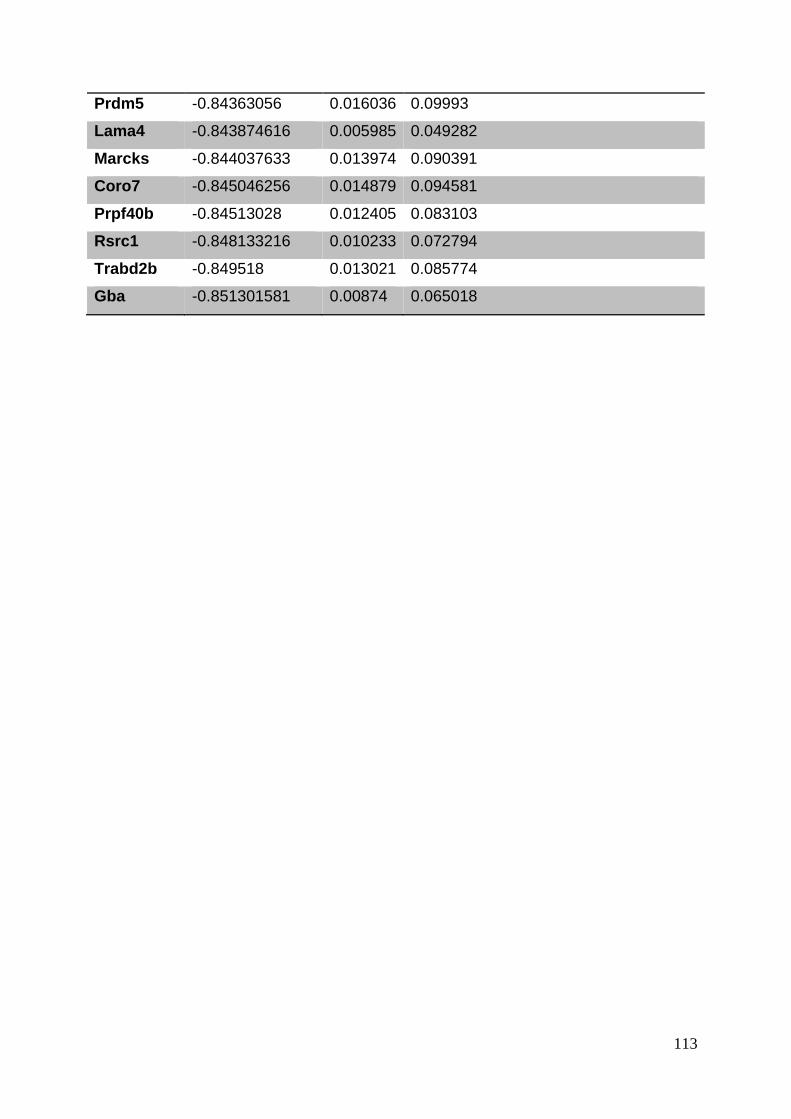
113
Prdm5 -0.84363056 0.016036 0.09993
Lama4 -0.843874616 0.005985 0.049282
Marcks -0.844037633 0.013974 0.090391
Coro7 -0.845046256 0.014879 0.094581
Prpf40b -0.84513028 0.012405 0.083103
Rsrc1 -0.848133216 0.010233 0.072794
Trabd2b -0.849518 0.013021 0.085774
Gba -0.851301581 0.00874 0.065018
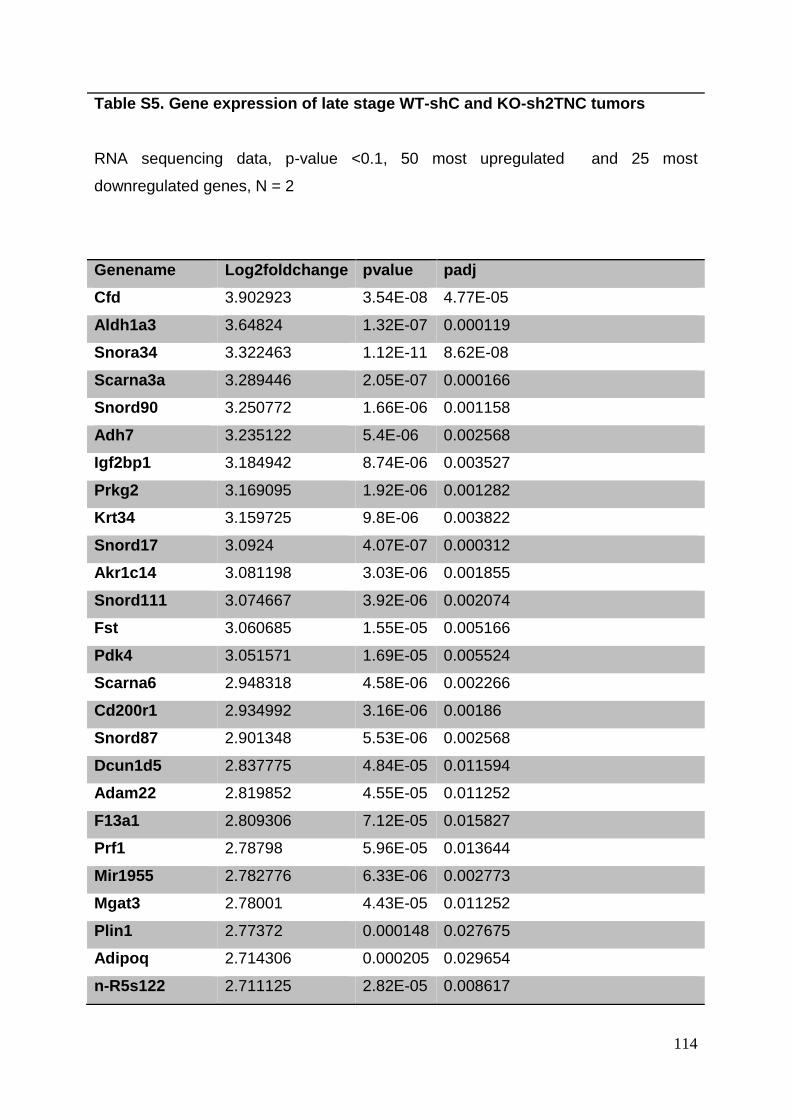
114
Table S5. Gene expression of late stage WT-shC and KO-sh2TNC tumors
RNA sequencing data, p-value <0.1, 50 most upregulated and 25 most
downregulated genes, N = 2
Genename Log2foldchange pvalue padj
Cfd 3.902923 3.54E-08 4.77E-05
Aldh1a3 3.64824 1.32E-07 0.000119
Snora34 3.322463 1.12E-11 8.62E-08
Scarna3a 3.289446 2.05E-07 0.000166
Snord90 3.250772 1.66E-06 0.001158
Adh7 3.235122 5.4E-06 0.002568
Igf2bp1 3.184942 8.74E-06 0.003527
Prkg2 3.169095 1.92E-06 0.001282
Krt34 3.159725 9.8E-06 0.003822
Snord17 3.0924 4.07E-07 0.000312
Akr1c14 3.081198 3.03E-06 0.001855
Snord111 3.074667 3.92E-06 0.002074
Fst 3.060685 1.55E-05 0.005166
Pdk4 3.051571 1.69E-05 0.005524
Scarna6 2.948318 4.58E-06 0.002266
Cd200r1 2.934992 3.16E-06 0.00186
Snord87 2.901348 5.53E-06 0.002568
Dcun1d5 2.837775 4.84E-05 0.011594
Adam22 2.819852 4.55E-05 0.011252
F13a1 2.809306 7.12E-05 0.015827
Prf1 2.78798 5.96E-05 0.013644
Mir1955 2.782776 6.33E-06 0.002773
Mgat3 2.78001 4.43E-05 0.011252
Plin1 2.77372 0.000148 0.027675
Adipoq 2.714306 0.000205 0.029654
n-R5s122 2.711125 2.82E-05 0.008617
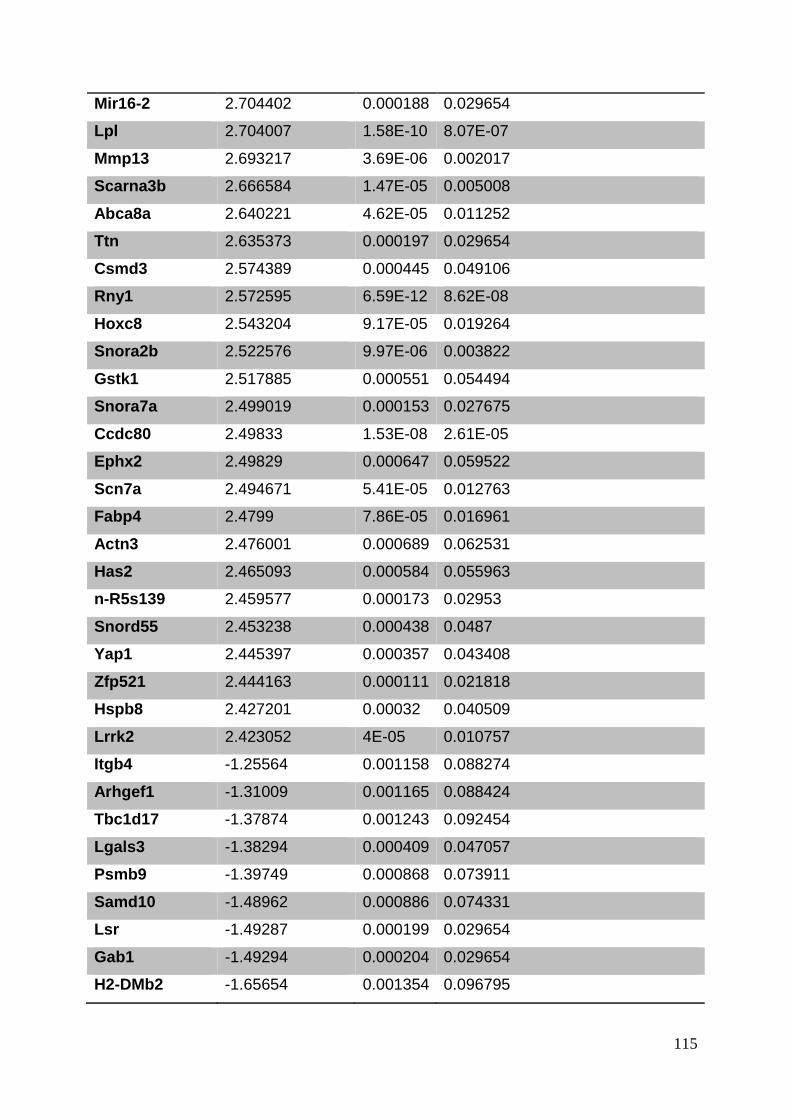
115
Mir16-2 2.704402 0.000188 0.029654
Lpl 2.704007 1.58E-10 8.07E-07
Mmp13 2.693217 3.69E-06 0.002017
Scarna3b 2.666584 1.47E-05 0.005008
Abca8a 2.640221 4.62E-05 0.011252
Ttn 2.635373 0.000197 0.029654
Csmd3 2.574389 0.000445 0.049106
Rny1 2.572595 6.59E-12 8.62E-08
Hoxc8 2.543204 9.17E-05 0.019264
Snora2b 2.522576 9.97E-06 0.003822
Gstk1 2.517885 0.000551 0.054494
Snora7a 2.499019 0.000153 0.027675
Ccdc80 2.49833 1.53E-08 2.61E-05
Ephx2 2.49829 0.000647 0.059522
Scn7a 2.494671 5.41E-05 0.012763
Fabp4 2.4799 7.86E-05 0.016961
Actn3 2.476001 0.000689 0.062531
Has2 2.465093 0.000584 0.055963
n-R5s139 2.459577 0.000173 0.02953
Snord55 2.453238 0.000438 0.0487
Yap1 2.445397 0.000357 0.043408
Zfp521 2.444163 0.000111 0.021818
Hspb8 2.427201 0.00032 0.040509
Lrrk2 2.423052 4E-05 0.010757
Itgb4 -1.25564 0.001158 0.088274
Arhgef1 -1.31009 0.001165 0.088424
Tbc1d17 -1.37874 0.001243 0.092454
Lgals3 -1.38294 0.000409 0.047057
Psmb9 -1.39749 0.000868 0.073911
Samd10 -1.48962 0.000886 0.074331
Lsr -1.49287 0.000199 0.029654
Gab1 -1.49294 0.000204 0.029654
H2-DMb2 -1.65654 0.001354 0.096795
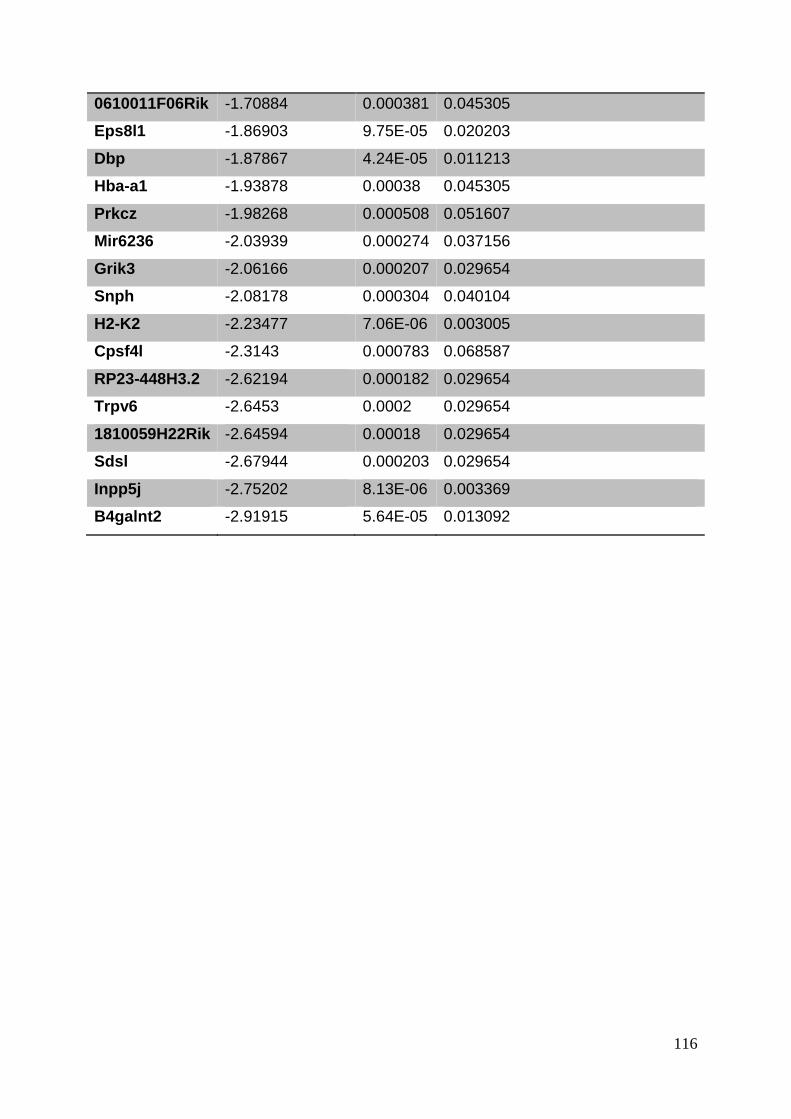
116
0610011F06Rik -1.70884 0.000381 0.045305
Eps8l1 -1.86903 9.75E-05 0.020203
Dbp -1.87867 4.24E-05 0.011213
Hba-a1 -1.93878 0.00038 0.045305
Prkcz -1.98268 0.000508 0.051607
Mir6236 -2.03939 0.000274 0.037156
Grik3 -2.06166 0.000207 0.029654
Snph -2.08178 0.000304 0.040104
H2-K2 -2.23477 7.06E-06 0.003005
Cpsf4l -2.3143 0.000783 0.068587
RP23-448H3.2 -2.62194 0.000182 0.029654
Trpv6 -2.6453 0.0002 0.029654
1810059H22Rik -2.64594 0.00018 0.029654
Sdsl -2.67944 0.000203 0.029654
Inpp5j -2.75202 8.13E-06 0.003369
B4galnt2 -2.91915 5.64E-05 0.013092
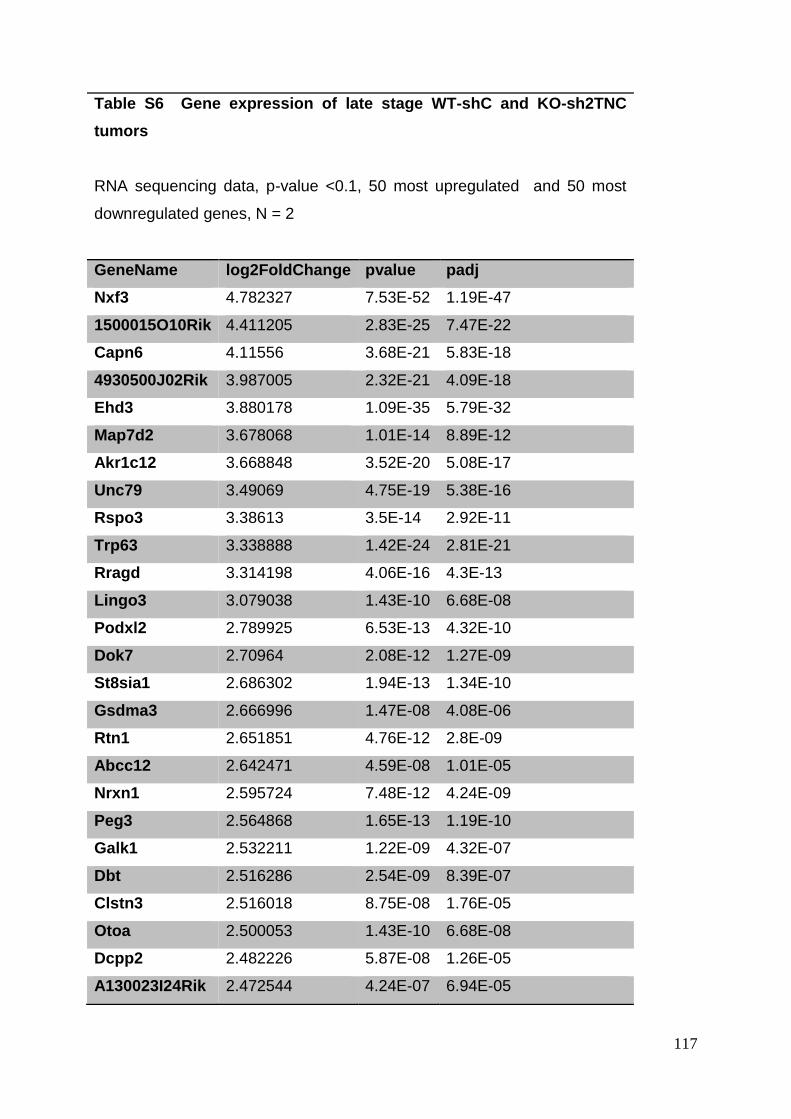
117
Table S6 Gene expression of late stage WT-shC and KO-sh2TNC
tumors
RNA sequencing data, p-value <0.1, 50 most upregulated and 50 most
downregulated genes, N = 2
GeneName log2FoldChange pvalue padj
Nxf3 4.782327 7.53E-52 1.19E-47
1500015O10Rik 4.411205 2.83E-25 7.47E-22
Capn6 4.11556 3.68E-21 5.83E-18
4930500J02Rik 3.987005 2.32E-21 4.09E-18
Ehd3 3.880178 1.09E-35 5.79E-32
Map7d2 3.678068 1.01E-14 8.89E-12
Akr1c12 3.668848 3.52E-20 5.08E-17
Unc79 3.49069 4.75E-19 5.38E-16
Rspo3 3.38613 3.5E-14 2.92E-11
Trp63 3.338888 1.42E-24 2.81E-21
Rragd 3.314198 4.06E-16 4.3E-13
Lingo3 3.079038 1.43E-10 6.68E-08
Podxl2 2.789925 6.53E-13 4.32E-10
Dok7 2.70964 2.08E-12 1.27E-09
St8sia1 2.686302 1.94E-13 1.34E-10
Gsdma3 2.666996 1.47E-08 4.08E-06
Rtn1 2.651851 4.76E-12 2.8E-09
Abcc12 2.642471 4.59E-08 1.01E-05
Nrxn1 2.595724 7.48E-12 4.24E-09
Peg3 2.564868 1.65E-13 1.19E-10
Galk1 2.532211 1.22E-09 4.32E-07
Dbt 2.516286 2.54E-09 8.39E-07
Clstn3 2.516018 8.75E-08 1.76E-05
Otoa 2.500053 1.43E-10 6.68E-08
Dcpp2 2.482226 5.87E-08 1.26E-05
A130023I24Rik 2.472544 4.24E-07 6.94E-05
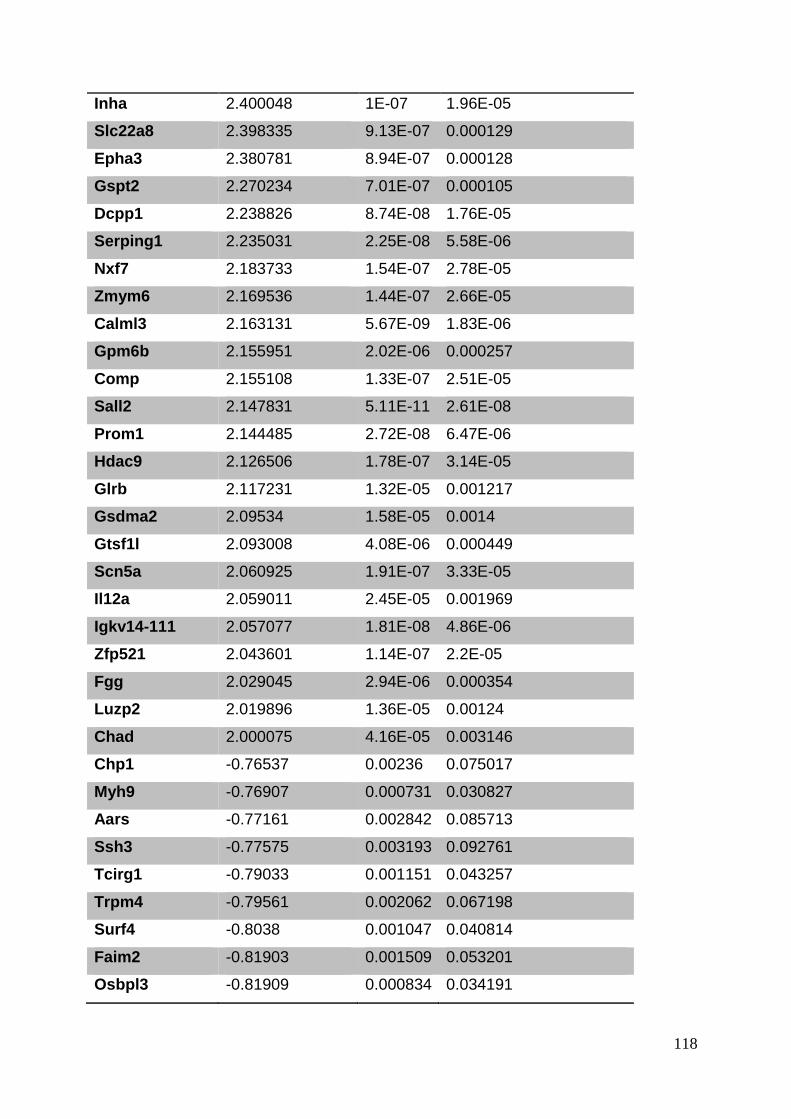
118
Inha 2.400048 1E-07 1.96E-05
Slc22a8 2.398335 9.13E-07 0.000129
Epha3 2.380781 8.94E-07 0.000128
Gspt2 2.270234 7.01E-07 0.000105
Dcpp1 2.238826 8.74E-08 1.76E-05
Serping1 2.235031 2.25E-08 5.58E-06
Nxf7 2.183733 1.54E-07 2.78E-05
Zmym6 2.169536 1.44E-07 2.66E-05
Calml3 2.163131 5.67E-09 1.83E-06
Gpm6b 2.155951 2.02E-06 0.000257
Comp 2.155108 1.33E-07 2.51E-05
Sall2 2.147831 5.11E-11 2.61E-08
Prom1 2.144485 2.72E-08 6.47E-06
Hdac9 2.126506 1.78E-07 3.14E-05
Glrb 2.117231 1.32E-05 0.001217
Gsdma2 2.09534 1.58E-05 0.0014
Gtsf1l 2.093008 4.08E-06 0.000449
Scn5a 2.060925 1.91E-07 3.33E-05
Il12a 2.059011 2.45E-05 0.001969
Igkv14-111 2.057077 1.81E-08 4.86E-06
Zfp521 2.043601 1.14E-07 2.2E-05
Fgg 2.029045 2.94E-06 0.000354
Luzp2 2.019896 1.36E-05 0.00124
Chad 2.000075 4.16E-05 0.003146
Chp1 -0.76537 0.00236 0.075017
Myh9 -0.76907 0.000731 0.030827
Aars -0.77161 0.002842 0.085713
Ssh3 -0.77575 0.003193 0.092761
Tcirg1 -0.79033 0.001151 0.043257
Trpm4 -0.79561 0.002062 0.067198
Surf4 -0.8038 0.001047 0.040814
Faim2 -0.81903 0.001509 0.053201
Osbpl3 -0.81909 0.000834 0.034191
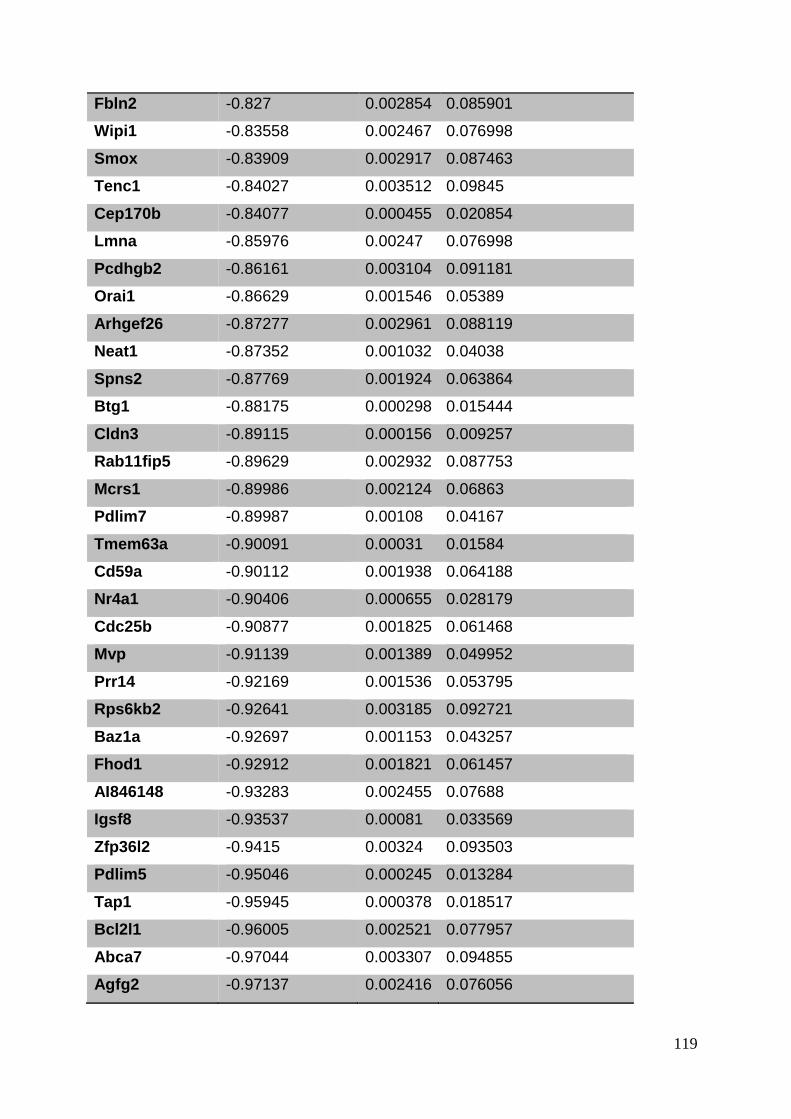
119
Fbln2 -0.827 0.002854 0.085901
Wipi1 -0.83558 0.002467 0.076998
Smox -0.83909 0.002917 0.087463
Tenc1 -0.84027 0.003512 0.09845
Cep170b -0.84077 0.000455 0.020854
Lmna -0.85976 0.00247 0.076998
Pcdhgb2 -0.86161 0.003104 0.091181
Orai1 -0.86629 0.001546 0.05389
Arhgef26 -0.87277 0.002961 0.088119
Neat1 -0.87352 0.001032 0.04038
Spns2 -0.87769 0.001924 0.063864
Btg1 -0.88175 0.000298 0.015444
Cldn3 -0.89115 0.000156 0.009257
Rab11fip5 -0.89629 0.002932 0.087753
Mcrs1 -0.89986 0.002124 0.06863
Pdlim7 -0.89987 0.00108 0.04167
Tmem63a -0.90091 0.00031 0.01584
Cd59a -0.90112 0.001938 0.064188
Nr4a1 -0.90406 0.000655 0.028179
Cdc25b -0.90877 0.001825 0.061468
Mvp -0.91139 0.001389 0.049952
Prr14 -0.92169 0.001536 0.053795
Rps6kb2 -0.92641 0.003185 0.092721
Baz1a -0.92697 0.001153 0.043257
Fhod1 -0.92912 0.001821 0.061457
AI846148 -0.93283 0.002455 0.07688
Igsf8 -0.93537 0.00081 0.033569
Zfp36l2 -0.9415 0.00324 0.093503
Pdlim5 -0.95046 0.000245 0.013284
Tap1 -0.95945 0.000378 0.018517
Bcl2l1 -0.96005 0.002521 0.077957
Abca7 -0.97044 0.003307 0.094855
Agfg2 -0.97137 0.002416 0.076056
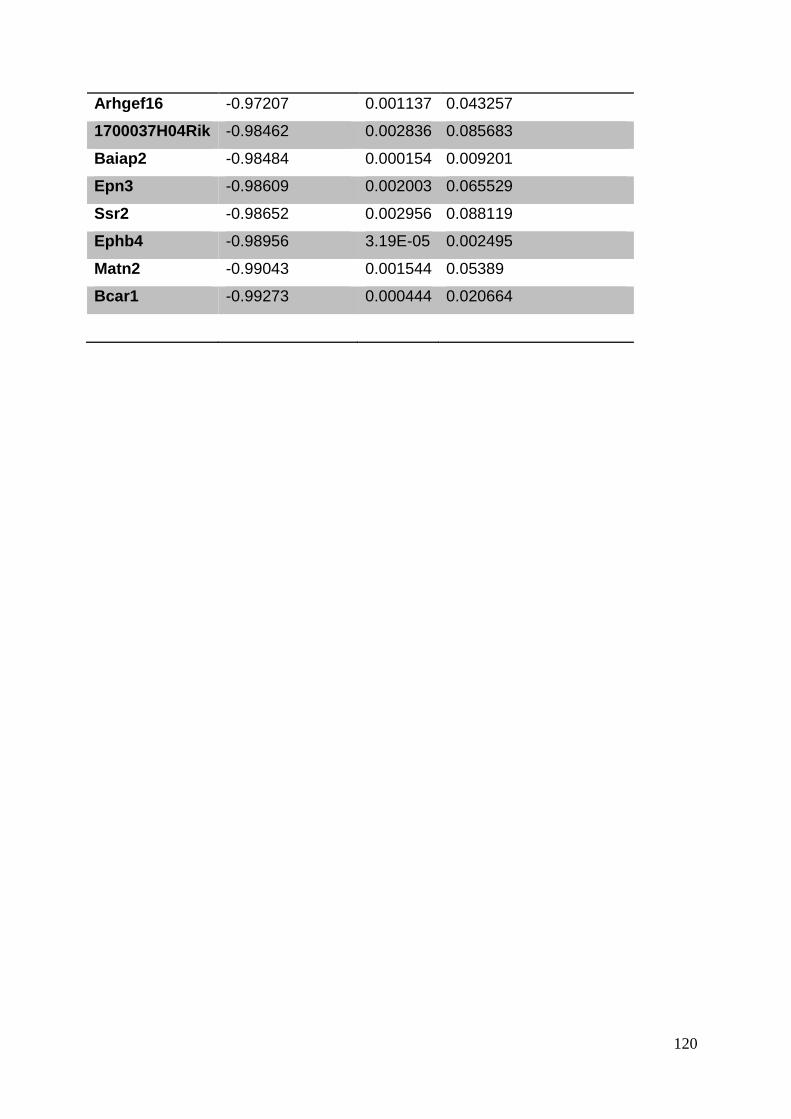
120
Arhgef16 -0.97207 0.001137 0.043257
1700037H04Rik -0.98462 0.002836 0.085683
Baiap2 -0.98484 0.000154 0.009201
Epn3 -0.98609 0.002003 0.065529
Ssr2 -0.98652 0.002956 0.088119
Ephb4 -0.98956 3.19E-05 0.002495
Matn2 -0.99043 0.001544 0.05389
Bcar1 -0.99273 0.000444 0.020664
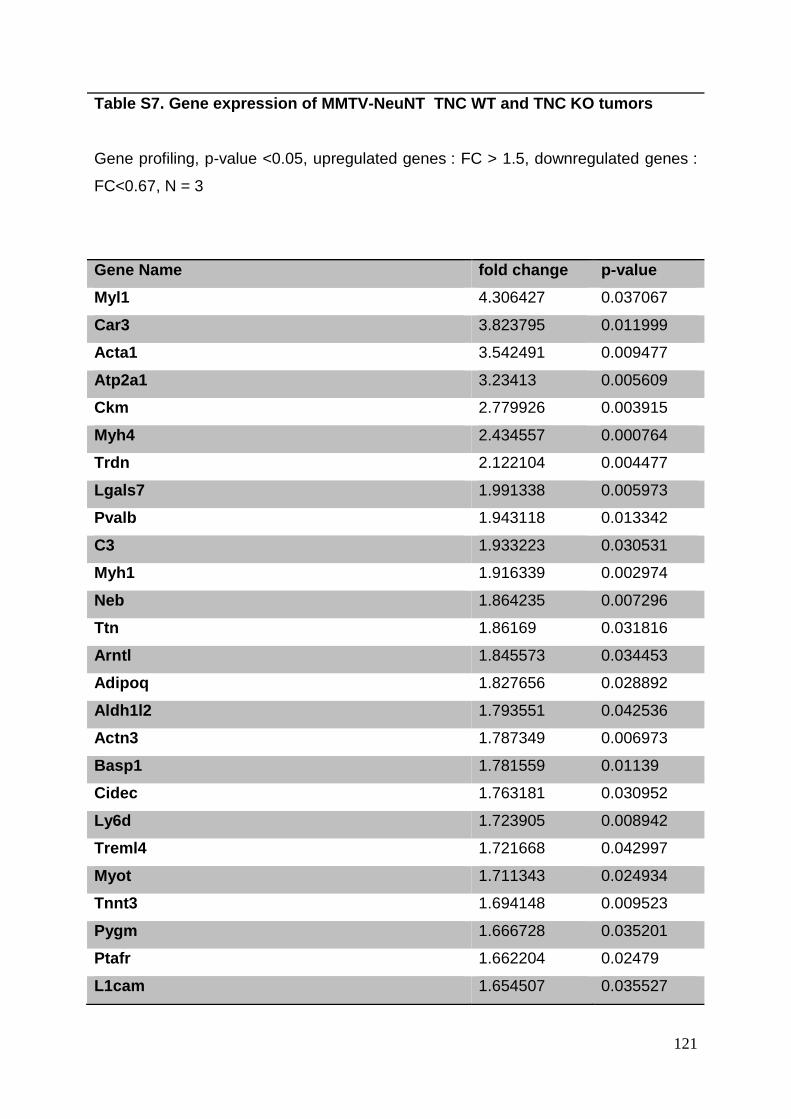
121
Table S7. Gene expression of MMTV-NeuNT TNC WT and TNC KO tumors
Gene profiling, p-value <0.05, upregulated genes : FC > 1.5, downregulated genes :
FC<0.67, N = 3
Gene Name fold change p-value
Myl1 4.306427 0.037067
Car3 3.823795 0.011999
Acta1 3.542491 0.009477
Atp2a1 3.23413 0.005609
Ckm 2.779926 0.003915
Myh4 2.434557 0.000764
Trdn 2.122104 0.004477
Lgals7 1.991338 0.005973
Pvalb 1.943118 0.013342
C3 1.933223 0.030531
Myh1 1.916339 0.002974
Neb 1.864235 0.007296
Ttn 1.86169 0.031816
Arntl 1.845573 0.034453
Adipoq 1.827656 0.028892
Aldh1l2 1.793551 0.042536
Actn3 1.787349 0.006973
Basp1 1.781559 0.01139
Cidec 1.763181 0.030952
Ly6d 1.723905 0.008942
Treml4 1.721668 0.042997
Myot 1.711343 0.024934
Tnnt3 1.694148 0.009523
Pygm 1.666728 0.035201
Ptafr 1.662204 0.02479
L1cam 1.654507 0.035527
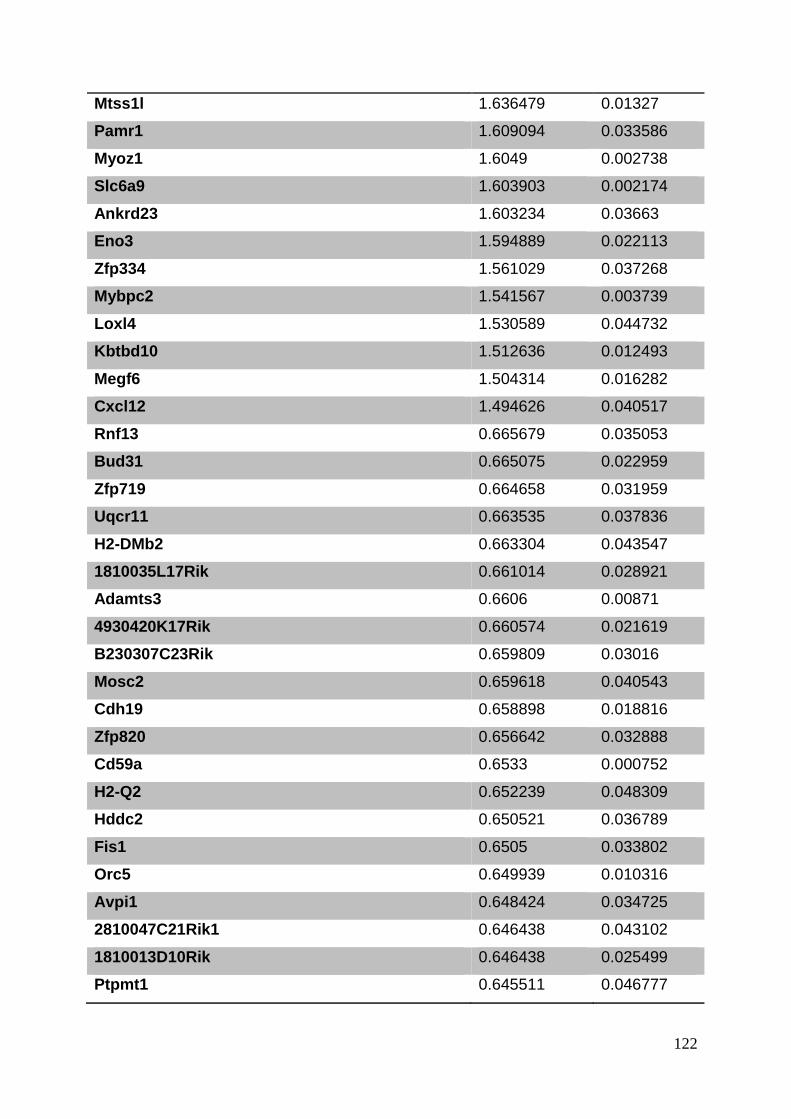
122
Mtss1l 1.636479 0.01327
Pamr1 1.609094 0.033586
Myoz1 1.6049 0.002738
Slc6a9 1.603903 0.002174
Ankrd23 1.603234 0.03663
Eno3 1.594889 0.022113
Zfp334 1.561029 0.037268
Mybpc2 1.541567 0.003739
Loxl4 1.530589 0.044732
Kbtbd10 1.512636 0.012493
Megf6 1.504314 0.016282
Cxcl12 1.494626 0.040517
Rnf13 0.665679 0.035053
Bud31 0.665075 0.022959
Zfp719 0.664658 0.031959
Uqcr11 0.663535 0.037836
H2-DMb2 0.663304 0.043547
1810035L17Rik 0.661014 0.028921
Adamts3 0.6606 0.00871
4930420K17Rik 0.660574 0.021619
B230307C23Rik 0.659809 0.03016
Mosc2 0.659618 0.040543
Cdh19 0.658898 0.018816
Zfp820 0.656642 0.032888
Cd59a 0.6533 0.000752
H2-Q2 0.652239 0.048309
Hddc2 0.650521 0.036789
Fis1 0.6505 0.033802
Orc5 0.649939 0.010316
Avpi1 0.648424 0.034725
2810047C21Rik1 0.646438 0.043102
1810013D10Rik 0.646438 0.025499
Ptpmt1 0.645511 0.046777
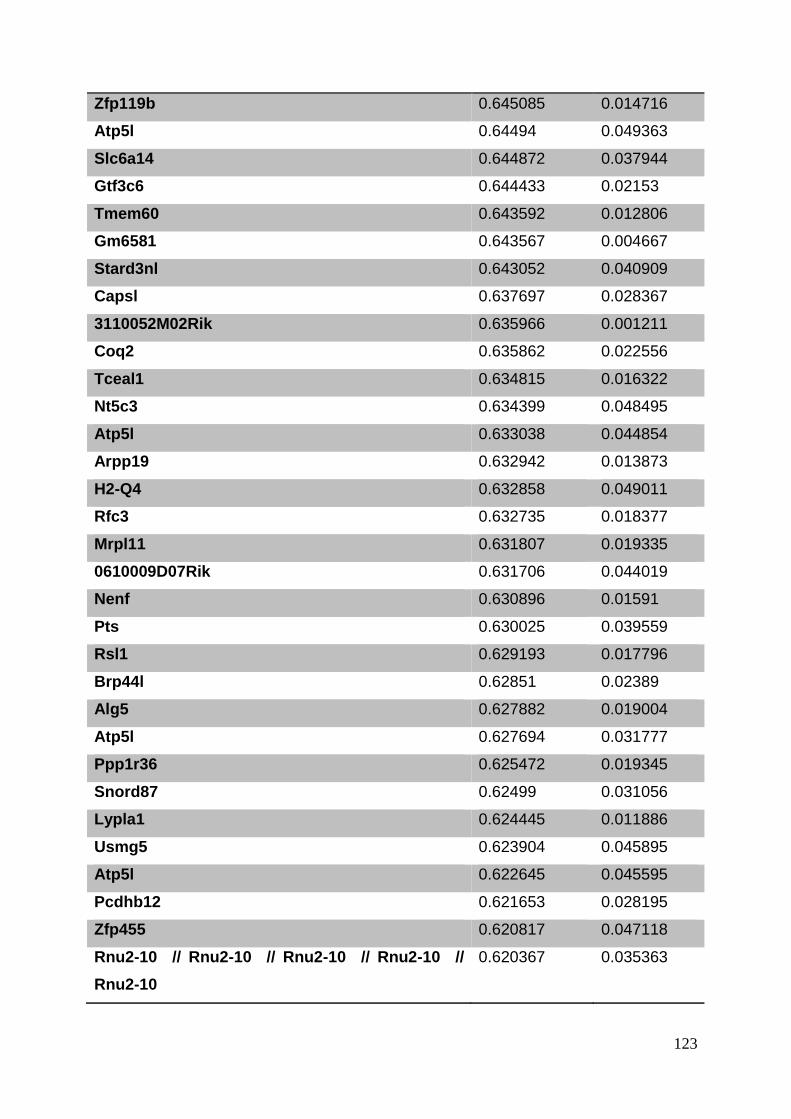
123
Zfp119b 0.645085 0.014716
Atp5l 0.64494 0.049363
Slc6a14 0.644872 0.037944
Gtf3c6 0.644433 0.02153
Tmem60 0.643592 0.012806
Gm6581 0.643567 0.004667
Stard3nl 0.643052 0.040909
Capsl 0.637697 0.028367
3110052M02Rik 0.635966 0.001211
Coq2 0.635862 0.022556
Tceal1 0.634815 0.016322
Nt5c3 0.634399 0.048495
Atp5l 0.633038 0.044854
Arpp19 0.632942 0.013873
H2-Q4 0.632858 0.049011
Rfc3 0.632735 0.018377
Mrpl11 0.631807 0.019335
0610009D07Rik 0.631706 0.044019
Nenf 0.630896 0.01591
Pts 0.630025 0.039559
Rsl1 0.629193 0.017796
Brp44l 0.62851 0.02389
Alg5 0.627882 0.019004
Atp5l 0.627694 0.031777
Ppp1r36 0.625472 0.019345
Snord87 0.62499 0.031056
Lypla1 0.624445 0.011886
Usmg5 0.623904 0.045895
Atp5l 0.622645 0.045595
Pcdhb12 0.621653 0.028195
Zfp455 0.620817 0.047118
Rnu2-10 // Rnu2-10 // Rnu2-10 // Rnu2-10 //
Rnu2-10
0.620367 0.035363
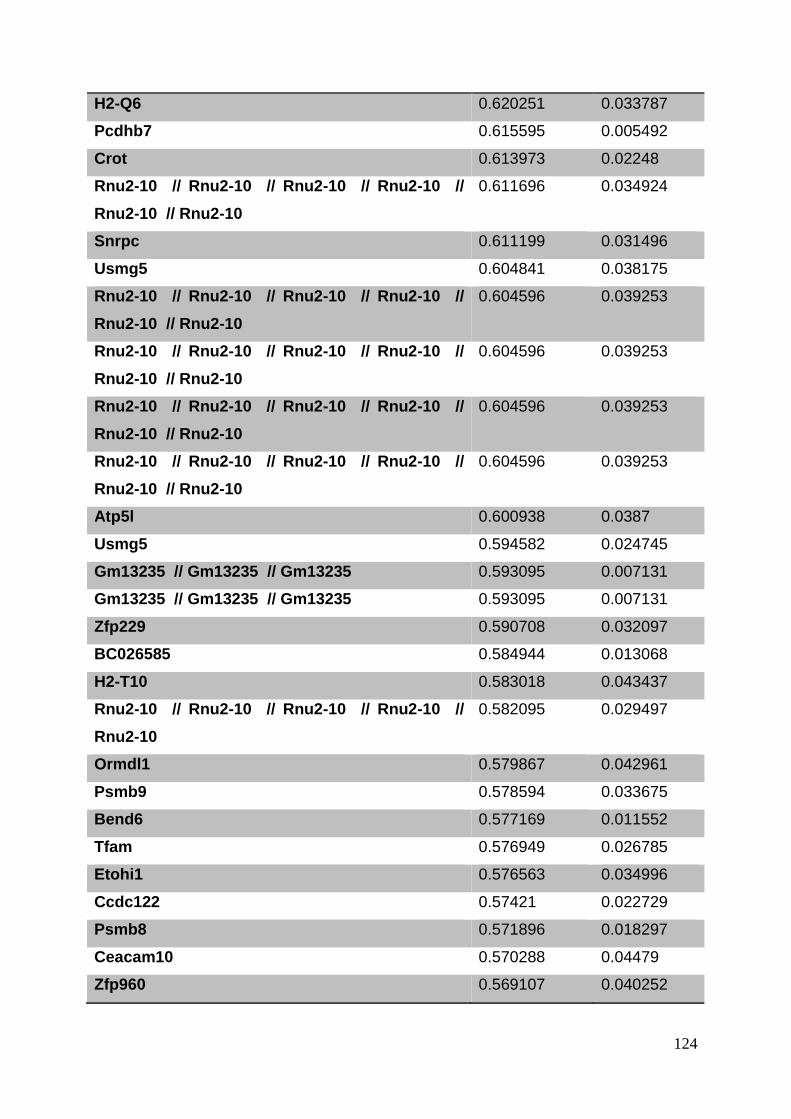
124
H2-Q6 0.620251 0.033787
Pcdhb7 0.615595 0.005492
Crot 0.613973 0.02248
Rnu2-10 // Rnu2-10 // Rnu2-10 // Rnu2-10 //
Rnu2-10 // Rnu2-10
0.611696 0.034924
Snrpc 0.611199 0.031496
Usmg5 0.604841 0.038175
Rnu2-10 // Rnu2-10 // Rnu2-10 // Rnu2-10 //
Rnu2-10 // Rnu2-10
0.604596 0.039253
Rnu2-10 // Rnu2-10 // Rnu2-10 // Rnu2-10 //
Rnu2-10 // Rnu2-10
0.604596 0.039253
Rnu2-10 // Rnu2-10 // Rnu2-10 // Rnu2-10 //
Rnu2-10 // Rnu2-10
0.604596 0.039253
Rnu2-10 // Rnu2-10 // Rnu2-10 // Rnu2-10 //
Rnu2-10 // Rnu2-10
0.604596 0.039253
Atp5l 0.600938 0.0387
Usmg5 0.594582 0.024745
Gm13235 // Gm13235 // Gm13235 0.593095 0.007131
Gm13235 // Gm13235 // Gm13235 0.593095 0.007131
Zfp229 0.590708 0.032097
BC026585 0.584944 0.013068
H2-T10 0.583018 0.043437
Rnu2-10 // Rnu2-10 // Rnu2-10 // Rnu2-10 //
Rnu2-10
0.582095 0.029497
Ormdl1 0.579867 0.042961
Psmb9 0.578594 0.033675
Bend6 0.577169 0.011552
Tfam 0.576949 0.026785
Etohi1 0.576563 0.034996
Ccdc122 0.57421 0.022729
Psmb8 0.571896 0.018297
Ceacam10 0.570288 0.04479
Zfp960 0.569107 0.040252
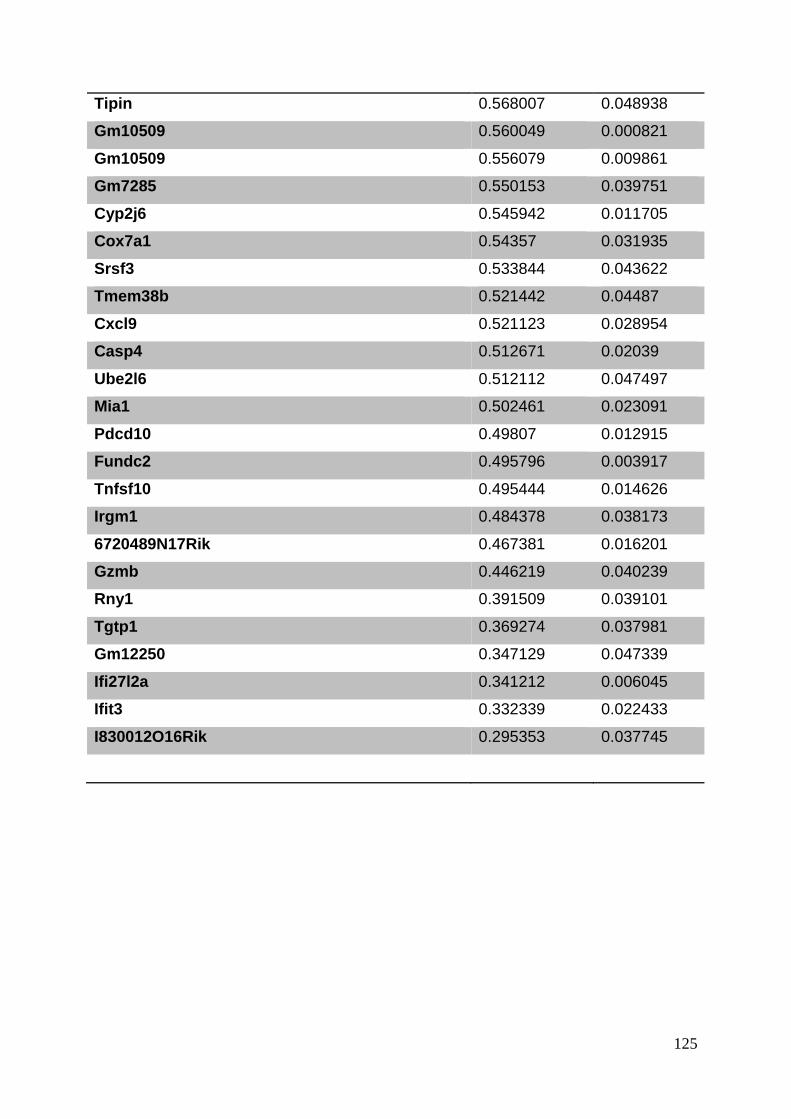
125
Tipin 0.568007 0.048938
Gm10509 0.560049 0.000821
Gm10509 0.556079 0.009861
Gm7285 0.550153 0.039751
Cyp2j6 0.545942 0.011705
Cox7a1 0.54357 0.031935
Srsf3 0.533844 0.043622
Tmem38b 0.521442 0.04487
Cxcl9 0.521123 0.028954
Casp4 0.512671 0.02039
Ube2l6 0.512112 0.047497
Mia1 0.502461 0.023091
Pdcd10 0.49807 0.012915
Fundc2 0.495796 0.003917
Tnfsf10 0.495444 0.014626
Irgm1 0.484378 0.038173
6720489N17Rik 0.467381 0.016201
Gzmb 0.446219 0.040239
Rny1 0.391509 0.039101
Tgtp1 0.369274 0.037981
Gm12250 0.347129 0.047339
Ifi27l2a 0.341212 0.006045
Ifit3 0.332339 0.022433
I830012O16Rik 0.295353 0.037745
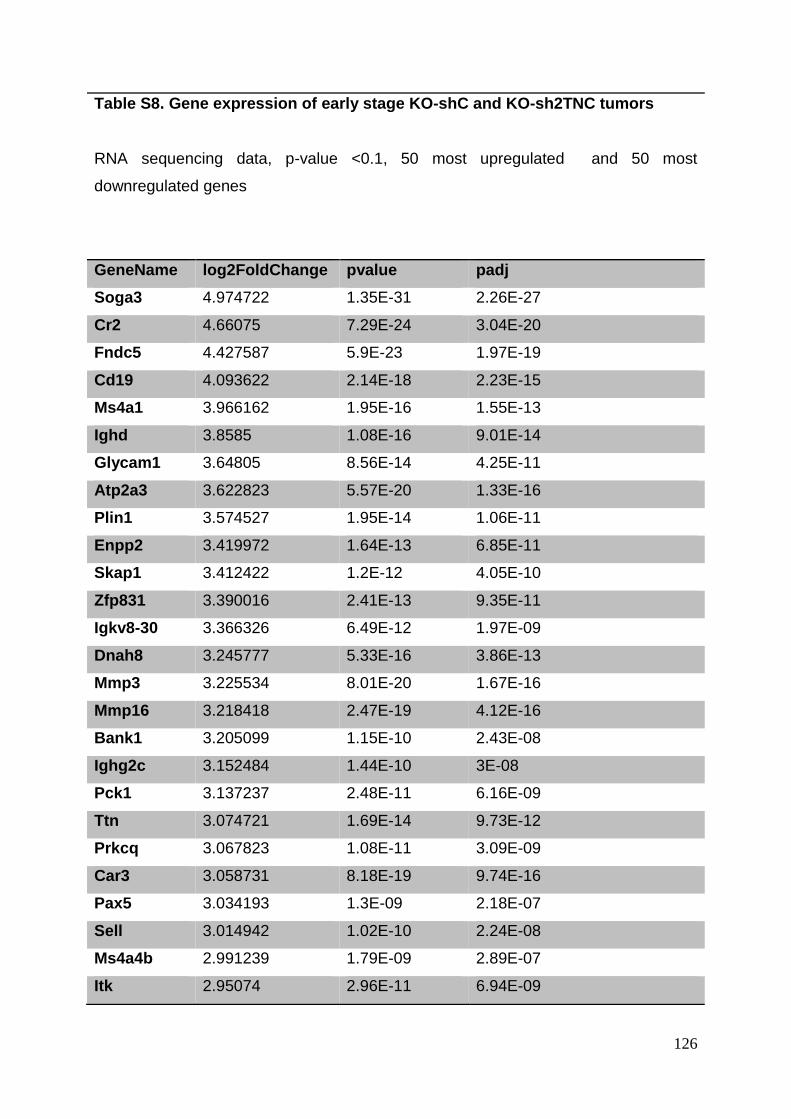
126
Table S8. Gene expression of early stage KO-shC and KO-sh2TNC tumors
RNA sequencing data, p-value <0.1, 50 most upregulated and 50 most
downregulated genes
GeneName log2FoldChange pvalue padj
Soga3 4.974722 1.35E-31 2.26E-27
Cr2 4.66075 7.29E-24 3.04E-20
Fndc5 4.427587 5.9E-23 1.97E-19
Cd19 4.093622 2.14E-18 2.23E-15
Ms4a1 3.966162 1.95E-16 1.55E-13
Ighd 3.8585 1.08E-16 9.01E-14
Glycam1 3.64805 8.56E-14 4.25E-11
Atp2a3 3.622823 5.57E-20 1.33E-16
Plin1 3.574527 1.95E-14 1.06E-11
Enpp2 3.419972 1.64E-13 6.85E-11
Skap1 3.412422 1.2E-12 4.05E-10
Zfp831 3.390016 2.41E-13 9.35E-11
Igkv8-30 3.366326 6.49E-12 1.97E-09
Dnah8 3.245777 5.33E-16 3.86E-13
Mmp3 3.225534 8.01E-20 1.67E-16
Mmp16 3.218418 2.47E-19 4.12E-16
Bank1 3.205099 1.15E-10 2.43E-08
Ighg2c 3.152484 1.44E-10 3E-08
Pck1 3.137237 2.48E-11 6.16E-09
Ttn 3.074721 1.69E-14 9.73E-12
Prkcq 3.067823 1.08E-11 3.09E-09
Car3 3.058731 8.18E-19 9.74E-16
Pax5 3.034193 1.3E-09 2.18E-07
Sell 3.014942 1.02E-10 2.24E-08
Ms4a4b 2.991239 1.79E-09 2.89E-07
Itk 2.95074 2.96E-11 6.94E-09
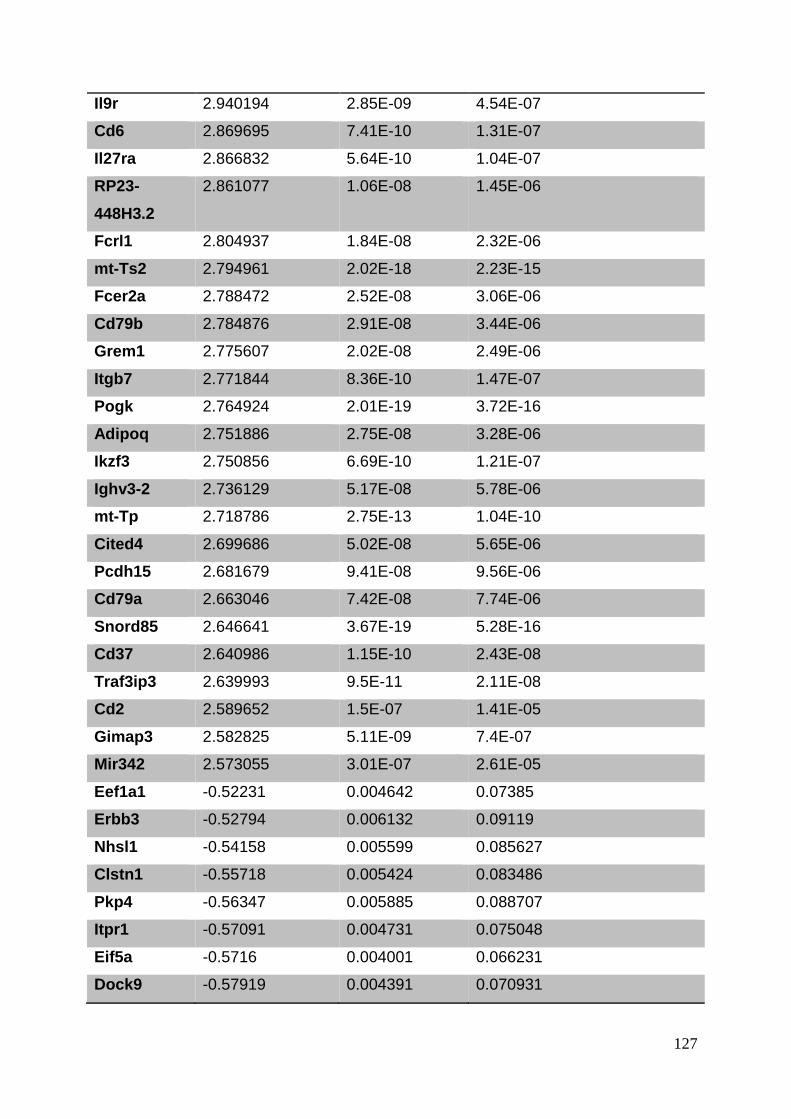
127
Il9r 2.940194 2.85E-09 4.54E-07
Cd6 2.869695 7.41E-10 1.31E-07
Il27ra 2.866832 5.64E-10 1.04E-07
RP23-
448H3.2
2.861077 1.06E-08 1.45E-06
Fcrl1 2.804937 1.84E-08 2.32E-06
mt-Ts2 2.794961 2.02E-18 2.23E-15
Fcer2a 2.788472 2.52E-08 3.06E-06
Cd79b 2.784876 2.91E-08 3.44E-06
Grem1 2.775607 2.02E-08 2.49E-06
Itgb7 2.771844 8.36E-10 1.47E-07
Pogk 2.764924 2.01E-19 3.72E-16
Adipoq 2.751886 2.75E-08 3.28E-06
Ikzf3 2.750856 6.69E-10 1.21E-07
Ighv3-2 2.736129 5.17E-08 5.78E-06
mt-Tp 2.718786 2.75E-13 1.04E-10
Cited4 2.699686 5.02E-08 5.65E-06
Pcdh15 2.681679 9.41E-08 9.56E-06
Cd79a 2.663046 7.42E-08 7.74E-06
Snord85 2.646641 3.67E-19 5.28E-16
Cd37 2.640986 1.15E-10 2.43E-08
Traf3ip3 2.639993 9.5E-11 2.11E-08
Cd2 2.589652 1.5E-07 1.41E-05
Gimap3 2.582825 5.11E-09 7.4E-07
Mir342 2.573055 3.01E-07 2.61E-05
Eef1a1 -0.52231 0.004642 0.07385
Erbb3 -0.52794 0.006132 0.09119
Nhsl1 -0.54158 0.005599 0.085627
Clstn1 -0.55718 0.005424 0.083486
Pkp4 -0.56347 0.005885 0.088707
Itpr1 -0.57091 0.004731 0.075048
Eif5a -0.5716 0.004001 0.066231
Dock9 -0.57919 0.004391 0.070931

128
Lphn3 -0.58639 0.004545 0.072572
Rpl6 -0.58918 0.004893 0.077174
Rpl18a -0.59109 0.004417 0.071151
Galnt3 -0.59508 0.005412 0.083486
Acox2 -0.59834 0.00624 0.092242
Col16a1 -0.60104 0.005306 0.082207
Rpl5 -0.60478 0.004357 0.070725
Ncl -0.60618 0.006908 0.098182
Hdac11 -0.6102 0.006347 0.093471
Ppia -0.61881 0.002777 0.050412
Slc7a5 -0.62389 0.006241 0.092242
Sel1l -0.62533 0.001109 0.02474
Txndc5 -0.62882 0.002467 0.046109
Otub1 -0.62931 0.006641 0.096272
Gpr126 -0.62967 0.004398 0.070974
Hgsnat -0.63477 0.006622 0.096081
Neo1 -0.63571 0.001913 0.037554
Rab11fip4 -0.6366 0.003743 0.063025
Tmed10 -0.6377 0.004057 0.067097
Esrp2 -0.64227 0.004373 0.070909
Copz1 -0.64451 0.00438 0.070931
Rpl36a -0.64933 0.006772 0.096991
Srsf3 -0.6501 0.002371 0.044654
Pdcd4 -0.65307 0.006739 0.096597
Gnl3l -0.65714 0.0022 0.042065
Aldoa -0.66287 0.002526 0.047023
Copg2 -0.66665 0.005383 0.083169
Esyt3 -0.67675 0.004668 0.074187
Lars -0.6785 0.003053 0.054179
Eid1 -0.68088 0.001728 0.034884
Ctcf -0.68175 0.004288 0.069886
Phgdh -0.69082 0.006968 0.09895
Taf1d -0.69302 0.00573 0.087006
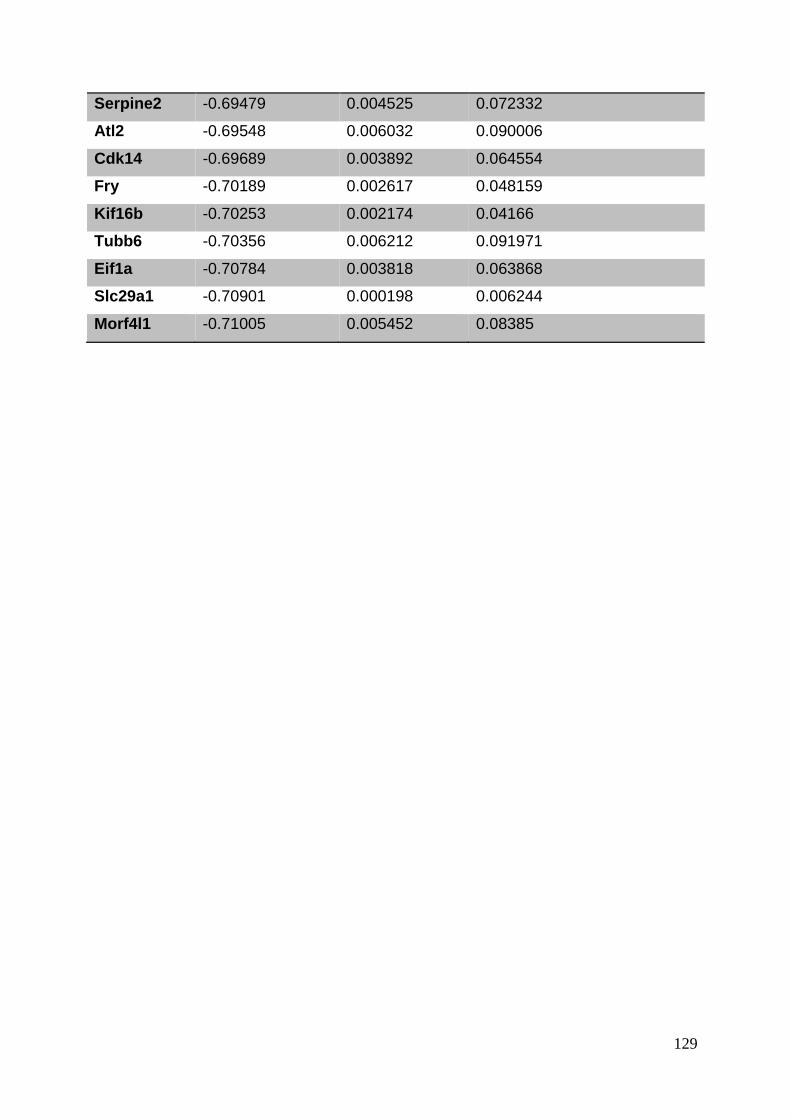
129
Serpine2 -0.69479 0.004525 0.072332
Atl2 -0.69548 0.006032 0.090006
Cdk14 -0.69689 0.003892 0.064554
Fry -0.70189 0.002617 0.048159
Kif16b -0.70253 0.002174 0.04166
Tubb6 -0.70356 0.006212 0.091971
Eif1a -0.70784 0.003818 0.063868
Slc29a1 -0.70901 0.000198 0.006244
Morf4l1 -0.71005 0.005452 0.08385
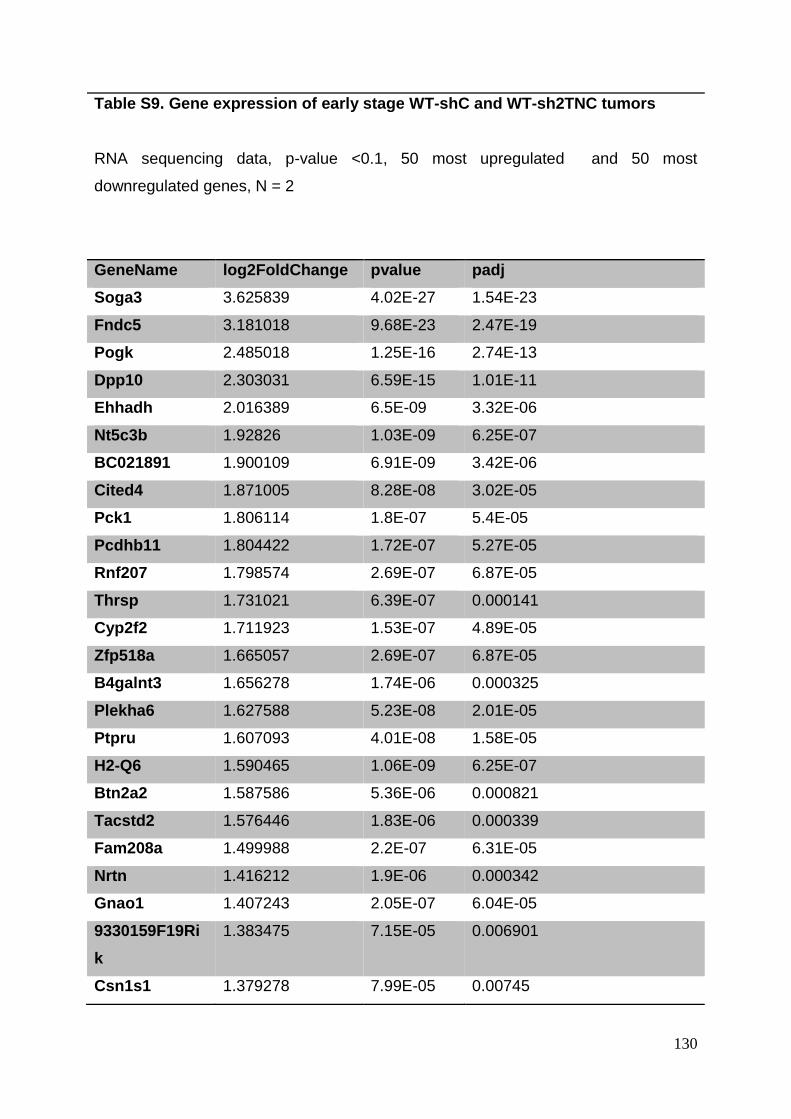
130
Table S9. Gene expression of early stage WT-shC and WT-sh2TNC tumors
RNA sequencing data, p-value <0.1, 50 most upregulated and 50 most
downregulated genes, N = 2
GeneName log2FoldChange pvalue padj
Soga3 3.625839 4.02E-27 1.54E-23
Fndc5 3.181018 9.68E-23 2.47E-19
Pogk 2.485018 1.25E-16 2.74E-13
Dpp10 2.303031 6.59E-15 1.01E-11
Ehhadh 2.016389 6.5E-09 3.32E-06
Nt5c3b 1.92826 1.03E-09 6.25E-07
BC021891 1.900109 6.91E-09 3.42E-06
Cited4 1.871005 8.28E-08 3.02E-05
Pck1 1.806114 1.8E-07 5.4E-05
Pcdhb11 1.804422 1.72E-07 5.27E-05
Rnf207 1.798574 2.69E-07 6.87E-05
Thrsp 1.731021 6.39E-07 0.000141
Cyp2f2 1.711923 1.53E-07 4.89E-05
Zfp518a 1.665057 2.69E-07 6.87E-05
B4galnt3 1.656278 1.74E-06 0.000325
Plekha6 1.627588 5.23E-08 2.01E-05
Ptpru 1.607093 4.01E-08 1.58E-05
H2-Q6 1.590465 1.06E-09 6.25E-07
Btn2a2 1.587586 5.36E-06 0.000821
Tacstd2 1.576446 1.83E-06 0.000339
Fam208a 1.499988 2.2E-07 6.31E-05
Nrtn 1.416212 1.9E-06 0.000342
Gnao1 1.407243 2.05E-07 6.04E-05
9330159F19Ri
k
1.383475 7.15E-05 0.006901
Csn1s1 1.379278 7.99E-05 0.00745
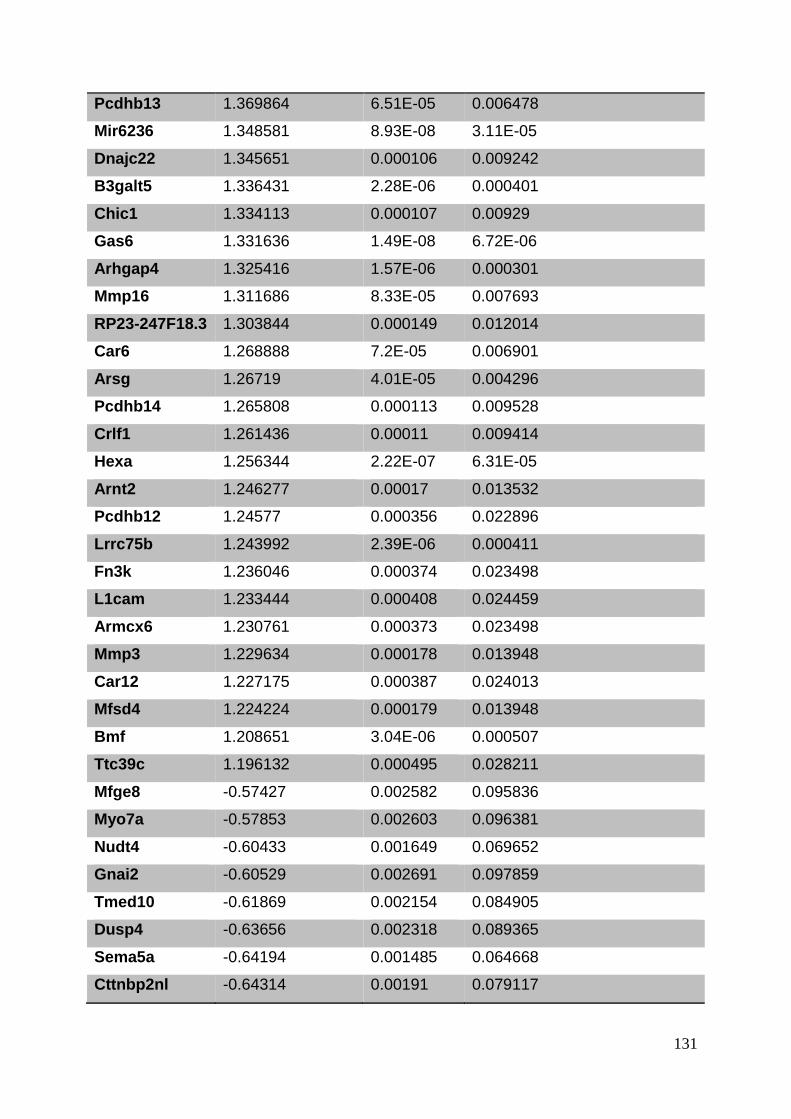
131
Pcdhb13 1.369864 6.51E-05 0.006478
Mir6236 1.348581 8.93E-08 3.11E-05
Dnajc22 1.345651 0.000106 0.009242
B3galt5 1.336431 2.28E-06 0.000401
Chic1 1.334113 0.000107 0.00929
Gas6 1.331636 1.49E-08 6.72E-06
Arhgap4 1.325416 1.57E-06 0.000301
Mmp16 1.311686 8.33E-05 0.007693
RP23-247F18.3 1.303844 0.000149 0.012014
Car6 1.268888 7.2E-05 0.006901
Arsg 1.26719 4.01E-05 0.004296
Pcdhb14 1.265808 0.000113 0.009528
Crlf1 1.261436 0.00011 0.009414
Hexa 1.256344 2.22E-07 6.31E-05
Arnt2 1.246277 0.00017 0.013532
Pcdhb12 1.24577 0.000356 0.022896
Lrrc75b 1.243992 2.39E-06 0.000411
Fn3k 1.236046 0.000374 0.023498
L1cam 1.233444 0.000408 0.024459
Armcx6 1.230761 0.000373 0.023498
Mmp3 1.229634 0.000178 0.013948
Car12 1.227175 0.000387 0.024013
Mfsd4 1.224224 0.000179 0.013948
Bmf 1.208651 3.04E-06 0.000507
Ttc39c 1.196132 0.000495 0.028211
Mfge8 -0.57427 0.002582 0.095836
Myo7a -0.57853 0.002603 0.096381
Nudt4 -0.60433 0.001649 0.069652
Gnai2 -0.60529 0.002691 0.097859
Tmed10 -0.61869 0.002154 0.084905
Dusp4 -0.63656 0.002318 0.089365
Sema5a -0.64194 0.001485 0.064668
Cttnbp2nl -0.64314 0.00191 0.079117
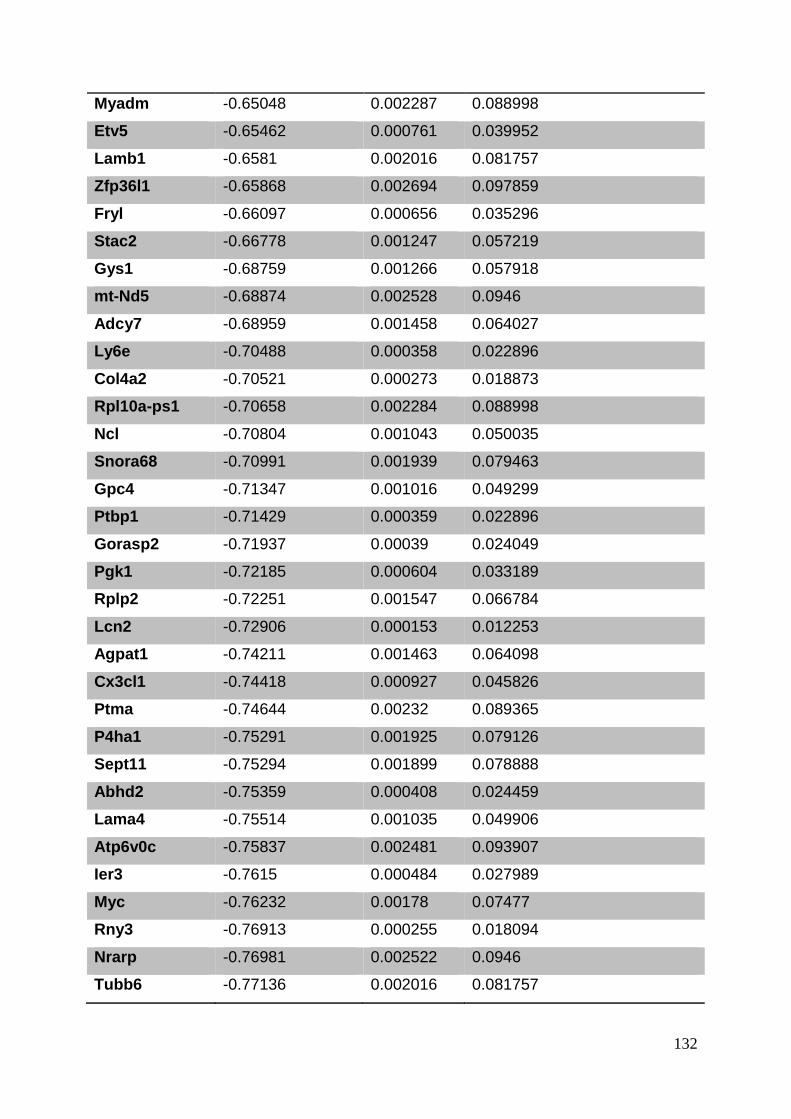
132
Myadm -0.65048 0.002287 0.088998
Etv5 -0.65462 0.000761 0.039952
Lamb1 -0.6581 0.002016 0.081757
Zfp36l1 -0.65868 0.002694 0.097859
Fryl -0.66097 0.000656 0.035296
Stac2 -0.66778 0.001247 0.057219
Gys1 -0.68759 0.001266 0.057918
mt-Nd5 -0.68874 0.002528 0.0946
Adcy7 -0.68959 0.001458 0.064027
Ly6e -0.70488 0.000358 0.022896
Col4a2 -0.70521 0.000273 0.018873
Rpl10a-ps1 -0.70658 0.002284 0.088998
Ncl -0.70804 0.001043 0.050035
Snora68 -0.70991 0.001939 0.079463
Gpc4 -0.71347 0.001016 0.049299
Ptbp1 -0.71429 0.000359 0.022896
Gorasp2 -0.71937 0.00039 0.024049
Pgk1 -0.72185 0.000604 0.033189
Rplp2 -0.72251 0.001547 0.066784
Lcn2 -0.72906 0.000153 0.012253
Agpat1 -0.74211 0.001463 0.064098
Cx3cl1 -0.74418 0.000927 0.045826
Ptma -0.74644 0.00232 0.089365
P4ha1 -0.75291 0.001925 0.079126
Sept11 -0.75294 0.001899 0.078888
Abhd2 -0.75359 0.000408 0.024459
Lama4 -0.75514 0.001035 0.049906
Atp6v0c -0.75837 0.002481 0.093907
Ier3 -0.7615 0.000484 0.027989
Myc -0.76232 0.00178 0.07477
Rny3 -0.76913 0.000255 0.018094
Nrarp -0.76981 0.002522 0.0946
Tubb6 -0.77136 0.002016 0.081757
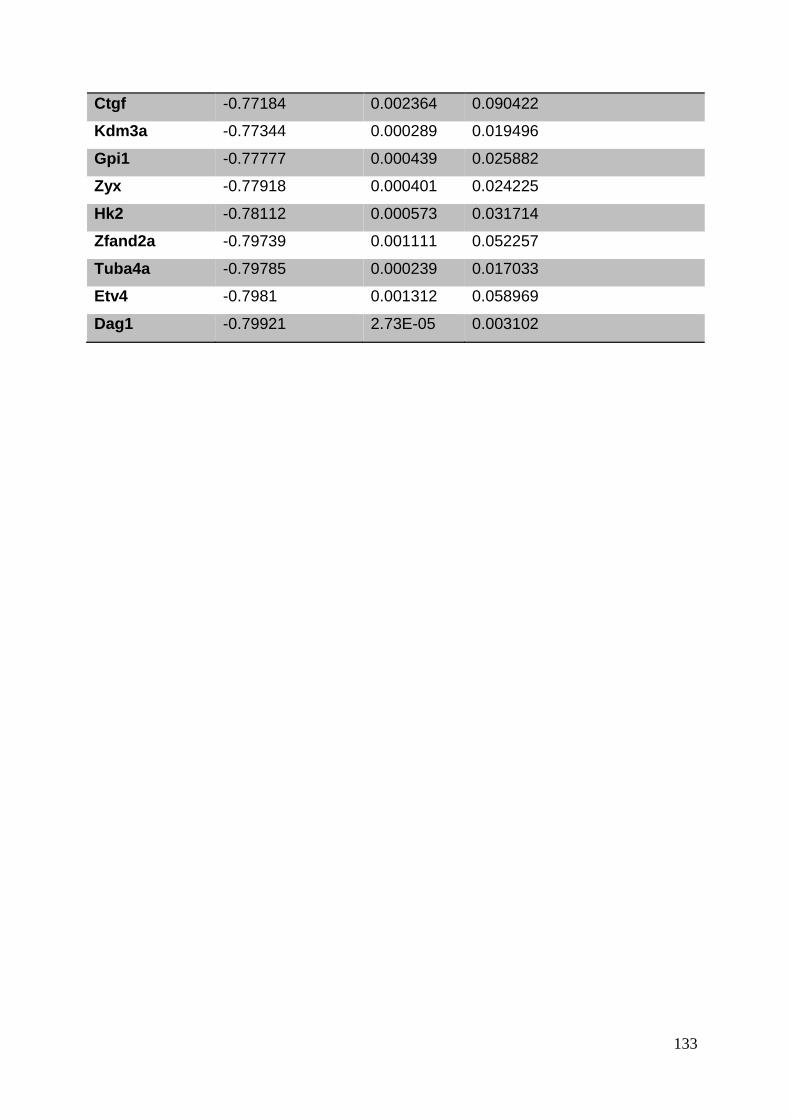
133
Ctgf -0.77184 0.002364 0.090422
Kdm3a -0.77344 0.000289 0.019496
Gpi1 -0.77777 0.000439 0.025882
Zyx -0.77918 0.000401 0.024225
Hk2 -0.78112 0.000573 0.031714
Zfand2a -0.79739 0.001111 0.052257
Tuba4a -0.79785 0.000239 0.017033
Etv4 -0.7981 0.001312 0.058969
Dag1 -0.79921 2.73E-05 0.003102
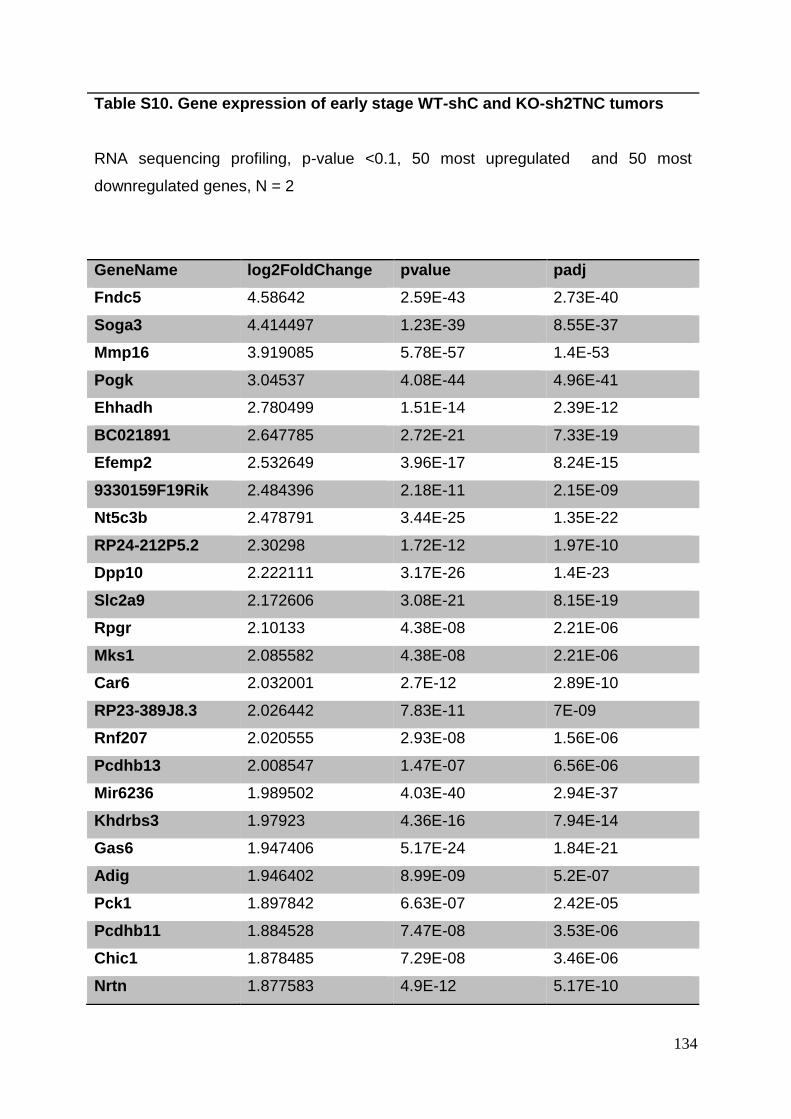
134
Table S10. Gene expression of early stage WT-shC and KO-sh2TNC tumors
RNA sequencing profiling, p-value <0.1, 50 most upregulated and 50 most
downregulated genes, N = 2
GeneName log2FoldChange pvalue padj
Fndc5 4.58642 2.59E-43 2.73E-40
Soga3 4.414497 1.23E-39 8.55E-37
Mmp16 3.919085 5.78E-57 1.4E-53
Pogk 3.04537 4.08E-44 4.96E-41
Ehhadh 2.780499 1.51E-14 2.39E-12
BC021891 2.647785 2.72E-21 7.33E-19
Efemp2 2.532649 3.96E-17 8.24E-15
9330159F19Rik 2.484396 2.18E-11 2.15E-09
Nt5c3b 2.478791 3.44E-25 1.35E-22
RP24-212P5.2 2.30298 1.72E-12 1.97E-10
Dpp10 2.222111 3.17E-26 1.4E-23
Slc2a9 2.172606 3.08E-21 8.15E-19
Rpgr 2.10133 4.38E-08 2.21E-06
Mks1 2.085582 4.38E-08 2.21E-06
Car6 2.032001 2.7E-12 2.89E-10
RP23-389J8.3 2.026442 7.83E-11 7E-09
Rnf207 2.020555 2.93E-08 1.56E-06
Pcdhb13 2.008547 1.47E-07 6.56E-06
Mir6236 1.989502 4.03E-40 2.94E-37
Khdrbs3 1.97923 4.36E-16 7.94E-14
Gas6 1.947406 5.17E-24 1.84E-21
Adig 1.946402 8.99E-09 5.2E-07
Pck1 1.897842 6.63E-07 2.42E-05
Pcdhb11 1.884528 7.47E-08 3.53E-06
Chic1 1.878485 7.29E-08 3.46E-06
Nrtn 1.877583 4.9E-12 5.17E-10
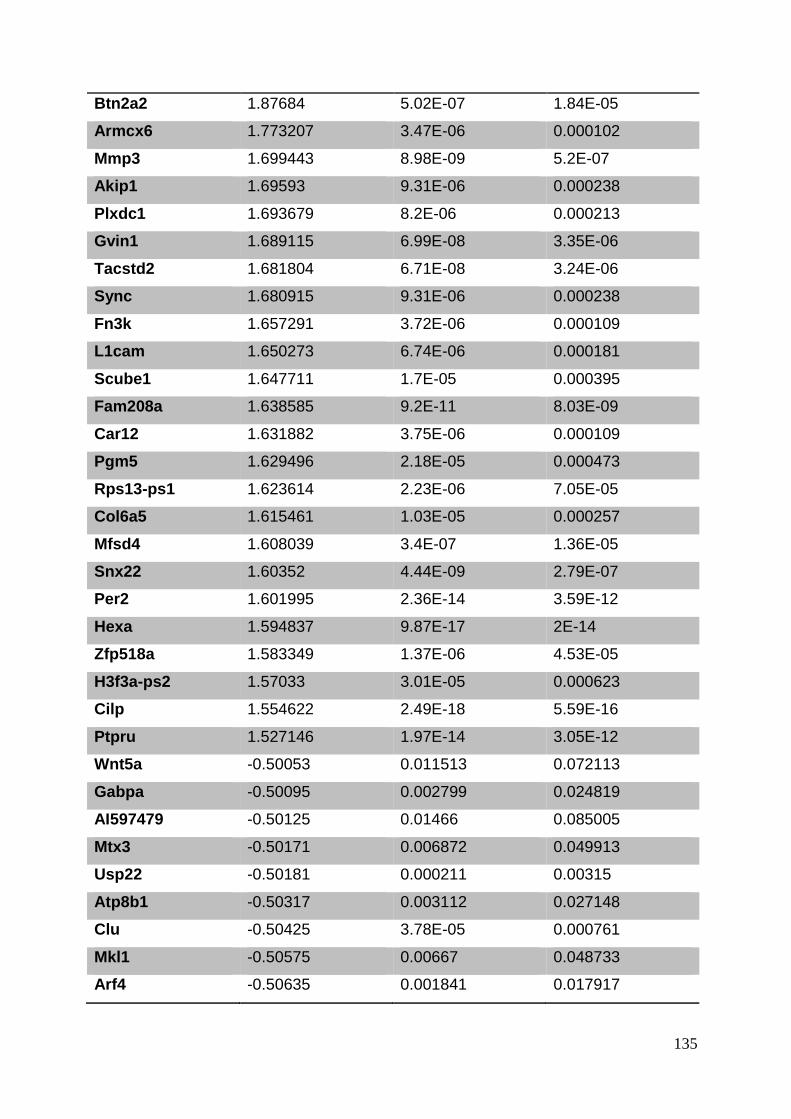
135
Btn2a2 1.87684 5.02E-07 1.84E-05
Armcx6 1.773207 3.47E-06 0.000102
Mmp3 1.699443 8.98E-09 5.2E-07
Akip1 1.69593 9.31E-06 0.000238
Plxdc1 1.693679 8.2E-06 0.000213
Gvin1 1.689115 6.99E-08 3.35E-06
Tacstd2 1.681804 6.71E-08 3.24E-06
Sync 1.680915 9.31E-06 0.000238
Fn3k 1.657291 3.72E-06 0.000109
L1cam 1.650273 6.74E-06 0.000181
Scube1 1.647711 1.7E-05 0.000395
Fam208a 1.638585 9.2E-11 8.03E-09
Car12 1.631882 3.75E-06 0.000109
Pgm5 1.629496 2.18E-05 0.000473
Rps13-ps1 1.623614 2.23E-06 7.05E-05
Col6a5 1.615461 1.03E-05 0.000257
Mfsd4 1.608039 3.4E-07 1.36E-05
Snx22 1.60352 4.44E-09 2.79E-07
Per2 1.601995 2.36E-14 3.59E-12
Hexa 1.594837 9.87E-17 2E-14
Zfp518a 1.583349 1.37E-06 4.53E-05
H3f3a-ps2 1.57033 3.01E-05 0.000623
Cilp 1.554622 2.49E-18 5.59E-16
Ptpru 1.527146 1.97E-14 3.05E-12
Wnt5a -0.50053 0.011513 0.072113
Gabpa -0.50095 0.002799 0.024819
AI597479 -0.50125 0.01466 0.085005
Mtx3 -0.50171 0.006872 0.049913
Usp22 -0.50181 0.000211 0.00315
Atp8b1 -0.50317 0.003112 0.027148
Clu -0.50425 3.78E-05 0.000761
Mkl1 -0.50575 0.00667 0.048733
Arf4 -0.50635 0.001841 0.017917
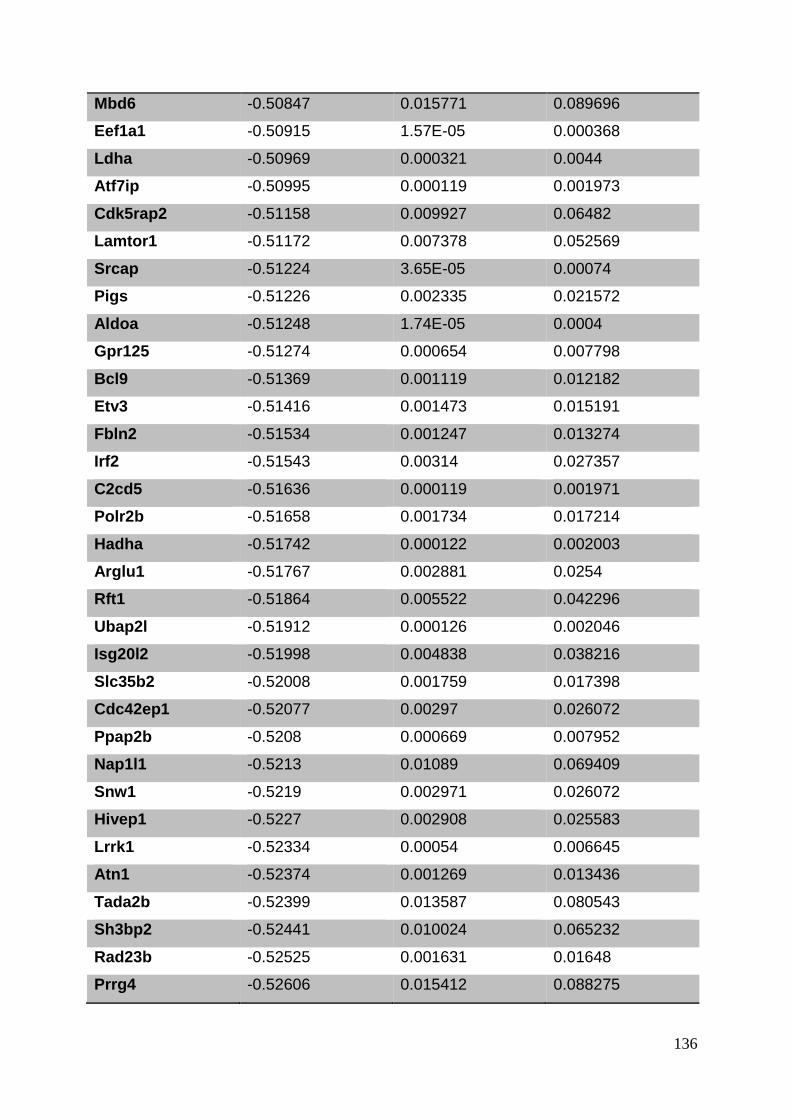
136
Mbd6 -0.50847 0.015771 0.089696
Eef1a1 -0.50915 1.57E-05 0.000368
Ldha -0.50969 0.000321 0.0044
Atf7ip -0.50995 0.000119 0.001973
Cdk5rap2 -0.51158 0.009927 0.06482
Lamtor1 -0.51172 0.007378 0.052569
Srcap -0.51224 3.65E-05 0.00074
Pigs -0.51226 0.002335 0.021572
Aldoa -0.51248 1.74E-05 0.0004
Gpr125 -0.51274 0.000654 0.007798
Bcl9 -0.51369 0.001119 0.012182
Etv3 -0.51416 0.001473 0.015191
Fbln2 -0.51534 0.001247 0.013274
Irf2 -0.51543 0.00314 0.027357
C2cd5 -0.51636 0.000119 0.001971
Polr2b -0.51658 0.001734 0.017214
Hadha -0.51742 0.000122 0.002003
Arglu1 -0.51767 0.002881 0.0254
Rft1 -0.51864 0.005522 0.042296
Ubap2l -0.51912 0.000126 0.002046
Isg20l2 -0.51998 0.004838 0.038216
Slc35b2 -0.52008 0.001759 0.017398
Cdc42ep1 -0.52077 0.00297 0.026072
Ppap2b -0.5208 0.000669 0.007952
Nap1l1 -0.5213 0.01089 0.069409
Snw1 -0.5219 0.002971 0.026072
Hivep1 -0.5227 0.002908 0.025583
Lrrk1 -0.52334 0.00054 0.006645
Atn1 -0.52374 0.001269 0.013436
Tada2b -0.52399 0.013587 0.080543
Sh3bp2 -0.52441 0.010024 0.065232
Rad23b -0.52525 0.001631 0.01648
Prrg4 -0.52606 0.015412 0.088275
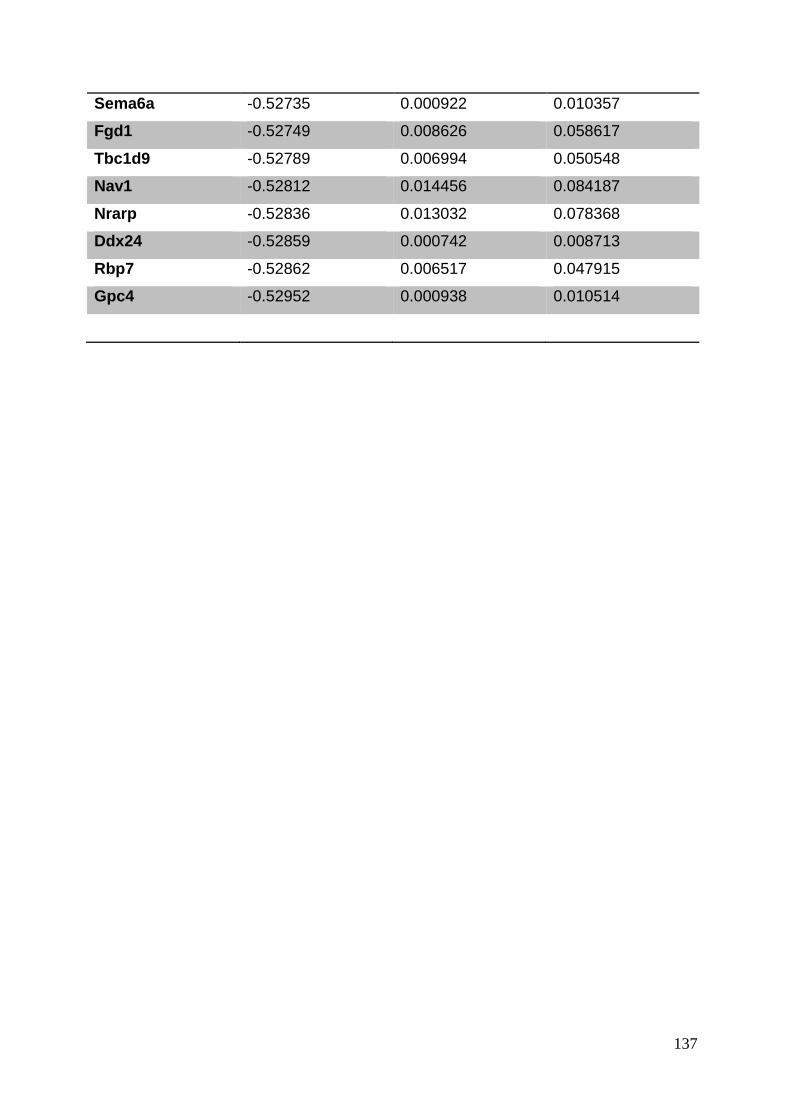
137
Sema6a -0.52735 0.000922 0.010357
Fgd1 -0.52749 0.008626 0.058617
Tbc1d9 -0.52789 0.006994 0.050548
Nav1 -0.52812 0.014456 0.084187
Nrarp -0.52836 0.013032 0.078368
Ddx24 -0.52859 0.000742 0.008713
Rbp7 -0.52862 0.006517 0.047915
Gpc4 -0.52952 0.000938 0.010514
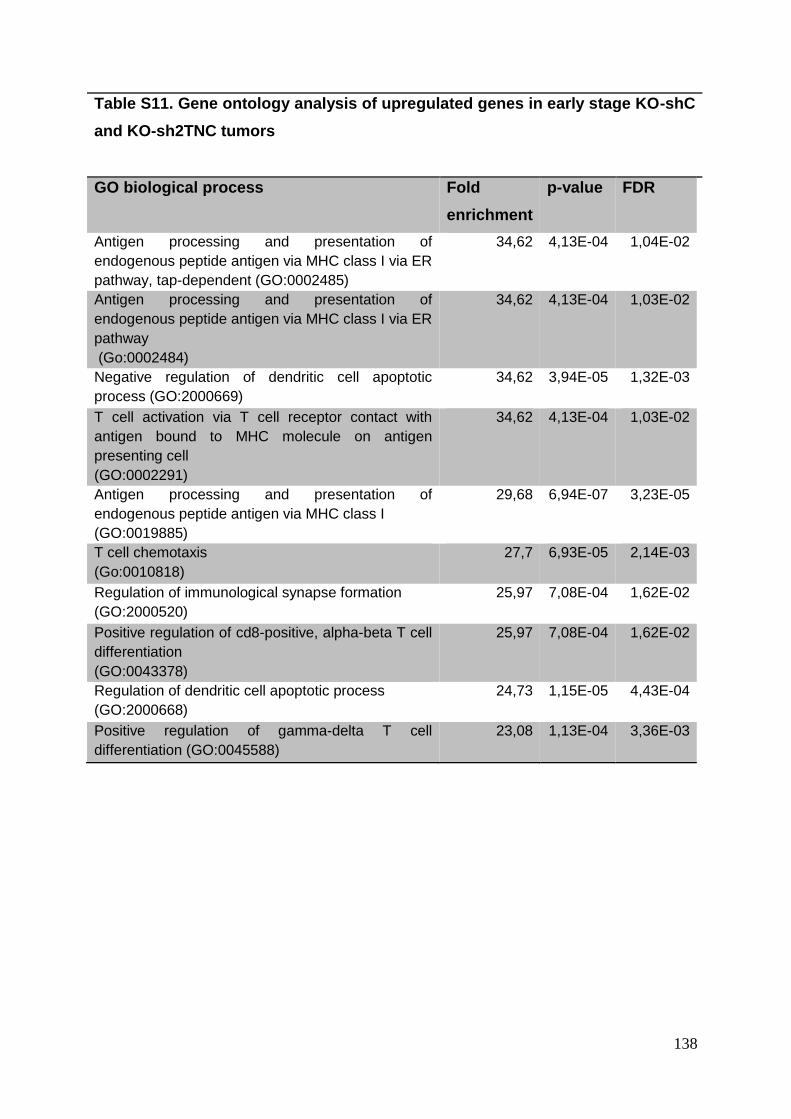
138
Table S11. Gene ontology analysis of upregulated genes in early stage KO-shC
and KO-sh2TNC tumors
GO biological process Fold
enrichment
p-value FDR
Antigen processing and presentation of
endogenous peptide antigen via MHC class I via ER
pathway, tap-dependent (GO:0002485)
34,62 4,13E-04 1,04E-02
Antigen processing and presentation of
endogenous peptide antigen via MHC class I via ER
pathway
(Go:0002484)
34,62 4,13E-04 1,03E-02
Negative regulation of dendritic cell apoptotic
process (GO:2000669)
34,62 3,94E-05 1,32E-03
T cell activation via T cell receptor contact with
antigen bound to MHC molecule on antigen
presenting cell
(GO:0002291)
34,62 4,13E-04 1,03E-02
Antigen processing and presentation of
endogenous peptide antigen via MHC class I
(GO:0019885)
29,68 6,94E-07 3,23E-05
T cell chemotaxis
(Go:0010818)
27,7 6,93E-05 2,14E-03
Regulation of immunological synapse formation
(GO:2000520)
25,97 7,08E-04 1,62E-02
Positive regulation of cd8-positive, alpha-beta T cell
differentiation
(GO:0043378)
25,97 7,08E-04 1,62E-02
Regulation of dendritic cell apoptotic process
(GO:2000668)
24,73 1,15E-05 4,43E-04
Positive regulation of gamma-delta T cell
differentiation (GO:0045588)
23,08 1,13E-04 3,36E-03

139
Table S12. Relapse-free survival in grade III breast cancer patients and
expression of candidate genes
Gene name Hazard ratio Log rank p
APS 0.49 (0.36 – 0.68) 9,90E-06
CD4 0,79 (0.64 – 0.98) 3,50E-02
CD74 0,69 (0.55 – 0.86) 9,60E-04
B2M 0,76 (0.61 – 0.95) 1,40E-02
CTSS 0,62 (0.45 – 0.85) 2,80E-03
CIITA 1,05 (0.85 – 1.31) 6,30E-01
TAP1 0,72 (0.58 – 0.9) 4,00E-03
CD86 0,91 (0.73 – 1.13) 3,80E-01
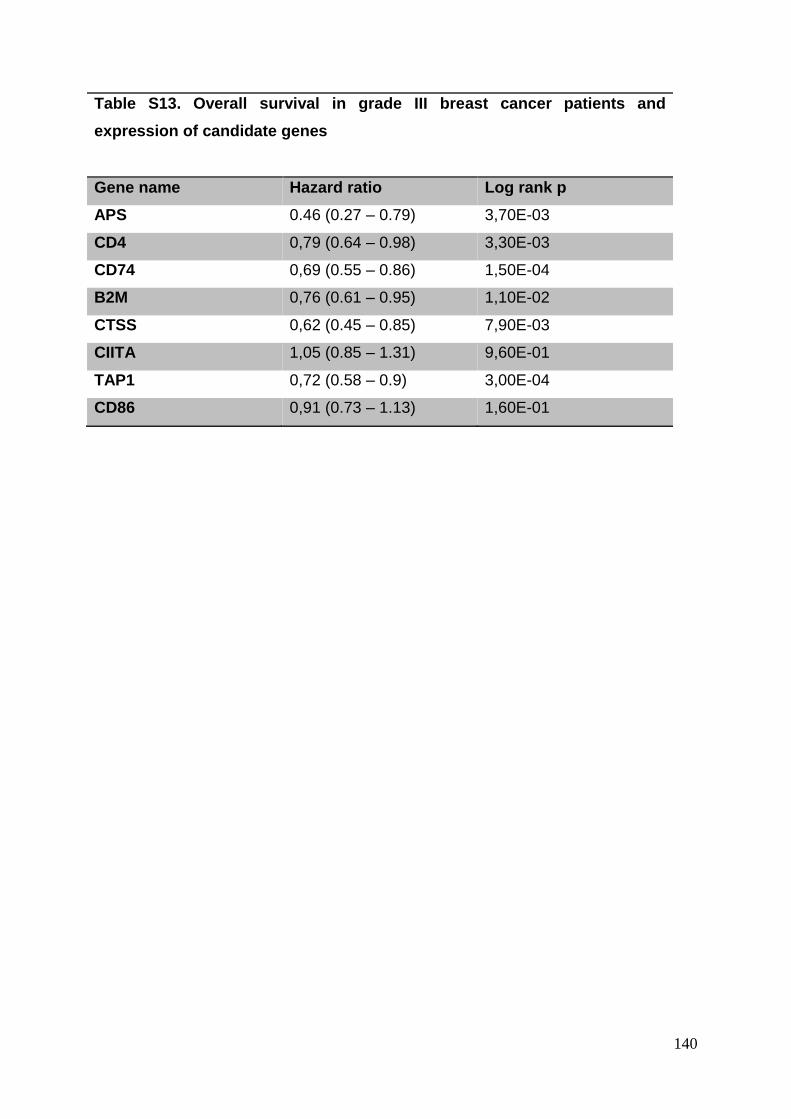
140
Table S13. Overall survival in grade III breast cancer patients and
expression of candidate genes
Gene name Hazard ratio Log rank p
APS 0.46 (0.27 – 0.79) 3,70E-03
CD4 0,79 (0.64 – 0.98) 3,30E-03
CD74 0,69 (0.55 – 0.86) 1,50E-04
B2M 0,76 (0.61 – 0.95) 1,10E-02
CTSS 0,62 (0.45 – 0.85) 7,90E-03
CIITA 1,05 (0.85 – 1.31) 9,60E-01
TAP1 0,72 (0.58 – 0.9) 3,00E-04
CD86 0,91 (0.73 – 1.13) 1,60E-01

141
4. Discussion and perspectives
TNC is a large ECM glycoprotein which is largely expressed during embryonic
development. However, its expression in the adult organism is restricted to some
tissues such as tendons, some stem cell niches and reticular fibers of lymphoid
organs. However, TNC is expressed de novo during wound healing and pathological
situations like inflammation and cancer. High expression of TNC correlates with poor
prognosis in several cancer types such as melanoma and colorectal cancer
(Midwood et al. 2016). In breast cancer, high TNC expression is associated with poor
metastasis-free survival and overall survival (Oskarsson et al. 2011). Furthermore, it
has previously been shown that in the TME, TNC can be expressed by both the
stromal and the cancer cells and that tumor cell-derived TNC correlates with poor
survival in breast patients (Ishihara et al. 1995). Despite these significant clinical
observations, how exactly TNC impacts breast tumor progression is largely unknown.
In order to address this question, we developed a novel orthotopic, syngeneic and
immunocompetent breast cancer model (NT193 model) with engineered levels of
TNC in both the host and the tumor cells. This allowed us to study the impact of host-
and tumor cell-derived TNC on breast cancer progression and lung metastasis
formation. Our results showed that host-derived TNC promotes a higher metastatic
burden as well as tumor cells survival (Appendix I, Sun et al, submitted). In vitro, TNC
increases cell migration through the induction of an EMT-like phenotype that is
relevant in vivo as we see more EMT like changes and enhanced breaching into the
lung parenchyma in TNC expressing conditions. Supported by observations in the
transgenic MMTV-NeuNT breast cancer model we demonstrated that TNC promotes
tumor cell extravasation to the lung parenchyma where promoting cellular plasticity is
an important mechanism (Appendix I, Sun et al, submitted).
We also demonstrated that the NT193 syngeneic model is an important model to
investigate the impact of TNC on the evolution of an immune response towards
engrafted tumor cells. Our results show clearly two phases and a previously unknown
janus role of TNC in tumor immunity. In a first phase, tumor cells express TNC which
triggers expression of an antigen presenting signature (APS) by the host that
142
enforces infiltration of CD8+ T cells into the tumor nests and subsequent tumor cell
death and tumor rejection. In a second phase, applying to the escapers, high
expression of TNC and organization in matrix tracks, corrupts the CD8+ T cell-
mediated immune response. We identified CXCL12/CXCR4 signaling as an important
downstream TNC triggered mechanism that leads to biochemical and physical
shielding of the tumor cell nests from the CD8+ T cell attack.
4.1. The NT193 grafting model recapitulating the MMTV-NeuNT transgenic
model is a valid novel preclinical breast cancer model
Research using breast cancer models has been instrumental in generating new
insights into the mechanisms underpinning tumor progression. One of the significant
transgenic mice used in breast cancer research is the MMTV-NeuNT model (Muller
et al. 1988). These mice express an activated form of the rat homologue of the HER2
oncogene (neu) specifically in the mammary epithelium. The main significance of this
model is that it mimics the progression phase of HER2+ breast cancers that are
characterized by an overexpression of HER2. HER2 plays a major role in mammary
carcinogenesis of about 15-25% of breast cancer patients (Yarden 2001). In the
original MMTV-Neu model, approximately 50% of mice develop multifocal breast
tumors with a latency of 5 to 8 months and, around 30% of the tumor-bearing mice
develop lung metastases (Muller et al. 1988). Despite the fact that this model
develops spontaneously breast tumors that progress into lung metastasis, the long
kinetics is a problem for preclinical research and in particular drug testing. On the
other side the long kinetics may better mimic the events that occur in human cancer
and in particular may allow establishing a relevant TME.
In the laboratory, we developed a syngeneic orthotopic immunocompetent grafting
model as a surrogate for the MMTV-NeuNT model. This was done by isolating a
tumor cell line (NT193 cells) from the primary tumor of a MMTV-NeuNT mouse (Arpel
et al. 2016). Upon grafting of NT193 cells in the surgically opened mammary fat pad
of a syngeneic FVB/NCrl host, breast tumors develop in a fraction of mice that
spontaneously form lung metastasis after 11-14 weeks. Histological analysis of the
resulting tumors revealed that the NT193 tumors are indistinguishable from the
MMTV-NeuNT tumors. An in-depth characterization of the NT193 tumors shows that
the tumors display an epithelial phenotype, a sustained expression of ErbB2 and an
143
organization of the tumor matrix as matrix tracks as we have seen in the MMTV-
NeuNT tumors. We concluded that the novel grafting model is a good substitute for
the transgenic mouse model.
In comparison with other models, the NT193 model presents some advantages. For
example the EO771 triple negative syngeneic (C57BL/6 host) grafting model is poorly
metastatic. In contrast, the NT193 model spontaneously develops lung metastasis
with features seen in the genetic model that are highly relevant for human cancer. In
the NT193 model vascular invasions are formed as precursors of parenchymal
metastasis (Casey, Laster, and Ross 1951, Appendix I, Sun et al., submitted). The
4T1 syngeneic (BALB/c host) grafting model is highly metastatic. Yet, these cells are
so aggressive that early events in the primary tumor cannot be investigated. This
applies in particular to the aspect of immune surveillance (Lelekakis et al. 1999;
Aslakson and Miller 1992). A similar drawback is seen with the PyMT syngeneic
grafting model (C57Bl6 and FVB host) that is similarly aggressive as the 4T1 model
(Yang et al. 2017). Tumor grafting models from a MMTV-Neu tumor have previously
been established but were discarded because the tumor cells underwent EMT in vivo
and therefore could not well be compared to the epithelial tumors of the stochastic
model (Santisteban et al. 2009). We had established the NT193 cell line from another
MMTV model where the cells express a constitutively active version of the rat ErbB2
molecule, NeuNT. The NeuNT contains a point mutation that generates an amino
acid substitution (Val-Glu) in the transmembrane domain of the protein, leading to
constant ligand-independent dimerizationofthereceptor (Bargmann, Hung, and
Weinberg 1986; Weiner et al. 1989).The NT193 cells are plastic in cell culture where
the majority of cells is epithelial (only E-cadherin positive) and the minority is
mesenchymal (only vimentin positive). For engraftment we used this pool of cells and
observed that all arising tumors were epithelial as they only expressed E-cadherin
but not vimentin.
Another aspect that has to be considered is the local milieu where the tumor cells are
engrafted. In most studies cells are injected through the nipple or directly into the
mammary fat pad. Both approaches have a drawback because the tumor cells are
not placed in their proper microenvironment, meaning directly into the mammary
epithelium. Therefore, we had surgically opened the mammary gland for engraftment

144
of the NT193 cells thereby enhancing the chances to place the cells in contact with
the mammary epithelium. Tissue wounding may have also another impact on early
events of immune surveillance. By engraftment of a massive number of tumor cells
(in the range of 106 or more) the poor number of circulating immune cells will not be
able to stage an immune response. Therefore, usually tumor penetrance in the
applied grafting models is 100%. Upon tissue wounding, the immune system is
already alerted and more immune cells may be primed to stage a defense against the
tumor cells upon grafting. Indeed, this seems to be the case, as only 50% of mice
develop tumors upon engraftment of NT193 cells and those tumors that are not
rejected experience a transient slowdown in their growth. Indeed wounding is
important for tumor rejection to occur in this model as without wounding, namely by
engraftment through the nipple no tumor rejection is seen (Deligne et al., in
preparation). Altogether, this wounding approach allowed us to establish the novel
NT193 syngeneic orthotopic grafting model with a kinetics that allows developing a
proper TME that promotes spontaneous metastasis to the lung. Most importantly, this
model is the first to allow addressing the evolution of tumor immunity.
4.2. Tumor cell-derived TNC impacts tumor growth in the WT hosts
TNC can be expressed by both the tumor cells and the stromal cells in the TME. The
high expression of TNC by the tumor cells has been correlated with shorter relapse-
free survival, low lymph-node metastasis-free survival and poor overall survival in
breast cancer patients (Ishihara et al. 1995). Since TNC expression is also
associated to shorter lung metastasis-free survival in breast cancer, the impact of
TNC on lung metastasis formation has been addressed in an immunocompromised
mouse model (Oskarsson et al. 2011). In an elegant study using cells where TNC
could be turned off at a given point upon injection, the authors found that tumor cell-
derived TNC is important for survival until the host expresses TNC at the metastatic
site in the lung. However one drawback of this study is that it lacks a functional
immune system so that a potential impact of TNC on tumor immunity could not be
addressed. Now, by using the NT193 model with engineered levels of TNC in the
host and in the tumor cells, respectively, we were able to assess the impact of TNC
derived from each cellular compartment on tumor progression and metastasis
formation in an immunocompetent setting. Most importantly, the TNC knockdown by
shRNA was stable in vivo and tumors induced by shTNC had very low TNC levels in
145
a TNCKO host. Therefore, we could well mimic MMTV-NeuNT tumors with high and
no TNC in the NT193 grafting model.
We observed that when shC cells were grafted into a WT host they were totally or
partially rejected as from the third week following engraftment. Interestingly, this was
not observed when we grafted shTNC cells in the WT host, suggesting that tumor
cell-derived TNC is involved in the tumor rejection process. Although TNC levels
were reduced in WT/shTNC tumors there was still some TNC present, but apparently
this did not elicit tumor rejection. On the contrary, injection of shC cells into a TNCKO
host did not lead to tumor rejection either. Again, IF staining revealed some residual
TNC expression in the tumors, but apparently this TNC did not induce tumor
rejection. These experiments imply that the cellular origin of the TNC in the TME
matters and that host-derived TNC is to some points different from tumor cell-derived
TNC. Most importantly, these results also suggest that combined expression of TNC
by the host and by the tumor cells is important to stage a rejection. Our further
detailed analysis indeed provides an explanation for this conundrum (see below).
There are several possibilities for differences between host- and tumor cell-derived
TNC. These include post-transcriptional alterations such as alternative splicing
occurring inside the FNIII repeats (Giblin and Midwood 2015). To date around 100
alternatively spliced isoforms have been described compared to the theoretical 511
expected. Interestingly, our in silico analysis of the RNAseq data from the early stage
NT193 tumors in the WT host revealed differences in TNC splice isoforms expressed
by the host (WR/shTNC) or the tumor cells (KO/shC). We identified 5 isoforms where
only one was specific for tumor cells. Interestingly, this isoform is the only one that
contained a C domain of TNC. It is intriguing to speculate that this domain may have
antigenic properties which have to be followed up in the future.
Structural differences in TNC can also be due to post-translational modifications.
These include glycosylation and citrullination (Giblin and Midwood 2015; Schwenzer
et al. 2016). For instance, in the RNAseq data comparison of early phase WT tumors,
we observed a 2.5-fold higher expression of the peptidylarginine deiminase type IV
(PAD4) in WT/shC versus WT/shTNC tumors. PAD4 is one of the enzymes that
citrullinates proteins. Citrullinated proteins have been described to be significantly
increased at sites of inflammation (Kinloch et al. 2008). In particular citrullinated TNC
146
was detected in blood from rheumatoid arthritis (RA) patients. Also circulating
antibodies in blood of these patients detected the citrullinated FBG domain of TNC
suggesting that indeed citrullinated TNC may be antigenic (Schwenzer et al. 2016). It
remains to be seen whether other domains of TNC than the FBG globe can be
citrullinated, in particular the C domain that was expressed by the tumor cells in our
model. Also, future studies should address whether TNC is citrullinated in cancer
which is unknown but an intriguing possibility. The NT193 model might be suitable to
address this question. Given the higher expression of PAD4, it is possible that
citrullination contributes to the observed tumor cell rejection phenotype in our model.
4.3. Tumor cell-derived TNC upregulates an antigen presentation signature
(APS) in the host
Since tumor-cell derived TNC triggered a tumor rejection response in the early tumor
phase, we speculated that this could be the result of an active tumor cell killing by the
immune system rather than a decrease of proliferation of the tumor cells. We
therefore injected the NT193 shC cells in a nude host, lacking B and T cells, and
observed no tumor rejection. These data show that the adaptive immune system is
implicated in the rejection process. To have some more insight about the
mechanisms underpinning the tumor rejection, we analyzed the RNAseq data. We
compared gene expression in KO/shC and KO/shTNC tumors. A gene ontology
analysis showed that one of the most enriched GO terms with 21 genes was the
antigen processing and presentation group of molecules. For instance these genes
include tap1 and tap2 which are ATP-dependent transporters involved in the
translocation of antigenic peptides from the cytosol to the endoplasmic reticulum
(Blum, Wearsch, and Cresswell 2013). This observation suggested that TNC
expressed by the tumor cells may elicit an immune response either by directly acting
as antigen or by inducing molecules that are recognized by the immune system as
antigens. Interestingly, although these 21 genes were upregulated in KO/shC tumors,
these tumors did not get rejected. Next, we asked whether these genes would also
be upregulated in the conditions where tumors regressed. And indeed also in
WT/shC tumors these genes are upregulated (in comparison to WT/shTNC). We
confirmed increased expression of 7 of these genes (ciita, ctss, b2m, cd74, tap1, cd4
and cd86) in WT/shC and KO/shC tumors and, coined them antigen-presenting-
signature APS. These molecules as e.g. CD4 or CD86 are expressed by the host and
147
may explain why only in a WT host tumor cells were rejected. To investigate this
possibility in more detail, we compared WT/shC with KO/shC tumors where the KO
host is unable to induce tumor rejection. Indeed, three of the APS genes B2M, CD4
and CD86 were reduced in the KO/shC tumors. Altogether, this analysis revealed
that tumor cells express molecules in a TNC dependent manner that trigger an
immune response in a WT host where TNC expressed by the host is important to
trigger an antigen-presenting-signature APS. Whether TNC itself is an antigen in
these tumors is an intriguing possibility. It is possible that similar to RA where TNC
was recognized as a danger-associated molecule (DAMP) TNC may have a similar
function in tumors (Midwood et al. 2009). In regard of this information, we propose
that TNC would be perceived by the immune system as an alarmin that would trigger
the anti-tumor immune response. This is consistent with our data showing that in the
WT hosts, expression of tumor cell-derived TNC is associated to high influx of CD8+
T cells, high mRNA levels of granzyme B and perforin, high apoptosis and tumor
rejection and smaller tumors. However, how TNC triggers the anti-tumor immune
response still needs to be investigated in the future.
We wanted to know whether the APS induced by TNC has any relevance for human
breast cancer patients. Therefore, we analyzed the expression of the APS genes in
publicly available breast cancer expression and survival data. Indeed, expression of
the APS above the mean correlated with longer relapse-free and better overall
survival in grade III breast cancer patients, but not in grade I or grade II patients. To
understand why this correlation only applies in grade III but not in grade I and grade
II patients we investigated in publicly available databases the level of expression
TNC. We observed that the levels of expression of TNC were not different from grade
I to grade III. To understand the clinical significance of the APS, we should therefore
better stratify the patients according to their expression of hormonal receptors or
HER2.
In summary, our results obtained in the NT193 tumor model revealed an unexpected
function of TNC in cancer by eliciting an immune response where we have identified
a group of molecules coined antigen-presenting-signature (APS) that can identify
patients with better survival. This information could be useful for patient stratification
and choice of therapy as well as for the design of an immunization protocol to elicit
this APS. In this context it is interesting to note that recognition as TAA apparently
148
applies in glioblastoma (GBM) patients (Mock et al. 2015). Based on these
observations the company Immatics had established an immunization protocol for
GBM patients where they included peptides derived from the TNC sequence. It is
urgent to determine which sequence in TNC is potentially antigenic in breast cancer
or which molecules are induced by TNC that are antigenic. These molecules could be
included in an immunization formula for breast cancer patients.
4.4. TNC impacts CD8+ T cell localization
Another main advantage of the NT193 model is that it allows monitoring different
stages of tumor progression and in particular evolution of tumor immunity. As we
discussed previously, expression of tumor-cell derived TNC in the WT host triggered
tumor rejection. While 50% of the tumors were completely rejected, the other tumors
regressed in size. As from the sixth week onwards the regressed tumors started to
proliferate again, with their sizes matching those of the unrejected tumors
(WT/shTNC) at the endpoint of the experiment. It can be noted that when we
assessed lung metastasis formation in this same experiment, the metastatic burden
was highest in the group of WT/shC mice that originally had experienced tumor
regression. This was accompanied by the highest proliferation index and the lowest
apoptotic index at the endstage of the experiment. These results are consistent with
the immunoediting concept described by Robert Schreiber (Schreiber, Old, and
Smyth 2011). A potential scenario is that early, tumor cell-derived TNC is seen as a
danger molecule by the immune system and defensive immune cells readily invade
the tumor to kill the tumor cells. Then a battle between the proliferating tumor cells
and the killing immune cells, presumably the CD8+ T cells, follows. This process
leads to tumor rejection in half on the cases and, in the other half potentially an
immunoediting mechanism. In the not rejected tumors, cells may become more
aggressive and invisible for the defensive immune cells, and/ or the immune cells
turn into tumor-supportive ones. Altogether, this might be the reason why the
metastatic burden was highest in this group of tumor mice.
Yet, how the tumor cells evade the anti-tumor response was still to be characterized.
We therefore analyzed the immune infiltration in the NT193 tumors both by FACS
analysis (Deligne et al. in preparation) and by immunostaining. This was assessed in
NT193 tumors expressing high or low levels of TNC (WT/shC versus WT/shTNC).
149
We observed an impact of TNC on macrophages, dendritic cells and CD8+ T cells,
with TNC reducing their abundance (Deligne ez al., in preparation). Interestingly,
immunofluorescence analysis of these late phase tumors for infiltrating immune cells
showed that the spatial distribution of CD8+ T cells was different, which was not the
case for other immune cells such as CD4+, CD11c+, F4/80+ cells that all were
present inside the tumor cell nests and the stroma. We found that CD8+ T cells were
enriched preferentially in the tumor matrix tracks rather than in the tumor cell nests.
This was accompanied by a decrease of granzyme B and perforin at mRNA level and
higher apoptosis levels, suggesting that the CD8+ T cells might get inhibited by
trapping in the TNC-enriched matrix and other mechanisms such as impaired priming
(Deligne et al., in preparation).
As we have described in the introduction, the immune contexture addressing the
localization of immune cells inside the tumor plays an essential role in determining
the efficiency on anti-tumor immune responses as well as immunotherapy outcome
(Fridman et al. 2012). In our NT193 model we describe the trapping of CD8+ T cells
in TNC-enriched matrix tracks thereby keeping these immune cells physically away
from the tumor cells. This observation matches the so called immune-exclusion tumor
phenotype where immune cells are present but unable to penetrate into the tumor
“parenchyma” where the latter term means tumor cell nests (Chen and Mellman
2017; Hegde, Karanikas, and Evers 2016). Interestingly, this interaction between
TNC and immune cells has also been observed in another tumor model developed in
the laboratory. Indeed, in a carcinogen-induced tongue OSCC tumor model, we have
seen that in a WT host CD45+ leukocytes and most notably CD11c+ DCs were
restricted to the TNC-enriched matrix tracks, while in the TNCKO tumors these cells
invaded the tumor nests and killed the tumor cells (Appendix II, Spenle, Loustau et
al., in preparation). These data strongly support our hypothesis that TNC plays an
important role in positioning immune cells of the innate (CD11c+ cells in the OSCC
model) and adaptive immune system (CD8+T cells in the NT193 model) inside the
stromal areas thereby blocking their contact with the tumor cells. This mechanism
could explain tumor progression by TNC. How TNC could do that we have
investigated in some detail (see below).
.
150
4.5. TNC impacts CD8+ T cell adhesion and migration through CXCL12
In order to understand the mechanisms through which TNC impacts CD8+ T cells,
we used the RNA seq data from the NT193 end stage tumors as well as the gene
profiling data from the MMTV-NeuNT tumors. We observed that CXCL12 is increased
in both tumor models in those tumors that express high levels of TNC. This we also
saw in cultured NT193 cells where TNC induced mRNA levels and secretion of
CXCL12. Interestingly, this chemokine has got some attention in the past and has
been associated with the immune-excluded tumor phenotype (Chen and Mellman
2017).
CXCL12 is a highly pleiotropic chemokine that has been described to be involved in a
variety of biological processes through interaction with its receptors CXCR4 and
CXCR7 (Bleul et al. 1996; Balabanian et al. 2005). High expression of CXCL12 by
bone marrow stromal cells is a prerequisite for maturation of B cells through
enhanced attraction of hematopoietic stem cells to the bone marrow
microenvironment (Egawa et al. 2001). In a landmark study, it was convincingly
shown that through high expression of CXCR4 in breast cancer cells, CXCL12
regulates the homing of metastatic cells to the lymph nodes and the lungs (Müller et
al. 2001). This concept was supported in many studies for different cancer types later
on (Burger and Kipps 2006). Apart from the widely described metastasis promoting
potential of CXCL12, this chemokine has also been reported to promote tumor cell
proliferation and invasion as well as angiogenesis (Orimo et al. 2005; Liang et al.
2005). As TNC also impacts invasion, metastasis and endothelial cell abundance in
the NT193 model (Sun et al., in prep), it will be interesting to see whether CXCL12
also plays a role in these particular phenotypes that are increased by TNC (Sun et
al., submitted).
In the NT193 model, we showed that tumor cells were a main source of CXCL12
inside the tumor cell nests. We also assessed the receptor expression and observed
that unlike CXCR7, the expression of CXCR4 was decreased by TNC. Altogether,
these data suggest that in the presence of TNC the tumor cells establish a CXCL12-
enriched microenvironment that probably does not directly affect the tumor cells.
Inspired by work from De Laporte et al. (2013), who showed that TNC binds many
soluble molecules, we investigated potential binding of CXCL12 to TNC and indeed
151
found such an interaction. This interaction was 35-fold weaker than that of CXCL12
with CXCR4. This may indicate that in tumor matrix tracks CXCL12 is exchanged
between TNC and CXCR4, thereby attracting CD8+ T cells. It is also possible that a
ternary complex is formed between TNC, CXCL12 and CXCR4, thereby facilitating
adhesion of CD8+ T cells to the usually non-adhesive TNC substratum. Through
which domain TNC binds CXCL12 and whether this is glycosylation dependent
remains to be determined as many interactions with CXCL12 are gycosylation
dependent (Huskens et al. 2007). Previously, it was reported that CXCL12 binding to
a biomimetic film enhanced CXCL12-induced signaling in breast cancer cells by
locally enhancing the signaling strength of CXCL12 (X. Q. Liu et al. 2017). It is
intriguing to speculate that TNC mimics the role of the biomimetic film thereby
enhancing CXCR4-CXCL12 signaling.
Since CD8+ T cells are localized in the TNC matrix tracks together with CXCL12, we
hypothesized that through CXCL12 TNC may attract and immobilize CD8+ T cells.
Indeed, we demonstrated, in cell migration assays, that the TNC/CXCL12 complex
enhanced CD8+ T cell migration and adhesion. This could be reversed by inhibition
of CXCR4 with the inhibitory drug AMD3100. Furthermore, inhibition of the CXCR4-
CXCL12 axis in vivo induced tumor regression. At the endpoint of the experiment, the
AM3100 treated tumors were smaller and highly infiltrated by CD8+ T cells
accompanied by a higher apoptotic index than the control group. These data suggest
that upon inhibition of the CXCR4-CXCL12 signaling axis, CD8+ T cells are enforced
in their tumor cell killing activity. How this works remains to be determined. These
results also suggest that CXCL12 expressed by the tumor cells may have a repellent
activity as was previously shown in another model (Zboralski et al. 2017), thereby
excluding CD8+ cells from the tumor cell nests. Thus CXCL12 expressed by the
tumor cells in a TNC dependent manner may expel CD8+ T cells from the tumor cell
nests and redirect them into the matrix tracks where they get stuck on TNC.
Previous in vitro studies assessing the impact of TNC on T cell function suggested
that TNC blocks T cell activity (Rüegg, Chiquet-Ehrismann, and Alkan 1989; Jachetti
et al. 2015). Our collaborators in Oxford indeed observed that also in the NT193
model CD8+ T cells were affected by TNC, as they were poorly primed.
Macrophages were skewed into a M2 phenotype and DC were poorly activated which
impacted on CD8+ T cell proliferation that was reduced by TNC. This involved TLR4
152
and PDL-1 as inhibition of both signaling reverted CD8+ T cell activities (Deligne et
al., in preparation).
It is possible that a combined high expression of TNC together with CXCL12 may
render tumors poorly responsive to immune checkpoint therapies. Infiltration of CD8+
T cells into the tumor cell nests is critical for successful antitumor immune
surveillance, which is positively correlated with a better clinical outcome (Fridman et
al. 2012; Naito et al. 1998). In a glioblastoma model, TNC has already been
associated to T cell exclusion at the tumor periphery (J.-Y. Huang et al. 2010).
Furthermore, in a pancreatic ductal adenocarcinoma model, it has been shown that
inhibition of the CXCR4-CXCL12 axis resulted in the accumulation of T cells in the
tumor which synergized with the response to an anti PD-L1 antibody (Feig et al.
2013). More recently, similar results were obtained in a murine colorectal cancer
model where combined AMD3100 treatment and anti PD-L1 therapy lead to tumor
regression (Zboralski et al. 2017). Together with our data, these observations
suggest that high TNC and CXCL12 expression in breast cancer patients could be
used to predict response efficacy to immune checkpoint therapies. We propose that
these therapies are poorly effective in the presence of TNC because TNC would trap
reactivated T cells (upon anti-PDL1 treatment or CART transfer). We suggest that
preventing sequestration of CD8+ T cells in the TNC containing matrix tracks by
inhibition of CXCR4 would enhance anti-PDL1 treatment efficiency. Here, our novel
NT193 model could be highly relevant for investigating combinatorial treatment
regimens targeting immune checkpoints and other relevant signaling such as
CXCR4.
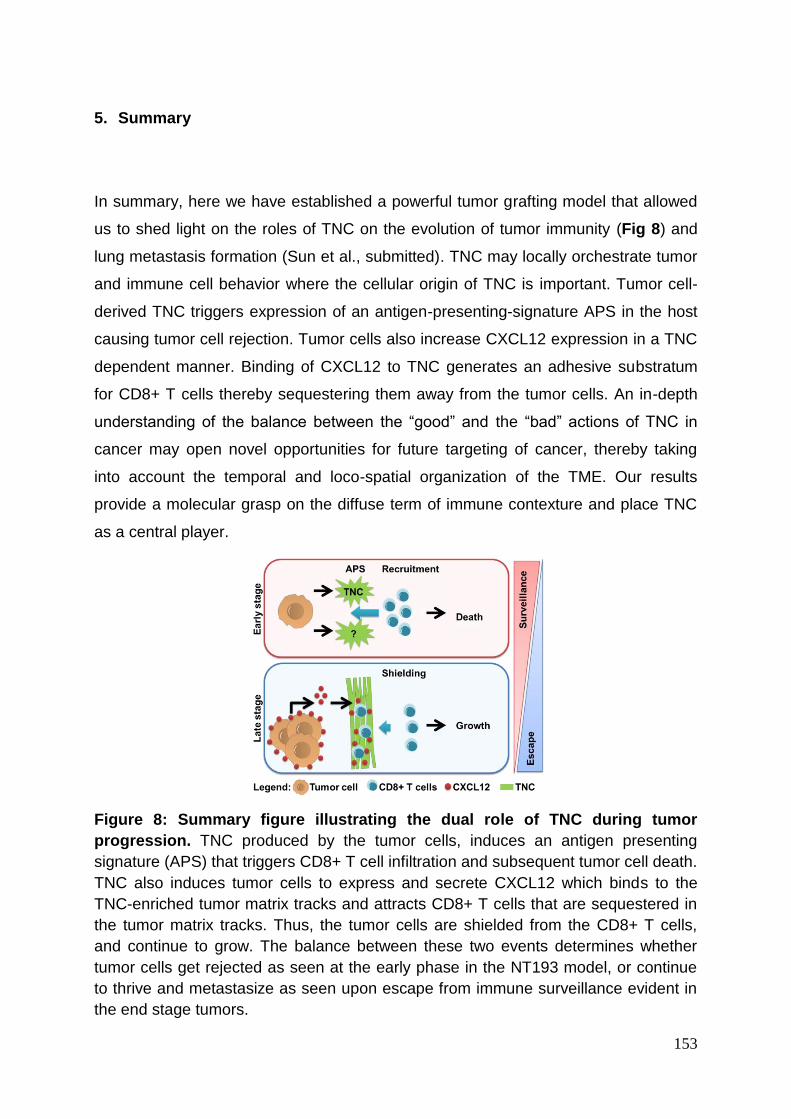
153
5. Summary
In summary, here we have established a powerful tumor grafting model that allowed
us to shed light on the roles of TNC on the evolution of tumor immunity (Fig 8) and
lung metastasis formation (Sun et al., submitted). TNC may locally orchestrate tumor
and immune cell behavior where the cellular origin of TNC is important. Tumor cell-
derived TNC triggers expression of an antigen-presenting-signature APS in the host
causing tumor cell rejection. Tumor cells also increase CXCL12 expression in a TNC
dependent manner. Binding of CXCL12 to TNC generates an adhesive substratum
for CD8+ T cells thereby sequestering them away from the tumor cells. An in-depth
understanding of the balance between the “good” and the “bad” actions of TNC in
cancer may open novel opportunities for future targeting of cancer, thereby taking
into account the temporal and loco-spatial organization of the TME. Our results
provide a molecular grasp on the diffuse term of immune contexture and place TNC
as a central player.
Figure 8: Summary figure illustrating the dual role of TNC during tumor
progression. TNC produced by the tumor cells, induces an antigen presenting
signature (APS) that triggers CD8+ T cell infiltration and subsequent tumor cell death.
TNC also induces tumor cells to express and secrete CXCL12 which binds to the
TNC-enriched tumor matrix tracks and attracts CD8+ T cells that are sequestered in
the tumor matrix tracks. Thus, the tumor cells are shielded from the CD8+ T cells,
and continue to grow. The balance between these two events determines whether
tumor cells get rejected as seen at the early phase in the NT193 model, or continue
to thrive and metastasize as seen upon escape from immune surveillance evident in
the end stage tumors.
154
6. References
Achen, M. G., M. Jeltsch, E. Kukk, T. Mäkinen, A. Vitali, A. F. Wilks, K. Alitalo, and S. A. Stacker. 1998. “Vascular Endothelial Growth Factor D (VEGF-D) Is a Ligand for the Tyrosine Kinases VEGF Receptor 2 (Flk1) and VEGF Receptor 3 (Flt4).” Proceedings of the National Academy of Sciences of the United States of America 95 (2): 548–53.
Al-Husein, Belal, Maha Abdalla, Morgan Trepte, David L. DeRemer, and Payaningal R. Somanath. 2012. “Antiangiogenic Therapy for Cancer: An Update.” Pharmacotherapy: The Journal of Human Pharmacology and Drug Therapy 32 (12): 1095–1111. https://doi.org/10.1002/phar.1147.
Ali, H. R., E. Provenzano, S.-J. Dawson, F. M. Blows, B. Liu, M. Shah, H. M. Earl, et al. 2014. “Association between CD8+ T-Cell Infiltration and Breast Cancer Survival in 12,439 Patients.” Annals of Oncology: Official Journal of the European Society for Medical Oncology 25 (8): 1536–43. https://doi.org/10.1093/annonc/mdu191.
Allavena, Paola, Antonio Sica, Cecilia Garlanda, and Alberto Mantovani. 2008. “The Yin-Yang of Tumor-Associated Macrophages in Neoplastic Progression and Immune Surveillance.” Immunological Reviews 222 (April): 155–61. https://doi.org/10.1111/j.1600-065X.2008.00607.x.
Allen, Michael D., Reza Vaziri, Michael Green, Claude Chelala, Adam R. Brentnall, Sally Dreger, Sabarinath Vallath, et al. 2011. “Clinical and Functional Significance of α9β1 Integrin Expression in Breast Cancer: A Novel Cell-Surface Marker of the Basal Phenotype That Promotes Tumour Cell Invasion.” The Journal of Pathology 223 (5): 646–58. https://doi.org/10.1002/path.2833.
Anders, S., P. T. Pyl, and W. Huber. 2015. “HTSeq--a Python Framework to Work with High-Throughput Sequencing Data.” Bioinformatics 31 (2): 166–69. https://doi.org/10.1093/bioinformatics/btu638.
Anderson, William F., Nilanjan Chatterjee, William B. Ershler, and Otis W. Brawley. 2002. “Estrogen Receptor Breast Cancer Phenotypes in the Surveillance, Epidemiology, and End Results Database.” Breast Cancer Research and Treatment 76 (1): 27–36. https://doi.org/10.1023/A:1020299707510.
Angell, Helen, and Jérôme Galon. 2013. “From the Immune Contexture to the Immunoscore: The Role of Prognostic and Predictive Immune Markers in Cancer.” Current Opinion in Immunology 25 (2): 261–67. https://doi.org/10.1016/j.coi.2013.03.004.
Angelov, D. N., M. Walther, M. Streppel, O. Guntinas-Lichius, W. F. Neiss, R. Probstmeier, and P. Pesheva. 1998. “Tenascin-R Is Antiadhesive for Activated Microglia That Induce Downregulation of the Protein after Peripheral Nerve Injury: A New Role in Neuronal Protection.” The Journal of Neuroscience: The Official Journal of the Society for Neuroscience 18 (16): 6218–29.
155
Arpel, Alexia, Coralie Gamper, Caroline Spenlé, Aurore Fernandez, Laurent Jacob, Nadège Baumlin, Patrice Laquerriere, Gertraud Orend, Gérard Crémel, and Dominique Bagnard. 2016. “Inhibition of Primary Breast Tumor Growth and Metastasis Using a Neuropilin-1 Transmembrane Domain Interfering Peptide.” Oncotarget 7 (34). https://doi.org/10.18632/oncotarget.10101.
Arpino, Grazia, Heidi Weiss, Adrian V. Lee, Rachel Schiff, Sabino De Placido, C. Kent Osborne, and Richard M. Elledge. 2005. “Estrogen Receptor–Positive, Progesterone Receptor–Negative Breast Cancer: Association With Growth Factor Receptor Expression and Tamoxifen Resistance.” JNCI: Journal of the National Cancer Institute 97 (17): 1254–61. https://doi.org/10.1093/jnci/dji249.
Asano, Tsuyoshi, Norimasa Iwasaki, Shigeyuki Kon, Masashi Kanayama, Junko Morimoto, Akio Minami, and Toshimitsu Uede. 2014. “α9β1 Integrin Acts as a Critical Intrinsic Regulator of Human Rheumatoid Arthritis.” Rheumatology (Oxford, England) 53 (3): 415–24. https://doi.org/10.1093/rheumatology/ket371.
Aslakson, C. J., and F. R. Miller. 1992. “Selective Events in the Metastatic Process Defined by Analysis of the Sequential Dissemination of Subpopulations of a Mouse Mammary Tumor.” Cancer Research 52 (6): 1399–1405.
Aufderheide, E., and P. Ekblom. 1988. “Tenascin during Gut Development: Appearance in the Mesenchyme, Shift in Molecular Forms, and Dependence on Epithelial-Mesenchymal Interactions.” The Journal of Cell Biology 107 (6 Pt 1): 2341–49.
Ayala, G. E., H. Dai, M. Powell, R. Li, Y. Ding, T. M. Wheeler, D. Shine, et al. 2008. “Cancer-Related Axonogenesis and Neurogenesis in Prostate Cancer.” Clinical Cancer Research 14 (23): 7593–7603. https://doi.org/10.1158/1078-0432.CCR-08-1164.
Bae, Young Kyung, Aeri Kim, Min Kyoung Kim, Jung Eun Choi, Su Hwan Kang, and Soo Jung Lee. 2013. “Fibronectin Expression in Carcinoma Cells Correlates with Tumor Aggressiveness and Poor Clinical Outcome in Patients with Invasive Breast Cancer.” Human Pathology 44 (10): 2028–37. https://doi.org/10.1016/j.humpath.2013.03.006.
Balabanian, Karl, Bernard Lagane, Simona Infantino, Ken Y. C. Chow, Julie Harriague, Barbara Moepps, Fernando Arenzana-Seisdedos, Marcus Thelen, and Françoise Bachelerie. 2005. “The Chemokine SDF-1/CXCL12 Binds to and Signals through the Orphan Receptor RDC1 in T Lymphocytes.” The Journal of Biological Chemistry 280 (42): 35760–66. https://doi.org/10.1074/jbc.M508234200.
Balkwill, F. R., M. Capasso, and T. Hagemann. 2012. “The Tumor Microenvironment at a Glance.” Journal of Cell Science 125 (23): 5591–96. https://doi.org/10.1242/jcs.116392.
Bardou, Valerie-Jeanne, Grazia Arpino, Richard M. Elledge, C. Kent Osborne, and Gary M. Clark. 2003. “Progesterone Receptor Status Significantly Improves
156
Outcome Prediction Over Estrogen Receptor Status Alone for Adjuvant Endocrine Therapy in Two Large Breast Cancer Databases.” Journal of Clinical Oncology 21 (10): 1973–79. https://doi.org/10.1200/JCO.2003.09.099.
Bargmann, Cornelia I., Mien-Chie Hung, and Robert A. Weinberg. 1986. “Multiple Independent Activations of the Neu Oncogene by a Point Mutation Altering the Transmembrane Domain of p185.” Cell 45 (5): 649–57. https://doi.org/10.1016/0092-8674(86)90779-8.
Bates, Gaynor J., Stephen B. Fox, Cheng Han, Russell D. Leek, José F. Garcia, Adrian L. Harris, and Alison H. Banham. 2006. “Quantification of Regulatory T Cells Enables the Identification of High-Risk Breast Cancer Patients and Those at Risk of Late Relapse.” Journal of Clinical Oncology: Official Journal of the American Society of Clinical Oncology 24 (34): 5373–80. https://doi.org/10.1200/JCO.2006.05.9584.
Baum, M., D. M. Brinkley, J. A. Dossett, K. McPherson, J. S. Patterson, R. D. Rubens, F. G. Smiddy, et al. 1983. “Improved Survival among Patients Treated with Adjuvant Tamoxifen after Mastectomy for Early Breast Cancer.” Lancet (London, England) 2 (8347): 450.
Baxevanis, C. N., G. V. Dedoussis, N. G. Papadopoulos, I. Missitzis, G. P. Stathopoulos, and M. Papamichail. 1994. “Tumor Specific Cytolysis by Tumor Infiltrating Lymphocytes in Breast Cancer.” Cancer 74 (4): 1275–82.
Beiter, Katharina, Elke Hiendlmeyer, Thomas Brabletz, Falk Hlubek, Angela Haynl, Claudia Knoll, Thomas Kirchner, and Andreas Jung. 2005. “β-Catenin Regulates the Expression of Tenascin-C in Human Colorectal Tumors.” Oncogene 24 (55): 8200–8204. https://doi.org/10.1038/sj.onc.1208960.
Bissell, Mina J., H.Glenn Hall, and Gordon Parry. 1982. “How Does the Extracellular Matrix Direct Gene Expression?” Journal of Theoretical Biology 99 (1): 31–68. https://doi.org/10.1016/0022-5193(82)90388-5.
Bissell, Mina J, and William C Hines. 2011. “Why Don’t We Get More Cancer? A Proposed Role of the Microenvironment in Restraining Cancer Progression.” Nature Medicine 17 (3): 320–29. https://doi.org/10.1038/nm.2328.
Biswas, Subhra K., and Alberto Mantovani. 2010. “Macrophage Plasticity and Interaction with Lymphocyte Subsets: Cancer as a Paradigm.” Nature Immunology 11 (10): 889–96. https://doi.org/10.1038/ni.1937.
Bleul, C. C., M. Farzan, H. Choe, C. Parolin, I. Clark-Lewis, J. Sodroski, and T. A. Springer. 1996. “The Lymphocyte Chemoattractant SDF-1 Is a Ligand for LESTR/Fusin and Blocks HIV-1 Entry.” Nature 382 (6594): 829–33. https://doi.org/10.1038/382829a0.
Blum, Janice S., Pamela A. Wearsch, and Peter Cresswell. 2013. “Pathways of Antigen Processing.” Annual Review of Immunology 31: 443–73. https://doi.org/10.1146/annurev-immunol-032712-095910.
157
Bonacchi, Andrea, Ilaria Petrai, Raffaella M. S. Defranco, Elena Lazzeri, Francesco Annunziato, Eva Efsen, Lorenzo Cosmi, et al. 2003. “The Chemokine CCL21 Modulates Lymphocyte Recruitment and Fibrosis in Chronic Hepatitis C.” Gastroenterology 125 (4): 1060–76.
Bonnans, Caroline, Jonathan Chou, and Zena Werb. 2014. “Remodelling the Extracellular Matrix in Development and Disease.” Nature Reviews Molecular Cell Biology 15 (12): 786–801. https://doi.org/10.1038/nrm3904.
Boyd, N. F., L. J. Martin, J. Stone, C. Greenberg, S. Minkin, and M. J. Yaffe. 2001. “Mammographic Densities as a Marker of Human Breast Cancer Risk and Their Use in Chemoprevention.” Current Oncology Reports 3 (4): 314–21.
Brossart, P., S. Wirths, G. Stuhler, V. L. Reichardt, L. Kanz, and W. Brugger. 2000. “Induction of Cytotoxic T-Lymphocyte Responses in Vivo after Vaccinations with Peptide-Pulsed Dendritic Cells.” Blood 96 (9): 3102–8.
Burger, Jan A., and Thomas J. Kipps. 2006. “CXCR4: A Key Receptor in the Crosstalk between Tumor Cells and Their Microenvironment.” Blood 107 (5): 1761–67. https://doi.org/10.1182/blood-2005-08-3182.
Burnet, F. M. 1970. “The Concept of Immunological Surveillance.” Progress in Experimental Tumor Research 13: 1–27.
Burnet, M. 1957. “Cancer; a Biological Approach. I. The Processes of Control.” British Medical Journal 1 (5022): 779–86.
Cai, Jun, Shaoxia Du, Hui Wang, Beibei Xin, Juan Wang, Wenyuan Shen, Wei Wei, Zhongkui Guo, and Xiaohong Shen. 2017. “Tenascin-C Induces Migration and Invasion through JNK/C-Jun Signalling in Pancreatic Cancer.” Oncotarget 8 (43): 74406–22. https://doi.org/10.18632/oncotarget.20160.
Cardoso, F., N. Harbeck, L. Fallowfield, S. Kyriakides, E. Senkus, and on behalf of the ESMO Guidelines Working Group. 2012. “Locally Recurrent or Metastatic Breast Cancer: ESMO Clinical Practice Guidelines for Diagnosis, Treatment and Follow-Up.” Annals of Oncology 23 (suppl 7): vii11-vii19. https://doi.org/10.1093/annonc/mds232.
Casey, A. E., W. R. Laster, and G. L. Ross. 1951. “Sustained Enhanced Growth of Carcinoma EO771 in C57 Black Mice.” Proceedings of the Society for Experimental Biology and Medicine. Society for Experimental Biology and Medicine (New York, N.Y.) 77 (2): 358–62.
Castellon, Raquel, Sergio Caballero, Hamdi K. Hamdi, Shari R. Atilano, Annette M. Aoki, Roy W. Tarnuzzer, M. Cristina Kenney, Maria B. Grant, and Alexander V. Ljubimov. 2002. “Effects of Tenascin-C on Normal and Diabetic Retinal Endothelial Cells in Culture.” Investigative Ophthalmology & Visual Science 43 (8): 2758–66.
Chen, Daniel S., and Ira Mellman. 2017. “Elements of Cancer Immunity and the Cancer–immune Set Point.” Nature 541 (7637): 321–30. https://doi.org/10.1038/nature21349.
158
Chen, Daniel S., and Ira Mellman. 2013. “Oncology Meets Immunology: The Cancer-Immunity Cycle.” Immunity 39 (1): 1–10. https://doi.org/10.1016/j.immuni.2013.07.012.
Chihara, T., S. Suzu, R. Hassan, N. Chutiwitoonchai, M. Hiyoshi, K. Motoyoshi, F. Kimura, and S. Okada. 2010. “IL-34 and M-CSF Share the Receptor Fms but Are Not Identical in Biological Activity and Signal Activation.” Cell Death and Differentiation 17 (12): 1917–27. https://doi.org/10.1038/cdd.2010.60.
Chilosi, M., M. Lestani, A. Benedetti, L. Montagna, S. Pedron, A. Scarpa, F. Menestrina, S. Hirohashi, G. Pizzolo, and G. Semenzato. 1993. “Constitutive Expression of Tenascin in T-Dependent Zones of Human Lymphoid Tissues.” The American Journal of Pathology 143 (5): 1348–55.
Chiquet, Matthias, Ana Sarasa-Renedo, and Vildan Tunç-Civelek. 2004. “Induction of Tenascin-C by Cyclic Tensile Strain versus Growth Factors: Distinct Contributions by Rho/ROCK and MAPK Signaling Pathways.” Biochimica et Biophysica Acta (BBA) - Molecular Cell Research 1693 (3): 193–204. https://doi.org/10.1016/j.bbamcr.2004.08.001.
Chiquet-Ehrismann, Ruth, Eleanor J. Mackie, Carolyn A. Pearson, and Teruyo Sakakura. 1986. “Tenascin: An Extracellular Matrix Protein Involved in Tissue Interactions during Fetal Development and Oncogenesis.” Cell 47 (1): 131–39. https://doi.org/10.1016/0092-8674(86)90374-0.
Chiquet-Ehrismann, Ruth, and Richard P. Tucker. 2011. “Tenascins and the Importance of Adhesion Modulation.” Cold Spring Harbor Perspectives in Biology 3 (5). https://doi.org/10.1101/cshperspect.a004960.
Chow, M. T., and A. D. Luster. 2014. “Chemokines in Cancer.” Cancer Immunology Research 2 (12): 1125–31. https://doi.org/10.1158/2326-6066.CIR-14-0160.
Claesson-Welsh, L., and M. Welsh. 2013. “VEGFA and Tumour Angiogenesis.” Journal of Internal Medicine 273 (2): 114–27. https://doi.org/10.1111/joim.12019.
Coca, S., J. Perez-Piqueras, D. Martinez, A. Colmenarejo, M. A. Saez, C. Vallejo, J. A. Martos, and M. Moreno. 1997. “The Prognostic Significance of Intratumoral Natural Killer Cells in Patients with Colorectal Carcinoma.” Cancer 79 (12): 2320–28.
Cornil, I., D. Theodorescu, S. Man, M. Herlyn, J. Jambrosic, and R. S. Kerbel. 1991. “Fibroblast Cell Interactions with Human Melanoma Cells Affect Tumor Cell Growth as a Function of Tumor Progression.” Proceedings of the National Academy of Sciences of the United States of America 88 (14): 6028–32.
Crossin, K. L. 1991. “Cytotactin Binding: Inhibition of Stimulated Proliferation and Intracellular Alkalinization in Fibroblasts.” Proceedings of the National Academy of Sciences of the United States of America 88 (24): 11403–7.
Curiel, Tyler J, George Coukos, Linhua Zou, Xavier Alvarez, Pui Cheng, Peter Mottram, Melina Evdemon-Hogan, et al. 2004. “Specific Recruitment of
159
Regulatory T Cells in Ovarian Carcinoma Fosters Immune Privilege and Predicts Reduced Survival.” Nature Medicine 10 (9): 942–49. https://doi.org/10.1038/nm1093.
De Arcangelis, A., P. Neuville, R. Boukamel, O. Lefebvre, M. Kedinger, and P. Simon-Assmann. 1996. “Inhibition of Laminin Alpha 1-Chain Expression Leads to Alteration of Basement Membrane Assembly and Cell Differentiation.” The Journal of Cell Biology 133 (2): 417–30.
De Laporte, Laura, Jeffrey J. Rice, Federico Tortelli, and Jeffrey A. Hubbell. 2013. “Tenascin C Promiscuously Binds Growth Factors via Its Fifth Fibronectin Type III-like Domain.” PloS One 8 (4): e62076. https://doi.org/10.1371/journal.pone.0062076.
Delort, Laetitia, Adrien Rossary, Marie-Chantal Farges, Marie-Paule Vasson, and Florence Caldefie-Chézet. 2015. “Leptin, Adipocytes and Breast Cancer: Focus on Inflammation and Anti-Tumor Immunity.” Life Sciences 140 (November): 37–48. https://doi.org/10.1016/j.lfs.2015.04.012.
DeNardo, David G., Donal J. Brennan, Elton Rexhepaj, Brian Ruffell, Stephen L. Shiao, Stephen F. Madden, William M. Gallagher, et al. 2011. “Leukocyte Complexity Predicts Breast Cancer Survival and Functionally Regulates Response to Chemotherapy.” Cancer Discovery 1 (1): 54–67. https://doi.org/10.1158/2159-8274.CD-10-0028.
Denkert, Carsten, Gunter von Minckwitz, Silvia Darb-Esfahani, Bianca Lederer, Barbara I. Heppner, Karsten E. Weber, Jan Budczies, et al. 2018. “Tumour-Infiltrating Lymphocytes and Prognosis in Different Subtypes of Breast Cancer: A Pooled Analysis of 3771 Patients Treated with Neoadjuvant Therapy.” The Lancet. Oncology 19 (1): 40–50. https://doi.org/10.1016/S1470-2045(17)30904-X.
DeSantis, Carol E., Jiemin Ma, Ann Goding Sauer, Lisa A. Newman, and Ahmedin Jemal. 2017. “Breast Cancer Statistics, 2017, Racial Disparity in Mortality by State: Breast Cancer Statistics, 2017.” CA: A Cancer Journal for Clinicians 67 (6): 439–48. https://doi.org/10.3322/caac.21412.
Desgrosellier, Jay S., and David A. Cheresh. 2010. “Integrins in Cancer: Biological Implications and Therapeutic Opportunities.” Nature Reviews. Cancer 10 (1): 9–22. https://doi.org/10.1038/nrc2748.
Dirat, B., L. Bochet, M. Dabek, D. Daviaud, S. Dauvillier, B. Majed, Y. Y. Wang, et al. 2011. “Cancer-Associated Adipocytes Exhibit an Activated Phenotype and Contribute to Breast Cancer Invasion.” Cancer Research 71 (7): 2455–65. https://doi.org/10.1158/0008-5472.CAN-10-3323.
Dobin, Alexander, Carrie A. Davis, Felix Schlesinger, Jorg Drenkow, Chris Zaleski, Sonali Jha, Philippe Batut, Mark Chaisson, and Thomas R. Gingeras. 2013. “STAR: Ultrafast Universal RNA-Seq Aligner.” Bioinformatics 29 (1): 15–21. https://doi.org/10.1093/bioinformatics/bts635.
160
Drumea-Mirancea, Mihaela, Johannes T. Wessels, Claudia A. Müller, Mike Essl, Johannes A. Eble, Eva Tolosa, Manuel Koch, et al. 2006. “Characterization of a Conduit System Containing Laminin-5 in the Human Thymus: A Potential Transport System for Small Molecules.” Journal of Cell Science 119 (Pt 7): 1396–1405. https://doi.org/10.1242/jcs.02840.
Dunn, Gavin P., Allen T. Bruce, Hiroaki Ikeda, Lloyd J. Old, and Robert D. Schreiber. 2002. “Cancer Immunoediting: From Immunosurveillance to Tumor Escape.” Nature Immunology 3 (11): 991–98. https://doi.org/10.1038/ni1102-991.
Dunn, Gavin P., Lloyd J. Old, and Robert D. Schreiber. 2004. “The Immunobiology of Cancer Immunosurveillance and Immunoediting.” Immunity 21 (2): 137–48. https://doi.org/10.1016/j.immuni.2004.07.017.
Early Breast Cancer Trialists’ Collaborative Group. 1988. “Effects of Adjuvant Tamoxifen and of Cytotoxic Therapy on Mortality in Early Breast Cancer.” New England Journal of Medicine 319 (26): 1681–92. https://doi.org/10.1056/NEJM198812293192601.
Egawa, T., K. Kawabata, H. Kawamoto, K. Amada, R. Okamoto, N. Fujii, T. Kishimoto, Y. Katsura, and T. Nagasawa. 2001. “The Earliest Stages of B Cell Development Require a Chemokine Stromal Cell-Derived Factor/Pre-B Cell Growth-Stimulating Factor.” Immunity 15 (2): 323–34.
Ehrismann, R., M. Chiquet, and D. C. Turner. 1981. “Mode of Action of Fibronectin in Promoting Chicken Myoblast Attachment. Mr = 60,000 Gelatin-Binding Fragment Binds Native Fibronectin.” The Journal of Biological Chemistry 256 (8): 4056–62.
Ehrlich, P. 1909. “Über den jetzigen Stand der Chemotherapie.” Berichte der deutschen chemischen Gesellschaft 42 (1): 17–47. https://doi.org/10.1002/cber.19090420105.
Ellyard, J. I., L. Simson, and C. R. Parish. 2007. “Th2-Mediated Anti-Tumour Immunity: Friend or Foe?” Tissue Antigens 70 (1): 1–11. https://doi.org/10.1111/j.1399-0039.2007.00869.x.
Emoto, K., Y. Yamada, H. Sawada, H. Fujimoto, M. Ueno, T. Takayama, K. Kamada, A. Naito, S. Hirao, and Y. Nakajima. 2001. “Annexin II Overexpression Correlates with Stromal Tenascin-C Overexpression: A Prognostic Marker in Colorectal Carcinoma.” Cancer 92 (6): 1419–26.
Engelhardt, John J., Bijan Boldajipour, Peter Beemiller, Priya Pandurangi, Caitlin Sorensen, Zena Werb, Mikala Egeblad, and Matthew F. Krummel. 2012. “Marginating Dendritic Cells of the Tumor Microenvironment Cross-Present Tumor Antigens and Stably Engage Tumor-Specific T Cells.” Cancer Cell 21 (3): 402–17. https://doi.org/10.1016/j.ccr.2012.01.008.
Engler, Adam J., Shamik Sen, H. Lee Sweeney, and Dennis E. Discher. 2006. “Matrix Elasticity Directs Stem Cell Lineage Specification.” Cell 126 (4): 677–89. https://doi.org/10.1016/j.cell.2006.06.044.
161
Feig, Christine, James O. Jones, Matthew Kraman, Richard J. B. Wells, Andrew Deonarine, Derek S. Chan, Claire M. Connell, et al. 2013. “Targeting CXCL12 from FAP-Expressing Carcinoma-Associated Fibroblasts Synergizes with Anti-PD-L1 Immunotherapy in Pancreatic Cancer.” Proceedings of the National Academy of Sciences of the United States of America 110 (50): 20212–17. https://doi.org/10.1073/pnas.1320318110.
Fitzmaurice, Christina, Daniel Dicker, Amanda Pain, Hannah Hamavid, Maziar Moradi-Lakeh, Michael F. MacIntyre, Christine Allen, et al. 2015. “The Global Burden of Cancer 2013.” JAMA Oncology 1 (4): 505. https://doi.org/10.1001/jamaoncol.2015.0735.
Fletcher, Anne L., Sophie E. Acton, and Konstantin Knoblich. 2015. “Lymph Node Fibroblastic Reticular Cells in Health and Disease.” Nature Reviews. Immunology 15 (6): 350–61. https://doi.org/10.1038/nri3846.
Foley, E. J. 1953. “Antigenic Properties of Methylcholanthrene-Induced Tumors in Mice of the Strain of Origin.” Cancer Research 13 (12): 835–37.
Folkman, J. 1971. “Tumor Angiogenesis: Therapeutic Implications.” The New England Journal of Medicine 285 (21): 1182–86. https://doi.org/10.1056/NEJM197111182852108.
Folkman, Judah. 2003. “Fundamental Concepts of the Angiogenic Process.” Current Molecular Medicine 3 (7): 643–51.
Foulkes, William D., Ian E. Smith, and Jorge S. Reis-Filho. 2010. “Triple-Negative Breast Cancer.” New England Journal of Medicine 363 (20): 1938–48. https://doi.org/10.1056/NEJMra1001389.
Frantz, C., K. M. Stewart, and V. M. Weaver. 2010. “The Extracellular Matrix at a Glance.” Journal of Cell Science 123 (24): 4195–4200. https://doi.org/10.1242/jcs.023820.
Fridman, Wolf Herman, Franck Pagès, Catherine Sautès-Fridman, and Jérôme Galon. 2012. “The Immune Contexture in Human Tumours: Impact on Clinical Outcome.” Nature Reviews Cancer 12 (4): 298–306. https://doi.org/10.1038/nrc3245.
Froelich, C. J., K. Orth, J. Turbov, P. Seth, R. Gottlieb, B. Babior, G. M. Shah, R. C. Bleackley, V. M. Dixit, and W. Hanna. 1996. “New Paradigm for Lymphocyte Granule-Mediated Cytotoxicity. Target Cells Bind and Internalize Granzyme B, but an Endosomolytic Agent Is Necessary for Cytosolic Delivery and Subsequent Apoptosis.” The Journal of Biological Chemistry 271 (46): 29073–79.
Fukino, Koichi, Lei Shen, Attila Patocs, George L. Mutter, and Charis Eng. 2007. “Genomic Instability Within Tumor Stroma and Clinicopathological Characteristics of Sporadic Primary Invasive Breast Carcinoma.” JAMA 297 (19): 2103. https://doi.org/10.1001/jama.297.19.2103.
162
Galon, J. 2006. “Type, Density, and Location of Immune Cells Within Human Colorectal Tumors Predict Clinical Outcome.” Science 313 (5795): 1960–64. https://doi.org/10.1126/science.1129139.
Galon, Jérôme, Bernhard Mlecnik, Gabriela Bindea, Helen K. Angell, Anne Berger, Christine Lagorce, Alessandro Lugli, et al. 2014. “Towards the Introduction of the ‘Immunoscore’ in the Classification of Malignant Tumours.” The Journal of Pathology 232 (2): 199–209. https://doi.org/10.1002/path.4287.
Galon, Jérôme, Franck Pagès, Francesco M. Marincola, Helen K. Angell, Magdalena Thurin, Alessandro Lugli, Inti Zlobec, et al. 2012. “Cancer Classification Using the Immunoscore: A Worldwide Task Force.” Journal of Translational Medicine 10 (October): 205. https://doi.org/10.1186/1479-5876-10-205.
Gebb, Sarah A. L., and Peter Lloyd Jones. 2003. “Hypoxia and Lung Branching Morphogenesis.” Advances in Experimental Medicine and Biology 543: 117–25.
Geyer, Felipe C., Maria A. Lopez-Garcia, Maryou B. Lambros, and Jorge S. Reis-Filho. 2009. “Genetic Characterization of Breast Cancer and Implications for Clinical Management.” Journal of Cellular and Molecular Medicine 13 (10): 4090–4103. https://doi.org/10.1111/j.1582-4934.2009.00906.x.
Ghajar, Cyrus M., and Mina J. Bissell. 2008. “Extracellular Matrix Control of Mammary Gland Morphogenesis and Tumorigenesis: Insights from Imaging.” Histochemistry and Cell Biology 130 (6): 1105–18. https://doi.org/10.1007/s00418-008-0537-1.
Giblin, Sean P, and Kim S Midwood. 2015. “Tenascin-C: Form versus Function.” Cell Adhesion & Migration 9 (1–2): 48–82. https://doi.org/10.4161/19336918.2014.987587.
Goh, Fui G., Anna M. Piccinini, Thomas Krausgruber, Irina A. Udalova, and Kim S. Midwood. 2010. “Transcriptional Regulation of the Endogenous Danger Signal Tenascin-C: A Novel Autocrine Loop in Inflammation.” Journal of Immunology (Baltimore, Md.: 1950) 184 (5): 2655–62. https://doi.org/10.4049/jimmunol.0903359.
Grivennikov, Sergei I., Florian R. Greten, and Michael Karin. 2010. “Immunity, Inflammation, and Cancer.” Cell 140 (6): 883–99. https://doi.org/10.1016/j.cell.2010.01.025.
Gschwind, Andreas, Oliver M. Fischer, and Axel Ullrich. 2004. “The Discovery of Receptor Tyrosine Kinases: Targets for Cancer Therapy.” Nature Reviews Cancer 4 (5): 361–70. https://doi.org/10.1038/nrc1360.
Guéry, Leslie, and Stéphanie Hugues. 2015. “Th17 Cell Plasticity and Functions in Cancer Immunity.” BioMed Research International 2015: 1–11. https://doi.org/10.1155/2015/314620.
Gulubova, Maya, and Tatyana Vlaykova. 2006. “Immunohistochemical Assessment of Fibronectin and Tenascin and Their Integrin Receptors alpha5beta1 and
163
alpha9beta1 in Gastric and Colorectal Cancers with Lymph Node and Liver Metastases.” Acta Histochemica 108 (1): 25–35. https://doi.org/10.1016/j.acthis.2005.12.001.
Györffy, Balazs, Andras Lanczky, Aron C. Eklund, Carsten Denkert, Jan Budczies, Qiyuan Li, and Zoltan Szallasi. 2010. “An Online Survival Analysis Tool to Rapidly Assess the Effect of 22,277 Genes on Breast Cancer Prognosis Using Microarray Data of 1,809 Patients.” Breast Cancer Research and Treatment 123 (3): 725–31. https://doi.org/10.1007/s10549-009-0674-9.
Hanahan, Douglas, and Lisa M. Coussens. 2012. “Accessories to the Crime: Functions of Cells Recruited to the Tumor Microenvironment.” Cancer Cell 21 (3): 309–22. https://doi.org/10.1016/j.ccr.2012.02.022.
Hanahan, Douglas, and Robert A Weinberg. 2000. “The Hallmarks of Cancer.” Cell 100 (1): 57–70. https://doi.org/10.1016/S0092-8674(00)81683-9.
Hanahan, Douglas, and Robert A. Weinberg. 2011. “Hallmarks of Cancer: The Next Generation.” Cell 144 (5): 646–74. https://doi.org/10.1016/j.cell.2011.02.013.
Hanamura, N., T. Yoshida, E. Matsumoto, Y. Kawarada, and T. Sakakura. 1997. “Expression of Fibronectin and Tenascin-C mRNA by Myofibroblasts, Vascular Cells and Epithelial Cells in Human Colon Adenomas and Carcinomas.” International Journal of Cancer 73 (1): 10–15.
Hancox, Rachael A, Michael D Allen, Deborah L Holliday, Dylan R Edwards, Caroline J Pennington, David S Guttery, Jacqueline A Shaw, Rosemary A Walker, J Howard Pringle, and J Louise Jones. 2009. “Tumour-Associated Tenascin-C Isoforms Promote Breast Cancer Cell Invasion and Growth by Matrix Metalloproteinase-Dependent and Independent Mechanisms.” Breast Cancer Research 11 (2). https://doi.org/10.1186/bcr2251.
Hauzenberger, D., P. Olivier, D. Gundersen, and C. Rüegg. 1999. “Tenascin-C Inhibits beta1 Integrin-Dependent T Lymphocyte Adhesion to Fibronectin through the Binding of Its fnIII 1-5 Repeats to Fibronectin.” European Journal of Immunology 29 (5): 1435–47.
Hegde, P. S., V. Karanikas, and S. Evers. 2016. “The Where, the When, and the How of Immune Monitoring for Cancer Immunotherapies in the Era of Checkpoint Inhibition.” Clinical Cancer Research 22 (8): 1865–74. https://doi.org/10.1158/1078-0432.CCR-15-1507.
Hemesath, T. J., L. S. Marton, and K. Stefansson. 1994. “Inhibition of T Cell Activation by the Extracellular Matrix Protein Tenascin.” Journal of Immunology (Baltimore, Md.: 1950) 152 (11): 5199–5207.
Herberman, R. B., M. E. Nunn, and D. H. Lavrin. 1975. “Natural Cytotoxic Reactivity of Mouse Lymphoid Cells against Syngeneic Acid Allogeneic Tumors. I. Distribution of Reactivity and Specificity.” International Journal of Cancer 16 (2): 216–29.
164
Herold-Mende, Christel, Margareta M. Mueller, Mario M. Bonsanto, Horst Peter Schmitt, Stefan Kunze, and Hans-Herbert Steiner. 2002. “Clinical Impact and Functional Aspects of Tenascin-C Expression during Glioma Progression.” International Journal of Cancer 98 (3): 362–69.
Hindermann, W., A. Berndt, L. Borsi, X. Luo, P. Hyckel, D. Katenkamp, and H. Kosmehl. 1999. “Synthesis and Protein Distribution of the Unspliced Large Tenascin-C Isoform in Oral Squamous Cell Carcinoma.” The Journal of Pathology 189 (4): 475–80. https://doi.org/10.1002/(SICI)1096-9896(199912)189:4<475::AID-PATH462>3.0.CO;2-V.
Horwitz, Kathryn B., Yoshihiro Koseki, and William L. McGUIRE. 1978. “Estrogen Control of Progesterone Receptor in Human Breast Cancer: Role of Estradiol and Antiestrogen*.” Endocrinology 103 (5): 1742–51. https://doi.org/10.1210/endo-103-5-1742.
Huang, Da Wei, Brad T Sherman, and Richard A Lempicki. 2009. “Systematic and Integrative Analysis of Large Gene Lists Using DAVID Bioinformatics Resources.” Nature Protocols 4 (1): 44–57. https://doi.org/10.1038/nprot.2008.211.
Huang, Jyun-Yuan, Yu-Jung Cheng, Yu-Ping Lin, Huan-Ching Lin, Chung-Chen Su, Rudy Juliano, and Bei-Chang Yang. 2010. “Extracellular Matrix of Glioblastoma Inhibits Polarization and Transmigration of T Cells: The Role of Tenascin-C in Immune Suppression.” Journal of Immunology (Baltimore, Md.: 1950) 185 (3): 1450–59. https://doi.org/10.4049/jimmunol.0901352.
Huang, W., R. Chiquet-Ehrismann, J. V. Moyano, A. Garcia-Pardo, and G. Orend. 2001. “Interference of Tenascin-C with Syndecan-4 Binding to Fibronectin Blocks Cell Adhesion and Stimulates Tumor Cell Proliferation.” Cancer Research 61 (23): 8586–94.
Huskens, Dana, Katrien Princen, Michael Schreiber, and Dominique Schols. 2007. “The Role of N-Glycosylation Sites on the CXCR4 Receptor for CXCL-12 Binding and Signaling and X4 HIV-1 Viral Infectivity.” Virology 363 (2): 280–87. https://doi.org/10.1016/j.virol.2007.01.031.
Hynes, R. O. 2009. “The Extracellular Matrix: Not Just Pretty Fibrils.” Science 326 (5957): 1216–19. https://doi.org/10.1126/science.1176009.
Hynes, R. O., and A. Naba. 2012. “Overview of the Matrisome--An Inventory of Extracellular Matrix Constituents and Functions.” Cold Spring Harbor Perspectives in Biology 4 (1): a004903–a004903. https://doi.org/10.1101/cshperspect.a004903.
Ilmonen, S., T. Jahkola, J. P. Turunen, T. Muhonen, and S. Asko-Seljavaara. 2004. “Tenascin-C in Primary Malignant Melanoma of the Skin.” Histopathology 45 (4): 405–11. https://doi.org/10.1111/j.1365-2559.2004.01976.x.
Ishihara, A., T. Yoshida, H. Tamaki, and T. Sakakura. 1995. “Tenascin Expression in Cancer Cells and Stroma of Human Breast Cancer and Its Prognostic
165
Significance.” Clinical Cancer Research: An Official Journal of the American Association for Cancer Research 1 (9): 1035–41.
Jachetti, Elena, Sara Caputo, Stefania Mazzoleni, Chiara Svetlana Brambillasca, Sara Martina Parigi, Matteo Grioni, Ignazio Stefano Piras, et al. 2015. “Tenascin-C Protects Cancer Stem-like Cells from Immune Surveillance by Arresting T-Cell Activation.” Cancer Research 75 (10): 2095–2108. https://doi.org/10.1158/0008-5472.CAN-14-2346.
Jéhannin-Ligier, Karine, Emmanuelle Dantony, Nadine Bossard, Florence Molinié, Gautier Defossez, Laëtitia Daubisse-Marliac, Patricia Delafosse, Laurent Remontet, and Zoé Uhry. 2017. “Projection de L’incidence et de La Mortalité Par Cancer En France Métropolitaine En 2017.” Saint-Maurice: Santé publique France. http://www.e-cancer.fr/Expertises-et-publications/Catalogue-des-publications/Projection-de-l-incidence-et-de-la-mortalite-en-France-metropolitaine-en-2017-Rapport-technique.
Joukov, V., K. Pajusola, A. Kaipainen, D. Chilov, I. Lahtinen, E. Kukk, O. Saksela, N. Kalkkinen, and K. Alitalo. 1996. “A Novel Vascular Endothelial Growth Factor, VEGF-C, Is a Ligand for the Flt4 (VEGFR-3) and KDR (VEGFR-2) Receptor Tyrosine Kinases.” The EMBO Journal 15 (2): 290–98.
Joyce, J. A., and D. T. Fearon. 2015. “T Cell Exclusion, Immune Privilege, and the Tumor Microenvironment.” Science 348 (6230): 74–80. https://doi.org/10.1126/science.aaa6204.
Kalams, S. A., and B. D. Walker. 1998. “The Critical Need for CD4 Help in Maintaining Effective Cytotoxic T Lymphocyte Responses.” The Journal of Experimental Medicine 188 (12): 2199–2204.
Katoh, D., K. Nagaharu, N. Shimojo, N. Hanamura, M. Yamashita, Y. Kozuka, K. Imanaka-Yoshida, and T. Yoshida. 2013. “Binding of αvβ1 and αvβ6 Integrins to Tenascin-C Induces Epithelial-Mesenchymal Transition-like Change of Breast Cancer Cells.” Oncogenesis 2 (August): e65. https://doi.org/10.1038/oncsis.2013.27.
Ke, Xing, and Lisong Shen. 2017. “Molecular Targeted Therapy of Cancer: The Progress and Future Prospect.” Frontiers in Laboratory Medicine 1 (2): 69–75. https://doi.org/10.1016/j.flm.2017.06.001.
Kinloch, Andrew, Karin Lundberg, Robin Wait, Natalia Wegner, Ngee Han Lim, Albert J. W. Zendman, Tore Saxne, Vivianne Malmström, and Patrick J. Venables. 2008. “Synovial Fluid Is a Site of Citrullination of Autoantigens in Inflammatory Arthritis.” Arthritis and Rheumatism 58 (8): 2287–95. https://doi.org/10.1002/art.23618.
Kmieciak, Maciej, Keith L. Knutson, Catherine I. Dumur, and Masoud H. Manjili. 2007. “HER-2/Neu Antigen Loss and Relapse of Mammary Carcinoma Are Actively Induced by T Cell-Mediated Anti-Tumor Immune Responses.” European Journal of Immunology 37 (3): 675–85. https://doi.org/10.1002/eji.200636639.
166
Knutson, Keith L., Hailing Lu, Brad Stone, Jennifer M. Reiman, Marshall D. Behrens, Christine M. Prosperi, Ekram A. Gad, Arianna Smorlesi, and Mary L. Disis. 2006. “Immunoediting of Cancers May Lead to Epithelial to Mesenchymal Transition.” Journal of Immunology (Baltimore, Md.: 1950) 177 (3): 1526–33.
Koebel, Catherine M., William Vermi, Jeremy B. Swann, Nadeen Zerafa, Scott J. Rodig, Lloyd J. Old, Mark J. Smyth, and Robert D. Schreiber. 2007. “Adaptive Immunity Maintains Occult Cancer in an Equilibrium State.” Nature 450 (7171): 903–7. https://doi.org/10.1038/nature06309.
Kryczek, I., M. Banerjee, P. Cheng, L. Vatan, W. Szeliga, S. Wei, E. Huang, et al. 2009. “Phenotype, Distribution, Generation, and Functional and Clinical Relevance of Th17 Cells in the Human Tumor Environments.” Blood 114 (6): 1141–49. https://doi.org/10.1182/blood-2009-03-208249.
Lange, Katrin, Martial Kammerer, Monika E. Hegi, Stefan Grotegut, Antje Dittmann, Wentao Huang, Erika Fluri, et al. 2007. “Endothelin Receptor Type B Counteracts Tenascin-C-Induced Endothelin Receptor Type A-Dependent Focal Adhesion and Actin Stress Fiber Disorganization.” Cancer Research 67 (13): 6163–73. https://doi.org/10.1158/0008-5472.CAN-06-3348.
Langlois, Benoit, Falk Saupe, Tristan Rupp, Christiane Arnold, Michaël van der Heyden, Gertraud Orend, and Thomas Hussenet. 2014. “AngioMatrix, a Signature of the Tumor Angiogenic Switch-Specific Matrisome, Correlates with Poor Prognosis for Glioma and Colorectal Cancer Patients.” Oncotarget 5 (21): 10529–45. https://doi.org/10.18632/oncotarget.2470.
Langmead, Ben, and Steven L Salzberg. 2012. “Fast Gapped-Read Alignment with Bowtie 2.” Nature Methods 9 (4): 357–59. https://doi.org/10.1038/nmeth.1923.
Lee, Andrew W, Tuan Truong, Kara Bickham, Jean-Francois Fonteneau, Marie Larsson, Ida Da Silva, Selin Somersan, Elaine K Thomas, and Nina Bhardwaj. 2002. “A Clinical Grade Cocktail of Cytokines and PGE2 Results in Uniform Maturation of Human Monocyte-Derived Dendritic Cells: Implications for Immunotherapy.” Vaccine 20 (December): A8–22. https://doi.org/10.1016/S0264-410X(02)00382-1.
Leek, R. D., C. E. Lewis, R. Whitehouse, M. Greenall, J. Clarke, and A. L. Harris. 1996. “Association of Macrophage Infiltration with Angiogenesis and Prognosis in Invasive Breast Carcinoma.” Cancer Research 56 (20): 4625–29.
Lelekakis, M., J. M. Moseley, T. J. Martin, D. Hards, E. Williams, P. Ho, D. Lowen, et al. 1999. “A Novel Orthotopic Model of Breast Cancer Metastasis to Bone.” Clinical & Experimental Metastasis 17 (2): 163–70.
Levental, Kandice R., Hongmei Yu, Laura Kass, Johnathon N. Lakins, Mikala Egeblad, Janine T. Erler, Sheri F. T. Fong, et al. 2009. “Matrix Crosslinking Forces Tumor Progression by Enhancing Integrin Signaling.” Cell 139 (5): 891–906. https://doi.org/10.1016/j.cell.2009.10.027.
167
Liang, Zhongxing, Younghyoun Yoon, John Votaw, Mark M. Goodman, Larry Williams, and Hyunsuk Shim. 2005. “Silencing of CXCR4 Blocks Breast Cancer Metastasis.” Cancer Research 65 (3): 967–71.
Liu, Mingli, Shanchun Guo, and Jonathan K. Stiles. 2011. “The Emerging Role of CXCL10 in Cancer (Review).” Oncology Letters 2 (4): 583–89. https://doi.org/10.3892/ol.2011.300.
Liu, Xi Qiu, Laure Fourel, Fabien Dalonneau, Rabia Sadir, Salome Leal, Hugues Lortat-Jacob, Marianne Weidenhaupt, Corinne Albiges-Rizo, and Catherine Picart. 2017. “Biomaterial-Enabled Delivery of SDF-1α at the Ventral Side of Breast Cancer Cells Reveals a Crosstalk between Cell Receptors to Promote the Invasive Phenotype.” Biomaterials 127 (May): 61–74. https://doi.org/10.1016/j.biomaterials.2017.02.035.
Love, Michael I, Wolfgang Huber, and Simon Anders. 2014. “Moderated Estimation of Fold Change and Dispersion for RNA-Seq Data with DESeq2.” Genome Biology 15 (12). https://doi.org/10.1186/s13059-014-0550-8.
Lu, C., M. F. Vickers, and R. S. Kerbel. 1992. “Interleukin 6: A Fibroblast-Derived Growth Inhibitor of Human Melanoma Cells from Early but Not Advanced Stages of Tumor Progression.” Proceedings of the National Academy of Sciences of the United States of America 89 (19): 9215–19.
Ma, Yang, Galina V. Shurin, Zhu Peiyuan, and Michael R. Shurin. 2013. “Dendritic Cells in the Cancer Microenvironment.” Journal of Cancer 4 (1): 36–44. https://doi.org/10.7150/jca.5046.
Mackie, E. J., R. Chiquet-Ehrismann, C. A. Pearson, Y. Inaguma, K. Taya, Y. Kawarada, and T. Sakakura. 1987. “Tenascin Is a Stromal Marker for Epithelial Malignancy in the Mammary Gland.” Proceedings of the National Academy of Sciences of the United States of America 84 (13): 4621–25.
Malanchi, Ilaria, Albert Santamaria-Martínez, Evelyn Susanto, Hong Peng, Hans-Anton Lehr, Jean-Francois Delaloye, and Joerg Huelsken. 2011. “Interactions between Cancer Stem Cells and Their Niche Govern Metastatic Colonization.” Nature 481 (7379): 85–89. https://doi.org/10.1038/nature10694.
Mariel, Garcia-Chagollan, Carranza-Torres Irma Edith, Carranza-Rosales Pilar, Guzmán-Delgado Nancy Elena, Ramírez-Montoya Humberto, Martínez-Silva María Guadalupe, Mariscal-Ramirez Ignacio, et al. 2018. “Expression of NK Cell Surface Receptors in Breast Cancer Tissue as Predictors of Resistance to Antineoplastic Treatment.” Technology in Cancer Research & Treatment 17 (January): 153303381876449. https://doi.org/10.1177/1533033818764499.
Marsh, Timothy, Kristian Pietras, and Sandra S. McAllister. 2013. “Fibroblasts as Architects of Cancer Pathogenesis.” Biochimica et Biophysica Acta (BBA) - Molecular Basis of Disease 1832 (7): 1070–78. https://doi.org/10.1016/j.bbadis.2012.10.013.
Martino, M. M., P. S. Briquez, A. Ranga, M. P. Lutolf, and J. A. Hubbell. 2013. “Heparin-Binding Domain of Fibrin(ogen) Binds Growth Factors and Promotes
168
Tissue Repair When Incorporated within a Synthetic Matrix.” Proceedings of the National Academy of Sciences 110 (12): 4563–68. https://doi.org/10.1073/pnas.1221602110.
Maschler, Sabine, Stefan Grunert, Adriana Danielopol, Hartmut Beug, and Gerhard Wirl. 2004. “Enhanced Tenascin-C Expression and Matrix Deposition during Ras/TGF-β-Induced Progression of Mammary Tumor Cells.” Oncogene 23 (20): 3622–33. https://doi.org/10.1038/sj.onc.1207403.
Mbeunkui, Flaubert, and Donald J. Johann. 2009. “Cancer and the Tumor Microenvironment: A Review of an Essential Relationship.” Cancer Chemotherapy and Pharmacology 63 (4): 571–82. https://doi.org/10.1007/s00280-008-0881-9.
Mi, Huaiyu, Xiaosong Huang, Anushya Muruganujan, Haiming Tang, Caitlin Mills, Diane Kang, and Paul D. Thomas. 2017. “PANTHER Version 11: Expanded Annotation Data from Gene Ontology and Reactome Pathways, and Data Analysis Tool Enhancements.” Nucleic Acids Research 45 (D1): D183–89. https://doi.org/10.1093/nar/gkw1138.
Midwood, Kim, Matthias Chiquet, Richard P. Tucker, and Gertraud Orend. 2016. “Tenascin-C at a Glance.” Journal of Cell Science 129 (23): 4321–27. https://doi.org/10.1242/jcs.190546.
Midwood, Kim, Thomas Hussenet, Benoit Langlois, and Gertraud Orend. 2011. “Advances in Tenascin-C Biology.” Cellular and Molecular Life Sciences 68 (19): 3175–99. https://doi.org/10.1007/s00018-011-0783-6.
Midwood, Kim S., Matthias Chiquet, Richard P. Tucker, and Gertraud Orend. 2016. “Tenascin-C at a Glance.” Journal of Cell Science 129 (23): 4321–27. https://doi.org/10.1242/jcs.190546.
Midwood, Kim S., and Jean E. Schwarzbauer. 2002. “Tenascin-C Modulates Matrix Contraction via Focal Adhesion Kinase- and Rho-Mediated Signaling Pathways.” Molecular Biology of the Cell 13 (10): 3601–13. https://doi.org/10.1091/mbc.e02-05-0292.
Midwood, Kim S., Leyla V. Valenick, Henry C. Hsia, and Jean E. Schwarzbauer. 2004. “Coregulation of Fibronectin Signaling and Matrix Contraction by Tenascin-C and Syndecan-4.” Molecular Biology of the Cell 15 (12): 5670–77. https://doi.org/10.1091/mbc.e04-08-0759.
Midwood, Kim, Sandra Sacre, Anna M. Piccinini, Julia Inglis, Annette Trebaul, Emma Chan, Stefan Drexler, et al. 2009. “Tenascin-C Is an Endogenous Activator of Toll-like Receptor 4 That Is Essential for Maintaining Inflammation in Arthritic Joint Disease.” Nature Medicine 15 (7): 774–80. https://doi.org/10.1038/nm.1987.
Minn, Andy J., Yibin Kang, Inna Serganova, Gaorav P. Gupta, Dilip D. Giri, Mikhail Doubrovin, Vladimir Ponomarev, William L. Gerald, Ronald Blasberg, and Joan Massagué. 2005. “Distinct Organ-Specific Metastatic Potential of
169
Individual Breast Cancer Cells and Primary Tumors.” Journal of Clinical Investigation 115 (1): 44–55. https://doi.org/10.1172/JCI22320.
Mittal, Deepak, Matthew M. Gubin, Robert D. Schreiber, and Mark J. Smyth. 2014. “New Insights into Cancer Immunoediting and Its Three Component Phases--Elimination, Equilibrium and Escape.” Current Opinion in Immunology 27 (April): 16–25. https://doi.org/10.1016/j.coi.2014.01.004.
Mock, Andreas, Rolf Warta, Christoph Geisenberger, Ralf Bischoff, Alexander Schulte, Katrin Lamszus, Volker Stadler, et al. 2015. “Printed Peptide Arrays Identify Prognostic TNC Serumantibodies in Glioblastoma Patients.” Oncotarget 6 (15): 13579–90. https://doi.org/10.18632/oncotarget.3791.
Mueller, Margareta M., and Norbert E. Fusenig. 2004. “Friends or Foes — Bipolar Effects of the Tumour Stroma in Cancer.” Nature Reviews Cancer 4 (11): 839–49. https://doi.org/10.1038/nrc1477.
Müller, Anja, Bernhard Homey, Hortensia Soto, Nianfeng Ge, Daniel Catron, Matthew E. Buchanan, Terri McClanahan, et al. 2001. “Involvement of Chemokine Receptors in Breast Cancer Metastasis.” Nature 410 (6824): 50–56. https://doi.org/10.1038/35065016.
Muller, W. J., E. Sinn, P. K. Pattengale, R. Wallace, and P. Leder. 1988. “Single-Step Induction of Mammary Adenocarcinoma in Transgenic Mice Bearing the Activated c-Neu Oncogene.” Cell 54 (1): 105–15.
Murray, Peter J., Judith E. Allen, Subhra K. Biswas, Edward A. Fisher, Derek W. Gilroy, Sergij Goerdt, Siamon Gordon, et al. 2014. “Macrophage Activation and Polarization: Nomenclature and Experimental Guidelines.” Immunity 41 (1): 14–20. https://doi.org/10.1016/j.immuni.2014.06.008.
Nagaharu, Keiki, Xinhui Zhang, Toshimichi Yoshida, Daisuke Katoh, Noriko Hanamura, Yuji Kozuka, Tomoko Ogawa, Taizo Shiraishi, and Kyoko Imanaka-Yoshida. 2011. “Tenascin C Induces Epithelial-Mesenchymal Transition–Like Change Accompanied by SRC Activation and Focal Adhesion Kinase Phosphorylation in Human Breast Cancer Cells.” The American Journal of Pathology 178 (2): 754–63. https://doi.org/10.1016/j.ajpath.2010.10.015.
Naito, Y., K. Saito, K. Shiiba, A. Ohuchi, K. Saigenji, H. Nagura, and H. Ohtani. 1998. “CD8+ T Cells Infiltrated within Cancer Cell Nests as a Prognostic Factor in Human Colorectal Cancer.” Cancer Research 58 (16): 3491–94.
Nakahara, Hiroki, Esteban C. Gabazza, Hajime Fujimoto, Yoichi Nishii, Corina N. D’Alessandro-Gabazza, Nelson E. Bruno, Takehiro Takagi, et al. 2006. “Deficiency of Tenascin C Attenuates Allergen-Induced Bronchial Asthma in the Mouse.” European Journal of Immunology 36 (12): 3334–45. https://doi.org/10.1002/eji.200636271.
Nencioni, Alessio, Frank Grünebach, Susanne M. Schmidt, Martin R. Müller, Davide Boy, Franco Patrone, Alberto Ballestrero, and Peter Brossart. 2008. “The Use of Dendritic Cells in Cancer Immunotherapy.” Critical Reviews in
170
Oncology/Hematology 65 (3): 191–99. https://doi.org/10.1016/j.critrevonc.2007.10.002.
Nieman, Kristin M, Hilary A Kenny, Carla V Penicka, Andras Ladanyi, Rebecca Buell-Gutbrod, Marion R Zillhardt, Iris L Romero, et al. 2011. “Adipocytes Promote Ovarian Cancer Metastasis and Provide Energy for Rapid Tumor Growth.” Nature Medicine 17 (11): 1498–1503. https://doi.org/10.1038/nm.2492.
Numasaki, Muneo, Jun-ichi Fukushi, Mayumi Ono, Satwant K. Narula, Paul J. Zavodny, Toshio Kudo, Paul D. Robbins, Hideaki Tahara, and Michael T. Lotze. 2003. “Interleukin-17 Promotes Angiogenesis and Tumor Growth.” Blood 101 (7): 2620–27. https://doi.org/10.1182/blood-2002-05-1461.
Ocklind, G., J. Talts, R. Fässler, A. Mattsson, and P. Ekblom. 1993. “Expression of Tenascin in Developing and Adult Mouse Lymphoid Organs.” The Journal of Histochemistry and Cytochemistry: Official Journal of the Histochemistry Society 41 (8): 1163–69. https://doi.org/10.1177/41.8.7687262.
O’Connell, J. T., H. Sugimoto, V. G. Cooke, B. A. MacDonald, A. I. Mehta, V. S. LeBleu, R. Dewar, et al. 2011a. “VEGF-A and Tenascin-C Produced by S100A4+ Stromal Cells Are Important for Metastatic Colonization.” Proceedings of the National Academy of Sciences 108 (38): 16002–7. https://doi.org/10.1073/pnas.1109493108.
Okabe, S. 2005. “Stromal Cell-Derived Factor-1 /CXCL12-Induced Chemotaxis of T Cells Involves Activation of the RasGAP-Associated Docking Protein p62Dok-1.” Blood 105 (2): 474–80. https://doi.org/10.1182/blood-2004-03-0843.
Olumi, A. F., G. D. Grossfeld, S. W. Hayward, P. R. Carroll, T. D. Tlsty, and G. R. Cunha. 1999. “Carcinoma-Associated Fibroblasts Direct Tumor Progression of Initiated Human Prostatic Epithelium.” Cancer Research 59 (19): 5002–11.
Orend, Gertraud, and Ruth Chiquet-Ehrismann. 2006. “Tenascin-C Induced Signaling in Cancer.” Cancer Letters 244 (2): 143–63. https://doi.org/10.1016/j.canlet.2006.02.017.
Orend, Gertraud, Wentao Huang, Monilola A. Olayioye, Nancy E. Hynes, and Ruth Chiquet-Ehrismann. 2003. “Tenascin-C Blocks Cell-Cycle Progression of Anchorage-Dependent Fibroblasts on Fibronectin through Inhibition of Syndecan-4.” Oncogene 22 (25): 3917–26. https://doi.org/10.1038/sj.onc.1206618.
Orimo, Akira, Piyush B. Gupta, Dennis C. Sgroi, Fernando Arenzana-Seisdedos, Thierry Delaunay, Rizwan Naeem, Vincent J. Carey, Andrea L. Richardson, and Robert A. Weinberg. 2005. “Stromal Fibroblasts Present in Invasive Human Breast Carcinomas Promote Tumor Growth and Angiogenesis through Elevated SDF-1/CXCL12 Secretion.” Cell 121 (3): 335–48. https://doi.org/10.1016/j.cell.2005.02.034.
Oskarsson, Thordur. 2013. “Extracellular Matrix Components in Breast Cancer Progression and Metastasis.” The Breast 22 (August): S66–72. https://doi.org/10.1016/j.breast.2013.07.012.
171
Oskarsson, Thordur, Swarnali Acharyya, Xiang H-F Zhang, Sakari Vanharanta, Sohail F Tavazoie, Patrick G Morris, Robert J Downey, Katia Manova-Todorova, Edi Brogi, and Joan Massagué. 2011. “Breast Cancer Cells Produce Tenascin C as a Metastatic Niche Component to Colonize the Lungs.” Nature Medicine 17 (7): 867–74. https://doi.org/10.1038/nm.2379.
Ota, Daichi, Masashi Kanayama, Yutaka Matsui, Koyu Ito, Naoyoshi Maeda, Goro Kutomi, Koichi Hirata, et al. 2014. “Tumor-α9β1 Integrin-Mediated Signaling Induces Breast Cancer Growth and Lymphatic Metastasis via the Recruitment of Cancer-Associated Fibroblasts.” Journal of Molecular Medicine (Berlin, Germany) 92 (12): 1271–81. https://doi.org/10.1007/s00109-014-1183-9.
Pagès, Franck, Anne Berger, Matthieu Camus, Fatima Sanchez-Cabo, Anne Costes, Robert Molidor, Bernhard Mlecnik, et al. 2005. “Effector Memory T Cells, Early Metastasis, and Survival in Colorectal Cancer.” New England Journal of Medicine 353 (25): 2654–66. https://doi.org/10.1056/NEJMoa051424.
Pardoll, Drew M. 2012. “The Blockade of Immune Checkpoints in Cancer Immunotherapy.” Nature Reviews Cancer 12 (4): 252–64. https://doi.org/10.1038/nrc3239.
Parekh, Kalpaj, Sabarinathan Ramachandran, Joel Cooper, Darell Bigner, Alexander Patterson, and T. Mohanakumar. 2005. “Tenascin-C, over Expressed in Lung Cancer down Regulates Effector Functions of Tumor Infiltrating Lymphocytes.” Lung Cancer 47 (1): 17–29. https://doi.org/10.1016/j.lungcan.2004.05.016.
Payne, Aimee S., and Lynn A. Cornelius. 2002. “The Role of Chemokines in Melanoma Tumor Growth and Metastasis.” Journal of Investigative Dermatology 118 (6): 915–22. https://doi.org/10.1046/j.1523-1747.2002.01725.x.
Piccart-Gebhart, Martine J., Marion Procter, Brian Leyland-Jones, Aron Goldhirsch, Michael Untch, Ian Smith, Luca Gianni, et al. 2005. “Trastuzumab after Adjuvant Chemotherapy in HER2-Positive Breast Cancer.” New England Journal of Medicine 353 (16): 1659–72. https://doi.org/10.1056/NEJMoa052306.
Ping, Yi-Fang, Xia Zhang, and Xiu-Wu Bian. 2016. “Cancer Stem Cells and Their Vascular Niche: Do They Benefit from Each Other?” Cancer Letters 380 (2): 561–67. https://doi.org/10.1016/j.canlet.2015.05.010.
Plitas, George, Catherine Konopacki, Kenmin Wu, Paula D. Bos, Monica Morrow, Ekaterina V. Putintseva, Dmitriy M. Chudakov, and Alexander Y. Rudensky. 2016. “Regulatory T Cells Exhibit Distinct Features in Human Breast Cancer.” Immunity 45 (5): 1122–34. https://doi.org/10.1016/j.immuni.2016.10.032.
Poznansky, M. C., I. T. Olszak, R. Foxall, R. H. Evans, A. D. Luster, and D. T. Scadden. 2000. “Active Movement of T Cells Away from a Chemokine.” Nature Medicine 6 (5): 543–48. https://doi.org/10.1038/75022.
Puente Navazo, M. D., D. Valmori, and C. Rüegg. 2001. “The Alternatively Spliced Domain TnFnIII A1A2 of the Extracellular Matrix Protein Tenascin-C
172
Suppresses Activation-Induced T Lymphocyte Proliferation and Cytokine Production.” Journal of Immunology (Baltimore, Md.: 1950) 167 (11): 6431–40.
Qi, Chun-Jian, Yong-Ling Ning, Ye-Shan Han, Hai-Yan Min, Heng Ye, Yu-Lan Zhu, and Ke-Qing Qian. 2012. “Autologous Dendritic Cell Vaccine for Estrogen Receptor (ER)/Progestin Receptor (PR) Double-Negative Breast Cancer.” Cancer Immunology, Immunotherapy 61 (9): 1415–24. https://doi.org/10.1007/s00262-011-1192-2.
Qian, Bin-Zhi, Jiufeng Li, Hui Zhang, Takanori Kitamura, Jinghang Zhang, Liam R. Campion, Elizabeth A. Kaiser, Linda A. Snyder, and Jeffrey W. Pollard. 2011. “CCL2 Recruits Inflammatory Monocytes to Facilitate Breast-Tumour Metastasis.” Nature 475 (7355): 222–25. https://doi.org/10.1038/nature10138.
Radisky, Evette S., and Derek C. Radisky. 2015. “Matrix Metalloproteinases as Breast Cancer Drivers and Therapeutic Targets.” Frontiers in Bioscience (Landmark Edition) 20 (June): 1144–63.
Rakha, Emad A., Jorge S. Reis-Filho, and Ian O. Ellis. 2010. “Combinatorial Biomarker Expression in Breast Cancer.” Breast Cancer Research and Treatment 120 (2): 293–308. https://doi.org/10.1007/s10549-010-0746-x.
Reiman, Jennifer M., Maciej Kmieciak, Masoud H. Manjili, and Keith L. Knutson. 2007. “Tumor Immunoediting and Immunosculpting Pathways to Cancer Progression.” Seminars in Cancer Biology 17 (4): 275–87. https://doi.org/10.1016/j.semcancer.2007.06.009.
Ribatti, Domenico. 2017. “The Concept of Immune Surveillance against Tumors. The First Theories.” Oncotarget 8 (4): 7175–80. https://doi.org/10.18632/oncotarget.12739.
Richter, Rudolf, Andrea Jochheim-Richter, Felicia Ciuculescu, Katarina Kollar, Erhard Seifried, Ulf Forssmann, Dennis Verzijl, et al. 2014. “Identification and Characterization of Circulating Variants of CXCL12 from Human Plasma: Effects on Chemotaxis and Mobilization of Hematopoietic Stem and Progenitor Cells.” Stem Cells and Development 23 (16): 1959–74. https://doi.org/10.1089/scd.2013.0524.
Rüegg, C. R., R. Chiquet-Ehrismann, and S. S. Alkan. 1989. “Tenascin, an Extracellular Matrix Protein, Exerts Immunomodulatory Activities.” Proceedings of the National Academy of Sciences of the United States of America 86 (19): 7437–41.
Ruffell, Brian, Alfred Au, Hope S. Rugo, Laura J. Esserman, E. Shelley Hwang, and Lisa M. Coussens. 2012. “Leukocyte Composition of Human Breast Cancer.” Proceedings of the National Academy of Sciences of the United States of America 109 (8): 2796–2801. https://doi.org/10.1073/pnas.1104303108.
Ruiz, Christian, Wentao Huang, Monika E. Hegi, Katrin Lange, Marie-France Hamou, Erika Fluri, Edward J. Oakeley, Ruth Chiquet-Ehrismann, and Gertraud Orend. 2004. “Growth Promoting Signaling by Tenascin-C [Corrected].” Cancer Research 64 (20): 7377–85. https://doi.org/10.1158/0008-5472.CAN-04-1234.
173
Rupp, Tristan, Benoit Langlois, Maria M. Koczorowska, Agata Radwanska, Zhen Sun, Thomas Hussenet, Olivier Lefebvre, et al. 2016. “Tenascin-C Orchestrates Glioblastoma Angiogenesis by Modulation of Pro- and Anti-Angiogenic Signaling.” Cell Reports 17 (10): 2607–19. https://doi.org/10.1016/j.celrep.2016.11.012.
Santisteban, Marta, Jennifer M. Reiman, Michael K. Asiedu, Marshall D. Behrens, Aziza Nassar, Kimberly R. Kalli, Paul Haluska, et al. 2009. “Immune-Induced Epithelial to Mesenchymal Transition in Vivo Generates Breast Cancer Stem Cells.” Cancer Research 69 (7): 2887–95. https://doi.org/10.1158/0008-5472.CAN-08-3343.
Satthaporn, Sukchai, Adrian Robins, Wichai Vassanasiri, Mohamed El-Sheemy, Jibril A. Jibril, David Clark, David Valerio, and Oleg Eremin. 2004. “Dendritic Cells Are Dysfunctional in Patients with Operable Breast Cancer.” Cancer Immunology, Immunotherapy: CII 53 (6): 510–18. https://doi.org/10.1007/s00262-003-0485-5.
Saupe, Falk, Anja Schwenzer, Yundan Jia, Isabelle Gasser, Caroline Spenlé, Benoit Langlois, Martial Kammerer, et al. 2013. “Tenascin-C Downregulates Wnt Inhibitor Dickkopf-1, Promoting Tumorigenesis in a Neuroendocrine Tumor Model.” Cell Reports 5 (2): 482–92. https://doi.org/10.1016/j.celrep.2013.09.014.
Schreiber, R. D., L. J. Old, and M. J. Smyth. 2011. “Cancer Immunoediting: Integrating Immunity’s Roles in Cancer Suppression and Promotion.” Science 331 (6024): 1565–70. https://doi.org/10.1126/science.1203486.
Schultz, Gregory S., and Annette Wysocki. 2009. “Interactions between Extracellular Matrix and Growth Factors in Wound Healing.” Wound Repair and Regeneration 17 (2): 153–62. https://doi.org/10.1111/j.1524-475X.2009.00466.x.
Schwenzer, Anja, Xia Jiang, Ted R. Mikuls, Jeffrey B. Payne, Harlan R. Sayles, Anne-Marie Quirke, Benedikt M. Kessler, et al. 2016. “Identification of an Immunodominant Peptide from Citrullinated Tenascin-C as a Major Target for Autoantibodies in Rheumatoid Arthritis.” Annals of the Rheumatic Diseases 75 (10): 1876–83. https://doi.org/10.1136/annrheumdis-2015-208495.
Seaman, Steven, Janine Stevens, Mi Young Yang, Daniel Logsdon, Cari Graff-Cherry, and Brad St Croix. 2007. “Genes That Distinguish Physiological and Pathological Angiogenesis.” Cancer Cell 11 (6): 539–54. https://doi.org/10.1016/j.ccr.2007.04.017.
Shankaran, V., H. Ikeda, A. T. Bruce, J. M. White, P. E. Swanson, L. J. Old, and R. D. Schreiber. 2001. “IFNgamma and Lymphocytes Prevent Primary Tumour Development and Shape Tumour Immunogenicity.” Nature 410 (6832): 1107–11. https://doi.org/10.1038/35074122.
Sharma, P., and J. P. Allison. 2015. “The Future of Immune Checkpoint Therapy.” Science 348 (6230): 56–61. https://doi.org/10.1126/science.aaa8172.

174
Shiga, Kazuyoshi, Masayasu Hara, Takaya Nagasaki, Takafumi Sato, Hiroki Takahashi, and Hiromitsu Takeyama. 2015. “Cancer-Associated Fibroblasts: Their Characteristics and Their Roles in Tumor Growth.” Cancers 7 (4): 2443–58. https://doi.org/10.3390/cancers7040902.
Siegel, Rebecca L., Kimberly D. Miller, and Ahmedin Jemal. 2017. “Cancer Statistics, 2017.” CA: A Cancer Journal for Clinicians 67 (1): 7–30. https://doi.org/10.3322/caac.21387.
Simian, M., Y. Hirai, M. Navre, Z. Werb, A. Lochter, and M. J. Bissell. 2001. “The Interplay of Matrix Metalloproteinases, Morphogens and Growth Factors Is Necessary for Branching of Mammary Epithelial Cells.” Development (Cambridge, England) 128 (16): 3117–31.
Simo, P., F. Bouziges, J. C. Lissitzky, L. Sorokin, M. Kedinger, and P. Simon-Assmann. 1992. “Dual and Asynchronous Deposition of Laminin Chains at the Epithelial-Mesenchymal Interface in the Gut.” Gastroenterology 102 (6): 1835–45.
Simpson, Peter T, Jorge S Reis-Filho, Theodora Gale, and Sunil R Lakhani. 2005. “Molecular Evolution of Breast Cancer.” The Journal of Pathology 205 (2): 248–54. https://doi.org/10.1002/path.1691.
Slamon, Dennis J., Brian Leyland-Jones, Steven Shak, Hank Fuchs, Virginia Paton, Alex Bajamonde, Thomas Fleming, et al. 2001. “Use of Chemotherapy plus a Monoclonal Antibody against HER2 for Metastatic Breast Cancer That Overexpresses HER2.” New England Journal of Medicine 344 (11): 783–92. https://doi.org/10.1056/NEJM200103153441101.
Sledge, George W., Eleftherios P. Mamounas, Gabriel N. Hortobagyi, Harold J. Burstein, Pamela J. Goodwin, and Antonio C. Wolff. 2014. “Past, Present, and Future Challenges in Breast Cancer Treatment.” Journal of Clinical Oncology 32 (19): 1979–86. https://doi.org/10.1200/JCO.2014.55.4139.
Soria, Gali, and Adit Ben-Baruch. 2008. “The Inflammatory Chemokines CCL2 and CCL5 in Breast Cancer.” Cancer Letters 267 (2): 271–85. https://doi.org/10.1016/j.canlet.2008.03.018.
Sorokin, Lydia. 2010. “The Impact of the Extracellular Matrix on Inflammation.” Nature Reviews. Immunology 10 (10): 712–23. https://doi.org/10.1038/nri2852.
Spaeth, Erika L., Jennifer L. Dembinski, A. Kate Sasser, Keri Watson, Ann Klopp, Brett Hall, Michael Andreeff, and Frank Marini. 2009. “Mesenchymal Stem Cell Transition to Tumor-Associated Fibroblasts Contributes to Fibrovascular Network Expansion and Tumor Progression.” Edited by Mikhail V. Blagosklonny. PLoS ONE 4 (4): e4992. https://doi.org/10.1371/journal.pone.0004992.
Spenlé, Caroline, Isabelle Gasser, Falk Saupe, Klaus-Peter Janssen, Christiane Arnold, Annick Klein, Michael van der Heyden, et al. 2015. “Spatial Organization of the Tenascin-C Microenvironment in Experimental and Human
175
Cancer.” Cell Adhesion & Migration 9 (1–2): 4–13. https://doi.org/10.1080/19336918.2015.1005452.
Sternlicht, Mark D, Andre Lochter, Carolyn J Sympson, Bing Huey, Jean-Philippe Rougier, Joe W Gray, Dan Pinkel, Mina J Bissell, and Zena Werb. 1999. “The Stromal Proteinase MMP3/Stromelysin-1 Promotes Mammary Carcinogenesis.” Cell 98 (2): 137–46. https://doi.org/10.1016/S0092-8674(00)81009-0.
Stylianopoulos, Triantafyllos, and Rakesh K. Jain. 2013. “Combining Two Strategies to Improve Perfusion and Drug Delivery in Solid Tumors.” Proceedings of the National Academy of Sciences of the United States of America 110 (46): 18632–37. https://doi.org/10.1073/pnas.1318415110.
Sun, Zhen, Anja Schwenzer, Tristan Rupp, Devadarssen Murdamoothoo, Rolando Vegliante, Olivier Lefebvre, Annick Klein, Thomas Hussenet, and Gertraud Orend. 2017. “Tenascin-C Promotes Tumor Cell Migration and Metastasis through Integrin α9β1 -Mediated YAP Inhibition.” Cancer Research, December, canres.1597.2017. https://doi.org/10.1158/0008-5472.CAN-17-1597.
Taga, Takashi, Atsushi Suzuki, Ignacio Gonzalez-Gomez, Floyd H. Gilles, Monique Stins, Hiroyuki Shimada, Lora Barsky, Kenneth I. Weinberg, and Walter E. Laug. 2002. “Alpha v-Integrin Antagonist EMD 121974 Induces Apoptosis in Brain Tumor Cells Growing on Vitronectin and Tenascin.” International Journal of Cancer 98 (5): 690–97.
Takeuchi, H., Y. Maehara, E. Tokunaga, T. Koga, Y. Kakeji, and K. Sugimachi. 2001. “Prognostic Significance of Natural Killer Cell Activity in Patients with Gastric Carcinoma: A Multivariate Analysis.” The American Journal of Gastroenterology 96 (2): 574–78. https://doi.org/10.1111/j.1572-0241.2001.03535.x.
Talts, J. F., G. Wirl, M. Dictor, W. J. Muller, and R. Fässler. 1999. “Tenascin-C Modulates Tumor Stroma and Monocyte/Macrophage Recruitment but Not Tumor Growth or Metastasis in a Mouse Strain with Spontaneous Mammary Cancer.” Journal of Cell Science 112 ( Pt 12) (June): 1855–64.
Tamaoki, Masashi, Kyoko Imanaka-Yoshida, Kazuto Yokoyama, Tomohiro Nishioka, Hiroyasu Inada, Michiaki Hiroe, Teruyo Sakakura, and Toshimichi Yoshida. 2005. “Tenascin-C Regulates Recruitment of Myofibroblasts during Tissue Repair after Myocardial Injury.” The American Journal of Pathology 167 (1): 71–80. https://doi.org/10.1016/S0002-9440(10)62954-9.
Tavazoie, Sohail F., Claudio Alarcón, Thordur Oskarsson, David Padua, Qiongqing Wang, Paula D. Bos, William L. Gerald, and Joan Massagué. 2008. “Endogenous Human microRNAs That Suppress Breast Cancer Metastasis.” Nature 451 (7175): 147–52. https://doi.org/10.1038/nature06487.
Teng, Michele W. L., Jerome Galon, Wolf-Herman Fridman, and Mark J. Smyth. 2015. “From Mice to Humans: Developments in Cancer Immunoediting.” The
176
Journal of Clinical Investigation 125 (9): 3338–46. https://doi.org/10.1172/JCI80004.
Teschendorff, Andrew E., Sergio Gomez, Alex Arenas, Dorraya El-Ashry, Marcus Schmidt, Mathias Gehrmann, and Carlos Caldas. 2010. “Improved Prognostic Classification of Breast Cancer Defined by Antagonistic Activation Patterns of Immune Response Pathway Modules.” BMC Cancer 10 (November): 604. https://doi.org/10.1186/1471-2407-10-604.
Teti, A. 1992. “Regulation of Cellular Functions by Extracellular Matrix.” Journal of the American Society of Nephrology: JASN 2 (10 Suppl): S83-87.
Tian, Tianhai, Sarah Olson, James M. Whitacre, and Angus Harding. 2011. “The Origins of Cancer Robustness and Evolvability.” Integrative Biology: Quantitative Biosciences from Nano to Macro 3 (1): 17–30. https://doi.org/10.1039/c0ib00046a.
Trapani, Joseph A., and Mark J. Smyth. 2002. “Functional Significance of the Perforin/Granzyme Cell Death Pathway.” Nature Reviews. Immunology 2 (10): 735–47. https://doi.org/10.1038/nri911.
Tsujino, T., I. Seshimo, H. Yamamoto, C. Y. Ngan, K. Ezumi, I. Takemasa, M. Ikeda, M. Sekimoto, N. Matsuura, and M. Monden. 2007. “Stromal Myofibroblasts Predict Disease Recurrence for Colorectal Cancer.” Clinical Cancer Research 13 (7): 2082–90. https://doi.org/10.1158/1078-0432.CCR-06-2191.
Tsunoda, Takatsugu, Hiroyasu Inada, Ilunga Kalembeyi, Kyoko Imanaka-Yoshida, Mirei Sakakibara, Ray Okada, Koji Katsuta, Teruyo Sakakura, Yuichi Majima, and Toshimichi Yoshida. 2003. “Involvement of Large Tenascin-C Splice Variants in Breast Cancer Progression.” The American Journal of Pathology 162 (6): 1857–67. https://doi.org/10.1016/S0002-9440(10)64320-9.
Tucker, Richard P., and Ruth Chiquet-Ehrismann. 2009. “The Regulation of Tenascin Expression by Tissue Microenvironments.” Biochimica Et Biophysica Acta 1793 (5): 888–92. https://doi.org/10.1016/j.bbamcr.2008.12.012.
Turley, Shannon J., Viviana Cremasco, and Jillian L. Astarita. 2015. “Immunological Hallmarks of Stromal Cells in the Tumour Microenvironment.” Nature Reviews. Immunology 15 (11): 669–82. https://doi.org/10.1038/nri3902.
Turnis, Meghan E, and Cliona M Rooney. 2010. “Enhancement of Dendritic Cells as Vaccines for Cancer.” Immunotherapy 2 (6): 847–62. https://doi.org/10.2217/imt.10.56.
Udalova, Irina A., Michaela Ruhmann, Scott J. P. Thomson, and Kim S. Midwood. 2011. “Expression and Immune Function of Tenascin-C.” Critical Reviews in Immunology 31 (2): 115–45.
Ursin, Giske, Linda Hovanessian-Larsen, Yuri R Parisky, Malcolm C Pike, and Anna H Wu. 2005. “Greatly Increased Occurrence of Breast Cancers in Areas of Mammographically Dense Tissue.” Breast Cancer Research 7 (5). https://doi.org/10.1186/bcr1260.
177
Van Obberghen-Schilling, Ellen, Richard P. Tucker, Falk Saupe, Isabelle Gasser, Botond Cseh, and Gertraud Orend. 2011. “Fibronectin and Tenascin-C: Accomplices in Vascular Morphogenesis during Development and Tumor Growth.” The International Journal of Developmental Biology 55 (4–5): 511–25. https://doi.org/10.1387/ijdb.103243eo.
Vasudev, Naveen S., and Andrew R. Reynolds. 2014. “Anti-Angiogenic Therapy for Cancer: Current Progress, Unresolved Questions and Future Directions.” Angiogenesis 17 (3): 471–94. https://doi.org/10.1007/s10456-014-9420-y.
Vesely, Matthew D., Michael H. Kershaw, Robert D. Schreiber, and Mark J. Smyth. 2011. “Natural Innate and Adaptive Immunity to Cancer.” Annual Review of Immunology 29 (1): 235–71. https://doi.org/10.1146/annurev-immunol-031210-101324.
Villegas, Francisco R., Santiago Coca, Vicente G. Villarrubia, Rodrigo Jiménez, María Jesús Chillón, Javier Jareño, Marcos Zuil, and Luis Callol. 2002. “Prognostic Significance of Tumor Infiltrating Natural Killer Cells Subset CD57 in Patients with Squamous Cell Lung Cancer.” Lung Cancer (Amsterdam, Netherlands) 35 (1): 23–28.
Vollmer, Günter. 1997. “Biologic and Oncologic Implications of Tenascin-C/Hexabrachion Proteins.” Critical Reviews in Oncology/Hematology 25 (3): 187–210. https://doi.org/10.1016/S1040-8428(97)00004-8.
Wang, Zhuomin, Bo Han, Zhuang Zhang, Jian Pan, and Hui Xia. 2010. “Expression of Angiopoietin-like 4 and Tenascin C but Not Cathepsin C mRNA Predicts Prognosis of Oral Tongue Squamous Cell Carcinoma.” Biomarkers: Biochemical Indicators of Exposure, Response, and Susceptibility to Chemicals 15 (1): 39–46. https://doi.org/10.3109/13547500903261362.
Weber, Frank, Lei Shen, Koichi Fukino, Attila Patocs, George L. Mutter, Trinidad Caldes, and Charis Eng. 2006. “Total-Genome Analysis of BRCA1/2-Related Invasive Carcinomas of the Breast Identifies Tumor Stroma as Potential Landscaper for Neoplastic Initiation.” The American Journal of Human Genetics 78 (6): 961–72. https://doi.org/10.1086/504090.
Weiner, D. B., J. Liu, J. A. Cohen, W. V. Williams, and M. I. Greene. 1989. “A Point Mutation in the Neu Oncogene Mimics Ligand Induction of Receptor Aggregation.” Nature 339 (6221): 230–31. https://doi.org/10.1038/339230a0.
Wenk, M. B., K. S. Midwood, and J. E. Schwarzbauer. 2000. “Tenascin-C Suppresses Rho Activation.” The Journal of Cell Biology 150 (4): 913–20.
Whitford, P., W. D. George, and A. M. Campbell. 1992. “Flow Cytometric Analysis of Tumour Infiltrating Lymphocyte Activation and Tumour Cell MHC Class I and II Expression in Breast Cancer Patients.” Cancer Letters 61 (2): 157–64.
Wijelath, E. S., S. Rahman, M. Namekata, J. Murray, T. Nishimura, Z. Mostafavi-Pour, Y. Patel, Y. Suda, M. J. Humphries, and M. Sobel. 2006. “Heparin-II Domain of Fibronectin Is a Vascular Endothelial Growth Factor-Binding Domain: Enhancement of VEGF Biological Activity by a Singular Growth
178
Factor/Matrix Protein Synergism.” Circulation Research 99 (8): 853–60. https://doi.org/10.1161/01.RES.0000246849.17887.66.
Willis, B. C., RM Dubois, and Z Borok. 2006. “Epithelial Origin of Myofibroblasts during Fibrosis in the Lung.” Proceedings of the American Thoracic Society 3 (4): 377–82. https://doi.org/10.1513/pats.200601-004TK.
Witz, Isaac P., and Orlev Levy-Nissenbaum. 2006. “The Tumor Microenvironment in the Post-PAGET Era.” Cancer Letters 242 (1): 1–10. https://doi.org/10.1016/j.canlet.2005.12.005.
Woodside, D. G., D. K. Wooten, and B. W. McIntyre. 1998. “Adenosine Diphosphate (ADP)-Ribosylation of the Guanosine Triphosphatase (GTPase) Rho in Resting Peripheral Blood Human T Lymphocytes Results in Pseudopodial Extension and the Inhibition of T Cell Activation.” The Journal of Experimental Medicine 188 (7): 1211–21.
Yamamoto, K., Q. N. Dang, S. P. Kennedy, R. Osathanondh, R. A. Kelly, and R. T. Lee. 1999. “Induction of Tenascin-C in Cardiac Myocytes by Mechanical Deformation. Role of Reactive Oxygen Species.” The Journal of Biological Chemistry 274 (31): 21840–46.
Yang, Yuan, Howard H. Yang, Ying Hu, Peter H. Watson, Huaitian Liu, Thomas R. Geiger, Miriam R. Anver, et al. 2017. “Immunocompetent Mouse Allograft Models for Development of Therapies to Target Breast Cancer Metastasis.” Oncotarget 8 (19): 30621–43. https://doi.org/10.18632/oncotarget.15695.
Yarden, Y. 2001. “Biology of HER2 and Its Importance in Breast Cancer.” Oncology 61 Suppl 2: 1–13. https://doi.org/10.1159/000055396.
Yokosaki, Y., H. Monis, J. Chen, and D. Sheppard. 1996. “Differential Effects of the Integrins alpha9beta1, alphavbeta3, and alphavbeta6 on Cell Proliferative Responses to Tenascin. Roles of the Beta Subunit Extracellular and Cytoplasmic Domains.” The Journal of Biological Chemistry 271 (39): 24144–50.
Yoshida, T., E. Matsumoto, N. Hanamura, I. Kalembeyi, K. Katsuta, A. Ishihara, and T. Sakakura. 1997. “Co-Expression of Tenascin and Fibronectin in Epithelial and Stromal Cells of Benign Lesions and Ductal Carcinomas in the Human Breast.” The Journal of Pathology 182 (4): 421–28. https://doi.org/10.1002/(SICI)1096-9896(199708)182:4<421::AID-PATH886>3.0.CO;2-U.
Yoshida, Toshimichi, Tatsuya Akatsuka, and Kyoko Imanaka-Yoshida. 2015. “Tenascin-C and Integrins in Cancer.” Cell Adhesion & Migration 9 (1–2): 96–104. https://doi.org/10.1080/19336918.2015.1008332.
Zagzag, D., D. R. Friedlander, J. Dosik, S. Chikramane, W. Chan, M. A. Greco, J. C. Allen, K. Dorovini-Zis, and M. Grumet. 1996. “Tenascin-C Expression by Angiogenic Vessels in Human Astrocytomas and by Human Brain Endothelial Cells in Vitro.” Cancer Research 56 (1): 182–89.
179
Zambonin, Valentina, Alessandro De Toma, Luisa Carbognin, Rolando Nortilli, Elena Fiorio, Veronica Parolin, Sara Pilotto, et al. 2017. “Clinical Results of Randomized Trials and ‘Real-World’ Data Exploring the Impact of Bevacizumab for Breast Cancer: Opportunities for Clinical Practice and Perspectives for Research.” Expert Opinion on Biological Therapy 17 (4): 497–506. https://doi.org/10.1080/14712598.2017.1289171.
Zboralski, Dirk, Kai Hoehlig, Dirk Eulberg, Anna Frömming, and Axel Vater. 2017. “Increasing Tumor-Infiltrating T Cells through Inhibition of CXCL12 with NOX-A12 Synergizes with PD-1 Blockade.” Cancer Immunology Research 5 (11): 950–56. https://doi.org/10.1158/2326-6066.CIR-16-0303.
Zeisberg, E. M., S. Potenta, L. Xie, M. Zeisberg, and R. Kalluri. 2007. “Discovery of Endothelial to Mesenchymal Transition as a Source for Carcinoma-Associated Fibroblasts.” Cancer Research 67 (21): 10123–28. https://doi.org/10.1158/0008-5472.CAN-07-3127.
Zhang, Lin, Jose R. Conejo-Garcia, Dionyssios Katsaros, Phyllis A. Gimotty, Marco Massobrio, Giorgia Regnani, Antonis Makrigiannakis, et al. 2003. “Intratumoral T Cells, Recurrence, and Survival in Epithelial Ovarian Cancer.” New England Journal of Medicine 348 (3): 203–13. https://doi.org/10.1056/NEJMoa020177.
Zhao, Xixi, Jingkun Qu, Yuchen Sun, Jizhao Wang, Xu Liu, Feidi Wang, Hong Zhang, et al. 2017. “Prognostic Significance of Tumor-Associated Macrophages in Breast Cancer: A Meta-Analysis of the Literature.” Oncotarget 8 (18): 30576–86. https://doi.org/10.18632/oncotarget.15736.
Zitvogel, Laurence, Antoine Tesniere, and Guido Kroemer. 2006. “Cancer despite Immunosurveillance: Immunoselection and Immunosubversion.” Nature Reviews Immunology 6 (10): 715–27. https://doi.org/10.1038/nri1936.
Zumsteg, Adrian, and Gerhard Christofori. 2009. “Corrupt Policemen: Inflammatory Cells Promote Tumor Angiogenesis:” Current Opinion in Oncology 21 (1): 60–70. https://doi.org/10.1097/CCO.0b013e32831bed7e.

Appendix I
180
Role of Tenascin-C in promoting lung metastasis through impacting vascular
invasions
Zhen Sun1-4&*, Inés Velázquez-Quesada1-4*, Devadarssen Murdamoothoo1-4, Gerlinde
Averous5, Constance Ahowesso1-4, Alev Yilmaz1-4, William Erne1-4, Michael van der
Heyden1-4, Caroline Spenlé1-4, Olivier Lefebvre1-4, Annick Klein1-4, Felicitas Oberndorfer6,
Andre Oszwald6, Catherine Bourdon7, Pierre Mangin7, Carole Mathelin8, Claire Deligne9,
Kim Midwood9, Marie-Pierre Chenard5, Gerhard Christofori10, Thomas Hussenet1-4 ,
Renate Kain6, Thomas Loustau1-4 and Gertraud Orend1-4#
Running title: Through impacting vascular invasions tenascin-C increases metastasis
* equal contribution
# correspondence:
Gertraud Orend, [email protected], Phone: +33 (0) 3 68 85 39 96, current
address : Institut d'Hématologie et d'Immunologie, Hôpital Civil, 4 rue Kirschleger, 67085
Strasbourg Cedex
& Current address: 1. Tongji Cancer Research Institute, Tongji Hospital, Tongji Medical
College in Huazhong University of Science and Technology, Wuhan, Hubei, China. 2.
Department of Gastrointestinal Surgery, Tongji Hospital, Tongji Medical College in Huazhong
University of Science and Technology, Wuhan, Hubei, China.
181
1 INSERM U1109 - MN3T, The Microenvironmental Niche in Tumorigenesis and Targeted
Therapy and, the Tumor Microenvironment group
2 Université de Strasbourg, Strasbourg, France
3 LabEx Medalis, Université de Strasbourg, France
4 Fédération de Médecine Translationnelle de Strasbourg (FMTS), Strasbourg, France
5 Department of Pathology, University Hospital Strasbourg, Strasbourg, France
6 Department of Pathology, Medical University of Vienna (MUW), Vienna, Austria
7 Etablissement Français du Sang, INSERM U949, Strasbourg, France
8 Department of breast diseases and surgery, Strasbourg University Hospital, Strasbourg,
France
9 Kennedy Institute of Rheumatology, University of Oxford, Oxford, UK
10 Department Medicine, University Basel, Basel, Switzerland
182

Abstract
Metastasis is a major cause of death in patients with cancer. The extracellular matrix
molecule tenascin-C is a known promoter of metastasis but how is poorly understood. We
used a transgenic murine MMTV-NeuNT model of metastasis, and a syngeneic
orthotopic breast cancer model derived thereof, with spontaneous metastasis to the lung.
Both models were engineered to control tenascin-C expression levels. We found that
tenascin-C promotes tumor onset and metastasis and demonstrate that tenascin-C
comprises a key component of vascular invasions in blood vessels at sites of metastatic
invasion. We reveal that vascular invasions are organized clusters of platelet associated
proliferating tumor cells with epithelial characteristics, that are surrounded by Fsp1+ cells,
a layer of matrix and a monolayer of endothelial cells. We show that host tenascin-C
promotes the development of the ensheathing endothelial cell coat around the
intravascular tumor cell nest, increases platelet abundance, tumor cell survival and
epithelial plasticity, and breaching of tumor cells into the lung parenchyma. This
phenotype correlated with increased survival and migration of cultured tumor cells
through tenascin-C-induced plasticity. Our results are relevant for human cancer, where
vascular invasions are a sign of worsened prognosis. We document that in tumor blood
vessels vascular invasions express tenascin-C and have an endothelial cell coat which is
in contrast to lymphatic vessels that lack these traits. This information may be useful for
stratification of cancer patients and provides tenascin-C blockade as a potential strategy
to specifically targeting vascular invasions in blood vessels for preventing tumor spread.
183
Key words: tumor microenvironment, tenascin-C, metastasis, vascular invasions, tumor
emboli, apoptosis, circulating tumor cells, epithelial-to-mesenchymal plasticity,
endothelialization, platelets
184
Introduction
Despite earlier diagnosis and improved treatment a high number of cancer patients die
due to cancer-related complications, tumor recurrence and, most frequently, metastasis 1.
Therefore, a better knowledge of the mechanisms of metastasis is required. The tumor
microenvironment (TME) comprising tumor and stromal cells, soluble factors and
extracellular matrix (ECM) promotes metastasis 2. An important ECM molecule that
enhances metastasis is tenascin-C (TNC) 3. TNC plays multiple roles in cancer, as
recently demonstrated in a stochastic pancreatic neuroendocrine tumor (PNET) model
with abundant and no TNC, where TNC was found to enhance survival, proliferation,
invasion, angiogenesis and, lung metastasis 4. Also in breast cancer models, TNC was
shown to play a role in promoting metastasis lung colonization 5,6. Yet, whether TNC is
also involved in earlier steps of metastasis before tumor cells enter the lung parenchyma
was unknown. An important step represents escape of tumor cells from the primary tumor
and homing to distant organs where vascular invasions are described as precursors of
parenchymal lung metastasis. Vascular invasions are clusters of tumor cells in the primary
tumor or in vessels of organs with metastasis. They are known since a long time and
correlate with thromboembolism and worsened cancer patient survival 7–9. Targeting
vascular invasions may offer novel anti-cancer targeting opportunities yet, little was
known about their cellular and molecular composition, which we had investigated here.
We generated MMTV-NeuNT mice 10 that lack TNC (TNCKO) 11 and compared tumor
onset and lung metastasis with that in WT tumor mice. We observed that TNC
accelerates tumor onset and increases lung metastasis. By grafting tumor cells, derived
from the same model 12 , expressing abundant or low TNC into the mammary gland of
immune competent syngeneic mice that do or do not express TNC, we identified
185
host-derived TNC as a component of vascular invasions, promoting parenchymal
metastasis. In the MMTV-NeuNT model we describe vascular invasions as platelet
associated nests of proliferating tumor cells, within blood vessels of the lung, where the
tumor cells are surrounded by a layer of TNC and other ECM molecules and, a luminal
endothelial monolayer. We demonstrate that in vascular invasions, TNC increases
platelet abundance and endothelialization and, enhances tumor cell survival, plasticity
and, breaching into the lung parenchyma. Similarly, tumor cells survive and migrate more
in vitro upon TNC-induced plasticity. This insight may offer opportunities for targeting
cancers with frequent vascular invasions found in blood vessels, such as we have
documented for renal cell carcinoma (RCC), hepatocellular carcinoma (HCC) and PNET
that, like the murine model, present a luminal endothelial monolayer ensheathing and
TNC expression. In contrast, vascular invasions of lymphatic vessels, that we have seen
in breast cancer and pancreatic adenocarcinomas lack these traits. Thus blockade of
TNC actions could be a potential strategy to specifically targeting vascular invasions in
blood vessels for preventing tumor spread to the lung.
186
Results
Tenascin-C accelerates tumor onset
We generated compound MMTV-NeuNT tumor mice lacking TNC (TNCKO) by breeding
and compared tumorigenesis with mice expressing wildtype (WT) levels of TNC. By
immunoblotting and immunofluorescence staining of primary tumors we found TNC
expressed in tumor matrix tracks (TMT) (Fig. S1A) as previously shown in other cancers
13. No TNC protein was found in Tnc knockout (TNCKO) tumors (Fig. S1A, B). We
compared tumor latency and observed that in WT mice, tumors were first palpable at 135
days. Sixty days later, all mice had developed tumors. Tumor latency was largely delayed
in TNCKO mice where tumors were first palpable at 175 days (Fig. 1A). As described in
this model 10, all mice developed multiple tumors. Mice were sacrificed 3 months after first
tumor palpation. No difference in tumor burden between genotypes was noted (Fig. 1B).
Tenascin-C enhances lung metastasis
We assessed lung metastasis by a stereological analysis 14 of the left and biggest lung
lobe and noticed no difference in the number of metastasis between tumor mice
expressing TNC or not (Fig. 1C, D). Yet, we found a higher metastatic index in WT mice
indicated by a bigger lung metastatic surface (Fig. 1E). As vascular invasions have been
described in MMTV-Neu mice as indicator of tumor spread 15, we used
immunohistochemistry and immunofluorescence to analyze the vascular invasions in
more detail. First, we observed vascular invasions to be present in blood vessels of the
lung (Fig. 1C, F). Surface measurement revealed that vascular invasions are bigger in
WT than in TNCKO mice (Fig. 1F, G). Reduced proliferation and/or increased apoptosis
may account for this observation which we addressed by staining for cleaved caspase-3
187
and Ki67. We noticed that cleaved caspase-3+ cells are less abundant in WT than in
TNCKO vascular invasions, suggesting that TNC promotes survival (Fig. 1H, I). It is
remarkable that some tumor cells within the intravascular tumor cell nests proliferate, yet
there was no difference in the number of Ki67+ cells between tumor mice expressing or
lacking TNC (Fig. 1J, K). Similar to cells in the vascular invasions, also in parenchymal
metastasis TNC did not influence cell proliferation but enhanced survival (Fig. S1C-F). In
summary, these observations suggest that TNC promotes cancer cell survival in vascular
invasions present in blood vessels and, in parenchymal metastasis which could explain
the observed higher metastatic burden of WT tumor mice.
Host TNC impacts survival in vascular invasions and enhances lung metastasis
We wanted to know whether TNC from the tumor cells or the stroma promotes
metastasis. Therefore, we established a syngeneic orthotopic grafting model by using
NT193 cells that we had established from a MMTV-NeuNT tumor 12. We engineered
NT193 cells to downregulate Tnc by shRNA technology and, grafted cells into the
mammary gland of a WT and TNCKO host, respectively. We confirmed Tnc knockdown
in the cultured cells and in tumors by immunoblotting and immunofluorescence analysis,
respectively (Fig. S2A-C). We noticed that NT193 tumors develop spontaneously lung
metastasis including vascular invasions. As for the MMTV-NeuNT model, with the
changing levels of TNC expression we found no difference in tumor burden (Fig. S2D)
nor the incidence of lung metastasis (Fig. 2A). Yet, we noticed that the lung metastatic
surface of shControl (shC) cell-derived tumors was bigger in WT than in TNCKO mice.
Moreover, irrespective of the cell genotype, there was a tendency towards more
metastasis in the WT than in the TNCKO host (Fig. 2B). Next, we determined the surface
and found that vascular invasions derived from shC tumor cells were significantly bigger
in a WT host than in a TNCKO host (Fig. 2C). Assessing survival and proliferation by
188
tissue staining revealed that some cells in the vascular invasions proliferate, yet
independent of TNC which is similar to the transgenic MMTV-NeuNT model (Fig. 2D, E).
In contrast, we saw the lowest apoptosis index when shC cells were grafted into a WT
host in comparison to a TNCKO host (Fig. 2F, G). Altogether, these results identify host
derived TNC as important component for enhancing survival of tumor cells in the vascular
invasions.
Vascular invasions residing in blood vessels are nests of tumor cells surrounded
by a layer of stromal cells expressing TNC
As our results suggest a role of TNC in vascular invasions, we characterized them by
hematoxylin/eosin (HE) staining and immunofluorescence analysis. We found vascular
invasions in blood vessels of the lung where they eventually occluded the vessel lumen
and sometimes had a necrotic center (Fig. 3A-C, S3A-C). We wanted to know whether
vascular invasions express TNC and saw abundant TNC at the periphery yet not within
the ErbB2+ tumor cell clusters (Fig. 3B-D).
To assess the cellular origin of TNC in the vascular invasions of the grafting model, we
stained for TNC together with SMA. We found SMA to be expressed in the lung vessel
wall yet not in the vascular invasions. Upon grafting of shC cells we noticed that the
vascular invasions expressed TNC when cells were grafted into a WT host. This was not
the case when cells were grafted into a TNCKO host (Fig. 3C, S3D). As Fsp1+ cells were
described as source of TNC in another breast cancer model 5, we asked whether these
cells potentially express TNC in the vascular invasions. Indeed, we observed an overlap
of TNC with the Fsp1 staining suggesting that Fsp1+ cells are a likely source of TNC in
the MMTV-NeuNT model (Fig. 3D). A similar result was obtained in the grafting model,
where the Fsp1 signal largely co-localized with TNC (Fig. 3E). Together, these results
suggest that Fsp1-expressing cells are likely candidates to express TNC in the vascular
189
invasions in both models, also demonstrating similarities between the genetic and the
grafting model.
Vascular invasions contain platelets and are surrounded by an endothelial cell
monolayer which is influenced by TNC
As very little was known about the cellular and ECM composition of vascular invasions,
we used multi-channel immunofluorescence staining for epithelial/tumor cells (CK8/18,
ErbB2), endothelial cells (CD31), platelets (CD41, RAM1), leukocytes (CD45), fibronectin
(FN) and laminin (LM) in sequential lung tissue sections. We observed that in all vascular
invasions tumor cells, homogenously expressing ErbB2 and CK8/18, formed a tightly
packed tumor cell cluster or nest that was enveloped by a layer of Fsp1+ cells and distinct
layers of TNC, LM and FN that surrounded platelets inside the tumor cell cluster (Fig. 4A
panel a-f). Endothelial cells were present at the luminal side of the vascular invasion as a
monolayer, characterized by flat endothelial cell nuclei (Fig. 4A panel b and e, S4A, B).
Neither FN, LM, TNC nor endothelial cells nor platelets or fibroblasts were found within
the tumor cell nest but at the rim (Fig. 4A). Moreover, leukocytes were not associated
with the vascular invasions but were present at the basal side of the vessel wall facing the
lung parenchyma (Fig. 4A panel c). Furthermore, vascular invasions of the NT193 model
resembled those of the MMTV-NeuNT model, expressing TNC and displaying a core of
proliferating tumor cells and a layer composed of fibroblasts and endothelial cells (Fig.
3C, E, Fig. S4B, C).
Since vascular invasions were also present in lung vessels of TNCKO mice, we asked
whether TNC had any impact on their organization. Staining for LM, FN, Fsp1 and SMA
did not reveal differences between genotypes, suggesting that TNC does not impact the
formation of vascular invasions (Fig. 3C, 4B, D). Staining for CD31 revealed an
190

endothelial monolayer around the tumor cell nests in both models (Fig. 4A, S4B). Yet, we
noticed more intact endothelial layers around the tumor nests in WT as compared to
TNCKO mice (Fig. 4B, C). We also observed a continuum between the endothelial layers
of the vascular invasion and the lung vessel wall (Fig. 4A, panel b and e).
Vascular invasions are known to be associated with vessel occlusion due to
thromboembolism where platelets are instrumental 16. By staining for CD41 and RAM1
(recognizing Gp1b 17), respectively, we found platelets inside the vascular invasions.
Moreover, platelets were surrounded by LM and the endothelial monolayer (Fig. 4A, D,
S4C, D). We also noticed an overlap of CD41 and TNC expression suggesting that
platelets may also be a source of TNC as was seen in another tumor model 18 (Fig. S4E).
By quantification of CD41 we found less platelets in vascular invasions of TNCKO than in
WT mice suggesting a potential role of TNC in platelet attachment as previously
described in a thrombosis model 19 (Fig. 4E). Altogether, our detailed analysis allows us
to deduce the organization of vascular invasions (Fig. 4F) as a CK8/18+ and ErbB2+
tumor cell cluster of proliferating tumor cells with local accumulation of platelets inside the
tumor embolus. Moreover, the tumor cell nest is enveloped by distinct layers of stromal
cells. Whereas Fsp1+ cells are in vicinity to the tumor cell nest and are a likely source of
TNC, an endothelial monolayer is present at the luminal rim of the tumor embolus which
is not in contact with TNC.
TNC promotes extravasation of tumor cells from vascular invasions into the lung
parenchyma
Vascular invasions were described as precursors of parenchymal metastasis in one of
the MMTV-Neu models 15. We made a similar observation now in the MMTV-NeuNT
model, where the relative abundance of parenchymal metastasis increased over time
(Fig. S5A). When we compared the ratio of vascular invasions to parenchymal
191
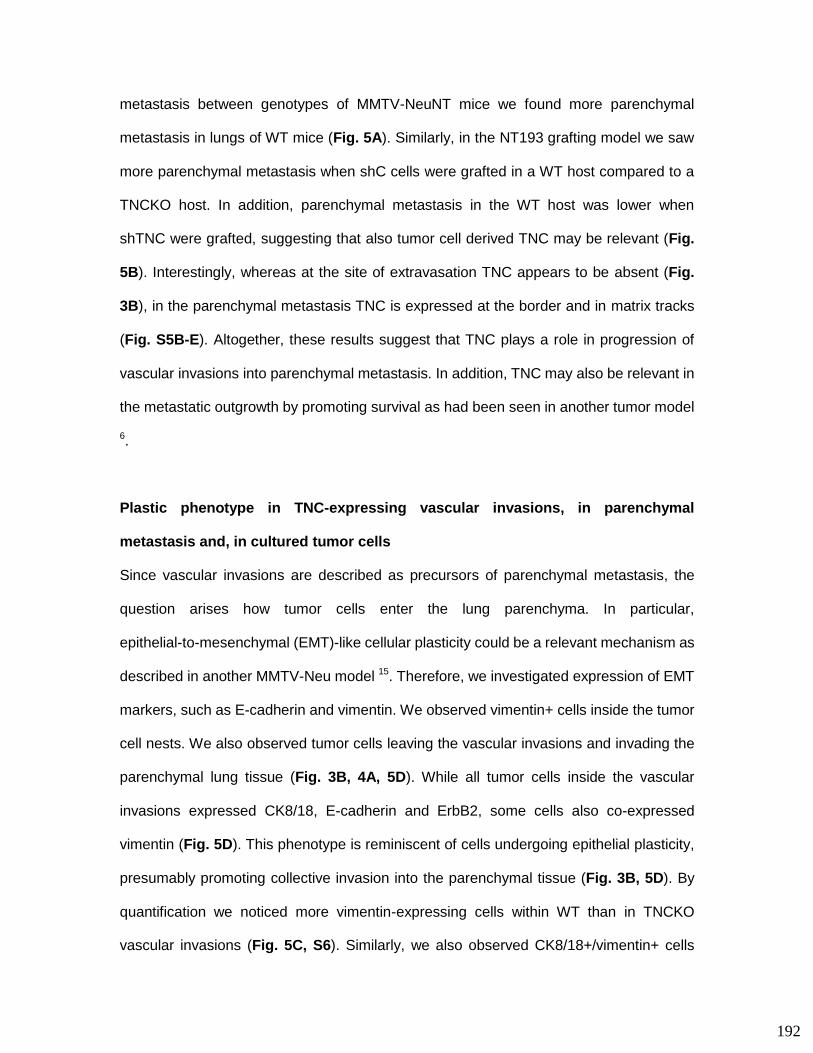
metastasis between genotypes of MMTV-NeuNT mice we found more parenchymal
metastasis in lungs of WT mice (Fig. 5A). Similarly, in the NT193 grafting model we saw
more parenchymal metastasis when shC cells were grafted in a WT host compared to a
TNCKO host. In addition, parenchymal metastasis in the WT host was lower when
shTNC were grafted, suggesting that also tumor cell derived TNC may be relevant (Fig.
5B). Interestingly, whereas at the site of extravasation TNC appears to be absent (Fig.
3B), in the parenchymal metastasis TNC is expressed at the border and in matrix tracks
(Fig. S5B-E). Altogether, these results suggest that TNC plays a role in progression of
vascular invasions into parenchymal metastasis. In addition, TNC may also be relevant in
the metastatic outgrowth by promoting survival as had been seen in another tumor model
6.
Plastic phenotype in TNC-expressing vascular invasions, in parenchymal
metastasis and, in cultured tumor cells
Since vascular invasions are described as precursors of parenchymal metastasis, the
question arises how tumor cells enter the lung parenchyma. In particular,
epithelial-to-mesenchymal (EMT)-like cellular plasticity could be a relevant mechanism as
described in another MMTV-Neu model 15. Therefore, we investigated expression of EMT
markers, such as E-cadherin and vimentin. We observed vimentin+ cells inside the tumor
cell nests. We also observed tumor cells leaving the vascular invasions and invading the
parenchymal lung tissue (Fig. 3B, 4A, 5D). While all tumor cells inside the vascular
invasions expressed CK8/18, E-cadherin and ErbB2, some cells also co-expressed
vimentin (Fig. 5D). This phenotype is reminiscent of cells undergoing epithelial plasticity,
presumably promoting collective invasion into the parenchymal tissue (Fig. 3B, 5D). By
quantification we noticed more vimentin-expressing cells within WT than in TNCKO
vascular invasions (Fig. 5C, S6). Similarly, we also observed CK8/18+/vimentin+ cells
192
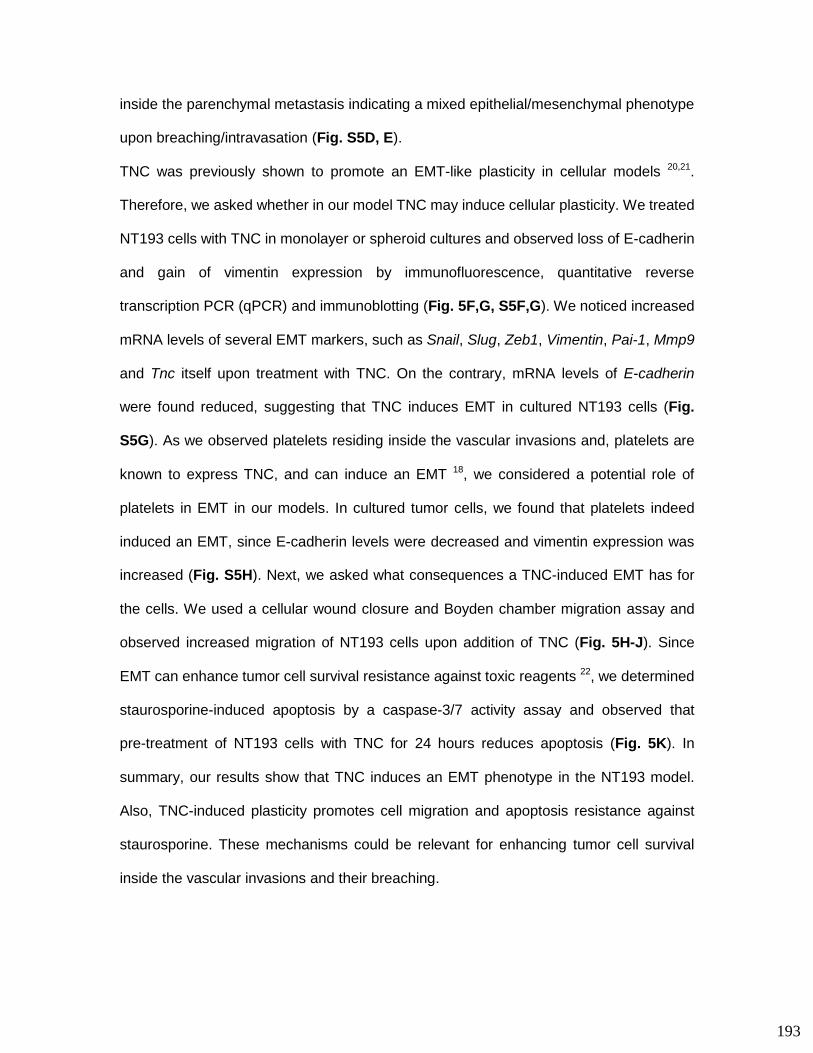
inside the parenchymal metastasis indicating a mixed epithelial/mesenchymal phenotype
upon breaching/intravasation (Fig. S5D, E).
TNC was previously shown to promote an EMT-like plasticity in cellular models 20,21.
Therefore, we asked whether in our model TNC may induce cellular plasticity. We treated
NT193 cells with TNC in monolayer or spheroid cultures and observed loss of E-cadherin
and gain of vimentin expression by immunofluorescence, quantitative reverse
transcription PCR (qPCR) and immunoblotting (Fig. 5F,G, S5F,G). We noticed increased
mRNA levels of several EMT markers, such as Snail, Slug, Zeb1, Vimentin, Pai-1, Mmp9
and Tnc itself upon treatment with TNC. On the contrary, mRNA levels of E-cadherin
were found reduced, suggesting that TNC induces EMT in cultured NT193 cells (Fig.
S5G). As we observed platelets residing inside the vascular invasions and, platelets are
known to express TNC, and can induce an EMT 18, we considered a potential role of
platelets in EMT in our models. In cultured tumor cells, we found that platelets indeed
induced an EMT, since E-cadherin levels were decreased and vimentin expression was
increased (Fig. S5H). Next, we asked what consequences a TNC-induced EMT has for
the cells. We used a cellular wound closure and Boyden chamber migration assay and
observed increased migration of NT193 cells upon addition of TNC (Fig. 5H-J). Since
EMT can enhance tumor cell survival resistance against toxic reagents 22, we determined
staurosporine-induced apoptosis by a caspase-3/7 activity assay and observed that
pre-treatment of NT193 cells with TNC for 24 hours reduces apoptosis (Fig. 5K). In
summary, our results show that TNC induces an EMT phenotype in the NT193 model.
Also, TNC-induced plasticity promotes cell migration and apoptosis resistance against
staurosporine. These mechanisms could be relevant for enhancing tumor cell survival
inside the vascular invasions and their breaching.
193
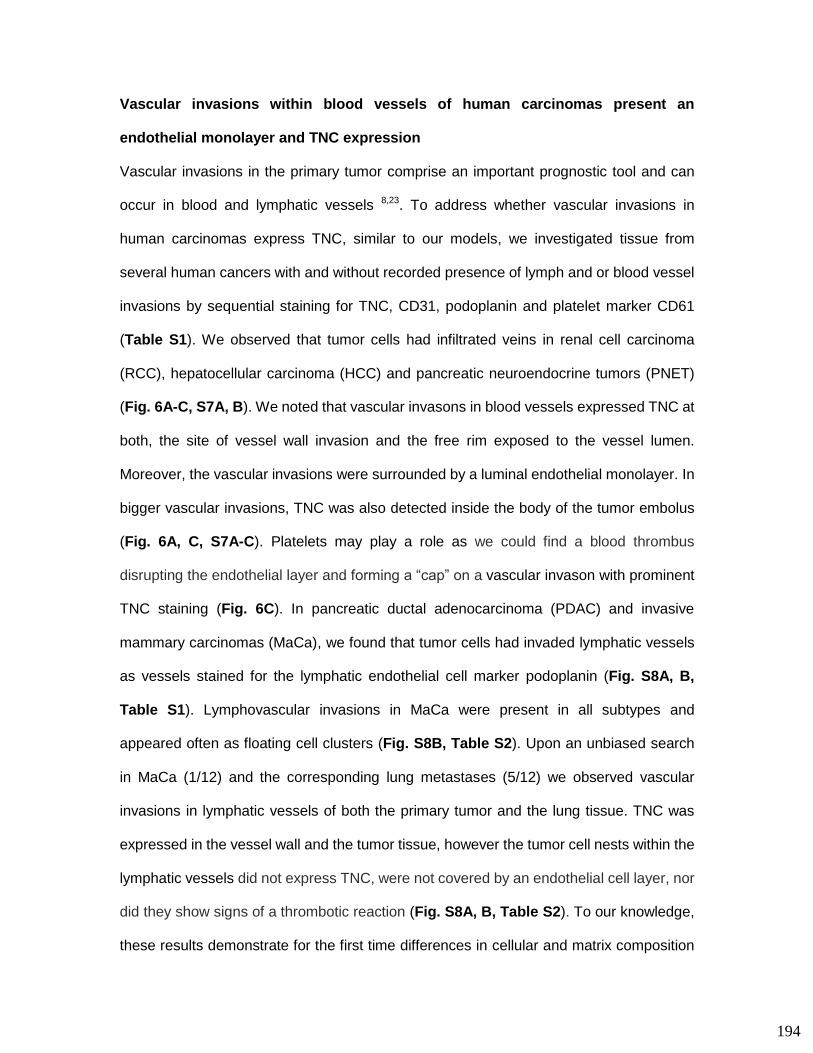
Vascular invasions within blood vessels of human carcinomas present an
endothelial monolayer and TNC expression
Vascular invasions in the primary tumor comprise an important prognostic tool and can
occur in blood and lymphatic vessels 8,23. To address whether vascular invasions in
human carcinomas express TNC, similar to our models, we investigated tissue from
several human cancers with and without recorded presence of lymph and or blood vessel
invasions by sequential staining for TNC, CD31, podoplanin and platelet marker CD61
(Table S1). We observed that tumor cells had infiltrated veins in renal cell carcinoma
(RCC), hepatocellular carcinoma (HCC) and pancreatic neuroendocrine tumors (PNET)
(Fig. 6A-C, S7A, B). We noted that vascular invasons in blood vessels expressed TNC at
both, the site of vessel wall invasion and the free rim exposed to the vessel lumen.
Moreover, the vascular invasions were surrounded by a luminal endothelial monolayer. In
bigger vascular invasions, TNC was also detected inside the body of the tumor embolus
(Fig. 6A, C, S7A-C). Platelets may play a role as we could find a blood thrombus
disrupting the endothelial layer and forming a “cap” on a vascular invason with prominent
TNC staining (Fig. 6C). In pancreatic ductal adenocarcinoma (PDAC) and invasive
mammary carcinomas (MaCa), we found that tumor cells had invaded lymphatic vessels
as vessels stained for the lymphatic endothelial cell marker podoplanin (Fig. S8A, B,
Table S1). Lymphovascular invasions in MaCa were present in all subtypes and
appeared often as floating cell clusters (Fig. S8B, Table S2). Upon an unbiased search
in MaCa (1/12) and the corresponding lung metastases (5/12) we observed vascular
invasions in lymphatic vessels of both the primary tumor and the lung tissue. TNC was
expressed in the vessel wall and the tumor tissue, however the tumor cell nests within the
lymphatic vessels did not express TNC, were not covered by an endothelial cell layer, nor
did they show signs of a thrombotic reaction (Fig. S8A, B, Table S2). To our knowledge,
these results demonstrate for the first time differences in cellular and matrix composition
194

between vascular invasions of blood and lymphatic vessels. We conclude, that as in the
murine metastasis models, vascular invasions in blood vessels of human cancers
express TNC and are enclosed by an endothelial monolayer, which may offer novel
diagnostic and targeting opportunities.
195
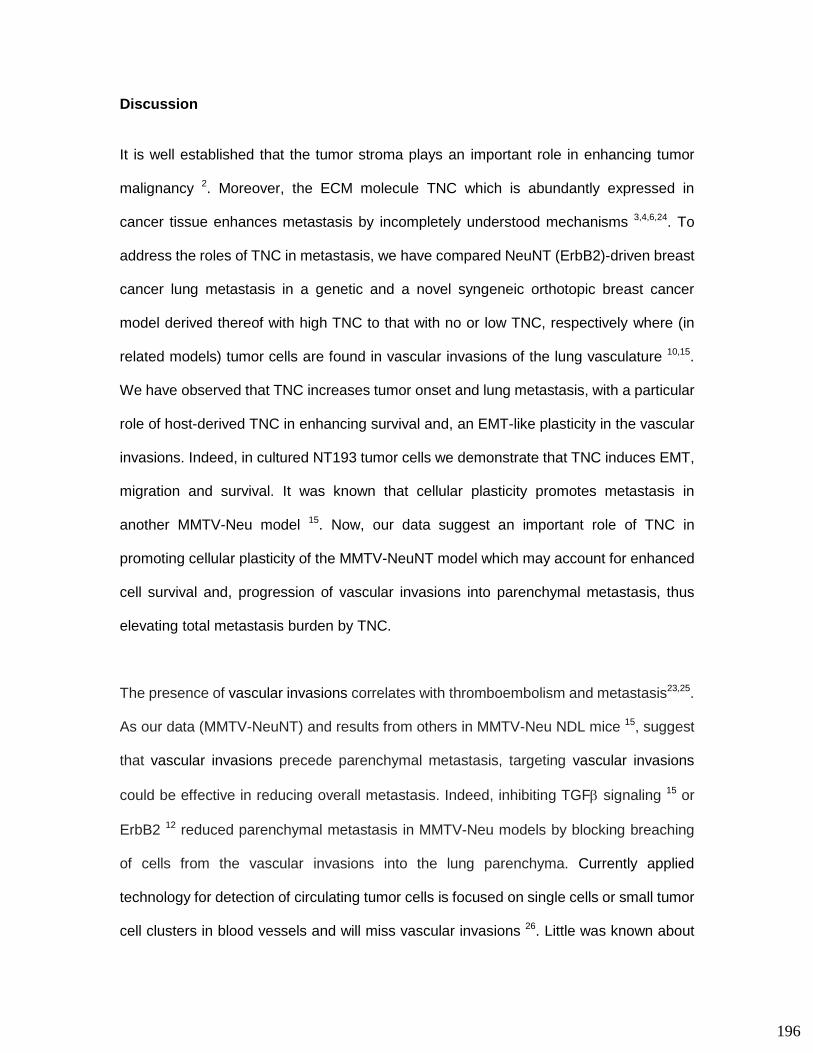
Discussion
It is well established that the tumor stroma plays an important role in enhancing tumor
malignancy 2. Moreover, the ECM molecule TNC which is abundantly expressed in
cancer tissue enhances metastasis by incompletely understood mechanisms 3,4,6,24. To
address the roles of TNC in metastasis, we have compared NeuNT (ErbB2)-driven breast
cancer lung metastasis in a genetic and a novel syngeneic orthotopic breast cancer
model derived thereof with high TNC to that with no or low TNC, respectively where (in
related models) tumor cells are found in vascular invasions of the lung vasculature 10,15.
We have observed that TNC increases tumor onset and lung metastasis, with a particular
role of host-derived TNC in enhancing survival and, an EMT-like plasticity in the vascular
invasions. Indeed, in cultured NT193 tumor cells we demonstrate that TNC induces EMT,
migration and survival. It was known that cellular plasticity promotes metastasis in
another MMTV-Neu model 15. Now, our data suggest an important role of TNC in
promoting cellular plasticity of the MMTV-NeuNT model which may account for enhanced
cell survival and, progression of vascular invasions into parenchymal metastasis, thus
elevating total metastasis burden by TNC.
The presence of vascular invasions correlates with thromboembolism and metastasis23,25.
As our data (MMTV-NeuNT) and results from others in MMTV-Neu NDL mice 15, suggest
that vascular invasions precede parenchymal metastasis, targeting vascular invasions
could be effective in reducing overall metastasis. Indeed, inhibiting TGF signaling 15 or
ErbB2 12 reduced parenchymal metastasis in MMTV-Neu models by blocking breaching
of cells from the vascular invasions into the lung parenchyma. Currently applied
technology for detection of circulating tumor cells is focused on single cells or small tumor
cell clusters in blood vessels and will miss vascular invasions 26. Little was known about
196
the cellular composition and molecular characteristics which altogether would be
important to exploit vascular invasions for prognosis or therapy 23,25. We have bridged this
gap by extensive tissue analysis of vascular invasions in our murine tumor models and in
human cancers. First, we have found that vascular invasions in blood vessels and
lymphatic vessels are different. Second, we report that within blood vessels, vascular
invasions are organized as tightly packed clusters of proliferating tumor cells. Importantly,
despite some cells with mesenchymal markers, all tumor cells express epithelial markers
and have tight junctions which may contribute to synoikis, a junctional
adhesion-associated survival mechanism 27. We further find that the tumor cell nests are
enveloped by Fsp1+ cells and a luminal endothelial monolayer, with FN and LM between
the two cell layers (Fig. 7). In vascular invasions TNC is co-localized with platelets and
Fsp1+ cells, supporting a potential role in TNC expression, as seen in other tumor models
5,18. Our data are novel as until now a role of TNC (and in particular stromal cell derived
TNC) before breaching was unknown. Although Fsp1+ cells had previously been shown
to be important for metastasis, presumably by secreting TNC and VEGFA 5, yet their
presence in vascular invasions was unknown. Our results enforce them as candidates for
anti-mestastasis therapy.
We observed that endothelialization of vascular invasions is the rule in the MMTV-NeuNT
model opposed to other Neu models, where vascular invasions were not apparent except
in compound MMTV-NeuYD/VEGFA mice 28. We observed that the proportion of
parenchymal metastasis decreased when the endothelial layer was impaired, which
happened in the absence of TNC, altogether presenting novel information and, pointing
at an important role of this endothelial layer in metastasis. Several concepts for the
formation of vascular invasions have been proposed where endothelial cells may play an
active role 29–31. Transdifferentiation of tumor cells into endothelial cells is a possibility 30,
197
as TNC was shown to promote transdifferentiation of neuroblastoma cells into endothelial
cells 32. We consider this possibility in our model unlikely as the endothelial cell layer is a
contiguous monolayer and we do not see expression of ErbB2 in the endothelial cells.
Budding from the tumor vasculature 31 may also not be a major source of vascular
invasions as we do not see SMA+ cells underneath the endothelial layer. Upon release
into the circulation by budding, platelets would get in contact with the tumor cells at the
outside of the tumor embolus. Yet, we see platelets inside the tumor cell nests beneath
the endothelial layer. The prominent location deep inside argues for an early role of
platelets in the formation of vascular invasions. Lapis and co-workers 29 proposed an
endothelialization mechanism where wrapping of endothelial cells around tumor cells is
initiated upon contact of tumor cells with the vasculature. A contiguous monolayer of
endothelial cells around the vascular invasions that we observed in the murine model and
in human cancers is supportive of this hypothesis. A pro-angiogenic function of TNC that
we have seen in two other tumor models is also supportive 4,33. In addition, we have
detected eventual endothelial layer interruptions which is reminiscent of a glimpse on
in-situ endothelialization. Bone marrow-derived endothelial progenitor cells (EPC)
potentially also play a role in this process, as they promote metastasis by contributing to
the angiogenic switch and outgrowth of metastasis 34. Previously, it has been shown that
EPC recruitment to the lesion was higher in an ischemia model in mice that express TNC
as compared to mice lacking TNC expression 35. We have further observed that TNC has
an impact on the endothelial monolayer of the vascular invasions, since this layer is found
interrupted or missing in the absence of TNC. Apparently, there are many possibilities of
how TNC promotes endothelial monolayer formation around the tumor cell nests which
remains to be determined in the future.
198
Our results are relevant for human cancers with vascular invasions in blood vessels such
as RCC, HCC and PNET. We suggest that these patients may benefit from an
anti-angiogenic drug treatment since these vascular invasions express TNC and have a
luminal endothelial monolayer. Anti-angiogenic treatment (mostly in conjunction with
other anti-cancer chemotherapies) is already applied in patients with RCC, HCC and
PNET 36 thus, potentially indeed targeting vascular invasions. In support, we have seen a
reduced metastasis burden in conditions where the endothelial monolayer around the
vascular invasions is disrupted (TNCKO mice). Hence, TNC expression and endothelial
ensheathing of vascular invasions in tumor biopsies could be used to stratify patients that
may benefit from an anti-angiogenic drug treatment, maybe in combination with serum
biomarkers that currently are exploited for prediction of anti-angiogenic treatment efficacy
for metastatic renal cell carcinoma 37. In contrast to vascular invasions in blood vessels,
we have found that lymphatic invasions (observed in MaCa and PDAC) do not exhibit an
endothelial layer nor TNC expression. Therefore our prediction is that MaCa and PDAC
patients may poorly benefit from an anti-angiogenic treatment. Indeed, using the
anti-angiogenic antibody bevacizumab/Avastin for treating advanced breast cancer
patients has lost approval by the FDA due to the lack of a benefit for the patient 38,39.
Altogether our study has provided novel insights into the multiple roles of TNC in lung
metastasis which provide novel diagnostic and targeting opportunities (Fig. 7). As only
few relevant syngeneic orthotopic cancer models are available, our novel grafting model
may be valuable for future metastasis inhibition studies targeting TNC and other
molecules.
199
Methods
Detailed information about material and methods can be found in the Supplemental
Material and Methods section.
Human cancer tissue
Two independent cohorts of human tissue from cancer patients were analyzed derived
from the Medical University of Vienna/General Hospital Vienna (MUW) and the Hôpital
Universitaire de Strasbourg Hautepierre (HUS). Mammary carcinoma (MaCa), MaCa
lung metastasis, renal cell carcinoma (RCC), hepatocellular carcinoma (HCC) and
pancreatic neuroendocrine tumor (PNET) tissue was histologically and immunologically
analyzed with specific antibodies against TNC, Factor VIII, CD31, CD34, podoplanin
(D2-40) or platelets (CD61). Ethical approval has been granted. Detailed information can
be found in Table S1-S3 and in the Supplementary Methods section. Results are
summarized in Table S2.
Mouse models and tissue preparation
MMTV-NeuNT female mice (FVB/NCrl background), TNC +/+ and TNC-/- were obtained
from crossing MMTV-NeuNT mice 10 provided by Gerhard Christofori (University of Basel,
Switzerland) with TNC +/- mice donated by Reinhard Fassler 11. Mice were housed and
handled according to the guidelines of INSERM and the ethical committee of Alsace,
France (CREMEAS). Syngeneic breast tumors were obtained by injecting 107 NT193 cells
into the fourth mammary gland of FVB/NCrl mice (one side). Mice were euthanized at
indicated time points and breast tumors and lungs were snap frozen in liquid nitrogen for
western blot and qPCR or embedded in O.C.T. (Sakura Finetek) or in paraffin for
200
histological analysis and immunostaining. Stereological analysis of lung metastasis was
performed as previously published 40. Quantification of TNC staining intensity was scored
41. Details are provided in the Supplementary Methods section.
Cell culture and in vitro assays
NT193 cells derived from a MMTV-NeuNT primary tumor 12 were cultured in DMEM
medium. NT193 sublines, control (SHC202V) and TNC knockdown (KD) (sh1:
TRCN0000312137; sh2: TRCN0000312138) were obtained by transduction using
lentiviral particles with shRNA vectors (Sigma‐Aldrich) and were maintained under
constant selection pressure. Overnight serum-starved cells were incubated with
recombinant TNC (purified as described in 42) or with platelets. In vitro quantification of
Caspase 3/7 activity was performed according to the manufacturer’s instructions
(Promega). Cellular wound healing assays were performed on non-proliferating, highly
confluent NT193 cultures and relative wound closure was determined upon treatment for
24 hours. Transwell migration towards 10% FCS was assessed upon prior treatment of
NT193 cells with TNC for 24 hours. Assessment of gene expression was done by
quantitative reverse transcription polymerase chain reaction (qPCR) using the indicated
primers (Table S4). Full information is included in the Supplementary Methods section.
Statistical analysis
The GraphPad Prism software (version 6) was used for graphical representations of data
and statistical analysis to assess the significance of observed differences. All parametric
(unpaired Student t-test with Welch’s correction in case of unequal variance) and non‐
parametric tests (Mann‐Whitney) were performed in a two‐tailed fashion. To compare the
proportion of vascular invasions and parenchymal metastases, Fisher’s exact test or Chi‐
201

square test was used. Mean ± SEM. p values < 0.05 were considered as statistically
significant (*p < 0.05; **p < 0.01; ***p < 0.001; ****p < 0.0001).
202
Disclosure of potential conflict of interest
The authors declare no competing financial interests.
Authors contribution
ZS, IVQ and TH developed the genetic and orthotopic grafting model. ZS, IVQ, TH, DM,
CA, TL, AY, CD, WE, MvH and CS performed experiments, analyzed and interpreted the
data. OL, AK and CB provided technical assistance. ZS, GA, FO, AO, CM, MPC and RK
provided, analyzed and interpreted data from human cancer patients. PM supervised the
platelet study. GC provided the MMTV-NeuNT mice. GC and KM critically reviewed the
manuscript and interpreted data. ZS, IVQ and GO wrote the manuscript. GO
conceptualized and supervised this study. Grants to GO largely financed the study.
Acknowledgements
We are grateful for technical support by Christiane Arnold, Anna Brown, Fanny Steinbach
and the personnel of the animal facility. We would like to thank the CRB (Biological
Resource Center) of the Strasbourg University Hospital for providing human tumor
samples. This work was supported by grants from Worldwide Cancer Research/AICR
(14-1070), INCa (TENPLAMET), Ligue Régional contre le Cancer, INSERM and
University Strasbourg to GO, INCa (TENPLAMET) to PM, and fellowship grants from the
Chinese Scholarship Council (ZS) and the French-Mexican scholarship program Conacyt
(IVQ). KSM is supported by Arthritis Research UK.
203
References
1. Talmadge, J. E. & Fidler, I. J. AACR Centennial Series: The Biology of Cancer
Metastasis: Historical Perspective. Cancer Res. 70, 5649–5669 (2010).
2. Bissell, M. J. & Hines, W. C. Why don’t we get more cancer? A proposed role of the
microenvironment in restraining cancer progression. Nat. Med. 17, 320–329 (2011).
3. Midwood, K. S., Chiquet, M., Tucker, R. P. & Orend, G. Tenascin-C at a glance. J
Cell Sci 129, 4321–4327 (2016).
4. Saupe, F. et al. Tenascin-C Downregulates Wnt Inhibitor Dickkopf-1, Promoting
Tumorigenesis in a Neuroendocrine Tumor Model. Cell Rep. 5, 482–492 (2013).
5. O’Connell, J. T. et al. VEGF-A and Tenascin-C produced by S100A4+ stromal cells
are important for metastatic colonization. Proc. Natl. Acad. Sci. 108, 16002–16007
(2011).
6. Oskarsson, T. et al. Breast cancer cells produce tenascin C as a metastatic niche
component to colonize the lungs. Nat. Med. 17, 867–874 (2011).
7. Kyriazi, V. Breast cancer as an acquired thrombophilic state. J. Breast Cancer 15,
148–156 (2012).
8. Mandalà, M. & Tondini, C. Adjuvant therapy in breast cancer and venous
thromboembolism. Thromb. Res. 130 Suppl 1, S66-70 (2012).
9. Soerjomataram, I., Louwman, M. W. J., Ribot, J. G., Roukema, J. A. & Coebergh, J.
W. W. An overview of prognostic factors for long-term survivors of breast cancer.
Breast Cancer Res. Treat. 107, 309–330 (2008).
10. Muller, W. J., Sinn, E., Pattengale, P. K., Wallace, R. & Leder, P. Single-step
induction of mammary adenocarcinoma in transgenic mice bearing the activated
c-neu oncogene. Cell 54, 105–115 (1988).
204

11. Talts, J. F., Wirl, G., Dictor, M., Muller, W. J. & Fässler, R. Tenascin-C modulates
tumor stroma and monocyte/macrophage recruitment but not tumor growth or
metastasis in a mouse strain with spontaneous mammary cancer. J. Cell Sci. 112 ( Pt
12), 1855–1864 (1999).
12. Arpel, A. et al. Transmembrane Domain Targeting Peptide Antagonizing ErbB2/Neu
Inhibits Breast Tumor Growth and Metastasis. Cell Rep. 8, 1714–1721 (2014).
13. Spenlé, C. et al. Spatial organization of the tenascin-C microenvironment in
experimental and human cancer. Cell Adhes. Migr. 9, 4–13 (2015).
14. Nielsen, B. S. et al. A Precise and Efficient Stereological Method for Determining
Murine Lung Metastasis Volumes. Am. J. Pathol. 158, 1997–2003 (2001).
15. Siegel, P. M., Shu, W., Cardiff, R. D., Muller, W. J. & Massagué, J. Transforming
growth factor β signaling impairs Neu-induced mammary tumorigenesis while
promoting pulmonary metastasis. Proc. Natl. Acad. Sci. 100, 8430–8435 (2003).
16. Meikle, C. K. S. et al. Cancer and Thrombosis: The Platelet Perspective. Front. Cell
Dev. Biol. 4, (2017).
17. Mangin, P. H. et al. Identification of five novel 14-3-3 isoforms interacting with the
GPIb-IX complex in platelets. J. Thromb. Haemost. 7, 1550–1555 (2009).
18. Labelle, M., Begum, S. & Hynes, R. O. Direct Signaling between Platelets and
Cancer Cells Induces an Epithelial-Mesenchymal-Like Transition and Promotes
Metastasis. Cancer Cell 20, 576–590 (2011).
19. Schaff, M. et al. Novel Function of Tenascin-C, a Matrix Protein Relevant to
Atherosclerosis, in Platelet Recruitment and Activation Under Flow. Arterioscler.
Thromb. Vasc. Biol. 31, 117–124 (2011).
20. Nagaharu, K. et al. Tenascin-C Induces Epithelial-Mesenchymal Transition–Like
Change Accompanied by SRC Activation and Focal Adhesion Kinase
Phosphorylation in Human Breast Cancer Cells. Am. J. Pathol. 178, 754–763 (2011).
205
21. Xu, J., Lamouille, S. & Derynck, R. TGF-β-induced epithelial to mesenchymal
transition. Cell Res. 19, 156–172 (2009).
22. Singh, A. & Settleman, J. EMT, cancer stem cells and drug resistance: an emerging
axis of evil in the war on cancer. Oncogene 29, 4741–4751 (2010).
23. Kane, R. D., Hawkins, H. K., Miller, J. A. & Noce, P. S. Microscopic pulmonary tumor
emboli associated with dyspnea. Cancer 36, 1473–1482 (1975).
24. Dandachi, N. et al. Co-expression of tenascin-C and vimentin in human breast cancer
cells indicates phenotypic transdifferentiation during tumour progression: correlation
with histopathological parameters, hormone receptors, and oncoproteins. J. Pathol.
193, 181–189 (2001).
25. Winterbauer, R., Elfenbein, B. & Ball, W. Incidence and clinical significance of tumor
embolization to the lungs - ScienceDirect. (1968). Available at:
https://www.sciencedirect.com/science/article/pii/0002934368900442?_rdoc=1&_fmt
=high&_origin=gateway&_docanchor=&md5=b8429449ccfc9c30159a5f9aeaa92ffb.
(Accessed: 10th April 2018)
26. Aceto, N. et al. Circulating Tumor Cell Clusters Are Oligoclonal Precursors of Breast
Cancer Metastasis. Cell 158, 1110–1122 (2014).
27. Shen, X. & Kramer, R. H. Adhesion-mediated squamous cell carcinoma survival
through ligand-independent activation of epidermal growth factor receptor. Am. J.
Pathol. 165, 1315–1329 (2004).
28. Oshima, R. G. et al. Angiogenic acceleration of Neu induced mammary tumor
progression and metastasis. Cancer Res. 64, 169–179 (2004).
29. Lapis, K., Paku, S. & Liotta, L. A. Endothelialization of embolized tumor cells during
metastasis formation. Clin. Exp. Metastasis 6, 73–89 (1988).
206
30. Mahooti, S. et al. Breast carcinomatous tumoral emboli can result from encircling
lymphovasculogenesis rather than lymphovascular invasion. Oncotarget 1, 131–147
(2010).
31. Sugino, T. et al. An Invasion-Independent Pathway of Blood-Borne Metastasis. Am.
J. Pathol. 160, 1973–1980 (2002).
32. Pezzolo, A. et al. Oct-4+/Tenascin C+ neuroblastoma cells serve as progenitors of
tumor-derived endothelial cells. Cell Res. 21, 1470–1486 (2011).
33. Rupp, T. et al. Tenascin-C Orchestrates Glioblastoma Angiogenesis by Modulation of
Pro- and Anti-angiogenic Signaling. Cell Rep. 17, 2607–2619 (2016).
34. Gao, D. et al. Endothelial Progenitor Cells Control the Angiogenic Switch in Mouse
Lung Metastasis. Science 319, 195–198 (2008).
35. Ballard, V. L. T. et al. Vascular tenascin-C regulates cardiac endothelial phenotype
and neovascularization. FASEB J. 20, 717–719 (2006).
36. Rajabi, M. & Mousa, S. The Role of Angiogenesis in Cancer Treatment. Biomedicines
5, 34 (2017).
37. Tran, H. T. et al. Prognostic or predictive plasma cytokines and angiogenic factors for
patients treated with pazopanib for metastatic renal-cell cancer: a retrospective
analysis of phase 2 and phase 3 trials. Lancet Oncol. 13, 827–837 (2012).
38. Vasudev, N. S. & Reynolds, A. R. Anti-angiogenic therapy for cancer: current
progress, unresolved questions and future directions. Angiogenesis 17, 471–494
(2014).
39. Zambonin, V. et al. Clinical results of randomized trials and ‘real-world’ data exploring
the impact of Bevacizumab for breast cancer: opportunities for clinical practice and
perspectives for research. Expert Opin. Biol. Ther. 17, 497–506 (2017).
40. Nielsen, S., Guo, Z., Johnson, C. M., Hensrud, D. D. & Jensen, M. D. Splanchnic
lipolysis in human obesity. J. Clin. Invest. 113, 1582–1588 (2004).
207
41. Shi, M. et al. Tenascin-C induces resistance to apoptosis in pancreatic cancer cell
through activation of ERK/NF-κB pathway. Apoptosis 20, 843–857 (2015).
42. Huang, W., Chiquet-Ehrismann, R., Moyano, J. V., Garcia-Pardo, A. & Orend, G.
Interference of tenascin-C with syndecan-4 binding to fibronectin blocks cell adhesion
and stimulates tumor cell proliferation. Cancer Res. 61, 8586–8594 (2001).
208
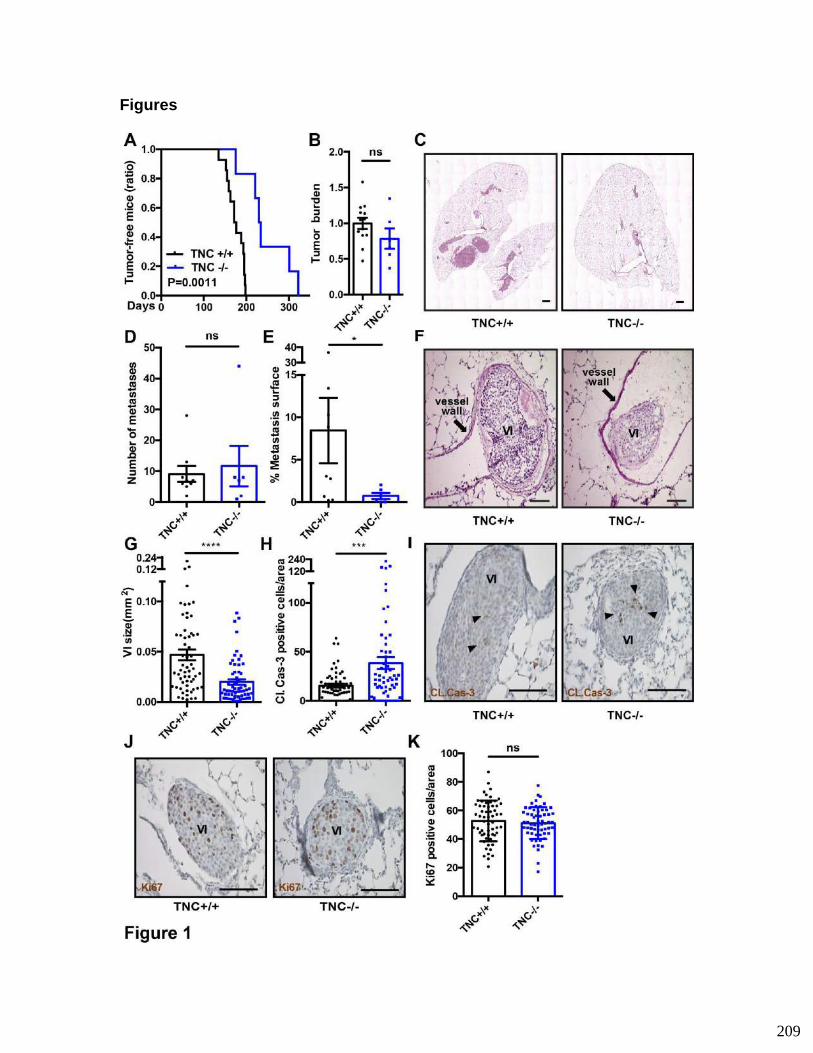
Figures
209

Figure 1. Reduced lung metastasis in the absence of TNC in MMTV-NeuNT mice
(A) Ratio of tumor-free mice is shown for MMTV-NeuNT tumor mice with two (TNC +/+, N
= 13 mice) and no (TNC -/-, N = 6) TNC alleles. The absence of TNC significantly delays
tumor latency (TNC +/+ versus TNC -/-, p = 0.0011; Log-rank tests). (B) Tumor burden of
TNC-/- tumor mice (N = 6) was determined and normalized to the mean tumor weight of
the control group (TNC +/+, N = 13). (C) Representative HE images of lung metastasis
from MMTV-NeuNT mice (TNC +/+ and TNC ‐/‐) that had been sacrificed 3 months after
tumor detection. Scale bar: 1000 μm. (D, E) Number of lung metastases (D) and of the
cumulated metastatic burden (metastatic area normalized to total lung area) (E) in lungs
of TNC +/+ (N = 9) and TNC -/- (N = 6) mice. (F, G) HE stained lung tissue was used for
size determination of vascular invasions (VI) (TNC +/+: N = 6 mice, n = 59 VI; TNC ‐/‐: N
= 6 mice, n = 60 VI). Scale bar: 100 μm. (H-K) Immunohistochemical (IHC) analysis for
cleaved caspase‐3 (Cl. Cas-3) (I) and Ki67 (J) in VI (TNC +/+, N = 6 mice, n = 59 VI; TNC
‐/‐, N = 6 mice, n = 60 VI). Dots represent number of apoptotic (H) and proliferative cells
(K) in VI per area (0.1 mm2), respectively. Arrowhead denotes cleaved caspase‐3
positive apoptotic cell (I). Scale bar: 100 μm. Mean ± SEM.
210

Figure 2. Host derived tenascin-C promotes lung metastasis in NT193 grafted
tumor mice (A-C) Quantification of the number of lung metastases (A), cumulated
metastatic burden (metastatic area normalized to total lung area) (B) and size of vascular
invasions (VI) (C) in lungs of TNC+/+ and TNC‐/‐ FVB hosts 3.5 months after engraftment
of NT193 sh control (shC), sh1TNC and sh2TNC cells (shC in TNC +/+ mice (N = 5);
sh1TNC in TNC +/+ mice (N = 4); sh2TNC in TNC +/+ mice (N = 7); shC in TNC -/- mice
(N = 6); sh1TNC in TNC -/- mice (N = 5); sh2TNC in TNC -/- mice (N = 5)). (D-G) IHC
analysis for Ki-67 (D) and cleaved caspase‐3 (Cl. Cas-3) (F) in vascular invasions of
lungs from NT193 engrafted mice. Dots represent proliferative (E) and apoptotic cells in
vascular invasions (G) per 0.1 mm2, respectively. Scale bar: 100 μm. Mean ± SEM.
211
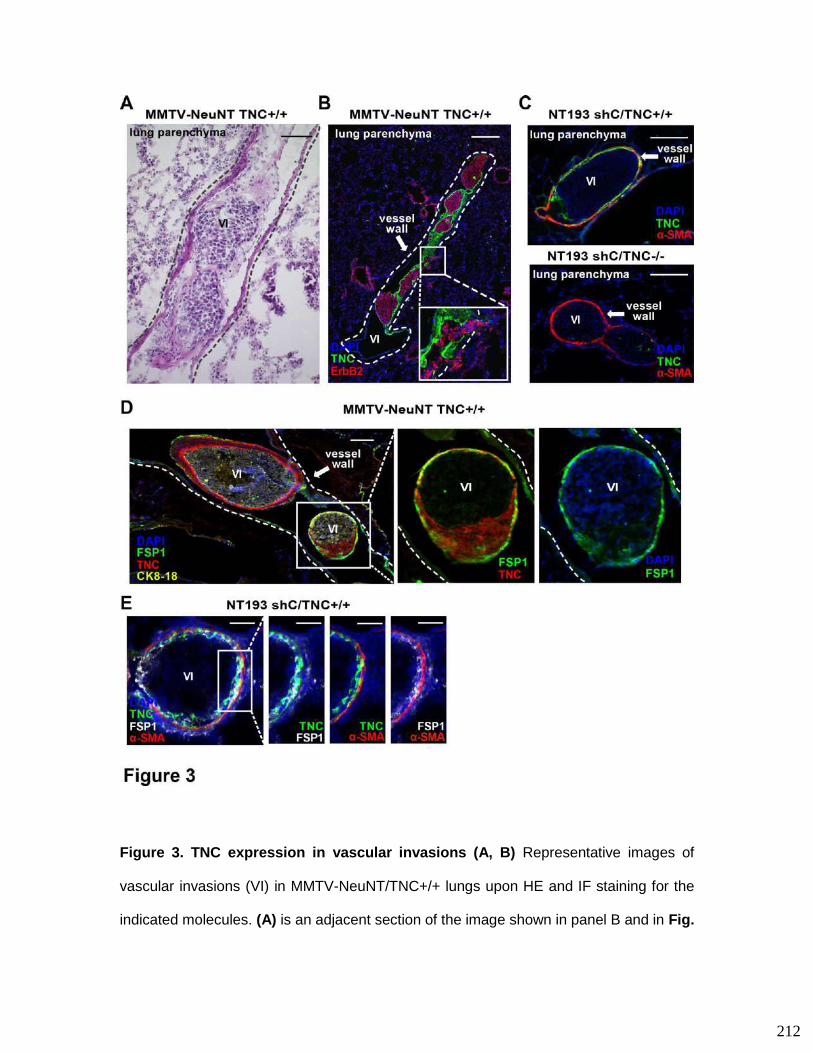
Figure 3. TNC expression in vascular invasions (A, B) Representative images of
vascular invasions (VI) in MMTV-NeuNT/TNC+/+ lungs upon HE and IF staining for the
indicated molecules. (A) is an adjacent section of the image shown in panel B and in Fig.
212
S3A. A dotted line is drawn along the vessel wall. (B) Note that TNC (green) is expressed
around tumor cells (red, ErbB2). Cell nuclei stained with DAPI. Scale bar: 100 μm (A),
500 μm (B). (C) Representative IF images for TNC (green) in lung vascular invasions of
tumor cell grafts of NT193 shC cells in a TNC+/+ and TNC-/- host. αSMA staining (red)
marks blood vessels. Note, that TNC is expressed in vascular invasions of shC cells
engrafted in a TNC+/+ host, yet not in a TNC-/- host. Scale bar: 100 μm. (D, E)
Representative IF images for FSP1+ cells and TNC in vascular invasions of
MMTV-NeuNT/TNC+/+ (D) and NT193 lung tissue (E). Scale bar: 100 μm (D), 50 μm (E).
White square represents area of higher magnification.
213
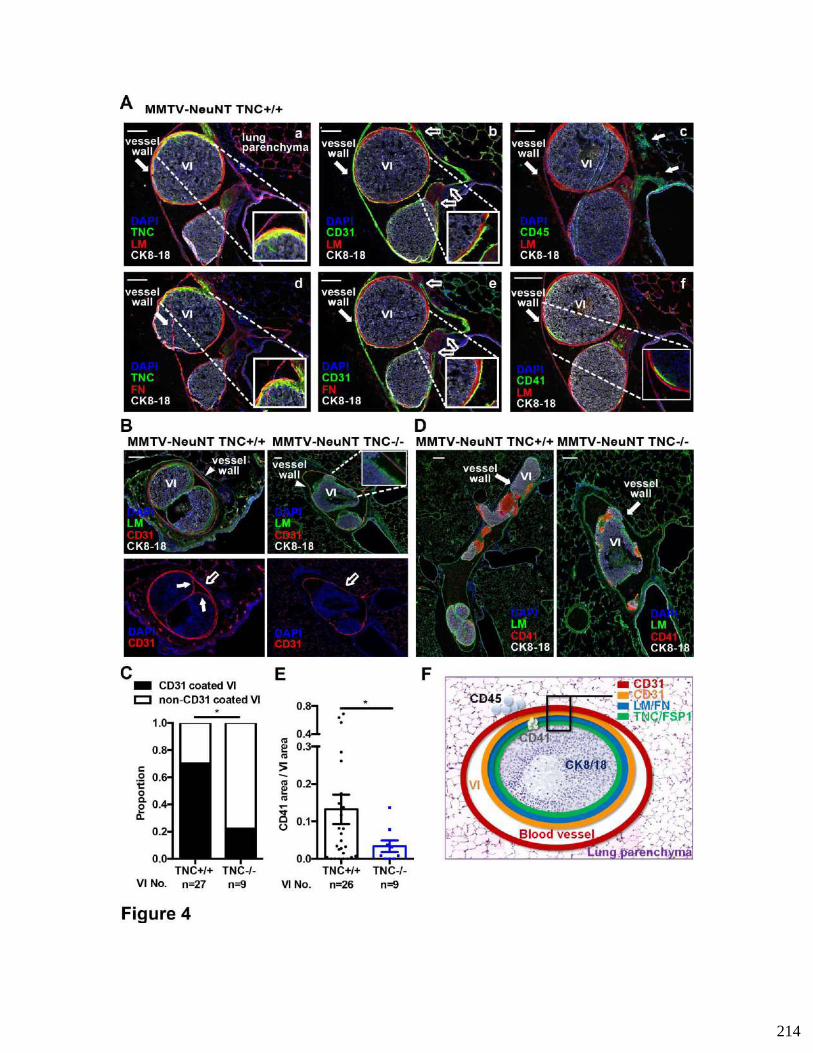
214
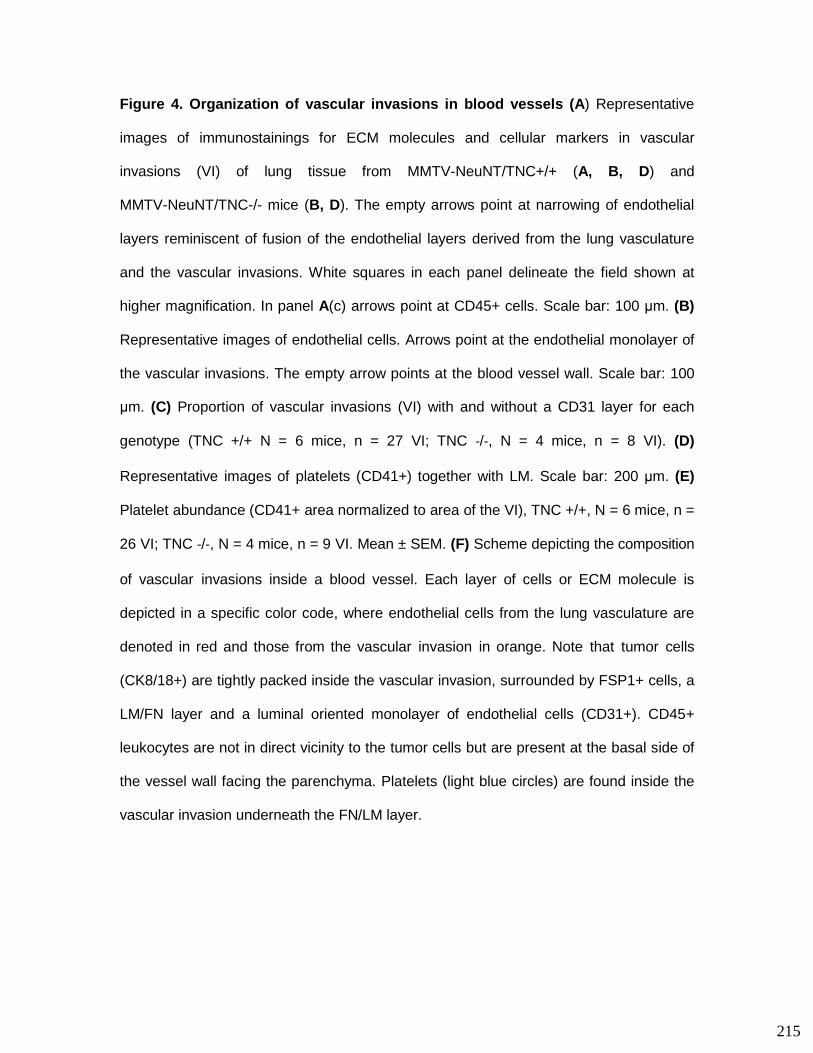
Figure 4. Organization of vascular invasions in blood vessels (A) Representative
images of immunostainings for ECM molecules and cellular markers in vascular
invasions (VI) of lung tissue from MMTV-NeuNT/TNC+/+ (A, B, D) and
MMTV-NeuNT/TNC-/- mice (B, D). The empty arrows point at narrowing of endothelial
layers reminiscent of fusion of the endothelial layers derived from the lung vasculature
and the vascular invasions. White squares in each panel delineate the field shown at
higher magnification. In panel A(c) arrows point at CD45+ cells. Scale bar: 100 μm. (B)
Representative images of endothelial cells. Arrows point at the endothelial monolayer of
the vascular invasions. The empty arrow points at the blood vessel wall. Scale bar: 100
μm. (C) Proportion of vascular invasions (VI) with and without a CD31 layer for each
genotype (TNC +/+ N = 6 mice, n = 27 VI; TNC ‐/-, N = 4 mice, n = 8 VI). (D)
Representative images of platelets (CD41+) together with LM. Scale bar: 200 μm. (E)
Platelet abundance (CD41+ area normalized to area of the VI), TNC +/+, N = 6 mice, n =
26 VI; TNC ‐/‐, N = 4 mice, n = 9 VI. Mean ± SEM. (F) Scheme depicting the composition
of vascular invasions inside a blood vessel. Each layer of cells or ECM molecule is
depicted in a specific color code, where endothelial cells from the lung vasculature are
denoted in red and those from the vascular invasion in orange. Note that tumor cells
(CK8/18+) are tightly packed inside the vascular invasion, surrounded by FSP1+ cells, a
LM/FN layer and a luminal oriented monolayer of endothelial cells (CD31+). CD45+
leukocytes are not in direct vicinity to the tumor cells but are present at the basal side of
the vessel wall facing the parenchyma. Platelets (light blue circles) are found inside the
vascular invasion underneath the FN/LM layer.
215
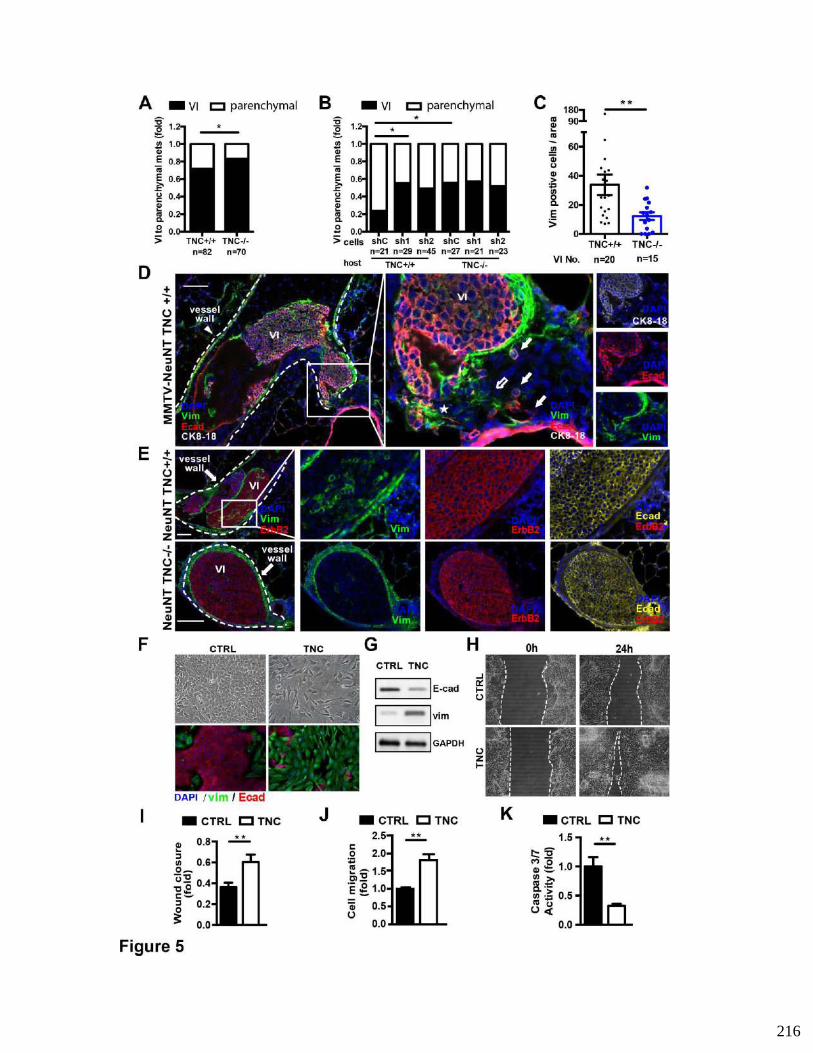
216
Figure 5. Tenascin-C promotes extravasation of tumor cells and epithelial cell
plasticity (A, B) Proportion of vascular invasions (VI) to parenchymal metastasis in
MMTV-NeuNT mice (A) (TNC +/+, N = 6 mice; TNC ‐/‐, N = 6 mice) and in NT193 grafted
mice (B) (shC in TNC +/+ mice (N = 5); sh1TNC in TNC +/+ mice (N = 4); sh2TNC in TNC
+/+ mice (N = 7); shC in TNC -/- mice (N = 6); sh1TNC in TNC -/- mice (N = 5); sh2TNC in
TNC -/- mice (N = 5). Mean ± SEM. Note, that either stromal or cancer cell derived TNC
increases parenchymal metastasis. (C) Quantification of tumor cells expressing both
vimentin (green) and ErbB2 (red) normalized per area of the vascular invasion (0.1 mm2).
MMTV-NeuNT (TNC +/+, N = 6 mice, n = 20 VI and TNC‐/‐, N = 4 mice, n = 15 VI). (D, E)
Representative IF images of vimentin (green), E-cadherin (red) and CK8/18 (white)
expression in vascular invasions from MMTV-NeuNT/TNC+/+ mice. White squares
delineate areas of higher magnification. Note that tumor cells (CK8/18+) are invading the
parenchymal lung tissue. Arrow points at single invading tumor cell with epithelilal
characteristics (CK8/18+ and E-cadherin+). Empty arrow points at invading vimentin+
and E-cadherin- cell. Star points at an event at the invading front. Scale bar: 100 μm. (E)
Representative IF images of cells expressing vimentin (green), ErbB2 (red) and
E-cadherin (yellow) in vascular invasions of MMTV-NeuNT mice (TNC+/+ and TNC‐/‐).
Scale bar: 100 μm. NT193 cells were treated with TNC for 24 hours before assessment of
epithelial/mesenchymal plasticity by imaging (F), western blot (G), migration (H-J) and
survival (K). (F) Phase contrast micrographs and IF images of E-cadherin (red) and
vimentin (green). Nuclei are stained by DAPI (blue). Scale bar: 20 μm. (G) Detection of
E-cadherin and vimentin by immunoblotting with GAPDH as loading control (one
representative of three independent experiments is shown). (H, I) Wound closure assay, n
= 14, five independent experiments with at least two replicates. Scale bar: 20 μm. (J)
217
Boyden chamber transwell migration assay. Prior to plating, cells were treated with TNC
for 24 hours, n = 7, two independent experiments with at least triplicates. (K) Assessment
of staurosporine (STS) - induced apoptosis by measuring caspase-3/7 activity, n = 9,
three independent experiments in triplicates.
218
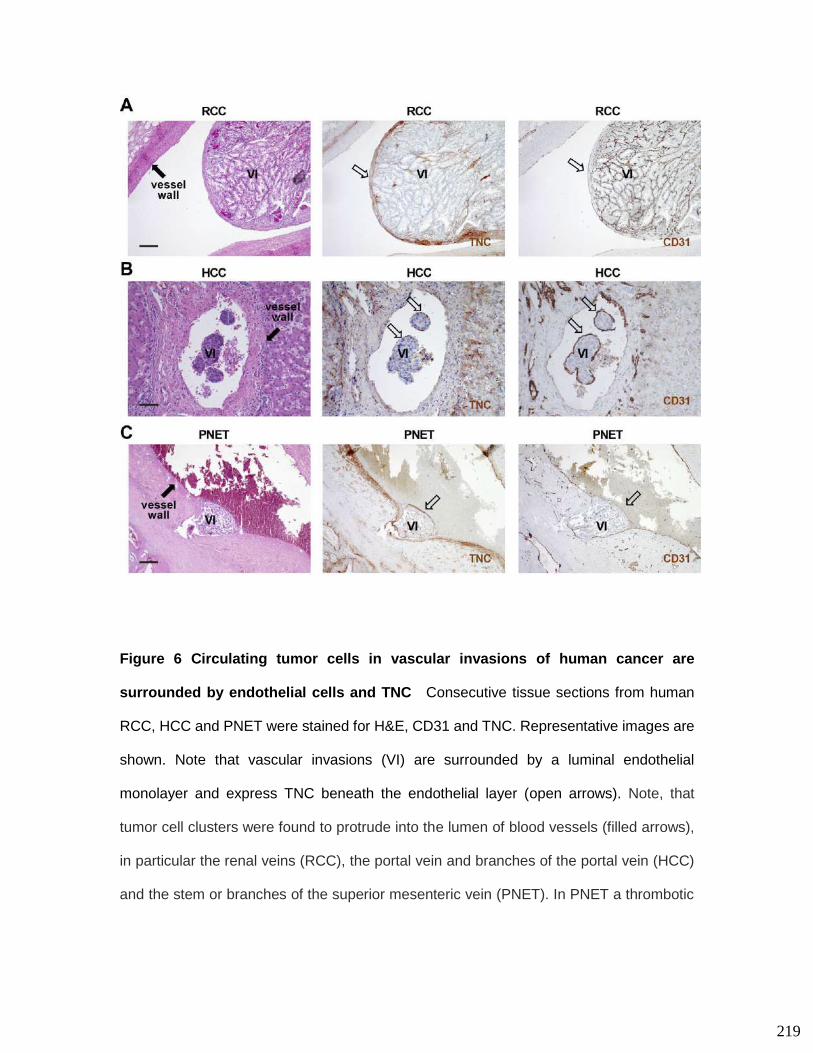
Figure 6 Circulating tumor cells in vascular invasions of human cancer are
surrounded by endothelial cells and TNC Consecutive tissue sections from human
RCC, HCC and PNET were stained for H&E, CD31 and TNC. Representative images are
shown. Note that vascular invasions (VI) are surrounded by a luminal endothelial
monolayer and express TNC beneath the endothelial layer (open arrows). Note, that
tumor cell clusters were found to protrude into the lumen of blood vessels (filled arrows),
in particular the renal veins (RCC), the portal vein and branches of the portal vein (HCC)
and the stem or branches of the superior mesenteric vein (PNET). In PNET a thrombotic
219

reaction is observed at the luminal surface of the endothelium covering the vascular
invasion. Scale bar represents 50 m.
220
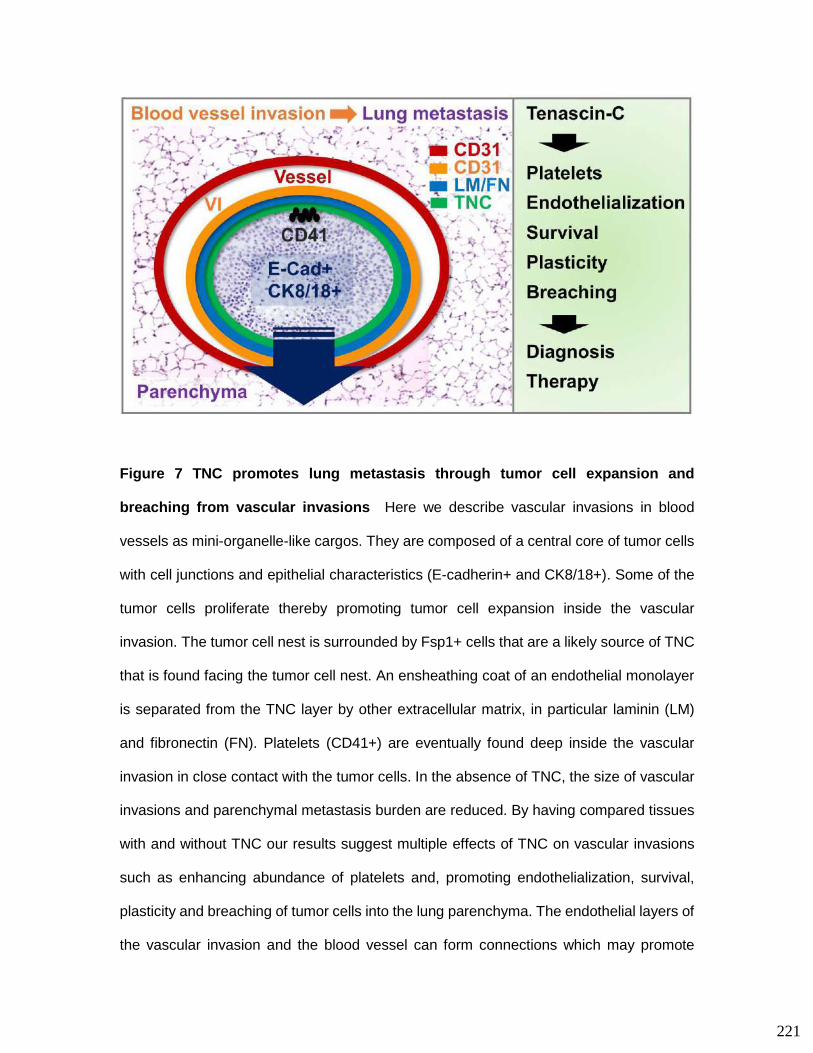
Figure 7 TNC promotes lung metastasis through tumor cell expansion and
breaching from vascular invasions Here we describe vascular invasions in blood
vessels as mini-organelle-like cargos. They are composed of a central core of tumor cells
with cell junctions and epithelial characteristics (E-cadherin+ and CK8/18+). Some of the
tumor cells proliferate thereby promoting tumor cell expansion inside the vascular
invasion. The tumor cell nest is surrounded by Fsp1+ cells that are a likely source of TNC
that is found facing the tumor cell nest. An ensheathing coat of an endothelial monolayer
is separated from the TNC layer by other extracellular matrix, in particular laminin (LM)
and fibronectin (FN). Platelets (CD41+) are eventually found deep inside the vascular
invasion in close contact with the tumor cells. In the absence of TNC, the size of vascular
invasions and parenchymal metastasis burden are reduced. By having compared tissues
with and without TNC our results suggest multiple effects of TNC on vascular invasions
such as enhancing abundance of platelets and, promoting endothelialization, survival,
plasticity and breaching of tumor cells into the lung parenchyma. The endothelial layers of
the vascular invasion and the blood vessel can form connections which may promote
221
breaching of the tumor cells. Epithelial plasticity of some tumor cells as indicated by
vimentin expression may also contribute to breaching. The composition of vascular
invasions offers opportunities for cancer patient stratification as in contrast to lymphatic
vessels, vascular invasions in blood vessels express TNC and have an endothelial coat
which could be a target of intervention therapies to preventing metastatic spread.
222
Supplemental information for Sun et al., “Role of Tenascin-C in promoting lung
metastasis through impacting vascular invasions”
Supplemental Material and Methods
Supplemental Table S1 Patient information
Supplemental Table S2 Summary of vascular invasion characteristics in human
cancers
Supplemental Table S3 List of antibodies
Supplemental Table S4 Primer sequences used for qPCR
Supplemental Figures S1 – S8
223
Supplementary Material and Methods
Human cancer tissue
Human cancer tissue (mammary carcinoma (MaCa), MaCa lung metastasis, renal cell
carcinoma (RCC), hepatocellular carcinoma (HCC), pancreatic neuroendocrine tumor
(PNET)) from two sites, the Medical University of Vienna/General Hospital Vienna
(MUW) and the Hôpital Universitaire de Strasbourg Hautepierre (HUS) was analyzed
(Table S1, S2). Patients underwent surgical treatment at the Department of Obstetrics
and Gynecology and at the Department of Surgery/Division of Thoracic Surgery (MUW
cohort), at the HUS for the pancreatic and hepatic tumors, and at the Nouvel Hôpital
Civil for the renal tumors (HUS cohort). 30 cases of histologically proven invasive MaCa
with metastasis to the lung were investigated. In addition, 35 breast cancer specimen
were collected (November 2013 – October 2014) and selected according to clinical
annotation of present vascular invasions (Table S1). Serial sections of 2 or 4 µm were
prepared and stained with antibodies specific for TNC, Factor VIII, CD31, CD34, CD61
and podoplanin (D2-40) by using an automated stainer (BenchMark Ultra,
Roche/Ventana). Analysis of staining results was performed by two pathologists
independently (FO/RK, MUW cohort of breast cancer, AO/RK MUW cohort of RCC,
GA/MPC, HUS cohort of breast cancer, GA/ZS, HUS cohort of RCC, HCC, PNET) in
each center (Table S1). Results are summarized in Table S2. Ethical approval for the
procedures described has been granted.
Mice
MMTV-NeuNT female mice (FVB/NCrl background) with a mutated constitutively active
form of rat ErbB2 (NeuNT), expressed under control of the mouse mammary tumor virus
(MMTV) regulatory region 1, were provided by Gerhard Christofori (University of Basel,
224

Switzerland). Mice expressing NeuNT develop multifocal breast adenocarcinoma and
lung metastasis. TNC +/- mice in the 129/Sv genetic background were generously
donated by Reinhard Fassler 2. Ten consecutive crosses with FVB/NCrl mice (Charles
River) were done to homogenize the background. TNC +/- males were crossed with TNC
+/- females to obtain TNC+/+ (WT) and TNC-/- (KO) littermates; MMTV-NeuNT males
(FVB/NCrl background) were crossed with TNC+/- females to generate double-
transgenic mice MMTV-NeuNT with a TNC+/+ and TNC-/- genotype, respectively. All
mice were housed and handled according to the guidelines of INSERM and the ethical
committee of Alsace, France (CREMEAS) (Directive 2010/63/EU on the protection of
animals used for scientific purposes).
Animal experiments
For the syngeneic mouse model, 107 NT193 cells were diluted in 50 μL PBS and
injected orthotopically into the left fourth mammary gland of FVB/NCrl mice. Mice were
euthanized at indicated time points and breast tumors and lungs were snap frozen in
liquid nitrogen for western blot and qPCR or embedded in O.C.T. (Sakura Finetek) or in
paraffin for histological analysis and immunostaining.
Tissue analysis
The stereological analysis of the lung metastasis (index and number) was done as
published 3. Briefly, the left lung lobe was cut transversally into 2.0 mm thick parallel
pieces, giving rise to a total of five to six pieces before paraffin embedding in parallel
orientation, and cutting into 7 μm thick sections. In cases where no metastasis was
found, 8 to 10 additional sections separated by 200 μm were analyzed.
HE staining
225
Lungs were prepared and fixed overnight in 4% PFA, dehydrated in 100% ethanol for
24 hours, embedded in paraffin, cut in 7 μm thick sections, dewaxed and rehydrated with
100% Toluene (2 washes of 15 minutes) then incubated in 100%–70% alcohol solutions
(10 minutes each) followed by a final staining with hematoxylin (Surgipath) for 5 minutes
and washing with tap water or followed by IHC. Sections were further processed with
differentiation solution (1% HCl in absolute ethanol, for 7 seconds), followed by washing
under tap water for 10 minutes. Sections were then incubated in eosin (Harris) for 10
seconds, rinsed and dehydrated in 70% - 100% alcohol baths with rapid dips in each
bath before final wash in toluene for 15 minutes. Finally, tissue sections were embedded
in Eukitt solution (Sigma).
Giemsa staining
Tissue was cut in 7 μm thick sections, dewaxed and stained with Giemsa (320310-0125,
RAL) for 2 hours at 37°C. Sections were further processed in a 0.5% aqueous acetic
acid solution, dehydrated and embedded in Eukitt solution.
Immunohistochemistry
Paraffin embedded tissue was rehydrated and the antigens were unmasked by boiling in
10 mM pH 6 citrate solution for 20 minutes. Cooled slides were washed and incubated in
a peroxide solution (0.6% H2O2, 0.1% triton X‐100 in PBS) to eliminate endogenous
peroxidase activity. Non‐specific binding sites were blocked with a blocking solution (5%
normal goat serum in PBS) for one hour at room temperature (RT) and then avidin/biotin
receptors were blocked by using the avidin/biotin blocking kit as recommended by the
manufacturer (Vector). Slides were incubated with the first antibody overnight at 4°C in a
humidified container. Next day, slides were washed and incubated for 45 minutes at
226
room temperature with a secondary antibody (coupled to biotin). The detection of
peroxidase was done using the Elite ABC system (VECTASTAIN) with DAB (Vector) as
substrate. Finally, tissue was stained with hematoxylin, dehydrated and the slide was
mounted. Proliferation and apoptosis were quantified as events per area upon staining
for Ki-67 and cleaved caspase-3, respectively.
Immunofluorescence staining
Tissue was air‐dried and unspecific signals were blocked with blocking solution (5%
normal goat or donkey serum in PBS) for one hour at room temperature. Tissue sections
were incubated with the primary antibody overnight at 4°C in a humidified container (see
Table S4). The following day the primary antibody was removed and tissue was
incubated with a fluorescent secondary antibody for one hour at room temperature.
Secondary goat or donkey antibodies for immunostainings were fluorescently labeled
(1/1000): anti-mouse, anti-rabbit, anti-rat, anti-guinea pig and anti-goat IgG (Jackson
Laboratory). Slides were washed and incubated with DAPI (Sigma) to visualize the
nuclei (10 minutes at room temperature). Excess of dye was removed and tissue was
embedded in the FluorSaveTM Reagent (Calbiochem). Fluorescent signal was analyzed
with a Zeiss Axio Imager Z2 microscope. The staining procedure (fixation, blocking,
antibody dilution) and image acquisition setting (microscope, magnification, light
intensity, exposure time) were kept constant per experiment and between genetic
conditions. Quantification of immunofluorescent microscopic images was done by the
ImageJ (National Institutes of Health) software using a constant threshold. The
expression of TNC was scored according to the extent and intensity of the whole tumor
mosaic picture. A typical fibrillar TNC staining with the MTn12 antibody in the stroma
around the tumor cells was considered as positive signal (no signal with the secondary
antibody alone). The extent of TNC staining was scored by the percentage of the
227
positively stained area. The stained area in each region of interest was scored as 0 for
staining less than 5 %, as 1 for 5–25 %, 2 for 25–50 %, 3 for 50–75 %, and 4 for more
than 75 % of the stained area. The intensity of staining was scored as 0, 1, 2 and 3
representing no staining, mild (weak but detectable above control), moderate (distinct)
and intense (strong) staining, respectively. The percentage of positively stained area and
intensity of staining were multiplied to produce a weighted score 4.
qPCR analysis
Total RNA was prepared using TriReagent (Life Technologies) according to the
manufacturer’s instructions. RNA was reverse transcribed (MultiScribe reverse
transcriptase, Applied Biosystems) and qPCR (real time quantitative polymerase chain
reaction) was done on cDNA (diluted 1:5 in water) using a 7500 Real Time PCR
machine (Applied Biosystems) with a SYBR green reaction mixture or Taqman reaction
mixture (Applied Biosystems). Data were normalized by using a Taqman mouse Gapdh
Endogenous Control (4333764T, Life Technology) and fold induction was calculated
using the comparative Ct method (-ddCt). Primers used for qPCR are listed in Table S4.
Immunoblotting
Cell lysates were prepared in lysis buffer (25 mM Tris-HCl pH 7.6, 150 mM NaCl,1% NP-
40, 1% sodium deoxycholate, 0.1% SDS) supplemented with protease inhibitor (Roche)
and Phosphatase Inhibitor Cocktail (Santa Cruz). Protein concentration was determined
with a Bradford Assay (BioRad). After addition of Laemmli buffer (Biorad), 20-30 μg
protein lysate was separated by SDS-PAGE in precasted 4-20 % gradient gels (Biorad),
transferred onto nitrocellulose membranes (Biorad) using TransBlot Turbo™ Transfer
System (Biorad), blocked with 5 % Blocking-Grade blocker (Biorad) in 0.1% Tween 20-
PBS and incubated with the primary (overnight at 4°C) and secondary antibodies (one
228
hour at RT) in 1.5 % Blocking-Grade Blocker in 0.1 %Tween 20-PBS. Secondary
antibodies used for western blots were ECL horseradish peroxidase-linked (1/1000):
anti-rat (NA935) and anti-rabbit (NA934V) (GE Healthcare). Protein bands were detected
with the Amersham ECL Western Blotting detection reagent (GE Healthcare) or
SuperSignal™ West Femto Maximum Sensitivity Substrate (ThermoFisher).
Immunofluorescence staining of cells
Cells were fixed in 4 % PFA for 10 minutes, permeabilized in PBS-Triton 0.1 % for 10
minutes, incubated with the primary antibody overnight at 4 °C, secondary antibody for
one hour at RT, DAPI, mounted with FluorSaveTM Reagent (Calbiochem) and analyzed
with a Zeiss Axio Imager Z2 microscope.
Cell culture
NT193 cells derived from a MMTV-NeuNT primary tumor 5 were cultured in DMEM
medium with 4.5 g/L glucose (GIBCO) supplemented with 10 % of inactivated fetal
bovine serum, penicillin (10 000 U/ml) and streptomycin (10 mg/ml). Cells were
maintained at 37°C in a humidified atmosphere of 5 % CO2 and were regularly analyzed
by PCR for mycoplasma.
Transduction of cells
Silencing of Tnc in mouse cells was done by short hairpin (sh) mediated gene
expression knock down (KD). Lentiviral particles with shRNA vectors (Sigma‐Aldrich)
specific for Tnc were used. sh1 (TRCN0000312137), sequence: 5’-CCGGCCCG
GAACTGAATATGGGATTCTCGAGAATCCCATATTCAGTTCCGGGTTTTTG-3’; sh2
(TRCN0000312138), sequence: 5’-CCGGGCATCAACACAACCAGTCTAACT
CGAGTTAGACTGGTTGTGTTGATGCTTTTTG-3’. Lentiviral particles encoding a non‐
229
targeting shRNA vector were used as a control (SHC202V, Sigma‐Aldrich). Transduced
cells were selected with normal medium supplemented with 10 μg/ml puromycin
(ThermoFisher) and the selection pressure was maintained in all in vitro experiments.
Spheroid assay
NT193 cells were seeded at 5000 cells per 100 μL together with TNC (10 μg/ml) or PBS-
Tween-20 (0.01%) in 96 well plates with round bottom pre-coated with 10 μg/ml of poly-
HEMA (Sigma) for 24 hours to allow spheroid formation and then cells were embedded
in OCT for further immunostaining analysis.
Wound healing assay
NT193 cells (2×10⁵) were grown to high confluency in 24-well plates for 24 hours.
Confluent cell monolayers were treated two hours with mitomycin-C (Sigma) at 2 μg/ml
to inhibit proliferation before application of a scratch wound with a pipet tip. Cell debris
was removed by PBS washing before addition of serum-free medium supplemented with
the indicated molecules. Images of the wounding area were acquired immediately after
scratching and then in the same field after 24 hours. The relative wound closure was
quantified by measuring the surface of the cell-free area at the time of injury and at the
end point of the experiment.
Transwell migration assay
NT193 cells (5x10⁵) were seeded for 7 hours in 60 mm dishes to adhere, then were
starved overnight in serum-free medium. Cells were treated 24 hours with TNC at 10
µg/ml in serum-free medium before trypsinisation and seeding (3x10⁴) in cell culture
inserts (Corning Transwell, pore size 8.0µm), in serum-free condition. Medium
containing 10% FBS was used as attractant. After 24 hours inserts were washed in PBS.
230
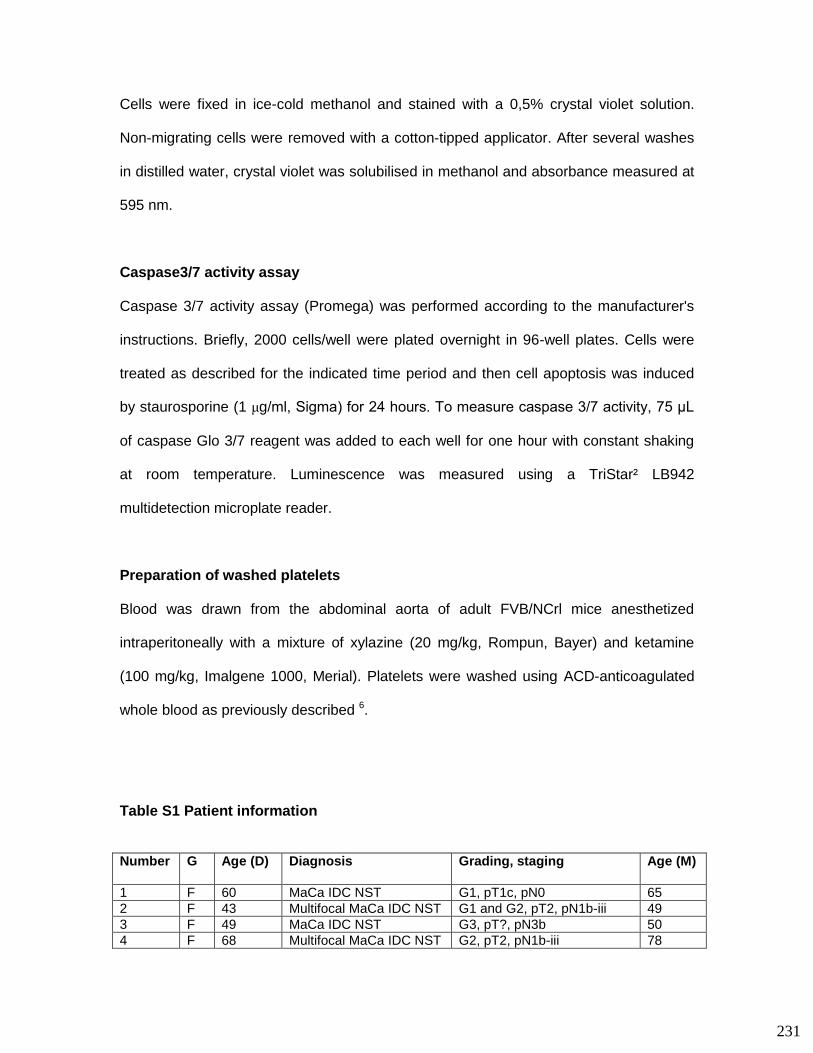
Cells were fixed in ice-cold methanol and stained with a 0,5% crystal violet solution.
Non-migrating cells were removed with a cotton-tipped applicator. After several washes
in distilled water, crystal violet was solubilised in methanol and absorbance measured at
595 nm.
Caspase3/7 activity assay
Caspase 3/7 activity assay (Promega) was performed according to the manufacturer's
instructions. Briefly, 2000 cells/well were plated overnight in 96-well plates. Cells were
treated as described for the indicated time period and then cell apoptosis was induced
by staurosporine (1 μg/ml, Sigma) for 24 hours. To measure caspase 3/7 activity, 75 μL
of caspase Glo 3/7 reagent was added to each well for one hour with constant shaking
at room temperature. Luminescence was measured using a TriStar² LB942
multidetection microplate reader.
Preparation of washed platelets
Blood was drawn from the abdominal aorta of adult FVB/NCrl mice anesthetized
intraperitoneally with a mixture of xylazine (20 mg/kg, Rompun, Bayer) and ketamine
(100 mg/kg, Imalgene 1000, Merial). Platelets were washed using ACD-anticoagulated
whole blood as previously described 6.
Table S1 Patient information Number G Age (D) Diagnosis Grading, staging Age (M)
1 F 60 MaCa IDC NST G1, pT1c, pN0 65
2 F 43 Multifocal MaCa IDC NST G1 and G2, pT2, pN1b-iii 49
3 F 49 MaCa IDC NST G3, pT?, pN3b 50
4 F 68 Multifocal MaCa IDC NST G2, pT2, pN1b-iii 78
231
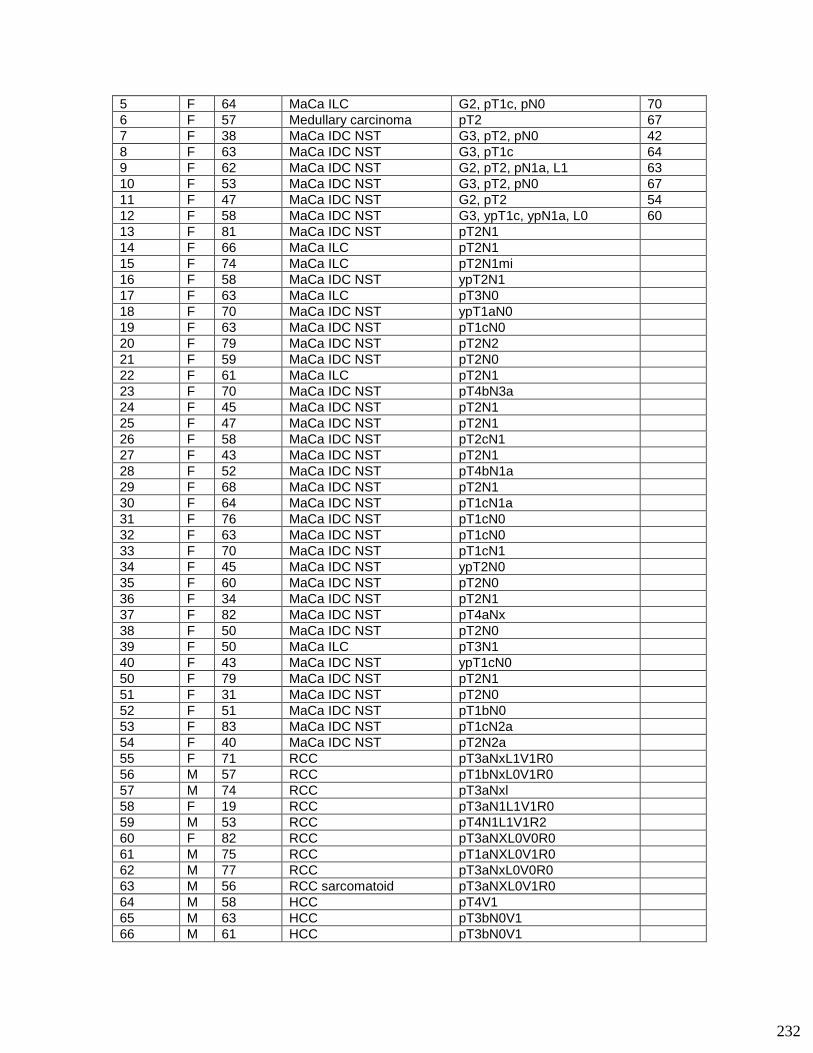
5 F 64 MaCa ILC G2, pT1c, pN0 70
6 F 57 Medullary carcinoma pT2 67
7 F 38 MaCa IDC NST G3, pT2, pN0 42
8 F 63 MaCa IDC NST G3, pT1c 64
9 F 62 MaCa IDC NST G2, pT2, pN1a, L1 63
10 F 53 MaCa IDC NST G3, pT2, pN0 67
11 F 47 MaCa IDC NST G2, pT2 54
12 F 58 MaCa IDC NST G3, ypT1c, ypN1a, L0 60
13 F 81 MaCa IDC NST pT2N1
14 F 66 MaCa ILC pT2N1
15 F 74 MaCa ILC pT2N1mi
16 F 58 MaCa IDC NST ypT2N1
17 F 63 MaCa ILC pT3N0
18 F 70 MaCa IDC NST ypT1aN0
19 F 63 MaCa IDC NST pT1cN0
20 F 79 MaCa IDC NST pT2N2
21 F 59 MaCa IDC NST pT2N0
22 F 61 MaCa ILC pT2N1
23 F 70 MaCa IDC NST pT4bN3a
24 F 45 MaCa IDC NST pT2N1
25 F 47 MaCa IDC NST pT2N1
26 F 58 MaCa IDC NST pT2cN1
27 F 43 MaCa IDC NST pT2N1
28 F 52 MaCa IDC NST pT4bN1a
29 F 68 MaCa IDC NST pT2N1
30 F 64 MaCa IDC NST pT1cN1a
31 F 76 MaCa IDC NST pT1cN0
32 F 63 MaCa IDC NST pT1cN0
33 F 70 MaCa IDC NST pT1cN1
34 F 45 MaCa IDC NST ypT2N0
35 F 60 MaCa IDC NST pT2N0
36 F 34 MaCa IDC NST pT2N1
37 F 82 MaCa IDC NST pT4aNx
38 F 50 MaCa IDC NST pT2N0
39 F 50 MaCa ILC pT3N1
40 F 43 MaCa IDC NST ypT1cN0
50 F 79 MaCa IDC NST pT2N1
51 F 31 MaCa IDC NST pT2N0
52 F 51 MaCa IDC NST pT1bN0
53 F 83 MaCa IDC NST pT1cN2a
54 F 40 MaCa IDC NST pT2N2a
55 F 71 RCC pT3aNxL1V1R0
56 M 57 RCC pT1bNxL0V1R0
57 M 74 RCC pT3aNxl
58 F 19 RCC pT3aN1L1V1R0
59 M 53 RCC pT4N1L1V1R2
60 F 82 RCC pT3aNXL0V0R0
61 M 75 RCC pT1aNXL0V1R0
62 M 77 RCC pT3aNxL0V0R0
63 M 56 RCC sarcomatoid pT3aNXL0V1R0
64 M 58 HCC pT4V1
65 M 63 HCC pT3bN0V1
66 M 61 HCC pT3bN0V1
232
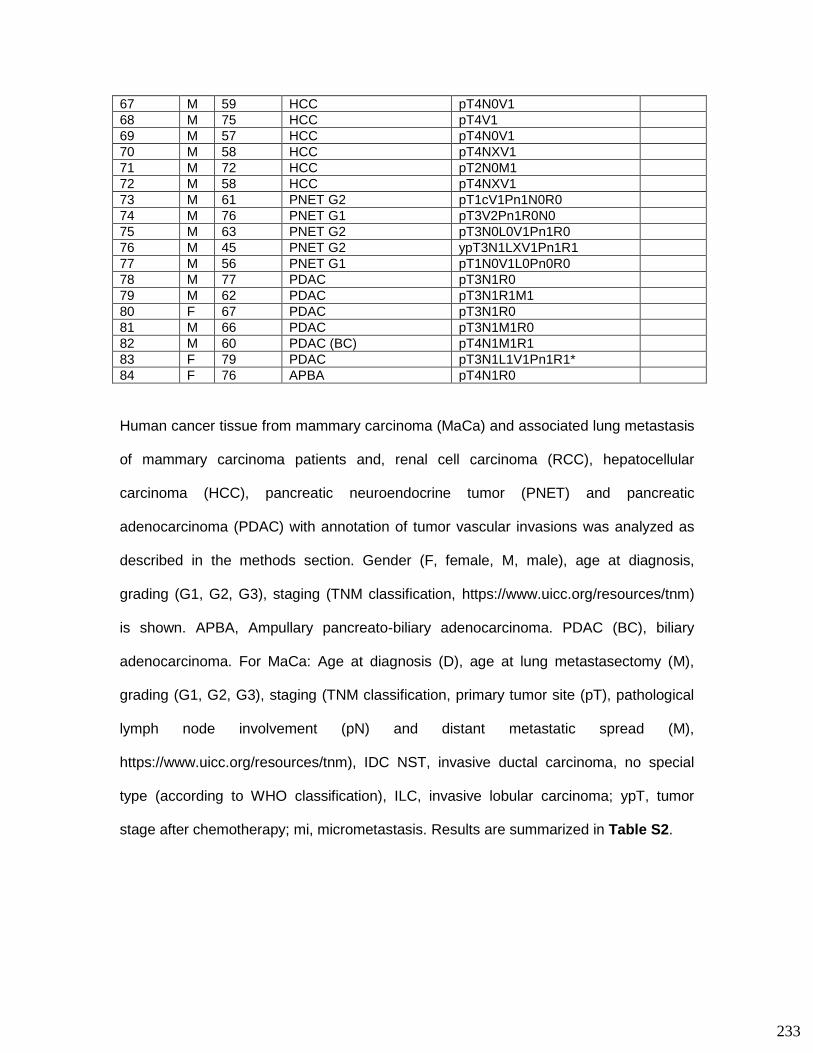
67 M 59 HCC pT4N0V1
68 M 75 HCC pT4V1
69 M 57 HCC pT4N0V1
70 M 58 HCC pT4NXV1
71 M 72 HCC pT2N0M1
72 M 58 HCC pT4NXV1
73 M 61 PNET G2 pT1cV1Pn1N0R0
74 M 76 PNET G1 pT3V2Pn1R0N0
75 M 63 PNET G2 pT3N0L0V1Pn1R0
76 M 45 PNET G2 ypT3N1LXV1Pn1R1
77 M 56 PNET G1 pT1N0V1L0Pn0R0
78 M 77 PDAC pT3N1R0
79 M 62 PDAC pT3N1R1M1
80 F 67 PDAC pT3N1R0
81 M 66 PDAC pT3N1M1R0
82 M 60 PDAC (BC) pT4N1M1R1
83 F 79 PDAC pT3N1L1V1Pn1R1*
84 F 76 APBA pT4N1R0
Human cancer tissue from mammary carcinoma (MaCa) and associated lung metastasis
of mammary carcinoma patients and, renal cell carcinoma (RCC), hepatocellular
carcinoma (HCC), pancreatic neuroendocrine tumor (PNET) and pancreatic
adenocarcinoma (PDAC) with annotation of tumor vascular invasions was analyzed as
described in the methods section. Gender (F, female, M, male), age at diagnosis,
grading (G1, G2, G3), staging (TNM classification, https://www.uicc.org/resources/tnm)
is shown. APBA, Ampullary pancreato-biliary adenocarcinoma. PDAC (BC), biliary
adenocarcinoma. For MaCa: Age at diagnosis (D), age at lung metastasectomy (M),
grading (G1, G2, G3), staging (TNM classification, primary tumor site (pT), pathological
lymph node involvement (pN) and distant metastatic spread (M),
https://www.uicc.org/resources/tnm), IDC NST, invasive ductal carcinoma, no special
type (according to WHO classification), ILC, invasive lobular carcinoma; ypT, tumor
stage after chemotherapy; mi, micrometastasis. Results are summarized in Table S2.
233
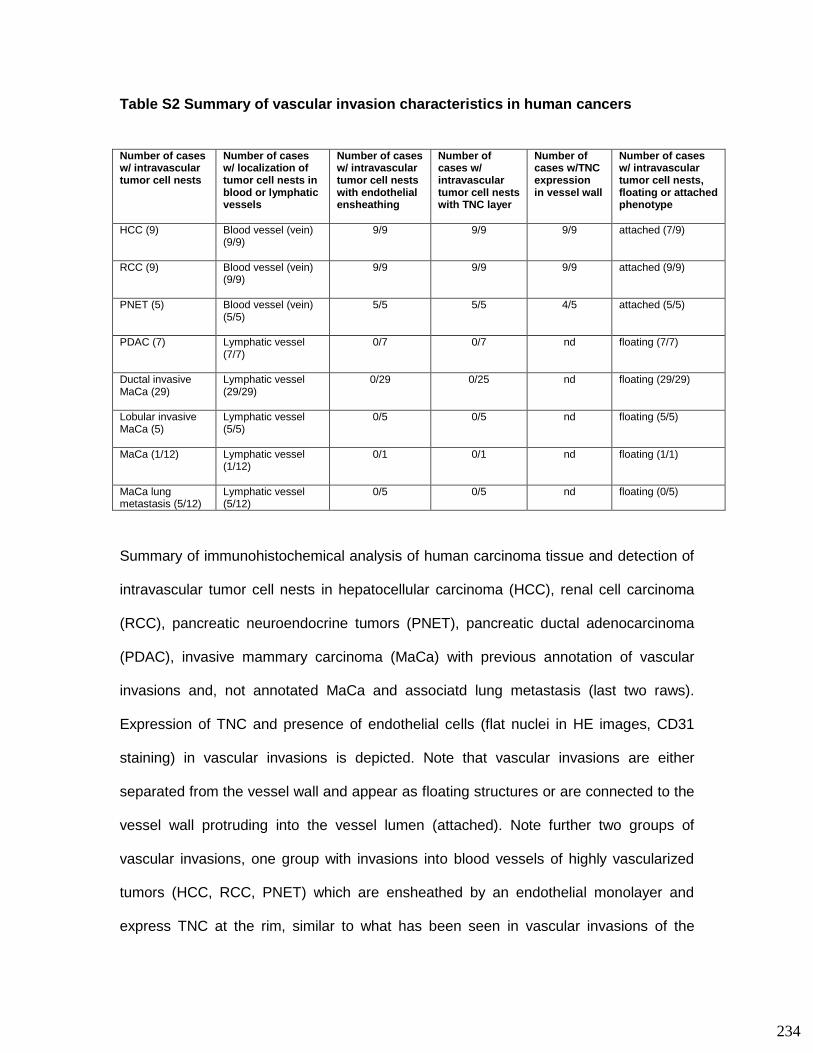
Table S2 Summary of vascular invasion characteristics in human cancers
Number of cases w/ intravascular tumor cell nests
Number of cases w/ localization of tumor cell nests in blood or lymphatic vessels
Number of cases w/ intravascular tumor cell nests with endothelial ensheathing
Number of cases w/ intravascular tumor cell nests with TNC layer
Number of cases w/TNC expression in vessel wall
Number of cases w/ intravascular tumor cell nests, floating or attached phenotype
HCC (9)
Blood vessel (vein) (9/9)
9/9 9/9 9/9 attached (7/9)
RCC (9)
Blood vessel (vein) (9/9)
9/9 9/9 9/9 attached (9/9)
PNET (5)
Blood vessel (vein) (5/5)
5/5 5/5 4/5 attached (5/5)
PDAC (7)
Lymphatic vessel (7/7)
0/7 0/7 nd floating (7/7)
Ductal invasive MaCa (29)
Lymphatic vessel (29/29)
0/29 0/25 nd floating (29/29)
Lobular invasive MaCa (5)
Lymphatic vessel (5/5)
0/5 0/5 nd floating (5/5)
MaCa (1/12)
Lymphatic vessel (1/12)
0/1 0/1 nd floating (1/1)
MaCa lung metastasis (5/12)
Lymphatic vessel (5/12)
0/5 0/5 nd floating (0/5)
Summary of immunohistochemical analysis of human carcinoma tissue and detection of
intravascular tumor cell nests in hepatocellular carcinoma (HCC), renal cell carcinoma
(RCC), pancreatic neuroendocrine tumors (PNET), pancreatic ductal adenocarcinoma
(PDAC), invasive mammary carcinoma (MaCa) with previous annotation of vascular
invasions and, not annotated MaCa and associatd lung metastasis (last two raws).
Expression of TNC and presence of endothelial cells (flat nuclei in HE images, CD31
staining) in vascular invasions is depicted. Note that vascular invasions are either
separated from the vessel wall and appear as floating structures or are connected to the
vessel wall protruding into the vessel lumen (attached). Note further two groups of
vascular invasions, one group with invasions into blood vessels of highly vascularized
tumors (HCC, RCC, PNET) which are ensheathed by an endothelial monolayer and
express TNC at the rim, similar to what has been seen in vascular invasions of the
234

murine MMTV-NeuNT and NT193 model. In the second group of tissues derived from
PDAC, MaCa and MaCa lung metastasis, tumor cell nests were seen in lymphatic
vessels that did not express TNC and lacked an endothelial cell layer. Note that the
vessel wall expressed TNC where it had been investigated (see also Fig. S7, S8). nd,
not determined.
235
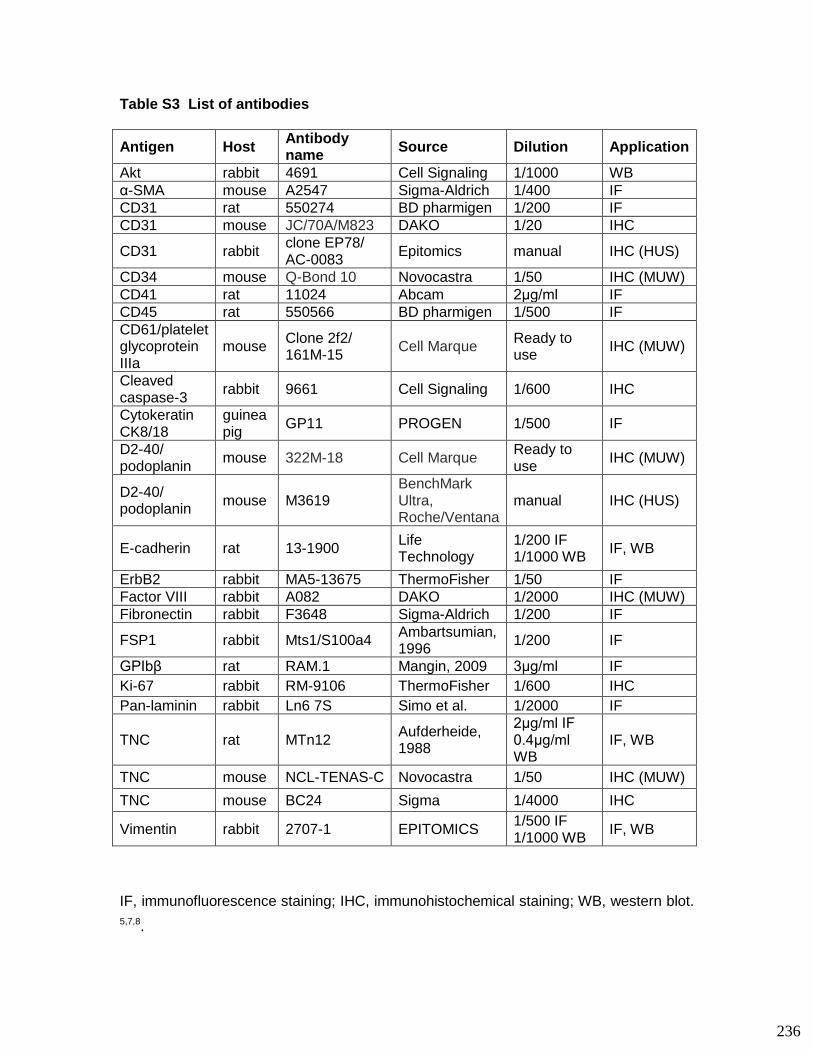
Table S3 List of antibodies
Antigen Host Antibody name
Source Dilution Application
Akt rabbit 4691 Cell Signaling 1/1000 WB
α-SMA mouse A2547 Sigma-Aldrich 1/400 IF
CD31 rat 550274 BD pharmigen 1/200 IF
CD31 mouse JC/70A/M823 DAKO 1/20 IHC
CD31 rabbit clone EP78/ AC-0083
Epitomics manual IHC (HUS)
CD34 mouse Q-Bond 10 Novocastra 1/50 IHC (MUW)
CD41 rat 11024 Abcam 2μg/ml IF
CD45 rat 550566 BD pharmigen 1/500 IF
CD61/platelet glycoprotein IIIa
mouse Clone 2f2/ 161M-15
Cell Marque Ready to use
IHC (MUW)
Cleaved caspase-3
rabbit 9661 Cell Signaling 1/600 IHC
Cytokeratin CK8/18
guinea pig
GP11 PROGEN 1/500 IF
D2-40/ podoplanin
mouse 322M-18 Cell Marque Ready to use
IHC (MUW)
D2-40/ podoplanin
mouse M3619 BenchMark Ultra, Roche/Ventana
manual IHC (HUS)
E-cadherin rat 13-1900 Life Technology
1/200 IF 1/1000 WB
IF, WB
ErbB2 rabbit MA5-13675 ThermoFisher 1/50 IF
Factor VIII rabbit A082 DAKO 1/2000 IHC (MUW)
Fibronectin rabbit F3648 Sigma-Aldrich 1/200 IF
FSP1 rabbit Mts1/S100a4 Ambartsumian, 1996
1/200 IF
GPIbβ rat RAM.1 Mangin, 2009 3μg/ml IF
Ki-67 rabbit RM-9106 ThermoFisher 1/600 IHC
Pan-laminin rabbit Ln6 7S Simo et al. 1/2000 IF
TNC rat MTn12 Aufderheide, 1988
2μg/ml IF 0.4μg/ml WB
IF, WB
TNC mouse NCL-TENAS-C Novocastra 1/50 IHC (MUW)
TNC mouse BC24 Sigma 1/4000 IHC
Vimentin rabbit 2707-1 EPITOMICS 1/500 IF 1/1000 WB
IF, WB
IF, immunofluorescence staining; IHC, immunohistochemical staining; WB, western blot.
5,7,8.
236
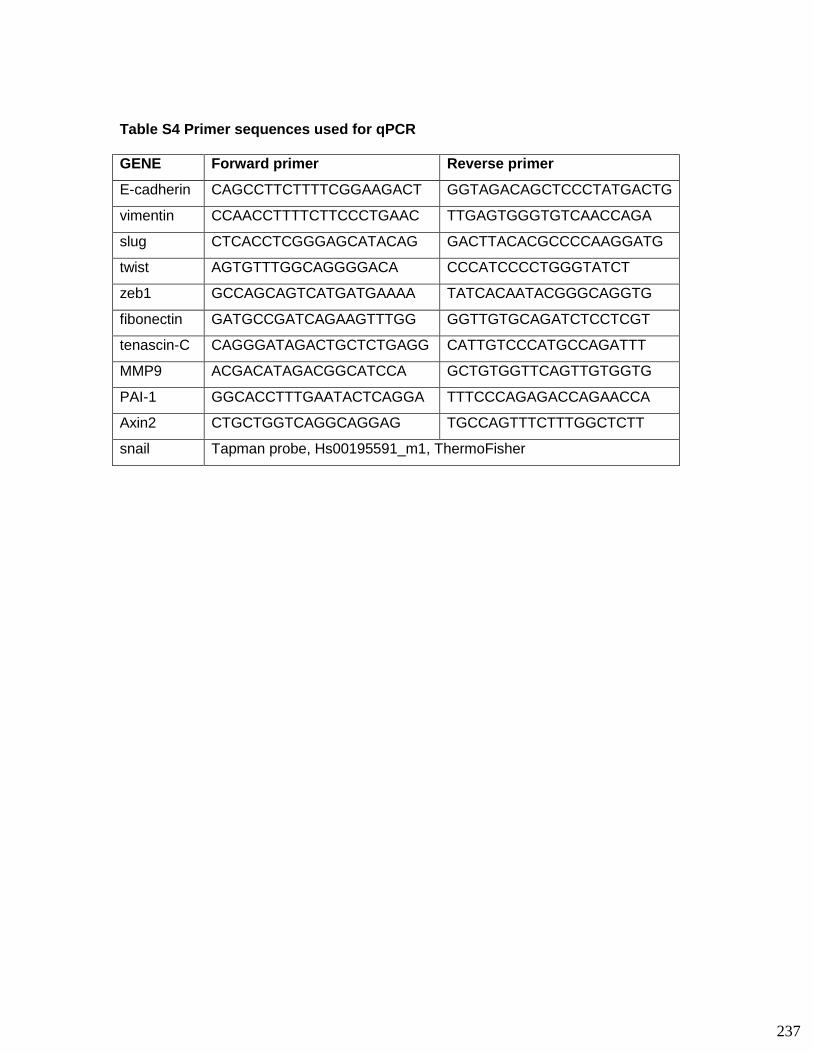
Table S4 Primer sequences used for qPCR
GENE Forward primer Reverse primer
E-cadherin CAGCCTTCTTTTCGGAAGACT GGTAGACAGCTCCCTATGACTG
vimentin CCAACCTTTTCTTCCCTGAAC TTGAGTGGGTGTCAACCAGA
slug CTCACCTCGGGAGCATACAG GACTTACACGCCCCAAGGATG
twist AGTGTTTGGCAGGGGACA CCCATCCCCTGGGTATCT
zeb1 GCCAGCAGTCATGATGAAAA TATCACAATACGGGCAGGTG
fibonectin GATGCCGATCAGAAGTTTGG GGTTGTGCAGATCTCCTCGT
tenascin-C CAGGGATAGACTGCTCTGAGG CATTGTCCCATGCCAGATTT
MMP9 ACGACATAGACGGCATCCA GCTGTGGTTCAGTTGTGGTG
PAI-1 GGCACCTTTGAATACTCAGGA TTTCCCAGAGACCAGAACCA
Axin2 CTGCTGGTCAGGCAGGAG TGCCAGTTTCTTTGGCTCTT
snail Tapman probe, Hs00195591_m1, ThermoFisher
237
References
1. Muller, W. J., Sinn, E., Pattengale, P. K., Wallace, R. & Leder, P. Single-step
induction of mammary adenocarcinoma in transgenic mice bearing the activated c-
neu oncogene. Cell 54, 105–115 (1988).
2. Talts, J. F., Wirl, G., Dictor, M., Muller, W. J. & Fässler, R. Tenascin-C modulates
tumor stroma and monocyte/macrophage recruitment but not tumor growth or
metastasis in a mouse strain with spontaneous mammary cancer. J. Cell. Sci. 112 (
Pt 12), 1855–1864 (1999).
3. Nielsen, B. S. et al. A Precise and Efficient Stereological Method for Determining
Murine Lung Metastasis Volumes. The American Journal of Pathology 158, 1997–
2003 (2001).
4. Shi, M. et al. Tenascin-C induces resistance to apoptosis in pancreatic cancer cell
through activation of ERK/NF-κB pathway. Apoptosis 20, 843–857 (2015).
5. Ambartsumian, N. S. et al. Metastasis of mammary carcinomas in GRS/A hybrid mice
transgenic for the mts1 gene. Oncogene 13, 1621–1630 (1996).
6. Cazenave, J.-P. et al. Preparation of Washed Platelet Suspensions From Human and
Rodent Blood. in Platelets and Megakaryocytes 272, 013–028 (Humana Press, 2004).
7. Aufderheide, E. & Ekblom, P. (7) Tenascin during gut development: Appearance in
the mesenchyme, shift in molecular forms, and dependence on epithelial-
mesenchymal interactions. (1988).
8. Mangin, P. H. et al. Identification of five novel 14-3-3 isoforms interacting with the
GPIb-IX complex in platelets. Journal of Thrombosis and Haemostasis 7, 1550–1555
(2009).
238

239
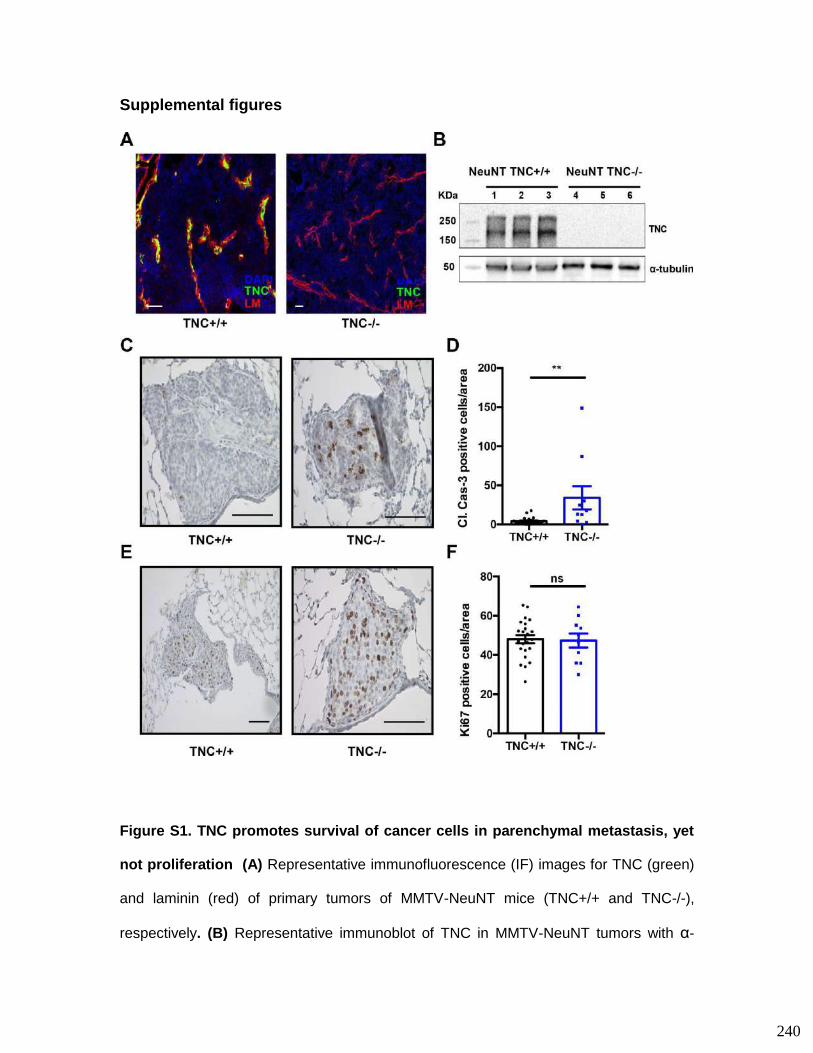
Supplemental figures
Figure S1. TNC promotes survival of cancer cells in parenchymal metastasis, yet
not proliferation (A) Representative immunofluorescence (IF) images for TNC (green)
and laminin (red) of primary tumors of MMTV-NeuNT mice (TNC+/+ and TNC-/-),
respectively. (B) Representative immunoblot of TNC in MMTV-NeuNT tumors with α-
240
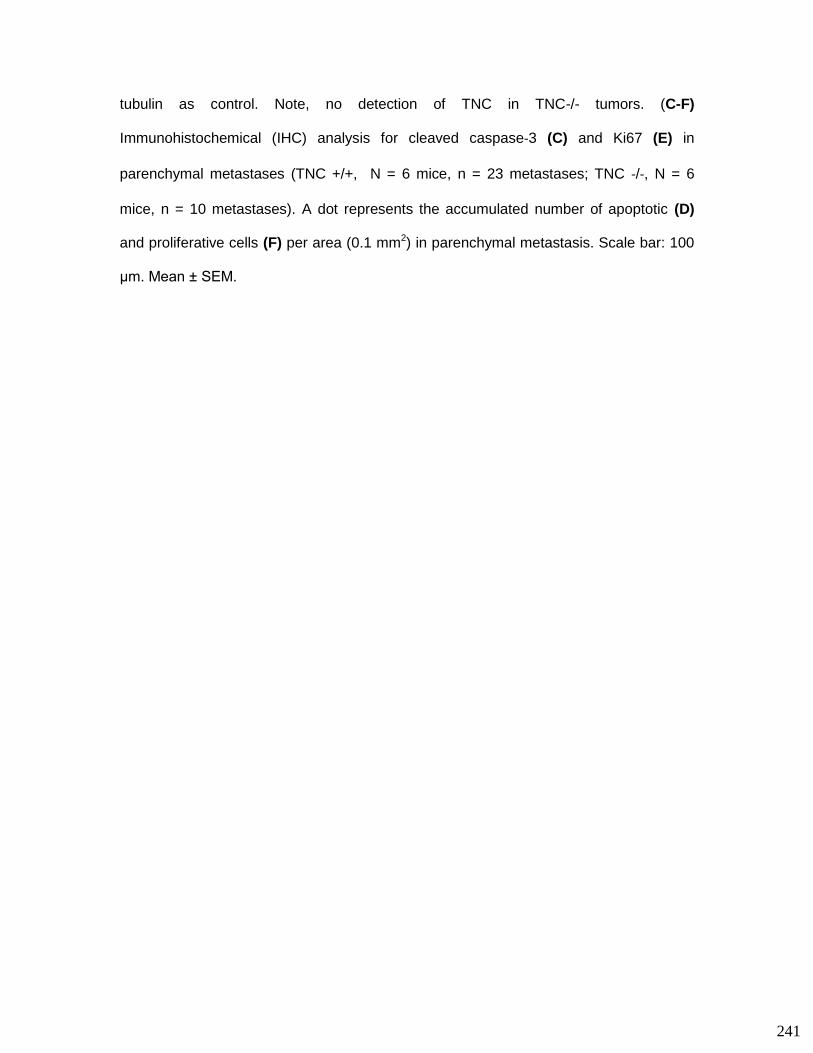
tubulin as control. Note, no detection of TNC in TNC-/- tumors. (C-F)
Immunohistochemical (IHC) analysis for cleaved caspase‐3 (C) and Ki67 (E) in
parenchymal metastases (TNC +/+, N = 6 mice, n = 23 metastases; TNC ‐/‐, N = 6
mice, n = 10 metastases). A dot represents the accumulated number of apoptotic (D)
and proliferative cells (F) per area (0.1 mm2) in parenchymal metastasis. Scale bar: 100
μm. Mean ± SEM.
241
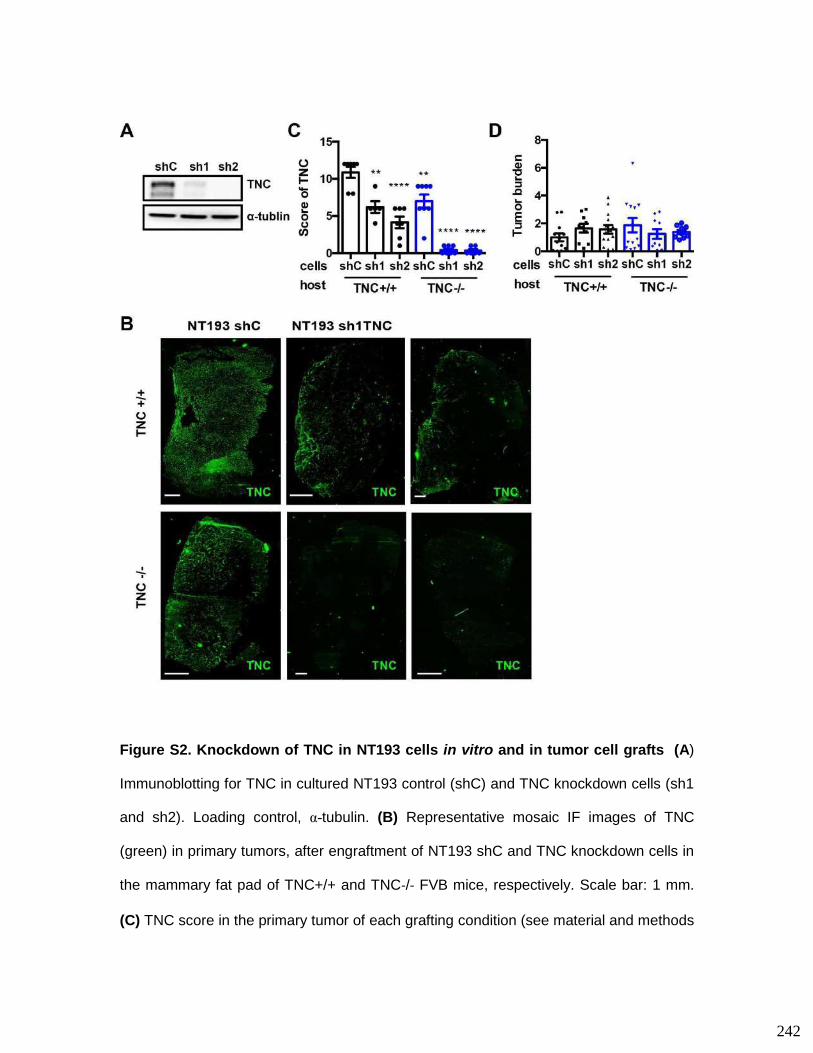
Figure S2. Knockdown of TNC in NT193 cells in vitro and in tumor cell grafts (A)
Immunoblotting for TNC in cultured NT193 control (shC) and TNC knockdown cells (sh1
and sh2). Loading control, α-tubulin. (B) Representative mosaic IF images of TNC
(green) in primary tumors, after engraftment of NT193 shC and TNC knockdown cells in
the mammary fat pad of TNC+/+ and TNC‐/‐ FVB mice, respectively. Scale bar: 1 mm.
(C) TNC score in the primary tumor of each grafting condition (see material and methods
242
for details). N = 6 mice for each grafting condition. (D) Tumor burden (g) of TNC+/+ and
TNC‐/‐ FVB hosts after engraftment of NT193 sh control (shC), sh1TNC and sh2TNC
cells (shC in TNC +/+ mice (N = 12); sh1TNC in TNC +/+ mice (N = 10); sh2TNC in TNC
+/+ mice (N = 14); shC in TNC -/- mice (N = 13); sh1TNC in TNC -/- mice (N = 10);
sh2TNC in TNC -/- mice (N = 9). Mean ± SEM.
243
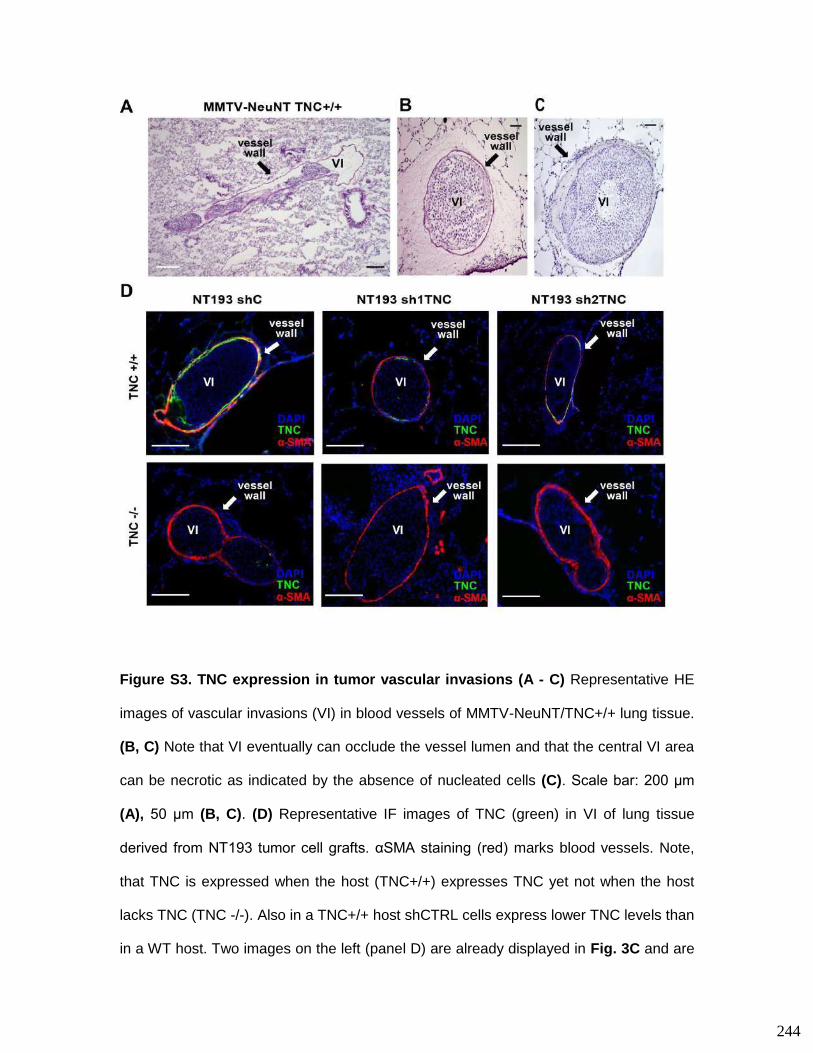
Figure S3. TNC expression in tumor vascular invasions (A - C) Representative HE
images of vascular invasions (VI) in blood vessels of MMTV-NeuNT/TNC+/+ lung tissue.
(B, C) Note that VI eventually can occlude the vessel lumen and that the central VI area
can be necrotic as indicated by the absence of nucleated cells (C). Scale bar: 200 μm
(A), 50 μm (B, C). (D) Representative IF images of TNC (green) in VI of lung tissue
derived from NT193 tumor cell grafts. αSMA staining (red) marks blood vessels. Note,
that TNC is expressed when the host (TNC+/+) expresses TNC yet not when the host
lacks TNC (TNC -/-). Also in a TNC+/+ host shCTRL cells express lower TNC levels than
in a WT host. Two images on the left (panel D) are already displayed in Fig. 3C and are
244
shown here again for comparison of TNC expression between the six conditions. Scale
bar: 100 μm.
245
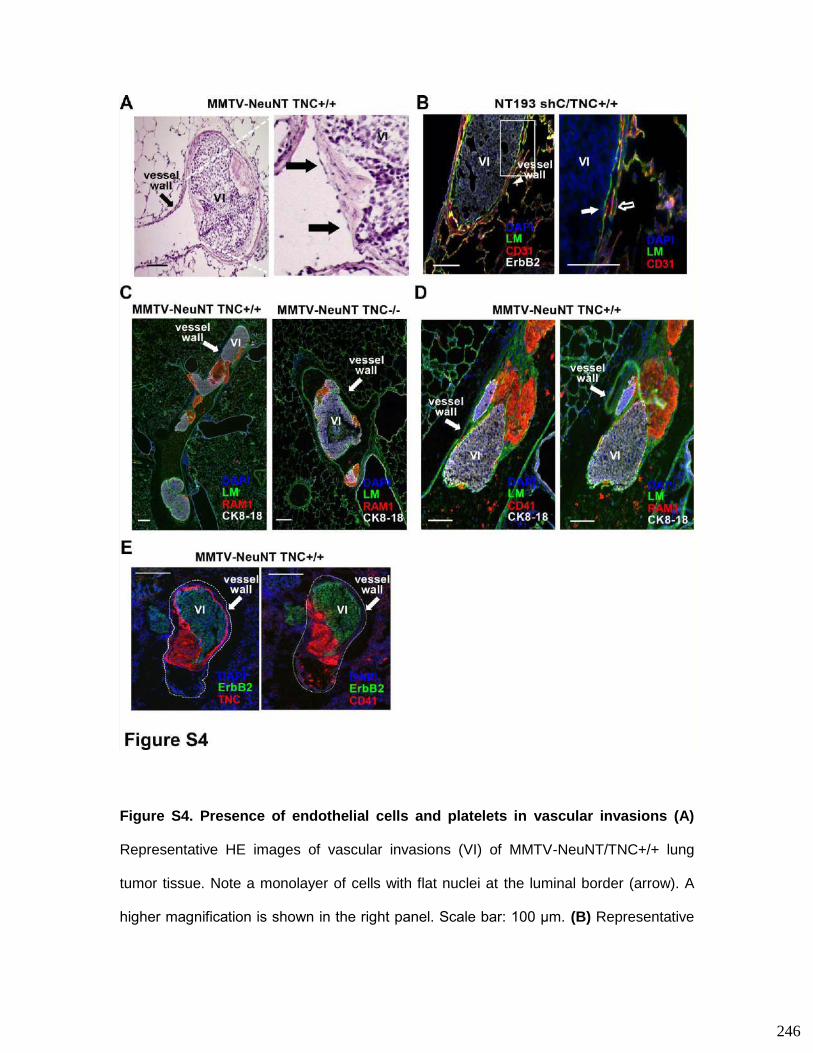
Figure S4. Presence of endothelial cells and platelets in vascular invasions (A)
Representative HE images of vascular invasions (VI) of MMTV-NeuNT/TNC+/+ lung
tumor tissue. Note a monolayer of cells with flat nuclei at the luminal border (arrow). A
higher magnification is shown in the right panel. Scale bar: 100 μm. (B) Representative
246
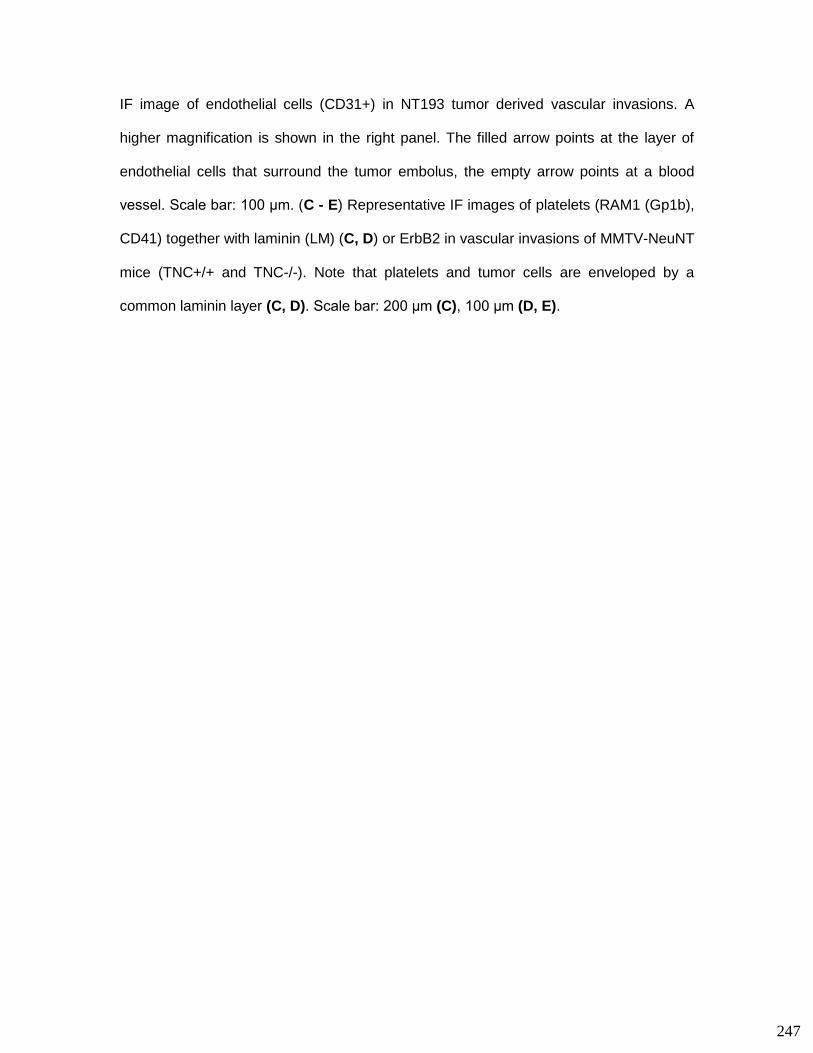
IF image of endothelial cells (CD31+) in NT193 tumor derived vascular invasions. A
higher magnification is shown in the right panel. The filled arrow points at the layer of
endothelial cells that surround the tumor embolus, the empty arrow points at a blood
vessel. Scale bar: 100 μm. (C - E) Representative IF images of platelets (RAM1 (Gp1b),
CD41) together with laminin (LM) (C, D) or ErbB2 in vascular invasions of MMTV-NeuNT
mice (TNC+/+ and TNC-/-). Note that platelets and tumor cells are enveloped by a
common laminin layer (C, D). Scale bar: 200 μm (C), 100 μm (D, E).
247
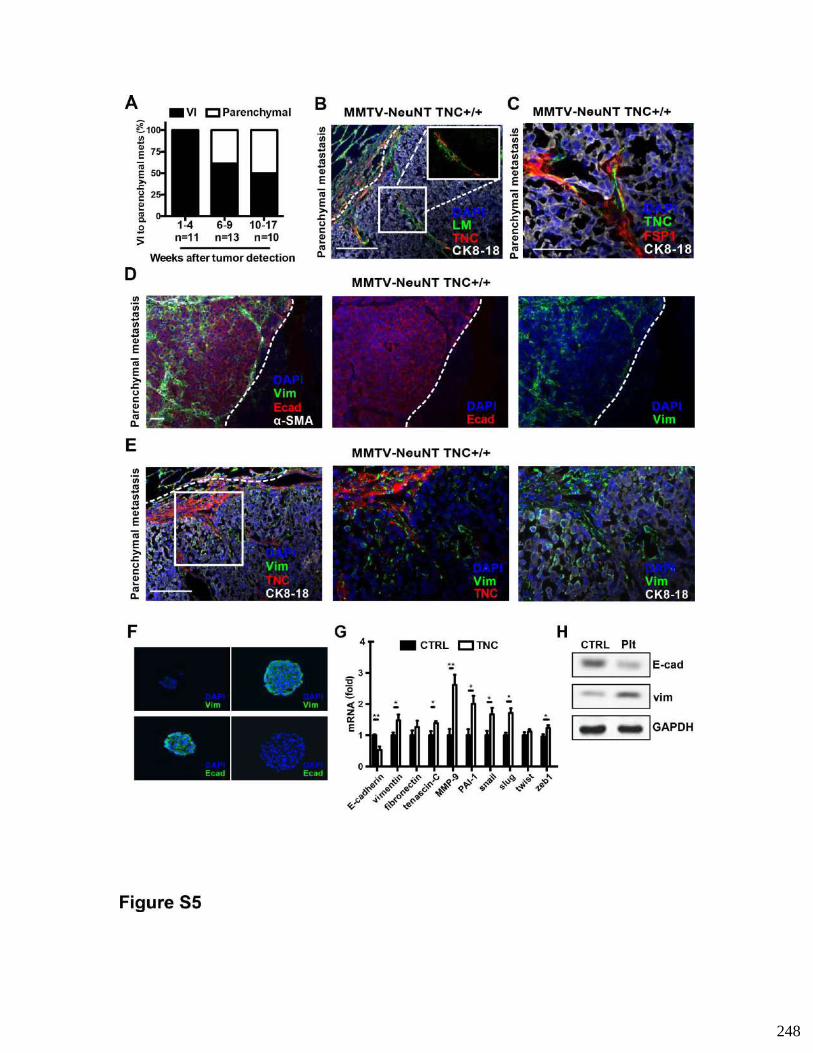
248
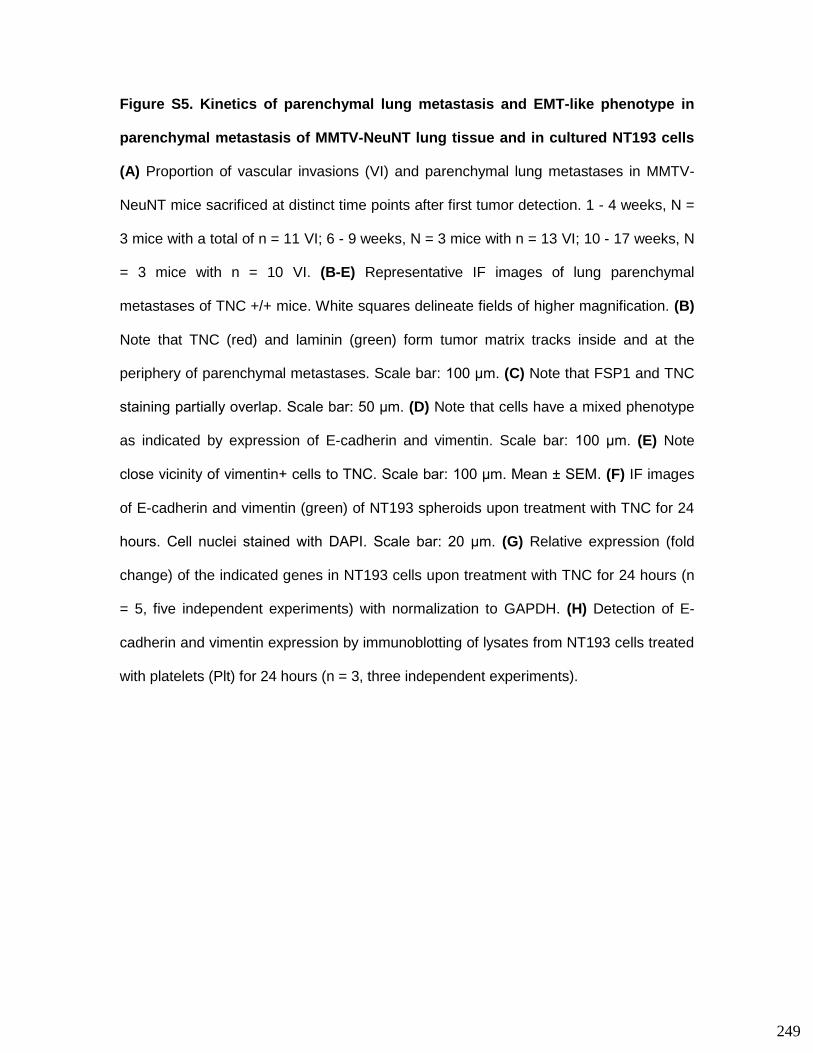
Figure S5. Kinetics of parenchymal lung metastasis and EMT-like phenotype in
parenchymal metastasis of MMTV-NeuNT lung tissue and in cultured NT193 cells
(A) Proportion of vascular invasions (VI) and parenchymal lung metastases in MMTV-
NeuNT mice sacrificed at distinct time points after first tumor detection. 1 - 4 weeks, N =
3 mice with a total of n = 11 VI; 6 - 9 weeks, N = 3 mice with n = 13 VI; 10 - 17 weeks, N
= 3 mice with n = 10 VI. (B-E) Representative IF images of lung parenchymal
metastases of TNC +/+ mice. White squares delineate fields of higher magnification. (B)
Note that TNC (red) and laminin (green) form tumor matrix tracks inside and at the
periphery of parenchymal metastases. Scale bar: 100 μm. (C) Note that FSP1 and TNC
staining partially overlap. Scale bar: 50 μm. (D) Note that cells have a mixed phenotype
as indicated by expression of E-cadherin and vimentin. Scale bar: 100 μm. (E) Note
close vicinity of vimentin+ cells to TNC. Scale bar: 100 μm. Mean ± SEM. (F) IF images
of E-cadherin and vimentin (green) of NT193 spheroids upon treatment with TNC for 24
hours. Cell nuclei stained with DAPI. Scale bar: 20 μm. (G) Relative expression (fold
change) of the indicated genes in NT193 cells upon treatment with TNC for 24 hours (n
= 5, five independent experiments) with normalization to GAPDH. (H) Detection of E-
cadherin and vimentin expression by immunoblotting of lysates from NT193 cells treated
with platelets (Plt) for 24 hours (n = 3, three independent experiments).
249

250

Figure S6. Cellular plasticity in MMTV-NeuNT vascular invasions (A, B)
Representative IF images of vimentin+ (green) and ErbB2+ (red) cells in vascular
invasions of lung tissue from MMTV-NeuNT TNC +/+ (N = 6 mice, n = 20 VI) (A) and
TNC ‐/‐ mice (N = 4 mice, n = 15 VI) (B). Scale bar: 100 μm.
251

Figure S7 Vascular invasions in blood vessels of human cancer are characterized
by endothelial cells and TNC expression Consecutive tissue sections from human
252

RCC, HCC and PNET were stained for HE, CD31 and TNC. Representative images
including mosaic images (upper image in A and B) are shown that demonstrate filling of
the invaded vessels (veins) (filled arrows). Note that vascular invasions (VI) are
surrounded by a luminal endothelial monolayer and express TNC beneath the
endothelial layer (open arrows). Scale bar represents 50 μm.
253
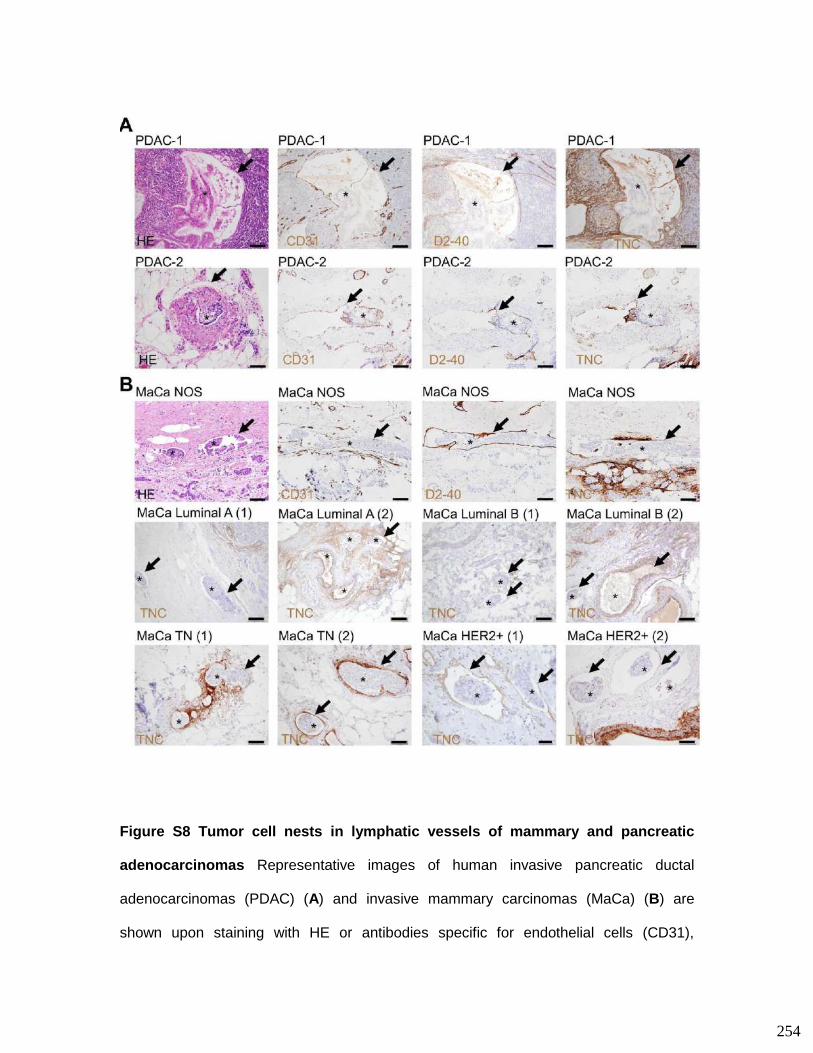
Figure S8 Tumor cell nests in lymphatic vessels of mammary and pancreatic
adenocarcinomas Representative images of human invasive pancreatic ductal
adenocarcinomas (PDAC) (A) and invasive mammary carcinomas (MaCa) (B) are
shown upon staining with HE or antibodies specific for endothelial cells (CD31),
254
lymphatic vessels (D2-40) and TNC, respectively. Arrow points at infiltrated lymphatic
vessel. As the tumor cell nests are found in lymphatic vessels they are desginated as
lymphovascuar invasions (LVI) and marked with a star. Note that LVI are not enveloped
by an endothelial monolayer, nor express TNC whereas the lymphatic vessel or the
surrounding tissue can abundantly express TNC. Scale bars are 20 μm (Her2+ (1), TN
(2)), 50 μm (PDAC (1), Luminal A (1/2), Luminal B (1/2), TN (1), Her2+ (2)) and 100 μm
(PDAC (2), MaCa).
255

Appendix II
256
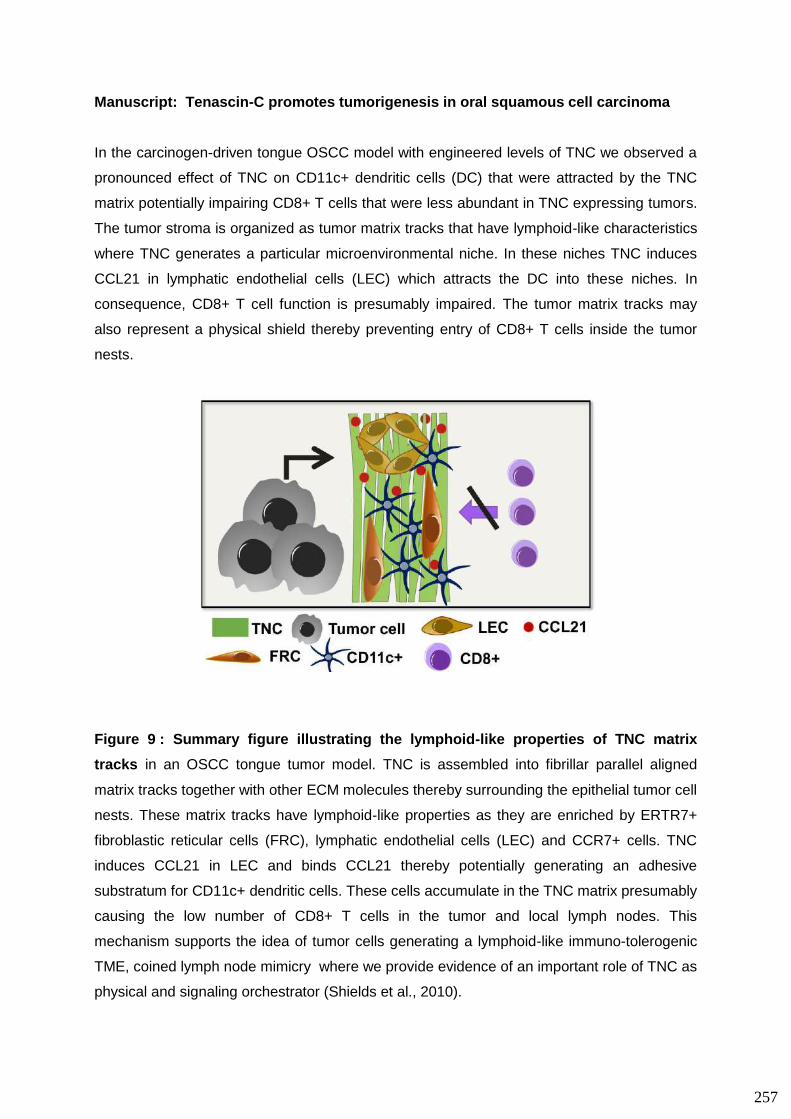
Manuscript: Tenascin-C promotes tumorigenesis in oral squamous cell carcinoma In the carcinogen-driven tongue OSCC model with engineered levels of TNC we observed a
pronounced effect of TNC on CD11c+ dendritic cells (DC) that were attracted by the TNC
matrix potentially impairing CD8+ T cells that were less abundant in TNC expressing tumors.
The tumor stroma is organized as tumor matrix tracks that have lymphoid-like characteristics
where TNC generates a particular microenvironmental niche. In these niches TNC induces
CCL21 in lymphatic endothelial cells (LEC) which attracts the DC into these niches. In
consequence, CD8+ T cell function is presumably impaired. The tumor matrix tracks may
also represent a physical shield thereby preventing entry of CD8+ T cells inside the tumor
nests.
Figure 9 : Summary figure illustrating the lymphoid-like properties of TNC matrix
tracks in an OSCC tongue tumor model. TNC is assembled into fibrillar parallel aligned
matrix tracks together with other ECM molecules thereby surrounding the epithelial tumor cell
nests. These matrix tracks have lymphoid-like properties as they are enriched by ERTR7+
fibroblastic reticular cells (FRC), lymphatic endothelial cells (LEC) and CCR7+ cells. TNC
induces CCL21 in LEC and binds CCL21 thereby potentially generating an adhesive
substratum for CD11c+ dendritic cells. These cells accumulate in the TNC matrix presumably
causing the low number of CD8+ T cells in the tumor and local lymph nodes. This
mechanism supports the idea of tumor cells generating a lymphoid-like immuno-tolerogenic
TME, coined lymph node mimicry where we provide evidence of an important role of TNC as
physical and signaling orchestrator (Shields et al., 2010).
257
Tenascin-C promotes tumorigenesis in oral squamous cell carcinoma
Caroline Spenlé1*, Thomas Loustau 1*, Devadarssen Murdamoothoo1, Pierre Bourdely2,
William Erne1, Hélène Burckel5, Alexandre Mariotte1, Gérard Cremel1, Stephanie Beghelli-de
la Forest Divonne3,4, Anne Sudaka3,4, Nouhen K3,4, Sebastian Schaub3,4, Rekima S3,4, Annick
Klein1, Christiane Arnold1, Philippe Georgel1, Michael van der Heyden1, Georges Noel5,
Fabienne Anjuère2+, Ellen Van Obberghen-Schilling3,4 + and Gertraud Orend G+
* equal contribution
+ equal corresponding authors
Address correspondence to Gertraud Orend, INSERM U1109, ImmunoRhumatologie
Moléculaire (IRM), HOPITAL CIVIL, Institut d'Hématologie et d'Immunologie, 1, Place de l'Hôpital,
67091 Strasbourg, France, phone (direct): 0033 (0) 3 68 85 39 96, [email protected],
https://u1109.wordpress.com/tumor-micro-environment/
1 Université Strasbourg, INSERM U1109- MN3T, The Microenvironmental Niche
in Tumorigenesis and Targeted Therapy, and The Tumor Microenvironment laboratory,
Hopital Civil, Institut d'Hématologie et d'Immunologie, Fédération de Médecine
Translationnelle de Strasbourg (FMTS), Strasbourg, France
2 Université Côte d’Azur, CNRS, IPMC, Valbonne-Sophia Antipolis, France
3 Université Côte d’Azur, CNRS, INSERM, iBV, France
4 Centre Antoine Lacassagne, Nice 06189, France
5 Centre Paul Strauss, Strasbourg, France
258

Running title : Tenascin-C promotes oral squamous cell carcinoma
Keywords : Tumor microenvironment, extracellular matrix, tenascin-C, oral squamous cell
carcinoma, radiotherapy
259
Abstract (250 words)
In the tumor microenvironment (TME) of head and neck tumors (HNSCC) the tumor
promoting extracellular matrix (ECM) molecule tenascin-C (TNC) is highly expressed. Yet,
how TNC impacts HNSCC is largely unknown. Therefore, we employed a carcinogen
(4NQO)-induced murine tongue tumor model (OSCC) with abundant and no TNC and
observed that TNC increases OSCC number, size and invasiveness and, impacts the
immune cell infiltrate. Whereas TNC reduced total leukocyte numbers, Tregs were more
abundant, suggesting a switch towards an immuno-tolerogenic TME. This correlates with
poor dendritic cell (DC) infiltration of local lymph nodes. We demonstrate organization of
TNC into tumor matrix tracks inside the stroma and describe their lymphoid-like properties.
Whereas in WT tumors, DC poorly entered the tumor cell nests and mostly remained inside
the matrix, they significantly invaded the tumor cell nests in the absence of TNC. Induction of
CCL21 and, CCL21 binding to TNC could explain the observed attraction and adhesion of
DC to TNC in vitro and in vivo. As tumor relapse represents a major problem upon
radiotherapy we investigated OSCC upon irradiation and observed tumor regression
accompanied by induction of TNC and, enforcement of the described lymphoid-like TME in
the remaining tumor tissue. Relevance for the human disease is presented as leukocytes
preferentially localize in TNC-rich stromal areas of HNSCC. Also, high TNC correlates with
earlier tumor relapse upon radiotherapy. Altogether, TNC may be a driver of an immuno-
tolerogenic lymphoid-like TME with a potential implication in rebound effects upon
radiotherapy where CCL21 could be a target.
260
Introduction
Head and neck squamous cell carcinomas (HNSCC) are heterogeneous malignancies that
arise in mucosal epithelia of the upper aero-digestive tract. Survival rates in Europe for
patients with HNSCC are only 42% at 5 years (Grégoire et al., 2010). At least two genetic
subclasses of HNSCCs can be distinguished, HPV-negative carcinomas and HPV-positive
(mainly oropharyngeal) carcinomas which display improved clinical outcomes. For these
tumors to develop and expand, malignant cells must overcome growth inhibitory signals from
the surrounding tissue and escape immune surveillance mechanisms that repress cancer
progression. This is achieved by promoting the conversion of the physiological
microenvironment to a pro-tumoral state. Pro-tumoral conversion of the microenvironment is
accompanied by major changes in the extracellular matrix (ECM), including the upregulation
of certain ECM components that regulate cell adhesion/migration, distribution, activation and
bioavailability of growth, angiogenic and immunomodulatory factors. Tenascin-C (TNC) is
one such molecule that has been found to impact the progression of several tumor types
through regulation of multiple cancer hallmarks including survival, proliferation, invasion,
metastasis, angiogenesis and chronic inflammation (Chiquet-Ehrismann et al., 2014;
Midwood et al., 2011, 2016). We have recently identified TNC as one of the major matrix
proteins upregulated in the ECM of HNSCC-associated fibroblasts (Gopal et al., 2017), yet
the precise roles of TNC in this disease have not yet been investigated.
In non-tumoral contexts TNC can activate an immune response by serving as a danger
associated molecular pattern (DAMP) molecule, as recently described in rheumatoid arthritis
where TNC binding to integrin and TLR4 triggers expression of pro-inflammatory
cytokines and more severe inflammation (Midwood et al., 2009). Although TNC is mostly
absent in normal tissues, it has been identified in reticular fibers of lymphoid tissues such as
the thymus where it was proposed to regulate leukocyte maturation (Drumea-Mirancea et al.,
2006). In cancer tissue, including insulinoma, colorectal carcinoma, glioma and breast cancer
261
(Rupp et al., 2016; Spenlé et al., 2015; Sun et al., submitted), we have observed TNC in
matrix tracks that share certain features with reticular fibers and may play a role in targeting
immune cell functions in cancer tissue (Midwood et al., 2011, 2016; Orend et al., 2014).
HNSCC is an immunosuppressive disease (Ferris, 2015). Hence, immunomodulatory
therapies that overcome immune suppressive signals in patients with HNSCC have
therapeutic promise. Indeed, several strategies that aim to restore antitumor immunity are
currently under investigation in HNSCC. Among these, targeting the immune-checkpoint
receptors or their ligands has shown clinical efficacy with durable long-lasting effects (Ferris,
2015; Sharma and Allison, 2015). However, only a fraction of patients (roughly 20%)
respond. Hence, much progress is needed to improve our understanding of interactions
between tumor cells and their host immune system, and in particular how immune cells
interact physically and functionally with the neoplastic stroma in HNSCC, in order to predict
treatment response and to provide a rational design for development of effective treatment
combinations.
In the present study we used a carcinogen driven murine model with abundant or absent
TNC to address the roles of TNC in squamous cell carcinomas of the oral cavity (OSCC).
This is an interesting in vivo immunocompetent model for analyzing the mechanisms
underlying carcinogen-induced reprogramming of the stromal environment and its
consequence in head and neck cancer. It recapitulates the human disease with respect to
histological features that characterize early steps of tumor progression in the tongue
including dysplasia, in situ carcinomas and invasive carcinomas. Moreover, it displays
genetic alterations similar to those observed with smoking exposure in HNSCC (Chung et al.,
2004) and sequential changes in gene expression with relevance for human OSCC (Foy et
al., 2016). Yet, this model has not been used so far to investigate the impact of the TME in
OSCC. Here, we identified TNC as an important molecule of the TME of OSCC. Comparison
of tumors in wildtype (WT) and TNC knockout (TNCKO) mice allowed us to demonstrate a
262
role for TNC in OSCC progression and suggest a mechanism by which the TNC-rich tumor
matrix generates a lymphoid like tumor microenvironment (TME) with immuno-tolerogenic
characteristics. We show that TNC in the tumor matrix tracks regulates the crosstalk with
CCL21 and, positioning of infiltrating tumor-associated leukocytes thereby facilitating escape
from immunosurveillance. This mechanism may provide targeting opportunities and, in
addition is relevant in human HNSCC where a high TNC expression correlates with earlier
tumor relapse upon radiotherapy.
263
Results
Human and mouse 4NQO-induced OSCC are associated with TNC upregulation
In non-tumoral human tongue tissue, TNC was barely expressed with a weak staining limited
to the basement membrane and lamina propria (Fig. 1A). In all human OSCC examined,
TNC expression was strongly upregulated in the tumor stroma region delaminated by the
lamina propria and basement membrane and, intimately close to the cancer cells. TNC
staining was often intense in the stroma between tumor epithelial islets (or nests) and
showing specific organization with dense aligned tracks of ECM encapsulating areas of
cohesive tumor epithelial cells. TNC was only rarely expressed in tumor epithelial cells (Fig.
1A).
To mimic the human OSCC pathological state in an immune-competent murine model we
employed 4-Nitroquinoline 1-oxide (4NQO) to induce squamous cell carcinomas in the
mucosal epithelial lining of the oral cavity of C57Bl6 mice. 4NQO is the most frequently used
carcinogen for induction of OSCC and causes DNA adduct formation thus mimicking the
effect of tobacco carcinogens (Kanojia and Vaidya, 2006). 4NQO induces premalignant and
malignant lesions mainly in the tongue and esophagus when applied at low concentration
through drinking water (Fig. S1A, B). This model recapitulates the human disease with
respect to histological features of each tumor progression step in the tongue, including
intraepithelial dysplasia, in situ carcinomas and invasive tumors (Fig. S1C). While its
expression was very low or absent in tongue epithelium of non-treated mice, TNC expression
became upregulated in the stroma area of 4NQO-induced OSCC (Fig. 1B).
Tenascin-C is organized in tumor matrix tracks and enhances OSCC onset and
progression
As TNC was expressed in the 4NQO-induced tumors we asked whether TNC had an impact
on tumorigenesis in this model by comparing tumor formation in WT mice with that in TNC
knockout (KO) mice. Whereas both genotypes developed tongue tumors (100% penetrance)
264
after exposure to 4NQO, TNCKO mice presented a reduced number of tumors with on
average of one tumor per mouse in comparison to two tumors in WT mice (Fig. 1C). In the
absence of TNC, tongue tumors were significantly smaller than in WT mice (Fig. 1D, E).
Moreover, TNCKO mice did not develop invasive carcinomas, whereas a fraction of tumors
in WT mice (18%) were invasive (Fig. 1F).
By immunofluorescence staining (IF) we characterized the carcinogen-induced tumors and
their stroma (Fig. 1G and S1D). We found TNC to be organized in tumor matrix tracks
together with other ECM molecules as laminin (LM), coll IV and fibronectin (FN) (Fig. 1C).
These matrix niches, also rich in FSP1+ and αSMA+ cells, are separating areas of p63
positive tumor epithelial cells. Tumors were mostly differentiated adenocarcinomas as they
expressed E-cadherin and no vimentin. They were highly vascularized as seen by CD31
staining. No difference in cell survival was apparent between genotypes after staining for
cleaved-caspase 3 (Fig. S1D).
TNC regulates loco-spatial distribution of leukocytes and dendritic cells
Given that TNC plays a role in inflammation and that HNSCC are inflammatory cancers, we
determined a potential impact of TNC on immune cell infiltration of the 4NQO-induced tumors
by FACS. We observed significantly less leukocytes in tumors of TNC-expressing mice (Fig.
2A). WT tumors contained in particular less cells positive for MHC class II and CD8. The
abundance of other immune cell types was not statistically significantly affected by TNC (Fig.
2A, S2A). As lymph nodes play an important role in staging an immune response, by FACS
we determined the immune cell infiltrate of local lymph nodes from 4NQO-induced tumor
bearing mice. We observed an impact of TNC on CD11c+ DC and CD8+ T cells that were
less abundant in lymph nodes from WT in comparison to TNCKO mice (Fig. 2B, S2B). We
confirmed this observation by IF staining showing less CD45+ and CD11c+ cells in the lymph
nodes of the WT mice (Fig. 2C, S2C). This result suggests that TNC may be involved in
impairing priming of DC and, potentially inactivating CD8+ T cell expansion. In contrast to the
265
local lymph nodes we did not see any difference in immune cell abundance in the spleens
from tumor bearing mice of both genotypes (Fig. S2D-G).
To address how TNC may impact leukocytes, we investigated the loco-spatial distribution of
CD45+ and CD11c+ cells in non-invasive tumors of both genotypes by IF. This experiment
indeed revealed that TNC impacted CD45+ leukocyte infiltration, as CD45+ cells were
preferentially present within the TNC-rich stromal areas in comparison to the tumor nests that
were largely devoid of CD45+ cells. In the absence of TNC, more CD45+ leukocytes
infiltrated the transformed epithelium of the tumors (Fig. 3A, B). Similarly, we found CD11c+
cells highly enriched in the TNC-rich stromal areas of WT tumors with only few cells inside
the tumor cell nests. This was particularly prominent in an invasive WT tumor, where we
observed that CD11c+ cells were exclusively located in the TNC matrix (Fig. S3A). Yet, in
TNCKO tumors significantly more CD11c+ cells infiltrated the tumor cell nests (Fig. 3C, D).
Altogether, these observations suggest that TNC may attract and potentially sequester
leukocytes, and in particular CD11c+ DC in the stroma, thereby blocking their entry into the
tumorigenic epithelium and also their egress into the local lymph nodes.
In human tongue tumors CD45+ leukocytes are also preferentially localized in TNC-
rich stroma
We next sought to examine the loco-spatial organization of infiltrating immune cells in human
tumors. To do so, CD45 staining was performed on a set of 10 primary tongue tumors (Table
S1). Well differentiated, p16 negative, fibrotic and inflammatory tumors of the tongue were
selected to most closely resemble those observed in the mouse OSCC model. We chose to
carry out staining on large tumor sections encompassing both the tumor and peritumoral
regions (Fig. S3B, C), rather than on small tissue cores of carcinoma lobules in order to
include staining of the fibrotic and inflammatory stromal compartment. Moreover, large
sections allowed for a more complete examination of morphological features and to include
heterogeneity of the tumors. For quantitative analysis, regions designated as tumor or stroma
(based on histological criteria) were traced by a pathologist on 3 representative fields from
266

each tumor section. A typical example is displayed (Fig. S3B, C). Across this set of tumors,
tumor and stromal regions corresponded to 43% and 57% respectively of the total surface.
CD45 staining in tumor and stromal regions was quantified, as detailed in the experimental
procedures. CD45-staining covered 25% of the stromal regions whereas only 4% of the
surface was stained in the tumor nest regions (Fig. 3E, F, S3D). TNC staining was
performed on adjacent tumor sections to visualize expression levels, organization and spatial
distribution of matrix proteins with respect to the infiltrating CD45+ cells. All tumors displayed
high levels of TNC in the stroma (Fig. 3E, S3C). As previously reported (Spenlé et al.,
2015a), TNC was commonly organized in fibrillar tracks and, CD45+ cells appeared to be
captured in these TNC matrix tracks (Fig. 3E, S3C). We conclude from the analysis of
human OSCC that tumor-infiltrating leukocytes are preferentially located in TNC-enriched
stromal zones, similar to what we had seen in the carcinogen-induced tumors of the mouse.
Through induction of CCL21 and CCR7, TNC impacts adhesion of dendritic cells
As the chemokine CCL21 and its receptor CCR7 play a role in immune tolerance of the
lymph node (ref) and have been implied in cancer (Shields, 2010, other paper Swartz lab) we
investigated the expression of CCL21 and CCR7 by qRTPCR in the 4NQO-induced OSCC.
We observed that both molecules are more expressed at mRNA level in WT than in TNCKO
tumors (Fig. S4A). This result was confirmed at protein level by tissue staining, where we
found CCL21 and CCR7 predominantly expressed in the TNC matrix tracks of the WT
tumors. In contrast, CCL21 and CCR7 were barely detectable in TNCKO tumors (Fig. 4A-D).
We investigated whether tumor cells may be a source of CCL21 as previously shown in
another study (Shields 2010). Therefore, we used our newly established tumorigenic
epithelial OSCC cell line from an invasive 4NQO-induced tumor (Spenlé et al., in
preparation). Upon treatment with TNC we investigated CCL21 and CCR7 expression by
qRTPCR and observed that OSCC cells do not express CCL21 (data not shown). In contrast,
they express CCR7 and, TNC increased CCR7 levels in these cells (Fig. 4E). In search of
the cellular source, we did co-staining of CCL21 with markers for fibroblasts (ERTR7, FSP1,
267
SMA) or lymphatic endothelial cells (LEC) and, observed a complete signal overlap in LEC
but not with other cells (Fig. 4F, data not shown). Moreover, in TNCKO tumors LEC only
poorly expressed CCL21 (Fig. 4F). To confirm that TNC induces CCL21 in LEC, we
incubated hLEC with purified TNC and determined CCL21 expression by qRTPCR. This
experiment confirmed that TNC can induce CCL21 mRNA levels in LEC (Fig. 4G). As TNC
was shown to bind soluble molecules (De Laporte et al., 2013; Martino et al., 2014) we
determined a potential interaction by surface plasmon resonance spectroscopy and,
discovered that CCL21 binds TNC with a Kd of 5.8 x 10⁻⁸ M that is lower than CCL21 binding
to CCR7 (Fig. 4H) (Lanati et al., 2010). Next, in a Boyden chamber migration assay we
compared attraction of bone marrow derived DC (BMDC) towards FN, TNC or a combination
of both substrata. We found that in combination with FN, TNC attracted BMDC (Fig. 4I).
Altogether these results suggest that TNC attracts DC where CCL21 and in particular its
binding to TNC may be relevant.
TNC impacts the generation of a lymphoid-like stroma with immuno-tolerogenic
properties
So far we have shown that TNC attracts DC into the ECM-rich stromal area of the tumor,
where LEC express CCL21. CCL21 may be involved in attracting DC in vivo into the stromal
areas as we have seen attraction of DC by TNC in vitro. Now, we decided to explore in more
detail the composition of the TNC-rich TME of the 4NQO-induced tumors. We investigated
the abundance of fibroblast reticular cells (FRC), usually present in secondary lymphoid
organs such as lymph nodes (Katakai et al., 2004) by staining for ERTR7 and, observed a
selective and high abundance of these cells inside the TNC matrix (Fig. 5A, B). We also
stained for gp38/podoplanin, a marker of lymphatic endothelial cells (LEC) and FRC, and
observed expression in the TNC-rich stroma (Fig. 5C,D). In TNCKO tumors, these cells were
also present in the stromal areas but the signal intensity was reduced. Upon quantification
we confirmed less abundant ERTR7+ and gp38+ cells in the TNCKO tumors (Fig. 5B, D).
Next, we measured the expression of immune cell markers and cytokines on extracted
268
OSCC tumors by qRTPCR. In presence of TNC, we found a significant increase in mRNA
levels Foxp3 that can be expressed by Treg, as well as of TGFβ and IL-10, which are anti-
inflammatory cytokines that again can be produced by Treg (ref). In contrast, the mRNA
levels of pro-inflammatory cytokines produced by mature T cells such as IL-12 and IL-4, were
reduced in tumors from WT mice in comparison to TNCKO mice (Fig. 5E). We also found a
combined linear positive correlation of expression of CCL21 with TGF, and IL10, and a
linear negative correlation of CCL21 with IL12 which suggests a potential interdependence
and link to TNC (Fig. 5F-H, S5). Altogether, we have shown that the stromal areas in OSCC
are characterized by the lymph node markers CCL21, CCR7, gp38 and ERTR7 and, that
they express LM2, FN, Coll IV and TNC. These ECM molecules were previously described
as constituents of reticular fibers in the thymus suggesting that the TNC-rich stroma in
tumors may have similar properties as e.g. impacting immune cell education in an immuno-
tolerogenic microenvironment (Drumea-Mirancea et al., 2006). This possibility is now
supported by our results that showed that TNC affected positioning of DC away from the
tumor cells inside the TNC rich stroma and upregulated immunosuppressive soluble factors.
Impact of radiotherapy
Radiotherapy is regularly used to treat OSCC tongue tumors that are inherently difficult to
completely resect by surgery. Irradiation induces a proinflammatory tissue response and may
trigger rebound effects (Spenlé et al., 2015b). But since only few tumor models exist to
investigate the impact of irradiation on the TME, here we established a radiotherapy protocol
for the carcinogen-induced tumor mice. We locally irradiated the lower part of the heads of
the mice at 16 weeks after exposure to 4NQO, where we already observed lesions in some
of the tongues, with one shot of 2Gy, sacrificed the mice at the end of the protocol and
investigated the remaining tumor tissue. We observed that WT mice had on average only
one tumor left after irradiation. Also the size of the remaining tumors was reduced, altogether
suggesting that this treatment had caused tumor regression (Fig. 6A, B). That the applied
dose of 2Gy irradiation was efficient, was also indicated by reduced proliferation in the
269
irradiated tumors (Fig. 6D). By staining for TNC, we noticed that its expression was higher in
the irradiated tumors (Fig. 6D). As TNC impacted the abundance of ERTR7+ FRC, we
examined the remaining tumor tissue by IF. Indeed expression of ERTR7 also appeared to
be enhanced (Fig. 6E). We observed also an accumulation of CD45+ and CD11c+ cells in
the stroma of WT tumors with a similar pronounced stroma-to-tumor-nest ratio as in the non-
irradiated tumors suggesting that the properties of the tumor stroma is preserved upon
irradiation (Fig. S6A, B). Finally we noticed that upon irradiation the fraction of invasive
tumors was increased, indicating that those tumors that were not destroyed now may
progress faster (Fig. S6C). These results suggest that this model can be used to address the
impact of gamma irradiation on tumor destruction and its impact on the TME. Our results
suggest that the lymphoid-like TME is not destroyed but rather enhanced upon radiotherapy
which could explain the more invasive phenotype of the remaining tumors.
Surprisingly, in TNCKO mice no effect on tumor numbers nor size was seen which correlated
with similar Ki67 staining intensities with and without irradiation (Fig. 6B,C, Fig. S6D).
Moreover, we did not see any obvious difference in ERTR7 staining between irradiated and
non-irradiated TNCKO tumors (Fig. S6E) nor a change in the higher abundance of CD45+
and CD11c+ cells in the stroma in comparison to the WT tumors (Fig. S6A, B). Finally, we
noticed more non-differentiated tumors upon irradiation suggesting that irradiation may have
had some effect on these tumors.
Finally, we asked whether our observations in murine OSCC have relevance for human
HNSCC. Therefore, we investigated TNC expression in a cohort of HNSCC patients that had
received radiotherapy where gene expression results are available from the relapsed tumors.
We observed that TNC levels above the median correlate with earlier tumor relapse (Fig.
6F). Thus our results derived from the OSCC model may have relevance for HNSCC.
Discussion
The TME largely impacts tumor malignancy and potentially therapy outcome in HNSCC, yet
we lack the molecular and mechanististic insight to better understand the roles of the TME in
270
this disease. Such information could be important to improve HNSCC therapy and patient
survival. The lack of good in vivo models that allow recapitulating the impact of the TME in
the human disease is also contributing to our poor knowledge. Here, we applied a well-
established carcinogen-induced tongue tumor model and analyzed the cellular and matrix
content of the TME and compared the results to human HNSCC. We confirmed published
results that whereas most of the murine carcinogen-induced adenocarcinomas are not
invasive, a few had invasive properties as seen in human HNSCC. The murine tumors were
also highly infiltrated by immune cells resembling human HNSCC. In addition, the general
organization of HNSCC into stromal areas surrounding tumor epithelial cell nests, as well as
high proliferation and vascularization was also recapitulated in the murine tumors. The
stromal areas were characterized by numerous fibroblasts expressing FSP1 or SMA, again
mimicking high abundance of fibroblasts in the stroma of the human tumors. We also found
that TNC is highly expressed in the stromal areas of the carcinogen-induced tumors which
again mimics HNSCC (Brüsehafer et al., 2016) and in particular human OSCC as we had
shown here. Altogether, these observations suggest that the carcinogen-induced model
recapitulates important features of HNSCC, including expression of FN (Gopal et al., 2017)
and TNC. As TNC is a known promoter of tumor malignancy and is highly expressed in
HNSCC, TNC may play an important role in this malignancy as key determinant of the TME
(Midwood et al., 2016). To address this possibility we decided to use immune competent
mice expressing or lacking TNC to induce OSCC by 4NQO and investigate the roles of TNC
in tumorigenesis in detail. We observed that less and smaller tongue tumors occurred in the
absence of TNC which were not invasive, suggesting that TNC promotes tumorigenesis also
in this tumor model as was previously seen in other murine tumor models and in human
cancers (Midwood et al., 2016; Saupe et al., 2013; Sun et al., submitted)).
Previously we observed that in several analyzed tumors, TNC is expressed in fibrillar ECM-
rich stromal networks. In these networks, defined ECM molecules are expressed in parallel
aligned fibrillar arrays providing niches for tumor cells, fibroblasts and leukocytes (Spenlé et
al., 2015a). As the ECM molecules formed long contiguous fibrils, sometimes contacting
271
blood vessels with a connection to the blood circulation, we previously have hypothesized
that they may act as transportation routes or tracks, hence the name “tumor matrix tracks”
TMT (Spenlé et al., 2015a). We previously noted similarities of the tumor matrix tracks to
reticular fibers in the thymus (Drumea-Mirancea et al., 2006; Spenlé et al., 2015b). In the
tongue tumors now we also found that FN, Coll IV and LM2 are expressed together with
TNC in fibrillar arrays reminiscent of what we had seen as matrix tracks in other tumors
(Spenlé et al., 2015b). In the carcinogen-induced OSCC all stromal areas expressed TNC
which is different to human HNSCC where all stroma is enriched in FN but not always in TNC
(Gopal et al., 2017). This discrepancy may be linked to the heterogeneous causes of human
OSCC and frequent high bacterial infiltration that is not mimicked in the murine model. Here,
we provide novel information about the cellular content of these stromal niches. We found
that cells expressing the reticular fiber markers CCR7, CCL21, ERTR7 and gp38, exclusively
resided in the TNC rich stroma, supporting the observation that the tumor matrix tracks have
similarities with reticular fibers. We wanted to know whether the absence of TNC has an
impact on the organization of these niches and therefore investigated the TNCKO tumor
tissue. We found that ERTR7, gp38, CCR7 and CCL21 were less prominent in the absence
of TNC, suggesting that TNC may play a role in the composition and potentially, function of
the tumor matrix tracks.
In support of this possibility, we observed an impact of TNC on leukocyte infiltration. The
number of infiltrated leukocytes (as determined by FACS) was reduced in WT tumors in
comparison to TNCKO tumors. Whereas the large majority of leukocytes was accumulated in
the TNC rich stroma, only a few cells entered the tumor cell nests. This was in contrast to
tumors not expressing the TNC protein, where leukocytes were less abundant in the stroma,
but entered the tumor cell nests more numerously. We also saw less MHC II+ cells in the WT
tumors and in particular less CD11c+ cells, suggesting that in a WT tumor, antigen
presentation and priming of cytotoxic T cells (CTL) may be reduced. Indeed, we found less
CD8+ T cells in the WT tumors. Also in the local lymph nodes of the tumor mice we saw less
272
CD11c+ and CD8+ T cells compared to the TNCKO conditions. In addition, TNC does not
only lower the number of CD11C+ cells but also appears to attract them into the TNC-rich
matrix tracks where the majority of DC were found. Only a few DC entered the tumor cell
nests. This was again different in TNCKO tumors where less DC were present in the matrix,
and more prominent in the tumor cell nests.
Here, we identified a mechanism that can explain how TNC promotes attraction of DC inside
the tumor matrix tracks. TNC may regulate the loco-spatial abundance of DC through
CCL21. Several evidences support this hypothesis. First, by using in vitro assays we showed
that CCL21 attracted DC towards a TNC substratum. Second, we found that CCL21 directly
binds to TNC which may increase the local concentration of CCL21 in vivo. Third, TNC also
directly increases the expression of CCL21 in LEC as seen in vitro and in vivo. That TNC
may impact attraction of DC in OSCC is supported by less CCL21 and fewer DC in the
stromal areas of the TNCKO tumors.
Previously, it was published that some tumor cells can generate a lymphoid-like immuno-
tolerogenic TME, a phenomenon that was called “lymph node mimicry”. The authors linked
these features to high expression of CCL21, which facilitated escape from immune
surveillance (Shields et al., 2010). The authors further described the lymphoid-like TME to
express CCR7, ERTR7 and gp38 and, to have immunosuppressive features. The authors
interpreted these observations that tumor cells hide themselves in a lymphoid-like and
immunosuppressive TME that they generate around themselves by expressing CCL21. But
nothing was known about the ECM in this lymphoid-like TME. Our results shed new light on
this concept where we demonstrate that TNC together with other ECM molecules form
niches with lymphoid-like properties, the tumor matrix tracks, and that TNC is an essential
molecule in defining the immunological properties of these niches by attracting leukocytes
and in particular DC inside the tumor matrix tracks. As in Shields et al., (2010) CCL21 and
CCR7 could be relevant in the OSCC model, as TNC increased expression of both
273
molecules. Yet, in the OSCC model LEC are the sole source of CCL21 and not the tumor
cells as previously described (Shields 2010). A particular difference to the study by Shields et
al., (2010) is the kinetics. In the carcinogen driven OSCC model tumors develop over 20
weeks which is different to the previously used grafting models that allow much less time for
tumor development. One could easily imagine that this has an impact on the organization
and subsequent function of the TME.
Altogether, our results suggest that TNC is impacting tumor immunity in OSCC at multiple
levels. TNC negatively regulates the number of innate (DC) and adaptive (CD8+ T cells)
immune cells and presumably reduces priming of effector cells in the lymph nodes. TNC may
also enhance the number of immunosuppressive Treg, thereby potentially supporting an
immuno-tolerogenic stroma. This has to be investigated in more detail in the future.
Moreover, TNC facilitates attraction of DC in the stromal tumor matrix niches thereby
physically separating them from the tumor cells. Our results suggest that TNC is an important
factor in the described lymph node mimicry likely enhancing escape from immune
surveillance (Fig. 6G).
Besides surgical removal radiotherapy represents the major treatment of HNSCC, but often
tumor relapse is observed. It is well known that radiotherapy induces an inflamed TME where
TNC can be induced (Asparuhova et al., 2015; Spenlé et al., 2015b). We now document
elevation of TNC expression in the carcinogen-induced OSCC. Here, we wanted to know
whether TNC has an impact on the destruction of the tumor tissue by irradiation. Therefore,
we irradiated mice of both genotypes with lesions and, found that the number and size of
tumors in a WT mouse significantly reduced after irradiation which was accompanied by
reduced proliferation. Surprisingly, in TNCKO mice irradiation did not affect tumor growth nor
proliferation. Even if irradiation potentially had been applied before tumors have formed,
irradiation may have changed the TME into a pro-tumorigenic one as was previously shown
in a 4T1 grafting model (where TNC is one of the induced genes) (Asparuhova et al., 2015),
274
thereby potentially promoting tumor growth. But this apparently was not the case in the
TNCKO condition as the tumors largely appear to be unaffected by irradiation. This raises
the question whether TNC is a critical component of the irradiation-induced pro-tumorigenic
TME. Future studies have to address this intriguing possibility. In the remaining WT tumors
we observed that not only TNC, but also expression of ERTR7 increased upon irradiation.
Moreover, the organization of the TME and the particular distribution of leukocytes inside the
tumor matrix tracks was not destroyed by gamma irradiation suggesting a potential role of
this TME in a rebound effect. Indeed, we saw more invasive tumors after irradiation. Future
studies should focus on the description of the irradiation-induced TME as e.g. the ECM
composition and tissue stiffening that were shown to be largely altered upon irradiation and
promoted tumor progression in the aforementioned 4T1 model (Asparuhova et al., 2015).
Altogether, our results suggest that irradiation may enhance the lymphoid-like TME in the
remaining tumors and potentially the induction of a pro-tumorigenic TME in tumor free areas,
thereby potentially enhancing tumor relapse and progression. This may have clinical
relevance as in human HNSCC earlier tumor relapse upon radiotherapy correlates with
higher TNC expression levels.
In summary, we have shown that the TME in the 4NQO-induced OSCC model phenocopies
important aspects of the TME in the human disease, in particular local distribution of
leukocytes in the stroma that is TNC rich. We further have shown that the TNC rich stroma
has lymphoid-like properties and impacts attraction of leukocytes and in particular dendritic
cells potentially through CCL21. Finally, we showed that the 4NQO-induced OSCC model is
suitable to address the impact of radiotherapy on the TME. We conclude that this model is a
relevant model to better understand the roles of the TME in HNSCC progression and
radiotherapy. Finally, an improved knowledge about the roles of TNC in the TME of OSCC
may provide novel angles for therapy.
275
References
Asparuhova, M.B., Secondini, C., Rüegg, C., and Chiquet-Ehrismann, R. (2015). Mechanism
of irradiation-induced mammary cancer metastasis: A role for SAP-dependent Mkl1
signaling. Mol Oncol 9, 1510–1527.
Brüsehafer, K., Manshian, B.B., Doherty, A.T., Zaïr, Z.M., Johnson, G.E., Doak, S.H., and
Jenkins, G.J.S. (2016). The clastogenicity of 4NQO is cell-type dependent and linked to
cytotoxicity, length of exposure and p53 proficiency. Mutagenesis 31, 171–180.
Chiquet-Ehrismann, R., Orend, G., Chiquet, M., Tucker, R.P., and Midwood, K.S. (2014).
Tenascins in stem cell niches. Matrix Biology 37, 112–123.
Chung, C.H., Parker, J.S., Karaca, G., Wu, J., Funkhouser, W.K., Moore, D., Butterfoss, D.,
Xiang, D., Zanation, A., Yin, X., et al. (2004). Molecular classification of head and neck
squamous cell carcinomas using patterns of gene expression. Cancer Cell 5, 489–500.
De Laporte, L., Rice, J.J., Tortelli, F., and Hubbell, J.A. (2013). Tenascin C Promiscuously
Binds Growth Factors via Its Fifth Fibronectin Type III-Like Domain. PLoS ONE 8, e62076.
Drumea-Mirancea, M., Wessels, J.T., Müller, C.A., Essl, M., Eble, J.A., Tolosa, E., Koch, M.,
Reinhardt, D.P., Sixt, M., Sorokin, L., et al. (2006). Characterization of a conduit system
containing laminin-5 in the human thymus: a potential transport system for small molecules. J
Cell Sci 119, 1396–1405.
Ferris, R.L. (2015). Immunology and Immunotherapy of Head and Neck Cancer. J Clin Oncol
33, 3293–3304.
Foy, J.-P., Tortereau, A., Caulin, C., Le Texier, V., Lavergne, E., Thomas, E., Chabaud, S.,
Perol, D., Lachuer, J., Lang, W., et al. (2016). The dynamics of gene expression changes in
a mouse model of oral tumorigenesis may help refine prevention and treatment strategies in
patients with oral cancer. Oncotarget 7, 35932–35945.
276
Gopal, S., Veracini, L., Grall, D., Butori, C., Schaub, S., Audebert, S., Camoin, L., Baudelet,
E., Radwanska, A., Beghelli-de la Forest Divonne, S., et al. (2017). Fibronectin-guided
migration of carcinoma collectives. Nat Commun 8, 14105.
Grégoire, V., Lefebvre, J.-L., Licitra, L., Felip, E., and EHNS-ESMO-ESTRO Guidelines
Working Group (2010). Squamous cell carcinoma of the head and neck: EHNS-ESMO-
ESTRO Clinical Practice Guidelines for diagnosis, treatment and follow-up. Ann. Oncol. 21
Suppl 5, v184-186.
Kanojia, D., and Vaidya, M.M. (2006). 4-nitroquinoline-1-oxide induced experimental oral
carcinogenesis. Oral Oncol. 42, 655–667.
Katakai, T., Hara, T., Sugai, M., Gonda, H., and Shimizu, A. (2004). Lymph Node Fibroblastic
Reticular Cells Construct the Stromal Reticulum via Contact with Lymphocytes. J Exp Med
200, 783–795.
Lanati, S., Dunn, D.B., Roussigné, M., Emmett, M.S., Carriere, V., Jullien, D., Budge, J.,
Fryer, J., Erard, M., Cailler, F., et al. (2010). Chemotrap-1: an engineered soluble receptor
that blocks chemokine-induced migration of metastatic cancer cells in vivo. Cancer Res 70,
8138–8148.
Martino, M.M., Briquez, P.S., Güç, E., Tortelli, F., Kilarski, W.W., Metzger, S., Rice, J.J.,
Kuhn, G.A., Müller, R., Swartz, M.A., et al. (2014). Growth Factors Engineered for Super-
Affinity to the Extracellular Matrix Enhance Tissue Healing. Science 343, 885–888.
Midwood, K., Sacre, S., Piccinini, A.M., Inglis, J., Trebaul, A., Chan, E., Drexler, S., Sofat, N.,
Kashiwagi, M., Orend, G., et al. (2009). Tenascin-C is an endogenous activator of Toll-like
receptor 4 that is essential for maintaining inflammation in arthritic joint disease. Nat. Med.
15, 774–780.
277
Midwood, K.S., Hussenet, T., Langlois, B., and Orend, G. (2011). Advances in tenascin-C
biology. Cell. Mol. Life Sci. 68, 3175–3199.
Midwood, K.S., Chiquet, M., Tucker, R.P., and Orend, G. (2016). Tenascin-C at a glance. J
Cell Sci 129, 4321–4327.
Rupp, T., Langlois, B., Koczorowska, M.M., Radwanska, A., Sun, Z., Hussenet, T., Lefebvre,
O., Murdamoothoo, D., Arnold, C., Klein, A., et al. (2016). Tenascin-C Orchestrates
Glioblastoma Angiogenesis by Modulation of Pro- and Anti-angiogenic Signaling. Cell
Reports 17, 2607–2619.
Saupe, F., Schwenzer, A., Jia, Y., Gasser, I., Spenlé, C., Langlois, B., Kammerer, M.,
Lefebvre, O., Hlushchuk, R., Rupp, T., et al. (2013). Tenascin-C Downregulates Wnt Inhibitor
Dickkopf-1, Promoting Tumorigenesis in a Neuroendocrine Tumor Model. Cell Reports 5,
482–492.
Sharma, P., and Allison, J.P. (2015). The future of immune checkpoint therapy. Science 348,
56–61.
Shields, J.D., Kourtis, I.C., Tomei, A.A., Roberts, J.M., and Swartz, M.A. (2010). Induction of
lymphoidlike stroma and immune escape by tumors that express the chemokine CCL21.
Science 328, 749–752.
Spenlé, C., Gasser, I., Saupe, F., Janssen, K.-P., Arnold, C., Klein, A., van der Heyden, M.,
Mutterer, J., Neuville-Méchine, A., Chenard, M.-P., et al. (2015a). Spatial organization of the
tenascin-C microenvironment in experimental and human cancer. Cell Adh Migr 9, 4–13.
Spenlé, C., Saupe, F., Midwood, K., Burckel, H., Noel, G., and Orend, G. (2015b). Tenascin-
C: Exploitation and collateral damage in cancer management. Cell Adh Migr 9, 141–153.
278

Talts, J.F., Wirl, G., Dictor, M., Muller, W.J., and Fässler, R. (1999). Tenascin-C modulates
tumor stroma and monocyte/macrophage recruitment but not tumor growth or metastasis in a
mouse strain with spontaneous mammary cancer. J. Cell. Sci. 112 ( Pt 12), 1855–1864.
279
Material and methods
Human tumor samples and immunohistochemistry
Surgically removed tongue tumors embedded in paraffin wax blocks were retrieved from the
archives of the Pathology Department of the Centre Antoine Lacassagne. Informed consent
was obtained for all subjects. Patient characteristics are summarized in Table S1.
Haematoxylin and eosin staining and immunohistochemical methods were performed on
serial 4 µm deparaffinized TMA sections. CD45 staining was performed on a BenchMark
Ulter automated slide staining system (Ventana Medical Systems, Inc., Roche Group,
Tuscon, AZ) using monoclonal anti-CD45 (LCA) antibody (clone 2B11+PD7/26) according to
instructions (UV/CC1M/16min @ 37°C ) of the manufacturer (Cell Marque, Rocklin, CA). For
TNC staining, intrinsic peroxidase was blocked by incubating sections with 3% hydrogen
peroxide for 15 min and antigen retrieval was performed in EDTA buffer pH 9.0, in a de-
cloaking chamber (Dako, S2367). Sections were blocked in 4 % goat serum for 1 hour, then
incubated for 1 hour with mouse monoclonal anti-TNC antibody (clone BC24, Sigma-Aldrich
1/1000). After rinsing with PBS, sections were incubated with biotinylated secondary
antibody (30 min), biotinylated goat anti-mouse IgG (30 min) then avidin-biotin complex
(Vector Lab, VECTASTAIN ABC Kit, PK-4000). Staining was revealed with 3,3 ′-
Diaminobenzidine developing solution (Vector Lab, DAB, SK-4100) then sections were
stained with hematoxylin and mounted with aqueous mounting medium.
Quantification of human staining
Stained slides were scanned on the Hamamatsu NanoZoomer 2.0-HT Digital slide scanner
(40X mode). Scans were viewed and images acquired using the NDP.view2 software. For
quantification, we developed a script (based on ImageJ) optimized to be used with interactive
surfaces. Images (5X magnification, 3 per tumor) were projected on an interactive digital
whiteboard for selection by pathologist of regions of interest (ROIs) corresponding to
carcinoma cells (tumor) or stroma. These ROIs where extracted after color deconvolution
and thresholding to quantify CD45 staining and hematoxylin. We then extracted the ratio of
280

area containing CD45 (holes are removed from hematoxylin image) per image and per ROI
type.
4NQO model, irradiation and immunofluorescence
4-NQO (Sigma-Aldrich) was given to 8 week old WT and TNCKO (Talts et al., 1999) mice,
that had been bred with C57Bl6 mice for more than 10 generation, in the drinking water at a
final concentration of 100 µg/ml during 16 weeks (stock 5 mg/ml in propylene glycol). Mice
were sacrificed at week 20 (or week 22 for the irradiation experiments) according to the
ethical limit point. After sacrifice, tongue, neck lymph node, spleen and lung were collected
and prepared for cryosectioning and IF analysis, mRNA or protein extraction. For irradiation
experiment, mice were treated with 4-NQO for 16 weeks, then received one shot of 2Gy
irradiation before feeding them with regular water until sacrifice.
For IF staining, unfixed frozen sections of 8 µm were incubated overnight directly with the
primary antibodies (Table S2). Bound antibodies were visualized with anti-mouse, anti-rabbit
or anti-rat secondary antibodies conjugated with Alexa 488 (Molecular Probe) or Cy3
(Jackson ImmunoResearch, UK). DAPI was used to visualize nuclei. After embedding in a
glycerol/PBS/phenylenediamine solution, sections were examined using an AxioVision
(Zeiss) microscope. Pictures were taken with an AxioCam MRm (Zeiss; Axiovision) camera.
Control sections were processed as above with omission of the primary antibodies. For
quantification of immune cells, ImageJ software was used. At least 2 sections of 5 different
tumors/mice were quantified per condition. Number of immune cells was reported in
correlation to the total number of DAPI positive cells.
Surface plasmon resonance spectroscopy
Surface plasmon resonance binding experiments were performed on a Biacore 2000
instrument (Biacore Inc.) at 25°C. TNC (Huang et al., 2001) was immobilized at high surface
density (around 7000 resonance units) on an activated CM5 chip (Biacore Inc.) using a
standard amine-coupling procedure according to the manufacturer's instruction. Soluble
281

molecules were added at a concentration of 10 μg/ml in 10 mM sodium acetate, pH 5.0, and
at a flow rate of 5 μl/min for 20 min before addition of 1 M ethanolamine. CCL21 (0.5, o.87
and 2µg in 200µl) was added to the chip at pH 6.0 (10 mM MES, pH 6.0, 150 mm sodium
chloride, 0.005% (v/v) surfactant P20), or at pH 7.4 (10mM HEPES, 150 mM sodium
chloride, 0.005% (v/v) surfactant P20), at a flow rate of 10 μl/min. A blank CM5 chip was
used for background correction. 10 mM glycine, pH 2.0, at 100 μl/min for 1 min was used to
regenerate the chip surface between two binding experiments. A steady state condition was
used to determine the affinity of CCL21 for TNC .The Dissociation constant (Kd) was
determined using the 1:1 Langmuir association model as described by the manufacturer.
Flow cytometry/FACS
Tongue tumors, regional lymph nodes and spleens were excised from TNC+/+ and -/- mice.
Tissues were inflated with digestion solution containing 1 mg/mL Collagenase D (Roche) and
0.2 mg/mL DNase I (Roche) 2% fetal bovine serum in RPMI, at 37°C for 2 hours. Upon
completion of digestion, 92 µL of EDTA 54 mM was added and the samples were vortexed at
maximal speed for 30 seconds. The resulting cell suspensions were passaged through a 70
µm and 40 µm cell strainer and treated with FACS buffer (PBS, 2% FBS, 1mM EDTA). After
cells were counted and 2 x 10⁶ cells per lymph node/spleen sample (1 x 10⁶ cells for tumor
sample) were stained with Aqua Live/Dead viability dye (Life Technologies) according the
manufacturer’s instructions. Cells were then incubated in blocking solution containing 2%
FcBlock (eBiosciences, San Diego, CA) in FACS buffer, for 15 min at 4°C and then stained
30 minutes at 4°C with a standard panel of immunophenotyping antibodies: solution 1 with
B220 (clone RA3-6B2, Biolegend), CD11c (clone HL3, BD biosciences), IA/IE (clone M5/114,
BD biosciences). Solution 2 with CD8a (clone M1/69, ebioscience), CD45 (clone 30-F11,
Biolegend), CD3e (clone 145-2C11, eBiosciences). Solution 3 with Gr1 (clone AL-21, BD
Biosciences), CD11b (clone M1/70, BD Bioscience). Data was acquired with BD accuri C6
flow cytometer using BD accuri C6 software. Adjustments were done on the software at the
beginning of each experiment.
282
Cell culture
LEC (ATCC), DC2.4 (Merck) and OSCC (Spenlé et al., in preparation) were cultured in
EGCM (Dutscher), RPMI (Dutscher) and DMEM-F12 (Dutscher) respectively with 10% Fetal
Bovine Serum (FBS, Sigma-Aldrich), 100 U/ml penicillin, 100 µg/ml streptomycin and 40
U/ml gentamicin at 37°C and 5% CO2. OSCC cells were supplemented with hydrocortisone
(Sigma) 50 µg/ml. Cells were starved with medium containing 1% FBS overnight before
treatment with TNC (10 µg/ml) or seeding cells on FN or FN/TNC substrata.
Coating with purified ECM molecules
Purification of FN and TNC and coating of cell culture dishes was done using protocols as
previously described (Huang and al., 2001). Briefly, FN and TNC were coated in 0.01%
Tween 20-PBS at 1 µg/cm² before saturation with 10 mg/ml heat inactivated BSA in PBS.
RNA extraction and real-time quantitative PCR:
Frozen tongue tumors, hLEC and DC2.4 were disolved in the TRizol reagent for total RNA
extraction. cDNAs were synthesized from 1000 µg of total RNA using random primers and
Moloney murine leukemia virus reverse transcriptase. The cDNA was used for quantitative
real-time PCR in an Mx3005P Real-Time PCR System (Thermo Fisher Scientific). Reactions
were carried out in duplicate for all conditions using a Sybr Green Master mix ((Thermo
Fisher Scientific) or Fast Taqman mix (Thermo Fisher Scientific) and expression of GAPDH
mRNA was used as endogenous control in the comparative cycle threshold method. Primer
sequences were used for qPCR determination (Table S3).
Statistical analysis
For all data, Gaussian distribution was tested by the d’Agostino-Pearson normality test.
When data followed a Gaussian distribution, statistical differences were analyzed by
unpaired t-test (with Welch’s correction in case of unequal variance) or ANOVA one-way with
Tukey post-test. Otherwise, the Mann Whitney test or a non-parametric ANOVA followed by
283

Dunns post-test were used to verify significance of the observed differences. All statistical
analyses were performed using the GraphPad Prism software. Mean ± SEM. p values < 0.05
were considered as statistically significant, *p < 0.05; **p < 0.01; ***p < 0.001; ****p < 0.0001.
284
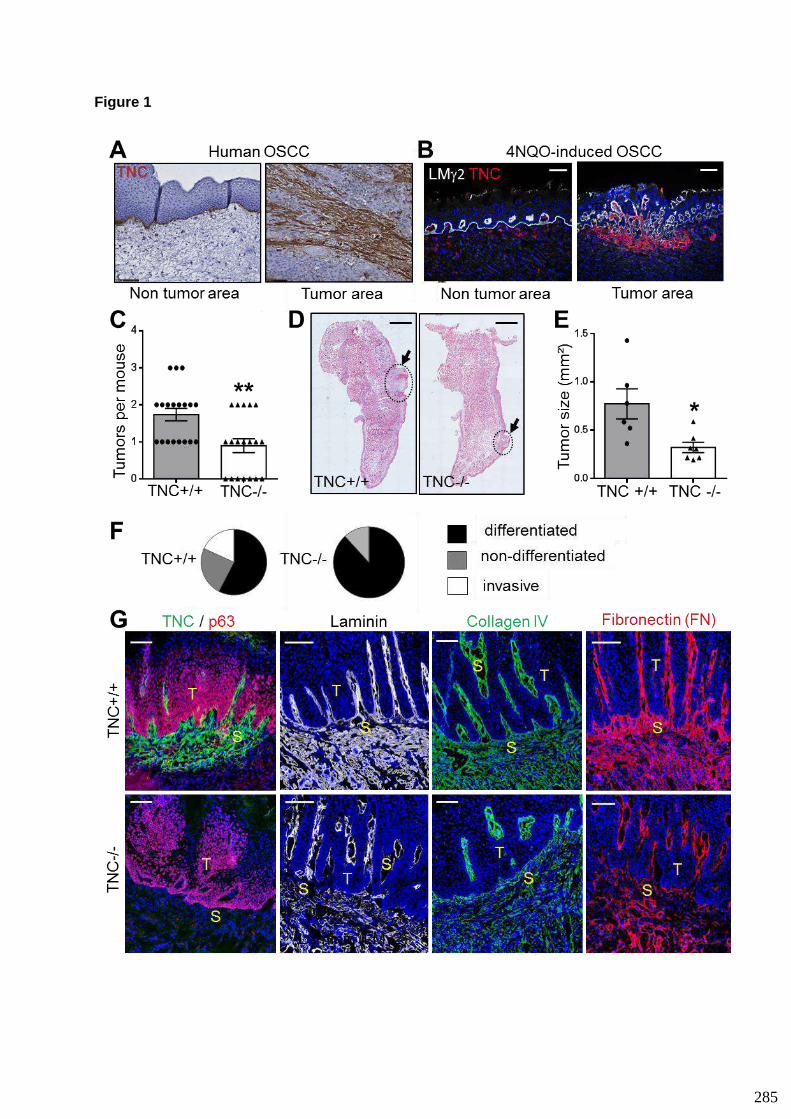
Figure 1
285
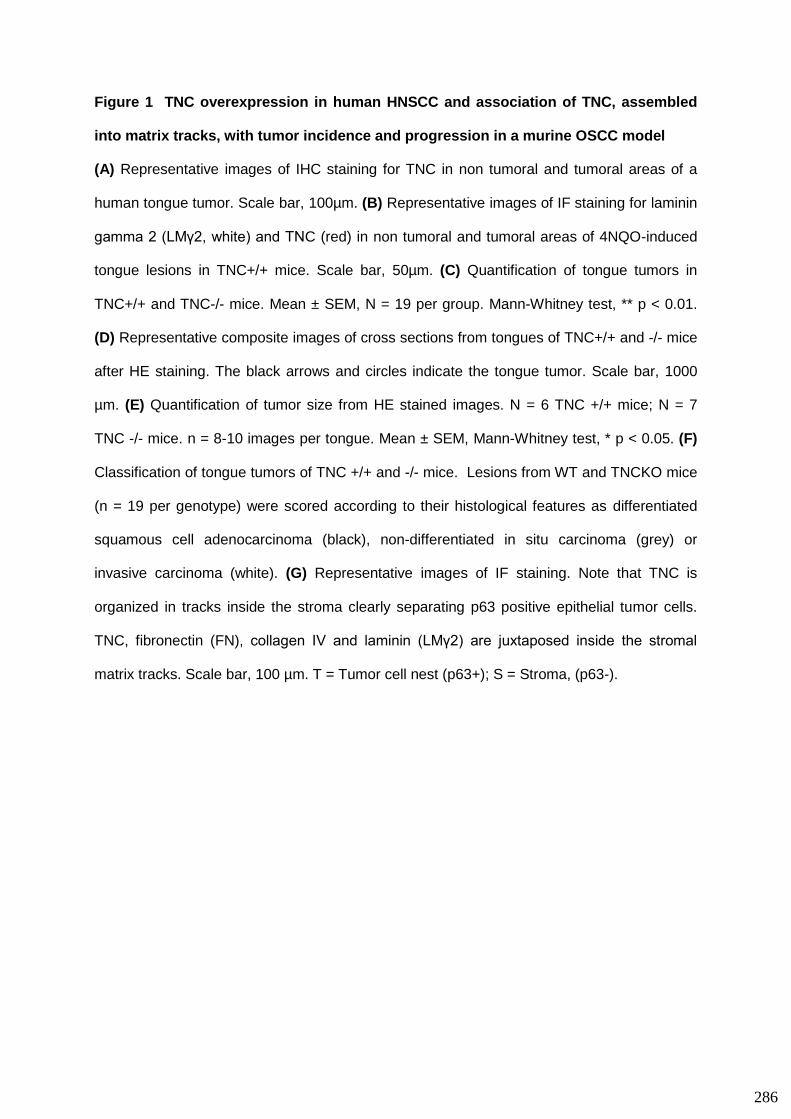
Figure 1 TNC overexpression in human HNSCC and association of TNC, assembled
into matrix tracks, with tumor incidence and progression in a murine OSCC model
(A) Representative images of IHC staining for TNC in non tumoral and tumoral areas of a
human tongue tumor. Scale bar, 100µm. (B) Representative images of IF staining for laminin
gamma 2 (LMγ2, white) and TNC (red) in non tumoral and tumoral areas of 4NQO-induced
tongue lesions in TNC+/+ mice. Scale bar, 50µm. (C) Quantification of tongue tumors in
TNC+/+ and TNC-/- mice. Mean ± SEM, N = 19 per group. Mann-Whitney test, ** p < 0.01.
(D) Representative composite images of cross sections from tongues of TNC+/+ and -/- mice
after HE staining. The black arrows and circles indicate the tongue tumor. Scale bar, 1000
µm. (E) Quantification of tumor size from HE stained images. N = 6 TNC +/+ mice; N = 7
TNC -/- mice. n = 8-10 images per tongue. Mean ± SEM, Mann-Whitney test, * p < 0.05. (F)
Classification of tongue tumors of TNC +/+ and -/- mice. Lesions from WT and TNCKO mice
(n = 19 per genotype) were scored according to their histological features as differentiated
squamous cell adenocarcinoma (black), non-differentiated in situ carcinoma (grey) or
invasive carcinoma (white). (G) Representative images of IF staining. Note that TNC is
organized in tracks inside the stroma clearly separating p63 positive epithelial tumor cells.
TNC, fibronectin (FN), collagen IV and laminin (LMγ2) are juxtaposed inside the stromal
matrix tracks. Scale bar, 100 µm. T = Tumor cell nest (p63+); S = Stroma, (p63-).
286
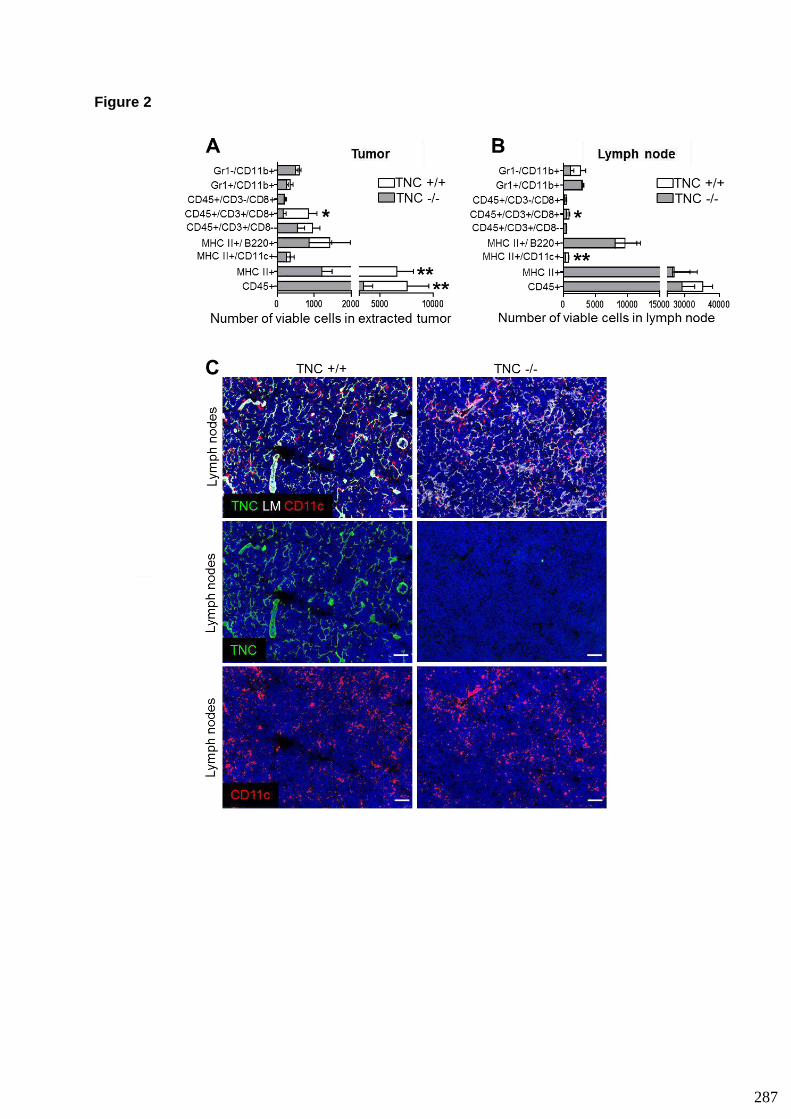
Figure 2
287
Figure 2 FACS analysis reveals less leukocytes and MHC II+ cells in OSCC tumors
expressing TNC
(A) Bar graph representation of the flow cytometry analysis of immune cell populations in the
extracted OSCC tumors of TNC +/+ (n = 5) and -/- (n = 6) mice. Leukocyte (CD45+), MHC II+
cells and CD8+ T cells (CD45+/CD3+/CD8+) are more abundant in TNC -/- tongue tumors.
Mann-Whitney test, * p < 0.05, ** p < 0.01. (B) Bar graph representation of the flow cytometry
analysis of immune cell populations in the lymph nodes of TNC +/+ (n = 5) and -/- (n = 6)
tumor mice. Note that CD8+ T cells (CD45+/CD3+/CD8+) and dendritic cells (MHC
II+/CD11c/B220-) are less abundant in regional lymph nodes of TNC +/+ tumor mice. Mann-
Whitney test, * p < 0.05, ** p < 0.01. (C) Representative IF images of lymph node tissue for
laminin (white), TNC (green) and CD11c (red) in tumor bearing WT and TNCKO mice. Scale
bar, 100 µm.
288
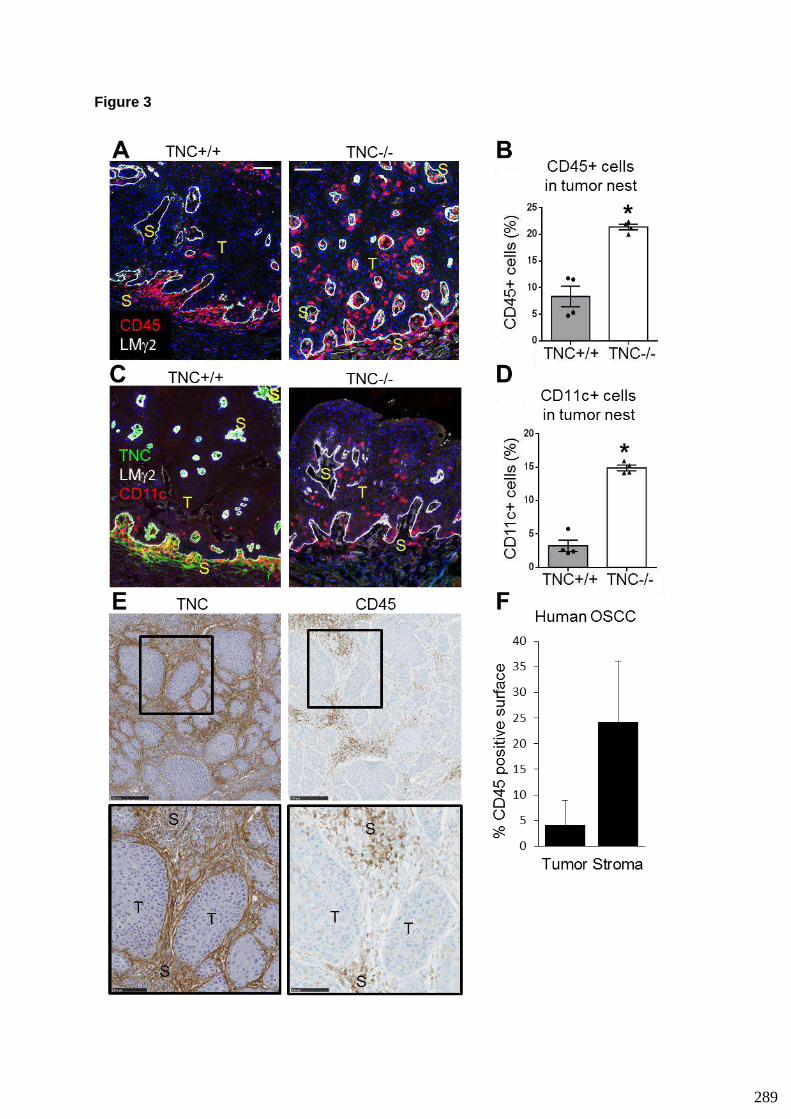
Figure 3
289

Figure 3 Enrichment of leukocytes and dendritic cells in TNC-rich stromal areas of the
carcinogen-induced OSCC
(A) Representative images of CD45 IF staining and (B) quantification of CD45+ cells in the
tumor nest of TNC +/+ and TNC -/- mice. (C) IF staining for CD11c and TNC and (D)
quantification of CD11c+ cells in the tumor nest of TNC +/+ and TNC -/- mice. Scale bar, 100
µm. T, Tumor; S, Stroma. The histograms corresponds to mean values (± SEM) from 4 mice
per genotype and 8-10 images per tumor. Mann-Whitney test, * p < 0.05. (E) Representative
IHC staining of TNC and CD45 in serial whole sections of a human tongue tumor. Scale bar,
200 µm. (F) Quantification of CD45+ cells in tumor epithelial nests and stroma (n = 10
tumors, 3 regions per tumor). Mean, +/-Standard Deviation.
290

Figure 4
291
Figure 4 Lymphoid-like properties of TNC-rich stromal areas in the murine OSCC
Representative IF images for CCL21 (A) and CCR7 (C). Scale bar, 100 µm; T, Tumor; S,
Stroma. Semi-quantitative measurement of CCL21 (B) and CCR7 (D) in tongue tumors of
TNC +/+ and -/- mice. Mean ± SEM from 5 mice per genotype and 8-10 individual images per
tumor. Mann-Whitney test; * p < 0.05. (E) mRNA levels (qRTPCR) of CCR7 in OSCC cells
treated in vitro for 24 hours with medium containing TNC (10 µg/mL). (N = 3 independent
experiments); Mann-Whitney test, mean ± SEM, * p < 0.05. (F) Representative IF images for
Lyve-1 (red) and CCL21 (green), showing colocalisation of these molecules. Scale bar, 100
µm; T, Tumor; S, Stroma. (G) Stimulation of human lymphatic endothelial cells (hLECs) with
soluble TNC (24 hours) induces CCL21 expression (qRTPCR). Means ± SEM. (H) Binding of
soluble CCL21 to TNC as measured by surface plasmon resonance spectrometry. Kd
(1/s)=0.0231; KD(M)=6,78e-08; KA(1/M)=1.47E+07 (I) Quantification of migration of Bone
Marrow derived dendritic cells (BMDC) towards FN, TNC or both in the presence of CCL21
for 2 hours in comparison to a not coated surface (C). Data derive from 4 independent
experiments (n = 9 wells) and are represented as normalized individual values (fold increase
of cell number for each condition compared to migration towards medium alone (no coating
condition). Mann-Whitney test, ns = not significant, ***p < 0.001.
292
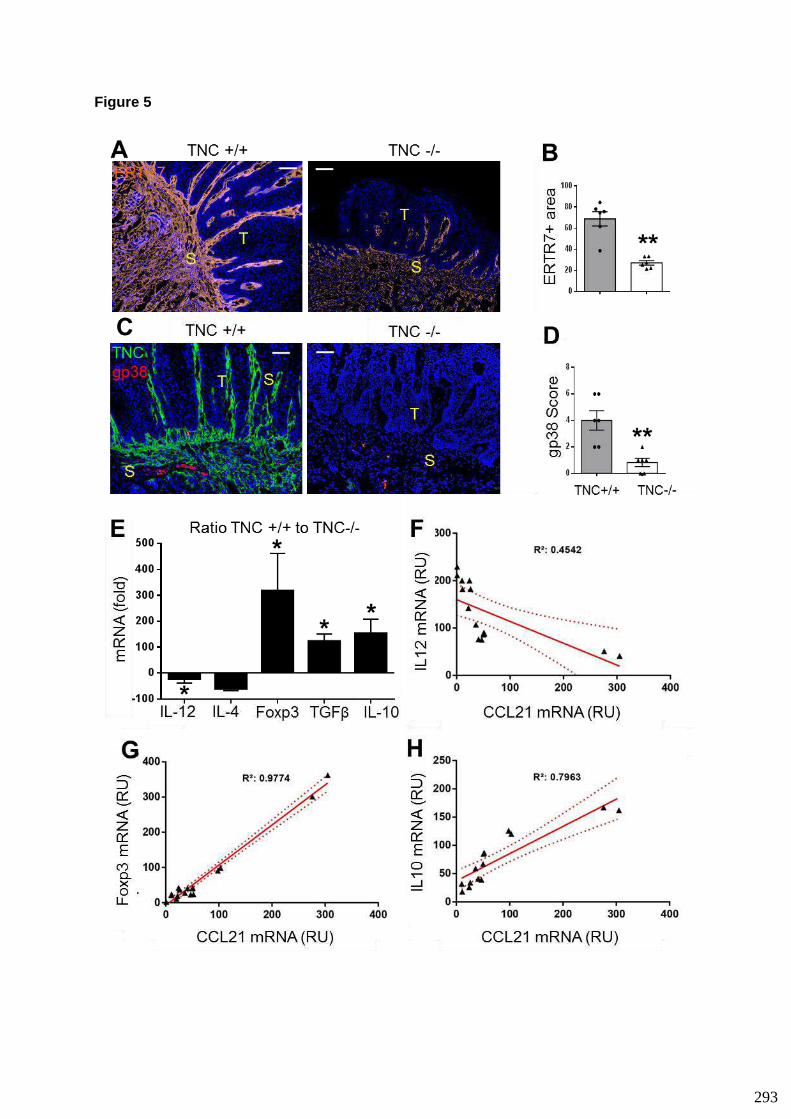
Figure 5
293
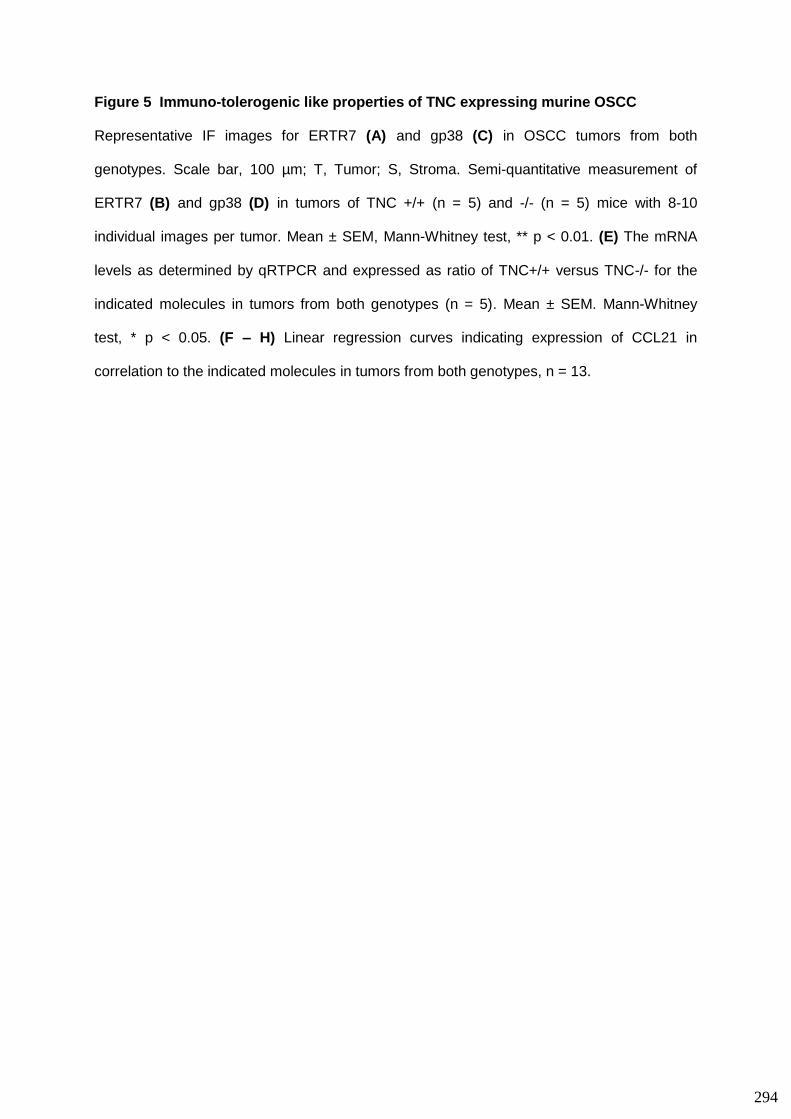
Figure 5 Immuno-tolerogenic like properties of TNC expressing murine OSCC
Representative IF images for ERTR7 (A) and gp38 (C) in OSCC tumors from both
genotypes. Scale bar, 100 µm; T, Tumor; S, Stroma. Semi-quantitative measurement of
ERTR7 (B) and gp38 (D) in tumors of TNC +/+ (n = 5) and -/- (n = 5) mice with 8-10
individual images per tumor. Mean ± SEM, Mann-Whitney test, ** p < 0.01. (E) The mRNA
levels as determined by qRTPCR and expressed as ratio of TNC+/+ versus TNC-/- for the
indicated molecules in tumors from both genotypes (n = 5). Mean ± SEM. Mann-Whitney
test, * p < 0.05. (F – H) Linear regression curves indicating expression of CCL21 in
correlation to the indicated molecules in tumors from both genotypes, n = 13.
294
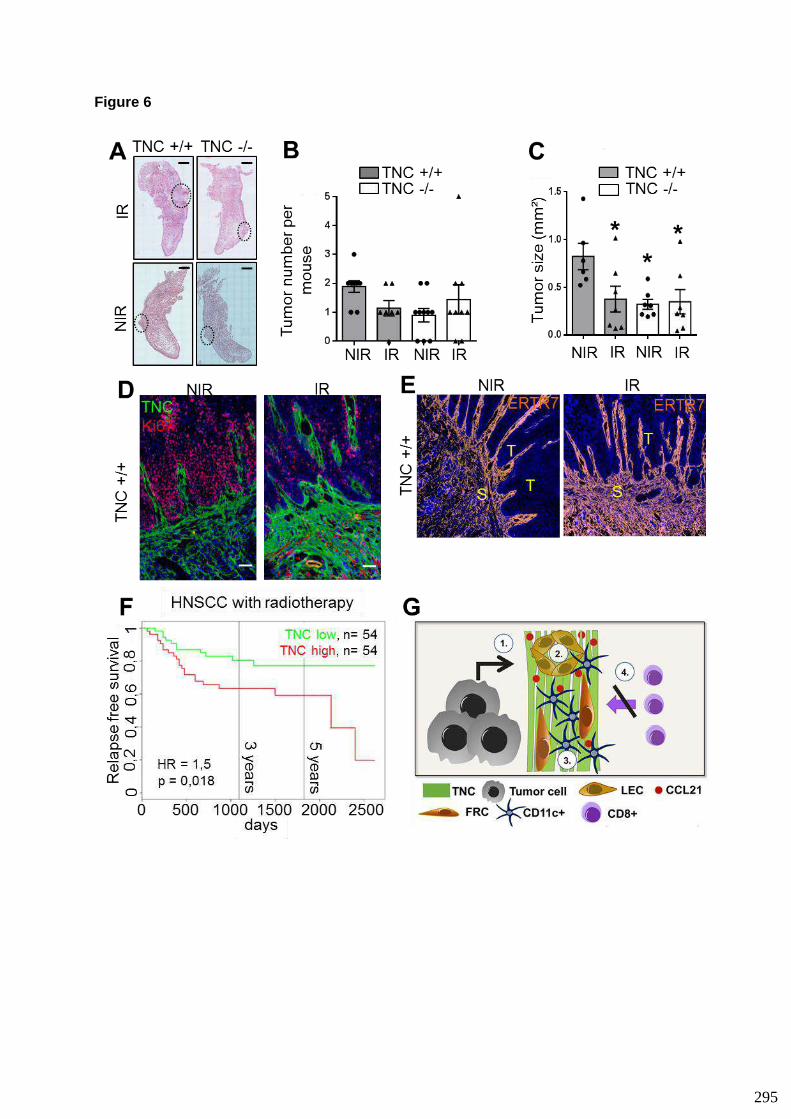
Figure 6
295
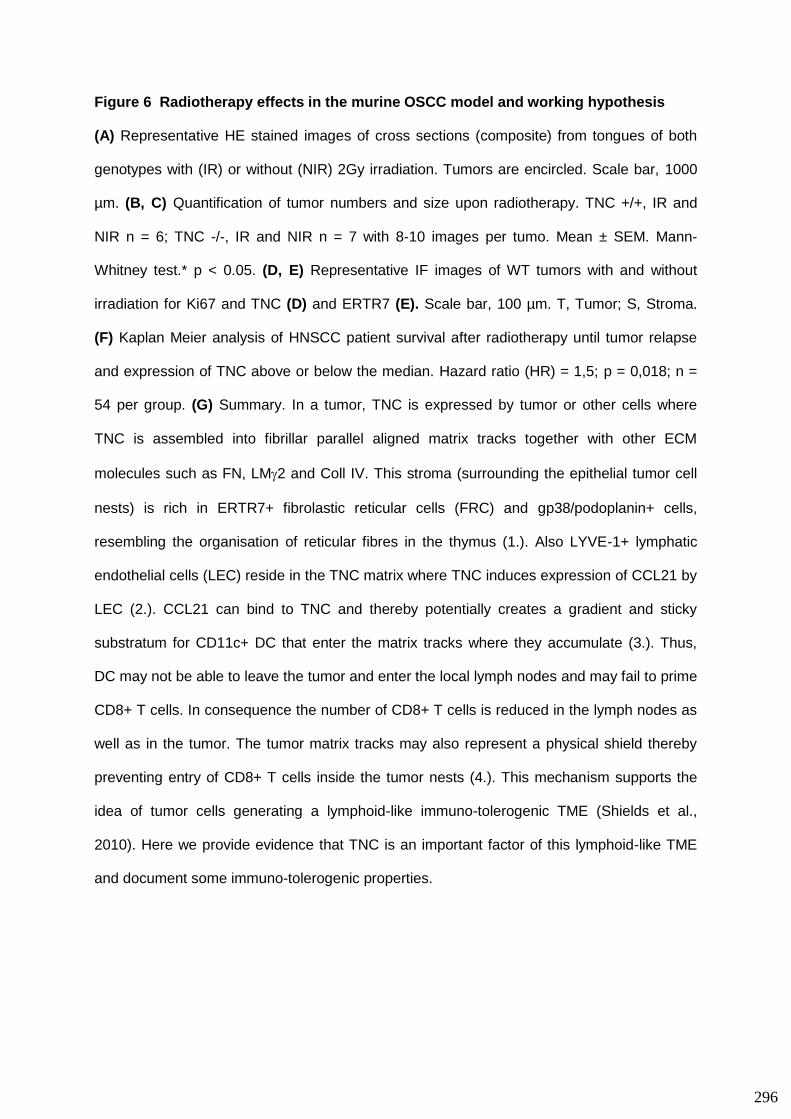
Figure 6 Radiotherapy effects in the murine OSCC model and working hypothesis
(A) Representative HE stained images of cross sections (composite) from tongues of both
genotypes with (IR) or without (NIR) 2Gy irradiation. Tumors are encircled. Scale bar, 1000
µm. (B, C) Quantification of tumor numbers and size upon radiotherapy. TNC +/+, IR and
NIR n = 6; TNC -/-, IR and NIR n = 7 with 8-10 images per tumo. Mean ± SEM. Mann-
Whitney test.* p < 0.05. (D, E) Representative IF images of WT tumors with and without
irradiation for Ki67 and TNC (D) and ERTR7 (E). Scale bar, 100 µm. T, Tumor; S, Stroma.
(F) Kaplan Meier analysis of HNSCC patient survival after radiotherapy until tumor relapse
and expression of TNC above or below the median. Hazard ratio (HR) = 1,5; p = 0,018; n =
54 per group. (G) Summary. In a tumor, TNC is expressed by tumor or other cells where
TNC is assembled into fibrillar parallel aligned matrix tracks together with other ECM
molecules such as FN, LM2 and Coll IV. This stroma (surrounding the epithelial tumor cell
nests) is rich in ERTR7+ fibrolastic reticular cells (FRC) and gp38/podoplanin+ cells,
resembling the organisation of reticular fibres in the thymus (1.). Also LYVE-1+ lymphatic
endothelial cells (LEC) reside in the TNC matrix where TNC induces expression of CCL21 by
LEC (2.). CCL21 can bind to TNC and thereby potentially creates a gradient and sticky
substratum for CD11c+ DC that enter the matrix tracks where they accumulate (3.). Thus,
DC may not be able to leave the tumor and enter the local lymph nodes and may fail to prime
CD8+ T cells. In consequence the number of CD8+ T cells is reduced in the lymph nodes as
well as in the tumor. The tumor matrix tracks may also represent a physical shield thereby
preventing entry of CD8+ T cells inside the tumor nests (4.). This mechanism supports the
idea of tumor cells generating a lymphoid-like immuno-tolerogenic TME (Shields et al.,
2010). Here we provide evidence that TNC is an important factor of this lymphoid-like TME
and document some immuno-tolerogenic properties.
296
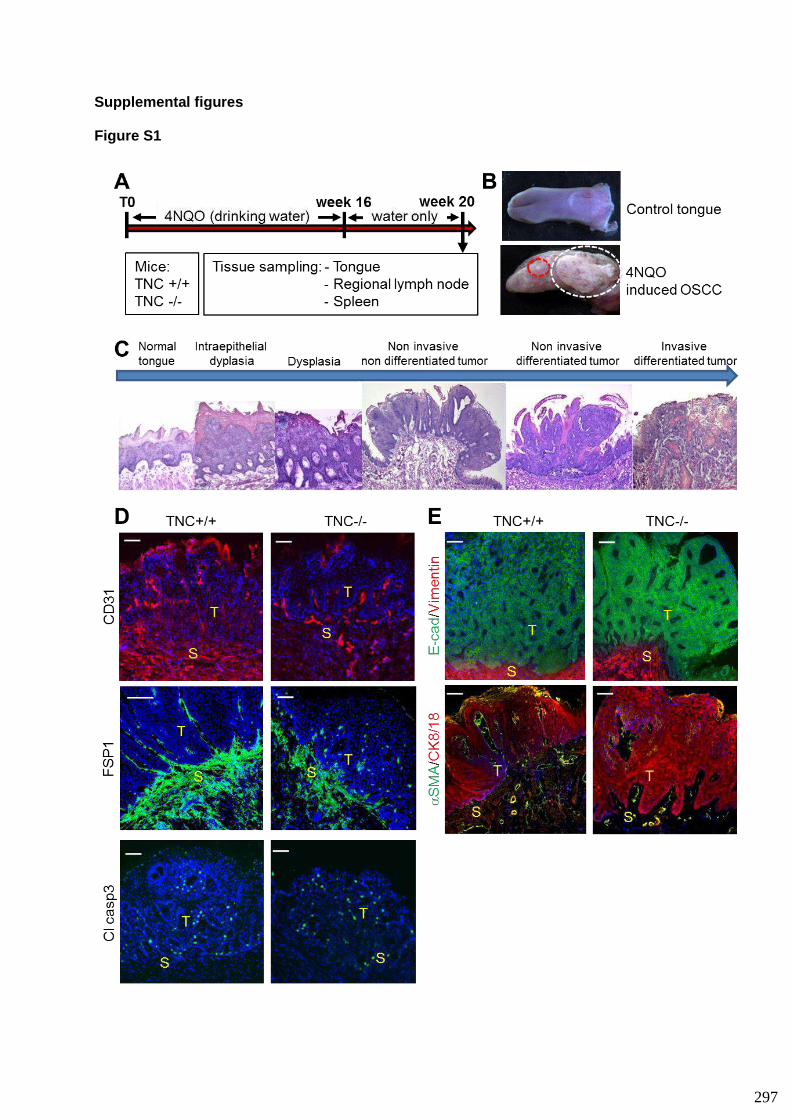
Supplemental figures
Figure S1
297
Supplementary Figure 1 4NQO protocol and characterization of early lesions in WT
and TNCKO mice
(A) Schematic representation of the experimental carcinogen treatment protocol indicating
the kinetics and tissue sampling for analysis. (B) Representative image of a control tongue
and a tongue with a tumor at the end of the carcinogen treatment protocol. White and red
circles represent an invasive and non-invasive tumor, respectively. (C) Representative
images illustrating the kinetics of the disease in a WT mouse. In our study, only non-invasive
tumors were investigated of both genotypes. (D, E) Representative IF images for the
indicated molecules. Scale bar, 100 µm. T, Tumor; S, Stroma.
298
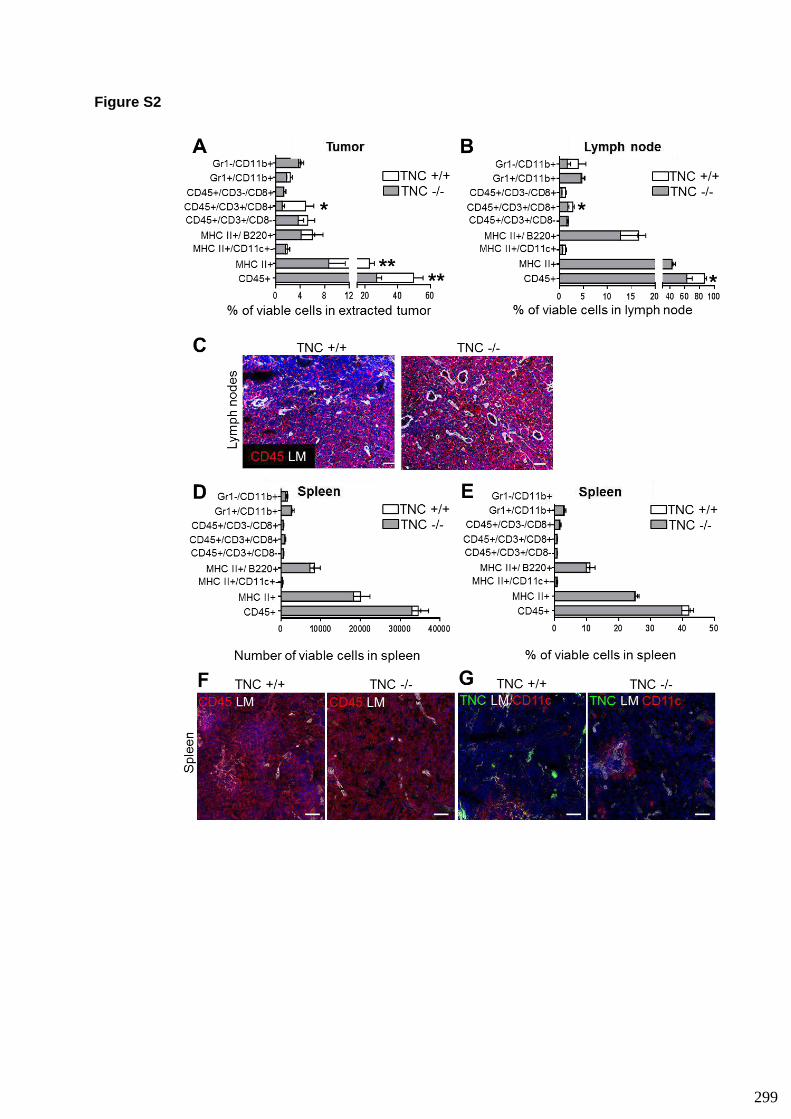
Figure S2
299
Supplementary Figure 2 FACS immunoprofiling and tissue staining of tumors, local
lymph nodes and spleen
(A, B, D, E) Bar graph representation of the flow cytometry analysis of immune cell
populations in the extracted OSCC tumors (A), local lymph nodes (B) and spleens (D, E) of
TNC +/+ (n = 5) and -/- (n = 6) tumor bearing mice represented as percentage of the total
viable cells in the tissue sample (A, B, E) or as real counts (D). Mann-Whitney test, * p <
0.05, ** p < 0.01. (C, F, G) IF images for the indicated molecules in representative lymph
nodes (C) and spleen (F, G). Scale bar, 100 µm.
300
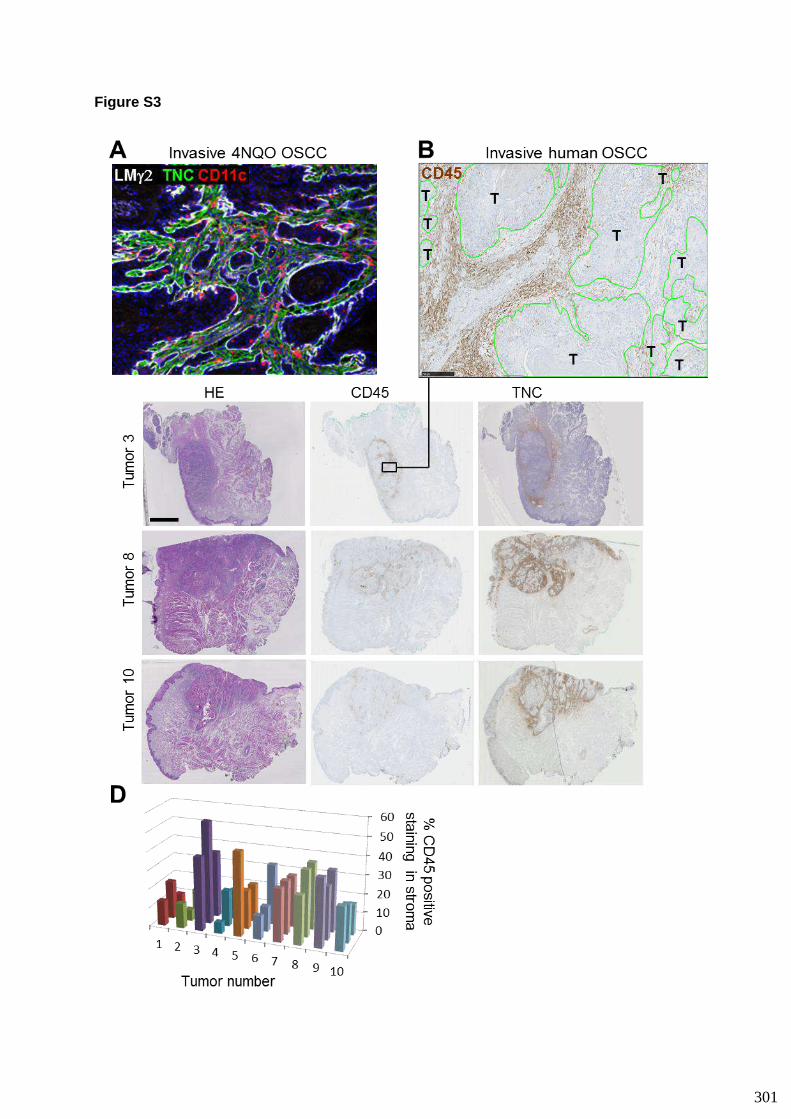
Figure S3
301
Supplementary Figure 3 Analysis of CD11c and CD45 expression in murine and
human OSCC
(A) Representative IF image of an invasive murine WT tumor for the indicated molecules.
Note that CD11c+ cells are exclusively present inside the TNC rich stroma. Scale bar, 100
µm. (B) Representation of a human OSCC upon staining for CD45. Areas designated as
tumor regions are circled in green, the remaining area corresponds to stroma. Scale bar, 250
µm. (C) Staining of CD45 and TNC in sections from 3 representative primary tongue tumors
used for quantitative analysis (tumor numbers indicated above images). Insert in tumor 3
depicts one of 3 fields selected for quantification and shown in panel B. Scale bar, 5 µm. (D)
Results correspond to values obtained from 3 individual images per tumor. Numbers of the
10 tumors are indicated below.
302
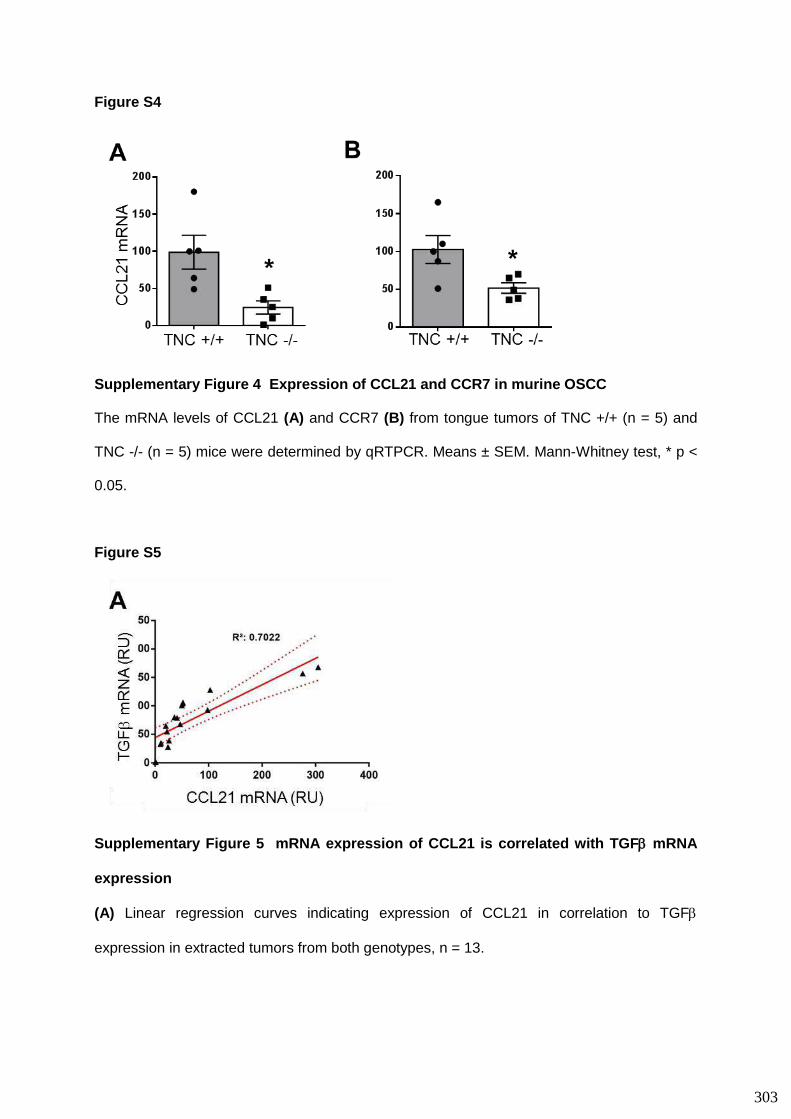
Figure S4
Supplementary Figure 4 Expression of CCL21 and CCR7 in murine OSCC
The mRNA levels of CCL21 (A) and CCR7 (B) from tongue tumors of TNC +/+ (n = 5) and
TNC -/- (n = 5) mice were determined by qRTPCR. Means ± SEM. Mann-Whitney test, * p <
0.05.
Figure S5
Supplementary Figure 5 mRNA expression of CCL21 is correlated with TGF mRNA
expression
(A) Linear regression curves indicating expression of CCL21 in correlation to TGF
expression in extracted tumors from both genotypes, n = 13.
303
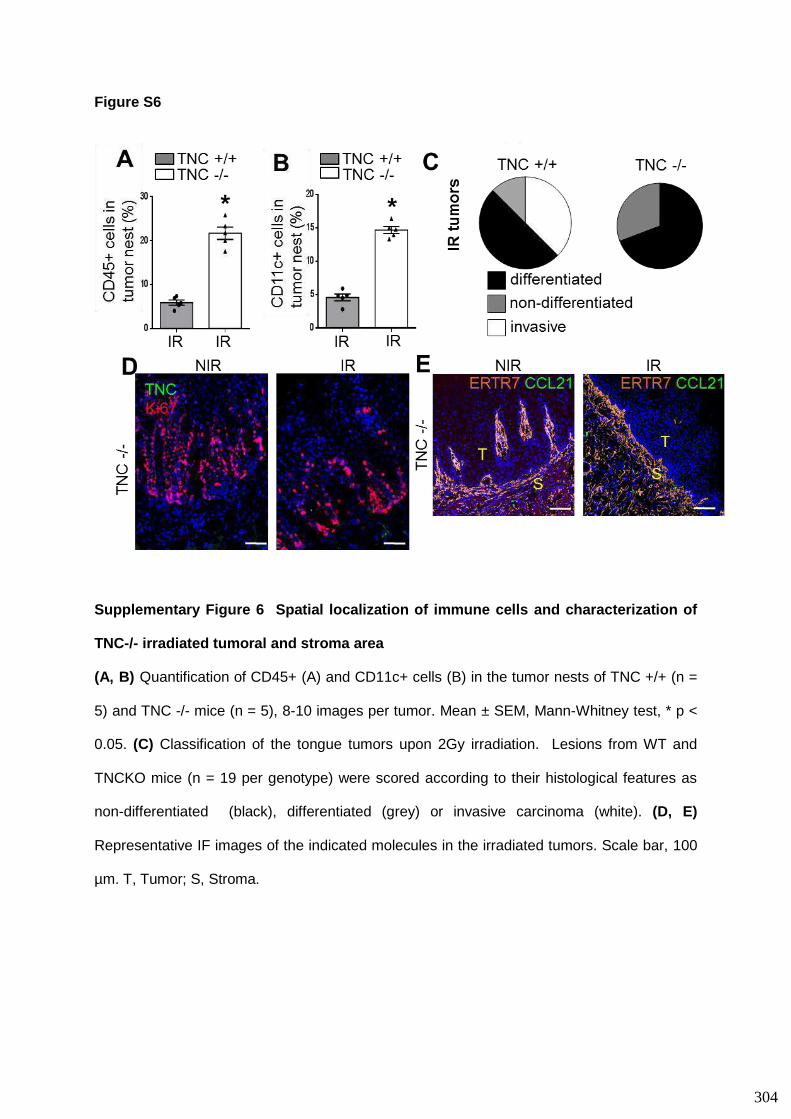
Figure S6
Supplementary Figure 6 Spatial localization of immune cells and characterization of
TNC-/- irradiated tumoral and stroma area
(A, B) Quantification of CD45+ (A) and CD11c+ cells (B) in the tumor nests of TNC +/+ (n =
5) and TNC -/- mice (n = 5), 8-10 images per tumor. Mean ± SEM, Mann-Whitney test, * p <
0.05. (C) Classification of the tongue tumors upon 2Gy irradiation. Lesions from WT and
TNCKO mice (n = 19 per genotype) were scored according to their histological features as
non-differentiated (black), differentiated (grey) or invasive carcinoma (white). (D, E)
Representative IF images of the indicated molecules in the irradiated tumors. Scale bar, 100
µm. T, Tumor; S, Stroma.
304
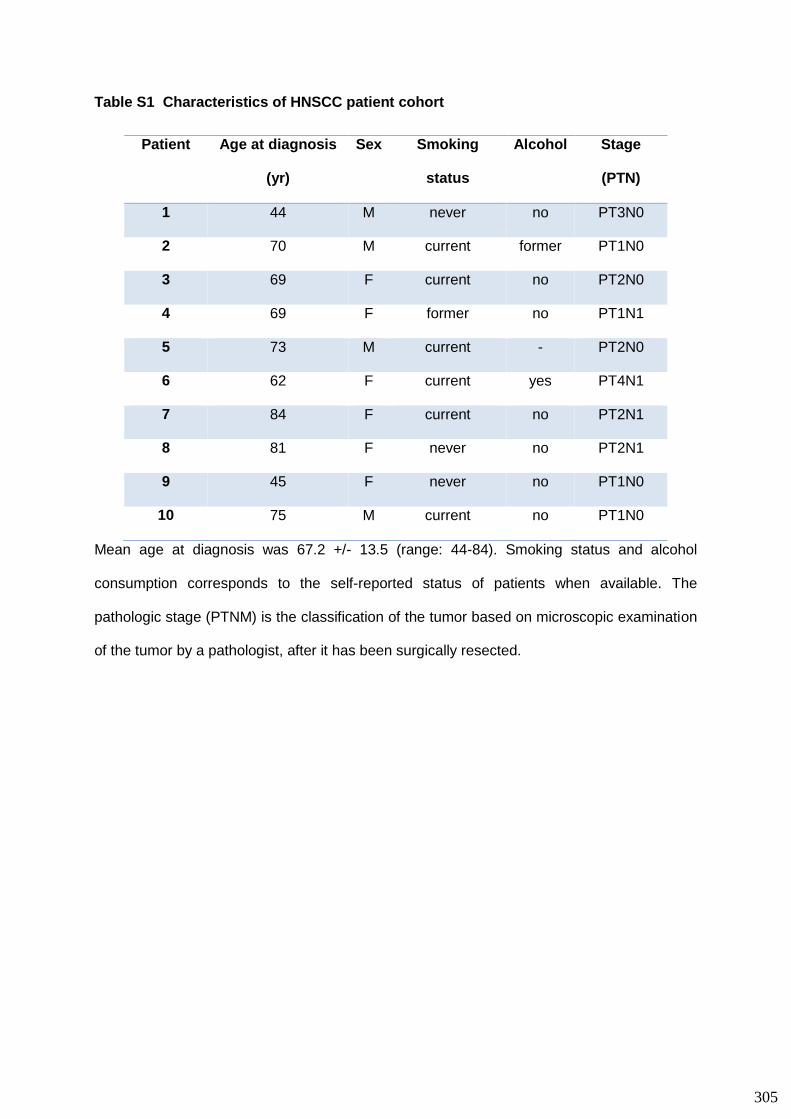
Table S1 Characteristics of HNSCC patient cohort
Patient Age at diagnosis
(yr)
Sex Smoking
status
Alcohol Stage
(PTN)
1 44 M never no PT3N0
2 70 M current former PT1N0
3 69 F current no PT2N0
4 69 F former no PT1N1
5 73 M current - PT2N0
6 62 F current yes PT4N1
7 84 F current no PT2N1
8 81 F never no PT2N1
9 45 F never no PT1N0
10 75 M current no PT1N0
Mean age at diagnosis was 67.2 +/- 13.5 (range: 44-84). Smoking status and alcohol
consumption corresponds to the self-reported status of patients when available. The
pathologic stage (PTNM) is the classification of the tumor based on microscopic examination
of the tumor by a pathologist, after it has been surgically resected.
305

Table S2: Protein quantification scoring and CCL21 expression quantification as
example
CCL21/CCR7/gp38 quantification criteria
Stained area in each region of interest
0 No expression
1 Basal expression (BE)
2 BE < area ≤ 2x BE
3 Area > 2x BE
Intensity staining
0 negative (no staining)
1 mild (weak)
2 moderate (distinct)
3 intense (strong)
TNC WT TNC KO
Mouse
ID
Area Intensity CCL21
Score
Mouse
ID
Area Intensity CCL21
Score
3418 3 3 9 3671 0 0 0
3689 3 3 9 3680 1 1 1
3725 2 2 4 3724 1 2 2
3696 2 3 6 3669 1 1 1
3399 3 2 6 3681 1 1 1
306
Disclosure of potential conflict of interest
The authors declare no competing financial interests.
Authors contribution
CS established the carcinogen model, CS and TL applied and investigated the model. CS,
HB and GN developed the irradiation protocol. DM, PB, WE, HB, AM, GC, SBFD, AS, KN,
SS, SR, RK, CA and MvH performed experiments, analyzed and interpreted the data. AS
and EVO supervised the analysis of the human HNSCC tissues. CS, TL, EVO and GO wrote
the manuscript. EVO, FA, CS and GO conceptualized and supervised the study. Grants to
EVO and GO financed the study.
Acknowledgements
We are grateful for technical support by Fanny Steinbach and the personnel of the animal
facility. This work was supported by grants from INCa (FITMANET), Ligue National contre le
Cancer/Tobacco call (EVO, GO), Ligue Régional contre le Cancer, INSERM and University
Strasbourg to GO, French National Institute of Cancer, the Fondation ARC, the Ligue
National Contre le Cancer (PAIR-VADS11-023), the Cancéropôle PACA, the LABEX
SIGNALIFE program (ANR-11-LABX-0028-01) to EVO, and fellowship grants from the
French Ministry of Research MRT (WE) and Association pour la Recherche sur le Cancer
ARC (DM). We also like to acknowledge the constructive scientific input from Patricia Simon-
Assmann and like to thank Nicolas Toussan (CAL-IUFC) for performing the CD45
immunostaining and Olivier Bordone (LPCE, CHU-Nice) for scanning the tumor slides. The
image analysis was carried out on the Imaging and Histopathology facilities of iBV.
307

Appendix III
308
Tumor Biology and Immunology
Tenascin-C Promotes Tumor Cell Migration andMetastasis through Integrin a9b1–MediatedYAP InhibitionZhen Sun1,2,3,4, Anja Schwenzer1,2,3,4, Tristan Rupp1,2,3,4,Devadarssen Murdamoothoo1,2,3,4, Rolando Vegliante1,2,3,4,Olivier Lefebvre1,2,3,4, Annick Klein1,2,3,4, Thomas Hussenet1,2,3,4,and Gertraud Orend1,2,3,4
Abstract
Tenascin-C is an extracellular matrix molecule that drivesprogression of many types of human cancer, but the basis forits actions remains obscure. In this study, we describe a cell-autonomous signaling mechanism explaining how tenascin-Cpromotes cancer cell migration in the tumor microenviron-ment. In a murine xenograft model of advanced human oste-osarcoma, tenascin-C and its receptor integrin a9b1 weredetermined to be essential for lung metastasis of tumor cells.We determined that activation of this pathway also reducedtumor cell–autonomous expression of target genes for thetranscription factor YAP. In clinical specimens, a genetic sig-
nature comprising four YAP target genes represents prognosticimpact. Taken together, our results illuminate how tumor celldeposition of tenascin-C in the tumor microenvironment pro-motes invasive migration and metastatic progression.
Significance: These results illuminate how the extracellularmatrix glycoprotein tenascin-C in the tumor microenviron-ment promotes invasive migration and metastatic progressionby employing integrin a9b1, abolishing actin stress fiberformation, inhibiting YAP and its target gene expression, withpotential implications for cancer prognosis and therapy. CancerRes; 78(4); 950–61. �2017 AACR.
IntroductionThe extracellular matrix (ECM) molecule tenascin-C (TNC)
that is highly expressed in the tumor microenvironment repre-sents an active component of cancer tissue. Its high expressioncorrelates with worsened patient survival prognosis in several
cancer types (1). TNC promotes multiple events in cancerprogression as recently demonstrated in a multistage neuro-endocrine tumorigenesis model with abundant and no TNC. Itwas shown that TNC enhances tumor cell survival, prolifera-tion, invasion, and lung metastasis. Moreover, TNC increasesNotch signaling in breast cancer (2). TNC also promotesstromal events such as the angiogenic switch and the formationof more but leaky blood vessels involving Wnt signaling andinhibition of Dickkopf1 (DKK1) in a neuroendocrine tumormodel (3, 4) and Ephrin-B2 signaling in a glioblastoma (GBM)model (5). TNC networks can have similarities with reticularfibers in lymphoid organs (6) and may alter the biomechanicalproperties of cancer tissue (7), in particular increase tissuestiffening (8). TNC also impairs actin stress fiber formation (9)and regulates gene expression, which may affect cell behaviorand tumor malignancy (10).
The actin polymerization state is interpreted by the cell throughtwo cotranscription factors, megakaryoblastic leukemia 1 (MKL1,myocardin-related transcription factorMRTF-A,MAL; ref. 11) andyes activating protein (YAP; refs. 12, 13). Under poorly adhesiveconditions, cells fail to polymerize actin and subsequently cannotform actin stress fibers. MKL1 binds to globular G-actin mono-mers and remains sequestered in the cytoplasm. In consequence,MKL1 cannot reach nuclear serum response factor (SRF) or DNAsequences to induce gene transcription (14, 15), and MKL1-dependent genes remain silent.
YAP and TAZ (transcriptional coactivator with PDZ-bindingmotif) proteins are integral parts of the Hippo signalingpathway that is important for organ growth control duringdevelopment and is often found to be deregulated in cancer
1INSERM U1109 - MN3T, The Microenvironmental Niche in Tumorigenesis andTargeted Therapy, Hopital Civil, Institut d'H�ematologie et d'Immunologie,Strasbourg, France. 2Universit�e de Strasbourg, Strasbourg, France. 3LabExMedalis, Universit�e de Strasbourg, Strasbourg, France. 4F�ed�eration deM�edecineTranslationnelle de Strasbourg (FMTS), Strasbourg, France.
Note: Supplementary data for this article are available at Cancer ResearchOnline (http://cancerres.aacrjournals.org/).
Z. Sun, A. Schwenzer, and T. Rupp contributed equally to this article.
Current address for Z. Sun: Tongji Cancer Research Institute, Tongji Hospital,Tongji Medical College in Huazhong, University of Science and Technology,Wuhan, Hubei, China; Department of Gastrointestinal Surgery, Tongji Hospital,Tongji Medical College in Huazhong, University of Science and Technology,Wuhan, Hubei, China; current address for A. Schwenzer: Kennedy Institute ofRheumatology, Nuffield Department of Orthopaedics, Rheumatology and Mus-culoskeletal Sciences, University of Oxford, Oxford, UK; and current address forT. Rupp: Porsolt, Research Laboratory, Z.A. de Glatign�e, 53940 Le Genest-Saint-Isle, France.
Corresponding Author:Gertraud Orend, INSERM, 1, Place de l'Hopital, Strasbourg67091, Cedex, France. Phone: 0033-0-3-68-85-39-96; E-mail:[email protected]
doi: 10.1158/0008-5472.CAN-17-1597
�2017 American Association for Cancer Research.
CancerResearch
Cancer Res; 78(4) February 15, 2018950
on April 3, 2018. © 2018 American Association for Cancer Research. cancerres.aacrjournals.org Downloaded from
Published OnlineFirst December 19, 2017; DOI: 10.1158/0008-5472.CAN-17-1597
309
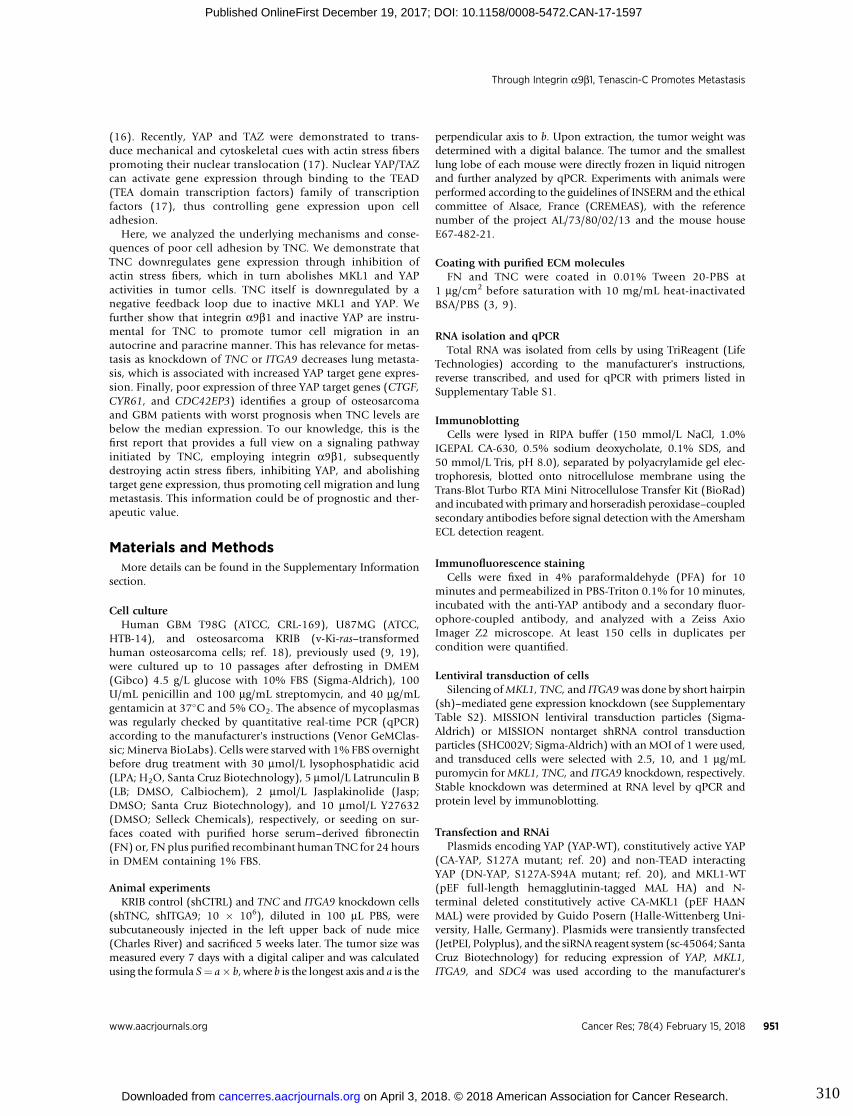
(16). Recently, YAP and TAZ were demonstrated to trans-duce mechanical and cytoskeletal cues with actin stress fiberspromoting their nuclear translocation (17). Nuclear YAP/TAZcan activate gene expression through binding to the TEAD(TEA domain transcription factors) family of transcriptionfactors (17), thus controlling gene expression upon celladhesion.
Here, we analyzed the underlying mechanisms and conse-quences of poor cell adhesion by TNC. We demonstrate thatTNC downregulates gene expression through inhibition ofactin stress fibers, which in turn abolishes MKL1 and YAPactivities in tumor cells. TNC itself is downregulated by anegative feedback loop due to inactive MKL1 and YAP. Wefurther show that integrin a9b1 and inactive YAP are instru-mental for TNC to promote tumor cell migration in anautocrine and paracrine manner. This has relevance for metas-tasis as knockdown of TNC or ITGA9 decreases lung metasta-sis, which is associated with increased YAP target gene expres-sion. Finally, poor expression of three YAP target genes (CTGF,CYR61, and CDC42EP3) identifies a group of osteosarcomaand GBM patients with worst prognosis when TNC levels arebelow the median expression. To our knowledge, this is thefirst report that provides a full view on a signaling pathwayinitiated by TNC, employing integrin a9b1, subsequentlydestroying actin stress fibers, inhibiting YAP, and abolishingtarget gene expression, thus promoting cell migration and lungmetastasis. This information could be of prognostic and ther-apeutic value.
Materials and MethodsMore details can be found in the Supplementary Information
section.
Cell cultureHuman GBM T98G (ATCC, CRL-169), U87MG (ATCC,
HTB-14), and osteosarcoma KRIB (v-Ki-ras–transformedhuman osteosarcoma cells; ref. 18), previously used (9, 19),were cultured up to 10 passages after defrosting in DMEM(Gibco) 4.5 g/L glucose with 10% FBS (Sigma-Aldrich), 100U/mL penicillin and 100 mg/mL streptomycin, and 40 mg/mLgentamicin at 37�C and 5% CO2. The absence of mycoplasmaswas regularly checked by quantitative real-time PCR (qPCR)according to the manufacturer's instructions (Venor GeMClas-sic; Minerva BioLabs). Cells were starved with 1% FBS overnightbefore drug treatment with 30 mmol/L lysophosphatidic acid(LPA; H2O, Santa Cruz Biotechnology), 5 mmol/L Latrunculin B(LB; DMSO, Calbiochem), 2 mmol/L Jasplakinolide (Jasp;DMSO; Santa Cruz Biotechnology), and 10 mmol/L Y27632(DMSO; Selleck Chemicals), respectively, or seeding on sur-faces coated with purified horse serum–derived fibronectin(FN) or, FN plus purified recombinant human TNC for 24 hoursin DMEM containing 1% FBS.
Animal experimentsKRIB control (shCTRL) and TNC and ITGA9 knockdown cells
(shTNC, shITGA9; 10 � 106), diluted in 100 mL PBS, weresubcutaneously injected in the left upper back of nude mice(Charles River) and sacrificed 5 weeks later. The tumor size wasmeasured every 7 days with a digital caliper and was calculatedusing the formula S¼ a� b, where b is the longest axis and a is the
perpendicular axis to b. Upon extraction, the tumor weight wasdetermined with a digital balance. The tumor and the smallestlung lobe of each mouse were directly frozen in liquid nitrogenand further analyzed by qPCR. Experiments with animals wereperformed according to the guidelines of INSERM and the ethicalcommittee of Alsace, France (CREMEAS), with the referencenumber of the project AL/73/80/02/13 and the mouse houseE67-482-21.
Coating with purified ECM moleculesFN and TNC were coated in 0.01% Tween 20-PBS at
1 mg/cm2 before saturation with 10 mg/mL heat-inactivatedBSA/PBS (3, 9).
RNA isolation and qPCRTotal RNA was isolated from cells by using TriReagent (Life
Technologies) according to the manufacturer's instructions,reverse transcribed, and used for qPCR with primers listed inSupplementary Table S1.
ImmunoblottingCells were lysed in RIPA buffer (150 mmol/L NaCl, 1.0%
IGEPAL CA-630, 0.5% sodium deoxycholate, 0.1% SDS, and50 mmol/L Tris, pH 8.0), separated by polyacrylamide gel elec-trophoresis, blotted onto nitrocellulose membrane using theTrans-Blot Turbo RTA Mini Nitrocellulose Transfer Kit (BioRad)and incubatedwith primary and horseradish peroxidase–coupledsecondary antibodies before signal detection with the AmershamECL detection reagent.
Immunofluorescence stainingCells were fixed in 4% paraformaldehyde (PFA) for 10
minutes and permeabilized in PBS-Triton 0.1% for 10 minutes,incubated with the anti-YAP antibody and a secondary fluor-ophore-coupled antibody, and analyzed with a Zeiss AxioImager Z2 microscope. At least 150 cells in duplicates percondition were quantified.
Lentiviral transduction of cellsSilencing ofMKL1, TNC, and ITGA9was done by short hairpin
(sh)–mediated gene expression knockdown (see SupplementaryTable S2). MISSION lentiviral transduction particles (Sigma-Aldrich) or MISSION nontarget shRNA control transductionparticles (SHC002V; Sigma-Aldrich) with anMOI of 1 were used,and transduced cells were selected with 2.5, 10, and 1 mg/mLpuromycin forMKL1, TNC, and ITGA9 knockdown, respectively.Stable knockdown was determined at RNA level by qPCR andprotein level by immunoblotting.
Transfection and RNAiPlasmids encoding YAP (YAP-WT), constitutively active YAP
(CA-YAP, S127A mutant; ref. 20) and non-TEAD interactingYAP (DN-YAP, S127A-S94A mutant; ref. 20), and MKL1-WT(pEF full-length hemagglutinin-tagged MAL HA) and N-terminal deleted constitutively active CA-MKL1 (pEF HADNMAL) were provided by Guido Posern (Halle-Wittenberg Uni-versity, Halle, Germany). Plasmids were transiently transfected(JetPEI, Polyplus), and the siRNA reagent system (sc-45064; SantaCruz Biotechnology) for reducing expression of YAP, MKL1,ITGA9, and SDC4 was used according to the manufacturer's
Through Integrin a9b1, Tenascin-C Promotes Metastasis
www.aacrjournals.org Cancer Res; 78(4) February 15, 2018 951
on April 3, 2018. © 2018 American Association for Cancer Research. cancerres.aacrjournals.org Downloaded from
Published OnlineFirst December 19, 2017; DOI: 10.1158/0008-5472.CAN-17-1597
310
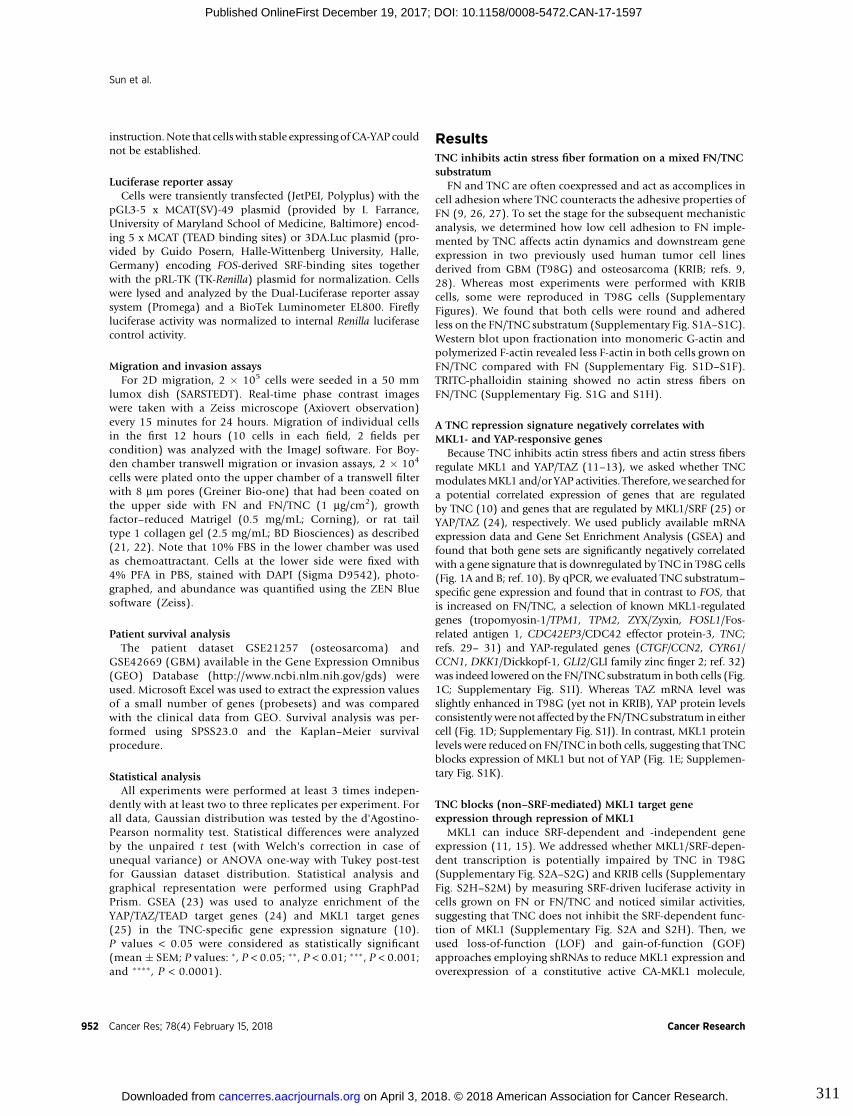
instruction.Note that cellswith stable expressing ofCA-YAP couldnot be established.
Luciferase reporter assayCells were transiently transfected (JetPEI, Polyplus) with the
pGL3-5 x MCAT(SV)-49 plasmid (provided by I. Farrance,University of Maryland School of Medicine, Baltimore) encod-ing 5 x MCAT (TEAD binding sites) or 3DA.Luc plasmid (pro-vided by Guido Posern, Halle-Wittenberg University, Halle,Germany) encoding FOS-derived SRF-binding sites togetherwith the pRL-TK (TK-Renilla) plasmid for normalization. Cellswere lysed and analyzed by the Dual-Luciferase reporter assaysystem (Promega) and a BioTek Luminometer EL800. Fireflyluciferase activity was normalized to internal Renilla luciferasecontrol activity.
Migration and invasion assaysFor 2D migration, 2 � 105 cells were seeded in a 50 mm
lumox dish (SARSTEDT). Real-time phase contrast imageswere taken with a Zeiss microscope (Axiovert observation)every 15 minutes for 24 hours. Migration of individual cellsin the first 12 hours (10 cells in each field, 2 fields percondition) was analyzed with the ImageJ software. For Boy-den chamber transwell migration or invasion assays, 2 � 104
cells were plated onto the upper chamber of a transwell filterwith 8 mm pores (Greiner Bio-one) that had been coated onthe upper side with FN and FN/TNC (1 mg/cm2), growthfactor–reduced Matrigel (0.5 mg/mL; Corning), or rat tailtype 1 collagen gel (2.5 mg/mL; BD Biosciences) as described(21, 22). Note that 10% FBS in the lower chamber was usedas chemoattractant. Cells at the lower side were fixed with4% PFA in PBS, stained with DAPI (Sigma D9542), photo-graphed, and abundance was quantified using the ZEN Bluesoftware (Zeiss).
Patient survival analysisThe patient dataset GSE21257 (osteosarcoma) and
GSE42669 (GBM) available in the Gene Expression Omnibus(GEO) Database (http://www.ncbi.nlm.nih.gov/gds) wereused. Microsoft Excel was used to extract the expression valuesof a small number of genes (probesets) and was comparedwith the clinical data from GEO. Survival analysis was per-formed using SPSS23.0 and the Kaplan–Meier survivalprocedure.
Statistical analysisAll experiments were performed at least 3 times indepen-
dently with at least two to three replicates per experiment. Forall data, Gaussian distribution was tested by the d'Agostino-Pearson normality test. Statistical differences were analyzedby the unpaired t test (with Welch's correction in case ofunequal variance) or ANOVA one-way with Tukey post-testfor Gaussian dataset distribution. Statistical analysis andgraphical representation were performed using GraphPadPrism. GSEA (23) was used to analyze enrichment of theYAP/TAZ/TEAD target genes (24) and MKL1 target genes(25) in the TNC-specific gene expression signature (10).P values < 0.05 were considered as statistically significant(mean � SEM; P values: �, P < 0.05; ��, P < 0.01; ���, P < 0.001;and ����, P < 0.0001).
ResultsTNC inhibits actin stress fiber formation on a mixed FN/TNCsubstratum
FN and TNC are often coexpressed and act as accomplices incell adhesion where TNC counteracts the adhesive properties ofFN (9, 26, 27). To set the stage for the subsequent mechanisticanalysis, we determined how low cell adhesion to FN imple-mented by TNC affects actin dynamics and downstream geneexpression in two previously used human tumor cell linesderived from GBM (T98G) and osteosarcoma (KRIB; refs. 9,28). Whereas most experiments were performed with KRIBcells, some were reproduced in T98G cells (SupplementaryFigures). We found that both cells were round and adheredless on the FN/TNC substratum (Supplementary Fig. S1A–S1C).Western blot upon fractionation into monomeric G-actin andpolymerized F-actin revealed less F-actin in both cells grown onFN/TNC compared with FN (Supplementary Fig. S1D–S1F).TRITC-phalloidin staining showed no actin stress fibers onFN/TNC (Supplementary Fig. S1G and S1H).
A TNC repression signature negatively correlates withMKL1- and YAP-responsive genes
Because TNC inhibits actin stress fibers and actin stress fibersregulate MKL1 and YAP/TAZ (11–13), we asked whether TNCmodulatesMKL1 and/or YAP activities. Therefore, we searched fora potential correlated expression of genes that are regulatedby TNC (10) and genes that are regulated by MKL1/SRF (25) orYAP/TAZ (24), respectively. We used publicly available mRNAexpression data and Gene Set Enrichment Analysis (GSEA) andfound that both gene sets are significantly negatively correlatedwith a gene signature that is downregulated by TNC in T98G cells(Fig. 1A and B; ref. 10). By qPCR, we evaluated TNC substratum–
specific gene expression and found that in contrast to FOS, thatis increased on FN/TNC, a selection of known MKL1-regulatedgenes (tropomyosin-1/TPM1, TPM2, ZYX/Zyxin, FOSL1/Fos-related antigen 1, CDC42EP3/CDC42 effector protein-3, TNC;refs. 29– 31) and YAP-regulated genes (CTGF/CCN2, CYR61/CCN1, DKK1/Dickkopf-1, GLI2/GLI family zinc finger 2; ref. 32)was indeed lowered on the FN/TNC substratum in both cells (Fig.1C; Supplementary Fig. S1I). Whereas TAZ mRNA level wasslightly enhanced in T98G (yet not in KRIB), YAP protein levelsconsistently were not affected by the FN/TNC substratum in eithercell (Fig. 1D; Supplementary Fig. S1J). In contrast, MKL1 proteinlevels were reduced on FN/TNC in both cells, suggesting that TNCblocks expression of MKL1 but not of YAP (Fig. 1E; Supplemen-tary Fig. S1K).
TNC blocks (non–SRF-mediated) MKL1 target geneexpression through repression of MKL1
MKL1 can induce SRF-dependent and -independent geneexpression (11, 15). We addressed whether MKL1/SRF-depen-dent transcription is potentially impaired by TNC in T98G(Supplementary Fig. S2A–S2G) and KRIB cells (SupplementaryFig. S2H–S2M) by measuring SRF-driven luciferase activity incells grown on FN or FN/TNC and noticed similar activities,suggesting that TNC does not inhibit the SRF-dependent func-tion of MKL1 (Supplementary Fig. S2A and S2H). Then, weused loss-of-function (LOF) and gain-of-function (GOF)approaches employing shRNAs to reduce MKL1 expression andoverexpression of a constitutive active CA-MKL1 molecule,
Sun et al.
Cancer Res; 78(4) February 15, 2018 Cancer Research952
on April 3, 2018. © 2018 American Association for Cancer Research. cancerres.aacrjournals.org Downloaded from
Published OnlineFirst December 19, 2017; DOI: 10.1158/0008-5472.CAN-17-1597
311
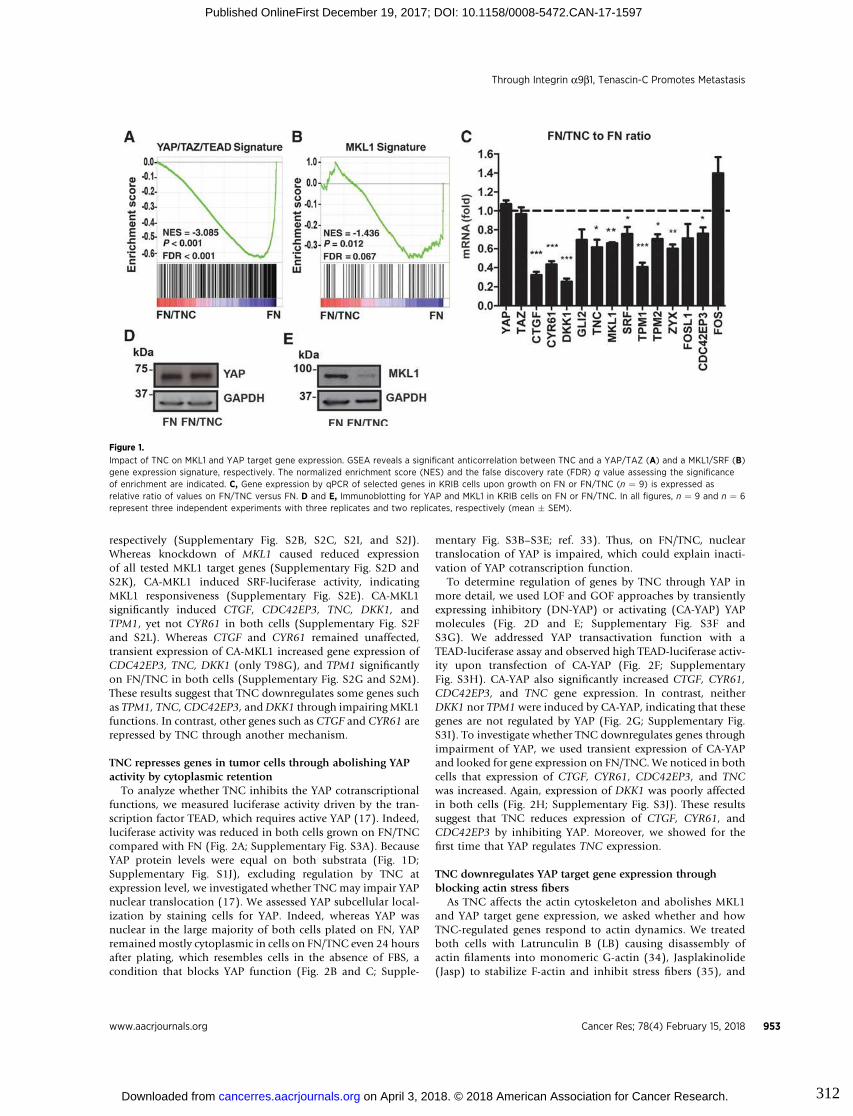
respectively (Supplementary Fig. S2B, S2C, S2I, and S2J).Whereas knockdown of MKL1 caused reduced expressionof all tested MKL1 target genes (Supplementary Fig. S2D andS2K), CA-MKL1 induced SRF-luciferase activity, indicatingMKL1 responsiveness (Supplementary Fig. S2E). CA-MKL1significantly induced CTGF, CDC42EP3, TNC, DKK1, andTPM1, yet not CYR61 in both cells (Supplementary Fig. S2Fand S2L). Whereas CTGF and CYR61 remained unaffected,transient expression of CA-MKL1 increased gene expression ofCDC42EP3, TNC, DKK1 (only T98G), and TPM1 significantlyon FN/TNC in both cells (Supplementary Fig. S2G and S2M).These results suggest that TNC downregulates some genes suchas TPM1, TNC, CDC42EP3, andDKK1 through impairing MKL1functions. In contrast, other genes such as CTGF and CYR61 arerepressed by TNC through another mechanism.
TNC represses genes in tumor cells through abolishing YAPactivity by cytoplasmic retention
To analyze whether TNC inhibits the YAP cotranscriptionalfunctions, we measured luciferase activity driven by the tran-scription factor TEAD, which requires active YAP (17). Indeed,luciferase activity was reduced in both cells grown on FN/TNCcompared with FN (Fig. 2A; Supplementary Fig. S3A). BecauseYAP protein levels were equal on both substrata (Fig. 1D;Supplementary Fig. S1J), excluding regulation by TNC atexpression level, we investigated whether TNC may impair YAPnuclear translocation (17). We assessed YAP subcellular local-ization by staining cells for YAP. Indeed, whereas YAP wasnuclear in the large majority of both cells plated on FN, YAPremainedmostly cytoplasmic in cells on FN/TNC even 24 hoursafter plating, which resembles cells in the absence of FBS, acondition that blocks YAP function (Fig. 2B and C; Supple-
mentary Fig. S3B–S3E; ref. 33). Thus, on FN/TNC, nucleartranslocation of YAP is impaired, which could explain inacti-vation of YAP cotranscription function.
To determine regulation of genes by TNC through YAP inmore detail, we used LOF and GOF approaches by transientlyexpressing inhibitory (DN-YAP) or activating (CA-YAP) YAPmolecules (Fig. 2D and E; Supplementary Fig. S3F andS3G). We addressed YAP transactivation function with aTEAD-luciferase assay and observed high TEAD-luciferase activ-ity upon transfection of CA-YAP (Fig. 2F; SupplementaryFig. S3H). CA-YAP also significantly increased CTGF, CYR61,CDC42EP3, and TNC gene expression. In contrast, neitherDKK1 nor TPM1 were induced by CA-YAP, indicating that thesegenes are not regulated by YAP (Fig. 2G; Supplementary Fig.S3I). To investigate whether TNC downregulates genes throughimpairment of YAP, we used transient expression of CA-YAPand looked for gene expression on FN/TNC. We noticed in bothcells that expression of CTGF, CYR61, CDC42EP3, and TNCwas increased. Again, expression of DKK1 was poorly affectedin both cells (Fig. 2H; Supplementary Fig. S3J). These resultssuggest that TNC reduces expression of CTGF, CYR61, andCDC42EP3 by inhibiting YAP. Moreover, we showed for thefirst time that YAP regulates TNC expression.
TNC downregulates YAP target gene expression throughblocking actin stress fibers
As TNC affects the actin cytoskeleton and abolishes MKL1and YAP target gene expression, we asked whether and howTNC-regulated genes respond to actin dynamics. We treatedboth cells with Latrunculin B (LB) causing disassembly ofactin filaments into monomeric G-actin (34), Jasplakinolide(Jasp) to stabilize F-actin and inhibit stress fibers (35), and
Figure 1.
Impact of TNC on MKL1 and YAP target gene expression. GSEA reveals a significant anticorrelation between TNC and a YAP/TAZ (A) and a MKL1/SRF (B)gene expression signature, respectively. The normalized enrichment score (NES) and the false discovery rate (FDR) q value assessing the significanceof enrichment are indicated. C, Gene expression by qPCR of selected genes in KRIB cells upon growth on FN or FN/TNC (n ¼ 9) is expressed asrelative ratio of values on FN/TNC versus FN. D and E, Immunoblotting for YAP and MKL1 in KRIB cells on FN or FN/TNC. In all figures, n ¼ 9 and n ¼ 6represent three independent experiments with three replicates and two replicates, respectively (mean � SEM).
Through Integrin a9b1, Tenascin-C Promotes Metastasis
www.aacrjournals.org Cancer Res; 78(4) February 15, 2018 953
on April 3, 2018. © 2018 American Association for Cancer Research. cancerres.aacrjournals.org Downloaded from
Published OnlineFirst December 19, 2017; DOI: 10.1158/0008-5472.CAN-17-1597
312
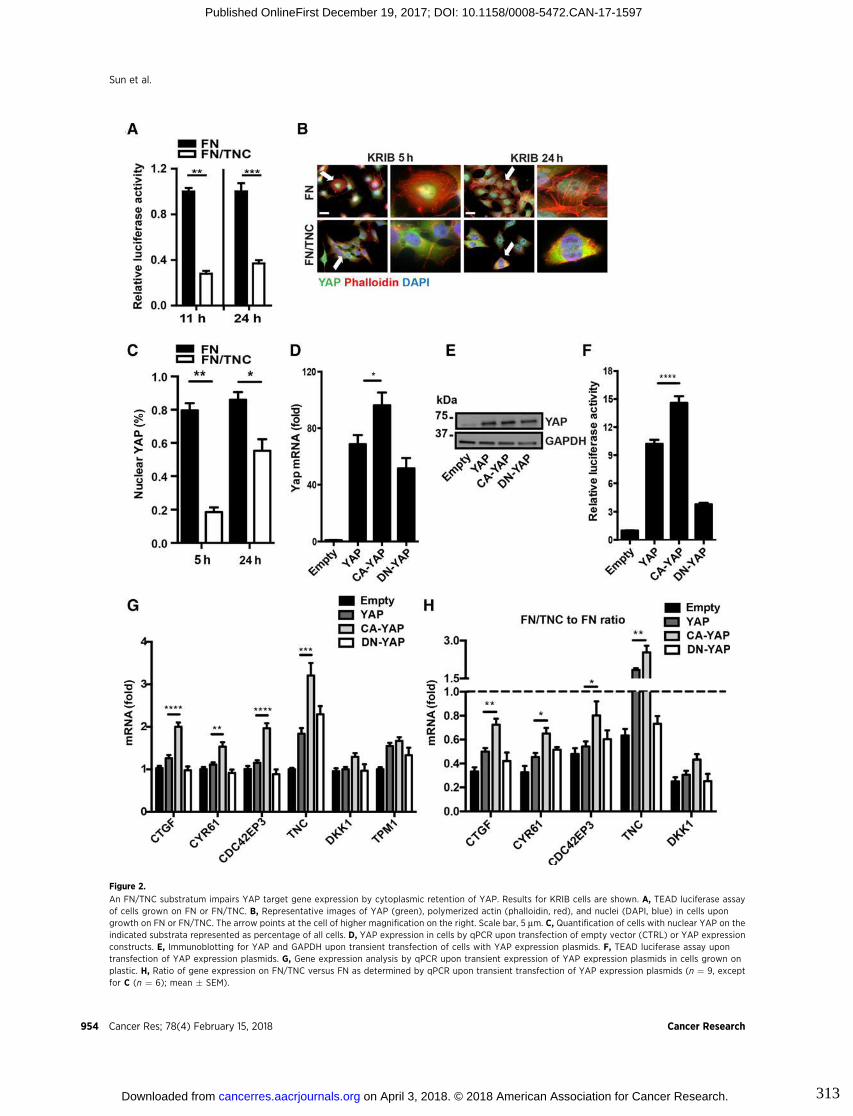
Figure 2.
An FN/TNC substratum impairs YAP target gene expression by cytoplasmic retention of YAP. Results for KRIB cells are shown. A, TEAD luciferase assayof cells grown on FN or FN/TNC. B, Representative images of YAP (green), polymerized actin (phalloidin, red), and nuclei (DAPI, blue) in cells upongrowth on FN or FN/TNC. The arrow points at the cell of higher magnification on the right. Scale bar, 5 mm. C, Quantification of cells with nuclear YAP on theindicated substrata represented as percentage of all cells. D, YAP expression in cells by qPCR upon transfection of empty vector (CTRL) or YAP expressionconstructs. E, Immunoblotting for YAP and GAPDH upon transient transfection of cells with YAP expression plasmids. F, TEAD luciferase assay upontransfection of YAP expression plasmids. G, Gene expression analysis by qPCR upon transient expression of YAP expression plasmids in cells grown onplastic. H, Ratio of gene expression on FN/TNC versus FN as determined by qPCR upon transient transfection of YAP expression plasmids (n ¼ 9, exceptfor C (n ¼ 6); mean � SEM).
Sun et al.
Cancer Res; 78(4) February 15, 2018 Cancer Research954
on April 3, 2018. © 2018 American Association for Cancer Research. cancerres.aacrjournals.org Downloaded from
Published OnlineFirst December 19, 2017; DOI: 10.1158/0008-5472.CAN-17-1597
313
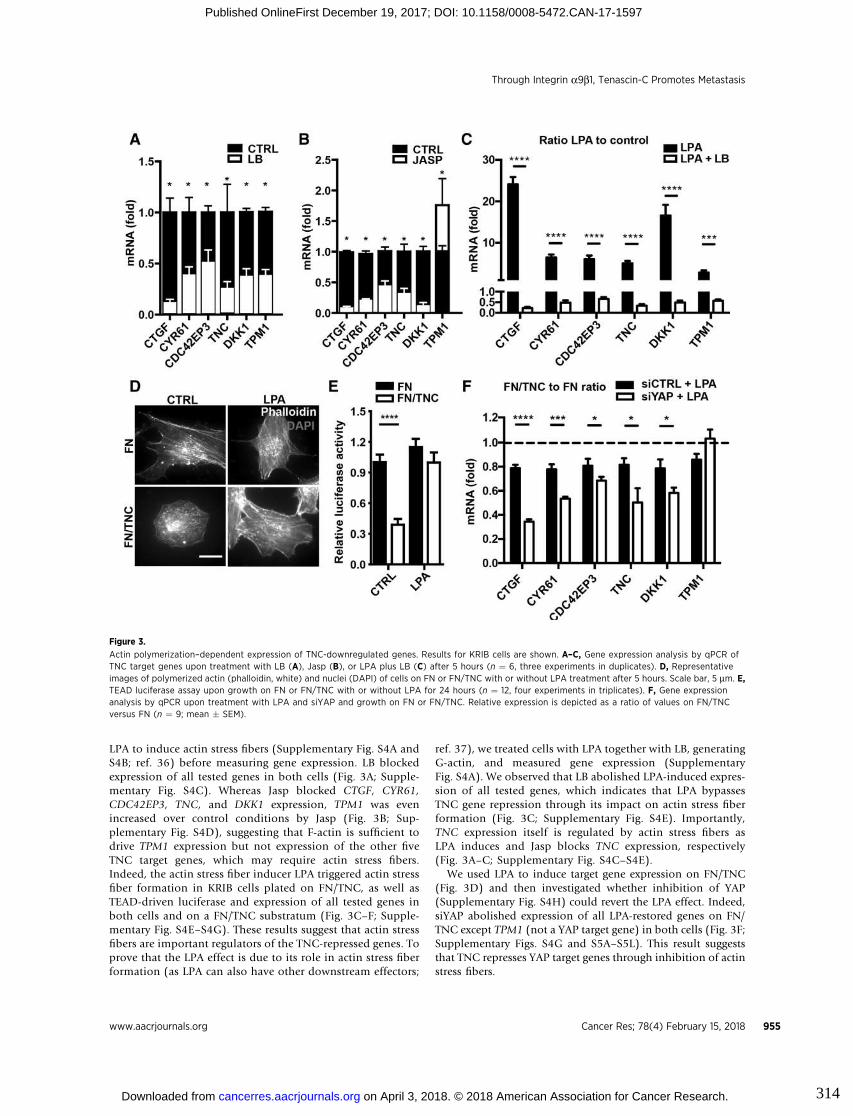
LPA to induce actin stress fibers (Supplementary Fig. S4A andS4B; ref. 36) before measuring gene expression. LB blockedexpression of all tested genes in both cells (Fig. 3A; Supple-mentary Fig. S4C). Whereas Jasp blocked CTGF, CYR61,CDC42EP3, TNC, and DKK1 expression, TPM1 was evenincreased over control conditions by Jasp (Fig. 3B; Sup-plementary Fig. S4D), suggesting that F-actin is sufficient todrive TPM1 expression but not expression of the other fiveTNC target genes, which may require actin stress fibers.Indeed, the actin stress fiber inducer LPA triggered actin stressfiber formation in KRIB cells plated on FN/TNC, as well asTEAD-driven luciferase and expression of all tested genes inboth cells and on a FN/TNC substratum (Fig. 3C–F; Supple-mentary Fig. S4E–S4G). These results suggest that actin stressfibers are important regulators of the TNC-repressed genes. Toprove that the LPA effect is due to its role in actin stress fiberformation (as LPA can also have other downstream effectors;
ref. 37), we treated cells with LPA together with LB, generatingG-actin, and measured gene expression (SupplementaryFig. S4A). We observed that LB abolished LPA-induced expres-sion of all tested genes, which indicates that LPA bypassesTNC gene repression through its impact on actin stress fiberformation (Fig. 3C; Supplementary Fig. S4E). Importantly,TNC expression itself is regulated by actin stress fibers asLPA induces and Jasp blocks TNC expression, respectively(Fig. 3A–C; Supplementary Fig. S4C–S4E).
We used LPA to induce target gene expression on FN/TNC(Fig. 3D) and then investigated whether inhibition of YAP(Supplementary Fig. S4H) could revert the LPA effect. Indeed,siYAP abolished expression of all LPA-restored genes on FN/TNC except TPM1 (not a YAP target gene) in both cells (Fig. 3F;Supplementary Figs. S4G and S5A–S5L). This result suggeststhat TNC represses YAP target genes through inhibition of actinstress fibers.
Figure 3.
Actin polymerization–dependent expression of TNC-downregulated genes. Results for KRIB cells are shown. A–C, Gene expression analysis by qPCR ofTNC target genes upon treatment with LB (A), Jasp (B), or LPA plus LB (C) after 5 hours (n ¼ 6, three experiments in duplicates). D, Representativeimages of polymerized actin (phalloidin, white) and nuclei (DAPI) of cells on FN or FN/TNC with or without LPA treatment after 5 hours. Scale bar, 5 mm. E,TEAD luciferase assay upon growth on FN or FN/TNC with or without LPA for 24 hours (n ¼ 12, four experiments in triplicates). F, Gene expressionanalysis by qPCR upon treatment with LPA and siYAP and growth on FN or FN/TNC. Relative expression is depicted as a ratio of values on FN/TNCversus FN (n ¼ 9; mean � SEM).
Through Integrin a9b1, Tenascin-C Promotes Metastasis
www.aacrjournals.org Cancer Res; 78(4) February 15, 2018 955
on April 3, 2018. © 2018 American Association for Cancer Research. cancerres.aacrjournals.org Downloaded from
Published OnlineFirst December 19, 2017; DOI: 10.1158/0008-5472.CAN-17-1597
314
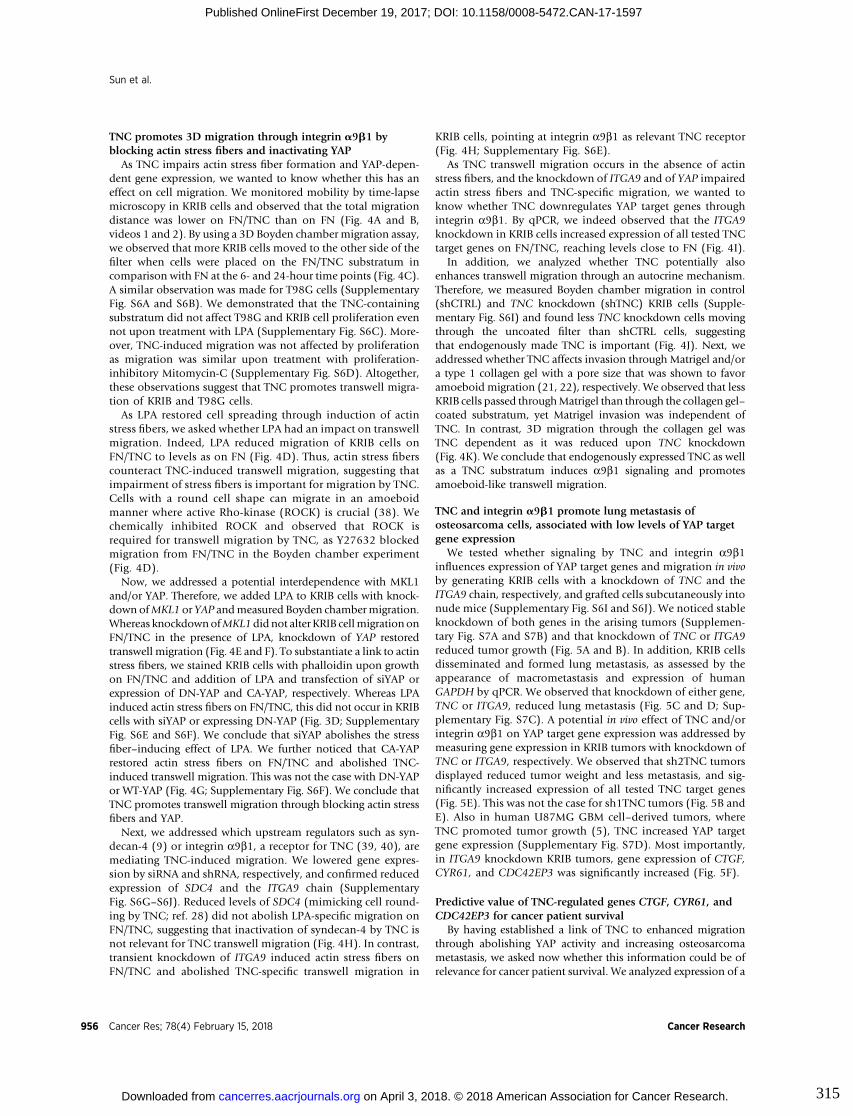
TNC promotes 3D migration through integrin a9b1 byblocking actin stress fibers and inactivating YAP
As TNC impairs actin stress fiber formation and YAP-depen-dent gene expression, we wanted to know whether this has aneffect on cell migration. We monitored mobility by time-lapsemicroscopy in KRIB cells and observed that the total migrationdistance was lower on FN/TNC than on FN (Fig. 4A and B,videos 1 and 2). By using a 3D Boyden chamber migration assay,we observed that more KRIB cells moved to the other side of thefilter when cells were placed on the FN/TNC substratum incomparison with FN at the 6- and 24-hour time points (Fig. 4C).A similar observation was made for T98G cells (SupplementaryFig. S6A and S6B). We demonstrated that the TNC-containingsubstratum did not affect T98G and KRIB cell proliferation evennot upon treatment with LPA (Supplementary Fig. S6C). More-over, TNC-induced migration was not affected by proliferationas migration was similar upon treatment with proliferation-inhibitory Mitomycin-C (Supplementary Fig. S6D). Altogether,these observations suggest that TNC promotes transwell migra-tion of KRIB and T98G cells.
As LPA restored cell spreading through induction of actinstress fibers, we asked whether LPA had an impact on transwellmigration. Indeed, LPA reduced migration of KRIB cells onFN/TNC to levels as on FN (Fig. 4D). Thus, actin stress fiberscounteract TNC-induced transwell migration, suggesting thatimpairment of stress fibers is important for migration by TNC.Cells with a round cell shape can migrate in an amoeboidmanner where active Rho-kinase (ROCK) is crucial (38). Wechemically inhibited ROCK and observed that ROCK isrequired for transwell migration by TNC, as Y27632 blockedmigration from FN/TNC in the Boyden chamber experiment(Fig. 4D).
Now, we addressed a potential interdependence with MKL1and/or YAP. Therefore, we added LPA to KRIB cells with knock-down ofMKL1 or YAP andmeasured Boyden chambermigration.Whereas knockdownofMKL1did not alter KRIB cellmigrationonFN/TNC in the presence of LPA, knockdown of YAP restoredtranswell migration (Fig. 4E and F). To substantiate a link to actinstress fibers, we stained KRIB cells with phalloidin upon growthon FN/TNC and addition of LPA and transfection of siYAP orexpression of DN-YAP and CA-YAP, respectively. Whereas LPAinduced actin stress fibers on FN/TNC, this did not occur in KRIBcells with siYAP or expressing DN-YAP (Fig. 3D; SupplementaryFig. S6E and S6F). We conclude that siYAP abolishes the stressfiber–inducing effect of LPA. We further noticed that CA-YAPrestored actin stress fibers on FN/TNC and abolished TNC-induced transwell migration. This was not the case with DN-YAPor WT-YAP (Fig. 4G; Supplementary Fig. S6F). We conclude thatTNC promotes transwell migration through blocking actin stressfibers and YAP.
Next, we addressed which upstream regulators such as syn-decan-4 (9) or integrin a9b1, a receptor for TNC (39, 40), aremediating TNC-induced migration. We lowered gene expres-sion by siRNA and shRNA, respectively, and confirmed reducedexpression of SDC4 and the ITGA9 chain (SupplementaryFig. S6G–S6J). Reduced levels of SDC4 (mimicking cell round-ing by TNC; ref. 28) did not abolish LPA-specific migration onFN/TNC, suggesting that inactivation of syndecan-4 by TNC isnot relevant for TNC transwell migration (Fig. 4H). In contrast,transient knockdown of ITGA9 induced actin stress fibers onFN/TNC and abolished TNC-specific transwell migration in
KRIB cells, pointing at integrin a9b1 as relevant TNC receptor(Fig. 4H; Supplementary Fig. S6E).
As TNC transwell migration occurs in the absence of actinstress fibers, and the knockdown of ITGA9 and of YAP impairedactin stress fibers and TNC-specific migration, we wanted toknow whether TNC downregulates YAP target genes throughintegrin a9b1. By qPCR, we indeed observed that the ITGA9knockdown in KRIB cells increased expression of all tested TNCtarget genes on FN/TNC, reaching levels close to FN (Fig. 4I).
In addition, we analyzed whether TNC potentially alsoenhances transwell migration through an autocrine mechanism.Therefore, we measured Boyden chamber migration in control(shCTRL) and TNC knockdown (shTNC) KRIB cells (Supple-mentary Fig. S6I) and found less TNC knockdown cells movingthrough the uncoated filter than shCTRL cells, suggestingthat endogenously made TNC is important (Fig. 4J). Next, weaddressed whether TNC affects invasion through Matrigel and/ora type 1 collagen gel with a pore size that was shown to favoramoeboid migration (21, 22), respectively. We observed that lessKRIB cells passed throughMatrigel than through the collagen gel–coated substratum, yet Matrigel invasion was independent ofTNC. In contrast, 3D migration through the collagen gel wasTNC dependent as it was reduced upon TNC knockdown(Fig. 4K). We conclude that endogenously expressed TNC as wellas a TNC substratum induces a9b1 signaling and promotesamoeboid-like transwell migration.
TNC and integrin a9b1 promote lung metastasis ofosteosarcoma cells, associated with low levels of YAP targetgene expression
We tested whether signaling by TNC and integrin a9b1influences expression of YAP target genes and migration in vivoby generating KRIB cells with a knockdown of TNC and theITGA9 chain, respectively, and grafted cells subcutaneously intonude mice (Supplementary Fig. S6I and S6J). We noticed stableknockdown of both genes in the arising tumors (Supplemen-tary Fig. S7A and S7B) and that knockdown of TNC or ITGA9reduced tumor growth (Fig. 5A and B). In addition, KRIB cellsdisseminated and formed lung metastasis, as assessed by theappearance of macrometastasis and expression of humanGAPDH by qPCR. We observed that knockdown of either gene,TNC or ITGA9, reduced lung metastasis (Fig. 5C and D; Sup-plementary Fig. S7C). A potential in vivo effect of TNC and/orintegrin a9b1 on YAP target gene expression was addressed bymeasuring gene expression in KRIB tumors with knockdown ofTNC or ITGA9, respectively. We observed that sh2TNC tumorsdisplayed reduced tumor weight and less metastasis, and sig-nificantly increased expression of all tested TNC target genes(Fig. 5E). This was not the case for sh1TNC tumors (Fig. 5B andE). Also in human U87MG GBM cell–derived tumors, whereTNC promoted tumor growth (5), TNC increased YAP targetgene expression (Supplementary Fig. S7D). Most importantly,in ITGA9 knockdown KRIB tumors, gene expression of CTGF,CYR61, and CDC42EP3 was significantly increased (Fig. 5F).
Predictive value of TNC-regulated genes CTGF, CYR61, andCDC42EP3 for cancer patient survival
By having established a link of TNC to enhanced migrationthrough abolishing YAP activity and increasing osteosarcomametastasis, we asked now whether this information could be ofrelevance for cancer patient survival. We analyzed expression of a
Sun et al.
Cancer Res; 78(4) February 15, 2018 Cancer Research956
on April 3, 2018. © 2018 American Association for Cancer Research. cancerres.aacrjournals.org Downloaded from
Published OnlineFirst December 19, 2017; DOI: 10.1158/0008-5472.CAN-17-1597
315
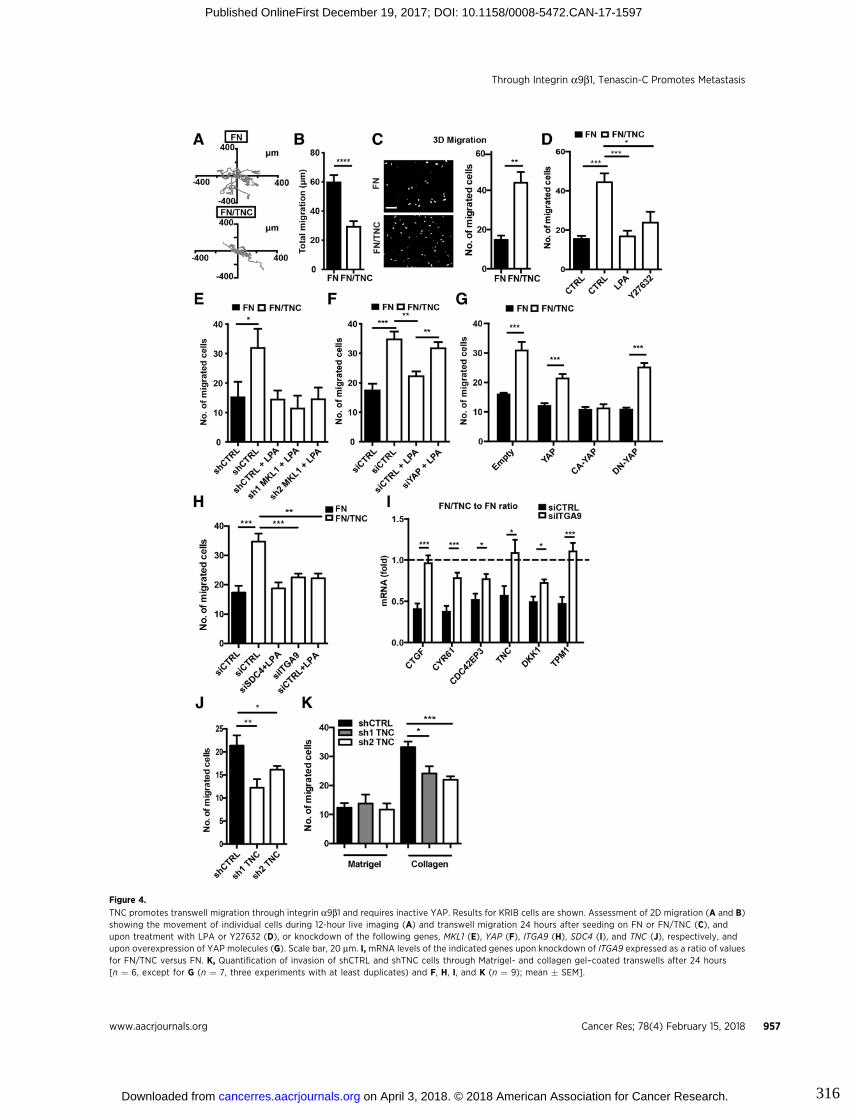
Figure 4.
TNC promotes transwell migration through integrin a9b1 and requires inactive YAP. Results for KRIB cells are shown. Assessment of 2D migration (A and B)showing the movement of individual cells during 12-hour live imaging (A) and transwell migration 24 hours after seeding on FN or FN/TNC (C), andupon treatment with LPA or Y27632 (D), or knockdown of the following genes, MKL1 (E), YAP (F), ITGA9 (H), SDC4 (I), and TNC (J), respectively, andupon overexpression of YAP molecules (G). Scale bar, 20 mm. I, mRNA levels of the indicated genes upon knockdown of ITGA9 expressed as a ratio of valuesfor FN/TNC versus FN. K, Quantification of invasion of shCTRL and shTNC cells through Matrigel- and collagen gel–coated transwells after 24 hours[n ¼ 6, except for G (n ¼ 7, three experiments with at least duplicates) and F, H, I, and K (n ¼ 9); mean � SEM].
Through Integrin a9b1, Tenascin-C Promotes Metastasis
www.aacrjournals.org Cancer Res; 78(4) February 15, 2018 957
on April 3, 2018. © 2018 American Association for Cancer Research. cancerres.aacrjournals.org Downloaded from
Published OnlineFirst December 19, 2017; DOI: 10.1158/0008-5472.CAN-17-1597
316
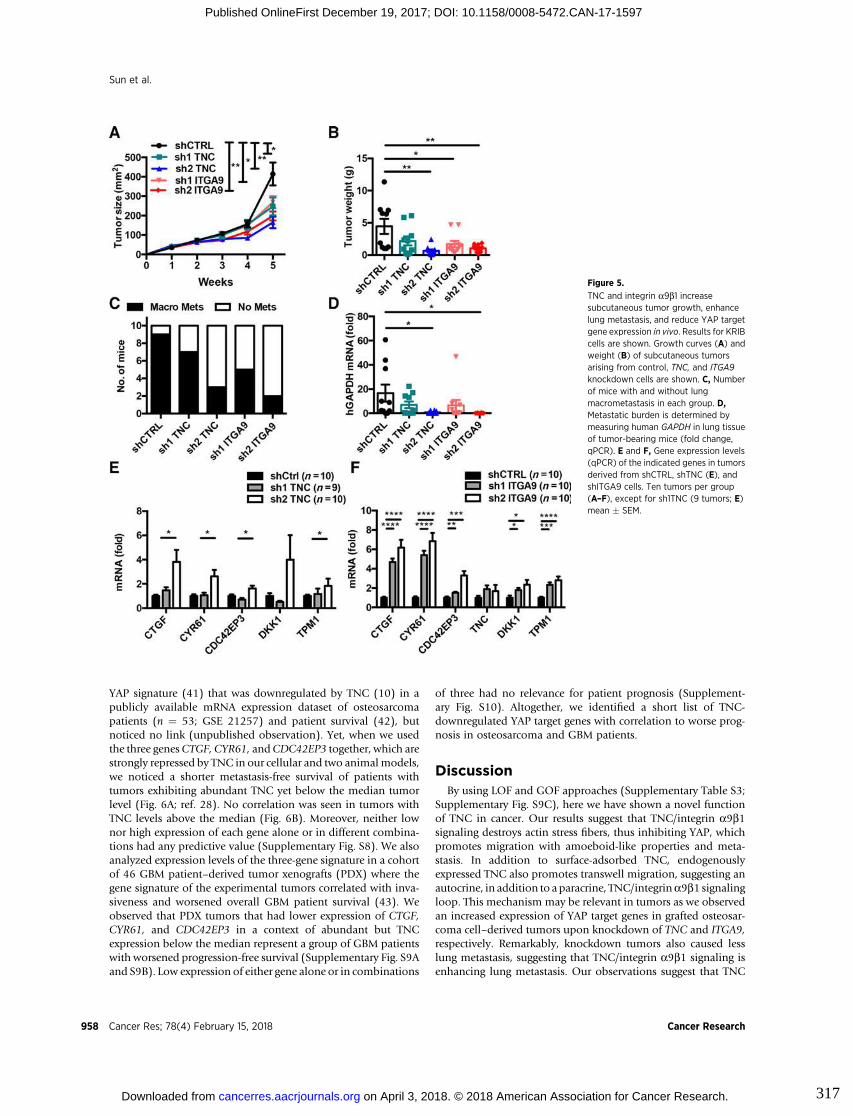
YAP signature (41) that was downregulated by TNC (10) in apublicly available mRNA expression dataset of osteosarcomapatients (n ¼ 53; GSE 21257) and patient survival (42), butnoticed no link (unpublished observation). Yet, when we usedthe three genesCTGF, CYR61, andCDC42EP3 together, which arestrongly repressed by TNC in our cellular and two animalmodels,we noticed a shorter metastasis-free survival of patients withtumors exhibiting abundant TNC yet below the median tumorlevel (Fig. 6A; ref. 28). No correlation was seen in tumors withTNC levels above the median (Fig. 6B). Moreover, neither lownor high expression of each gene alone or in different combina-tions had any predictive value (Supplementary Fig. S8). We alsoanalyzed expression levels of the three-gene signature in a cohortof 46 GBM patient–derived tumor xenografts (PDX) where thegene signature of the experimental tumors correlated with inva-siveness and worsened overall GBM patient survival (43). Weobserved that PDX tumors that had lower expression of CTGF,CYR61, and CDC42EP3 in a context of abundant but TNCexpression below the median represent a group of GBM patientswith worsened progression-free survival (Supplementary Fig. S9Aand S9B). Low expression of either gene alone or in combinations
of three had no relevance for patient prognosis (Supplement-ary Fig. S10). Altogether, we identified a short list of TNC-downregulated YAP target genes with correlation to worse prog-nosis in osteosarcoma and GBM patients.
DiscussionBy using LOF and GOF approaches (Supplementary Table S3;
Supplementary Fig. S9C), here we have shown a novel functionof TNC in cancer. Our results suggest that TNC/integrin a9b1signaling destroys actin stress fibers, thus inhibiting YAP, whichpromotes migration with amoeboid-like properties and meta-stasis. In addition to surface-adsorbed TNC, endogenouslyexpressed TNC also promotes transwell migration, suggesting anautocrine, in addition to aparacrine, TNC/integrina9b1 signalingloop. This mechanism may be relevant in tumors as we observedan increased expression of YAP target genes in grafted osteosar-coma cell–derived tumors upon knockdown of TNC and ITGA9,respectively. Remarkably, knockdown tumors also caused lesslung metastasis, suggesting that TNC/integrin a9b1 signaling isenhancing lung metastasis. Our observations suggest that TNC
Figure 5.
TNC and integrin a9b1 increasesubcutaneous tumor growth, enhancelung metastasis, and reduce YAP targetgene expression in vivo. Results for KRIBcells are shown. Growth curves (A) andweight (B) of subcutaneous tumorsarising from control, TNC, and ITGA9knockdown cells are shown. C, Numberof mice with and without lungmacrometastasis in each group. D,Metastatic burden is determined bymeasuring human GAPDH in lung tissueof tumor-bearing mice (fold change,qPCR). E and F, Gene expression levels(qPCR) of the indicated genes in tumorsderived from shCTRL, shTNC (E), andshITGA9 cells. Ten tumors per group(A–F), except for sh1TNC (9 tumors; E)mean � SEM.
Sun et al.
Cancer Res; 78(4) February 15, 2018 Cancer Research958
on April 3, 2018. © 2018 American Association for Cancer Research. cancerres.aacrjournals.org Downloaded from
Published OnlineFirst December 19, 2017; DOI: 10.1158/0008-5472.CAN-17-1597
317
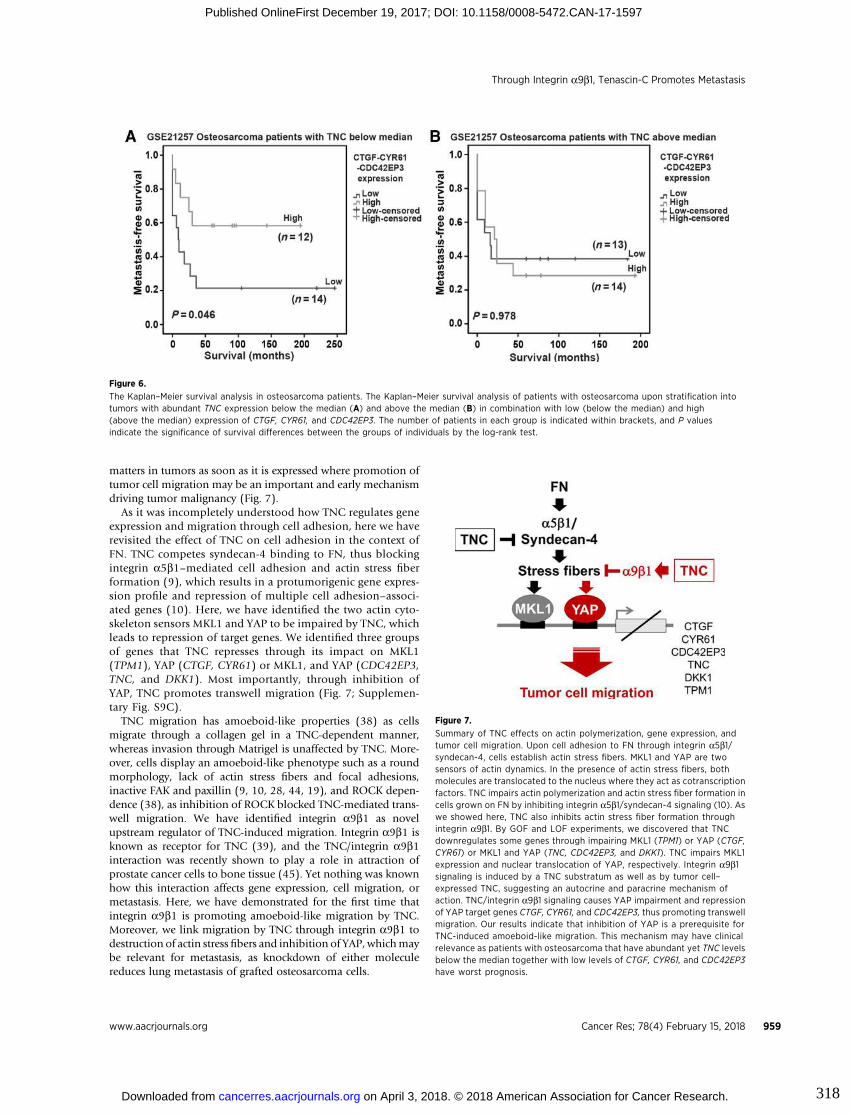
matters in tumors as soon as it is expressed where promotion oftumor cell migration may be an important and early mechanismdriving tumor malignancy (Fig. 7).
As it was incompletely understood how TNC regulates geneexpression and migration through cell adhesion, here we haverevisited the effect of TNC on cell adhesion in the context ofFN. TNC competes syndecan-4 binding to FN, thus blockingintegrin a5b1–mediated cell adhesion and actin stress fiberformation (9), which results in a protumorigenic gene expres-sion profile and repression of multiple cell adhesion–associ-ated genes (10). Here, we have identified the two actin cyto-skeleton sensors MKL1 and YAP to be impaired by TNC, whichleads to repression of target genes. We identified three groupsof genes that TNC represses through its impact on MKL1(TPM1), YAP (CTGF, CYR61) or MKL1, and YAP (CDC42EP3,TNC, and DKK1). Most importantly, through inhibition ofYAP, TNC promotes transwell migration (Fig. 7; Supplemen-tary Fig. S9C).
TNC migration has amoeboid-like properties (38) as cellsmigrate through a collagen gel in a TNC-dependent manner,whereas invasion through Matrigel is unaffected by TNC. More-over, cells display an amoeboid-like phenotype such as a roundmorphology, lack of actin stress fibers and focal adhesions,inactive FAK and paxillin (9, 10, 28, 44, 19), and ROCK depen-dence (38), as inhibition of ROCK blocked TNC-mediated trans-well migration. We have identified integrin a9b1 as novelupstream regulator of TNC-induced migration. Integrin a9b1 isknown as receptor for TNC (39), and the TNC/integrin a9b1interaction was recently shown to play a role in attraction ofprostate cancer cells to bone tissue (45). Yet nothing was knownhow this interaction affects gene expression, cell migration, ormetastasis. Here, we have demonstrated for the first time thatintegrin a9b1 is promoting amoeboid-like migration by TNC.Moreover, we link migration by TNC through integrin a9b1 todestruction of actin stress fibers and inhibition of YAP, whichmaybe relevant for metastasis, as knockdown of either moleculereduces lung metastasis of grafted osteosarcoma cells.
Figure 6.
The Kaplan–Meier survival analysis in osteosarcoma patients. The Kaplan–Meier survival analysis of patients with osteosarcoma upon stratification intotumors with abundant TNC expression below the median (A) and above the median (B) in combination with low (below the median) and high(above the median) expression of CTGF, CYR61, and CDC42EP3. The number of patients in each group is indicated within brackets, and P valuesindicate the significance of survival differences between the groups of individuals by the log-rank test.
Figure 7.
Summary of TNC effects on actin polymerization, gene expression, andtumor cell migration. Upon cell adhesion to FN through integrin a5b1/syndecan-4, cells establish actin stress fibers. MKL1 and YAP are twosensors of actin dynamics. In the presence of actin stress fibers, bothmolecules are translocated to the nucleus where they act as cotranscriptionfactors. TNC impairs actin polymerization and actin stress fiber formation incells grown on FN by inhibiting integrin a5b1/syndecan-4 signaling (10). Aswe showed here, TNC also inhibits actin stress fiber formation throughintegrin a9b1. By GOF and LOF experiments, we discovered that TNCdownregulates some genes through impairing MKL1 (TPM1) or YAP (CTGF,CYR61) or MKL1 and YAP (TNC, CDC42EP3, and DKK1). TNC impairs MKL1expression and nuclear translocation of YAP, respectively. Integrin a9b1signaling is induced by a TNC substratum as well as by tumor cell–expressed TNC, suggesting an autocrine and paracrine mechanism ofaction. TNC/integrin a9b1 signaling causes YAP impairment and repressionof YAP target genes CTGF, CYR61, and CDC42EP3, thus promoting transwellmigration. Our results indicate that inhibition of YAP is a prerequisite forTNC-induced amoeboid-like migration. This mechanism may have clinicalrelevance as patients with osteosarcoma that have abundant yet TNC levelsbelow the median together with low levels of CTGF, CYR61, and CDC42EP3have worst prognosis.
Through Integrin a9b1, Tenascin-C Promotes Metastasis
www.aacrjournals.org Cancer Res; 78(4) February 15, 2018 959
on April 3, 2018. © 2018 American Association for Cancer Research. cancerres.aacrjournals.org Downloaded from
Published OnlineFirst December 19, 2017; DOI: 10.1158/0008-5472.CAN-17-1597
318
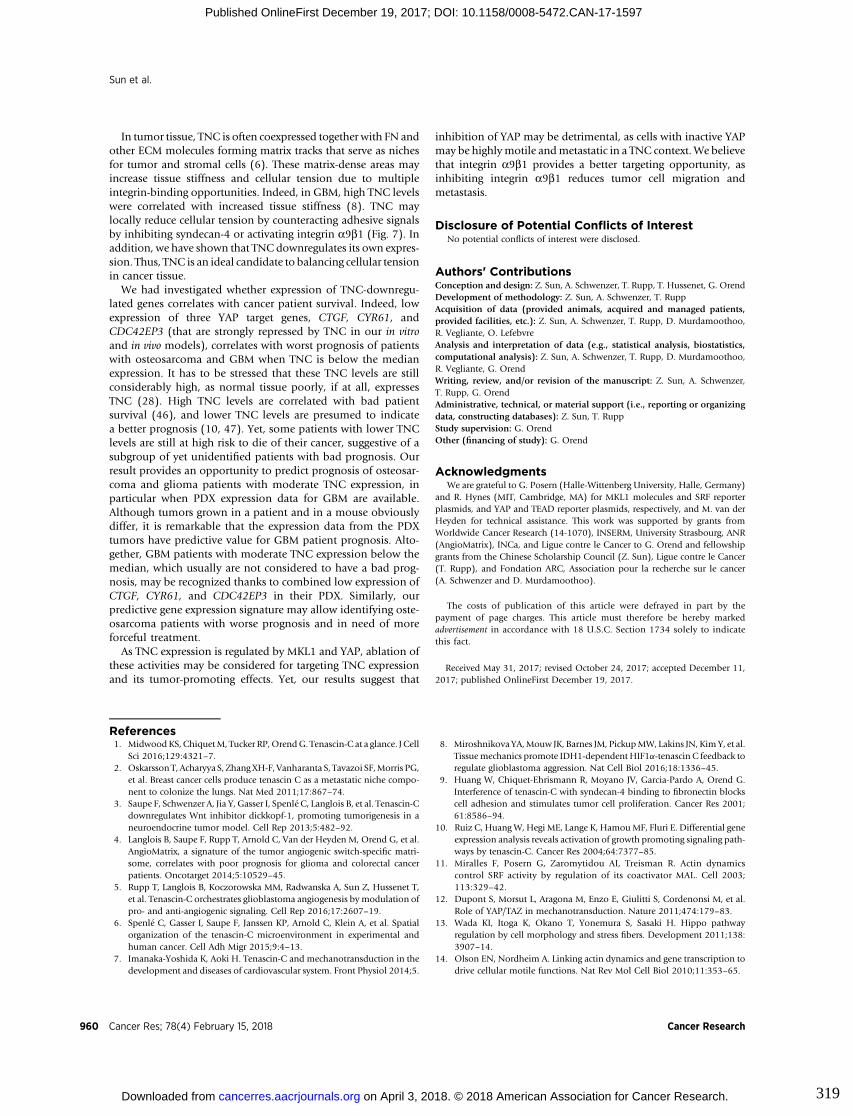
In tumor tissue, TNC is often coexpressed together with FN andother ECM molecules forming matrix tracks that serve as nichesfor tumor and stromal cells (6). These matrix-dense areas mayincrease tissue stiffness and cellular tension due to multipleintegrin-binding opportunities. Indeed, in GBM, high TNC levelswere correlated with increased tissue stiffness (8). TNC maylocally reduce cellular tension by counteracting adhesive signalsby inhibiting syndecan-4 or activating integrin a9b1 (Fig. 7). Inaddition, we have shown that TNC downregulates its own expres-sion. Thus, TNC is an ideal candidate to balancing cellular tensionin cancer tissue.
We had investigated whether expression of TNC-downregu-lated genes correlates with cancer patient survival. Indeed, lowexpression of three YAP target genes, CTGF, CYR61, andCDC42EP3 (that are strongly repressed by TNC in our in vitroand in vivo models), correlates with worst prognosis of patientswith osteosarcoma and GBM when TNC is below the medianexpression. It has to be stressed that these TNC levels are stillconsiderably high, as normal tissue poorly, if at all, expressesTNC (28). High TNC levels are correlated with bad patientsurvival (46), and lower TNC levels are presumed to indicatea better prognosis (10, 47). Yet, some patients with lower TNClevels are still at high risk to die of their cancer, suggestive of asubgroup of yet unidentified patients with bad prognosis. Ourresult provides an opportunity to predict prognosis of osteosar-coma and glioma patients with moderate TNC expression, inparticular when PDX expression data for GBM are available.Although tumors grown in a patient and in a mouse obviouslydiffer, it is remarkable that the expression data from the PDXtumors have predictive value for GBM patient prognosis. Alto-gether, GBM patients with moderate TNC expression below themedian, which usually are not considered to have a bad prog-nosis, may be recognized thanks to combined low expression ofCTGF, CYR61, and CDC42EP3 in their PDX. Similarly, ourpredictive gene expression signature may allow identifying oste-osarcoma patients with worse prognosis and in need of moreforceful treatment.
As TNC expression is regulated by MKL1 and YAP, ablation ofthese activities may be considered for targeting TNC expressionand its tumor-promoting effects. Yet, our results suggest that
inhibition of YAP may be detrimental, as cells with inactive YAPmay be highlymotile andmetastatic in a TNC context. We believethat integrin a9b1 provides a better targeting opportunity, asinhibiting integrin a9b1 reduces tumor cell migration andmetastasis.
Disclosure of Potential Conflicts of InterestNo potential conflicts of interest were disclosed.
Authors' ContributionsConception and design: Z. Sun, A. Schwenzer, T. Rupp, T. Hussenet, G. OrendDevelopment of methodology: Z. Sun, A. Schwenzer, T. RuppAcquisition of data (provided animals, acquired and managed patients,provided facilities, etc.): Z. Sun, A. Schwenzer, T. Rupp, D. Murdamoothoo,R. Vegliante, O. LefebvreAnalysis and interpretation of data (e.g., statistical analysis, biostatistics,computational analysis): Z. Sun, A. Schwenzer, T. Rupp, D. Murdamoothoo,R. Vegliante, G. OrendWriting, review, and/or revision of the manuscript: Z. Sun, A. Schwenzer,T. Rupp, G. OrendAdministrative, technical, or material support (i.e., reporting or organizingdata, constructing databases): Z. Sun, T. RuppStudy supervision: G. OrendOther (financing of study): G. Orend
AcknowledgmentsWe are grateful to G. Posern (Halle-Wittenberg University, Halle, Germany)
and R. Hynes (MIT, Cambridge, MA) for MKL1 molecules and SRF reporterplasmids, and YAP and TEAD reporter plasmids, respectively, and M. van derHeyden for technical assistance. This work was supported by grants fromWorldwide Cancer Research (14-1070), INSERM, University Strasbourg, ANR(AngioMatrix), INCa, and Ligue contre le Cancer to G. Orend and fellowshipgrants from the Chinese Scholarship Council (Z. Sun), Ligue contre le Cancer(T. Rupp), and Fondation ARC, Association pour la recherche sur le cancer(A. Schwenzer and D. Murdamoothoo).
The costs of publication of this article were defrayed in part by thepayment of page charges. This article must therefore be hereby markedadvertisement in accordance with 18 U.S.C. Section 1734 solely to indicatethis fact.
Received May 31, 2017; revised October 24, 2017; accepted December 11,2017; published OnlineFirst December 19, 2017.
References1. MidwoodKS, ChiquetM, Tucker RP,OrendG. Tenascin-C at a glance. J Cell
Sci 2016;129:4321–7.2. Oskarsson T, Acharyya S, ZhangXH-F, Vanharanta S, Tavazoi SF,Morris PG,
et al. Breast cancer cells produce tenascin C as a metastatic niche compo-nent to colonize the lungs. Nat Med 2011;17:867–74.
3. Saupe F, Schwenzer A, Jia Y, Gasser I, Spenl�e C, Langlois B, et al. Tenascin-Cdownregulates Wnt inhibitor dickkopf-1, promoting tumorigenesis in aneuroendocrine tumor model. Cell Rep 2013;5:482–92.
4. Langlois B, Saupe F, Rupp T, Arnold C, Van der Heyden M, Orend G, et al.AngioMatrix, a signature of the tumor angiogenic switch-specific matri-some, correlates with poor prognosis for glioma and colorectal cancerpatients. Oncotarget 2014;5:10529–45.
5. Rupp T, Langlois B, Koczorowska MM, Radwanska A, Sun Z, Hussenet T,et al. Tenascin-C orchestrates glioblastoma angiogenesis by modulation ofpro- and anti-angiogenic signaling. Cell Rep 2016;17:2607–19.
6. Spenl�e C, Gasser I, Saupe F, Janssen KP, Arnold C, Klein A, et al. Spatialorganization of the tenascin-C microenvironment in experimental andhuman cancer. Cell Adh Migr 2015;9:4–13.
7. Imanaka-Yoshida K, Aoki H. Tenascin-C and mechanotransduction in thedevelopment and diseases of cardiovascular system. Front Physiol 2014;5.
8. Miroshnikova YA,Mouw JK, Barnes JM, PickupMW, Lakins JN, KimY, et al.Tissuemechanics promote IDH1-dependent HIF1a-tenascin C feedback toregulate glioblastoma aggression. Nat Cell Biol 2016;18:1336–45.
9. Huang W, Chiquet-Ehrismann R, Moyano JV, Garcia-Pardo A, Orend G.Interference of tenascin-C with syndecan-4 binding to fibronectin blockscell adhesion and stimulates tumor cell proliferation. Cancer Res 2001;61:8586–94.
10. Ruiz C, HuangW, Hegi ME, Lange K, HamouMF, Fluri E. Differential geneexpression analysis reveals activation of growth promoting signaling path-ways by tenascin-C. Cancer Res 2004;64:7377–85.
11. Miralles F, Posern G, Zaromytidou AI, Treisman R. Actin dynamicscontrol SRF activity by regulation of its coactivator MAL. Cell 2003;113:329–42.
12. Dupont S, Morsut L, Aragona M, Enzo E, Giulitti S, Cordenonsi M, et al.Role of YAP/TAZ in mechanotransduction. Nature 2011;474:179–83.
13. Wada KI, Itoga K, Okano T, Yonemura S, Sasaki H. Hippo pathwayregulation by cell morphology and stress fibers. Development 2011;138:3907–14.
14. Olson EN, Nordheim A. Linking actin dynamics and gene transcription todrive cellular motile functions. Nat Rev Mol Cell Biol 2010;11:353–65.
Sun et al.
Cancer Res; 78(4) February 15, 2018 Cancer Research960
on April 3, 2018. © 2018 American Association for Cancer Research. cancerres.aacrjournals.org Downloaded from
Published OnlineFirst December 19, 2017; DOI: 10.1158/0008-5472.CAN-17-1597
319
15. Gurbuz I, Ferralli J, Roloff T, Chiquet-Ehrismann R, Asparuhova MB. SAPdomain-dependentMkl1 signaling stimulates proliferation and cellmigra-tion by induction of a distinct gene set indicative of poor prognosis inbreast cancer patients. Mol Cancer 2014;13:22.
16. Zhao B, Li L, Lei Q, Guan KL. The Hippo-YAP pathway in organ sizecontrol and tumorigenesis: an updated version. Genes Dev 2010;24:862–74.
17. Halder G, Dupont S, Piccolo S. Transduction of mechanical and cytoskel-etal cues by YAP and TAZ. Nat Rev Mol Cell Biol 2012;13:591–600.
18. Berlin €O, Samid D, Donthineni-Rao R, Akeson W, Amiel D, Woods VL.Development of a novel spontaneous metastasis model of human oste-osarcoma transplanted orthotopically into bone of athymic mice. CancerRes 1993;53:4890–5.
19. Lange K, Kammerer M, Hegi ME, Grotegut S, Dittmann A, Huang W, et al.Endothelin receptor type B counteracts tenascin-C-induced endothelinreceptor type A-dependent focal adhesion and actin stress fiber disorga-nization. Cancer Res 2007;67:6163–73.
20. Lamar JM, Stern P, Liu H, Schindler JW, Jiang ZG, Hynes RO. The Hippopathway target, YAP, promotes metastasis through its TEAD-interactiondomain. Proc Natl Acad Sci U S A 2012;109:E2441–50.
21. Lehmann S, te Boekhorst V, Odenthal J, Bianchi R, van Helvert S,Ikenberg K, et al. Hypoxia induces a HIF-1-dependent transition fromcollective-to-amoeboid dissemination in epithelial cancer cells. CurrBiol 2017;27:392–400.
22. Wolf K, Alexander S, Schacht V, Coussens LM, von Andrian UH, vanRheenen J, et al. Collagen-based cell migration models in vitro and invivo. Semin Cell Dev Biol 2009;20:931–41.
23. SubramanianA, TamayoP,Mootha VK,Mukherjee S, Ebert BL,GilletteMA,et al. Gene set enrichment analysis: a knowledge-based approach forinterpreting genome-wide expression profiles. Proc Natl Acad Sci U S A2005;102:15545–50.
24. Zhao B, Ye X, Yu J, Li L, LiW, Li S, et al. TEADmediates YAP-dependent geneinduction and growth control. Genes Dev 2008;22:1962–71.
25. Descot A, Hoffmann R, Shaposhnikov D, Reschke M, Ullrich A, Posern G.Negative regulation of the EGFR-MAPK cascade by actin-MAL-mediatedMig6/Errfi-1 induction. Mol Cell 2009;35:291–304.
26. Chiquet-Ehrismann R, Kalla P, Pearson CA, Beck K, Chiquet M. Tenascininterferes with fibronectin action. Cell 1988;53:383–90.
27. Van Obberghen-Schilling E, Tucker RP, Saupe F, Gasser I, Cseh B,Orend G. Fibronectin and tenascin-C: accomplices in vascular mor-phogenesis during development and tumor growth. Int J Dev Biol2011;55:511–25.
28. Lange K, Kammerer M, Saupe F, Hegi ME, Grotegut S, Fluri E, et al.Combined lysophosphatidic acid/platelet-derived growth factor signalingtriggers glioma cell migration in a tenascin-C microenvironment. CancerRes 2008;68:6942–52.
29. Selvaraj A, Prywes R. Expression profiling of serum inducible genes iden-tifies a subset of SRF target genes that are MKL dependent. BMC Mol Biol2004;5:13.
30. Lee SM, Vasishtha M, Prywes R. Activation and repression of cellularimmediate early genes by serum response factor cofactors. J Biol Chem2010;285:22036–49.
31. Asparuhova MB, Ferralli J, Chiquet M, Chiquet-Ehrismann R. Thetranscriptional regulator megakaryoblastic leukemia-1 mediates serum
response factor-independent activation of tenascin-C transcription bymechanical stress. FASEB J 2011;25:3477–88.
32. Seo E, Basu-Roy U, Gunaratne PH, Coarfa C, Lim DS, Basilico C, et al.SOX2 regulates YAP1 to maintain stemness and determine cell fate inthe osteo-adipo lineage. Cell Rep 2013;3:2075–87.
33. Calvo F, Ege N, Grande-Garcia A, Hooper S, Jenkins RP, Chaudhry SI,et al. Mechanotransduction and YAP-dependent matrix remodellingis required for the generation and maintenance of cancer-associatedfibroblasts. Nat Cell Biol 2013;15:637–46.
34. Wakatsuki T, Schwab B, ThompsonNC, Elson EL. Effects of cytochalasin Dand latrunculin B on mechanical properties of cells. J Cell Sci 2001;114:1025–36.
35. Visegr�ady B, Lo��rinczy D, Hild G, Somogyi B, Nyitrai M. The effect ofphalloidin and jasplakinolide on the flexibility and thermal stability ofactin filaments. FEBS Lett 2004;565:163–6.
36. Nobes CD, Hall A. Rho, rac, and cdc42 GTPases regulate the assembly ofmultimolecular focal complexes associated with actin stress fibers, lamel-lipodia, and filopodia. Cell 1995;81:53–62.
37. Willier S, Butt E, Grunewald TGP. Lysophosphatidic acid (LPA) signallingin cellmigration and cancer invasion: a focussed review and analysis of LPAreceptor gene expression on the basis of more than 1700 cancer micro-arrays. Biol Cell 2013;105:317–33.
38. Pan?kov�a K, R€osel D, Novotn�y M, Br�abek J. The molecular mechanisms oftransition between mesenchymal and amoeboid invasiveness in tumorcells. Cell Mol Life Sci 2010;67:63–71.
39. Yokosaki Y, Matsuura N, Higashiyama S, Murakami I, ObaraM, YamakidoM. Identification of the ligand binding site for the integrin alpha9 beta1 inthe third fibronectin type III repeat of tenascin-C. J Biol Chem 1998;273:11423–8.
40. Kon S, Uede T. The role of a9b1 integrin and its ligands in thedevelopment of autoimmune diseases. J Cell Commun Signal 2017Oct 3. Epub ahead of print.
41. Zanconato F, ForcatoM, BattilanaG, Azzolin L,Quaranta E, Bodega B, et al.Genome-wide association between YAP/TAZ/TEAD and AP-1 at enhancersdrives oncogenic growth. Nat Cell Biol 2015;17:1218–27.
42. Buddingh EP, Kuijjer ML, Duim RAJ, B€urger H, Agelopoulos K, MyklebostO, et al. Tumor-infiltrating macrophages are associated with metastasissuppression in high-grade osteosarcoma: a rationale for treatment withmacrophage activating agents. Clin Cancer Res 2011;17:2110–9.
43. Joo KM, Kim J, Jin J, Kim M, Seol HJ, Muradov J, et al. Patient-specificorthotopic glioblastoma xenograft models recapitulate the histopathologyand biology of human glioblastomas in situ. Cell Rep 2013;3:260–73.
44. Orend G, Huang W, Olayioye MA, Hynes NE, Chiquet-Ehrismann R.Tenascin-C blocks cell-cycle progression of anchorage-dependent fibro-blasts on fibronectin through inhibition of syndecan-4. Oncogene2003;22:3917–26.
45. San Martin R, Pathak R, Jain A, Jung SY, Hilsenbeck SG, Pin?a-Barba MC,et al. Tenascin-C and integrin a9 mediate interactions of prostate cancerwith the bone microenvironment. Cancer Res 2017;77:5977–88.
46. Midwood KS, Hussenet T, Langlois B, Orend G. Advances in tenascin-C biology. Cell Mol Life Sci 2011;68:3175–99.
47. Ishihara A, Yoshida T, Tamaki H, Sakakura T. Tenascin expression in cancercells and stroma of human breast cancer and its prognostic significance.Clin Cancer Res 1995;1:1035–41.
www.aacrjournals.org Cancer Res; 78(4) February 15, 2018 961
Through Integrin a9b1, Tenascin-C Promotes Metastasis
on April 3, 2018. © 2018 American Association for Cancer Research. cancerres.aacrjournals.org Downloaded from
Published OnlineFirst December 19, 2017; DOI: 10.1158/0008-5472.CAN-17-1597
320
2018;78:950-961. Published OnlineFirst December 19, 2017.Cancer Res Zhen Sun, Anja Schwenzer, Tristan Rupp, et al.
Mediated YAP Inhibition−1β9αIntegrin Tenascin-C Promotes Tumor Cell Migration and Metastasis through
Updated version
10.1158/0008-5472.CAN-17-1597doi:
Access the most recent version of this article at:
Material
Supplementary
http://cancerres.aacrjournals.org/content/suppl/2017/12/19/0008-5472.CAN-17-1597.DC1
Access the most recent supplemental material at:
Cited articles
http://cancerres.aacrjournals.org/content/78/4/950.full#ref-list-1
This article cites 45 articles, 18 of which you can access for free at:
E-mail alerts related to this article or journal.Sign up to receive free email-alerts
Subscriptions
Reprints and
To order reprints of this article or to subscribe to the journal, contact the AACR Publications Department at
Permissions
Rightslink site. Click on "Request Permissions" which will take you to the Copyright Clearance Center's (CCC)
.http://cancerres.aacrjournals.org/content/78/4/950To request permission to re-use all or part of this article, use this link
on April 3, 2018. © 2018 American Association for Cancer Research. cancerres.aacrjournals.org Downloaded from
Published OnlineFirst December 19, 2017; DOI: 10.1158/0008-5472.CAN-17-1597
321

Appendix IV
322
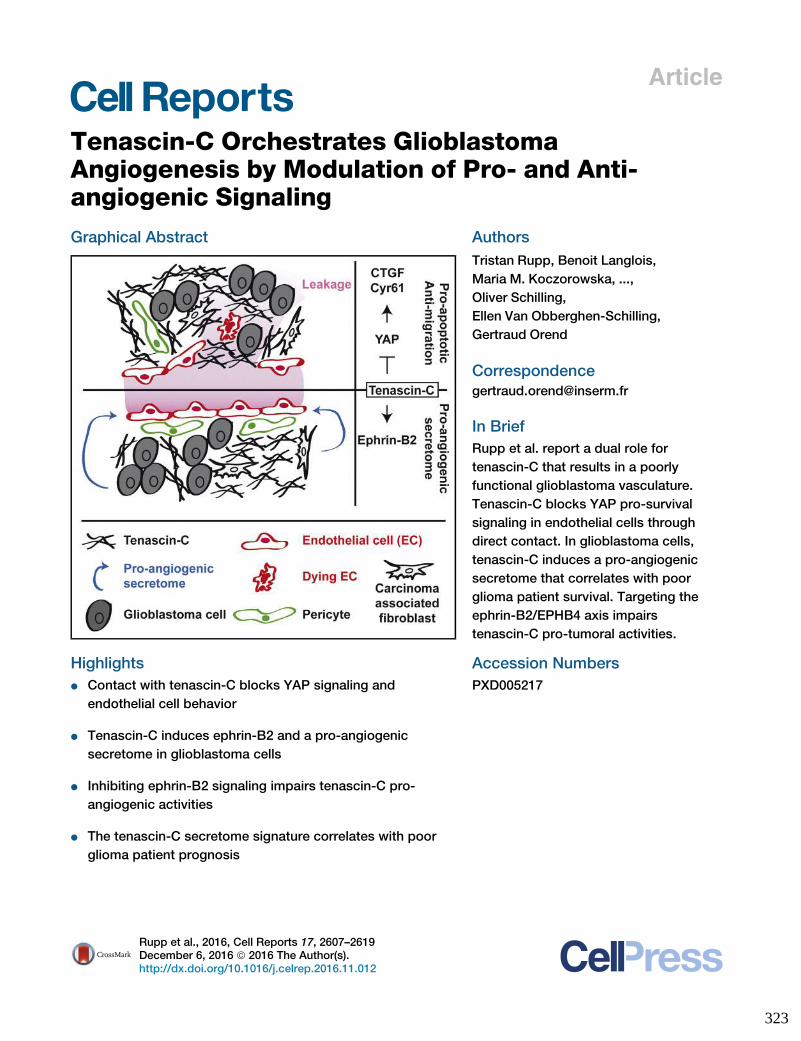
Article
Tenascin-C Orchestrates GlioblastomaAngiogenesis by Modulation of Pro- and Anti-angiogenic Signaling
Graphical Abstract
Highlights
d Contact with tenascin-C blocks YAP signaling and
endothelial cell behavior
d Tenascin-C induces ephrin-B2 and a pro-angiogenic
secretome in glioblastoma cells
d Inhibiting ephrin-B2 signaling impairs tenascin-C pro-
angiogenic activities
d The tenascin-C secretome signature correlates with poor
glioma patient prognosis
Authors
Tristan Rupp, Benoit Langlois,
Maria M. Koczorowska, ...,
Oliver Schilling,
Ellen Van Obberghen-Schilling,
Gertraud Orend
In Brief
Rupp et al. report a dual role for
tenascin-C that results in a poorly
functional glioblastoma vasculature.
Tenascin-C blocks YAP pro-survival
signaling in endothelial cells through
direct contact. In glioblastoma cells,
tenascin-C induces a pro-angiogenic
secretome that correlates with poor
glioma patient survival. Targeting the
ephrin-B2/EPHB4 axis impairs
tenascin-C pro-tumoral activities.
Accession Numbers
PXD005217
Rupp et al., 2016, Cell Reports 17, 2607–2619December 6, 2016 ª 2016 The Author(s).http://dx.doi.org/10.1016/j.celrep.2016.11.012
323
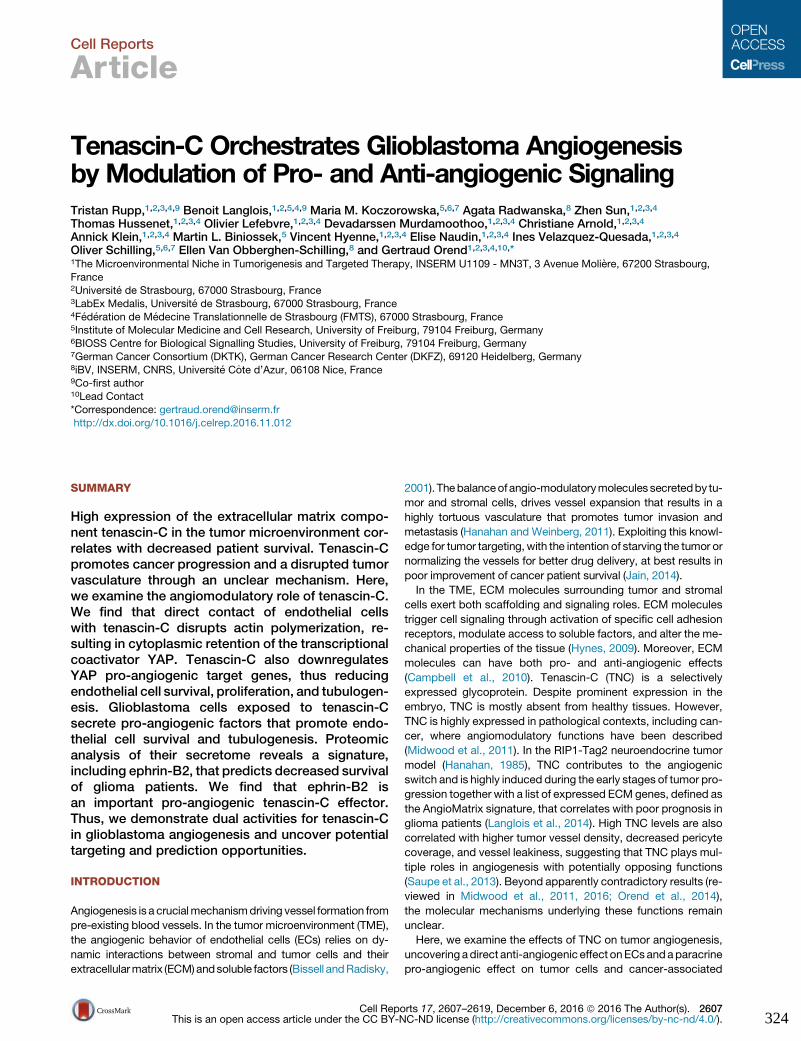
Cell Reports
Article
Tenascin-C Orchestrates Glioblastoma Angiogenesisby Modulation of Pro- and Anti-angiogenic SignalingTristan Rupp,1,2,3,4,9 Benoit Langlois,1,2,5,4,9 Maria M. Koczorowska,5,6,7 Agata Radwanska,8 Zhen Sun,1,2,3,4
Thomas Hussenet,1,2,3,4 Olivier Lefebvre,1,2,3,4 Devadarssen Murdamoothoo,1,2,3,4 Christiane Arnold,1,2,3,4
Annick Klein,1,2,3,4 Martin L. Biniossek,5 Vincent Hyenne,1,2,3,4 Elise Naudin,1,2,3,4 Ines Velazquez-Quesada,1,2,3,4
Oliver Schilling,5,6,7 Ellen Van Obberghen-Schilling,8 and Gertraud Orend1,2,3,4,10,*1The Microenvironmental Niche in Tumorigenesis and Targeted Therapy, INSERM U1109 - MN3T, 3 Avenue Moliere, 67200 Strasbourg,
France2Universite de Strasbourg, 67000 Strasbourg, France3LabEx Medalis, Universite de Strasbourg, 67000 Strasbourg, France4Federation de Medecine Translationnelle de Strasbourg (FMTS), 67000 Strasbourg, France5Institute of Molecular Medicine and Cell Research, University of Freiburg, 79104 Freiburg, Germany6BIOSS Centre for Biological Signalling Studies, University of Freiburg, 79104 Freiburg, Germany7German Cancer Consortium (DKTK), German Cancer Research Center (DKFZ), 69120 Heidelberg, Germany8iBV, INSERM, CNRS, Universite Cote d’Azur, 06108 Nice, France9Co-first author10Lead Contact
*Correspondence: [email protected]
http://dx.doi.org/10.1016/j.celrep.2016.11.012
SUMMARY
High expression of the extracellular matrix compo-nent tenascin-C in the tumor microenvironment cor-relates with decreased patient survival. Tenascin-Cpromotes cancer progression and a disrupted tumorvasculature through an unclear mechanism. Here,we examine the angiomodulatory role of tenascin-C.We find that direct contact of endothelial cellswith tenascin-C disrupts actin polymerization, re-sulting in cytoplasmic retention of the transcriptionalcoactivator YAP. Tenascin-C also downregulatesYAP pro-angiogenic target genes, thus reducingendothelial cell survival, proliferation, and tubulogen-esis. Glioblastoma cells exposed to tenascin-Csecrete pro-angiogenic factors that promote endo-thelial cell survival and tubulogenesis. Proteomicanalysis of their secretome reveals a signature,including ephrin-B2, that predicts decreased survivalof glioma patients. We find that ephrin-B2 isan important pro-angiogenic tenascin-C effector.Thus, we demonstrate dual activities for tenascin-Cin glioblastoma angiogenesis and uncover potentialtargeting and prediction opportunities.
INTRODUCTION
Angiogenesis is a crucialmechanismdriving vessel formation from
pre-existing blood vessels. In the tumor microenvironment (TME),
the angiogenic behavior of endothelial cells (ECs) relies on dy-
namic interactions between stromal and tumor cells and their
extracellularmatrix (ECM)andsoluble factors (Bissell andRadisky,
2001). Thebalanceofangio-modulatorymolecules secretedby tu-
mor and stromal cells, drives vessel expansion that results in a
highly tortuous vasculature that promotes tumor invasion and
metastasis (Hanahan and Weinberg, 2011). Exploiting this knowl-
edge for tumor targeting,with the intention of starving the tumor or
normalizing the vessels for better drug delivery, at best results in
poor improvement of cancer patient survival (Jain, 2014).
In the TME, ECM molecules surrounding tumor and stromal
cells exert both scaffolding and signaling roles. ECM molecules
trigger cell signaling through activation of specific cell adhesion
receptors, modulate access to soluble factors, and alter the me-
chanical properties of the tissue (Hynes, 2009). Moreover, ECM
molecules can have both pro- and anti-angiogenic effects
(Campbell et al., 2010). Tenascin-C (TNC) is a selectively
expressed glycoprotein. Despite prominent expression in the
embryo, TNC is mostly absent from healthy tissues. However,
TNC is highly expressed in pathological contexts, including can-
cer, where angiomodulatory functions have been described
(Midwood et al., 2011). In the RIP1-Tag2 neuroendocrine tumor
model (Hanahan, 1985), TNC contributes to the angiogenic
switch and is highly induced during the early stages of tumor pro-
gression together with a list of expressed ECM genes, defined as
the AngioMatrix signature, that correlates with poor prognosis in
glioma patients (Langlois et al., 2014). High TNC levels are also
correlated with higher tumor vessel density, decreased pericyte
coverage, and vessel leakiness, suggesting that TNC plays mul-
tiple roles in angiogenesis with potentially opposing functions
(Saupe et al., 2013). Beyond apparently contradictory results (re-
viewed in Midwood et al., 2011, 2016; Orend et al., 2014),
the molecular mechanisms underlying these functions remain
unclear.
Here, we examine the effects of TNC on tumor angiogenesis,
uncovering adirect anti-angiogenic effect onECsandaparacrine
pro-angiogenic effect on tumor cells and cancer-associated
Cell Reports 17, 2607–2619, December 6, 2016 ª 2016 The Author(s). 2607This is an open access article under the CC BY-NC-ND license (http://creativecommons.org/licenses/by-nc-nd/4.0/). 324
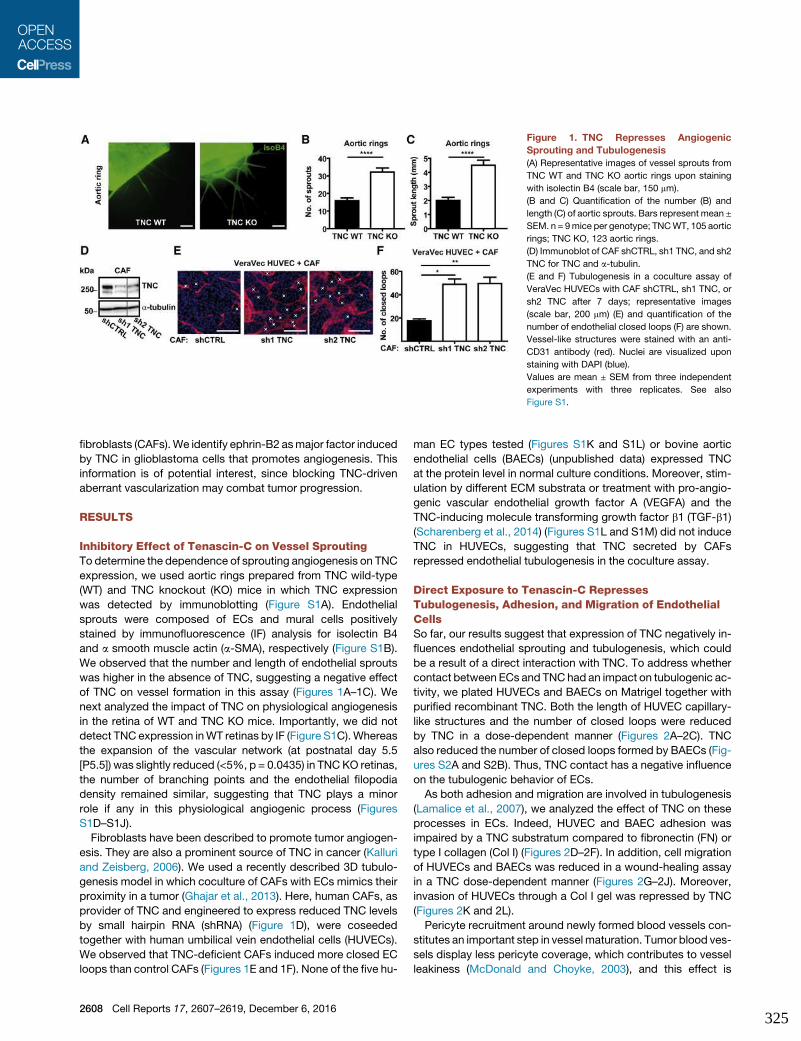
fibroblasts (CAFs).We identify ephrin-B2 asmajor factor induced
by TNC in glioblastoma cells that promotes angiogenesis. This
information is of potential interest, since blocking TNC-driven
aberrant vascularization may combat tumor progression.
RESULTS
Inhibitory Effect of Tenascin-C on Vessel SproutingTo determine the dependence of sprouting angiogenesis on TNC
expression, we used aortic rings prepared from TNC wild-type
(WT) and TNC knockout (KO) mice in which TNC expression
was detected by immunoblotting (Figure S1A). Endothelial
sprouts were composed of ECs and mural cells positively
stained by immunofluorescence (IF) analysis for isolectin B4
and a smooth muscle actin (a-SMA), respectively (Figure S1B).
We observed that the number and length of endothelial sprouts
was higher in the absence of TNC, suggesting a negative effect
of TNC on vessel formation in this assay (Figures 1A–1C). We
next analyzed the impact of TNC on physiological angiogenesis
in the retina of WT and TNC KO mice. Importantly, we did not
detect TNC expression inWT retinas by IF (Figure S1C).Whereas
the expansion of the vascular network (at postnatal day 5.5
[P5.5]) was slightly reduced (<5%, p = 0.0435) in TNC KO retinas,
the number of branching points and the endothelial filopodia
density remained similar, suggesting that TNC plays a minor
role if any in this physiological angiogenic process (Figures
S1D–S1J).
Fibroblasts have been described to promote tumor angiogen-
esis. They are also a prominent source of TNC in cancer (Kalluri
and Zeisberg, 2006). We used a recently described 3D tubulo-
genesis model in which coculture of CAFs with ECs mimics their
proximity in a tumor (Ghajar et al., 2013). Here, human CAFs, as
provider of TNC and engineered to express reduced TNC levels
by small hairpin RNA (shRNA) (Figure 1D), were coseeded
together with human umbilical vein endothelial cells (HUVECs).
We observed that TNC-deficient CAFs induced more closed EC
loops than control CAFs (Figures 1E and 1F). None of the five hu-
man EC types tested (Figures S1K and S1L) or bovine aortic
endothelial cells (BAECs) (unpublished data) expressed TNC
at the protein level in normal culture conditions. Moreover, stim-
ulation by different ECM substrata or treatment with pro-angio-
genic vascular endothelial growth factor A (VEGFA) and the
TNC-inducing molecule transforming growth factor b1 (TGF-b1)
(Scharenberg et al., 2014) (Figures S1L and S1M) did not induce
TNC in HUVECs, suggesting that TNC secreted by CAFs
repressed endothelial tubulogenesis in the coculture assay.
Direct Exposure to Tenascin-C RepressesTubulogenesis, Adhesion, and Migration of EndothelialCellsSo far, our results suggest that expression of TNC negatively in-
fluences endothelial sprouting and tubulogenesis, which could
be a result of a direct interaction with TNC. To address whether
contact between ECs and TNChad an impact on tubulogenic ac-
tivity, we plated HUVECs and BAECs on Matrigel together with
purified recombinant TNC. Both the length of HUVEC capillary-
like structures and the number of closed loops were reduced
by TNC in a dose-dependent manner (Figures 2A–2C). TNC
also reduced the number of closed loops formed by BAECs (Fig-
ures S2A and S2B). Thus, TNC contact has a negative influence
on the tubulogenic behavior of ECs.
As both adhesion and migration are involved in tubulogenesis
(Lamalice et al., 2007), we analyzed the effect of TNC on these
processes in ECs. Indeed, HUVEC and BAEC adhesion was
impaired by a TNC substratum compared to fibronectin (FN) or
type I collagen (Col I) (Figures 2D–2F). In addition, cell migration
of HUVECs and BAECs was reduced in a wound-healing assay
in a TNC dose-dependent manner (Figures 2G–2J). Moreover,
invasion of HUVECs through a Col I gel was repressed by TNC
(Figures 2K and 2L).
Pericyte recruitment around newly formed blood vessels con-
stitutes an important step in vessel maturation. Tumor blood ves-
sels display less pericyte coverage, which contributes to vessel
leakiness (McDonald and Choyke, 2003), and this effect is
Figure 1. TNC Represses Angiogenic
Sprouting and Tubulogenesis
(A) Representative images of vessel sprouts from
TNC WT and TNC KO aortic rings upon staining
with isolectin B4 (scale bar, 150 mm).
(B and C) Quantification of the number (B) and
length (C) of aortic sprouts. Bars represent mean ±
SEM. n = 9mice per genotype; TNCWT, 105 aortic
rings; TNC KO, 123 aortic rings.
(D) Immunoblot of CAF shCTRL, sh1 TNC, and sh2
TNC for TNC and a-tubulin.
(E and F) Tubulogenesis in a coculture assay of
VeraVec HUVECs with CAF shCTRL, sh1 TNC, or
sh2 TNC after 7 days; representative images
(scale bar, 200 mm) (E) and quantification of the
number of endothelial closed loops (F) are shown.
Vessel-like structures were stained with an anti-
CD31 antibody (red). Nuclei are visualized upon
staining with DAPI (blue).
Values are mean ± SEM from three independent
experiments with three replicates. See also
Figure S1.
2608 Cell Reports 17, 2607–2619, December 6, 2016325

enhanced by TNC in an insulinoma mouse model (Saupe et al.,
2013). We addressed if and how TNC affects human brain
vascular pericyte (HBVP) behavior. Whereas pericytes ex-
pressed TNC, which can be enhanced by TGF-b (Figure S2C),
we observed that similarly to ECs, only a few pericytes adhered
to the TNC substratum (Figures 2D and 2M). Furthermore,
wound closure of a pericyte monolayer was largely impaired by
TNC in a dose-dependent manner (Figures 2N and 2O), suggest-
ing a similar inhibitory effect of TNC on pericyte migration.
Tenascin-C Impairs Survival of Endothelial CellsWe also investigated if and how TNC affected EC proliferation
using an MTS incorporation assay. Whereas HUVECs and
BAECs proliferated on FN and Col I over 3 days, their growth
only slightly increased on TNC in the same time frame, demon-
strating an inhibitory effect of TNC (Figures 3A and 3B) that
was dose dependent (Figure S3A). In contrast to ECs, despite
delayed cell adhesion on TNC, the growth of pericytes over
time was unaffected by TNC (Figure 3C).
In the TME, cells interact with their ECM in a 3D context. More-
over, 3D models exhibit properties such as mechanical compli-
ance and immobilization of growth factors that are closer to
the complexity found in tissues (Beacham et al., 2007). Here,
we generated a 3D cell-derived matrix (CDM) as described pre-
viously (Beacham et al., 2007) (Figure S3B) that was assembled
by mouse embryonic fibroblasts (MEFs) derived from TNC KO
(TNC�) or TNC WT (TNC+) mice. We confirmed that CDM from
TNC KO MEFs was devoid of TNC and that both CDMs pre-
sented a similar fibrillar ECM network comprising FN, periostin,
and Col I (Figure S3C). Growth of both EC types tested (HUVECs
andBAECs) was higher on TNC -deficient CDM than on the CDM
containing the TNC protein (Figures 3D and 3E). Similarly BAEC
growth was reduced on CDM generated by CAFs with TNC
knockdown (KD) (shTNC) when compared with control (shCTRL)
cells (Figure S3D), whereas pericyte growth was unaffected
(Figure 3F). These findings recapitulate the inhibitory effect of
TNC on the growth of ECs on a 2D TNC substratum.
Inhibition of cell growth by TNC could depend on an altered
balance of survival and proliferation, which we tested by plating
HUVECs on either purified ECM coatings or CDM. Indeed, TNC-
containing substrata increased EC apoptosis, as illustrated by
the increased number of cleaved-caspase-3-positive nuclei in
the presence of TNC (Figures 3G and 3H). Assessing prolifera-
tion by bromodeoxyuridine (BrdU) incorporation revealed a
reduction on TNC in comparison to FN and Col I (Figure 3I).
Thus, ECs exposed to TNC are prone to apoptosis and show a
reduced proliferation rate. This could have an impact on endo-
thelium function, which we tested in an in vitro Boyden chamber
permeability assay. We observed that the TNC substratum
increased dextran-FITC diffusion across the endothelial mono-
layer over that of the other ECM coatings (Figure S3E), suggest-
ing that TNC may alter endothelial monolayer integrity in vitro.
Tenascin-C Impairs YAP Signaling through Repressionof Actin Polymerization, Causing Downregulation ofPro-angiogenic Molecules and Cell GrowthSignaling associated with the actin cytoskeleton status plays an
important role during angiogenesis (Bayless and Johnson, 2011).
Since TNC affects the organization of the actin cytoskeleton in
fibroblasts and tumor cells (Midwood et al., 2011), we tested
its effect on actin polymerization in ECs. We observed that
whereas actin stress fibers are present in HUVECs on Col I and
FN substrata, these structures were poorly detectable on TNC
(Figures 4A and S4A). Similarly, only few actin stress fibers
were seen on CDM containing TNC (TNC+) which was in
contrast to cells seeded on CDM lacking TNC (TNC�), where
we observed abundant actin stress fiber formation (Figure S4B).
Quantification of the relative abundance of filamentous/polymer-
ized (F) versus globular/non-polymerized (G) actin upon fraction-
ation (Posern et al., 2002) showed that 5 hr after seeding on TNC,
the ratio of F-actin to G-actin in HUVECs was largely reduced in
comparison to FN or Col I (Figures 4B and 4C).
YAP (Yes-associated protein), a sensor of cell shape and regu-
lated by the actin cytoskeleton, acts as a transcriptional inte-
grator of extracellular stimuli (Halder et al., 2012). Upon actin
polymerization, YAP translocates into the nucleus, where it binds
to members of the TEAD family of transcription factors and
induces gene expression (Calvo et al., 2013). We studied sub-
cellular localization of YAP and observed that whereas 85% of
HUVECs plated on FN exhibited nuclear YAP, only 12% of cells
plated on TNC had nuclear YAP, similar to cells grown on FN in
low serum in which YAP is mainly sequestered in the cytoplasm
(Calvo et al., 2013) (Figures 4D and 4E).
Connective tissue growth factor (CTGF) and cysteine-rich
protein 61 (Cyr61), two pro-angiogenic molecules that promote
migration and survival of ECs (Brigstock, 2002), are direct YAP
target genes (Halder et al., 2012). qRT-PCR revealed that
expression of CTGF and Cyr61 was downregulated in HUVECs
grown on the TNC substratum in comparison to FN (Figure 4F).
To address whether downregulation of YAP target genes and
inhibition of actin polymerization by TNC are functionally linked,
we treated HUVECs with lysophosphatidic acid (LPA) to rescue
actin stress fiber formation (Siess et al., 1999). Indeed, LPA
induced spreading and stress fiber formation (Figure S4C) in
the majority of HUVECs plated on TNC (Figure S4D). LPA-
induced cell spreading was further associated with a significant
increase in HUVEC growth on TNC (Figure 4G) and an elevated
expression of CTGF (Figure 4H) and Cyr61 (Figure S4F). The
LPA effect was due to a restoration of YAP activity, since it
was reversed by YAP KD (Figures 4H, 4I, S4E, and S4F). These
results suggested that adhesion to a TNC substratum represses
actin polymerization, nuclear localization of YAP, expression of
pro-angiogenic factors, and EC growth.
Induction of a Pro-angiogenic Secretome in Tumor Cellsand Fibroblasts by Tenascin-CTo analyze a potential paracrine angiogenic activity of TNC,
we investigated the effect of TNC on the secretome of glioblas-
toma (GBM) cells, which abundantly express TNC. We collected
conditioned media (CM) from three independent GBM cell lines,
namely U87MG, U118MG, and U373MG, that had been grown
48 hr on CDM containing (TNC+) or lacking TNC (TNC�) and
then assessed the impact of these CM on HUVEC survival and
tubulogenesis. We confirmed by an MTS assay that the CM
derived from a similar number of cells (Figure S5A) and that
CMof U87MG, U118MG, andU373MGexposed to TNC (present
Cell Reports 17, 2607–2619, December 6, 2016 2609326
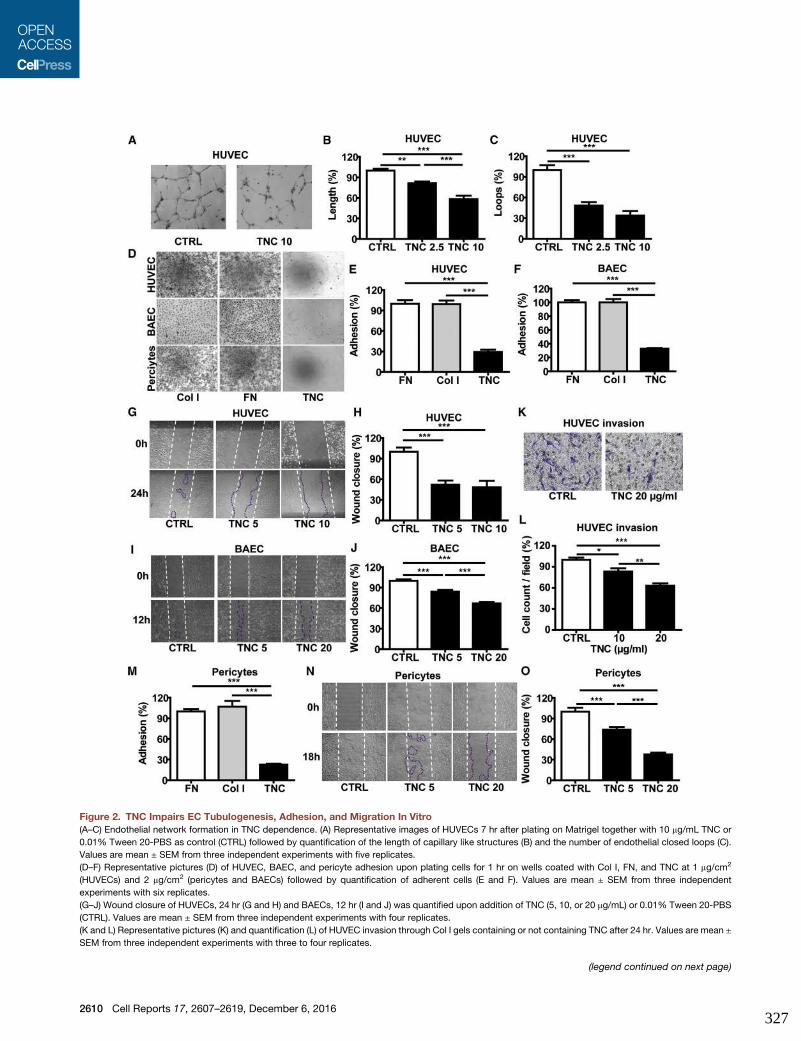
Figure 2. TNC Impairs EC Tubulogenesis, Adhesion, and Migration In Vitro
(A–C) Endothelial network formation in TNC dependence. (A) Representative images of HUVECs 7 hr after plating on Matrigel together with 10 mg/mL TNC or
0.01% Tween 20-PBS as control (CTRL) followed by quantification of the length of capillary like structures (B) and the number of endothelial closed loops (C).
Values are mean ± SEM from three independent experiments with five replicates.
(D–F) Representative pictures (D) of HUVEC, BAEC, and pericyte adhesion upon plating cells for 1 hr on wells coated with Col I, FN, and TNC at 1 mg/cm2
(HUVECs) and 2 mg/cm2 (pericytes and BAECs) followed by quantification of adherent cells (E and F). Values are mean ± SEM from three independent
experiments with six replicates.
(G–J) Wound closure of HUVECs, 24 hr (G and H) and BAECs, 12 hr (I and J) was quantified upon addition of TNC (5, 10, or 20 mg/mL) or 0.01% Tween 20-PBS
(CTRL). Values are mean ± SEM from three independent experiments with four replicates.
(K and L) Representative pictures (K) and quantification (L) of HUVEC invasion through Col I gels containing or not containing TNC after 24 hr. Values are mean ±
SEM from three independent experiments with three to four replicates.
(legend continued on next page)
2610 Cell Reports 17, 2607–2619, December 6, 2016327
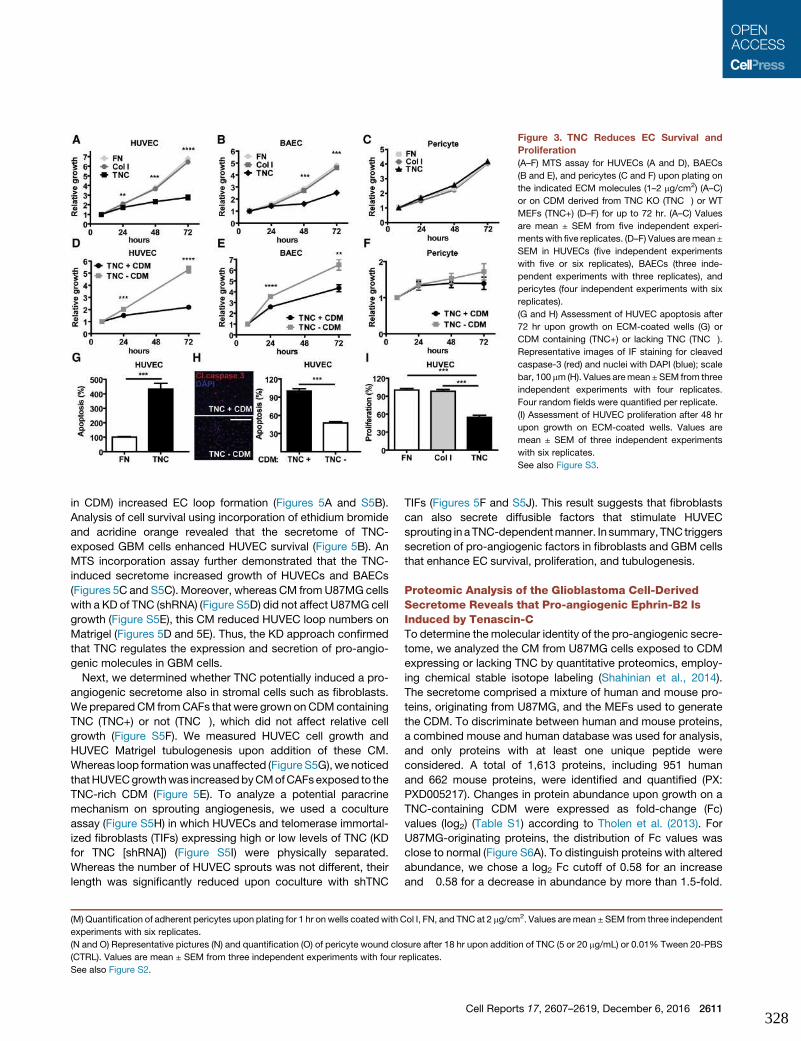
in CDM) increased EC loop formation (Figures 5A and S5B).
Analysis of cell survival using incorporation of ethidium bromide
and acridine orange revealed that the secretome of TNC-
exposed GBM cells enhanced HUVEC survival (Figure 5B). An
MTS incorporation assay further demonstrated that the TNC-
induced secretome increased growth of HUVECs and BAECs
(Figures 5C and S5C). Moreover, whereas CM fromU87MG cells
with a KD of TNC (shRNA) (Figure S5D) did not affect U87MG cell
growth (Figure S5E), this CM reduced HUVEC loop numbers on
Matrigel (Figures 5D and 5E). Thus, the KD approach confirmed
that TNC regulates the expression and secretion of pro-angio-
genic molecules in GBM cells.
Next, we determined whether TNC potentially induced a pro-
angiogenic secretome also in stromal cells such as fibroblasts.
We prepared CM fromCAFs that were grown onCDMcontaining
TNC (TNC+) or not (TNC�), which did not affect relative cell
growth (Figure S5F). We measured HUVEC cell growth and
HUVEC Matrigel tubulogenesis upon addition of these CM.
Whereas loop formationwas unaffected (Figure S5G), wenoticed
thatHUVECgrowthwas increasedbyCMofCAFsexposed to the
TNC-rich CDM (Figure 5E). To analyze a potential paracrine
mechanism on sprouting angiogenesis, we used a coculture
assay (Figure S5H) in which HUVECs and telomerase immortal-
ized fibroblasts (TIFs) expressing high or low levels of TNC (KD
for TNC [shRNA]) (Figure S5I) were physically separated.
Whereas the number of HUVEC sprouts was not different, their
length was significantly reduced upon coculture with shTNC
TIFs (Figures 5F and S5J). This result suggests that fibroblasts
can also secrete diffusible factors that stimulate HUVEC
sprouting in aTNC-dependentmanner. In summary, TNC triggers
secretion of pro-angiogenic factors in fibroblasts and GBM cells
that enhance EC survival, proliferation, and tubulogenesis.
Proteomic Analysis of the Glioblastoma Cell-DerivedSecretome Reveals that Pro-angiogenic Ephrin-B2 IsInduced by Tenascin-CTo determine the molecular identity of the pro-angiogenic secre-
tome, we analyzed the CM from U87MG cells exposed to CDM
expressing or lacking TNC by quantitative proteomics, employ-
ing chemical stable isotope labeling (Shahinian et al., 2014).
The secretome comprised a mixture of human and mouse pro-
teins, originating from U87MG, and the MEFs used to generate
the CDM. To discriminate between human and mouse proteins,
a combined mouse and human database was used for analysis,
and only proteins with at least one unique peptide were
considered. A total of 1,613 proteins, including 951 human
and 662 mouse proteins, were identified and quantified (PX:
PXD005217). Changes in protein abundance upon growth on a
TNC-containing CDM were expressed as fold-change (Fc)
values (log2) (Table S1) according to Tholen et al. (2013). For
U87MG-originating proteins, the distribution of Fc values was
close to normal (Figure S6A). To distinguish proteins with altered
abundance, we chose a log2 Fc cutoff of 0.58 for an increase
and �0.58 for a decrease in abundance by more than 1.5-fold.
(M) Quantification of adherent pericytes upon plating for 1 hr on wells coated with Col I, FN, and TNC at 2 mg/cm2. Values aremean ±SEM from three independent
experiments with six replicates.
(N and O) Representative pictures (N) and quantification (O) of pericyte wound closure after 18 hr upon addition of TNC (5 or 20 mg/mL) or 0.01% Tween 20-PBS
(CTRL). Values are mean ± SEM from three independent experiments with four replicates.
See also Figure S2.
Figure 3. TNC Reduces EC Survival and
Proliferation
(A–F) MTS assay for HUVECs (A and D), BAECs
(B and E), and pericytes (C and F) upon plating on
the indicated ECM molecules (1–2 mg/cm2) (A–C)
or on CDM derived from TNC KO (TNC�) or WT
MEFs (TNC+) (D–F) for up to 72 hr. (A–C) Values
are mean ± SEM from five independent experi-
ments with five replicates. (D–F) Values aremean ±
SEM in HUVECs (five independent experiments
with five or six replicates), BAECs (three inde-
pendent experiments with three replicates), and
pericytes (four independent experiments with six
replicates).
(G and H) Assessment of HUVEC apoptosis after
72 hr upon growth on ECM-coated wells (G) or
CDM containing (TNC+) or lacking TNC (TNC�).
Representative images of IF staining for cleaved
caspase-3 (red) and nuclei with DAPI (blue); scale
bar, 100 mm (H). Values aremean±SEM from three
independent experiments with four replicates.
Four random fields were quantified per replicate.
(I) Assessment of HUVEC proliferation after 48 hr
upon growth on ECM-coated wells. Values are
mean ± SEM of three independent experiments
with six replicates.
See also Figure S3.
Cell Reports 17, 2607–2619, December 6, 2016 2611328
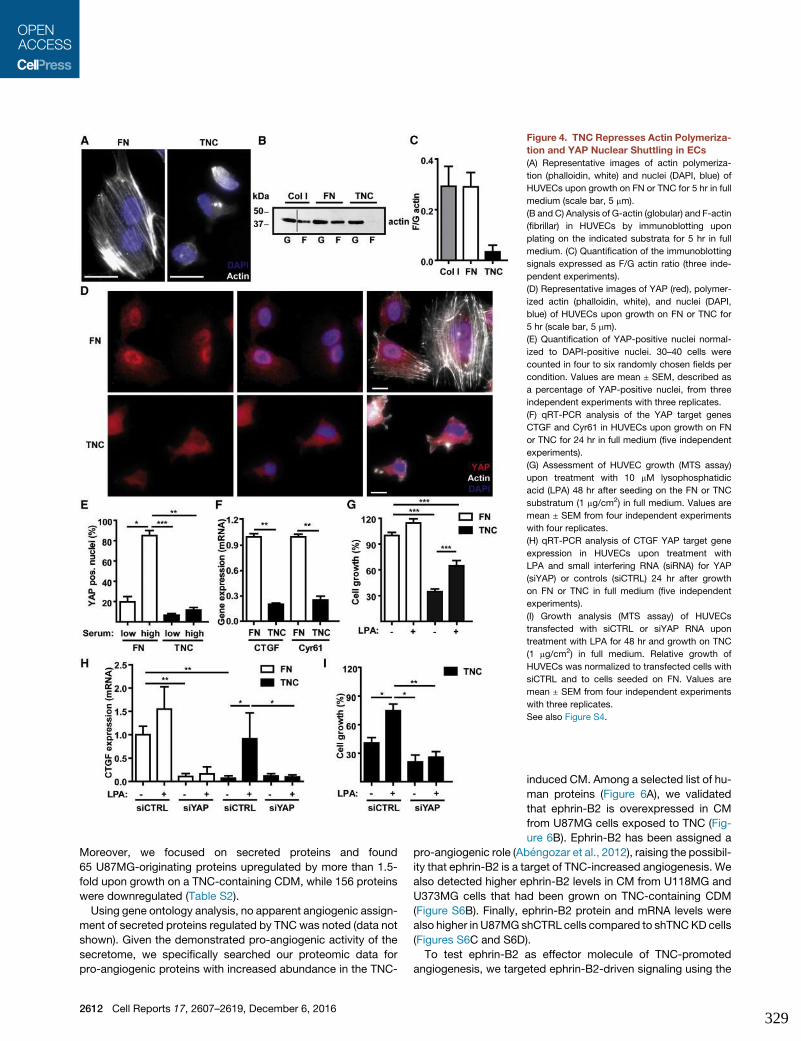
Moreover, we focused on secreted proteins and found
65 U87MG-originating proteins upregulated by more than 1.5-
fold upon growth on a TNC-containing CDM, while 156 proteins
were downregulated (Table S2).
Using gene ontology analysis, no apparent angiogenic assign-
ment of secreted proteins regulated by TNC was noted (data not
shown). Given the demonstrated pro-angiogenic activity of the
secretome, we specifically searched our proteomic data for
pro-angiogenic proteins with increased abundance in the TNC-
Figure 4. TNC Represses Actin Polymeriza-
tion and YAP Nuclear Shuttling in ECs
(A) Representative images of actin polymeriza-
tion (phalloidin, white) and nuclei (DAPI, blue) of
HUVECs upon growth on FN or TNC for 5 hr in full
medium (scale bar, 5 mm).
(B and C) Analysis of G-actin (globular) and F-actin
(fibrillar) in HUVECs by immunoblotting upon
plating on the indicated substrata for 5 hr in full
medium. (C) Quantification of the immunoblotting
signals expressed as F/G actin ratio (three inde-
pendent experiments).
(D) Representative images of YAP (red), polymer-
ized actin (phalloidin, white), and nuclei (DAPI,
blue) of HUVECs upon growth on FN or TNC for
5 hr (scale bar, 5 mm).
(E) Quantification of YAP-positive nuclei normal-
ized to DAPI-positive nuclei. 30–40 cells were
counted in four to six randomly chosen fields per
condition. Values are mean ± SEM, described as
a percentage of YAP-positive nuclei, from three
independent experiments with three replicates.
(F) qRT-PCR analysis of the YAP target genes
CTGF and Cyr61 in HUVECs upon growth on FN
or TNC for 24 hr in full medium (five independent
experiments).
(G) Assessment of HUVEC growth (MTS assay)
upon treatment with 10 mM lysophosphatidic
acid (LPA) 48 hr after seeding on the FN or TNC
substratum (1 mg/cm2) in full medium. Values are
mean ± SEM from four independent experiments
with four replicates.
(H) qRT-PCR analysis of CTGF YAP target gene
expression in HUVECs upon treatment with
LPA and small interfering RNA (siRNA) for YAP
(siYAP) or controls (siCTRL) 24 hr after growth
on FN or TNC in full medium (five independent
experiments).
(I) Growth analysis (MTS assay) of HUVECs
transfected with siCTRL or siYAP RNA upon
treatment with LPA for 48 hr and growth on TNC
(1 mg/cm2) in full medium. Relative growth of
HUVECs was normalized to transfected cells with
siCTRL and to cells seeded on FN. Values are
mean ± SEM from four independent experiments
with three replicates.
See also Figure S4.
induced CM. Among a selected list of hu-
man proteins (Figure 6A), we validated
that ephrin-B2 is overexpressed in CM
from U87MG cells exposed to TNC (Fig-
ure 6B). Ephrin-B2 has been assigned a
pro-angiogenic role (Abengozar et al., 2012), raising the possibil-
ity that ephrin-B2 is a target of TNC-increased angiogenesis. We
also detected higher ephrin-B2 levels in CM from U118MG and
U373MG cells that had been grown on TNC-containing CDM
(Figure S6B). Finally, ephrin-B2 protein and mRNA levels were
also higher in U87MG shCTRL cells compared to shTNCKD cells
(Figures S6C and S6D).
To test ephrin-B2 as effector molecule of TNC-promoted
angiogenesis, we targeted ephrin-B2-driven signaling using the
2612 Cell Reports 17, 2607–2619, December 6, 2016329
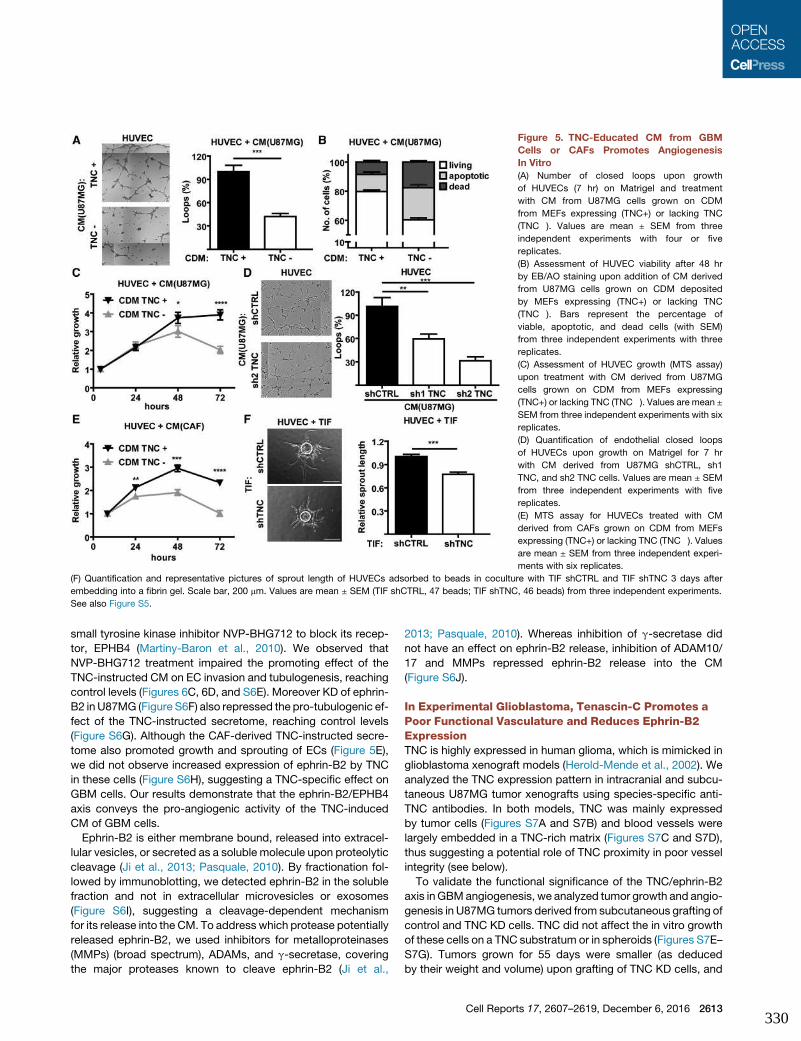
small tyrosine kinase inhibitor NVP-BHG712 to block its recep-
tor, EPHB4 (Martiny-Baron et al., 2010). We observed that
NVP-BHG712 treatment impaired the promoting effect of the
TNC-instructed CM on EC invasion and tubulogenesis, reaching
control levels (Figures 6C, 6D, and S6E). Moreover KD of ephrin-
B2 in U87MG (Figure S6F) also repressed the pro-tubulogenic ef-
fect of the TNC-instructed secretome, reaching control levels
(Figure S6G). Although the CAF-derived TNC-instructed secre-
tome also promoted growth and sprouting of ECs (Figure 5E),
we did not observe increased expression of ephrin-B2 by TNC
in these cells (Figure S6H), suggesting a TNC-specific effect on
GBM cells. Our results demonstrate that the ephrin-B2/EPHB4
axis conveys the pro-angiogenic activity of the TNC-induced
CM of GBM cells.
Ephrin-B2 is either membrane bound, released into extracel-
lular vesicles, or secreted as a soluble molecule upon proteolytic
cleavage (Ji et al., 2013; Pasquale, 2010). By fractionation fol-
lowed by immunoblotting, we detected ephrin-B2 in the soluble
fraction and not in extracellular microvesicles or exosomes
(Figure S6I), suggesting a cleavage-dependent mechanism
for its release into the CM. To address which protease potentially
released ephrin-B2, we used inhibitors for metalloproteinases
(MMPs) (broad spectrum), ADAMs, and g-secretase, covering
the major proteases known to cleave ephrin-B2 (Ji et al.,
2013; Pasquale, 2010). Whereas inhibition of g-secretase did
not have an effect on ephrin-B2 release, inhibition of ADAM10/
17 and MMPs repressed ephrin-B2 release into the CM
(Figure S6J).
In Experimental Glioblastoma, Tenascin-C Promotes aPoor Functional Vasculature and Reduces Ephrin-B2ExpressionTNC is highly expressed in human glioma, which is mimicked in
glioblastoma xenograft models (Herold-Mende et al., 2002). We
analyzed the TNC expression pattern in intracranial and subcu-
taneous U87MG tumor xenografts using species-specific anti-
TNC antibodies. In both models, TNC was mainly expressed
by tumor cells (Figures S7A and S7B) and blood vessels were
largely embedded in a TNC-rich matrix (Figures S7C and S7D),
thus suggesting a potential role of TNC proximity in poor vessel
integrity (see below).
To validate the functional significance of the TNC/ephrin-B2
axis in GBMangiogenesis, we analyzed tumor growth and angio-
genesis in U87MG tumors derived from subcutaneous grafting of
control and TNC KD cells. TNC did not affect the in vitro growth
of these cells on a TNC substratum or in spheroids (Figures S7E–
S7G). Tumors grown for 55 days were smaller (as deduced
by their weight and volume) upon grafting of TNC KD cells, and
Figure 5. TNC-Educated CM from GBM
Cells or CAFs Promotes Angiogenesis
In Vitro
(A) Number of closed loops upon growth
of HUVECs (7 hr) on Matrigel and treatment
with CM from U87MG cells grown on CDM
from MEFs expressing (TNC+) or lacking TNC
(TNC�). Values are mean ± SEM from three
independent experiments with four or five
replicates.
(B) Assessment of HUVEC viability after 48 hr
by EB/AO staining upon addition of CM derived
from U87MG cells grown on CDM deposited
by MEFs expressing (TNC+) or lacking TNC
(TNC�). Bars represent the percentage of
viable, apoptotic, and dead cells (with SEM)
from three independent experiments with three
replicates.
(C) Assessment of HUVEC growth (MTS assay)
upon treatment with CM derived from U87MG
cells grown on CDM from MEFs expressing
(TNC+) or lacking TNC (TNC�). Values are mean ±
SEM from three independent experiments with six
replicates.
(D) Quantification of endothelial closed loops
of HUVECs upon growth on Matrigel for 7 hr
with CM derived from U87MG shCTRL, sh1
TNC, and sh2 TNC cells. Values are mean ± SEM
from three independent experiments with five
replicates.
(E) MTS assay for HUVECs treated with CM
derived from CAFs grown on CDM from MEFs
expressing (TNC+) or lacking TNC (TNC�). Values
are mean ± SEM from three independent experi-
ments with six replicates.
(F) Quantification and representative pictures of sprout length of HUVECs adsorbed to beads in coculture with TIF shCTRL and TIF shTNC 3 days after
embedding into a fibrin gel. Scale bar, 200 mm. Values are mean ± SEM (TIF shCTRL, 47 beads; TIF shTNC, 46 beads) from three independent experiments.
See also Figure S5.
Cell Reports 17, 2607–2619, December 6, 2016 2613330
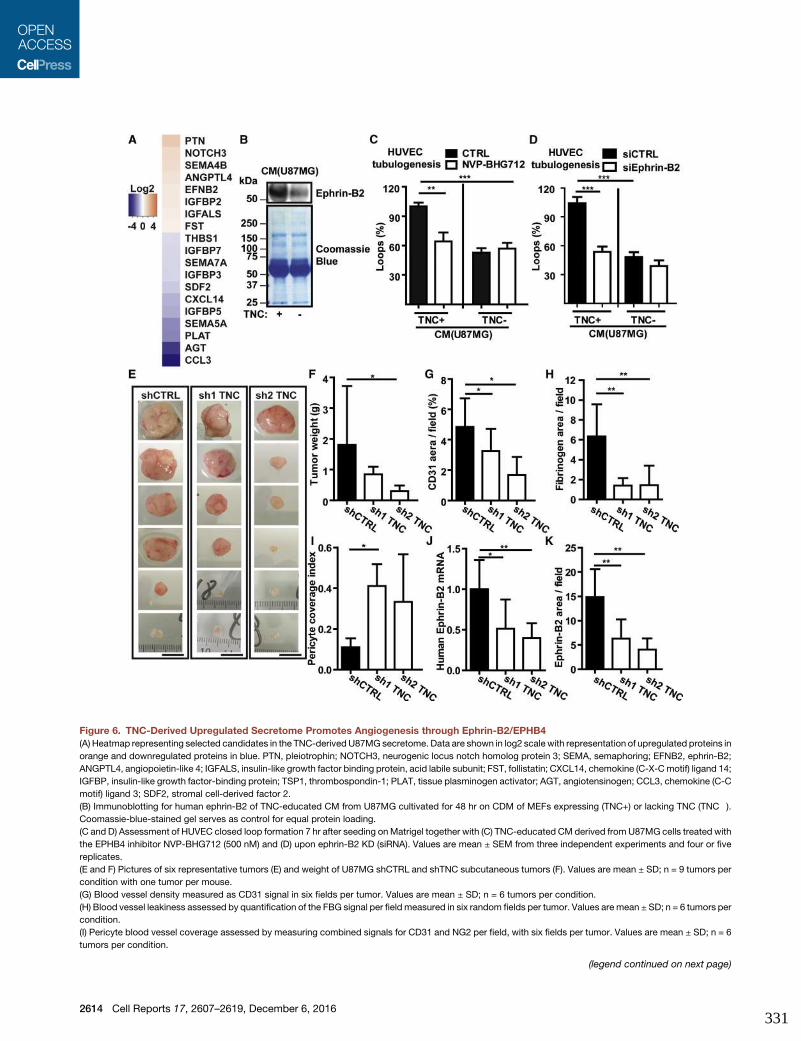
Figure 6. TNC-Derived Upregulated Secretome Promotes Angiogenesis through Ephrin-B2/EPHB4
(A) Heatmap representing selected candidates in the TNC-derivedU87MG secretome. Data are shown in log2 scale with representation of upregulated proteins in
orange and downregulated proteins in blue. PTN, pleiotrophin; NOTCH3, neurogenic locus notch homolog protein 3; SEMA, semaphoring; EFNB2, ephrin-B2;
ANGPTL4, angiopoietin-like 4; IGFALS, insulin-like growth factor binding protein, acid labile subunit; FST, follistatin; CXCL14, chemokine (C-X-Cmotif) ligand 14;
IGFBP, insulin-like growth factor-binding protein; TSP1, thrombospondin-1; PLAT, tissue plasminogen activator; AGT, angiotensinogen; CCL3, chemokine (C-C
motif) ligand 3; SDF2, stromal cell-derived factor 2.
(B) Immunoblotting for human ephrin-B2 of TNC-educated CM from U87MG cultivated for 48 hr on CDM of MEFs expressing (TNC+) or lacking TNC (TNC�).
Coomassie-blue-stained gel serves as control for equal protein loading.
(C and D) Assessment of HUVEC closed loop formation 7 hr after seeding onMatrigel together with (C) TNC-educated CM derived fromU87MG cells treated with
the EPHB4 inhibitor NVP-BHG712 (500 nM) and (D) upon ephrin-B2 KD (siRNA). Values are mean ± SEM from three independent experiments and four or five
replicates.
(E and F) Pictures of six representative tumors (E) and weight of U87MG shCTRL and shTNC subcutaneous tumors (F). Values are mean ± SD; n = 9 tumors per
condition with one tumor per mouse.
(G) Blood vessel density measured as CD31 signal in six fields per tumor. Values are mean ± SD; n = 6 tumors per condition.
(H) Blood vessel leakiness assessed by quantification of the FBG signal per field measured in six random fields per tumor. Values are mean ± SD; n = 6 tumors per
condition.
(I) Pericyte blood vessel coverage assessed by measuring combined signals for CD31 and NG2 per field, with six fields per tumor. Values are mean ± SD; n = 6
tumors per condition.
(legend continued on next page)
2614 Cell Reports 17, 2607–2619, December 6, 2016331

this effect was significant in sh2 TNC cells (Figures 6E, 6F,
and S7H) and was correlated with reduced TNC expression.
Whereas no difference in host-derived (murine) TNC expression
was seen, tumor cell-derived (human) TNC expression was lower
in shTNC tumors, indicating that the TNC KD was active in vivo
(Figures S7I and S7J). These results showed that TNC promoted
U87MG tumor growth.
By CD31 staining, we observed that blood vessels were more
numerous in control tumors than in TNC KD tumors (Figure 6G).
Given its close proximity to blood vessels (Figure S7D), TNCmay
affect vessel function. Assessing the expression of fibrinogen
(FBG) that spills out into the surrounding tissue from tumor ves-
sels as a readout for vessel leakiness, we determined either the
covered FBG surface or the leakiness score, which includes the
relative abundance of leakage sites (Figures S7K and S7L). We
observed that vessels were more leaky in control tumors than
in TNC KD tumors (Figures 6H and S7M). We also analyzed peri-
cyte abundance and coverage of blood vessels by tissue stain-
ing for NG2 and observed fewer pericytes and a lower pericyte
coverage index in control tumors (Figures 6I, S7N, and S7O).
Analysis of ephrin-B2 expression in U87MG tumors revealed
that whereas murine ephrin-B2 was not different (Figure S7P),
human ephrin-B2 mRNA and protein levels were significantly
higher in control tumors than in TNC KD tumors (Figures 6J,
6K, and S7Q). Thus, TNC promotes ephrin-B2 expression in
GBM cells, which correlates with more but less functional blood
vessels.
Combined Tenascin-C and Ephrin-B2 as well as theTenascin-C-Dependent Protein Signature Correlatewith Poor Glioma Patient SurvivalIt was already known that TNCmRNA levels correlate with wors-
ened overall survival (Midwood et al., 2011) and that ephrin-B2
protein levels correlate with lower progression-free survival of
GBM patients (Tu et al., 2012). We now revisited the expression
of these two molecules using publicly available transcriptome
data of two larger cohorts from The Cancer Genome Atlas
(TCGA) comprising 745 glioma patients with 540 GBM and 205
low-grade glioma (LGG) specimens to determine how combined
expression of TNC and ephrin-B2 or expression of our identified
TNC-upregulated list of 65 proteins (Table S2) correlated with
patient survival. This analysis substantiated published results
and demonstrated that high ephrin-B2 expression correlates
with shorter overall survival of LGG and GBM patients (Figures
S8A and S8B). In addition TNC, which was found to be one of
the most overexpressed genes in GBM, ranging in the top 2%
of overexpressed genes with a 36-fold higher level in the GBM
patients (Figure S8C), was also correlated with shorter survival
in GBM and LGG patients (Figures S8D and S8E). Moreover,
the prediction power largely increased when the combined
expression of ephrin-B2 and TNC was used (Figures 7A and
7B). Furthermore, by patient stratification using a cutoff for
assignment into high and low averages of gene expression of
the TNC signature, we observed that higher expression of the
65 upregulated candidates was correlated with shorter survival
of GBM and LGG patients (Figures 7C and 7D). However, there
was no correlation between our signature and prognosis of pa-
tients with head and neck squamous cell carcinoma; breast, co-
lon, lung, and ovarian cancers; or melanoma (Figures S9A–S9F),
demonstrating a selected specificity of this signature for glioma
malignancy. Our results thus demonstrate that the combined
expression of ephrin-B2 and TNC as well as the TNC-derived
signature has a strong negative prognostic value for survival of
LGG and GBM patients that is higher than that observed for
TNC and ephrin-B2 alone.
Inhibition of EPHB4 Reduces Glioblastoma VesselFormation and GrowthFinally, we assessed a potential anti-tumorigenic effect of
EPHB4 inhibition in GBM by intraperitoneal administration of
the specific EPHB4 kinase inhibitor NVP-BHG712 in U87MG-tu-
mor-bearing mice (Martiny-Baron et al., 2010). We observed a
significantly reduced tumor growth (Figure 7E), a reduced prolif-
eration index (Figure 7F), and a decrease in vessel density (Fig-
ure 7G) in treated mice. We conclude that targeting the ephrin-
B2/EPHB4 axis has treatment potential for GBM.
In summary, our study shows that TNC stimulates the angio-
genic properties of fibroblasts and GBM cells by altering the
composition of their secretomes. We revealed ephrin-B2 as
novel pro-angiogenic factor that is upregulated by TNC in
GBM cells in vitro and in vivo. Furthermore, ephrin-B2 notably
conveys TNC pro-angiogenic activity. This might be relevant
for treating GBM patients, as blocking EPHB4 reduced GBM
growth. In contrast, a direct interaction with TNC interferes
with EC survival, proliferation, and tubulogenesis, thus counter-
acting the pro-angiogenic paracrine activities of TNC. We
describe YAP as a novel downstream target that is impaired by
the anti-adhesive activity of TNC. Cytoplasmic sequestration of
YAP by TNC results in repression of pro-angiogenic genes.
Thus, a concurrent action of direct and paracrine responses to
TNC in the TME could determine whether ECs react by thriving
or dying (Figure 7H).
DISCUSSION
Some studies have investigated a potential role of TNC in tumor
angiogenesis, but mechanistic insight was lacking (reviewed in
Orend et al., 2014). Here, we used several state-of-the-art angio-
genesis models to comprehensively address the roles of TNC in
tumor angiogenesis. We demonstrated independent pro- and
anti- angiogenic effects of TNC. It is remarkable that TNC is
mostly absent from healthy arteries or veins (Kimura et al.,
2014; Mustafa et al., 2012) as well as from remodeling angio-
genic tissues such as the endometrium or placenta (Mustafa
(J and K) Ephrin-B2 levels in U87MG shCTRL and TNC KD tumors. (J) Human ephrin-B2 mRNA levels (qRT-PCR analysis). Values are mean ± SD; n = 9, 8, and 6
tumors for shCTRL, sh1 TNC, and sh2 TNC cells, respectively. (K) Ephrin-B2 quantification by tissue staining. Values are mean ± SD; n = 6 tumors per condition
and ten fields per tumor.
See also Figures S6 and S7 and Tables S1 and S2.
Cell Reports 17, 2607–2619, December 6, 2016 2615332
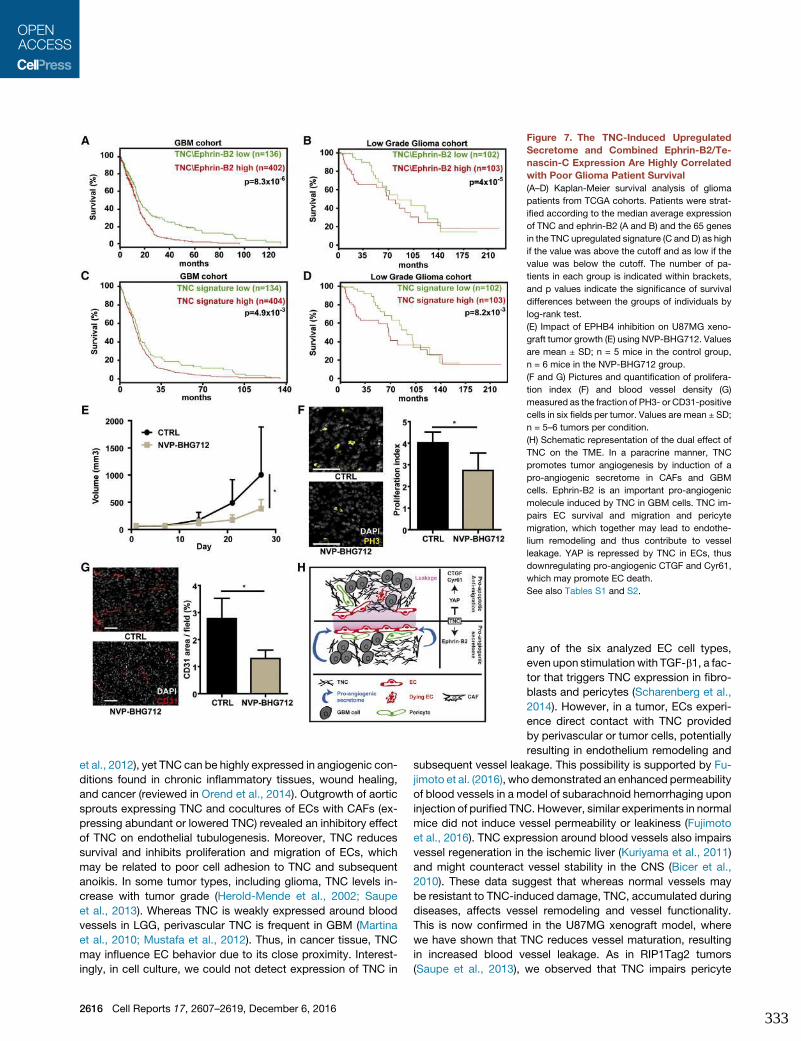
et al., 2012), yet TNC can be highly expressed in angiogenic con-
ditions found in chronic inflammatory tissues, wound healing,
and cancer (reviewed in Orend et al., 2014). Outgrowth of aortic
sprouts expressing TNC and cocultures of ECs with CAFs (ex-
pressing abundant or lowered TNC) revealed an inhibitory effect
of TNC on endothelial tubulogenesis. Moreover, TNC reduces
survival and inhibits proliferation and migration of ECs, which
may be related to poor cell adhesion to TNC and subsequent
anoikis. In some tumor types, including glioma, TNC levels in-
crease with tumor grade (Herold-Mende et al., 2002; Saupe
et al., 2013). Whereas TNC is weakly expressed around blood
vessels in LGG, perivascular TNC is frequent in GBM (Martina
et al., 2010; Mustafa et al., 2012). Thus, in cancer tissue, TNC
may influence EC behavior due to its close proximity. Interest-
ingly, in cell culture, we could not detect expression of TNC in
Figure 7. The TNC-Induced Upregulated
Secretome and Combined Ephrin-B2/Te-
nascin-C Expression Are Highly Correlated
with Poor Glioma Patient Survival
(A–D) Kaplan-Meier survival analysis of glioma
patients from TCGA cohorts. Patients were strat-
ified according to the median average expression
of TNC and ephrin-B2 (A and B) and the 65 genes
in the TNC upregulated signature (C and D) as high
if the value was above the cutoff and as low if the
value was below the cutoff. The number of pa-
tients in each group is indicated within brackets,
and p values indicate the significance of survival
differences between the groups of individuals by
log-rank test.
(E) Impact of EPHB4 inhibition on U87MG xeno-
graft tumor growth (E) using NVP-BHG712. Values
are mean ± SD; n = 5 mice in the control group,
n = 6 mice in the NVP-BHG712 group.
(F and G) Pictures and quantification of prolifera-
tion index (F) and blood vessel density (G)
measured as the fraction of PH3- or CD31-positive
cells in six fields per tumor. Values are mean ± SD;
n = 5–6 tumors per condition.
(H) Schematic representation of the dual effect of
TNC on the TME. In a paracrine manner, TNC
promotes tumor angiogenesis by induction of a
pro-angiogenic secretome in CAFs and GBM
cells. Ephrin-B2 is an important pro-angiogenic
molecule induced by TNC in GBM cells. TNC im-
pairs EC survival and migration and pericyte
migration, which together may lead to endothe-
lium remodeling and thus contribute to vessel
leakage. YAP is repressed by TNC in ECs, thus
downregulating pro-angiogenic CTGF and Cyr61,
which may promote EC death.
See also Tables S1 and S2.
any of the six analyzed EC cell types,
even upon stimulation with TGF-b1, a fac-
tor that triggers TNC expression in fibro-
blasts and pericytes (Scharenberg et al.,
2014). However, in a tumor, ECs experi-
ence direct contact with TNC provided
by perivascular or tumor cells, potentially
resulting in endothelium remodeling and
subsequent vessel leakage. This possibility is supported by Fu-
jimoto et al. (2016), who demonstrated an enhanced permeability
of blood vessels in a model of subarachnoid hemorrhaging upon
injection of purified TNC. However, similar experiments in normal
mice did not induce vessel permeability or leakiness (Fujimoto
et al., 2016). TNC expression around blood vessels also impairs
vessel regeneration in the ischemic liver (Kuriyama et al., 2011)
and might counteract vessel stability in the CNS (Bicer et al.,
2010). These data suggest that whereas normal vessels may
be resistant to TNC-induced damage, TNC, accumulated during
diseases, affects vessel remodeling and vessel functionality.
This is now confirmed in the U87MG xenograft model, where
we have shown that TNC reduces vessel maturation, resulting
in increased blood vessel leakage. As in RIP1Tag2 tumors
(Saupe et al., 2013), we observed that TNC impairs pericyte
2616 Cell Reports 17, 2607–2619, December 6, 2016333

coverage in U87MG tumors. Thus, dynamic TNC expression can
induce vascular remodeling and tumor vessel leakage.
We find that TNC impairs EC adhesion, thus blocking actin
polymerization into actin stress fibers. How cells interpret this
particular adhesion is not completely understood. YAP/TAZ
signaling acts as a sensor of cell adhesion and actin polymer-
ization and regulates migration and proliferation (Halder et al.,
2012). YAP/TAZ are translocated into the nucleus upon actin
polymerization and thus trigger gene transcription (Halder
et al., 2012). Here, we find that TNC directly represses EC
proliferation through impaired YAP nuclear translocation, likely
contributing to the anti-angiogenic effects of TNC. In support
of this possibility, we demonstrated that TNC downregulates
expression of the pro-angiogenic YAP target genes CTGF and
Cyr61 (Brigstock, 2002). Moreover, repression of YAP target
genes and inhibition of proliferation by TNC occurs through
YAP, since restoration of cell spreading and actin polymerization
on TNC by LPA increases cell growth, which is inhibited by KD
of YAP.
We also analyzed paracrine mechanisms and focused on gli-
omas where high TNC expression correlates with malignancy
(Midwood et al., 2011). We observed that TNC triggers secretion
of soluble factors in three different humanGBMcell lines and that
this secretome promotes survival, proliferation, and tubulogene-
sis of ECs. Our mass spectrometric analysis showed that the se-
cretome of TNC-instructed U87MG cells differs from that of
cells not educated by TNC. Among 221 differently expressed
molecules, 65 were upregulated, and their combined expression
correlates with poor patient survival in two large cohorts of LGG
and GBM patients. Thus, expression of these factors could be
valuable for glioma (and in particular LGG) patient survival
prediction.
We identified pro-angiogenic ephrin-B2 (Abengozar et al.,
2012) as an important target of TNC in the U87MG signature,
and we validated this in vivo. Ephrins, transmembrane signaling
proteins, play an important role in physiological and tumor angio-
genesis, which applies in particular to ephrin-B2 and its receptor,
EPHB4 (Pasquale, 2010). Using a pharmacological EPHB4 inhib-
itor (Martiny-Baron et al., 2010), we demonstrated its important
role in TNC-induced pro-angiogenic paracrine signaling. This
appears to be specific to GBM cells, since TNC did not increase
ephrin-B2 in CAFs. Ephrin-B2 has been described to activate
EPHB4 through membrane-mediated cell-cell contact (Pas-
quale, 2010) that may involve exosomes where ephrin-B2 is
abundant (Ji et al., 2013). Ephrin-B2 can also be released upon
proteolytic cleavage by MMP2 and MMP9 (Lin et al., 2008),
ADAMs, or g-secretase (Pasquale, 2010). We showed that eph-
rin-B2 acts as a soluble factor in the TNC-dependent secretome
and is released from U87MG cells by MMPs and ADAM10/17.
Previously it was shown that high expression of ephrin-B2 or
EPHB4 correlates with low progression-free survival (Tu et al.,
2012) and that high levels of TNC have been linked to shorter
overall survival of glioma patients (Midwood et al., 2011). Impor-
tantly, here we found not only that the expression of ephrin-B2 or
TNC alone correlates with poor overall survival in two large
cohorts of LGG andGBMbut also that concomitant high expres-
sion of TNC and ephrin-B2 has an even more significant predic-
tive value.
Our results showed for the first time that inhibition of EPHB4
reducesGBM tumor growth and angiogenesis, as had previously
been seen for other tumors (Abengozar et al., 2012; Martiny-
Baron et al., 2010). Thus, pharmacological targeting of the
TME by compounds that block TNC-induced pro-angiogenic
signals such as EPHB4 may be useful in blocking GBM tumor
angiogenesis and growth.
In conclusion, our study reveals cellular and molecular mech-
anisms underlying the multiple effects of TNC during tumor
angiogenesis. Whereas TNC exerts direct anti-angiogenic activ-
ity toward ECs, TNC also controls paracrine pro-angiogenic
signals conveyed by tumor cells and CAFs. These opposing ef-
fects provide contrasting angiomodulatory functions of TNC in
the TME, where its expression promotes the assembly of denser
but less functional tumor blood vessels. The TNC-regulated pro-
and anti-angiogenic signature, in particular ephrin-B2, may open
innovative pharmacological opportunities to counteract TNC
activity in GBM.
EXPERIMENTAL PROCEDURES
Animal Experiments
In the GBM xenograft model, 5 3 106 U87MG control (shCTRL) and knock-
down cells (shTNC) were diluted in 100 mL PBS and injected subcutaneously
in the left upper back of nude mice (Charles River Laboratories); after
55 days, mice were sacrificed. Analysis of EPHB4 inhibition on tumor develop-
ment was done by subcutaneously engrafting 5 3 106 U87MG shCTRL cells
into nude mice. Animals were grouped randomly when tumors reached an
average size of 70 mm3. NVP-BHG712 (diluted in DMSO) was applied daily
by intraperitoneal injection for 4 weeks at 10 mg/kg. DMSO alone was applied
as control. Tumor size was measured every 3 or 7 days with a caliper, and
tumor volume was calculated using the formula V = (a2*b)/2, where b is the
longest axis and a is the perpendicular axis to b. Tumor tissue was snap frozen
in liquid nitrogen or directly embedded in O.C.T. and further analyzed
by qRT-PCR and immunostaining. For GBM intracranial xenograft tumors,
13 106 U87MG cells were injected into nude mice and tumors were collected
after 35 days. Tumor tissues were directly embedded in O.C.T. for further anal-
ysis by immunostaining. Experiments with animals were performed according
to the guidelines of INSERM and the ethical committee of Alsace, France
(CREMEAS).
Vascular Coculture Assay
The protocol from Ghajar et al. (2013) was adapted. Briefly, CAF control
(shCTRL) or KD for TNC (shTNC) cells were seeded at a density of 50,000 cells
per well in 96-well culture plates together with VeraVec HUVECs at a 5:2 ratio.
The cell mixture was suspended in ECGMmedium. During the 7 days of cocul-
ture in ECGM, themediumwas replenished every 2 days. Then, cells were fixed
and stained with a CD31 antibody and DAPI. Total closed loops were counted
usingZENBlue software (Carl Zeiss) as a readout for network complexity. Three
independent experiments were done, with six replicates per experiment.
Statistical Analysis
All in vitro and ex vivo experiments were performed at least three times inde-
pendently using at least three biological replicates per experiment (except for
qPCR, which used one biological replicate). Statistical analysis and graphical
representation were done using GraphPad Prism or R. p values < 0.05 were
considered as statistically significant (*p < 0.05; **p < 0.01; ***p < 0.001;
****p < 0.0001).
ACCESSION NUMBERS
The accession number for the mass spectrometry proteomics data reported in
this paper is PX: PXD005217.
Cell Reports 17, 2607–2619, December 6, 2016 2617334
SUPPLEMENTAL INFORMATION
Supplemental Information includes Supplemental Experimental Procedures,
eleven figures, and two tables and can be found with this article online at
http://dx.doi.org/10.1016/j.celrep.2016.11.012.
AUTHOR CONTRIBUTIONS
T.R., B.L., E.V.O.-S., O.S., and G.O. designed the experiments; T.R., B.L.,
M.M.K., A.R., S.Z., D.M., I.V.-Q., and O.L. performed experiments and
analyzed the data; C.A., A.K., M.L.B., V.H., and E.N. provided technical assis-
tance; T.H. provided scientific support; E.V.O.-S. and O.S. critically reviewed
the manuscript; and T.R. and G.O. wrote the manuscript.
ACKNOWLEDGMENTS
This work is dedicated to the memory of Ruth Chiquet-Ehrismann. G.O. is
deeply grateful to Ruth Chiquet-Ehrismann for her generous scientific and per-
sonal support over the years. We are indebted toM. Chiquet, O. deWever, and
J.Huelsken for reagents; B.Mayer andF. Jehle for technical assistancewith the
proteomic analysis; and P. Simon-Assman for critical review of themanuscript.
This studywas supported by INCa, Fondation ARC, and Ligue contre le Cancer
(G.O.); ANR AngioMatrix (G.O. and E.V.O.-S.); Fondation ARC (E.V.O.-S.); the
DFG (grants SCHI 871/2, 871/5, 871/6, GR 1748/6, and INST 39/900-1) and
theEuropeanResearchCouncil, theExcellence Initiative of theGermanFederal
and State Governments (grant SFB850) (O.S.); and the Ligue contre le Cancer
(fellowship to T.R.).
Received: February 3, 2016
Revised: September 22, 2016
Accepted: October 31, 2016
Published: December 6, 2016
REFERENCES
Abengozar, M.A., de Frutos, S., Ferreiro, S., Soriano, J., Perez-Martinez, M.,
Olmeda, D., Marenchino, M., Canamero, M., Ortega, S., Megias, D., et al.
(2012). Blocking ephrinB2 with highly specific antibodies inhibits angiogen-
esis, lymphangiogenesis, and tumor growth. Blood 119, 4565–4576.
Bayless, K.J., and Johnson, G.A. (2011). Role of the cytoskeleton in formation
and maintenance of angiogenic sprouts. J. Vasc. Res. 48, 369–385.
Beacham, D.A., Amatangelo, M.D., and Cukierman, E. (2007). Preparation of
extracellular matrices produced by cultured and primary fibroblasts. Curr. Pro-
toc. Cell Biol. Chapter 10, Unit 10.9.
Bicer, A., Guclu, B., Ozkan, A., Kurtkaya, O., Koc, D.Y., Necmettin Pamir, M.,
and Kilic, T. (2010). Expressions of angiogenesis associated matrix metallo-
proteinases and extracellular matrix proteins in cerebral vascular malforma-
tions. J. Clin. Neurosci. 17, 232–236.
Bissell, M.J., and Radisky, D. (2001). Putting tumours in context. Nat. Rev.
Cancer 1, 46–54.
Brigstock, D.R. (2002). Regulation of angiogenesis and endothelial cell
function by connective tissue growth factor (CTGF) and cysteine-rich 61
(CYR61). Angiogenesis 5, 153–165.
Calvo, F., Ege, N., Grande-Garcia, A., Hooper, S., Jenkins, R.P., Chaudhry,
S.I., Harrington, K., Williamson, P., Moeendarbary, E., Charras, G., and Sahai,
E. (2013). Mechanotransduction and YAP-dependent matrix remodelling is
required for the generation andmaintenance of cancer-associated fibroblasts.
Nat. Cell Biol. 15, 637–646.
Campbell, N.E., Kellenberger, L., Greenaway, J., Moorehead, R.A., Linnerth-
Petrik, N.M., and Petrik, J. (2010). Extracellular matrix proteins and tumor
angiogenesis. J. Oncol. 2010, 586905.
Fujimoto, M., Shiba, M., Kawakita, F., Liu, L., Shimojo, N., Imanaka-Yoshida,
K., Yoshida, T., and Suzuki, H. (2016). Deficiency of tenascin-C and attenua-
tion of blood-brain barrier disruption following experimental subarachnoid
hemorrhage in mice. J. Neurosurg. 124, 1693–1702.
Ghajar, C.M., Peinado, H., Mori, H., Matei, I.R., Evason, K.J., Brazier, H.,
Almeida, D., Koller, A., Hajjar, K.A., Stainier, D.Y.R., et al. (2013). The perivas-
cular niche regulates breast tumour dormancy. Nat. Cell Biol. 15, 807–817.
Halder, G., Dupont, S., and Piccolo, S. (2012). Transduction of mechanical and
cytoskeletal cues by YAP and TAZ. Nat. Rev. Mol. Cell Biol. 13, 591–600.
Hanahan, D. (1985). Heritable formation of pancreatic beta-cell tumours in
transgenic mice expressing recombinant insulin/simian virus 40 oncogenes.
Nature 315, 115–122.
Hanahan, D., and Weinberg, R.A. (2011). Hallmarks of cancer: the next gener-
ation. Cell 144, 646–674.
Herold-Mende, C., Mueller, M.M., Bonsanto, M.M., Schmitt, H.P., Kunze, S.,
and Steiner, H.-H. (2002). Clinical impact and functional aspects of tenascin-
C expression during glioma progression. Int. J. Cancer 98, 362–369.
Hynes, R.O. (2009). The extracellular matrix: not just pretty fibrils. Science 326,
1216–1219.
Jain, R.K. (2014). Antiangiogenesis strategies revisited: from starving tumors
to alleviating hypoxia. Cancer Cell 26, 605–622.
Ji, H., Greening, D.W., Barnes, T.W., Lim, J.W., Tauro, B.J., Rai, A., Xu, R.,
Adda, C., Mathivanan, S., Zhao, W., et al. (2013). Proteome profiling of exo-
somes derived from human primary and metastatic colorectal cancer cells
reveal differential expression of key metastatic factors and signal transduction
components. Proteomics 13, 1672–1686.
Kalluri, R., and Zeisberg, M. (2006). Fibroblasts in cancer. Nat. Rev. Cancer 6,
392–401.
Kimura, T., Shiraishi, K., Furusho, A., Ito, S., Hirakata, S., Nishida, N., Yoshi-
mura, K., Imanaka-Yoshida, K., Yoshida, T., Ikeda, Y., et al. (2014). Tenascin
C protects aorta from acute dissection in mice. Sci. Rep. 4, 4051.
Kuriyama, N., Duarte, S., Hamada, T., Busuttil, R.W., and Coito, A.J. (2011).
Tenascin-C: a novel mediator of hepatic ischemia and reperfusion injury. Hep-
atology 54, 2125–2136.
Lamalice, L., Le Boeuf, F., and Huot, J. (2007). Endothelial cell migration during
angiogenesis. Circ. Res. 100, 782–794.
Langlois, B., Saupe, F., Rupp, T., Arnold, C., van der Heyden, M., Orend, G.,
and Hussenet, T. (2014). AngioMatrix, a signature of the tumor angiogenic
switch-specific matrisome, correlates with poor prognosis for glioma and
colorectal cancer patients. Oncotarget 5, 10529–10545.
Lin, K.-T., Sloniowski, S., Ethell, D.W., and Ethell, I.M. (2008). Ephrin-B2-
induced cleavage of EphB2 receptor is mediated bymatrix metalloproteinases
to trigger cell repulsion. J. Biol. Chem. 283, 28969–28979.
Martina, E., Degen, M., R€uegg, C., Merlo, A., Lino, M.M., Chiquet-Ehrismann,
R., and Brellier, F. (2010). Tenascin-W is a specific marker of glioma-associ-
ated blood vessels and stimulates angiogenesis in vitro. FASEB J. 24,
778–787.
Martiny-Baron, G., Holzer, P., Billy, E., Schnell, C., Brueggen, J., Ferretti, M.,
Schmiedeberg, N., Wood, J.M., Furet, P., and Imbach, P. (2010). The small
molecule specific EphB4 kinase inhibitor NVP-BHG712 inhibits VEGF driven
angiogenesis. Angiogenesis 13, 259–267.
McDonald, D.M., and Choyke, P.L. (2003). Imaging of angiogenesis: from
microscope to clinic. Nat. Med. 9, 713–725.
Midwood, K.S., Hussenet, T., Langlois, B., and Orend, G. (2011). Advances in
tenascin-C biology. Cell. Mol. Life Sci. 68, 3175–3199.
Midwood, K.S., Chiquet, M., Tucker, R.P., andOrend, G. (2016). Tenascin-C at
a glance. J. Cell Sci.
Mustafa, D.A.M., Dekker, L.J., Stingl, C., Kremer, A., Stoop, M., Sillevis Smitt,
P.A.E., Kros, J.M., and Luider, T.M. (2012). A proteome comparison between
physiological angiogenesis and angiogenesis in glioblastoma.Mol. Cell. Prote-
omics 1, M111.008466.
Orend, G., Saupe, F., Schwenzer, A., and Midwood, K. (2014). The Extracel-
lular Matrix and Cancer: Regulation of Tumor Cell Biology by Tenascin-C
(iConcept Press).
Pasquale, E.B. (2010). Eph receptors and ephrins in cancer: bidirectional sig-
nalling and beyond. Nat. Rev. Cancer 10, 165–180.
2618 Cell Reports 17, 2607–2619, December 6, 2016335
Posern, G., Sotiropoulos, A., and Treisman, R. (2002). Mutant actins demon-
strate a role for unpolymerized actin in control of transcription by serum
response factor. Mol. Biol. Cell 13, 4167–4178.
Saupe, F., Schwenzer, A., Jia, Y., Gasser, I., Spenle, C., Langlois, B., Kam-
merer, M., Lefebvre, O., Hlushchuk, R., Rupp, T., et al. (2013). Tenascin-C
downregulates wnt inhibitor dickkopf-1, promoting tumorigenesis in a neuro-
endocrine tumor model. Cell Rep. 5, 482–492.
Scharenberg, M.A., Pippenger, B.E., Sack, R., Zingg, D., Ferralli, J., Schenk,
S., Martin, I., and Chiquet-Ehrismann, R. (2014). TGF-b-induced differentiation
into myofibroblasts involves specific regulation of two MKL1 isoforms. J. Cell
Sci. 127, 1079–1091.
Shahinian, H., Loessner, D., Biniossek, M.L., Kizhakkedathu, J.N., Clements,
J.A., Magdolen, V., and Schilling, O. (2014). Secretome and degradome
profiling shows that Kallikrein-related peptidases 4, 5, 6, and 7 induce
TGFb-1 signaling in ovarian cancer cells. Mol. Oncol. 8, 68–82.
Siess, W., Zangl, K.J., Essler, M., Bauer, M., Brandl, R., Corrinth, C., Bittman,
R., Tigyi, G., and Aepfelbacher, M. (1999). Lysophosphatidic acidmediates the
rapid activation of platelets and endothelial cells by mildly oxidized low density
lipoprotein and accumulates in human atherosclerotic lesions. Proc. Natl.
Acad. Sci. USA 96, 6931–6936.
Tholen, S., Biniossek, M.L., Gansz, M., Gomez-Auli, A., Bengsch, F., Noel, A.,
Kizhakkedathu, J.N., Boerries, M., Busch, H., Reinheckel, T., and Schilling, O.
(2013). Deletion of cysteine cathepsins B or L yields differential impacts onmu-
rine skin proteome and degradome. Mol. Cell. Proteomics 12, 611–625.
Tu, Y., He, S., Fu, J., Li, G., Xu, R., Lu, H., and Deng, J. (2012). Expression of
EphrinB2 and EphB4 in glioma tissues correlated to the progression of glioma
and the prognosis of glioblastoma patients. Clin. Transl. Oncol. 14, 214–220.
Cell Reports 17, 2607–2619, December 6, 2016 2619336
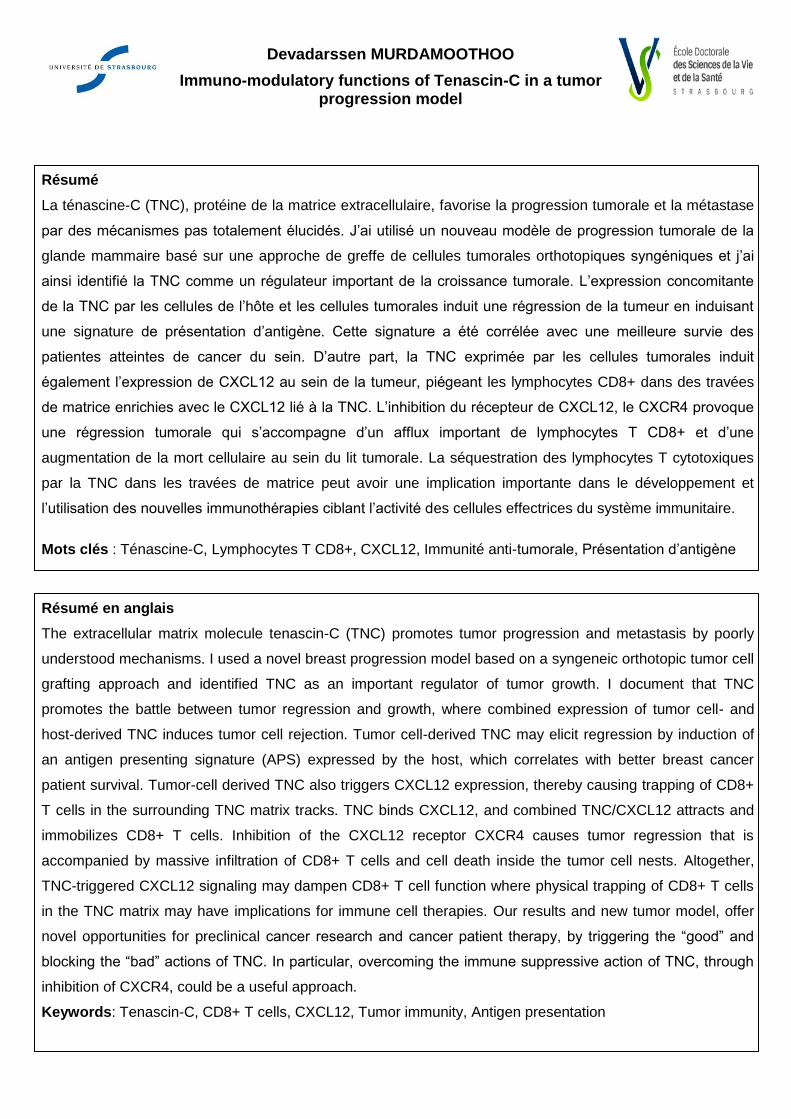
180
Devadarssen MURDAMOOTHOO
Immuno-modulatory functions of Tenascin-C in a tumor progression model
Résumé
La ténascine-C (TNC), protéine de la matrice extracellulaire, favorise la progression tumorale et la métastase
par des mécanismes pas totalement élucidés. J’ai utilisé un nouveau modèle de progression tumorale de la
glande mammaire basé sur une approche de greffe de cellules tumorales orthotopiques syngéniques et j’ai
ainsi identifié la TNC comme un régulateur important de la croissance tumorale. L’expression concomitante
de la TNC par les cellules de l’hôte et les cellules tumorales induit une régression de la tumeur en induisant
une signature de présentation d’antigène. Cette signature a été corrélée avec une meilleure survie des
patientes atteintes de cancer du sein. D’autre part, la TNC exprimée par les cellules tumorales induit
également l’expression de CXCL12 au sein de la tumeur, piégeant les lymphocytes CD8+ dans des travées
de matrice enrichies avec le CXCL12 lié à la TNC. L’inhibition du récepteur de CXCL12, le CXCR4 provoque
une régression tumorale qui s’accompagne d’un afflux important de lymphocytes T CD8+ et d’une
augmentation de la mort cellulaire au sein du lit tumorale. La séquestration des lymphocytes T cytotoxiques
par la TNC dans les travées de matrice peut avoir une implication importante dans le développement et
l’utilisation des nouvelles immunothérapies ciblant l’activité des cellules effectrices du système immunitaire.
Mots clés : Ténascine-C, Lymphocytes T CD8+, CXCL12, Immunité anti-tumorale, Présentation d’antigène
Résumé en anglais
The extracellular matrix molecule tenascin-C (TNC) promotes tumor progression and metastasis by poorly
understood mechanisms. I used a novel breast progression model based on a syngeneic orthotopic tumor cell
grafting approach and identified TNC as an important regulator of tumor growth. I document that TNC
promotes the battle between tumor regression and growth, where combined expression of tumor cell- and
host-derived TNC induces tumor cell rejection. Tumor cell-derived TNC may elicit regression by induction of
an antigen presenting signature (APS) expressed by the host, which correlates with better breast cancer
patient survival. Tumor-cell derived TNC also triggers CXCL12 expression, thereby causing trapping of CD8+
T cells in the surrounding TNC matrix tracks. TNC binds CXCL12, and combined TNC/CXCL12 attracts and
immobilizes CD8+ T cells. Inhibition of the CXCL12 receptor CXCR4 causes tumor regression that is
accompanied by massive infiltration of CD8+ T cells and cell death inside the tumor cell nests. Altogether,
TNC-triggered CXCL12 signaling may dampen CD8+ T cell function where physical trapping of CD8+ T cells
in the TNC matrix may have implications for immune cell therapies. Our results and new tumor model, offer
novel opportunities for preclinical cancer research and cancer patient therapy, by triggering the “good” and
blocking the “bad” actions of TNC. In particular, overcoming the immune suppressive action of TNC, through
inhibition of CXCR4, could be a useful approach.
Keywords: Tenascin-C, CD8+ T cells, CXCL12, Tumor immunity, Antigen presentation
Related Documents