Research Data Monograph Circulating Tumor Cells Cellular Information for Better Healthcare 8425 (2005/01/18) 3401 Masons Mill Road, Suite 100 Huntingdon Valley, Pennsylvania 19006 phone 215.830.0777, 877.822.0777 web www.immunicon.com Research Use Only. Performance characteristics have not been established. Information in this monograph concerns uses that have not been approved or cleared by the U.S. Food and Drug Administration. These studies are presented to encourage additional research studies.

Welcome message from author
This document is posted to help you gain knowledge. Please leave a comment to let me know what you think about it! Share it to your friends and learn new things together.
Transcript
Research DataMonograph
Circulating Tumor Cells
Cellular Information for Better Healthcare
8425 (2005/01/18)
3401 Masons Mill Road, Suite 100Huntingdon Valley, Pennsylvania 19006phone 215.830.0777, 877.822.0777web www.immunicon.com
Research Use Only. Performance characteristics have not been established.Information in this monograph concerns uses that have not been approved or clearedby the U.S. Food and Drug Administration. These studies are presented to encourageadditional research studies.
Intended Use Statement for the CellSearch™ Circulating Tumor Cell KitFor in vitro diagnostic use.The CellSearch™ Circulating Tumor Cell Kit is intended for the enumeration ofcirculating tumor cells (CTC) of epithelial origin (CD45-, EpCAM+, andcytokeratins 8, 18+, and/or 19+) in whole blood.
The presence of CTC in the peripheral blood, as detected by the CellSearch™Circulating Tumor Cell Kit, is associated with decreased progression free survivaland decreased overall survival in patients treated for metastatic breast cancer. ACTC count of 5 or more per 7.5 mL of blood is predictive of shorter progressionfree survival and overall survival.
Research Use OnlyFor Research Use Only. Performance characteristics have not beenestablished.Some information in this monograph concerns a use that has not been approvedor cleared by the U.S. Food and Drug Administration.
CellTracks®, CellSave® and MagNest® are registered trademarks of Immunivest Corporation.CellSearch™ is a trademark of Veridex, LLC.
This product and/or associated components thereof, and procedures and instrument systemsdescribed herein, are protected by United States patents and corresponding international patentsand pending patent applications, owned by Immunivest Corporation, a subsidiary of ImmuniconCorporation, and include one or more of the following: US Patent Numbers 5,512,332, 5,597,531,5,698,271, 6,120,856, 6,623,982, 6,620,627, 5,985,153, 6,136,182, 6,365,262, 6,645,731, 6,861,259,6,790,366, 5,186,827, and 5,466,574. Certain components are licensed to Immunicon Corporationfrom Streck Laboratories, Inc., La Vista, NE, US Patent Numbers 5,849,517 and 5,459,073.
Cellular Information for Better Healthcare
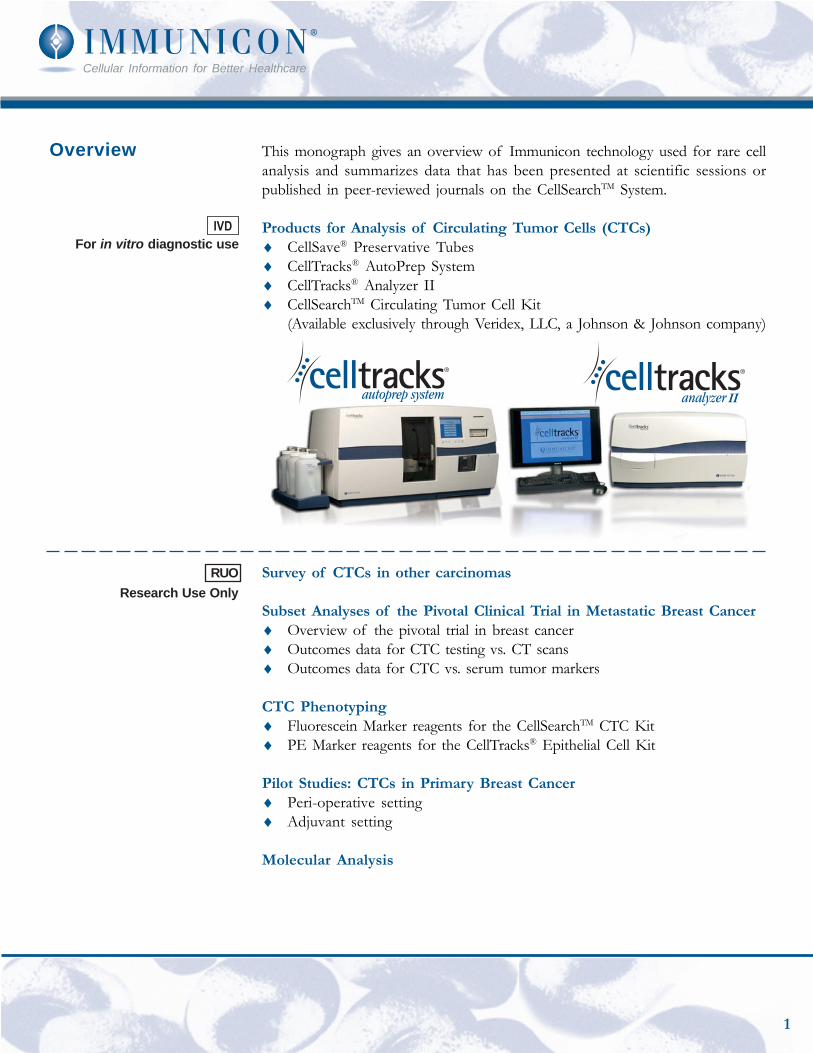
This monograph gives an overview of Immunicon technology used for rare cellanalysis and summarizes data that has been presented at scientific sessions orpublished in peer-reviewed journals on the CellSearchTM System.
Products for Analysis of Circulating Tumor Cells (CTCs)♦ CellSave® Preservative Tubes♦ CellTracks® AutoPrep System♦ CellTracks® Analyzer II♦ CellSearchTM Circulating Tumor Cell Kit
(Available exclusively through Veridex, LLC, a Johnson & Johnson company)
Survey of CTCs in other carcinomas
Subset Analyses of the Pivotal Clinical Trial in Metastatic Breast Cancer♦ Overview of the pivotal trial in breast cancer♦ Outcomes data for CTC testing vs. CT scans♦ Outcomes data for CTC vs. serum tumor markers
CTC Phenotyping♦ Fluorescein Marker reagents for the CellSearchTM CTC Kit♦ PE Marker reagents for the CellTracks® Epithelial Cell Kit
Pilot Studies: CTCs in Primary Breast Cancer♦ Peri-operative setting♦ Adjuvant setting
Molecular Analysis
Overview
For in vitro diagnostic use
RUOResearch Use Only
1
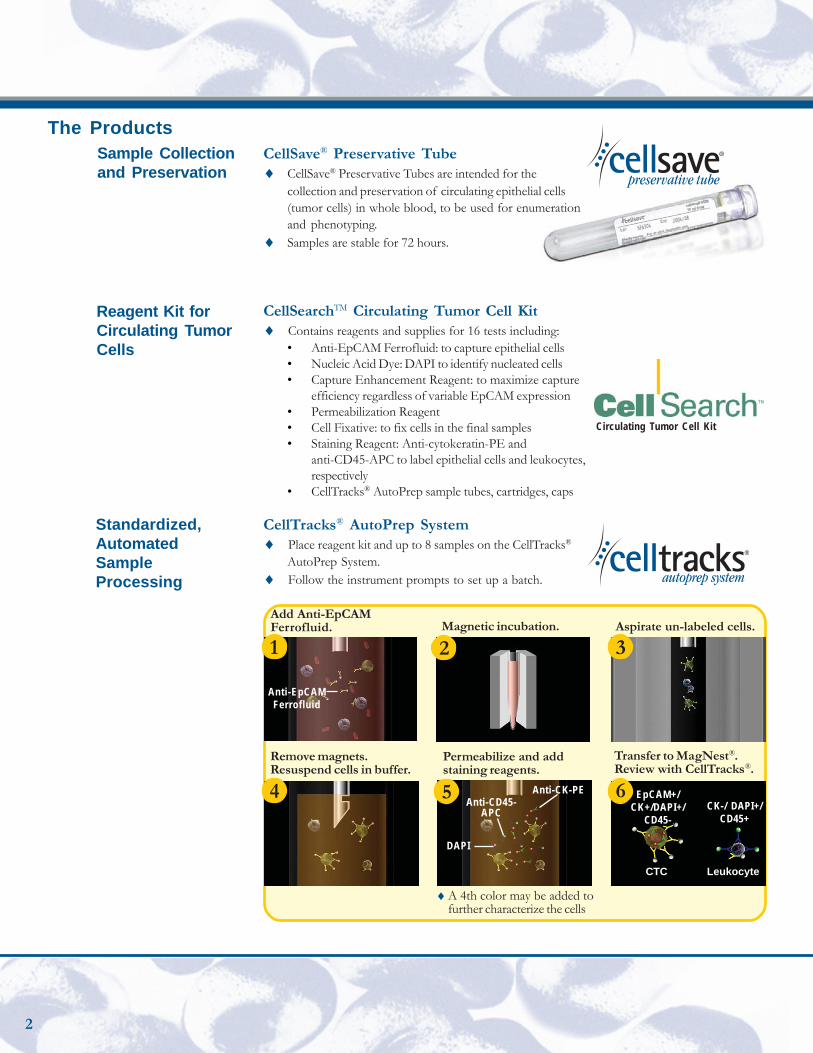
CellSave® Preservative Tube♦ CellSave® Preservative Tubes are intended for the
collection and preservation of circulating epithelial cells(tumor cells) in whole blood, to be used for enumerationand phenotyping.
♦ Samples are stable for 72 hours.
CellSearchTM Circulating Tumor Cell Kit♦ Contains reagents and supplies for 16 tests including:
• Anti-EpCAM Ferrofluid: to capture epithelial cells• Nucleic Acid Dye: DAPI to identify nucleated cells• Capture Enhancement Reagent: to maximize capture
efficiency regardless of variable EpCAM expression• Permeabilization Reagent• Cell Fixative: to fix cells in the final samples• Staining Reagent: Anti-cytokeratin-PE and
anti-CD45-APC to label epithelial cells and leukocytes,respectively
• CellTracks® AutoPrep sample tubes, cartridges, caps
CellTracks® AutoPrep System♦ Place reagent kit and up to 8 samples on the CellTracks®
AutoPrep System.♦ Follow the instrument prompts to set up a batch.
The ProductsSample Collectionand Preservation
Standardized,AutomatedSampleProcessing
Reagent Kit forCirculating TumorCells
♦ A 4th color may be added tofurther characterize the cells
1Magnetic incubation. Aspirate un-labeled cells.
Anti-EpCAMFerrofluid
Permeabilize and addstaining reagents.
EpCAM+/CK+/DAPI+/
CD45-CK-/ DAPI+/
CD45+
CTC Leukocyte
Transfer to MagNest®.Review with CellTracks®.
Remove magnets.Resuspend cells in buffer.
Anti-CD45-APC
Anti-CK-PE
DAPI
Add Anti-EpCAMFerrofluid.
1 2 3
5 64
Circulating Tumor Cell Kit
2
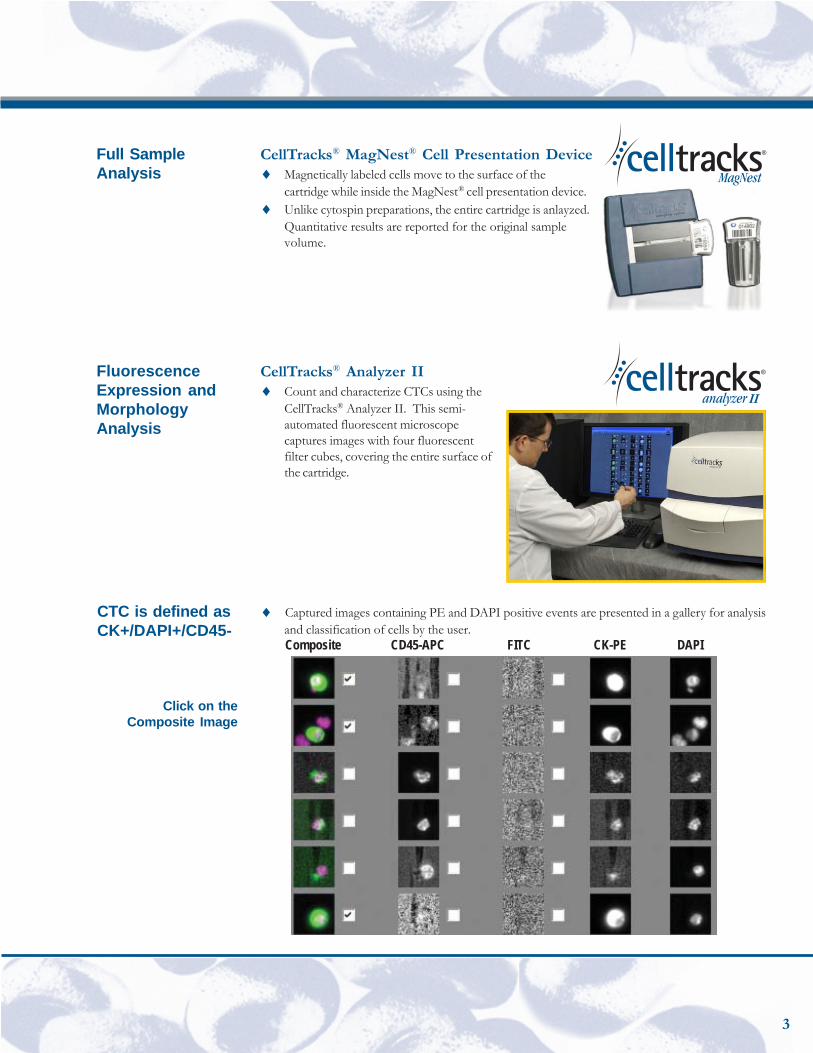
CellTracks® MagNest® Cell Presentation Device♦ Magnetically labeled cells move to the surface of the
cartridge while inside the MagNest® cell presentation device.♦ Unlike cytospin preparations, the entire cartridge is anlayzed.
Quantitative results are reported for the original samplevolume.
CellTracks® Analyzer II♦ Count and characterize CTCs using the
CellTracks® Analyzer II. This semi-automated fluorescent microscopecaptures images with four fluorescentfilter cubes, covering the entire surface ofthe cartridge.
Full SampleAnalysis
FluorescenceExpression andMorphologyAnalysis
♦ Captured images containing PE and DAPI positive events are presented in a gallery for analysisand classification of cells by the user.Composite CD45-APC FITC CK-PE DAPI
CTC is defined asCK+/DAPI+/CD45-
Click on theComposite Image
3
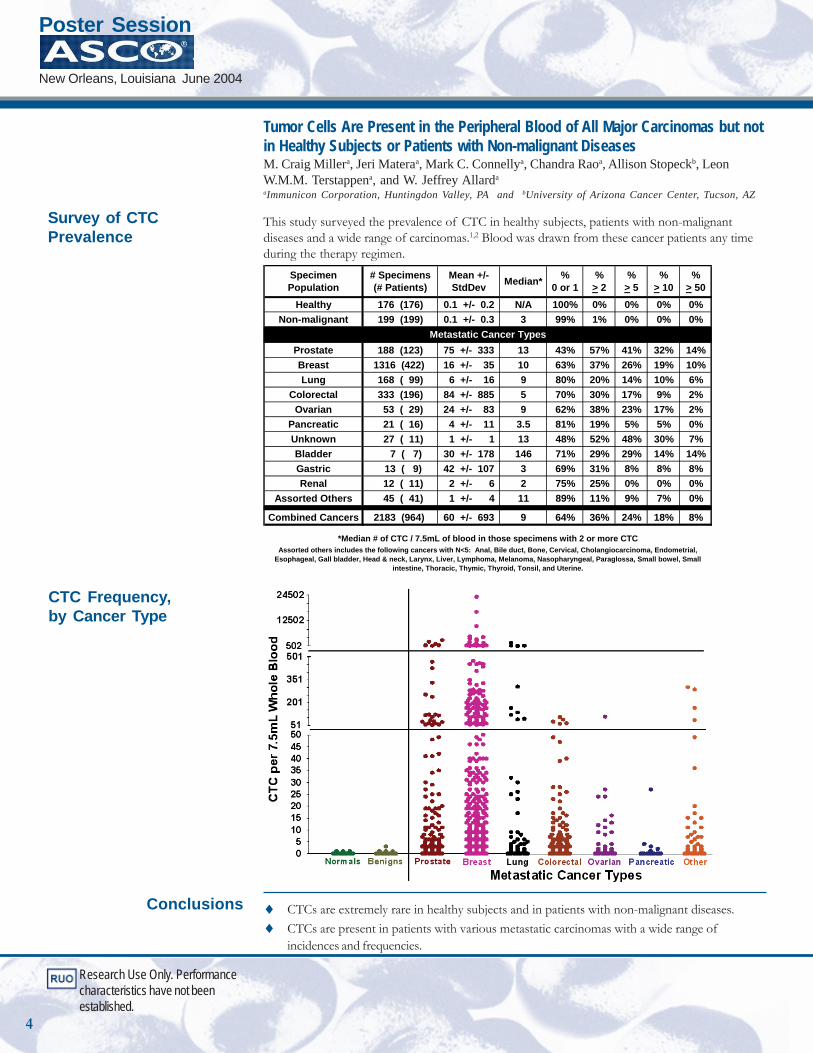
♦ CTCs are extremely rare in healthy subjects and in patients with non-malignant diseases.♦ CTCs are present in patients with various metastatic carcinomas with a wide range of
incidences and frequencies.
Conclusions
Specimen Population
# Specimens(# Patients)
Mean +/- StdDev Median* %
0 or 1%
> 2%
> 5%
> 10%
> 50Healthy 176 (176) 0.1 +/- 0.2 N/A 100% 0% 0% 0% 0%
Non-malignant 199 (199) 0.1 +/- 0.3 3 99% 1% 0% 0% 0%
Prostate 188 (123) 75 +/- 333 13 43% 57% 41% 32% 14%Breast 1316 (422) 16 +/- 35 10 63% 37% 26% 19% 10%Lung 168 ( 99) 6 +/- 16 9 80% 20% 14% 10% 6%
Colorectal 333 (196) 84 +/- 885 5 70% 30% 17% 9% 2%Ovarian 53 ( 29) 24 +/- 83 9 62% 38% 23% 17% 2%
Pancreatic 21 ( 16) 4 +/- 11 3.5 81% 19% 5% 5% 0%Unknown 27 ( 11) 1 +/- 1 13 48% 52% 48% 30% 7%Bladder 7 ( 7) 30 +/- 178 146 71% 29% 29% 14% 14%Gastric 13 ( 9) 42 +/- 107 3 69% 31% 8% 8% 8%Renal 12 ( 11) 2 +/- 6 2 75% 25% 0% 0% 0%
Assorted Others 45 ( 41) 1 +/- 4 11 89% 11% 9% 7% 0%
Combined Cancers 2183 (964) 60 +/- 693 9 64% 36% 24% 18% 8%
Assorted others includes the following cancers with N<5: Anal, Bile duct, Bone, Cervical, Cholangiocarcinoma, Endometrial, Esophageal, Gall bladder, Head & neck, Larynx, Liver, Lymphoma, Melanoma, Nasopharyngeal, Paraglossa, Small bowel, Small
intestine, Thoracic, Thymic, Thyroid, Tonsil, and Uterine.
*Median # of CTC / 7.5mL of blood in those specimens with 2 or more CTC
Metastatic Cancer Types
Tumor Cells Are Present in the Peripheral Blood of All Major Carcinomas but notin Healthy Subjects or Patients with Non-malignant DiseasesM. Craig Millera, Jeri Materaa, Mark C. Connellya, Chandra Raoa, Allison Stopeckb, LeonW.M.M. Terstappena, and W. Jeffrey Allarda
aImmunicon Corporation, Huntingdon Valley, PA and bUniversity of Arizona Cancer Center, Tucson, AZ
This study surveyed the prevalence of CTC in healthy subjects, patients with non-malignantdiseases and a wide range of carcinomas.1,2 Blood was drawn from these cancer patients any timeduring the therapy regimen.
CTC Frequency,by Cancer Type
Survey of CTCPrevalence
Research Use Only. Performancecharacteristics have not beenestablished.
Poster Session
New Orleans, Louisiana June 2004
4
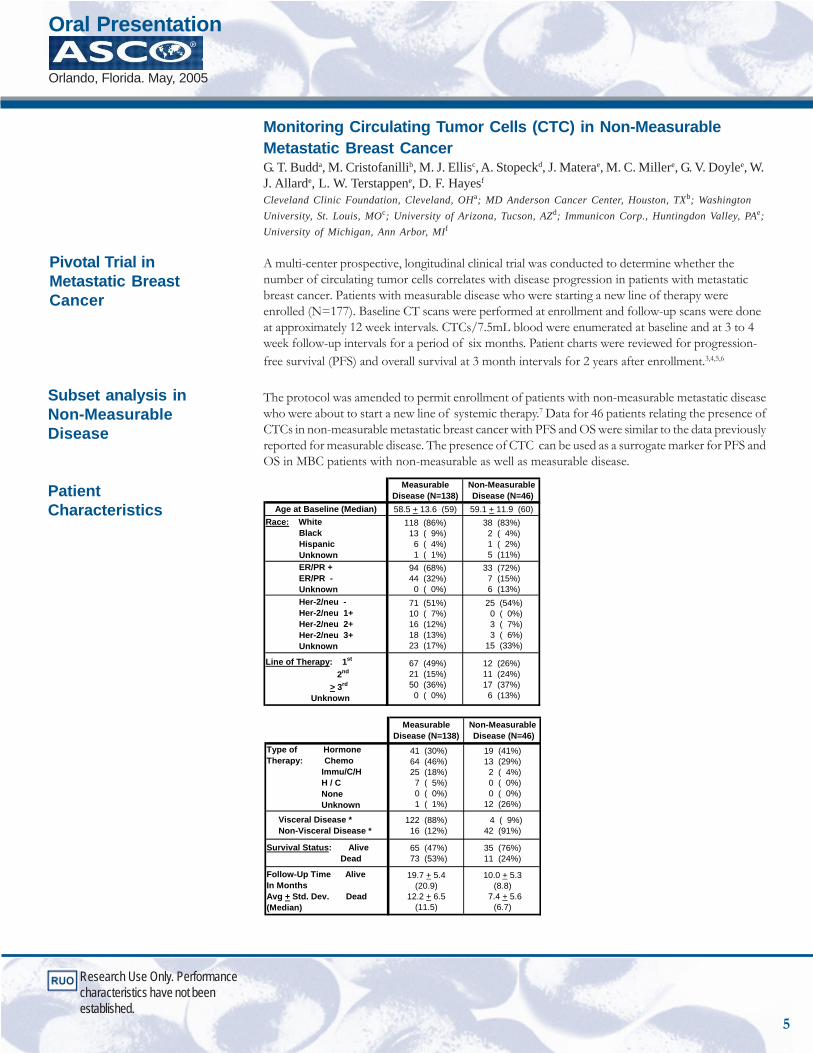
Monitoring Circulating Tumor Cells (CTC) in Non-MeasurableMetastatic Breast CancerG. T. Budda, M. Cristofanillib, M. J. Ellisc, A. Stopeckd, J. Materae, M. C. Millere, G. V. Doylee, W.J. Allarde, L. W. Terstappene, D. F. Hayesf
Cleveland Clinic Foundation, Cleveland, OHa; MD Anderson Cancer Center, Houston, TXb; WashingtonUniversity, St. Louis, MOc; University of Arizona, Tucson, AZd; Immunicon Corp., Huntingdon Valley, PAe;University of Michigan, Ann Arbor, MIf
A multi-center prospective, longitudinal clinical trial was conducted to determine whether thenumber of circulating tumor cells correlates with disease progression in patients with metastaticbreast cancer. Patients with measurable disease who were starting a new line of therapy wereenrolled (N=177). Baseline CT scans were performed at enrollment and follow-up scans were doneat approximately 12 week intervals. CTCs/7.5mL blood were enumerated at baseline and at 3 to 4week follow-up intervals for a period of six months. Patient charts were reviewed for progression-free survival (PFS) and overall survival at 3 month intervals for 2 years after enrollment.3,4,5,6
The protocol was amended to permit enrollment of patients with non-measurable metastatic diseasewho were about to start a new line of systemic therapy.7 Data for 46 patients relating the presence ofCTCs in non-measurable metastatic breast cancer with PFS and OS were similar to the data previouslyreported for measurable disease. The presence of CTC can be used as a surrogate marker for PFS andOS in MBC patients with non-measurable as well as measurable disease.
MeasurableDisease (N=138)
Non-Measurable Disease (N=46)
Age at Baseline (Median) 58.5 + 13.6 (59) 59.1 + 11.9 (60)Race: White Black Hispanic Unknown
118 (86%) 13 ( 9%) 6 ( 4%) 1 ( 1%)
38 (83%) 2 ( 4%) 1 ( 2%) 5 (11%)
ER/PR + ER/PR - Unknown
94 (68%) 44 (32%) 0 ( 0%)
33 (72%) 7 (15%) 6 (13%)
Her-2/neu - Her-2/neu 1+ Her-2/neu 2+ Her-2/neu 3+ Unknown
71 (51%) 10 ( 7%) 16 (12%) 18 (13%) 23 (17%)
25 (54%) 0 ( 0%) 3 ( 7%) 3 ( 6%) 15 (33%)
Line of Therapy: 1st
2nd
> 3rd
Unknown
67 (49%) 21 (15%) 50 (36%) 0 ( 0%)
12 (26%)11 (24%)17 (37%) 6 (13%)
MeasurableDisease (N=138)
Non-Measurable Disease (N=46)
Type of HormoneTherapy: Chemo Immu/C/H H / C None Unknown
41 (30%) 64 (46%) 25 (18%) 7 ( 5%) 0 ( 0%) 1 ( 1%)
19 (41%)13 (29%) 2 ( 4%) 0 ( 0%) 0 ( 0%)12 (26%)
Visceral Disease * Non-Visceral Disease *
122 (88%) 16 (12%)
4 ( 9%)42 (91%)
Survival Status: Alive Dead
65 (47%) 73 (53%)
35 (76%)11 (24%)
Follow-Up Time AliveIn MonthsAvg + Std. Dev. Dead(Median)
19.7 + 5.4(20.9)
12.2 + 6.5(11.5)
10.0 + 5.3(8.8)
7.4 + 5.6(6.7)
Subset analysis inNon-MeasurableDisease
PatientCharacteristics
Research Use Only. Performancecharacteristics have not beenestablished.
Pivotal Trial inMetastatic BreastCancer
Oral Presentation
Orlando, Florida. May, 2005
5
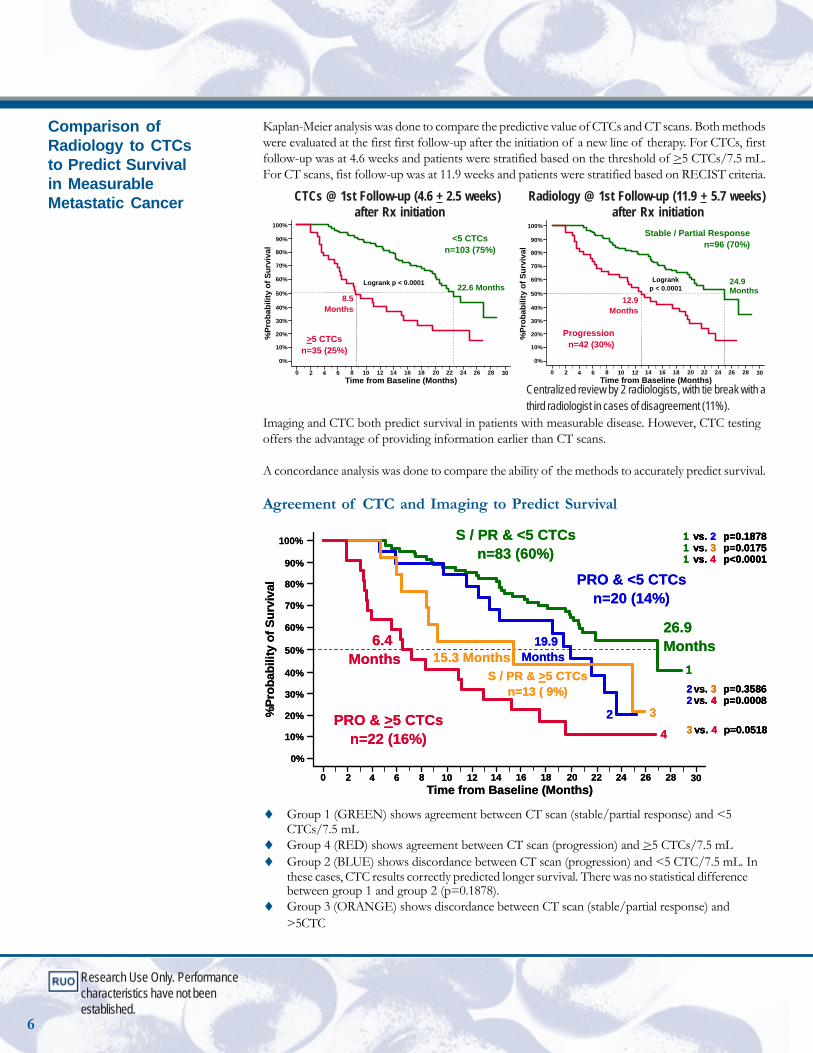
Comparison ofRadiology to CTCsto Predict Survivalin MeasurableMetastatic Cancer
Research Use Only. Performancecharacteristics have not beenestablished.
Kaplan-Meier analysis was done to compare the predictive value of CTCs and CT scans. Both methodswere evaluated at the first first follow-up after the initiation of a new line of therapy. For CTCs, firstfollow-up was at 4.6 weeks and patients were stratified based on the threshold of >5 CTCs/7.5 mL.For CT scans, fist follow-up was at 11.9 weeks and patients were stratified based on RECIST criteria.
CTCs @ 1st Follow-up (4.6 + 2.5 weeks) Radiology @ 1st Follow-up (11.9 + 5.7 weeks) after Rx initiation after Rx initiation
%Pr
obab
ility
of S
urvi
val
Time from Baseline (Months)0 2 4 6 8 10 12 14 16 18 22 24 26 28 30
0%
10%
20%
30%
40%
50%
60%
70%
80%
90%
100%
20
Logrankp < 0.0001
24.9 Months
12.9Months
Progressionn=42 (30%)
Stable / Partial Responsen=96 (70%)
%Pr
obab
ility
of S
urvi
val
Time from Baseline (Months)0 2 4 6 8 10 12 14 16 18 22 24 26 28 30
0%
10%
20%
30%
40%
50%
60%
70%
80%
90%
100%
20
Logrank p < 0.0001 22.6 Months8.5
Months
>5 CTCsn=35 (25%)
<5 CTCsn=103 (75%)
Centralized review by 2 radiologists, with tie break with athird radiologist in cases of disagreement (11%).
Imaging and CTC both predict survival in patients with measurable disease. However, CTC testingoffers the advantage of providing information earlier than CT scans.
A concordance analysis was done to compare the ability of the methods to accurately predict survival.
Agreement of CTC and Imaging to Predict Survival
1 vs. 2 p=0.18781 vs. 3 p=0.01751 vs. 4 p<0.0001
2 vs. 3 p=0.35862 vs. 4 p=0.0008
3 vs. 4 p=0.0518
%Pr
obab
ility
of S
urvi
val
Time from Baseline (Months)0 2 4 6 8 10 12 14 16 18 22 24 26 28 30
0%
10%
20%
30%
40%
50%
60%
70%
80%
90%
100%
20
1
2 3
4PRO & >5 CTCs
n=22 (16%)
6.4 Months 15.3 Months
19.9 Months
26.9 Months
S / PR & >5 CTCsn=13 ( 9%)
PRO & <5 CTCsn=20 (14%)
S / PR & <5 CTCsn=83 (60%)
1 vs. 2 p=0.18781 vs. 3 p=0.01751 vs. 4 p<0.0001
1 vs. 2 p=0.18781 vs. 3 p=0.01751 vs. 4 p<0.0001
2 vs. 3 p=0.35862 vs. 4 p=0.00082 vs. 3 p=0.35862 vs. 4 p=0.0008
3 vs. 4 p=0.05183 vs. 4 p=0.0518
%Pr
obab
ility
of S
urvi
val
Time from Baseline (Months)0 2 4 6 8 10 12 14 16 18 22 24 26 28 30
0%
10%
20%
30%
40%
50%
60%
70%
80%
90%
100%
20
1
2 3
4PRO & >5 CTCs
n=22 (16%)
6.4 Months 15.3 Months
19.9 Months
26.9 Months
S / PR & >5 CTCsn=13 ( 9%)
PRO & <5 CTCsn=20 (14%)
S / PR & <5 CTCsn=83 (60%)
♦ Group 1 (GREEN) shows agreement between CT scan (stable/partial response) and <5CTCs/7.5 mL
♦ Group 4 (RED) shows agreement between CT scan (progression) and >5 CTCs/7.5 mL♦ Group 2 (BLUE) shows discordance between CT scan (progression) and <5 CTC/7.5 mL. In
these cases, CTC results correctly predicted longer survival. There was no statistical differencebetween group 1 and group 2 (p=0.1878).
♦ Group 3 (ORANGE) shows discordance between CT scan (stable/partial response) and>5CTC
6
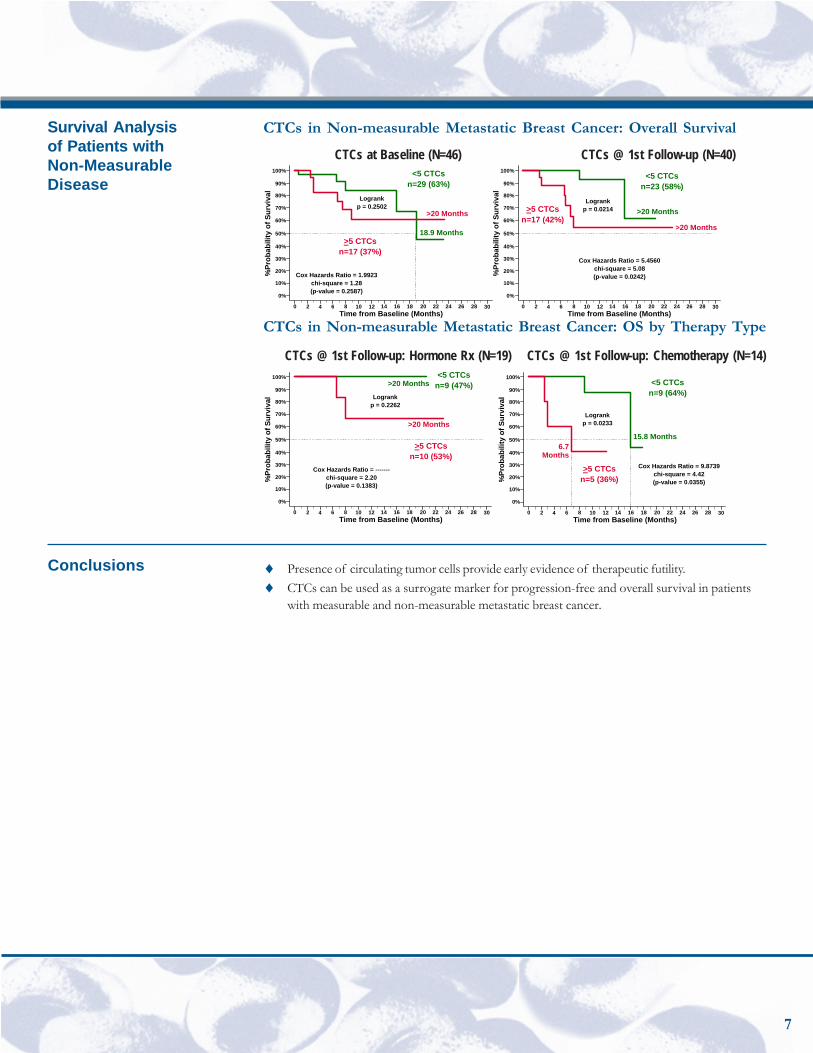
CTCs in Non-measurable Metastatic Breast Cancer: Overall Survival
CTCs at Baseline (N=46) CTCs @ 1st Follow-up (N=40)
%Pr
obab
ility
of S
urvi
val
Time from Baseline (Months)0 2 4 6 8 10 12 14 16 18 22 24 26 28 30
0%
10%
20%
30%
40%
50%
60%
70%
80%
90%
100%
20
Logrankp = 0.2502
Cox Hazards Ratio = 1.9923chi-square = 1.28(p-value = 0.2587)
18.9 Months
>20 Months
>5 CTCsn=17 (37%)
<5 CTCsn=29 (63%)
%Pr
obab
ility
of S
urvi
val
Time from Baseline (Months)0 2 4 6 8 10 12 14 16 18 22 24 26 28 30
0%
10%
20%
30%
40%
50%
60%
70%
80%
90%
100%
20
Logrankp = 0.0214
Cox Hazards Ratio = 5.4560chi-square = 5.08(p-value = 0.0242)
>20 Months
>20 Months
>5 CTCsn=17 (42%)
<5 CTCsn=23 (58%)
CTCs in Non-measurable Metastatic Breast Cancer: OS by Therapy Type
CTCs @ 1st Follow-up: Hormone Rx (N=19) CTCs @ 1st Follow-up: Chemotherapy (N=14)
%Pr
obab
ility
of S
urvi
val
Time from Baseline (Months)0 2 4 6 8 10 12 14 16 18 22 24 26 28 30
0%
10%
20%
30%
40%
50%
60%
70%
80%
90%
100%
20
Logrankp = 0.0233
Cox Hazards Ratio = 9.8739chi-square = 4.42(p-value = 0.0355)
15.8 Months6.7
Months
>5 CTCsn=5 (36%)
<5 CTCsn=9 (64%)
%Pr
obab
ility
of S
urvi
val
Time from Baseline (Months)0 2 4 6 8 10 12 14 16 18 22 24 26 28 30
0%
10%
20%
30%
40%
50%
60%
70%
80%
90%
100%
20
Logrankp = 0.2262
Cox Hazards Ratio = -------chi-square = 2.20(p-value = 0.1383)
>20 Months
>20 Months
>5 CTCsn=10 (53%)
<5 CTCsn=9 (47%)
♦ Presence of circulating tumor cells provide early evidence of therapeutic futility.♦ CTCs can be used as a surrogate marker for progression-free and overall survival in patients
with measurable and non-measurable metastatic breast cancer.
Survival Analysisof Patients withNon-MeasurableDisease
7
Conclusions
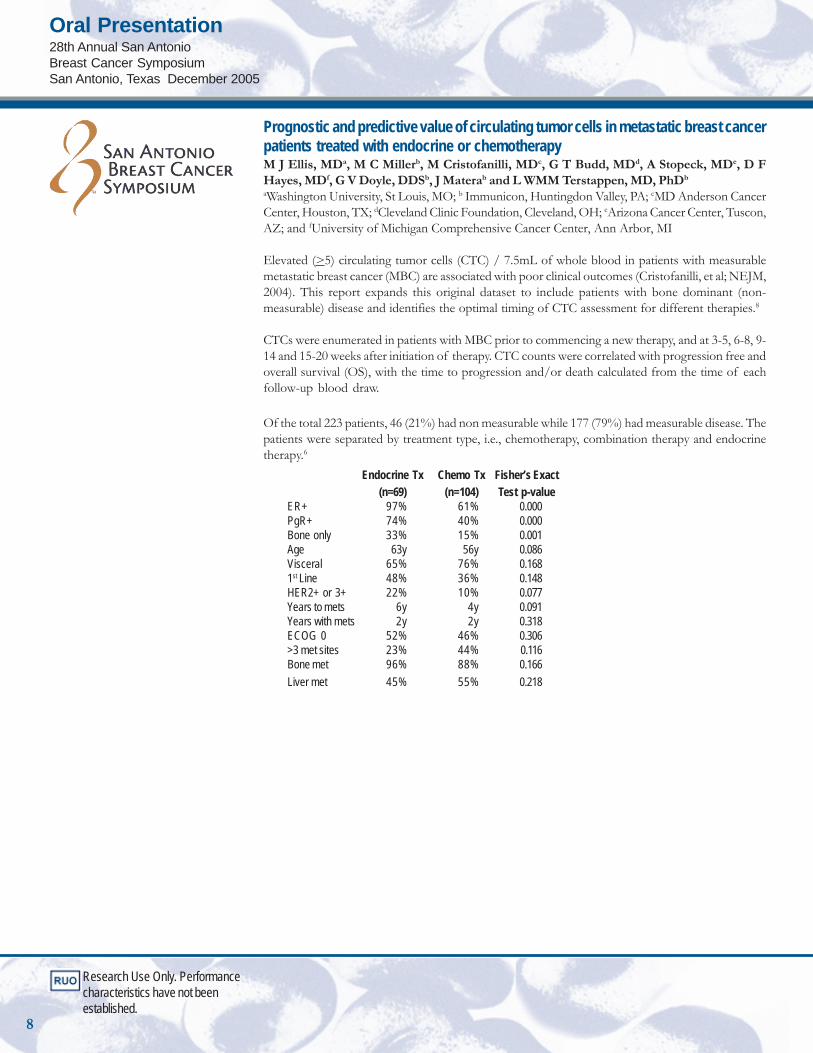
Prognostic and predictive value of circulating tumor cells in metastatic breast cancerpatients treated with endocrine or chemotherapyM J Ellis, MDa, M C Millerb, M Cristofanilli, MDc, G T Budd, MDd, A Stopeck, MDe, D FHayes, MDf, G V Doyle, DDSb, J Materab and L WMM Terstappen, MD, PhDb
aWashington University, St Louis, MO; b Immunicon, Huntingdon Valley, PA; cMD Anderson CancerCenter, Houston, TX; dCleveland Clinic Foundation, Cleveland, OH; eArizona Cancer Center, Tuscon,AZ; and fUniversity of Michigan Comprehensive Cancer Center, Ann Arbor, MI
Elevated (>5) circulating tumor cells (CTC) / 7.5mL of whole blood in patients with measurablemetastatic breast cancer (MBC) are associated with poor clinical outcomes (Cristofanilli, et al; NEJM,2004). This report expands this original dataset to include patients with bone dominant (non-measurable) disease and identifies the optimal timing of CTC assessment for different therapies.8
CTCs were enumerated in patients with MBC prior to commencing a new therapy, and at 3-5, 6-8, 9-14 and 15-20 weeks after initiation of therapy. CTC counts were correlated with progression free andoverall survival (OS), with the time to progression and/or death calculated from the time of eachfollow-up blood draw.
Of the total 223 patients, 46 (21%) had non measurable while 177 (79%) had measurable disease. Thepatients were separated by treatment type, i.e., chemotherapy, combination therapy and endocrinetherapy.6
Endocrine Tx Chemo Tx Fisher’s Exact(n=69) (n=104) Test p-value
ER+ 97% 61% 0.000PgR+ 74% 40% 0.000Bone only 33% 15% 0.001Age 63y 56y 0.086Visceral 65% 76% 0.1681st Line 48% 36% 0.148HER2+ or 3+ 22% 10% 0.077Years to mets 6y 4y 0.091Years with mets 2y 2y 0.318ECOG 0 52% 46% 0.306>3 met sites 23% 44% 0.116Bone met 96% 88% 0.166Liver met 45% 55% 0.218
Research Use Only. Performancecharacteristics have not beenestablished.
Oral Presentation28th Annual San AntonioBreast Cancer SymposiumSan Antonio, Texas December 2005
8
Research Use Only. Performancecharacteristics have not beenestablished.
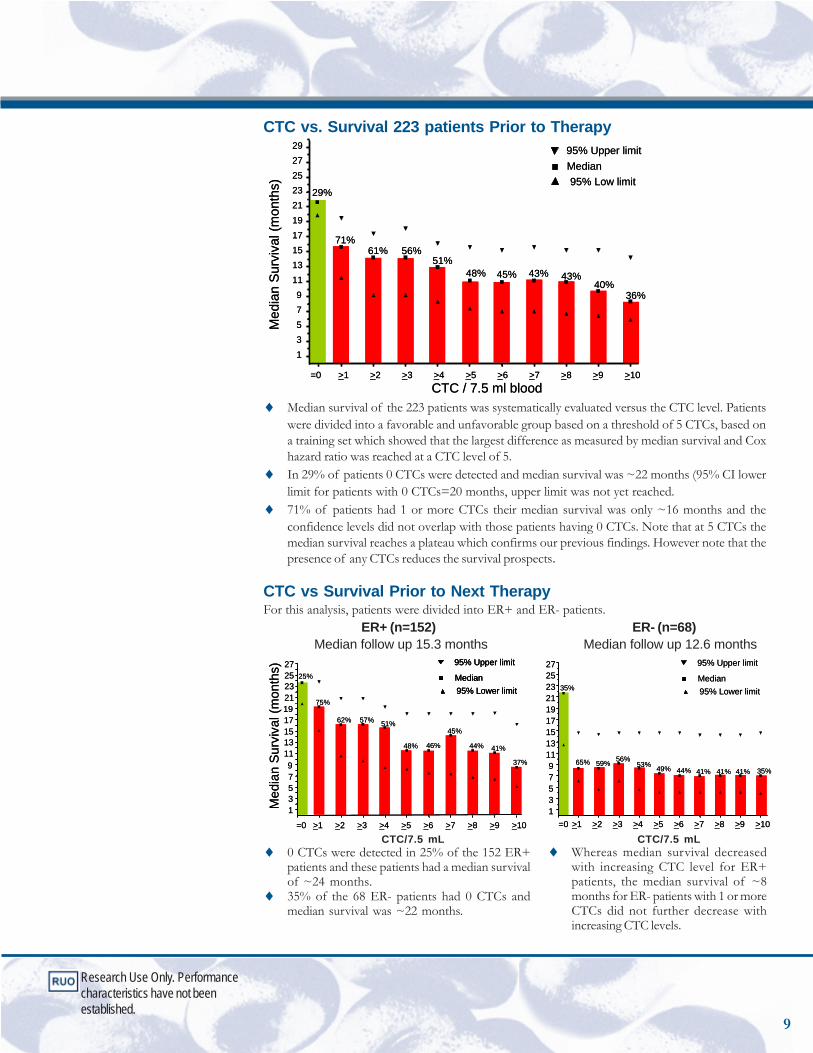
CTC vs. Survival 223 patients Prior to Therapy
Med
ian
Sur
viva
l (m
onth
s)
CTC / 7.5 ml blood
Median95% Low limit
95% Upper limit
13579
11131517192123252729
29%
71%61% 56%
51%48% 45% 43% 43%
40%36%
=0 >1 >2 >3 >5 >7 >8 >9>6>4 >10
Med
ian
Sur
viva
l (m
onth
s)
CTC / 7.5 ml blood
Median95% Low limit
95% Upper limit
13579
11131517192123252729
29%
71%61% 56%
51%48% 45% 43% 43%
40%36%
=0 >1 >2 >3 >5 >7 >8 >9>6>4 >10
♦ Median survival of the 223 patients was systematically evaluated versus the CTC level. Patientswere divided into a favorable and unfavorable group based on a threshold of 5 CTCs, based ona training set which showed that the largest difference as measured by median survival and Coxhazard ratio was reached at a CTC level of 5.
♦ In 29% of patients 0 CTCs were detected and median survival was ~22 months (95% CI lowerlimit for patients with 0 CTCs=20 months, upper limit was not yet reached.
♦ 71% of patients had 1 or more CTCs their median survival was only ~16 months and theconfidence levels did not overlap with those patients having 0 CTCs. Note that at 5 CTCs themedian survival reaches a plateau which confirms our previous findings. However note that thepresence of any CTCs reduces the survival prospects.
CTC vs Survival Prior to Next TherapyFor this analysis, patients were divided into ER+ and ER- patients.
ER+ (n=152) ER- (n=68)Median follow up 15.3 months Median follow up 12.6 months
>101
19
2321
25
Med
ian
Sur
viva
l (m
onth
s)
Median95% Lower limit
95% Upper limit
Median95% Lower limit
95% Upper limit
=0 >1 >2 >3 >5 >7 >8 >9>6>4 >10
25%
75%
62% 57% 51%
48% 46%
45%
44% 41%
37%
7
3
9
5
17
1311
15
27
13579
111315171921232527
35%
65% 59% 56%53% 49% 44% 41% 41% 41% 35%
=0 >1 >2 >3 >5 >7 >8 >9>6>4 >101
19
2321
25
Med
ian
Sur
viva
l (m
onth
s)
Median95% Lower limit
95% Upper limit
Median95% Lower limit
95% Upper limit
Median95% Lower limit
95% Upper limit
=0 >1 >2 >3 >5 >7 >8 >9>6>4 >10
25%
75%
62% 57% 51%
48% 46%
45%
44% 41%
37%
7
3
9
5
17
1311
15
27
13579
111315171921232527
35%
65% 59% 56%53% 49% 44% 41% 41% 41% 35%
=0 >1 >2 >3 >5 >7 >8 >9>6>4
CTC/7.5 mL CTC/7.5 mL♦ 0 CTCs were detected in 25% of the 152 ER+
patients and these patients had a median survivalof ~24 months.
♦ 35% of the 68 ER- patients had 0 CTCs andmedian survival was ~22 months.
♦ Whereas median survival decreasedwith increasing CTC level for ER+patients, the median survival of ~8months for ER- patients with 1 or moreCTCs did not further decrease withincreasing CTC levels.
9
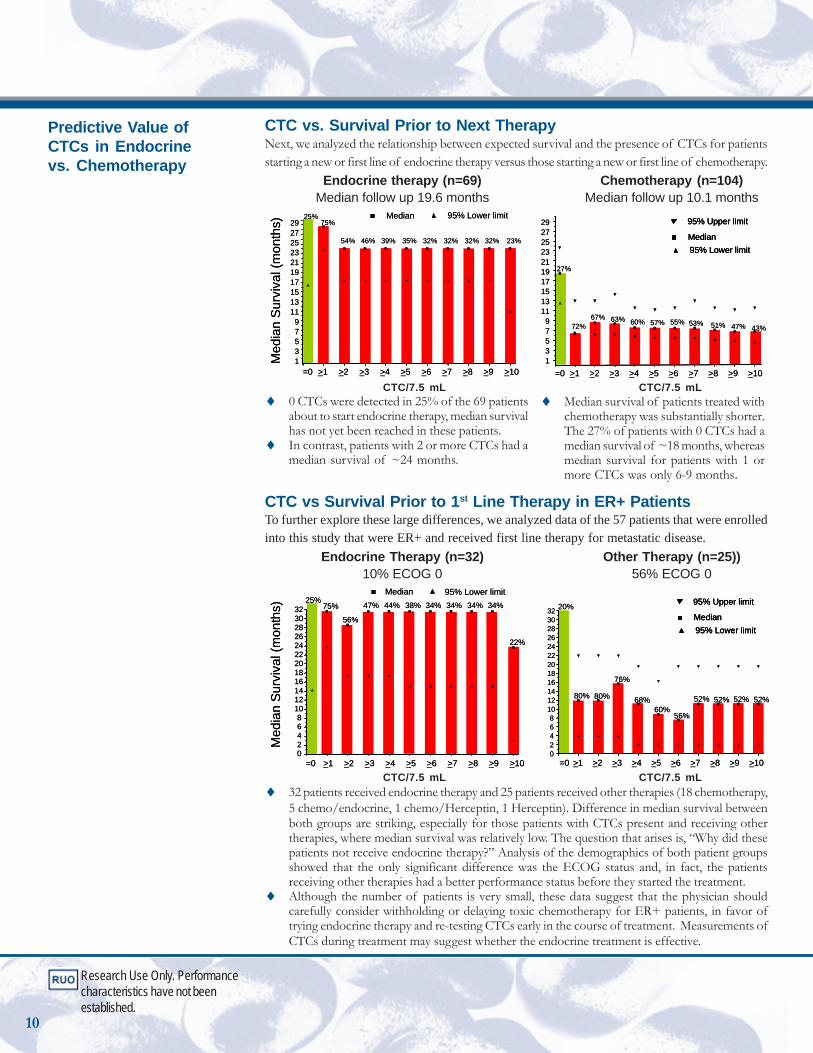
CTC vs. Survival Prior to Next TherapyNext, we analyzed the relationship between expected survival and the presence of CTCs for patientsstarting a new or first line of endocrine therapy versus those starting a new or first line of chemotherapy.
Endocrine therapy (n=69) Chemotherapy (n=104)Median follow up 19.6 months Median follow up 10.1 months
2325
1719
1311
>10>10
7
3
9
1
5
17
13
19
11
15
27
2321
25
29
Med
ian
Sur
viva
l (m
onth
s)
Median95% Lower limit
95% Upper limit Median 95% Lower limit 25%75%
54% 46% 39% 35% 32% 32% 32% 32% 23%
=0 >1 >2 >3 >5 >7 >8 >9>6>4
27%
72%67% 63% 60% 57% 55% 53% 51% 47% 43%
=0 >1 >2 >3 >5 >7 >8 >9>6>4
7
3
9
1
5
15
27
21
29
2325
1719
1311
>10>10
7
3
9
1
5
17
13
19
11
15
27
2321
25
29
Med
ian
Sur
viva
l (m
onth
s)
Median95% Lower limit
95% Upper limit
Median95% Lower limit
95% Upper limit Median 95% Lower limit 25%75%
54% 46% 39% 35% 32% 32% 32% 32% 23%
=0 >1 >2 >3 >5 >7 >8 >9>6>4
27%
72%67% 63% 60% 57% 55% 53% 51% 47% 43%
=0 >1 >2 >3 >5 >7 >8 >9>6>4
7
3
9
1
5
15
27
21
29
CTC/7.5 mL CTC/7.5 mL♦ 0 CTCs were detected in 25% of the 69 patients
about to start endocrine therapy, median survivalhas not yet been reached in these patients.
♦ In contrast, patients with 2 or more CTCs had amedian survival of ~24 months.
CTC vs Survival Prior to 1st Line Therapy in ER+ PatientsTo further explore these large differences, we analyzed data of the 57 patients that were enrolledinto this study that were ER+ and received first line therapy for metastatic disease.
Endocrine Therapy (n=32) Other Therapy (n=25))10% ECOG 0 56% ECOG 0
>10
Med
ian
Sur
viva
l (m
onth
s)
Median95% Lower limit
95% Upper limit Median 95% Lower limit
02468
101214161820222426283032
25%75%
56%
47% 44% 38% 34% 34% 34% 34%
22%
=0 >1 >2 >3 >5 >7 >8 >9>6>4 =0 >1 >2 >3 >5 >7 >8 >9>6>4 >1002468
101214161820222426283032 20%
80% 80%
76%
68%60%
56%
52% 52% 52% 52%
>10
Med
ian
Sur
viva
l (m
onth
s)
Median95% Lower limit
95% Upper limit
Median95% Lower limit
95% Upper limit Median 95% Lower limit
02468
101214161820222426283032
25%75%
56%
47% 44% 38% 34% 34% 34% 34%
22%
=0 >1 >2 >3 >5 >7 >8 >9>6>4 =0 >1 >2 >3 >5 >7 >8 >9>6>4 >1002468
101214161820222426283032 20%
80% 80%
76%
68%60%
56%
52% 52% 52% 52%
CTC/7.5 mL CTC/7.5 mL♦ 32 patients received endocrine therapy and 25 patients received other therapies (18 chemotherapy,
5 chemo/endocrine, 1 chemo/Herceptin, 1 Herceptin). Difference in median survival betweenboth groups are striking, especially for those patients with CTCs present and receiving othertherapies, where median survival was relatively low. The question that arises is, “Why did thesepatients not receive endocrine therapy?” Analysis of the demographics of both patient groupsshowed that the only significant difference was the ECOG status and, in fact, the patientsreceiving other therapies had a better performance status before they started the treatment.
♦ Although the number of patients is very small, these data suggest that the physician shouldcarefully consider withholding or delaying toxic chemotherapy for ER+ patients, in favor oftrying endocrine therapy and re-testing CTCs early in the course of treatment. Measurements ofCTCs during treatment may suggest whether the endocrine treatment is effective.
Research Use Only. Performancecharacteristics have not beenestablished.
♦ Median survival of patients treated withchemotherapy was substantially shorter.The 27% of patients with 0 CTCs had amedian survival of ~18 months, whereasmedian survival for patients with 1 ormore CTCs was only 6-9 months.
10
Predictive Value ofCTCs in Endocrinevs. Chemotherapy
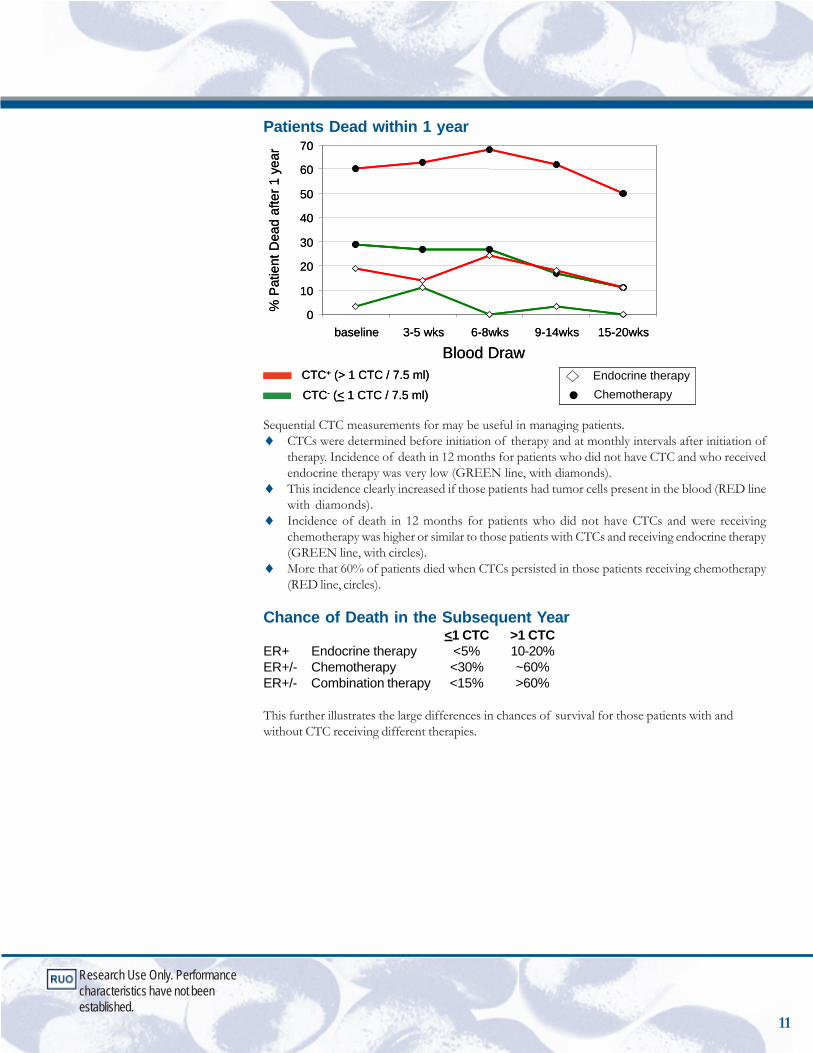
Patients Dead within 1 year
% P
atie
nt D
ead
afte
r 1 y
ear
Blood Draw
0
10
20
30
40
50
60
70
baseline 3-5 wks 6-8wks 9-14wks 15-20wks
% P
atie
nt D
ead
afte
r 1 y
ear
Blood Draw
0
10
20
30
40
50
60
70
baseline 3-5 wks 6-8wks 9-14wks 15-20wks
CTC+ (> 1 CTC / 7.5 ml)
CTC- (< 1 CTC / 7.5 ml)Endocrine therapyChemotherapy
CTC+ (> 1 CTC / 7.5 ml)
CTC- (< 1 CTC / 7.5 ml)Endocrine therapyChemotherapy
Sequential CTC measurements for may be useful in managing patients.♦ CTCs were determined before initiation of therapy and at monthly intervals after initiation of
therapy. Incidence of death in 12 months for patients who did not have CTC and who receivedendocrine therapy was very low (GREEN line, with diamonds).
♦ This incidence clearly increased if those patients had tumor cells present in the blood (RED linewith diamonds).
♦ Incidence of death in 12 months for patients who did not have CTCs and were receivingchemotherapy was higher or similar to those patients with CTCs and receiving endocrine therapy(GREEN line, with circles).
♦ More that 60% of patients died when CTCs persisted in those patients receiving chemotherapy(RED line, circles).
Chance of Death in the Subsequent Year<1 CTC >1 CTC
ER+ Endocrine therapy <5% 10-20%ER+/- Chemotherapy <30% ~60%ER+/- Combination therapy <15% >60%
This further illustrates the large differences in chances of survival for those patients with andwithout CTC receiving different therapies.
Research Use Only. Performancecharacteristics have not beenestablished.
11
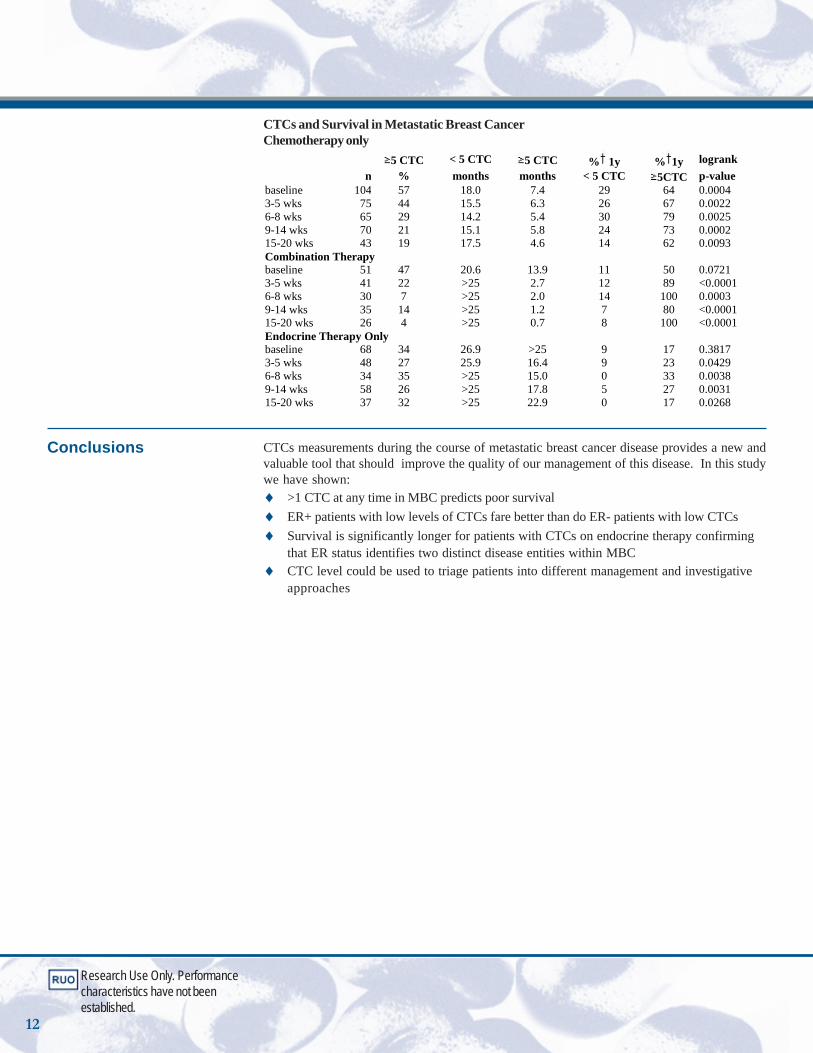
Conclusions
CTCs and Survival in Metastatic Breast CancerChemotherapy only 5 CTC < 5 CTC 5 CTC % 1y % 1y logrank n % months months < 5 CTC 5CTC p-value baseline 104 57 18.0 7.4 29 64 0.0004 3-5 wks 75 44 15.5 6.3 26 67 0.0022 6-8 wks 65 29 14.2 5.4 30 79 0.0025 9-14 wks 70 21 15.1 5.8 24 73 0.0002 15-20 wks 43 19 17.5 4.6 14 62 0.0093 Combination Therapy baseline 51 47 20.6 13.9 11 50 0.0721 3-5 wks 41 22 >25 2.7 12 89 <0.0001 6-8 wks 30 7 >25 2.0 14 100 0.0003 9-14 wks 35 14 >25 1.2 7 80 <0.0001 15-20 wks 26 4 >25 0.7 8 100 <0.0001 Endocrine Therapy Only baseline 68 34 26.9 >25 9 17 0.3817 3-5 wks 48 27 25.9 16.4 9 23 0.0429 6-8 wks 34 35 >25 15.0 0 33 0.0038 9-14 wks 58 26 >25 17.8 5 27 0.0031 15-20 wks 37 32 >25 22.9 0 17 0.0268
CTCs measurements during the course of metastatic breast cancer disease provides a new andvaluable tool that should improve the quality of our management of this disease. In this studywe have shown:♦ >1 CTC at any time in MBC predicts poor survival♦ ER+ patients with low levels of CTCs fare better than do ER- patients with low CTCs♦ Survival is significantly longer for patients with CTCs on endocrine therapy confirming
that ER status identifies two distinct disease entities within MBC♦ CTC level could be used to triage patients into different management and investigative
approaches
Research Use Only. Performancecharacteristics have not beenestablished.
12

13
Survival AnalysisUsing CTC vs.Serum TumorMarker, MUC-1
Research Use Only. Performancecharacteristics have not beenestablished.
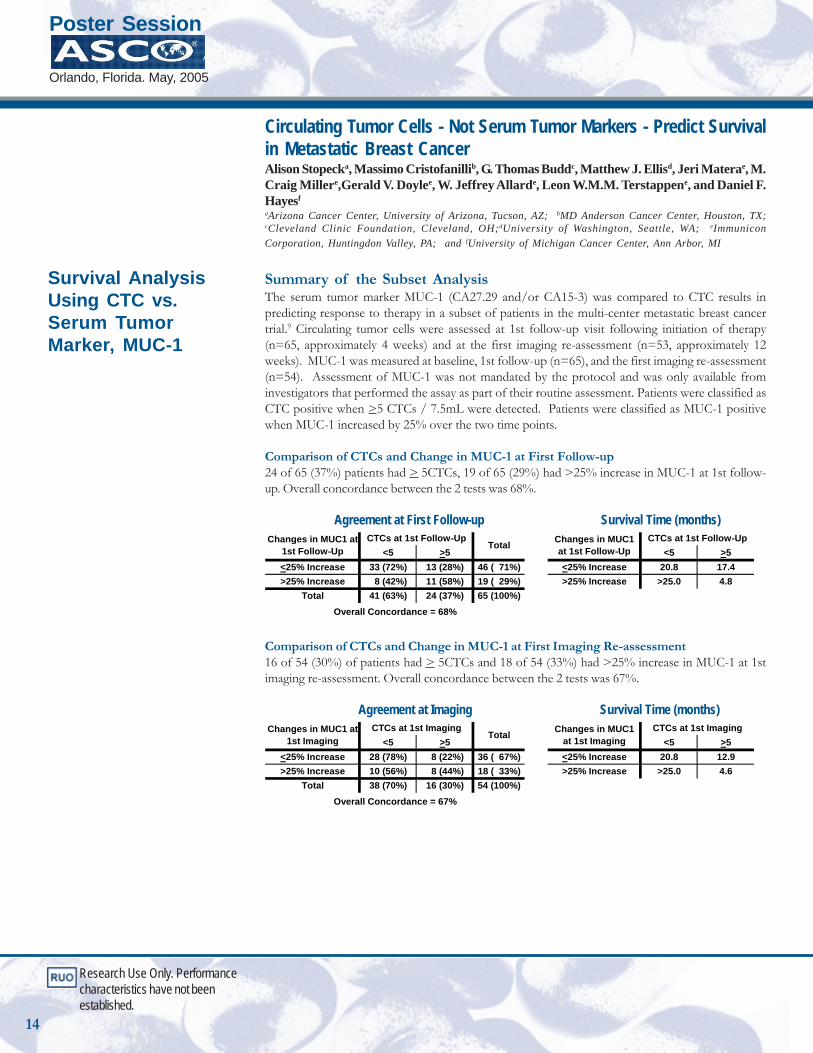
Circulating Tumor Cells - Not Serum Tumor Markers - Predict Survivalin Metastatic Breast CancerAlison Stopecka, Massimo Cristofanillib, G. Thomas Buddc, Matthew J. Ellisd, Jeri Materae, M.Craig Millere,Gerald V. Doylee, W. Jeffrey Allarde, Leon W.M.M. Terstappene, and Daniel F.Hayesf
aArizona Cancer Center, University of Arizona, Tucson, AZ; bMD Anderson Cancer Center, Houston, TX;cCleveland Clinic Foundation, Cleveland, OH;dUniversity of Washington, Seattle, WA; eImmuniconCorporation, Huntingdon Valley, PA; and fUniversity of Michigan Cancer Center, Ann Arbor, MI
Summary of the Subset AnalysisThe serum tumor marker MUC-1 (CA27.29 and/or CA15-3) was compared to CTC results inpredicting response to therapy in a subset of patients in the multi-center metastatic breast cancertrial.9 Circulating tumor cells were assessed at 1st follow-up visit following initiation of therapy(n=65, approximately 4 weeks) and at the first imaging re-assessment (n=53, approximately 12weeks). MUC-1 was measured at baseline, 1st follow-up (n=65), and the first imaging re-assessment(n=54). Assessment of MUC-1 was not mandated by the protocol and was only available frominvestigators that performed the assay as part of their routine assessment. Patients were classified asCTC positive when >5 CTCs / 7.5mL were detected. Patients were classified as MUC-1 positivewhen MUC-1 increased by 25% over the two time points.
Comparison of CTCs and Change in MUC-1 at First Follow-up24 of 65 (37%) patients had > 5CTCs, 19 of 65 (29%) had >25% increase in MUC-1 at 1st follow-up. Overall concordance between the 2 tests was 68%.
Agreement at First Follow-up Survival Time (months)
<5 >5 <5 >5<25% Increase 33 (72%) 13 (28%) 46 ( 71%) <25% Increase 20.8 17.4>25% Increase 8 (42%) 11 (58%) 19 ( 29%) >25% Increase >25.0 4.8
Total 41 (63%) 24 (37%) 65 (100%)
Changes in MUC1 at 1st Follow-Up
CTCs at 1st Follow-UpTotal
Overall Concordance = 68%
Changes in MUC1 at 1st Follow-Up
CTCs at 1st Follow-Up
Comparison of CTCs and Change in MUC-1 at First Imaging Re-assessment16 of 54 (30%) of patients had > 5CTCs and 18 of 54 (33%) had >25% increase in MUC-1 at 1stimaging re-assessment. Overall concordance between the 2 tests was 67%.
Agreement at Imaging Survival Time (months)
<5 >5 <5 >5<25% Increase 28 (78%) 8 (22%) 36 ( 67%) <25% Increase 20.8 12.9>25% Increase 10 (56%) 8 (44%) 18 ( 33%) >25% Increase >25.0 4.6
Total 38 (70%) 16 (30%) 54 (100%)
Changes in MUC1 at 1st Imaging
CTCs at 1st ImagingTotal
Overall Concordance = 67%
Changes in MUC1 at 1st Imaging
CTCs at 1st Imaging
Poster Session
Orlando, Florida. May, 2005
14
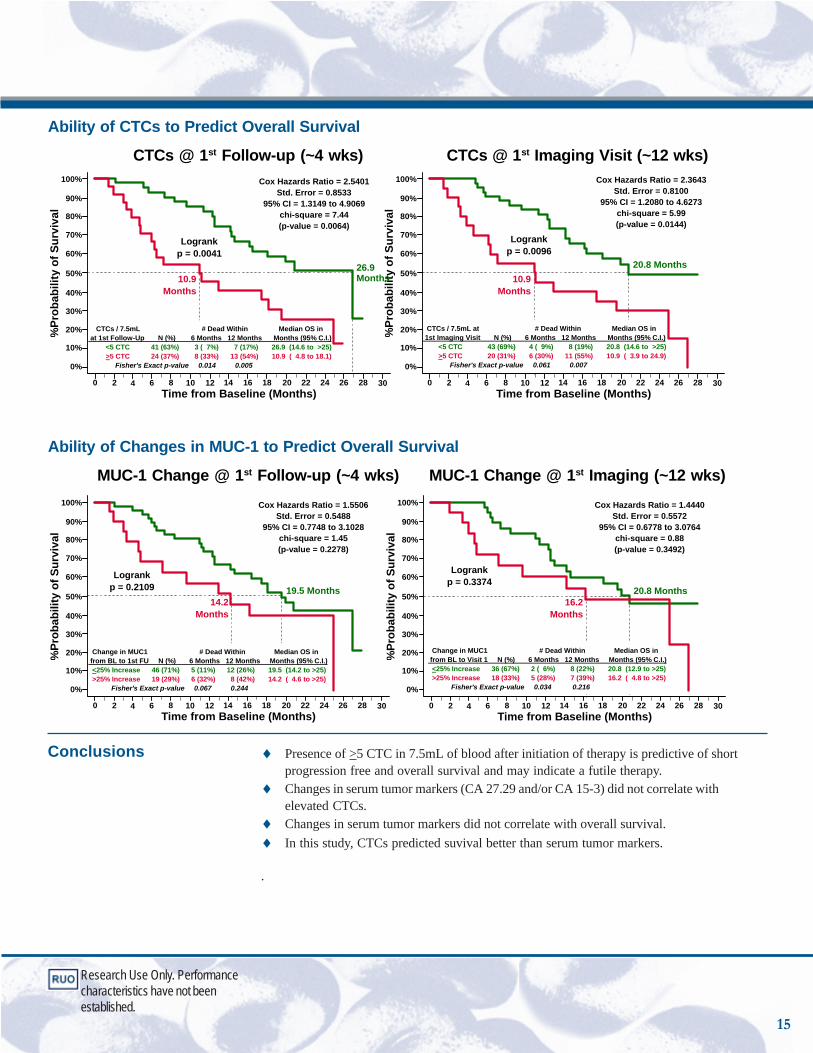
Ability of CTCs to Predict Overall Survival
CTCs @ 1st Follow-up (~4 wks) CTCs @ 1st Imaging Visit (~12 wks)
%Pr
obab
ility
of S
urvi
val
Time from Baseline (Months)0 2 4 6 8 10 12 14 16 18 22 24 26 28 30
0%
10%
20%
30%
40%
50%
60%
70%
80%
90%
100%
20
Logrankp = 0.0096
20.8 Months10.9
Months
Cox Hazards Ratio = 2.3643Std. Error = 0.8100
95% CI = 1.2080 to 4.6273chi-square = 5.99(p-value = 0.0144)
CTCs / 7.5mL at # Dead Within Median OS in 1st Imaging Visit N (%) 6 Months 12 Months Months (95% C.I.) <5 CTC 43 (69%) 4 ( 9%) 8 (19%) 20.8 (14.6 to >25) >5 CTC 20 (31%) 6 (30%) 11 (55%) 10.9 ( 3.9 to 24.9) Fisher's Exact p-value 0.061 0.007
%Pr
obab
ility
of S
urvi
val
Time from Baseline (Months)0 2 4 6 8 10 12 14 16 18 22 24 26 28 30
0%
10%
20%
30%
40%
50%
60%
70%
80%
90%
100%
20
Logrankp = 0.0041
26.9 Months10.9
Months
CTCs / 7.5mL # Dead Within Median OS in at 1st Follow-Up N (%) 6 Months 12 Months Months (95% C.I.) <5 CTC 41 (63%) 3 ( 7%) 7 (17%) 26.9 (14.6 to >25) >5 CTC 24 (37%) 8 (33%) 13 (54%) 10.9 ( 4.8 to 18.1) Fisher's Exact p-value 0.014 0.005
Cox Hazards Ratio = 2.5401Std. Error = 0.8533
95% CI = 1.3149 to 4.9069chi-square = 7.44(p-value = 0.0064)
Ability of Changes in MUC-1 to Predict Overall Survival
MUC-1 Change @ 1st Follow-up (~4 wks) MUC-1 Change @ 1st Imaging (~12 wks)
%Pr
obab
ility
of S
urvi
val
Time from Baseline (Months)0 2 4 6 8 10 12 14 16 18 22 24 26 28 30
0%
10%
20%
30%
40%
50%
60%
70%
80%
90%
100%
20
Logrankp = 0.3374
20.8 Months16.2
Months
Change in MUC1 # Dead Within Median OS in from BL to Visit 1 N (%) 6 Months 12 Months Months (95% C.I.) <25% Increase 36 (67%) 2 ( 6%) 8 (22%) 20.8 (12.9 to >25) >25% Increase 18 (33%) 5 (28%) 7 (39%) 16.2 ( 4.8 to >25) Fisher's Exact p-value 0.034 0.216
Cox Hazards Ratio = 1.4440Std. Error = 0.5572
95% CI = 0.6778 to 3.0764chi-square = 0.88(p-value = 0.3492)
%Pr
obab
ility
of S
urvi
val
Time from Baseline (Months)0 2 4 6 8 10 12 14 16 18 22 24 26 28 30
0%
10%
20%
30%
40%
50%
60%
70%
80%
90%
100%
20
Logrankp = 0.2109 19.5 Months
14.2Months
Change in MUC1 # Dead Within Median OS in from BL to 1st FU N (%) 6 Months 12 Months Months (95% C.I.) <25% Increase 46 (71%) 5 (11%) 12 (26%) 19.5 (14.2 to >25) >25% Increase 19 (29%) 6 (32%) 8 (42%) 14.2 ( 4.6 to >25) Fisher's Exact p-value 0.067 0.244
Cox Hazards Ratio = 1.5506Std. Error = 0.5488
95% CI = 0.7748 to 3.1028chi-square = 1.45(p-value = 0.2278)
Conclusions ♦ Presence of >5 CTC in 7.5mL of blood after initiation of therapy is predictive of shortprogression free and overall survival and may indicate a futile therapy.
♦ Changes in serum tumor markers (CA 27.29 and/or CA 15-3) did not correlate withelevated CTCs.
♦ Changes in serum tumor markers did not correlate with overall survival.♦ In this study, CTCs predicted suvival better than serum tumor markers.
.
Research Use Only. Performancecharacteristics have not beenestablished.
15
Monitoring Target Modulation on Circulating Tumor CellsGerald Doylea, Madeline Repoleta, David Chianesea, Renouard Sandersa, Chandra Raoa, JeffSmerageb and Leon WMM Terstappena
a Immunicon Corporation, Huntingdon Valley, PA. b University of Michigan
Advances in tumor biology have allowed the development of drugs directed against specific cellulartargets, which has introduced complexities in the standard route of drug development. The traditional3-phase drug development model generally assumes that the maximum tolerated dose is mostefficacious and that reduction in tumor size is a sufficient indicator of activity. However, theseassumptions may not apply to new target-directed agents since target modulation may occur at lowerdoses and may be cytostatic rather than cytotoxic. Thus, tumor size may not change substantiallywith treatment, thereby raising challenges to identification of drug activity. Traditional tumor markers,such as CA15-3 and CEA, are not always elevated, and fluctuations represent changes in tumorburden rather than specific target modulation. Thus, secondary end-points other than tumor sizeand tumor burden are needed for evaluation of response in early phase trials.
In this regard, monitoring of CTCs for evidence of biological effect, such as modulation of theintended molecular target or downstream signaling pathways10,11,12, or monitoring for evidence ofearly cell death13, might provide surrogate evidence of drug activity. To that end, the CellSearchTM
System has already shown that CTCs can be isolated from the blood of patients with a variety ofcarcinomas and that the presence of 5 or more CTCs in 7.5 mL of blood predicts response to therapyand survival independent of type of therapy.
The objective of this study was to determine if specific drug related molecular targets could bedetected on CTCs and if their level of expression could be semi-quantitatively analyzed. In addition,an epithelial cell specific apoptosis marker was used to determine if CTCs undergo apoptosis. Fivemolecular targets associated with known therapies were selected i.e., Insulin-like Growth Factor 1Receptor (IGF-1-r) / anti-sense therapies, Epidermal Growth Factor Receptor (EGFR) / bevacizumab,Her2/neu / trastazumab, MUC-1 / immunotherapies, Bcl-2 / oblimersen. Multiple monoclonalantibodies specific for each antigen were compared using a model system employing cultured cancercell lines that expressed the specific antigen over a range of values. After optimum stainingconcentrations were determined the reagents were tested on CTCs from patients with a variety ofcarcinomas.
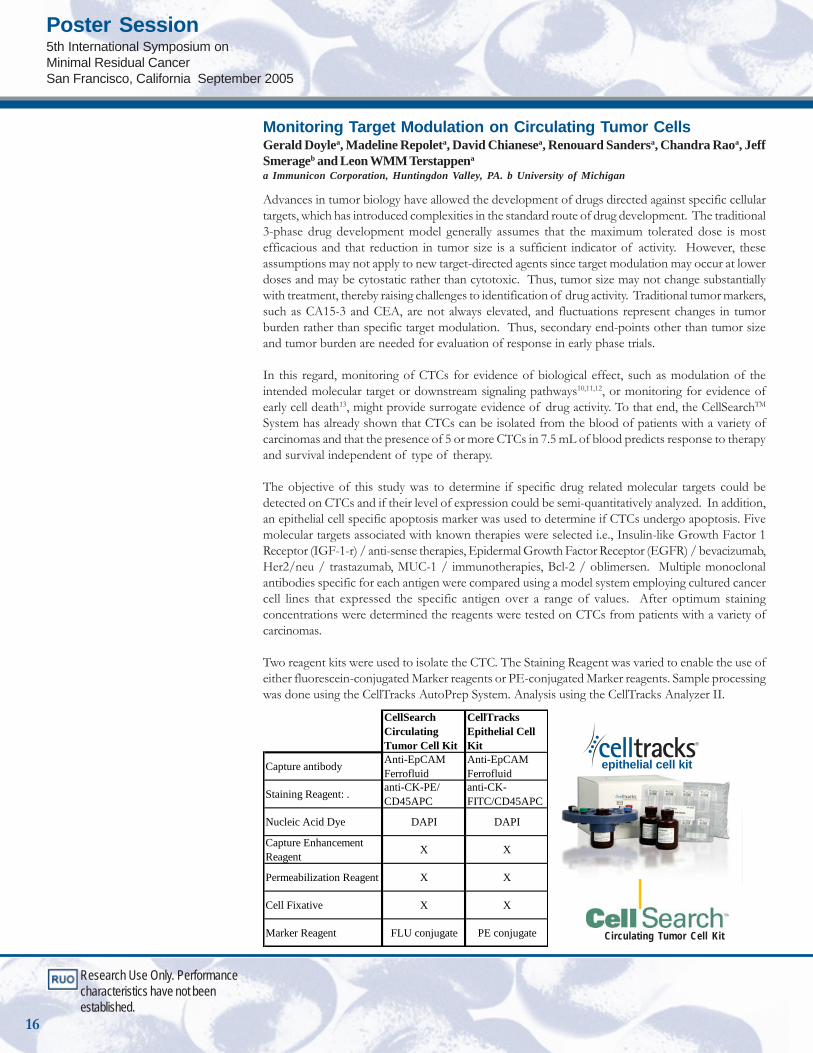
Two reagent kits were used to isolate the CTC. The Staining Reagent was varied to enable the use ofeither fluorescein-conjugated Marker reagents or PE-conjugated Marker reagents. Sample processingwas done using the CellTracks AutoPrep System. Analysis using the CellTracks Analyzer II.
CellSearch Circulating Tumor Cell Kit
CellTracks Epithelial Cell Kit
Capture antibody Anti-EpCAM Ferrofluid
Anti-EpCAM Ferrofluid
Staining Reagent: . anti-CK-PE/ CD45APC
anti-CK-FITC/CD45APC
Nucleic Acid Dye DAPI DAPI
Capture Enhancement Reagent X X
Permeabilization Reagent X X
Cell Fixative X X
Marker Reagent FLU conjugate PE conjugate Circulating Tumor Cell Kit
epithelial cell kit
Research Use Only. Performancecharacteristics have not beenestablished.
Poster Session5th International Symposium onMinimal Residual CancerSan Francisco, California September 2005
16
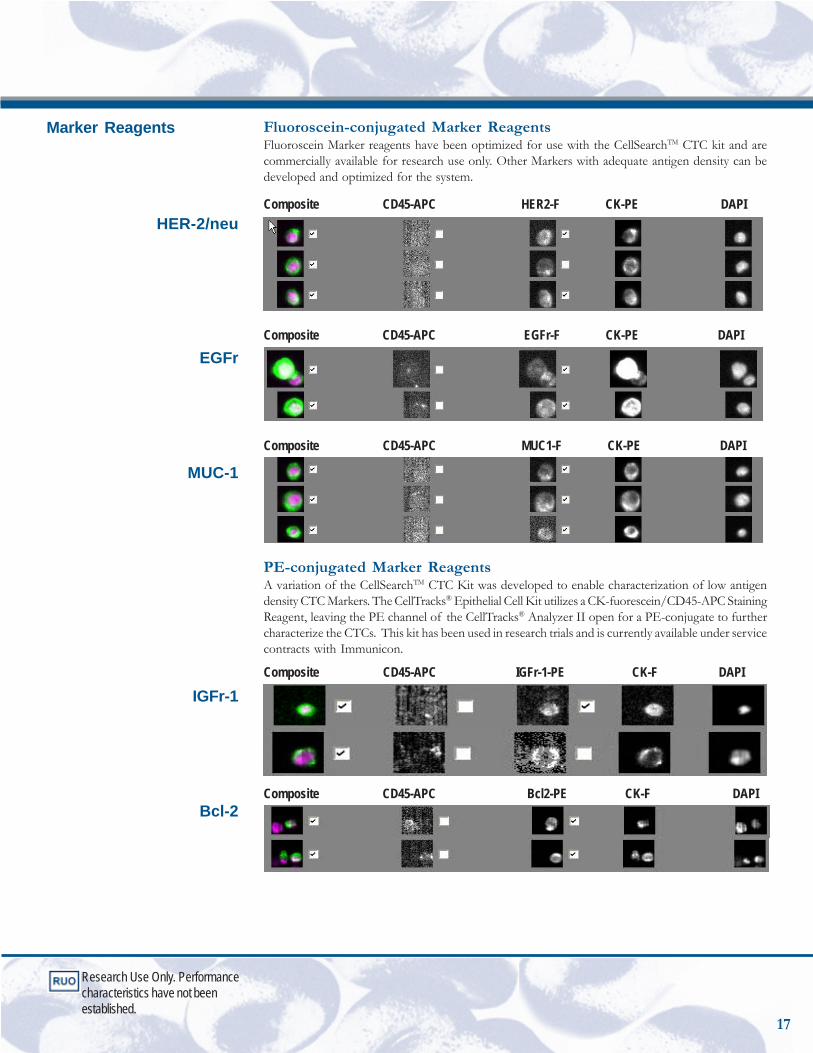
Fluoroscein-conjugated Marker ReagentsFluoroscein Marker reagents have been optimized for use with the CellSearchTM CTC kit and arecommercially available for research use only. Other Markers with adequate antigen density can bedeveloped and optimized for the system.
Composite CD45-APC HER2-F CK-PE DAPI
Composite CD45-APC EGFr-F CK-PE DAPI
Composite CD45-APC MUC1-F CK-PE DAPI
PE-conjugated Marker ReagentsA variation of the CellSearchTM CTC Kit was developed to enable characterization of low antigendensity CTC Markers. The CellTracks® Epithelial Cell Kit utilizes a CK-fuorescein/CD45-APC StainingReagent, leaving the PE channel of the CellTracks® Analyzer II open for a PE-conjugate to furthercharacterize the CTCs. This kit has been used in research trials and is currently available under servicecontracts with Immunicon.
Composite CD45-APC IGFr-1-PE CK-F DAPI
Composite CD45-APC Bcl2-PE CK-F DAPI
Marker Reagents
HER-2/neu
EGFr
MUC-1
IGFr-1
Bcl-2
Research Use Only. Performancecharacteristics have not beenestablished.
17
Conclusions
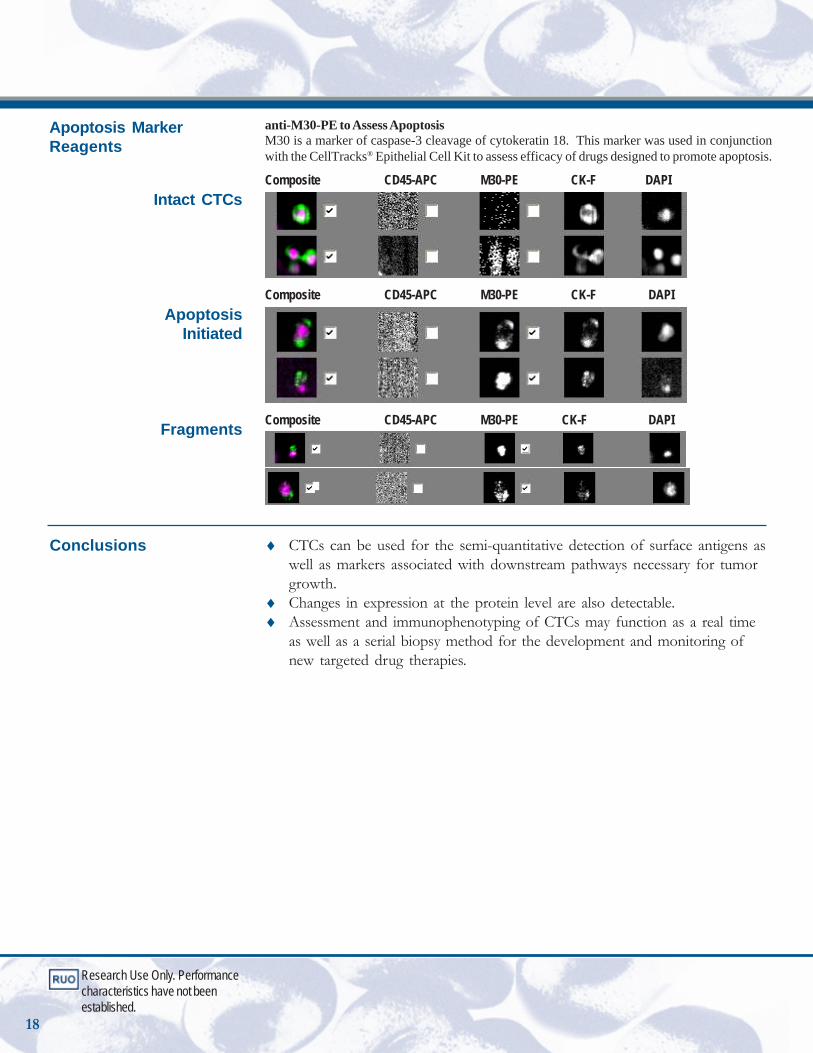
anti-M30-PE to Assess ApoptosisM30 is a marker of caspase-3 cleavage of cytokeratin 18. This marker was used in conjunctionwith the CellTracks® Epithelial Cell Kit to assess efficacy of drugs designed to promote apoptosis.
Composite CD45-APC M30-PE CK-F DAPI
Composite CD45-APC M30-PE CK-F DAPI
Composite CD45-APC M30-PE CK-F DAPI
♦ CTCs can be used for the semi-quantitative detection of surface antigens aswell as markers associated with downstream pathways necessary for tumorgrowth.
♦ Changes in expression at the protein level are also detectable.♦ Assessment and immunophenotyping of CTCs may function as a real time
as well as a serial biopsy method for the development and monitoring ofnew targeted drug therapies.
Intact CTCs
ApoptosisInitiated
Fragments
Apoptosis MarkerReagents
Research Use Only. Performancecharacteristics have not beenestablished.
18
Peri-operative assessment of circulating tumor cells in blood,disseminated tumor cells in bone marrow, and tissue genesignatures in patients with primary breast cancer.T G Frazier, MDa, M Flynn, RN MSa, B A Sieling, MDa, M Hermanb, C S Rao, PhDb, S Grossb,M C Millerb, G V Doyle, DDSb and L Terstappen, MD PhDb.aBreast Center, Bryn Mawr Hospital, Bryn Mawr, PA; and bImmunicon Corporation, HuntingdonValley, PA
Background: ~30% of the 200,000 women diagnosed annually with breast cancerwill recur. Without a validated assay to identify these patients, all becomecandidates for adjuvant therapy. Both real-time RT-PCR analysis of primary tissueand detection of disseminated tumor cells (DTC) in bone marrow byimmunohistochemistry (IHC) purportedly aid in identifying these patients. Theprimary objective of this study was to demonstrate that the automated CellSearchTM
System used to detect circulating tumor cells (CTC) in blood could also be usedto quantify DTCs in bone marrow. Incidence of CTCs, DTCs and gene signaturesin matched specimens were also compared.
Methods: 30 mL blood and 3mL bone marrow specimens were collected inCellSave® Preservative Tubes peri-operatively from 33 primary breast cancerpatients stage 0-III. 31 healthy donors were used to determine CTC backgroundin blood while a separate 51 healthy marrow donors served as DTC controls. Bothblood and marrow specimens were prepared on the CellTracks® AutoPrep Systemto enrich EpCAM+ cells. Using the CellTracks® Analyzer II, cells were counted astumor cells if they were also nucleated, expressed cytokeratin and lacked CD45.The OncoType Dx Multi-gene RT-PCR assay was used to analyze paraffin treatedtissue.
Results: 0/31 control blood donors had CTCs while 6/33 (18%) patients had >2CTC/30 mL blood (Range 2-8, mean 3.2/30ml, 2.4SD) [Fishers exact p-value =0.025]. 4/51 (8%) control marrow donors had >1 DTC/3 mL marrow (range 1-6,mean 4 DTC/3 mL, SD2.4) while 9/33 (27%) patients had >1 DTC/3 mL (range1-29, mean 8 DTC/3 mL, SD11) [Fishers exact p-value = 0.028]. 2 patients (1DCIS, 1 Stage I) had positive CTC and DTC counts. 2 patients still had DTCs (26,29/3 mL) after neoadjuvant therapy. Patients with OncoType Dx recurrence scores6-15 (low risk) also had no detectable CTCs and/or DTCs.
Discussion: The CellSearchTM System can be used to quantify DTCs. CTCs andDTCs may provide prognostic information complementary to gene expressionprofiling possibly increasing the accuracy of assessment of risk of recurrence inpatients with primary breast cancer. The DTC method is being further validatedby comparison to a gold standard IHC bone marrow assay in a multi centerinternational study.
Abstract
Poster Session28th Annual San AntonioBreast Cancer SymposiumSan Antonio, Texas December 2005
Research Use Only. Performancecharacteristics have not beenestablished.
19
Trial DesignProspective, double-blind, single siteBiopsy confirmed breast cancerStage 0 – III30ml blood drawn at time of IV insertion immediately prior to SurgeryBi-lateral iliac crest bone marrow aspirates at time of / prior to surgerySame Automated system used to process blood and bone marrow
---5 (8)---61DTC Control------0 (0)31CTC Control
4 /8%9 /17%18 /34%53Total1 (33)3(100)1 (33)3III1 (8)1 (8) 3 (23)13II2 (8)3 (12)11 (44)25I0 0)2 (17)3 (25)12TNM Stage 0
n (%)n (%)n (%)Dual+DTC+CTC+
nPOPULATION
---5 (8)---61DTC Control------0 (0)31CTC Control
4 /8%9 /17%18 /34%53Total1 (33)3(100)1 (33)3III1 (8)1 (8) 3 (23)13II2 (8)3 (12)11 (44)25I0 0)2 (17)3 (25)12TNM Stage 0
n (%)n (%)n (%)Dual+DTC+CTC+
nPOPULATION
CTC+ > 1 tumor cell in 30 ml of peripheral blood DTC+ > 1 tumor cell in 3 ml of bone marrow
13 patients (ER+ Node- Stage 0-II) provided matched CTC, DTC & OncotypeDx data (seefollowing Table)3 stage III patients received neo-adjuvant therapy – after treatment none had CTCs butall still had positive bone marrows (2, 26, 29 DTCs) at time of surgeryOne patient with Atypical Ductal Hyperplasia & Atypical Lobular Hyperplasia (nodetectable in situ or invasive cancer) had a bilateral prophylactic mastectomy – no CTCswere found but the bone marrow was positive (5 DTCs)
Results
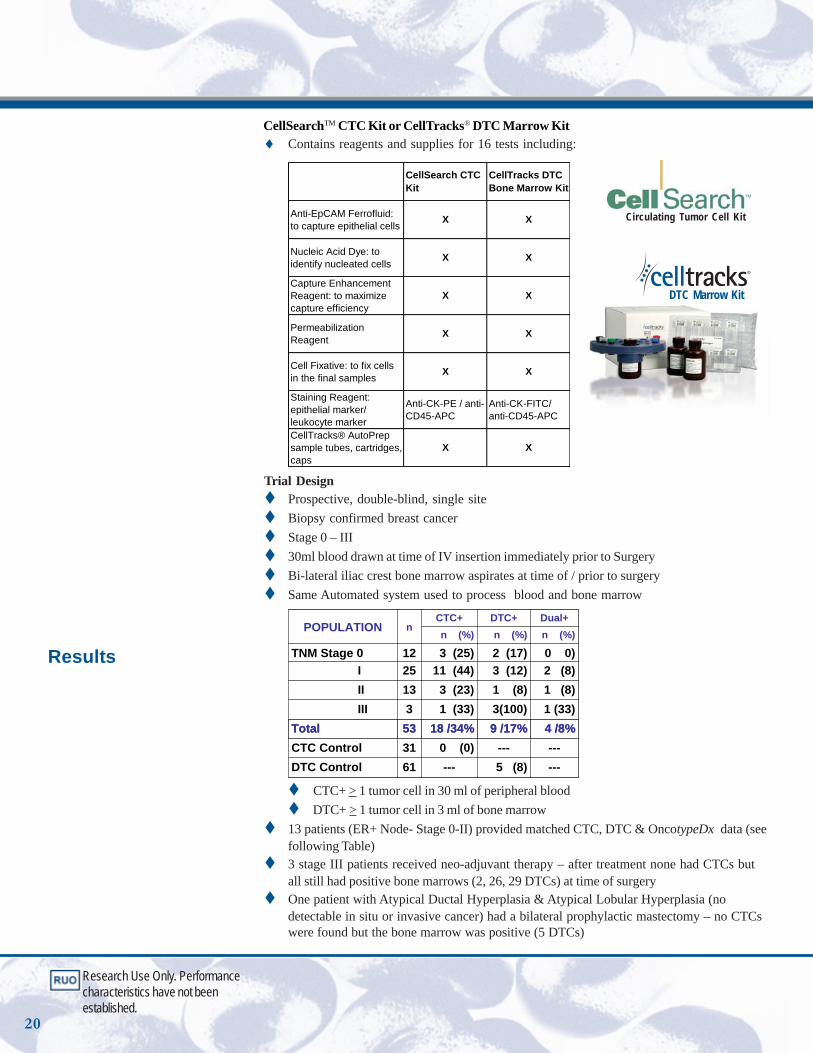
CellSearchTM CTC Kit or CellTracks® DTC Marrow Kit♦ Contains reagents and supplies for 16 tests including:
CellSearch CTC Kit
CellTracks DTC Bone Marrow Kit
Anti-EpCAM Ferrofluid: to capture epithelial cells X X
Nucleic Acid Dye: to identify nucleated cells X X
Capture Enhancement Reagent: to maximize capture efficiency
X X
Permeabilization Reagent X X
Cell Fixative: to fix cells in the final samples X X
Staining Reagent: epithelial marker/ leukocyte marker
Anti-CK-PE / anti-CD45-APC
Anti-CK-FITC/ anti-CD45-APC
CellTracks® AutoPrep sample tubes, cartridges, caps
X X
Circulating Tumor Cell Kit
DTC Marrow Kit
Research Use Only. Performancecharacteristics have not beenestablished.
20
Conclusions ♦ The automated CellTracks® System can be used to quantify DTCs as well asCTCs
♦ CTCs and/or DTCs may provide prognostic information complimentary to geneexpression profiling assays
♦ CTCs and/or DTCs may be a means to determine the effectiveness of neoadjuvanttherapy
♦ Comparison to a gold standard IHC based DTC assay to establish CellTracks®
assay accuracy is underway
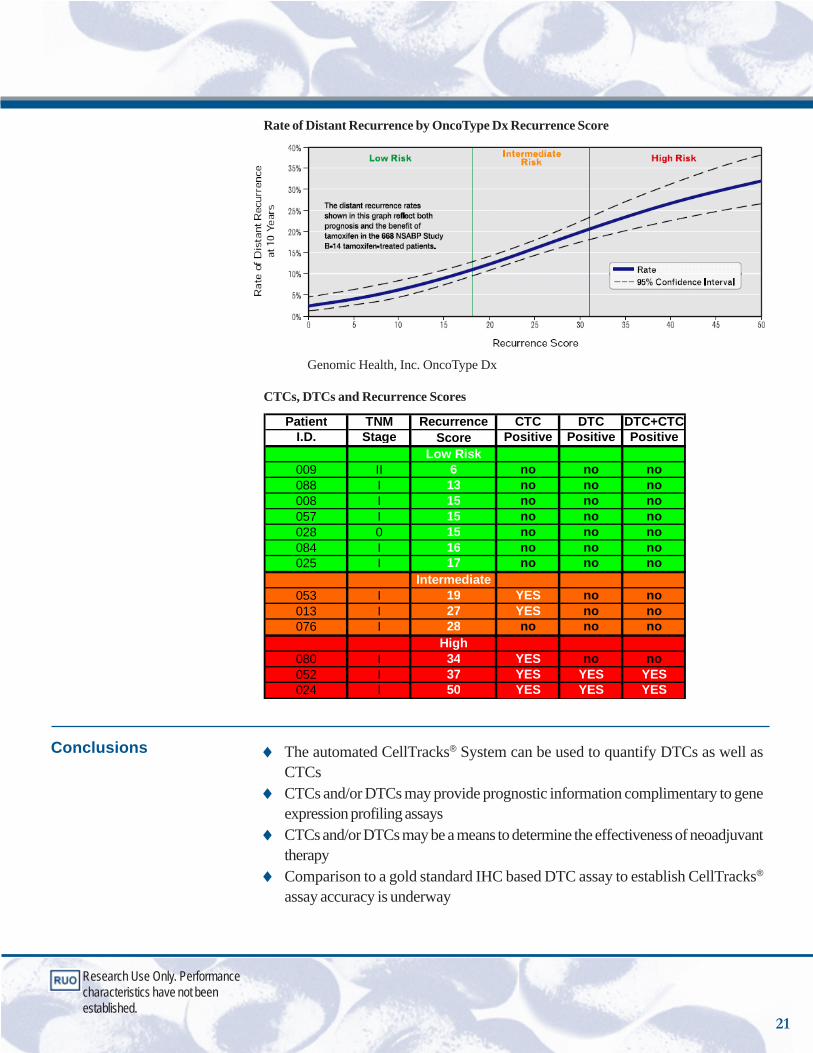
Rate of Distant Recurrence by OncoType Dx Recurrence Score
Genomic Health, Inc. OncoType Dx
CTCs, DTCs and Recurrence Scores
Patient TNM Recurrence CTC DTC DTC+CTCI.D. Stage Score Positive Positive Positive
Low Risk009 II 6 no no no088 I 13 no no no008 I 15 no no no057 I 15 no no no028 0 15 no no no084 I 16 no no no025 I 17 no no no
Intermediate053 I 19 YES no no013 I 27 YES no no076 I 28 no no no
High080 I 34 YES no no052 I 37 YES YES YES024 I 50 YES YES YES
Research Use Only. Performancecharacteristics have not beenestablished.
21
Poster Session28th Annual San AntonioBreast Cancer SymposiumSan Antonio, Texas December 2005
Circulating tumor cells in adjuvant breast cancer patientsS. Almokadema, K. Leitzela, H. A. Harveya, E. Bannona, S. M. Alia, M. C. Millerb, M. Repolletb,LWWM. Terstappenb, Gerald V. Doyleb, T. Frazierc, A. Liptona
aPennsylvania State College of Medicine/ Hershey Medical Center, Hershey, PA; bImmuniconCorporation, Huntington Valley, PA; cComprehensive Breast Center, Bryn Mawr Hospital, BrynMawr, PA
Background: One of the first steps in metastasis is the ability of primary breastcancer cells to detach and invade the circulation. The presence of >5 circulatingtumor cells (CTCs) in 7.5mL of blood from metastatic breast cancer patientspredicts shorter progression-free and overall survival (M Christofanilli et al NEJM351:781-791, 2004). The purpose of our study was to determine if CTCs werepresent in the blood of patients who had recently completed adjuvantchemotherapy.
Methods: 51 patients were accrued within 12 months of completing adjuvantchemotherapy, none of whom had evidence of recurrence by imaging. Patientscharacteristics: 17 (33%) patients were stage I, 26 (51%) stage II, and 8 (16%)stage III. In addition, 8 (16%) patients were Her2/neu 3+ by IHC. CTCs wereimmunomagnetically separated and fluorescently stained using the CellSearch™Circulating Tumor Cell Kit. Circulating tumor cells (CTCs) were classified usingthe CellTracks® Analyzer II as CTCs if they stained positive for DAPI (nucleardye), and cytokeratin 8, 18 and/or 19, and if they stained negative for theleukocyte-specific antibody CD45.
Results: In a control group of 145 healthy females, 8 (5.5%) had 1 CTC / 7.5 mLblood. In 199 patients with benign breast diseases, 14 (7.0 %) had 1 CTC/ 7.5mL, and only 1 (0.5%) had 3 CTCs/7.5 mL detected in their blood. 8 patients outof 51 patients in the study group (16%) had >1 CTC/ 7.5 mL (five patients has 1CTC in one tube, two patient had 2 CTC in one tube, and the eighth patient hadone CTC in three tubes). Of the 8 patients with CTCs, 2 were stage I (12%), 4stage II (15%), and 2 stage III (25%). Additionally, 2 (25%) were Her2/neu 3+by IHC in the primary tumor. In summary, CTC were detected in 8/51(16%)adjuvant breast cancer patients, 8/145 (5.5%) healthy control, and 15/199 (7.5%)in benign breast diseases patients. There were statistically significant differencesin the proportion of CTCs between these groups (Fisher’s exact test p>0.0346breast cancer vs healthy control; p>0.0993 breast cancer vs benign diseases group;and p>0.044 breast cancer group vs both control groups).
Conclusions: CTCs were detected in 16% of breast cancer patients who recentlycompleted adjuvant chemotherapy; this finding was statistically significant incomparison with the healthy control group. Patient accrual and follow-up in thisstudy continues to determine if the presence of elevated CTCs is associated withearly recurrence of the disease.
Abstract
Research Use Only. Performancecharacteristics have not beenestablished.
22
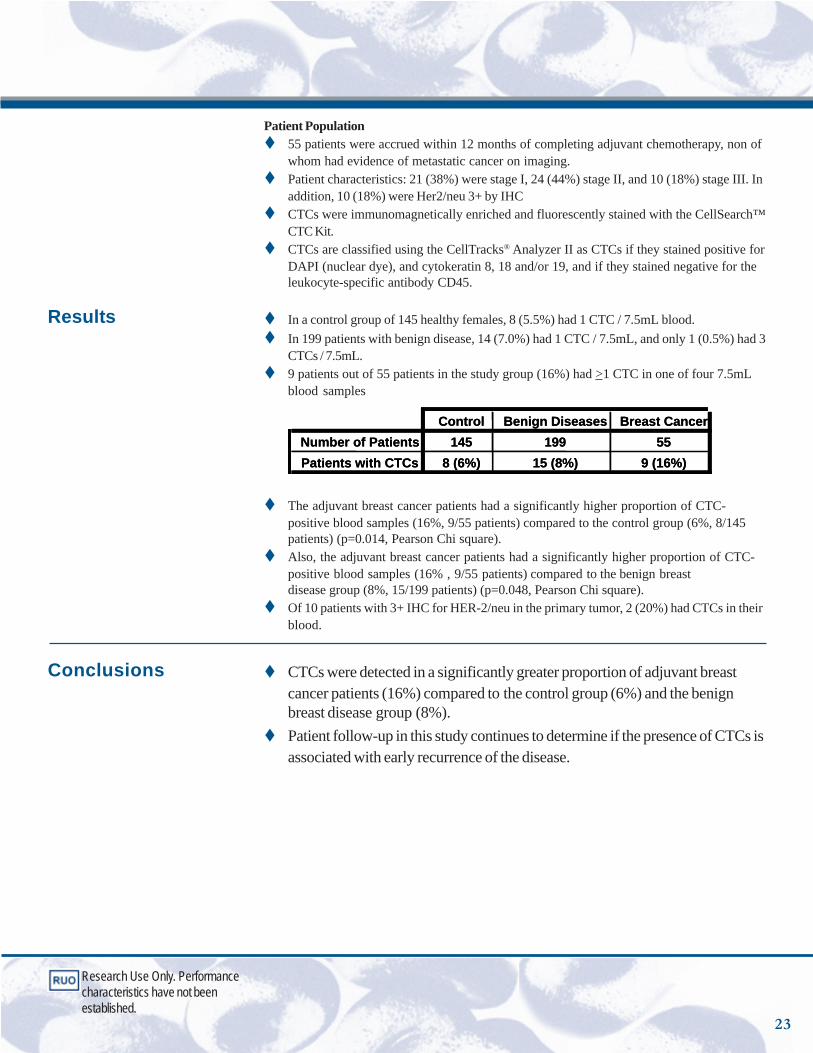
Patient Population55 patients were accrued within 12 months of completing adjuvant chemotherapy, non ofwhom had evidence of metastatic cancer on imaging.Patient characteristics: 21 (38%) were stage I, 24 (44%) stage II, and 10 (18%) stage III. Inaddition, 10 (18%) were Her2/neu 3+ by IHCCTCs were immunomagnetically enriched and fluorescently stained with the CellSearch™CTC Kit.CTCs are classified using the CellTracks® Analyzer II as CTCs if they stained positive forDAPI (nuclear dye), and cytokeratin 8, 18 and/or 19, and if they stained negative for theleukocyte-specific antibody CD45.
In a control group of 145 healthy females, 8 (5.5%) had 1 CTC / 7.5mL blood.In 199 patients with benign disease, 14 (7.0%) had 1 CTC / 7.5mL, and only 1 (0.5%) had 3CTCs / 7.5mL.9 patients out of 55 patients in the study group (16%) had >1 CTC in one of four 7.5mLblood samples
Control Benign Diseases Breast CancerNumber of Patients 145 199 55Patients with CTCs 8 (6%) 15 (8%) 9 (16%)
Control Benign Diseases Breast CancerNumber of Patients 145 199 55Patients with CTCs 8 (6%) 15 (8%) 9 (16%)
The adjuvant breast cancer patients had a significantly higher proportion of CTC-positive blood samples (16%, 9/55 patients) compared to the control group (6%, 8/145patients) (p=0.014, Pearson Chi square).Also, the adjuvant breast cancer patients had a significantly higher proportion of CTC-positive blood samples (16% , 9/55 patients) compared to the benign breastdisease group (8%, 15/199 patients) (p=0.048, Pearson Chi square).Of 10 patients with 3+ IHC for HER-2/neu in the primary tumor, 2 (20%) had CTCs in theirblood.
CTCs were detected in a significantly greater proportion of adjuvant breastcancer patients (16%) compared to the control group (6%) and the benignbreast disease group (8%). Patient follow-up in this study continues to determine if the presence of CTCs isassociated with early recurrence of the disease.
Results
Conclusions
Research Use Only. Performancecharacteristics have not beenestablished.
23
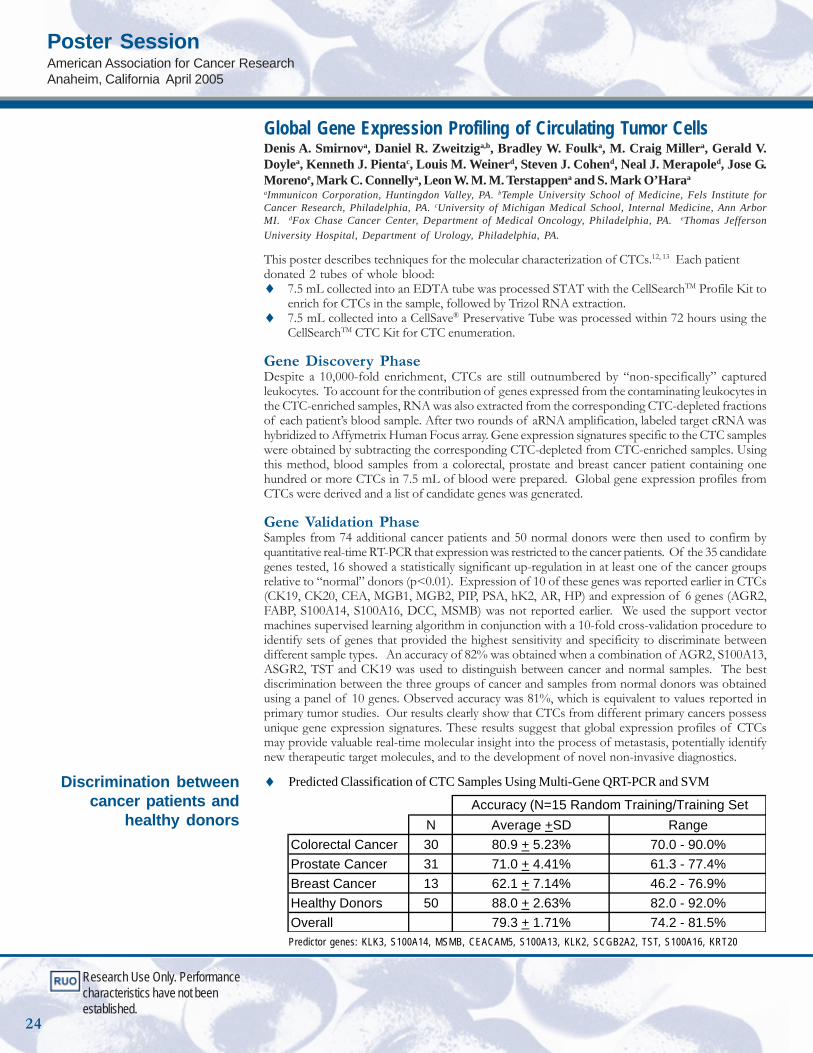
Global Gene Expression Profiling of Circulating Tumor CellsDenis A. Smirnova, Daniel R. Zweitziga,b, Bradley W. Foulka, M. Craig Millera, Gerald V.Doylea, Kenneth J. Pientac, Louis M. Weinerd, Steven J. Cohend, Neal J. Merapoled, Jose G.Morenoe, Mark C. Connellya, Leon W. M. M. Terstappena and S. Mark O’Haraa
aImmunicon Corporation, Huntingdon Valley, PA. bTemple University School of Medicine, Fels Institute forCancer Research, Philadelphia, PA. cUniversity of Michigan Medical School, Internal Medicine, Ann ArborMI. dFox Chase Cancer Center, Department of Medical Oncology, Philadelphia, PA. eThomas JeffersonUniversity Hospital, Department of Urology, Philadelphia, PA.
This poster describes techniques for the molecular characterization of CTCs.12, 13 Each patientdonated 2 tubes of whole blood:♦ 7.5 mL collected into an EDTA tube was processed STAT with the CellSearchTM Profile Kit to
enrich for CTCs in the sample, followed by Trizol RNA extraction.♦ 7.5 mL collected into a CellSave® Preservative Tube was processed within 72 hours using the
CellSearchTM CTC Kit for CTC enumeration.
Gene Discovery PhaseDespite a 10,000-fold enrichment, CTCs are still outnumbered by “non-specifically” capturedleukocytes. To account for the contribution of genes expressed from the contaminating leukocytes inthe CTC-enriched samples, RNA was also extracted from the corresponding CTC-depleted fractionsof each patient’s blood sample. After two rounds of aRNA amplification, labeled target cRNA washybridized to Affymetrix Human Focus array. Gene expression signatures specific to the CTC sampleswere obtained by subtracting the corresponding CTC-depleted from CTC-enriched samples. Usingthis method, blood samples from a colorectal, prostate and breast cancer patient containing onehundred or more CTCs in 7.5 mL of blood were prepared. Global gene expression profiles fromCTCs were derived and a list of candidate genes was generated.
Gene Validation PhaseSamples from 74 additional cancer patients and 50 normal donors were then used to confirm byquantitative real-time RT-PCR that expression was restricted to the cancer patients. Of the 35 candidategenes tested, 16 showed a statistically significant up-regulation in at least one of the cancer groupsrelative to “normal” donors (p<0.01). Expression of 10 of these genes was reported earlier in CTCs(CK19, CK20, CEA, MGB1, MGB2, PIP, PSA, hK2, AR, HP) and expression of 6 genes (AGR2,FABP, S100A14, S100A16, DCC, MSMB) was not reported earlier. We used the support vectormachines supervised learning algorithm in conjunction with a 10-fold cross-validation procedure toidentify sets of genes that provided the highest sensitivity and specificity to discriminate betweendifferent sample types. An accuracy of 82% was obtained when a combination of AGR2, S100A13,ASGR2, TST and CK19 was used to distinguish between cancer and normal samples. The bestdiscrimination between the three groups of cancer and samples from normal donors was obtainedusing a panel of 10 genes. Observed accuracy was 81%, which is equivalent to values reported inprimary tumor studies. Our results clearly show that CTCs from different primary cancers possessunique gene expression signatures. These results suggest that global expression profiles of CTCsmay provide valuable real-time molecular insight into the process of metastasis, potentially identifynew therapeutic target molecules, and to the development of novel non-invasive diagnostics.
♦ Predicted Classification of CTC Samples Using Multi-Gene QRT-PCR and SVM
Predictor genes: KLK3, S100A14, MSMB, CEACAM5, S100A13, KLK2, SCGB2A2, TST, S100A16, KRT20
N Average +SD RangeColorectal Cancer 30 80.9 + 5.23% 70.0 - 90.0%Prostate Cancer 31 71.0 + 4.41% 61.3 - 77.4%Breast Cancer 13 62.1 + 7.14% 46.2 - 76.9%Healthy Donors 50 88.0 + 2.63% 82.0 - 92.0%Overall 79.3 + 1.71% 74.2 - 81.5%
Accuracy (N=15 Random Training/Training Set
Discrimination betweencancer patients and
healthy donors
Research Use Only. Performancecharacteristics have not beenestablished.
Poster SessionAmerican Association for Cancer ResearchAnaheim, California April 2005
24
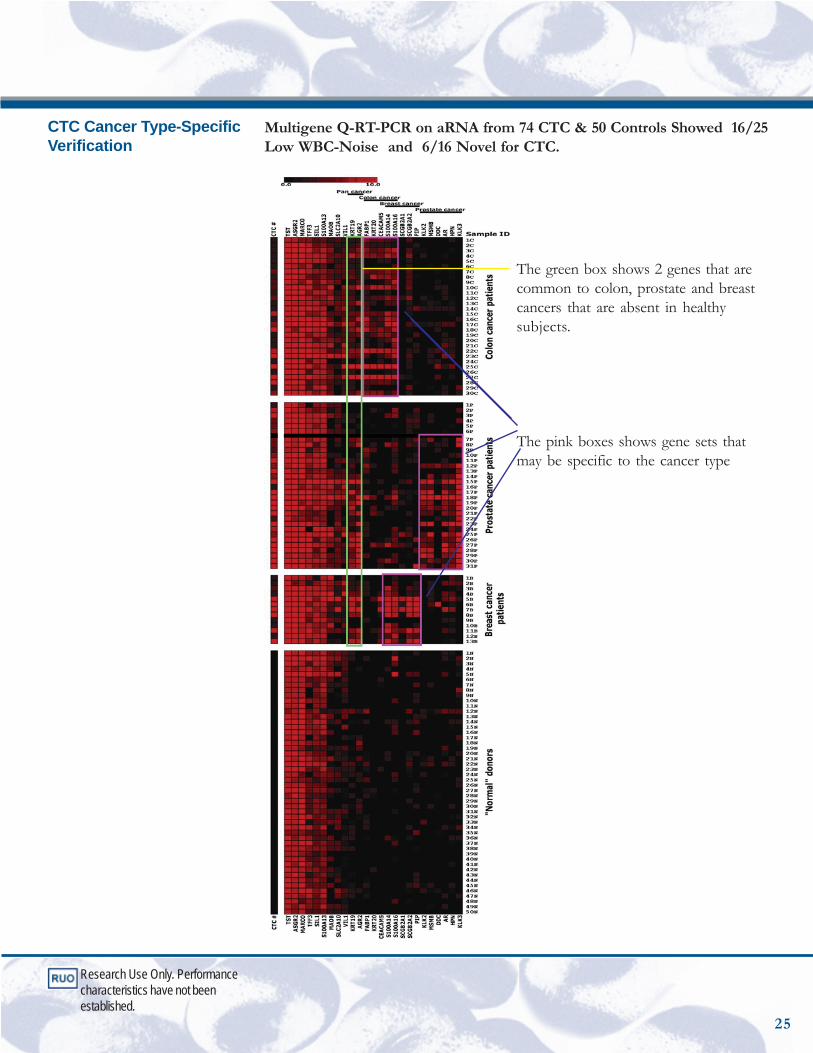
Multigene Q-RT-PCR on aRNA from 74 CTC & 50 Controls Showed 16/25Low WBC-Noise and 6/16 Novel for CTC.
CTC Cancer Type-SpecificVerification
The green box shows 2 genes that arecommon to colon, prostate and breastcancers that are absent in healthysubjects.
The pink boxes shows gene sets thatmay be specific to the cancer type
Research Use Only. Performancecharacteristics have not beenestablished.
25
3401 Masons Mill Road, Suite 100Huntingdon Valley, Pennsylvania 19006phone 215.830.0777, 877.822.0777fax 215.830.0482web www.immunicon.com
1 W. Jeffrey Allard, Leon W. M. M. Terstappen, et al: Tumor Cells Circulate in the Peripheral Blood of AllMajor Carcinomas but not in Healthy Subjects or Patients with Nonmalignant Diseases. Clinical CancerResearch. 10:6897-6904, 2004
2 J. Moreno, L. Gomella, L.W.M.M. Terstappen, et al: Circulating Tumor Cells Predict Survival in Patientswith Metastatic Prostate Cancer. Urology 65(4):713-718, 2005
3 M. Cristofanilli, D. Hayes, et al: Circulating Tumor Cells, Disease Progression, and Survival in MetastaticBreast Cancer. New England Journal of Medicine 351:781-791, 2004
4 CellSearchTM Circulating Tumor Cell Kit Instructions for Use
5 M. Cristofanilli, D.F. Hayes, et al: Oral Presentation, ASCO 2005. Presence of Circulating Tumor Cells inMetastatic Breast Cancer predicts Rapid Progression and Poor Prognosis
6 M. Cristofanilli, D. Hayes, et al: Circulating Tumor Cells: A Novel Prognostic Factor for Newly DiagnosedBreast Cancer. Journal of Clinical Oncology. 23(7):1420-1430, 2005
7 G.T. Budd, D.F. Hayes, et al: Oral Presentation, ASCO 2005. Monitoring Circulating Tumor Cells in Non-Measurable Metastatic Breast Cancer
8 M.J. Ellis, D.F. Hayes, L.W.M.M. Terstappen, et al: Oral Presentation, San Antonio Breast CancerSymposium 2005. Prognostic and Predictive Value of Circulating Tumor Cells in Metastatic Breast CancerPatients Treated with Endocrine or Chemotherapy
9 A. Stopeck, M. Cristofanilli, D.F. Hayes, et al: Poster Presentation, ASCO 2005. Circulatiing Tumor Cells-Not Serum Tumor Markers- Predict Survival in Metastatic Breast Cancer
10 S. Meng, J. Uhr, et al: HER-2 Gene Amplification Can Be Acquired as Breast Cancer Progresses.Proceedings of the National Academy of Science. 101(25):9393-9398, 2004
11 D.F. Hayes, L.W.M.M. Terstappen, et al: Monitoring Expression of HER-2 on Circulating Epithelial Cellsin Patients with Advanced Breast Cancer. International Journal of Oncology. 21:1111-1117, 2002
12 G. Doyle, J. Smerage, L.W.M.M. Terstappen, et al: Poster Session 5th International Symposium on MinimalResidual Cancer 2005. Monitoring Target Modulation on Circulating Tumor Cells.
13 C.J. Larson, L.W.M.M. Terstappen, et al: Apoptosis of Circulating Tumor Cells in Prostate Cancer Patients.Cytometry. 62A:46-53, 2004
14 T.G. Frazier, M. et al: Poster Presentation, San Antonio Breast Cancer Symposium 2005. Peri-operativeassessment of circulating tumor cells in blood, disseminated tumor cells in bone marrow, and tissue genesignatures in patients with primary breast cancer.
15 S. Almokadem, A. Lipton, et al: Poster Presentation, San Antonio Breast Cancer Symposium 2005. Circulatingtumor cells in adjuvant breast cancer patients.
16 D. Smirnov, S.M. O'Hara et al: Global Gene Expression Profiling of Circulating Tumor Cells. CancerResearch. 65(12):4993-4997, 2005
17 S.M. O’Hara, L.W.M.M. Terstappen, et al: Multigene Reverse Transcription-PCR Profiling of CirculatingTumor Cells in Hormone-Refractory Prostate Cancer. Clinical Chemistry. 50:(5):826-835, 2004
References