Immune correlate study on human Schistosoma japonicum in a well-defined population in Leyte, Philippines: I. Assessment of ‘resistance’ versus ‘susceptibility’ to S. japonicum infection Luz P. Acosta a, *, Gemiliano D.L. Aligui a , Wilfred U. Tiu b , Donald P. McManus c , Remigio M. Olveda a a Research Institute for Tropical Medicine, FICC Compound, Alabang, Muntinlupa City, Philippines b Department of Parasitology, College of Public Health, University of the Philippines Manila, Ermita, Manila, Philippines c Molecular Parasitology Unit, Australian Centre for International and Tropical Health and Nutrition, The Queensland Institute of Medical Research and the University of Queensland, 300 Herston Road, Brisbane 4029, Queensland, Australia Received 15 February 2001; received in revised form 17 June 2002; accepted 5 July 2002 Abstract This study describes the categorical classification of 155 individuals living in an endemic village in Macanip, Leyte, Philippines as ‘resistant’ or ‘susceptible’ to Schistosoma japonicum infection using available exposure, infection and reinfection data collected from a 3-year water contact (WC) study. Epidemiological parameters including age, sex, and infection intensities in relation to observed reinfection patterns are also described. This classification was used in subsequent immunological studies described in two accompanying papers to identify protective immune mechanisms among resistant individuals induced by defined candidate vaccine molecules for S. japonicum . The study suggests that individuals who were most vulnerable to rapid reinfection were children belonging to the 5 /14 age group. A drop in incidence at age group 15 /19 and decreased intensity of infection starting at this age group and older (15 /) suggests development of immunity. Controlling for the effect of the other variables, a multivariate analysis showed significant association for sex, in that females were more likely to be resistant. This implies that other than acquired immunity to infection, some age-dependent host factors may also play an important role in the overall changes of reinfection patterns seen in schistosomiasis japonica in this population. Crown Copyright # 2002 Published by Elsevier Science B.V. All rights reserved. Keywords: Schistosomiasis; Schistosoma japonicum ; Reinfection; Age-dependent host factors; Resistance; Susceptibility 1. Introduction Interpretation of age-prevalence or age-infection intensity patterns observed in schistosomiasis japonicum-endemic communities has generally attributed the declining levels of infection in adults to development of acquired immunity (Ross et al., * Corresponding author. Tel.: /632-807-26-28; fax: /632- 842-22-45 E-mail address: [email protected]v.ph (L.P. Acosta). Acta Tropica 84 (2002) 127 /136 www.parasitology-online.com 0001-706X/02/$ - see front matter. Crown Copyright # 2002 Published by Elsevier Science B.V. All rights reserved. PII:S0001-706X(02)00176-6

Welcome message from author
This document is posted to help you gain knowledge. Please leave a comment to let me know what you think about it! Share it to your friends and learn new things together.
Transcript
Immune correlate study on human Schistosoma japonicum in awell-defined population in Leyte, Philippines: I. Assessment of
‘resistance’ versus ‘susceptibility’ to S. japonicum infection
Luz P. Acosta a,*, Gemiliano D.L. Aligui a, Wilfred U. Tiu b, DonaldP. McManus c, Remigio M. Olveda a
a Research Institute for Tropical Medicine, FICC Compound, Alabang, Muntinlupa City, Philippinesb Department of Parasitology, College of Public Health, University of the Philippines Manila, Ermita, Manila, Philippines
c Molecular Parasitology Unit, Australian Centre for International and Tropical Health and Nutrition, The Queensland Institute of
Medical Research and the University of Queensland, 300 Herston Road, Brisbane 4029, Queensland, Australia
Received 15 February 2001; received in revised form 17 June 2002; accepted 5 July 2002
Abstract
This study describes the categorical classification of 155 individuals living in an endemic village in Macanip, Leyte,
Philippines as ‘resistant’ or ‘susceptible’ to Schistosoma japonicum infection using available exposure, infection and
reinfection data collected from a 3-year water contact (WC) study. Epidemiological parameters including age, sex, and
infection intensities in relation to observed reinfection patterns are also described. This classification was used in
subsequent immunological studies described in two accompanying papers to identify protective immune mechanisms
among resistant individuals induced by defined candidate vaccine molecules for S. japonicum . The study suggests that
individuals who were most vulnerable to rapid reinfection were children belonging to the 5�/14 age group. A drop in
incidence at age group 15�/19 and decreased intensity of infection starting at this age group and older (15�/) suggests
development of immunity. Controlling for the effect of the other variables, a multivariate analysis showed significant
association for sex, in that females were more likely to be resistant. This implies that other than acquired immunity to
infection, some age-dependent host factors may also play an important role in the overall changes of reinfection
patterns seen in schistosomiasis japonica in this population.
Crown Copyright # 2002 Published by Elsevier Science B.V. All rights reserved.
Keywords: Schistosomiasis; Schistosoma japonicum ; Reinfection; Age-dependent host factors; Resistance; Susceptibility
1. Introduction
Interpretation of age-prevalence or age-infection
intensity patterns observed in schistosomiasis
japonicum-endemic communities has generally
attributed the declining levels of infection in adults
to development of acquired immunity (Ross et al.,
* Corresponding author. Tel.: �/632-807-26-28; fax: �/632-
842-22-45
E-mail address: [email protected] (L.P. Acosta).
Acta Tropica 84 (2002) 127�/136
www.parasitology-online.com
0001-706X/02/$ - see front matter. Crown Copyright # 2002 Published by Elsevier Science B.V. All rights reserved.
PII: S 0 0 0 1 - 7 0 6 X ( 0 2 ) 0 0 1 7 6 - 6
2000; Olveda et al., 1996). Earlier studies onSchistosoma. mansoni (Kloetzel and Da Silva,
1967) have shown that among adult immigrants,
the same convex shape of age-prevalence and
intensity curves persisted, implying that levels of
infection were attributed to duration of exposure
and thus the development of immunity. These
studies, however, were limited because of lack of
field data to back up the observations. It wasargued that the decline in infection levels may well
be because of lack or reduced exposure in adults
and/or partly as a result of spontaneous death of
adult schistosome worms from a primary infection
(Dalton and Pole, 1978).
Until recently, longitudinal studies have been
designed to accurately measure intensity of infec-
tion and reinfection after treatment over a periodof time and at the same time monitor actual levels
of exposure estimated by direct observations of
water contact (WC) at potential transmission sites.
Parallel studies have been conducted for both S.
mansoni in Kenya (Sturrock et al., 1983; Butter-
worth et al., 1985; Dunne et al., 1992) and for
Schistosoma haematobium in the Gambia (Wilkins
et al., 1987). These studies provided evidence foran age-dependent acquired resistance to reinfec-
tion, where younger children were re-infected
faster, with high infection intensities, than adults,
a feature that could not be attributed to changes in
exposure. An 8-year longitudinal study of Schis-
tosoma japonicum in the Philippines also showed
that the time of re-infection in children between
the ages 7 and 13 was significantly more rapid,while a significant decrease in the risk of reinfec-
tion was observed among individuals aged 14�/35
with a history of prior infection (Olveda et al.,
1996).
In this study, we describe the exposure and
reinfection pattern of a sub-group of individuals
who volunteered for blood extraction and whose
blood samples were examined in subsequent im-munological assays described elsewhere (Acosta et
al., 2002a,b). These individuals belonged to a
larger cohort of a WC study undertaken in
1993�/1995.
This study used data from the 3-year field
observation of water exposure and infection pat-
tern to classify two extreme groups of ‘resistant’
and ‘susceptible’ individuals. Those classified as‘resistant’ were those who had high exposure but
showed less reinfection or consistent low infection
intensities. While those classified as ‘susceptible’
were individuals having showed more reinfection
or consistent high intensity infection. Epidemiolo-
gical parameters such as age, sex, exposure and
infection intensities that contributed to the ob-
served reinfection patterns (comparing ‘resistant’and ‘susceptible’) are also described. The classifi-
cation of these individuals into these two groups
who had their blood examined in several immu-
nological assays was the basis in identifying any
indication of protective immune mechanism
among the ‘resistant’ individuals induced by po-
tential candidate vaccine molecules for S. japoni-
cum . Two separate papers describe theimmunological basis of cellular and humoral
immune responses of these individuals to the
defined vaccine molecules and native antigens
(Acosta et al., 2002a,b).
The data presented here are limited to the
estimated exposure and infection patterns for the
subgroup of individuals described in this study,
who agreed to provide blood samples, and not forthe larger WC population. A detailed description
of the 3-year WC follow-up, results and validation
of a mathematical model of potential exposure
index and reinfection patterns for the entire WC
cohort will be published elsewhere (see also Aligui
et al., 1997; Aligui, 1997; thesis).
2. Materials and methods
2.1. Study population
A total of 155 individuals (67 females and 88
males) aged from 5 to 76 years were enrolled in this
study. These individuals were part of a larger study
(n�/412) whose exposures were characterized by
observing WC activities on potential exposure sitesover a 10-month period from 1993 to 1995. From
this larger population, 155 volunteered for blood
extraction in 1995 for the immunological studies,
which comprised the study population described in
this paper. To estimate a yearly incidence of
infection, all received yearly treatment regardless
L.P. Acosta et al. / Acta Tropica 84 (2002) 127�/136128
of parasitology results and, therefore, were assuredof yearly zero infection baseline, since the efficacy
of Praziquantel given at 50 mg/kg body weight was
found to be �/98% (Olveda et al., 1996).
Parasitologic diagnosis used duplicate slides of a
five stool sample Kato�/Katz examination (50 mg
per smear). Egg output intensities remained very
low throughout the duration of the WC follow-up.
Average EPG or egg output were, therefore,categorized as Low (1�/19 EPG); Moderate (20�/
99 EPG) and High (100�/EPG) infection intensi-
ties.
The study was thoroughly reviewed and ap-
proved by the RITM Institutional and Ethical
Review Board.
2.2. Water contact exposure measures
The WC study site located in Macanip, Leyte
(described in earlier studies as Village C by Olveda
et al., 1983, 1996) was approximately 216 hectares
of land area. Thirty water observation sites were
selected from a pilot ocular survey that identified
potential human exposure sites. Local field work-
ers residents of the same village were hired as
observers for the WC activities and snail collectionfor the 3-year duration of the study. Two teams of
observers (four observers per team) were assigned
for an 80-day period of water observation sche-
dules per cycle. Each cycle consisted of ten
observation schedules of 6 days observations and
snail collections, and 2 days rest. A field team
leader was assigned to monitor all field activities
and data collection. Each time a study participantwas observed at one of the sites, WC data were
collected which included: duration (frequency) of
contact in minutes, degree of contact to approx-
imate percent skin surface exposure, activity types
(such as crossing, drawing water, walking in water,
gathering vegetables, washing dishes, washing
clothes, bathing, washing body parts, playing in
water, swimming, ploughing, planting and weed-ing) and time of day. Snails were collected on days
alternating with WC observations. Snail infection
rates for each observation site on a certain date
were then recorded and used as a surrogate marker
for cercarial burden at the WC site and, therefore,
‘potential’ exposure was assumed. This assump-
tion was based on actual data by Pesigan et al.1958, on S. japonicum mouse exposure experi-
ments and cercarial shedding and density measures
at different times of days.
After the baseline parasitology diagnosis and
mass treatment with Praziquantel, three cycles of
WC observations (80 days per cycle) were started
within a 10-month duration followed by two more
rounds of parasitology screening, mass treatmentand 10-month WC observations. For the whole
duration of the 3-year study, WC data from a total
of ten observation cycles (this included the initial
ocular WC observation) were collected.
In deriving an exposure index for S. japonicum
infection, WC measures were tested by modeling
relationships among different WC variables, snail
infection and intensity of infection in humans.Four predictors of infection were found namely:
snail infection, time of day, degree and duration of
contact. A functional additive formula of exposure
risk model called the weighted index of potential
exposure (WIPE) was proposed and computed as
the sum of snail infection and degree of WC in
percent divided by the duration of contact in
minutes, weighted by time of day of activity.WIPE was computed for each contact episode
and aggregated into a summative exposure value
per individual. The assumptions for this proposed
index were validated by explorative correlation
and multivariate analysis using post treatment WC
data and infection intensity at the end of the
observation period (as well as with other indepen-
dent variables to assess multicollinearity) andcompared with the ‘classical’ multiplicative index
(termed as Index 1) used in S. mansoni and S.
haematobium . Infection intensity was regressed for
each index (WIPE and index 1) separately, with
past infection, age and gender as covariates.
Results showed that WIPE was a better predictor
of intensity of infection (P�/0.001) than the
comparison index (P�/0.896), explaining 23% ofthe variation in intensity of infection with past
infection, age, and gender as covariates. A receiver
operator curve (ROC) plot for WIPE index also
showed that it is possible to determine a cut-off
value for the index (50th percentile) and classify
exposure scores into ‘high’ and ‘low’ exposure
index.
L.P. Acosta et al. / Acta Tropica 84 (2002) 127�/136 129
2.3. Assessment of ‘resistant’ versus ‘susceptible’
individuals
‘Resistance’ was assumed for individuals with
any of the following criteria.
1) Individuals, who were initially with moderate
or high EPG and subsequently became unin-
fected or remained with low EPG at least twice
on follow-up despite having a ‘high’ exposure
index.
2) Individuals, who were initially uninfected orwith low EPG and remained uninfected or
with low EPG on follow-up despite having a
‘high’ exposure index.
3) Individuals, who were initially with low EPG
and on follow-up became uninfected despite
having ‘high’ exposure index.
‘Susceptibility’ was assumed for individuals with
any of the following criteria.
1) Individuals, who were initially with moderate
or high EPG and remained with moderate orhigh EPG at least twice on follow-up.
2) Individuals, who were initially uninfected and/
or with low infection and became moderately
to highly infected at least twice on follow-up.
3) Individuals, who became infected at least
twice regardless of intensity of infection dur-
ing the 3-year follow-up having minimal or
‘low’ exposure index.
2.4. Statistical analysis
STATATM/Statistical software version 4.0 (Texas,
USA) was used for all data analysis. Distributions
of infection, reinfection and ‘immune’ profiles
across the different age groups, sex and exposure
categories were either plotted or tabulated. Rela-
tionships between different epidemiological para-
meters such as age, sex, exposure and infectionintensities were initially examined by Spearman’s
rank correlation coefficient test and the Pearson’s
x2-test on log transformed data. Differences be-
tween means used the Student’s t -test and analysis
of variance (ANOVA). Linear trends were eval-
uated by logistic regression analysis to predict a
dichotomous classification of ‘resistant’ and ‘sus-ceptible’ individuals.
3. Results
3.1. Population description
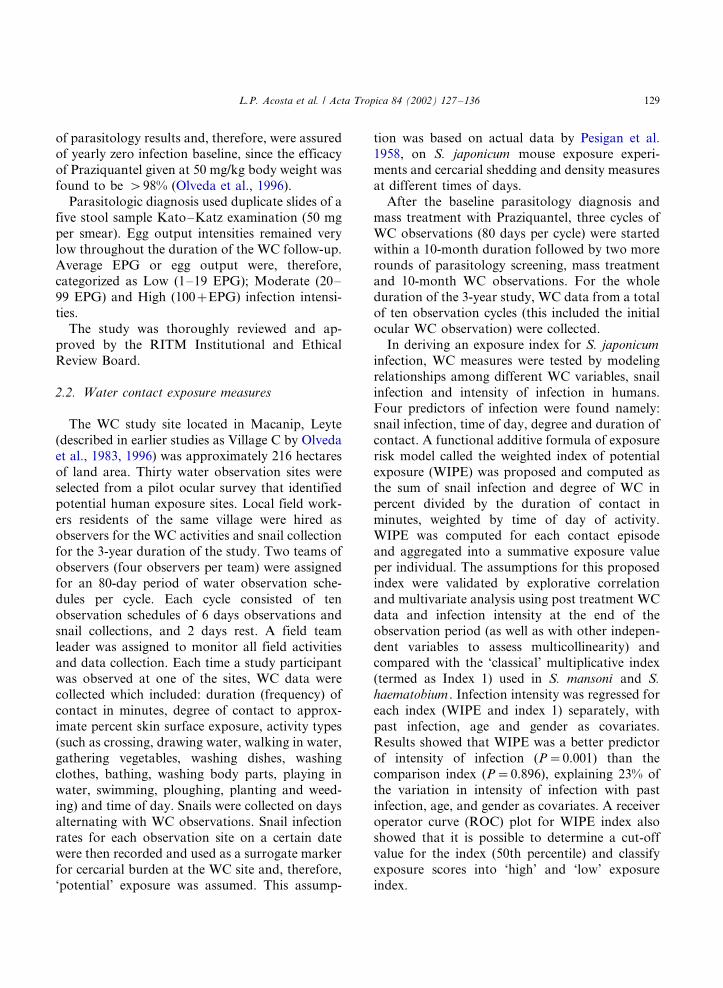
Table 1 shows the average exposure estimatesdistributed across the different age groups and
gender. The age structure of the population of
both the study population and the WC population
as well as for the whole Village of Macanip (parent
population) were typical of a rural endemic area in
the Philippines wherein around 40�/50% were 19
years of age or younger. Comparing exposure
patterns, both the study population and the largerWC population (source population) had a right
skewed exposure and were almost identical (Fig.
1). However, the study population had a signifi-
cant higher mean exposure than the source popu-
lation (Student’s t -test; (P B/0.000). This is of an
advantage for this study, since highly exposed
individuals could provide a clearer distinction
between those who were reinfected more oftenthan those who were not, hence limiting the
number of indiscriminate individuals, who can
not be classified into ‘resistant’ or ‘susceptible’.
Spearman’s rank correlation computed for age
and exposure showed a significant positive corre-
lation coefficient (Spearman’s coefficient r�/
0.3161, P B/0.0001). No significant difference in
terms of mean exposure scores was shown betweenmales and females using the Student’s t-test.
3.2. Incidence, infection and reinfection patterns
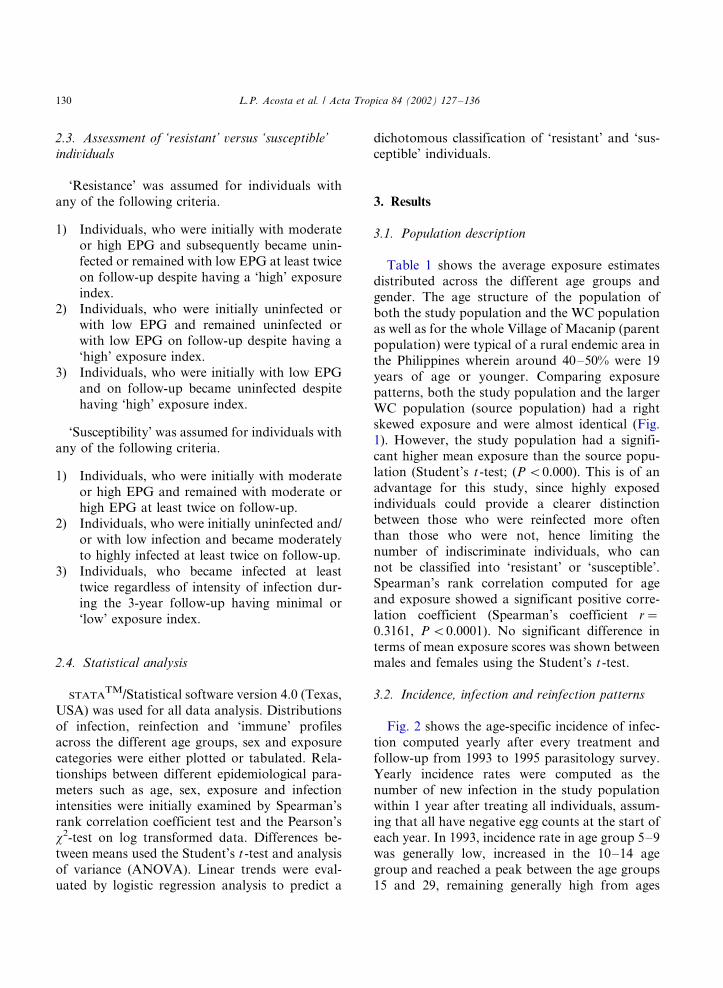
Fig. 2 shows the age-specific incidence of infec-
tion computed yearly after every treatment and
follow-up from 1993 to 1995 parasitology survey.
Yearly incidence rates were computed as the
number of new infection in the study populationwithin 1 year after treating all individuals, assum-
ing that all have negative egg counts at the start of
each year. In 1993, incidence rate in age group 5�/9
was generally low, increased in the 10�/14 age
group and reached a peak between the age groups
15 and 29, remaining generally high from ages
L.P. Acosta et al. / Acta Tropica 84 (2002) 127�/136130
30�/. In 1994, incidence gradually increased start-
ing at age 15�/19, but declined at age 50�/ and
over. After 3 years of annual treatment and
follow-up, a significant increase in incidence rates
were seen at age groups 5�/9 and 10�/14, signifi-
cantly decreased at age group 15�/19 and increased
again from age 20�/.
Due to increased sensitivity of the diagnosis
with five-stool samples, high incidence rates were
computed during the WC follow-up. However,
intensities of infections were greatly reduced to
very low levels as a result of intensive community-
based chemotherapy control in this village (Olveda
et al., 1983, 1996) since 1981. Egg intensities were
compared with the 1993 survey done at the start of
the WC study, and at the end of the study in 1995
Table 1
Mean exposure estimates (WIPE) by age and gender
Age N Mean S.E. 95% Confidence interval (CI)
5�/9 16 605.65 163.56 257.03�/954.27
10�/14 35 1046.12 158.50 724.01�/1368.23
15�/19 13 1133.61 260.16 566.76�/1200.45
20�/29 16 748.18 135.59 459.17�/1037.20
30�/39 26 1561.76 268.95 1007.86�/2115.67
40�/49 20 1447.16 260.59 901.74�/1992.58
50�/ 20 1876.16 293.39 1264.19�/2488.13
Males 84 1275.88 115.84 1045.47�/1506.28
Females 61 1180.17 153.30 873.52�/1486.83
Fig. 1. Exposure score of the study population and the WC population (source population, Aligui, 1997).
Fig. 2. Incidence rates after yearly treatment and follow-up
from 1993 to 1995 survey.
L.P. Acosta et al. / Acta Tropica 84 (2002) 127�/136 131
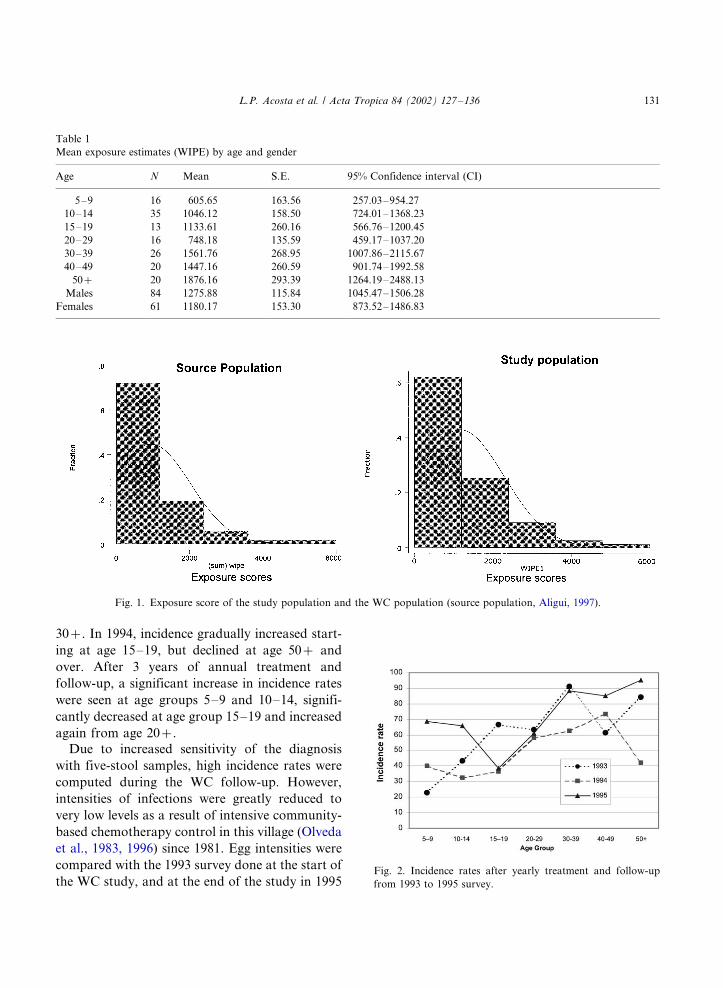
(Fig. 3). The graph shows similarity in mean egg
output across the different age groups, except for
age group 10�/14, where it appears to increase and
between age group 20 and 29, where it shows a
decrease in mean EPG after the 3-year treatment
follow-up. These results suggest that there is highannual reinfection occurring at the different age
groups across time, with highest reinfection in
adults 30 years and older. However, children in the
5�/14 years of age appear to have the greatest
change in reinfection rates from 1993 to 1995, with
the age group 10�/14 having the greatest increase
in mean EPG, while there is less reinfection among
age group 15�/19 from 1994 to 1995. Although,incidence of infection tends to increase with age,
majority of adults starting at age 20 and older have
Low (B/20 EPG) egg output intensities.
Infection intensity was also evaluated in relation
to exposure. An increasing trend in average EPG
as exposure increases were shown for the para-
sitology survey in 1993 and 1995 (data not shown).
Using the Spearman rank correlation analysis, asignificant association was computed between
exposure and EPG in 1995 (r�/0.2698, n�/144,
P�/0.0011). These data suggest that exposure
somehow determines infection intensity.
3.3. Immune classification of ‘resistance’ versus
‘susceptibility’
‘Resistance’ versus ‘susceptibility’ to reinfection
in this study was assumed for individuals based on
their exposure (computed WIPE value) and infec-
tion criteria as described in Section 2. Of the 155
individuals enrolled in this study, 13 individualswere not classified into either of the two groups,
and thus were classified as ‘indeterminate’ and
were not included in the analysis. These included
those who had: (a) no parasitology results and/or
no exposure records for the past 3 years and those;
(b) who were egg negative or had Low egg counts
(EPG) with minimal or no exposure.
There were 89 (62%) individuals classified as‘resistant’ and 55 (38%) classified as ‘susceptible’
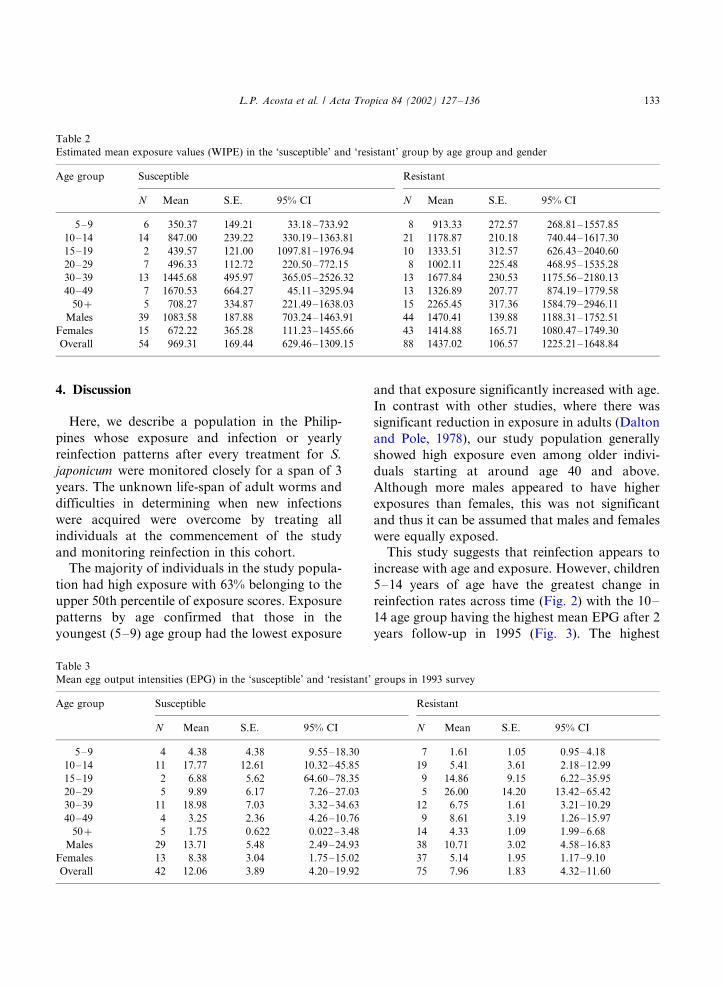
based on these criteria. Table 2 shows the average
exposure values of individuals classified either as
‘resistant’ or ‘susceptible’ across the different age
groups and gender. Generally, exposure of indivi-
duals classified as ‘susceptible’ included those with
moderate and or high exposure while most in the
‘resistant’ group have high exposure values. Aver-age infection intensities across the different age
groups and gender belonging in the ‘susceptible’
and ‘resistant’ groups are shown in Tables 3�/5.
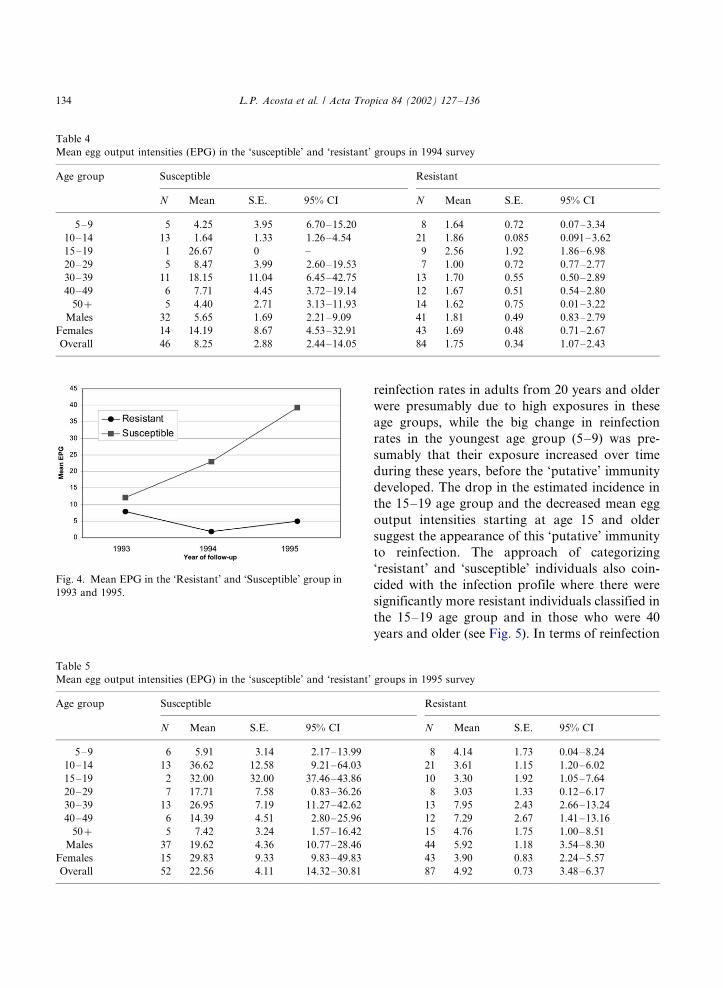
Mean EPG is relatively higher among ‘susceptible’
individuals than in the resistant group on the 2nd
year (1994) (Table 4) and on the 3rd year (1995)
(Table 5) of follow-up. Fig. 4 shows the overall
mean infection intensities in the ‘resistant’ and‘susceptible’ individuals during the 3 years follow-
up. The graph shows a marked increase in the
overall mean egg output in the susceptible group
from year 1 to 3 of follow up. Significant
differences between means in the ‘susceptible’
and ‘resistant’ groups were shown using the
ANOVA test (F�/1.98, df�/93, P B/0.05) com-
bining both the effect of immune classification andyear of follow-up.
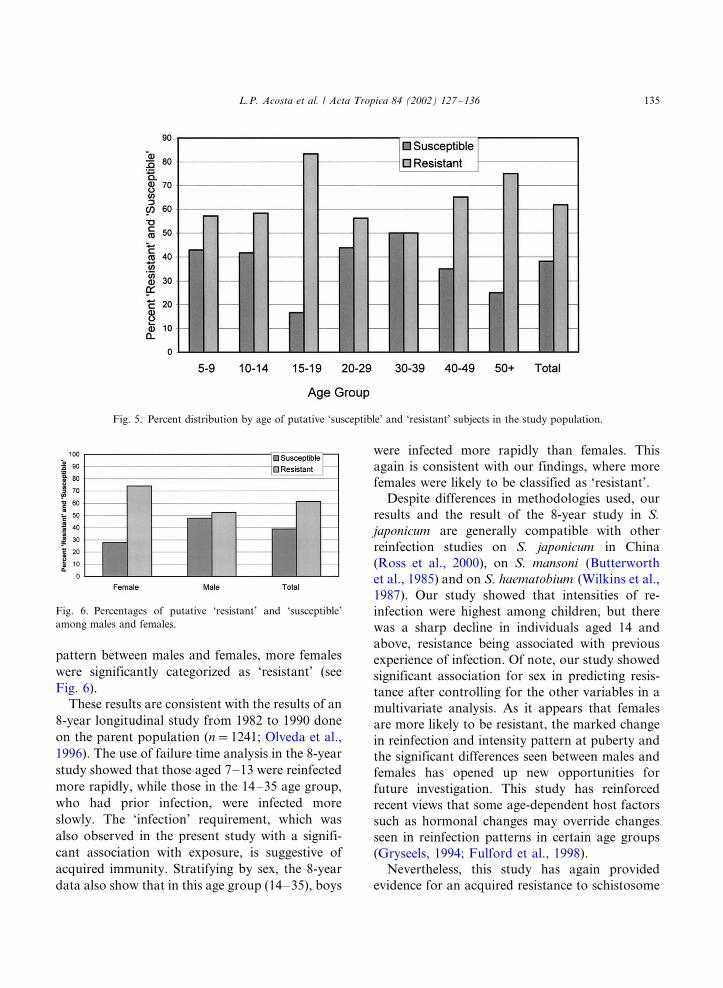
Distribution of observed percentages between
these categories by age and sex are shown in Figs.
5 and 6. There were significantly more individuals
in the 15�/19 age group and in the 40�/ age group
who were classified as ‘resistant’. More females
were likewise classified as ‘resistant’ (Fig. 6) (x2�/
6.84, P B/0009). Logistic regression analysis usedto predict the dichotomous classification of in-
dividuals into either ‘resistant’ or ‘susceptible’
(susceptible�/0/resistant�/1) controlling for the
effect of both age and sex (females�/0/males�/1),
indicated that females were likely to be more
‘resistant’ than males (OR�/0.38, n�/142, P B/
0.01).
Fig. 3. Mean EPG by age in 1993 and 1995.
L.P. Acosta et al. / Acta Tropica 84 (2002) 127�/136132
4. Discussion
Here, we describe a population in the Philip-
pines whose exposure and infection or yearly
reinfection patterns after every treatment for S.
japonicum were monitored closely for a span of 3
years. The unknown life-span of adult worms and
difficulties in determining when new infections
were acquired were overcome by treating all
individuals at the commencement of the study
and monitoring reinfection in this cohort.
The majority of individuals in the study popula-
tion had high exposure with 63% belonging to the
upper 50th percentile of exposure scores. Exposure
patterns by age confirmed that those in the
youngest (5�/9) age group had the lowest exposure
and that exposure significantly increased with age.
In contrast with other studies, where there was
significant reduction in exposure in adults (Dalton
and Pole, 1978), our study population generally
showed high exposure even among older indivi-
duals starting at around age 40 and above.
Although more males appeared to have higher
exposures than females, this was not significant
and thus it can be assumed that males and females
were equally exposed.This study suggests that reinfection appears to
increase with age and exposure. However, children
5�/14 years of age have the greatest change in
reinfection rates across time (Fig. 2) with the 10�/
14 age group having the highest mean EPG after 2
years follow-up in 1995 (Fig. 3). The highest
Table 2
Estimated mean exposure values (WIPE) in the ‘susceptible’ and ‘resistant’ group by age group and gender
Age group Susceptible Resistant
N Mean S.E. 95% CI N Mean S.E. 95% CI
5�/9 6 350.37 149.21 33.18�/733.92 8 913.33 272.57 268.81�/1557.85
10�/14 14 847.00 239.22 330.19�/1363.81 21 1178.87 210.18 740.44�/1617.30
15�/19 2 439.57 121.00 1097.81�/1976.94 10 1333.51 312.57 626.43�/2040.60
20�/29 7 496.33 112.72 220.50�/772.15 8 1002.11 225.48 468.95�/1535.28
30�/39 13 1445.68 495.97 365.05�/2526.32 13 1677.84 230.53 1175.56�/2180.13
40�/49 7 1670.53 664.27 45.11�/3295.94 13 1326.89 207.77 874.19�/1779.58
50�/ 5 708.27 334.87 221.49�/1638.03 15 2265.45 317.36 1584.79�/2946.11
Males 39 1083.58 187.88 703.24�/1463.91 44 1470.41 139.88 1188.31�/1752.51
Females 15 672.22 365.28 111.23�/1455.66 43 1414.88 165.71 1080.47�/1749.30
Overall 54 969.31 169.44 629.46�/1309.15 88 1437.02 106.57 1225.21�/1648.84
Table 3
Mean egg output intensities (EPG) in the ‘susceptible’ and ‘resistant’ groups in 1993 survey
Age group Susceptible Resistant
N Mean S.E. 95% CI N Mean S.E. 95% CI
5�/9 4 4.38 4.38 9.55�/18.30 7 1.61 1.05 0.95�/4.18
10�/14 11 17.77 12.61 10.32�/45.85 19 5.41 3.61 2.18�/12.99
15�/19 2 6.88 5.62 64.60�/78.35 9 14.86 9.15 6.22�/35.95
20�/29 5 9.89 6.17 7.26�/27.03 5 26.00 14.20 13.42�/65.42
30�/39 11 18.98 7.03 3.32�/34.63 12 6.75 1.61 3.21�/10.29
40�/49 4 3.25 2.36 4.26�/10.76 9 8.61 3.19 1.26�/15.97
50�/ 5 1.75 0.622 0.022�/3.48 14 4.33 1.09 1.99�/6.68
Males 29 13.71 5.48 2.49�/24.93 38 10.71 3.02 4.58�/16.83
Females 13 8.38 3.04 1.75�/15.02 37 5.14 1.95 1.17�/9.10
Overall 42 12.06 3.89 4.20�/19.92 75 7.96 1.83 4.32�/11.60
L.P. Acosta et al. / Acta Tropica 84 (2002) 127�/136 133
reinfection rates in adults from 20 years and older
were presumably due to high exposures in these
age groups, while the big change in reinfection
rates in the youngest age group (5�/9) was pre-
sumably that their exposure increased over time
during these years, before the ‘putative’ immunity
developed. The drop in the estimated incidence in
the 15�/19 age group and the decreased mean egg
output intensities starting at age 15 and older
suggest the appearance of this ‘putative’ immunity
to reinfection. The approach of categorizing
‘resistant’ and ‘susceptible’ individuals also coin-
cided with the infection profile where there were
significantly more resistant individuals classified in
the 15�/19 age group and in those who were 40
years and older (see Fig. 5). In terms of reinfection
Table 4
Mean egg output intensities (EPG) in the ‘susceptible’ and ‘resistant’ groups in 1994 survey
Age group Susceptible Resistant
N Mean S.E. 95% CI N Mean S.E. 95% CI
5�/9 5 4.25 3.95 6.70�/15.20 8 1.64 0.72 0.07�/3.34
10�/14 13 1.64 1.33 1.26�/4.54 21 1.86 0.085 0.091�/3.62
15�/19 1 26.67 0 �/ 9 2.56 1.92 1.86�/6.98
20�/29 5 8.47 3.99 2.60�/19.53 7 1.00 0.72 0.77�/2.77
30�/39 11 18.15 11.04 6.45�/42.75 13 1.70 0.55 0.50�/2.89
40�/49 6 7.71 4.45 3.72�/19.14 12 1.67 0.51 0.54�/2.80
50�/ 5 4.40 2.71 3.13�/11.93 14 1.62 0.75 0.01�/3.22
Males 32 5.65 1.69 2.21�/9.09 41 1.81 0.49 0.83�/2.79
Females 14 14.19 8.67 4.53�/32.91 43 1.69 0.48 0.71�/2.67
Overall 46 8.25 2.88 2.44�/14.05 84 1.75 0.34 1.07�/2.43
Table 5
Mean egg output intensities (EPG) in the ‘susceptible’ and ‘resistant’ groups in 1995 survey
Age group Susceptible Resistant
N Mean S.E. 95% CI N Mean S.E. 95% CI
5�/9 6 5.91 3.14 2.17�/13.99 8 4.14 1.73 0.04�/8.24
10�/14 13 36.62 12.58 9.21�/64.03 21 3.61 1.15 1.20�/6.02
15�/19 2 32.00 32.00 37.46�/43.86 10 3.30 1.92 1.05�/7.64
20�/29 7 17.71 7.58 0.83�/36.26 8 3.03 1.33 0.12�/6.17
30�/39 13 26.95 7.19 11.27�/42.62 13 7.95 2.43 2.66�/13.24
40�/49 6 14.39 4.51 2.80�/25.96 12 7.29 2.67 1.41�/13.16
50�/ 5 7.42 3.24 1.57�/16.42 15 4.76 1.75 1.00�/8.51
Males 37 19.62 4.36 10.77�/28.46 44 5.92 1.18 3.54�/8.30
Females 15 29.83 9.33 9.83�/49.83 43 3.90 0.83 2.24�/5.57
Overall 52 22.56 4.11 14.32�/30.81 87 4.92 0.73 3.48�/6.37
Fig. 4. Mean EPG in the ‘Resistant’ and ‘Susceptible’ group in
1993 and 1995.
L.P. Acosta et al. / Acta Tropica 84 (2002) 127�/136134
pattern between males and females, more females
were significantly categorized as ‘resistant’ (see
Fig. 6).
These results are consistent with the results of an
8-year longitudinal study from 1982 to 1990 done
on the parent population (n�/1241; Olveda et al.,
1996). The use of failure time analysis in the 8-year
study showed that those aged 7�/13 were reinfected
more rapidly, while those in the 14�/35 age group,
who had prior infection, were infected more
slowly. The ‘infection’ requirement, which was
also observed in the present study with a signifi-
cant association with exposure, is suggestive of
acquired immunity. Stratifying by sex, the 8-year
data also show that in this age group (14�/35), boys
were infected more rapidly than females. This
again is consistent with our findings, where more
females were likely to be classified as ‘resistant’.
Despite differences in methodologies used, our
results and the result of the 8-year study in S.
japonicum are generally compatible with other
reinfection studies on S. japonicum in China
(Ross et al., 2000), on S. mansoni (Butterworth
et al., 1985) and on S. haematobium (Wilkins et al.,
1987). Our study showed that intensities of re-
infection were highest among children, but there
was a sharp decline in individuals aged 14 and
above, resistance being associated with previous
experience of infection. Of note, our study showed
significant association for sex in predicting resis-
tance after controlling for the other variables in a
multivariate analysis. As it appears that females
are more likely to be resistant, the marked change
in reinfection and intensity pattern at puberty and
the significant differences seen between males and
females has opened up new opportunities for
future investigation. This study has reinforced
recent views that some age-dependent host factors
such as hormonal changes may override changes
seen in reinfection patterns in certain age groups
(Gryseels, 1994; Fulford et al., 1998).
Nevertheless, this study has again provided
evidence for an acquired resistance to schistosome
Fig. 5. Percent distribution by age of putative ‘susceptible’ and ‘resistant’ subjects in the study population.
Fig. 6. Percentages of putative ‘resistant’ and ‘susceptible’
among males and females.
L.P. Acosta et al. / Acta Tropica 84 (2002) 127�/136 135
reinfection indicating slow development of immu-nity not attributable to changes in exposure. The
same individuals in this study were bled and their
blood examined for antigen-specific cellular and
humoral responses described in the two separate
papers (Acosta et al., 2002a,b). These two papers
attempt to verify whether potential anti-S. japoni-
cum vaccine candidates show any indication of
protective immune effector function among indi-viduals who were classified as ‘resistant’ versus
‘susceptible’ in this study.
Acknowledgements
We would like to thank Dr Lilia Portillo (head
of the Schistosomiasis Research and TrainingDivision (SRTD) in Palo, Leyte), Roger Hambre
and Bienvenido Arbas for coordinating the field
activities in Macanip, Leyte for the 3-year WC
study. We also wish to thank Fe Pagado for
helping us in the community organization and
Dr Li Yuesheng for his expert comments on drafts
of the manuscript. This study received financial
support from the UNDP/World Bank/WHO Spe-cial Programme for Research and Training in
Tropical Diseases and the National Health and
Medical Research Council of Australia.
References
Acosta, L.P., Waine, G., Aligui, G.D.L., Tiu, W.U., Olveda,
R.M., McManus, D.P., 2002a. Immune correlate study on
human Schistosoma japonicum in a defined population in
Leyte, Philippines: II. Cellular immune responses to Schis-
tosoma japonicum recombinant and native antigens, Acta
Trop. 84, 137�/149.
Acosta, L.P., McManus, D.P., Aligui, G.D.L., Olveda, R.M.,
Tiu, W.U. 2002b. Immune correlate study on human
Schistosoma japonicum in a defined population in Leyte,
Philippines: III. Antigen-specific antibody responses to
Schistosoma japonicum recombinant and native antigens
(submitted for publication).
Aligui, G.D.L., 1997. Quantifying human Schistosoma japoni-
cum infection and exposure: errors in field diagnostics and
uncertainties in exposure estimates. Ph.D. thesis, Brown
University, RI, USA.
Aligui, G.D.L., Moor, V., McGarvey, S.T., Olds, G.R., Olveda,
R.M., 1997. A proposed exposure model specific for
Schistosoma japonicum . Am. J. Trop. Med. Hyg. 57
(supplement), 241.
Butterworth, A.E., Capron, M., Cordingley, J.S., Dalton, P.R.,
Dunne, D.W., Karinki, H.C., Kimani, G., Koech, D.,
Mugambi, M., Ouma, J.H., Prentice, M.A., Richardson,
B.A., Arap Siongok, T.K., Sturrock, R.F., Taylor, D.W.,
1985. Immunity after treatment of human schistosomiasis
mansoni: II. Identification of resistant individuals and
analysis of the immune responses. Trans. R. Soc. Trop.
Med. Hyg. 79, 393�/408.
Dalton, P.R., Pole, D., 1978. Water contact patterns in relation
to Schistosoma haematobium infection. Bull. WHO 56, 417�/
426.
Dunne, D.W., Butterworth, A.E., Fulford, A.J.C., Kariuki,
H.C., Langley, J.G., Ouma, J.H., Capron, A., Pierce, R.J.,
Sturrock, R.F., 1992. Immunity after treatment of human
schistosomiasis mansoni: association between IgE antibo-
dies to adult worm antigens and resistance to reinfection.
Eur. J. Immunol. 22, 1483�/1494.
Fulford, A.J.C., Webster, M., Ouma, J.H., Kimani, G., Dunne,
D.W., 1998. Puberty and age-related changes in suscept-
ibility to schistosome infection. Parasitol. Today 14, 23�/26.
Gryseels, B., 1994. Human resistance to Schistosoma infections:
age or experience. Parasitol. Today 10, 380�/384.
Kloetzel, K., Da Silva, J.R., 1967. Schistosomiasis mansoni
acquired in adulthood: acquired behavior of egg counts and
intradermal test. Am. J. Trop. Med. Hyg. 16, 167�/169.
Olveda, R.M., Tiu, E., Fevidal, P., De Veyra, F., Icatlo, F.C.,
Domingo, E.O., 1983. Relationship of prevalence and
intensity of infection to morbidity in schistosomiasis japo-
nica: a study of three communities in Leyte, Philippines.
Am. J. Trop. Med. Hyg. 32, 1312�/1321.
Olveda, R.M., Daniel, B., Ramirez, B.L., Aligui, G.D.L.,
Acosta, L.P., Fevidal, P., Tiu, E., De Veyra, F., Peters, P.,
Romulo, R., Domingo, E.O., Weist, P.M., Olds, G.R.,
1996. Schistosomiasis japonica in the Philippines: the long
term impact of population-based chemotherapy on infec-
tion, transmission and morbidity. J. Infect. Dis. 174, 163�/
172.
Pesigan, T.P., Farooq, M., Hairston, N.G., Jauregui, J.J.,
Garcia, E.G., Santos, A.T., Santos, B.C., Besa, A.A.,
1958. Studies on Schistosoma japonicum infection in the
Philippines. The molluscan host. Bull. WHO 18, 481�/578.
Ross, A.G.P., Sleigh, A.C., Li, Y.S., Williams, G.M., Aligui,
G.dL., McManus, D.P., 2000. Is there immunity to
Schistosoma japonicum . Parasitol. Today 16, 159�/164.
Sturrock, R.F., Kimani, R., Cotrell, B.J., Butterworth, A.E.,
Seitz, H.M., Siongok, T.K., Houba, V., 1983. Observations
on possible immunity to reinfection among Kenyan school-
children after treatment for Schistosoma mansoni . Trans. R.
Soc.Trop. Med. Hyg. 77, 363�/371.
Wilkins, H., Blumenthal, U., Hagan, P., Hayes, R., Tullock, S.,
1987. Resistance to reinfection after treatment of urinary
schistosomiasis. Trans. R. Soc. Trop. Med. Hyg. 81, 29�/35.
L.P. Acosta et al. / Acta Tropica 84 (2002) 127�/136136
Related Documents