IMMIGRATION TO RUSSIA: WHY IT IS INEVITABLE, AND HOW LARGE IT MAY HAVE TO BE TO PROVIDE THE WORKFORCE RUSSIA NEEDS An NCEEER Working Paper by Grigory Ioffe Radford University and Zhanna Zayonchkovskaya Institute for Economic Forecasting, Russian Academy of Sciences The National Council for Eurasian and East European Research University of Washington Box 353650 Seattle, WA 98195 [email protected] http://www.nceeer.org/ TITLE VIII PROGRAM

Welcome message from author
This document is posted to help you gain knowledge. Please leave a comment to let me know what you think about it! Share it to your friends and learn new things together.
Transcript

IMMIGRATION TO RUSSIA:
WHY IT IS INEVITABLE, AND HOW LARGE IT MAY HAVE TO
BE TO PROVIDE THE WORKFORCE RUSSIA NEEDS
An NCEEER Working Paper by
Grigory Ioffe Radford University
and Zhanna Zayonchkovskaya
Institute for Economic Forecasting, Russian Academy of Sciences
The National Council for Eurasian and East European Research University of Washington Box 353650 Seattle, WA 98195 [email protected] http://www.nceeer.org/
TITLE VIII PROGRAM

Project Information* Principal Investigator: Grigory Ioffe NCEEER Contract Number: 824-05g
Date: January 21, 2010 Copyright Information Individual researchers retain the copyright on their work products derived from research funded through a contract or grant from the National Council for Eurasian and East European Research (NCEEER). However, the NCEEER and the United States Government have the right to duplicate and disseminate, in written and electronic form, reports submitted to NCEEER to fulfill Contract or Grant Agreements either (a) for NCEEER’s own internal use, or (b) for use by the United States Government, and as follows: (1) for further dissemination to domestic, international, and foreign governments, entities and/or individuals to serve official United States Government purposes or (2) for dissemination in accordance with the Freedom of Information Act or other law or policy of the United States Government granting the public access to documents held by the United States Government. Neither NCEEER nor the United States Government nor any recipient of this Report may use it for commercial sale.
* The work leading to this report was supported in part by contract or grant funds provided by the National Council for Eurasian and East European Research, funds which were made available by the U.S. Department of State under Title VIII (The Soviet-East European Research and Training Act of 1983, as amended). The analysis and interpretations contained herein are those of the author.

Executive Summary
Between 1992 and 2008, Russia’s population shrank by 6.6 million people, a result of
deaths exceeding births by 12.6 million and immigration exceeding emigration by 6.0 million.
Having reached a peak of almost 1 million people in 1994, net immigration subsided to 119,000
in 2004, but “negative natural increase” continued and is not likely to be reversed any time soon.
Since the early nineties, many social scientists and journalists have commented on different
aspects of Russia’s demographic situation. Of recent analyses, the most informative are by
Murray Feshbach (2008) and Timothy Heleniak (2009).
This paper addresses four questions: What causes and sustains the demand for
immigration to Russia? What are the legal, illegal, and semi-legal segments of current
immigration? What are the possible scenarios of immigration to Russia until 2026, the year for
which the Russian Federal Bureau of Statistics (Rosstat) is currently making its own projections?
What is the likely interplay of immigration and domestic migration, and what is the likely
distribution of domestic and international migrants between Russia’s Federal Districts (Okrugs)
in 2026?
Introduction
Between 1992 and 2008, Russia’s population shrank by 6.6 million people, a result of
deaths exceeding births by 12.6 million and immigration exceeding emigration by 6.0 million.
Having reached a peak of almost 1 million people in 1994, net immigration subsided to 119,000
in 2004, but “negative natural increase”1 continued and is not likely to be reversed any time
soon. Since the early nineties, many social scientists and journalists have commented on
different aspects of Russia’s demographic situation. Of recent analyses, the most informative are
by Murray Feshbach (2008) and Timothy Heleniak (2009).
While Feshbach’s major emphasis is Russia’s health crisis, he also weighed in on the
poor prospects of an upswing in births in Russia; the number of females aged 20 to 29 will peak
at about 13 million around 2012-2013 and then plummet to some 7 or 8 million in the next
decade. Anatoly Vishnevsky, a leading Russian demographer, echoed Feshbach’s observation in
a recent interview (Vishnevsky 2009). According to Vishnevsky, “when population is not
growing it is losing drive” (Ibid.).
In addition to examining Russia’s exceedingly low birth rate, Heleniak’s survey of
Russia’s demographic situation reviews and commends Russia’s package of pro-natalist policies,
in place since 2007, calls attention to the exceptionally high mortality of working-age men and to
the fact that Russia already has the world’s second-largest stock of international migrants
(mostly from the post-Soviet countries). Also, Heleniak reviews the evolution of Russia’s post-
Soviet immigration policy, invokes the UN 2001 projections of immigration to Russia required
1 Population specialists in English-speaking countries do not seem to like the phrase “natural decrease” and prefer “negative natural increase.” It is different in Russia, where the phrases yestestvennyi prirost and yestestvennaya ubyl are deemed equally legitimate.
IMMIGRATION TO RUSSIA 1

to compensate for the upcoming decline of its working-age population2 (WAP), and
characterizes the reversal of centuries-old domestic migrations to the far north and east.
Taking Heleniak’s survey as a point of departure, this paper addresses four questions:
What causes and sustains the demand for immigration to Russia? What are the legal, illegal, and
semi-legal segments of current immigration? What are the possible scenarios of immigration to
Russia until 2026, the year for which the Russian Federal Bureau of Statistics (Rosstat) is
currently making its own projections? What is the likely interplay of immigration and domestic
migration, and what is the likely distribution of domestic and international migrants between
Russia’s Federal Districts (Okrugs) in 2026?
Why Does Russia Need Immigrants3?
So far, a single turning point in the dynamics of Russia’s population has been publicized:
in 1992, it began to decline. From 1992 to 2008, immigration compensated for a little less than
half (47.7%) of the excess of deaths over births. Indeed, in the 1990s, Russia received an
unprecedented influx of 4.5 million migrants from the former Soviet republics (Figure 1). The
inflows during both the following (2000–2008) and the preceding (1980s) periods were much
smaller–1.5 million and 1.9 million, respectively. Most analysts do not think that Russia’s
depopulation will end before the middle of the 21st century, although one of Rosstat’s scenarios–
the one referred to as high in Table 1 and matching the official demographic policy document–
does postulate the earlier reversal in population dynamics. However, Russian demographers
consider this scenario overly optimistic (Russia Facing 2009), mostly because of its excessive
assumption about rising fertility (Table 1).
2 In Russia, the working-age population consists of men aged 16 to 60 and women aged 16 to 55.
IMMIGRATION TO RUSSIA 2

In 2007, Russia’s population change reached a second turning point not quite publicized
yet. Prior to 2007, Russia’s WAP continued to grow as the balance between those entering the
working age group and those exiting it remained positive. In 2007, retirements and premature
deaths were–for the first time ever–not compensated for by people entering the WAP–a delayed
effect of the consistently low birth rate. While in 2007, the net decline of working age Russians
amounted to just 300,000, it was twice as big in 2008; and from 2011 to 2017, the WAP decline
will exceed 1 million per year (Figure 2).
Between 2009 and 2026, Russia’s WAP will shrink by 17 million, which is 24% of
Russia’s overall employment in 2009. This contraction lends itself to more accurate prediction
than the total population’s decline, for the simple reason that almost all of those who will enter
the WAP group by 2026 have been already born. This adds certainty to the prediction of a drastic
decline in the WAP and makes labor the most deficient production factor in Russia.
The prospect of growing immigrant communities is not yet fully accepted by the Russian
public or even by the political class. For example, activists from Russia’s national-patriotic
ideological camp maintain that there is no objective need for immigration; rather, it is insinuated
that “a well-paid campaign” (Krupnov 2005) and ploys of foreign institutions and foundations
are bent on selling Russians “a demographic policy which is contrary to our interests”
(Beloborodov 2005). A 2006 national survey revealed that only 4% of Russians see immigration
as the way to solve Russia’s demographic problem (Rossiyane 2006). According to Sergei
Mironov, the Chair of Russia’s Council of the Federation, “it is quite possible to make sure that
not 100 but 250 million people will live in Russia in 2050,” but recruitment of a foreign labor
force can be considered only “as an extraordinary and short-term measure” (Mironov 2005). Is
3 In this text, the notion of “immigrants” applies to international migrants only but not to incoming domestic migrants.
IMMIGRATION TO RUSSIA 3

that really so?
Even a cursory glance at the Russia-without-immigrants scenario makes one doubt its
plausibility. In 2003, when the WAP was still growing, the labor deficit was recorded at 42% of
Russia’s production units (Gimpelson 2004), and in the Moscow subway one could come across
a billboard beginning with the sentence, “We have a lot of money but no people.” So far, not a
single country has demonstrated steady economic growth under a shrinking labor force.
For that reason, one might watch Japan, where population decline commenced in 2005
but immigration policy continues to be highly restrictive. Whether or not Japan eventually opens
its labor market, that may not necessarily give a cue to Russia, where labor productivity is much
lower than in Japan. Even the overly optimistic assumption of a 7.2% annual growth in Russia’s
labor productivity was shown to produce a GDP decline totaling 10 trillion rubles by 2020, if the
deficit of labor is not compensated by immigration (Arkhangelsky et al. 2005).
One has to also take into account that technological advances usually allow for the
release of labor from production, particularly from industry, whose share in Russia’s workforce
has been declining anyway–in 2008 it amounted to just 16.8% of the total (Rossiya v Tsifrakh,
2009: 98). In contrast, services tend to expand, and gains in service-sector jobs more than offset
losses of jobs in industry and agriculture. This has been the case in the West, and Russia seems
to follow suit. For example, from 2004 to 2007, the overall employment in Russia increased by
1,612,000 people, employment in agriculture declined by 505,000 people and in manufacturing
by 419,000 people. During the same period, employment in retail increased by 870,000 people
and in other services by 1,216,000 people. The number of people engaged in construction also
rose–by 531,000 people (Rossiisky Statistichesky 2008: 138). Thus, the gain in service-and-
construction sector employment was more than twice as large as the loss of industrial and
IMMIGRATION TO RUSSIA 4

agricultural jobs (Rossiisky Statistichesky 2008).
Some participants of the debate over Russia’s demographic situation present its core
subject as a zero-sum game–boosting fertility or boosting immigration. Clearly, Russia could
benefit from rising fertility, but there has been no policy-induced reversal of a downward trend in
fertility anywhere in the world. (Post-war baby booms may be called qualified exceptions.) Even
if bonuses meted out since 2007 by the Russian government for second and additional children
ultimately prove to be fertility boosters, a couple of decades will pass until the more numerous
newborns reach working age.
Consequently, the idea that Russia’s bright economic future may not be achievable
without attracting a large number of immigrants is sinking in, as evidenced in the 2006
amendments to the 2002 immigration law (enacted on 01/15/2007), which simplified registration
requirements for foreigners, wrested registration away from the jurisdiction of endemically
corrupt Russian police, and made it easier to obtain employment authorization.
Categories of Immigrants in Today’s Russia
Following a surge in the first half of the 1990s, recorded immigration to Russia quickly
receded. After the 2004 nadir of 119,200 immigrants, their number rose again, to 297,200 in
2008. To be sure, to a large extent this rise was conditioned by a change in the recording of
migration. Since 2007, along with immigrants arriving in Russia for permanent residency,
temporary immigrants with at least one year of stay in Russia have been included in the
incoming immigration statistics. However, selective surveys and personal observations suggest
that the actual number of immigrants in Russia exceeds the recorded total by a huge margin.
IMMIGRATION TO RUSSIA 5

Any approximation of the actual number of immigrants, including that reflected by
Figure 3, is open to debate. Aside from roughly 300,000 recorded migrants per annum who
arrive for permanent residency in Russia, there are about 600,000 business migrants, determined
as the incoming minus outgoing foreigners with business visas (596,000 in 2006; 604,000 in
2007; and 635,000 in 2008–according to annual data books Chislennost 2006–2009).
The incoming and outgoing flows of foreigners pursuing other goals (those with tourist
and homestay visas) are mutually balanced. Labor migrants–foreigners who register their stay in
Russia and get employment authorization–form another recorded component. Following the
liberalization of the migration law, this component rose from 1.0 million in 2006 to 1.7 million
in 2007 and to 2.4 million in 2008. Several surveys have shown that whereas prior to 2007 legal
labor migrants accounted for 10-15% of the total number of foreign labor migrants in Russia,
after the new migration law was adopted their number increased to 15-25% (Vitkovskaya et al,
2009).
This means that the illegal component is still very large, primarily because most
employers reject employees’ requests to formalize their hire. According to the joint report of the
International Organization for Migration, OSCE, and Russia’s Federal Migration Service, the
new law significantly boosted the share of immigrants registering their stay in Russia (to 75%),
but the share of legitimate labor immigration does not exceed 30% of the total (Ibid.). In other
words, for the most part immigrants come to Russia and stay legally but the vast majority of
them continue to work illegally. If the above-mentioned share (about 30%) is correct, then the
overall stock of labor immigrants in Russia is somewhere between six and seven million people,
which is 8-10% of Russia’s entire employment.
IMMIGRATION TO RUSSIA 6

Because some non-working dependents live with labor immigrants, the overall number of
immigrants is between seven and eight million people. This estimate is fairly conservative, for
two reasons. First, the selective surveys on which it is based never extend to all the shadow
employers in the area covered by those surveys. Second, the estimate does not include migrants
working as household aid; if they do not work for an agency and are attached to one household,
they are not supposed to obtain an employment authorization card. Such people probably number
in the hundreds of thousands in Moscow alone. According to available surveys, roughly 70% of
labor migrants are men; according to an unpublished statistic obtained from the Federal
Migration Service, the share of men is even higher–84%. The same source assigns 40% of labor
migrants to construction, 7% to industry, 7% to agriculture, 20% to retail, and the rest to other
services (Zayonchkovskaya, Mkrtychyan, and Tyuryukanova 2009: 34).
Figure 3 allows for several intermediary conclusions. First, in Russia, the recorded
immigration is but a small component of the overall immigration. Second, there is high demand
for foreign labor. Third, the fact that most immigrants work illegally and some stay illegally
underscores the shortcomings of Russia’s immigration policy (if there is any true policy). After
2007, the application of the law is at more fault than the law itself. As a result, recorded
immigration can hardly be considered a reliable basis for prediction. Fourth, Russia is able to
attract the needed number of immigrants. That the application of immigration law is flawed
likely affects the quality of immigrants and the share of legal immigrants in the overall inflow
more than the size of the inflow per se. Finally, to some extent the demand for labor can be
satisfied through labor migration.
IMMIGRATION TO RUSSIA 7

Immigration and Domestic Migration
Predicting future immigration, especially its spatial distribution, is hardly possible
without taking domestic migration into account. In a vast country whose “demographic blanket”
is getting thinner and thinner, domestic migration is often the major predictor of success in
regional development. It is no accident that resettlement has been assigned great significance in
Russia regardless of political order.
After the breakup of the Soviet Union, domestic migration in Russia fell by more than
half. Whereas in 1989, 3.3% of Russia’s population moved from one census-designated place to
another, in 2007, only 1.4% did, a throwback to the horizontal mobility in Russia prior to World
War I (Zayonchkovskaya and Nozdrina 2008: 48). This decline is a function of several factors,
the most important of which is arguably a sweeping change in residence acquisition practices
after the breakup of the Soviet Union.
Throughout the last three Soviet decades, a Soviet citizen could count on either obtaining
a free apartment from the state or receiving a no-interest state loan to obtain a cooperative
apartment. In that latter case, most salaried people would be able to afford a monthly payment,
and quite a few could afford a down payment. Now, one has to buy a dwelling in a housing
market where prices are out of proportion with regular family income, and a mortgage, if
available, comes with at least 14% annual interest.
This change has imposed a drastic limitation on the possibility of moving permanently,
and at the same time has led to replacement of (permanent) migration by circulation or
temporary labor migration. Based on extrapolation of survey results in seven cities of Russia
(Zayonchkovskaya and Mkrtychyan 2007), our estimate of temporary labor migration in 2002
was approximately three million people per year; by 2008, this number may have increased
IMMIGRATION TO RUSSIA 8

slightly. If one adds this flow to that involved in domestic migration (i.e., that associated with
change in permanent place of residency), the resulting sum would roughly amount to Russia’s
domestic migration on the eve of the breakup of the Soviet Union.
Just like immigration, domestic migration is not fully recorded. Because freedom of
movement is guaranteed by the Russian Constitution and a special 1993 law, “On Freedom of
Movement and Choice of Place of Stay and Residence in the Russian Federation,” Russian
citizens often neglect to declare a change in their place of residency, especially when they move
into rented accommodations. Consequently, Russia’s rate of domestic migration may not be as
low as reflected by the official statistics. We hypothesize that by 2026 the rate of domestic
migration will rise to the 1989 level from which the downward trend started. The increase in
domestic migration will be conditioned by rapid expansion of employment opportunities due to
shrinkage of the WAP, but a steeper increase would require more affordable housing in the
regions of inflow, an unlikely situation.
Domestic migration has two stable and interrelated trends: western drift and centripetal
character. For the most part net migration from most civil subdivisions is directed to subdivisions
located farther west, but the role played by Moscow (and its urban agglomeration) in the spatial
redistribution of Russia’s population has become overpowering. To be sure, the capital city
region has attracted domestic migrants for decades, but European Russia’s south (particularly
Krasnodar and Stavropol regions) once exerted an equally powerful pull, at least until the late
1980s. Moreover, Russia’s regional capitals attracted up to half of the migrants from each
region’s periphery.
Now, instead of relocating to regional capitals or to Russia’s south, migrants tend to head
straight to Moscow or its environs. In all likelihood, the Moscow region will be the only area in
IMMIGRATION TO RUSSIA 9

all of Russia that will be able to meet its demand for labor through domestic migration. However,
other Russian regions might meet their labor demand through external migration, since in this
area the Moscow region is not as dominant as in domestic flows.4
Because the Russian capital is located in the western part of the country, the role of
Moscow can be construed as integral to the western drift. For about four centuries, Russians
migrated to Siberia. The first sign of reversal in that movement appeared as early as the 1960s. In
the first half of the 1960s, the natural increase of the Soviet Union’s population had fallen by half
(from its 1950s level). The government responded by reducing mandatory army service from
three to two years, eliminating the 11th grade in secondary schools, expanding evening curricula
in the institutions of higher learning at the expense of daytime curricula, cutting back on
supplemental personnel (like janitors and guards), and imposing draconian limitations on
household farming operations.
Despite all these measures, however, the outflow of urbanites from southern parts of
Siberia and Far East exceeded the inflow. Since that time, migration to the east has been related
to the dynamics of the WAP within the entire country. When the WAP slowed its growth, more
employment opportunities arose in the most attractive regions, and correspondingly more
migrants relocated from east to west. But when the WAP growth accelerated, more people
relocated in the opposite direction. In the 1970s, domestic migration assumed the direction (from
west to east) that the Soviet state actually wanted.
Though attributed to the Communist Party’s wisdom, this movement was in fact due to a
demographic wave resulting from the coming of age of a large generation born in the 1950s. In
4 For example, from 2001 to 2005, out of 264,300 recorded migrants in Moscow, 232,800 (88.1%) were domestic migrants. By comparison, out of 18,300 recorded 2001-05 migrants in the Stavropol region, 11,300 (61.7%) were migrants from the “near abroad” (Zayonchkovskaya 2008).
IMMIGRATION TO RUSSIA 10
the 1980s, the flow reversed again, although this time it was more than offset by the growth in
military contingents in Russia’s Far East. It appears that when labor is deficient, the population
gains additional freedom of movement and relocates to the preferred regions, i.e., those with
more favorable climate and living conditions. But when the supply of labor exceeds demand,
people relocate to regions that still offer jobs, which in Russia means Siberia and the Far East.
After the breakup of the Soviet Union, the western drift and the centripetal character of domestic
migration were reinforced, and the demographic situation in the years to come will strengthen
these trends.
One often hears that the most labor-deficient Russian region is the Far East. This belief is
rooted in the notion that although the colonization of Siberia and the Far East lasted for four
centuries, no equitable population distribution has been achieved, and the farther from the center,
the thinner the “demographic blanket.” But contrasts in population density are not always the
most reliable indicator of labor deficiency. One can claim that in the regions of old colonization,
particularly in the Central Federal District (CFD), the demographic situation is more dire than in
the Far East.
For example, in the CFD, the rate of natural increase is more negative than in the Far East
(minus 5.8 people per 1000 versus 1.0 people per 1,000 in 2008), and the share of people of
retirement age is higher (23.9% versus 17.1%). In the CFD, population decline in the absence of
migration is going to be steeper than elsewhere. Even more significant is the fact that in the
CFD, the WAP will–in the absence of migration–decline by 27.0% (from 2008 to 2026), whereas
in Russia as a whole it will decline by 20.4%. Figure 4 disaggregates the WAP decline into
regions and shows that the regions of old colonization, particularly the CFD (without its south)
as well as Leningrad, Pskov, and Novgorod regions (of the Northwest) are going to suffer the
IMMIGRATION TO RUSSIA 11

steepest decline in WAP.
The CFD is the country’s most developed area, and it competes with the Far East and
other federal districts for labor. The CFD is much like a powerful demographic pump that since
the late 1960s has needed a steady inflow of migrants in order to make up for its steep decline in
WAP. Before that, the CFD was a migration donor, sending migrants to all other regions within
the Russian/Soviet polity for several centuries.
But by the mid-1960s, its pool of labor had been exhausted, and so the CFD became a
migration magnet whose attraction has been directly proportional to its WAP dynamics. In fact,
two of Russia’s federal districts are polar opposites–the CFD draws people from all the other
districts, and the Far East sends people to all the other districts. Each district to the west of the
Far East loses migrants in favor of still more western districts and gets partial compensation
through migration from the east.
The Far East sustained the heaviest loss in domestic migration–753,000 during the inter-
census period from 1989 to 2002. Roughly one-third of these people left the Far East for the
CFD, 22% for the Southern district, 15% for the Volga District, and 15% for the Siberia District.
The latter, however, managed to compensate for 30% of its loss through outmigration from the
Far East, while the Urals District compensated for half of its own outflow by inflow from Siberia
and the Far East.
Curiously, CFD’s gain in domestic migrations between the two censuses (1989 and
2002)–787,000 people–was almost exactly equal to the Far East’s loss–that is, the polar opposite
positions of these districts in domestic migration find numerical confirmation. Having
contributed 28% of CFD’s migration gain, the Far East was the CFD’s greatest donor. Just
because the most economically developed and attractive federal district of Russia competes for
IMMIGRATION TO RUSSIA 12

labor with the Far East and other districts, it is unrealistic to count on the resumption of the
eastern drift in Russia’s domestic migration.
More recent trends reflected by Table 4 reveal that besides the CFD, in 2007-2008 net
gains in domestic migration were recorded only in the Northwest. But almost half of the
Northwest’s migration gains were “forwarded” to the CFD, and the magnetisms of these two
migration gainers are not comparable. All other federal districts registered net losses.
Figuratively speaking, nowadays Siberia begins at the Volga River. The CFD absorbed
almost all migrants from the South, 70% of migrants from the Volga and Urals, and more than
40% of migrants from Siberia and Far East. Siberia, the Far East, and the Volga Districts became
the major migration donors of western Russia in general, but most especially of the CFD. In
addition, Siberia and the Far East compensated for 12% of the migration losses of the Volga
District and 40% of those of the Urals. But Siberia received very little inflow from the Far East.
The western drift in domestic migration has been characteristic for the entire post-Soviet period
(Table 5), and the deepening deficit of the WAP does not leave any hope for the reversal of this
trend in the foreseeable future.
In most cases, losses from domestic migration were compensated by inflow from the
countries of the CIS. But as immigration from the CIS declined, the attractiveness of the CFD
grew. Between 1989 and 2002, the CFD accounted for 60% of positive net migration (both
domestic and international); from 2001 to 2008 it absorbed practically the entire population
redistribution between the federal districts of Russia and over half of immigrants. In the overall
inflow into the CFD, domestic migration exceeds immigration. The share of the domestic
component in the overall net migration to the CFD was particularly high from 2001 to 2006
(Figure 5) but continued to be significant thereafter. Although the net inflow into the CFD had
IMMIGRATION TO RUSSIA 13
declined since 1994, it has been on the rise again since 2001 (Figure 5), but in every other federal
district it oscillates around zero (Figure 6).
Almost all the domestic inflow into the CFD–and since the mid-1990s, almost all the
incoming immigrants–has been absorbed by Moscow and Moscow Oblast. Thus, migration
within Russia has become overwhelmingly centripetal. In 2008, out of 80 Russia’s regions, 47
had positive net migration. If one adds up these 47 region-specific increments, the share of
Moscow and Moscow Oblast is 37.4% of the total. The 2007 statistic was close: 36.1%.
Prior to the above-mentioned change in recording rules, the centripetal character of
migration was even more striking. Thus, in 2006, positive net migration was recorded in 32
regions, and Moscow and its oblast accounted for 46.5% of the total. The same took place in
2004 and 2005. Some weakening of Moscow’s magnetism in 2007 and 2008, as well as the
broadening of the set of regions with positive net migration, probably reflects the fact that in the
Moscow region it is more difficult than elsewhere in Russia to obtain permanent residency.
A complementary perspective on centripetal growth is provided by Figure 7, which
shows that since 1999, net migration to Moscow has been commensurate to net migration to
Russia as a whole. It is almost as if Moscow is a state of its own. Indeed, it is now perceived all
across Russia as the “inner abroad”–not only because it is so expensive to live in Moscow
(unless you are in possession of a living space in that city) but also because for many Russians
and people from the “near abroad” (i.e., from the CIS) migration to Moscow is an alternative to
migration to the “distant abroad,” that is, to countries outside the former Soviet Union.
While the centrality of Moscow in Russia may seem like common knowledge, its pivotal
role in the national migration system may not be fully recognized. If it were, the well-publicized
intent of the Moscow city government to cut back on the recruitment of foreigners and replace
IMMIGRATION TO RUSSIA 14
them with domestic migrants (Inorodnoye, 2007) would be seen as destructive for Russia as a
whole. Moscow and its oblast already absorb from one-third to one-half of all domestic
migrants; the area is rapidly converting Moscow’s hinterland, now stretching to the Volga River,
into a kind of a social desert. Consequently, the interests of Russia as a whole would be best
served if, contrary to the Moscow city government’s attitude, the city and oblast relied heavily
on foreign, not domestic labor.
Even St. Petersburg, Russia’s second largest city, is no competitor to Moscow. In 2008,
together with the Leningrad Oblast, St. Petersburg absorbed 12.8% of the positive net migration
of Russia’s regions. Though Russia’s northern capital attracts migrants from all over the country,
only from the regions of the European north and the neighboring Pskov, Novgorod, and Karelia
regions does St. Petersburg attract more migrants than Moscow. In 2008, the combined share of
the two capital regions–Moscow, St. Petersburg, and their respective oblasts–in positive net
migration of Russia’s regions was 51%, but it was close to two-thirds in 2006 when the old
migration recording rules were still being used.
If one extrapolates from current trends, no federal district but the CFD will be able to be
replenished by migrants. Just to make up for the upcoming WAP shrinkage in that district, it will
have to receive six million migrants before 2026. To accomplish this, one would have to
mobilize the migration potential of the entire country. Under such conditions, Siberia and the Far
East will remain migration donors of the CFD. This will remain so even assuming that
immigration will rise to almost 400,000 per year by 2021-2025 as per the median Rosstat
scenario (Table 3). This scenario implies population decline in every federal district, particularly
in Siberia and Far East. But even then, only 85% of the decline in the WAP in the CFD will be
compensated for, and retirees will account for 30% of its population.
IMMIGRATION TO RUSSIA 15
Predicting Russia’s Migration until 2026: Three Scenarios
Our projections of net migration (domestic and international) by federal district are not
derived from a statistical model; rather, they are based on six assumptions that follow from the
previous discussion. First, we assume that immigration is the only way to compensate for the
upcoming deficit in the WAP. Second, we assume that the CFD will continue to absorb at least
half of all international migrants to Russia. In fact, the CFD’s share in net international
migration (immigration) will rise to almost two-thirds if the overall number of immigrants
coming to Russia does not increase significantly; the share in question will only decline slightly
if the overall number of immigrants shoots up.
Third, we assume that the shares of other federal districts in the number of immigrants to
Russia will not undergo significant change. Although an increase or decrease in the share of the
CFD cannot but alter the shares of the rest, the ranking order of the remaining six districts’
shares (in total net international migration) will stay the same as today: the South, the Volga, the
Urals, the Northwest, Siberia, and the Far East. Fourth, we assume that the western drift and
centripetal character of domestic migration will continue. Fifth, any increase in the number of
immigrants coming to the CFD will result in a commensurate decrease in the number of
domestic migrants to the Federal District. So while the western drift and centripetal character of
domestic migration will continue, they may be weakened by the rise in immigration. Finally,
while we believe that domestic migration will increase from its current low level (1.4% of the
population) to its 1989 level (3.3% of the population), this does not necessarily apply to net
migration between federal districts. In other words, if immigration rises, fewer domestic
migrants will move between federal districts, which is a focus of our projections, but more
domestic migrants will move within federal districts.
IMMIGRATION TO RUSSIA 16

While all three scenarios reflected by Table 6 are based on these assumptions, the key
difference between them (the one that triggers all other differences) is the amount of net
international migration to Russia. The low scenario results from the extrapolation of current
migration trends and ensures 15% compensation for the upcoming WAP decline in Russia as a
whole. According to this scenario, net migration to the CFD will increase from 180,000 per
annum in 2007-2008 to 250,000 per annum from 2009 to 2026. Under this scenario, all the
(inter-district) domestic migrants and two-thirds of immigrants will relocate to the CFD. The
total net migration to this district will amount to 4.7 million people over the entire period,
including almost 2.3 million immigrants.
Even so, only half of the upcoming WAP decline in the CFD will be offset through
migration. These outcomes will result from the CFD’s share in Russia’s net immigration rising
from 48% in 2007-10 to 61% over the period from 2011 to 2026, and from the CFD receiving
domestic migrants from all other regions of Russia. Net migration will be positive in the
Northwest (due to St. Petersburg and Leningrad Oblast), the South (due to Krasnodarsky Krai),
and the Volga (due to Tatarstan and Samara Oblast) Districts. Whereas the migration-induced
growth in the CFD will be achieved through almost equal contributions from domestic migration
and immigration (2.4 million people and 2.3 million people, respectively), in all other districts
growth is possible only through immigration because the retention of a huge deficit in the WAP
in the CFD means that no weakening of centripetal shifts in Russia’s population can be expected.
The major region of outflow will be Siberia–a peculiar replay of the 1960s situation. The
outflow from the Far East will probably lessen because its migration potential will be all but
exhausted. Immigration will only partially offset Siberian and Far Eastern losses through
domestic migration, and those losses will amount to 1.5 million people from 2007 to 2026. The
IMMIGRATION TO RUSSIA 17
low scenario is catastrophic for Russia because in addition to low compensation for the WAP
decline through immigration, the population of all federal districts will decline due to negative
natural increase. Even the most attractive federal district, the CFD, will experience an acute
deficit of labor.
From this perspective, the high scenario is much more favorable for Russia. According to
it, Russia will receive a total of 12.9 million immigrants by the end of 2025, which will
compensate for half of the nationwide WAP decline (A reminder: working-age immigrants
account for 70% of the total number of immigrants) and 90% of the WAP decline in the CFD.
Under this scenario, we envisage the lowering of the CFD’s share in immigration from 58% (low
scenario) to 52%. As a result of high-level compensation for the WAP decline in the CFD, many
more immigrants will relocate to districts other than the CFD, and the CFD’s pull on domestic
migrants will decrease by half.
Our high scenario distinguishes potential regions of exodus. For example, in two federal
districts–the South and the Volga–rural populations are still numerous; consequently, the outflow
from these regions will decline only by 25-30% (compared with the low scenario). In contrast, in
the Urals, where the rural and small-town population is almost exhausted by previous migration
and where Russia’s largest oil and gas reserves are located, the out-migration will lessen more
significantly. The mitigating effect of increased immigration will be at its lowest in Siberia and
the Far East. The level of compensation for the district-specific WAP declines will remain low
even under our high-immigration scenario. Only in the South will it reach 60%. In the
Northwest, the Volga, and the Urals, it will be within the 30-40% range. Siberia and the Far East
can count on only 10% compensation and only by the end of the period, after 2020.
IMMIGRATION TO RUSSIA 18
Nationwide, the effect of our high scenario (Figure 8)–WAP decline–still displays
significant spatial contrasts, although they are somewhat less than they would be in the absence
of migration (Figure 4). In the Far East, only Khabarovsk Krai is likely to benefit more than
other regions from the high-immigration scenario. In Siberia, the same applies to the Novosibirsk
Oblast. The demographic situation will improve in the southern part of the Volga District as well
as in the southern part of the CFD. Overall, however, even our high-immigration scenario
suggests an inadequate supply of labor in much of Russia.
The medium scenario is by definition at a mid-point between high and low: it envisions
almost a doubling of net migration to Russia (7.3 million people) compared with the low
scenario (3.4 million people) but is well short of the high scenario (12.9 million). Consequently,
the medium scenario will ensure compensation for the WAP decline in the CFD by a little more
than a half and by 30% nationwide. This scenario includes the possible realization of the 2006–
2012 compatriots’ resettlement program (adopted by a presidential decree of June 22, 2006) now
underway in Russia, although so far the number of newcomers covered by this program has been
far short of the established targets (Bovt, 2009). Should the program performance improve
between now and 2012, this may boost the inflow of immigrants to the regions adjacent to CIS
countries of origin and thus partially offset the centripetal population shift. Compared with the
low scenario, the migration losses of Siberia and the Far East will decline by half, and net
migration to other districts will increase noticeably. However, the plausibility of the medium
scenario depends strongly on the scale of (temporary) labor migration to the CFD, Siberia, and
the Far East to replace domestic out-migration.
In our judgment, only the high scenario will tangibly mitigate the labor deficit in Russia.
Any fewer immigrants than envisioned by that scenario will lead to further contraction of the
IMMIGRATION TO RUSSIA 19
populated space, stagnation, and the subsequent decay of Russia’s ever-expanding east (which
now includes the Urals), further decline in economic output outside the energy sector, and drastic
limitations on retirement and other social programs.
Discussion
Our pivotal assumption is the imperative to compensate at least partially for the
upcoming decline in the WAP through international migration. But any estimate of that need
may seem unreliable without invoking planned investment and considering how it relates to the
projected demand in newcomers and their geography. Likewise, one may question whether
Russia has a migration policy that would address the country’s needs. And finally, taking both
considerations into account, which of our scenarios is most plausible?
It is unlikely that the geography of new job creation can change the geography of
migration in Russia, because the decline in the WAP promises to be the most dramatic in the
federal district whose attractiveness (an accumulated effect of lasting development) is second to
none. In other words, even without commissioning new production capacities there will be
plenty of vacancies in the existing ones. In Russia, the Gosplan’s famous dictum that
“investment in production begets people (to be employed in that production)” stopped working
about four decades before the 2007 commencement of the decline in the WAP. For that reason,
no inflow of young labor to Russian agriculture occurred even after its share in the overall
investment had reached 28%, as it did in the early 1980s. For the same reason, Siberia and the
Far East were officially designated as labor deficient (trudodefitsitnye).
In 2008, Russia’s Institute for Regional Policy published its survey of 1400 large (>
$100,000,000) investment projects (Dostatochno 2008). By 2020, they are expected to create 3.2
IMMIGRATION TO RUSSIA 20
million new jobs. Together with smaller-scale projects, the overall growth in the number of jobs
is expected to approximate 7 million by 2020. In other words, 7 million new jobs will have been
created by the time the WAP will have declined by 14 million without immigration! This
projected growth is well above our high scenario [Note that new jobs are in focus, working
migrants account for 70% of the total migrants, and our projections are for the beginning of
2026, not 2020.]
The survey authors emphasize that interregional competition for labor will intensify, and
the winners of that competition will be regions that will expand affordable housing, adapt local
education programs to local needs, and offer the most attractive aid packages to migrants. This
list does not include the enormous disparity in the regions’ pull factors at the start of this race for
domestic migrants, a gap that can be bridged only partially if at all. According to the survey, the
list of twenty regions with the highest projected job creation is topped by the Leningrad Oblast,
with 230,000 new jobs by 2020. Our data suggest that out of that list, only Moscow and
Leningrad Oblasts as well as St. Petersburg can succeed in attracting domestic migrants, thus
exacerbating the labor deficit elsewhere.
It may also be that the Voronezh, Nizhni Novgorod, Sverdlovsk, and Novosibirsk Oblasts
will receive some migrants from within Russia. But there is practically no chance for most of the
remaining twelve regions, especially for the Irkutsk, Orenburg, and Chelyabinsk Oblasts, and for
Krasnoyarsk Krai. These and other regions can count only on immigrants. Out of fifteen regions
with the highest rate of job creation (as opposed to the total number of new jobs), two ethnic
homelands of the North Caucasus–the Adyghean and Karachai-Circassian Republics–can
probably rely on the regional labor force reserves. But five regions of the Far East (the Amur,
Jewish, Sakhalin, and Kamchatka Oblasts, and the Sakha/Yakut Republic) that are on the same
IMMIGRATION TO RUSSIA 21
list can only rely on immigration, and the same applies to a very significant degree to such
CFD’s regions as the Kostroma, Voronezh, and Lipetsk Oblasts, and the Perm Oblast (of the
Urals district). Meeting the demand for labor that the investment projects will entail is beyond
our high scenario.
Throughout the 1990s, Russia was arguably one of the most open countries in the world.
This applied to both emigration and immigration. This open-door practice was accompanied by
highly inaccurate recording of immigrants and by various forms of exploitation of them,
including forced labor, human trafficking, and fraudulent recruitment schemes. Accustomed to a
long lasting closed-country regime, many Russians became increasingly wary of “too many”
foreigners in the streets of their cities.
Prompted by this wariness, the government went to the opposite extreme and introduced
rigid immigration control. Adopted in 2002, the Federal Law, “On the Legal Situation of
Foreigners in the Russian Federation” erected tall barriers to immigrants’ lawful stay and
employment. To legalize their stay in Russia, foreigners were required to register within 72
hours of their arrival for a maximum 90-day stay. In order to register, two applications had to be
filled–one from the foreigner and another from the owner or leaser of the dwelling in which the
foreigner would reside. (While hotels procured registration on their own, only tourists usually
stay there; prior to 2007, many hotel clerks offered registration for a hefty bribe.) The applicant
and his/her host would then visit a local police department and receive the approval stamp in
his/her passport.
Employment authorization was to be procured by the prospective employer; it was
impossible to even solicit an employment authorization without the residential approval stamp in
the passport. It was almost as if someone had deliberately created an outlet for corruption. In
IMMIGRATION TO RUSSIA 22

every major Russian city, intermediary services offered residential registration and employment
authorization for a significant fee, some of which was used to bribe the police. This situation
narrowed the legal space for immigrants and boosted corruption, and the recorded component of
immigration shrunk.
Those with personal experience of going through this routine can fully appreciate the
changes that were adopted in 2006 and went into effect on January 15, 2007. Based on 2006
amendments to the 2002 law and on the newly adopted law, “On the Records of Foreign Citizens
and Persons without Citizenship in the Russian Federation,” temporary migrants no longer must
apply for registration and receive a stamp in their passport. Instead, within 72 hours they must
notify the Federal Migration Service of their arrival. This can be done by mail from any post
office, which is to provide a blank migration form and certify that it is filled out correctly5.
The address for the stay may not necessarily be the address of actual residence but that of
a place of work or of a recruitment agency. A migrant attaches a copy of his/her photo-bearing
passport page to that form and a copy of an immigration stub received at the border crossing.
Once the form is accepted by the postal clerk, the migrant receives a stub testifying that he or she
has registered. The initial period of temporary stay has been extended from 90 to 180 days, and it
can be extended to one year upon request.
Equally important, obtaining an employment authorization card has become much easier
as well. According to the 2006 amendments, it is to be handed to the applicant (by the local
office of the Federal Migration Service) him/herself, not to his/her employer, which means that
he/she can start job hunting on his/her own without being attached to a certain employer. The
employment authorization changes have so far been made only in regard to CIS migrants
IMMIGRATION TO RUSSIA 23

entering Russia without a visa, but this is an understandable preference as the CIS countries are
major origins of migrant labor force.
These changes brought about almost immediate positive effects but also a backlash from
the members of Russia’s bureaucratic class, including the mayor of Moscow (Inorodnoye, 2007),
which triggered a partial restoration of constraints, and the global financial crisis has also
exacerbated the situation. One positive effect was more complete migration records. In 2007, 8
million entries for temporary stay were recorded,6 and 1.7 million job authorizations were
handed to temporary migrants (up from 1.0 million in 2006). Whereas prior to 2007, surveys
showed that almost half of all labor migrants were unregistered, in 2007 only 15% were. Also,
before 2007 from 15 to 25% of all labor migrants worked legally, but in 2007, 76% of migrants
had job authorization. Third, the tax base of the foreign labor force has doubled.
The rights of migrants and their freedom of movement have expanded, but that does not
guarantee their legal employment. Moreover, the new job authorization program cast additional
light on the dual nature of Russia’s job market, especially on the ample opportunities for shadow
employment. In 2007, about 40% of migrants authorized to work were hired unofficially
(Zayonchkovskaya et al. 2009: 58). That is, a perfectly legal migrant may still turn out to be an
illegal worker and may even not be aware of it. This situation is often used by Russian officials
when demanding that the old restrictions be restored (as if the pre-2007 labor immigration
control had not been a fiasco).
Today, restrictions operate through the centralized assignment of numerical quotas on the
foreign labor force; beyond the quotas, no job authorizations are to be provided. The overall
5 One of this article’s authors registered numerous times for a non-hotel stay in Moscow according to the pre-2007 law, and three times according to the new rules, and can testify to the almost unbelievable simplification of the registration procedure.
IMMIGRATION TO RUSSIA 24

quota is determined through a complicated and multi-layered mechanism not backed by any
serious methodology. Only large businesses can get their need in foreign labor registered. Small
businesses, let alone individuals who hire foreign construction workers and nannies, cannot
break through.
The 2008 quota of 1.8 million foreign workers was exhausted before the end of June–in
some regions as early as in April. Before the decision to increase the 2008 quota, employers had
to either slow down or terminate their activity, or hire workers illegally. This unfortunate
experience led to a steep increase in the 2009 quota–to 3.9 million workers. However, the global
financial crisis prompted a decision to cut that quota in half (Gritsyuk 2008).
Responding to situations in which employers actually laid off Russians but retained
foreigners who worked longer hours and were paid less, in December 2008 Russia’s trade union
leader Mikhail Shmakov called upon the government to issue a temporary ban on hiring
foreigners (Ibid.). For 2010, the announced quota is 2 million workers, including a 0.7 million
reserve which may or may not be used. That includes the 250,000 quota for the city of Moscow
(down from 392,000 in 2009) (Rossiya vdvoye, 2009). As stated above, like no other place,
Moscow is able to meet its labor demand by hiring Russian nationals.
The liberalization of foreign labor hiring practices sustained a major setback in February
2009, when the Federal Migration Service issued its directive (prikaz) No. 36. According to it,
foreigners with visa waivers (i.e., people from the CIS countries except Turkmenistan) are
initially authorized to work for 90 days; after that, they may submit a finalized employment
agreement and may be authorized to work for at most one year (actually for nine months, as this
one-year term includes the initial 90 days). For the second (year-long) authorization, a specific
6 In 2008, there were 9.2 million foreign migrants recorded in Russia, and 4 million during the first six months of 2009 (Romodanovsky, 2009).
IMMIGRATION TO RUSSIA 25

employer must be listed. This means that after a short period, attachment to an employer is back.
Although this amendment–much like the entire practice of assigning quotas–is done to protect
domestic labor, it is unlikely to attain this goal. Rather, it will push both employers and
immigrants to bypass the law and will open up new opportunities for corruption.
The fact that the recent liberalization of immigration practices has already been subject to
setbacks casts doubt on Russia’s readiness to respond to what may well be its existential
demographic challenge. The nature of immigrant job-hunting channels, of media coverage, and
of public debate over immigration increase that doubt. Currently, more than 70% of labor
migrants find work through relatives and friends, about 15% through unlicensed private
mediators, and only 10% through official employment agencies (Zayonchkovskaya et al. 2009).
Members of the immigrant labor force have limited access to the justice system and cannot
protect their rights. Xenophobia (in Russia often called migrantophobia) is rampant and bolstered
by the media. The titles of media articles like “In Russia Every Tenth Labor Migrant has
Tuberculosis” (V Rossii 2007) or “Labor Migrants Bring Tuberculosis and AIDS to St.
Petersburg” (Trudovye 2009) are as widespread as they are misleading. In 2007, tuberculosis
was found in every 125th–not 10th–migrant, and AIDS was diagnosed is every 534th one
(Zayonchkovskaya et al. 2009).
Migrantophobes claim a high crime rate among labor migrants. However, in 2007
migrants committed only 1.4% of recorded criminal offenses in Russia–a slight decline from
2006. Conversely, crimes against foreigners in Russia are on the rise. Whereas migrants are for
the most part caught stealing, crimes against migrants are usually more grave, including brutal
slayings. From January to May 2008, in Moscow there were no fewer than 126 assaults on
IMMIGRATION TO RUSSIA 26
foreigners; 72 died. The most frequent hate crime victims are Uzbeks, Kyrgyz, Tajik, and
Azerbaijanis.
Migrantophobes also invoke cultural distance between major groups of migrants and
Russians. (This problem is quite real but is no more serious than that faced by other immigrant-
receiving societies.) According to a 2007 survey by the Levada Center, only 12.5% of Russians
have a favorable attitude toward immigrants, whereas 22% are hostile to them (Trudovaya 2008).
Russia’s regional leaders’ mantra continues to be “if we come up with the right pay, we
will find workers at home.” But while some employers will, most won’t, and that simple truth
has not sunk in yet. Even public debates between social scientists do not always suggest an
understanding of Russia’s demographic challenge. For example, Izvestia’s report from the
roundtable on immigration held in Moscow’s Polytechnic Museum on November 29, 2009, is
couched in pro-et-contra terms, as if there were some genuine alternative to immigration
(Priyakhina, 2009).
There are strong indications that Russia’s top leaders understand that, for Russia,
immigration is not an option but a necessity; however, no reasonable policy can hinge on the
good intentions of national leaders alone. At least some societal consensus is required. This
particularly applies to immigration policy, which must be enforced all over the country, and by
low-level bureaucrats. Not only is there no consensus; all too many Russians are in denial. The
issue of immigration has not been adequately examined yet, and this is arguably the main reason
why Russia does not have a coherent immigration policy. As there has been a sequence of
inconsistent immigration control acts, our medium scenario (implying that only 30% of the
upcoming decline in WAP will be compensated for) appears to be the most realistic.
Russia’s institutional behavior in the area of immigration is more reactive than proactive,
IMMIGRATION TO RUSSIA 27

so the low scenario is likely to be exceeded as soon as businesses across the country make their
acute deficit of workers known to the upper echelons of power. In response, those in power will
expand foreign labor quotas. However, they will also have to offer naturalization to ever-
increasing number of immigrants, first in the southern regions of the Far East, where new
investment projects will require a stable labor force, and then in the other regions. At the same
time, the absence of a broad social consensus on immigration will continue to restrain
immigration and may not allow it to reach the high scenario.
Conclusion
In 2007, Russia’s population dynamics entered a new phase–a decline in the working age
population. From 2011 to 2017, this decline will exceed one million people a year. This will
make labor the most deficient resource in Russia, and it will increase Russia’s demand for
immigrants. A few Russian regions will be able to compensate for their decline in the working
age population by attracting Russian nationals from other regions, but this will only boost
demand for immigrants elsewhere. While the country already hosts a number of international
migrants second only to that in the United States, Russian society has not yet realized that
immigration is Russia’s destiny and that Russia’s economic prospects–as well as perhaps its
territorial integrity–depend on it. As a result, it is definitely in Russia’s interests to resolve as
soon as possible a glaring contradiction between the demographic challenge and the institutional
response to it.
IMMIGRATION TO RUSSIA 28

References Arkhangelsky, V., A. Ivanova, V. Kuznetsov, L. Rybakovsky, S. Riazantsev, Strategiya Demograficheskogo Razvitiya Rossii (The Strategy of Russia’s Demographic Development), Moscow: Institut Sotsialno-Politicheskikh Issledovanii, Moscow 2005. Beloborodov, Igor, “Russkikh Khoronit Rano” (It is Too Early to Bury Russians), RBC Daily, June 28, 2005; http://www.ctvr.ru/lentad/2005/6/28/1.htm. Bovt, Georgy, “Vozvrashchentsy Non Grata” (Returnees Non Grata), Izvestia, February 14, 2008; http://www.izvestia.ru/comment/article3112995/index.html. Chislennost i Migratsii Naseleniya v ...Godu (Population Size and Migrations in …Year), Moscow: Rosstat 2006, 2007, 2008, 2009. Dostatochno li v Rossii Professionalnykh Kadrov dlya Investitsionnogo Rosta? (Is There Enough Labor in Russia for Investment-induced Growth?), Report of the Institute for Regional Policy 2008; http://www.polit.ru/research/2008/10/30/demoscope349.html. Feshbach, Murray, “The Health Crisis in Russia’s Ranks,” Current History, October 2008: 336–341. Gimpelson, Vladimir, Defitsyt Kvalifikatsii i Navykov na Rynke Truda: Nedostatok Predlozheniya, Ogranicheniya Sprosa ili Lozhnye Signaly Rabotodatelei (Qualification and Skill Deficit in the Labor Market: Inadequate Supply, Limited Demand, or False Signals by Employers), Preprint, Moscow: Vysshaya Shkola Ekonomiki 2004. Gritsyuk, Marina, “Inostrantsev Urezali: Quota na Migrantov Snizhena Vdvoye” (Foreigners Have Been Cut: the Migration Quota Has Been Reduced by Half), Rossiiskaya Gazeta, December 12, 2008; http://www.rg.ru/2008/12/12/migrant.html. Heleniak, Timothy, Population Perils in Russia at the Beginning of the 21st Century, Stephen Wegren and Dale Herspring, After Putin’s Russia: Past Imperfect, Future Unknown, Lanham: Rowman, and Littlefield Publishers 2009: 133–158. Krupnov, Yuri, “Informatsionnaya Voina: Protiv Nas Vedyotsya Operatsiya ‘Migranty Spasut Rossiyu,’” (Information War: The Operation ‘Migrants Will Save Russia’ is Being Conducted against Us), KM.RU Novosti, October 18, 2005; http://www.km.ru/magazin/view.asp?id={2779160C-F769-493E-9685-B46CAA298023. Luzhkov, Yuri, “Moskva–Ne Prokhodnoi Dvor,” (Moscow is No Place for Vagabonds), Rossiiskaya Gazeta, September 16, 2007. Mironov, Sergei, “Nado Pobudit Materei k Mnogodetnosti,” (It is Necessary to Prompt Mothers toward Having Many Children), Rossiiskaya Gazeta, April 28, 2005; http://www.rg.ru/2005/04/28/demografiya-mironov.html.
IMMIGRATION TO RUSSIA 29

Priakhina, Yekaterina, “Nuzhny li Rossii Gastarbeitery,” (Does Russia Need Guest Workers), Izvestia, November 30, 2009; http://www.izvestia.ru/russia/article3135943/index.html. Romodanovsky, Konstantin, “Vashe Pravo” (Your Right), Migratsiya, No. 15, August 2009. Rossiisky Statistichesky Yezhegodnik, Moscow: Rosstat 2008. Rossiya v Tsifrakh, Moscow: Rosstat 2009. “Rossiya Vdvoye Urezala Chislo Vakansii dlya Gastarbiterov “(Russia has Reduced the Number of Vacancies for Guest Workers by Half), Lenta.RU, November 20, 2009; http://www.lenta.ru/news/2009/11/20/cutquotes/. “Rossiyane za Rozhdayemost i Protiv Immigrantov” (Russians are for Fertility and against Immigrants), BBC, Russian Service, June 1, 2006; https://rumail.radford.edu/owa/redir.aspx?C=20ba5cb530494d2f8b97d02615375c0d&URL=http%3a%2f%2fnews.bbc.co.uk%2fhi%2frussian%2frussia%2fnewsid_5037000%2f5037700.stm. Russia Facing Demographic Challenges: National Human Development Report 2008, Moscow: UNDP 2009. Trudovaya Migratsiya iz Ukrainy, Belarusi, i Moldovy v Rossiyu: Tendentsii i Svyaz s Torgovley Luidmi (Labor migration from Ukraine, Belarus, and Moldova to Russia: Trends and Relationship with Human Trafficking), Chisinau: La Strada 2008; http://www.lastrada.md/date/docs/mfm_rus.doc. “Trudovye Migrant Vezut v Peterburg Tuberculos i Vich,” (Labor Migrants Bring Tuberculosis and HIV to St. Petersburg), BaltInfo, October 1, 2009; http://www.baltinfo.ru/news/Trudovye-migranty-privozyat-v-Peterburg-tuberkulez-i-VICh---ekspert-107462. “V Rossii Kazhdyi Desyatyi Trudovoi Migrant Bolen Tuberkulyuzom” (In Russia Every Tenth Labor Migrant Has Tuberculosis), Polyarnaya Zvezda, February 22, 2007; http://www.zvezda.ru/web/news4389.htm. Vishnevsky, Anatoly, Rossiya Poshla v Rost (Interview) (Russia Began to Grow), Izvestia, November 23, 2009; http://www.izvestia.ru/obshestvo/article3135648/index.html. Vitkovskaya, Galina, A. Platonova, V. Shkol’nikov, Novoye Migratsionnoye Zakonodatelstvo Rossiiskoi Federatsii: Pravopremenitelnaya Praktika (New Migration Legislation in the Russian Federation: Enforcement Practices), Moscow: Adamant, 2009. “Inorodnoye Telo: Yuri Luzhkov Nachinayet Kampaniyu protiv Migrantov” (An Alien Body: Yuri Luzhkov Launches a Campaign against Migrants) Kommersant, June 7, 2007; http://www.kommersant.ru/doc.aspx?DocsID=77322.
IMMIGRATION TO RUSSIA 30
Zayonchkovskaya, Zhanna, Nikita Mkrtychyan, and Yelena Tyuryukanova, “Rossiya pered Vyzovami Immigratsii,” (Russia and the Challenges of Immigration), Postsovetskiye Transformatsii: Otrazheniye v Migratsiyakh (Post-Soviet Transformations as Reflected in Migrations), Moscow: Institute for Economic Forecasting 2009: 9–62. Zayonchkovskaya, Zhanna and Nadezhda Nozdrina, “Migratsionnyi Opyt Naseleniya Regionalnykh Tsentrov Rossii” (Migration Experience of Russia’s Regional Centers), Problemy Prognozirovaniya, No. 4, 2008: 94 – 110. Zayonchkovskaya, Zhanna, “Migratsiya” (Migration), Anatoly Vishnevsky (Ed.), Naseleniye Rossii 2006, Moscow: GU VSHE 2008.
IMMIGRATION TO RUSSIA 31

Table 1
The Official 2026 Population Projection
Indicator Starting Value Scenarios
Low Medium High
Population in Millions 141.9 (2009) 129.4 137.0 145.1
Total Fertility Rate 1.406 (2007) 1.379 1.680 1.890
Life Expectancy at Birth: Men Women
61.4 (2007) 73.9 (2007)
62.4 75.1
63.8 75.8
67.8 77.6
Net migration in Thousands Per Year
257 (2008) 200 Gradual Rise to 450
Gradual Rise to 690
Source: The Demographic Yearbook of Russia. 2008. p. 532-540
IMMIGRATION TO RUSSIA 32
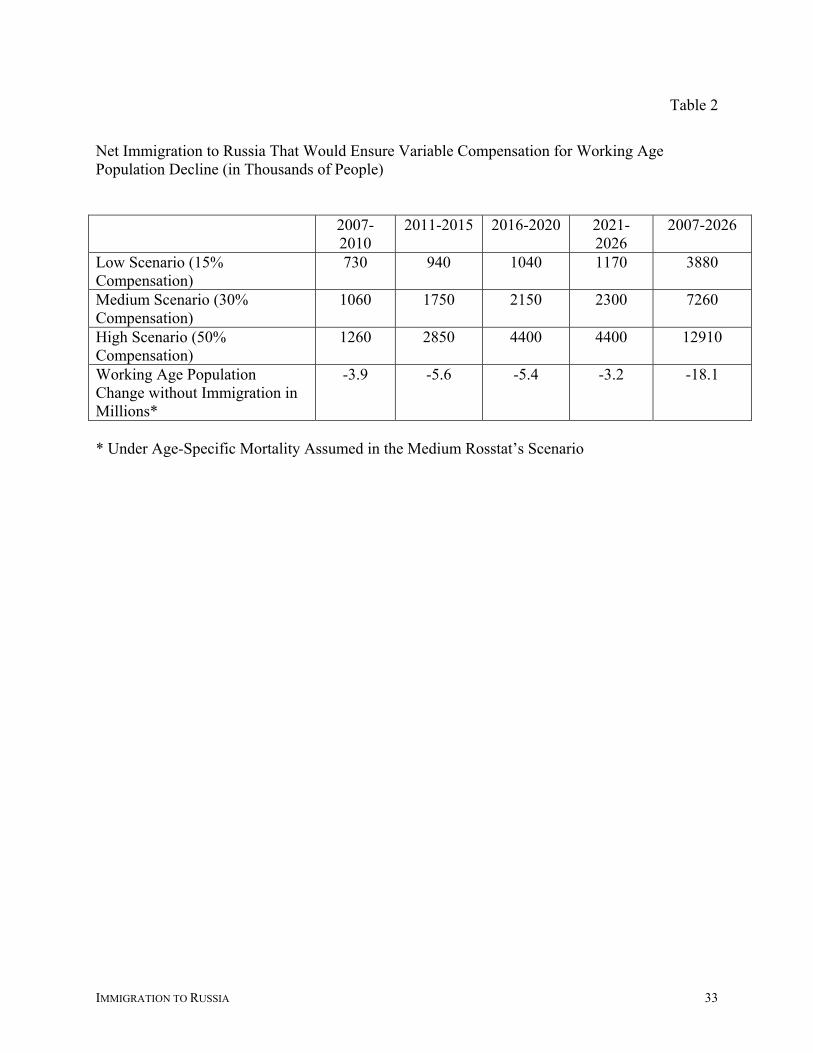
Table 2
Net Immigration to Russia That Would Ensure Variable Compensation for Working Age Population Decline (in Thousands of People)
2007-
2010 2011-2015 2016-2020 2021-
2026 2007-2026
Low Scenario (15% Compensation)
730 940 1040 1170 3880
Medium Scenario (30% Compensation)
1060 1750 2150 2300 7260
High Scenario (50% Compensation)
1260 2850 4400 4400 12910
Working Age Population Change without Immigration in Millions*
-3.9 -5.6 -5.4 -3.2 -18.1
* Under Age-Specific Mortality Assumed in the Medium Rosstat’s Scenario
IMMIGRATION TO RUSSIA 33
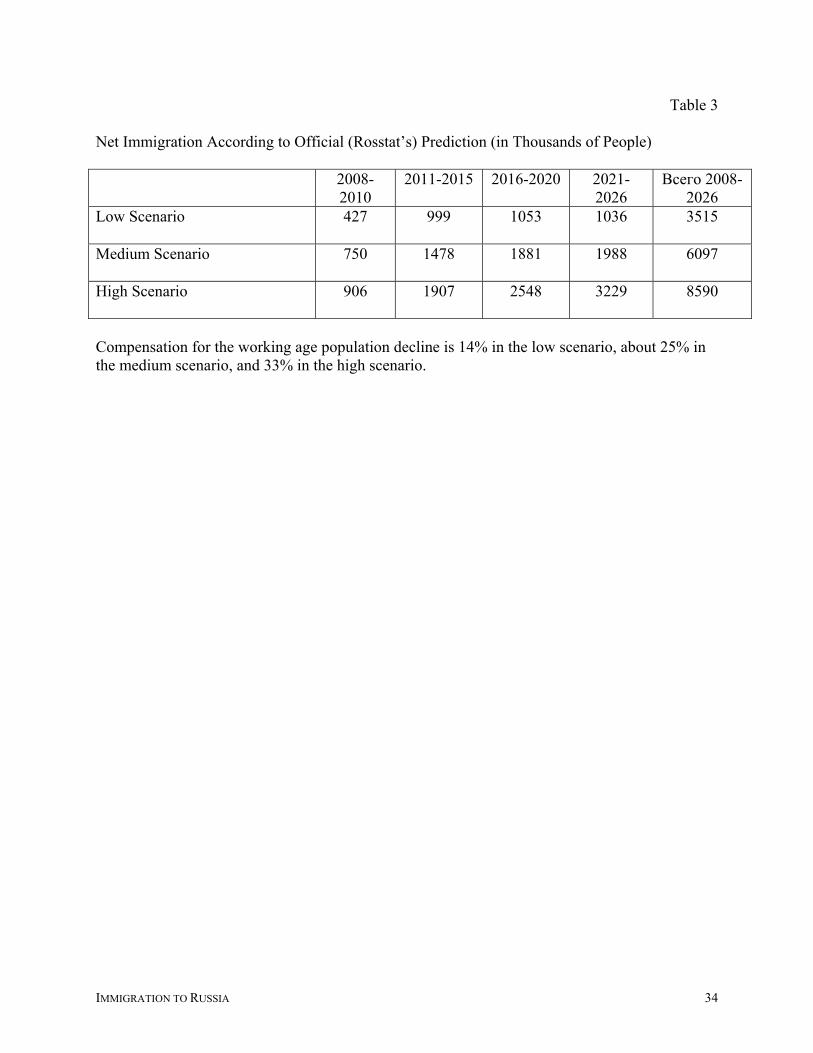
Table 3
Net Immigration According to Official (Rosstat’s) Prediction (in Thousands of People)
2008-2010
2011-2015 2016-2020 2021-2026
Всего 2008-2026
Low Scenario
427 999 1053 1036 3515
Medium Scenario
750 1478 1881 1988 6097
High Scenario
906 1907 2548 3229 8590
Compensation for the working age population decline is 14% in the low scenario, about 25% in the medium scenario, and 33% in the high scenario.
IMMIGRATION TO RUSSIA 34

Table 4
2007–2008 Domestic Net Migration between the Federal Districts (in Thousands of People)
Federal Districts
Center Northwest South Volga Urals Siberia Far East
Center - -18.1 -34.7 -51.7 -18.0 -28.3 -21.6 Northwest 18.1 - -5.6 -7.1 -5.7 -9.4 -7.2 South 34.7 5.6 - -7.5 -1.3 -13.6 -9.7 Volga 51.7 7.1 7.5 - 6.8 -4.9 -3.9 Urals 18.0 5.7 1.3 -6.8 - -7.6 -2.3 Siberia 28.3 9.4 13.6 4.9 7.6 - -5.1 Far East 21.6 7.2 9.7 3.9 2.3 5.1 - Total 172.4 16.9 -8.2 -64.3 -8.3 -58.7 -49.8 Calculated on the basis of the annual data books, Chislennost i Migratsiya Naseleniya Rossiiskoi Federatsii, Moscow: Rosstat 2007 (and 2008)
IMMIGRATION TO RUSSIA 35
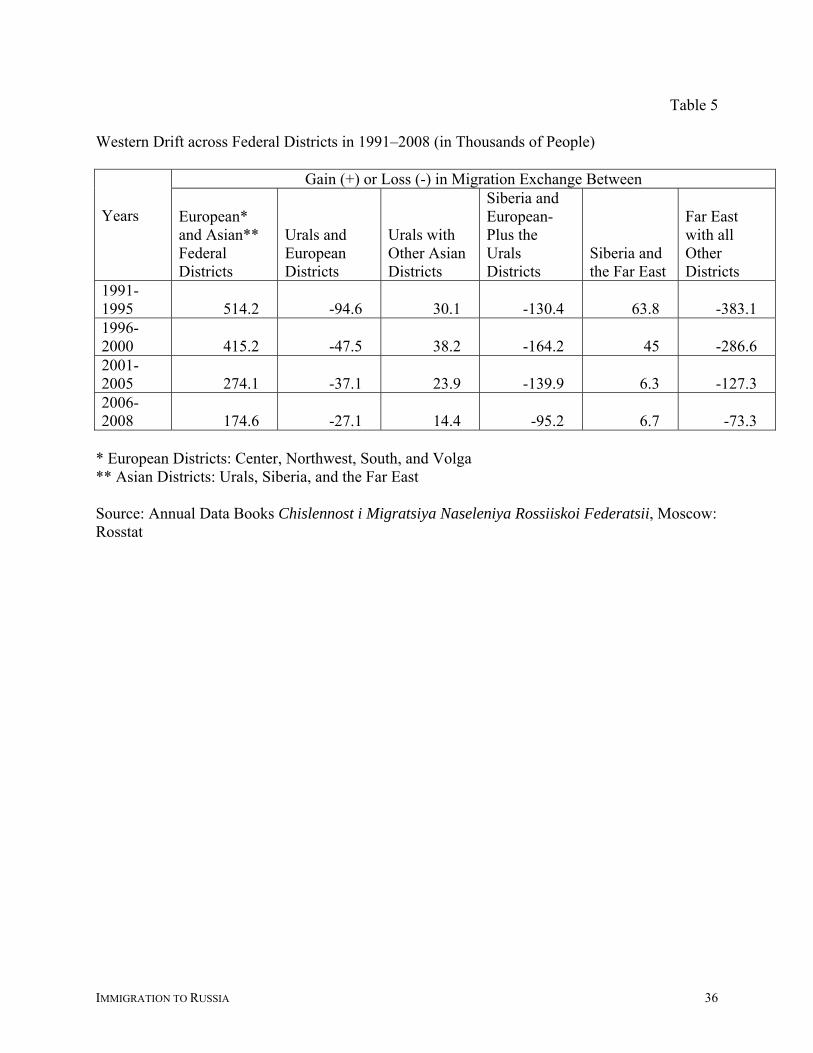
Table 5 Western Drift across Federal Districts in 1991–2008 (in Thousands of People)
Gain (+) or Loss (-) in Migration Exchange Between
Years
European* and Asian** Federal Districts
Urals and European Districts
Urals with Other Asian Districts
Siberia and European-Plus the Urals Districts
Siberia and the Far East
Far East with all Other Districts
1991-1995 514.2 -94.6 30.1 -130.4 63.8 -383.1 1996-2000 415.2 -47.5 38.2 -164.2 45 -286.6 2001-2005 274.1 -37.1 23.9 -139.9 6.3 -127.3 2006-2008 174.6 -27.1 14.4 -95.2 6.7 -73.3
* European Districts: Center, Northwest, South, and Volga ** Asian Districts: Urals, Siberia, and the Far East Source: Annual Data Books Chislennost i Migratsiya Naseleniya Rossiiskoi Federatsii, Moscow: Rosstat
IMMIGRATION TO RUSSIA 36
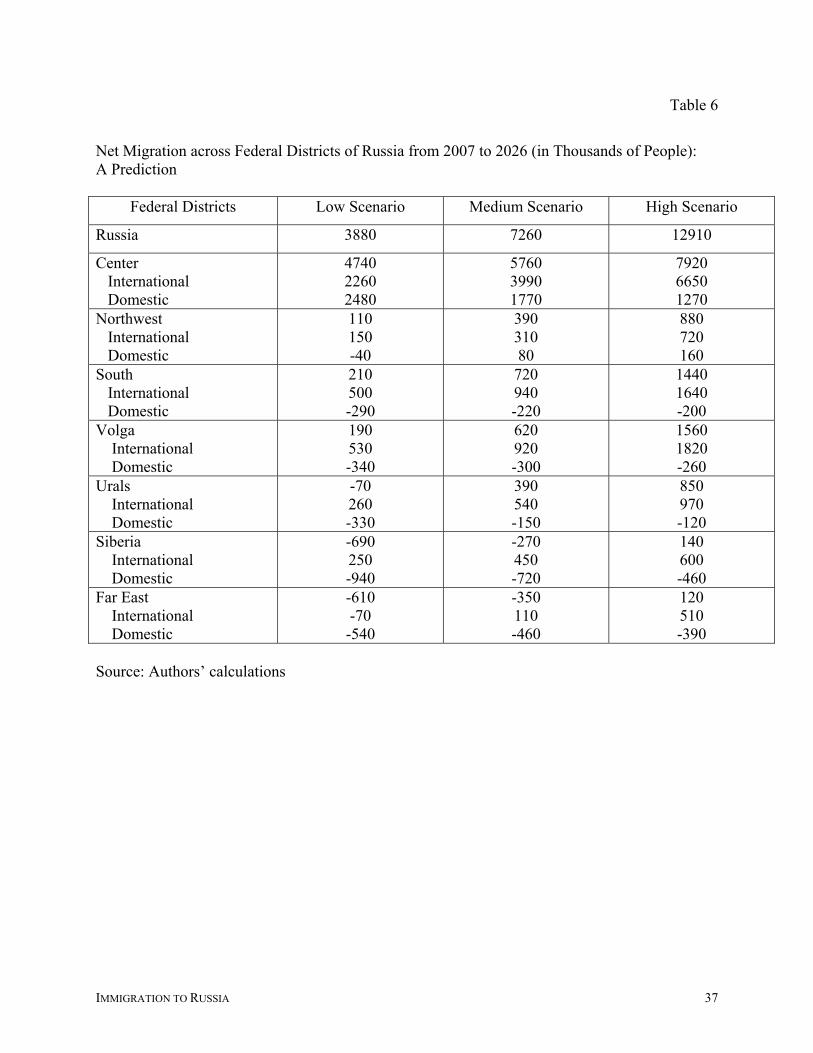
Table 6
Net Migration across Federal Districts of Russia from 2007 to 2026 (in Thousands of People): A Prediction
Federal Districts Low Scenario Medium Scenario High Scenario
Russia 3880 7260 12910
Center International Domestic
4740 2260 2480
5760 3990 1770
7920 6650 1270
Northwest International Domestic
110 150 -40
390 310 80
880 720 160
South International Domestic
210 500 -290
720 940 -220
1440 1640 -200
Volga International Domestic
190 530 -340
620 920 -300
1560 1820 -260
Urals International Domestic
-70 260 -330
390 540 -150
850 970 -120
Siberia International Domestic
-690 250 -940
-270 450 -720
140 600 -460
Far East International Domestic
-610 -70 -540
-350 110 -460
120 510 -390
Source: Authors’ calculations
IMMIGRATION TO RUSSIA 37
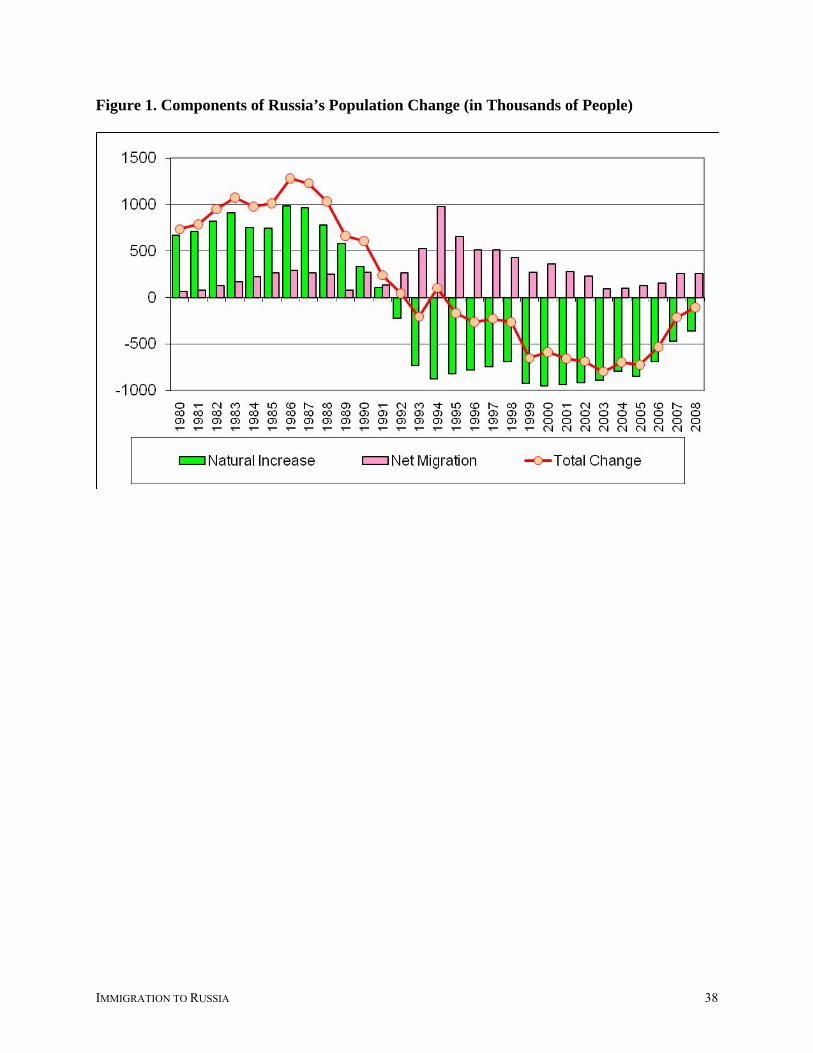
Figure 1. Components of Russia’s Population Change (in Thousands of People)
IMMIGRATION TO RUSSIA 38
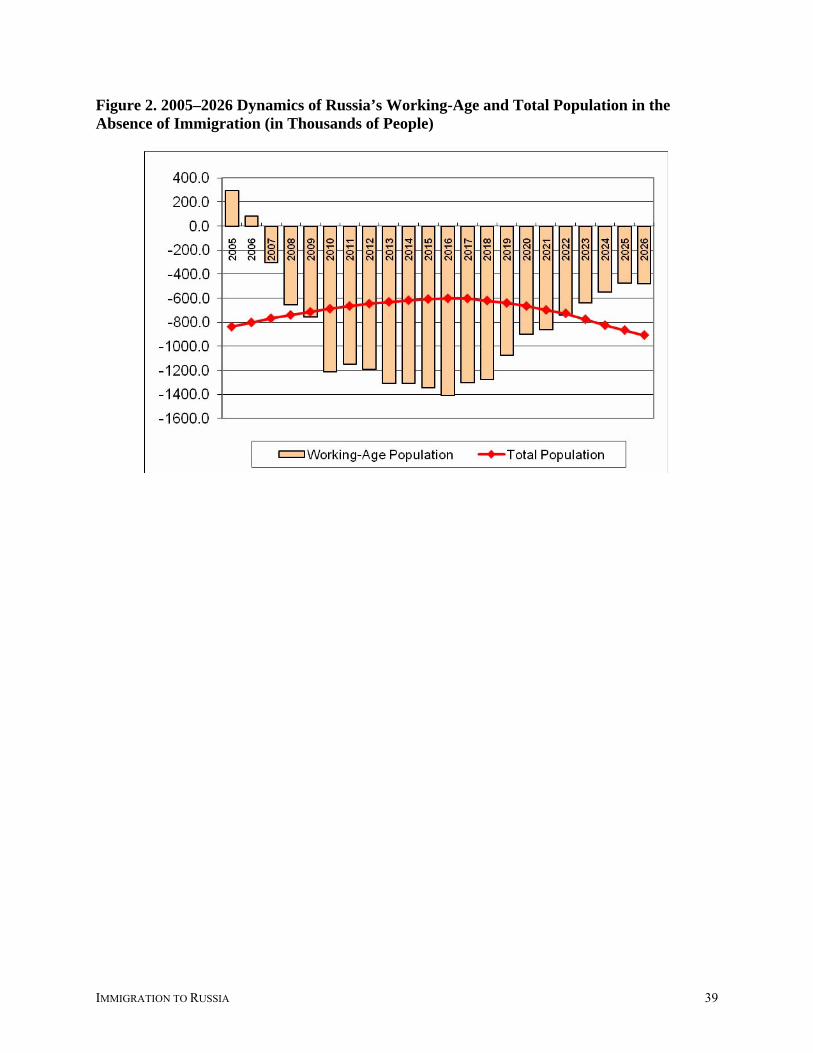
Figure 2. 2005–2026 Dynamics of Russia’s Working-Age and Total Population in the Absence of Immigration (in Thousands of People)
IMMIGRATION TO RUSSIA 39

Figure 3. Migration Flows to Russia: 2009 Estimate
Recorded Net Immigration 300,000 per
annum
Migrants with Business Visas: about 600,000
Total Stock of
Immigrants ~7,000,000-8,000,000*
Legal (Authorized to Stay
and Work) 2,000,000
Illegal ~4,000,000-5,000,000*
Temporary Labor Migrants
~6,000,000-7,000,000*
Not Authorized to Stay and Work
~25%
Authorized to Stay but not to Work
~75%
Illegal Employment
Illegal Stay
* Peak season number
IMMIGRATION TO RUSSIA 40

Figure 4. Working-Age Population in 2026 as a Percentage of That in 2008 in the Absence of Migration
10
20
Kaliningrad region
Republic of Karelia
Leningrad region
Pskov region
Novgorod region
Vologda region
Arkhangelsk region
Republic of Komi
Kirov region
Komi-Permyatzky autonomous district
Perm region
Tver region
Yaroslavl region
Ivanovo region
Nizhny Novgorod region
Kostroma region
Smolensk region
Moscow region
Vladimir region
Republic of Mariy El
Chuvash republic
Bryansk region Kaluga region
Tula region
Oryol region
Kursk region
Belgorod region
Voronezh region
Rostov region
Krasnodar territory
Republic of Adygeya
Karachaev-Circassian republic Stavropol territory
Kabardian-Balkar republic
Republic of North Ossetia
Chechen and Ingush republics
Republic of Dagestan
Republic of Kalmykia Astrakhan region
Volgograd region Saratov region
Penza region
Tambov region
Lipetzk region
Ryazan region
Republic of Mordovia
Ulyanovsk region
Samara region
Orenburg region
Republic of Tatarstan
Udmurt republic
Republic of Bashkortostan
Chelyabinsk regionKurgan region
Sverdlovsk region
Yamalo-Nenetz autonomous okrug
Khanty-Mansi autonomous okrug
Tyumen region
Omsk region
Novosibirsk region
Tomsk region
Altai territory
Republic of Altai
Republic of Khakasia
Kemerov region
Krasnoyarsk region
Republic of Tuva
Evenki autonomous okrug
Irkutsk region
Ust-Ordynsky Buryat autonomous okrug
Republic of Buryatia
Aginsky Buryat autonomous okrug
Chita region
Amur region
Jewish autonomous oblast
Khabarovsk territory
Primorsky krai
Sakhalin region
Magadan region
Koryak autonomous okrug
Chechen republic
Ingush republic
St. Petersburg
Moscow citi
Murmansk Oblast
Taimyr (Dolgano-Nenetz) autonomous okrug
Republic of Sakha (Yakutia)
Chukchi Autonomous Okrug
Nenets autonomous okrug
Kamchatka Oblast
1013
111312
7
5
4
3266
65
25
27
17
33
19
24
2116
2931
15 18
262237
35
36
5957
50
54 58
5355
51
4143
44 47
45
39
3823
30
48
46
64
4262
61
68 63
67
78
77
76
74
73
75
71
70
82
72
83
81
85
86
8780
89
88
96
92
95
94
100
100
100
100
100
99
9898
5652
10
20
8
84
91
93
6
St. Petersburg
Moscow
97
< 75
75 - 80
80 - 85
85 - 100
100 <
IMMIGRATION TO RUSSIA 41
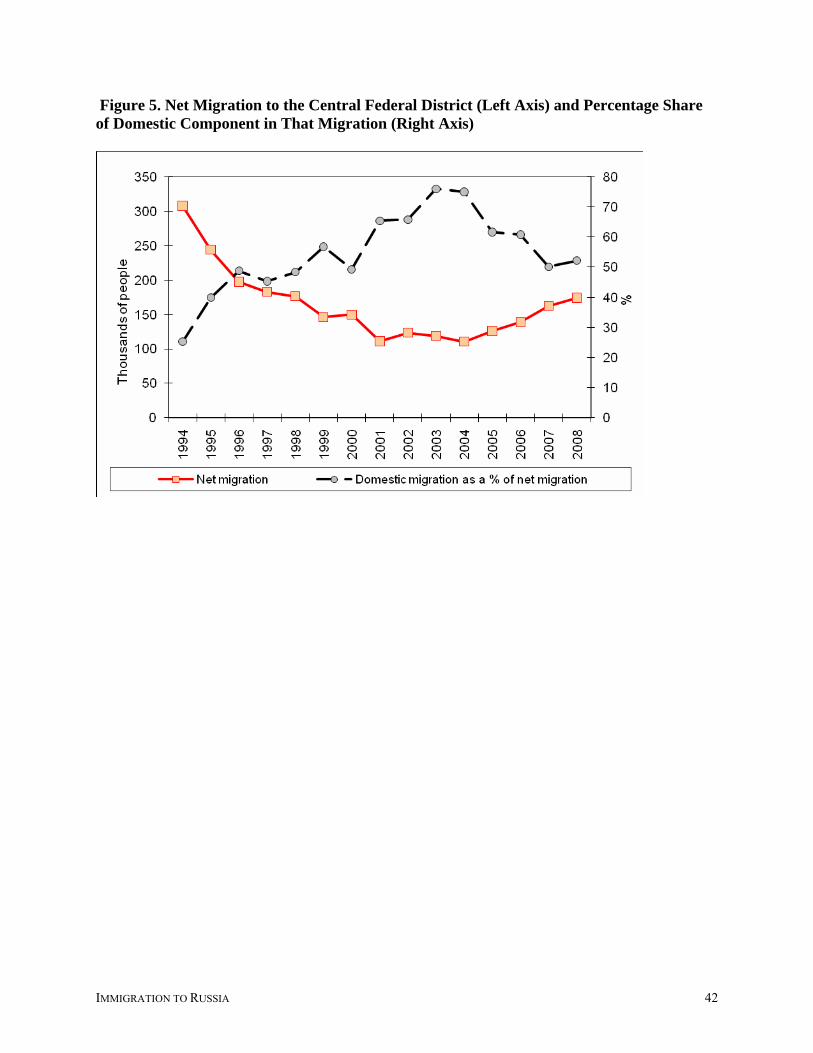
Figure 5. Net Migration to the Central Federal District (Left Axis) and Percentage Share of Domestic Component in That Migration (Right Axis)
IMMIGRATION TO RUSSIA 42

Figure 6. Net Migration by Federal District (in Thousands of People)
Source: Chislennost i Migratsiya Naseleniya Rossiiskoi Federatsii (Annual data books by Rosstat).
IMMIGRATION TO RUSSIA 43

Figure 7. Net Migration to Russia and the City of Moscow (in Thousands of People).
Source: Chislennost i Migratsiya Naseleniya Rossiiskoi Federatsii (Annual data books by Rosstat).
IMMIGRATION TO RUSSIA 44

Figure 8. Working-Age Population in 2026 as a Percentage of That in 2008, According to the High Scenario (For this map, net migration was determined for the Federal Districts (Table 6) and then disaggregated into oblasts in proportion to their current working age populations.)
10
20
Kaliningrad region
Republic of Karelia
Leningrad region
Pskov region
Novgorod region
Vologda region
Arkhangelsk region
Republic of Komi
Kirov region
Komi-Permyatzky autonomous district
Perm region
Tver region
Yaroslavl region
Ivanovo region
Nizhny Novgorod region
Kostroma region
Smolensk region
Moscow region
Vladimir region
Republic of Mariy El
Chuvash republic
Bryansk region Kaluga region
Tula region
Oryol region
Kursk region
Belgorod region
Voronezh region
Rostov region
Krasnodar territory
Republic of Adygeya
Karachaev-Circassian republic Stavropol territory
Kabardian-Balkar republic
Republic of North Ossetia
Chechen and Ingush republics
Republic of Dagestan
Republic of Kalmykia Astrakhan region
Volgograd region Saratov region
Penza region
Tambov region
Lipetzk region
Ryazan region
Republic of Mordovia
Ulyanovsk region
Samara region
Orenburg region
Republic of Tatarstan
Udmurt republic
Republic of Bashkortostan
Chelyabinsk regionKurgan region
Sverdlovsk region
Yamalo-Nenetz autonomous okrug
Khanty-Mansi autonomous okrug
Tyumen region
Omsk region
Novosibirsk region
Tomsk region
Altai territory
Republic of Altai
Republic of Khakasia
Kemerov region
Krasnoyarsk region
Republic of Tuva
Evenki autonomous okrug
Irkutsk region
Ust-Ordynsky Buryat autonomous okrug
Republic of Buryatia
Aginsky Buryat autonomous okrug
Chita region
Amur region
Jewish autonomous oblast
Khabarovsk territory
Primorsky krai
Sakhalin region
Magadan region
Koryak autonomous okrug
Chechen republic
Ingush republic
St. Petersburg
Moscow citi
Murmansk Oblast
Taimyr (Dolgano-Nenetz) autonomous okrug
Republic of Sakha (Yakutia)
Chukchi Autonomous Okrug
Nenets autonomous okrug
Kamchatka Oblast
1013
111312
7
5
4
3266
65
25
27
17
33
19
24
2116
2931
15 18
262237
35
36
5957
50
54 58
5355
51
4143
44 47
45
39
3823
30
48
46
64
4262
61
68 63
67
78
77
76
74
73
75
71
70
82
72
83
81
85
86
8780
89
88
96
92
95
94
100
100
100
100
100
99
9898
5652
10
20
8
84
91
93
6
St. Petersburg
Moscow
97
< 81
81 - 86
86 - 91
91 - 96
96 <
IMMIGRATION TO RUSSIA 45
Related Documents