Immigration in Connecticut: A Growing Opportunity Rafael Mejia Priscilla Canny, Ph.D. September 2007

Welcome message from author
This document is posted to help you gain knowledge. Please leave a comment to let me know what you think about it! Share it to your friends and learn new things together.
Transcript
Immigration in Connecticut:A Growing Opportunity
Rafael Mejia Priscilla Canny, Ph.D. September 2007

Immigration in Connecticut – October 2007 2
Immigration in Connecticut: A Growing Opportunity1
According to the United States Census Bureau’s newly released 2006 American Community Survey (ACS), about one out of every eight residents living in Connecticut was born outside the United States.2,3 This represents an increase in Connecticut’s immigrant population from one in nine residents at the time of the 2000 census and one in eleven at the time of the 1990 census. Many of Connecticut’s immigrants are the parents of children; these children represent an increasing proportion of Connecticut’s future workers and citizens. Importantly, many of these children are citizens, even if their parents are not. Policies aimed at non-citizens often have an impact on these children.
A combination of language and economic barriers put children in immigrant families at risk for poor educational and health outcomes. To ensure the productivity and well-being of Connecticut’s next generation, policy makers need to address the challenges facing immigrant children and families. This report summarizes and updates facts and trends about these children and their families from our previous report. Immigrant Population Increases The ACS reports that 12.9% (452,358 persons) of Connecticut’s residents were born outside of the United States. This represents a growth of 61% in the size of Connecticut’s foreign-born population since 1990 and a growth of 21% since 2000. Connecticut has the 11th highest percentage of foreign-born residents in the country. In addition, Connecticut has the largest proportion of residents born in Puerto Rico; an additional 2.4% of Connecticut’s residents (86,118 persons) were born in Puerto Rico but are not captured in the foreign-born statistics since they are U.S. citizens. Between 1995 and 2025, Connecticut is expected to gain 337,000 people through international migration, doubling the foreign-born population (the 12th greatest percentage increase in immigrant population size among the fifty states and Washington DC).4 These immigrants will help counteract what would otherwise be a serious demographic challenge: Connecticut’s aging population. As baby boomers reach retirement age, the number of residents over age 65 is projected to grow by 69% (an additional 324,222 elderly) between the year 2000 and 2030. But the impact of this change will not be nearly as dramatic as it would otherwise -- or as it will be in some other states -- because the predicted migration will bring children and young working families to Connecticut. In 1995, the share of Connecticut’s population under age 20 was 6th lowest in the nation, but in 2025, Connecticut is projected to rank 29th highest in the share of its population under age 20 in large part because of immigration. 5
1 This report is an update of an earlier report: J. Fishkin, P. Canny, D. Hall, Immigration in Connecticut, January 2005, which was based on 2003 American Community Survey Data (available at: http://www.ctkidslink.org/pub_detail_211.html). 2 Data in this report come from the United States Census Bureau American Community Survey 2006 unless otherwise noted. “Residents” are people who are currently living or staying at the address and whose expected length of stay exceeds two months, or who are staying less time but have no other place to live or stay. Residents also include people who live at the address but are away for a short period of time (two months or less) when the household is contacted. The ACS does not count people who plan to live at the address for less than two months or plan to be away for more than two months, for this reason the ACS might not include as “residents” a portion of the highly migrant farm worker population. “Foreign-born” is defined as anyone who is not a U.S. citizen at birth. This includes naturalized U.S. citizens, lawful permanent residents (immigrants), temporary migrants (such as foreign students), humanitarian migrants (such as refugees), and persons illegally present in the United States. 3 Although the sample size of the ACS enables reliable estimates for cities as small as 65,000 persons, there is a margin of error in any estimate based on sampling. 4 United States Census Bureau, Population Division, Interim State Population Projects, 2005. Table 4. 5 United States Census Bureau, Population Division, Connecticut’s Population Projections: 1995 to 2025.
Immigration in Connecticut – October 2007 3
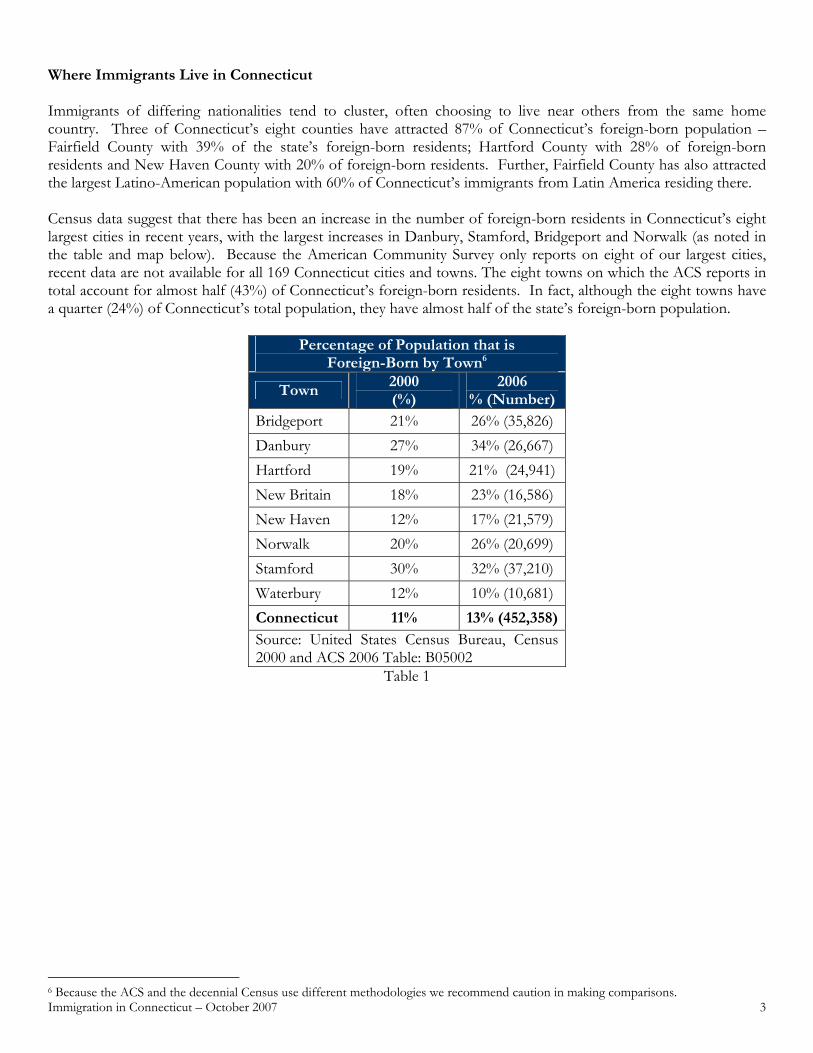
Where Immigrants Live in Connecticut Immigrants of differing nationalities tend to cluster, often choosing to live near others from the same home country. Three of Connecticut’s eight counties have attracted 87% of Connecticut’s foreign-born population – Fairfield County with 39% of the state’s foreign-born residents; Hartford County with 28% of foreign-born residents and New Haven County with 20% of foreign-born residents. Further, Fairfield County has also attracted the largest Latino-American population with 60% of Connecticut’s immigrants from Latin America residing there. Census data suggest that there has been an increase in the number of foreign-born residents in Connecticut’s eight largest cities in recent years, with the largest increases in Danbury, Stamford, Bridgeport and Norwalk (as noted in the table and map below). Because the American Community Survey only reports on eight of our largest cities, recent data are not available for all 169 Connecticut cities and towns. The eight towns on which the ACS reports in total account for almost half (43%) of Connecticut’s foreign-born residents. In fact, although the eight towns have a quarter (24%) of Connecticut’s total population, they have almost half of the state’s foreign-born population.
Percentage of Population that is Foreign-Born by Town6
Town 2000 (%)
2006 % (Number)
Bridgeport 21% 26% (35,826) Danbury 27% 34% (26,667) Hartford 19% 21% (24,941)New Britain 18% 23% (16,586) New Haven 12% 17% (21,579) Norwalk 20% 26% (20,699) Stamford 30% 32% (37,210) Waterbury 12% 10% (10,681) Connecticut 11% 13% (452,358)Source: United States Census Bureau, Census 2000 and ACS 2006 Table: B05002
Table 1
6 Because the ACS and the decennial Census use different methodologies we recommend caution in making comparisons.
Immigration in Connecticut – October 2007 4
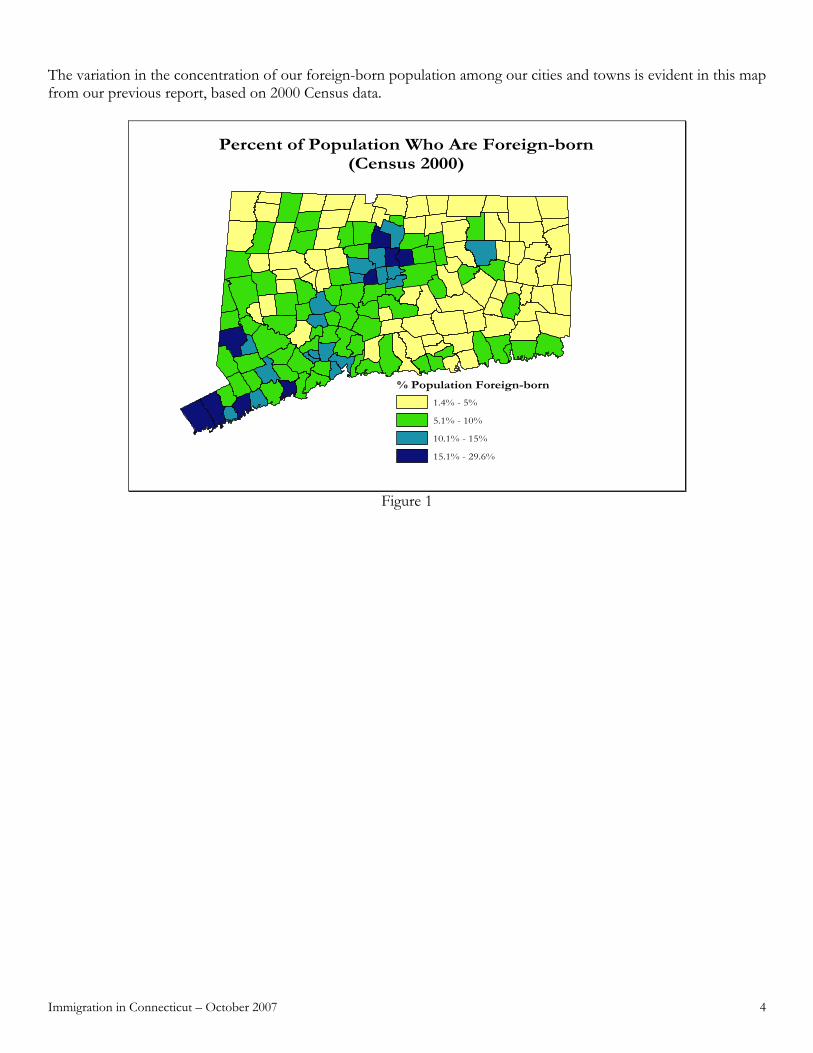
The variation in the concentration of our foreign-born population among our cities and towns is evident in this map from our previous report, based on 2000 Census data.
Percent of Population Who Are Foreign-born(Census 2000)
% Population Foreign-born
1.4% - 5%
5.1% - 10%
10.1% - 15%
15.1% - 29.6%
Figure 1
Immigration in Connecticut – October 2007 5
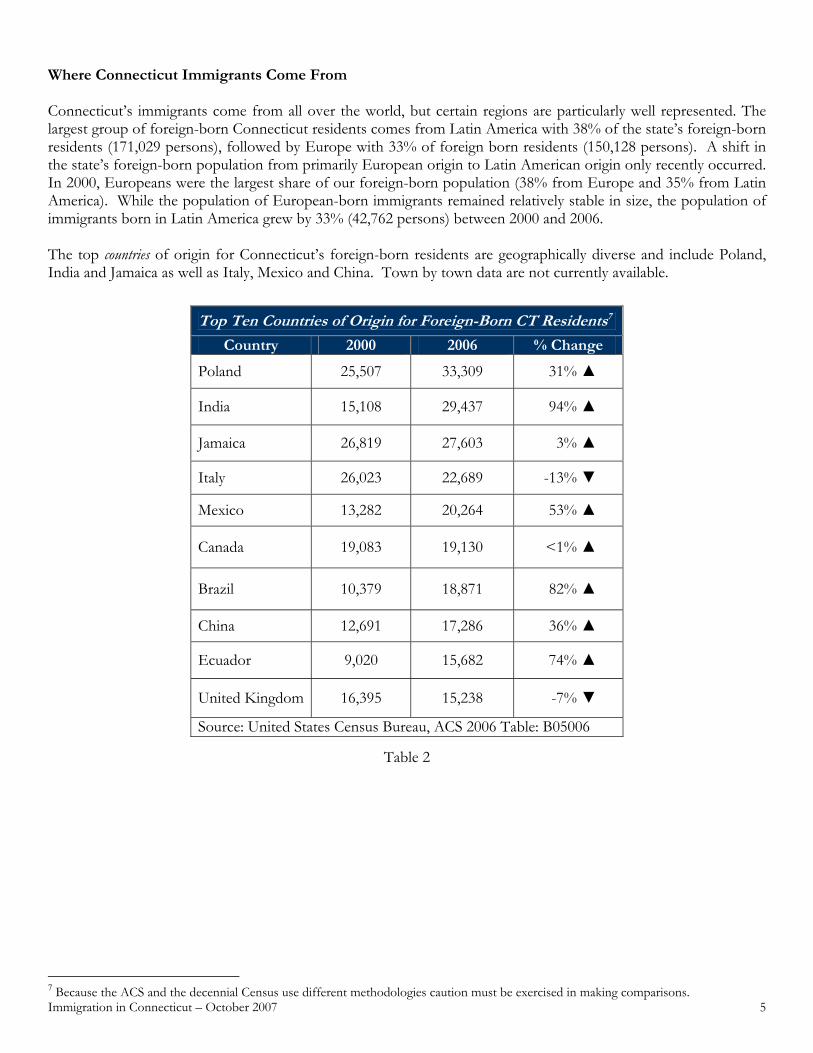
Where Connecticut Immigrants Come From Connecticut’s immigrants come from all over the world, but certain regions are particularly well represented. The largest group of foreign-born Connecticut residents comes from Latin America with 38% of the state’s foreign-born residents (171,029 persons), followed by Europe with 33% of foreign born residents (150,128 persons). A shift in the state’s foreign-born population from primarily European origin to Latin American origin only recently occurred. In 2000, Europeans were the largest share of our foreign-born population (38% from Europe and 35% from Latin America). While the population of European-born immigrants remained relatively stable in size, the population of immigrants born in Latin America grew by 33% (42,762 persons) between 2000 and 2006. The top countries of origin for Connecticut’s foreign-born residents are geographically diverse and include Poland, India and Jamaica as well as Italy, Mexico and China. Town by town data are not currently available.
Table 2
7 Because the ACS and the decennial Census use different methodologies caution must be exercised in making comparisons.
Top Ten Countries of Origin for Foreign-Born CT Residents7
Country 2000 2006 % Change
Poland 25,507 33,309 31% ▲
India 15,108 29,437 94% ▲
Jamaica 26,819 27,603 3% ▲
Italy 26,023 22,689 -13% ▼
Mexico 13,282 20,264 53% ▲
Canada 19,083 19,130 <1% ▲
Brazil 10,379 18,871 82% ▲
China 12,691 17,286 36% ▲
Ecuador 9,020 15,682 74% ▲
United Kingdom 16,395 15,238 -7% ▼
Source: United States Census Bureau, ACS 2006 Table: B05006

Immigration in Connecticut – October 2007 6
Patterns of Immigration in Connecticut Connecticut’s patterns of immigration from various regions of the world have changed dramatically over the last three decades. As the accompanying table and Figure 2 below show, more of Connecticut’s immigrants who were born in Europe and other areas8 arrived prior to 1980 than in the decades since (47% and 39% respectively). By contrast, the largest share of Connecticut immigrants from Latin America (36%) arrived between 1990 and 1999. Immigrants from Asia are the most recent to arrive with 35% of foreign-born residents from Asia arriving in Connecticut since 2000.
Table 3
Figure 2
8 The designation ‘other areas’ includes countries other than those in Europe, Asia, or Latin America.
Year of Immigration to the United States, by Place of Birth
Birth Region Before 1980 1980 to 1989 1990 to 1999 After 2000 Total Europe 47% 12% 24% 16% 99%1 Asia 15% 18% 31% 35% 99%1 Latin America 15% 20% 36% 28% 99%1 Other Areas 39% 13% 24% 24% 100% 1. The total is not 100% due to rounding. Source: United States Census Bureau, ACS 2006, Table C05007

Immigration in Connecticut – October 2007 7
0%10%20%30%40%50%60%70%80%90%
100%
Europe Asia Latin America Other Areas
Connecticut Immigrants: Place of Birth by Year of Entry to the United States
Entered U.S. before 1980: Entered U.S. 1980 to 1989: Entered U.S. 1990 to 1999: Entered U.S. 2000 or later

Immigration in Connecticut – October 2007 8
Language Barriers Children living in homes where English is not the primary language Language barriers are one of the challenges immigrant families and their children face at school and work. According to the Connecticut State Department of Education (SDE), one in eight Connecticut children in the state’s K-12 schools lives in a home where English is not the primary language. For the past 12 years, the percentage of youth statewide who live in these circumstances has changed very little, remaining consistently between 11% and 13%. In some towns, however, the proportion of youth living in homes where English is not the primary language is much greater, with Hartford (47%), New Britain (43%) and Bridgeport (39%) having the highest rates.9 (See table 4 below). Notably, however, since 2000-2001, all three of these towns have experienced a decline in the number of children who live in homes where English is not the primary language. In 2000, New Britain had the highest percentage (65%) of students living in homes where English was not the primary language.10 As of 2005-2006, Hartford has the highest percentage (47%) of students living in homes where English is not the primary language.11 School districts with comparable student and family background characteristics are grouped into district reference groups (DRGs) by the State Department of Education12. The vast majority of students in homes where English is not the primary language are in our state’s two highest need DRGs out of the state’s nine DRGs: DRG H and DRG I. (See Figure 3)
9 Connecticut State Department of Education, Strategic School Profile Data, 2005-2006. 10 Between 2000 and 2005, New Britain changed its methodology for reporting the percentage of students living in homes with non-English home language. This might be partly responsible for the significant change in the reported size of this population. 11 Connecticut State Department of Education, Strategic School Profile Data, 2005-2006. 12 Districts are grouped by the State Department of Education into DRGs on the basis of median family income, parental education, parental occupation, percentage of children receiving free or reduced-price meals, percentage of children whose families speak a language other than English at home, and enrollment. For more information refer to, P. Canny, District Reference Groups (DRGs) Formerly Educational Reference Groups (ERGs), June 2006. Available at: www.ctkidslink.org/publications/ece06drgerg.pdf.
% of Students Living in Homes Where English is not the Primary Language, by DRG (2005-2006)
2.5%
6.4%
1.3%
5.6%
1.2%3.4%
6.4%
28.1%
33.7%
0%
5%
10%
15%
20%
25%
30%
35%
40%
A B C D E F G H I
District Refence Group

Immigration in Connecticut – October 2007 9
Figure 3 In the last few years, in DRG I (the grouping of Connecticut’s poorest and highest need school districts) there has been a decline in the percentage of students living in homes where English is not the primary language in five out of seven school districts. However, in DRG H (districts which are slightly less needy than in DRG I, but still of great need) there has been an increase in the percent of students whose home language is not English. (See Table 4)
Language Barriers for Connecticut Schoolchildren1
DRG I School District
% Non-English Home Language (2000-2001)
% Non-English Home Language
(2005-2006) DRG H
School District
% Non-English Home Language
(2000-2001)
% Non-English Home Language
(2005-2006) Bridgeport 40% 39% Ansonia 5% 11% Hartford 56% 47% Danbury 30% 38% New Britain 65% 43% Derby 12% 14% New Haven 30% 29% East Hartford 16% 17% New London 12% 26% Meriden 24% 28% Waterbury 21% 14% Norwalk 25% 36% Windham 14% 28% Norwich 8% 18% Stamford 31% 35% West Haven 12% 15% Source: SDE, Strategic School Profiles 2000-2001 and 2005-2006.
Table 4
Source: Strategic School Profile Data, 2005-2006
Immigration in Connecticut – October 2007 10
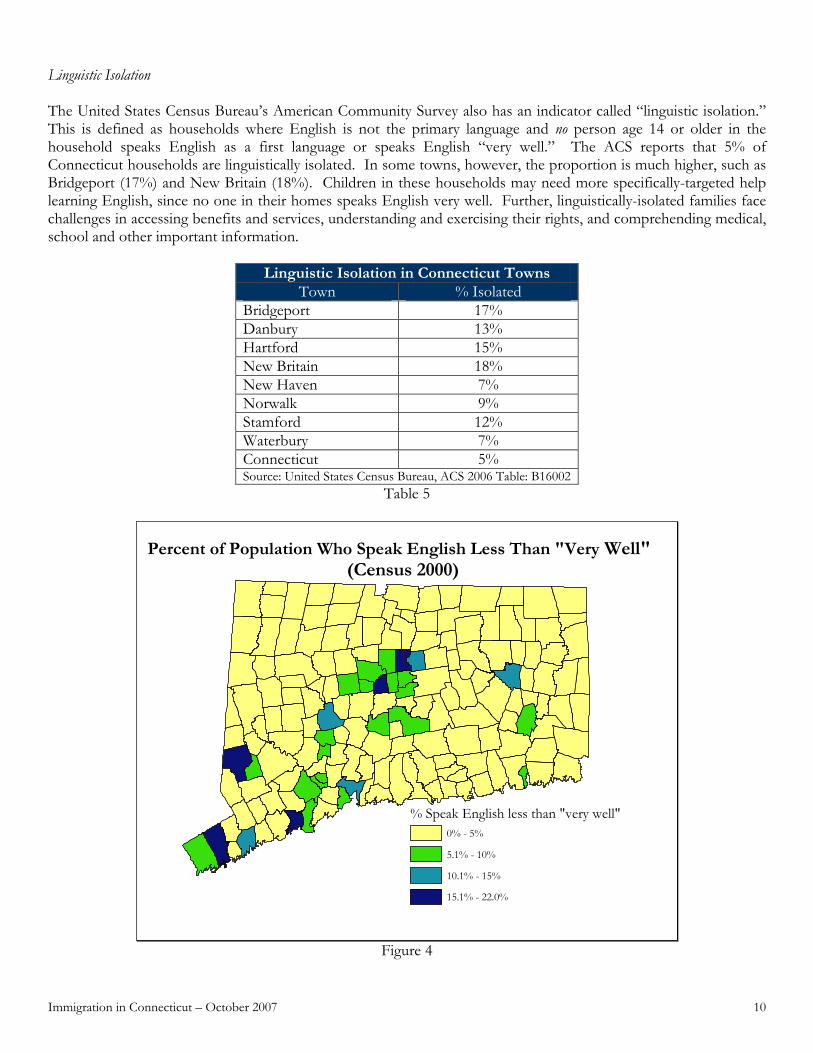
Linguistic Isolation The United States Census Bureau’s American Community Survey also has an indicator called “linguistic isolation.” This is defined as households where English is not the primary language and no person age 14 or older in the household speaks English as a first language or speaks English “very well.” The ACS reports that 5% of Connecticut households are linguistically isolated. In some towns, however, the proportion is much higher, such as Bridgeport (17%) and New Britain (18%). Children in these households may need more specifically-targeted help learning English, since no one in their homes speaks English very well. Further, linguistically-isolated families face challenges in accessing benefits and services, understanding and exercising their rights, and comprehending medical, school and other important information.
Linguistic Isolation in Connecticut Towns Town % Isolated
Bridgeport 17% Danbury 13% Hartford 15% New Britain 18% New Haven 7% Norwalk 9% Stamford 12% Waterbury 7% Connecticut 5% Source: United States Census Bureau, ACS 2006 Table: B16002
Table 5
Percent of Population Who Speak English Less Than "Very Well"
(Census 2000)
% Speak English less than "very well" 0% - 5%
5.1% - 10%
10.1% - 15%
15.1% - 22.0%
Figure 4
Immigration in Connecticut – October 2007 11
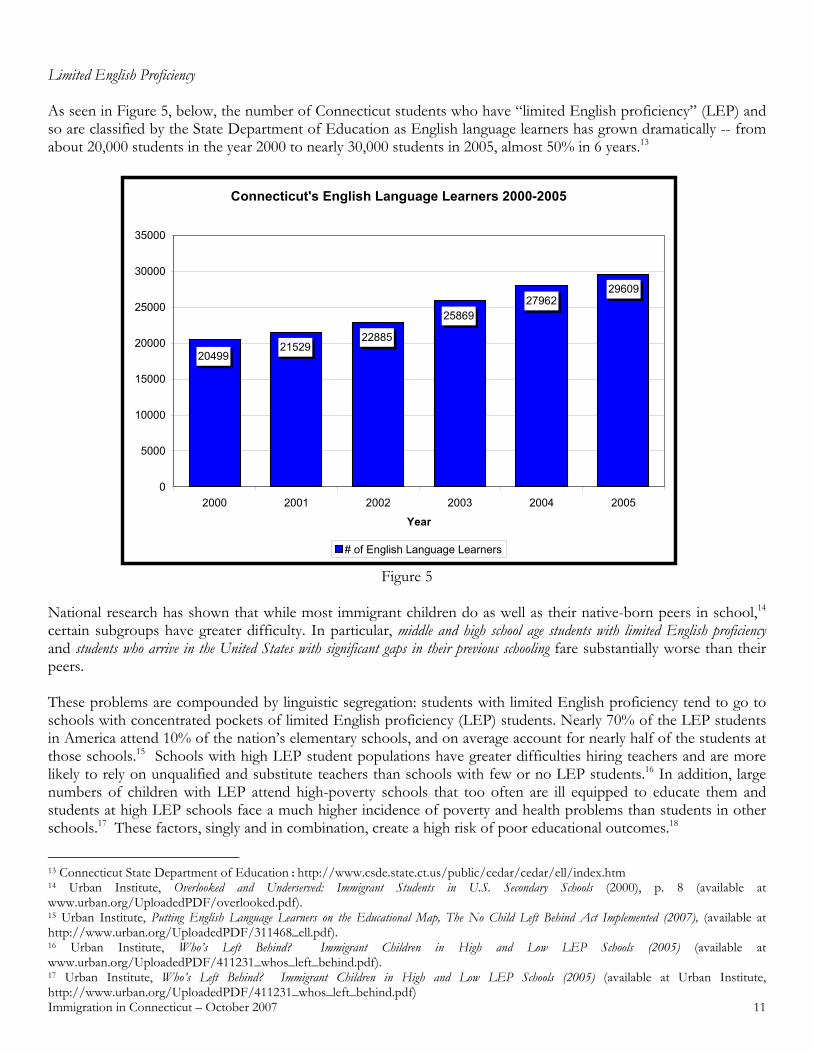
Limited English Proficiency As seen in Figure 5, below, the number of Connecticut students who have “limited English proficiency” (LEP) and so are classified by the State Department of Education as English language learners has grown dramatically -- from about 20,000 students in the year 2000 to nearly 30,000 students in 2005, almost 50% in 6 years.13
Figure 5 National research has shown that while most immigrant children do as well as their native-born peers in school,14 certain subgroups have greater difficulty. In particular, middle and high school age students with limited English proficiency and students who arrive in the United States with significant gaps in their previous schooling fare substantially worse than their peers. These problems are compounded by linguistic segregation: students with limited English proficiency tend to go to schools with concentrated pockets of limited English proficiency (LEP) students. Nearly 70% of the LEP students in America attend 10% of the nation’s elementary schools, and on average account for nearly half of the students at those schools.15 Schools with high LEP student populations have greater difficulties hiring teachers and are more likely to rely on unqualified and substitute teachers than schools with few or no LEP students.16 In addition, large numbers of children with LEP attend high-poverty schools that too often are ill equipped to educate them and students at high LEP schools face a much higher incidence of poverty and health problems than students in other schools.17 These factors, singly and in combination, create a high risk of poor educational outcomes.18
13 Connecticut State Department of Education : http://www.csde.state.ct.us/public/cedar/cedar/ell/index.htm 14 Urban Institute, Overlooked and Underserved: Immigrant Students in U.S. Secondary Schools (2000), p. 8 (available at www.urban.org/UploadedPDF/overlooked.pdf). 15 Urban Institute, Putting English Language Learners on the Educational Map, The No Child Left Behind Act Implemented (2007), (available at http://www.urban.org/UploadedPDF/311468_ell.pdf). 16 Urban Institute, Who’s Left Behind? Immigrant Children in High and Low LEP Schools (2005) (available at www.urban.org/UploadedPDF/411231_whos_left_behind.pdf). 17 Urban Institute, Who’s Left Behind? Immigrant Children in High and Low LEP Schools (2005) (available at Urban Institute, http://www.urban.org/UploadedPDF/411231_whos_left_behind.pdf)
Connecticut's English Language Learners 2000-2005
2960927962
25869
2288521529
20499
0
5000
10000
15000
20000
25000
30000
35000
2000 2001 2002 2003 2004 2005
Year
# of English Language Learners
Immigration in Connecticut – October 2007 12
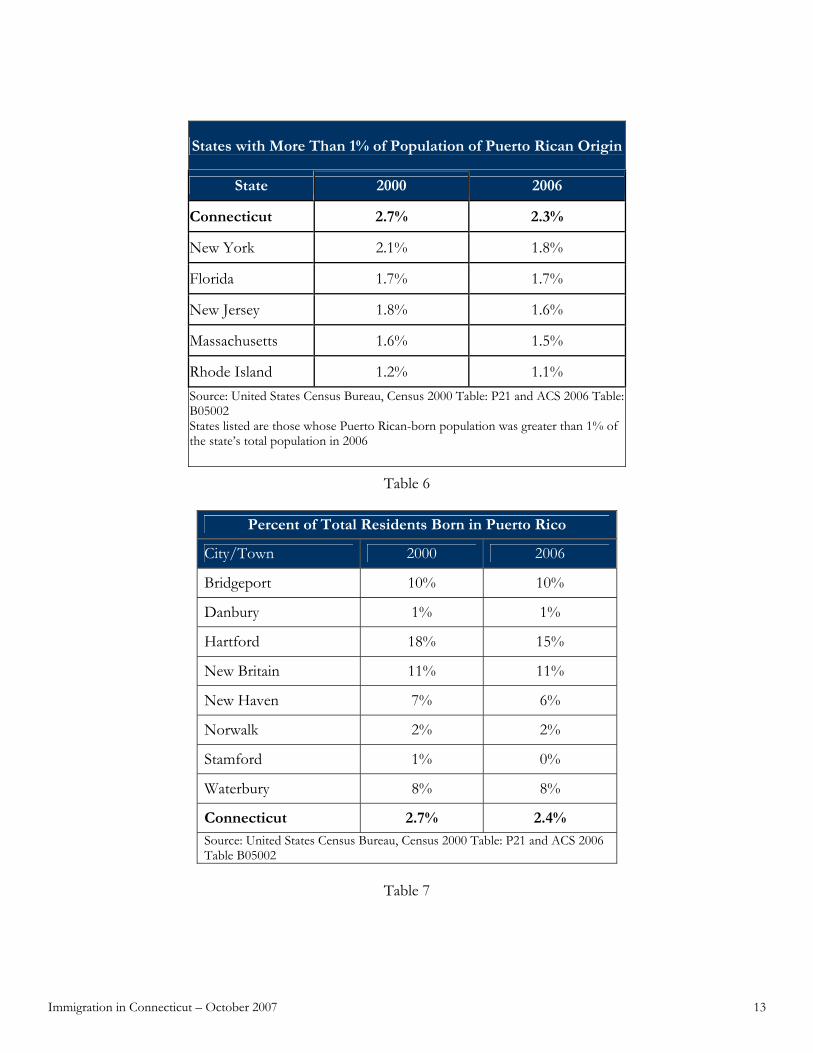
Employment, Income and Poverty Foreign-born residents now are an established and growing sector of Connecticut’s work force. The 2006 ACS also provides data on employment and educational attainment for foreign-born residents. The number of foreign-born workers in Connecticut grew by 36% between 2000 and 2006, about twice the growth the group experienced between 1990 and 2000. More than half of Connecticut’s foreign-born workers are U.S. citizens. Foreign-born residents are as likely to be employed as native-born residents (69% of foreign-born residents are in the workforce, compare to 68% of native-born residents.) They are employed in various fields throughout Connecticut’s economy, most commonly in management and professional (31.4%), service (22.6%), and sales and office occupations (19.6%). Connecticut’s foreign-born workforce is disproportionately lower income; immigrants are more likely to work in low wage jobs. An analysis of the 2006 ACS data shows that twenty-seven percent of Connecticut’s native-born, full time, year-round workers earned less than $35,000 in 2006, whereas 43% of Connecticut foreign-born workers earned less than $35,000. This is likely due, in part, to lower levels of academic attainment within the foreign-born population, compared to the native-born population. Connecticut foreign-born workers age 25 and older are twice as likely as native-born workers age 25 and older to have less than a high school education. Among Connecticut residents, 8% of those born in the United States live below the poverty level, as compared to 9% of foreign-born. However, foreign-born married couple families with at least one child under the age of five are almost three times more likely to be in poverty than native-born families. Consequently, many children of immigrants grow up in poverty, yet often face barriers (including language barriers, ineligibility for benefits, and distrust) that prevent them from receiving needed benefits and services. Connecticut’s Puerto Rican Population19 Among all states, Connecticut has the largest proportion of residents born in Puerto Rico and Hartford has a fifth of Connecticut’s Puerto Rican population (Table 6). As of the 2006 American Community Survey, 86,118 Connecticut residents were born in Puerto Rico (2.4%). The population of Connecticut residents born in Puerto Rico has decreased by 4,405 (4.9%) since the 2000 Census. Although children and parents who were born in Puerto Rico are United States citizens, they share many important characteristics with immigrant groups, such as cultural differences, language difficulties, and low-wage work. They make up a substantial proportion of the population in many Connecticut cities. Indeed, in some Connecticut cities, the Puerto Rican population far surpasses populations from other places. In Hartford, the Puerto Rican population is almost as large as its total foreign-born population. (Table 7)
18 Urban Institute: Overlooked and Underserved: Immigrant Students in U.S. Secondary Schools (2000) (available at www.urban.org/UploadedPDF/overlooked.pdf). 19 Because this paper is first and foremost a study of immigration, data included here for Puerto Ricans focuses on those who have moved to the United States from Puerto Rico. They are not counted in the “foreign born” population because they are U.S. citizens. There is also a larger Puerto Rican community, consisting of residents whose ancestors moved to the United States from Puerto Rico, that shares many of the challenges experienced by families who recently have migrated from Puerto Rico.
Immigration in Connecticut – October 2007 13
Table 6
Percent of Total Residents Born in Puerto Rico
City/Town 2000 2006
Bridgeport 10% 10%
Danbury 1% 1%
Hartford 18% 15%
New Britain 11% 11%
New Haven 7% 6%
Norwalk 2% 2%
Stamford 1% 0%
Waterbury 8% 8%
Connecticut 2.7% 2.4% Source: United States Census Bureau, Census 2000 Table: P21 and ACS 2006 Table B05002
Table 7
States with More Than 1% of Population of Puerto Rican Origin
State 2000 2006
Connecticut 2.7% 2.3%
New York 2.1% 1.8%
Florida 1.7% 1.7%
New Jersey 1.8% 1.6%
Massachusetts 1.6% 1.5%
Rhode Island 1.2% 1.1% Source: United States Census Bureau, Census 2000 Table: P21 and ACS 2006 Table: B05002 States listed are those whose Puerto Rican-born population was greater than 1% of the state’s total population in 2006

Immigration in Connecticut – October 2007 14
Citizenship and Legal Status Most children of immigrants are citizens—even if their parents are not.20 In fact, nationwide, 75 percent of all children of immigrants live in what are called “mixed-status” families, in which the parents are not citizens but their children are.21 Because so many families are mixed-status, policies aimed at non-citizens often affect large numbers of children who are United States citizens. Immigrants in Connecticut can be divided into five categories:22
o Naturalized citizens; o Legal permanent residents; o Refugees and asylees; o Temporary workers and educational visa holders; o Undocumented immigrants.23
While the Census does not report data for each of these categories, according to the 2006 ACS 46% of Connecticut’s foreign born residents are naturalized citizens. Importantly, families may have members from multiple categories. For example, families with parents who are legal permanent residents or even citizens may include a relative who is undocumented. As mentioned above, citizen children may have one or more parents or siblings who are undocumented. Also, many immigrants change status. For instance, some students become legal residents through marriage or employment, some undocumented asylum-seekers are granted asylum, some permanent residents become naturalized citizens, and some temporary visa holders violate the conditions of their visas and fall out of status.24 Conclusion – Increased Immigration Provides Opportunities Since our first report on immigration in January 2005, the percent of Connecticut residents who are foreign-born has increased –Connecticut now has the 11th highest percentage of foreign-born residents in the country. Connecticut’s growing immigrant population presents unique opportunities for Connecticut. First, this more youthful immigrant population can help to offset the potential challenges of Connecticut’s aging population by expanding the labor pool, assuring Connecticut’s economy a more adequately sized workforce. Second, the language skills and cultural competencies of Connecticut's immigrants, along with their established ties to dozens of countries, will be strong competitive assets for the state in this increasingly global economy. Finally, these workers will expand Connecticut’s tax base, a necessity if Connecticut is to have sufficient revenues to support publicly-funded services, such as health care and housing, for its growing elderly population.
20 Children born in the United States to foreign-born parents are automatically United States citizens, regardless of parental immigration or citizenship status. The Fourteenth Amendment to the United States Constitution states: “All persons born or naturalized in the United States…are citizens of the United States and of the State wherein they reside.” 21 Urban Institute, Immigration -- Issues in Focus (2004). In this instance, the Urban Institute defines “mixed families” as those “made up of non-citizen parents and citizen children” www.urban.org/content/IssuesInFocus/immigrationstudies/immigration.htm#findings. Other Urban Institute studies acknowledge that “mixed families” can be defined as families in which either some, or all, children are citizens. See Randolph Capps, et al, Health Insurance Coverage of Children in Mixed-Status Immigrant Families (Urban Institute, 2003). 22 For definitions and more information, see Urban Institute, The New Neighbors. www.urban.org/UploadedPDF/310844_the_new_neighbors.pdf, p.14 23 For purposes of this paper, this category includes immigrants who do not have legal immigration status or who are in immigration court proceedings to determine the legality of their status. 24 In addition, legal permanent residents -- including long-time residents with US citizen spouses, parents, or children-can become deportable for a wide range of criminal convictions. (For additional information see: Human Rights Watch, Forced Apart: Families Separated and Immigrants Harmed by United States Deportation Policy, Volume 19, No. 3. Available at: http://hrw.org/reports/2007/us0707)

Immigration in Connecticut – October 2007 15
Yet immigrant children and families continue to face barriers to success in Connecticut. Unfortunately, a combination of barriers involving language, employment and poverty can lead the children of immigrants to fall behind the children of native-born residents. As mentioned earlier in this report, these barriers include:
• Language barriers – One in eight children in Connecticut’s K-12 schools lives in a home where English is not the primary language and 29,609 students in Connecticut schools were classified as having limited English proficiency (LEP) in 2005. The LEP population has grown by almost 50% since 2000.
• Linguistic isolation – A total of 5% of Connecticut households live in linguistic isolation, i.e., households where English is not the primary language and no person age 14 or older speaks English as a first language or speaks English “very well”
• Lower Wage Jobs – A disproportionate number of foreign-born residents work in low wage jobs. • Lower Academic Attainment – Foreign-born workers age 25 and older are twice as likely as native-born
workers age 25 and older to have less than a high school education. Connecticut’s challenge is to ensure that these recent immigrants, and their children, receive the supports and education necessary to achieve their full potential, not only for their own well-being but for all of Connecticut.25 To do so, policymakers must address the specific challenges facing immigrant children and families, including :
• Expanding English language programs for foreign-born children and their parents. • Assuring that information about state-funded programs and services for which this population may be
eligible is communicated in multiple languages. • Expanding training and employment opportunities for immigrant parents. • Increasing state funding to school districts with a disproportionate share of immigrant children to help them
address the students’ unique educational needs.26
25
For additional information on the condition of immigrants in Connecticut, as well as throughout the United States, please refer to Migration Policy Institute (www.migrationinformation.com). Their website includes four fact sheets of note, which detail the status of immigrants in Connecticut across varied domains. Workforce Characteristics: http://www.migrationinformation.org/datahub/state3.cfm?ID=CT Demographic and Social: http://www.migrationinformation.org/datahub/state.cfm?ID=CT Income and Poverty: http://www.migrationinformation.org/datahub/state4.cfm?ID=CT Language and Education: http://www.migrationinformation.org/datahub/state2.cfm?ID=CT 26 In the 2007 General Assembly Session, for example, the formula for the Education Cost Sharing (ECS) grant was revised to give even greater weight for Limited English Proficiency students when determining funding for school districts – from a weight of 110% to 115% per LEP student. PA 07-03 §61 (25) (E). This enhances the funding available to districts with large numbers of LEP students.
Related Documents