Immigration and Crime in Spain, 1999-2006 by Cesar Alonso * , Nuno Garoupa ** , Marcelo Perera *** and Pablo Vazquez **** DOCUMENTO DE TRABAJO 2008-34 Serie Inmigración CÁTEDRA Fedea - Banco Popular October 2008 This Paper has been prepared for the Fedea Report 2008 * Universidad Carlos III de Madrid. ** IMDEA. *** Centro de Investigaciones Económicas CINVE-Uruguay. **** FEDEA. Los Documentos de Trabajo se distribuyen gratuitamente a las Universidades e Instituciones de Investigación que lo solicitan. No obstante están disponibles en texto completo a través de Internet: http://www.fedea.es. These Working Paper are distributed free of charge to University Department and other Research Centres. They are also available through Internet: http://www.fedea.es . ISSN:1696-750

Welcome message from author
This document is posted to help you gain knowledge. Please leave a comment to let me know what you think about it! Share it to your friends and learn new things together.
Transcript
Immigration and Crime in Spain, 1999-2006 by
Cesar Alonso*, Nuno Garoupa**, Marcelo Perera*** and Pablo Vazquez**** DOCUMENTO DE TRABAJO 2008-34
Serie Inmigración CÁTEDRA Fedea - Banco Popular
October 2008
This Paper has been prepared for the Fedea Report 2008
* Universidad Carlos III de Madrid. ** IMDEA. *** Centro de Investigaciones Económicas CINVE-Uruguay. **** FEDEA. Los Documentos de Trabajo se distribuyen gratuitamente a las Universidades e Instituciones de Investigación que lo solicitan. No obstante están disponibles en texto completo a través de Internet: http://www.fedea.es. These Working Paper are distributed free of charge to University Department and other Research Centres. They are also available through Internet: http://www.fedea.es. ISSN:1696-750
Immigration and Crime in Spain, 1999-20061
César Alonso-Borrego Nuno Garoupa Marcelo Perera Pablo Vázquez
October, 2008 Abstract: Crime in Spain is not high, by European standards, but together with immigration, crime rates have increased significantly in the last decade. The goals of this paper are (i) to evaluate empirically the extent to which there is either a negative or a positive correlation between crime and immigration and, (ii) to provide a preliminary assessment of the extent to which a causal mechanism can be identified. We find that both immigrants and natives have contributed to the increase in the crime rate. However, the contribution of immigrants seems to be relatively higher. This result is partly explained by the fact that immigration has contributed to the main increase of the collective of males aged 20 to 50, which are responsible for most offences, and by differences in socioeconomic opportunities between migrants and natives. After controlling for such differences, being an immigrant still plays a significant role, but its estimated effect is diminished and the gradual decrease in the crime rates for each nationality appears to indicate a lower propensity to commit criminal offences among the newly-arrived immigrants. We find significant differences in the behavior of immigrants towards crime by their nationality of origin. The crime gap between immigrants and natives is moderate, and can be largely explained by a higher propensity of immigrants to commit minor offences. This type of crimes, although being the less serious, generates a strong perception of insecurity among native population, but its number has decreased in recent years.
1 This paper has been written as a chapter of 2008 Fedea´s Report. Financial support from MMECC (EC project 044422) is acknowledged by Garoupa and from the Spanish Ministry of Education (Grant No. SEJ2006-05710/ECON) by Alonso-Borrego. We are grateful to comments by Antonio Cabrales and Marco Celentani, and to the capable research assistant work of Mario Alloza.
1
1. Introduction
Immigration and crime are intrinsically interconnected in the pop culture of the Spanish
media as in many other countries. Newspapers report everyday how certain criminal
acts are committed by immigrants. Even political parties take this issue as a serious
matter that justifies changes in policies. Opinion polls reflect that a significant part of
the population considers immigration an important problem and relates immigration to
crime. According to an opinion poll published by the newspaper El Mundo, over two
thirds of the population (66%) think there is a relation between immigration and public
un-safety (El Mundo, newspaper, August 18th, 2008). Naturally the relationship
between crime and immigration is neither new nor confined to Spain. However, what is
unclear is the extent to which such relationship in fact exists beyond anecdotal episodes
and relatively cavalier statistical interpretations of pre-selected data.
According to economic standard models of crime, as the one proposed by Becker, 1968
and Polinsky and Shavell, 2000 immigrants may undercomply with the law more
frequently than natives, if their benefits of crime are higher or their costs are lower.
Benefits and costs of crime could be different from that of natives: difficulties in the
labor market and lack of economic opportunities (Bianchi, Buonanno and Pinotti,
2008); ethnical homogeneity as a mechanism of control and quality assurance (Garoupa,
2007); different costs of undercompliance due to distinctive cultural perceptions
(Dharmapala and Garoupa 2004; McAdams 2000); or even less knowledge of local
laws, can affect the costs and benefits of committing a crime and explain the differences
in crime rates (Garoupa, 1997). Only a serious and rigorous empirical analysis can
decide if that profile does actually prevail in reality.
The goal of this paper is to use Spain as a case study to (i) evaluate empirically the
correlation between crime and immigration and, (ii) provide a preliminary assessment
of the extent to which a causal mechanism - such as “ceteris paribus, being an
2
immigrant makes an individual more likely to perpetrate crimes” – can be identified.
We answer (i) in the positive and (ii) in the negative.
In the first part of the paper, Section 2, we intend to perform a comprehensive
description of crime in Spain. Our results are summarized in the following.
When compared to other European countries, the crime rate in Spain cannot be
considered particularly high. The notable exception is theft-related crime, for which
Spain is second only to France. But the prominence of France and Spain can be
explained observing that tourists are often the passive targets of theft-related crimes,
and that Spain and France can have large populations of tourists.
The available statistics for Spain make it possible calculate the crime rate in accordance
with the number of arrested and convicted persons, two different sources of information
which complement each other, as it is possible to know the nationality of the arrested
persons and the province of origin of the convicted persons. Using both sources, we
have evidence that the crime rate in Spain has increased from 2000 to 2006 from 2.4 to
3.2 per thousand inhabitants in terms of convicted persons, and from 5.2 to 6.3 per
thousand inhabitants in the case of arrested persons. These increases are not negligible
when compared to other European countries.
It is worth noting that the crime rate has not increased steadily, but has experienced
sudden changes over the period under study. The most important of these changes took
place in 2003, when bodily harm conducts were no longer considered to be a minor but
a criminal offence. In fact, if we follow in detail the evolution of different types of
crimes during this period, the greatest growth is precisely related to this type of offences
against persons, while offences against property have experience a slight decrease in
numbers.
Crime rates of immigrants are substantially higher than those of natives. Although those
differences are still true today, they have been substantially reduced in the last few
years: the gap between their respective rates (in terms of per 1000 inhabitants) is now
close to 19 points, when using the data available for arrested persons.
3
When looking in closer detail at the role of foreign population in the growth of crime
rates, the first thing that draws attention is that both groups, immigrants and natives,
have contributed to its growth. More specifically, 32 percent of the crime rate growth
can be attributed to natives committing a greater number of offences, while a 48 percent
can be attributed to the arrival of immigrants with higher crime rates than natives. If we
examine in detail the number of committed offences, we can observe that the arrival of
immigrants have resulted in a lack of progress in the reduction of offences against
property and in a minor increase in the number of offences against Collective Security
(i.e. drugs and trafficking). In the case of natives, their contribution to the increase in
the crime rate is primarily concentrated in offences against persons. Although this type
of offence is increasing at a faster rate among immigrants than natives, when we
compare the population growth of both groups in the last few years, its growth is
particularly significant among natives. This can be mostly attributed to the more intense
prosecution of this type of offences, rather than to increasing crime rates among natives.
Further analysis of the (partial) contribution of immigrants to the growth of the crime
rate in Spain reveals that, in particular, foreigners from African countries have made a
significant contribution to the increase in the number of drug and property related
offences. For the rest of immigrants, it appears to exist a certain link between country of
origin and type of offences, although this not particularly significant. In any case, the
gradual decrease in the crime rates for every nationality appears to indicate a lower
propensity to commit criminal offences among the newly-arrived immigrants.
In the period under study, we also find an increase in the number of minor offences
(misdemeanours), but a decrease in the number of arrested persons for this type of
offences. This is the result of an increase in the number of minor offences against
property, which usually have relatively low rates of resolution and detainment. For this
type of minor offences, foreigners show a significant higher crime rate than natives,
especially in the case of foreigners from Algeria and Romania. The incidence of minor
offences against property among natives have significantly decreased in the period.
In this work we also attempt to elucidate the reasons behind the differences between the
criminal rates of immigrants and natives. More particularly, we want to assess whether
these differences are due to the fact that immigrants find themselves in a social and
economic situation where the propensity to commit an offence is higher, or whether
4
they can be attributed to cultural factors. From the data available about homicides, a
type of criminal offence easy to compare between both groups, we find that both factors
are relatively significant.
In the second part of the paper, section 3, we focus on property crimes and minor
crimes. Our econometric results confirm the conclusions of the descriptive analysis:
crime rate and immigrants’ share are positive and significantly correlated, even after
controlling for all observed socioeconomic and demographic factors. Controlling for
socioeconomic and demographic factors, which capture differences among natives and
immigrants that potentially affect the propensity towards crime, the effect of the
immigrants’ share is reduced but it is still significant.
The econometric analysis of section 3 provides an an assessment of the effect of
immigration on the crime rate that parallels the findings of our descriptive analysis:
immigration matters in order to explain the crime rate, but its importance should not be
overstated. Age reveals as the main channel through which immigration has led to an
increase in the crime rate. In particular, the fact that immigration tends to increase the
weight of males aged 20 to 50 in Spanish population, which is the group more prone to
commit crime, is behind the significant effect of the immigrants’ share.
A further econometric exercise shows that even after controlling for socioeconomic
factors, a differential in crime rates between native and immigrants remains. Our
estimates indicate that higher proportions of American, non-UE European, and African
immigrants tend to widen the crime differential, with the estimated effect being largest
for the latter ones.
2. Immigration and crime in Spain.
2.1 The evolution of the crime rate in Spain, 2000-2006
The crime rate (CR) is calculated as the ratio of number of offences to total population.
It is also the most appropriate variable to measure the evolution of crime incidence
when there has been a significant population growth (as it has been the case of Spain for
the last few years), because this population increase is taken into account in this
5
measure, thus showing whether the increase in the number of offences has been offset
or not by the population growth.
During an episode of substantial population growth, it can be expected a corresponding
increase in the number of committed offences. Notwithstanding, the main matter of
concern is whether the increase in crime incidence exceeds the population growth rate
or not.
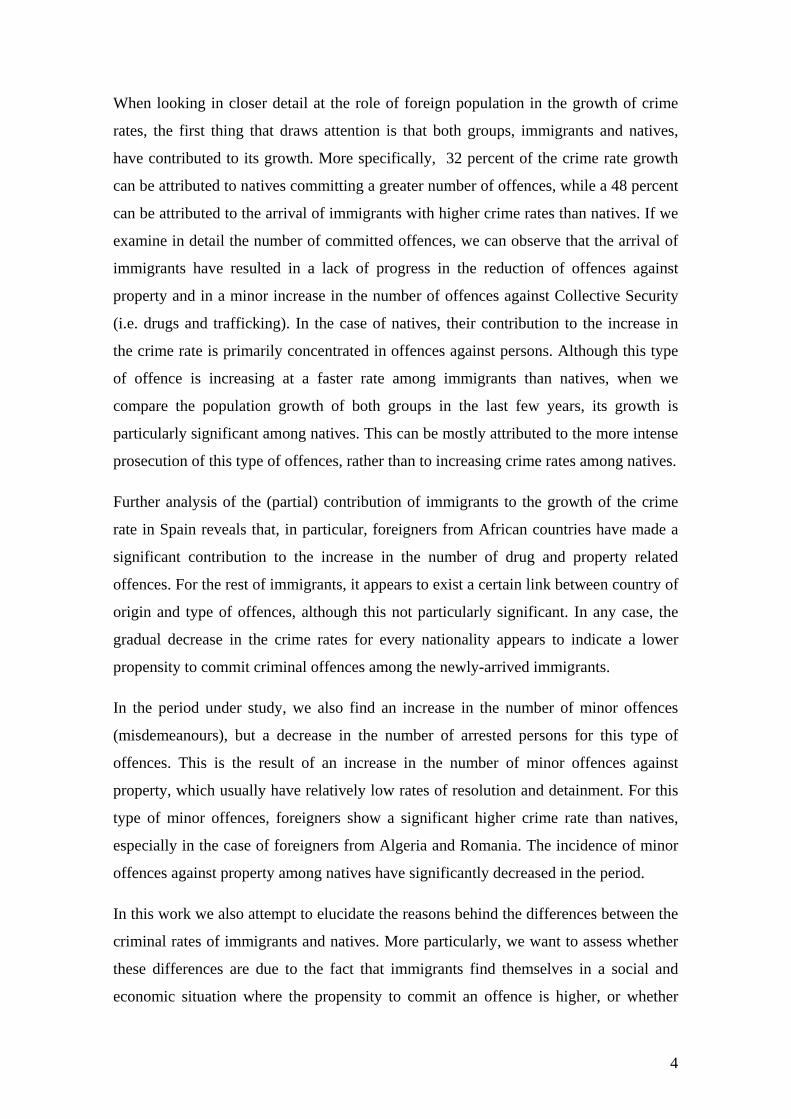
When comparing with neighbouring countries, the crime rate in Spain is not particularly
high, fluctuating from 50 to 60 offences per thousand inhabitants for the year 2006. (See
Figure 1)2.
Fig. 1. UE 15 Crime Rates, 2006
0 50 100 1
Sweden
UK
Belgium
Denmark
Germany
Netherlands
Austria
Finland
France
Luxembourg
Spain
Italy
Greece
Portugal
Ireland
Offences per 1000 inhabitantsSource: Eurostat
50
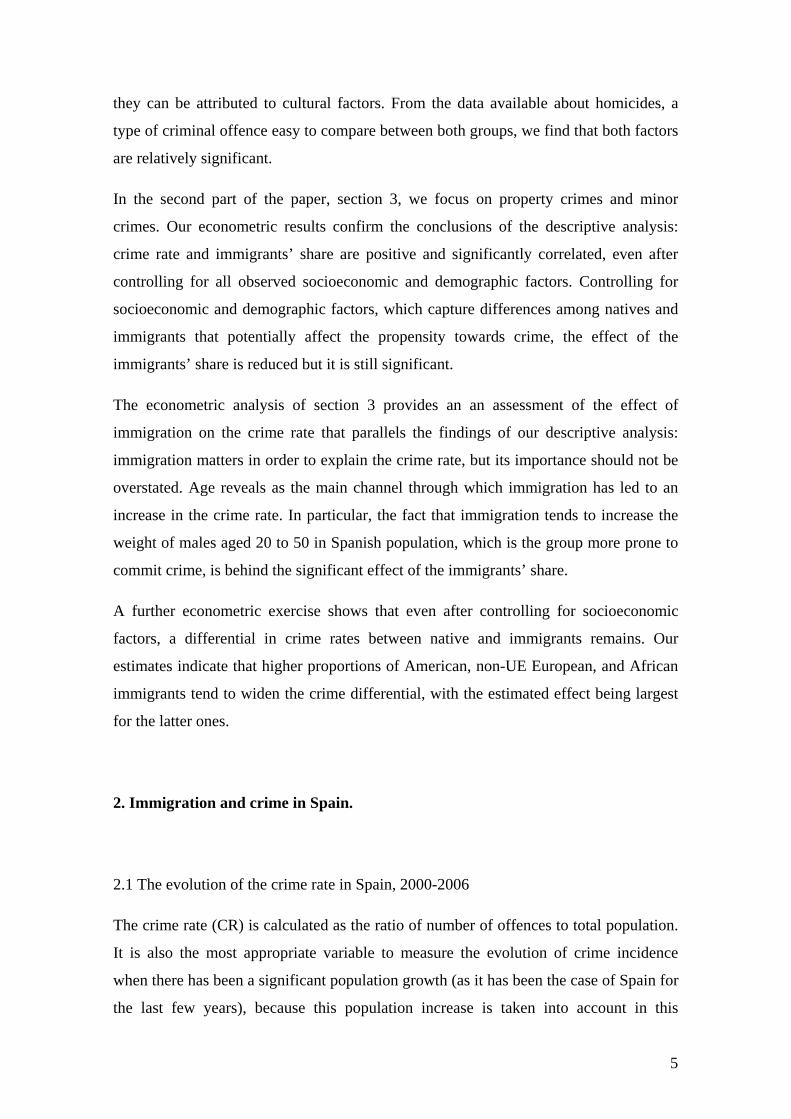
If we focus our attention in some of the most standardised offences, like homicide and
theft (see Figures 2 and 3), which can be regarded as more comparable across
countries, Spain is ranked at an average position in relation to homicides, but ranks
close to the top in terms of theft. In the last case, it is just behind France, the other main
tourist destination in the EU15. For this reason, it can be argued that a more accurate
2It is difficult, though, to compare crimes between different countries. A particular behavior like drug consumption is considered to be an offence in some countries while not in others. Likewise, certain acts can be considered minor offences while in other countries are prosecuted as criminal offences, eliciting different judicial responses and sentences. Despite these differences, international comparisons are still useful as a point of reference for our work.
6
picture would require calculating theft-rates using as not only nationals, but also
tourists, who are often the passive victims of these petty crimes, as population of
reference. An alternative would be to subtract the number of theft-related crimes
suffered by tourists to the total.
Fig. 2 and 3: UE Rates of Homicide and Theft (respectively), 2006
0
5
10
15
20
25
Austria
Denmark
German
y
Netherlan
ds
Greece
Sweden
Spain
Italy
Portug
al
France UK
Irelan
d
Belgium
Luex
mbourg
Finlan
d
Hom
icid
es p
er m
illio
n of
inha
bita
nts
Source: Eurostat
0,0
0,5
1,0
1,5
2,0
2,5
Greece
Irelan
d
Finlan
d
Luxe
mbourg
Austria
German
y
Netherlan
ds
Denmark
Sweden Ita
ly UK
Belgium
Portug
alSpa
in
France
Rob
beri
es p
er 1
000
inha
bita
nts
Source: Eurostat
The available data for Spain make it possible to estimate the crime rates in relation to
the number of arrested and convicted persons. These represent two complementary
sources of information: on the one hand, the data for arrested persons provides us with
information about the nationality of likely offenders and, on the other, the data for
convicted persons indicates the province in which the criminal offence took place (there
are also other important differences which will be explained below). Both sources of
information reveal the growth of crime rates in Spain for the period from 2000 to 2006,
moving from 2.4 to 3.2 per thousand inhabitants in the case of convicted persons, and
from 5.2 to 6.3 per thousand inhabitants in the case of arrested persons.
This is a moderate growth in terms of crime rate. (To put this figures in context we can
consider, for example, that the current difference in crime rates between Spain and
France or Spain and Germany is 9 and 27 points respectively). But this growth, though
moderate, is still significant when compared to the downward trend in crimes rate
experienced by other EU countries for the same period of time. As can be seen in Figure
4, Spain is one of the EU countries with the highest growth in its crime rate.
7
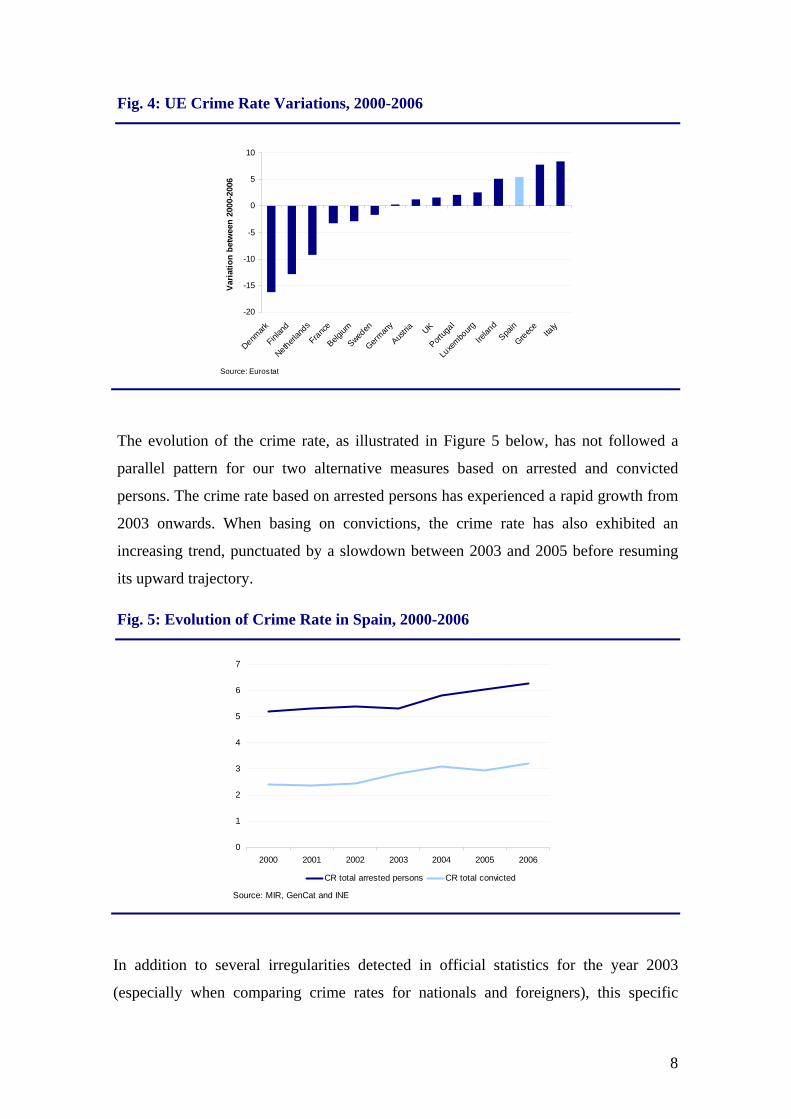
Fig. 4: UE Crime Rate Variations, 2000-2006
-20
-15
-10
-5
0
5
10
Denmark
Finlan
d
Netherlan
ds
France
Belgium
Sweden
German
y
Austria UK
Portug
al
Luxe
mbourg
Irelan
dSpa
in
Greece
Italy
Vari
atio
n be
twee
n 20
00-2
006
Source: Eurostat
The evolution of the crime rate, as illustrated in Figure 5 below, has not followed a
parallel pattern for our two alternative measures based on arrested and convicted
persons. The crime rate based on arrested persons has experienced a rapid growth from
2003 onwards. When basing on convictions, the crime rate has also exhibited an
increasing trend, punctuated by a slowdown between 2003 and 2005 before resuming
its upward trajectory.
Fig. 5: Evolution of Crime Rate in Spain, 2000-2006
0
1
2
3
4
5
6
7
2000 2001 2002 2003 2004 2005 2006
CR total arrested persons CR total convicted
Source: MIR, GenCat and INE
In addition to several irregularities detected in official statistics for the year 2003
(especially when comparing crime rates for nationals and foreigners), this specific
8
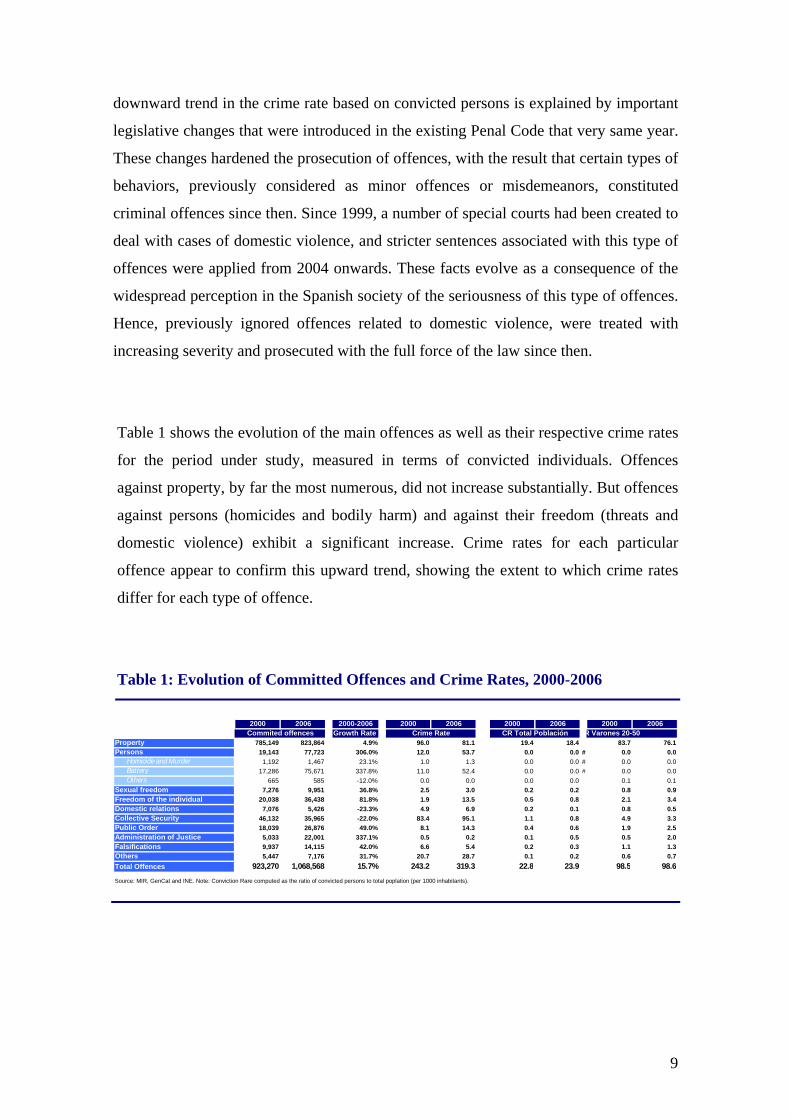
downward trend in the crime rate based on convicted persons is explained by important
legislative changes that were introduced in the existing Penal Code that very same year.
These changes hardened the prosecution of offences, with the result that certain types of
behaviors, previously considered as minor offences or misdemeanors, constituted
criminal offences since then. Since 1999, a number of special courts had been created to
deal with cases of domestic violence, and stricter sentences associated with this type of
offences were applied from 2004 onwards. These facts evolve as a consequence of the
widespread perception in the Spanish society of the seriousness of this type of offences.
Hence, previously ignored offences related to domestic violence, were treated with
increasing severity and prosecuted with the full force of the law since then.
Table 1 shows the evolution of the main offences as well as their respective crime rates
for the period under study, measured in terms of convicted individuals. Offences
against property, by far the most numerous, did not increase substantially. But offences
against persons (homicides and bodily harm) and against their freedom (threats and
domestic violence) exhibit a significant increase. Crime rates for each particular
offence appear to confirm this upward trend, showing the extent to which crime rates
differ for each type of offence.
Table 1: Evolution of Committed Offences and Crime Rates, 2000-2006
2000 2006 2000-2006 2000 2006 2000 2006 2000 2006Growth Rate CR Varones 20-50
Property 785,149 823,864 4.9% 96.0 81.1 19.4 18.4 83.7 76.1Persons 19,143 77,723 306.0% 12.0 53.7 0.0 0.0 # 0.0 0.0
Homicide and Murder 1,192 1,467 23.1% 1.0 1.3 0.0 0.0 # 0.0 0.0Battery 17,286 75,671 337.8% 11.0 52.4 0.0 0.0 # 0.0 0.0Others 665 585 -12.0% 0.0 0.0 0.0 0.0 0.1 0.1
Sexual freedom 7,276 9,951 36.8% 2.5 3.0 0.2 0.2 0.8 0.9Freedom of the individual 20,038 36,438 81.8% 1.9 13.5 0.5 0.8 2.1 3.4Domestic relations 7,076 5,426 -23.3% 4.9 6.9 0.2 0.1 0.8 0.5Collective Security 46,132 35,965 -22.0% 83.4 95.1 1.1 0.8 4.9 3.3Public Order 18,039 26,876 49.0% 8.1 14.3 0.4 0.6 1.9 2.5Administration of Justice 5,033 22,001 337.1% 0.5 0.2 0.1 0.5 0.5 2.0Falsifications 9,937 14,115 42.0% 6.6 5.4 0.2 0.3 1.1 1.3Others 5,447 7,176 31.7% 20.7 28.7 0.1 0.2 0.6 0.7Total Offences 923,270 1,068,568 15.7% 243.2 319.3 22.8 23.9 98.5 98.6
Source: MIR, GenCat and INE. Note: Conviction Rare computed as the ratio of convicted persons to total poplation (per 1000 inhabitants).
Commited offences CR Total PoblaciónCrime Rate
9
2.2. Offences committed by foreigners
The apparent correlation between the arrival of immigrants and the growth of crime
rates poses an interesting question about the relationship between both variables. A
proper answer requires analyzing, first of all, the actual crime rates for nationals and
immigrants provided by the two main available sources, namely, the statistics of
arrested and convicted persons.
2.2.1 Age and gender
If we want to compare nationals and immigrants, we have to take into account two
important aspects which set both groups apart: their gender and age composition.
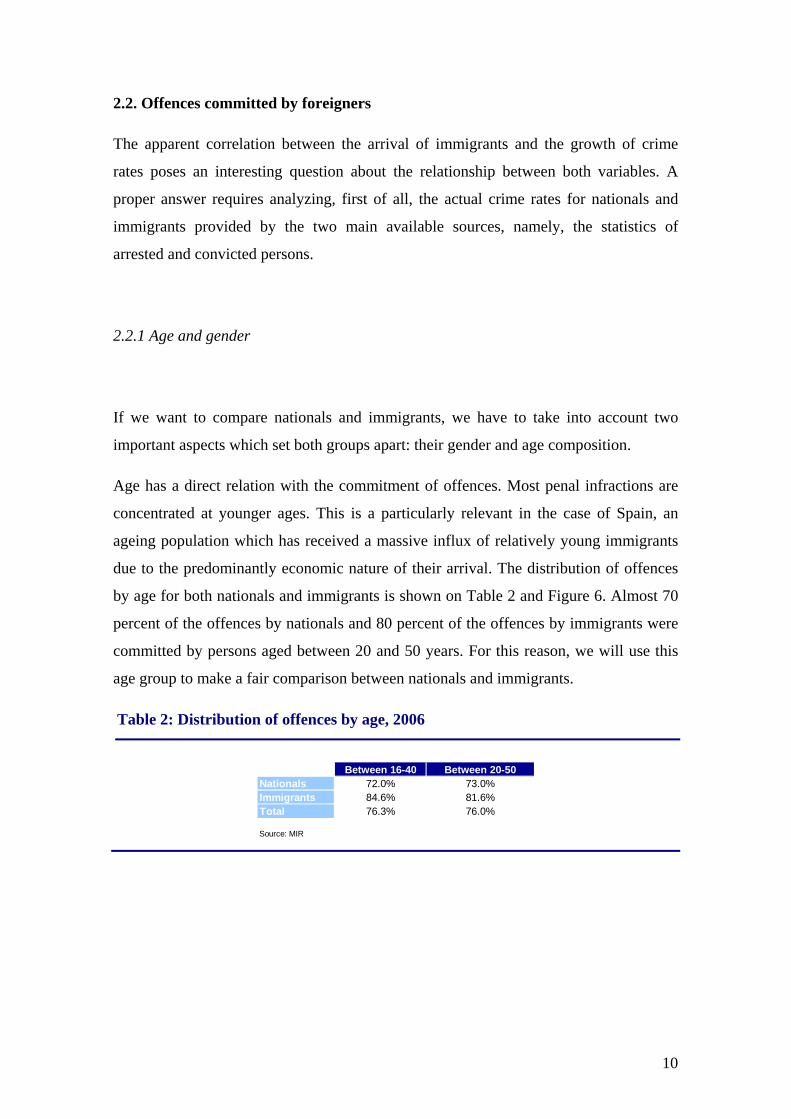
Age has a direct relation with the commitment of offences. Most penal infractions are
concentrated at younger ages. This is a particularly relevant in the case of Spain, an
ageing population which has received a massive influx of relatively young immigrants
due to the predominantly economic nature of their arrival. The distribution of offences
by age for both nationals and immigrants is shown on Table 2 and Figure 6. Almost 70
percent of the offences by nationals and 80 percent of the offences by immigrants were
committed by persons aged between 20 and 50 years. For this reason, we will use this
age group to make a fair comparison between nationals and immigrants.
Table 2: Distribution of offences by age, 2006
Between 16-40 Between 20-50Nationals 72.0% 73.0%Immigrants 84.6% 81.6%Total 76.3% 76.0%
Source: MIR
10
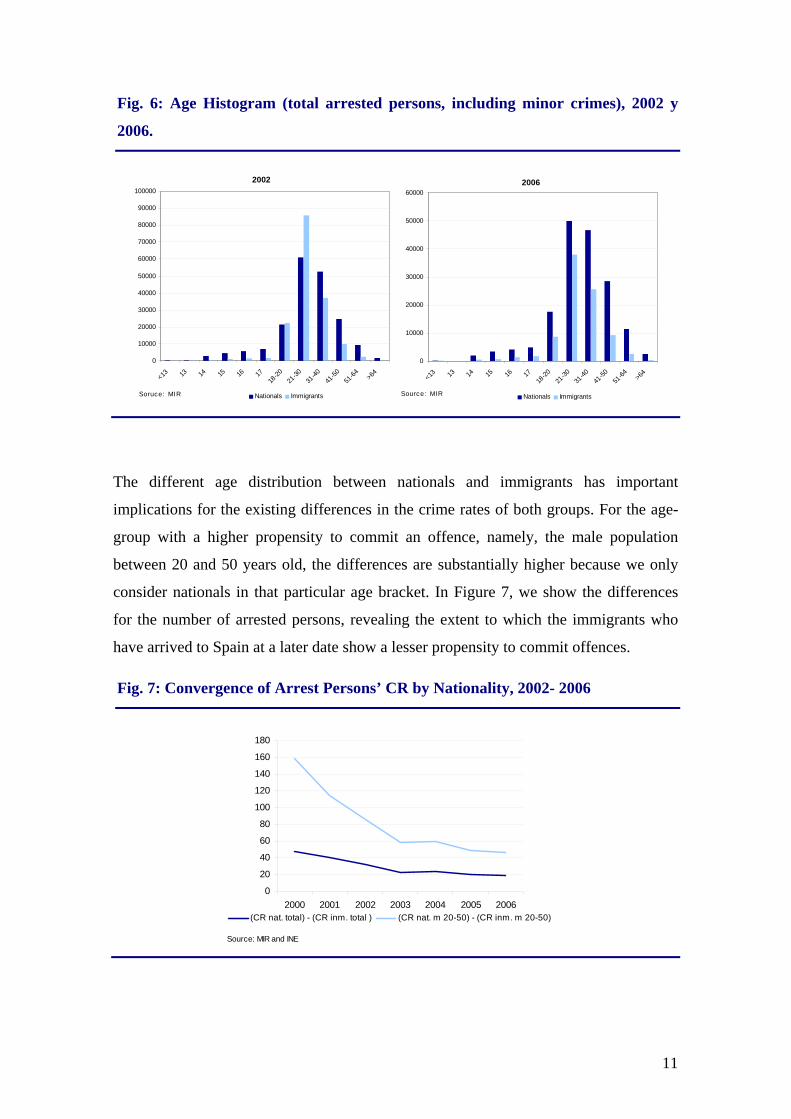
Fig. 6: Age Histogram (total arrested persons, including minor crimes), 2002 y
2006.
2002
0
10000
20000
30000
40000
50000
60000
70000
80000
90000
100000
<13 13 14 15 16 1718
-2021
-3031
-4041
-5051
-64 >64
Nationals ImmigrantsSoruce: MIR
2006
0
10000
20000
30000
40000
50000
60000
<13 13 14 15 16 1718
-2021
-3031
-4041
-5051
-64 >64
Nationals ImmigrantsSource: MIR
The different age distribution between nationals and immigrants has important
implications for the existing differences in the crime rates of both groups. For the age-
group with a higher propensity to commit an offence, namely, the male population
between 20 and 50 years old, the differences are substantially higher because we only
consider nationals in that particular age bracket. In Figure 7, we show the differences
for the number of arrested persons, revealing the extent to which the immigrants who
have arrived to Spain at a later date show a lesser propensity to commit offences.
Fig. 7: Convergence of Arrest Persons’ CR by Nationality, 2002- 2006
0
20
40
60
80
100
120
140
160
180
2000 2001 2002 2003 2004 2005 2006(CR nat. total) - (CR inm. total ) (CR nat. m 20-50) - (CR inm. m 20-50)
Source: MIR and INE
11
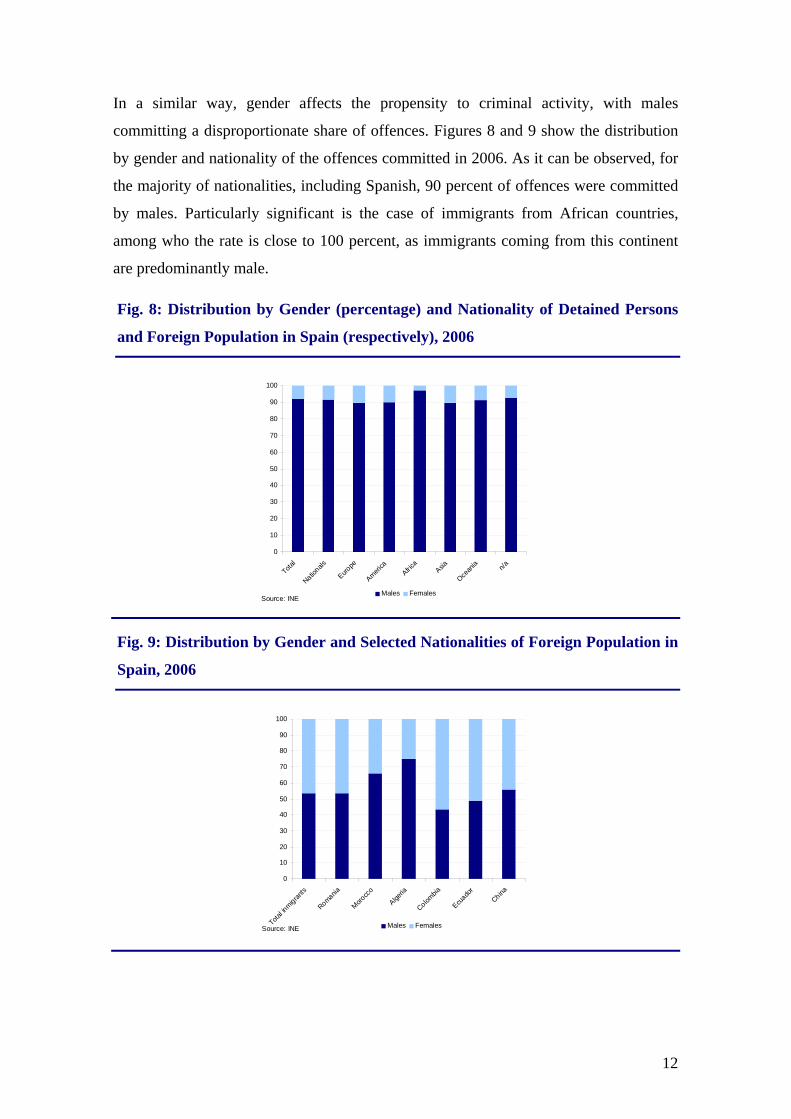
In a similar way, gender affects the propensity to criminal activity, with males
committing a disproportionate share of offences. Figures 8 and 9 show the distribution
by gender and nationality of the offences committed in 2006. As it can be observed, for
the majority of nationalities, including Spanish, 90 percent of offences were committed
by males. Particularly significant is the case of immigrants from African countries,
among who the rate is close to 100 percent, as immigrants coming from this continent
are predominantly male.
Fig. 8: Distribution by Gender (percentage) and Nationality of Detained Persons
and Foreign Population in Spain (respectively), 2006
0
10
20
30
40
50
60
70
80
90
100
Total
Nationals
Europe
America
Africa
Asia
Ocean
ia n/a
Males FemalesSource: INE
Fig. 9: Distribution by Gender and Selected Nationalities of Foreign Population in
Spain, 2006
0
10
20
30
40
50
60
70
80
90
100
Total in
migrants
Romania
Morocc
o
Algeria
Colombia
Ecuado
rChina
Males FemalesSource: INE
12
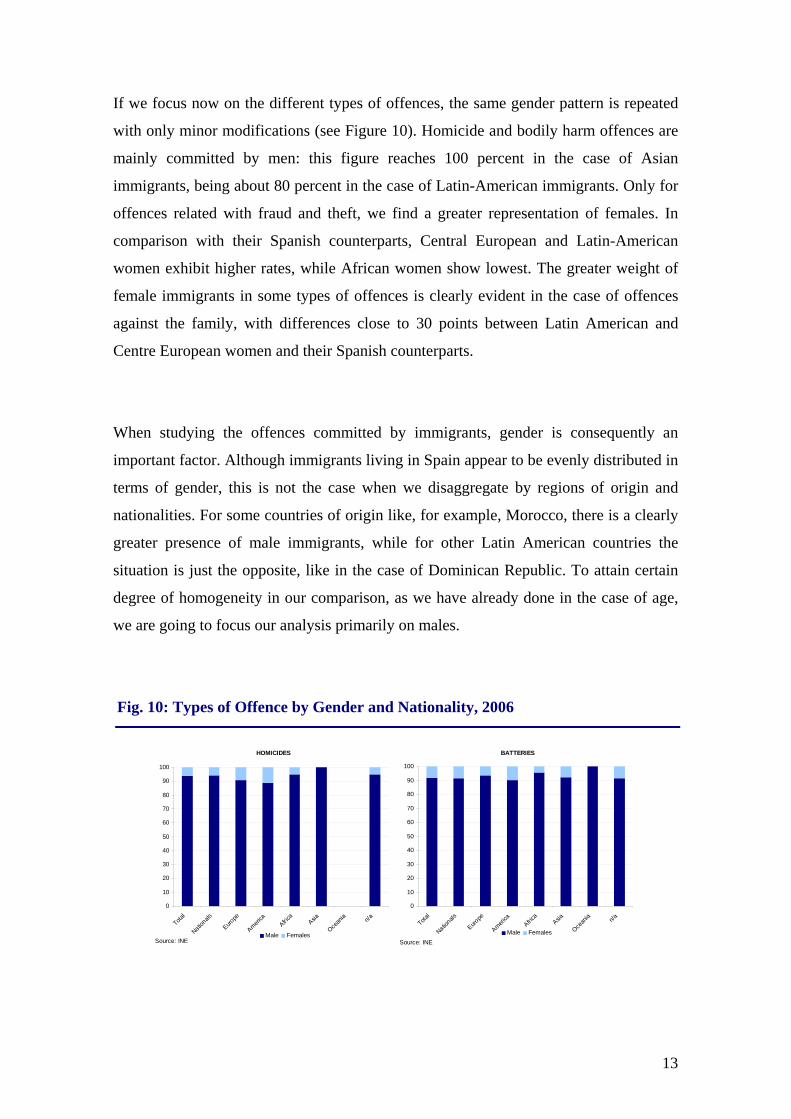
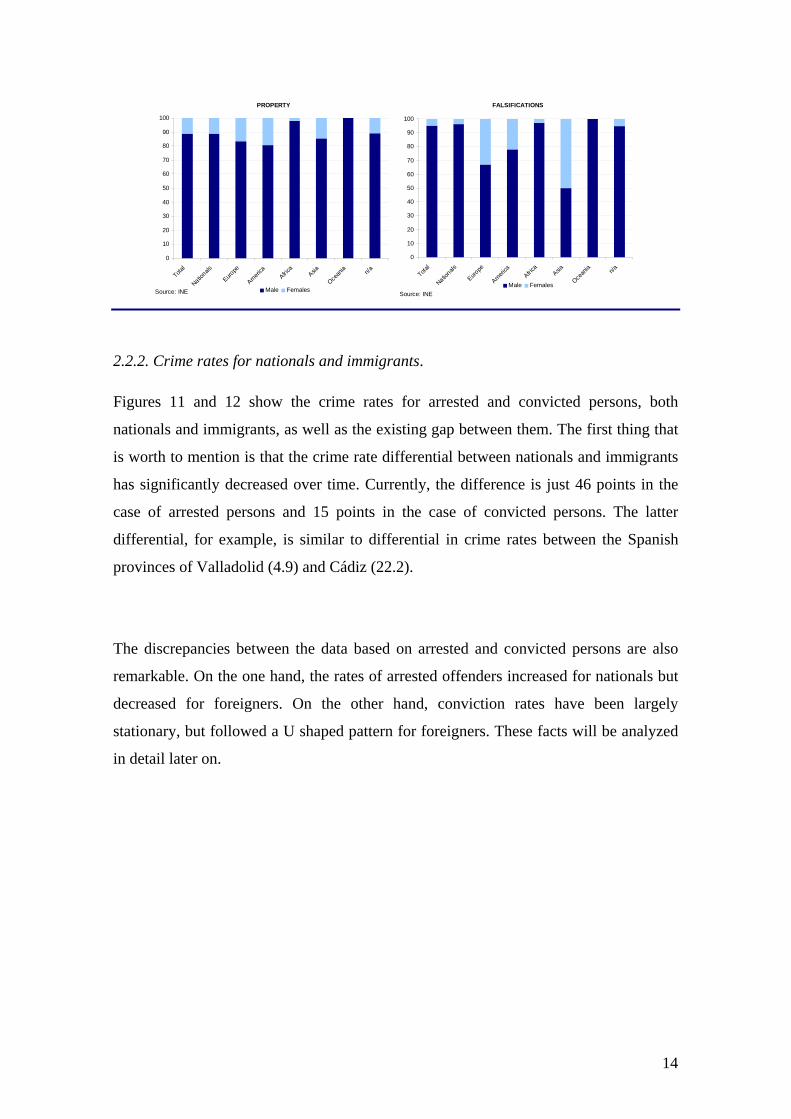
If we focus now on the different types of offences, the same gender pattern is repeated
with only minor modifications (see Figure 10). Homicide and bodily harm offences are
mainly committed by men: this figure reaches 100 percent in the case of Asian
immigrants, being about 80 percent in the case of Latin-American immigrants. Only for
offences related with fraud and theft, we find a greater representation of females. In
comparison with their Spanish counterparts, Central European and Latin-American
women exhibit higher rates, while African women show lowest. The greater weight of
female immigrants in some types of offences is clearly evident in the case of offences
against the family, with differences close to 30 points between Latin American and
Centre European women and their Spanish counterparts.
When studying the offences committed by immigrants, gender is consequently an
important factor. Although immigrants living in Spain appear to be evenly distributed in
terms of gender, this is not the case when we disaggregate by regions of origin and
nationalities. For some countries of origin like, for example, Morocco, there is a clearly
greater presence of male immigrants, while for other Latin American countries the
situation is just the opposite, like in the case of Dominican Republic. To attain certain
degree of homogeneity in our comparison, as we have already done in the case of age,
we are going to focus our analysis primarily on males.
Fig. 10: Types of Offence by Gender and Nationality, 2006
HOMICIDES
0
10
20
30
40
50
60
70
80
90
100
Total
Nationals
Europe
America
Africa
Asia
Ocean
ia n/a
Male FemalesSource: INE
BATTERIES
0
10
20
30
40
50
60
70
80
90
100
Total
Nationals
Europe
America
Africa
Asia
Ocean
ia n/a
Male FemalesSource: INE
13
PROPERTY
0
10
20
30
40
50
60
70
80
90
100
Total
Nationals
Europe
America
Africa
Asia
Ocean
ia n/a
Male FemalesSource: INE
FALSIFICATIONS
0
10
20
30
40
50
60
70
80
90
100
Total
Nationals
Europe
America
Africa
Asia
Ocean
ia n/a
Male FemalesSource: INE
2.2.2. Crime rates for nationals and immigrants.
Figures 11 and 12 show the crime rates for arrested and convicted persons, both
nationals and immigrants, as well as the existing gap between them. The first thing that
is worth to mention is that the crime rate differential between nationals and immigrants
has significantly decreased over time. Currently, the difference is just 46 points in the
case of arrested persons and 15 points in the case of convicted persons. The latter
differential, for example, is similar to differential in crime rates between the Spanish
provinces of Valladolid (4.9) and Cádiz (22.2).
The discrepancies between the data based on arrested and convicted persons are also
remarkable. On the one hand, the rates of arrested offenders increased for nationals but
decreased for foreigners. On the other hand, conviction rates have been largely
stationary, but followed a U shaped pattern for foreigners. These facts will be analyzed
in detail later on.
14
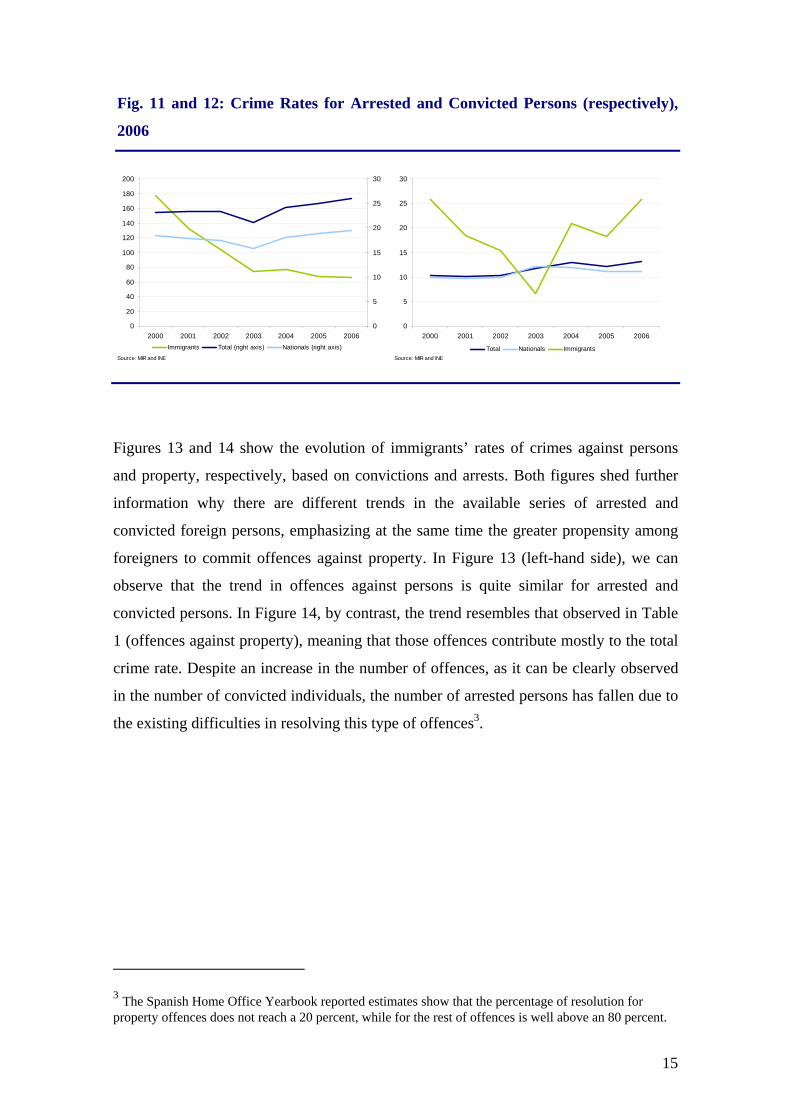
Fig. 11 and 12: Crime Rates for Arrested and Convicted Persons (respectively),
2006
0
20
40
60
80
100
120
140
160
180
200
2000 2001 2002 2003 2004 2005 20060
5
10
15
20
25
30
Immigrants Total (right axis) Nationals (right axis)Source: MIR and INE
0
5
10
15
20
25
30
2000 2001 2002 2003 2004 2005 2006
Total Nationals ImmigrantsSource: MIR and INE
Figures 13 and 14 show the evolution of immigrants’ rates of crimes against persons
and property, respectively, based on convictions and arrests. Both figures shed further
information why there are different trends in the available series of arrested and
convicted foreign persons, emphasizing at the same time the greater propensity among
foreigners to commit offences against property. In Figure 13 (left-hand side), we can
observe that the trend in offences against persons is quite similar for arrested and
convicted persons. In Figure 14, by contrast, the trend resembles that observed in Table
1 (offences against property), meaning that those offences contribute mostly to the total
crime rate. Despite an increase in the number of offences, as it can be clearly observed
in the number of convicted individuals, the number of arrested persons has fallen due to
the existing difficulties in resolving this type of offences3.
3 The Spanish Home Office Yearbook reported estimates show that the percentage of resolution for property offences does not reach a 20 percent, while for the rest of offences is well above an 80 percent.
15
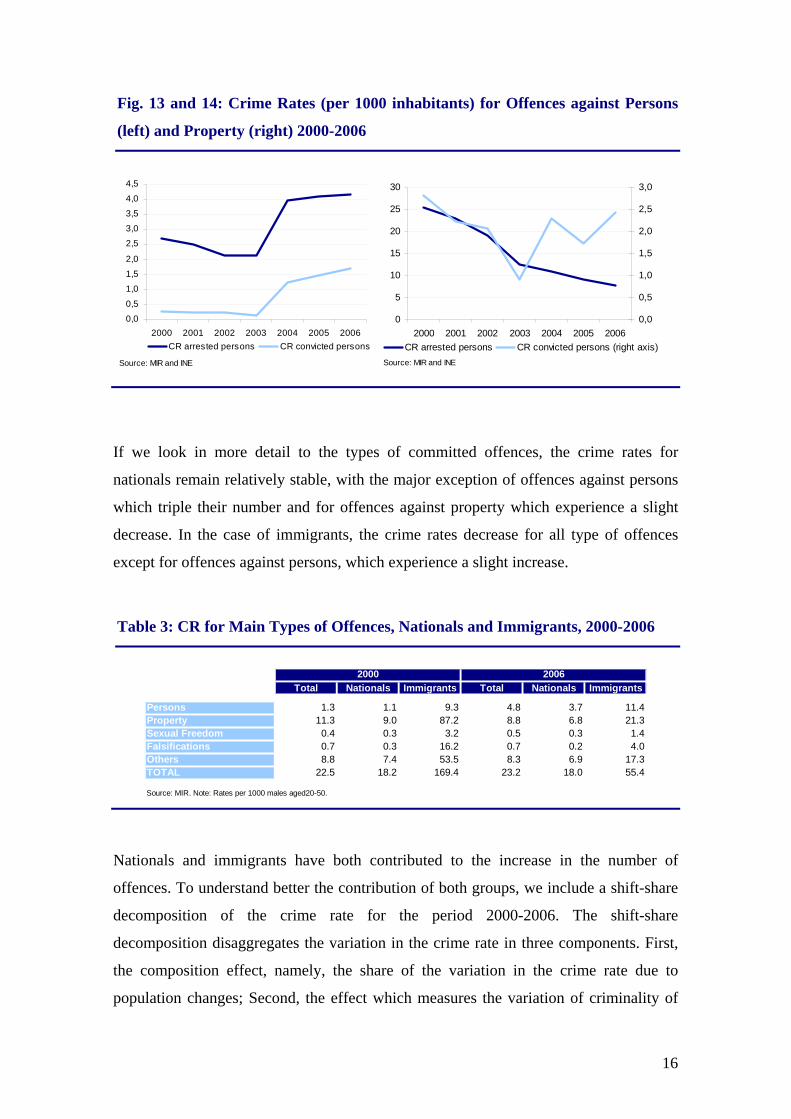
Fig. 13 and 14: Crime Rates (per 1000 inhabitants) for Offences against Persons
(left) and Property (right) 2000-2006
0,0
0,5
1,0
1,5
2,0
2,5
3,0
3,5
4,0
4,5
2000 2001 2002 2003 2004 2005 2006CR arrested persons CR convicted persons
Source: MIR and INE
0
5
10
15
20
25
30
2000 2001 2002 2003 2004 2005 20060,0
0,5
1,0
1,5
2,0
2,5
3,0
CR arrested persons CR convicted persons (right axis)Source: MIR and INE
If we look in more detail to the types of committed offences, the crime rates for
nationals remain relatively stable, with the major exception of offences against persons
which triple their number and for offences against property which experience a slight
decrease. In the case of immigrants, the crime rates decrease for all type of offences
except for offences against persons, which experience a slight increase.
Table 3: CR for Main Types of Offences, Nationals and Immigrants, 2000-2006
Total Nationals Immigrants Total Nationals Immigrants
Persons 1.3 1.1 9.3 4.8 3.7 11.4Property 11.3 9.0 87.2 8.8 6.8 21.3Sexual Freedom 0.4 0.3 3.2 0.5 0.3 1.4Falsifications 0.7 0.3 16.2 0.7 0.2 4.0Others 8.8 7.4 53.5 8.3 6.9 17.3TOTAL 22.5 18.2 169.4 23.2 18.0 55.4
Source: MIR. Note: Rates per 1000 males aged20-50.
2000 2006
Nationals and immigrants have both contributed to the increase in the number of
offences. To understand better the contribution of both groups, we include a shift-share
decomposition of the crime rate for the period 2000-2006. The shift-share
decomposition disaggregates the variation in the crime rate in three components. First,
the composition effect, namely, the share of the variation in the crime rate due to
population changes; Second, the effect which measures the variation of criminality of
16
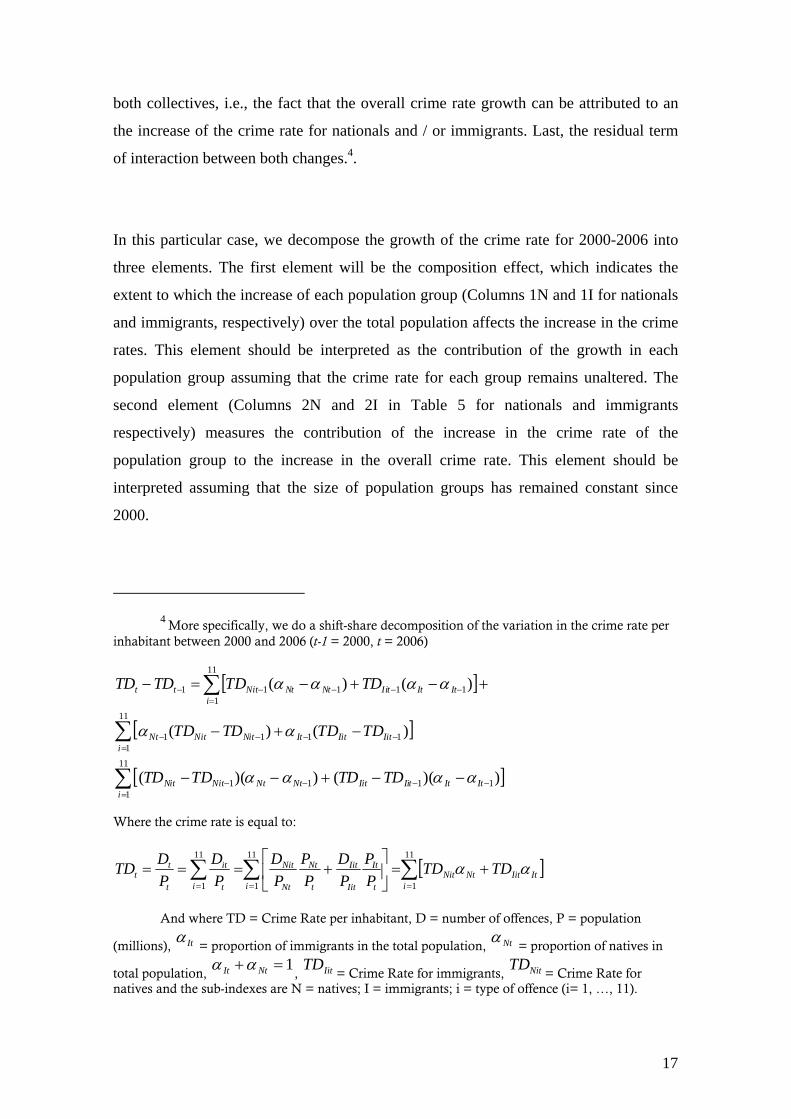
both collectives, i.e., the fact that the overall crime rate growth can be attributed to an
the increase of the crime rate for nationals and / or immigrants. Last, the residual term
of interaction between both changes.4.
In this particular case, we decompose the growth of the crime rate for 2000-2006 into
three elements. The first element will be the composition effect, which indicates the
extent to which the increase of each population group (Columns 1N and 1I for nationals
and immigrants, respectively) over the total population affects the increase in the crime
rates. This element should be interpreted as the contribution of the growth in each
population group assuming that the crime rate for each group remains unaltered. The
second element (Columns 2N and 2I in Table 5 for nationals and immigrants
respectively) measures the contribution of the increase in the crime rate of the
population group to the increase in the overall crime rate. This element should be
interpreted assuming that the size of population groups has remained constant since
2000.
4 More specifically, we do a shift-share decomposition of the variation in the crime rate per
inhabitant between 2000 and 2006 (t-1 = 2000, t = 2006)
[ ]
[ ]
[ ]∑
∑
∑
=−−−−
=−−−−
=−−−−−
−−+−−
−+−
+−+−=−
11
11111
11
11111
11
111111
))(())((
)()(
)()(
iItItIitIitNtNtNitNit
iIitIitItNitNitNt
iItItIitNtNtNittt
TDTDTDTD
TDTDTDTD
TDTDTDTD
αααα
αα
αααα
Where the crime rate is equal to:
[ ]∑∑∑===
+=⎥⎦
⎤⎢⎣
⎡+===
11
1
11
1
11
1 iItIitNtNit
i t
It
Iit
Iit
t
Nt
Nt
Nit
i t
it
t
tt TDTD
PP
PD
PP
PD
PD
PDTD αα
And where TD = Crime Rate per inhabitant, D = number of offences, P = population
(millions), Itα = proportion of immigrants in the total population, Ntα
= proportion of natives in
total population, 1=+ NtIt αα
, = Crime Rate for immigrants, = Crime Rate for natives and the sub-indexes are N = natives; I = immigrants; i = type of offence (i= 1, …, 11).
IitTD NitTD
17
If immigrants commit offences with the same frequency as nationals, the first term of
our equation will be small, meaning that their own characteristics did not result in an
increase in the number of offences. On the other hand, if this term is substantial in
relation to the other component, it will indicate that the increase in the number of
offences is not due to a uniform increase among both nationals and immigrants in their
propensity to commit more offences, but to the greater presence of foreigners.
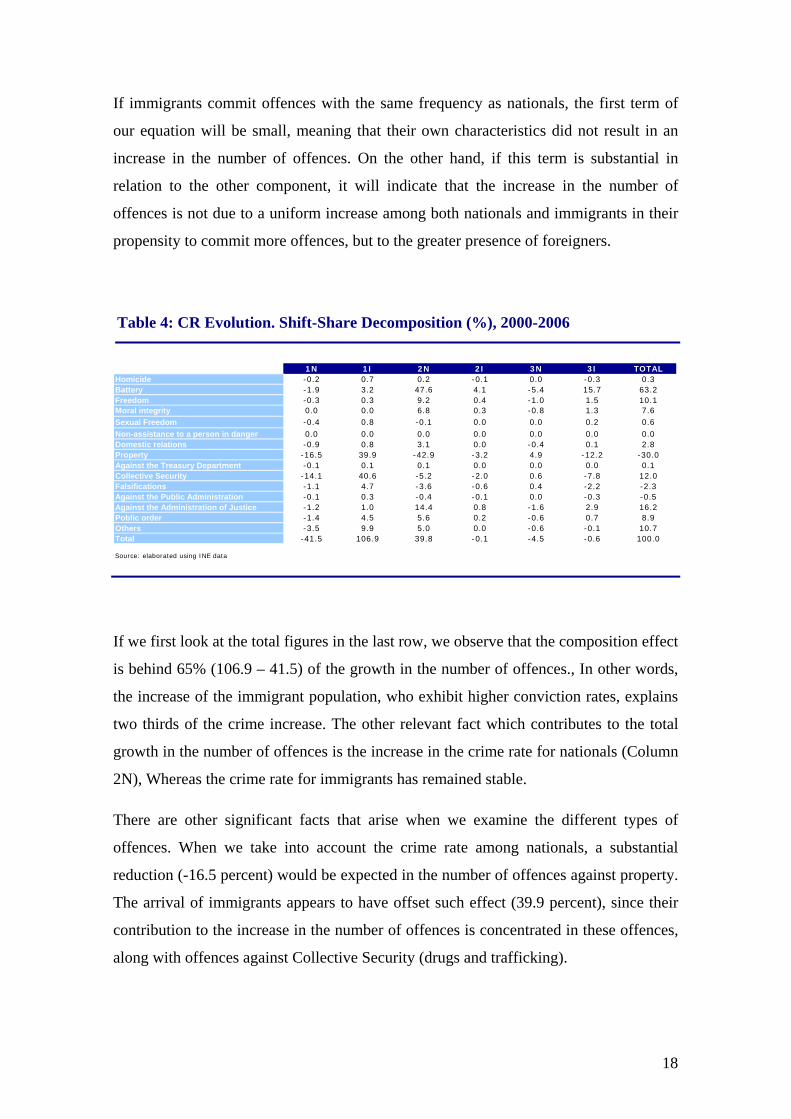
Table 4: CR Evolution. Shift-Share Decomposition (%), 2000-2006
1N 1I 2N 2I 3N 3I TOTALHomicide -0.2 0.7 0.2 -0.1 0.0 -0.3 0.3Battery -1.9 3.2 47.6 4.1 -5.4 15.7 63.2Freedom -0.3 0.3 9.2 0.4 -1.0 1.5 10.1Moral integrity 0.0 0.0 6.8 0.3 -0.8 1.3 7.6Sexual Freedom -0.4 0.8 -0.1 0.0 0.0 0.2 0.6Non-assistance to a person in danger 0.0 0.0 0.0 0.0 0.0 0.0 0.0Domestic relations -0.9 0.8 3.1 0.0 -0.4 0.1 2.8Property -16.5 39.9 -42.9 -3.2 4.9 -12.2 -30.0Against the Treasury Department -0.1 0.1 0.1 0.0 0.0 0.0 0.1Collective Security -14.1 40.6 -5.2 -2.0 0.6 -7.8 12.0Falsifications -1.1 4.7 -3.6 -0.6 0.4 -2.2 -2.3Against the Public Administration -0.1 0.3 -0.4 -0.1 0.0 -0.3 -0.5Against the Administration of Justice -1.2 1.0 14.4 0.8 -1.6 2.9 16.2Poblic order -1.4 4.5 5.6 0.2 -0.6 0.7 8.9Others -3.5 9.9 5.0 0.0 -0.6 -0.1 10.7Total -41.5 106.9 39.8 -0.1 -4.5 -0.6 100.0
Source: elaborated using INE data
If we first look at the total figures in the last row, we observe that the composition effect
is behind 65% (106.9 – 41.5) of the growth in the number of offences., In other words,
the increase of the immigrant population, who exhibit higher conviction rates, explains
two thirds of the crime increase. The other relevant fact which contributes to the total
growth in the number of offences is the increase in the crime rate for nationals (Column
2N), Whereas the crime rate for immigrants has remained stable.
There are other significant facts that arise when we examine the different types of
offences. When we take into account the crime rate among nationals, a substantial
reduction (-16.5 percent) would be expected in the number of offences against property.
The arrival of immigrants appears to have offset such effect (39.9 percent), since their
contribution to the increase in the number of offences is concentrated in these offences,
along with offences against Collective Security (drugs and trafficking).
18

It is also worth mentioning bodily harm offences and, in general, offences against
individuals, freedom and moral integrity. We have already noted that their prosecution
has intensified through the provision of better resources and the implementation of more
severe court sentences. Since we can control the results with the shift-share
decomposition in relation to the population growth experienced by both groups, we can
clearly observe that the growth of this type of offences has become particularly relevant
in the case of nationals but not of immigrants. In other words, although these types of
offences have increased more among immigrants than among nationals, when we
compare the population growth of both groups, we can perceive that this increase has
been more significant among nationals. This is probably the result of a greater
prosecution of this type of offences rather than of being committed more frequently.
Finally, offences against the administration of justice (mainly, breach of conviction) are
predominantly committed by nationals, and contribute substantially to the growth of
offences during this period.
2.2.3 Offences and nationalities
Nationality is also a relevant factor when considering the evolution of offences in Spain.
In Table 5 we implement a decomposition as in the previous chart, but in terms of
nationalities (note that the third component of interaction is not shown on this chart due
to lack of space, the full chart can be found in the Appendix). Within the overall
contribution of the immigrant population to crime growth, this table allows to examine
the specific contribution of each nationality and to elucidate if the most relevant factor
for each case is the population growth of that particular nationality or the actual increase
of its crime rate.
19
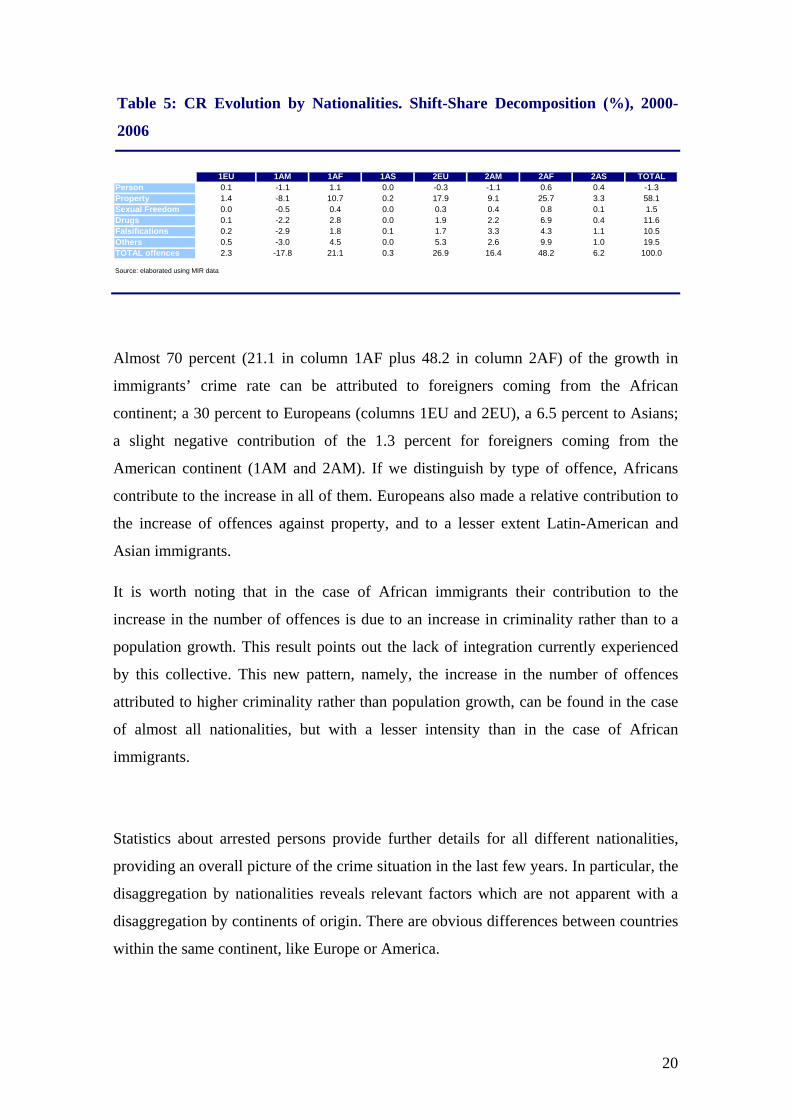
Table 5: CR Evolution by Nationalities. Shift-Share Decomposition (%), 2000-
2006
1EU 1AM 1AF 1AS 2EU 2AM 2AF 2AS TOTALPerson 0.1 -1.1 1.1 0.0 -0.3 -1.1 0.6 0.4 -1.3Property 1.4 -8.1 10.7 0.2 17.9 9.1 25.7 3.3 58.1Sexual Freedom 0.0 -0.5 0.4 0.0 0.3 0.4 0.8 0.1 1.5Drugs 0.1 -2.2 2.8 0.0 1.9 2.2 6.9 0.4 11.6Falsifications 0.2 -2.9 1.8 0.1 1.7 3.3 4.3 1.1 10.5Others 0.5 -3.0 4.5 0.0 5.3 2.6 9.9 1.0 19.5TOTAL offences 2.3 -17.8 21.1 0.3 26.9 16.4 48.2 6.2 100.0
Source: elaborated using MIR data
Almost 70 percent (21.1 in column 1AF plus 48.2 in column 2AF) of the growth in
immigrants’ crime rate can be attributed to foreigners coming from the African
continent; a 30 percent to Europeans (columns 1EU and 2EU), a 6.5 percent to Asians;
a slight negative contribution of the 1.3 percent for foreigners coming from the
American continent (1AM and 2AM). If we distinguish by type of offence, Africans
contribute to the increase in all of them. Europeans also made a relative contribution to
the increase of offences against property, and to a lesser extent Latin-American and
Asian immigrants.
It is worth noting that in the case of African immigrants their contribution to the
increase in the number of offences is due to an increase in criminality rather than to a
population growth. This result points out the lack of integration currently experienced
by this collective. This new pattern, namely, the increase in the number of offences
attributed to higher criminality rather than population growth, can be found in the case
of almost all nationalities, but with a lesser intensity than in the case of African
immigrants.
Statistics about arrested persons provide further details for all different nationalities,
providing an overall picture of the crime situation in the last few years. In particular, the
disaggregation by nationalities reveals relevant factors which are not apparent with a
disaggregation by continents of origin. There are obvious differences between countries
within the same continent, like Europe or America.
20
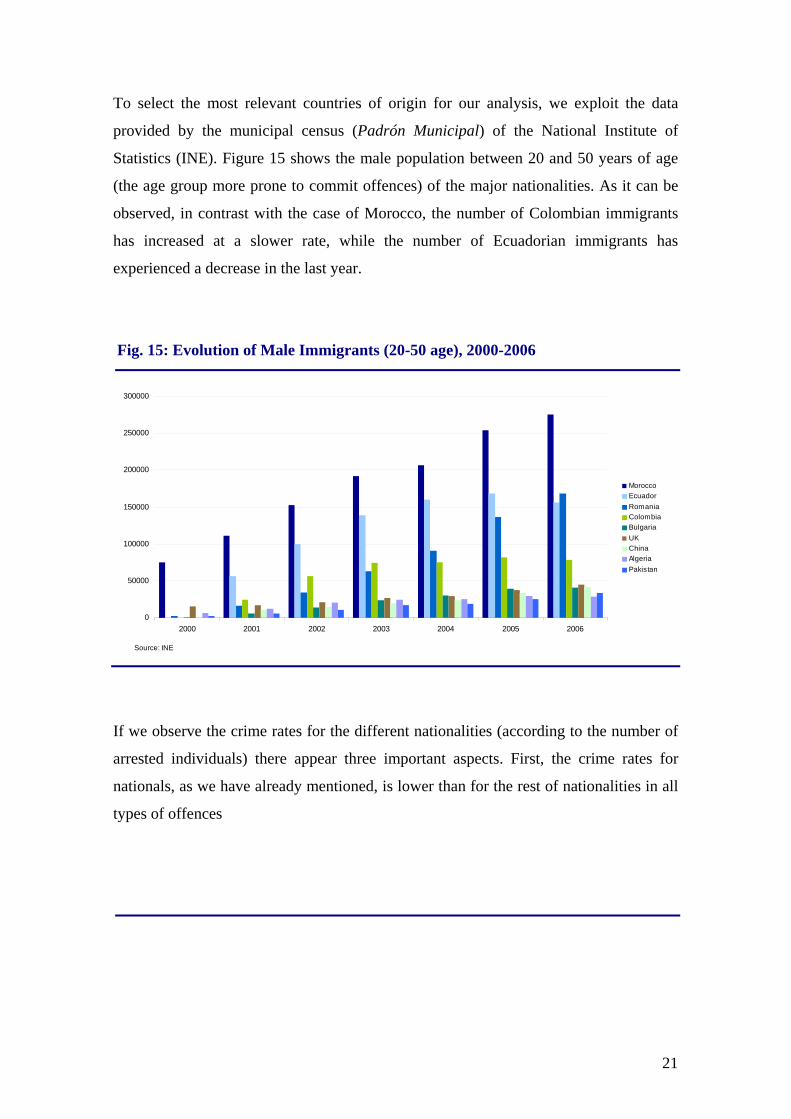
To select the most relevant countries of origin for our analysis, we exploit the data
provided by the municipal census (Padrón Municipal) of the National Institute of
Statistics (INE). Figure 15 shows the male population between 20 and 50 years of age
(the age group more prone to commit offences) of the major nationalities. As it can be
observed, in contrast with the case of Morocco, the number of Colombian immigrants
has increased at a slower rate, while the number of Ecuadorian immigrants has
experienced a decrease in the last year.
Fig. 15: Evolution of Male Immigrants (20-50 age), 2000-2006
0
50000
100000
150000
200000
250000
300000
2000 2001 2002 2003 2004 2005 2006
MoroccoEcuadorRomaniaColombiaBulgariaUKChinaAlgeriaPakistan
Source: INE
If we observe the crime rates for the different nationalities (according to the number of
arrested individuals) there appear three important aspects. First, the crime rates for
nationals, as we have already mentioned, is lower than for the rest of nationalities in all
types of offences
21
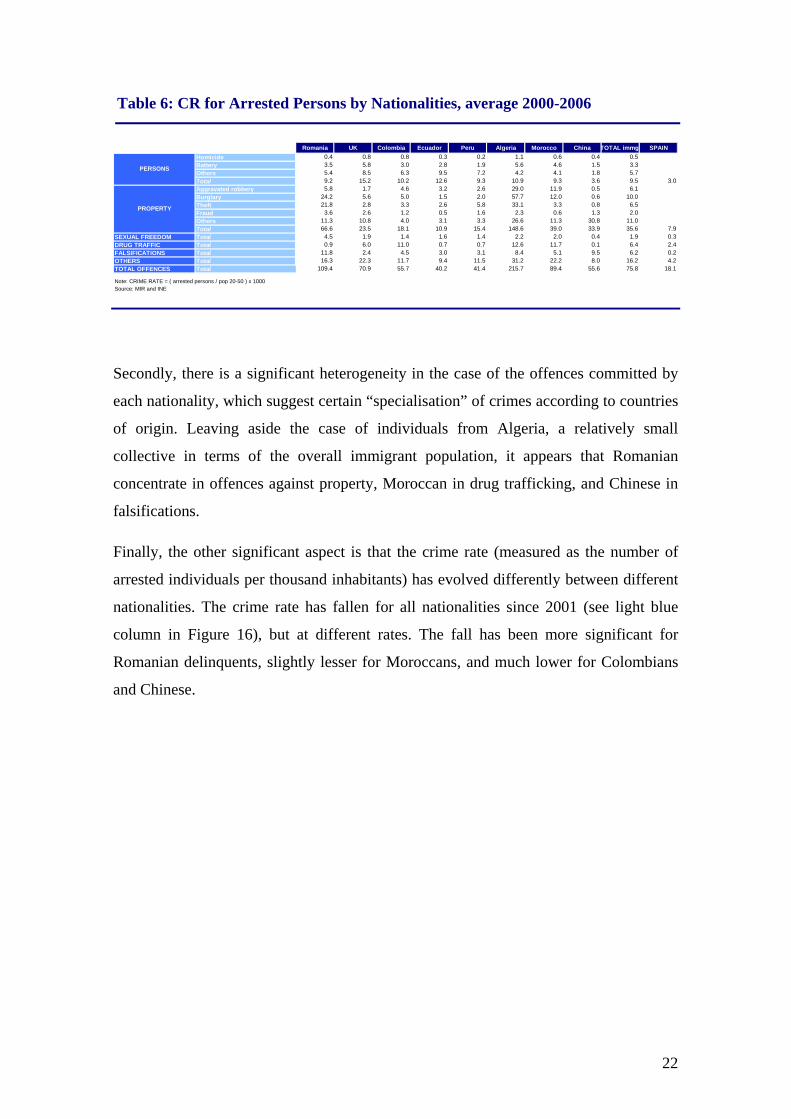
Table 6: CR for Arrested Persons by Nationalities, average 2000-2006
Romania UK Colombia Ecuador Peru Algeria Morocco China TOTAL immg SPAINHomicide 0.4 0.8 0.8 0.3 0.2 1.1 0.6 0.4 0.5Battery 3.5 5.8 3.0 2.8 1.9 5.6 4.6 1.5 3.3Others 5.4 8.5 6.3 9.5 7.2 4.2 4.1 1.8 5.7Total 9.2 15.2 10.2 12.6 9.3 10.9 9.3 3.6 9.5 3.0Aggravated robbery 5.8 1.7 4.6 3.2 2.6 29.0 11.9 0.5 6.1Burglary 24.2 5.6 5.0 1.5 2.0 57.7 12.0 0.6 10.0Theft 21.8 2.8 3.3 2.6 5.8 33.1 3.3 0.8 6.5Fraud 3.6 2.6 1.2 0.5 1.6 2.3 0.6 1.3 2.0Others 11.3 10.8 4.0 3.1 3.3 26.6 11.3 30.8 11.0Total 66.6 23.5 18.1 10.9 15.4 148.6 39.0 33.9 35.6 7.9
SEXUAL FREEDOM Total 4.5 1.9 1.4 1.6 1.4 2.2 2.0 0.4 1.9 0.3DRUG TRAFFIC Total 0.9 6.0 11.0 0.7 0.7 12.6 11.7 0.1 6.4 2.4FALSIFICATIONS Total 11.8 2.4 4.5 3.0 3.1 8.4 5.1 9.5 6.2 0.2OTHERS Total 16.3 22.3 11.7 9.4 11.5 31.2 22.2 8.0 16.2 4.2TOTAL OFFENCES Total 109.4 70.9 55.7 40.2 41.4 215.7 89.4 55.6 75.8 18.1
Note: CRIME RATE = ( arrested persons / pop 20-50 ) x 1000Source: MIR and INE
PROPERTY
PERSONS
Secondly, there is a significant heterogeneity in the case of the offences committed by
each nationality, which suggest certain “specialisation” of crimes according to countries
of origin. Leaving aside the case of individuals from Algeria, a relatively small
collective in terms of the overall immigrant population, it appears that Romanian
concentrate in offences against property, Moroccan in drug trafficking, and Chinese in
falsifications.
Finally, the other significant aspect is that the crime rate (measured as the number of
arrested individuals per thousand inhabitants) has evolved differently between different
nationalities. The crime rate has fallen for all nationalities since 2001 (see light blue
column in Figure 16), but at different rates. The fall has been more significant for
Romanian delinquents, slightly lesser for Moroccans, and much lower for Colombians
and Chinese.
22
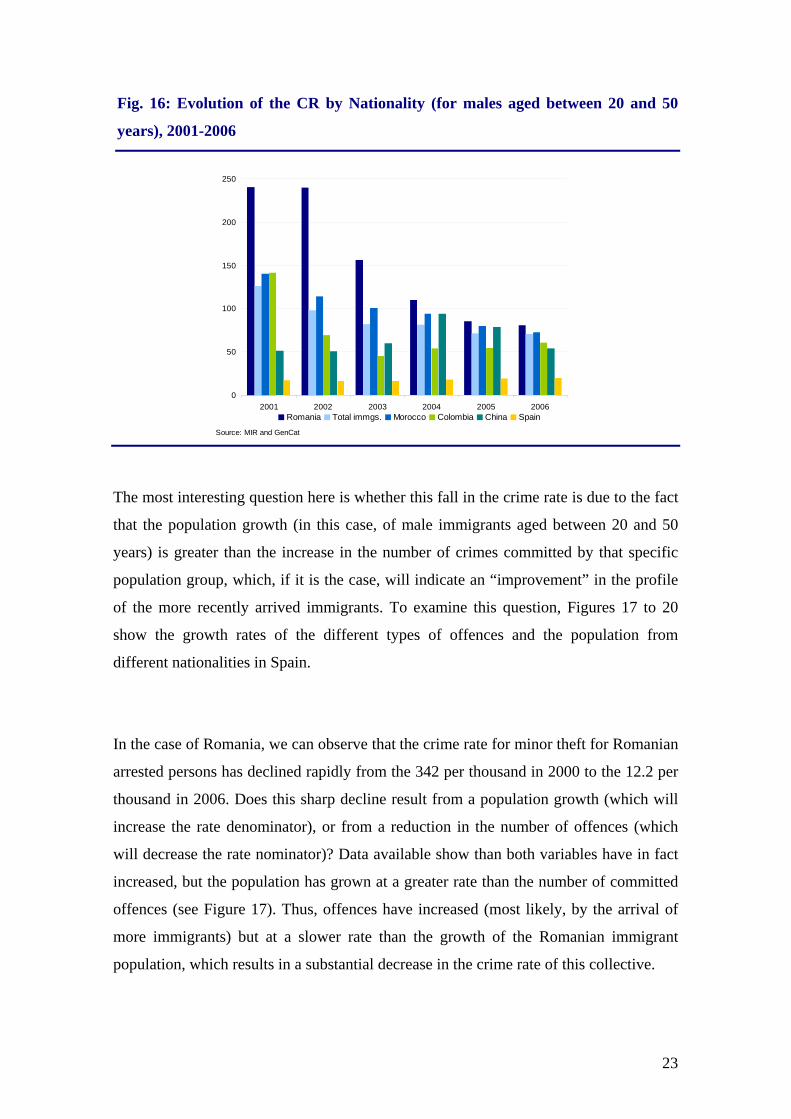
Fig. 16: Evolution of the CR by Nationality (for males aged between 20 and 50
years), 2001-2006
0
50
100
150
200
250
2001 2002 2003 2004 2005 2006Romania Total immgs. Morocco Colombia China Spain
Source: MIR and GenCat
The most interesting question here is whether this fall in the crime rate is due to the fact
that the population growth (in this case, of male immigrants aged between 20 and 50
years) is greater than the increase in the number of crimes committed by that specific
population group, which, if it is the case, will indicate an “improvement” in the profile
of the more recently arrived immigrants. To examine this question, Figures 17 to 20
show the growth rates of the different types of offences and the population from
different nationalities in Spain.
In the case of Romania, we can observe that the crime rate for minor theft for Romanian
arrested persons has declined rapidly from the 342 per thousand in 2000 to the 12.2 per
thousand in 2006. Does this sharp decline result from a population growth (which will
increase the rate denominator), or from a reduction in the number of offences (which
will decrease the rate nominator)? Data available show than both variables have in fact
increased, but the population has grown at a greater rate than the number of committed
offences (see Figure 17). Thus, offences have increased (most likely, by the arrival of
more immigrants) but at a slower rate than the growth of the Romanian immigrant
population, which results in a substantial decrease in the crime rate of this collective.
23
In the case of Moroccan immigrants, the crime rate for drug trafficking has fallen from
21.5 per thousand in 2000 to 7.8 per thousand in 2006 (see Figure 18) In fact, the
overall trend for drug trafficking offences among this immigrant collective appears to
have slowed down, having experienced a significant reduction in the last two years.
Although there has been also a slowdown in their population growth, this is still higher
than the increase in the number of offences, thus resulting in a partial reduction in their
crime rate.
For Colombian immigrants, the evolution has been remarkably different. Their crime
rate appears to have stabilised in 2006 around the 0.7 per thousand inhabitants, after
falling from 2.1 per thousand inhabitants in 2000 (see Figure 19). Until 2004,
population growth was higher than the number of homicides and, as a result, crime rates
exhibited a relative reduction until then. Since 2004, however, homicides committed by
Colombian immigrants have grown more than its population, with a peak in the crime
rate that year. In 2006, both population and the number of offences have grown at
similar rates and, therefore, the crime rate for Colombian immigrants has remained
relatively stable.
Finally, the crime rate among the Chinese immigrant population has experienced
substantial variations during the period (See Figure 20), largely due to population
growth, although there is a tendency to decrease (from 13.4 per thousand to 9.8 per
thousand) in the last few years.
24
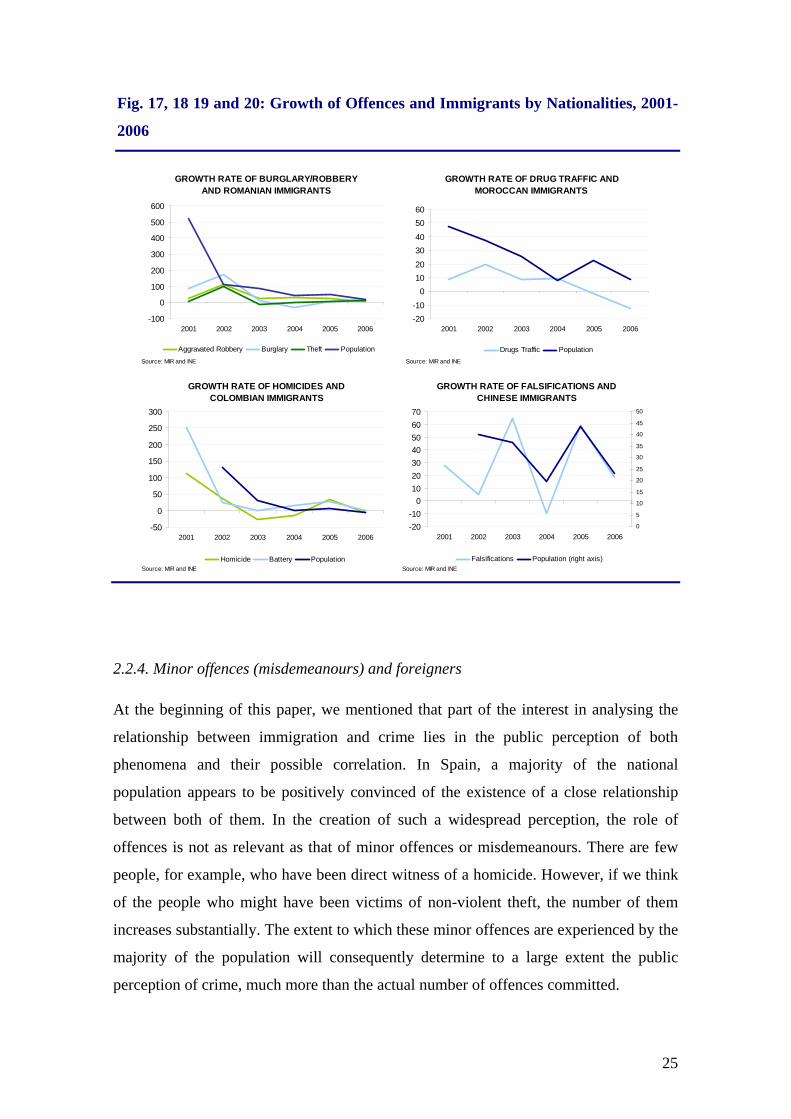
Fig. 17, 18 19 and 20: Growth of Offences and Immigrants by Nationalities, 2001-
2006
GROWTH RATE OF BURGLARY/ROBBERY AND ROMANIAN IMMIGRANTS
-100
0
100
200
300
400
500
600
2001 2002 2003 2004 2005 2006
Aggravated Robbery Burglary Theft PopulationSource: MIR and INE
GROWTH RATE OF DRUG TRAFFIC AND MOROCCAN IMMIGRANTS
-20-10
01020
3040
5060
2001 2002 2003 2004 2005 2006
Drugs Traffic PopulationSource: MIR and INE
GROWTH RATE OF HOMICIDES AND COLOMBIAN IMMIGRANTS
-50
0
50
100
150
200
250
300
2001 2002 2003 2004 2005 2006
Homicide Battery PopulationSource: MIR and INE
GROWTH RATE OF FALSIFICATIONS AND CHINESE IMMIGRANTS
-20-10
010203040506070
2001 2002 2003 2004 2005 20060
5
10
15
20
25
30
35
40
45
50
Falsifications Population (right axis)Source: MIR and INE
2.2.4. Minor offences (misdemeanours) and foreigners
At the beginning of this paper, we mentioned that part of the interest in analysing the
relationship between immigration and crime lies in the public perception of both
phenomena and their possible correlation. In Spain, a majority of the national
population appears to be positively convinced of the existence of a close relationship
between both of them. In the creation of such a widespread perception, the role of
offences is not as relevant as that of minor offences or misdemeanours. There are few
people, for example, who have been direct witness of a homicide. However, if we think
of the people who might have been victims of non-violent theft, the number of them
increases substantially. The extent to which these minor offences are experienced by the
majority of the population will consequently determine to a large extent the public
perception of crime, much more than the actual number of offences committed.
25
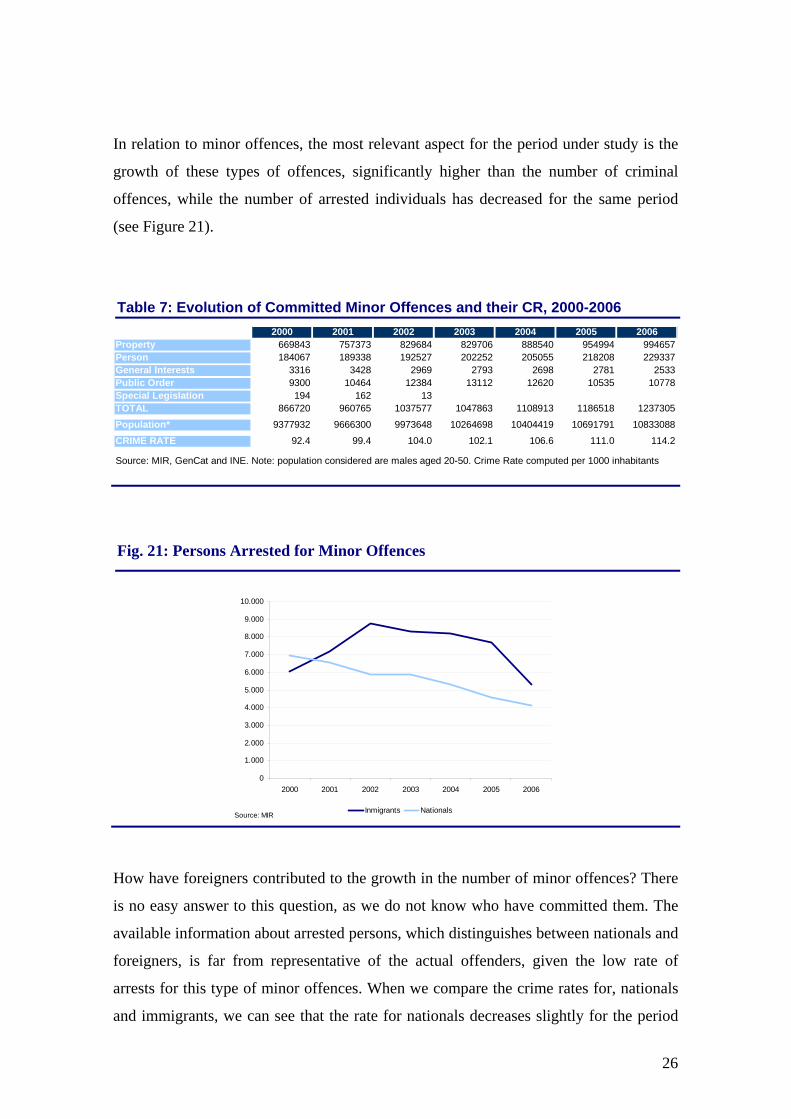
In relation to minor offences, the most relevant aspect for the period under study is the
growth of these types of offences, significantly higher than the number of criminal
offences, while the number of arrested individuals has decreased for the same period
(see Figure 21).
Table 7: Evolution of Committed Minor Offences and their CR, 2000-2006 2000 2001 2002 2003 2004 2005 2006
Property 669843 757373 829684 829706 888540 954994 994657Person 184067 189338 192527 202252 205055 218208 229337General Interests 3316 3428 2969 2793 2698 2781 2533Public Order 9300 10464 12384 13112 12620 10535 10778Special Legislation 194 162 13TOTAL 866720 960765 1037577 1047863 1108913 1186518 1237305
Population* 9377932 9666300 9973648 10264698 10404419 10691791 10833088
CRIME RATE 92.4 99.4 104.0 102.1 106.6 111.0 114.2
Source: MIR, GenCat and INE. Note: population considered are males aged 20-50. Crime Rate computed per 1000 inhabitants
Fig. 21: Persons Arrested for Minor Offences
0
1.000
2.000
3.000
4.000
5.000
6.000
7.000
8.000
9.000
10.000
2000 2001 2002 2003 2004 2005 2006
Inmigrants NationalsSource: MIR
How have foreigners contributed to the growth in the number of minor offences? There
is no easy answer to this question, as we do not know who have committed them. The
available information about arrested persons, which distinguishes between nationals and
foreigners, is far from representative of the actual offenders, given the low rate of
arrests for this type of minor offences. When we compare the crime rates for, nationals
and immigrants, we can see that the rate for nationals decreases slightly for the period
26
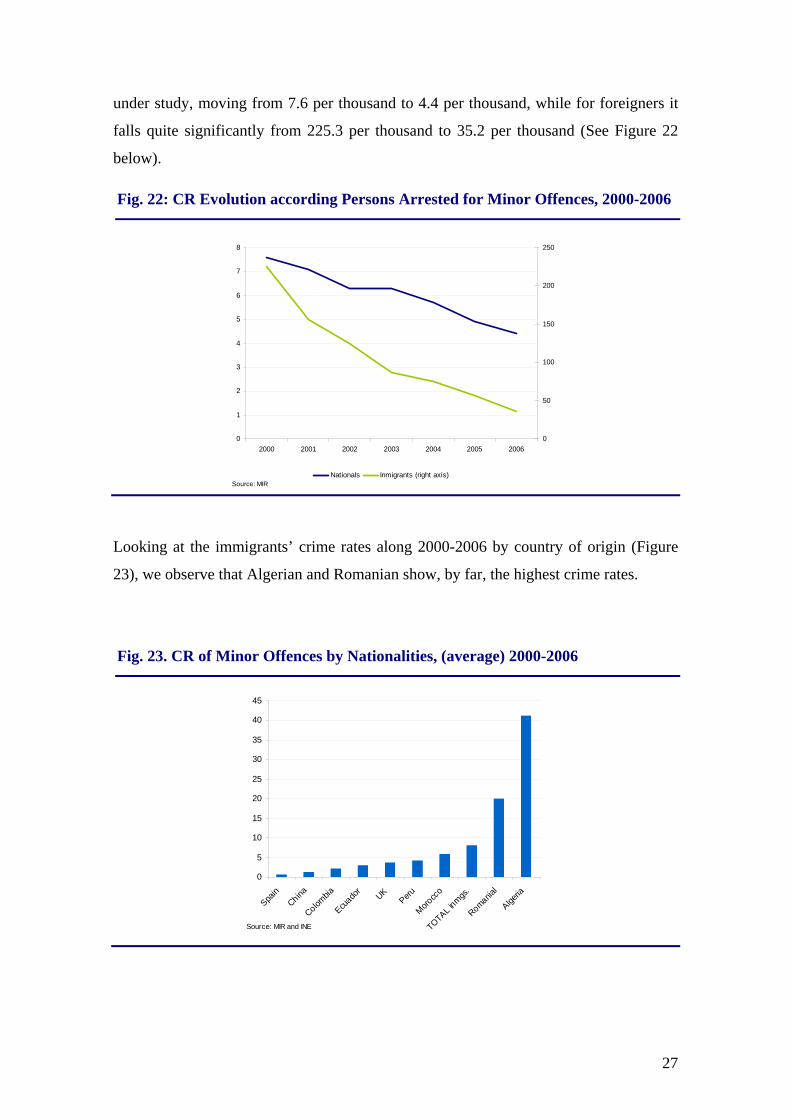
under study, moving from 7.6 per thousand to 4.4 per thousand, while for foreigners it
falls quite significantly from 225.3 per thousand to 35.2 per thousand (See Figure 22
below).
Fig. 22: CR Evolution according Persons Arrested for Minor Offences, 2000-2006
0
1
2
3
4
5
6
7
8
2000 2001 2002 2003 2004 2005 20060
50
100
150
200
250
Nationals Inmigrants (right axis)Source: MIR
Looking at the immigrants’ crime rates along 2000-2006 by country of origin (Figure
23), we observe that Algerian and Romanian show, by far, the highest crime rates.
Fig. 23. CR of Minor Offences by Nationalities, (average) 2000-2006
0
5
10
15
20
25
30
35
40
45
Spain
China
Colombia
Ecuado
rUK
Peru
Morocc
o
TOTAL inmgs
.
Romanial
Algeria
Source: MIR and INE
27
2.2.5. Immigration or Culture
The main economic models of crime behavior attempt to explain the reasons why
foreigners may have higher crime rates than nationals. In the last instance, these models
provide rationale to situations in which being an immigrant in a foreign country
partially reduces the opportunity cost to commit a crime when compared to nationals.
However, there is also another possible explanation: the immigrants bring with them a
whole set of values, rules, and experiences (i.e. a culture) which do not consider such
criminal activities to be totally reprehensible and, as a result, they may have a greater
propensity to commit certain types of offences.
We have seen how the differential in crime rates between nationals and immigrants has
significantly narrowed in the period under study, although there remains a substantial
gap. We have shown the specific types of offences and the nationalities which have
mostly contribute to the continuing existence of this crime gap between nationals and
immigrants in terms. Some of the points raised in our analysis will be explored in more
detail in the next section.
In this section, we are going to provide further evidence to disentangle which one of the
two possible alternatives proposed at the beginning of this paper contributes mostly to
the crime rate differential between nationals and immigrants.
For such purpose, we proceed as follows. We first concentrate on a particular criminal
offence (in this case, homicide) which is similarly defined worldwide in all the
legislative codes, and is therefore particularly useful to in Spain for different
nationalities (first column in Table 8). We also report the homicide rates committed in
the countries of origin, obtained from the United Nations data (Column 2). Finally, we
compute the ratio between the homicide rates in the host country (Spain) and in the
country origin by nationality (Column 3).
If the resulting ratio is fairly similar for different countries of origin, this would support
the idea that something in the fact of being immigrant makes them to maintain similar
crime rates between their country of origin and their host country. This would imply
that if we take the crime rate for a particular country of origin and multiply it for a
28
constant (common to immigrants of any origin), we would obtain the crime rate in the
host country for the immigrants coming from that particular country.
However, if the ratio differs widely by nationality of origin, it would suggest that the
factor behind crime propensity is not the fact of being an immigrant, but rather the
whole set of values, rules and experiences, brought by immigrants. In such case, the
crime rates are different because each nationality has some indelible traits which are not
easily forgotten by the fact of having migrated to a different country.
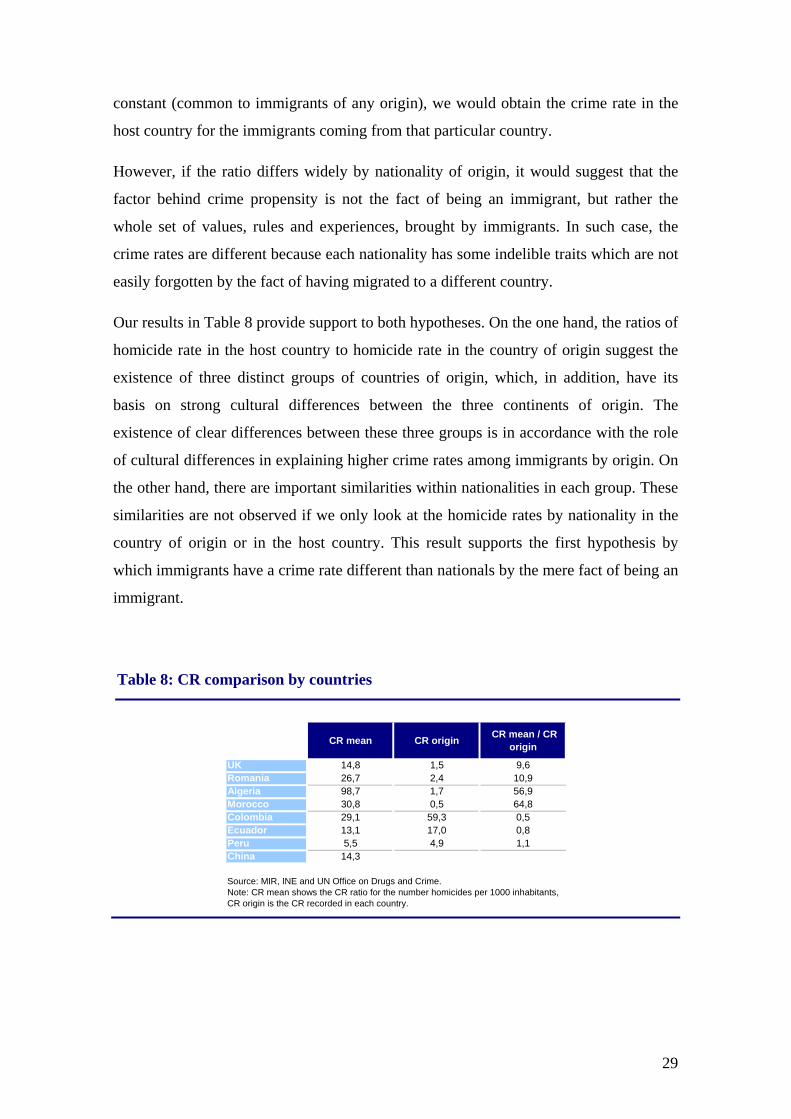
Our results in Table 8 provide support to both hypotheses. On the one hand, the ratios of
homicide rate in the host country to homicide rate in the country of origin suggest the
existence of three distinct groups of countries of origin, which, in addition, have its
basis on strong cultural differences between the three continents of origin. The
existence of clear differences between these three groups is in accordance with the role
of cultural differences in explaining higher crime rates among immigrants by origin. On
the other hand, there are important similarities within nationalities in each group. These
similarities are not observed if we only look at the homicide rates by nationality in the
country of origin or in the host country. This result supports the first hypothesis by
which immigrants have a crime rate different than nationals by the mere fact of being an
immigrant.
Table 8: CR comparison by countries
CR mean CR origin CR mean / CR origin
UK 14,8 1,5 9,6Romania 26,7 2,4 10,9Algeria 98,7 1,7 56,9Morocco 30,8 0,5 64,8Colombia 29,1 59,3 0,5Ecuador 13,1 17,0 0,8Peru 5,5 4,9 1,1China 14,3
Source: MIR, INE and UN Office on Drugs and Crime.Note: CR mean shows the CR ratio for the number homicides per 1000 inhabitants, CR origin is the CR recorded in each country.
29
III. EMPIRICAL ANALISYS
Our main information sources for crime are the data on convictions from the Ministerio
del Interior (Spanish Ministry of Home Affairs) and the data about committed crimes
from Instituto Nacional de Estadística (Spanish National Statistics). Both sources
provide province-level annual data between 1999 and 2006.
The data about committed crimes includes no information regarding the nationality of
lawbreakers, but data on convictions is broken down between national and non-national
convicted criminals. Besides, there is a disaggregation by type of crime, among
economic crimes (including property and other economic crimes), and crimes against
the persons. However, this information is only available for those criminals already
convicted.
In both cases, the crime rates (based on either committed crimes or convicted criminals)
where defined as crime rates per each 10,000 inhabitants, for which the corresponding
province populations from Census were used. When the crime rates were computed for
nationals and non-nationals, the relevant population was the province number of
nationals and non-nationals, respectively.
The main descriptive statistics of the province crime rates between 1999 and 2006 are
shown in Table 9. We also show the ratio of convicted to arrested, as a measure of
deterrence.
30
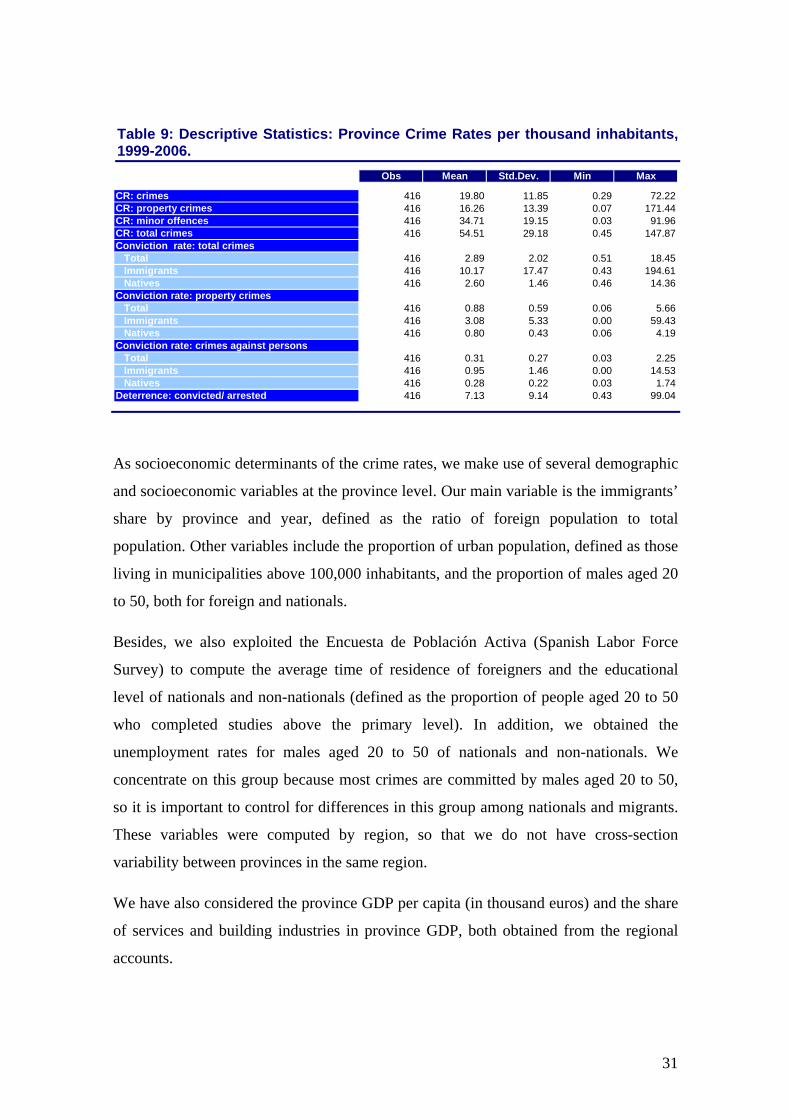
Table 9: Descriptive Statistics: Province Crime Rates per thousand inhabitants, 1999-2006.
Obs Mean Std.Dev. Min Max
CR: crimes 416 19.80 11.85 0.29 72.22CR: property crimes 416 16.26 13.39 0.07 171.44CR: minor offences 416 34.71 19.15 0.03 91.96CR: total crimes 416 54.51 29.18 0.45 147.87Conviction rate: total crimes Total 416 2.89 2.02 0.51 18 Immigrants 416 10.17 17.47 0.43 194.61 Natives 416 2.60 1.46 0.46 14Conviction rate: property crimes Total 416 0.88 0.59 0.06 5 Immigrants 416 3.08 5.33 0.00 59 Natives 416 0.80 0.43 0.06 4Conviction rate: crimes against persons Total 416 0.31 0.27 0.03 2 Immigrants 416 0.95 1.46 0.00 14 Natives 416 0.28 0.22 0.03 1Deterrence: convicted/ arrested 416 7.13 9.14 0.43 99
.45
.36
.66
.43
.19
.25
.53
.74
.04
As socioeconomic determinants of the crime rates, we make use of several demographic
and socioeconomic variables at the province level. Our main variable is the immigrants’
share by province and year, defined as the ratio of foreign population to total
population. Other variables include the proportion of urban population, defined as those
living in municipalities above 100,000 inhabitants, and the proportion of males aged 20
to 50, both for foreign and nationals.
Besides, we also exploited the Encuesta de Población Activa (Spanish Labor Force
Survey) to compute the average time of residence of foreigners and the educational
level of nationals and non-nationals (defined as the proportion of people aged 20 to 50
who completed studies above the primary level). In addition, we obtained the
unemployment rates for males aged 20 to 50 of nationals and non-nationals. We
concentrate on this group because most crimes are committed by males aged 20 to 50,
so it is important to control for differences in this group among nationals and migrants.
These variables were computed by region, so that we do not have cross-section
variability between provinces in the same region.
We have also considered the province GDP per capita (in thousand euros) and the share
of services and building industries in province GDP, both obtained from the regional
accounts.
31
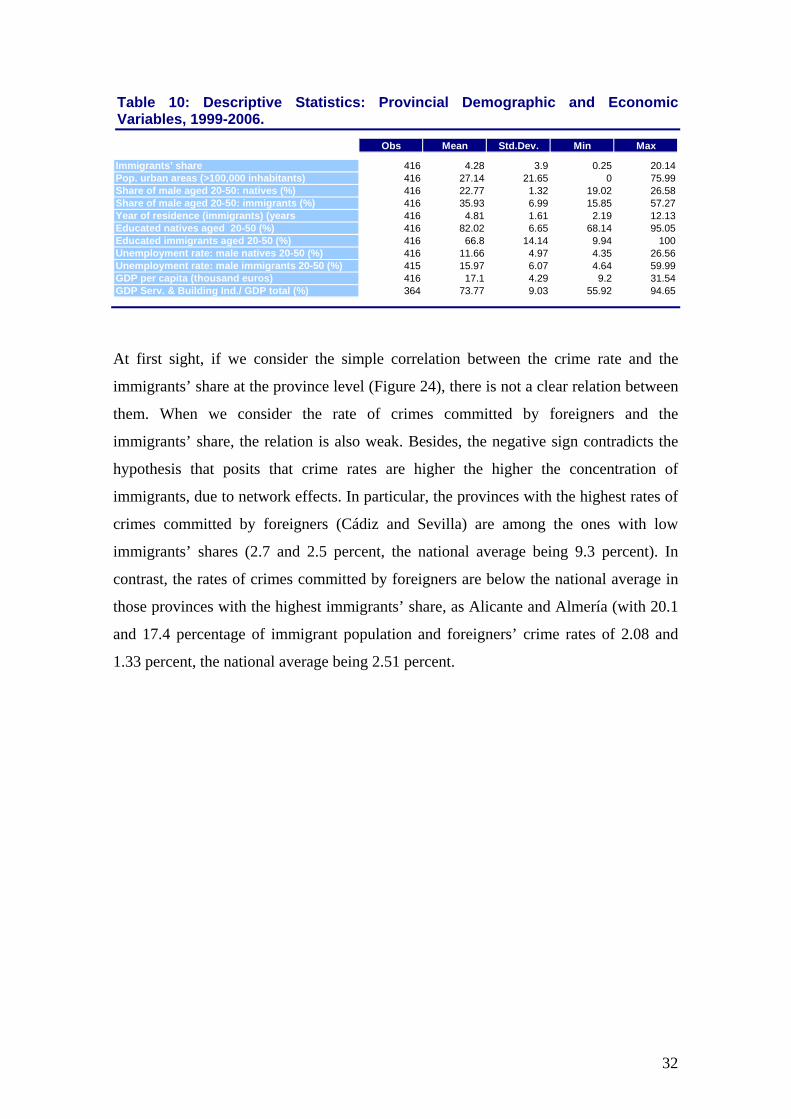
Table 10: Descriptive Statistics: Provincial Demographic and Economic Variables, 1999-2006.
Obs Mean Std.Dev. Min Max
Immigrants’ share 416 4.28 3.9 0.25 20.14Pop. urban areas (>100,000 inhabitants) 416 27.14 21.65 0 75.99Share of male aged 20-50: natives (%) 416 22.77 1.32 19.02 26.58Share of male aged 20-50: immigrants (%) 416 35.93 6.99 15.85 57.27Year of residence (immigrants) (years 416 4.81 1.61 2.19 12Educated natives aged 20-50 (%) 416 82.02 6.65 68.14 95.05Educated immigrants aged 20-50 (%) 416 66.8 14.14 9.94 100Unemployment rate: male natives 20-50 (%) 416 11.66 4.97 4.35 26.56Unemployment rate: male immigrants 20-50 (%) 415 15.97 6.07 4.64 59.99GDP per capita (thousand euros) 416 17.1 4.29 9.2 31.54GDP Serv. & Building Ind./ GDP total (%) 364 73.77 9.03 55.92 94.65
.13
At first sight, if we consider the simple correlation between the crime rate and the
immigrants’ share at the province level (Figure 24), there is not a clear relation between
them. When we consider the rate of crimes committed by foreigners and the
immigrants’ share, the relation is also weak. Besides, the negative sign contradicts the
hypothesis that posits that crime rates are higher the higher the concentration of
immigrants, due to network effects. In particular, the provinces with the highest rates of
crimes committed by foreigners (Cádiz and Sevilla) are among the ones with low
immigrants’ shares (2.7 and 2.5 percent, the national average being 9.3 percent). In
contrast, the rates of crimes committed by foreigners are below the national average in
those provinces with the highest immigrants’ share, as Alicante and Almería (with 20.1
and 17.4 percentage of immigrant population and foreigners’ crime rates of 2.08 and
1.33 percent, the national average being 2.51 percent.
32
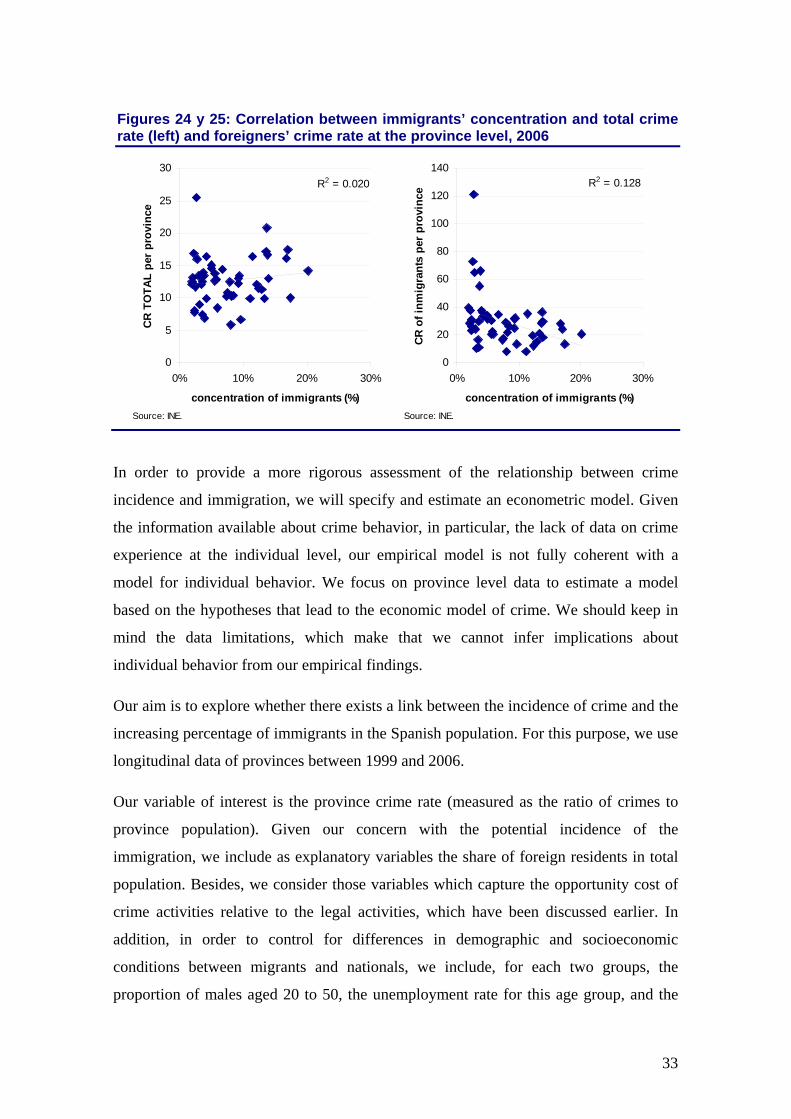
Figures 24 y 25: Correlation between immigrants’ concentration and total crime rate (left) and foreigners’ crime rate at the province level, 2006
R2 = 0.020
0
5
10
15
20
25
30
0% 10% 20% 30%
concentration of immigrants (%)
CR T
OTA
L pe
r pro
vinc
e
Source: INE.
R2 = 0.128
0
20
40
60
80
100
120
140
0% 10% 20% 30%
concentration of immigrants (%)
CR o
f inm
igra
nts
per
prov
ince
Source: INE.
In order to provide a more rigorous assessment of the relationship between crime
incidence and immigration, we will specify and estimate an econometric model. Given
the information available about crime behavior, in particular, the lack of data on crime
experience at the individual level, our empirical model is not fully coherent with a
model for individual behavior. We focus on province level data to estimate a model
based on the hypotheses that lead to the economic model of crime. We should keep in
mind the data limitations, which make that we cannot infer implications about
individual behavior from our empirical findings.
Our aim is to explore whether there exists a link between the incidence of crime and the
increasing percentage of immigrants in the Spanish population. For this purpose, we use
longitudinal data of provinces between 1999 and 2006.
Our variable of interest is the province crime rate (measured as the ratio of crimes to
province population). Given our concern with the potential incidence of the
immigration, we include as explanatory variables the share of foreign residents in total
population. Besides, we consider those variables which capture the opportunity cost of
crime activities relative to the legal activities, which have been discussed earlier. In
addition, in order to control for differences in demographic and socioeconomic
conditions between migrants and nationals, we include, for each two groups, the
proportion of males aged 20 to 50, the unemployment rate for this age group, and the
33
percentage of educated people within this age group. Furthermore, in order to control
for differential effects by immigrant country of origin, we have considered the weight of
immigrants from four regions of origin: non-UE Europe, Latin America, Africa, and
Asia.
Several contributions (Sah, 1991; Glaeser et al., 1996; Fajnzylber et al., 2002; Grogger,
1995) have pointed out the potential importance of criminal experience, learning-by-
doing in criminal activities, as well as the scarcity of opportunities in legal activities for
ex-convicts. The importance of these effects can be tested introducing the lagged crime
rate among the covariates, in line with Buonanno and Montolio (2007).
Our empirical specification, using sub indices i and t to denote provinces and years,
respectively, can thus be written as
tititititi uXCC ,,'
,, ++++= − αηβρ 1
where C denotes the crime rate, and X is the vector of further covariates affecting crime
rate; the last three terms denote unobserved terms capturing unobserved heterogeneity
among provinces, aggregate shocks common to all provinces, and idiosyncratic shocks.
In this context, the existence of province-level unobserved heterogeneity introduces a
potential endogeneity problem to the extent that province-level omitted factors can be
correlated with the observed covariates. This is the case, by construction, whenever the
lagged crime rate is included. Under the assumption that province-specific unobserved
factors are invariant over time, the availability of longitudinal or panel data may yield
consistent estimates by means of a fixed-effects transformation that removes the
unobserved heterogeneity term, whereas the parameters of interest remain unchanged
after such transformation. The fact that there are endogenous variables among the
covariates (the lagged dependent variable, among others), requires an instrumental
variable procedure.
The obvious instruments are the lagged values of the covariates, which are uncorrelated
with the error term. Nevertheless, we also consider the share of services and building
industries in province GDP as instrument for the share of resident immigrants in
province population. This variable is positively correlated with the share of immigrants
in each province total population (see left graph in Figure A.1), due to the high labor
34
participation of immigrants in these activities. Nevertheless, the full exogeneity of this
variable could be questioned, to the extent that as this variable increases, the labor
opportunities of immigrants increase, and migrants might become less prone to involve
in criminal activities. In such case, the use of this instrument could induce a negative
bias when estimating the relation between immigrants’ share and crime rate. However,
this argument, which seems appropriate in static terms, is weakened in dynamic terms.
In the right graph of Figure A.1, we find that the regional unemployment rate for
immigrants, if anything, is positively correlated with the share of services and building
industries in regional GDP. In fact, we find that the immigrants’ unemployment rate
moves in the same direction as the weight of services and building in regional GDP,
which challenges the previous reasoning. The high geographical mobility of immigrants
is behind this result, thus inducing the positive correlation between the geographical
concentration of immigrants and the importance of those activities that offer them more
employment opportunities. Nevertheless, we have implemented estimations with and
without this instrument, and our results are robust to the inclusion of this variable in the
instrument set.
The estimation approach consists on a generalized method of moments (GMM)
estimator (see Hansen, 1982; Arellano and Bond 1991). In particular, our estimation
approach consists of a system-GMM estimator proposed by Arellano and Bover (1995)
and developed by Blundell and Bond (1998). Given the small sample size, the standard
errors must be appropriately corrected from potential finite-sample bias following
Windmeijer (2004).
We will consider three different measures of the dependent variable: total crimes,
property crimes and minor crimes. The OLS estimates are inconsistent in the presence
of province unobserved effects correlated with the covariates. In particular, if there are
unobserved province characteristics that are related with the share of immigrants in the
province, we would obtain an inconsistent estimate of the effect of immigration on
crime. The within-province transformation would remove any time-invariant province
effect, but it requires strict exogeneity of the right-hand-side variables, what it is not the
case if the lagged crime rate is among the explanatory variables.
In Table A1, we report OLS estimates (excluding the lagged crime rate) and the within-
province estimates. The most remarkable fact is that OLS estimates produce a positive
35
and significant coefficient of the concentration of immigrants on crime rates. This
would lead to conclude that immigration has a positive effect on the local crime rate,
even after controlling for province specific characteristics, such as economic conditions
and the population composition. The significance of the immigrants’ share disappears
when we implement the within-province estimation, except for minor crimes. However,
these estimates are not reliable too, since it is well-known the inconsistency of this
estimator in the presence of the lagged dependent variable.
The GMM estimates are reported in Table A2. In the first two columns, we have only
included the immigrants’ share and the lagged crime rate, so that other province
observed characteristics, such as economic conditions and population composition,
were excluded. In the first two specifications, the immigrants’ share exhibits a positive
and significant effect for total crime, and also for property and minor crimes. The
estimates in the last two columns include province-level variables that capture
demographic and socioeconomic conditions for nationals and non-nationals.
Interestingly, the lagged crime rate loses its significance when these additional control
variables were included. Most variables were no significant at the 10 percent level, but
jointly they add explanatory power to the specification. Both for total crimes and for the
two types of crimes considered, the immigrants’ share is positive and significant even
after controlling for all the observed socioeconomic and demographic factors. In
comparison with OLS estimates, though, the estimated effects are, in general,
substantially smaller.
In the case of total crimes, we find that the share of males aged 20 to 50 is negative for
immigrants, but not significant, and positive for nationals. Besides, the coefficient of
this variable for nationals is sizeable. We can interpret it as follows: a one percent
increase in the proportion of national males between 20 and 50 years would lead an
increase of 3.9 additional crimes per thousand inhabitants. In relative terms, given that
the sample mean of the total crime rate was about 600 in 2006, a one percent increase in
national males aged 20 to 50 would lead to an average increase in total crime around 6.5
percent. In 2006, the ratio of males aged 20 to 50 to total males was 69 percent for
immigrants and 46 percent for nationals. In the case of nationals, this figure is fairly
constant in the sample period, whereas the proportion of this age group among
immigrants was at its maximum in 2005 and 2006. The non significance of the share of
this age group for male immigrants is easily explained by the fact that the immigrants’
36
share is highly correlated with the share of this age group, even after controlling for
province effects (80%). Behind our result, there remains the fact that the age
distribution of immigrants is very different from the age distribution of nationals. In
particular, distribution of immigrants is strongly biased towards the group with the
highest crime incidence, males aged 20 to 50, so that the immigrants’ share captures all
the effect of any increase in this group.
Looking at the effect of the immigrants’ share, the estimated effect implies that a one
percent increase in the concentration of immigrants would lead to an average increase of
1.9 further crimes per each thousand inhabitants, which approximately amounts to a 3.2
percent increase in the total crime rate. Nevertheless, given the relative size of
immigrants and nationals, the absolute effect on the total crime rate is still larger for
immigrants: male immigrants aged 20 to 50 represented, in 2006, one sixth of male
nationals aged 20 to 50.
The specification tests, namely the Hansen-Sargan and the AR(2) tests, yield mixed
evidence. Whereas the high p-value of the AR(2) test does not indicate specification
error, the Hansen-Sargan test has a p-value of 2 percent, which sheds some doubts on
the specification. It may be pointing out that some of the instruments used are invalid.
But this test is a general specification test. For instance, it could be indicating
misspecification of the functional form. In particular, we are aggregating different types
of crime when computing the total crime rate, and assuming that the effects of all the
variables are proportional to the number of any type of crime. We can investigate
whether this latter explanation has empirical support, concentrating on separate
estimates by type of crime.
Concerning crime types, we first find that the specification tests are much more
favorable when we use disaggregated categories of crime. This finding reflects the fact
that socioeconomic and demographic variables have different effects on different types
of crime.
Both for property and minor crimes, we find again that immigrants’ share and the share
of male nationals aged 20 to 50 have a significant effect. In the case of immigrant share,
we find that a one percent increase of this variable would lead to average increases of
4.6 percent in the rate of crimes against property, and 3 percent in the rate of minor
crimes.
37
Notice that behind the apparently higher effect of immigration on minor crimes, there is
the fact that the incidence of minor crimes is the highest. Moreover, it is worth noticing
that minor crimes include misdemeanors, entailing mostly economic or administrative
sanctions but not penal and imprisonment measures. In this latter case, the relative lack
of knowledge of immigrants might be behind their higher propensity to commit minor
crimes.
The significant coefficients of the share of national males aged 20 to 50 imply, on
average, that a one percent increase in the size of this group would increase property
crimes by 15 percent, and minor crimes by 7.4 percent. Again, the relative effects of
this national population group are higher than the effect of immigrant population, but if
we account for the relative sizes of both populations, the absolute effect is higher for
immigrants. In any case, the positive effect of immigration on crime, although
significant, must be qualified. The contribution of immigration to the crime
phenomenon is strongly related with the fact that an increase in immigrants lead to an
increase in total population of the male group more prone to commit crime.
Our results are fairly coherent with the predictions of the economic model of crime, so
that once that we control for socioeconomic and demographic factors, some of which
capturing differences among nationals and immigrants that potentially affect the
propensity towards crime, the effect of the immigrants’ share is reduced. In particular,
our results show that the fact that immigration tend to increase the weight of males aged
20 to 50 in Spanish population, which is the group more prone to commit crime, is
behind the significant effect of the immigrants’ share. Regarding this, we find that an
increase in the proportion of this population group within national population would
also have a significantly positive effect on crime.
In the previous estimates, we have provided evidence about the province crime rate and
the weight of immigrants in province population. We now investigate an alternative
model, which considers the crime rate differential between immigrants and nationals,
and see how immigrants’ share affect this differential, once after controlling for
socioeconomic factors. We thus consider the following equation,
titititiNI
tiNI uXCCCC ,,,, ')()( ++++−=− − αηβρ 1
38
The only information related with province crime rate which is available separately for
nationals and non-nationals is provided by the number of convictions. Thus, we have
measured the difference in the crime rate between immigrants and nationals using this
variable, which also provides disaggregation for total crimes, economic crimes, and
crimes against persons.
In addition to immigrants’ share in the province, we consider among the covariates
those factors capturing the heterogeneity among national and immigrant population
which might be relevant within the economic approach to crime activities. These
variables are the differences between immigrants and nationals in the unemployment
rate, the average level of education, and the weight of males aged 20 to 50 in total
population. We have also included the average duration of residence of non-UE
foreigners. Moreover, in order to control for differential effects by immigrant country of
origin, we have considered the weight of immigrants from four regions of origin: non-
UE Europe, America, Africa, and others. Besides, the equation above was estimated
with and without the weight of services and building in province GDP among the
instrument set.
In all the specifications for the differential in the rates of total crimes, the immigrants’
share exhibits a negative coefficient, generally significant, what points out that the
crime rate differential would narrow as the immigrants’ concentration increases.
Besides, the education gap between non-nationals and nationals has a negative effect on
the crime differential, which is significant at the 10 percent. Hence, the crime
differential becomes lower the lower the education gap.
We now discuss the results disaggregated by type of crime. In the case of economic
crime, we find again that the differential in property crime rates is narrowed as the
immigrants’ share increases. From estimates in the second and fourth columns, we find
evidence of a negative composition effect in immigrants’ population. In particular, the
fourth column estimates indicate that a higher proportions of American, non-UE
European, and African immigrants tend to widen the crime differential, the estimated
effect being larger for the latter ones. This result would suggest that cultural differences
in attitudes towards economic crime.
Interestingly, the unemployment rate difference exhibits a positive and significant
effect, thus reflecting the fact that the crime rate differential increases when the
39
differences in employment opportunities are widened. Last, differences in the
proportion of males aged 20 to 50 have a significant effect, but negative, what is
contrary to expected.
With regard to crimes against persons, the model has much lower explanatory power.
However, this result is not surprising, since this type of crime is expected to be
relatively unaffected by socioeconomic reasons. The strongest result here is that the
crime rate differential increases with the immigrants’ time of residence. Also, the
proportion of African immigrants and the differential in the proportion of males aged 20
to 50 has a positive effect on the crime differential.
IV. CONCLUSIONS
Crime rates in Spain are not (by European standards) but have steadily increased in the
last couple of years. The rates of crimes committed by immigrants are substantially
higher than nationals. Although those differences are still true today, they have been
substantially reduced in the last few years. Both immigrants and nationals have
contributed to crime rate growth. The arrival of immigrants has resulted in a lack of
progress in the reduction of offences against property and in a minor increase in the
number of offences against Collective Security (i.e. drugs and trafficking). In the case
of nationals, their contribution to the increase in the crime rate is primarily concentrated
in offences against persons. Econometric results confirm what we obtained in the
descriptive section even after controlling for all the observed socioeconomic and
demographic factors. The econometric section also allows us to seize the effect of
immigration and to conclude that immigration matters in order to explain the crime rate
but its importance should not be overstated.
We also provide an evidence of cultural differences in attitudes towards economic
crime. Our estimation indicate that a higher proportions of American, non-UE
European, and African immigrants tend to widen the crime differential, the estimated
effect being larger for the latter ones. Furthermore, we have found that the gap in crime
rates between immigrants and nationals tends to be reduced as the immigrants’ share
increases. We interpret this as the result of immigrants’ integration, on the one side, and
40
that after the stock of resident immigrants is large enough, different communities reach
a size which allows them to generate positive synergies, improving their socioeconomic
prospects.
Our paper generally supports that labor market related conditions seem to supersede
other potential explanations for the relationship between crime and immigration.
However, given the limitations of the dataset and the available statistics of crime in
Spain, our econometric analysis cannot exclude other alternative explanations such as
ethnical related activities or misperceptions about the law. Cultural differences were
statistically detected thus endorsing the view that some communities of immigrants
might not see criminal law as a body of rules that captures their own views of society.
The implications of our analysis are that the relationship between crime and
immigration should not be overstated but neither understated. Most probably policies
should look at the roots of crime rather than at the immigration status, thus calling for
better economic and social policies rather than specific legal interventions. If the main
causes of the correlation between crime and immigration are economic in general, and
labor market opportunities in the particular, then policies that address these root causes
are more recommended. For example, it is possible to tailor immigration policies to
reduce potential crime by favor high human over low human capital. It is also possible
to develop policies to attract low crime immigration such as Northern European
pensioners. However, there are important trade-offs in terms of labor demand.
Age is the main channel (although not the only one) through which immigration has led
to an increase in the crime rate. For that reason, the relation between crime and
immigration in Spain should be thought as part of a more general tradeoff that is facing
the Spanish society. Immigration in Spain is economic immigration filling occupations
in which (young) age is the main requirement. That labor force has allowed them to an
important cycle of economic growth but no without costs.
41
V. REFERENCES
Arellano, M., Bover, O., 1995. Another look at the instrumental-variable estimation of
error components models. Journal of Econometrics 68, 29-52.
Arellano, M., Bond, S., 1991. Some tests of specification for panel data: Monte Carlo
evidence and application to employment equation. Review of Economic Studies 58,
277-297.
Becker, G., 1968, Crime and Punishment: An Economic Approach, Journal of Political
Economy 76, 169-217.
Bianchi, M., Buonanno, P., and Pinotti, P., 2008, Do Immigrants Cause Crime?,
Working Paper 2008-05, Paris School of Economics.
Blundell, R., Bond, S., 1998. Initial conditions and moment restrictions in dynamic
panel data models. Journal of Econometrics 87, 115-143.
Buonanno, P., and D. Montolio, 2007, Identifying the Socio-economic and
Demographic Determinants of Crime across Spanish Provinces, International Review of
Law and Economics, forthcoming.
Calvó- Armengol A., Zenou Y., 2003, Does Crime affect unemployment? The role of
social networks, Annales d’Economie et Statistique. Nº 71-72.
Chiricos T., 1987, Rates if crime and unemployment: An analysis of aggregate research
evidence, Social Problems, 34, p. 187-211.
Dharmapala, D., and Garoupa, N., 2004, Penalty Enhancements for Hate Crimes: An
Economic Analysis, American Law and Economics Review 6, 185-207.
Fajnzylber, P., Lederman, D. and N. Loayza, 2002. Inequality and violent crime.
Journal of Law and Economics 45, 1-40.
Freeman R.B., 1999, The economics of crime, in Handbook of Labor Economics, O.
Ashenfelter and D. Cards (Eds.), Amsterdam: North Holland, p. 3529-3571.
Garoupa, N., 1997, The Theory of Optimal Law Enforcement, Journal of Economic
Surveys 11, 267-295.
42
43
Garoupa, N., 2007, Optimal Law Enforcement and Criminal Organization, Journal of
Economic Behavior and Organization 63, 461-474.
Glaeser, E.L., Sacerdote, B. and J.A. Scheinkman, 1996. Crime and social interactions.
Quarterly Journal of Economics 111, 507-548.
Gould E., Weinberg B., Mustard D., 2002, Crime and local labor market opportunities
in the United States: 1979-1997, Review of Economics and Statistics. February 2002,
84(1): 45-61.
Grogger, J., 1995. The effect of arrest on the employment and earnings of young men.
Quarterly Journal of Economics 110, 51-72.
Hansen, L.P. 1982. Large sample properties of generalized method of moments
estimators. Econometrica 50, 1029-1054.
Lee D., 1993, An empirical investigation of the economic incentives for criminal
behavior, Unpublished Manuscript, Harvard University.
Levitt S. D., 2001, Alternative strategies for identifying the link between unemployment
and crime. Journal of Quantitative Criminology, vol. 17, nº 4, December 2001.
McAdams, R., 2000, A Focal Point Theory of Expressive Law, Virginia Law Review
86, 1649-1729.
Polinsky, A. M. and Shavell, S., 2000, The Economic Theory of Public Enforcement of
the Law, Journal of Economic Literature 38, 45-76.
Raphael S., Winter-Ebmer R., 2001, Identifying the effect of unemployment on crime.
Journal of Law and Statistics, vol. XLIV (April 2001).
Sah, R.K., 1991. Social Osmosis and Patterns of Crime. Journal of Political Economy
99, 1271-1295.
Windmeijer, F. 2004. A finite sample correction for the variance of linear efficient two-
step GMM estimators. Journal of Econometrics 126(1), 25-51.
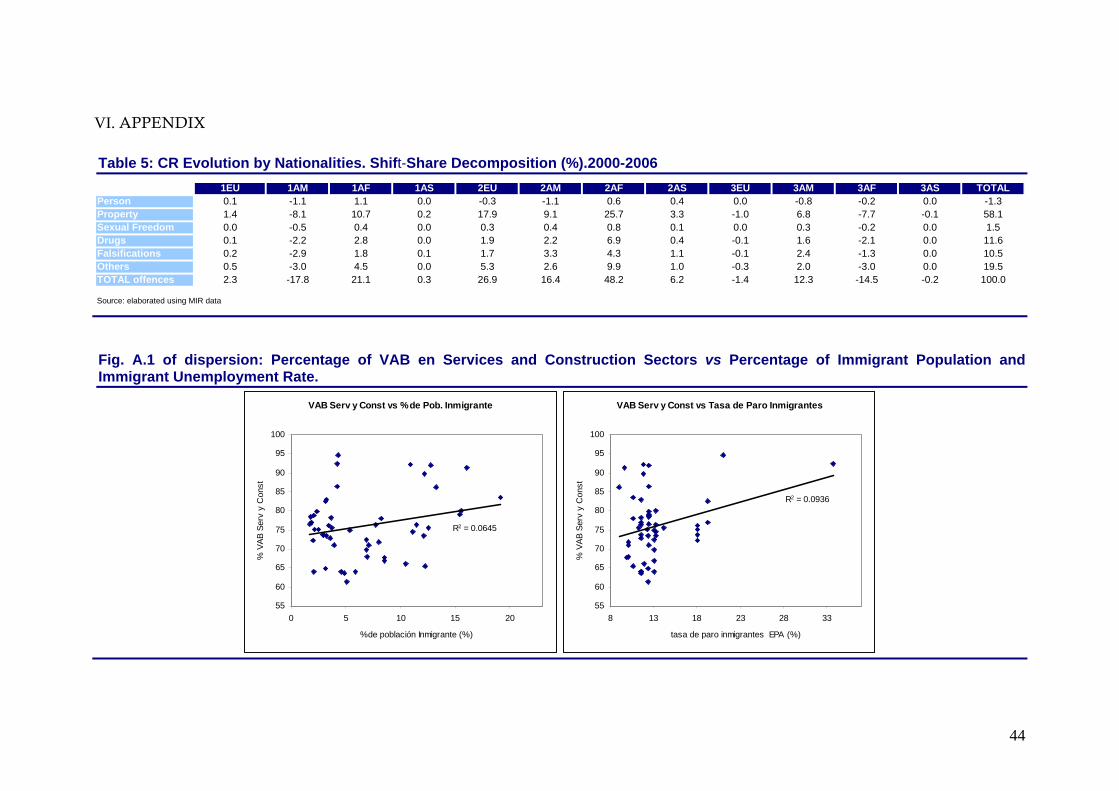
44
VI. APPENDIX
Table 5: CR Evolution by Nationalities. Shift-Share Decomposition (%).2000-2006 1EU 1AM 1AF 1AS 2EU 2AM 2AF 2AS 3EU 3AM 3AF 3AS TOTAL
Person 0.1 -1.1 1.1 0.0 -0.3 -1.1 0.6 0.4 0.0 -0.8 -0.2 0.0 -1.3Property 1.4 -8.1 10.7 0.2 17.9 9.1 25.7 3.3 -1.0 6.8 -7.7 -0.1 58.1Sexual Freedom 0.0 -0.5 0.4 0.0 0.3 0.4 0.8 0.1 0.0 0.3 -0.2 0.0 1.5Drugs 0.1 -2.2 2.8 0.0 1.9 2.2 6.9 0.4 -0.1 1.6 -2.1 0.0 11.6Falsifications 0.2 -2.9 1.8 0.1 1.7 3.3 4.3 1.1 -0.1 2.4 -1.3 0.0 10.5Others 0.5 -3.0 4.5 0.0 5.3 2.6 9.9 1.0 -0.3 2.0 -3.0 0.0 19.5TOTAL offences 2.3 -17.8 21.1 0.3 26.9 16.4 48.2 6.2 -1.4 12.3 -14.5 -0.2 100.0
Source: elaborated using MIR data
Fig. A.1 of dispersion: Percentage of VAB en Services and Construction Sectors vs Percentage of Immigrant Population and Immigrant Unemployment Rate.
VAB Serv y Const vs Tasa de Paro Inmigrantes
R2 = 0.0936
55
60
65
70
75
80
85
90
95
100
8 13 18 23 28 33
tasa de paro inmigrantes EPA (%)
% V
AB S
erv
y C
onst
VAB Serv y Const vs % de Pob. Inmigrante
R2 = 0.0645
55
60
65
70
75
80
85
90
95
100
0 5 10 15 20
%de población Inmigrante (%)
% V
AB S
erv
y C
onst
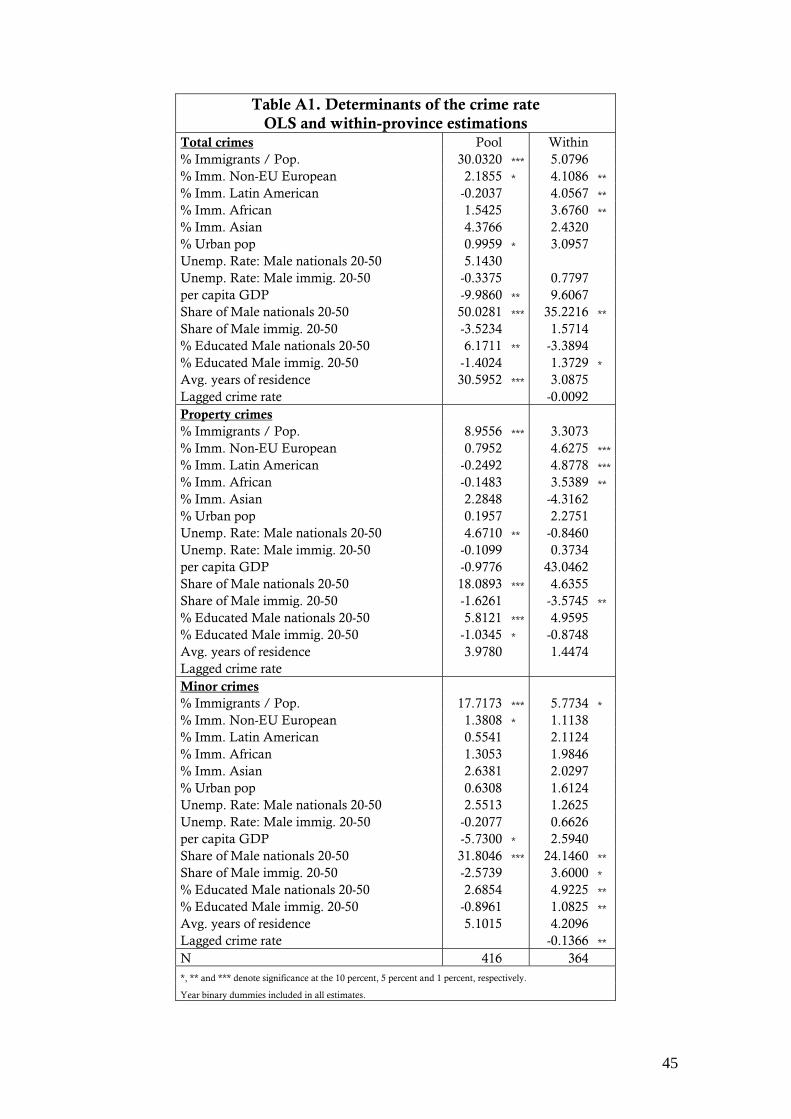
Table A1. Determinants of the crime rate OLS and within-province estimations
Total crimes Pool Within
% Immigrants / Pop. 30.0320 *** 5.0796
% Imm. Non-EU European 2.1855 * 4.1086 **
% Imm. Latin American -0.2037 4.0567 **
% Imm. African 1.5425 3.6760 **
% Imm. Asian 4.3766 2.4320
% Urban pop 0.9959 * 3.0957
Unemp. Rate: Male nationals 20-50 5.1430
Unemp. Rate: Male immig. 20-50 -0.3375 0.7797
per capita GDP -9.9860 ** 9.6067
Share of Male nationals 20-50 50.0281 *** 35.2216 **
Share of Male immig. 20-50 -3.5234 1.5714
% Educated Male nationals 20-50 6.1711 ** -3.3894
% Educated Male immig. 20-50 -1.4024 1.3729 *
Avg. years of residence 30.5952 *** 3.0875
Lagged crime rate -0.0092
Property crimes % Immigrants / Pop. 8.9556 *** 3.3073
% Imm. Non-EU European 0.7952 4.6275 ***
% Imm. Latin American -0.2492 4.8778 ***
% Imm. African -0.1483 3.5389 **
% Imm. Asian 2.2848 -4.3162
% Urban pop 0.1957 2.2751
Unemp. Rate: Male nationals 20-50 4.6710 ** -0.8460
Unemp. Rate: Male immig. 20-50 -0.1099 0.3734
per capita GDP -0.9776 43.0462
Share of Male nationals 20-50 18.0893 *** 4.6355
Share of Male immig. 20-50 -1.6261 -3.5745 **
% Educated Male nationals 20-50 5.8121 *** 4.9595
% Educated Male immig. 20-50 -1.0345 * -0.8748
Avg. years of residence 3.9780 1.4474
Lagged crime rate
Minor crimes % Immigrants / Pop. 17.7173 *** 5.7734 *
% Imm. Non-EU European 1.3808 * 1.1138
% Imm. Latin American 0.5541 2.1124
% Imm. African 1.3053 1.9846
% Imm. Asian 2.6381 2.0297
% Urban pop 0.6308 1.6124
Unemp. Rate: Male nationals 20-50 2.5513 1.2625
Unemp. Rate: Male immig. 20-50 -0.2077 0.6626
per capita GDP -5.7300 * 2.5940
Share of Male nationals 20-50 31.8046 *** 24.1460 **
Share of Male immig. 20-50 -2.5739 3.6000 *
% Educated Male nationals 20-50 2.6854 4.9225 **
% Educated Male immig. 20-50 -0.8961 1.0825 **
Avg. years of residence 5.1015 4.2096
Lagged crime rate -0.1366 **
N 416 364 *, ** and *** denote significance at the 10 percent, 5 percent and 1 percent, respectively.
Year binary dummies included in all estimates.
45
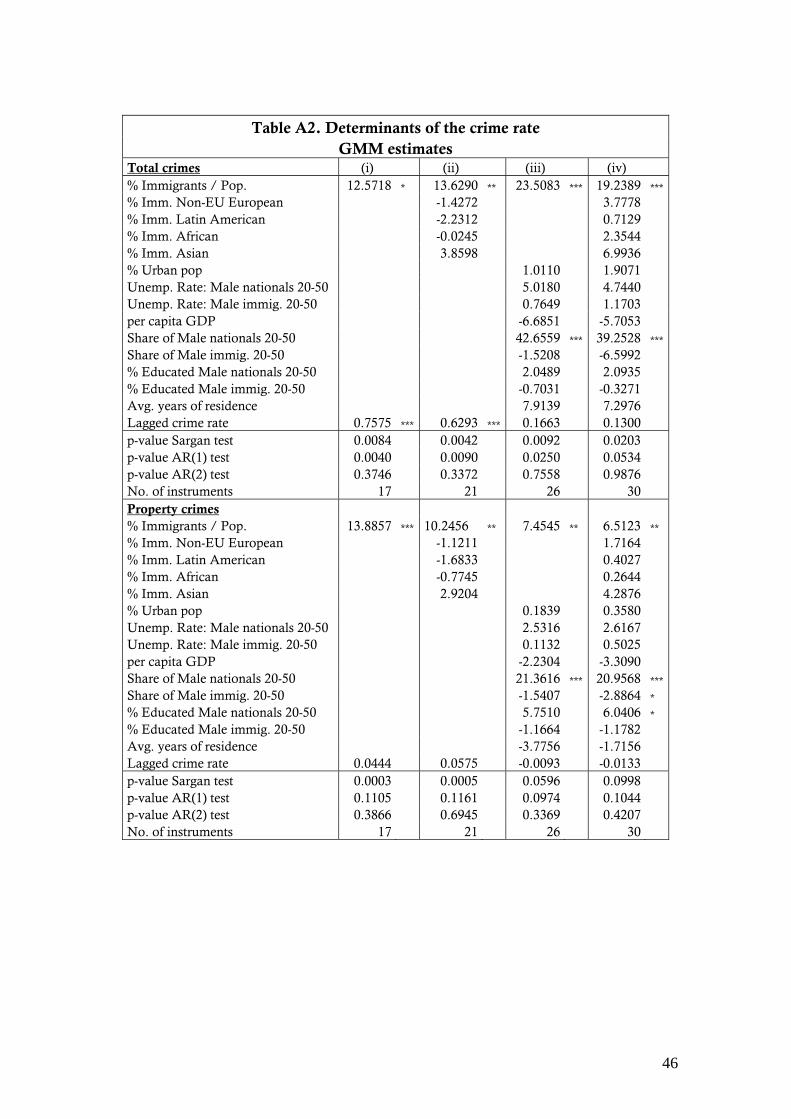
Table A2. Determinants of the crime rate
GMM estimates Total crimes (i) (ii) (iii) (iv)
% Immigrants / Pop. 12.5718 * 13.6290 ** 23.5083 *** 19.2389 ***
% Imm. Non-EU European -1.4272 3.7778
% Imm. Latin American -2.2312 0.7129
% Imm. African -0.0245 2.3544
% Imm. Asian 3.8598 6.9936
% Urban pop 1.0110 1.9071
Unemp. Rate: Male nationals 20-50 5.0180 4.7440
Unemp. Rate: Male immig. 20-50 0.7649 1.1703
per capita GDP -6.6851 -5.7053
Share of Male nationals 20-50 42.6559 *** 39.2528 ***
Share of Male immig. 20-50 -1.5208 -6.5992
% Educated Male nationals 20-50 2.0489 2.0935
% Educated Male immig. 20-50 -0.7031 -0.3271
Avg. years of residence 7.9139 7.2976
Lagged crime rate 0.7575 *** 0.6293 *** 0.1663 0.1300
p-value Sargan test 0.0084 0.0042 0.0092 0.0203
p-value AR(1) test 0.0040 0.0090 0.0250 0.0534
p-value AR(2) test 0.3746 0.3372 0.7558 0.9876
No. of instruments 17 21 26 30
Property crimes
% Immigrants / Pop. 13.8857 *** 10.2456 ** 7.4545 ** 6.5123 **
% Imm. Non-EU European -1.1211 1.7164
% Imm. Latin American -1.6833 0.4027
% Imm. African -0.7745 0.2644
% Imm. Asian 2.9204 4.2876
% Urban pop 0.1839 0.3580
Unemp. Rate: Male nationals 20-50 2.5316 2.6167
Unemp. Rate: Male immig. 20-50 0.1132 0.5025
per capita GDP -2.2304 -3.3090
Share of Male nationals 20-50 21.3616 *** 20.9568 ***
Share of Male immig. 20-50 -1.5407 -2.8864 *
% Educated Male nationals 20-50 5.7510 6.0406 *
% Educated Male immig. 20-50 -1.1664 -1.1782
Avg. years of residence -3.7756 -1.7156
Lagged crime rate 0.0444 0.0575 -0.0093 -0.0133
p-value Sargan test 0.0003 0.0005 0.0596 0.0998
p-value AR(1) test 0.1105 0.1161 0.0974 0.1044
p-value AR(2) test 0.3866 0.6945 0.3369 0.4207
No. of instruments 17 21 26 30
46
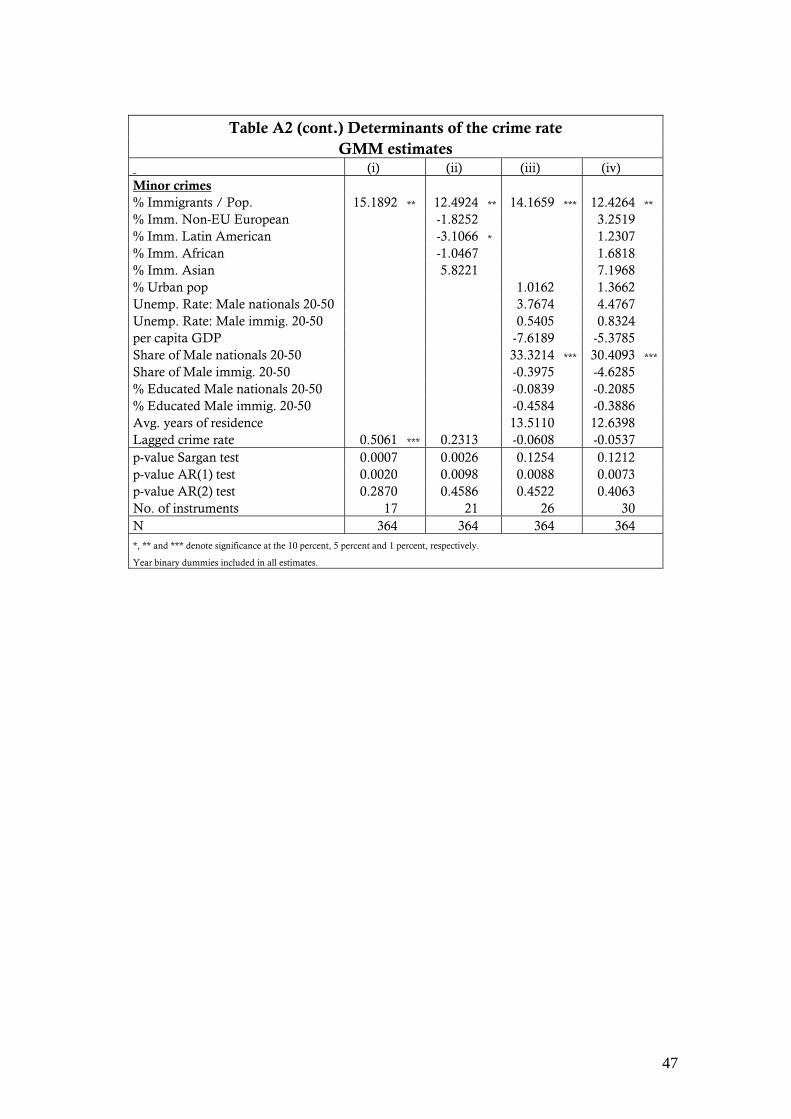
Table A2 (cont.) Determinants of the crime rate
GMM estimates (i) (ii) (iii) (iv)
Minor crimes
% Immigrants / Pop. 15.1892 ** 12.4924 ** 14.1659 *** 12.4264 **
% Imm. Non-EU European -1.8252 3.2519
% Imm. Latin American -3.1066 * 1.2307
% Imm. African -1.0467 1.6818
% Imm. Asian 5.8221 7.1968
% Urban pop 1.0162 1.3662
Unemp. Rate: Male nationals 20-50 3.7674 4.4767
Unemp. Rate: Male immig. 20-50 0.5405 0.8324
per capita GDP -7.6189 -5.3785
Share of Male nationals 20-50 33.3214 *** 30.4093 ***
Share of Male immig. 20-50 -0.3975 -4.6285
% Educated Male nationals 20-50 -0.0839 -0.2085
% Educated Male immig. 20-50 -0.4584 -0.3886
Avg. years of residence 13.5110 12.6398
Lagged crime rate 0.5061 *** 0.2313 -0.0608 -0.0537
p-value Sargan test 0.0007 0.0026 0.1254 0.1212
p-value AR(1) test 0.0020 0.0098 0.0088 0.0073
p-value AR(2) test 0.2870 0.4586 0.4522 0.4063
No. of instruments 17 21 26 30
N 364 364 364 364 *, ** and *** denote significance at the 10 percent, 5 percent and 1 percent, respectively.
Year binary dummies included in all estimates.
47
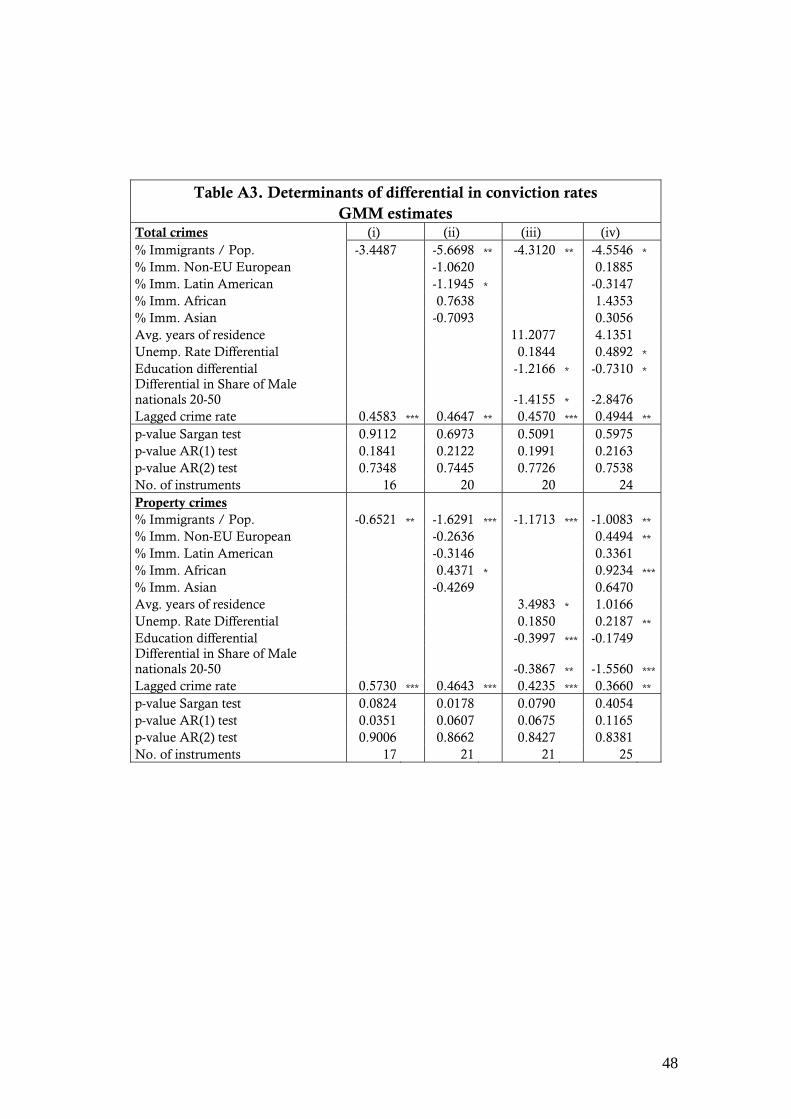
Table A3. Determinants of differential in conviction rates GMM estimates
Total crimes (i) (ii) (iii) (iv)
% Immigrants / Pop. -3.4487 -5.6698 ** -4.3120 ** -4.5546 *
% Imm. Non-EU European -1.0620 0.1885
% Imm. Latin American -1.1945 * -0.3147
% Imm. African 0.7638 1.4353
% Imm. Asian -0.7093 0.3056
Avg. years of residence 11.2077 4.1351
Unemp. Rate Differential 0.1844 0.4892 *
Education differential -1.2166 * -0.7310 *
Differential in Share of Male nationals 20-50 -1.4155 * -2.8476
Lagged crime rate 0.4583 *** 0.4647 ** 0.4570 *** 0.4944 **
p-value Sargan test 0.9112 0.6973 0.5091 0.5975
p-value AR(1) test 0.1841 0.2122 0.1991 0.2163
p-value AR(2) test 0.7348 0.7445 0.7726 0.7538
No. of instruments 16 20 20 24
Property crimes
% Immigrants / Pop. -0.6521 ** -1.6291 *** -1.1713 *** -1.0083 **
% Imm. Non-EU European -0.2636 0.4494 **
% Imm. Latin American -0.3146 0.3361
% Imm. African 0.4371 * 0.9234 ***
% Imm. Asian -0.4269 0.6470
Avg. years of residence 3.4983 * 1.0166
Unemp. Rate Differential 0.1850 0.2187 **
Education differential -0.3997 *** -0.1749
Differential in Share of Male nationals 20-50 -0.3867 ** -1.5560 ***
Lagged crime rate 0.5730 *** 0.4643 *** 0.4235 *** 0.3660 **
p-value Sargan test 0.0824 0.0178 0.0790 0.4054
p-value AR(1) test 0.0351 0.0607 0.0675 0.1165
p-value AR(2) test 0.9006 0.8662 0.8427 0.8381
No. of instruments 17 21 21 25
48
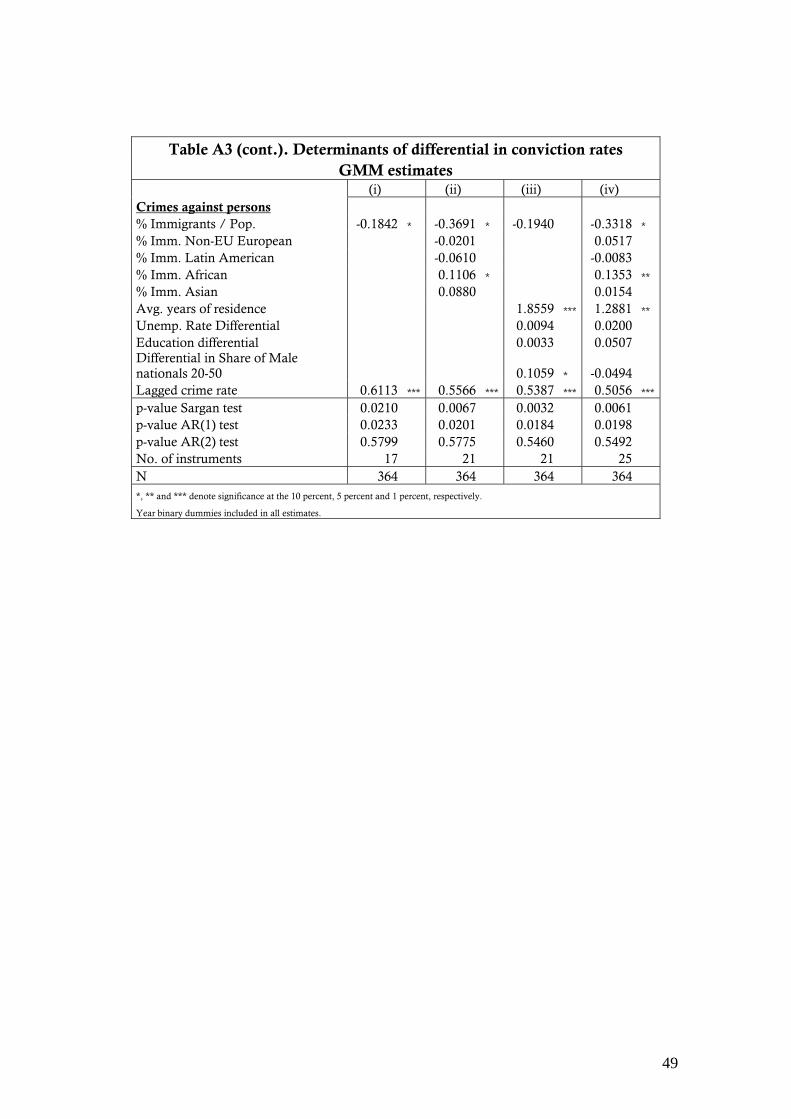
Table A3 (cont.). Determinants of differential in conviction rates GMM estimates
(i) (ii) (iii) (iv)
Crimes against persons
% Immigrants / Pop. -0.1842 * -0.3691 * -0.1940 -0.3318 *
% Imm. Non-EU European -0.0201 0.0517
% Imm. Latin American -0.0610 -0.0083
% Imm. African 0.1106 * 0.1353 **
% Imm. Asian 0.0880 0.0154
Avg. years of residence 1.8559 *** 1.2881 **
Unemp. Rate Differential 0.0094 0.0200
Education differential 0.0033 0.0507
Differential in Share of Male nationals 20-50 0.1059 * -0.0494
Lagged crime rate 0.6113 *** 0.5566 *** 0.5387 *** 0.5056 ***
p-value Sargan test 0.0210 0.0067 0.0032 0.0061
p-value AR(1) test 0.0233 0.0201 0.0184 0.0198
p-value AR(2) test 0.5799 0.5775 0.5460 0.5492
No. of instruments 17 21 21 25
N 364 364 364 364 *, ** and *** denote significance at the 10 percent, 5 percent and 1 percent, respectively.
Year binary dummies included in all estimates.
49
ÚLTIMOS DOCUMENTOS DE TRABAJO
2008-34: “Immigration and Crime in Spain, 1999-2006”, Cesar Alonso, Nuno Garoupa, Marcelo Perera y
Pablo Vazquez. 2008-33: “A Social Network Approach to Spanish Immigration: An Analysis of Immigration into Spain 1998-
2006”, Rickard Sandell. 2008-32: “The Consequences on Job Satisfaction of Job-Worker Educational and Skill Mismatches in the
Spanish Labour Market: a Panel Analysis”, Lourdes Badillo Amador, Ángel López Nicolás y Luis E. Vila.
2008-31: “Students’assessment of higher education in Spain”, César Alonso-Borrego”, Antonio Romero-Medina.
2008-30: “Body image and food disorders: Evidence from a sample of European women”, Joan Costa-Font y Mireia Jofre-Bonet.
2008-29: “Aggregation and Dissemination of Information in Experimental Asset Markets in the Presence of a Manipulator”, HelenaVeiga y Marc Vorsatz.
2008-28: “The Measurement of Consensus: An Axiomatic Analysis”, Jorge Alcalde-Unzu and Marc Vorsatz.
2008-27: “Macroeconomic Consequences of International Commodity Price Shocks”, Claudia S. Gómez-López y Luis A. Puch.
2008-26: “The Effect of Short–Selling on the Aggregation of Information in an Experimental Asset Market”, Helena Veiga y Marc Vorsatz.
2008-25: “Adult height and childhood disease”, Carlos Bozzoli, Angus Deaton y Climent Quintana-Domeque.
2008-24: “On Gender Gaps and Self-Fulfilling Expectations: Theory, Policies and Some Empirical Evidence” Sara de la Rica, Juan J. Dolado y Cecilia García-Peñalosa.
2008-23: “Fuel Consumption, Economic Determinants and Policy Implications for Road Transport in Spain”, Rosa M. González-Marrero, Rosa M. Lorenzo-Alegría y Gustavo A. Marrero.
2008-22: “Trade-off between formal and informal care in Spain”, Sergi Jiménez-Martín y Cristina Vilaplana Prieto.
2008-21: “The Rise in Obesity Across the Atlantic: An Economic Perspective”, Giorgio Brunello, Pierre-Carl Michaud y Anna Sanz-de-Galdeano.
2008-20: “Multimarket Contact in Pharmaceutical Markets”, Javier Coronado, Sergi Jiménez-Martín y Pedro L. Marín.
2008-19: “Financial Analysts impact on Stock Volatility. A Study on the Pharmaceutical Sector”, Clara I. Gonzalez y Ricardo Gimeno.
2007-18: “The Determinants of Pricing in Pharmaceuticals: are U.S. prices really so high?”, Antonio Cabrales y Sergi Jiménez-Martín.
2008-17: “Does Immigration Raise Natives’ Income? National and Regional Evidence from Spain”, Catalina Amuedo-Dorantes y Sara de la Rica.
2008-16: “Assessing the Argument for Specialized Courts: Evidence from Family Courts in Spain”, Nuno Garoupa, Natalia Jorgensen y Pablo Vázquez.
2008-15: “Do Men and Women-Economists Choose the Same Research Fields?: Evidence from Top-50 Departments”, Juan J. Dolado, Florentino Felgueroso y Miguel Almunia.
2008-14: “Demographic change, pension reform and redistribution in Spain”, Alfonso R. Sánchez Martín y Virginia Sánchez Marcos.
2008-13: “Exploring the Pathways of Inequality in Health, Access and Financing in Decentralised Spain”, Joan Costa-Font y Joan Gil.
2008-12: “Hybrid Consumption Paths in the Attribute Space: A Model and Application with Scanner Data”, Sergi Jiménez Martín y Antonio Ladron-de-Guevara Martinez.
2008-11: “Decomposing Body Mass Index Gaps Between Mediterranean Countries: A Counterfactual Quantile Regression Analysis”, Joan Costa-Font, Daniele Fabbri y Joan Gil.
2008-10: “How Well do Individuals Predicttheir Impact on Regional Employment How Well do Individuals Predict”, Hugo Benítez-Silva, Selcuk Eren, Frank Heiland y Sergi Jiménez-Martín.
2008-09: “From Income to Consumption: Measuring Households Partial Insurance”, José María Casado García.
2008-07: “Differential Grading Standards and University Funding: Evidence from Italy”, Manuel Bagues, Mauro Sylos Labini y Natalia Zinovyeva.
2008-05: “Gatekeeping versus Direct-Access when Patient Information Matters”, Paula González.
Related Documents


