DISCUSSION PAPER SERIES ABCD www.cepr.org www.ssrn.com/xxx/xxx/xxx No. 4052 IMMIGRATING TO OPPORTUNITY: ESTIMATING THE EFFECT OF SCHOOL QUALITY USING A NATURAL EXPERIMENT ON ETHIOPIANS IN ISRAEL Eric D Gould, Victor Lavy and Daniele Paserman LABOUR ECONOMICS and PUBLIC POLICY

Welcome message from author
This document is posted to help you gain knowledge. Please leave a comment to let me know what you think about it! Share it to your friends and learn new things together.
Transcript
DISCUSSION PAPER SERIES
ABCD
www.cepr.org
www.ssrn.com/xxx/xxx/xxx
No. 4052
IMMIGRATING TO OPPORTUNITY: ESTIMATING THE EFFECT
OF SCHOOL QUALITY USING A NATURAL EXPERIMENT ON
ETHIOPIANS IN ISRAEL
Eric D Gould, Victor Lavy and Daniele Paserman
LABOUR ECONOMICS and PUBLIC POLICY
ISSN 0265-8003
IMMIGRATING TO OPPORTUNITY: ESTIMATING THE EFFECT
OF SCHOOL QUALITY USING A NATURAL EXPERIMENT ON
ETHIOPIANS IN ISRAEL
Eric D Gould, Hebrew University of Jerusalem and CEPR Victor Lavy, Hebrew University of Jerusalem and CEPR
Daniele Paserman, Hebrew University of Jerusalem and CEPR
Discussion Paper No. 4052 September 2003
Centre for Economic Policy Research 90–98 Goswell Rd, London EC1V 7RR, UK
Tel: (44 20) 7878 2900, Fax: (44 20) 7878 2999 Email: [email protected], Website: www.cepr.org
This Discussion Paper is issued under the auspices of the Centre’s research programme in LABOUR ECONOMICS and PUBLIC POLICY. Any opinions expressed here are those of the author(s) and not those of the Centre for Economic Policy Research. Research disseminated by CEPR may include views on policy, but the Centre itself takes no institutional policy positions.
The Centre for Economic Policy Research was established in 1983 as a private educational charity, to promote independent analysis and public discussion of open economies and the relations among them. It is pluralist and non-partisan, bringing economic research to bear on the analysis of medium- and long-run policy questions. Institutional (core) finance for the Centre has been provided through major grants from the Economic and Social Research Council, under which an ESRC Resource Centre operates within CEPR; the Esmée Fairbairn Charitable Trust; and the Bank of England. These organizations do not give prior review to the Centre’s publications, nor do they necessarily endorse the views expressed therein.
These Discussion Papers often represent preliminary or incomplete work, circulated to encourage discussion and comment. Citation and use of such a paper should take account of its provisional character.
Copyright: Eric D Gould, Victor Lavy and Daniele Paserman
CEPR Discussion Paper No. 4052
September 2003
ABSTRACT
Immigrating to Opportunity: Estimating the Effect of School Quality Using a Natural Experiment on Ethiopians in Israel*
In May 1991, 15,000 Ethiopian Jews were brought to Israel in an overnight airlift and sorted in a haphazard and essentially random fashion to absorption centres across the country. This quasi-random assignment produced a natural experiment whereby the initial schooling environment of Ethiopian children can be considered exogenous to their family background and parental decisions. We examine the extent to which the initial elementary school environment affected the high school outcomes of Ethiopian children, using administrative panel data on the educational career of each child in Israel through much of the 1990s. The results show that the early school environment has an important effect on high school dropout and repetition rates and on end-of-high-school matriculation exams. The results are robust to controlling for observable characteristics of the community, suggesting that characteristics of the elementary school itself, such as the quality of instruction and peer effects, are important for high school success.
JEL Classification: I20 and J24 Keywords: dropout rates, immigrant absorption, natural experiment, peer effects and school quality
Eric D Gould Department of Economics Hebrew University of Jerusalem Mount Scopus Jerusalem 91905 ISRAEL Tel: (972 2) 588 3247 Fax: (972 2) 581 6071 Email: [email protected] For further Discussion Papers by this author see: www.cepr.org/pubs/new-dps/dplist.asp?authorid=145428
Victor Lavy Department of Economics Hebrew University of Jerusalem Mount Scopus Jerusalem 91905 ISRAEL Tel: (972 2) 588 3245 Fax: (972 2) 581 6071 Email: [email protected] For further Discussion Papers by this author see: www.cepr.org/pubs/new-dps/dplist.asp?authorid=157183
Daniele Paserman Department of Economics Hebrew University of Jerusalem Mount Scopus Jerusalem 91905 ISRAEL Tel: (972 2) 588 3365 Fax: (972 2) 581 6071 Email: [email protected] For further Discussion Papers by this author see: www.cepr.org/pubs/new-dps/dplist.asp?authorid=157644
*We would like to thank Joshua Angrist, Simon Burgess, Esther Duflo, Caroline Hoxby, Yona Rubinstein and Dani Tsiddon for helpful suggestions and Shula Mula for insightful conversations on the absorption process of Ethiopians to Israel. We are grateful to participants at the CEPR Conference on ‘Inequality and Education’ (Paris, May 2003), and to seminar participants in Amsterdam, Tel Aviv, the University of Haifa and the NBER Summer Institute 2003 for helpful comments. Vadim Krimsky provided expert research assistance. All errors are our own.
Submitted 11 August 2003
1
I. Introduction How important is the environment faced by a young child � her family, her school, her teachers, her peers � in shaping her future outcomes? This is one of the central questions in the social sciences, yet providing a convincing answer has proved elusive, mainly because it is very difficult (and in most cases ethically unjustifiable) to create the ideal laboratory conditions necessary to analyze the matter. Yet sometimes nature, institutions, and political circumstances provide us with the means to address these crucial issues by way of a natural experiment. The sudden exodus of Ethiopian Jews to Israel in May 1991 during �Operation Solomon� represents such a natural experiment.
In the span of thirty-six hours, fifteen thousand Ethiopian immigrants were airlifted to Israel and were subsequently distributed into various absorption centers throughout the country. All available evidence suggests that the sorting of immigrants across the country occurred in an essentially random manner. This random sorting process created variation in the school placement of Ethiopian children, which was uncorrelated with the choices and family background characteristics of the children and their parents. In other words, some children ended up attending schools in wealthy Jerusalem suburbs, while others were less fortunate and were relegated to low socio-economic status development towns, far from the economic and cultural center of the country.
In this paper, we exploit the random assignment of immigrants to absorption centers to examine how the elementary school environment affected the long-term achievements of Ethiopian students in their high school years. The natural experiment provided by Operation Solomon allows us to avoid the typical difficulties posed by non-random selection of students into schools, which prevent researchers from identifying separately the effects of family background and the educational environment on student achievements.
Using panel data on a sample of Ethiopian children, we are able to track where Ethiopian children went to elementary school and follow them throughout their high school years. We measure the quality of the elementary school environment faced by Ethiopian children using the average scores on standardized mathematics and Hebrew tests a year prior to the wave of Ethiopian immigration. These measures are exogenous to the influx of Ethiopians into the school system, since they are measured just before the sudden and unexpected immigration wave. With this exogenous variation, we test whether the elementary school environment is related to several different outcomes four to seven years later, when the students are supposed to be in high school. The particular outcomes we measure include the quality of the high school attended, dropping out at various stages in high school, advancing to various stages in high school without repeating a grade and passing the all-important matriculation exams, necessary to attend university.
2
The results show that attending an elementary school with high pre-immigration math scores reduces the chances of a student dropping out of high school by 3.5-5.1 percentage points relative to an average dropout rate of 10 percent, and increases the passing rates on high school matriculation exams by 7.1-8.8 percentage points relative to an average of 27 percent. In contrast, we find that attending elementary schools with high verbal scores has no effect on most of the high school outcomes. We conjecture that this is due to Ethiopian immigrants learning Hebrew in separate classes and with inexperienced teachers, so that the quality of a school�s verbal program for regular students was inconsequential to an Ethiopian student�s later scholastic achievement.
Overall, our results point to the importance of the early schooling environment in determining later outcomes. Ideally, we would like to identify which elements of the environment are important for high school success. The quality of instruction in elementary school, the quality of one�s peers, the availability of learning opportunities in one�s community outside the classroom (libraries, museums, extracurricular activities), and the labor market prospects faced by one�s parents may all contribute to high educational achievements. These factors operate by motivating children, by instilling in them a passion for learning, by teaching them good study habits, and by providing a supportive and learning-friendly family environment. We attempt to disentangle these competing explanations by first estimating the simple relationship between our measures of the school environment quality and high school outcomes, and then sequentially adding controls for a variety of other observable characteristics of the school and the school district, and for the socioeconomic status of the Ethiopians� peers. Interestingly, our basic findings are insensitive to the inclusion of control variables for the characteristics of the community where one lives or attends school, or for the socioeconomic status of one�s peers. This evidence is consistent with the interpretation that the driving force behind our results is the quality of the elementary school itself, and not other observable environmental factors.
This paper is related to at least four important strands of empirical research. First, by looking at how the elementary school environment affects outcomes in high school, this paper contributes to the debate over whether investments in the early stages of a child�s development have long-term payoffs. For example, Heckman (2000) argues that early investments in human capital for children have a larger payoff than interventions at a later stage, which aim to close the gap between troubled students and regular students. This argument is based on the idea that the early creation of human capital has a multiplicative effect by making it easier for children to develop more human capital throughout their childhood years. Some evidence for this claim is provided by Krueger and Whitmore (2001), who use data from the Tennessee STAR experiment and find that students who attended small classes in early grades were more likely to take college-entrance exams, and had somewhat higher test scores. Currie (2001) and Garces, Thomas
3
and Currie (2002) examine the effects of Head Start on later outcomes, and find some evidence of higher graduation rates among whites, and lower crime rates for blacks. Our analysis further contributes to this literature by showing that the elementary school environment does have relatively large long-term effects in high school.
The second line of research related to our analysis looks at the role of peer effects in the creation of human capital. This literature examines whether students benefit from being in contact with better students (Arnott and Rowse, 1987; Sacerdote, 2001; Zimmerman, 2003). This question has also guided other researchers, who have looked at whether desegregation policies in the United States (such as bussing) help or hurt the achievements of blacks and whites (for example, see Hoxby, 2000a; Angrist and Lang, 2002; Hanushek, Kain, and Rivkin, 2002). In related work, Katz, Kling, and Liebman (2001) and Oreopoulos (2003) have studied the effect of neighborhood quality on a broad range of individual outcomes. Their studies use random variation in the neighborhood placement of households to analyze the short-run and long-run effects on labor market outcomes, health, criminal activity, and behavioral problems. Our analysis uses a similar estimation strategy, since we exploit the random placement of Ethiopian families across Israel for our identification strategy, but our focus is on the long-term effects of the early schooling environment on achievements in high school.
The third line of research related to ours concerns the broad issue of determining the effect of school resources on student success (see Burtless, 1996, for a wide range of views on the subject). Economists have investigated the effects of class size on student achievement, using data from both randomized (Krueger, 1999; Krueger and Whitmore, 2001), and natural experiments (Angrist and Lavy, 1999; Hoxby, 2000b); the effects of class size and teacher quality on the economic returns to schooling (Card and Krueger, 1992; Betts, 1995); the effects of teacher training and computers on pupil learning (Angrist and Lavy, 2001 and 2002); and the effect of teacher incentives on student achievement (Lavy, 2002a and 2002b). This paper contributes to this literature by focusing on school performance, rather than measured inputs, as an indicator of the schooling environment, by using a different identification strategy, and by focusing on the long-term effects of the quality of the elementary school environment on outcomes in high school.
Finally, our paper also contributes to the large literature on the assimilation of immigrants in a host country (Borjas, 1995; Lalonde and Topel, 1997). The immigration wave of Ethiopian Jews to Israel (as opposed to the mass migration from the former Soviet Union) is similar in many aspects to migration waves from less developed countries to North America, Western Europe, and Australia. Our research can shed light on how the assimilation process and geographic dispersion of immigrants in the host country affects their educational and economic
4
outcomes. In this respect, our work is similar to Edin, Fredriksson and Åslund (2003), who exploit a Swedish government initiative that distributed refugee immigrants across locations in order to investigate whether living in ethnic enclaves improves labor market outcomes.
The structure of the paper is as follows. The next section presents the historical background that preceded the exodus of Ethiopian Jews to Israel in May 1991, and describes in detail the �epic� story behind Operation Solomon. It also provides anecdotal evidence on how the new immigrants were sorted into housing and schools in a random fashion. Section III describes the data and the empirical strategy. Section IV tests for whether the data accord with the random placement of Ethiopian children into schools, as described in Section II. Section V presents the empirical estimates of the effect of the elementary school environment on a variety of high school outcomes, Section VI tests the robustness of the results to the inclusions of other measures of the schooling environment, and Section VII discusses the magnitude of the effects. Section VIII concludes the paper. II. Operation Solomon: The Case for a Natural Experiment 1. Historical Background 1
Ethiopian Jews, who sometimes refer to themselves as Beta Israel,2 claim to be the descendants of Menelik I, king of Ethiopia, son of the biblical King Solomon and the Queen of Sheba. While there is much debate as to the historical veracity of these claims, there is little controversy as to the fact that a community that identified itself as Jewish has lived in the region of Northern Ethiopia around Lake Tana for several centuries. Throughout most of their history, Ethiopian Jews had no contact with or knowledge of the rest of the Jewish world. Only around the 19th century did the existence of a community of black Jews in the heart of Africa arouse the interest of Christian missionaries and of European Jews, concerned with the survival of the Beta Israel. In 1867, Joseph Halevy was the first practicing European Jew to visit Ethiopia: his student Jacques Faitlovitch, who first visited Ethiopia in 1904, dedicated his life to the reintegration of the Beta Israel to the mainstream of Jewish life.
No attempt was made to bring the Ethiopians to Israel when the State was created in 1948. The first Israeli governments, together with North American Jewish groups, did provide some assistance for educational and health-care programs throughout the 1960s, but it was only starting in the late 1970s that the Likud-led government of Menachem Begin began to pursue a more positive attitude towards Ethiopian immigration. An important role in this change was the 1973 ruling of Israel�s Sephardic chief rabbi, Ovadia Yosef, that the Beta Israel were in fact
1 This section is based on Kaplan (1992) and Wagaw (1993). 2 Literally, the House of Israel.
5
descendants of one of Israel�s lost tribes, and were therefore entitled to migrate to Israel as full citizens under the Law of Return. This ruling was backed two years later by Israel�s Ashkenazi chief rabbi, and transformed into law on April 25, 1975. Thus, Israel had become a viable home for those Ethiopian Jews who were willing to migrate. At roughly the same time, two other factors contributed to increase the push for migration: 1) the drought and consequent famine in Ethiopia, which became increasingly acute after 1973, and 2) the deposition of emperor Haile Selassie in 1974 and the installation of a Marxist-Leninist military junta led by Colonel Mengistu Haile Mariam, which led to a period of civil strife in Ethiopia. As a result, between 1977 and 1984, 7000 Ethiopian Jews migrated to Israel, and 6500 arrived via Sudanese refugee camps between November 1984 and January 1995 (�Operation Moses�). News of this operation leaked to the press, embarrassing the Ethiopian and Sudanese governments, and the venture was brought to an abrupt halt, leaving many Ethiopians stranded in Sudan, and the bulk of the Beta Israel (approximately 20,000-30,000 people) still in Ethiopia.
After 1985, a trickle of immigrants continued to arrive to Israel, mostly on a family reunification basis. After the resumption of diplomatic relations between Israel and Ethiopia in 1989, Ethiopian Jews began to emigrate to Israel in greater numbers: around 5000 Ethiopians arrived in 1990, while some twenty thousand had moved from the Gondar region to Addis Ababa, where they were placed in a temporary camp in the Israeli Embassy compound. At this time, Israel was planning to complete the exodus of the Beta Israel within two years in an orderly manner: the relatively small number of monthly departures would enable Israel to portray the operation as a limited family reunification plan, avoiding the suspicions of the Ethiopian population and the international community. However, military events in Ethiopia were overtaking political plans. In March 1991, it became common knowledge that the anti-Mengistu rebels were making steady gains in their struggle against government forces, and foreign residents in Addis Ababa were told by their embassies to leave the country. On May 21, 1991, Mengistu resigned the presidency and fled the country for Zimbabwe. On Friday May 24, minutes before the rebels took over Addis Ababa, the emergency rescue of Ethiopian Jews was underway.
During thirty-six hours between May 24 and May 25, 1991, over fourteen thousand Ethiopian Jews were airlifted to Israel in �Operation Solomon.� Thirty-three aircrafts were used in the course of the operation. One of the Boeing 747 aircraft set a world capacity record when 1,180 passengers somehow found space on a plane built for 400. The Boeing 707s carried up to 500 passengers. In all, 40 round-trips were flown from Tel Aviv to Addis Ababa. During one 30-minutes period late Friday night, no less than 2,900 immigrants arrived in Tel Aviv. (Jerusalem Post, May 31, 1991).
6
The day and a half journey that started in the streets of Addis Ababa and ended in temporary housing locations in Israel determined the schools the immigrants� children would attend just a month later. We will claim below that the course of events in this brief journey led to a random assignment of pupils to schools in Israel.
2. Randomness in the Airlift from Addis Ababa to Tel Aviv The call for Jews to assemble at the Israeli Embassy compound was issued at dawn, May 24. The initial trickle quickly became a flood, as Jews streamed in from the four neighborhoods in which they had been living in rented quarters. �After passing through the checkpoints, the immigrants were led aboard buses which transported them some 15 kilometers to the military wing of Addis Ababa�s airport. The immigrants were not allowed to carry with them any belongings and they left behind all their bags and luggage, both for security reasons and because every inch of space on the planes was needed,� (Jerusalem Post, May 22, 1992). This and other casual evidence suggest that the scene at the embassy compound was one of chaos, where thousands of people were trying to make their way to the buses without order, without a pre-prepared list of evacuees and without any rules of boarding priority.3 Zimna Berhane, an Ethiopian-born Jewish Agency official who was the main organizer of the Ethiopian Jews living in the Embassy compound, said that �all of Addis was there, and that the scene was reminiscent of Saigon in the days before its fall to the communists. (Jerusalem Post, May 26, 1991).4
This description of events at the embassy suggests that the boarding of buses at the embassy did not take place according to any particular order. This fact is very important for our study because the random order of boarding the buses determined also the order in which immigrants boarded planes, the timing of landing in Tel Aviv, the order in which they were bused out of the airport in Tel Aviv and the specific absorption center they were sent to. However, even though the initial randomness was triggered in the embassy compound in Addis Ababa, additional chaos and random grouping of the immigrants were added along the way.
The embassy staff was under orders to keep up a sufficient flow of evacuees to the airport so that there would always be a reserve at the airport to fill planes as quickly as they landed (Jerusalem Post, May 26, 1991). Yet, the boarding process at the airport was initially difficult as evident from the following quote from an Israeli soldier whose job was to escort the busloads to the planes in Addis: �At first the soldiers asked their charges to come forward in small, 3 Micha Feldman, a Jewish Agency official who helped oversee Operation Solomon recall: �There was no order, and as word of the operation spread, thousands of Ethiopians Jews and their neighbors, swarmed to the embassy compound. We weren�t able to move. We couldn�t register anyone as hundreds of non-Jews came to watch the show. We couldn�t get people into the embassy and on the buses because thousands of people were in the way. I gave the order to my people to use force to clear the path.� (The Jerusalem Post, 22 September 1991).
7
manageable groups as they prepared to approach the planes. It didn�t work. When we asked a few to stand up, they all stood up, hundreds. Then we�d ask them to sit down again, and without a word, boom, down they sat. Finally someone had the idea to take a rope, just a simple rope, and cordon off about 40 people. Then we�d ask only these to come with us, toward the plane. Worked like magic�. (Jerusalem Post, May 31, 1991). 3. The Placement in Absorption Centers
With the landing of each plane in Tel Aviv, several buses pulled out from a parking lot inside the airfield where 250 other buses were waiting, picked up the newcomers, and took them to absorption centers. The Jewish Agency had opened 40 �emergency absorption centers� in hotels and caravans to supplement its existing 50 absorption centers and make room for the immigrants (Jerusalem Post, May 26, 1991). The newcomers were taken to absorption centers as far away as Eilat in the south or Kiriat Shmona in the north.5 Many of those placed in hotels were moved within a few months in groups to caravan parks that were set up, in most cases nearby, as a solution to the overcrowding in the hotels that served as the Ethiopian immigrants� first homes in Israel.6
The immigrants were placed into absorption centers in order of their arrival and there is plenty of evidence to suggest that they could not affect the place they were sent to. Even those who had close relatives (children, parents) in Israel did not get to be placed near them.7 Nor could the relatives already in Israel influence the placement outcome of their immigrant relatives.8
4 There is also evidence that many non-Jewish Ethiopians asked or tried to board the buses and planes. 5 The majority of the immigrants, over 7,000, were sent to centers in the north, 3,000 to Jerusalem and the southern region, and around 1,000 to the Tel Aviv area. Tiberias was the city that absorbed the largest number of Ethiopian immigrants, some 2,200, followed by Jerusalem with 1,800, Ashkelon with 1,200, and Nahariya with 1,000. (The Jerusalem Post, Friday, May 31, 1991). 6 �Because of the pressing need to move large numbers of people out of hotels quickly, the caravan sites were established all over the country, whether or not employment opportunities existed in those areas� (A quote from an article by Sue-Fishkoff who interviewed Ya�acov Babu, spokesman for the Unite Organization of Jews from Ethiopia. The Jerusalem Post, May 22, 1991). An example is the story of some 1,400 immigrants that were placed at the Diplomat Hotel in Jerusalem, the highest number in any one hotel in the country. By December 1991 all of them were placed in mobile homes sites all over the country. (The Jerusalem Post, December 20, 1991). 7 A typical story is that of Fantu Atrash, 55, who arrived during Operation Solomon from a village in the Gondar region. Atrash had many relatives in Netanya, Tiberias and Ashkelon, all from the same region in Gondar, but she was placed in Safed in the north of Israel even though she would have liked to be near her relatives. (The Jerusalem Post, August 23, 1992). Another story is that of Dessta Tadla, a single mother to five children, who was also placed in Safed although she would have preferred to live near her uncle in Rishon Lezion (The Jerusalem Post, August 23, 1992). 8 This is evident from the following quotes: �The Jewish Agency has asked veteran immigrants to not go to the absorption centers looking for relatives until at least Tuesday, so workers will be able to concentrate on finishing the initial absorption of the 14,400 Jews airlifted here in Operation Solomon. Within the next few days, the Agency would come up with a computerized list of newcomers�In the meantime, the names and whereabouts of some new arrivals have already begun to be announced on Israel radio�s Amharic service each evening�� (The Jerusalem Post, May 27, 1991). Even Jewish Agency staffer Ginette Afgas, 29, who had been hoping that her brother, whom she had
8
The immigrants of Operation Solomon remained in mobile home camps much longer than the government initially planned. The Shamir government�s initial target date of July 1993 to complete the move to permanent housing was abandoned, as the new Rabin government in 1992 abrogated all commitments that had been previously made to the Ethiopians (Kaplan and Rosen 1994, page 83). In early 1993, the government announced that it would take three to four years before all of the caravan sites could be evacuated.9 The length of stay in the initial housing has direct bearing on the main issue analyzed in this paper, the effect of elementary school quality on later schooling outcomes, because it implies that pupils who enrolled in September 1991 remained in the same school for an average period of at least 3-4 years.
4. The placement in schools The Ministry of Education and the absorption authorities decided to place elementary school pupils in neighborhood schools, or in the nearest religious schools. This policy was stated publicly by the Ministry director general just before the 1991-1992 school year started: �All pupils aged six to 17 will be moved into regular schools on September 1. Elementary school pupils will be studying in schools in their neighborhoods, while pupils aged 12-17 will study in dormitory facilities. Most students, as expected, will be studying in state religious schools, though some will have their classes located in state secular schools, due to a lack of space in the religious institutions. But despite their location in secular schools, their studies will be conducted under the auspices of the state-religious system. This is a policy agreed upon by the government, the Jewish agency, and the religious leadership of the Ethiopian community� (Jerusalem Post, August 30, 1991).10 Another piece of evidence revealing the policy to place immigrant students in the nearest religious elementary school is found in a quote from Ora Donio, deputy general manager of the Jewish Agency�s immigration department: �While there are no schools in any of the caravan parks, immigrant children walk or are bused to nearby schools outside the sites.� (Jerusalem Post, May 22, 1992). In most schools the Ethiopian pupils were integrated in regular
not seen for 18 years, would be among the group coming to Hotel Carmeliya, Haifa, found that he had apparently been directed elsewhere, and she had to postpone her eagerly awaited reunion. 9 There is casual evidence suggesting that the stay of Ethiopian immigrants in caravan sites was prolonged by their hesitation to move to permanent housing by buying apartments or houses. Explaining why immigrants seemed hesitant to buy their own homes, a government official said �many Ethiopians have the attitude that the government brought us here, the government will provide us with housing. We won�t be thrown out onto the street, so why complicate things with mortgage payments� (The Jerusalem Post, February 21, 1992). 10 The decision to place Ethiopian pupils in state religious schools, based on the assumption that it would ease the transition for immigrants from a traditional religious background, was applied not only in elementary schools but in secondary level boarding schools as well. Although parents were permitted to transfer a child to any school after the first year, in practice this seldom occurred (Kaplan and Rosen, 1994).
9
classes though there were cases of segregated classes for Ethiopians.11 To sum up, there is an abundance of anecdotal evidence suggesting that the initial placement of Ethiopians in absorption centers and schools was as good as random. In the next sections, we will describe the data, and provide empirical support for what was described above as a random process did indeed lead to an orthogonal relationship between students� background characteristics and the quality of the schools they were assigned to. III. Data and Empirical Framework The primary question posed in this paper is whether Ethiopian immigrant children who were placed in a better primary school achieved better high school outcomes. In general, answering such a question is non-trivial due to the non-random assignment of children to schools, either because of the choice of schools exercised by children and their parents or because of endogenous matching of pupils to schools done by education authorities. These behavioral decisions lead very often to the sorting of pupils to schools by ability and by socio-economic background. As a result, the observed strong correlation between measured school quality and the scholastic achievements of pupils does not necessarily represent a causal connection. In addition, answering this question suffers from Manski�s �reflection problem� (Manski, 1993), whereby the researcher tries to to infer whether the average behaviour in some group influences the behaviour of the individuals that comprise the group. The challenge of neutralizing the causal effect from student quality to school quality in order to identify the causal effect in the opposite direction is very difficult.12
In this study, we explore a unique opportunity to overcome these estimation problems, by implementing an empirical strategy that exploits random variation in the primary school placement of Ethiopian children during their first few years after immigration. This unique historical episode allows us to solve the usual problem confronted when using observational data for evaluation, namely that of an unobserved counterfactual. Ideally, to estimate the effect of the school environment on student outcomes, we would like to observe both the outcome of the student if she had attended the good school, and the counterfactual, her outcome if she had attended the inferior school. Clearly, however, a student is observed only in one type of school,
11 The following quote provides evidence on this policy: �In most cases, new immigrants are scattered through the school system, usually without large enough concentration in individual schools to warrant separate classes. In this situation, the new immigrants are placed in classrooms with veteran Israeli children and have a few hours of separate lessons to help them learn Hebrew. When they are concentrated in large numbers, we can have separate classes for them until they learn enough Hebrew and are ready to be integrated� Tova Azoulay, Ministry of Education and Culture deputy spokesperson, (The Jerusalem Post, June 1, 1991). 12 The reflection problem is particularly acute if the regressor of interest is measured contemporaneously with the outcome variable. In our particular data set the reflection problem might not be as relevant, since we use predetermined test scores as our measure of school quality.
10
and not both of them simultaneously. If, however, we could randomly assign students to good or inferior schools, the unobserved counterfactual problem would be resolved, since the distribution of potential outcomes conditional on actual assignment to the good school would be identical to the distribution of potential outcomes in the population.13
In the absence of actual physical randomization, the next best strategy is to take advantage of quasi-randomizations (�natural experiments�) generated by special institutional or political circumstances. The May 1991 Ethiopian immigration wave produced exactly such a natural experiment that allows us to exploit variation in school placement that is exogenous to the characteristics and choices of students, parents, and policy makers. Consequently, we are able to use this random school placement of Ethiopian students to identify the counterfactual effect of changing the student�s school environment. 1. Empirical Framework
Formally, consider a simplified model in which schools can be classified as either �high� or �low� quality. Define yi1 and yi0 as the potential outcomes of individual i if she attends the high quality or low quality school respectively; let di be the treatment indicator (di is equal to 1 if individual i attends a high quality school and zero otherwise); and let yi be the observed outcome for individual i, yi = diyi1 + (1-di)yi0. We are interested in estimating the causal effect of attending a high quality school. The average treatment effect is
( ) ( )01 ii yEyE −=α .
If students were truly assigned randomly to schools, y1 and y0 would be independent of the treatment indicator, so that
( ) ( )( ) ( ),.1|11| 101 yEdyddyEdyE ==−+==
and
( ) ( )( ) ( ).0|10| 001 yEdyddyEdyE ==−+==
Hence, the average treatment effect can be calculated as the simple difference in mean outcomes between students in high quality and low quality schools. We maintain the weaker assumption of conditional random assignment: the potential outcomes are independent of the treatment indicator, conditional on a set of covariates x. This assumption allows for the possibility that the allocation of families to absorption centers was in some way affected by background characteristics (parents� education, family size), but that for immigrants with identical backgrounds the allocation was as good as random.
13 The counterfactual framework was pioneered by Rubin (1974) and since adopted by many in both statistics and econometrics, including Rosenbaum and Rubin (1983), Heckman (1992), Imbens and Angrist (1994), Angrist,

11
Conditional independence implies conditional mean independence:
( ) ( ) ( ) ( )xxxx |,| and;|,| 1100 yEdyEyEdyE == .
This in turn yields
( ) ( ) [ ] [ ]{ }( ) [ ] [ ]{ } .|||
,|,|,|,|
010
010
xxxxxxx
yEyEdyEdyEdyEddyEdyE
−+=−+=
Therefore, the average treatment effect for a given value of the vector x can be estimated by the simple difference in means between the treated and the control groups with covariates equal to x. To calculate the average treatment effect, we need to average over all possible values of x. This can in theory be done non-parametrically with a multitude of data, but given that in our case x is high-dimensional, we will follow a different approach.
We first decompose the potential outcomes into their means and a stochastic component:
000
111
ii
ii
vyvy
+=+=
µµ
,
with E(vij) = 0, for j=1,2. We further assume that the conditional mean of the stochastic components is identical for the treated and the control group, and can be expressed as a function of the covariates, linear in its parameters.
( ) ( ) ( ) .'|| 0001 βη iiiii xhxvExvE +==
Then, some simple algebraic manipulations yield that the conditional expectation of the observed outcome yi, conditional on the control variables and the treatment indicator di is
( ) ( ) ( ) .',| 000 βαηµ iiiii xhddxyE +++=
This basic result extends to continuous treatment variables (such as the measure of school quality we use in our regressions) if we make the assumption of a constant additive treatment effect. Therefore, a simple least squares regression of the observed outcome on the treatment indicator and the control function will yield a consistent estimate of the average treatment effect. In practice, we use a statistical regression model:
( ) ( )( )( ) , School ofQuality odNeighborho
BackgroundFamily
Quality School ElementaryOutcome SchoolHigh
2
1
0
ijj
i
jij
uj +++
+=
λλ
αλ
Imbens and Rubin (1996), Manski (1996), Heckman, Ichimura and Todd (1997).
12
where we have included family background variables and neighborhood characteristics as our control variables. In addition, since most of our dependent variables are binary, we will use the probit model for estimation. 2. Data
Implementing the empirical strategy outlined above requires rich information of a panel nature: the primary school a pupil attends at a young age, the characteristics of that school and its surrounding community, measures of the pupil�s progression through middle and high school, the scholastic achievements in the matriculation exams toward the end of high school, as well as measures of family background. We are able to construct such a panel using administrative data from the Israeli Ministry of Education and results from a national testing wave carried out in 1991.
The first year of data is for the 1993-1994 school year, which is two years after the large wave of Ethiopian immigration. The sample includes all Ethiopian children from the May 1991 immigration wave who were in fifth grade in the 1993-1994 school year (532 students), as well as all other fifth-grade students in the country, for a total of about 70,000 observations. We are able to follow each student in the studied cohort from fifth grade throughout the advanced stages of high school, until the 2000-2001 school year, when this cohort was scheduled to finish twelfth grade if they had progressed through the system without repetition. The administrative data contains information on the country of birth and date of immigration (month and year) of the children and their parents: this enables us to precisely identify pupils of Ethiopian origin who arrived in May 1991. The data also includes an identifier of the school each child attended in fifth grade, parental schooling and family size, time series information on students� progression through various grades until an event of dropping out or high school completion, as well as information about whether the pupil obtained a matriculation diploma at the end of high school. In addition, we were able to collect matriculation exams data for the 2001-2002 school year for the subsample of Ethiopian students who were enrolled in 11th grade in 2000-2001, i.e., students who had repeated one grade, and were lagging behind their cohort in the schooling cycle.14 This allows us to have an almost complete picture of matriculation rates for Ethiopian students. This is particularly important, since in Israel the high school matriculation exam � known as the �Bagrut� � is a pre-requisite for admission to universities and is one of the most economically important education milestones. Similar high school matriculation exams are found in many countries and in some American states. Examples include the French Baccalaureate, the German
14 At the time of the writing of this draft, the Ministry of Education had not yet released the full data on matriculation exams in 2001-2002.
13
Certificate of Maturity (Reifezeugnis), the Italian Diploma di Maturità, the New York State Regents examinations, and the recently instituted Massachusetts Comprehensive Assessment System.
3. Measuring School Quality
To measure school quality we use data on the average grades for the 4th and 5th grade students in each elementary school on the math and verbal tests carried out nationally in the 1990-1991 school year.15 We use the term �school quality� to represent many relevant features of the schooling environment: the quality of instruction, the quality of one�s peers, the available facilities in and outside the school, the labor market opportunities faced by one�s parents, et cetera. In the following sections, we will try to distinguish between the various components of the schooling environment.
Our measure of school quality has at least two distinct advantages. First, by using test scores from 1990-1991, which is one year before the unexpected mass wave of Ethiopian immigrants, our measure of school quality is completely exogenous to the absorption process of Ethiopian children into schools, as required by our empirical strategy. Second, we are able to use student outputs as a direct measure of quality, rather than imperfectly measured and debatable school inputs.
The average scores of 4th and 5th graders within each elementary school are likely to be good indicators of the quality of the school environment. However, the average performance of each cohort alone may also be affected by idiosyncratic shocks, such as compositional changes of students� background or innate ability. Therefore, aggregating the 4th and 5th grades scores together within the school may reflect more accurately the systematic part of school quality. Since the test in each subject and across grades is not comparable, simply averaging them is not appropriate. Therefore, we adopt alternative approaches for aggregating the scores across cohorts, which are discussed in the next section. 4. Summary Statistics
In Figure 1, we show the distribution of Ethiopian children in Israeli elementary schools by immigration date.16 The figure illustrates the dramatic nature of the May 1991 immigration wave. The number of immigrant children who arrived in May 1991 (1,793 pupils in 1st, 2nd and 5th grades) is more than ten times larger than the number of immigrants who arrived in any other
15 This is the same data used in Angrist and Lavy (1999). 16 The data refers to grades 1, 2 and 5, the only grades for which we have data on the universe of pupils enrolled in the school system.
14
month, and altogether May 1991 immigrants account for about 40 percent of all Ethiopians in the Israeli school system.
Table 1 presents summary statistics of the data for our primary sample of Ethiopian students who immigrated in May 1991, and also for three other sub-samples of interest: Ethiopians who immigrated in the 1980s, immigrants from the Soviet Union, and the rest of the Israeli Jewish population. Table 1 also presents the elementary school quality measures discussed above (average scores for the 4th and 5th grade students on the 1991 standardized math and verbal tests), a 1991 socio-economic index of students in each elementary school (before the Ethiopian immigrants from Operation Solomon were enrolled in Israeli schools), the religious status of each school,17 and the percentage of Ethiopians in the class and grade.
Table 1 reveals that Ethiopian immigrants from the 1991 wave typically went to under-achieving schools with students of a lower socio-economic background. This result is not surprising since they were not placed in particularly high-income areas where the best schools are likely to be. However, this result does not violate the crucial exogeneity assumption necessary for identifying the treatment effect, represented by the elementary school environment. The random assignment assumption does not require that Ethiopians were placed in a random sample of Israeli schools, but requires only that the distribution of Ethiopians across schools was independent of the Ethiopians� own choices, abilities, background, etc. Figures 2 and 3 show that Ethiopians were placed in a sample of schools that closely represents the distribution of schools for all the other students. These figures show that, although Ethiopians were placed in lower achieving schools on average, the distribution of schools had a very broad and representative range of quality.
Comparing column 1 to columns 2-4 in Table 1 reveals that the May 1991 Ethiopian immigrants went to better schools than the children of Ethiopian families from earlier immigration dates, but not as good as the schools attended by former Soviet Union immigrants. This reflects the fact that veteran Ethiopians over the years tended to settle in low housing cost communities which also have lower quality schools, while many of the former Soviet Union immigrants chose to live in large and central metropolitan areas.
Ninety two percent of the Ethiopian fifth graders who immigrated in May 1991 studied in religious schools, higher than the respective proportion among immigrants who arrived in the 1980s (upper panel in Table 1). This reflects the official government policy discussed in the previous section. Also important to note is the high average proportion of Ethiopians placed within the same class (32%) or grade (27%) for the May 1991 immigrants.
17 The Israeli public school system includes religious (25%) and secular (75%) state schools.
15
The measures of student�s family background presented in the second panel of Table 1 include the education levels of both parents, number of siblings, and age while attending fifth grade.18 Table 1 reveals stark differences in levels of parental education between the Ethiopians and the rest of the population. Parents of Ethiopian children typically had 1 or 2 years of education, compared to an average of over 11.5 for parents of Israeli Jewish children in fifth grade. Table A1 in the Appendix reveals that these numbers are not unusual for the Ethiopian population � average schooling in Ethiopia for 1990 was one year. Consequently, our sample reflects the expected differences in parental background between Ethiopian children and their peers. Parental schooling of Ethiopians who immigrated during the 1980s is higher than that of the May 1991 Ethiopians, albeit still substantially lower than that of natives and Russian immigrants.
The bottom panel of Table 1 presents the means for the various measures of high school outcomes: whether or not the student ever attends various grades, whether the student reached a given grade without repeating, whether the student drops out of school before completing 12th grade, whether the student passed the matriculation exams, and the quality of the high school attended (measured by the average matriculation rate for students between 1996 and 1998). Not unsurprisingly, the high school educational outcomes of Ethiopian students are significantly lower than those of their peers for most outcomes. For example, only 23 percent of the Ethiopians passed their matriculation exams by the end of the 2000-2001 school year compared to 58 percent for Israeli Jews and 50 percent for Russian immigrants.
However, there is ample evidence that the main difference between new Ethiopian students and their peers is that Ethiopian children are much more likely to repeat a grade.19 For example, only 67 percent of the Ethiopian sample made it to 10th grade without repeating a grade compared to 94 percent for Israeli Jews, while 92 percent of the Ethiopians did eventually make it to 10th grade compared to 96 percent for Israeli Jews. Similar results are found for twelfth grade: only 10 percent of Ethiopians drop-out before completing 12th grade compared to 9 percent for Israeli Jews; only 65 percent of the Ethiopians reach 12th grade without repeating a grade, compared to 89 percent for Israeli Jews.
Because of the large incidence of grade repetition for Ethiopians, it is important to keep in mind that some of our measures concerning achievement in twelfth grade, such as passing
18 This is calculated from the reported year of birth in the Ministry of Education data. This variable may be problematic since many Ethiopians did not know their exact date of birth, as the Ethiopian calendar differs from that used in the West both with regards to the months and years. 19 The relatively low high school achievements of the Russian immigrants, such as only 86 percent ever attending 10th grade, are likely to reflect migration of Russians out of Israel to other countries rather than the true drop out rate. This is not likely to be a problem for Ethiopian immigrants, but comparing outcomes with Russian immigrants may be problematic for this reason.
16
matriculation exams, ever attending 12th grade, or dropping out before completing 12th grade are heavily influenced by the delays of Ethiopian students in actually making it to 12th grade. 20 The reason is that our data includes information on all pupils only up to the end of the 2000-2001 school year, the year in which the 5th grade cohort of 1993-1994 is supposed to graduate from 12th grade if it does not repeat a grade. That is, perhaps the percentage of Ethiopian students finishing 12th grade and passing the matriculation exams will not be so much worse than their peers once we allow for them to actually make it there with a one or two year lag. Conversely, the estimate of the dropout probability for Ethiopians may be biased downwards, since a student who attends 10th or 11th grade in 2001 and drops out subsequently would be incorrectly classified as still in school according to our data.21
IV. Empirically Testing for Random Assignment In Section II we described in detail the process that brought thousands of Ethiopian Jews to Israel in the space of 36 hours in the course of Operation Solomon, and argued that all available evidence indicates that the assignment of immigrants to absorption centers across the country, and consequently the assignment of children to schools, was performed in a totally chaotic and random fashion. In this section, we test whether the anecdotal evidence finds confirmation in the data.
Specifically, we test whether there is a significant relationship between the observable characteristics of Ethiopian children and the type of school they attended. This can be done by estimating regressions of the various measures of the student�s elementary school environment on various measures of their family background. If the assignment was indeed random, we expect to find no such significant relationship. This is not necessarily a proof of random assignment, as the assumption requires there to be no correlation between school quality and both observable and unobservable background characteristics. However, the lack of a significant relationship between school quality and observables suggests that it is unlikely that such a relationship exists between school quality and unobservables. The results of these tests are presented in Table 2.
Each coefficient in Table 2 represents the estimate from a single regression for each of the various measures of the elementary school environment on one of the measures of family background. For example, the first column represents the results of eight separate regressions for the eight measures of the elementary school environment, when the explanatory variable in each 20 Repeating a grade for Ethiopians is not necessarily as bad a signal about achievements as it is for non-Ethiopians. In fact, repeating a grade after immigration may eventually be more beneficial to an Ethiopian child than being passed along after a marginal performance stemming from problems of adapting to a new language and environment.
17
regression is father�s years of schooling. In addition to the school characteristics presented in Table 1 (average math scores, average verbal scores, and the school mean socioeconomic index), we also use other characteristics of the school environment, including income per capita, the matriculation rate, rate of population on welfare, rate of the labor force receiving unemployment benefits and the dependency ratio22 in the town or regional council the school is located in.
The first column of Table 2 reveals that father�s schooling is not significantly correlated with any measure of the school quality or community environment measures. The robust t statistics (adjusted for clustering) reported in parentheses are mostly below 1, indicating essentially no relationship between indicators of school quality and father�s education. The second column of Table 2 indicates that mother�s schooling is also not correlated with school quality and community measures, although it does seem to be correlated with the socioeconomic index of the students and the percent of unemployment recipients in the community. As for the other three personal characteristics (sex, number of siblings and age), they are largely uncorrelated with any of the school quality or community environment measures.
Overall, the results in Table 2 do not suggest any systematic pattern in the school placement of Ethiopian children according to their family background. With only a few exceptions, the t-statistics for the all the coefficients in Table 2 are well below 1; only four out of the forty t-statistics presented in the table are above the level of marginal significance.
These results confirm our claims about the random nature of the placement of immigrants in temporary housing, as described in the previous sections. It is worth emphasizing that the regressions find no correlation between background characteristics and the quality of schools attended by Ethiopians in the 1993-1994 school year, two full years after Operation Solomon. Contributing factors that helped keep the initial assignment unchanged for a few years is the limited education of the Ethiopian immigrants in combination with their limited understanding of Hebrew and the Israeli bureaucracy. As noted in footnote 9, another factor that limited very much the move of Ethiopian families from their initial temporary housing was their hesitation to take a mortgage to finance the purchase of apartments or houses. Given these obstacles, it is easy to understand why Ethiopian parents had very little involvement in the choice of their child�s school in the first few years after their immigration. Naturally, we expect that Ethiopian parents would have gradually learned some Hebrew and learned more about the Israeli education system, so that the placement of children into schools would be less random over time. Table 3 examines this
21 We only have data for 2001-2002 for the sample of May 1991 Ethiopians: in the regression analysis we will use the complete data for this sample, while in Table 1 we restrict the analysis to the data available for the 2000-2001 school year for the sake of comparability with other sectors of the population. 22 The dependency ratio is defined as the ratio of the population of children (under 15) and elderly (over 65) to the working age population.
18
issue directly by studying whether parental schooling levels are associated with school quality for other samples in the population.23
The first column in Table 3 replicates, for ease of comparison, the results from Table 2 for the May 1991 Ethiopian immigrants. The second and third columns show, respectively, the results for the prior wave of Ethiopian immigrants from the 1980�s and for the Russian immigrants, who immigrated roughly at the same time as the 1991 Ethiopians. In these two samples, parental education levels are highly correlated with elementary school quality. In addition, the bottom panel of Table 3 shows that, for all three groups, parental background is strongly correlated with school quality as the cohort reaches their high school years. This finding confirms our expectation that educated parents of Ethiopian children learn over time how to place their children into better schools, just like other sectors of the population.
The comparison between the first three columns in Table 3 demonstrates just how unusual the sample of 1991 Ethiopian immigrants appears to be as of 1993: they are the only sub-sample that is not strongly sorted into better elementary schools according to parental background, despite displaying very strong sorting later on in their high school years. These findings clearly demonstrate that the apparent �random sorting� into elementary schools is not due to the low mean and variation in education levels of Ethiopian parents, since the same sample of Ethiopians displays strong sorting later on in high school. In addition, this possibility is further refuted by the strong sorting into elementary schools by the prior wave of Ethiopian immigrants (second column), who also had extremely low levels of education. Furthermore, the evidence in favor of random sorting into elementary schools is not due to the fact that the Ethiopians had been in Israel for only a short period, since we do find strong positive sorting for the sample of former Soviet Union immigrants, who arrived at roughly the same time. Nor can the differences across groups in elementary school be explained by the smaller standard errors for the non-Ethiopian sub-groups as a result of much larger sample sizes � since this cannot explain the large differences in the sizes of the coefficients in elementary school (as well as the occasional unexpected negative sign for 1991 Ethiopians).
The last column in Table 3 shows that average math and verbal scores of primary schools are highly and positively related to the education levels of both parents of native Israeli Jewish children. This result is to be expected since native families have already self-selected themselves into schools according to their family income, educational background, ethnic group, etc. These results point to why it is so difficult to estimate the effect of the schooling environment on the performance of students: it is impossible to know whether this very strong correlation is due to a
23 Table 3 presents the same tests for balancing for the other sub-populations in Israel only for parental education. For the full listing of all the school and local characteristics as in Table 2, see the Tables in Appendix B1-B3.
19
causal effect, or whether it stems from selective sorting, or whether it exhibits the �reflection� problem described in Manski (1993).
Overall, the results in Table 2 and 3 illustrate that 1991 Ethiopian immigrant children were sorted across schools in an essentially random manner. In addition, Figures 2 and 3 show that Ethiopians were sorted into schools that reflect the whole population of Israeli schools. Therefore, we not only have exogenous variation to exploit, but a considerable level of variation as well. V. The Effect of the Elementary School Environment on High School Outcomes Given that it seems justified to assume that the Ethiopians from the 1991 immigration wave were randomly sorted across schools, the aim of this section is to examine if the random variation in the schooling environment can explain variation in our measures of individual-level high school outcomes described in Section III. 1. Assuming a linear effect of test scores
Using the sample of Ethiopian immigrants from the 1991 wave who were in fifth grade in the 1993-1994 school year, Table 4 presents the basic results for how measures of the quality of the school environment affected high school outcomes. The first two columns use the average math scores for 4th and 5th graders, a year prior to the Ethiopian immigration wave of 1991. Since these tests were not comparable, we aggregated them in two ways. First, we simply standardized them by their mean and standard deviation and computed the simple mean of the standardized variable across the two grades for each elementary school. Second, we take the average percentile rank across grades within each school, since the percentile rank should be a comparable measure of school performance across grades. The last two columns do the same for the verbal scores of 4th and 5th graders in each elementary school. Each row and column in Table 4 represents a different probit regression. For example, the coefficient (0.015) in the first row and column represents the marginal effect from a probit on whether the student ever attended 10th grade on the elementary school�s average standardized math score. All of the probit regressions control for father�s years of schooling, mother�s years of schooling, a gender dummy, age while attending fifth grade, number of siblings (0 if unknown), a dummy for whether the number of siblings is unknown, and a dummy for whether the elementary school was religious.
According to the table, the marginal effect of the average math score on the probability of ever attending 10th grade is 0.015, which means that a one standard deviation change in the average math score of the school leads to a 1.5 percentage point change in the probability of ever attending 10th grade. Considering that only 8 percent of all Ethiopian students do not make it to
20
10th grade (Table 1), a 1.5 percentage point response is quite substantial in magnitude, in addition to being statistically significant.
Although Table 4 reports results from many different probits, several patterns emerge in the analysis. First, the average standardized math score appears to be significant at the 10 percent level for three of the eight high school outcomes, and marginally insignificant for two additional outcomes. The results are similar (but a little weaker) using the average percentile math score. The outcomes that emerge significant are primarily those about staying in school and progressing through the system without repeating grades. Somewhat surprisingly, math scores do not seem to be related to the key outcome of passing the matriculation exams, although they are negatively related to the dropout rate, which is also a very important outcome.
The last two columns of Table 4 use verbal scores as the measure of school quality. In contrast to the results using math scores, verbal scores of the elementary school are significant determinants of only two of the high school outcomes, most notably the overall dropout rate, and some of the coefficients have the wrong sign. The results are similar using the average standardized verbal scores or the average percentile score. Although Table 4 presents some evidence that verbal test scores are related to the dropout rates of Ethiopian children in high school, the results for verbal scores are clearly much less consistent across outcomes than the results for math scores. This pattern will repeat itself, and therefore will be discussed at length later on. In the meantime, the mixed results for verbal scores should be interpreted with caution.24 2. Allowing for a non-linear effect of school quality
Table 4 examined whether the quality of the elementary school environment is related to various high school outcomes with a linear specification. We now examine whether the effect is non-linear. Theoretically, students may benefit by being in only the top schools, or perhaps their performance is negatively affected only if they attend the worst schools. Another possibility could be that Ethiopian students benefit from good schools, but not from the very best schools because the distance between them and the other students is too great, and perhaps detrimental to the morale and learning process of Ethiopian immigrants. Some evidence for this scenario is presented in Figures 4a-4d, which show how the various high school outcomes of Ethiopian students vary according to the average math percentile rank of their elementary school. For a variety of outcome variables, the figures present both the average success rates in each quintile of
24 If the previous cohort of Ethiopian immigrants, who were disproportionately located in low socio-economic status towns, were able to influence the placement of their family members from the new cohort, and if having a network of relatives increases the chances of success in high school, then our results would be biased against finding any effect of school quality on outcomes.
21
the distribution of elementary school math scores, and a kernel estimate of the success probability on the average percentile math score.25
For all of the outcomes in Figures 4a-4d, the effect of math scores is linear for much of the graph, but is often interrupted by an abrupt jump or dip at one or both tails of the distribution. For example, the probability of ever attending 10th grade (Figure 4a) is lowest in the lowest quality schools, then appears to be flat in the middle of the distribution, and then jumps up abruptly in the top quintile. The probability of reaching 12th grade rises almost linearly, and then dips in the top quintile (Figure 4b). The dropout rate in Figure 4c exhibits no meaningful trend in the bottom half of the distribution, until sharply dipping in the upper tail.
The non-linear pattern is more dramatic for the high school matriculation outcomes in Figure 4d. Ethiopians do better in the worst schools than the second worst, but then they seem to benefit from the higher quality of the school until the abrupt dip in the upper quintile. The effect of quality is linear in the middle quintiles, but the interruptions at the tails of the distribution cause the coefficient in a linear specification (Table 4) to be insignificant. There are two possible interpretations for these patterns. First, the effect is indeed non-linear. Second, the data is noisy due to the small sample size (509 observations). Both of these interpretations are examined in Tables 5a and 5b.
Table 5a tests for a non-linear relationship between high school outcomes and two different ways of creating a non-linear math score. First, we simply create five dummy variables for whether the school�s average percentile score falls within the five quintiles of the national distribution of average math scores (as displayed in Figures 4a-4d). Secondly, we calculate the national quartile of the school�s 4th and 5th grade scores separately, and assign a value of 1 to a school that falls in the first (bottom) quartile, a value of 2 to a school that falls in the second quartile, and so on. We then add the values for 4th and 5th grade scores, and call the resulting sum the �quartile score�. Therefore, a school that ranks in the third quartile of 4th grade scores and in the fourth (top) quartile of 5th grade scores will have a �quartile score� of 7. The non-linear specification will then include dummy variables for each possible quartile score between 2 and 8 (with one category obviously omitted). The reasons for creating the �quartile score� are to check the robustness of using the quintiles of the average percentile scores, and to smooth out
25 The kernel estimate of the regression function at x0 is
( ) .1
1
�
1
0
1
0
0
∑
∑
−
−
Τ=T
t
T
tt
xxKT
yxxKxf
λλ
λλ
We used a biweight kernel, K(u)=(15/8)(1-4u2)2 for u∈ [-½,½], and bandwidth λ=0.28.
22
idiosyncrasies in the average percentile score of any given school by grouping the 4th and 5th grade scores first into quartiles before combining them.
The coefficients in columns (1) of Table 5a essentially test for whether the patterns seen in Figures 4a-4d are statistically significant. Overall, the results confirm what the pictures show: the upper two quintiles are often significant, although the top quintile seems somewhat weaker than the second highest quintile. This result may be due to the small number of students26 in the top quintile, or as mentioned above, perhaps the gap between immigrants and natives was so large in the very best schools that Ethiopian students ended up suffering because of it. It is important to note that the omitted category is the bottom quintile, which sometimes is more beneficial to Ethiopian students than being in the second quintile � this is particularly true for passing the matriculation exams. If the second quintile (Q2) were the excluded category in the matriculation exam regression, the coefficients for the other groups would obviously be more significant.
As stated above, the small sample sizes could be contributing to the changes in patterns at the tails of the math distribution, so we investigate this further by dividing schools into �good� and �bad� schools based on their average percentile rank. Column (2) in Table 5a groups the upper two quintiles together and this measure comes in quite significant for 6 of the 8 high school outcomes, including the most important ones: the dropout rate and the passing rate on the matriculation exams.
The analysis is repeated using our second non-linear measure of math scores, the �quartile score�, in columns (3) and (4) in Table 5a. The results are very similar to those obtained with the quintiles for the average percentile: being in a school with high math scores significantly affects high school outcomes, but the impact seems to be greater for the �good� schools (schools with a quartile score of 6 or 7) than for the �best� schools (schools with a quartile score of 8). However, when the upper schools are grouped together in column (4), the effect of the better schools is much more pronounced for all of the high school outcomes.
Overall, Table 5a shows that the effect of the quality of the elementary school environment on high school outcomes appears to be non-linear. The strongest results are obtained when we divide the schools into two categories, which could be interpreted as proxying for �good� versus �bad� schools: students seem to significantly benefit from being placed in �good� elementary schools. However, the results might be sharper using this dichotomous variable simply because it reduces the amount of noise in the data stemming from a rather small sample size and noisy measures of school quality.
26 Forty-three students (8.5 percent of the sample) were in the top quintile of elementary schools. 124 students were in the bottom quintile, 185 in the second quintile, 94 in the third quintile and 63 in the fourth quintile.
23
Table 5b repeats the non-linear analysis with the verbal scores instead of the math scores. The results here are similar to those in Table 4 where verbal scores were not significantly related to most of the high school outcomes. Even using the dichotomous measures of �good� and �bad� schools does not affect these results, as none of the coefficients emerge statistically significant for any high school outcome. Being in an elementary school with high verbal scores seemingly has had no impact on the high school outcomes of Ethiopian immigrants, and this begs for an explanation. 3. Reconciling the differences between math and verbal scores as measures of school quality
To investigate why the verbal and math results differ, we checked for whether the relationship between high school outcomes and the two different types of tests is also different for other Israeli students, or whether this phenomenon is unique to the Ethiopian sample. The first two columns of Table 6 replicate column 2 of Tables 5a and 5b for the sample of other Israeli 5th graders in 1993/94 (the sample, shown in column 4 in Table 1, includes Israeli Jews but excludes former Soviet Union and older Ethiopian immigrants). For every high school outcome in Table 6, the math and verbal score coefficients are nearly identical to each other in magnitude and statistical significance. Although these coefficients should not be interpreted as being causal, since we do not claim that other Israelis were randomly distributed into elementary schools, the results show that there are no differences in the relationship between math and verbal scores with the high school outcomes for other Israelis. These findings suggest that the differential effects of math and verbal scores of the elementary school on the high school outcomes of Ethiopian students are most likely specific to the case of the Ethiopians themselves, rather than something systematic about the two tests which should also show up for other Israelis.27
If we assume that test scores do indeed reflect the quality of the instruction in reading and mathematics, the fact that the quality of the verbal program in elementary school may have been less relevant to Ethiopian children than the quality of the math program can be easily explained. First, in many elementary schools, Ethiopian students were taught Hebrew in special classes separate from the other Israeli children.28 Second, when the Ethiopian students were taught in separate classes, often their teachers were recent high school graduates performing national service,29 which would render the verbal quality of the regular program inconsequential for Ethiopians. Third, �after-school� programs aimed at teaching language skills to Ethiopian 27 Interestingly, Currie and Thomas (2001) also find that success in reading may be less dependent on school quality than success in mathematics. 28 In footnote 12 we presented quotes of Ministry of Education officials that indicated that the official policy contemplated language instruction in separate classes.
24
immigrant children may have diluted the effects of a weak or even a strong verbal program. There is evidence that such programs were indeed offered to the May 1991 immigrant pupils in their schools and at the community level. Finally, it may be the case that Ethiopian students benefited more from a strong math program because their language deficit was less of a problem in learning math skills. All of these factors combined may be the reason why the math and verbal quality of the elementary school is so differentially related to high school outcomes for Ethiopians, but not for other Israeli students.
4. Summarizing the linear and non-linear results
Overall, the linear and non-linear results show that the elementary school environment, as measured by the math performance of students prior to the Ethiopian immigration, positively affected the chances of Ethiopian students to proceed through high school without repeating a grade or dropping out. The non-linear specification also shows that Ethiopians who attended �good schools� had significantly higher passing rates on the matriculation exams. All of these findings suggest that Ethiopians who were randomly placed into better elementary schools had a better chance to succeed in high school, thus validating the importance of the early schooling environment.30
Ideally, we would like to identify which aspects of the school environment lead to better high school outcomes for Ethiopian children. Elementary school math scores may reflect the quality of the school: the organization of the educational program, the abilities of teachers, the amount of resources, or the quality of one�s peers. However, it is also possible that elementary school math scores are correlated with other aspects of the elementary school environment, and perhaps are picking up the causal effect of these omitted characteristics, rather than the direct effect of school quality. For example, it may be the case that Ethiopian children who live in high socioeconomic status communities are more likely to patronize the public library, participate in extracurricular activities, or simply are more motivated to succeed in school to emulate their peers. Alternatively, the prevailing labor market opportunities faced by their parents may also have contributed to the children�s scholastic achievements. In these examples, it is not elementary school quality in and of itself (the quality of the educational program, the organizational capabilities of headmasters, the motivational abilities of teachers) that affects high school outcomes: instead, an Ethiopian child placed in a good �environment� (high quality peers,
29 The national service of teaching in religious elementary schools is an option opened only to religious female high school graduates as an alternative to their compulsory military service. 30 In regressions not reported, we have also found that school quality seems to be somewhat more beneficial for girls than for boys, but the sample sizes are too small to estimate these differences with precision.
25
availability of extracurricular activities, good labor market prospects for the parents) would be more likely to succeed, even if she attended a low quality school.
We attempt to control for many of these factors in the next section; however, it does not change the basic finding that the elementary school environment matters for high school success. In addition, if our results are picking up a correlation with unobservable factors of the schooling environment, these unobserved variables are likely to be correlated with the verbal test scores as well, but we do not find any effects for the verbal scores. In this sense, the differences between the verbal and math score results increase the likelihood that we have identified the effect of being in an elementary school with a strong math program (reflecting the quality of instruction, peer composition and other determinants of school quality), or at least something correlated with the math program and not the verbal program.
In the next section, we add several more variables of the schooling environment in order to identify which aspects of the elementary school are important in determining high school success. But, the lesson so far is that the early schooling environment matters, even for the important outcomes like dropout rates and passing rates on the matriculation exams. VI. Adding additional controls for the schooling environment
Table 7a examines whether the results in Table 5a using the �Top 2 Quintile� dummy variable for math scores are explained by other observable features of the schooling environment. Table 7b repeats the analysis for our second measure of �good schools� by using the �high quartile score� dummy variable. We do not present a similar analysis for the verbal score results, since the verbal results were never significant and they stay insignificant with all of the additional controls.
The first column in Table 7a simply replicates column (2) in Table 5a for ease of comparison. The second column adds several characteristics describing the community population surrounding the school (income per capita, matriculation rate, welfare recipients per 1000 inhabitants, rate of unemployment benefit recipients, and the dependency ratio). All these measures were taken from 1991, a year prior to the immigration wave, in order to avoid being endogenous to the presence of Ethiopian children and families in the school or school district. After including these additional characteristics of the other students and population within the schooling district, the coefficient on elementary school math scores should isolate the effect of school quality (the quality of teachers, peers, school principals, school resources, etc.) rather than the effect of favorable economic opportunities for the parents, or the availability of out-of-
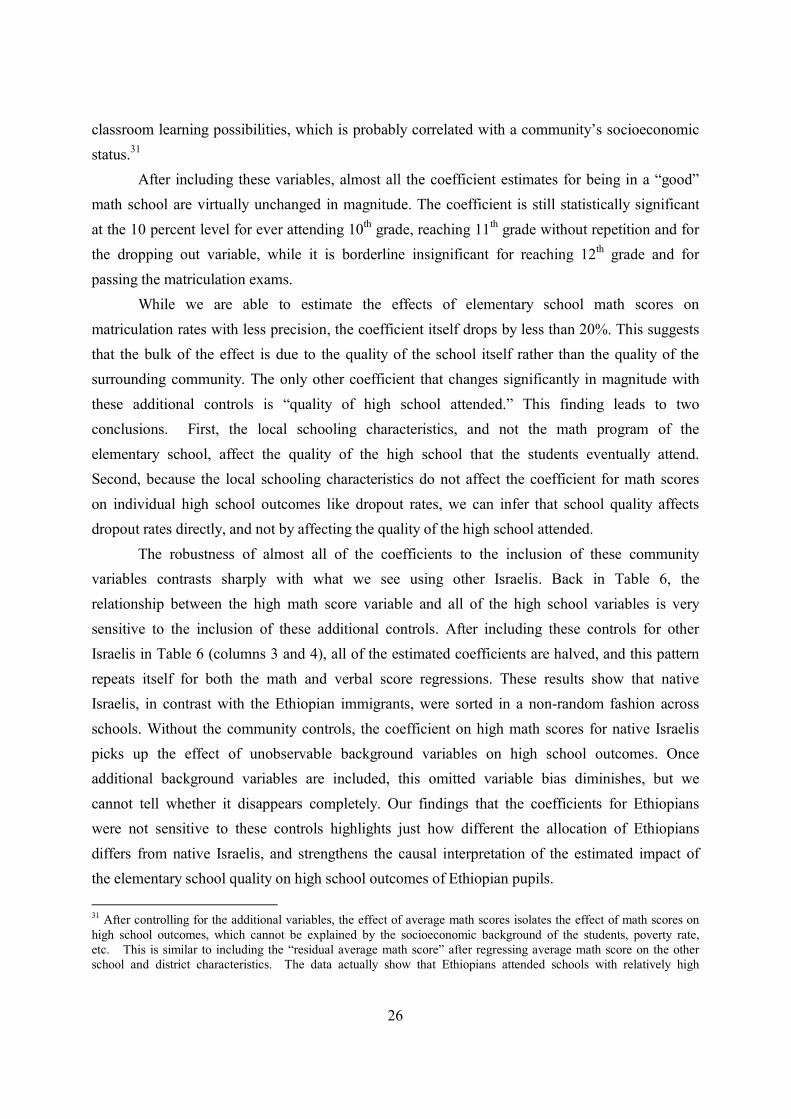
26
classroom learning possibilities, which is probably correlated with a community�s socioeconomic status.31
After including these variables, almost all the coefficient estimates for being in a �good� math school are virtually unchanged in magnitude. The coefficient is still statistically significant at the 10 percent level for ever attending 10th grade, reaching 11th grade without repetition and for the dropping out variable, while it is borderline insignificant for reaching 12th grade and for passing the matriculation exams.
While we are able to estimate the effects of elementary school math scores on matriculation rates with less precision, the coefficient itself drops by less than 20%. This suggests that the bulk of the effect is due to the quality of the school itself rather than the quality of the surrounding community. The only other coefficient that changes significantly in magnitude with these additional controls is �quality of high school attended.� This finding leads to two conclusions. First, the local schooling characteristics, and not the math program of the elementary school, affect the quality of the high school that the students eventually attend. Second, because the local schooling characteristics do not affect the coefficient for math scores on individual high school outcomes like dropout rates, we can infer that school quality affects dropout rates directly, and not by affecting the quality of the high school attended.
The robustness of almost all of the coefficients to the inclusion of these community variables contrasts sharply with what we see using other Israelis. Back in Table 6, the relationship between the high math score variable and all of the high school variables is very sensitive to the inclusion of these additional controls. After including these controls for other Israelis in Table 6 (columns 3 and 4), all of the estimated coefficients are halved, and this pattern repeats itself for both the math and verbal score regressions. These results show that native Israelis, in contrast with the Ethiopian immigrants, were sorted in a non-random fashion across schools. Without the community controls, the coefficient on high math scores for native Israelis picks up the effect of unobservable background variables on high school outcomes. Once additional background variables are included, this omitted variable bias diminishes, but we cannot tell whether it disappears completely. Our findings that the coefficients for Ethiopians were not sensitive to these controls highlights just how different the allocation of Ethiopians differs from native Israelis, and strengthens the causal interpretation of the estimated impact of the elementary school quality on high school outcomes of Ethiopian pupils. 31 After controlling for the additional variables, the effect of average math scores isolates the effect of math scores on high school outcomes, which cannot be explained by the socioeconomic background of the students, poverty rate, etc. This is similar to including the �residual average math score� after regressing average math score on the other school and district characteristics. The data actually show that Ethiopians attended schools with relatively high
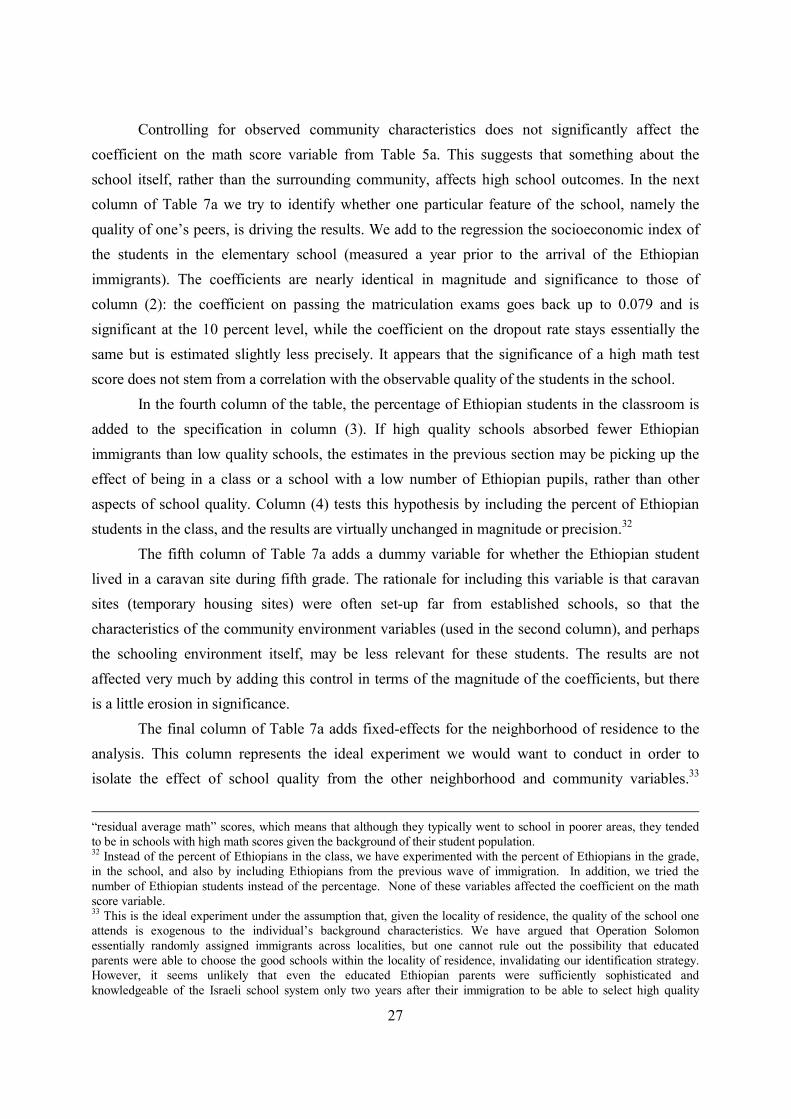
27
Controlling for observed community characteristics does not significantly affect the coefficient on the math score variable from Table 5a. This suggests that something about the school itself, rather than the surrounding community, affects high school outcomes. In the next column of Table 7a we try to identify whether one particular feature of the school, namely the quality of one�s peers, is driving the results. We add to the regression the socioeconomic index of the students in the elementary school (measured a year prior to the arrival of the Ethiopian immigrants). The coefficients are nearly identical in magnitude and significance to those of column (2): the coefficient on passing the matriculation exams goes back up to 0.079 and is significant at the 10 percent level, while the coefficient on the dropout rate stays essentially the same but is estimated slightly less precisely. It appears that the significance of a high math test score does not stem from a correlation with the observable quality of the students in the school.
In the fourth column of the table, the percentage of Ethiopian students in the classroom is added to the specification in column (3). If high quality schools absorbed fewer Ethiopian immigrants than low quality schools, the estimates in the previous section may be picking up the effect of being in a class or a school with a low number of Ethiopian pupils, rather than other aspects of school quality. Column (4) tests this hypothesis by including the percent of Ethiopian students in the class, and the results are virtually unchanged in magnitude or precision.32
The fifth column of Table 7a adds a dummy variable for whether the Ethiopian student lived in a caravan site during fifth grade. The rationale for including this variable is that caravan sites (temporary housing sites) were often set-up far from established schools, so that the characteristics of the community environment variables (used in the second column), and perhaps the schooling environment itself, may be less relevant for these students. The results are not affected very much by adding this control in terms of the magnitude of the coefficients, but there is a little erosion in significance.
The final column of Table 7a adds fixed-effects for the neighborhood of residence to the analysis. This column represents the ideal experiment we would want to conduct in order to isolate the effect of school quality from the other neighborhood and community variables.33
�residual average math� scores, which means that although they typically went to school in poorer areas, they tended to be in schools with high math scores given the background of their student population. 32 Instead of the percent of Ethiopians in the class, we have experimented with the percent of Ethiopians in the grade, in the school, and also by including Ethiopians from the previous wave of immigration. In addition, we tried the number of Ethiopian students instead of the percentage. None of these variables affected the coefficient on the math score variable. 33 This is the ideal experiment under the assumption that, given the locality of residence, the quality of the school one attends is exogenous to the individual�s background characteristics. We have argued that Operation Solomon essentially randomly assigned immigrants across localities, but one cannot rule out the possibility that educated parents were able to choose the good schools within the locality of residence, invalidating our identification strategy. However, it seems unlikely that even the educated Ethiopian parents were sufficiently sophisticated and knowledgeable of the Israeli school system only two years after their immigration to be able to select high quality
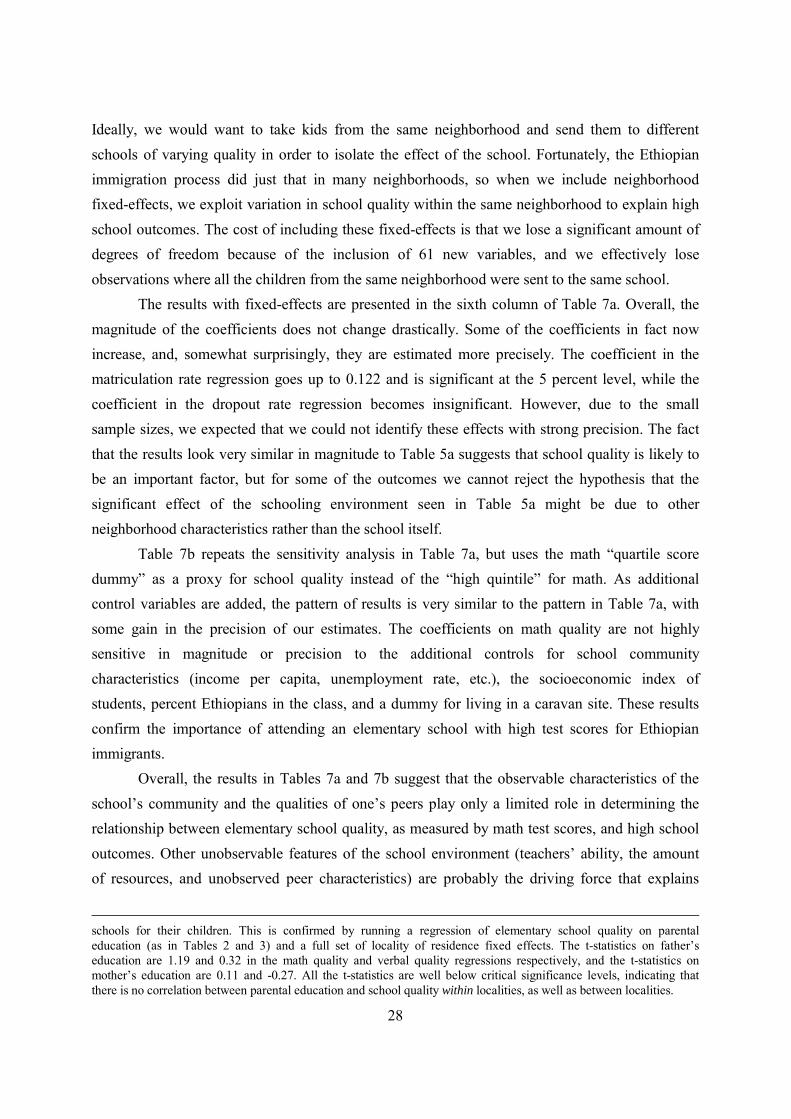
28
Ideally, we would want to take kids from the same neighborhood and send them to different schools of varying quality in order to isolate the effect of the school. Fortunately, the Ethiopian immigration process did just that in many neighborhoods, so when we include neighborhood fixed-effects, we exploit variation in school quality within the same neighborhood to explain high school outcomes. The cost of including these fixed-effects is that we lose a significant amount of degrees of freedom because of the inclusion of 61 new variables, and we effectively lose observations where all the children from the same neighborhood were sent to the same school.
The results with fixed-effects are presented in the sixth column of Table 7a. Overall, the magnitude of the coefficients does not change drastically. Some of the coefficients in fact now increase, and, somewhat surprisingly, they are estimated more precisely. The coefficient in the matriculation rate regression goes up to 0.122 and is significant at the 5 percent level, while the coefficient in the dropout rate regression becomes insignificant. However, due to the small sample sizes, we expected that we could not identify these effects with strong precision. The fact that the results look very similar in magnitude to Table 5a suggests that school quality is likely to be an important factor, but for some of the outcomes we cannot reject the hypothesis that the significant effect of the schooling environment seen in Table 5a might be due to other neighborhood characteristics rather than the school itself.
Table 7b repeats the sensitivity analysis in Table 7a, but uses the math �quartile score dummy� as a proxy for school quality instead of the �high quintile� for math. As additional control variables are added, the pattern of results is very similar to the pattern in Table 7a, with some gain in the precision of our estimates. The coefficients on math quality are not highly sensitive in magnitude or precision to the additional controls for school community characteristics (income per capita, unemployment rate, etc.), the socioeconomic index of students, percent Ethiopians in the class, and a dummy for living in a caravan site. These results confirm the importance of attending an elementary school with high test scores for Ethiopian immigrants.
Overall, the results in Tables 7a and 7b suggest that the observable characteristics of the school�s community and the qualities of one�s peers play only a limited role in determining the relationship between elementary school quality, as measured by math test scores, and high school outcomes. Other unobservable features of the school environment (teachers� ability, the amount of resources, and unobserved peer characteristics) are probably the driving force that explains
schools for their children. This is confirmed by running a regression of elementary school quality on parental education (as in Tables 2 and 3) and a full set of locality of residence fixed effects. The t-statistics on father�s education are 1.19 and 0.32 in the math quality and verbal quality regressions respectively, and the t-statistics on mother�s education are 0.11 and -0.27. All the t-statistics are well below critical significance levels, indicating that there is no correlation between parental education and school quality within localities, as well as between localities.
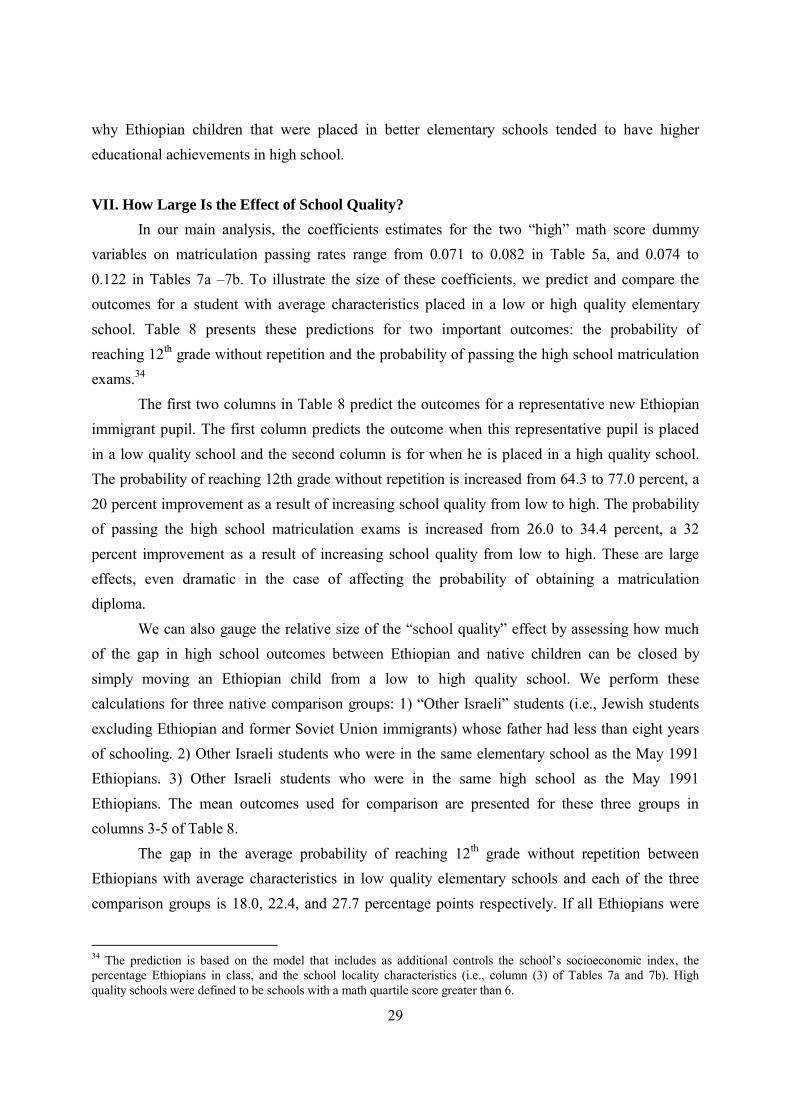
29
why Ethiopian children that were placed in better elementary schools tended to have higher educational achievements in high school. VII. How Large Is the Effect of School Quality?
In our main analysis, the coefficients estimates for the two �high� math score dummy variables on matriculation passing rates range from 0.071 to 0.082 in Table 5a, and 0.074 to 0.122 in Tables 7a �7b. To illustrate the size of these coefficients, we predict and compare the outcomes for a student with average characteristics placed in a low or high quality elementary school. Table 8 presents these predictions for two important outcomes: the probability of reaching 12th grade without repetition and the probability of passing the high school matriculation exams.34
The first two columns in Table 8 predict the outcomes for a representative new Ethiopian immigrant pupil. The first column predicts the outcome when this representative pupil is placed in a low quality school and the second column is for when he is placed in a high quality school. The probability of reaching 12th grade without repetition is increased from 64.3 to 77.0 percent, a 20 percent improvement as a result of increasing school quality from low to high. The probability of passing the high school matriculation exams is increased from 26.0 to 34.4 percent, a 32 percent improvement as a result of increasing school quality from low to high. These are large effects, even dramatic in the case of affecting the probability of obtaining a matriculation diploma.
We can also gauge the relative size of the �school quality� effect by assessing how much of the gap in high school outcomes between Ethiopian and native children can be closed by simply moving an Ethiopian child from a low to high quality school. We perform these calculations for three native comparison groups: 1) �Other Israeli� students (i.e., Jewish students excluding Ethiopian and former Soviet Union immigrants) whose father had less than eight years of schooling. 2) Other Israeli students who were in the same elementary school as the May 1991 Ethiopians. 3) Other Israeli students who were in the same high school as the May 1991 Ethiopians. The mean outcomes used for comparison are presented for these three groups in columns 3-5 of Table 8.
The gap in the average probability of reaching 12th grade without repetition between Ethiopians with average characteristics in low quality elementary schools and each of the three comparison groups is 18.0, 22.4, and 27.7 percentage points respectively. If all Ethiopians were
34 The prediction is based on the model that includes as additional controls the school�s socioeconomic index, the percentage Ethiopians in class, and the school locality characteristics (i.e., column (3) of Tables 7a and 7b). High quality schools were defined to be schools with a math quartile score greater than 6.
30
to be placed into high quality elementary schools, the gaps relative to the three comparison groups are reduced dramatically to 5.3, 9.7 and 15.0 points respectively. Most dramatic is the almost total elimination of the gap relative to the group of Israeli pupils who is closest to the Ethiopian pupils in terms of family educational background.
The gap in the average probability of passing the high school matriculation exams between Ethiopians with average characteristics in low quality schools and each of three comparison groups is 14.7, 16.7 and 31.3 percentage points respectively. If all Ethiopians were placed in high quality elementary schools these gaps would be reduced significantly to 6.4, 18.4, and 23.0 percentage points respectively. Again, most dramatic is the closing of more than a half of the gap relative to the group of Israeli pupils who had similar family educational background.
VIII. Conclusion The analysis in this paper exploits the exogenous variation in school quality created by the random assortment of Ethiopian immigrant children into schools upon their arrival. This natural experiment created a unique research opportunity to study the effects of the elementary schooling environment on high school outcomes.
The results suggest that elementary schools that are strong in math have a significant impact on the dropout rates of students in high school, with some evidence that they also impact the passing rate on high school matriculation exams, which are necessary to enter college. At the minimum, these results point to the importance of the early schooling environment in determining important high school outcomes such as dropout rates and passing the matriculation exams. The results are robust to the inclusion of additional controls for observable and unobservable characteristics of the school�s surrounding community, suggesting that it is the quality of the elementary school that is important for high school success, rather than other features of the environment. We also try to identify separately which components of school quality are driving the results, and provide some evidence that being in contact with high socioeconomic status peers cannot explain our findings.
In contrast to the math quality of the elementary school, we find little or no evidence that attending an elementary school with high verbal performance affects outcomes in high school. We suspect that this result is due to several factors that rendered the strength of verbal program in school less relevant for Ethiopian students.
We believe that these results can have important and far-reaching implications, which go well beyond the immediate but narrow Israeli context. First, this paper is one of the first attempts at estimating precisely the effect of school quality in a setting that resembles as closely as possible the ideal conditions of a controlled laboratory experiment. Second, all industrialized
31
countries have seen a sharp increase in immigration rates from the developing world in the past two decades. The question of how to successfully integrate younger generations of immigrants, first in the school system, and subsequently in the fabric of society, is at the forefront of policymakers� agendas throughout the Western world. The finding that the community characteristics seem not to alter the effect of early childhood school quality on the high school achievements of Ethiopian children may not be so surprising given that immigrants tend to segregate themselves for several years after their arrival. This finding may be also relevant for other immigrant receiving countries, and suggests that some of the potential benefits of immigration are lost as a result of newcomers� propensity to have limited interactions with the absorbing communities.
Third, substantial gaps in educational achievements exist even among natives of different ethnic or racial background. The gap in educational achievements between blacks and whites in the United States is quite similar to the gap between Ethiopians and native Israelis. The results in this paper suggest that a substantial fraction of the gap could be closed if minority students attended higher quality elementary schools. Finally, our results can also be placed in the context of the developing world, and Africa in particular. Sixty-five percent of the children in our cohort reached 12th grade, a remarkable improvement relative to the educational achievements of their parents. The mean high school outcomes of the new Ethiopians in Israel, especially of those who were placed in good elementary schools, should strengthen the quest for improving school quality in poor countries in their quest for economic and social development.
32
VII. References Angrist, Joshua D.; Imbens, Guido W. and Rubin, Donald B. �Identification of Causal Effects Using Instrumental Variables,� Journal of the American Statistical Association, 91(434), June 1996, pages 444-455. Angrist, Joshua D. and Lang, Kevin, �How Important are Classroom Peer Effects? Evidence from Boston�s Metco Program,� NBER Working Paper 9263, October 2002. Angrist, Joshua D. and Lavy, Victor. �Using Maimonides' Rule to Estimate the Effect of Class Size on Scholastic Achievement.� Quarterly Journal of Economics, 114(2), May 1999, pages 533-75. Angrist, Joshua D. and Lavy, Victor. �Does Teacher Training Affect Pupil Learning? Evidence from Matched Comparisons in Jerusalem Public Schools.� Journal of Labor Economics, 19(2), April 2001, pages 343-69. Angrist, Joshua D. and Lavy, Victor. �New Evidence on Classroom Computers and Pupil Learning.� The Economic Journal, 112(482), October 2002, pages 735-765. Arnott, Richard J. and Rowse, John. �Peer Group Effects and Educational Attainment.� Journal of Public Economics, 32(3), April 1987, pages 287-305. Betts, Julian R. �Does School Quality Matter? Evidence from the National Longitudinal Survey of Youth.� Review of Economics and Statistics, 77(2), May 1995, pages 231-50. Borjas, George J. Heaven’s Door. Immigration Policy and the American Economy. Princeton, Princeton University Press, 1999. Burtless, Gary. Does Money Matter? The Effect of School Resources on Student Achievement and Adult Success. Washington, D.C.: Brookings Institution Press, 1996. Card, David and Krueger, Alan B. �Does School Quality Matter? Returns to Education and the Characteristics of Public Schools in the United States.� Journal of Political Economy, 100(1), February 1992, pages 1-40. Currie, Janet. �Early Childhood Education Programs.� Journal of Economic Perspectives, 15(2), Spring 2001, pages 213-238. Currie, Janet and Thomas, Duncan. �Early Test Scores, School Quality and SES: Longrun Effects on Wage and Employment Outcomes.� Research in Labor Economics, 20, 2001, pages 103-132. Edin, Per-Anders, Fredriksson, Peter and Åslund, Olof. �Ethnic Enclaves and the Economic Success of Immigrants � Evidence from a Natural Experiment.� Quarterly Journal of Economics, 118(1), February 2003, pages 329-357. Garces, Eliana; Thomas, Duncan and Currie, Janet. �Longer Term Effects of Head Start.� American Economic Review, 92(4), September 2002, pages 999-1012. Hanushek, Eric; Kain, John F. and Rivkin, Steven G. �New Evidence About Brown V. Board of Education: The Complex Effects of School Racial Composition on Achievement,� NBER Working Paper 8741, January 2002. Heckman, James J. �Randomization and Social Program Evaluation,� in Evaluating Welfare and Training Programs, ed. C. F. Manski and D. McFadden. Cambridge, MA: Harvard University Press, 1992, pages 201-230. Heckman, James J. �Policies to Foster Human Capital,� Research in Economics, 54(1), March 2000, pages 3-56.
33
Heckman, James J.; Ichimura, Hidehiko and Todd, Petra E. �Matching as an Econometric Evaluation Estimator: Evidence from Evaluating a Job Training Programme,� Review of Economic Studies, 64(4), October 1997, pages 605-654. Hoxby, Caroline M. �Peer Effects in the Classroom: Learning from Gender and Race Variation,� NBER Working Paper 7867, August 2000a. Hoxby, Caroline M. �The Effects of Class Size on Student Achievement: New Evidence from Population Variation.� Quarterly Journal of Economics; 115(4), November 2000b, pages 1239-85. Imbens, Guido W. and Angrist, Joshua D. �Identification and Estimation of Local Average Treatment Effects,� Econometrica, 62(2), March 1994, pages 467-475. Kaplan, Steven. The Beta Israel (Falasha) in Ethiopia: From Earliest Times to the Twentieth Century. New York: New York University Press, 1992. Kaplan Steven and Rosen, Chaim. �Ethiopian Jews in Israel,� American Jewish Year Book, 1994, pages 59-109. Katz, Lawrence F.; Kling, Jeffrey R. and Liebman, Jeffrey B. �Moving to Opportunity in Boston: Early Results from a Randomized Mobility Experiment,� Quarterly Journal of Economics 116, pages 607-654. Krueger, Alan B. �Experimental Estimates of Education Production Functions.� Quarterly Journal of Economics, 114(2), May 1999, pages 497-532. Krueger, Alan B. and Whitmore, Diane M. �The Effect of Attending a Small Class in the Early Grades on College-Test Taking and Middle School Test Results: Evidence from Project STAR.� Economic Journal, 111(468), January 2001, pages 1-28. LaLonde, Robert and Topel, Robert. �Economic Impact of International Migration and the Economic Performance of Immigrants,� in Handbook of Population Economics, Mark Rosenzweig and Oded Stark, eds. Amsterdam: North Holland, 1997. Lavy, Victor. �Evaluating the Effect of Teachers� Group Performance Incentives on Pupils� Achievements.� Journal of Political Economy, 110(6), December 2002, pages 1286-1317. Lavy, Victor. �Paying for Performance: The Effect of Teachers� Financial Incentives on Students� Scholastic Achievements,� mimeo., Hebrew University, August 2002. Manski, Charles F. �Identification of Endogenous Social Effects: The Reflection Problem,� Review of Economic Studies, LX (1993), pages 531-542. Manski, Charles F. �Learning about Treatment Effects from Experiments with Random Assignment of Treatments,� Journal of Human Resources, 31(4), Fall 1996, pages 709-733. Oreopoulos, Philip. �The Long-Run Consequences of Living in a Poor Neighborhood.� Quarterly Journal of Economics, 118(4), November 2003, forthcoming. Rosenbaum, Paul R. and Rubin, Donald B. �The Central Role of the Propensity Score in Observational Studies for Causal Effects,� Biometrika, 70(1), April 1983, pages 41-55. Rubin, Donald B. �Estimating Causal Effects of Treatments in Randomized and Nonrandomized Studies,� Journal of Educational Psychology, 66(5), October 1974, pages 688-701. Sacerdote, Bruce. �Peer Effects with Random Assignment: Results for Dartmouth Roommates.� Quarterly Journal of Economics, 116(2), May 2001, pages 681-704. Wagaw, Thesome. For Our Soul: Ethiopian Jews in Israel. Detroit: Wayne State University Press, 1993. Zimmerman, David J. �Peer Effects in Academic Outcomes: Evidence from a Natural Experiment,� Review of Economics and Statistics, 85(1), February 2003, pages 9-23.
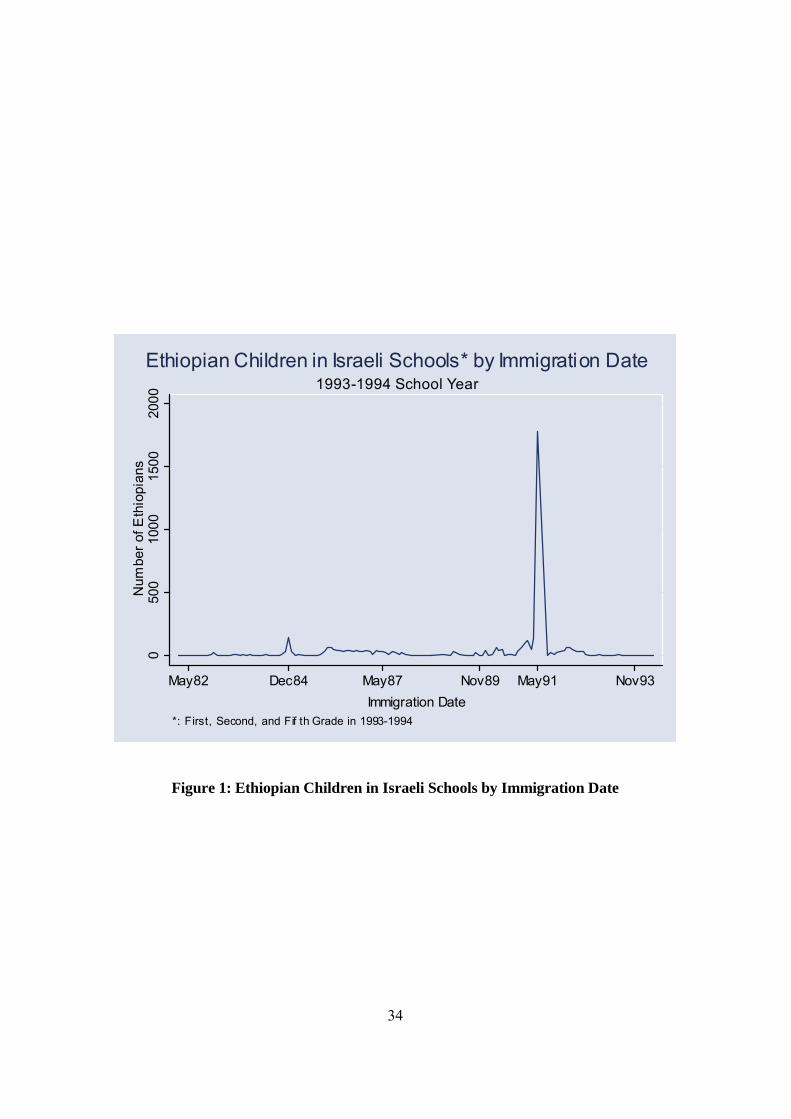
34
050
010
0015
0020
00N
umbe
r of
Eth
iopi
ans
May82 Dec84 May87 Nov89 May91 Nov93
Immigration Date*: First, Second, and Fif th Grade in 1993-1994
1993-1994 School Year
Ethiopian Children in Israeli Schools* by Immigration Date
Figure 1: Ethiopian Children in Israeli Schools by Immigration Date
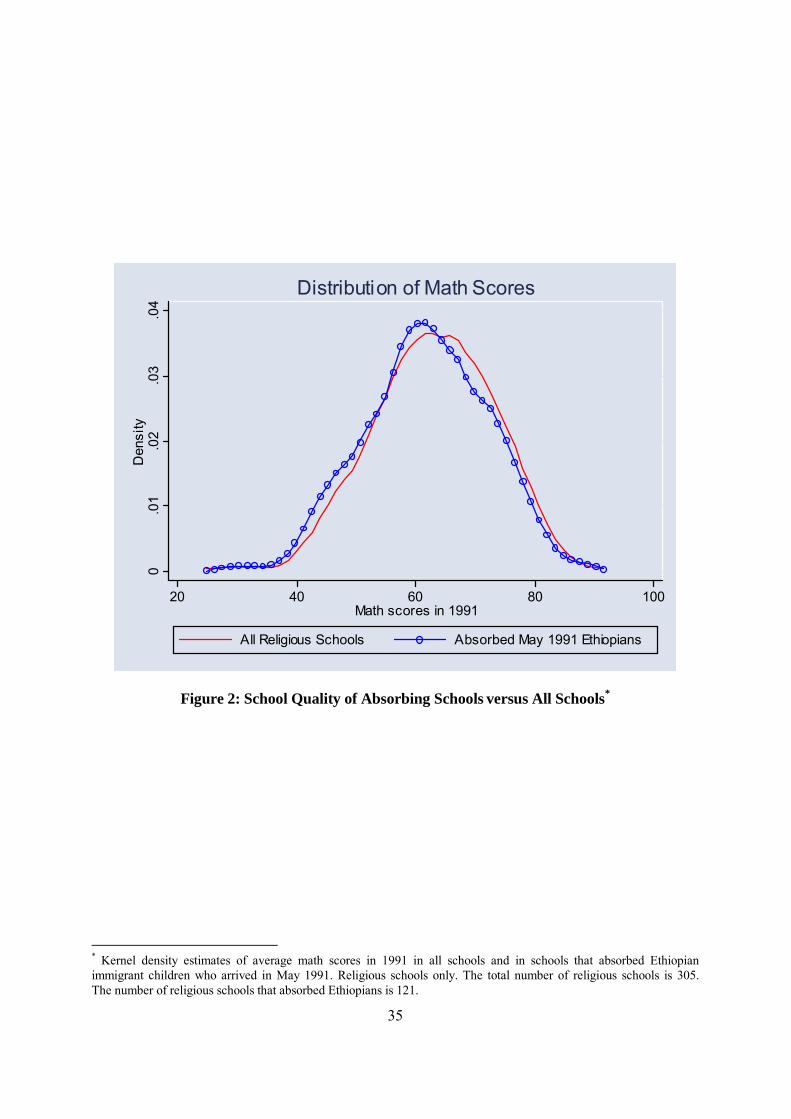
35
0.0
1.0
2.0
3.0
4D
ensi
ty
20 40 60 80 100Math scores in 1991
All Religious Schools Absorbed May 1991 Ethiopians
Distribution of Math Scores
Figure 2: School Quality of Absorbing Schools versus All Schools*
* Kernel density estimates of average math scores in 1991 in all schools and in schools that absorbed Ethiopian immigrant children who arrived in May 1991. Religious schools only. The total number of religious schools is 305. The number of religious schools that absorbed Ethiopians is 121.
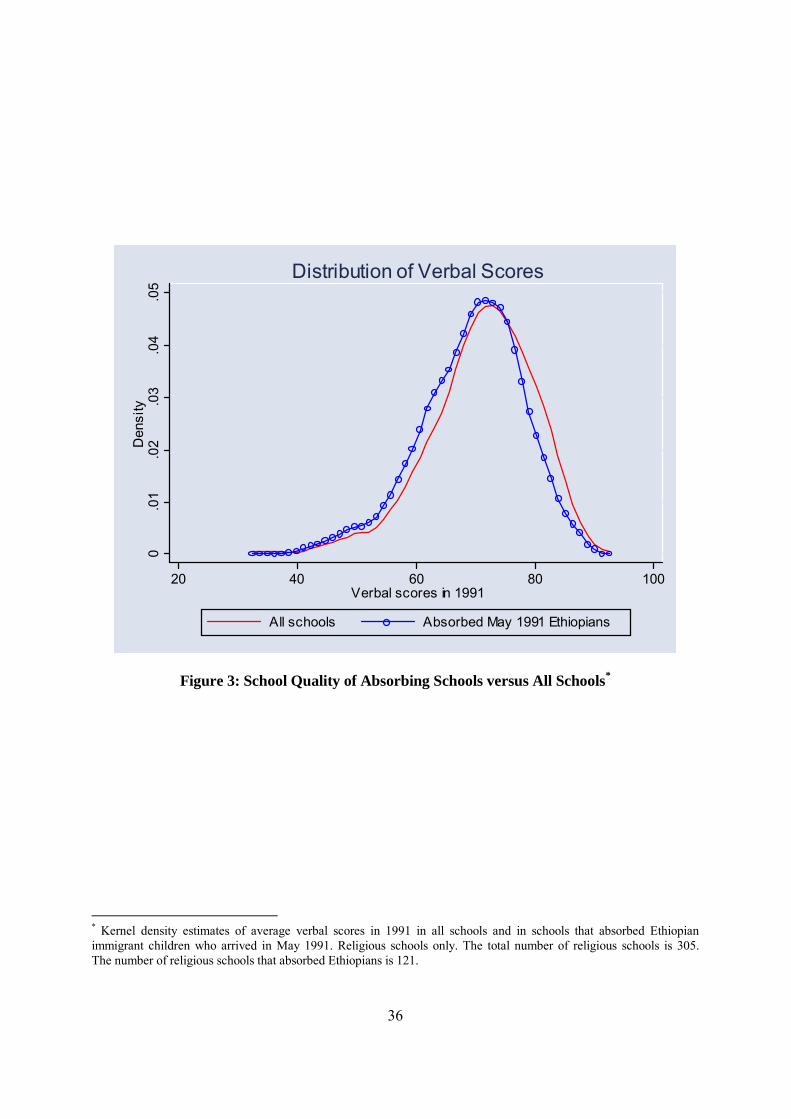
36
0.0
1.0
2.0
3.0
4.0
5D
ensi
ty
20 40 60 80 100Verbal scores in 1991
All schools Absorbed May 1991 Ethiopians
Distribution of Verbal Scores
Figure 3: School Quality of Absorbing Schools versus All Schools*
* Kernel density estimates of average verbal scores in 1991 in all schools and in schools that absorbed Ethiopian immigrant children who arrived in May 1991. Religious schools only. The total number of religious schools is 305. The number of religious schools that absorbed Ethiopians is 121.
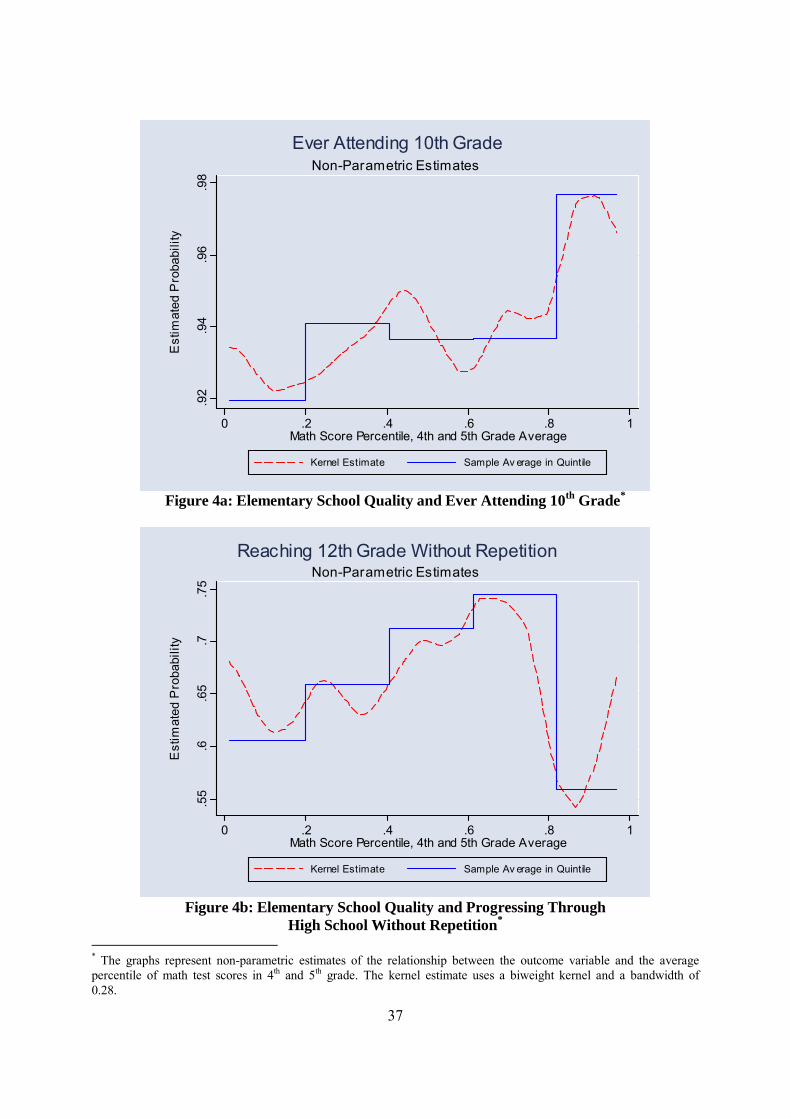
37
.92
.94
.96
.98
Est
imat
ed P
roba
bilit
y
0 .2 .4 .6 .8 1Math Score Percentile, 4th and 5th Grade Average
Kernel Estimate Sample Av erage in Quintile
Non-Parametric Estimates
Ever Attending 10th Grade
Figure 4a: Elementary School Quality and Ever Attending 10th Grade*
.55
.6.6
5.7
.75
Est
imat
ed P
roba
bilit
y
0 .2 .4 .6 .8 1Math Score Percentile, 4th and 5th Grade Average
Kernel Estimate Sample Av erage in Quintile
Non-Parametric Estimates
Reaching 12th Grade Without Repetition
Figure 4b: Elementary School Quality and Progressing Through
High School Without Repetition*
* The graphs represent non-parametric estimates of the relationship between the outcome variable and the average percentile of math test scores in 4th and 5th grade. The kernel estimate uses a biweight kernel and a bandwidth of 0.28.
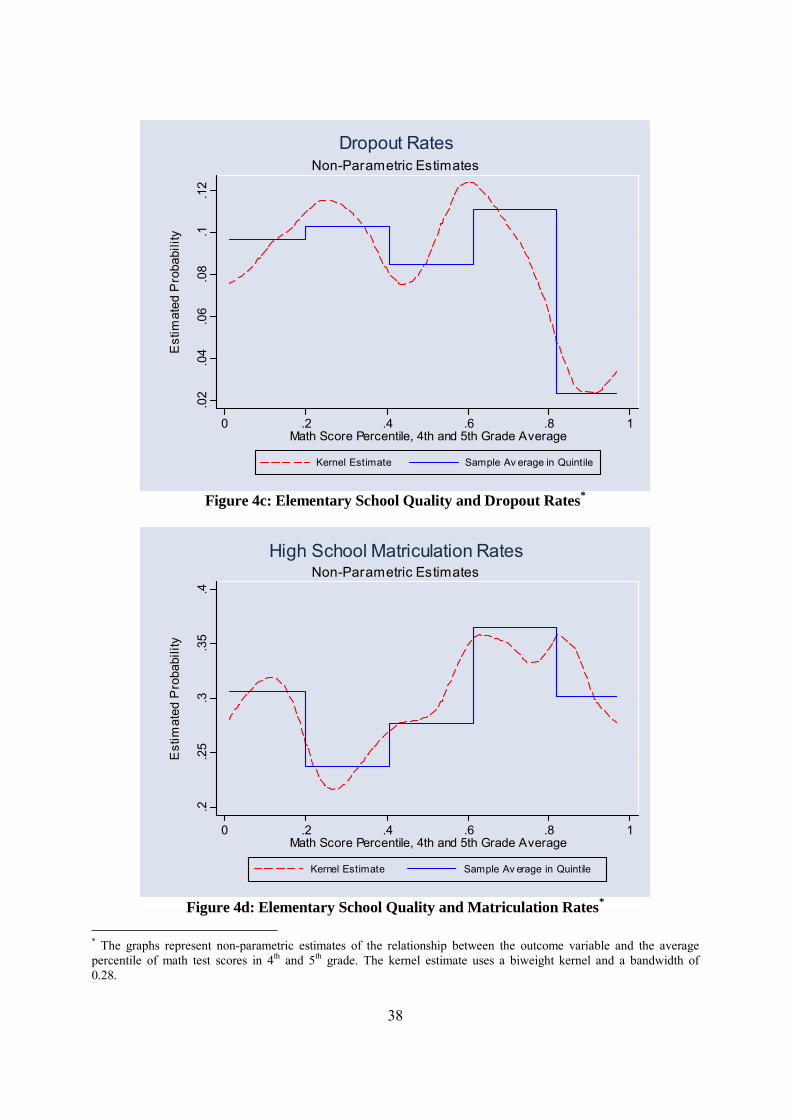
38
.02
.04
.06
.08
.1.1
2
Est
imat
ed P
roba
bilit
y
0 .2 .4 .6 .8 1Math Score Percentile, 4th and 5th Grade Average
Kernel Estimate Sample Av erage in Quintile
Non-Parametric Estimates
Dropout Rates
Figure 4c: Elementary School Quality and Dropout Rates*
.2.2
5.3
.35
.4
Est
imat
ed P
roba
bilit
y
0 .2 .4 .6 .8 1Math Score Percentile, 4th and 5th Grade Average
Kernel Estimate Sample Av erage in Quintile
Non-Parametric Estimates
High School Matriculation Rates
Figure 4d: Elementary School Quality and Matriculation Rates*
* The graphs represent non-parametric estimates of the relationship between the outcome variable and the average percentile of math test scores in 4th and 5th grade. The kernel estimate uses a biweight kernel and a bandwidth of 0.28.
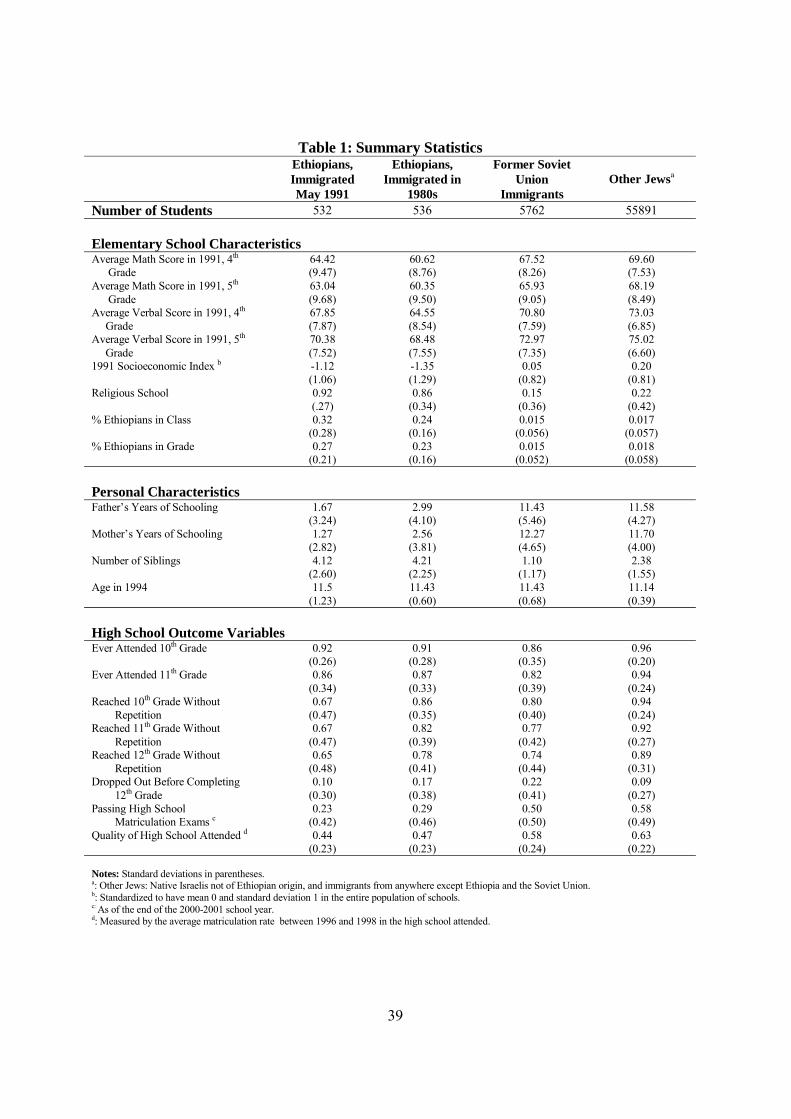
39
Table 1: Summary Statistics
Ethiopians, Immigrated May 1991
Ethiopians, Immigrated in
1980s
Former Soviet Union
Immigrants Other Jewsa
Number of Students 532 536 5762 55891 Elementary School Characteristics Average Math Score in 1991, 4th Grade
64.42 (9.47)
60.62 (8.76)
67.52 (8.26)
69.60 (7.53)
Average Math Score in 1991, 5th Grade
63.04 (9.68)
60.35 (9.50)
65.93 (9.05)
68.19 (8.49)
Average Verbal Score in 1991, 4th Grade
67.85 (7.87)
64.55 (8.54)
70.80 (7.59)
73.03 (6.85)
Average Verbal Score in 1991, 5th Grade
70.38 (7.52)
68.48 (7.55)
72.97 (7.35)
75.02 (6.60)
1991 Socioeconomic Index b -1.12 (1.06)
-1.35 (1.29)
0.05 (0.82)
0.20 (0.81)
Religious School 0.92 (.27)
0.86 (0.34)
0.15 (0.36)
0.22 (0.42)
% Ethiopians in Class 0.32 (0.28)
0.24 (0.16)
0.015 (0.056)
0.017 (0.057)
% Ethiopians in Grade 0.27 (0.21)
0.23 (0.16)
0.015 (0.052)
0.018 (0.058)
Personal Characteristics Father�s Years of Schooling 1.67
(3.24) 2.99
(4.10) 11.43 (5.46)
11.58 (4.27)
Mother�s Years of Schooling 1.27 (2.82)
2.56 (3.81)
12.27 (4.65)
11.70 (4.00)
Number of Siblings 4.12 (2.60)
4.21 (2.25)
1.10 (1.17)
2.38 (1.55)
Age in 1994 11.5 (1.23)
11.43 (0.60)
11.43 (0.68)
11.14 (0.39)
High School Outcome Variables Ever Attended 10th Grade 0.92
(0.26) 0.91
(0.28) 0.86
(0.35) 0.96
(0.20) Ever Attended 11th Grade 0.86
(0.34) 0.87
(0.33) 0.82
(0.39) 0.94
(0.24) Reached 10th Grade Without
Repetition 0.67
(0.47) 0.86
(0.35) 0.80
(0.40) 0.94
(0.24) Reached 11th Grade Without
Repetition 0.67
(0.47) 0.82
(0.39) 0.77
(0.42) 0.92
(0.27) Reached 12th Grade Without
Repetition 0.65
(0.48) 0.78
(0.41) 0.74
(0.44) 0.89
(0.31) Dropped Out Before Completing
12th Grade 0.10
(0.30) 0.17
(0.38) 0.22
(0.41) 0.09
(0.27) Passing High School
Matriculation Exams c 0.23
(0.42) 0.29
(0.46) 0.50
(0.50) 0.58
(0.49) Quality of High School Attended d 0.44
(0.23) 0.47
(0.23) 0.58
(0.24) 0.63
(0.22)
Notes: Standard deviations in parentheses. a: Other Jews: Native Israelis not of Ethiopian origin, and immigrants from anywhere except Ethiopia and the Soviet Union. b: Standardized to have mean 0 and standard deviation 1 in the entire population of schools. c: As of the end of the 2000-2001 school year. d: Measured by the average matriculation rate between 1996 and 1998 in the high school attended.
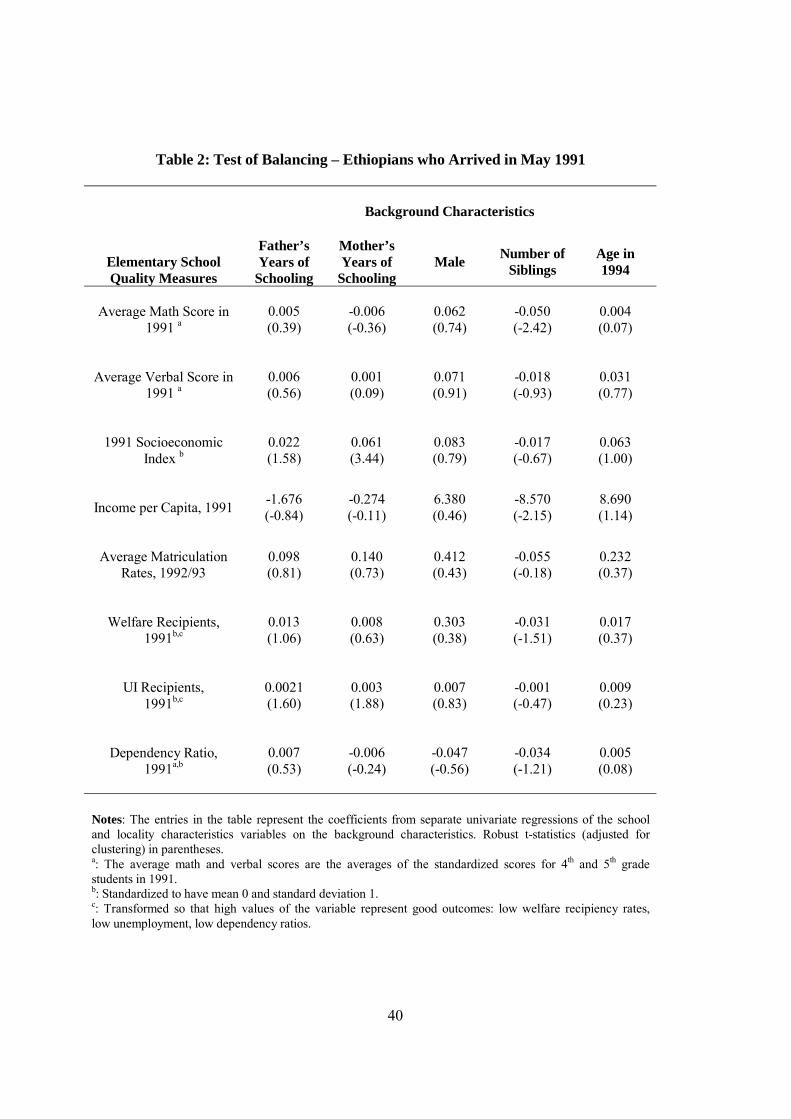
40
Table 2: Test of Balancing – Ethiopians who Arrived in May 1991
Background Characteristics
Elementary School Quality Measures
Father’s Years of
Schooling
Mother’s Years of
Schooling Male Number of
Siblings Age in 1994
Average Math Score in
1991 a
0.005 (0.39)
-0.006 (-0.36)
0.062 (0.74)
-0.050 (-2.42)
0.004 (0.07)
Average Verbal Score in
1991 a
0.006 (0.56)
0.001 (0.09)
0.071 (0.91)
-0.018 (-0.93)
0.031 (0.77)
1991 Socioeconomic
Index b
0.022 (1.58)
0.061 (3.44)
0.083 (0.79)
-0.017 (-0.67)
0.063 (1.00)
Income per Capita, 1991
-1.676 (-0.84)
-0.274 (-0.11)
6.380 (0.46)
-8.570 (-2.15)
8.690 (1.14)
Average Matriculation
Rates, 1992/93
0.098 (0.81)
0.140 (0.73)
0.412 (0.43)
-0.055 (-0.18)
0.232 (0.37)
Welfare Recipients,
1991b,c
0.013 (1.06)
0.008 (0.63)
0.303 (0.38)
-0.031 (-1.51)
0.017 (0.37)
UI Recipients,
1991b,c
0.0021 (1.60)
0.003 (1.88)
0.007 (0.83)
-0.001 (-0.47)
0.009 (0.23)
Dependency Ratio,
1991a,b
0.007 (0.53)
-0.006 (-0.24)
-0.047 (-0.56)
-0.034 (-1.21)
0.005 (0.08)
Notes: The entries in the table represent the coefficients from separate univariate regressions of the school and locality characteristics variables on the background characteristics. Robust t-statistics (adjusted for clustering) in parentheses. a: The average math and verbal scores are the averages of the standardized scores for 4th and 5th grade students in 1991. b: Standardized to have mean 0 and standard deviation 1. c: Transformed so that high values of the variable represent good outcomes: low welfare recipiency rates, low unemployment, low dependency ratios.
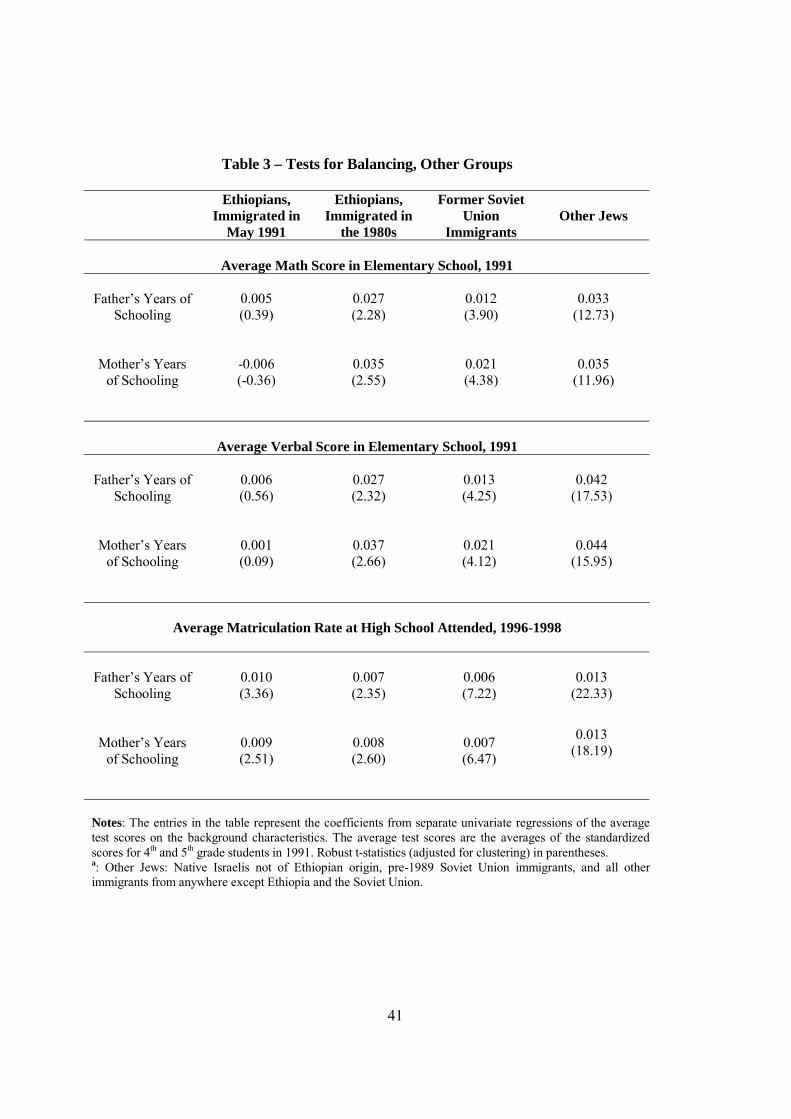
41
Table 3 – Tests for Balancing, Other Groups
Ethiopians,
Immigrated in May 1991
Ethiopians, Immigrated in
the 1980s
Former Soviet Union
Immigrants Other Jews
Average Math Score in Elementary School, 1991
Father�s Years of
Schooling
0.005 (0.39)
0.027 (2.28)
0.012 (3.90)
0.033 (12.73)
Mother�s Years
of Schooling
-0.006 (-0.36)
0.035 (2.55)
0.021 (4.38)
0.035 (11.96)
Average Verbal Score in Elementary School, 1991
Father�s Years of Schooling
0.006 (0.56)
0.027 (2.32)
0.013 (4.25)
0.042 (17.53)
Mother�s Years
of Schooling
0.001 (0.09)
0.037 (2.66)
0.021 (4.12)
0.044 (15.95)
Average Matriculation Rate at High School Attended, 1996-1998
Father�s Years of
Schooling
0.010 (3.36)
0.007 (2.35)
0.006 (7.22)
0.013 (22.33)
Mother�s Years
of Schooling
0.009 (2.51)
0.008 (2.60)
0.007 (6.47)
0.013 (18.19)
Notes: The entries in the table represent the coefficients from separate univariate regressions of the average test scores on the background characteristics. The average test scores are the averages of the standardized scores for 4th and 5th grade students in 1991. Robust t-statistics (adjusted for clustering) in parentheses. a: Other Jews: Native Israelis not of Ethiopian origin, pre-1989 Soviet Union immigrants, and all other immigrants from anywhere except Ethiopia and the Soviet Union.
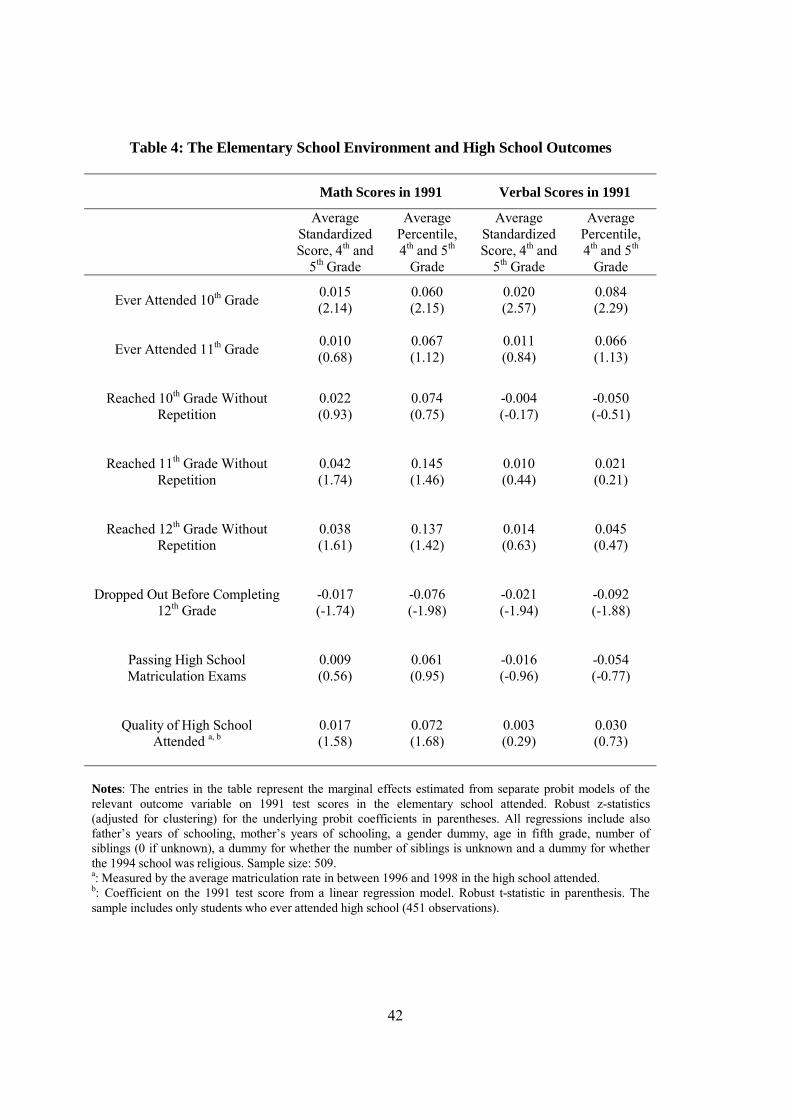
42
Table 4: The Elementary School Environment and High School Outcomes
Math Scores in 1991 Verbal Scores in 1991
Average Standardized Score, 4th and
5th Grade
Average Percentile, 4th and 5th
Grade
Average Standardized Score, 4th and
5th Grade
Average Percentile, 4th and 5th
Grade
Ever Attended 10th Grade
0.015 (2.14)
0.060 (2.15)
0.020 (2.57)
0.084 (2.29)
Ever Attended 11th Grade
0.010 (0.68)
0.067 (1.12)
0.011 (0.84)
0.066 (1.13)
Reached 10th Grade Without
Repetition
0.022 (0.93)
0.074 (0.75)
-0.004 (-0.17)
-0.050 (-0.51)
Reached 11th Grade Without
Repetition
0.042 (1.74)
0.145 (1.46)
0.010 (0.44)
0.021 (0.21)
Reached 12th Grade Without
Repetition
0.038 (1.61)
0.137 (1.42)
0.014 (0.63)
0.045 (0.47)
Dropped Out Before Completing
12th Grade
-0.017 (-1.74)
-0.076 (-1.98)
-0.021 (-1.94)
-0.092 (-1.88)
Passing High School Matriculation Exams
0.009 (0.56)
0.061 (0.95)
-0.016 (-0.96)
-0.054 (-0.77)
Quality of High School
Attended a, b
0.017 (1.58)
0.072 (1.68)
0.003 (0.29)
0.030 (0.73)
Notes: The entries in the table represent the marginal effects estimated from separate probit models of the relevant outcome variable on 1991 test scores in the elementary school attended. Robust z-statistics (adjusted for clustering) for the underlying probit coefficients in parentheses. All regressions include also father�s years of schooling, mother�s years of schooling, a gender dummy, age in fifth grade, number of siblings (0 if unknown), a dummy for whether the number of siblings is unknown and a dummy for whether the 1994 school was religious. Sample size: 509. a: Measured by the average matriculation rate in between 1996 and 1998 in the high school attended. b: Coefficient on the 1991 test score from a linear regression model. Robust t-statistic in parenthesis. The sample includes only students who ever attended high school (451 observations).
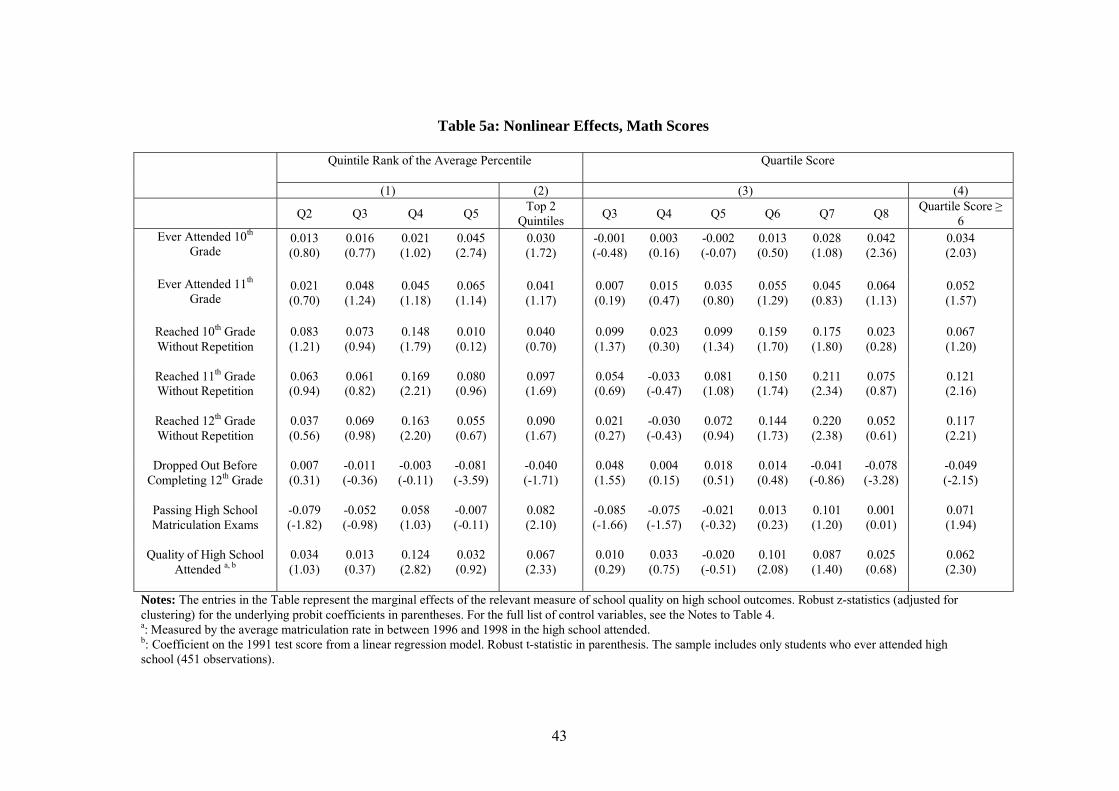
43
Table 5a: Nonlinear Effects, Math Scores
Quintile Rank of the Average Percentile
Quartile Score
(1) (2) (3) (4)
Q2 Q3 Q4 Q5 Top 2 Quintiles Q3 Q4 Q5 Q6 Q7 Q8 Quartile Score ≥
6 Ever Attended 10th
Grade
0.013 (0.80)
0.016 (0.77)
0.021 (1.02)
0.045 (2.74)
0.030 (1.72)
-0.001 (-0.48)
0.003 (0.16)
-0.002 (-0.07)
0.013 (0.50)
0.028 (1.08)
0.042 (2.36)
0.034 (2.03)
Ever Attended 11th
Grade
0.021 (0.70)
0.048 (1.24)
0.045 (1.18)
0.065 (1.14)
0.041 (1.17)
0.007 (0.19)
0.015 (0.47)
0.035 (0.80)
0.055 (1.29)
0.045 (0.83)
0.064 (1.13)
0.052 (1.57)
Reached 10th Grade Without Repetition
0.083 (1.21)
0.073 (0.94)
0.148 (1.79)
0.010 (0.12)
0.040 (0.70)
0.099 (1.37)
0.023 (0.30)
0.099 (1.34)
0.159 (1.70)
0.175 (1.80)
0.023 (0.28)
0.067 (1.20)
Reached 11th Grade Without Repetition
0.063 (0.94)
0.061 (0.82)
0.169 (2.21)
0.080 (0.96)
0.097 (1.69)
0.054 (0.69)
-0.033 (-0.47)
0.081 (1.08)
0.150 (1.74)
0.211 (2.34)
0.075 (0.87)
0.121 (2.16)
Reached 12th Grade Without Repetition
0.037 (0.56)
0.069 (0.98)
0.163 (2.20)
0.055 (0.67)
0.090 (1.67)
0.021 (0.27)
-0.030 (-0.43)
0.072 (0.94)
0.144 (1.73)
0.220 (2.38)
0.052 (0.61)
0.117 (2.21)
Dropped Out Before
Completing 12th Grade
0.007 (0.31)
-0.011 (-0.36)
-0.003 (-0.11)
-0.081 (-3.59)
-0.040 (-1.71)
0.048 (1.55)
0.004 (0.15)
0.018 (0.51)
0.014 (0.48)
-0.041 (-0.86)
-0.078 (-3.28)
-0.049 (-2.15)
Passing High School Matriculation Exams
-0.079 (-1.82)
-0.052 (-0.98)
0.058 (1.03)
-0.007 (-0.11)
0.082 (2.10)
-0.085 (-1.66)
-0.075 (-1.57)
-0.021 (-0.32)
0.013 (0.23)
0.101 (1.20)
0.001 (0.01)
0.071 (1.94)
Quality of High School
Attended a, b
0.034 (1.03)
0.013 (0.37)
0.124 (2.82)
0.032 (0.92)
0.067 (2.33)
0.010 (0.29)
0.033 (0.75)
-0.020 (-0.51)
0.101 (2.08)
0.087 (1.40)
0.025 (0.68)
0.062 (2.30)
Notes: The entries in the Table represent the marginal effects of the relevant measure of school quality on high school outcomes. Robust z-statistics (adjusted for clustering) for the underlying probit coefficients in parentheses. For the full list of control variables, see the Notes to Table 4. a: Measured by the average matriculation rate in between 1996 and 1998 in the high school attended. b: Coefficient on the 1991 test score from a linear regression model. Robust t-statistic in parenthesis. The sample includes only students who ever attended high school (451 observations).
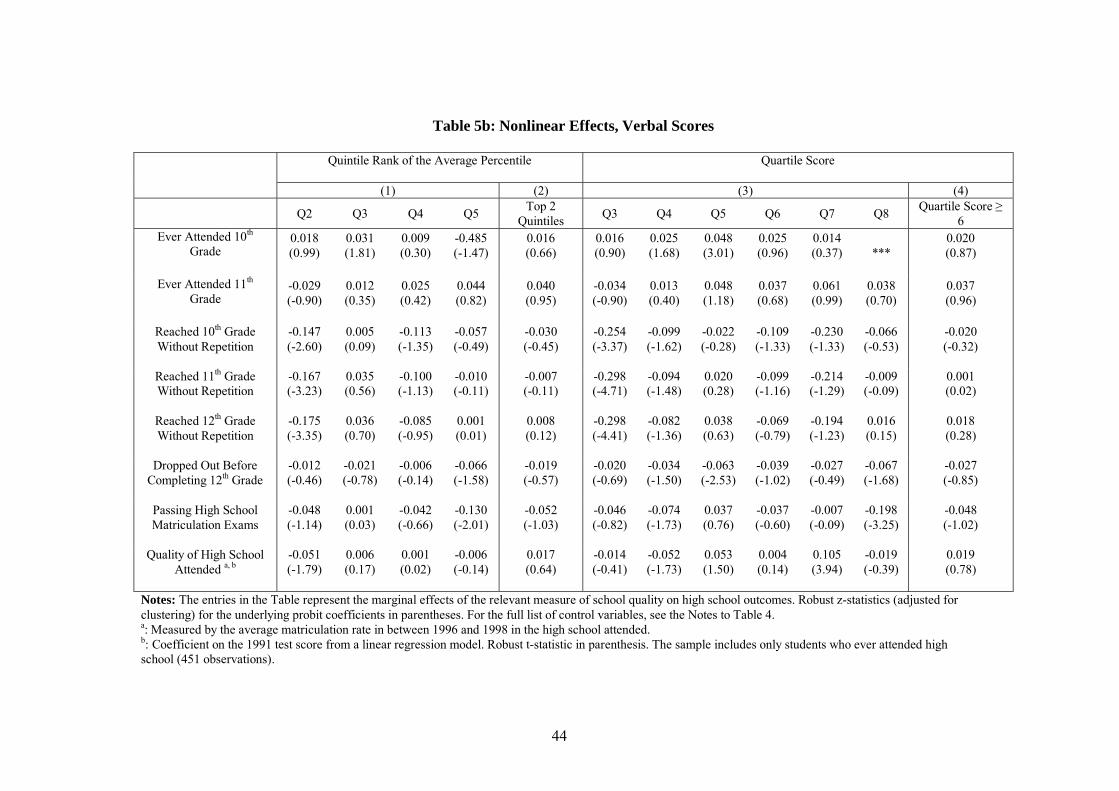
44
Table 5b: Nonlinear Effects, Verbal Scores
Quintile Rank of the Average Percentile
Quartile Score
(1) (2) (3) (4)
Q2 Q3 Q4 Q5 Top 2 Quintiles Q3 Q4 Q5 Q6 Q7 Q8 Quartile Score ≥
6 Ever Attended 10th
Grade
0.018 (0.99)
0.031 (1.81)
0.009 (0.30)
-0.485 (-1.47)
0.016 (0.66)
0.016 (0.90)
0.025 (1.68)
0.048 (3.01)
0.025 (0.96)
0.014 (0.37)
***
0.020 (0.87)
Ever Attended 11th
Grade
-0.029 (-0.90)
0.012 (0.35)
0.025 (0.42)
0.044 (0.82)
0.040 (0.95)
-0.034 (-0.90)
0.013 (0.40)
0.048 (1.18)
0.037 (0.68)
0.061 (0.99)
0.038 (0.70)
0.037 (0.96)
Reached 10th Grade Without Repetition
-0.147 (-2.60)
0.005 (0.09)
-0.113 (-1.35)
-0.057 (-0.49)
-0.030 (-0.45)
-0.254 (-3.37)
-0.099 (-1.62)
-0.022 (-0.28)
-0.109 (-1.33)
-0.230 (-1.33)
-0.066 (-0.53)
-0.020 (-0.32)
Reached 11th Grade Without Repetition
-0.167 (-3.23)
0.035 (0.56)
-0.100 (-1.13)
-0.010 (-0.11)
-0.007 (-0.11)
-0.298 (-4.71)
-0.094 (-1.48)
0.020 (0.28)
-0.099 (-1.16)
-0.214 (-1.29)
-0.009 (-0.09)
0.001 (0.02)
Reached 12th Grade Without Repetition
-0.175 (-3.35)
0.036 (0.70)
-0.085 (-0.95)
0.001 (0.01)
0.008 (0.12)
-0.298 (-4.41)
-0.082 (-1.36)
0.038 (0.63)
-0.069 (-0.79)
-0.194 (-1.23)
0.016 (0.15)
0.018 (0.28)
Dropped Out Before
Completing 12th Grade
-0.012 (-0.46)
-0.021 (-0.78)
-0.006 (-0.14)
-0.066 (-1.58)
-0.019 (-0.57)
-0.020 (-0.69)
-0.034 (-1.50)
-0.063 (-2.53)
-0.039 (-1.02)
-0.027 (-0.49)
-0.067 (-1.68)
-0.027 (-0.85)
Passing High School Matriculation Exams
-0.048 (-1.14)
0.001 (0.03)
-0.042 (-0.66)
-0.130 (-2.01)
-0.052 (-1.03)
-0.046 (-0.82)
-0.074 (-1.73)
0.037 (0.76)
-0.037 (-0.60)
-0.007 (-0.09)
-0.198 (-3.25)
-0.048 (-1.02)
Quality of High School
Attended a, b
-0.051 (-1.79)
0.006 (0.17)
0.001 (0.02)
-0.006 (-0.14)
0.017 (0.64)
-0.014 (-0.41)
-0.052 (-1.73)
0.053 (1.50)
0.004 (0.14)
0.105 (3.94)
-0.019 (-0.39)
0.019 (0.78)
Notes: The entries in the Table represent the marginal effects of the relevant measure of school quality on high school outcomes. Robust z-statistics (adjusted for clustering) for the underlying probit coefficients in parentheses. For the full list of control variables, see the Notes to Table 4. a: Measured by the average matriculation rate in between 1996 and 1998 in the high school attended. b: Coefficient on the 1991 test score from a linear regression model. Robust t-statistic in parenthesis. The sample includes only students who ever attended high school (451 observations).
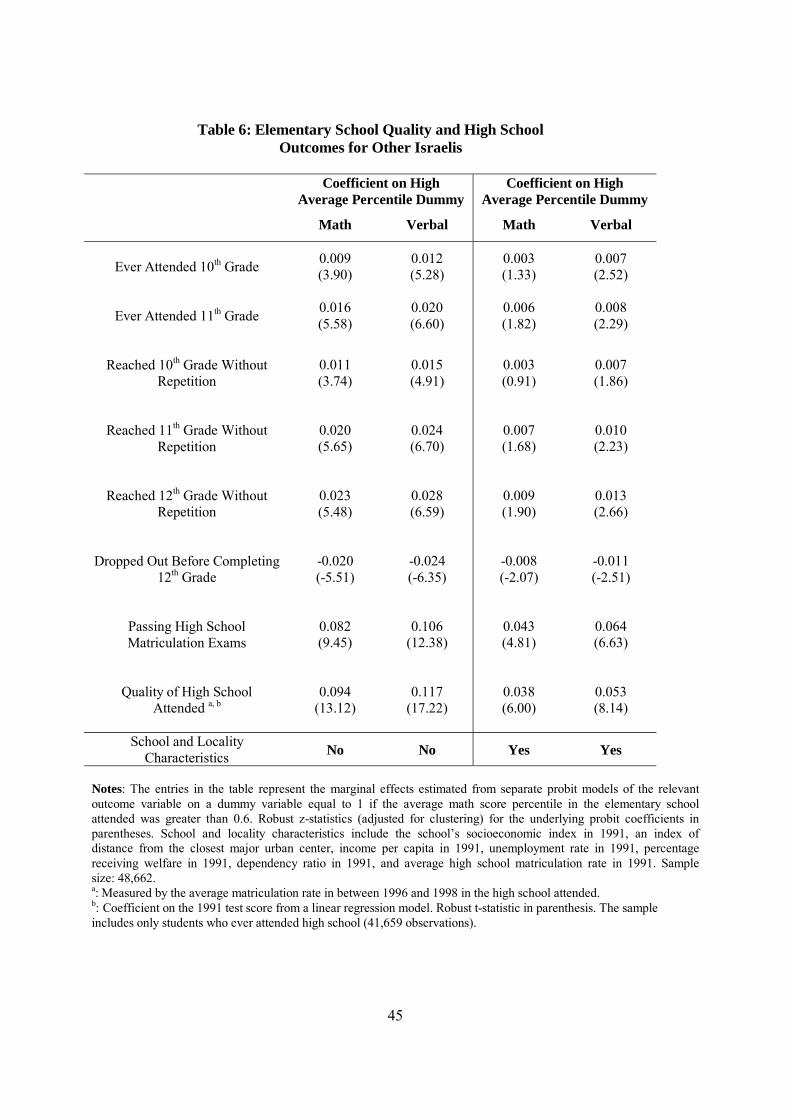
45
Table 6: Elementary School Quality and High School Outcomes for Other Israelis
Coefficient on High
Average Percentile Dummy Coefficient on High
Average Percentile Dummy
Math Verbal Math Verbal
Ever Attended 10th Grade
0.009 (3.90)
0.012 (5.28)
0.003 (1.33)
0.007 (2.52)
Ever Attended 11th Grade
0.016 (5.58)
0.020 (6.60)
0.006 (1.82)
0.008 (2.29)
Reached 10th Grade Without
Repetition
0.011 (3.74)
0.015 (4.91)
0.003 (0.91)
0.007 (1.86)
Reached 11th Grade Without
Repetition
0.020 (5.65)
0.024 (6.70)
0.007 (1.68)
0.010 (2.23)
Reached 12th Grade Without
Repetition
0.023 (5.48)
0.028 (6.59)
0.009 (1.90)
0.013 (2.66)
Dropped Out Before Completing
12th Grade
-0.020 (-5.51)
-0.024 (-6.35)
-0.008 (-2.07)
-0.011 (-2.51)
Passing High School Matriculation Exams
0.082 (9.45)
0.106 (12.38)
0.043 (4.81)
0.064 (6.63)
Quality of High School
Attended a, b
0.094 (13.12)
0.117 (17.22)
0.038 (6.00)
0.053 (8.14)
School and Locality Characteristics No No Yes Yes
Notes: The entries in the table represent the marginal effects estimated from separate probit models of the relevant outcome variable on a dummy variable equal to 1 if the average math score percentile in the elementary school attended was greater than 0.6. Robust z-statistics (adjusted for clustering) for the underlying probit coefficients in parentheses. School and locality characteristics include the school�s socioeconomic index in 1991, an index of distance from the closest major urban center, income per capita in 1991, unemployment rate in 1991, percentage receiving welfare in 1991, dependency ratio in 1991, and average high school matriculation rate in 1991. Sample size: 48,662. a: Measured by the average matriculation rate in between 1996 and 1998 in the high school attended. b: Coefficient on the 1991 test score from a linear regression model. Robust t-statistic in parenthesis. The sample includes only students who ever attended high school (41,659 observations).
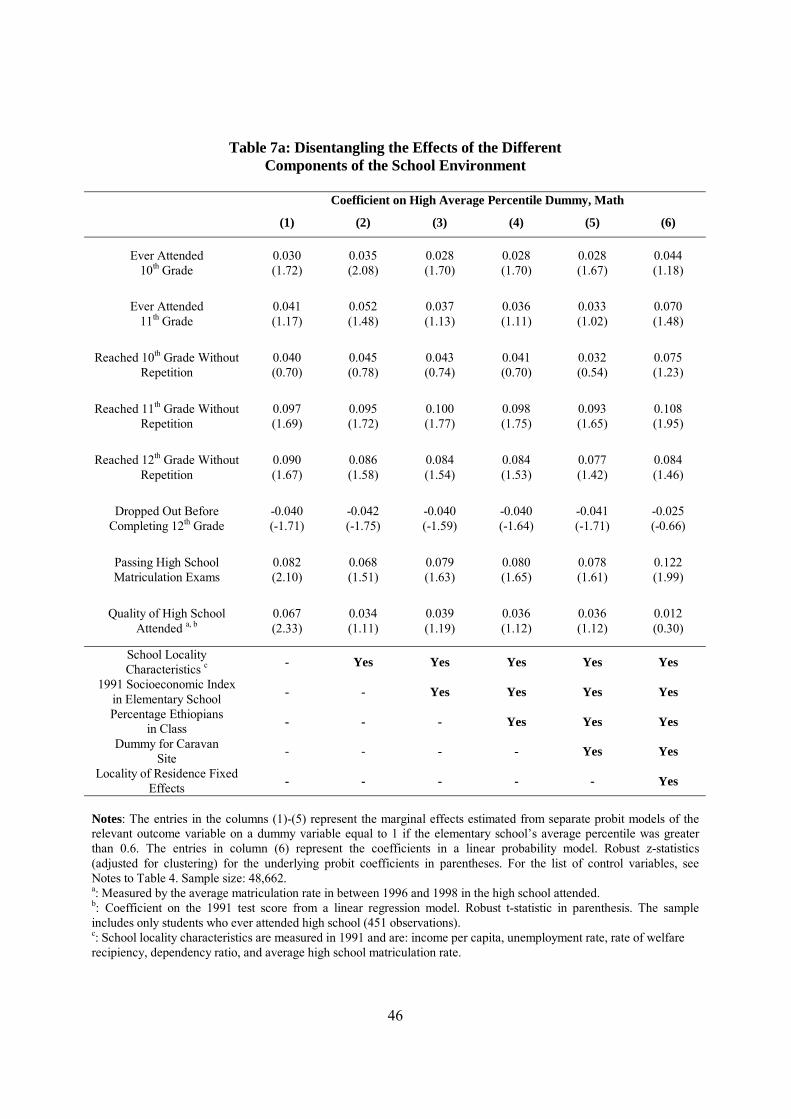
46
Table 7a: Disentangling the Effects of the Different
Components of the School Environment
Coefficient on High Average Percentile Dummy, Math
(1) (2) (3) (4) (5) (6)
Ever Attended 10th Grade
0.030 (1.72)
0.035 (2.08)
0.028 (1.70)
0.028 (1.70)
0.028 (1.67)
0.044 (1.18)
Ever Attended 11th Grade
0.041 (1.17)
0.052 (1.48)
0.037 (1.13)
0.036 (1.11)
0.033 (1.02)
0.070 (1.48)
Reached 10th Grade Without Repetition
0.040 (0.70)
0.045 (0.78)
0.043 (0.74)
0.041 (0.70)
0.032 (0.54)
0.075 (1.23)
Reached 11th Grade Without Repetition
0.097 (1.69)
0.095 (1.72)
0.100 (1.77)
0.098 (1.75)
0.093 (1.65)
0.108 (1.95)
Reached 12th Grade Without Repetition
0.090 (1.67)
0.086 (1.58)
0.084 (1.54)
0.084 (1.53)
0.077 (1.42)
0.084 (1.46)
Dropped Out Before Completing 12th Grade
-0.040 (-1.71)
-0.042 (-1.75)
-0.040 (-1.59)
-0.040 (-1.64)
-0.041 (-1.71)
-0.025 (-0.66)
Passing High School Matriculation Exams
0.082 (2.10)
0.068 (1.51)
0.079 (1.63)
0.080 (1.65)
0.078 (1.61)
0.122 (1.99)
Quality of High School Attended a, b
0.067 (2.33)
0.034 (1.11)
0.039 (1.19)
0.036 (1.12)
0.036 (1.12)
0.012 (0.30)
School Locality Characteristics c - Yes Yes Yes Yes Yes
1991 Socioeconomic Index in Elementary School - - Yes Yes Yes Yes
Percentage Ethiopians in Class - - - Yes Yes Yes
Dummy for Caravan Site - - - - Yes Yes
Locality of Residence Fixed Effects - - - - - Yes
Notes: The entries in the columns (1)-(5) represent the marginal effects estimated from separate probit models of the relevant outcome variable on a dummy variable equal to 1 if the elementary school�s average percentile was greater than 0.6. The entries in column (6) represent the coefficients in a linear probability model. Robust z-statistics (adjusted for clustering) for the underlying probit coefficients in parentheses. For the list of control variables, see Notes to Table 4. Sample size: 48,662. a: Measured by the average matriculation rate in between 1996 and 1998 in the high school attended. b: Coefficient on the 1991 test score from a linear regression model. Robust t-statistic in parenthesis. The sample includes only students who ever attended high school (451 observations). c: School locality characteristics are measured in 1991 and are: income per capita, unemployment rate, rate of welfare recipiency, dependency ratio, and average high school matriculation rate.
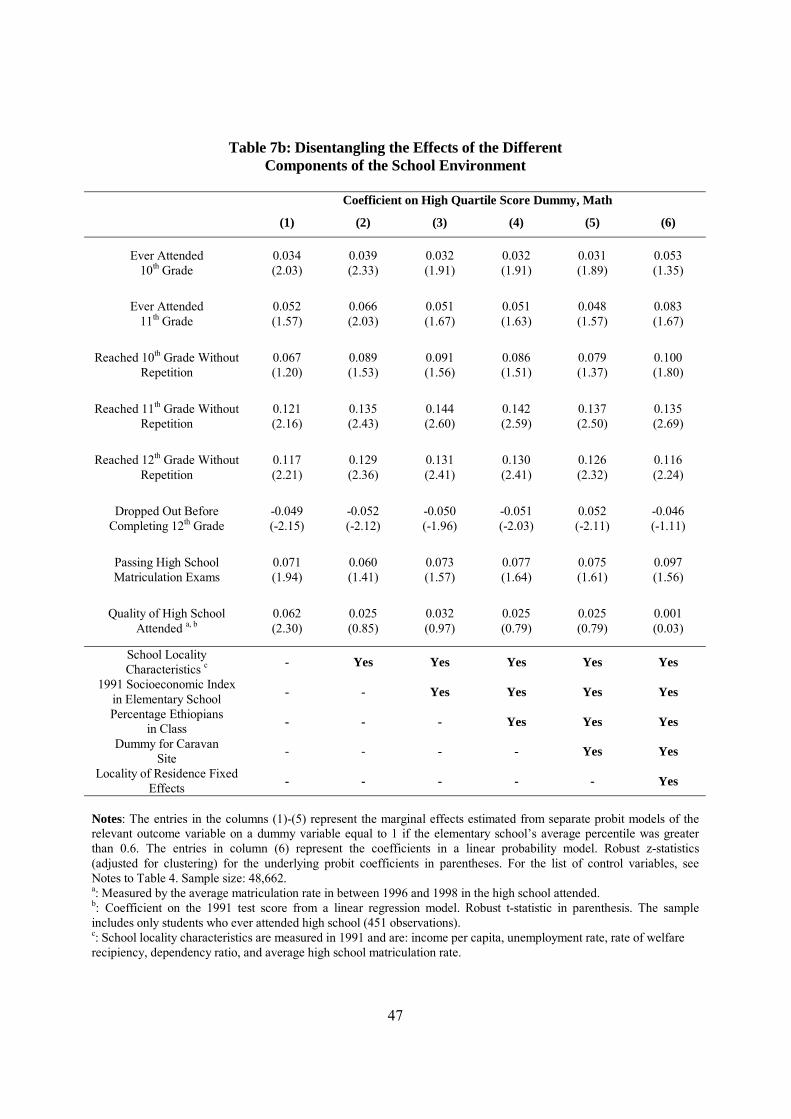
47
Table 7b: Disentangling the Effects of the Different
Components of the School Environment
Coefficient on High Quartile Score Dummy, Math
(1) (2) (3) (4) (5) (6)
Ever Attended 10th Grade
0.034 (2.03)
0.039 (2.33)
0.032 (1.91)
0.032 (1.91)
0.031 (1.89)
0.053 (1.35)
Ever Attended 11th Grade
0.052 (1.57)
0.066 (2.03)
0.051 (1.67)
0.051 (1.63)
0.048 (1.57)
0.083 (1.67)
Reached 10th Grade Without Repetition
0.067 (1.20)
0.089 (1.53)
0.091 (1.56)
0.086 (1.51)
0.079 (1.37)
0.100 (1.80)
Reached 11th Grade Without Repetition
0.121 (2.16)
0.135 (2.43)
0.144 (2.60)
0.142 (2.59)
0.137 (2.50)
0.135 (2.69)
Reached 12th Grade Without Repetition
0.117 (2.21)
0.129 (2.36)
0.131 (2.41)
0.130 (2.41)
0.126 (2.32)
0.116 (2.24)
Dropped Out Before Completing 12th Grade
-0.049 (-2.15)
-0.052 (-2.12)
-0.050 (-1.96)
-0.051 (-2.03)
0.052 (-2.11)
-0.046 (-1.11)
Passing High School Matriculation Exams
0.071 (1.94)
0.060 (1.41)
0.073 (1.57)
0.077 (1.64)
0.075 (1.61)
0.097 (1.56)
Quality of High School Attended a, b
0.062 (2.30)
0.025 (0.85)
0.032 (0.97)
0.025 (0.79)
0.025 (0.79)
0.001 (0.03)
School Locality Characteristics c - Yes Yes Yes Yes Yes
1991 Socioeconomic Index in Elementary School - - Yes Yes Yes Yes
Percentage Ethiopians in Class - - - Yes Yes Yes
Dummy for Caravan Site - - - - Yes Yes
Locality of Residence Fixed Effects - - - - - Yes
Notes: The entries in the columns (1)-(5) represent the marginal effects estimated from separate probit models of the relevant outcome variable on a dummy variable equal to 1 if the elementary school�s average percentile was greater than 0.6. The entries in column (6) represent the coefficients in a linear probability model. Robust z-statistics (adjusted for clustering) for the underlying probit coefficients in parentheses. For the list of control variables, see Notes to Table 4. Sample size: 48,662. a: Measured by the average matriculation rate in between 1996 and 1998 in the high school attended. b: Coefficient on the 1991 test score from a linear regression model. Robust t-statistic in parenthesis. The sample includes only students who ever attended high school (451 observations). c: School locality characteristics are measured in 1991 and are: income per capita, unemployment rate, rate of welfare recipiency, dependency ratio, and average high school matriculation rate.
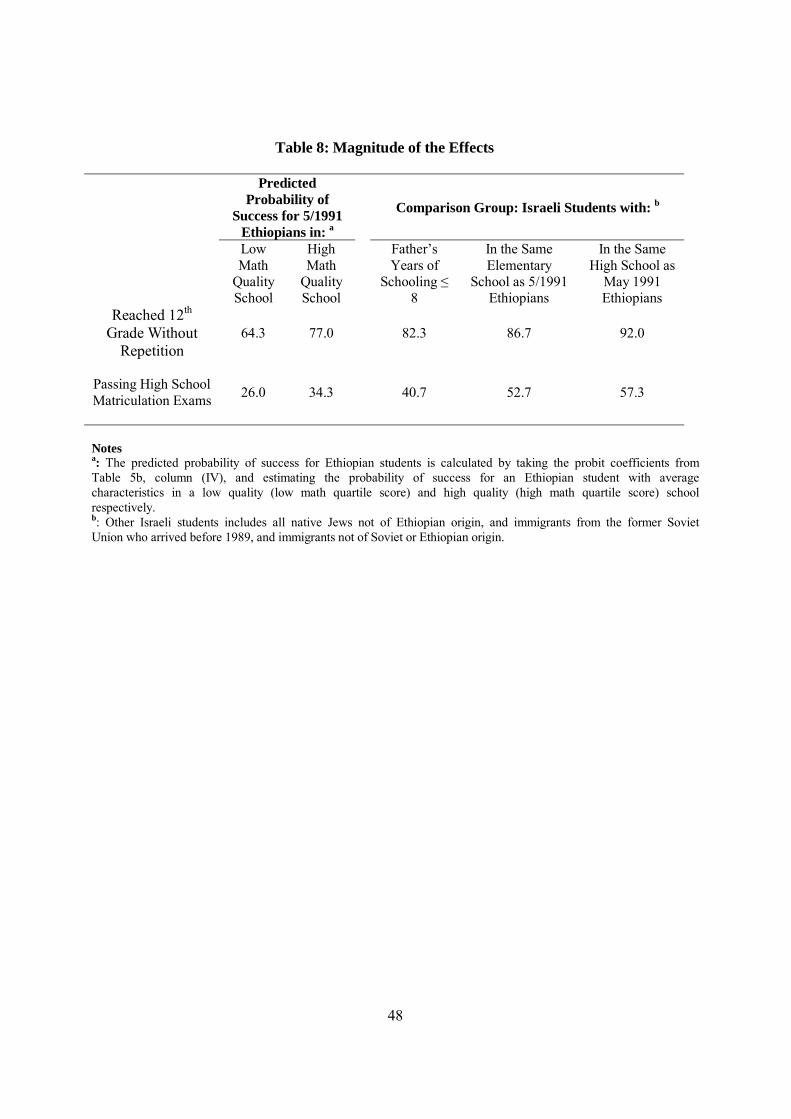
48
Table 8: Magnitude of the Effects
Predicted
Probability of Success for 5/1991
Ethiopians in: a
Comparison Group: Israeli Students with: b
Low Math
Quality School
High Math
Quality School
Father�s Years of
Schooling ≤ 8
In the Same Elementary
School as 5/1991 Ethiopians
In the Same High School as
May 1991 Ethiopians
Reached 12th Grade Without
Repetition 64.3 77.0
82.3 86.7 92.0
Passing High School Matriculation Exams
26.0 34.3
40.7 52.7 57.3
Notes a: The predicted probability of success for Ethiopian students is calculated by taking the probit coefficients from Table 5b, column (IV), and estimating the probability of success for an Ethiopian student with average characteristics in a low quality (low math quartile score) and high quality (high math quartile score) school respectively. b: Other Israeli students includes all native Jews not of Ethiopian origin, and immigrants from the former Soviet Union who arrived before 1989, and immigrants not of Soviet or Ethiopian origin.
49
Appendix A: The disparity between the old and new home environment Disparities in the social and economic environments between Ethiopia and Israel were still very
dramatic in 1990. The gap in GNP per capita was in a factor of 90, though only of 31 where the
comparison is in terms of purchasing power parity (Table A1 in the appendix). The gap in (1990)
mean years of schooling of the population is also quite dramatic, 8.8 in Israel versus 1.0 in
Ethiopia. The health indicators reveal wide disparities in health status of the two countries
populations. For example infant mortality in Ethiopia in 1990 (132) was thirteen times larger than
in Israel (10) at the same year. Demographically, the Ethiopian community is comparatively
young: over 50 per cent are aged eighteen or under. The community also contains a high
percentage of both one-parent families (27 per cent) and large households with six or more
members.
These differences between the two countries might be very relevant for the initial
transition to life in Israel and, in the context of this paper, for the potential effect of school quality
on learning of pupils who are not accustomed at all to western style schooling.
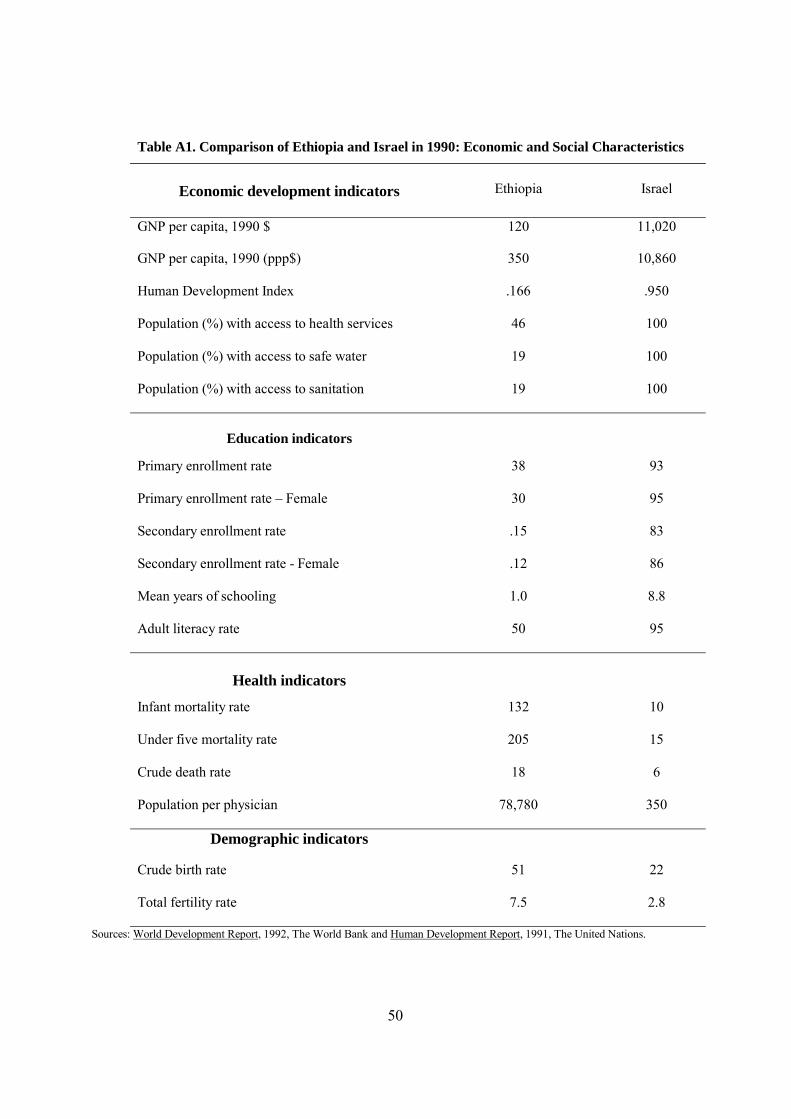
50
Table A1. Comparison of Ethiopia and Israel in 1990: Economic and Social Characteristics
Economic development indicators
Ethiopia
Israel
GNP per capita, 1990 $ 120 11,020
GNP per capita, 1990 (ppp$) 350
10,860
Human Development Index .166 .950
Population (%) with access to health services 46 100
Population (%) with access to safe water 19 100
Population (%) with access to sanitation 19 100
Education indicators
Primary enrollment rate 38 93
Primary enrollment rate � Female 30 95
Secondary enrollment rate .15
83
Secondary enrollment rate - Female .12 86
Mean years of schooling 1.0 8.8
Adult literacy rate 50 95
Health indicators
Infant mortality rate 132 10
Under five mortality rate 205 15
Crude death rate 18 6
Population per physician 78,780 350
Demographic indicators
Crude birth rate 51 22
Total fertility rate 7.5 2.8
Sources: World Development Report, 1992, The World Bank and Human Development Report, 1991, The United Nations.
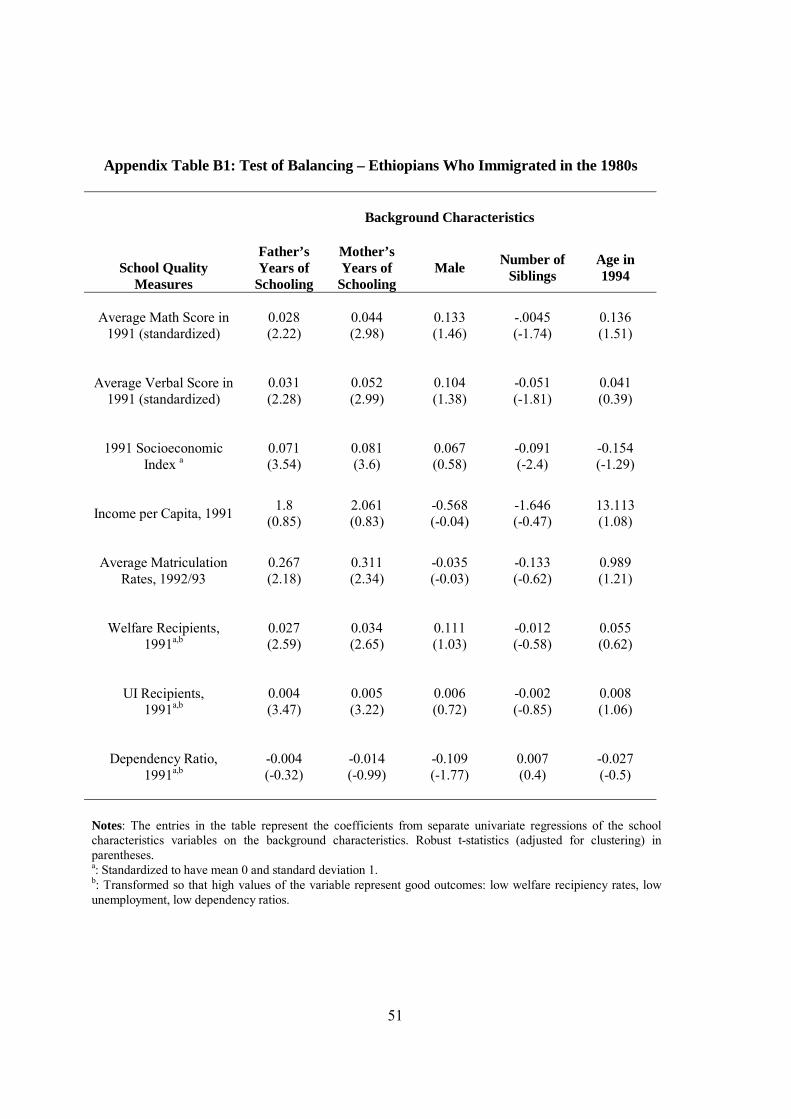
51
Appendix Table B1: Test of Balancing – Ethiopians Who Immigrated in the 1980s
Background Characteristics
School Quality Measures
Father’s Years of
Schooling
Mother’s Years of
Schooling Male Number of
Siblings Age in 1994
Average Math Score in
1991 (standardized)
0.028 (2.22)
0.044 (2.98)
0.133 (1.46)
-.0045 (-1.74)
0.136 (1.51)
Average Verbal Score in
1991 (standardized)
0.031 (2.28)
0.052 (2.99)
0.104 (1.38)
-0.051 (-1.81)
0.041 (0.39)
1991 Socioeconomic
Index a
0.071 (3.54)
0.081 (3.6)
0.067 (0.58)
-0.091 (-2.4)
-0.154 (-1.29)
Income per Capita, 1991
1.8 (0.85)
2.061 (0.83)
-0.568 (-0.04)
-1.646 (-0.47)
13.113 (1.08)
Average Matriculation
Rates, 1992/93
0.267 (2.18)
0.311 (2.34)
-0.035 (-0.03)
-0.133 (-0.62)
0.989 (1.21)
Welfare Recipients,
1991a,b
0.027 (2.59)
0.034 (2.65)
0.111 (1.03)
-0.012 (-0.58)
0.055 (0.62)
UI Recipients,
1991a,b
0.004 (3.47)
0.005 (3.22)
0.006 (0.72)
-0.002 (-0.85)
0.008 (1.06)
Dependency Ratio,
1991a,b
-0.004 (-0.32)
-0.014 (-0.99)
-0.109 (-1.77)
0.007 (0.4)
-0.027 (-0.5)
Notes: The entries in the table represent the coefficients from separate univariate regressions of the school characteristics variables on the background characteristics. Robust t-statistics (adjusted for clustering) in parentheses. a: Standardized to have mean 0 and standard deviation 1. b: Transformed so that high values of the variable represent good outcomes: low welfare recipiency rates, low unemployment, low dependency ratios.
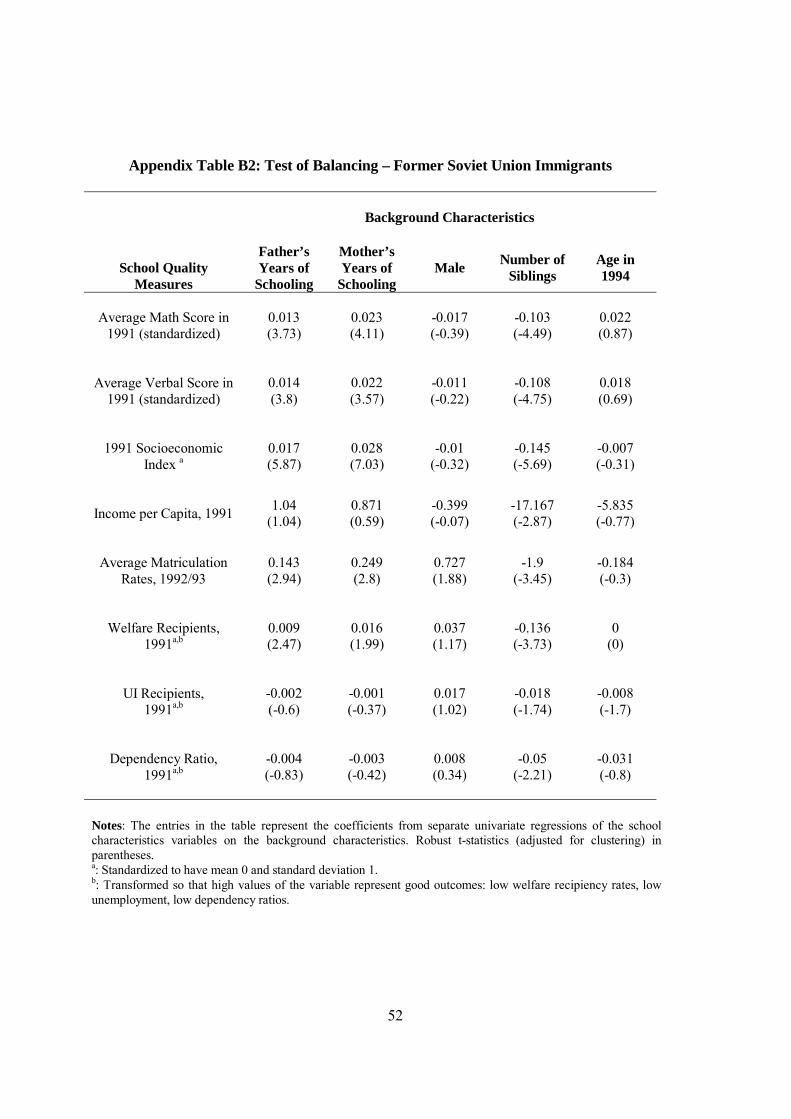
52
Appendix Table B2: Test of Balancing – Former Soviet Union Immigrants
Background Characteristics
School Quality Measures
Father’s Years of
Schooling
Mother’s Years of
Schooling Male Number of
Siblings Age in 1994
Average Math Score in
1991 (standardized)
0.013 (3.73)
0.023 (4.11)
-0.017 (-0.39)
-0.103 (-4.49)
0.022 (0.87)
Average Verbal Score in
1991 (standardized)
0.014 (3.8)
0.022 (3.57)
-0.011 (-0.22)
-0.108 (-4.75)
0.018 (0.69)
1991 Socioeconomic
Index a
0.017 (5.87)
0.028 (7.03)
-0.01 (-0.32)
-0.145 (-5.69)
-0.007 (-0.31)
Income per Capita, 1991
1.04 (1.04)
0.871 (0.59)
-0.399 (-0.07)
-17.167 (-2.87)
-5.835 (-0.77)
Average Matriculation
Rates, 1992/93
0.143 (2.94)
0.249 (2.8)
0.727 (1.88)
-1.9 (-3.45)
-0.184 (-0.3)
Welfare Recipients,
1991a,b
0.009 (2.47)
0.016 (1.99)
0.037 (1.17)
-0.136 (-3.73)
0 (0)
UI Recipients,
1991a,b
-0.002 (-0.6)
-0.001 (-0.37)
0.017 (1.02)
-0.018 (-1.74)
-0.008 (-1.7)
Dependency Ratio,
1991a,b
-0.004 (-0.83)
-0.003 (-0.42)
0.008 (0.34)
-0.05 (-2.21)
-0.031 (-0.8)
Notes: The entries in the table represent the coefficients from separate univariate regressions of the school characteristics variables on the background characteristics. Robust t-statistics (adjusted for clustering) in parentheses. a: Standardized to have mean 0 and standard deviation 1. b: Transformed so that high values of the variable represent good outcomes: low welfare recipiency rates, low unemployment, low dependency ratios.
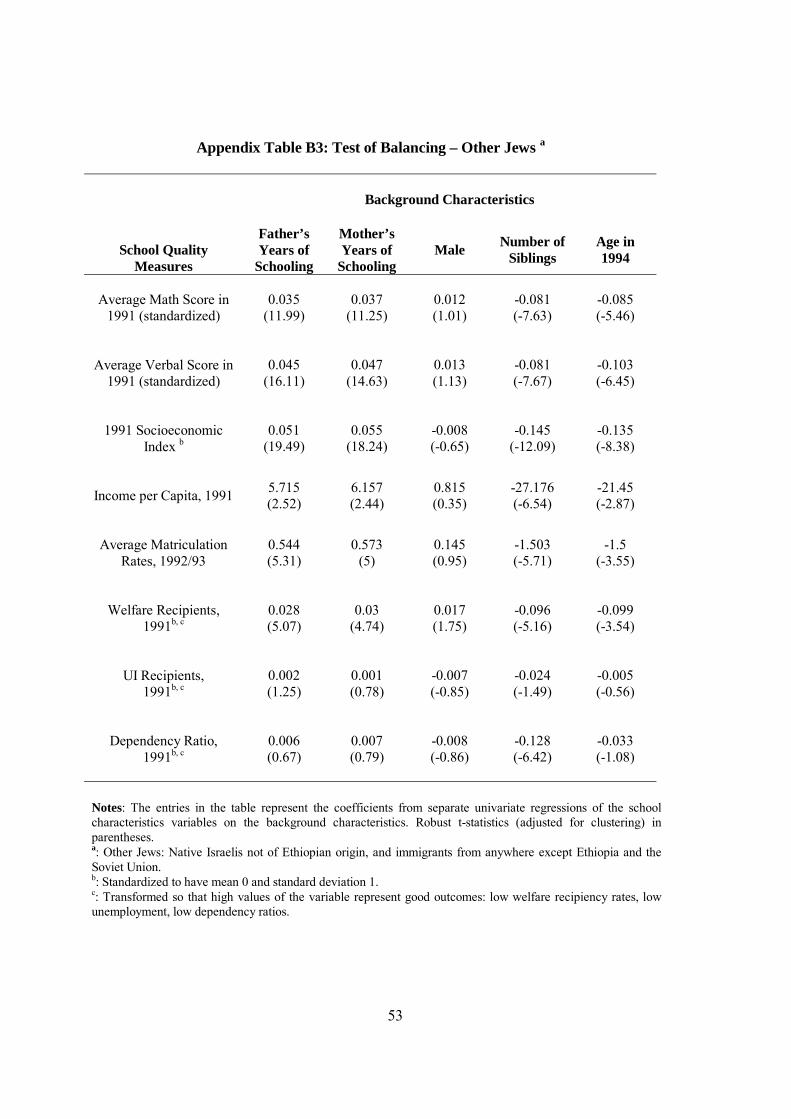
53
Appendix Table B3: Test of Balancing – Other Jews a
Background Characteristics
School Quality Measures
Father’s Years of
Schooling
Mother’s Years of
Schooling Male Number of
Siblings Age in 1994
Average Math Score in
1991 (standardized)
0.035 (11.99)
0.037 (11.25)
0.012 (1.01)
-0.081 (-7.63)
-0.085 (-5.46)
Average Verbal Score in
1991 (standardized)
0.045 (16.11)
0.047 (14.63)
0.013 (1.13)
-0.081 (-7.67)
-0.103 (-6.45)
1991 Socioeconomic
Index b
0.051 (19.49)
0.055 (18.24)
-0.008 (-0.65)
-0.145 (-12.09)
-0.135 (-8.38)
Income per Capita, 1991
5.715 (2.52)
6.157 (2.44)
0.815 (0.35)
-27.176 (-6.54)
-21.45 (-2.87)
Average Matriculation
Rates, 1992/93
0.544 (5.31)
0.573 (5)
0.145 (0.95)
-1.503 (-5.71)
-1.5 (-3.55)
Welfare Recipients,
1991b, c
0.028 (5.07)
0.03 (4.74)
0.017 (1.75)
-0.096 (-5.16)
-0.099 (-3.54)
UI Recipients,
1991b, c
0.002 (1.25)
0.001 (0.78)
-0.007 (-0.85)
-0.024 (-1.49)
-0.005 (-0.56)
Dependency Ratio,
1991b, c
0.006 (0.67)
0.007 (0.79)
-0.008 (-0.86)
-0.128 (-6.42)
-0.033 (-1.08)
Notes: The entries in the table represent the coefficients from separate univariate regressions of the school characteristics variables on the background characteristics. Robust t-statistics (adjusted for clustering) in parentheses. a: Other Jews: Native Israelis not of Ethiopian origin, and immigrants from anywhere except Ethiopia and the Soviet Union. b: Standardized to have mean 0 and standard deviation 1. c: Transformed so that high values of the variable represent good outcomes: low welfare recipiency rates, low unemployment, low dependency ratios.
Related Documents


