Immigrants’ Earnings and Workplace Characteristics * Anabela Carneiro Faculdade de Economia do Porto and CETE Nat´ ercia Fortuna Faculdade de Economia do Porto and CEMPRE Jos´ e Varej˜ ao Faculdade de Economia do Porto and CETE † January, 2006 Abstract This paper studys the determinants of earnings among foreign work- ers in Portugal. We use data from a matched employer-employee dataset that covers all wage-earners in the Portuguese economy. Despite the caveats inherent to the use of cross-sectional data, this type of dataset allows us to study the importance of the workplace as a determinant of the economic progress of immigrants. We find evidence of promotions being used to reallocate foreign workers within matches, indicating that occupational upgrading takes place with or without job switching. ”Eth- nic goods” in the workplace are also important determinants of immi- grants’ earnings. This result translates to the workplace the importance of ethnic concentration in residential areas previously documented in the literature. Quantile regression shows that the wage disadvantage of im- migrants varies enormously along the wage distribution (it is null at the right tail, and maximum at the 3 rd decile). At the left-tail of the wage distribution, foreign workers are effectively protected by minimum wage provisions. Returns to schooling and country-of-origin effects also vary along the wage distribution. Keywords: Immigrants’ earnings, quantile regression, matched employer- employee data JEL codes: J15, J24, J61. * We would like to thank the financialsupport from Funda¸ c˜ ao para a Ciˆ encia e a Tecnologia (Grant no. PIQS/ ECO/50044/2003). We also thank the Departamento de Estat´ ıstica do Minist´ erio do Trabalho that kindly allowed us to use the data. The usual disclaimer applies. † Corresponding author: Jos´ e Varej˜ ao, Faculdade de Economia, Universidade do Porto, Rua Dr Roberto Frias, 4200-464 Porto, Portugal. E-mail: [email protected]. Phone: 351-225571229

Welcome message from author
This document is posted to help you gain knowledge. Please leave a comment to let me know what you think about it! Share it to your friends and learn new things together.
Transcript
Immigrants’ Earnings and Workplace Characteristics ∗
Anabela CarneiroFaculdade de Economia do Porto and CETE
Natercia FortunaFaculdade de Economia do Porto and CEMPRE
Jose Varejao
Faculdade de Economia do Porto and CETE †
January, 2006
Abstract
This paper studys the determinants of earnings among foreign work-ers in Portugal. We use data from a matched employer-employee datasetthat covers all wage-earners in the Portuguese economy. Despite thecaveats inherent to the use of cross-sectional data, this type of datasetallows us to study the importance of the workplace as a determinant ofthe economic progress of immigrants. We find evidence of promotionsbeing used to reallocate foreign workers within matches, indicating thatoccupational upgrading takes place with or without job switching. ”Eth-nic goods” in the workplace are also important determinants of immi-grants’ earnings. This result translates to the workplace the importanceof ethnic concentration in residential areas previously documented in theliterature. Quantile regression shows that the wage disadvantage of im-migrants varies enormously along the wage distribution (it is null at theright tail, and maximum at the 3rd decile). At the left-tail of the wagedistribution, foreign workers are effectively protected by minimum wageprovisions. Returns to schooling and country-of-origin effects also varyalong the wage distribution.
Keywords: Immigrants’ earnings, quantile regression, matched employer-
employee data
JEL codes: J15, J24, J61.
∗We would like to thank the financial support from Fundacao para a Ciencia e a Tecnologia (Grant no. PIQS/ECO/50044/2003). We also thank the Departamento de Estatıstica do Ministerio do Trabalho that kindly allowedus to use the data. The usual disclaimer applies.
†Corresponding author: Jose Varejao, Faculdade de Economia, Universidade do Porto, Rua Dr Roberto Frias,4200-464 Porto, Portugal. E-mail: [email protected]. Phone: 351-225571229
1 Introduction
In the very heart of today’s immigration debate lies the question of how well
immigrants fare at destination. The answer to this question crucially determines
the social and economic consequences of immigration for receiving countries.
The comparison between successive cohorts of immigrants to the United States
unequivocally demonstated the importance of skills in the process of shaping the
economic performance of immigrants both in the immediate post-migration period
and over the long-run (see Borjas, 1999, e.g.). Yet, it is also well-know that human
capital accumulated at home, through schooling or labor market experience, in-
stantaneously looses value as individuals cross national borders. The magnitude of
this loss is significantly influenced by factors such as the economic and cultural sim-
ilarity between the source and destination countries (Chiswick, 1979). The larger
those differences are the more immigrants lack country-specific skills and informa-
tion which harms their immediate labor market prospects. Alone, lower returns
to foreign human capital were found to fully explain the earnings disadvantage
of immigrants as compared to those earned by similar native workers (Friedberg,
2000). The difficulty of finding jobs in high-skilled occupations leads high-skilled
immigrants to accept job offers in low skilled occupations, thereby magnifying the
depreciation of the human capital acquired at home.
Occupational downgrading may be optimal if combined with on-the-job search
which, with time, permits them to find better matches and receive higher wages
(Weiss et al., 2003). Mobility up the occupational ladder alongside with rising
returns to imported and local human capital are the three major sources of wage
growth for immigrants. The national origin of an individual’s human capital
(Friedberg, 2000), language skills (Chiswick and Miller, 2002), training and ex-
perience acquired locally (Cohen and Eckstein, 2002) and clustering into ethnic
enclaves (Borjas, 2000), all have been found to play a role in the process of eco-
nomic assimilation of immigrants. Yet, although it narrows over time, the wage
gap between immigrants and natives never closes completely (see Borjas, 1999, for
1
a review).
This paper is concerned with the analysis of the earnings of immigrants. We
focus on the case of immigrants into the Portuguese labor market. In the last
decades, Portugal which was, as other West European countries, a region of emi-
gration, turned to a net-immigration country. As that happened, the geographic
origin of immigrants to the country grew more and more diversified with increasing
numbers of people arriving from Eastern Europe or Asia.1 Yet, alongside with Ger-
many, Portugal is the European country where immigrants fare the best relative
to natives (Adsera and Chiswick, 2005).
The data we use come from a matched employer-employee dataset that contains
information on all wage-earners working in the private sector, 23,163 (or 1.1 percent
of the total) of which are non-national citizens. Comparing with the type of data
more commonly used in the study of the economic performance of immigrants, our
data has the advantage of permiting us to incorporate the characteristics of the
workplace in our study, while still being able to consider most (but no all) other
customary variables, the major exception being time since arrival in the country. 2
Among others, we are able to analyse the role of ethnic segregation at the workplace
level. The same reasons why we expect that residential segregation may have an
impact on wages are also valid for workplace segregation although the latter has not
been given the attention it might deserve. Within-match occupational upgrading
is also discussed and the probability of promotion of immigrants and natives are
studied.
The paper is outlined as follows. Section 2 describes the dataset. In section 3
an estimate of the wage disadvantage of immigrants is obtained and its variation
over the entire distribution of wages is analyzed - the importance of minimum
wage legislation at the left-tail of the distribution is ilustrated. In section 4 we
discuss the determinants of immigrants. Among other, ethnic concentration in the
1Portugal’s only experience as a region of immigration occured in the mid-1970s following the independenceof the country’s colonies in Africa (see Carrington and Lima, 1996).
2The importance of employer characteristics for earnings was documented before. Because we are using asingle cross-section we cannot avoid the ”cohort quality” issue and therefore we are not able identify separatelyage and cohort effects. See for example, Groshen (1990) or Abowd et al.(1999).
2
workplace is found to play a significant role. Quantile regression is used in section
5 to uncover changes in the effects of the covariates on the earnings of immigrants
over the wage distribution. Section 6 concludes.
2 The Data
The data set used in this study comes from Quadros de Pessoal (QP). QP is
an annual mandatory employment survey collected by the Portuguese Ministry of
Employment, that covers virtually all establishments with wage earners.3 Each
year every establishment with wage earners is legally obliged to fill in a standard-
ized questionnaire. By law, the questionnaire is made available to every worker
in a public space of the establishment. This requirement facilitates the work of
the services of the Ministry of Employment that monitor compliance of firms with
the law (e. g., illegal work). The administrative nature of the data and its public
availability implies a high degree of coverage and reliability.
Reported data cover the establishment itself (location, economic activity and
employment), the firm (location, economic activity, employment, sales and legal
framework) and each of its workers (gender, age, education, skill, occupation,
tenure, earnings and duration of work). The information on earnings is very com-
plete. It includes the base wage (gross pay for normal hours of work), seniority
payments, regular benefits, irregular benefits and overtime pay, as well as the
mechanism of wage bargaining. Information on normal and overtime hours of
work is also available. In fact, one of the main advantages of this data set is to
have information at both individual and firm level and to match workers with their
employers. Previous empirical research on immigrant wage gaps has been based on
individual or household data sets with little information on employers attributes.
Of course, this data set also has some disadvantages. The most important is
the impossibility to have information on a panel of individuals. Even though the
Ministry of Employment has been conducting this survey since 1982, the 2000
wave is the first one to collect information on worker’s nationality. Thus, in our
3Public administration and non-market services are excluded.
3
analysis we will use information solely for the year of 2000.
The QP file for 2000 includes 2,688,957 registers. We restricted our sample to
non-apatrid workers aged between 16-70 years. Thus, and after excluding those
observations with missing values on the explanatory variables and the outliers
in wages (1% top and bottom observations), we obtained a sample of 2,195,073
workers.4 Of this total, 23,163 do not have portuguese nationality and are classified
as immigrants. Table 1 presents the sample means for the two groups of workers:
immigrants and native-born workers. The sample means for the main groups of
immigrants in Portugal accordding to the area of origin are also reported. As
can be seen in Table 1, more than 40% of immigrant workers come from former
portuguese colonies such as Angola, Mozambique, Cape Verde, Guinea-Bissau,
Sao Tome & Prıncipe and East-Timor. Twenty-two percent are from some of the
former Soviet Union (Russia, Ukraine, Moldova and others), 16% from developed
countries (Western Europe, USA, Canada and Japan), 11% from Brasil and the
remainder 9% are from a wide range of countries 5
4 When a worker is present in the QP file for more than one time in 2000, the register in the plant in whichhe had worked a higher number of hours was selected.
5See Appendix 1 for the definition of nationalities’ groups.
4
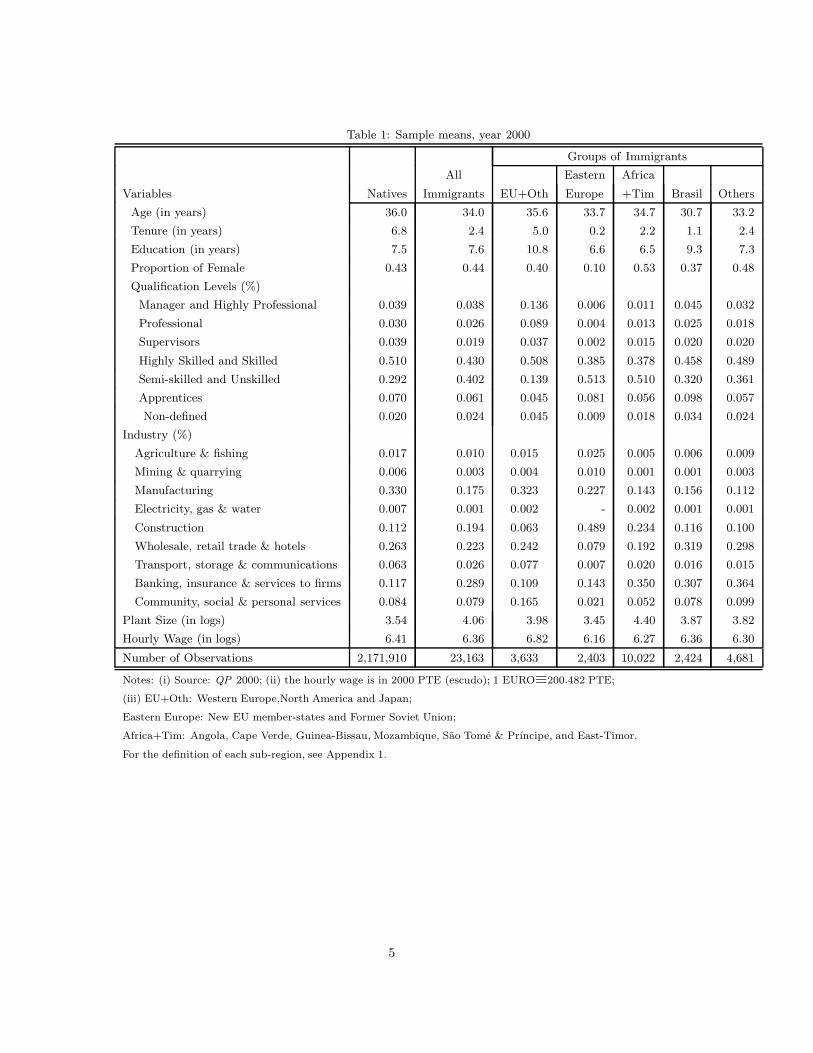
Table 1: Sample means, year 2000
Groups of Immigrants
All Eastern Africa
Variables Natives Immigrants EU+Oth Europe +Tim Brasil Others
Age (in years) 36.0 34.0 35.6 33.7 34.7 30.7 33.2
Tenure (in years) 6.8 2.4 5.0 0.2 2.2 1.1 2.4
Education (in years) 7.5 7.6 10.8 6.6 6.5 9.3 7.3
Proportion of Female 0.43 0.44 0.40 0.10 0.53 0.37 0.48
Qualification Levels (%)
Manager and Highly Professional 0.039 0.038 0.136 0.006 0.011 0.045 0.032
Professional 0.030 0.026 0.089 0.004 0.013 0.025 0.018
Supervisors 0.039 0.019 0.037 0.002 0.015 0.020 0.020
Highly Skilled and Skilled 0.510 0.430 0.508 0.385 0.378 0.458 0.489
Semi-skilled and Unskilled 0.292 0.402 0.139 0.513 0.510 0.320 0.361
Apprentices 0.070 0.061 0.045 0.081 0.056 0.098 0.057
Non-defined 0.020 0.024 0.045 0.009 0.018 0.034 0.024
Industry (%)
Agriculture & fishing 0.017 0.010 0.015 0.025 0.005 0.006 0.009
Mining & quarrying 0.006 0.003 0.004 0.010 0.001 0.001 0.003
Manufacturing 0.330 0.175 0.323 0.227 0.143 0.156 0.112
Electricity, gas & water 0.007 0.001 0.002 - 0.002 0.001 0.001
Construction 0.112 0.194 0.063 0.489 0.234 0.116 0.100
Wholesale, retail trade & hotels 0.263 0.223 0.242 0.079 0.192 0.319 0.298
Transport, storage & communications 0.063 0.026 0.077 0.007 0.020 0.016 0.015
Banking, insurance & services to firms 0.117 0.289 0.109 0.143 0.350 0.307 0.364
Community, social & personal services 0.084 0.079 0.165 0.021 0.052 0.078 0.099
Plant Size (in logs) 3.54 4.06 3.98 3.45 4.40 3.87 3.82
Hourly Wage (in logs) 6.41 6.36 6.82 6.16 6.27 6.36 6.30
Number of Observations 2,171,910 23,163 3,633 2,403 10,022 2,424 4,681
Notes: (i) Source: QP 2000; (ii) the hourly wage is in 2000 PTE (escudo); 1 EURO≡200.482 PTE;
(iii) EU+Oth: Western Europe,North America and Japan;
Eastern Europe: New EU member-states and Former Soviet Union;
Africa+Tim: Angola, Cape Verde, Guinea-Bissau, Mozambique, Sao Tome & Prıncipe, and East-Timor.
For the definition of each sub-region, see Appendix 1.
5
In general, immigrant workers are slightly younger, with lower tenure and qual-
ifications, but with approximately the same schooling as natives (7.5 years). Ed-
ucational attainment is highest for EU immigrants (10.8 years) and lowest for
those arriving from the Portuguese-spaking nations in Africa and from East-Timor
(Africa+Tim) (6.5 years). Average tenure among natives is 6.8 years, while it is
only 2.4 years for immigrants. 46 percent of all immigrants are, on average, em-
ployed in low skill occupations, compared to 36 percent of native workers. The
main exception are immigrants from Western Europe, U.S.A. and Japan for whom
that percentage does not exceed 18.5 percent.
Immigrants from the EU+Oth group have the highest hourly wages (6.82) -
even higher than those of portuguese natives (6.41) - while immigrants from other
regions have wages that are considerably lower than their native counterparts.
Concerning promotions, in 2000 immigrant workers were promoted at a higher rate
than their native counterparts (19.8 percent against 15.5 percent, on average).
More than one half of all immigrants from the EU+Oth group are employed
in the manufacturing and wholesale, retail trade & hotels sectors, whereas 62
percent of the Brazilian immigrants are employed in the wholesale, retail trade
& hotels sector and in the sub-sector of services supplied to firms.6 Immigrants
from Africa+Tim are also largely employed in the sub-sector of services supplied
to firms (more than 30 percent) and in construction (23.4 percent). About one
half of all immigrants from Eastern Europe are employed in the construction sector
(48.9 percent).
3 The earnings disadvantage of immigrants
The standard approach to the study of the earnings of immigrants is based on
the estimation of a human capital earnings function (Mincer, 1974) augmented
to include immigrants experience in the host labor market (Chiswick, 1978) and
whenever available some measure of the destination language fluency, minority
6In the one-digit sector of banking, insurance & services supplied to firms, 82 percent of the immigrant workersare employed in firms of temporary work and firms of cleaning services.
6
language concentration in residential areas and indicators of the country of origin
of the immigrant (e.g., Chiswick and Miller, 2002).
As explained before, the dataset we use is not without inconvenients the most
notorious being the lack of information about the year of arrival to Portugal for
which reason different cohorts are not separable. A few compromises have to be
made although we believe that none is too serious to cloud the interpretation of the
results we will look at. One such compromise consists in not distinguishing total
experience from experience acquired in the Portuguese labor market - we simply
use an age variable (and its square) as a proxy for total labor market experience,
independently of where that experience was accumulated.
The basic wage equation is defined as:
lnWi = β0 + β1Xi + β2Zij + εi (1),
where lnWi is the natural log of the average hourly wage for individual i, defined
as the ratio between the base wage and the total number of hours usually worked.
Xi is a vector of individual characteristics such as gender, immigrant status, age
(and its square), education levels, tenure (and its square) and qualification level.
Zij includes a set of firms’ characteristics such as size and industry. β0 is a constant
term and εi is a disturbance term with zero mean and constant variance.
The variable male takes the value one for males and zero for females. The
variable immigrant is a dummy variable for immigrant status (1 if immigrant; 0
otherwise). The variable age of the individual (and its square: age squared) is
measured in years. The variable tenure (and its square: tenure squared) is defined
as the number of years with the current employer. A set of dummies are used
for the education and qualification levels. Six categories are considered for the
education levels: less than preparatory (the omitted category), preparatory, lower
secondary, upper secondary, college and non-defined (a residual category). Seven
categories are defined for the qualification levels: manager and highly professional,
professional, supervisors, highly skilled and skilled, semi-skilled and unskilled, ap-
prentices (the omitted category) and non-defined (a residual category). Plant size
7
is defined as the natural log of total employment at the plant level. A set of
industry dummies (one-digit) are also included.7
The empirical analysis begins with the estimation of the earnings equation
for the sample of immigrants and natives pooled together (first column in Table
2). For the moment, our interest is on the coefficient of the immigrant status
variable. The corresponding estimate is −0.026. This simply says that immigrant
workers earn hourly wages which are inferior by approximately 2.6 percent than
those earned by similar native workers. This estimate is not directly comparable
with those available for other immigrants in other countries because we are not
conditioning on the duration of stay in the host country. However, considering the
fact that immigration to Portugal is recent, this result suggests that immigrants
do fare better in the Portuguese labor market than in other (European) countries
which is consistent with the results obtained by Adsera and Chiswick (2005) for
Portugal.8
7At one-digit level there are nine sectors according to the Portuguese Classification of Economic Activities(CAE). The omitted category is manufacturing.
8Using data from the European Community Household Panel, Adsera and Chiswick (2005) put the differencebetween immigrants’ earnings at arrival and natives in Portugal at -14.4 percent, the lowest they obtain for the15 European Union countries they consider.
8
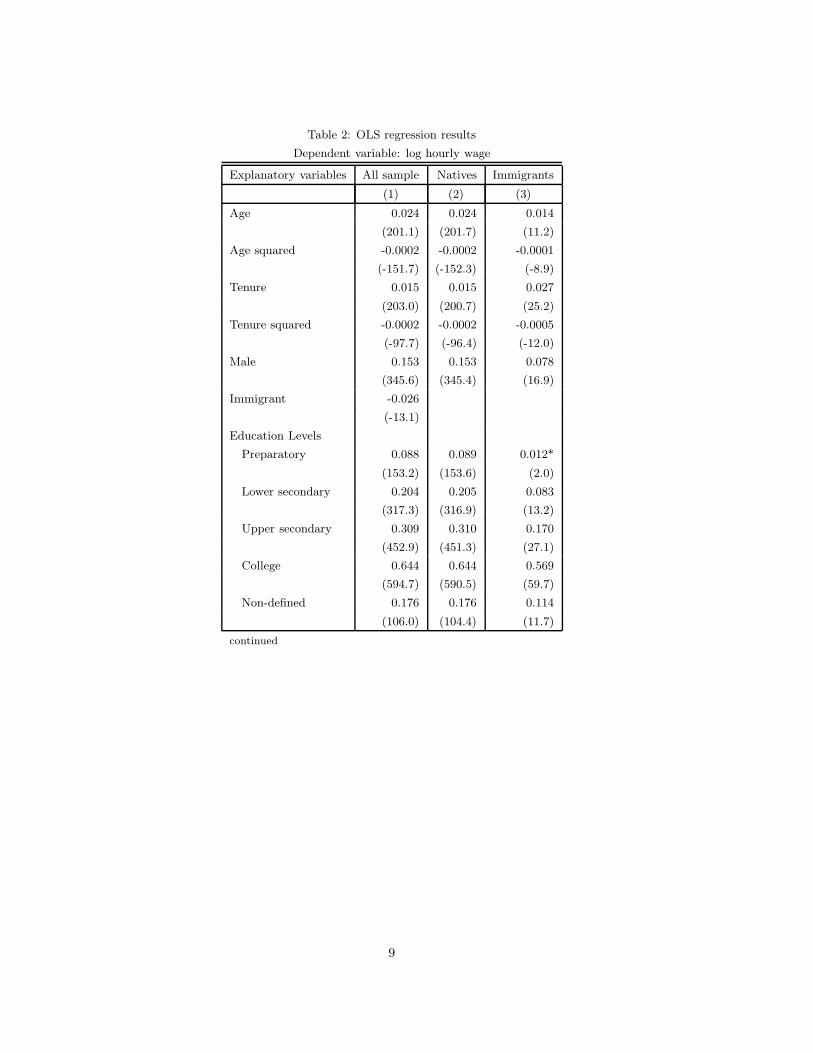
Table 2: OLS regression results
Dependent variable: log hourly wage
Explanatory variables All sample Natives Immigrants
(1) (2) (3)
Age 0.024 0.024 0.014
(201.1) (201.7) (11.2)
Age squared -0.0002 -0.0002 -0.0001
(-151.7) (-152.3) (-8.9)
Tenure 0.015 0.015 0.027
(203.0) (200.7) (25.2)
Tenure squared -0.0002 -0.0002 -0.0005
(-97.7) (-96.4) (-12.0)
Male 0.153 0.153 0.078
(345.6) (345.4) (16.9)
Immigrant -0.026
(-13.1)
Education Levels
Preparatory 0.088 0.089 0.012*
(153.2) (153.6) (2.0)
Lower secondary 0.204 0.205 0.083
(317.3) (316.9) (13.2)
Upper secondary 0.309 0.310 0.170
(452.9) (451.3) (27.1)
College 0.644 0.644 0.569
(594.7) (590.5) (59.7)
Non-defined 0.176 0.176 0.114
(106.0) (104.4) (11.7)
continued
9
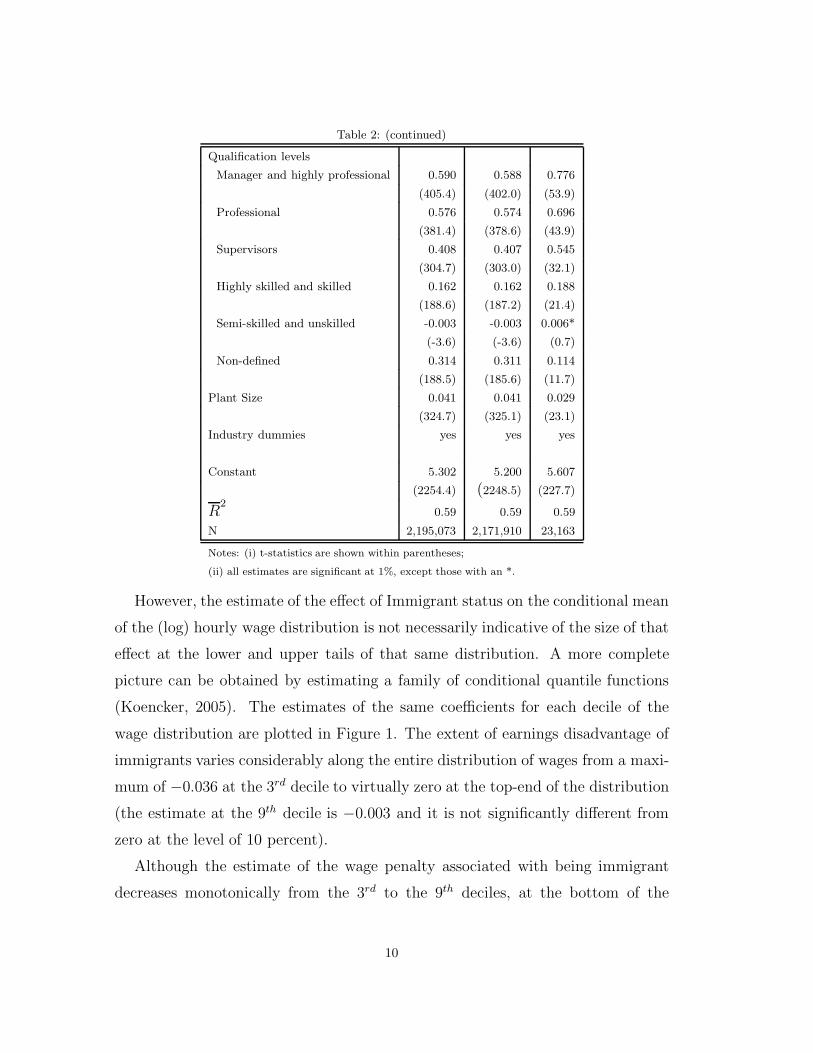
Table 2: (continued)
Qualification levels
Manager and highly professional 0.590 0.588 0.776
(405.4) (402.0) (53.9)
Professional 0.576 0.574 0.696
(381.4) (378.6) (43.9)
Supervisors 0.408 0.407 0.545
(304.7) (303.0) (32.1)
Highly skilled and skilled 0.162 0.162 0.188
(188.6) (187.2) (21.4)
Semi-skilled and unskilled -0.003 -0.003 0.006*
(-3.6) (-3.6) (0.7)
Non-defined 0.314 0.311 0.114
(188.5) (185.6) (11.7)
Plant Size 0.041 0.041 0.029
(324.7) (325.1) (23.1)
Industry dummies yes yes yes
Constant 5.302 5.200 5.607
(2254.4) (2248.5) (227.7)
R2
0.59 0.59 0.59
N 2,195,073 2,171,910 23,163
Notes: (i) t-statistics are shown within parentheses;
(ii) all estimates are significant at 1%, except those with an *.
However, the estimate of the effect of Immigrant status on the conditional mean
of the (log) hourly wage distribution is not necessarily indicative of the size of that
effect at the lower and upper tails of that same distribution. A more complete
picture can be obtained by estimating a family of conditional quantile functions
(Koencker, 2005). The estimates of the same coefficients for each decile of the
wage distribution are plotted in Figure 1. The extent of earnings disadvantage of
immigrants varies considerably along the entire distribution of wages from a maxi-
mum of −0.036 at the 3rd decile to virtually zero at the top-end of the distribution
(the estimate at the 9th decile is −0.003 and it is not significantly different from
zero at the level of 10 percent).
Although the estimate of the wage penalty associated with being immigrant
decreases monotonically from the 3rd to the 9th deciles, at the bottom of the
10
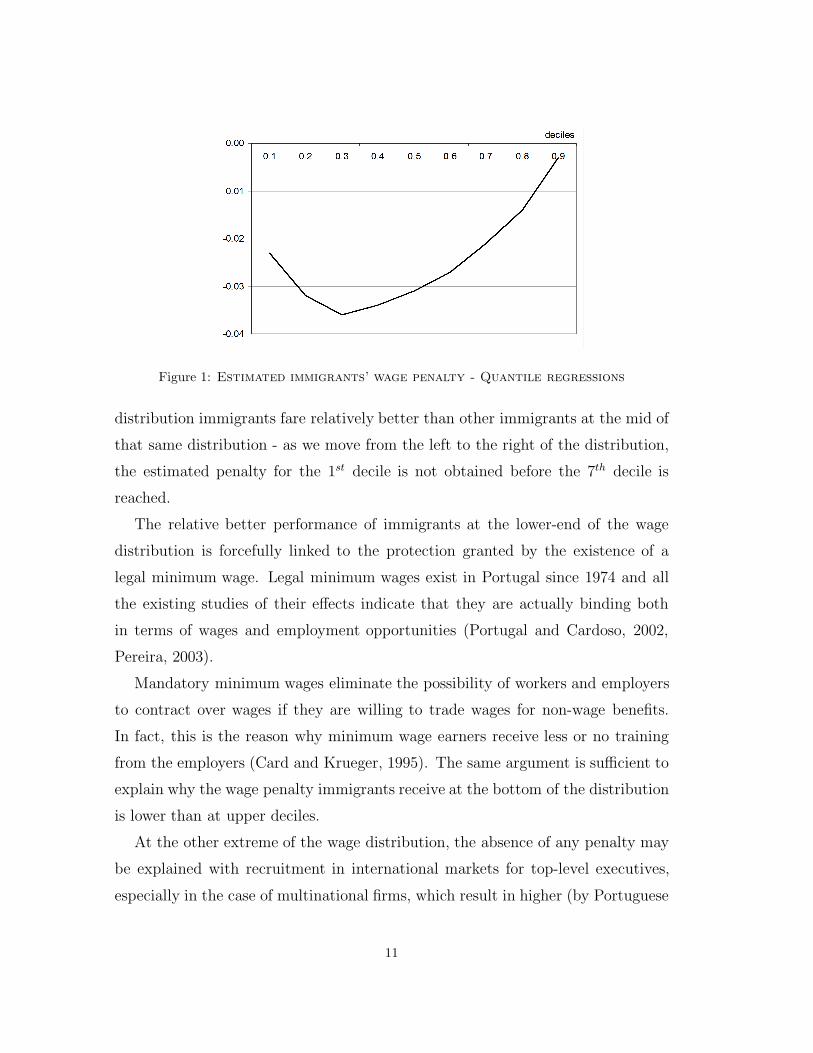
Figure 1: Estimated immigrants’ wage penalty - Quantile regressions
distribution immigrants fare relatively better than other immigrants at the mid of
that same distribution - as we move from the left to the right of the distribution,
the estimated penalty for the 1st decile is not obtained before the 7th decile is
reached.
The relative better performance of immigrants at the lower-end of the wage
distribution is forcefully linked to the protection granted by the existence of a
legal minimum wage. Legal minimum wages exist in Portugal since 1974 and all
the existing studies of their effects indicate that they are actually binding both
in terms of wages and employment opportunities (Portugal and Cardoso, 2002,
Pereira, 2003).
Mandatory minimum wages eliminate the possibility of workers and employers
to contract over wages if they are willing to trade wages for non-wage benefits.
In fact, this is the reason why minimum wage earners receive less or no training
from the employers (Card and Krueger, 1995). The same argument is sufficient to
explain why the wage penalty immigrants receive at the bottom of the distribution
is lower than at upper deciles.
At the other extreme of the wage distribution, the absence of any penalty may
be explained with recruitment in international markets for top-level executives,
especially in the case of multinational firms, which result in higher (by Portuguese
11
standards) wages being paid to foreign workers hired into high wage positions. The
choice between managerial expatriates and natives is one of the most researched
topics in the literature on the staffing practices of multinational companies. In
that context the design of compensation policies has the primary objective of pro-
moting international mobility among top cadres while guaranteeing equity within
the company (Bonache and Fernandez, 1997), both resulting in higher wages being
paid to expatriates (immigrants) than to native workers in similar positions. In
the aggregate, this is consistent with a smaller penalty associated with being an
immigrant at the top of the wage distribution, which is exactly what we found.
4 The determinants of earnings of immigrants and natives
4.1 Schooling and experience
To get a more clear picture of how each regressor in Equation 1 contributes to
the wages earned by immigrants and natives, Equation 1 was estimated using
two sub-samples corresponding to each worker group - natives and immigrants.
Results are displayed in the last two columns in Table 2. Conditionning on the
same set of regressors, we find that returns to age (experience) and schooling are
much lower among immigrants than they are among natives. Schooling, especially
at low and intermediate levels, is less valuable for immigrants even if we cannot
control for the duration of stay in the Portuguese labor market. Low returns
to schooling and experience, even considering the caveats involved, necessarily
means that immigrants into Portugal suffer huge losses in returns to human capital
accumulated in the country of origin. Differently put, human capital is imperfectly
transferable across nations, a result also noted by several authors (e.g., Friedberg,
2000, Eckstein and Weiss, 2003).
4.2 Tenure
On the contrary, returns to tenure are for immigrants almost twice as greater as
for natives - for the first year they spend with one employer, immigrants wages
rise by 2.65 percent (1.48 percent for natives). The fact that returns to tenure are
12
higher for immigrants than for natives with the same characteristics indicates that
part of the adverse consequences of forming less than adequate matches - occupa-
tional downgrading - are reversed within a short period and without further job
switching. This could be another consequence of the imperfect transferability of
human capital - the information content of schooling diplomas being reduced, em-
ployers hire immigrant workers into low-level positions and as information about
the true quality of the match becomes available they are promoted into higher
level positions (alternatively, their contracts are terminated). Occupational down-
grading is followed by occupational upgrading even within on-going employment
relationships and even if the motivation for immigrants to accept low-skilled jobs
is justified on the grounds of continuing (on-the-) job search efforts as suggested
by Weiss et al. (2003).
Another indication that immigrants move up the occupational ladder faster than
natives may be obtained from the analysis of employers’ promotion policies. To
do that we used the information contained in the dataset on the year of admission
and the year of last promotion of each worker still employed in 2000 (the only
year for which information on the nationality of the worker is available). To
avoid more serious selectivity problems that would result from sampling very long
employment relationships, we restricted our analysis to workers admited in 1999
and still employed in the same establishment in 2000.9 The final sample contains
140,441 workers (observations), 1,323 of which are immigrants. A probit model for
the probability of being promoted in the year 2000 was estimated on this sample.
Results are on Table 3.9Although this sampling plan may under-represent very short employment spells, the consequences for our
analysis are minor considering that we are only interested in the comparison of the probability of promotion forthe two groups of workers and the same restriction is imposed on the two datasets.
13

Table 3: Probit results
Dependent variable: prom=1 if promoted in 2000
Explanatory variables (1)
Age -0.028
(142.4)
Age squared 0.0002
(65.2)
Male -0.082
(103.4)
Immigrant 0.127
(11.6)
Education Levels
Preparatory 0.033
(7.86)
Lower secondary 0.132
(109.0)
Upper secondary 0.167
(167.9)
College 0.125
(45.1)
Non-defined 0.031*
(0.9)
14
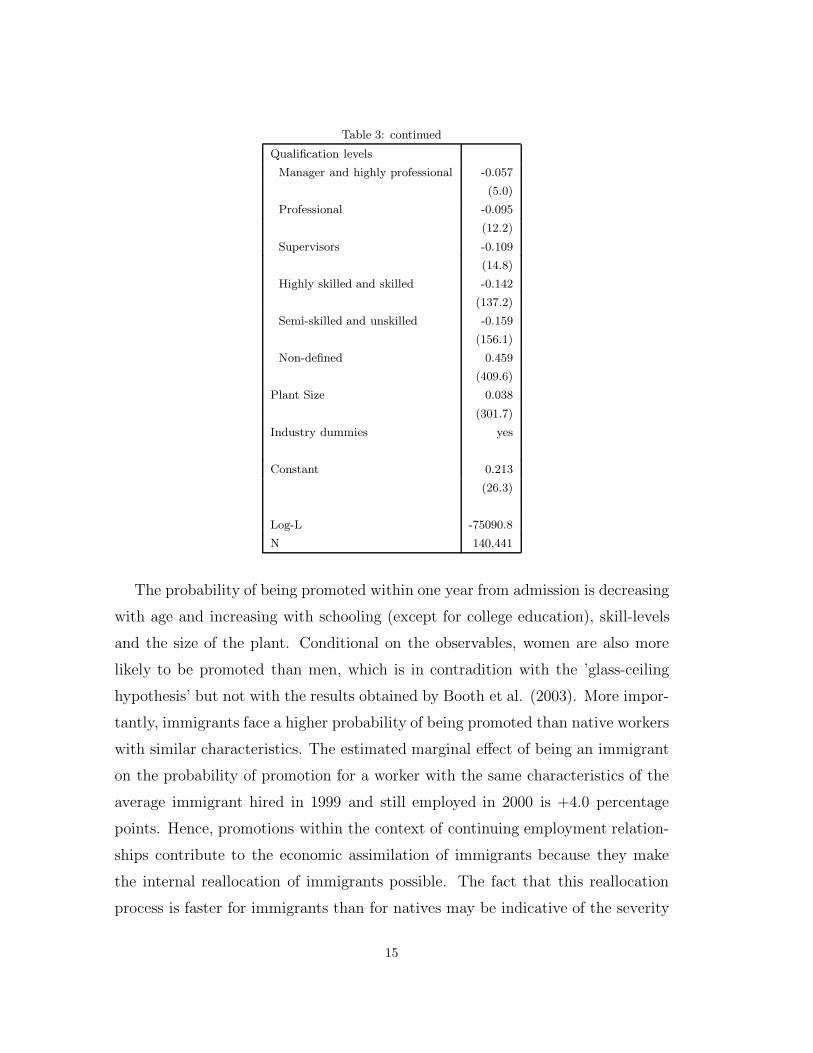
Table 3: continued
Qualification levels
Manager and highly professional -0.057
(5.0)
Professional -0.095
(12.2)
Supervisors -0.109
(14.8)
Highly skilled and skilled -0.142
(137.2)
Semi-skilled and unskilled -0.159
(156.1)
Non-defined 0.459
(409.6)
Plant Size 0.038
(301.7)
Industry dummies yes
Constant 0.213
(26.3)
Log-L -75090.8
N 140,441
The probability of being promoted within one year from admission is decreasing
with age and increasing with schooling (except for college education), skill-levels
and the size of the plant. Conditional on the observables, women are also more
likely to be promoted than men, which is in contradition with the ’glass-ceiling
hypothesis’ but not with the results obtained by Booth et al. (2003). More impor-
tantly, immigrants face a higher probability of being promoted than native workers
with similar characteristics. The estimated marginal effect of being an immigrant
on the probability of promotion for a worker with the same characteristics of the
average immigrant hired in 1999 and still employed in 2000 is +4.0 percentage
points. Hence, promotions within the context of continuing employment relation-
ships contribute to the economic assimilation of immigrants because they make
the internal reallocation of immigrants possible. The fact that this reallocation
process is faster for immigrants than for natives may be indicative of the severity
15
of the informational disadvantage employers’ face when they choose to hire foreign
rather than native workers.
4.3 Job and workplace characteristics
Returns to location in the establishment’s hierarchy of skills are greater for im-
migrants than for natives irrespective of the skill-level. This is the result of lower
wages at the baseline category (apprentices) which reflects the fact that, at entry-
levels, immigrants earn considerably less than natives, and also of the fact that
promotions to higher-level positions imply a wage premium with two components
- returns to specific training and to information that immigrants may be able to
signal during the early stages of their stay with the employer.
The positive premium associated with working in large size employers (Brown
and Medoff, 1989) is less important for immigrants than it is for natives. Although
there is no obvious reason why this should be the case, this result could indicate
that immigrants hired into large units are to some extent confined to peripheral
and perhaps temporary positions which is something we cannot control for. In
fact, estimation of the probit model separately for natives and immigrants shows
that the marginal effect of the size variable evaluated for a worker with the average
characteristics of immigrants hired in 1999, is half as large for immigrants than
for natives.
4.4 Region of origin
Schooling and labor market experience determine earnings both through their lev-
els and their national origin. The country where human capital was accumulated
matters and is a crucial determinant of its value in the host labor market (Fried-
berg, 2000). Differences in school quality across countries as well as in the degree of
compatibility between national schooling systems and labor market requirements
at destination are the two most frequently cited reasons why that should be the
case. The national origin may also be related to any possible form of discrimina-
tion especially if discriminatory behavior varies with schooling (or other observed
16

attributes) and its distribution across nationalities is also different.
To analyze the effects of the country of origin on wages of the foreign born, eight
dummy variables to nationality groups were entered into the regression equation
(1).10 The omitted group is that of the Portuguese-speaking countries. Another
variable Same Group Pct was also added to the regression equation. Results are
in Table 4 (first column).
10For the list of countries included in each group, refer to Appendix 1
17
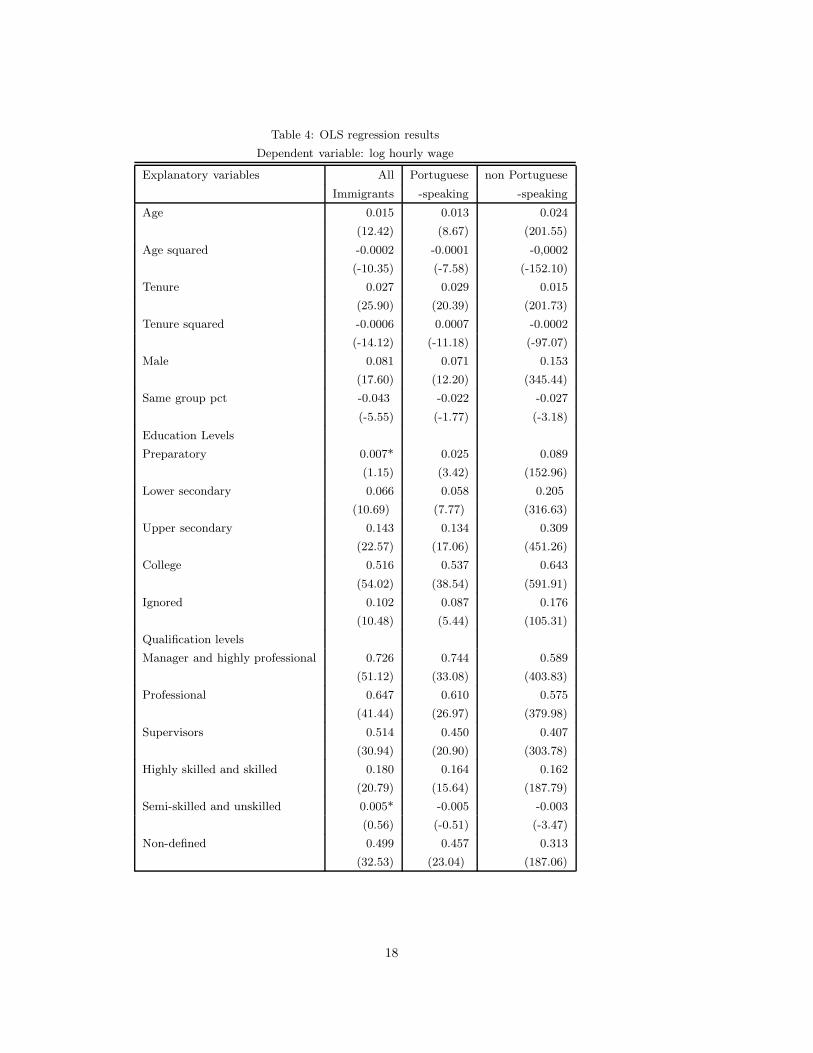
Table 4: OLS regression results
Dependent variable: log hourly wage
Explanatory variables All Portuguese non Portuguese
Immigrants -speaking -speaking
Age 0.015 0.013 0.024
(12.42) (8.67) (201.55)
Age squared -0.0002 -0.0001 -0,0002
(-10.35) (-7.58) (-152.10)
Tenure 0.027 0.029 0.015
(25.90) (20.39) (201.73)
Tenure squared -0.0006 0.0007 -0.0002
(-14.12) (-11.18) (-97.07)
Male 0.081 0.071 0.153
(17.60) (12.20) (345.44)
Same group pct -0.043 -0.022 -0.027
(-5.55) (-1.77) (-3.18)
Education Levels
Preparatory 0.007* 0.025 0.089
(1.15) (3.42) (152.96)
Lower secondary 0.066 0.058 0.205
(10.69) (7.77) (316.63)
Upper secondary 0.143 0.134 0.309
(22.57) (17.06) (451.26)
College 0.516 0.537 0.643
(54.02) (38.54) (591.91)
Ignored 0.102 0.087 0.176
(10.48) (5.44) (105.31)
Qualification levels
Manager and highly professional 0.726 0.744 0.589
(51.12) (33.08) (403.83)
Professional 0.647 0.610 0.575
(41.44) (26.97) (379.98)
Supervisors 0.514 0.450 0.407
(30.94) (20.90) (303.78)
Highly skilled and skilled 0.180 0.164 0.162
(20.79) (15.64) (187.79)
Semi-skilled and unskilled 0.005* -0.005 -0.003
(0.56) (-0.51) (-3.47)
Non-defined 0.499 0.457 0.313
(32.53) (23.04) (187.06)
18
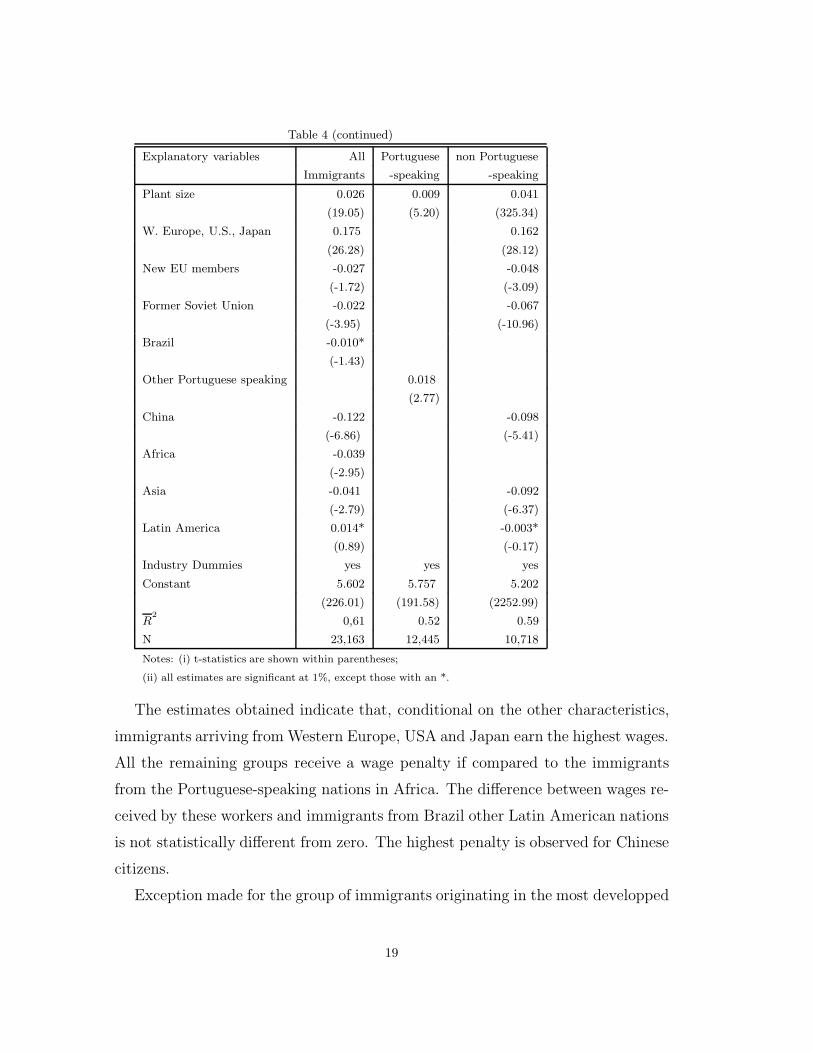
Table 4 (continued)
Explanatory variables All Portuguese non Portuguese
Immigrants -speaking -speaking
Plant size 0.026 0.009 0.041
(19.05) (5.20) (325.34)
W. Europe, U.S., Japan 0.175 0.162
(26.28) (28.12)
New EU members -0.027 -0.048
(-1.72) (-3.09)
Former Soviet Union -0.022 -0.067
(-3.95) (-10.96)
Brazil -0.010*
(-1.43)
Other Portuguese speaking 0.018
(2.77)
China -0.122 -0.098
(-6.86) (-5.41)
Africa -0.039
(-2.95)
Asia -0.041 -0.092
(-2.79) (-6.37)
Latin America 0.014* -0.003*
(0.89) (-0.17)
Industry Dummies yes yes yes
Constant 5.602 5.757 5.202
(226.01) (191.58) (2252.99)
R2
0,61 0.52 0.59
N 23,163 12,445 10,718
Notes: (i) t-statistics are shown within parentheses;
(ii) all estimates are significant at 1%, except those with an *.
The estimates obtained indicate that, conditional on the other characteristics,
immigrants arriving from Western Europe, USA and Japan earn the highest wages.
All the remaining groups receive a wage penalty if compared to the immigrants
from the Portuguese-speaking nations in Africa. The difference between wages re-
ceived by these workers and immigrants from Brazil other Latin American nations
is not statistically different from zero. The highest penalty is observed for Chinese
citizens.
Exception made for the group of immigrants originating in the most developped
19
countries, the fact that immigrants faring the best are those from Portuguese-
speaking countries indicates that language-skills do matter. However, there is no
evidence that immigrants who use the Portuguese as their native language may
receive higher returns to schooling or experience. In fact it is the opposite that
we observe (Table 4, two last columns). Although we cannot separate experience
acquired before and after migration, the estimate obtained for the age variable is
consistent with the fact that language proficiency and post-migration experience
are substitutes (Chiswick and Miller, 1993). As to language fluency, it is admitedly
measured with error as it rests only on the identification of the country of birth.
However, the result we obtained could indicate that schooling quality related issues
may be outweighting any possible benefits of language fluency that may exist, es-
pecially because the highest wage immigrants are in the non-Portuguese-speaking
group. The only benefit of language fluency as determined by country of birth
emerges as higher returns to tenure, consistent with the fact that local accumula-
tion of (specific) human capital is complementary to language fluency.
4.5 Ethnic concentration
Residential areas with higher concentration of immigrants of the same origin offer
”ethnic goods” at a lower cost than they are available in low-concentration areas.
Hence, high wage offers will be needed to induce one member of the group to leave
the area. As a result, wages will be inversely related to group-concentration. Immi-
grants are expected to make wage concessions so as they can live in more home-like
neighborhoods. Although we are not aware that the issue has been investigated
before, the same reasoning applies to workplaces. Workers may be willing to pay
to work in units where they may share with their co-workers the same geographic
origin (or, indeed, the immigrant status). It is this effect that the Same Group
Pct variable is meant to capture. This variable measures for each worker the pro-
portion of his co-workers at the same establishment that have the same nationality
as defined in Appendix 1. The results in Table 4 indicate that immigrants actually
value ethnic goods. For the whole sample of immigrants, wages are reduced by
20
approximately 4.3 percent for each 1 percentage point increase in the workplace
ethnic concentration. The corresponding estimates for the Portuguese-speaking
and non-Portuguese-speaking groups are -1.8 and -2.7 percent, respectively. These
results show that the value of ethnic concentration is all the greater, the more
culturally distant (in terms of language, at least) the country of birth is from the
country of residence.
5 Quantile regression and the determinants of earnings of immigrants
Most studies of immigrants earnings employ least squares regression methods.
However, these methods produce estimates of the various covariates effects on
the conditional mean of the dependent variable, possibly concealing differences in
responses at the two extremes of wage distribution. Quantile regression helps to
uncover any such differences.
To investigate whether these differences matter, the regression equation (1)
was re-estimated as a family of conditional quantile functions. The same set of
covariates as in Table 4 entered the regression equation. Nine distinct quantile
regression estimates, one for each decile, were obtained. Results for the 1st, the
median, and the 9th decile are displayed in Table 5.
21
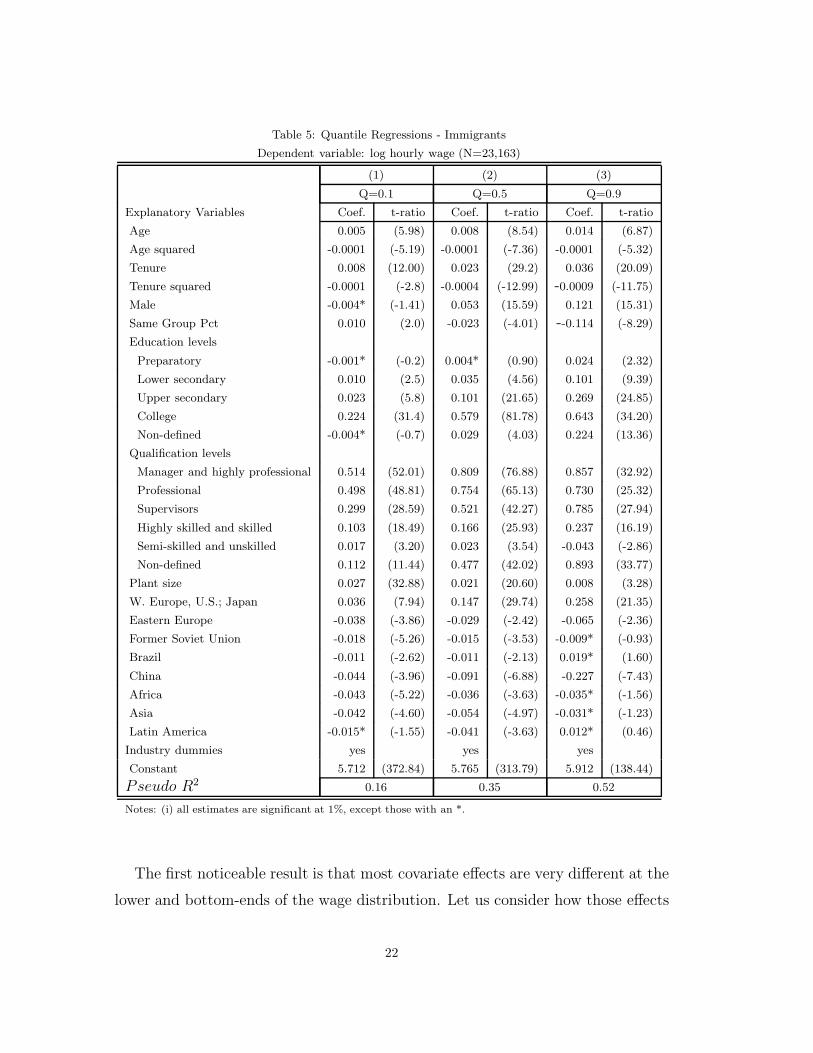
Table 5: Quantile Regressions - Immigrants
Dependent variable: log hourly wage (N=23,163)
(1) (2) (3)
Q=0.1 Q=0.5 Q=0.9
Explanatory Variables Coef. t-ratio Coef. t-ratio Coef. t-ratio
Age 0.005 (5.98) 0.008 (8.54) 0.014 (6.87)
Age squared -0.0001 (-5.19) -0.0001 (-7.36) -0.0001 (-5.32)
Tenure 0.008 (12.00) 0.023 (29.2) 0.036 (20.09)
Tenure squared -0.0001 (-2.8) -0.0004 (-12.99) -0.0009 (-11.75)
Male -0.004* (-1.41) 0.053 (15.59) 0.121 (15.31)
Same Group Pct 0.010 (2.0) -0.023 (-4.01) --0.114 (-8.29)
Education levels
Preparatory -0.001* (-0.2) 0.004* (0.90) 0.024 (2.32)
Lower secondary 0.010 (2.5) 0.035 (4.56) 0.101 (9.39)
Upper secondary 0.023 (5.8) 0.101 (21.65) 0.269 (24.85)
College 0.224 (31.4) 0.579 (81.78) 0.643 (34.20)
Non-defined -0.004* (-0.7) 0.029 (4.03) 0.224 (13.36)
Qualification levels
Manager and highly professional 0.514 (52.01) 0.809 (76.88) 0.857 (32.92)
Professional 0.498 (48.81) 0.754 (65.13) 0.730 (25.32)
Supervisors 0.299 (28.59) 0.521 (42.27) 0.785 (27.94)
Highly skilled and skilled 0.103 (18.49) 0.166 (25.93) 0.237 (16.19)
Semi-skilled and unskilled 0.017 (3.20) 0.023 (3.54) -0.043 (-2.86)
Non-defined 0.112 (11.44) 0.477 (42.02) 0.893 (33.77)
Plant size 0.027 (32.88) 0.021 (20.60) 0.008 (3.28)
W. Europe, U.S.; Japan 0.036 (7.94) 0.147 (29.74) 0.258 (21.35)
Eastern Europe -0.038 (-3.86) -0.029 (-2.42) -0.065 (-2.36)
Former Soviet Union -0.018 (-5.26) -0.015 (-3.53) -0.009* (-0.93)
Brazil -0.011 (-2.62) -0.011 (-2.13) 0.019* (1.60)
China -0.044 (-3.96) -0.091 (-6.88) -0.227 (-7.43)
Africa -0.043 (-5.22) -0.036 (-3.63) -0.035* (-1.56)
Asia -0.042 (-4.60) -0.054 (-4.97) -0.031* (-1.23)
Latin America -0.015* (-1.55) -0.041 (-3.63) 0.012* (0.46)
Industry dummies yes yes yes
Constant 5.712 (372.84) 5.765 (313.79) 5.912 (138.44)
Pseudo R2 0.16 0.35 0.52
Notes: (i) all estimates are significant at 1%, except those with an *.
The first noticeable result is that most covariate effects are very different at the
lower and bottom-ends of the wage distribution. Let us consider how those effects
22
change for a selection of covariates.
Returns to education are very low at the 10th percentile for all schooling levels,
although returns to college are much higher than to the educational level imme-
diately before. However, at the top of the distribution returns to the very same
levels of education are considerably higher except for preparatory school. This
tell us that schooling transferability varies enormously with the location in the
distribution, although it is always present. 11
At the top, the wage premium received by male immigrants is twice as large
as it is at the median, whereas at the bottom it is not significantly different from
zero.
It is of particular interest to compare the estimated coefficient of the Same
Group Pct variable. From virtually zero at the 1st decile, where again binding
minimum wage regulation prohibits any concession workers could agree upon, it
decreases steadily to −0.023 at the 5th decile and to −0.1145 at the 9th decile.
Immigrants are willing to pay for workplace ethnic goods independently of where
they are in the wage distribution. In fact, the higher wage they earn the more
they are willing to pay to work with a larger proportion of workers with similar
national origins.
The country of origin effect becomes less important as we approach the upper-
end of the distribution where most estimates are not statistically different from
zero. However, the premium received by Western Europe, USA and Japan national
citizens is almost ten times as great in the 9th decile as in the 1st. To a smaller
degree, the same happens with Brazilian nationals. On the contrary, the penalty
associated with Chinese origin is five times larger at the upper-tail of distribution
than at the lower-tail.
6 Conclusions
Using a single cross-section of matched employer-employee data we were able to
11A comparison with the corresponding estimates for the sample of native workers reveals that returns toimported schooling are less than to local schooling across the whole wage distribution.
23
compare the earnings of immigrant and native workers in Portugal. We conclude
that immigrants’ earnings are 2.6 percent below the earnings of similar native
workers. Although we cannot compute the earnings differential at the time of
entry, this estimate is consistent with previous findings of migrants faring better
in the Portuguese labor market than elsewhere in Europe. Quantile regressions
shows that at the left-tail of the wage distribution, immigrants fare better than
anywhere else below the 7th decile indicating that such labor market institutions as
legal minimum wages are non-neutral also in terms of the economic performance
of immigrants.
We were also able to establish that the economic assimilitation of immigrants
takes place in the context of continuing matches as much as with job switching
which has been receiving more attention. The demand for ”ethnic goods”, known
to influence the earnings of immigrants, when linked to the choice of the residential
area, were found to be important also at the workplace level. Immigrants’ wages
are reduced by as much as 4.3 percent for each additional percentage point increase
in the concentration of same origin immigrants in the workplace.
Quantile regression helped uncover significant differences in the effects of the
earnings determinants over the wage distribution - except for very specific cases,
the region of origin is less penalized as we approach the right-tail of the wage
distribution. The loss of human capital as embodied in schooling is also less
important for higher wage levels.
24
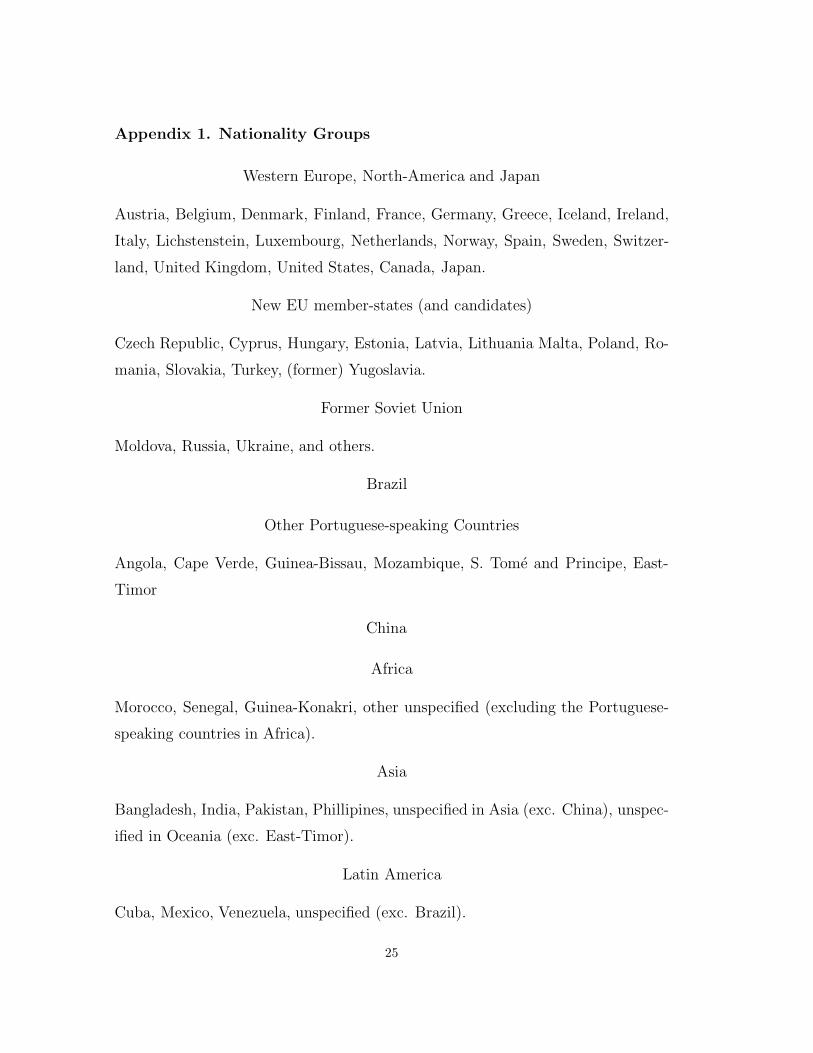
Appendix 1. Nationality Groups
Western Europe, North-America and Japan
Austria, Belgium, Denmark, Finland, France, Germany, Greece, Iceland, Ireland,
Italy, Lichstenstein, Luxembourg, Netherlands, Norway, Spain, Sweden, Switzer-
land, United Kingdom, United States, Canada, Japan.
New EU member-states (and candidates)
Czech Republic, Cyprus, Hungary, Estonia, Latvia, Lithuania Malta, Poland, Ro-
mania, Slovakia, Turkey, (former) Yugoslavia.
Former Soviet Union
Moldova, Russia, Ukraine, and others.
Brazil
Other Portuguese-speaking Countries
Angola, Cape Verde, Guinea-Bissau, Mozambique, S. Tome and Principe, East-
Timor
China
Africa
Morocco, Senegal, Guinea-Konakri, other unspecified (excluding the Portuguese-
speaking countries in Africa).
Asia
Bangladesh, India, Pakistan, Phillipines, unspecified in Asia (exc. China), unspec-
ified in Oceania (exc. East-Timor).
Latin America
Cuba, Mexico, Venezuela, unspecified (exc. Brazil).
25
References
Abowd JM, Kramarz F, Margolis DN (1999) High Wage Workers and High
Wage Firms. Econometrica, 67(2):251-333.
Adsera A, Chiswick BR (2005) Divergent Patterns in Immigrant Earnings
across European Destinations. Paper presented at EALE/SOLE conference
2005, San Francisco.
Bonache J, Fernandez Z (1997) Expatriate Compensation and Its Link to
the Subsidiary Strategic Role: A Theoretical Analysis. International Journal
of Human Resource Management, 8(4):457-475.
Booth A, Francesconi F, Frank J (2003) A Sticky Floors Model of Pro-
motion, Pay, and Gender. European Economic Review, 47(2):295-322.
Borjas GJ (1999) Heaven’s Door: Immigration Policy and the American Econ-
omy, Princeton University Press, Princeton.
Borjas GJ (2000) Ethnic Enclaves and Assimilation. Swedish Economic Policy
Review, 7(2):89-122.
Brown C, Medoff J (1989) The Employer Size-Wage Effect. Journal of Po-
litical Economy, 97(5):1027-1059.
Card D, Krueger AB (1995) Myth and Measurement: The Economics of the
New Minimum Wage. Princeton University Press, Princeton.
Carrington WJ, Lima, PJF (1996) The Impact of 1970s Repatriates from
Africa on the Portuguese Labor Market. Industrial and Labor Relations Re-
view, 49(2):330-347.
Chiswick BR (1978) The Effect of Americanization on the Earnings of Foreign-
born Men Journal of Political Economy, 86(5):897-921.
26
Chiswick BR (1979) The Economic Progress of Immigrants: Some Apparently
Universal Patterns. In: Fellner W (ed) Contemporary Economic Problems.
American Enterprise Institute, Washington D.C., 357-399.
Chiswick BR, Miller, PW (2002) Immigrant Earnings: Language Skills, Lin-
guistic Concentrations and the Business Cycle. Journal of Population Eco-
nomics, 15(1):31-57.
Chiswick BR, Miller, PW (2003) The Complementarity of Language and
Other Human Capital: Immigrant Earnings in Canada. Economics of Edu-
cation Review, 22(5):469-480.
Cohen S, Epstein, Z (2002) Labor Mobility of Immigrants: Training, Experi-
ence, Language and Opportunities. Mimeo, Tel Aviv University, Tel Aviv.
Eckstein Z, Weiss, Y (2004) On the Wage Growth of Immigrants: Israel,
1990-2000. Journal of the European Economic Association, 2(4):665-695.
Friedberg RM (2000) You Can’t Take It with You? Immigrant Assimila-
tion and the Portability of Human Capital. Journal of Labor Economics,
18(2):221-251.
Groshen E (1990) The Structure of the Female/Male Wage Differential: Is It
Who You Are, What You Do, or Where You Work?. Journal of Human
Resources, 26(3):457-472.
Koencker R (2005) Quantile Regression. Cambridge University Press, Cam-
bridge.
Mincer J (1974) Schooling, Experience and Earnings. Columbia University
Press, New York.
Pereira SC (2003) The Impact of Minimum Wage on Youth Employment in
Portugal. European Economic Review, 47(2):229-244.
Portugal P, Cardoso AR (2002) Disentangling the Minimum Wage Puz-
zle: An Analysis of Worker Accessions and Separations from a Longitudinal
27

Matched Employer-Employed Data Set. Banco de Portugal Working Paper
WP 8-02, Lisbon.
Weiss Y, Sauer RM, Gotlibovski M (2003) Immigration, Search and Loss
of Skill. Journal of Labor Economics, 21(3):221-251.
28
Related Documents