Immersive Volume Rendering of Blood Vessels Gregory Long, Han Suk Kim, Alison Marsden, Yuri Bazilevs, J¨ urgen P. Schulze University of California San Diego, 9500 Gilman Drive, La Jolla, CA, USA ABSTRACT In this paper, we present a novel method of visualizing flow in blood vessels. Our approach reads unstructured tetrahedral data, resamples it, and uses slice based 3D texture volume rendering. Due to the sparse structure of blood vessels, we utilize an octree to efficiently store the resampled data by discarding empty regions of the volume. We use animation to convey time series data, wireframe surface to give structure, and utilize the StarCAVE, a 3D virtual reality environment, to add a fully immersive element to the visualization. Our tool has great value in interdisciplinary work, helping scientists collaborate with clinicians, by improv- ing the understanding of blood flow simulations. Full immersion in the flow field allows for a more intuitive understanding of the flow phenomena, and can be a great help to medical experts for treatment planning. Keywords: Volume Rendering, Blood flow, Virtual Reality, octree, tetrahedra 1. INTRODUCTION Simulation of blood flow for cardiovascular applications provides a wealth of data that is often not clinically available, including wall shear stress, wall motion, and time-dependent three dimensional velocity fields. Accurate prediction of blood flow and interpretation of the results can be crucial for surgical planning in a range of cardiovascular disease applications, including aneurysm treatment, coronary artery disease, and congenital heart disease. Recent advances in fluid structure interaction simulations now enable coupled fluid/solid simulations, producing time dependent blood flow and wall motion. Due to these advances in blood flow simulation, an intuitive, easy to use method of blood flow visualization has become more and more important. Advanced visualization of these results via 3D virtual reality facilitates communication between engineers and clinicians by improving understanding of simulation capabilities. By immersing the viewer in the flow field, the user can experience the full dynamic motion of both the blood flow and wall motion, which is not possible to convey using conventional visualization modalities. We have developed a novel method for visualizing time series blood flow in a CAVE environment. Structurally, blood vessels have an interesting shape: they are long and thin, with many small branches. Because of this shape, a traditional direct volume rendering approach would create a significant amount of empty space, incurring unnecessary overhead. To solve this issue, we utilize an octree data structure, and render each leaf node, instead of the entire, sparse volume. Our method reads in unstructured tetrahedral data, constructs an octree, and resamples the data, storing it into voxel format via 3D textures. For each node, we use slice based volume rendering with a 1 dimensional look up table for a transfer function. Per users requests, we also implemented various features to aid in the visualization. Users can navigate both around and within the vessel without loss of performance, and can dynamically adjust rendering quality, animation speed, and transfer function values. Time series information is conveyed through animation. Finally, a polygonal mesh of the vessel wall can be toggled, to aid in depth perception, and therefore visualization of the 3D structure. In this paper, we will discuss our method for rendering blood flow in blood vessels, as well as the implica- tions of our method in domain science. Section 2 discusses related work in the areas of octree based volume rendering, volume rendering in virtual reality, rendering of tetrahedral data, and visualization of blood flow. Section 3 presents in detail our visualization method. Section 4 discusses performance results as well as qual- ity/performance tradeoffs. Section 5 discusses design decisions and the impact of our visualization method on domain science. Finally, Section 6 concludes our discussion and touches upon possible future work.

Welcome message from author
This document is posted to help you gain knowledge. Please leave a comment to let me know what you think about it! Share it to your friends and learn new things together.
Transcript
Immersive Volume Rendering of Blood Vessels
Gregory Long, Han Suk Kim, Alison Marsden, Yuri Bazilevs, Jurgen P. Schulze
University of California San Diego, 9500 Gilman Drive, La Jolla, CA, USA
ABSTRACT
In this paper, we present a novel method of visualizing flow in blood vessels. Our approach reads unstructuredtetrahedral data, resamples it, and uses slice based 3D texture volume rendering. Due to the sparse structureof blood vessels, we utilize an octree to efficiently store the resampled data by discarding empty regions ofthe volume. We use animation to convey time series data, wireframe surface to give structure, and utilize theStarCAVE, a 3D virtual reality environment, to add a fully immersive element to the visualization.
Our tool has great value in interdisciplinary work, helping scientists collaborate with clinicians, by improv-ing the understanding of blood flow simulations. Full immersion in the flow field allows for a more intuitiveunderstanding of the flow phenomena, and can be a great help to medical experts for treatment planning.
Keywords: Volume Rendering, Blood flow, Virtual Reality, octree, tetrahedra
1. INTRODUCTION
Simulation of blood flow for cardiovascular applications provides a wealth of data that is often not clinicallyavailable, including wall shear stress, wall motion, and time-dependent three dimensional velocity fields. Accurateprediction of blood flow and interpretation of the results can be crucial for surgical planning in a range ofcardiovascular disease applications, including aneurysm treatment, coronary artery disease, and congenital heartdisease. Recent advances in fluid structure interaction simulations now enable coupled fluid/solid simulations,producing time dependent blood flow and wall motion. Due to these advances in blood flow simulation, anintuitive, easy to use method of blood flow visualization has become more and more important. Advancedvisualization of these results via 3D virtual reality facilitates communication between engineers and cliniciansby improving understanding of simulation capabilities. By immersing the viewer in the flow field, the user canexperience the full dynamic motion of both the blood flow and wall motion, which is not possible to convey usingconventional visualization modalities.
We have developed a novel method for visualizing time series blood flow in a CAVE environment. Structurally,blood vessels have an interesting shape: they are long and thin, with many small branches. Because of this shape,a traditional direct volume rendering approach would create a significant amount of empty space, incurringunnecessary overhead. To solve this issue, we utilize an octree data structure, and render each leaf node, insteadof the entire, sparse volume. Our method reads in unstructured tetrahedral data, constructs an octree, andresamples the data, storing it into voxel format via 3D textures. For each node, we use slice based volumerendering with a 1 dimensional look up table for a transfer function. Per users requests, we also implementedvarious features to aid in the visualization. Users can navigate both around and within the vessel without loss ofperformance, and can dynamically adjust rendering quality, animation speed, and transfer function values. Timeseries information is conveyed through animation. Finally, a polygonal mesh of the vessel wall can be toggled,to aid in depth perception, and therefore visualization of the 3D structure.
In this paper, we will discuss our method for rendering blood flow in blood vessels, as well as the implica-tions of our method in domain science. Section 2 discusses related work in the areas of octree based volumerendering, volume rendering in virtual reality, rendering of tetrahedral data, and visualization of blood flow.Section 3 presents in detail our visualization method. Section 4 discusses performance results as well as qual-ity/performance tradeoffs. Section 5 discusses design decisions and the impact of our visualization method ondomain science. Finally, Section 6 concludes our discussion and touches upon possible future work.
2. RELATED WORK
Texture based volume rendering is a widely known method for accelerating volume rendering performance,1 andoctree based volume rendering is a widely known method of increasing performance in texture based volumerendering. La Mar et al.2 present an octree based method for volume rendering, creating levels of detail byfiltering the volume data based on the distance of the data from the camera. Plate et al.3 also present an octreebased method that runs at interactive frame rates, using a caching technique to render very large datasets. Ourapproach does not use the octree to filter the data into multiple resolutions based on camera positions, butinstead uses the octree structure only to reduce the amount of data stored by culling spaces that contain nodata. However, our algorithm supports time series with separately computed octrees for each time step.
Direct rendering of unstructured tetrahedral meshes has been covered extensively,4–6 however our approachdiffers in that we use barycentric coordinates to resample the tetrahedral data into a regular voxel grid, asopposed to rendering the mesh directly.
Medical volume rendering has mostly been done for diagnosis and virtual surgery. Little work has beendone on volume rendering in immersive virtual environments. Schulze et al.7 presented the volume renderingapplication for a CAVE-like system with a full transfer function editor, but it uses a single regular grid whichis wasteful in the case of blood vessel trees. Blood vessels have been volume rendered before,8–10 but ourmethod differs in that it uses an octree-optimized data set to skip empty regions of the data volume, and directvolume rendering with a transfer function editor for rendering. Also, our rendering system has been integratedinto a virtual reality software framework (COVISE11), and thus runs in CAVE and similar, tracked, immersiveenvironments.
A popular approach for data visualization is to use the Visualization Toolkit (VTK),12 but it does notsupport octrees for direct volume rendering, and thus requires much more memory for the same renderingquality compared to our algorithm.
3. TECHNICAL DESCRIPTION
Our dataset is composed of two sets of patient specific cardiovascular simulations. The first model is that ofa cerebral aneurysm taken from Bazilevs et al.13 The model is constructed from CT scan data and meshedwith tetrahedral elements using the techniques described by Zhang et al.14 The model was simulated using afully-coupled fluid-structure intercation (FSI) analysis (see Bazilevs et al.13 for details). The use of FSI producesvessel wall deformation during the simulated cardiac cycle, which motivates the use of separate octrees at eachtime step.
The second model corresponds to a patient-specific Kawasaki disease configuration. Kawasaki disease (KD)is a serious pediatric illness affecting the cardiovascular system. There are currently over 6,000 cases of KDdiagnosed annually in the US, and KD is the leading cause of acquired heart disease in children.15 One of themost serious complications of Kawasaki disease, occurring in about 25% of untreated cases, is the formation oflarge aneurysms in the coronary arteries. These aneurysms put patients at risk for myocardial infarction (MI(heart attack)) due to thrombosis that blocks flow distal to the aneurysm. Aneurysms caused by KD differfrom other common types of aneurysms (abdominal, cerebral) in that they typically develop thrombosis (clot)as opposed to a sudden vessel wall rupture.
The KD model is constructed from CT scan data, using SimVascular16 and MeshSim.17 Simulation resultsare generated with a state-of-the-art finite element flow solver PHASTA.18 The blood vessels are long, winding,tube like structures, often with smaller, branching paths off of a main path. This type of structure leads to avery sparse volume, if the data is naively converted into a single large volume. This motivates the use of anoctree with many levels of recursion.
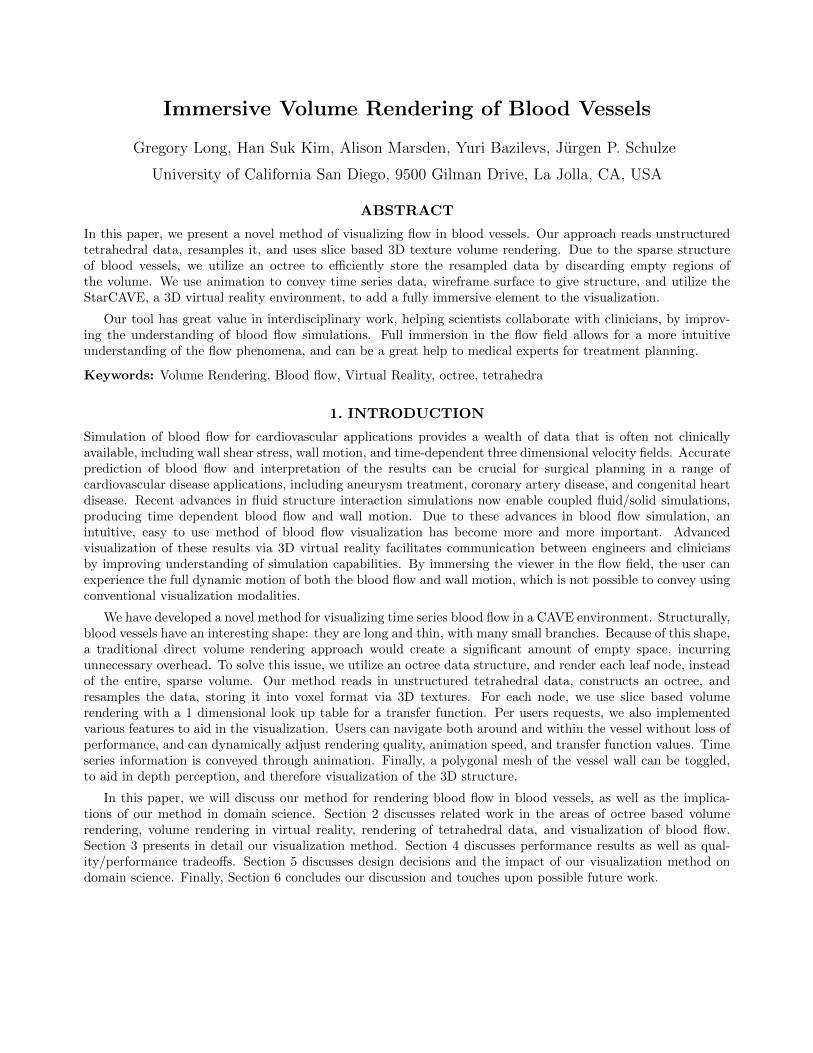
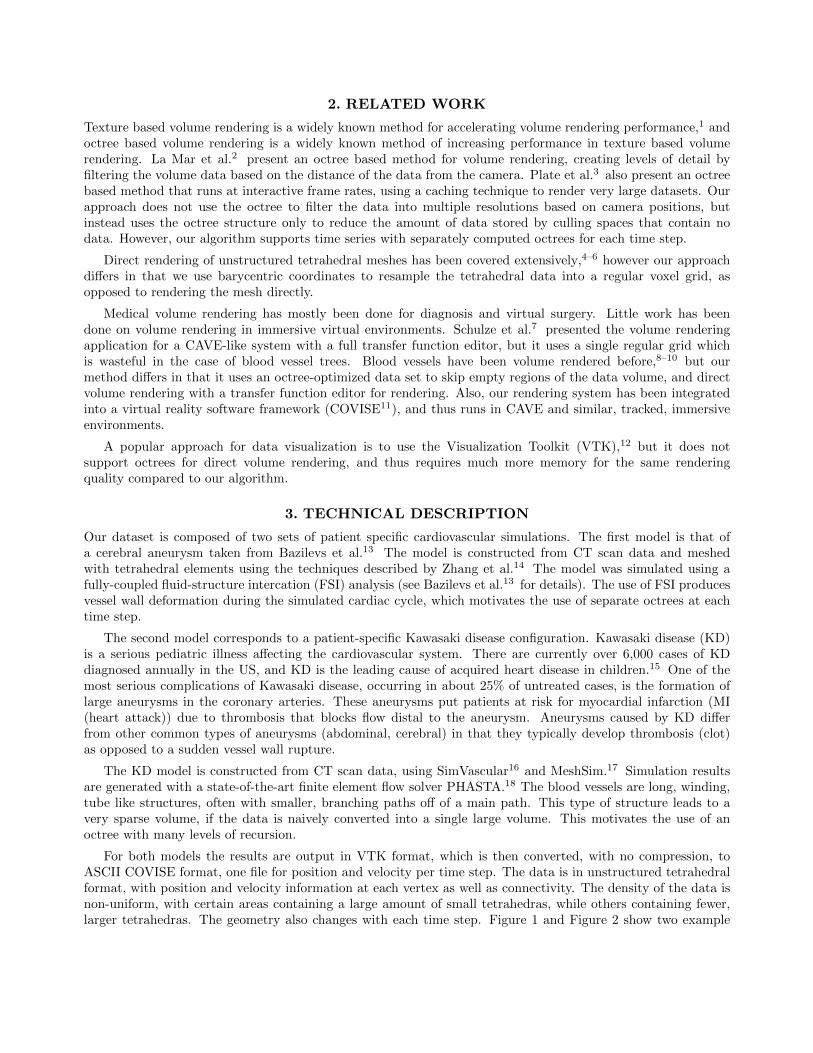
For both models the results are output in VTK format, which is then converted, with no compression, toASCII COVISE format, one file for position and velocity per time step. The data is in unstructured tetrahedralformat, with position and velocity information at each vertex as well as connectivity. The density of the data isnon-uniform, with certain areas containing a large amount of small tetrahedras, while others containing fewer,larger tetrahedras. The geometry also changes with each time step. Figure 1 and Figure 2 show two example
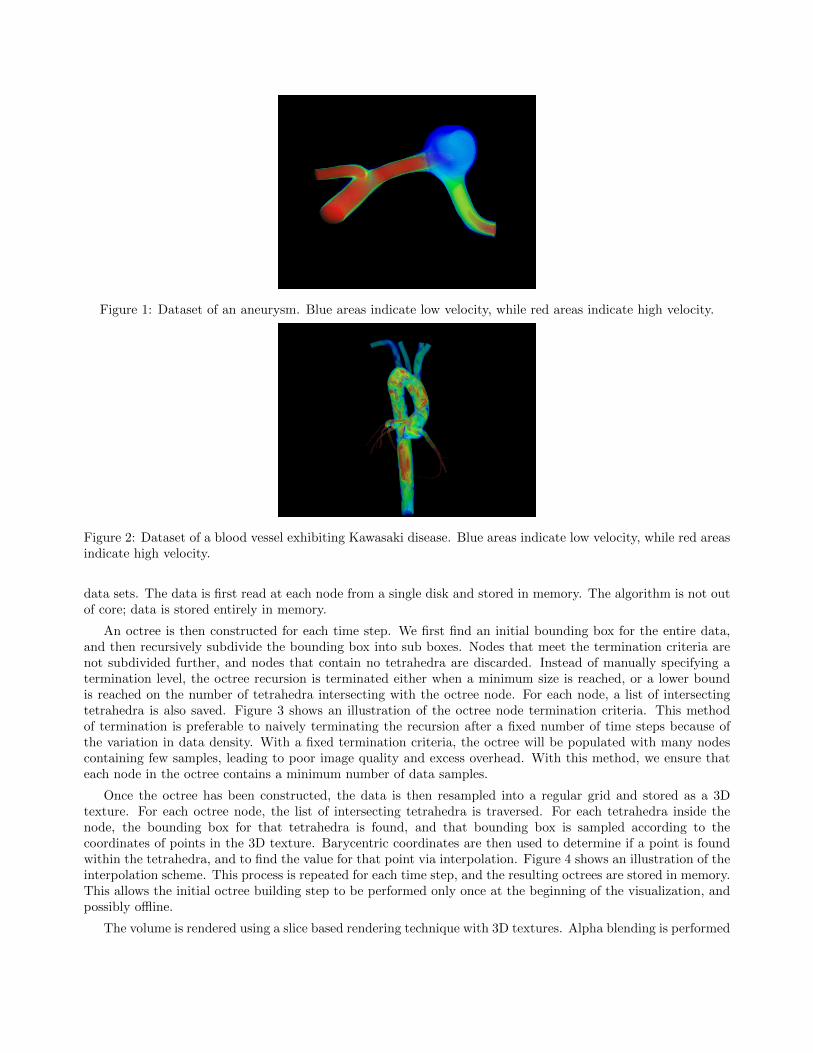
Figure 1: Dataset of an aneurysm. Blue areas indicate low velocity, while red areas indicate high velocity.
Figure 2: Dataset of a blood vessel exhibiting Kawasaki disease. Blue areas indicate low velocity, while red areasindicate high velocity.
data sets. The data is first read at each node from a single disk and stored in memory. The algorithm is not outof core; data is stored entirely in memory.
An octree is then constructed for each time step. We first find an initial bounding box for the entire data,and then recursively subdivide the bounding box into sub boxes. Nodes that meet the termination criteria arenot subdivided further, and nodes that contain no tetrahedra are discarded. Instead of manually specifying atermination level, the octree recursion is terminated either when a minimum size is reached, or a lower boundis reached on the number of tetrahedra intersecting with the octree node. For each node, a list of intersectingtetrahedra is also saved. Figure 3 shows an illustration of the octree node termination criteria. This methodof termination is preferable to naively terminating the recursion after a fixed number of time steps because ofthe variation in data density. With a fixed termination criteria, the octree will be populated with many nodescontaining few samples, leading to poor image quality and excess overhead. With this method, we ensure thateach node in the octree contains a minimum number of data samples.
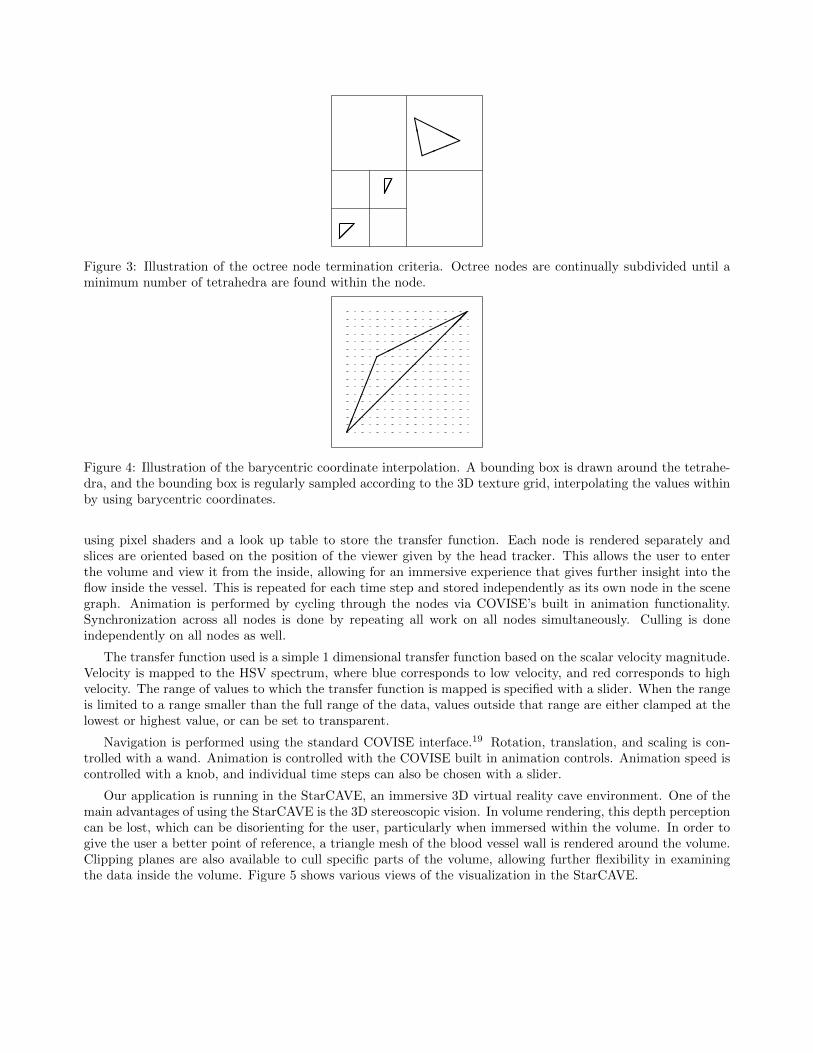
Once the octree has been constructed, the data is then resampled into a regular grid and stored as a 3Dtexture. For each octree node, the list of intersecting tetrahedra is traversed. For each tetrahedra inside thenode, the bounding box for that tetrahedra is found, and that bounding box is sampled according to thecoordinates of points in the 3D texture. Barycentric coordinates are then used to determine if a point is foundwithin the tetrahedra, and to find the value for that point via interpolation. Figure 4 shows an illustration of theinterpolation scheme. This process is repeated for each time step, and the resulting octrees are stored in memory.This allows the initial octree building step to be performed only once at the beginning of the visualization, andpossibly offline.
The volume is rendered using a slice based rendering technique with 3D textures. Alpha blending is performed
DDDHH
HH!!!
��
��
Figure 3: Illustration of the octree node termination criteria. Octree nodes are continually subdivided until aminimum number of tetrahedra are found within the node.
������������
�����
������
Figure 4: Illustration of the barycentric coordinate interpolation. A bounding box is drawn around the tetrahe-dra, and the bounding box is regularly sampled according to the 3D texture grid, interpolating the values withinby using barycentric coordinates.
using pixel shaders and a look up table to store the transfer function. Each node is rendered separately andslices are oriented based on the position of the viewer given by the head tracker. This allows the user to enterthe volume and view it from the inside, allowing for an immersive experience that gives further insight into theflow inside the vessel. This is repeated for each time step and stored independently as its own node in the scenegraph. Animation is performed by cycling through the nodes via COVISE’s built in animation functionality.Synchronization across all nodes is done by repeating all work on all nodes simultaneously. Culling is doneindependently on all nodes as well.
The transfer function used is a simple 1 dimensional transfer function based on the scalar velocity magnitude.Velocity is mapped to the HSV spectrum, where blue corresponds to low velocity, and red corresponds to highvelocity. The range of values to which the transfer function is mapped is specified with a slider. When the rangeis limited to a range smaller than the full range of the data, values outside that range are either clamped at thelowest or highest value, or can be set to transparent.
Navigation is performed using the standard COVISE interface.19 Rotation, translation, and scaling is con-trolled with a wand. Animation is controlled with the COVISE built in animation controls. Animation speed iscontrolled with a knob, and individual time steps can also be chosen with a slider.
Our application is running in the StarCAVE, an immersive 3D virtual reality cave environment. One of themain advantages of using the StarCAVE is the 3D stereoscopic vision. In volume rendering, this depth perceptioncan be lost, which can be disorienting for the user, particularly when immersed within the volume. In order togive the user a better point of reference, a triangle mesh of the blood vessel wall is rendered around the volume.Clipping planes are also available to cull specific parts of the volume, allowing further flexibility in examiningthe data inside the volume. Figure 5 shows various views of the visualization in the StarCAVE.

Figure 5: Various views of the blood flow visualization in the StarCAVE.
4. RESULTS
Our software is based on the COVISE software environment, and is run on a cluster of 16 nodes, each consistingof an Intel Core 2 Quad 4-core processor running at 2.4 GHz, 4 GB RAM, and dual NVIDIA Quadro 5600video cards. Measurements were obtained by averaging a series of 10 samples. We measured our performancerendering two datasets, Aneurysm and Kawasaki. The Aneurysm dataset contains 144,612 tetrahedra, while theKawasaki dataset contains 3,557,011. However, due to our resampling algorithm, the Aneurysm dataset contains320 leaf nodes, while the Kawasaki dataset contains only 230. The total memory usage at 64×64×64 resolutionfor the Aneurysm dataset is 80 MB - as a comparison, if an equivalent texture resolution was used to render theAneurysm dataset without an octree, the total texture size would be 1.01 GB, or an increase of 12.9×.
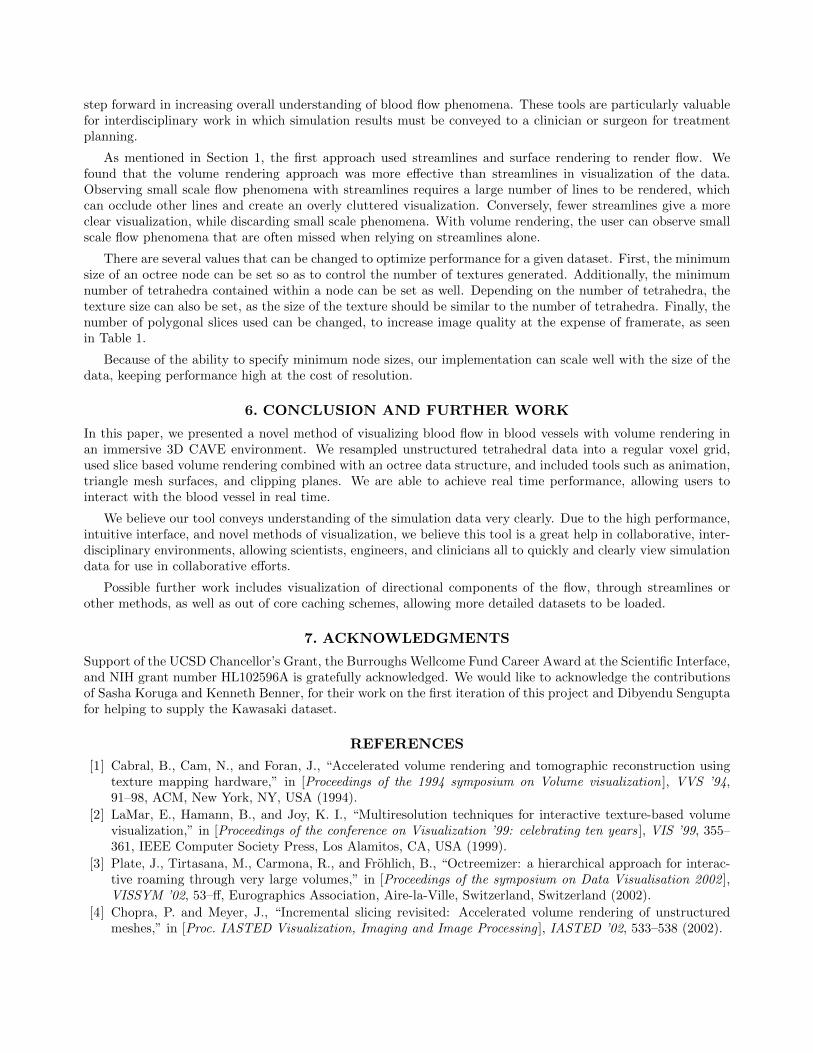
Tables 1 and 2 show frame rate and preprocessing time for our Aneurysm and Kawasaki datasets, givendifferent numbers of slices and texture sizes. Note that while the Kawasaki dataset contains significantly moretetrahedra than Aneurysm, and therefore has a significantly higher preprocessing time, its frame rate is higher,due to a lower number of leaf nodes. Figures 6 and 7 show the effect of the number of slices and texture size onimage quality. Increasing the number of slices improves image quality, at the expense of frame rate. However,the image quality is still acceptable at 10 slices, and increases significantly at 20, without a loss of interactivity.Additionally, because the number of slices can be changed interactively, users can choose a low number of slicesto navigate, and increase the slices when visual quality is desired. Increasing texture size can also improve imagequality, at the expense of preprocessing time. Because this preprocessing is only done once, and can be doneoffline and stored for future use, it is desirable to use the highest possible size that can fit into video memory.
5. DISCUSSION
We found that the advanced visualization of cardiovascular simulations provides a new experience in data analysisand interpretation of simulation results which improves the physical intuition of the user, and allows for a moredynamic and physical exploration of the data. The ability to move inside and rotate data in real time is a

(a) 10 slices. (b) 20 slices.
(c) 50 slices. (d) 100 slices.
Figure 6: The Aneurysm dataset, rendered with different numbers of slices. Higher slice count results in higherimage quality/less artifacts.
number of slices frame rate (Aneurysm) frame rate (Kawasaki)10 26.8 31.220 15.4 19.530 11.2 13.650 7.1 8.940 8.6 11.060 5.9 7.670 5.2 6.580 4.6 5.890 4.1 5.2100 3.7 4.7
Table 1: Frame rate as a function of the number of slices per octree leaf node. Note that the Kawasaki datasethas a higher performance, due to less leaf nodes after resampling.
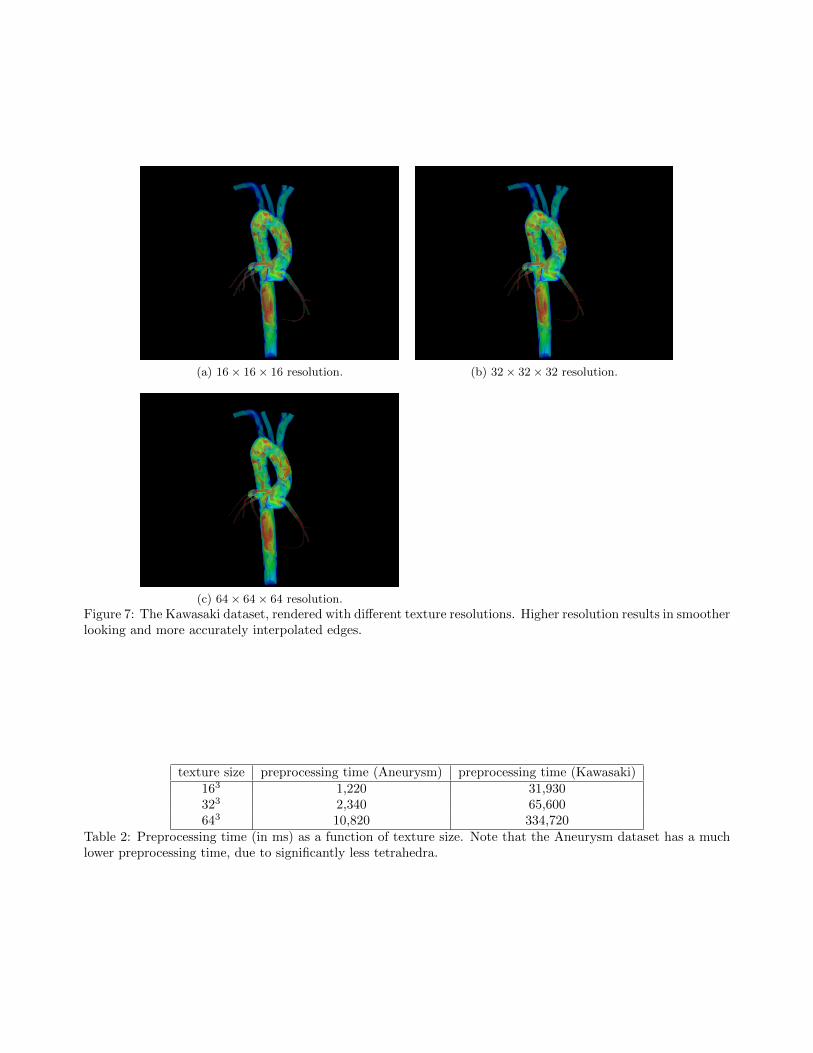
(a) 16× 16× 16 resolution. (b) 32× 32× 32 resolution.
(c) 64× 64× 64 resolution.
Figure 7: The Kawasaki dataset, rendered with different texture resolutions. Higher resolution results in smootherlooking and more accurately interpolated edges.
texture size preprocessing time (Aneurysm) preprocessing time (Kawasaki)163 1,220 31,930323 2,340 65,600643 10,820 334,720
Table 2: Preprocessing time (in ms) as a function of texture size. Note that the Aneurysm dataset has a muchlower preprocessing time, due to significantly less tetrahedra.
step forward in increasing overall understanding of blood flow phenomena. These tools are particularly valuablefor interdisciplinary work in which simulation results must be conveyed to a clinician or surgeon for treatmentplanning.
As mentioned in Section 1, the first approach used streamlines and surface rendering to render flow. Wefound that the volume rendering approach was more effective than streamlines in visualization of the data.Observing small scale flow phenomena with streamlines requires a large number of lines to be rendered, whichcan occlude other lines and create an overly cluttered visualization. Conversely, fewer streamlines give a moreclear visualization, while discarding small scale phenomena. With volume rendering, the user can observe smallscale flow phenomena that are often missed when relying on streamlines alone.
There are several values that can be changed to optimize performance for a given dataset. First, the minimumsize of an octree node can be set so as to control the number of textures generated. Additionally, the minimumnumber of tetrahedra contained within a node can be set as well. Depending on the number of tetrahedra, thetexture size can also be set, as the size of the texture should be similar to the number of tetrahedra. Finally, thenumber of polygonal slices used can be changed, to increase image quality at the expense of framerate, as seenin Table 1.
Because of the ability to specify minimum node sizes, our implementation can scale well with the size of thedata, keeping performance high at the cost of resolution.
6. CONCLUSION AND FURTHER WORK
In this paper, we presented a novel method of visualizing blood flow in blood vessels with volume rendering inan immersive 3D CAVE environment. We resampled unstructured tetrahedral data into a regular voxel grid,used slice based volume rendering combined with an octree data structure, and included tools such as animation,triangle mesh surfaces, and clipping planes. We are able to achieve real time performance, allowing users tointeract with the blood vessel in real time.
We believe our tool conveys understanding of the simulation data very clearly. Due to the high performance,intuitive interface, and novel methods of visualization, we believe this tool is a great help in collaborative, inter-disciplinary environments, allowing scientists, engineers, and clinicians all to quickly and clearly view simulationdata for use in collaborative efforts.
Possible further work includes visualization of directional components of the flow, through streamlines orother methods, as well as out of core caching schemes, allowing more detailed datasets to be loaded.
7. ACKNOWLEDGMENTS
Support of the UCSD Chancellor’s Grant, the Burroughs Wellcome Fund Career Award at the Scientific Interface,and NIH grant number HL102596A is gratefully acknowledged. We would like to acknowledge the contributionsof Sasha Koruga and Kenneth Benner, for their work on the first iteration of this project and Dibyendu Senguptafor helping to supply the Kawasaki dataset.
REFERENCES
[1] Cabral, B., Cam, N., and Foran, J., “Accelerated volume rendering and tomographic reconstruction usingtexture mapping hardware,” in [Proceedings of the 1994 symposium on Volume visualization ], VVS ’94,91–98, ACM, New York, NY, USA (1994).
[2] LaMar, E., Hamann, B., and Joy, K. I., “Multiresolution techniques for interactive texture-based volumevisualization,” in [Proceedings of the conference on Visualization ’99: celebrating ten years ], VIS ’99, 355–361, IEEE Computer Society Press, Los Alamitos, CA, USA (1999).
[3] Plate, J., Tirtasana, M., Carmona, R., and Frohlich, B., “Octreemizer: a hierarchical approach for interac-tive roaming through very large volumes,” in [Proceedings of the symposium on Data Visualisation 2002 ],VISSYM ’02, 53–ff, Eurographics Association, Aire-la-Ville, Switzerland, Switzerland (2002).
[4] Chopra, P. and Meyer, J., “Incremental slicing revisited: Accelerated volume rendering of unstructuredmeshes,” in [Proc. IASTED Visualization, Imaging and Image Processing ], IASTED ’02, 533–538 (2002).
[5] Weiler, M., Kraus, M., and Ertl, T., “Hardware-based view-independent cell projection,” in [Proceedings ofthe 2002 IEEE symposium on Volume visualization and graphics ], VVS ’02, 13–22, IEEE Press, Piscataway,NJ, USA (2002).
[6] Callahan, S. P., Ikits, M., Comba, J. L. D., and Silva, C. T., “Hardware-assisted visibility sorting forunstructured volume rendering,” IEEE Transactions on Visualization and Computer Graphics 11, 285–295(May 2005).
[7] Schulze, J., Wossner, U., Walz, S., and Lang, U., “Volume rendering in a virtual environment,” in [Proceed-ings of 5th IPTW and Eurographics Virtual Environments ], 187–198, Springer Verlag (2001).
[8] Bartz, D., Straßer, W., Skalej, M., and Welte, D., “Interactive exploration of extra- and intracranial bloodvessels,” in [Proceedings of the 10th IEEE Visualization 1999 Conference (VIS ’99) ], VISUALIZATION ’99,–, IEEE Computer Society, Washington, DC, USA (1999).
[9] Tsuchiya, K., Katase, S., Hachiya, J., and Shiokawa, Y., “Volume-rendered 3d display of mr angiograms inthe diagnosis of cerebral arteriovenous malformations,” Acta Radiologica 44(6), 675–679 (2003).
[10] Kindlmann, G. L., Weinstein, D. M., Jones, G. M., Johnson, C. R., Capecchi, M. R., and Keller, C.,“Practical vessel imaging by computed tomography in live transgenic mouse models for human tumors,”Molecular Imaging 4(4), 417–24 (2005).
[11] Rantzau, D., Lang, U., and Ruhle, R., “Collaborative and interactive visualization in a distributed highperformance software environment,” in [Proceedings of the International Workshop on High PerformanceComputing for Graphics and Visualization ], (1996).
[12] Schroeder, W., Martin, K., and Lorensen, B., [Visualization Toolkit: An Object-Oriented Approach to 3DGraphics, 4th Edition ], Kitware, fourth ed. (2006).
[13] Bazilevs, Y., Hsu, M.-C., Zhang, Y., Wang, W., Kvamsdal, T., Hentschel, S., and Isaksen, J., “Computa-tional vascular fluid-structure interaction: methodology and application to cerebral aneurysms,” 9, 481–498(2010). 10.1007/s10237-010-0189-7.
[14] Zhang, Y., Wang, W., Liang, X., Bazilevs, Y., Hsu, M.-C., Kvamsdal, T., Brekken, R., and Isaksen, J.,“High-fidelity tetrahedral mesh generation from medical imaging data for fluid-structure interaction analysisof cerebral aneurysms,” CMES: Computer Modeling in Engineering & Sciences 42, 141–150 (2009).
[15] Holman, R., Belay, E., Christensen, K., Folkema, A., Steiner, C., and Schonberger, L., “Hospitalizations forkawasaki syndrome among children in the united states, 1997-2007,” Pediatric Infectious Disease Journal 29,483–488 (2010).
[16] “Simvascular: Cardiovascular modeling and simulation application,” (2011).http://wiki.simtk.org/simvascular/.
[17] “Meshsim,” (2011). http://www.simmetrix.com/products/meshsim/MeshSim.html.
[18] “Parallel hierarchic adaptive stabilized transient analysis (phasta),” (2011).https://www.scorec.rpi.edu/wiki/PHASTA.
[19] “Collaborative vision and simulation environment (covise),” (2011).http://www.hlrs.de/organization/av/vis/covise.
Related Documents


![RESound: Interactive Sound Rendering for Dynamic Virtual ...gamma-web.iacs.umd.edu/Sound/RESound/RESound.pdf · worlds [10, 27]. In addition to immersive environments, au-ditory display](https://static.cupdf.com/doc/110x72/5f4e810ad5a8656e6f10645b/resound-interactive-sound-rendering-for-dynamic-virtual-gamma-webiacsumdedusoundresound.jpg)
