© 2015 International Monetary Fund IMF Country Report No. 15/281 DEMOCRATIC REPUBLIC OF THE CONGO SELECTED ISSUES This Selected Issues paper on the Democratic Republic of the Congo was prepared by a staff team of the International Monetary Fund as background documentation for the periodic consultation with the Democratic Republic of the Congo. It is based on the information available at the time it was completed on August 20, 2015. Copies of this report are available to the public from International Monetary Fund Publication Services PO Box 92780 Washington, D.C. 20090 Telephone: (202) 623-7430 Fax: (202) 623-7201 E-mail: [email protected] Web: http://www.imf.org Price: $18.00 per printed copy International Monetary Fund Washington, D.C. October 2015

Welcome message from author
This document is posted to help you gain knowledge. Please leave a comment to let me know what you think about it! Share it to your friends and learn new things together.
Transcript
© 2015 International Monetary Fund
IMF Country Report No. 15/281
DEMOCRATIC REPUBLIC OF THE CONGO SELECTED ISSUES
This Selected Issues paper on the Democratic Republic of the Congo was prepared by a
staff team of the International Monetary Fund as background documentation for the
periodic consultation with the Democratic Republic of the Congo. It is based on the
information available at the time it was completed on August 20, 2015.
Copies of this report are available to the public from
International Monetary Fund Publication Services
PO Box 92780 Washington, D.C. 20090
Telephone: (202) 623-7430 Fax: (202) 623-7201
E-mail: [email protected] Web: http://www.imf.org
Price: $18.00 per printed copy
International Monetary Fund
Washington, D.C.
October 2015
DEMOCRATIC REPUBLIC OF THE CONGO SELECTED ISSUES
Approved By African Department
Prepared by Messrs. Toé, Maino, Koulet-Vickot, Hellwig, Melhado (all AFR), Petit (FAD), and Mvogo (Economist at the Resident Representative’s office in Kinshasa).
TAKING STOCK OF POVERTY IN THE DEMOCRATIC REPUBLIC OF THE CONGO ______________4
A. Recent Progress in Poverty Reduction ___________________________________________________________4
B. Drivers of Progress ______________________________________________________________________________5
C. Main Challenges Going Forward_________________________________________________________________6
D. Policy Recommendations ________________________________________________________________________7
References _______________________________________________________________________________________ 11 FIGURES 1. Indicators of Poverty _____________________________________________________________________________4 2. Selected Social Indicators, 2005–12 ______________________________________________________________5 3. Macroeconomic Performance and Poverty ______________________________________________________6 4. Poverty Reduction, Unemployment, Underemployment _________________________________________8 5. Government Expenditures on Education and Health ____________________________________________8 6. Poverty and Education ___________________________________________________________________________9
TABLES 1. Millennium Development Goals _______________________________________________________________ 10
THE QUEST TOWARDS DIVERSIFICATION _____________________________________________________ 12
A. The Structure of the Congolese Economy _____________________________________________________ 12
B. Growth and Factor Inputs ______________________________________________________________________ 16
C. Export Diversification __________________________________________________________________________ 19
D. The Congolese Informal Economy: a Digression ______________________________________________ 24
E. Conclusion _____________________________________________________________________________________ 25
References _______________________________________________________________________________________ 26
CONTENTS
August 20, 2015
DEMOCRATIC REPUBLIC OF THE CONGO
2 INTERNATIONAL MONETARY FUND
BOXES 1. Measuring Export Diversification ______________________________________________________________ 19
FIGURES 1. Real GDP Growth and GDP by Sector __________________________________________________________ 13 2. GDP Contributions by Sector Compared to SSA Countries ____________________________________ 14 3. Sub-Saharan Africa and Comparator Countries: Depth of Integration in Global Value Chains, Average 2008–12 _________________________________________________________________________________ 15 4. GDP Contributions by Sector __________________________________________________________________ 16 5. Productivity ____________________________________________________________________________________ 17 6. Employment by Sector and Gender ____________________________________________________________ 18 7. Economic Diversification: DRC vs. SSA Countries ______________________________________________ 20 8. Export Diversification __________________________________________________________________________ 22 9. Export Diversification and Quality Index _______________________________________________________ 24
TABLES 1. Output Volatility and Product Diversification __________________________________________________ 23
THE CONTRIBUTION OF THE MINING SECTOR TO THE CONGOLESE ECONOMY ___________ 27
A. Background ____________________________________________________________________________________ 27
B. The Mining Sector: The Engine of Economic Growth __________________________________________ 27
C. Factors Behind the Recent Mining Sector Growth _____________________________________________ 31
D. The Current Landscape ________________________________________________________________________ 33
References _______________________________________________________________________________________ 36 FIGURES 1. Contribution to Growth and Structure of GDP _________________________________________________ 28 2. Mineral Exports and FDI _______________________________________________________________________ 29 3. Mining Payments to Government and Tax Structures _________________________________________ 30 4. Mineral Production, 2014–20 __________________________________________________________________ 35
TABLES 1. Mining Fiscal Regimes: DRC and Peer Comparators ___________________________________________ 32 2. Comparative Fiscal Regimes Under Current and Draft Mining Codes _________________________ 34
STRENGTHENING BUDGET CREDIBILITY ______________________________________________________ 37
A. Actual and Forecasted Resources______________________________________________________________ 37
B. Actual and Budget Allocations _________________________________________________________________ 39
C. The Road to Enhance Budget Credibility ______________________________________________________ 43 FIGURES 1a. Forecasted and Executed Resources __________________________________________________________ 38 1b. Forecasted and Executed External Resources, Tax and Non-Tax Revenue ____________________ 38 2a. Forecasted and Executed Expenditures _______________________________________________________ 40 2b. Forecasted and Executed Foreign/Domestically-Financed Expenditures _____________________ 40
DEMOCRATIC REPUBLIC OF THE CONGO
INTERNATIONAL MONETARY FUND 3
TABLES 1. Democratic Republic of the Congo: Breakdown of the Budget/Execution _____________________ 39 2. Democratic Republic of the Congo: Breakdown of the Budget / Execution ___________________ 41 3. Execution Rates for Domestically-Funded _____________________________________________________ 42 4. Execution for Domestically Funded ____________________________________________________________ 42
FINANCIAL INCLUSION IN THE DEMOCRATIC REPUBLIC OF THE CONGO: PERFORMANCE
AND CHALLENGES ______________________________________________________________________________ 44
A. Recent Trends _________________________________________________________________________________ 44
B. Benchmarking DRC ____________________________________________________________________________ 44
C. Barriers to Access ______________________________________________________________________________ 47
D. Policy Recommendations ______________________________________________________________________ 50
References _______________________________________________________________________________________ 52 FIGURES 1. Access to and Use of Financial Services ________________________________________________________ 45 2. Financial Inclusion Gaps in DRC and SSA ______________________________________________________ 46 3. Access Strand Across the Region ______________________________________________________________ 47 4. Access Strands 2014 by Income Categories ___________________________________________________ 48 5. Mobile Money Accounts in DRC and SSA______________________________________________________ 49 6. Enterprise Survey Indicators, 2013 _____________________________________________________________ 49 APPENDIX TABLES 1. Variables Description __________________________________________________________________________ 53 2. Regression Results _____________________________________________________________________________ 54
DEMOCRATIC REPUBLIC OF THE CONGO
4 INTERNATIONAL MONETARY FUND
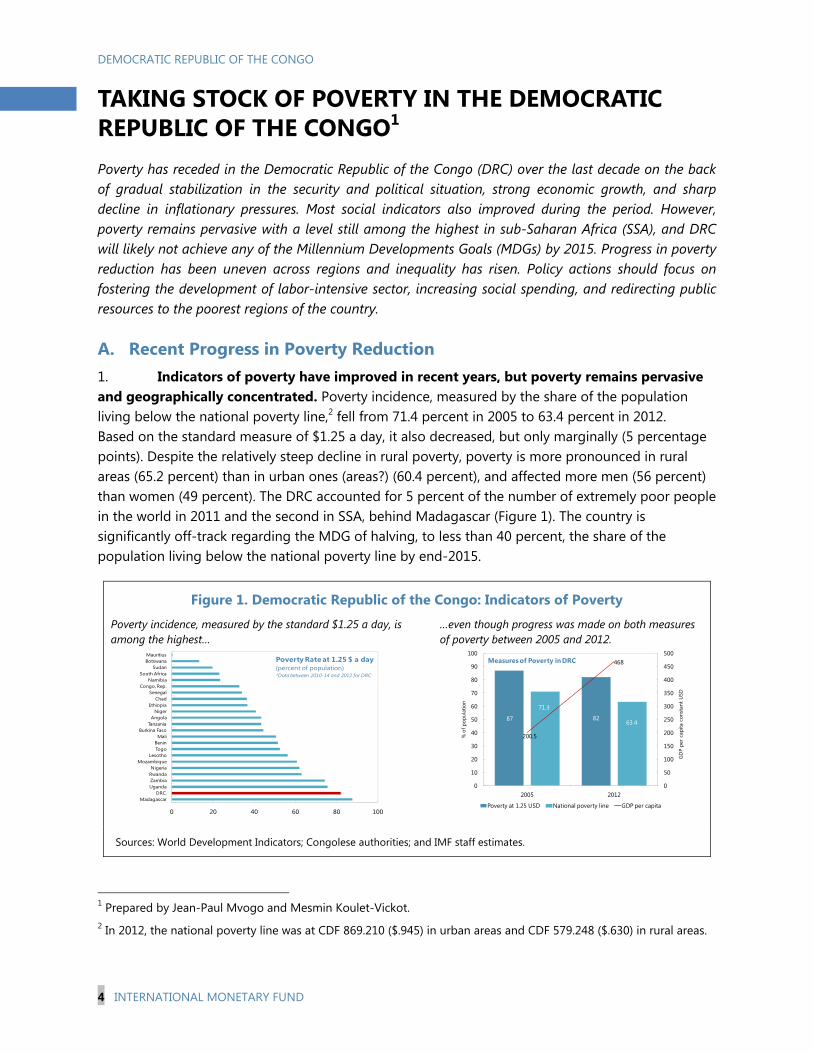
TAKING STOCK OF POVERTY IN THE DEMOCRATIC REPUBLIC OF THE CONGO1 Poverty has receded in the Democratic Republic of the Congo (DRC) over the last decade on the back of gradual stabilization in the security and political situation, strong economic growth, and sharp decline in inflationary pressures. Most social indicators also improved during the period. However, poverty remains pervasive with a level still among the highest in sub-Saharan Africa (SSA), and DRC will likely not achieve any of the Millennium Developments Goals (MDGs) by 2015. Progress in poverty reduction has been uneven across regions and inequality has risen. Policy actions should focus on fostering the development of labor-intensive sector, increasing social spending, and redirecting public resources to the poorest regions of the country.
A. Recent Progress in Poverty Reduction 1. Indicators of poverty have improved in recent years, but poverty remains pervasive and geographically concentrated. Poverty incidence, measured by the share of the population living below the national poverty line,2 fell from 71.4 percent in 2005 to 63.4 percent in 2012. Based on the standard measure of $1.25 a day, it also decreased, but only marginally (5 percentage points). Despite the relatively steep decline in rural poverty, poverty is more pronounced in rural areas (65.2 percent) than in urban ones (areas?) (60.4 percent), and affected more men (56 percent) than women (49 percent). The DRC accounted for 5 percent of the number of extremely poor people in the world in 2011 and the second in SSA, behind Madagascar (Figure 1). The country is significantly off-track regarding the MDG of halving, to less than 40 percent, the share of the population living below the national poverty line by end-2015.
Figure 1. Democratic Republic of the Congo: Indicators of Poverty
Poverty incidence, measured by the standard $1.25 a day, is among the highest…
…even though progress was made on both measures of poverty between 2005 and 2012.
Sources: World Development Indicators; Congolese authorities; and IMF staff estimates.
1 Prepared by Jean-Paul Mvogo and Mesmin Koulet-Vickot. 2 In 2012, the national poverty line was at CDF 869.210 ($.945) in urban areas and CDF 579.248 ($.630) in rural areas.
0 20 40 60 80 100
MadagascarDRC.
UgandaZambiaRwandaNigeria
MozambiqueLesotho
TogoBenin
MaliBurkina Faso
TanzaniaAngola
NigerEthiopia
ChadSenegal
Congo, Rep.Namibia
South AfricaSudan
BotswanaMauritius
Poverty Rate at 1.25 $ a day(percent of population)*Data between 2010-14 and 2012 for DRC
87 82
71.3
63.4
200.5
468
0
50
100
150
200
250
300
350
400
450
500
0
10
20
30
40
50
60
70
80
90
100
2005 2012
GD
P pe
r ca
pita
con
stan
t U
SD
% o
f pop
ulat
ion
Measures of Poverty in DRC
Poverty at 1.25 USD National poverty line GDP per capita
DEMOCRATIC REPUBLIC OF THE CONGO
INTERNATIONAL MONETARY FUND 5
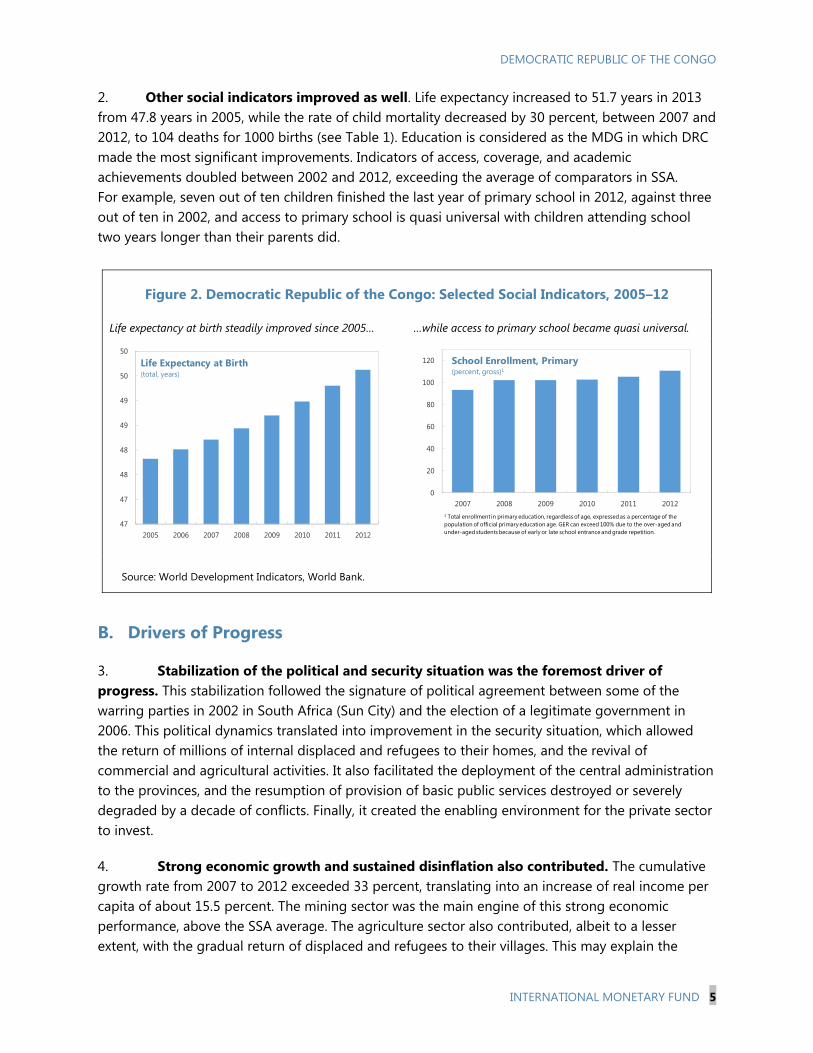
2. Other social indicators improved as well. Life expectancy increased to 51.7 years in 2013 from 47.8 years in 2005, while the rate of child mortality decreased by 30 percent, between 2007 and 2012, to 104 deaths for 1000 births (see Table 1). Education is considered as the MDG in which DRC made the most significant improvements. Indicators of access, coverage, and academic achievements doubled between 2002 and 2012, exceeding the average of comparators in SSA. For example, seven out of ten children finished the last year of primary school in 2012, against three out of ten in 2002, and access to primary school is quasi universal with children attending school two years longer than their parents did.
Figure 2. Democratic Republic of the Congo: Selected Social Indicators, 2005–12
Life expectancy at birth steadily improved since 2005… …while access to primary school became quasi universal.
Source: World Development Indicators, World Bank.
B. Drivers of Progress
3. Stabilization of the political and security situation was the foremost driver of progress. This stabilization followed the signature of political agreement between some of the warring parties in 2002 in South Africa (Sun City) and the election of a legitimate government in 2006. This political dynamics translated into improvement in the security situation, which allowed the return of millions of internal displaced and refugees to their homes, and the revival of commercial and agricultural activities. It also facilitated the deployment of the central administration to the provinces, and the resumption of provision of basic public services destroyed or severely degraded by a decade of conflicts. Finally, it created the enabling environment for the private sector to invest.
4. Strong economic growth and sustained disinflation also contributed. The cumulative growth rate from 2007 to 2012 exceeded 33 percent, translating into an increase of real income per capita of about 15.5 percent. The mining sector was the main engine of this strong economic performance, above the SSA average. The agriculture sector also contributed, albeit to a lesser extent, with the gradual return of displaced and refugees to their villages. This may explain the
47
47
48
48
49
49
50
50
2005 2006 2007 2008 2009 2010 2011 2012
Life Expectancy at Birth(total, years)
0
20
40
60
80
100
120
2007 2008 2009 2010 2011 2012
School Enrollment, Primary (percent, gross)1
1 Total enrollment in primary education, regardless of age, expressed as a percentage of the population of official primary education age. GER can exceed 100% due to the over-aged and under-aged students because of early or late school entrance and grade repetition.
DEMOCRATIC REPUBLIC OF THE CONGO
6 INTERNATIONAL MONETARY FUND
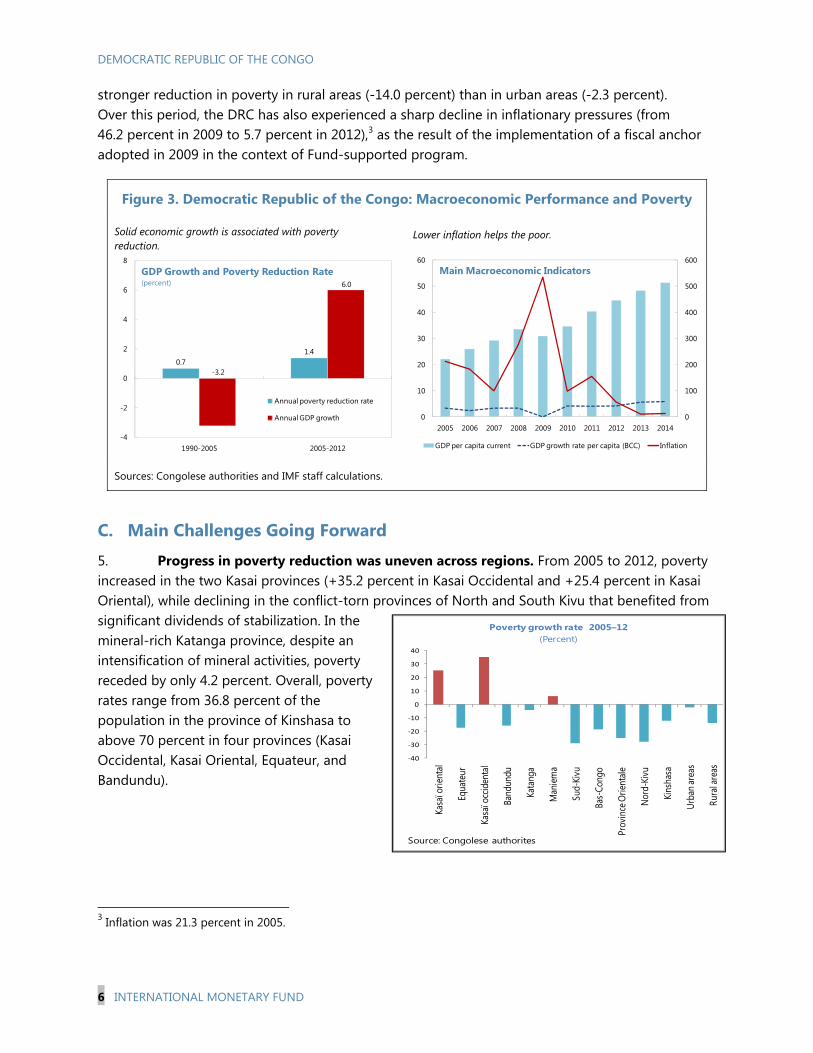
stronger reduction in poverty in rural areas (-14.0 percent) than in urban areas (-2.3 percent). Over this period, the DRC has also experienced a sharp decline in inflationary pressures (from 46.2 percent in 2009 to 5.7 percent in 2012),3 as the result of the implementation of a fiscal anchor adopted in 2009 in the context of Fund-supported program.
Figure 3. Democratic Republic of the Congo: Macroeconomic Performance and Poverty
Solid economic growth is associated with poverty reduction.
Lower inflation helps the poor.
Sources: Congolese authorities and IMF staff calculations.
C. Main Challenges Going Forward
5. Progress in poverty reduction was uneven across regions. From 2005 to 2012, poverty increased in the two Kasai provinces (+35.2 percent in Kasai Occidental and +25.4 percent in Kasai Oriental), while declining in the conflict-torn provinces of North and South Kivu that benefited from significant dividends of stabilization. In the mineral-rich Katanga province, despite an intensification of mineral activities, poverty receded by only 4.2 percent. Overall, poverty rates range from 36.8 percent of the population in the province of Kinshasa to above 70 percent in four provinces (Kasai Occidental, Kasai Oriental, Equateur, and Bandundu).
3 Inflation was 21.3 percent in 2005.
0.71.4
-3.2
6.0
-4
-2
0
2
4
6
8
1990-2005 2005-2012
GDP Growth and Poverty Reduction Rate(percent)
Annual poverty reduction rate
Annual GDP growth 0
100
200
300
400
500
600
0
10
20
30
40
50
60
2005 2006 2007 2008 2009 2010 2011 2012 2013 2014
Main Macroeconomic Indicators
GDP per capita current GDP growth rate per capita (BCC) Inflation
‐40
-30
-20
-10
0
10
20
30
40
Kasa
ï orie
ntal
Equa
teur
Kasa
ï occ
iden
tal
Band
undu
Kata
nga
Man
iema
Sud-
Kivu
Bas-
Cong
o
Prov
ince
Orie
ntale
Nord
-Kivu
Kins
hasa
Urba
n are
as
Rura
l are
as
Poverty growth rate 2005–12(Percent)
Source: Congolese authorites
DEMOCRATIC REPUBLIC OF THE CONGO
INTERNATIONAL MONETARY FUND 7
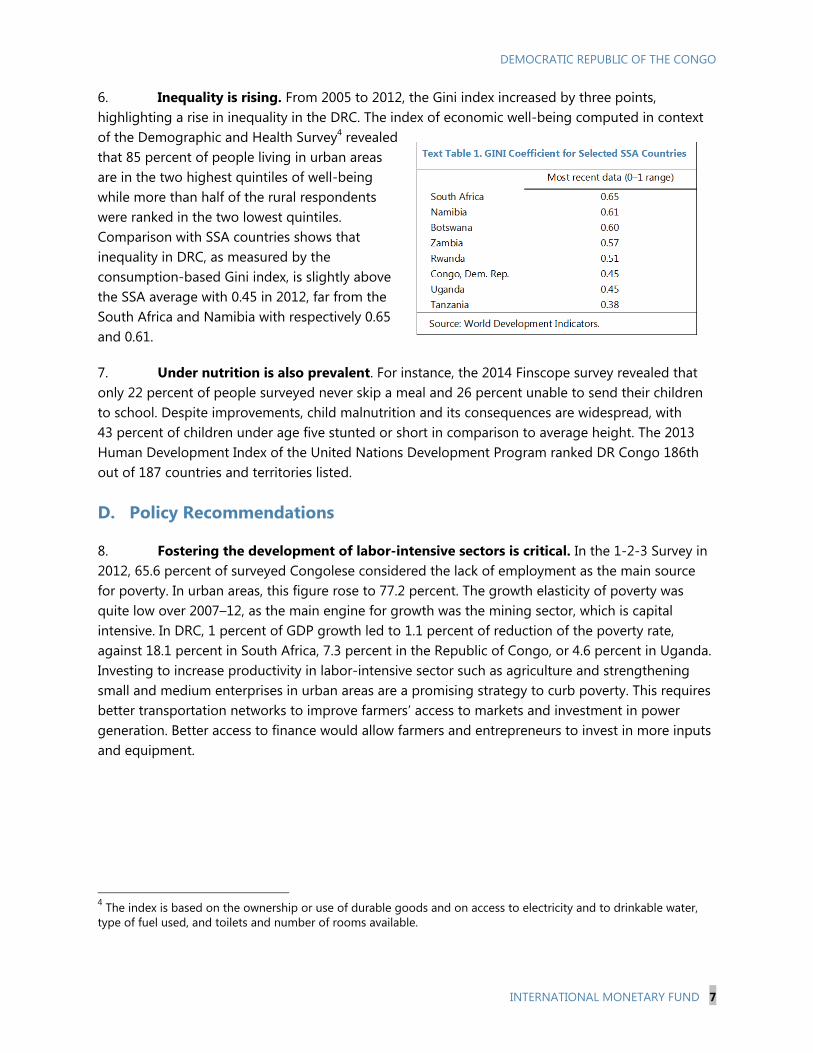
6. Inequality is rising. From 2005 to 2012, the Gini index increased by three points, highlighting a rise in inequality in the DRC. The index of economic well-being computed in context of the Demographic and Health Survey4 revealed that 85 percent of people living in urban areas are in the two highest quintiles of well-being while more than half of the rural respondents were ranked in the two lowest quintiles. Comparison with SSA countries shows that inequality in DRC, as measured by the consumption-based Gini index, is slightly above the SSA average with 0.45 in 2012, far from the South Africa and Namibia with respectively 0.65 and 0.61.
7. Under nutrition is also prevalent. For instance, the 2014 Finscope survey revealed that only 22 percent of people surveyed never skip a meal and 26 percent unable to send their children to school. Despite improvements, child malnutrition and its consequences are widespread, with 43 percent of children under age five stunted or short in comparison to average height. The 2013 Human Development Index of the United Nations Development Program ranked DR Congo 186th out of 187 countries and territories listed.
D. Policy Recommendations
8. Fostering the development of labor-intensive sectors is critical. In the 1-2-3 Survey in 2012, 65.6 percent of surveyed Congolese considered the lack of employment as the main source for poverty. In urban areas, this figure rose to 77.2 percent. The growth elasticity of poverty was quite low over 2007–12, as the main engine for growth was the mining sector, which is capital intensive. In DRC, 1 percent of GDP growth led to 1.1 percent of reduction of the poverty rate, against 18.1 percent in South Africa, 7.3 percent in the Republic of Congo, or 4.6 percent in Uganda. Investing to increase productivity in labor-intensive sector such as agriculture and strengthening small and medium enterprises in urban areas are a promising strategy to curb poverty. This requires better transportation networks to improve farmers’ access to markets and investment in power generation. Better access to finance would allow farmers and entrepreneurs to invest in more inputs and equipment.
4 The index is based on the ownership or use of durable goods and on access to electricity and to drinkable water, type of fuel used, and toilets and number of rooms available.
DEMOCRATIC REPUBLIC OF THE CONGO
8 INTERNATIONAL MONETARY FUND
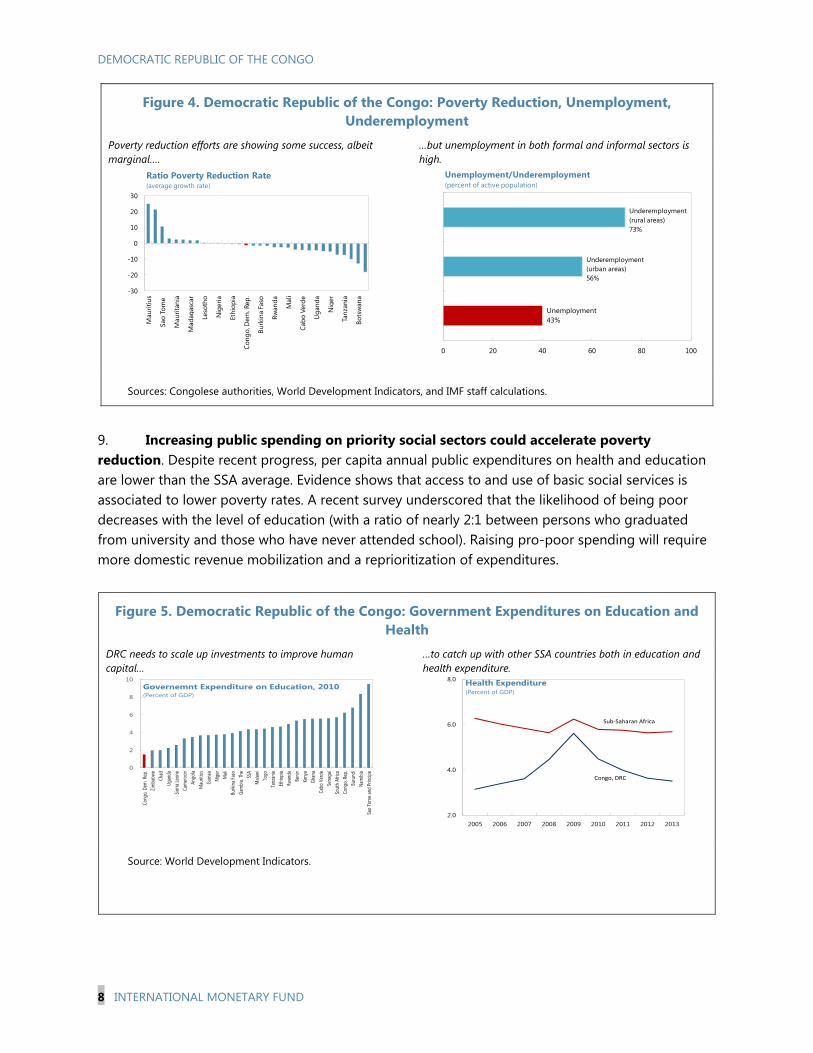
Figure 4. Democratic Republic of the Congo: Poverty Reduction, Unemployment, Underemployment
Poverty reduction efforts are showing some success, albeit marginal….
…but unemployment in both formal and informal sectors is high.
Sources: Congolese authorities, World Development Indicators, and IMF staff calculations.
9. Increasing public spending on priority social sectors could accelerate poverty reduction. Despite recent progress, per capita annual public expenditures on health and education are lower than the SSA average. Evidence shows that access to and use of basic social services is associated to lower poverty rates. A recent survey underscored that the likelihood of being poor decreases with the level of education (with a ratio of nearly 2:1 between persons who graduated from university and those who have never attended school). Raising pro-poor spending will require more domestic revenue mobilization and a reprioritization of expenditures.
Figure 5. Democratic Republic of the Congo: Government Expenditures on Education and Health
DRC needs to scale up investments to improve human capital…
…to catch up with other SSA countries both in education and health expenditure.
Source: World Development Indicators.
-30
-20
-10
0
10
20
30
Mau
ritiu
s
Sao
Tom
e
Mau
ritan
ia
Mad
agas
car
Leso
tho
Nig
eria
Ethi
opia
Cong
o, D
em. R
ep.
Burk
ina
Faso
Rwan
da
Mal
i
Cabo
Ver
de
Uga
nda
Nig
er
Tanz
ania
Bots
wan
a
Ratio Poverty Reduction Rate(average growth rate)
0 20 40 60 80 100
Unemployment/Underemployment(percent of active population)
Underemployment (rural areas)73%
Underemployment (urban areas)56%
Unemployment43%
0
2
4
6
8
10
Cong
o, De
m. R
ep.
Zimba
bwe
Chad
Ugan
daSie
rra Le
one
Cam
eroo
nAn
gola
Mau
ritius
Guine
aNi
ger
Mali
Burk
ina Fa
soGa
mbi
a, Th
eSS
AM
alawi
Togo
Tanz
ania
Ethio
pia
Rwan
daBe
ninKe
nya
Ghan
aCa
bo V
erde
Sene
gal
Sout
h Af
rica
Cong
o, Re
p.Bu
rund
iNa
mib
iaSa
o To
me a
nd Pr
incip
e
Governemnt Expenditure on Education, 2010(Percent of GDP)
2.0
4.0
6.0
8.0
2005 2006 2007 2008 2009 2010 2011 2012 2013
Health Expenditure (Percent of GDP)
Sub-Saharan Africa
Congo, DRC
DEMOCRATIC REPUBLIC OF THE CONGO
INTERNATIONAL MONETARY FUND 9
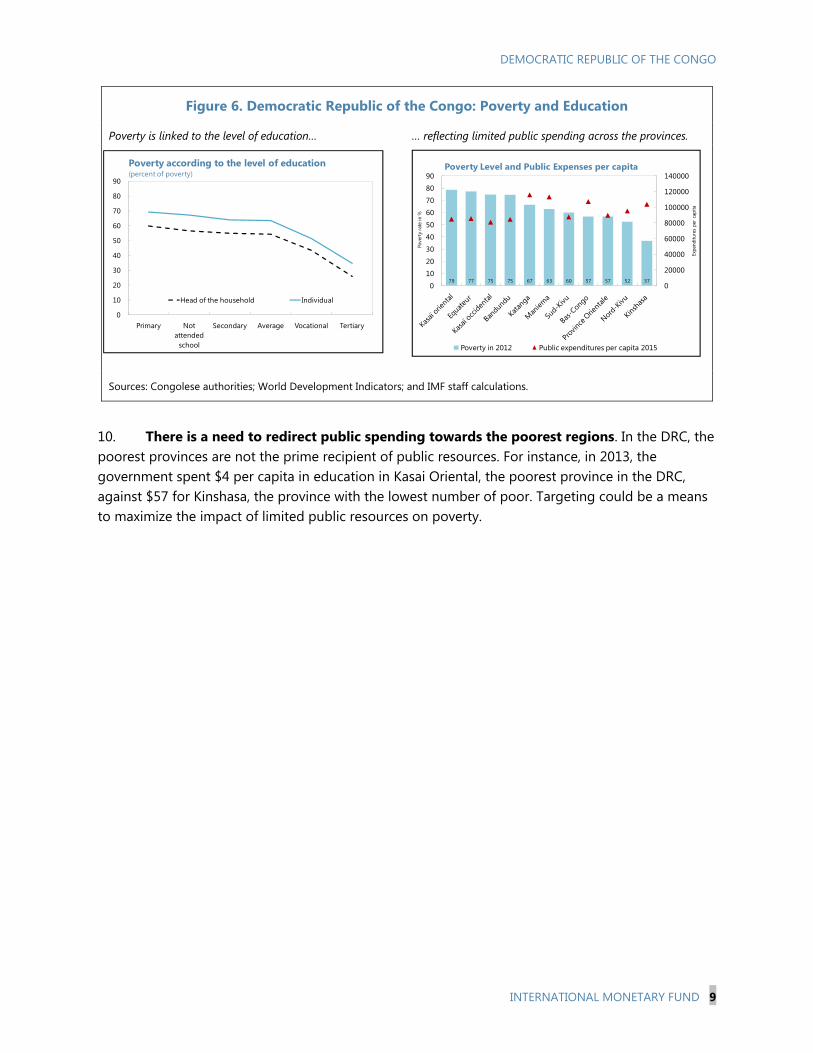
Figure 6. Democratic Republic of the Congo: Poverty and Education
Poverty is linked to the level of education… … reflecting limited public spending across the provinces.
Sources: Congolese authorities; World Development Indicators; and IMF staff calculations.
10. There is a need to redirect public spending towards the poorest regions. In the DRC, the poorest provinces are not the prime recipient of public resources. For instance, in 2013, the government spent $4 per capita in education in Kasai Oriental, the poorest province in the DRC, against $57 for Kinshasa, the province with the lowest number of poor. Targeting could be a means to maximize the impact of limited public resources on poverty.
0
10
20
30
40
50
60
70
80
90
Primary Not attended
school
Secondary Average Vocational Tertiary
Poverty according to the level of education(percent of poverty)
Head of the household Individual
79 77 75 75 67 63 60 57 57 52 370
20000
40000
60000
80000
100000
120000
140000
0
10
20
30
40
50
60
70
80
90
Expe
nditu
res
per
capi
ta
Pove
rty
rate
in %
Poverty Level and Public Expenses per capita
Poverty in 2012 Public expenditures per capita 2015
DEMOCRATIC REPUBLIC OF THE CONGO
10 INTERNATIONAL MONETARY FUND
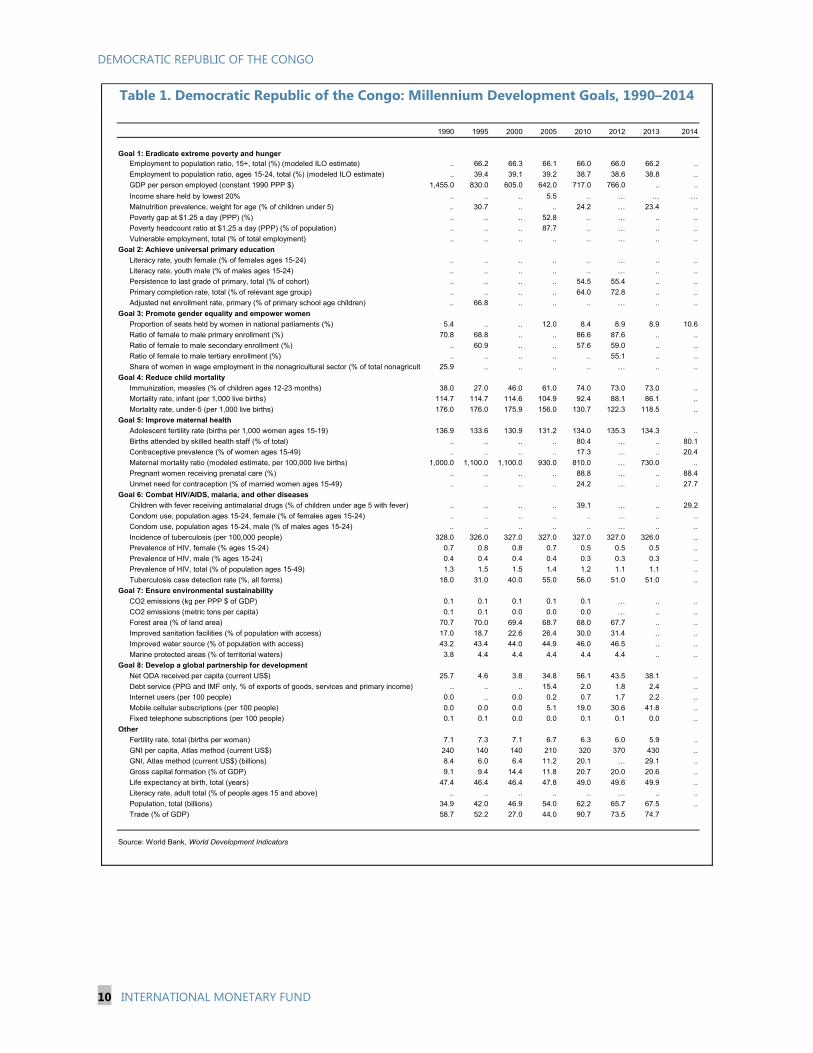
Table 1. Democratic Republic of the Congo: Millennium Development Goals, 1990–2014
1990 1995 2000 2005 2010 2012 2013 2014
Goal 1: Eradicate extreme poverty and hungerEmployment to population ratio, 15+, total (%) (modeled ILO estimate) .. 66.2 66.3 66.1 66.0 66.0 66.2 ..
Employment to population ratio, ages 15-24, total (%) (modeled ILO estimate) .. 39.4 39.1 39.2 38.7 38.6 38.8 ..
GDP per person employed (constant 1990 PPP $) 1,455.0 830.0 605.0 642.0 717.0 766.0 .. ..
Income share held by lowest 20% .. .. .. 5.5 .. … … …
Malnutrition prevalence, weight for age (% of children under 5) .. 30.7 .. .. 24.2 … 23.4 ..
Poverty gap at $1.25 a day (PPP) (%) .. .. .. 52.8 .. … .. ..
Poverty headcount ratio at $1.25 a day (PPP) (% of population) .. .. .. 87.7 .. … .. ..
Vulnerable employment, total (% of total employment) .. .. .. .. .. … .. ..
Goal 2: Achieve universal primary education
Literacy rate, youth female (% of females ages 15-24) .. .. .. .. .. … .. ..
Literacy rate, youth male (% of males ages 15-24) .. .. .. .. .. … .. ..
Persistence to last grade of primary, total (% of cohort) .. .. .. .. 54.5 55.4 .. ..
Primary completion rate, total (% of relevant age group) .. .. .. .. 64.0 72.8 .. ..
Adjusted net enrollment rate, primary (% of primary school age children) .. 66.8 .. .. .. … .. ..
Goal 3: Promote gender equality and empower women
Proportion of seats held by women in national parliaments (%) 5.4 .. .. 12.0 8.4 8.9 8.9 10.6
Ratio of female to male primary enrollment (%) 70.8 68.8 .. .. 86.6 87.6 .. ..
Ratio of female to male secondary enrollment (%) .. 60.9 .. .. 57.6 59.0 .. ..
Ratio of female to male tertiary enrollment (%) .. .. .. .. .. 55.1 .. ..
Share of women in wage employment in the nonagricultural sector (% of total nonagricult 25.9 .. .. .. .. … .. ..
Goal 4: Reduce child mortality
Immunization, measles (% of children ages 12-23 months) 38.0 27.0 46.0 61.0 74.0 73.0 73.0 ..
Mortality rate, infant (per 1,000 live births) 114.7 114.7 114.6 104.9 92.4 88.1 86.1 ..
Mortality rate, under-5 (per 1,000 live births) 176.0 176.0 175.9 156.0 130.7 122.3 118.5 ..
Goal 5: Improve maternal health
Adolescent fertility rate (births per 1,000 women ages 15-19) 136.9 133.6 130.9 131.2 134.0 135.3 134.3 ..
Births attended by skilled health staff (% of total) .. .. .. .. 80.4 … .. 80.1
Contraceptive prevalence (% of women ages 15-49) .. .. .. .. 17.3 … .. 20.4
Maternal mortality ratio (modeled estimate, per 100,000 live births) 1,000.0 1,100.0 1,100.0 930.0 810.0 … 730.0 ..
Pregnant women receiving prenatal care (%) .. .. .. .. 88.8 … .. 88.4
Unmet need for contraception (% of married women ages 15-49) .. .. .. .. 24.2 … .. 27.7
Goal 6: Combat HIV/AIDS, malaria, and other diseases
Children with fever receiving antimalarial drugs (% of children under age 5 with fever) .. .. .. .. 39.1 … .. 29.2
Condom use, population ages 15-24, female (% of females ages 15-24) .. .. .. .. .. … .. ..
Condom use, population ages 15-24, male (% of males ages 15-24) .. .. .. .. .. … .. ..
Incidence of tuberculosis (per 100,000 people) 328.0 326.0 327.0 327.0 327.0 327.0 326.0 ..
Prevalence of HIV, female (% ages 15-24) 0.7 0.8 0.8 0.7 0.5 0.5 0.5 ..
Prevalence of HIV, male (% ages 15-24) 0.4 0.4 0.4 0.4 0.3 0.3 0.3 ..
Prevalence of HIV, total (% of population ages 15-49) 1.3 1.5 1.5 1.4 1.2 1.1 1.1 ..
Tuberculosis case detection rate (%, all forms) 18.0 31.0 40.0 55.0 56.0 51.0 51.0 ..
Goal 7: Ensure environmental sustainability
CO2 emissions (kg per PPP $ of GDP) 0.1 0.1 0.1 0.1 0.1 … .. ..
CO2 emissions (metric tons per capita) 0.1 0.1 0.0 0.0 0.0 … .. ..
Forest area (% of land area) 70.7 70.0 69.4 68.7 68.0 67.7 .. ..
Improved sanitation facilities (% of population with access) 17.0 18.7 22.6 26.4 30.0 31.4 .. ..
Improved water source (% of population with access) 43.2 43.4 44.0 44.9 46.0 46.5 .. ..
Marine protected areas (% of territorial waters) 3.8 4.4 4.4 4.4 4.4 4.4 .. ..
Goal 8: Develop a global partnership for development
Net ODA received per capita (current US$) 25.7 4.6 3.8 34.8 56.1 43.5 38.1 ..
Debt service (PPG and IMF only, % of exports of goods, services and primary income) .. .. .. 15.4 2.0 1.8 2.4 ..
Internet users (per 100 people) 0.0 .. 0.0 0.2 0.7 1.7 2.2 ..
Mobile cellular subscriptions (per 100 people) 0.0 0.0 0.0 5.1 19.0 30.6 41.8 ..
Fixed telephone subscriptions (per 100 people) 0.1 0.1 0.0 0.0 0.1 0.1 0.0 ..
Other
Fertility rate, total (births per woman) 7.1 7.3 7.1 6.7 6.3 6.0 5.9 ..
GNI per capita, Atlas method (current US$) 240 140 140 210 320 370 430 ..
GNI, Atlas method (current US$) (billions) 8.4 6.0 6.4 11.2 20.1 … 29.1 ..
Gross capital formation (% of GDP) 9.1 9.4 14.4 11.8 20.7 20.0 20.6 ..
Life expectancy at birth, total (years) 47.4 46.4 46.4 47.8 49.0 49.6 49.9 ..
Literacy rate, adult total (% of people ages 15 and above) .. .. .. .. .. … .. ..
Population, total (billions) 34.9 42.0 46.9 54.0 62.2 65.7 67.5 ..
Trade (% of GDP) 58.7 52.2 27.0 44.0 90.7 73.5 74.7
Source: World Bank, World Development Indicators
DEMOCRATIC REPUBLIC OF THE CONGO
INTERNATIONAL MONETARY FUND 11
References United Nations Development Program, 2014, “Progress Evaluation Achieved by the Republic of the
Congo towards the Millennium Developments Goals in 2012.”
Ministry of Planning, 2014, “Résultats de l'enquête sur l'emploi, le secteur informel et sur la consommation des ménages in 2012.”
Ministry of Planning and Ministry of Health, 2014, “Deuxième enquête démographique et de santé (EDS-DRC II 2013-2014).”
Ministry of Primary and Secondary Education, UNICEF and UNESCO, 2014, “Rapport d’état du système éducatif.”
DEMOCRATIC REPUBLIC OF THE CONGO
12 INTERNATIONAL MONETARY FUND
THE QUEST TOWARDS DIVERSIFICATION1 While natural resources have delivered strong economic growth over recent years, the Democratic Republic of the Congo (DRC) faces daunting challenges regarding export diversification and domestic production. Based on cross-country experiences, this note evaluates the type of structural reforms and economic diversification that could contribute to boost and sustain growth in DRC, underscoring the need for improving infrastructure and trade networks, reducing barriers to entry for new products, deepening financial markets, and investing in human capital.
A. The Structure of the Congolese Economy
1. Since the 2000, economic activity in the DRC recovered, exhibiting vigorous growth. From 2002–08, real GDP growth averaged 5.8, but slowed significantly in 2009 with the global financial falling to 2.9 percent. However, after 2010, economic activity recovered and growth remained strong. Over the last four years, real GDP growth averaged 7.8 percent, driven essentially by the mining sector. Inflation fell from 15.5 percent in 2011 to 1 percent in 2014 as the authorities adhered to a fiscal anchor.2 Higher mining exports and sustained foreign direct investment contributed to an overall balance of payment surplus, despite decreasing official transfers.3 International reserves started falling in 2014, further declining in 2015.
2. Notwithstanding recent success, sustaining high economic growth is becoming increasingly challenging. On the one hand, economic growth is projected at 9.2 percent for 2015 and 7.5 percent on average in 2016–19 on the back of continued expansion of mining production with new mines coming on stream. On the other hand, inflation is expected to remain low. Nonetheless, with the current trend decline in copper and oil prices, the current account position is projected to deteriorate over the medium term, economic growth would slow down, and international reserve coverage to fall below four weeks by 2019. Risks to the outlook include: (i) a sharper decline in commodity prices; (ii) continued delays in structural reforms; (iii) escalation of residual insecurity into conflicts.
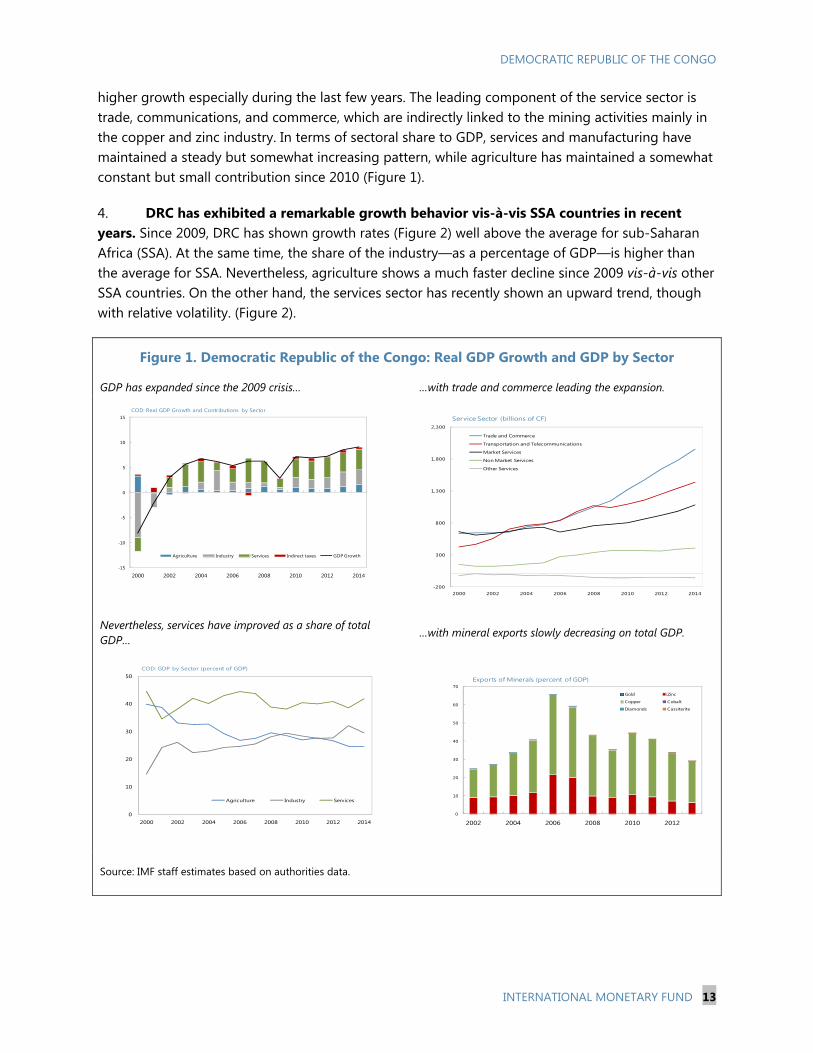
3. Diversification slowly progresses led by the service sector. Since 2006, exports of minerals have been steadily declining—as a percentage of GDP (Figure 1)—albeit the recent record production of 1 million tons of copper in 2014. While manufacturing—mainly, mining activities—is significant for the development of the country, the value added of services has been essential to the
1 Prepared by Rodolfo Maino. Dafina Glaser provided valuable research assistance. The assessment of diversification should be interpreted cautiously due to data limitation. 2 The fiscal anchor was adopted in the context of the 2009 Enhanced Credit Facility Program with the Fund, prohibiting financing from the central bank. 3 In 2014, copper production reached 1.065 million tons in 2014 and new projects should further expand production in the coming years. Last year alone, copper exports grew by 16.3 percent, making the country the world’s 6th largest copper exporter. The production of gold has more than doubled since 2013.
DEMOCRATIC REPUBLIC OF THE CONGO
INTERNATIONAL MONETARY FUND 13
higher growth especially during the last few years. The leading component of the service sector is trade, communications, and commerce, which are indirectly linked to the mining activities mainly in the copper and zinc industry. In terms of sectoral share to GDP, services and manufacturing have maintained a steady but somewhat increasing pattern, while agriculture has maintained a somewhat constant but small contribution since 2010 (Figure 1).
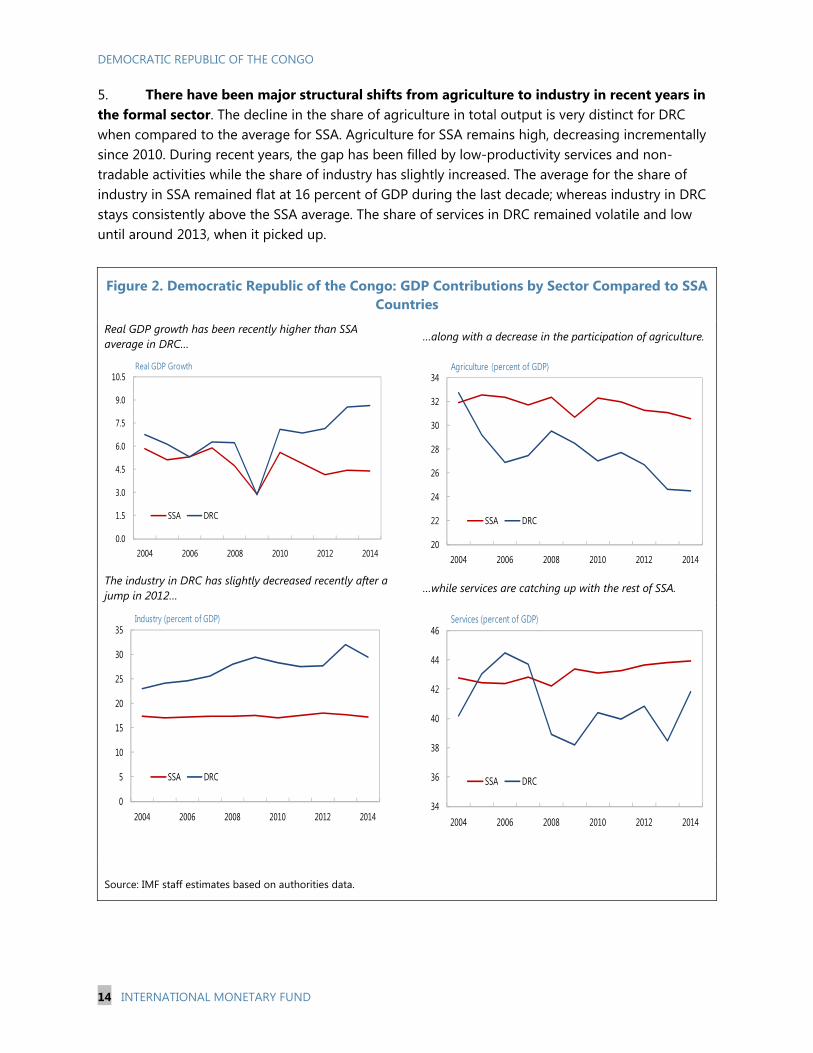
4. DRC has exhibited a remarkable growth behavior vis-à-vis SSA countries in recent years. Since 2009, DRC has shown growth rates (Figure 2) well above the average for sub-Saharan Africa (SSA). At the same time, the share of the industry—as a percentage of GDP—is higher than the average for SSA. Nevertheless, agriculture shows a much faster decline since 2009 vis-à-vis other SSA countries. On the other hand, the services sector has recently shown an upward trend, though with relative volatility. (Figure 2).
Figure 1. Democratic Republic of the Congo: Real GDP Growth and GDP by Sector
GDP has expanded since the 2009 crisis… …with trade and commerce leading the expansion.
Nevertheless, services have improved as a share of total GDP…
…with mineral exports slowly decreasing on total GDP.
Source: IMF staff estimates based on authorities data.
-15
-10
-5
0
5
10
15
2000 2002 2004 2006 2008 2010 2012 2014
COD: Real GDP Growth and Contributions by Sector
Agriculture Industry Services Indirect taxes GDP Growth
-200
300
800
1,300
1,800
2,300
2000 2002 2004 2006 2008 2010 2012 2014
Service Sector (billions of CF)
Trade and Commerce
Transportation and Telecommunications
Market Services
Non Market Services
Other Services
0
10
20
30
40
50
2000 2002 2004 2006 2008 2010 2012 2014
COD: GDP by Sector (percent of GDP)
Agriculture Industry Services
0
10
20
30
40
50
60
70
2002 2004 2006 2008 2010 2012
Exports of Minerals (percent of GDP)
Gold Zinc
Copper Cobalt
Diamonds Cassiterite
DEMOCRATIC REPUBLIC OF THE CONGO
14 INTERNATIONAL MONETARY FUND
5. There have been major structural shifts from agriculture to industry in recent years in the formal sector. The decline in the share of agriculture in total output is very distinct for DRC when compared to the average for SSA. Agriculture for SSA remains high, decreasing incrementally since 2010. During recent years, the gap has been filled by low-productivity services and non-tradable activities while the share of industry has slightly increased. The average for the share of industry in SSA remained flat at 16 percent of GDP during the last decade; whereas industry in DRC stays consistently above the SSA average. The share of services in DRC remained volatile and low until around 2013, when it picked up.
Figure 2. Democratic Republic of the Congo: GDP Contributions by Sector Compared to SSA Countries
Real GDP growth has been recently higher than SSA average in DRC…
…along with a decrease in the participation of agriculture.
The industry in DRC has slightly decreased recently after a jump in 2012…
…while services are catching up with the rest of SSA.
Source: IMF staff estimates based on authorities data.
0.0
1.5
3.0
4.5
6.0
7.5
9.0
10.5
2004 2006 2008 2010 2012 2014
Real GDP Growth
SSA DRC
20
22
24
26
28
30
32
34
2004 2006 2008 2010 2012 2014
Agriculture (percent of GDP)
SSA DRC
0
5
10
15
20
25
30
35
2004 2006 2008 2010 2012 2014
Industry (percent of GDP)
SSA DRC
34
36
38
40
42
44
46
2004 2006 2008 2010 2012 2014
Services (percent of GDP)
SSA DRC
DEMOCRATIC REPUBLIC OF THE CONGO
INTERNATIONAL MONETARY FUND 15
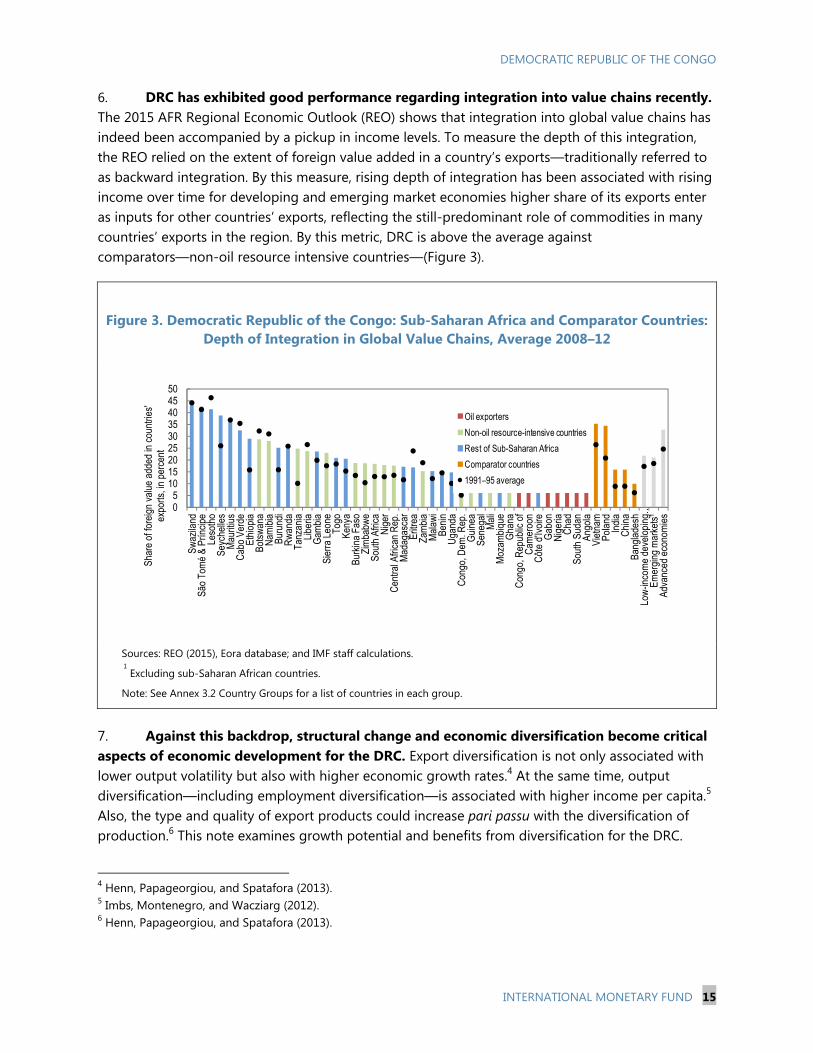
6. DRC has exhibited good performance regarding integration into value chains recently. The 2015 AFR Regional Economic Outlook (REO) shows that integration into global value chains has indeed been accompanied by a pickup in income levels. To measure the depth of this integration, the REO relied on the extent of foreign value added in a country’s exports—traditionally referred to as backward integration. By this measure, rising depth of integration has been associated with rising income over time for developing and emerging market economies higher share of its exports enter as inputs for other countries’ exports, reflecting the still-predominant role of commodities in many countries’ exports in the region. By this metric, DRC is above the average against comparators—non-oil resource intensive countries—(Figure 3).
Figure 3. Democratic Republic of the Congo: Sub-Saharan Africa and Comparator Countries: Depth of Integration in Global Value Chains, Average 2008–12
Sources: REO (2015), Eora database; and IMF staff calculations. 1 Excluding sub-Saharan African countries.
Note: See Annex 3.2 Country Groups for a list of countries in each group.
7. Against this backdrop, structural change and economic diversification become critical aspects of economic development for the DRC. Export diversification is not only associated with lower output volatility but also with higher economic growth rates.4 At the same time, output diversification—including employment diversification—is associated with higher income per capita.5 Also, the type and quality of export products could increase pari passu with the diversification of production.6 This note examines growth potential and benefits from diversification for the DRC.
4 Henn, Papageorgiou, and Spatafora (2013). 5 Imbs, Montenegro, and Wacziarg (2012). 6 Henn, Papageorgiou, and Spatafora (2013).
05
101520253035404550
Swaz
iland
São
Tom
é &
Prín
cipe
Leso
tho
Seyc
helle
sM
aurit
ius
Cab
o Ve
rde
Ethi
opia
Bots
wan
aN
amib
iaBu
rund
iR
wan
daTa
nzan
iaLi
beria
Gam
bia
Sier
ra L
eone
Togo
Keny
aBu
rkin
a Fa
soZi
mba
bwe
Sout
h Af
rica
Nig
erC
entra
l Afri
can
Rep
.M
adag
asca
rEr
itrea
Zam
bia
Mal
awi
Beni
nU
gand
aC
ongo
, Dem
. Rep
.G
uine
aSe
nega
lM
ali
Moz
ambi
que
Gha
naC
ongo
, Rep
ublic
of
Cam
eroo
nC
ôte
d'Iv
oire
Gab
onN
iger
iaC
had
Sout
h Su
dan
Ango
laVi
etna
mPo
land
Indi
aC
hina
Bang
lade
shLo
w-in
com
e de
velo
ping
…Em
ergi
ng m
arke
ts¹
Adva
nced
eco
nom
ies
Shar
e of
fore
ign
valu
e ad
ded
in c
ount
ries'
expo
rts, i
n pe
rcen
t
Oil exporters
Non-oil resource-intensive countries
Rest of Sub-Saharan Africa
Comparator countries
1991–95 average
DEMOCRATIC REPUBLIC OF THE CONGO
16 INTERNATIONAL MONETARY FUND
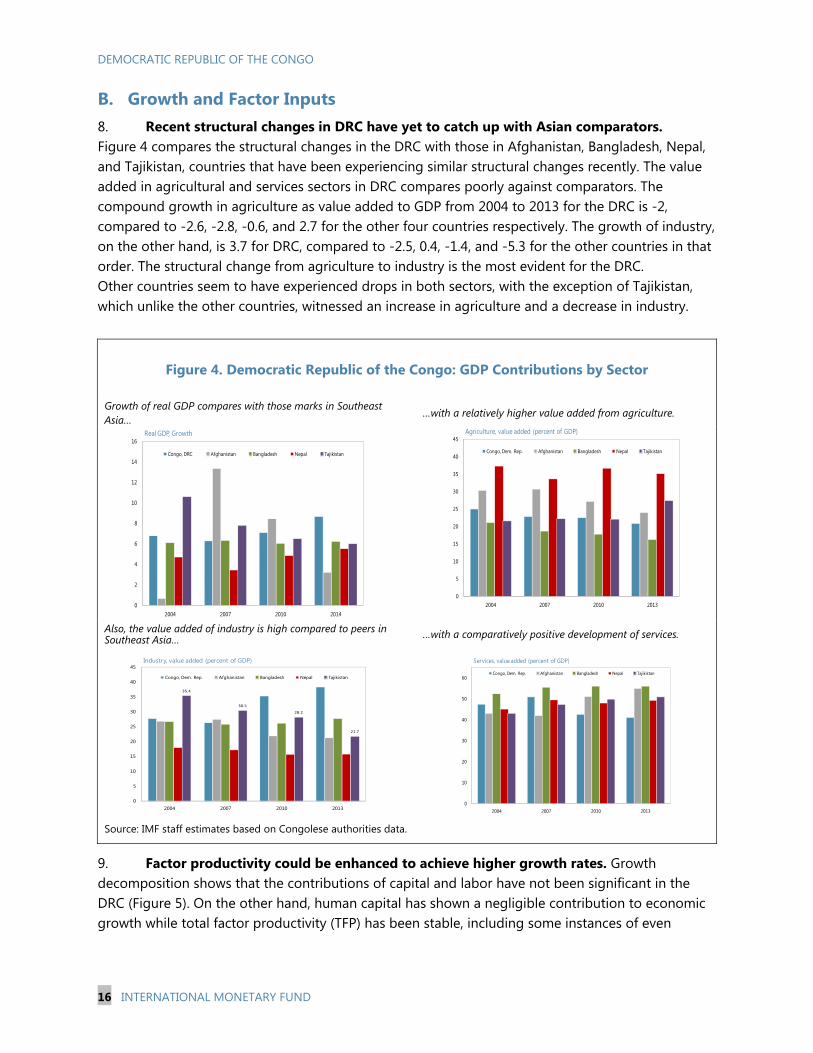
B. Growth and Factor Inputs 8. Recent structural changes in DRC have yet to catch up with Asian comparators. Figure 4 compares the structural changes in the DRC with those in Afghanistan, Bangladesh, Nepal, and Tajikistan, countries that have been experiencing similar structural changes recently. The value added in agricultural and services sectors in DRC compares poorly against comparators. The compound growth in agriculture as value added to GDP from 2004 to 2013 for the DRC is -2, compared to -2.6, -2.8, -0.6, and 2.7 for the other four countries respectively. The growth of industry, on the other hand, is 3.7 for DRC, compared to -2.5, 0.4, -1.4, and -5.3 for the other countries in that order. The structural change from agriculture to industry is the most evident for the DRC. Other countries seem to have experienced drops in both sectors, with the exception of Tajikistan, which unlike the other countries, witnessed an increase in agriculture and a decrease in industry.
Figure 4. Democratic Republic of the Congo: GDP Contributions by Sector
Growth of real GDP compares with those marks in Southeast Asia…
…with a relatively higher value added from agriculture.
Also, the value added of industry is high compared to peers in Southeast Asia… …with a comparatively positive development of services.
Source: IMF staff estimates based on Congolese authorities data.
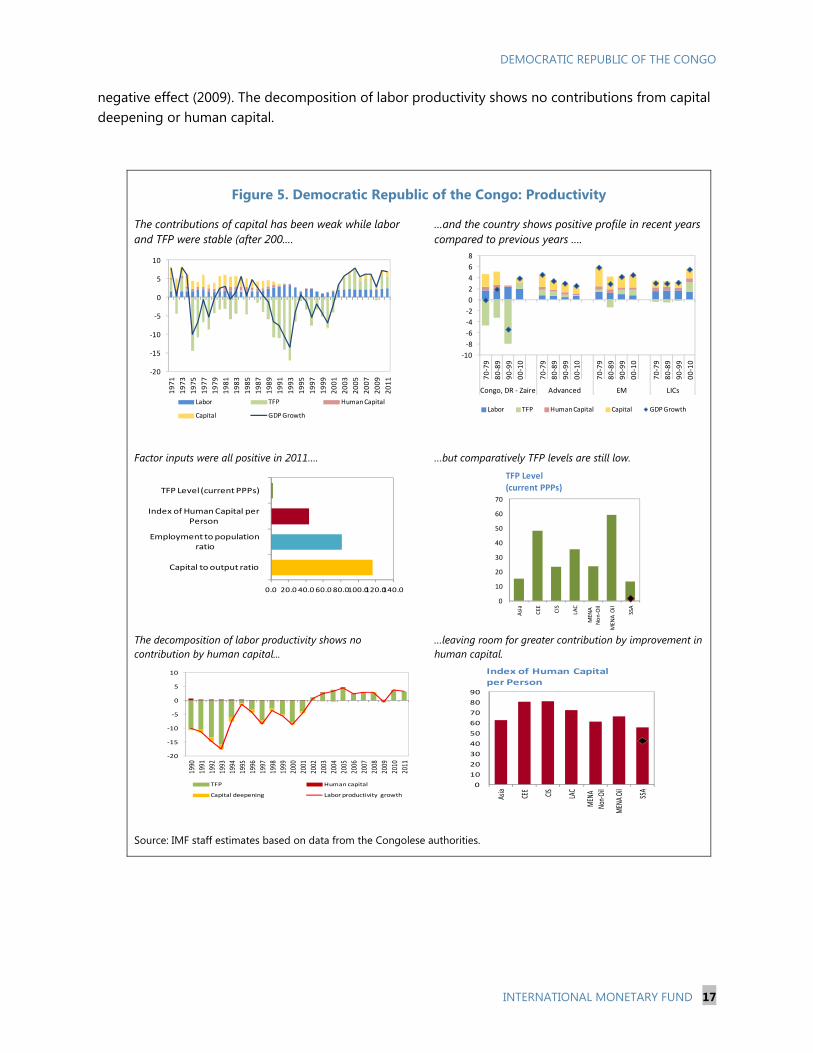
9. Factor productivity could be enhanced to achieve higher growth rates. Growth decomposition shows that the contributions of capital and labor have not been significant in the DRC (Figure 5). On the other hand, human capital has shown a negligible contribution to economic growth while total factor productivity (TFP) has been stable, including some instances of even
0
2
4
6
8
10
12
14
16
2004 2007 2010 2014
Real GDP, Growth
Congo, DRC Afghanistan Bangladesh Nepal Tajikistan
0
5
10
15
20
25
30
35
40
45
2004 2007 2010 2013
Agriculture, value added (percent of GDP)
Congo, Dem. Rep. Afghanistan Bangladesh Nepal Tajikistan
35.4
30.5
28.2
21.7
0
5
10
15
20
25
30
35
40
45
2004 2007 2010 2013
Industry, value added (percent of GDP)
Congo, Dem. Rep. Afghanistan Bangladesh Nepal Tajikistan
0
10
20
30
40
50
60
2004 2007 2010 2013
Services, value added (percent of GDP)
Congo, Dem. Rep. Afghanistan Bangladesh Nepal Tajikistan
DEMOCRATIC REPUBLIC OF THE CONGO
INTERNATIONAL MONETARY FUND 17
-20
-15
-10
-5
0
5
10
19
71
19
73
19
75
19
77
19
79
19
81
19
83
19
85
19
87
19
89
19
91
19
93
19
95
19
97
19
99
20
01
20
03
20
05
20
07
20
09
20
11
Labor TFP Human Capital
Capital GDP Growth
-10
-8
-6
-4
-2
0
2
4
6
8
70
-79
80
-89
90
-99
00
-10
70
-79
80
-89
90
-99
00
-10
70
-79
80
-89
90
-99
00
-10
70
-79
80
-89
90
-99
00
-10
Congo, DR - Zaire Advanced EM LICs
Labor TFP Human Capital Capital GDP Growth
0.0 20.0 40.0 60.0 80.0100.0120.0140.0
Capital to output ratio
Employment to population ratio
Index of Human Capital per Person
TFP Level (current PPPs)
-20
-15
-10
-5
0
5
10
1990
1991
1992
1993
1994
1995
1996
1997
1998
1999
2000
2001
2002
2003
2004
2005
2006
2007
2008
2009
2010
2011
TFP Human capital
Capital deepening Labor productivity growth
0
10
20
30
40
50
60
70
Asi
a
CEE CIS
LAC
MEN
A
No
n-O
il
MEN
A O
il
SSA
TFP Level (current PPPs)
0
10
20
30
40
50
60
70
80
90
Asia
CEE CIS
LAC
MEN
A
Non-
Oil
MEN
A Oi
l
SSA
Index of Human Capital per Person
negative effect (2009). The decomposition of labor productivity shows no contributions from capital deepening or human capital.
Figure 5. Democratic Republic of the Congo: Productivity
The contributions of capital has been weak while labor and TFP were stable (after 200.…
…and the country shows positive profile in recent years compared to previous years ….
Factor inputs were all positive in 2011…. …but comparatively TFP levels are still low.
The decomposition of labor productivity shows no contribution by human capital...
…leaving room for greater contribution by improvement in human capital.
Source: IMF staff estimates based on data from the Congolese authorities.
DEMOCRATIC REPUBLIC OF THE CONGO
18 INTERNATIONAL MONETARY FUND
Source: World Bank.
0
5,000
10,000
15,000
20,000
25,000
30,000
2000 2002 2004 2006 2008 2010 2012 2014
Congo, DRC: Employment by sector (thousands)
Services
Industry
Agriculture
Source: ILO - Trends Econometric Models, October 2013.
0
2,000
4,000
6,000
8,000
10,000
12,000
2000 2005 2010 2014 2000 2005 2010 2014 2000 2005 2010 2014
Agriculture Industry Services
Congo, DRC: Sectoral Employment by Gender (thousands)
Male Female
Source: ILO - Trends Econometric Models, October 2013.
10. Developing human capital could have a significant effect on economic diversification and growth rates in DRC. Future investment in health, education and training could benefit from increases in productivity. In particular, emphasis should be put in expanding years of schooling, human resource management and audits and control on costs and spending.
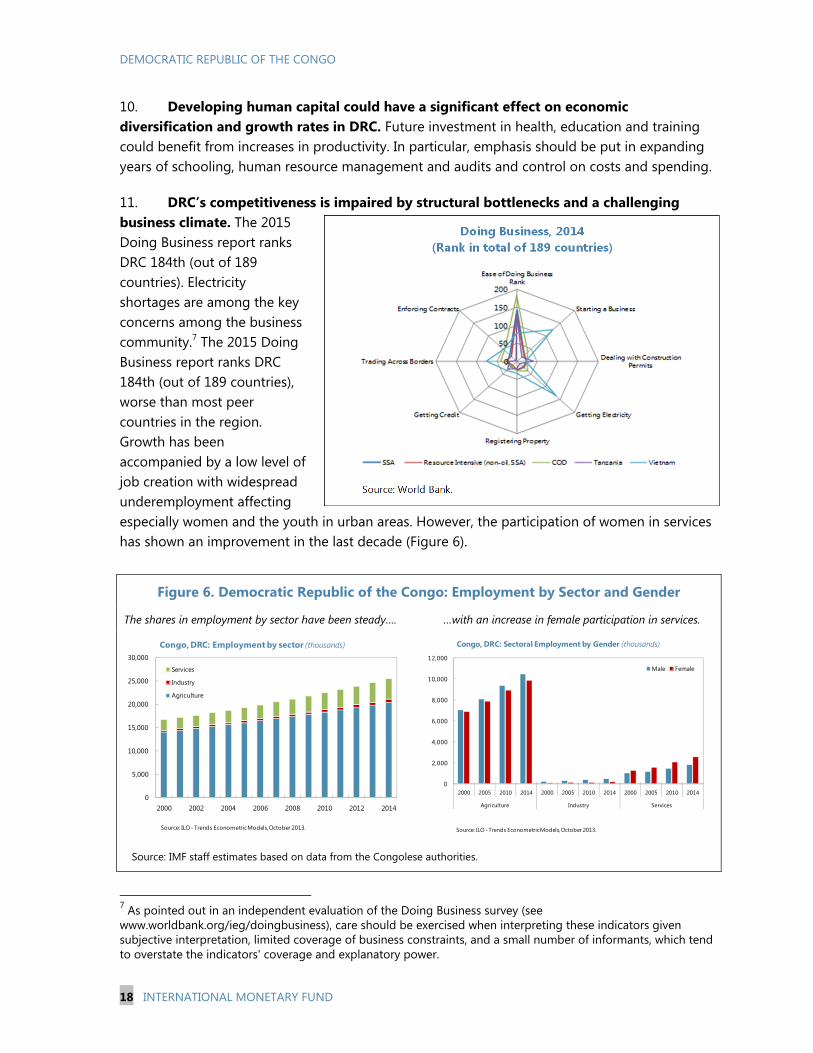
11. DRC’s competitiveness is impaired by structural bottlenecks and a challenging business climate. The 2015 Doing Business report ranks DRC 184th (out of 189 countries). Electricity shortages are among the key concerns among the business community.7 The 2015 Doing Business report ranks DRC 184th (out of 189 countries), worse than most peer countries in the region. Growth has been accompanied by a low level of job creation with widespread underemployment affecting especially women and the youth in urban areas. However, the participation of women in services has shown an improvement in the last decade (Figure 6).
Figure 6. Democratic Republic of the Congo: Employment by Sector and Gender
The shares in employment by sector have been steady…. …with an increase in female participation in services.
Source: IMF staff estimates based on data from the Congolese authorities.
7 As pointed out in an independent evaluation of the Doing Business survey (see www.worldbank.org/ieg/doingbusiness), care should be exercised when interpreting these indicators given subjective interpretation, limited coverage of business constraints, and a small number of informants, which tend to overstate the indicators' coverage and explanatory power.
DEMOCRATIC REPUBLIC OF THE CONGO
INTERNATIONAL MONETARY FUND 19
C. Export Diversification
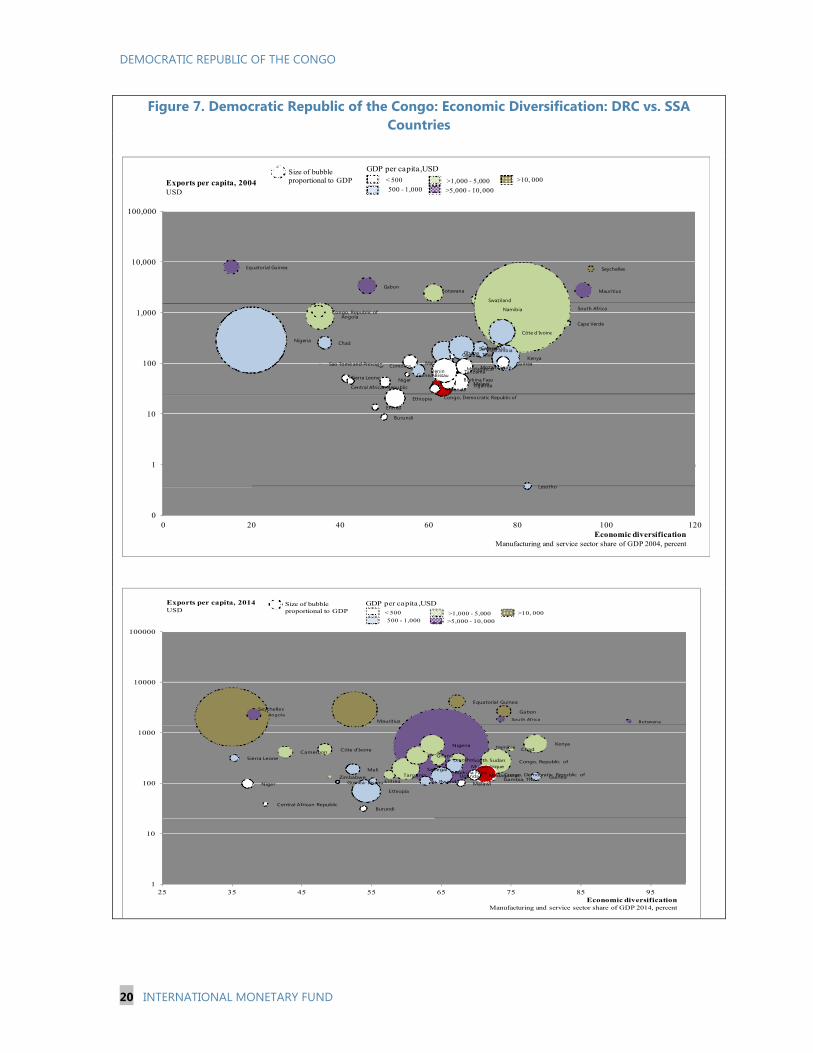
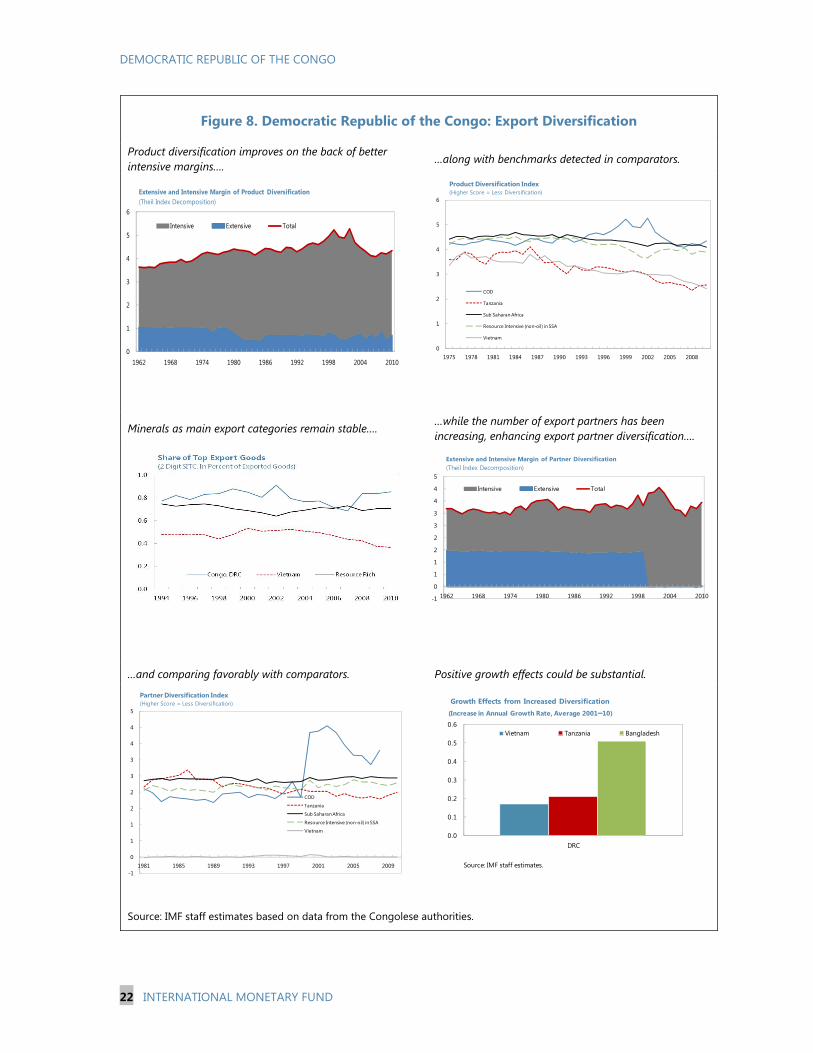
12. DRC’s exports have concentrated on minerals (Figure 7). Overall export diversification and product exports moved slightly upwards, based on exports of new minerals in the last decade. Yet, diversification is still lower vis-à-vis comparators like SSA, Tanzania, Vietnam, and resource intensive (non-oil) countries in SSA.
13. Product diversification could yield growth gains (Figure 8, last chart). Further increasing product variety similar to diversification could yield further growth gains. Based on the estimates in IMF (2014a), a one standard deviation increase in LIC’s export diversification raises the growth rate by about 0.8 percentage points (Box 1).8 For DRC, this translates into estimated growth gains of 0.2 percentage point if export diversification was raised to levels observed in comparators like Vietnam.
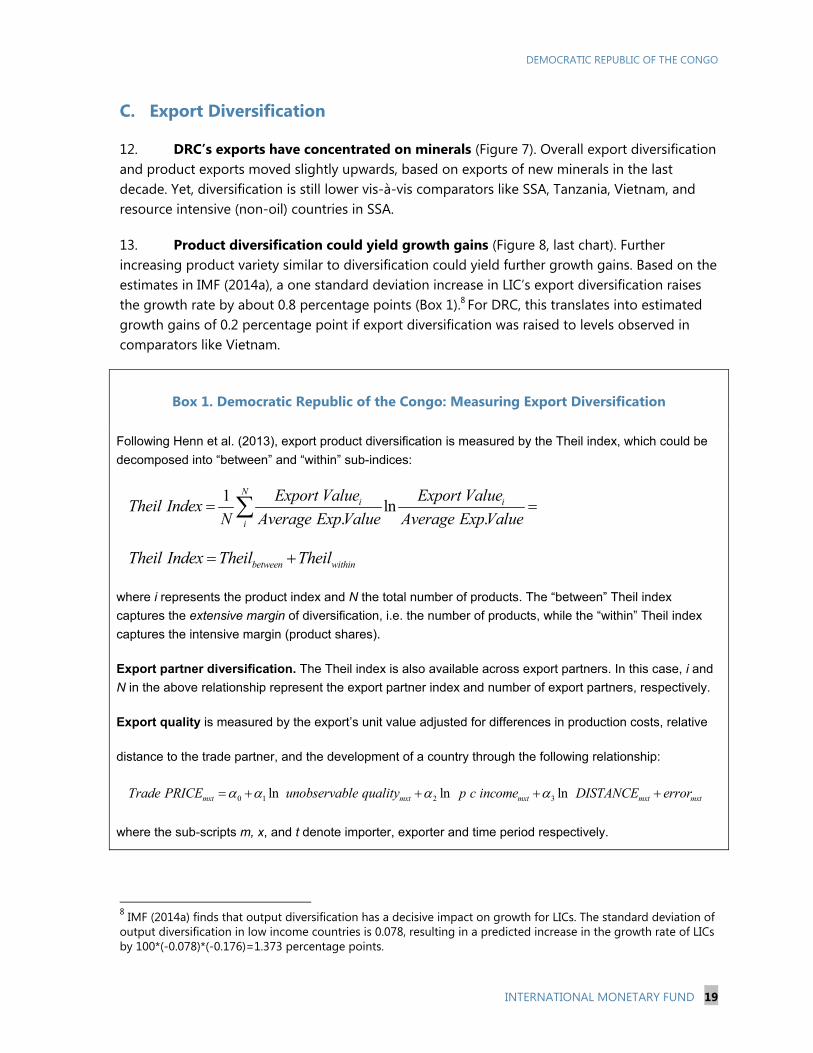
Box 1. Democratic Republic of the Congo: Measuring Export Diversification
Following Henn et al. (2013), export product diversification is measured by the Theil index, which could be
decomposed into “between” and “within” sub-indices:
1
ln. .
Ni i
i
Export Value Export ValueTheil Index
N Average ExpValue Average ExpValue
between withinTheil Index Theil Theil
where i represents the product index and N the total number of products. The “between” Theil index
captures the extensive margin of diversification, i.e. the number of products, while the “within” Theil index
captures the intensive margin (product shares).
Export partner diversification. The Theil index is also available across export partners. In this case, i and
N in the above relationship represent the export partner index and number of export partners, respectively.
Export quality is measured by the export’s unit value adjusted for differences in production costs, relative
distance to the trade partner, and the development of a country through the following relationship:
0 1 2 3ln ln lnmxt mxt mxt mxt mxtTrade PRICE unobservable quality p c income DISTANCE error
where the sub-scripts m, x, and t denote importer, exporter and time period respectively.
8 IMF (2014a) finds that output diversification has a decisive impact on growth for LICs. The standard deviation of output diversification in low income countries is 0.078, resulting in a predicted increase in the growth rate of LICs by 100*(-0.078)*(-0.176)=1.373 percentage points.
DEMOCRATIC REPUBLIC OF THE CONGO
20 INTERNATIONAL MONETARY FUND
Figure 7. Democratic Republic of the Congo: Economic Diversification: DRC vs. SSA Countries
Seychelles
MauritiusGabon
Equatorial Guinea
AngolaCongo, Republic of
Swaziland
Cape Verde
Namibia
Botswana
South Africa
Chad
Benin
KenyaZambia
Comoros
Lesotho
Ghana
Sao Tomé and Principe
Senegal
Côte d'Ivoire
CameroonNigeria
Burundi
Ethiopia Congo, Democratic Republic of
MalawiNiger
Eritrea
Rwanda
Madagascar
Sierra Leone
UgandaCentral African Republic
Mozambique
Guinea-BissauBurkina Faso
Gambia, The
Guinea
Tanzania
Mali
0
1
10
100
1,000
10,000
100,000
0 20 40 60 80 100 120
Exports per capita, 2004USD
GDP per capita ,USD< 500
500 - 1,000>1,000 - 5,000
>5,000 - 10, 000
>10, 000Size of bubble proportional to GDP
Economic diversificationManufacturing and service sector share of GDP 2004, percent
Mauritius
GabonSeychellesEquatorial Guinea
Angola
Namibia
South Africa Botswana
TanzaniaZimbabwe
Senegal
LesothoSouth Sudan
ChadCôte d'IvoireCameroon
Kenya
GhanaCongo, Republic of
Nigeria
Ethiopia
GuineaGuinea-BissauEritrea
MozambiqueBurkina Faso
RwandaUganda
Mali
Sierra Leone
Malawi
BurundiCentral African Republic
Congo, Democratic Republic ofGambia, The
Madagascar
Niger
1
10
100
1000
10000
100000
25 35 45 55 65 75 85 95
Exports per capita, 2014USD
GDP per capita ,USD
< 500
500 - 1,000>1,000 - 5,000
>5,000 - 10, 000
>10, 000
Size of bubble proportional to GDP
Economic diversificationManufacturing and service sector share of GDP 2014, percent
DEMOCRATIC REPUBLIC OF THE CONGO
INTERNATIONAL MONETARY FUND 21
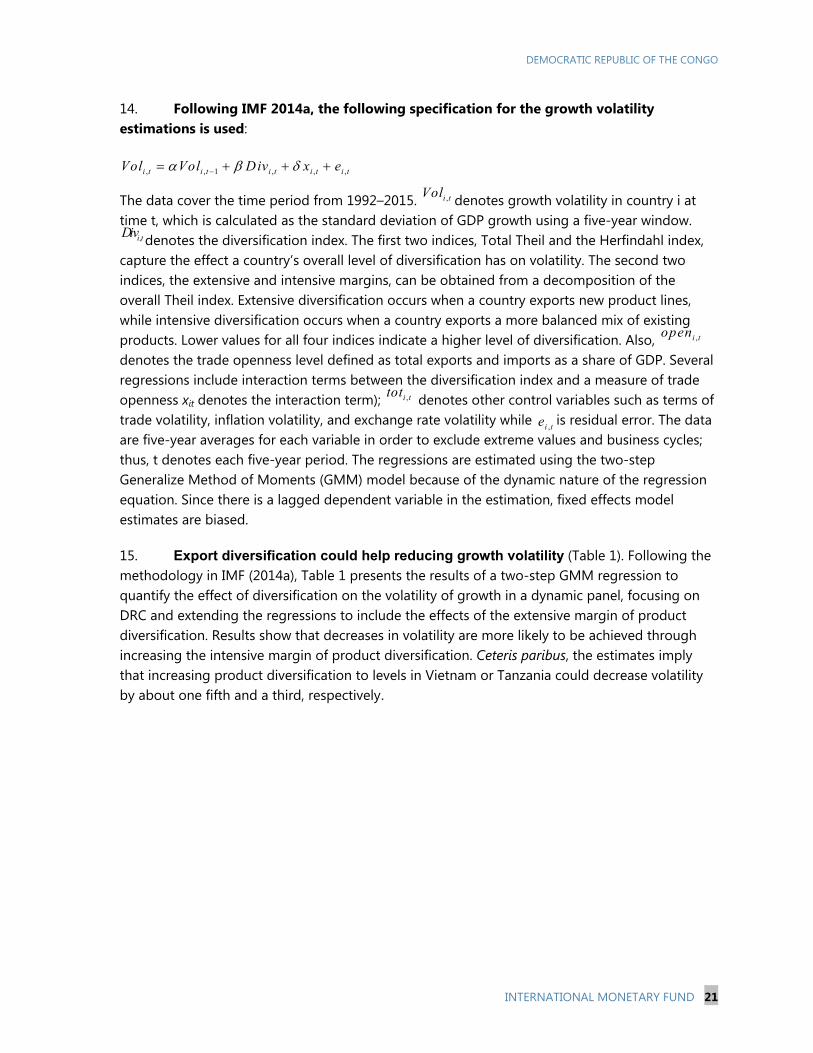
14. Following IMF 2014a, the following specification for the growth volatility estimations is used:
, , 1 , , ,i t i t i t i t i tVol Vol Div x e
The data cover the time period from 1992–2015. ,i tVol denotes growth volatility in country i at time t, which is calculated as the standard deviation of GDP growth using a five-year window.
,i tDiv denotes the diversification index. The first two indices, Total Theil and the Herfindahl index, capture the effect a country’s overall level of diversification has on volatility. The second two indices, the extensive and intensive margins, can be obtained from a decomposition of the overall Theil index. Extensive diversification occurs when a country exports new product lines, while intensive diversification occurs when a country exports a more balanced mix of existing products. Lower values for all four indices indicate a higher level of diversification. Also, ,i topen
denotes the trade openness level defined as total exports and imports as a share of GDP. Several regressions include interaction terms between the diversification index and a measure of trade openness xit denotes the interaction term); ,i ttot denotes other control variables such as terms of trade volatility, inflation volatility, and exchange rate volatility while
,i te is residual error. The data are five-year averages for each variable in order to exclude extreme values and business cycles; thus, t denotes each five-year period. The regressions are estimated using the two-step Generalize Method of Moments (GMM) model because of the dynamic nature of the regression equation. Since there is a lagged dependent variable in the estimation, fixed effects model estimates are biased.
15. Export diversification could help reducing growth volatility (Table 1). Following the methodology in IMF (2014a), Table 1 presents the results of a two-step GMM regression to quantify the effect of diversification on the volatility of growth in a dynamic panel, focusing on DRC and extending the regressions to include the effects of the extensive margin of product diversification. Results show that decreases in volatility are more likely to be achieved through increasing the intensive margin of product diversification. Ceteris paribus, the estimates imply that increasing product diversification to levels in Vietnam or Tanzania could decrease volatility by about one fifth and a third, respectively.
DEMOCRATIC REPUBLIC OF THE CONGO
22 INTERNATIONAL MONETARY FUND
0
1
2
3
4
5
6
1962 1968 1974 1980 1986 1992 1998 2004 2010
Extensive and Intensive Margin of Product Diversification(Theil Index Decomposition)
Intensive Extensive Total
0
1
2
3
4
5
6
1975 1978 1981 1984 1987 1990 1993 1996 1999 2002 2005 2008
Product Diversification Index(Higher Score = Less Diversification)
COD
Tanzania
Sub Saharan Africa
Resource Intensive (non-oil) in SSA
Vietnam
-1
0
1
1
2
2
3
3
4
4
5
1981 1985 1989 1993 1997 2001 2005 2009
Partner Diversification Index(Higher Score = Less Diversification)
COD
Tanzania
Sub Saharan Africa
Resource Intensive (non-oil) in SSA
Vietnam
-1
0
1
1
2
2
3
3
4
4
5
1962 1968 1974 1980 1986 1992 1998 2004 2010
Extensive and Intensive Margin of Partner Diversification(Theil Index Decomposition)
Intensive Extensive Total
0.0
0.1
0.2
0.3
0.4
0.5
0.6
DRC
Growth Effects from Increased Diversification(Increase in Annual Growth Rate, Average 2001–10)
Vietnam Tanzania Bangladesh
Source: IMF staff estimates.
Figure 8. Democratic Republic of the Congo: Export Diversification
Product diversification improves on the back of better intensive margins….
…along with benchmarks detected in comparators.
Minerals as main export categories remain stable…. …while the number of export partners has been increasing, enhancing export partner diversification….
…and comparing favorably with comparators. Positive growth effects could be substantial.
Source: IMF staff estimates based on data from the Congolese authorities.
DEMOCRATIC REPUBLIC OF THE CONGO
INTERNATIONAL MONETARY FUND 23
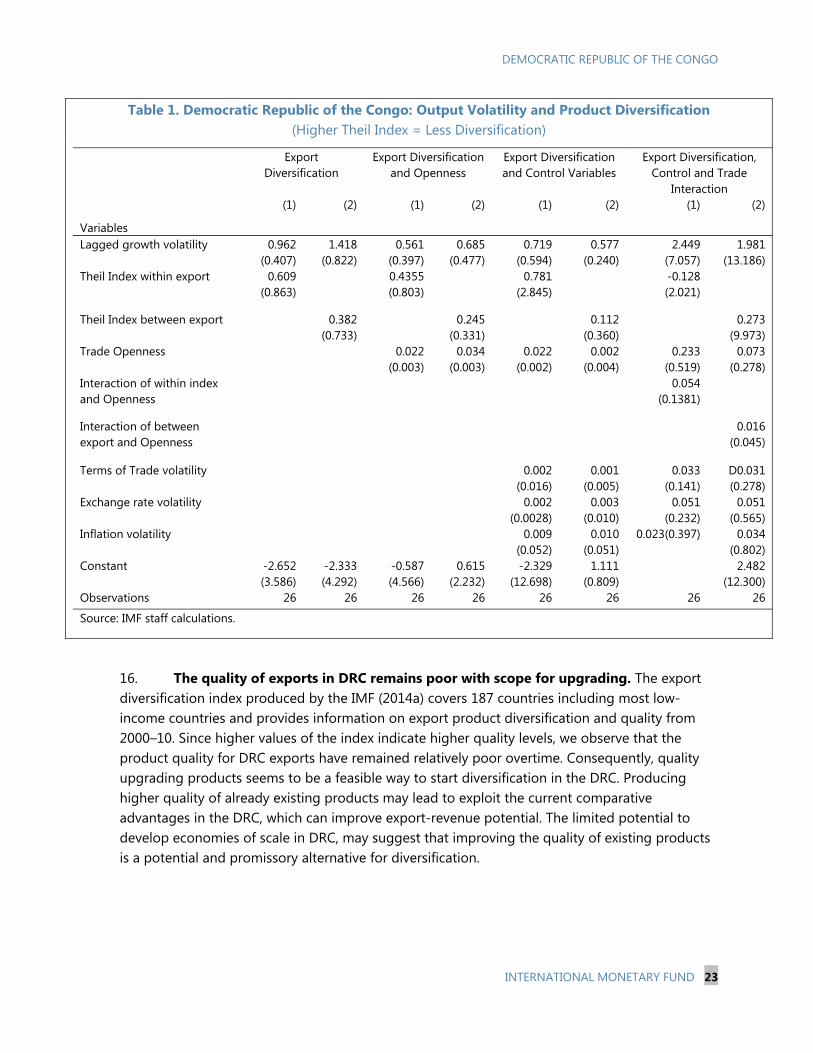
Table 1. Democratic Republic of the Congo: Output Volatility and Product Diversification
(Higher Theil Index = Less Diversification)
Export Diversification
Export Diversification and Openness
Export Diversification and Control Variables
Export Diversification, Control and Trade
Interaction (1) (2) (1) (2) (1) (2) (1) (2)
Variables Lagged growth volatility 0.962
(0.407) 1.418
(0.822) 0.561
(0.397) 0.685
(0.477) 0.719
(0.594) 0.577
(0.240) 2.449
(7.057) 1.981
(13.186) Theil Index within export
0.609 (0.863)
0.4355 (0.803)
0.781 (2.845)
-0.128 (2.021)
Theil Index between export 0.382 (0.733)
0.245 (0.331)
0.112 (0.360)
0.273 (9.973)
Trade Openness 0.022 (0.003)
0.034 (0.003)
0.022 (0.002)
0.002 (0.004)
0.233 (0.519)
0.073 (0.278)
Interaction of within index and Openness
0.054 (0.1381)
Interaction of between export and Openness
0.016 (0.045)
Terms of Trade volatility 0.002 (0.016)
0.001 (0.005)
0.033 (0.141)
D0.031 (0.278)
Exchange rate volatility 0.002 (0.0028)
0.003 (0.010)
0.051 (0.232)
0.051 (0.565)
Inflation volatility 0.009 (0.052)
0.010 (0.051)
0.023(0.397) 0.034 (0.802)
Constant -2.652 (3.586)
-2.333 (4.292)
-0.587 (4.566)
0.615 (2.232)
-2.329 (12.698)
1.111 (0.809)
2.482 (12.300)
Observations 26 26 26 26 26 26 26 26
Source: IMF staff calculations.
16. The quality of exports in DRC remains poor with scope for upgrading. The export diversification index produced by the IMF (2014a) covers 187 countries including most low-income countries and provides information on export product diversification and quality from 2000–10. Since higher values of the index indicate higher quality levels, we observe that the product quality for DRC exports have remained relatively poor overtime. Consequently, quality upgrading products seems to be a feasible way to start diversification in the DRC. Producing higher quality of already existing products may lead to exploit the current comparative advantages in the DRC, which can improve export-revenue potential. The limited potential to develop economies of scale in DRC, may suggest that improving the quality of existing products is a potential and promissory alternative for diversification.
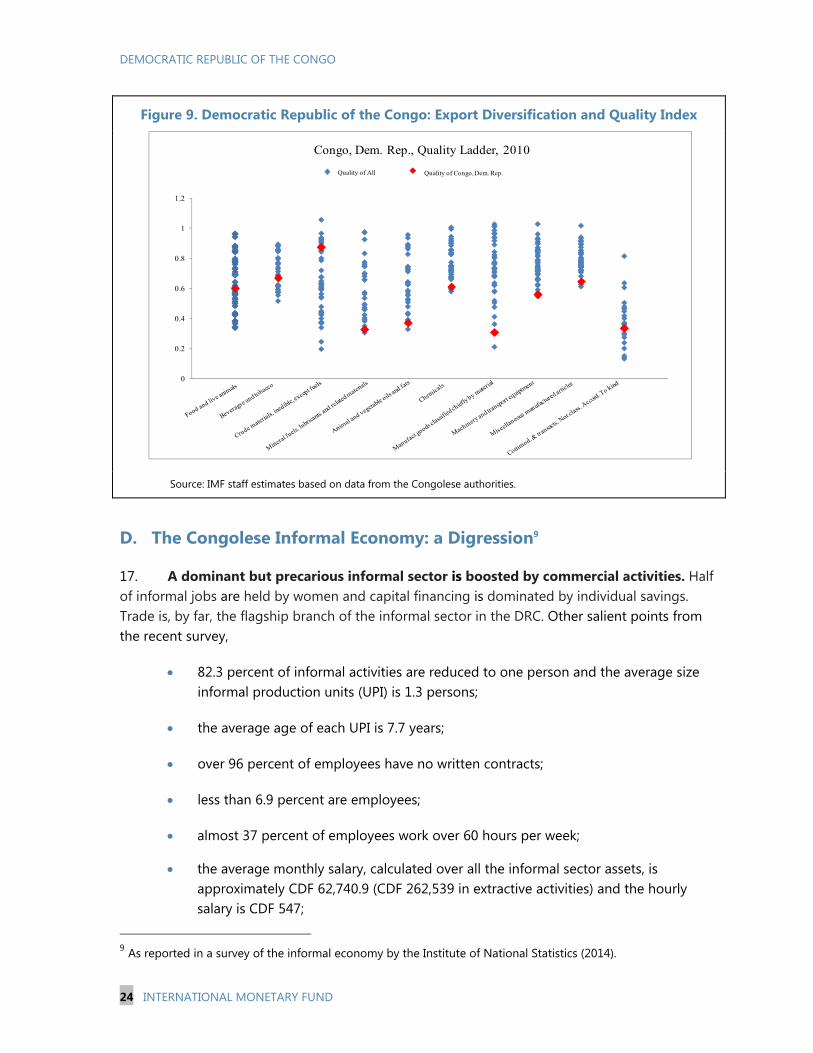
DEMOCRATIC REPUBLIC OF THE CONGO
24 INTERNATIONAL MONETARY FUND
Figure 9. Democratic Republic of the Congo: Export Diversification and Quality Index
Source: IMF staff estimates based on data from the Congolese authorities.
D. The Congolese Informal Economy: a Digression9
17. A dominant but precarious informal sector is boosted by commercial activities. Half of informal jobs are held by women and capital financing is dominated by individual savings. Trade is, by far, the flagship branch of the informal sector in the DRC. Other salient points from the recent survey,
82.3 percent of informal activities are reduced to one person and the average size informal production units (UPI) is 1.3 persons;
the average age of each UPI is 7.7 years;
over 96 percent of employees have no written contracts;
less than 6.9 percent are employees;
almost 37 percent of employees work over 60 hours per week;
the average monthly salary, calculated over all the informal sector assets, is approximately CDF 62,740.9 (CDF 262,539 in extractive activities) and the hourly salary is CDF 547;
9 As reported in a survey of the informal economy by the Institute of National Statistics (2014).
0
0.2
0.4
0.6
0.8
1
1.2
Congo, Dem. Rep., Quality Ladder, 2010
Quality of All Quality of Congo,Dem. Rep.
DEMOCRATIC REPUBLIC OF THE CONGO
INTERNATIONAL MONETARY FUND 25
Mining1.9
Services19.5
Industry16.5
Commerce62.1
National Statistical Agency, DRC (2014)
Informal Activity by Sector(percent)
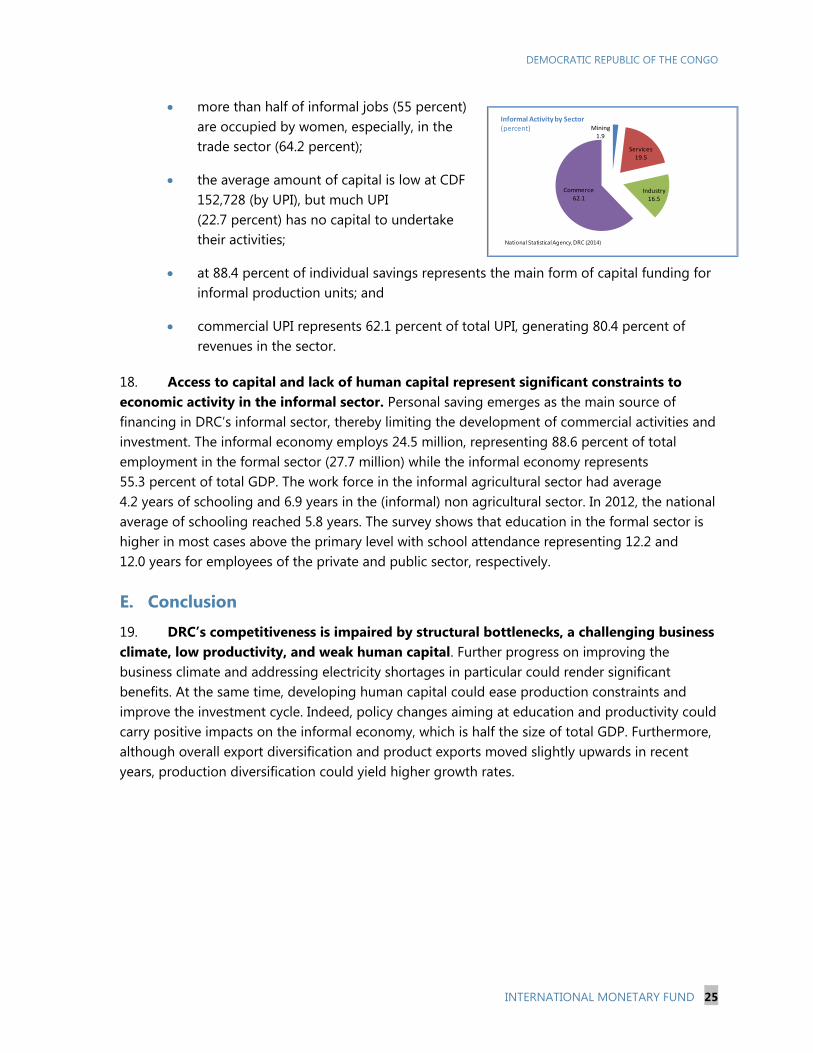
more than half of informal jobs (55 percent) are occupied by women, especially, in the trade sector (64.2 percent);
the average amount of capital is low at CDF 152,728 (by UPI), but much UPI (22.7 percent) has no capital to undertake their activities;
at 88.4 percent of individual savings represents the main form of capital funding for informal production units; and
commercial UPI represents 62.1 percent of total UPI, generating 80.4 percent of revenues in the sector.
18. Access to capital and lack of human capital represent significant constraints to economic activity in the informal sector. Personal saving emerges as the main source of financing in DRC’s informal sector, thereby limiting the development of commercial activities and investment. The informal economy employs 24.5 million, representing 88.6 percent of total employment in the formal sector (27.7 million) while the informal economy represents 55.3 percent of total GDP. The work force in the informal agricultural sector had average 4.2 years of schooling and 6.9 years in the (informal) non agricultural sector. In 2012, the national average of schooling reached 5.8 years. The survey shows that education in the formal sector is higher in most cases above the primary level with school attendance representing 12.2 and 12.0 years for employees of the private and public sector, respectively.
E. Conclusion
19. DRC’s competitiveness is impaired by structural bottlenecks, a challenging business climate, low productivity, and weak human capital. Further progress on improving the business climate and addressing electricity shortages in particular could render significant benefits. At the same time, developing human capital could ease production constraints and improve the investment cycle. Indeed, policy changes aiming at education and productivity could carry positive impacts on the informal economy, which is half the size of total GDP. Furthermore, although overall export diversification and product exports moved slightly upwards in recent years, production diversification could yield higher growth rates.
DEMOCRATIC REPUBLIC OF THE CONGO
26 INTERNATIONAL MONETARY FUND
References
Dabla-Norris, Era, Giang Ho, Kalpana Kochhar, Annette Kyobe, and Robert Tchaidze, 2013,“ Anchoring Growth: The Importance of Productivity-Enhancing Reforms in Emerging Market and Developing Economies” IMF SDN/13/08.
Dabla-Norris, Era, Jim Brumby, Annette Kyobe, Zac Mills, and Chris Papageorgiou, 2011, “Investing in Public investment Efficiency” IMF Working Paper 11/97.
Henn, Christian, Chris Papageorgiou, and Nikola Spatafora, 2013,” Export Quality in Developing Countries,” IMF Working Paper 13/108.
Imbs, Jean, Claudio Montenegro, and Romain Wacziarg, 2012, “Economic Integration and Structural Change,” The World Bank. April.
IMF, 2014a, “Sustaining Long-Run Growth and Macroeconomic Stability in Low-Income Countries—The Role of Structural Transformation and Diversification.” IMF Policy Paper, March.
Institut National de la Statistique, 2014, “Résultats de l’enquête sur l’Emploi, le Secteur Informel et sur la Consommation des Ménages en 2012,” Septembre.
DEMOCRATIC REPUBLIC OF THE CONGO
INTERNATIONAL MONETARY FUND 27
THE CONTRIBUTION OF THE MINING SECTOR TO THE CONGOLESE ECONOMY1 A. Background
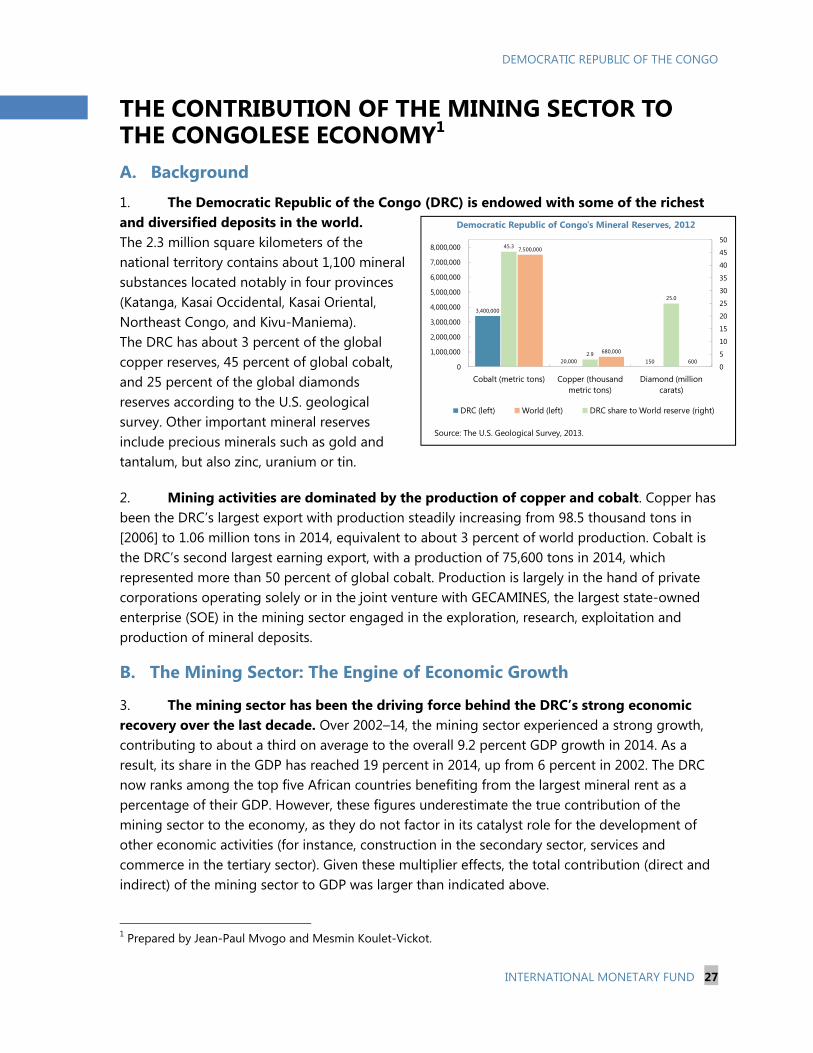
1. The Democratic Republic of the Congo (DRC) is endowed with some of the richest and diversified deposits in the world. The 2.3 million square kilometers of the national territory contains about 1,100 mineral substances located notably in four provinces (Katanga, Kasai Occidental, Kasai Oriental, Northeast Congo, and Kivu-Maniema). The DRC has about 3 percent of the global copper reserves, 45 percent of global cobalt, and 25 percent of the global diamonds reserves according to the U.S. geological survey. Other important mineral reserves include precious minerals such as gold and tantalum, but also zinc, uranium or tin.
2. Mining activities are dominated by the production of copper and cobalt. Copper has been the DRC’s largest export with production steadily increasing from 98.5 thousand tons in [2006] to 1.06 million tons in 2014, equivalent to about 3 percent of world production. Cobalt is the DRC’s second largest earning export, with a production of 75,600 tons in 2014, which represented more than 50 percent of global cobalt. Production is largely in the hand of private corporations operating solely or in the joint venture with GECAMINES, the largest state-owned enterprise (SOE) in the mining sector engaged in the exploration, research, exploitation and production of mineral deposits.
B. The Mining Sector: The Engine of Economic Growth
3. The mining sector has been the driving force behind the DRC’s strong economic recovery over the last decade. Over 2002–14, the mining sector experienced a strong growth, contributing to about a third on average to the overall 9.2 percent GDP growth in 2014. As a result, its share in the GDP has reached 19 percent in 2014, up from 6 percent in 2002. The DRC now ranks among the top five African countries benefiting from the largest mineral rent as a percentage of their GDP. However, these figures underestimate the true contribution of the mining sector to the economy, as they do not factor in its catalyst role for the development of other economic activities (for instance, construction in the secondary sector, services and commerce in the tertiary sector). Given these multiplier effects, the total contribution (direct and indirect) of the mining sector to GDP was larger than indicated above.
1 Prepared by Jean-Paul Mvogo and Mesmin Koulet-Vickot.
3,400,000
20,000 150
7,500,000
680,000
600
45.3
2.9
25.0
0
5
10
15
20
25
30
35
40
45
50
0
1,000,000
2,000,000
3,000,000
4,000,000
5,000,000
6,000,000
7,000,000
8,000,000
Cobalt (metric tons) Copper (thousand metric tons)
Diamond (million carats)
Democratic Republic of Congo's Mineral Reserves, 2012
DRC (left) World (left) DRC share to World reserve (right)
Source: The U.S. Geological Survey, 2013.

DEMOCRATIC REPUBLIC OF THE CONGO
28 INTERNATIONAL MONETARY FUND
Figure 1. Democratic Republic of the Congo: Contribution to Growth and Structure of GDP
The mining sector has spurred GDP growth…. Expanding its share of the economy in recent years.
Sources: Central Bank of Congo and IMF staff estimates.
4. The mining sector has been the key driver of external sector developments. Mining sector (including oil) is estimated to have generated USD 11 billion in export earnings compared to USD 1.4 billion a decade earlier. It accounted for more than 94 percent of total merchandise exports in 2014, up from 80 percent in 2004. Over the same period, it has been the main driver of the large current account deficits on the back of increase in investment-related imports. It is estimated to have been the primary beneficiary of the surge in foreign direct investment (FDI) inflows (cumulative amount of more than $13 billion over 2002–14), which largely covered the large external current account deficits and contributed to the overall balance of payments surpluses recorded.
-2
0
2
4
6
8
10
12
2010 2011 2012 2013 2014
DRC: Contribution to GDP Growth, 2010-14
Subsistence agriculture Mining and extractionIndustry sector (secondary) Service sector (tertiary)Real GDP growth
DRC: Sectoral Structure, 2014
Service Sector 38%
Subsistence Agriculture
19%
Mining and Extraction
22%
Industry Sector21%
DEMOCRATIC REPUBLIC OF THE CONGO
INTERNATIONAL MONETARY FUND 29
Figure 2. Democratic Republic of the Congo: Mineral Exports and FDI
The share of mineral exports in total exports increased… …as the mining sector benefited from FDI inflows.
Sources: Central Bank of Congo and IMF staff estimates.
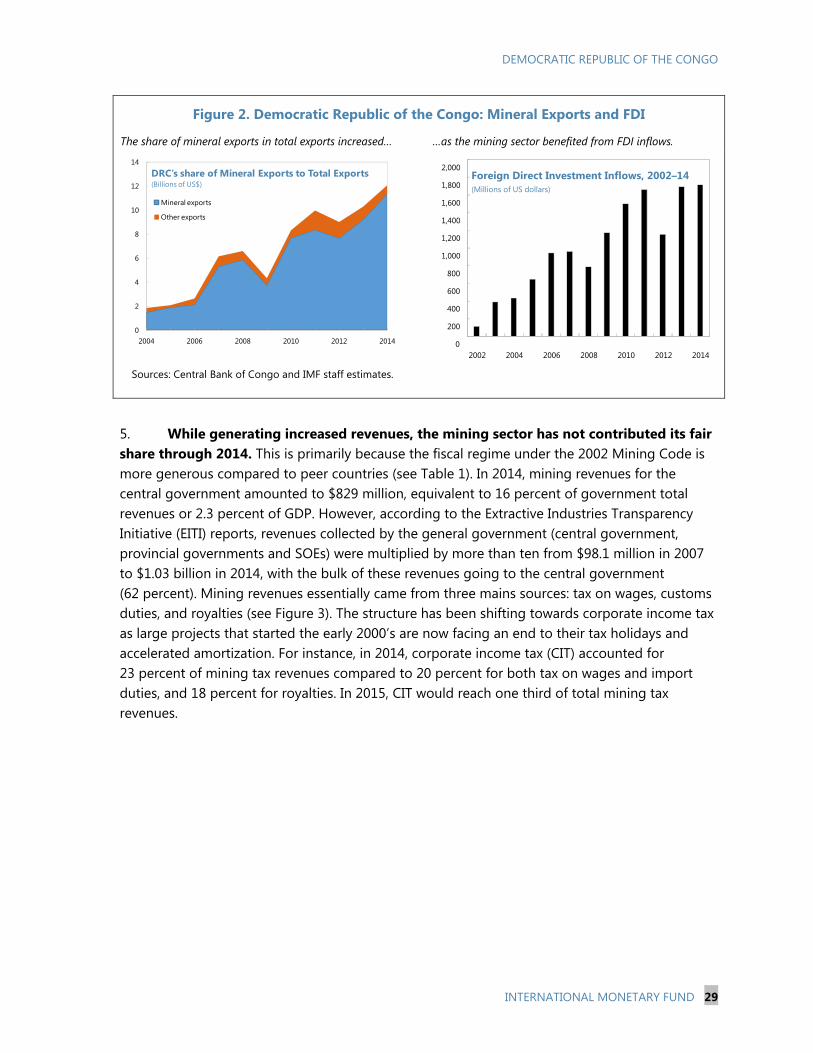
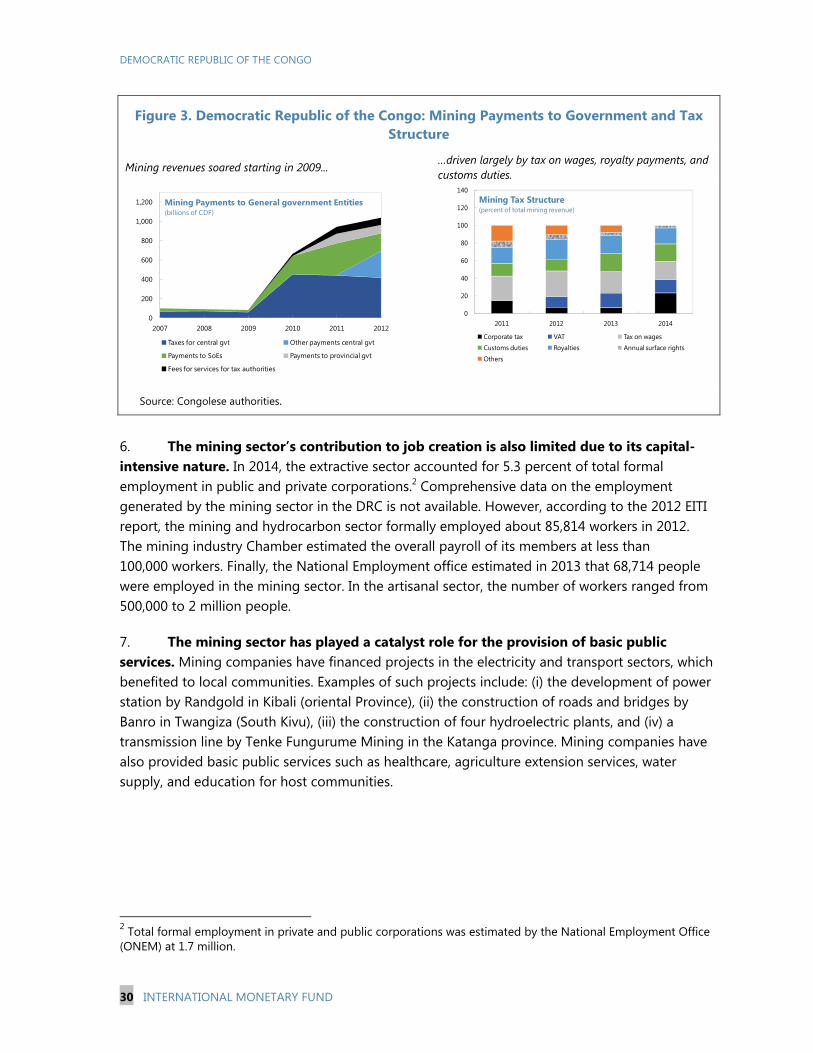
5. While generating increased revenues, the mining sector has not contributed its fair share through 2014. This is primarily because the fiscal regime under the 2002 Mining Code is more generous compared to peer countries (see Table 1). In 2014, mining revenues for the central government amounted to $829 million, equivalent to 16 percent of government total revenues or 2.3 percent of GDP. However, according to the Extractive Industries Transparency Initiative (EITI) reports, revenues collected by the general government (central government, provincial governments and SOEs) were multiplied by more than ten from $98.1 million in 2007 to $1.03 billion in 2014, with the bulk of these revenues going to the central government (62 percent). Mining revenues essentially came from three mains sources: tax on wages, customs duties, and royalties (see Figure 3). The structure has been shifting towards corporate income tax as large projects that started the early 2000’s are now facing an end to their tax holidays and accelerated amortization. For instance, in 2014, corporate income tax (CIT) accounted for 23 percent of mining tax revenues compared to 20 percent for both tax on wages and import duties, and 18 percent for royalties. In 2015, CIT would reach one third of total mining tax revenues.
0
2
4
6
8
10
12
14
2004 2006 2008 2010 2012 2014
DRC's share of Mineral Exports to Total Exports(Billions of US$)
Mineral exports
Other exports
0
200
400
600
800
1,000
1,200
1,400
1,600
1,800
2,000
2002 2004 2006 2008 2010 2012 2014
Foreign Direct Investment Inflows, 2002–14(Millions of US dollars)
DEMOCRATIC REPUBLIC OF THE CONGO
30 INTERNATIONAL MONETARY FUND
Figure 3. Democratic Republic of the Congo: Mining Payments to Government and Tax Structure
Mining revenues soared starting in 2009... …driven largely by tax on wages, royalty payments, and customs duties.
Source: Congolese authorities.
6. The mining sector’s contribution to job creation is also limited due to its capital-intensive nature. In 2014, the extractive sector accounted for 5.3 percent of total formal employment in public and private corporations.2 Comprehensive data on the employment generated by the mining sector in the DRC is not available. However, according to the 2012 EITI report, the mining and hydrocarbon sector formally employed about 85,814 workers in 2012. The mining industry Chamber estimated the overall payroll of its members at less than 100,000 workers. Finally, the National Employment office estimated in 2013 that 68,714 people were employed in the mining sector. In the artisanal sector, the number of workers ranged from 500,000 to 2 million people.
7. The mining sector has played a catalyst role for the provision of basic public services. Mining companies have financed projects in the electricity and transport sectors, which benefited to local communities. Examples of such projects include: (i) the development of power station by Randgold in Kibali (oriental Province), (ii) the construction of roads and bridges by Banro in Twangiza (South Kivu), (iii) the construction of four hydroelectric plants, and (iv) a transmission line by Tenke Fungurume Mining in the Katanga province. Mining companies have also provided basic public services such as healthcare, agriculture extension services, water supply, and education for host communities.
2 Total formal employment in private and public corporations was estimated by the National Employment Office (ONEM) at 1.7 million.
0
200
400
600
800
1,000
1,200
2007 2008 2009 2010 2011 2012
Mining Payments to General government Entities(billions of CDF)
Taxes for central gvt Other payments central gvt
Payments to SoEs Payments to provincial gvt
Fees for services for tax authorities
0
20
40
60
80
100
120
140
2011 2012 2013 2014
Mining Tax Structure(percent of total mining revenue)
Corporate tax VAT Tax on wagesCustoms duties Royalties Annual surface rights
Others
DEMOCRATIC REPUBLIC OF THE CONGO
INTERNATIONAL MONETARY FUND 31
C. Factors Behind the Recent Mining Sector Growth
8. The stabilization of the political and security situation. The appeasement in the socio-political and security environment following the Sun City Agreement of 2002 and the launch of open political process helped establish progressively government control over areas of the country that were under warlords’ rule. These positive developments were critical in attracting large amounts of foreign investments in the mining sector.
9. The Mining Code of 2002. This code allows the private sector to access mineral rights, without being required as in the past (under the Mining Code of 1981) to have a partnership or special mining agreement with the State. The liberalization of the sector, together with the competitive tax regime, provided the needed impetus for a renewed private sector interest in exploration and exploitation operations.
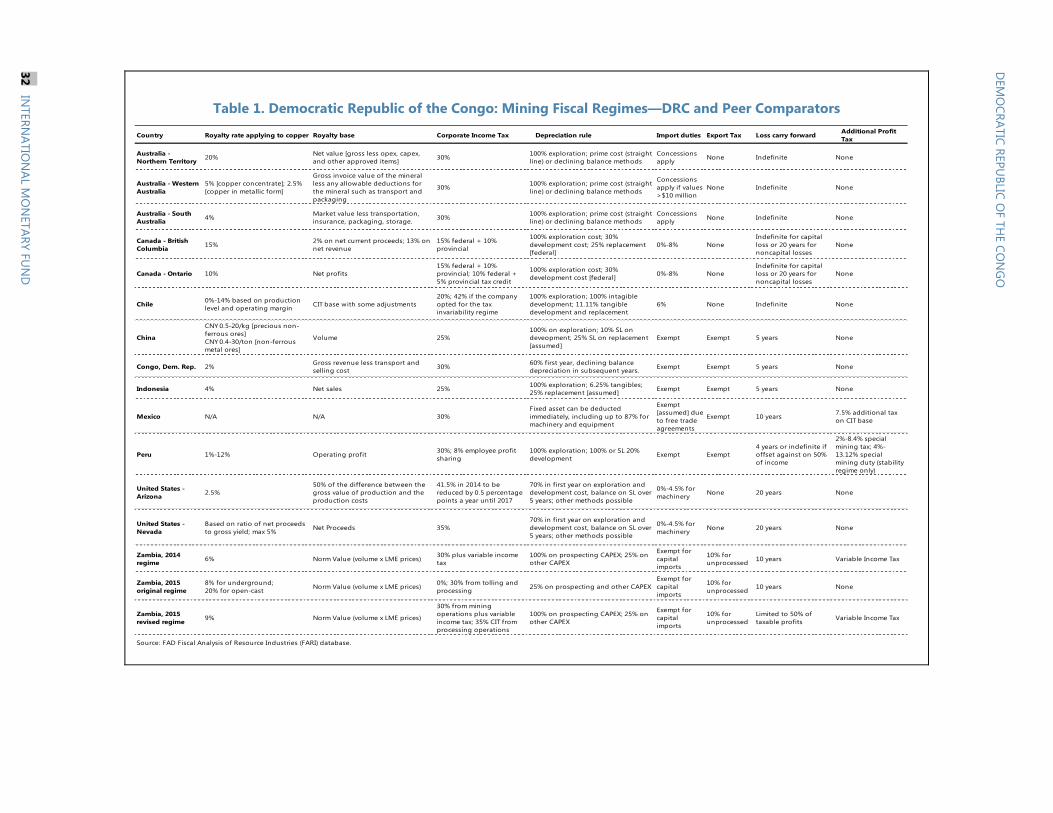
Table 1. Democratic Republic of the Congo: Mining Fiscal Regimes—DRC and Peer Comparators
Country Royalty rate applying to copper Royalty base Corporate Income Tax Depreciation rule Import duties Export Tax Loss carry forward Additional Profit Tax
Australia - Northern Territory 20% Net value [gross less opex, capex,
and other approved items] 30% 100% exploration; prime cost (straight line) or declining balance methods
Concessions apply None Indefinite None
Australia - Western Australia
5% [copper concentrate]; 2.5% [copper in metallic form]
Gross invoice value of the mineral less any allowable deductions for the mineral such as transport and packaging
30% 100% exploration; prime cost (straight line) or declining balance methods
Concessions apply if values >$10 million
None Indefinite None
Australia - South Australia 4% Market value less transportation,
insurance, packaging, storage. 30% 100% exploration; prime cost (straight line) or declining balance methods
Concessions apply None Indefinite None
Canada - British Columbia 15% 2% on net current proceeds; 13% on
net revenue15% federal + 10% provincial
100% exploration cost; 30% development cost; 25% replacement [federal]
0%-8% NoneIndefinite for capital loss or 20 years for noncapital losses
None
Canada - Ontario 10% Net profits15% federal + 10% provincial; 10% federal + 5% provincial tax credit
100% exploration cost; 30% development cost [federal] 0%-8% None
Indefinite for capital loss or 20 years for noncapital losses
None
Chile 0%-14% based on production level and operating margin CIT base with some adjustments
20%; 42% if the company opted for the tax invariability regime
100% exploration; 100% intagible development; 11.11% tangible development and replacement
6% None Indefinite None
China
CNY 0.5-20/kg [precious non-ferrous ores]CNY 0.4-30/ton [non-ferrous metal ores]
Volume 25%100% on exploration; 10% SL on deveopment; 25% SL on replacement [assumed]
Exempt Exempt 5 years None
Congo, Dem. Rep. 2% Gross revenue less transport and selling cost 30% 60% first year, declining balance
depreciation in subsequent years. Exempt Exempt 5 years None
Indonesia 4% Net sales 25% 100% exploration; 6.25% tangibles; 25% replacement [assumed] Exempt Exempt 5 years None
Mexico N/A N/A 30%Fixed asset can be deducted immediately, including up to 87% for machinery and equipment
Exempt [assumed] due to free trade agreements
Exempt 10 years 7.5% additional tax on CIT base
Peru 1%-12% Operating profit 30%; 8% employee profit sharing
100% exploration; 100% or SL 20% development Exempt Exempt
4 years or indefinite if offset against on 50% of income
2%-8.4% special mining tax; 4%-13.12% special mining duty (stability regime only)
United States - Arizona 2.5%
50% of the difference between the gross value of production and the production costs
41.5% in 2014 to be reduced by 0.5 percentage points a year until 2017
70% in first year on exploration and development cost, balance on SL over 5 years; other methods possible
0%-4.5% for machinery None 20 years None
United States - Nevada
Based on ratio of net proceeds to gross yield; max 5% Net Proceeds 35%
70% in first year on exploration and development cost, balance on SL over 5 years; other methods possible
0%-4.5% for machinery None 20 years None
Zambia, 2014 regime 6% Norm Value (volume x LME prices) 30% plus variable income
tax100% on prospecting CAPEX; 25% on other CAPEX
Exempt for capital imports
10% for unprocessed 10 years Variable Income Tax
Zambia, 2015 original regime
8% for underground; 20% for open-cast Norm Value (volume x LME prices) 0%; 30% from tolling and
processing 25% on prospecting and other CAPEXExempt for capital imports
10% for unprocessed 10 years None
Zambia, 2015 revised regime 9% Norm Value (volume x LME prices)
30% from mining operations plus variable income tax; 35% CIT from processing operations
100% on prospecting CAPEX; 25% on other CAPEX
Exempt for capital imports
10% for unprocessed
Limited to 50% of taxable profits Variable Income Tax
Source: FAD Fiscal Analysis of Resource Industries (FARI) database.
DEM
OCRATIC
REPUBLIC
OF
THE
CON
GO
32IN
TERNATIO
NAL
MO
NETARY
FUN
D
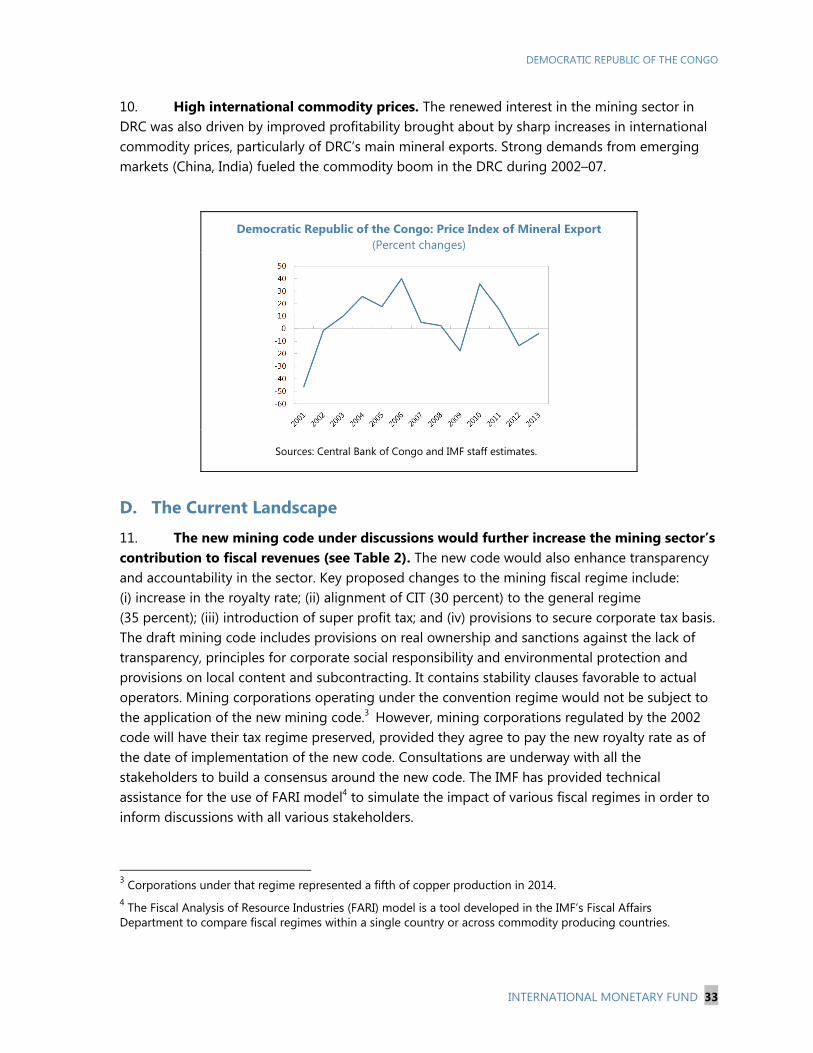
DEMOCRATIC REPUBLIC OF THE CONGO
INTERNATIONAL MONETARY FUND 33
10. High international commodity prices. The renewed interest in the mining sector in DRC was also driven by improved profitability brought about by sharp increases in international commodity prices, particularly of DRC’s main mineral exports. Strong demands from emerging markets (China, India) fueled the commodity boom in the DRC during 2002–07.
Democratic Republic of the Congo: Price Index of Mineral Export (Percent changes)
Sources: Central Bank of Congo and IMF staff estimates.
D. The Current Landscape
11. The new mining code under discussions would further increase the mining sector’s contribution to fiscal revenues (see Table 2). The new code would also enhance transparency and accountability in the sector. Key proposed changes to the mining fiscal regime include: (i) increase in the royalty rate; (ii) alignment of CIT (30 percent) to the general regime (35 percent); (iii) introduction of super profit tax; and (iv) provisions to secure corporate tax basis. The draft mining code includes provisions on real ownership and sanctions against the lack of transparency, principles for corporate social responsibility and environmental protection and provisions on local content and subcontracting. It contains stability clauses favorable to actual operators. Mining corporations operating under the convention regime would not be subject to the application of the new mining code.3 However, mining corporations regulated by the 2002 code will have their tax regime preserved, provided they agree to pay the new royalty rate as of the date of implementation of the new code. Consultations are underway with all the stakeholders to build a consensus around the new code. The IMF has provided technical assistance for the use of FARI model4 to simulate the impact of various fiscal regimes in order to inform discussions with all various stakeholders.
3 Corporations under that regime represented a fifth of copper production in 2014. 4 The Fiscal Analysis of Resource Industries (FARI) model is a tool developed in the IMF’s Fiscal Affairs Department to compare fiscal regimes within a single country or across commodity producing countries.
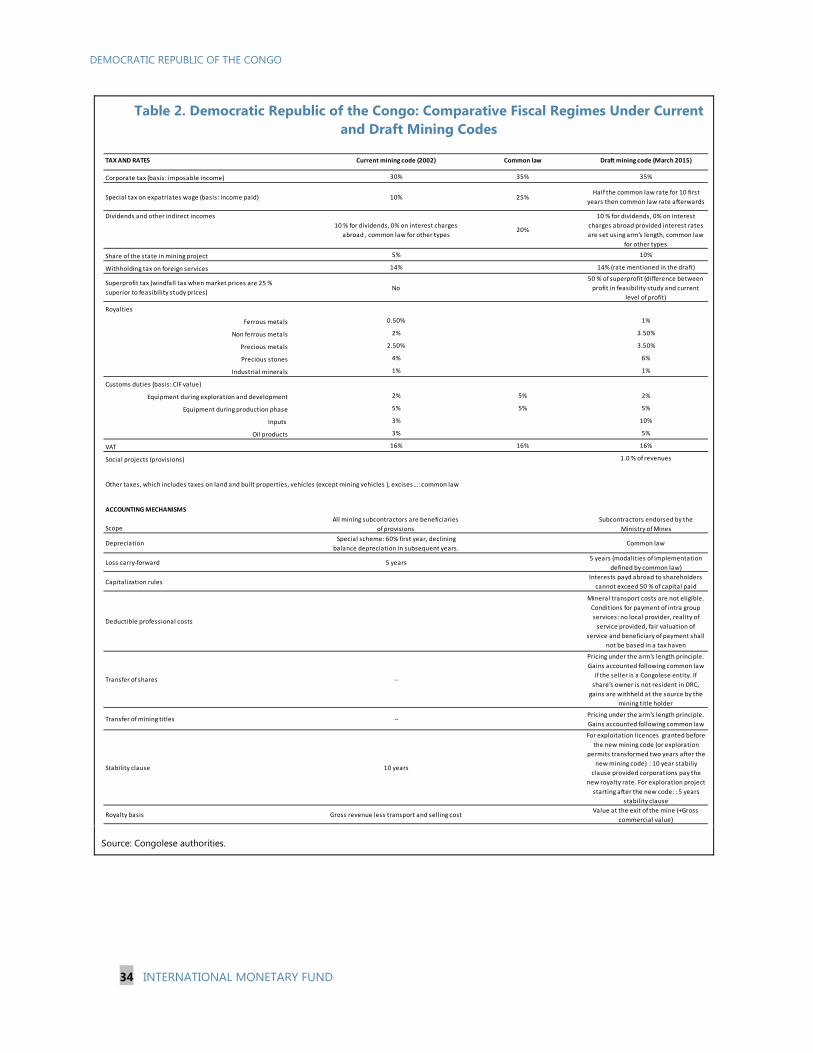
DEMOCRATIC REPUBLIC OF THE CONGO
34 INTERNATIONAL MONETARY FUND
Table 2. Democratic Republic of the Congo: Comparative Fiscal Regimes Under Current and Draft Mining Codes
Source: Congolese authorities.
TAX AND RATES Current mining code (2002) Common law Draft mining code (March 2015)
Corporate tax (basis: imposable income) 30% 35% 35%
Special tax on expatriates wage (basis: income paid) 10% 25%Half the common law rate for 10 first
years then common law rate afterwards
Dividends and other indirect incomes
10 % for dividends, 0% on interest charges
abroad , common law for other types20%
10 % for dividends, 0% on interest
charges abroad provided interest rates
are set using arm's length, common law
for other types
Share of the state in mining project 5% 10%
Withholding tax on foreign services 14% 14% (rate mentioned in the draft)
Superprofit tax (windfall tax when market prices are 25 %
superior to feasibility study prices)No
50 % of superprofit (difference between
profit in feasibility study and current
level of profit)
Royalties
Ferrous metals 0.50% 1%
Non ferrous metals 2% 3.50%
Precious metals 2.50% 3.50%
Precious stones 4% 6%
Industrial minerals 1% 1%
Customs duties (basis: CIF value)
Equipment during exploration and development 2% 5% 2%
Equipment during production phase 5% 5% 5%
Inputs 3% 10%
Oil products 3% 5%
VAT 16% 16% 16%
Social projects (provisions) 1.0 % of revenues
Other taxes, which includes taxes on land and built properties, vehicles (except mining vehicles ), excises…: common law
ACCOUNTING MECHANISMS
Scope
All mining subcontractors are beneficiaries
of provisions
Subcontractors endorsed by the
Ministry of Mines
Depreciation Special scheme: 60% first year, declining
balance depreciation in subsequent years.Common law
Loss carry-forward 5 years5 years (modalities of implementation
defined by common law)
Capitalization rules Interests payd abroad to shareholders
cannot exceed 50 % of capital paid
Deductible professional costs
Mineral transport costs are not eligible.
Conditions for payment of intra group
services: no local provider, reality of
service provided, fair valuation of
service and beneficiary of payment shall
not be based in a tax haven
Transfer of shares --
Pricing under the arm's length principle.
Gains accounted following common law
if the seller is a Congolese entity. If
share's owner is not resident in DRC,
gains are withheld at the source by the
mining title holder
Transfer of mining titles --Pricing under the arm's length principle.
Gains accounted following common law
Stability clause 10 years
For exploitation licences granted before
the new mining code (or exploration
permits transformed two years after the
new mining code) : 10 year stabiliy
clause provided corporations pay the
new royalty rate. For exploration project
starting after the new code: : 5 years
stability clause
Royalty basis Gross revenue less transport and selling costValue at the exit of the mine (+Gross
commercial value)
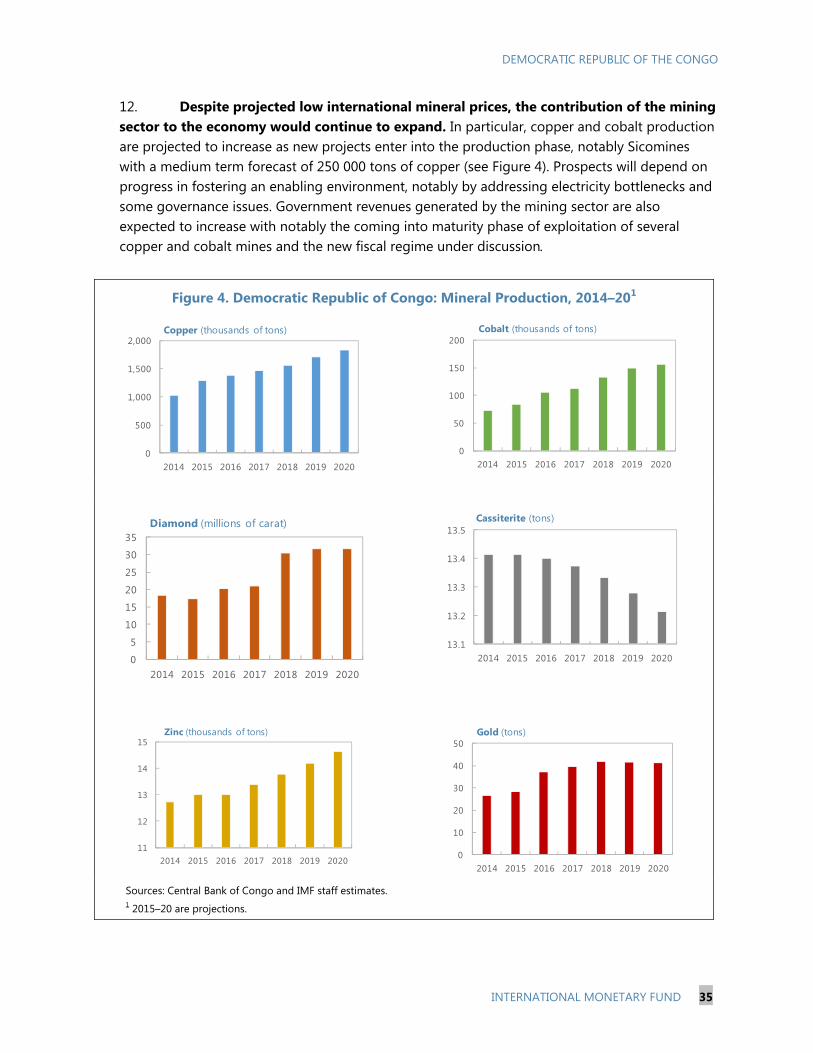
DEMOCRATIC REPUBLIC OF THE CONGO
INTERNATIONAL MONETARY FUND 35
12. Despite projected low international mineral prices, the contribution of the mining sector to the economy would continue to expand. In particular, copper and cobalt production are projected to increase as new projects enter into the production phase, notably Sicomines with a medium term forecast of 250 000 tons of copper (see Figure 4). Prospects will depend on progress in fostering an enabling environment, notably by addressing electricity bottlenecks and some governance issues. Government revenues generated by the mining sector are also expected to increase with notably the coming into maturity phase of exploitation of several copper and cobalt mines and the new fiscal regime under discussion.
Figure 4. Democratic Republic of Congo: Mineral Production, 2014–201
Sources: Central Bank of Congo and IMF staff estimates. 1 2015–20 are projections.
0
500
1,000
1,500
2,000
2014 2015 2016 2017 2018 2019 2020
Copper (thousands of tons)
0
50
100
150
200
2014 2015 2016 2017 2018 2019 2020
Cobalt (thousands of tons)
0
5
10
15
20
25
30
35
2014 2015 2016 2017 2018 2019 2020
Diamond (millions of carat)
13.1
13.2
13.3
13.4
13.5
2014 2015 2016 2017 2018 2019 2020
Cassiterite (tons)
11
12
13
14
15
2014 2015 2016 2017 2018 2019 2020
Zinc (thousands of tons)
0
10
20
30
40
50
2014 2015 2016 2017 2018 2019 2020
Gold (tons)
DEMOCRATIC REPUBLIC OF THE CONGO
36 INTERNATIONAL MONETARY FUND
References Extractive Industries Transparency Initiative, 2014, Democratic Republic of the Congo: Reports
2007 to 2013.
Mupepele Monti L., 2012, “L'industrie minérale congolaise: chiffres et défis (L'Harmattan}.”
World Bank, 2008, “Growth with Governance in the Mining Sector.
World Bank , 2012, “Résilience d'un géant African: Accélérer la Croissance et Promouvoir l'Emploi en République Démocratique du Congo,“ under the supervision of Herderschee J., Mukoko Samba D., Thimenga Tshibangu M., Mediaspaul.
.
DEMOCRATIC REPUBLIC OF THE CONGO
INTERNATIONAL MONETARY FUND 37
STRENGTHENING BUDGET CREDIBILITY1 Budget credibility in the Democratic Republic of the Congo (DRC) has been undermined by unrealistic resource projections. This situation has complicated budget execution and limited Parliament’s oversight role. This note analyses resource and expenditure forecasts to budget execution over the past five years in order to identify the main causes of low implementation, and proposes measures that would enhance the credibility of the budget.
A. Actual and Forecasted Resources
1. Differences between budgeted resources and outturns in the DRC have been large. As illustrated in Figure 1a and 1b, over the past five years, the execution rates of total budgeted resources have fluctuated between 48.6 and 71.9 percent, driven mostly by developments in external resources. Tax and non-tax revenues, albeit more predictable with execution rates ranging from 75 to 85 percent, also contributed to the fluctuations. While both the budgeted resources and outturns have increased at an average of about 25 percent per annum in nominal terms, revenue projections in the budget process seem to not take into consideration the outturns of the previous year and appear to be based on the previous year’s forecasts. This has led to resources projections always higher on average by 55 percent than the previous year’s outturns.
2. Several administrative weaknesses explain these discrepancies. For external financing, it mainly reflects flaws in the process of gathering data from donors, as well in the administrative capacity to mobilize aid. Concerning tax and non-tax revenue, the differences2 come from natural resource and telecommunication revenues (royalties and other one-off revenues), and reflect both limited technical capacity of the administration to forecast mining and telecommunication revenues, as well insufficient information-sharing between line ministries and revenue administration. They also come from VAT, and indicate difficulties by the tax administration to control the VAT base. For instance, poor VAT performance has accounted for up to 50 percent of the budget/execution gap in 2013 and over 25 percent in 2012.
1 Prepared by Patrick Petit. 2 Before 2011, by far the most important cause for the gap in tax and non-tax revenues was difficulties in forecasting revenues from the provinces. Since the adoption in 2011 of the Law on Public Finance Management, revenues from provinces are excluded from the central government’s budget.
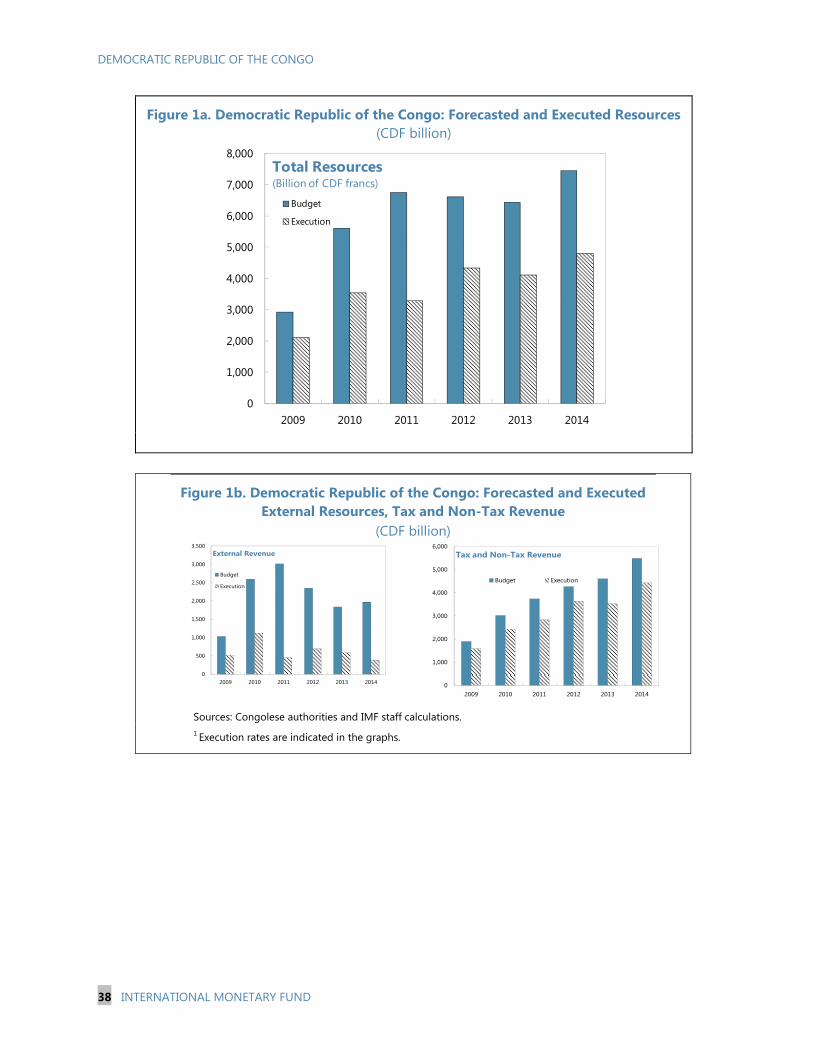
DEMOCRATIC REPUBLIC OF THE CONGO
38 INTERNATIONAL MONETARY FUND
0
500
1,000
1,500
2,000
2,500
3,000
3,500
2009 2010 2011 2012 2013 2014
Budget
Execution
External Revenue
Figure 1a. Democratic Republic of the Congo: Forecasted and Executed Resources (CDF billion)
Figure 1b. Democratic Republic of the Congo: Forecasted and Executed External Resources, Tax and Non-Tax Revenue
(CDF billion)
Sources: Congolese authorities and IMF staff calculations. 1 Execution rates are indicated in the graphs.
0
1,000
2,000
3,000
4,000
5,000
6,000
7,000
8,000
2009 2010 2011 2012 2013 2014
Budget
Execution
Total Resources(Billion of CDF francs)
0
1,000
2,000
3,000
4,000
5,000
6,000
2009 2010 2011 2012 2013 2014
Budget Execution
Tax and Non-Tax Revenue
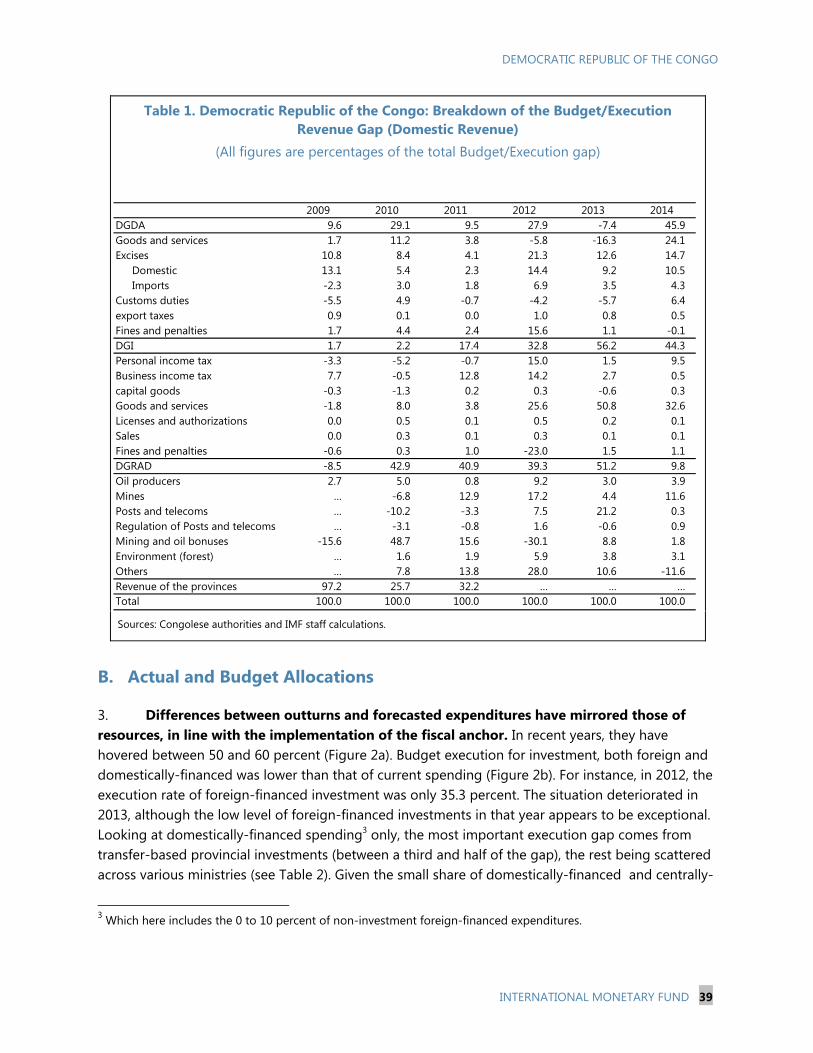
DEMOCRATIC REPUBLIC OF THE CONGO
INTERNATIONAL MONETARY FUND 39
Table 1. Democratic Republic of the Congo: Breakdown of the Budget/Execution Revenue Gap (Domestic Revenue)
(All figures are percentages of the total Budget/Execution gap)
Sources: Congolese authorities and IMF staff calculations.
B. Actual and Budget Allocations
3. Differences between outturns and forecasted expenditures have mirrored those of resources, in line with the implementation of the fiscal anchor. In recent years, they have hovered between 50 and 60 percent (Figure 2a). Budget execution for investment, both foreign and domestically-financed was lower than that of current spending (Figure 2b). For instance, in 2012, the execution rate of foreign-financed investment was only 35.3 percent. The situation deteriorated in 2013, although the low level of foreign-financed investments in that year appears to be exceptional. Looking at domestically-financed spending3 only, the most important execution gap comes from transfer-based provincial investments (between a third and half of the gap), the rest being scattered across various ministries (see Table 2). Given the small share of domestically-financed and centrally-
3 Which here includes the 0 to 10 percent of non-investment foreign-financed expenditures.
2009 2010 2011 2012 2013 2014DGDA 9.6 29.1 9.5 27.9 -7.4 45.9Goods and services 1.7 11.2 3.8 -5.8 -16.3 24.1Excises 10.8 8.4 4.1 21.3 12.6 14.7
Domestic 13.1 5.4 2.3 14.4 9.2 10.5Imports -2.3 3.0 1.8 6.9 3.5 4.3
Customs duties -5.5 4.9 -0.7 -4.2 -5.7 6.4export taxes 0.9 0.1 0.0 1.0 0.8 0.5Fines and penalties 1.7 4.4 2.4 15.6 1.1 -0.1DGI 1.7 2.2 17.4 32.8 56.2 44.3Personal income tax -3.3 -5.2 -0.7 15.0 1.5 9.5Business income tax 7.7 -0.5 12.8 14.2 2.7 0.5capital goods -0.3 -1.3 0.2 0.3 -0.6 0.3Goods and services -1.8 8.0 3.8 25.6 50.8 32.6Licenses and authorizations 0.0 0.5 0.1 0.5 0.2 0.1Sales 0.0 0.3 0.1 0.3 0.1 0.1Fines and penalties -0.6 0.3 1.0 -23.0 1.5 1.1DGRAD -8.5 42.9 40.9 39.3 51.2 9.8Oil producers 2.7 5.0 0.8 9.2 3.0 3.9Mines … -6.8 12.9 17.2 4.4 11.6Posts and telecoms … -10.2 -3.3 7.5 21.2 0.3Regulation of Posts and telecoms … -3.1 -0.8 1.6 -0.6 0.9Mining and oil bonuses -15.6 48.7 15.6 -30.1 8.8 1.8Environment (forest) … 1.6 1.9 5.9 3.8 3.1Others … 7.8 13.8 28.0 10.6 -11.6Revenue of the provinces 97.2 25.7 32.2 … … …Total 100.0 100.0 100.0 100.0 100.0 100.0
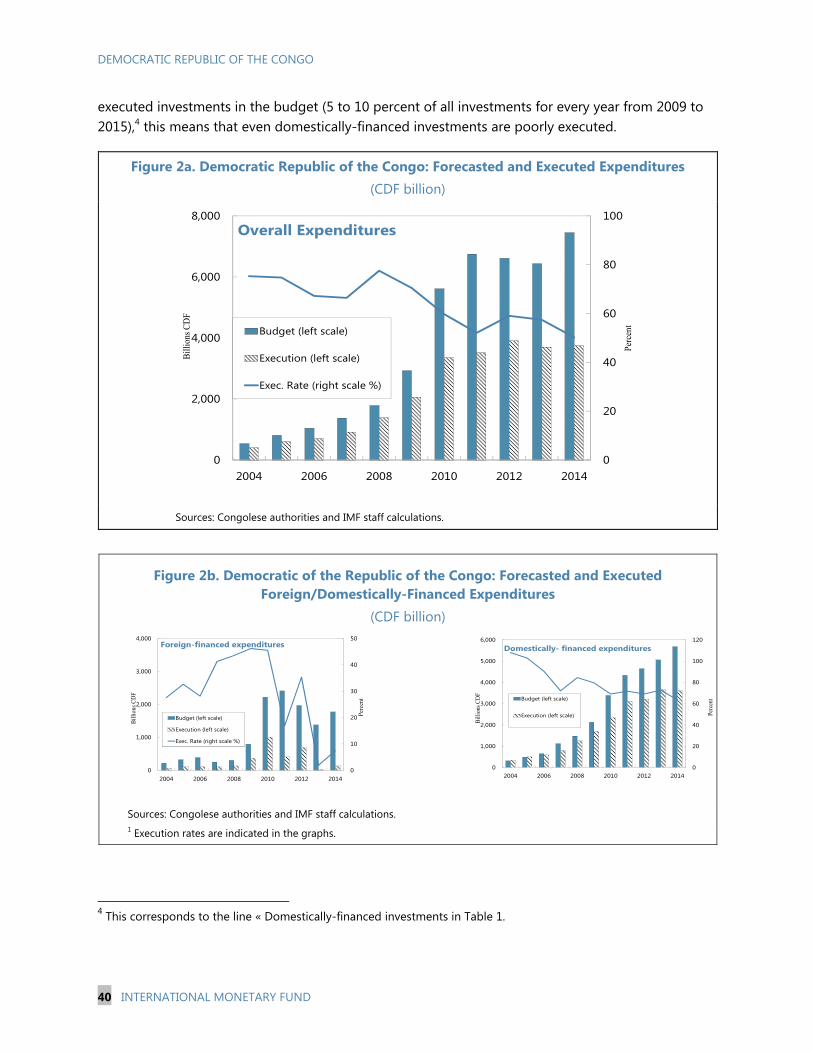
DEMOCRATIC REPUBLIC OF THE CONGO
40 INTERNATIONAL MONETARY FUND
executed investments in the budget (5 to 10 percent of all investments for every year from 2009 to 2015),4 this means that even domestically-financed investments are poorly executed.
Figure 2a. Democratic Republic of the Congo: Forecasted and Executed Expenditures (CDF billion)
Sources: Congolese authorities and IMF staff calculations.
Figure 2b. Democratic of the Republic of the Congo: Forecasted and Executed Foreign/Domestically-Financed Expenditures
(CDF billion)
Sources: Congolese authorities and IMF staff calculations. 1 Execution rates are indicated in the graphs.
4 This corresponds to the line « Domestically-financed investments in Table 1.
0
20
40
60
80
100
0
2,000
4,000
6,000
8,000
2004 2006 2008 2010 2012 2014
Perc
ent
Bill
ions
CD
F
Budget (left scale)
Execution (left scale)
Exec. Rate (right scale %)
Overall Expenditures
0
10
20
30
40
50
0
1,000
2,000
3,000
4,000
2004 2006 2008 2010 2012 2014
Perc
ent
Bill
ions
CD
F
Budget (left scale)
Execution (left scale)
Exec. Rate (right scale %)
Foreign-financed expenditures
0
20
40
60
80
100
120
0
1,000
2,000
3,000
4,000
5,000
6,000
2004 2006 2008 2010 2012 2014
Perc
ent
Bill
ions
CD
F
Budget (left scale)
Execution (left scale)
Domestically- financed expenditures
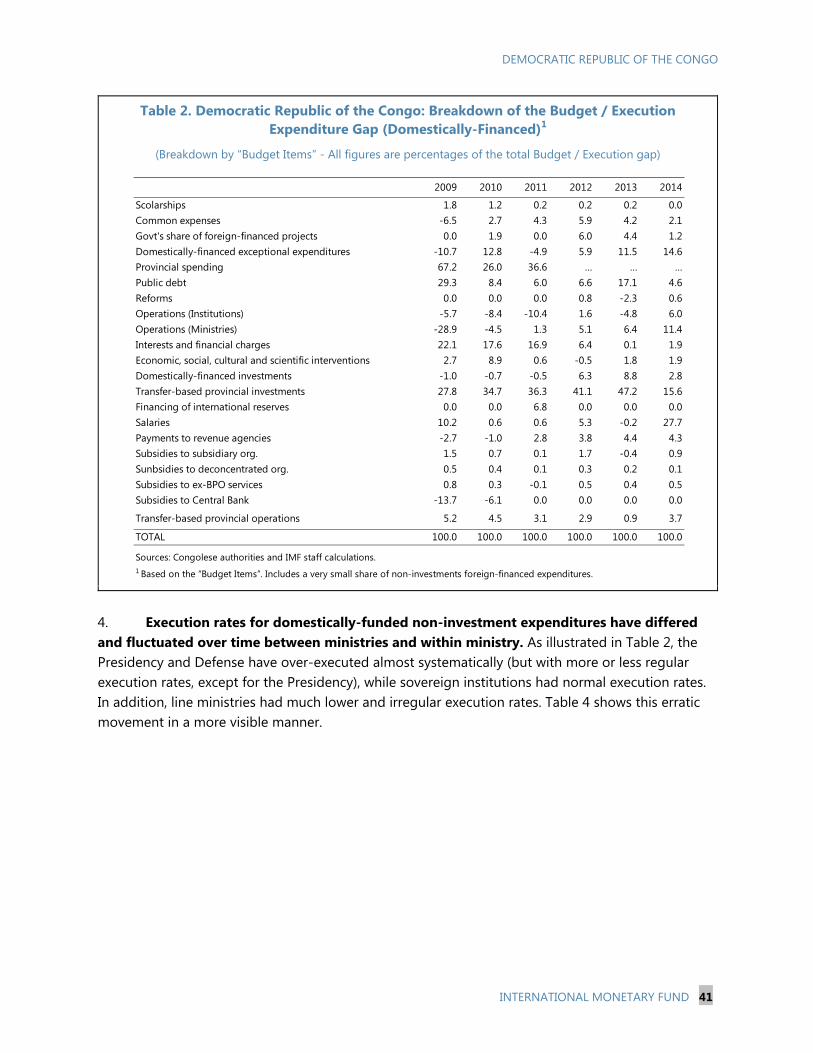
DEMOCRATIC REPUBLIC OF THE CONGO
INTERNATIONAL MONETARY FUND 41
Table 2. Democratic Republic of the Congo: Breakdown of the Budget / Execution Expenditure Gap (Domestically-Financed)1
(Breakdown by “Budget Items” - All figures are percentages of the total Budget / Execution gap)
4. Execution rates for domestically-funded non-investment expenditures have differed and fluctuated over time between ministries and within ministry. As illustrated in Table 2, the Presidency and Defense have over-executed almost systematically (but with more or less regular execution rates, except for the Presidency), while sovereign institutions had normal execution rates. In addition, line ministries had much lower and irregular execution rates. Table 4 shows this erratic movement in a more visible manner.
2009 2010 2011 2012 2013 2014
Scolarships 1.8 1.2 0.2 0.2 0.2 0.0Common expenses -6.5 2.7 4.3 5.9 4.2 2.1Govt's share of foreign-financed projects 0.0 1.9 0.0 6.0 4.4 1.2Domestically-financed exceptional expenditures -10.7 12.8 -4.9 5.9 11.5 14.6Provincial spending 67.2 26.0 36.6 … … …Public debt 29.3 8.4 6.0 6.6 17.1 4.6Reforms 0.0 0.0 0.0 0.8 -2.3 0.6Operations (Institutions) -5.7 -8.4 -10.4 1.6 -4.8 6.0Operations (Ministries) -28.9 -4.5 1.3 5.1 6.4 11.4Interests and financial charges 22.1 17.6 16.9 6.4 0.1 1.9Economic, social, cultural and scientific interventions 2.7 8.9 0.6 -0.5 1.8 1.9Domestically-financed investments -1.0 -0.7 -0.5 6.3 8.8 2.8Transfer-based provincial investments 27.8 34.7 36.3 41.1 47.2 15.6Financing of international reserves 0.0 0.0 6.8 0.0 0.0 0.0Salaries 10.2 0.6 0.6 5.3 -0.2 27.7Payments to revenue agencies -2.7 -1.0 2.8 3.8 4.4 4.3Subsidies to subsidiary org. 1.5 0.7 0.1 1.7 -0.4 0.9Sunbsidies to deconcentrated org. 0.5 0.4 0.1 0.3 0.2 0.1Subsidies to ex-BPO services 0.8 0.3 -0.1 0.5 0.4 0.5Subsidies to Central Bank -13.7 -6.1 0.0 0.0 0.0 0.0
Transfer-based provincial operations 5.2 4.5 3.1 2.9 0.9 3.7
TOTAL 100.0 100.0 100.0 100.0 100.0 100.0
1 Based on the “Budget Items”. Includes a very small share of non-investments foreign-financed expenditures.
Sources: Congolese authorities and IMF staff calculations.
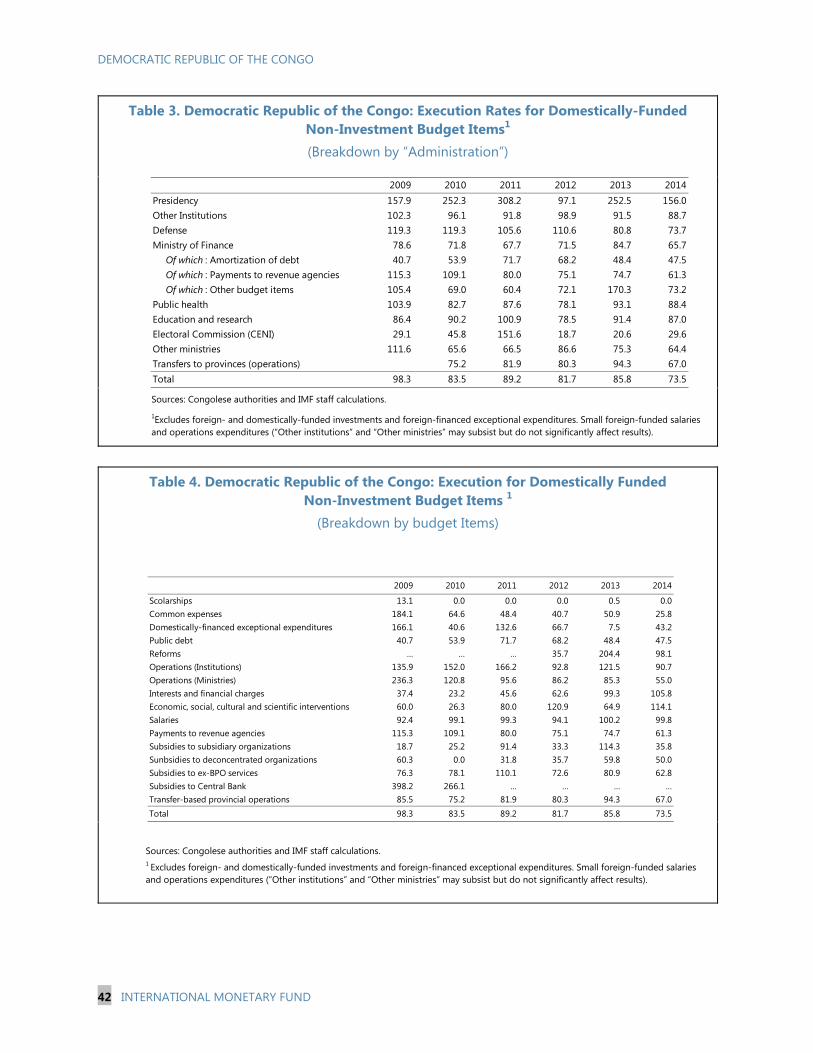
DEMOCRATIC REPUBLIC OF THE CONGO
42 INTERNATIONAL MONETARY FUND
Table 3. Democratic Republic of the Congo: Execution Rates for Domestically-Funded Non-Investment Budget Items1 (Breakdown by “Administration”)
Sources: Congolese authorities and IMF staff calculations.
1Excludes foreign- and domestically-funded investments and foreign-financed exceptional expenditures. Small foreign-funded salaries and operations expenditures (“Other institutions” and “Other ministries” may subsist but do not significantly affect results).
Table 4. Democratic Republic of the Congo: Execution for Domestically Funded Non-Investment Budget Items 1
(Breakdown by budget Items)
Sources: Congolese authorities and IMF staff calculations. 1 Excludes foreign- and domestically-funded investments and foreign-financed exceptional expenditures. Small foreign-funded salaries and operations expenditures (“Other institutions” and “Other ministries” may subsist but do not significantly affect results).
2009 2010 2011 2012 2013 2014Presidency 157.9 252.3 308.2 97.1 252.5 156.0Other Institutions 102.3 96.1 91.8 98.9 91.5 88.7Defense 119.3 119.3 105.6 110.6 80.8 73.7Ministry of Finance 78.6 71.8 67.7 71.5 84.7 65.7
Of which : Amortization of debt 40.7 53.9 71.7 68.2 48.4 47.5Of which : Payments to revenue agencies 115.3 109.1 80.0 75.1 74.7 61.3Of which : Other budget items 105.4 69.0 60.4 72.1 170.3 73.2
Public health 103.9 82.7 87.6 78.1 93.1 88.4Education and research 86.4 90.2 100.9 78.5 91.4 87.0Electoral Commission (CENI) 29.1 45.8 151.6 18.7 20.6 29.6Other ministries 111.6 65.6 66.5 86.6 75.3 64.4Transfers to provinces (operations) 75.2 81.9 80.3 94.3 67.0Total 98.3 83.5 89.2 81.7 85.8 73.5
2009 2010 2011 2012 2013 2014
Scolarships 13.1 0.0 0.0 0.0 0.5 0.0Common expenses 184.1 64.6 48.4 40.7 50.9 25.8Domestically-financed exceptional expenditures 166.1 40.6 132.6 66.7 7.5 43.2Public debt 40.7 53.9 71.7 68.2 48.4 47.5Reforms … … … 35.7 204.4 98.1Operations (Institutions) 135.9 152.0 166.2 92.8 121.5 90.7Operations (Ministries) 236.3 120.8 95.6 86.2 85.3 55.0Interests and financial charges 37.4 23.2 45.6 62.6 99.3 105.8Economic, social, cultural and scientific interventions 60.0 26.3 80.0 120.9 64.9 114.1Salaries 92.4 99.1 99.3 94.1 100.2 99.8Payments to revenue agencies 115.3 109.1 80.0 75.1 74.7 61.3Subsidies to subsidiary organizations 18.7 25.2 91.4 33.3 114.3 35.8Sunbsidies to deconcentrated organizations 60.3 0.0 31.8 35.7 59.8 50.0Subsidies to ex-BPO services 76.3 78.1 110.1 72.6 80.9 62.8Subsidies to Central Bank 398.2 266.1 … … … …Transfer-based provincial operations 85.5 75.2 81.9 80.3 94.3 67.0
Total 98.3 83.5 89.2 81.7 85.8 73.5
DEMOCRATIC REPUBLIC OF THE CONGO
INTERNATIONAL MONETARY FUND 43
C. The Road to Enhance Budget Credibility
5. Large gap between actual and forecasted revenue and expenditures undermines budget credibility and the oversight role of Parliament. Shortfalls in the revenue collection in the DRC’s context inevitably lead re-prioritization and re-allocation of resources, thus depriving Parliament of its authority and rightful role in the budget management process. Inasmuch as expenditure cuts heavily fall on investments, this could inhibit private sector development because of the ensuing lack of enabling environment.
6. Ensuring the realism of resource projections is paramount to budget credibility. In this regard, it is necessary to use past realizations as a basis for projections. Tax measures attached to the draft budget should be adopted simultaneously with the budget law or otherwise the related resources deducted from the draft budget. The capacity of revenue administration to forecast natural resource revenues needs to be strengthened. In this regard, the FARI5 model provided by the IMF to the authorities through a technical assistance could be used to forecast natural resource revenues. Better information sharing between line ministries and the Ministry of Budget in one hand, and the authorities and donors on the other hand could help reduce discrepancy between revenue projections and outcomes.
7. The increased use of supplementary budget is a means to restore the credibility of the budget and the oversight of the parliament. It would allow to factor into the budget (revenue and expenditure) the impact of unanticipated developments since the adoption of the budget, preserving then the oversight role of parliament. Frequent budget overruns in some lines would then be avoided.
5 The Fiscal Analysis of Resources Industries (FARI) model is a tool developed in the IMF’s Fiscal Affairs Department.
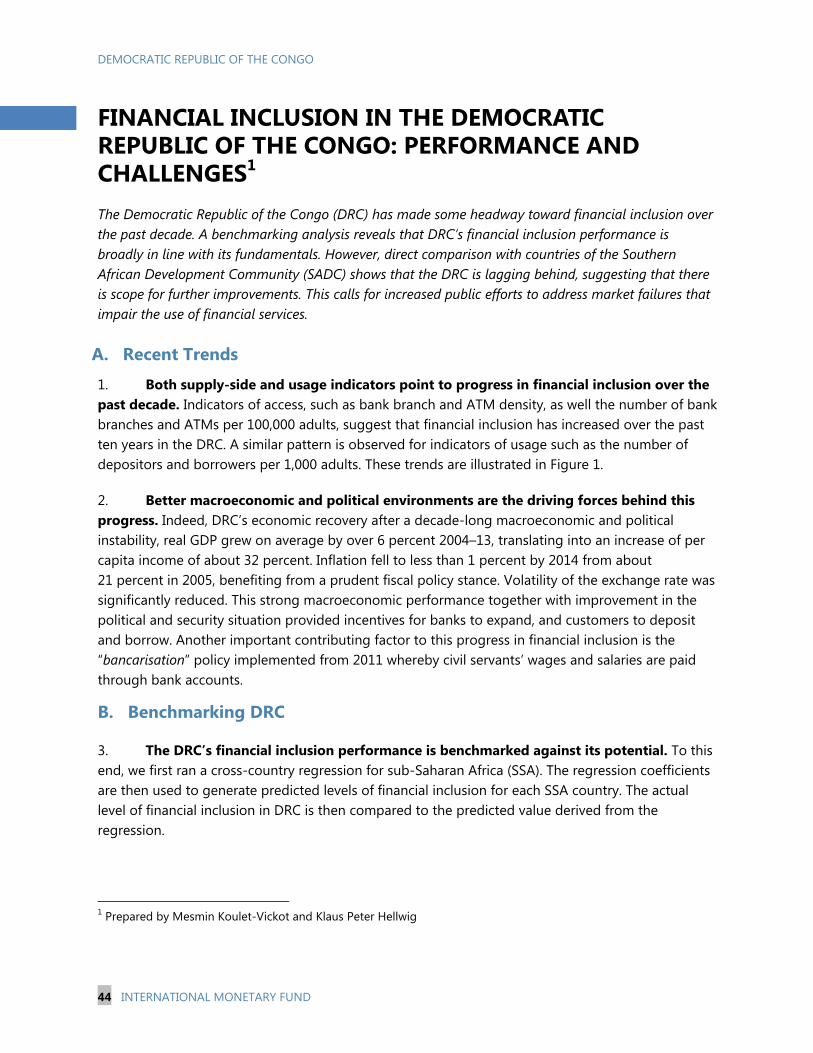
DEMOCRATIC REPUBLIC OF THE CONGO
44 INTERNATIONAL MONETARY FUND
FINANCIAL INCLUSION IN THE DEMOCRATIC REPUBLIC OF THE CONGO: PERFORMANCE AND CHALLENGES1 The Democratic Republic of the Congo (DRC) has made some headway toward financial inclusion over the past decade. A benchmarking analysis reveals that DRC’s financial inclusion performance is broadly in line with its fundamentals. However, direct comparison with countries of the Southern African Development Community (SADC) shows that the DRC is lagging behind, suggesting that there is scope for further improvements. This calls for increased public efforts to address market failures that impair the use of financial services.
A. Recent Trends
1. Both supply-side and usage indicators point to progress in financial inclusion over the past decade. Indicators of access, such as bank branch and ATM density, as well the number of bank branches and ATMs per 100,000 adults, suggest that financial inclusion has increased over the past ten years in the DRC. A similar pattern is observed for indicators of usage such as the number of depositors and borrowers per 1,000 adults. These trends are illustrated in Figure 1.
2. Better macroeconomic and political environments are the driving forces behind this progress. Indeed, DRC’s economic recovery after a decade-long macroeconomic and political instability, real GDP grew on average by over 6 percent 2004–13, translating into an increase of per capita income of about 32 percent. Inflation fell to less than 1 percent by 2014 from about 21 percent in 2005, benefiting from a prudent fiscal policy stance. Volatility of the exchange rate was significantly reduced. This strong macroeconomic performance together with improvement in the political and security situation provided incentives for banks to expand, and customers to deposit and borrow. Another important contributing factor to this progress in financial inclusion is the “bancarisation” policy implemented from 2011 whereby civil servants’ wages and salaries are paid through bank accounts.
B. Benchmarking DRC
3. The DRC’s financial inclusion performance is benchmarked against its potential. To this end, we first ran a cross-country regression for sub-Saharan Africa (SSA). The regression coefficients are then used to generate predicted levels of financial inclusion for each SSA country. The actual level of financial inclusion in DRC is then compared to the predicted value derived from the regression.
1 Prepared by Mesmin Koulet-Vickot and Klaus Peter Hellwig
DEMOCRATIC REPUBLIC OF THE CONGO
INTERNATIONAL MONETARY FUND 45
Figure 1. Democratic Republic of the Congo: Access to and Use of Financial Services
4. Variables of the model. We used two financial inclusion measures: the number of depositors with commercial banks per 1,000 adults and the number of borrowers with commercial banks per 1,000 adults. These variables come from the IMF’s Financial Access Survey (FAS) and only cover the year 2013. We assumed that financial inclusion is affected by three types of factors: structural characteristic, economic development, and policy environment. The list of variables as well the sources are presented in Table 1.
5. The benchmarking regression suggests that there is no financial inclusion gap in 2013. Put it differently, DRC is about where it should be based on its fundamentals. However, it is worth noting that the predicted level of financial inclusion derived from this regression is not the optimal one, but rather the level based on a set of SSA countries’ fundamentals (Appendix).
Source: FAS, IMF.
0.00
0.02
0.04
0.06
0.08
0.10
0.12
0.0
0.1
0.2
0.3
0.4
0.5
0.6
0.7
0.8
2004 2007 2010 2013
Commercial bank branches per 1,000 km2
Commercial bank branches per 100,000 adults (RHS)
Comercial Bank Branches
0.0
0.2
0.4
0.6
0.8
1.0
0.00
0.03
0.06
0.09
0.12
0.15
2009 2010 2011 2012 2013
ATMs per 1,000 km2
ATMs per 100,000 adults (RHS)
Number of ATMs
0.0
0.5
1.0
1.5
2.0
2.5
3.0
3.5
4.0
2004 2007 2010 2013
Borrowing From Commercial Banks (per 1,000 adults)
0
1
2
3
4
5
6
7
2010 2011 2012 2013
Loans Accounts with Commercial Banks (per 1,000 adults)
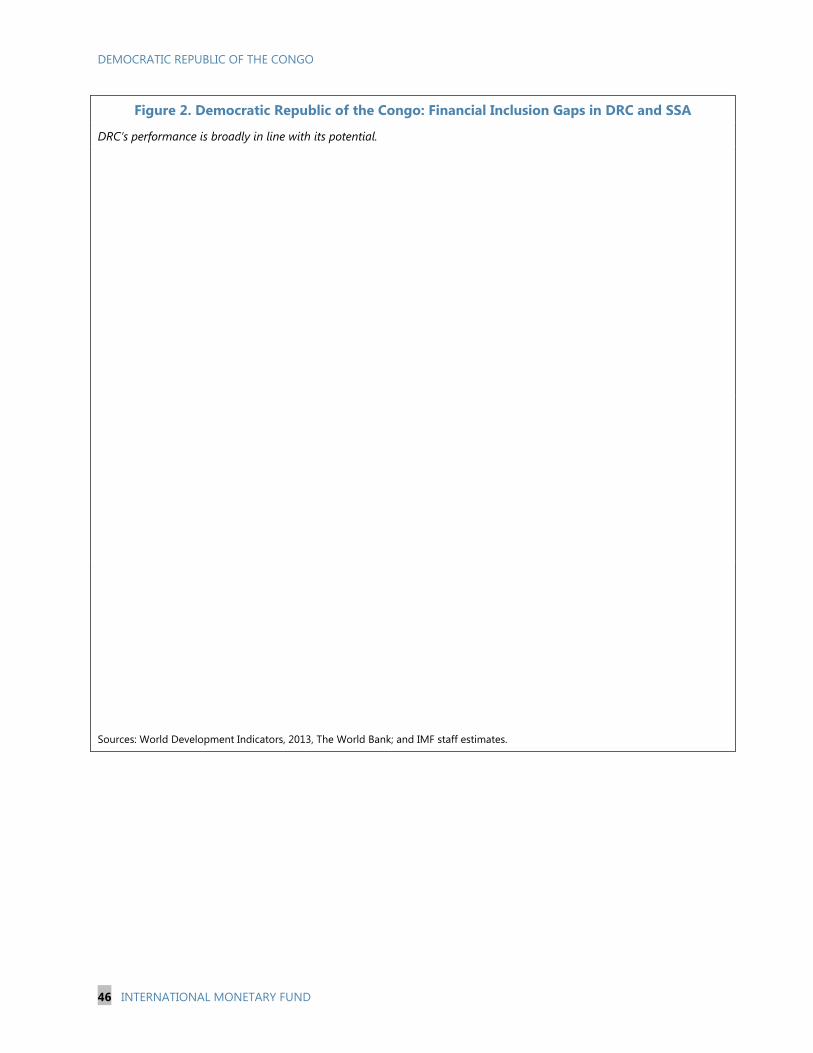
DEMOCRATIC REPUBLIC OF THE CONGO
46 INTERNATIONAL MONETARY FUND
Figure 2. Democratic Republic of the Congo: Financial Inclusion Gaps in DRC and SSA
DRC’s performance is broadly in line with its potential.
Sources: World Development Indicators, 2013, The World Bank; and IMF staff estimates.
DEMOCRATIC REPUBLIC OF THE CONGO
INTERNATIONAL MONETARY FUND 47
C. Barriers to Access
Challenges
6. Despite this recent progress, financial inclusion in DRC remains low compared to other SADC countries. According to the 2014 FinScope Survey (demand-side survey conducted by FinMark Trust), DRC has among the lowest inclusion financial levels in the SADC region (Figure 3). Only 48 percent of adults in DRC are financially included compared to 73 percent in Tanzania, 77 percent in Zimbabwe or 86 percent in South Africa. Similarly, DRC is lagging behind in terms of bank penetration as only 12 percent of adults use financial services provided by banks as compared to 75 percent in South Africa and 30 percent in Tanzania.
Figure 3. Democratic Republic of the Congo: Access Strand Across the Region (Percent)
Sources: World Development Indicators, 2013, The World Bank; and IMF staff estimates.
7. Financial inclusion is more limited among the most vulnerable segments of the population. Individuals at the bottom of the income distribution are the most financially excluded (see Figure 4), in particular people making a living in farming activities. There is also a small gender gap: 56 percent of women are excluded compared to 48 percent of men.
12
12
14
14
27
30
38
41
54
62
75
85
1
24
43
9
7
39
23
18
10
8
5
3
9
12
16
14
15
8
20
8
9
3
6
1
78
52
27
63
51
23
19
33
27
27
14
10
0 10 20 30 40 50 60 70 80 90 100
Mozambique 2009
DRC 2014
Tanzania 2013
Zambia 2009
Malawi 2014
Zimbabwe 2014
Lesotho 2011
Bostwana 2009
Swaziland 2014
Namibia 2011
South Africa 2014
Mauritius 2014
Banked Other formal (non-bank) Informal only Excluded
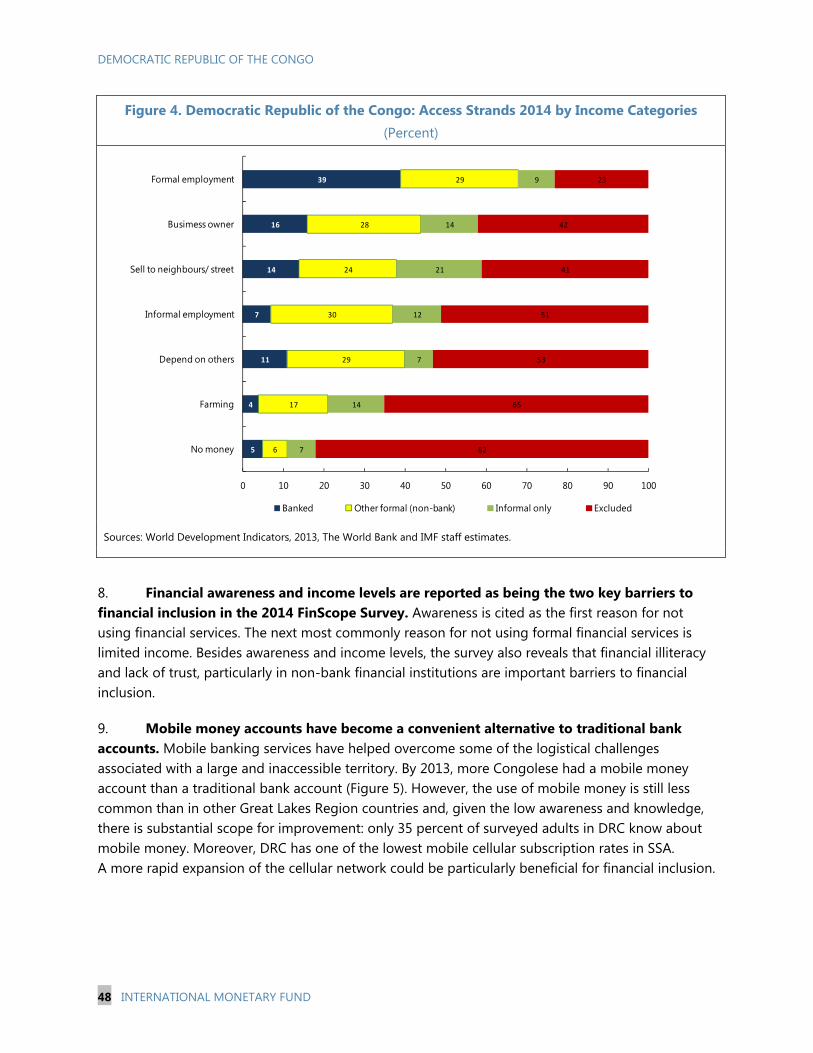
DEMOCRATIC REPUBLIC OF THE CONGO
48 INTERNATIONAL MONETARY FUND
Figure 4. Democratic Republic of the Congo: Access Strands 2014 by Income Categories (Percent)
Sources: World Development Indicators, 2013, The World Bank and IMF staff estimates.
8. Financial awareness and income levels are reported as being the two key barriers to financial inclusion in the 2014 FinScope Survey. Awareness is cited as the first reason for not using financial services. The next most commonly reason for not using formal financial services is limited income. Besides awareness and income levels, the survey also reveals that financial illiteracy and lack of trust, particularly in non-bank financial institutions are important barriers to financial inclusion.
9. Mobile money accounts have become a convenient alternative to traditional bank accounts. Mobile banking services have helped overcome some of the logistical challenges associated with a large and inaccessible territory. By 2013, more Congolese had a mobile money account than a traditional bank account (Figure 5). However, the use of mobile money is still less common than in other Great Lakes Region countries and, given the low awareness and knowledge, there is substantial scope for improvement: only 35 percent of surveyed adults in DRC know about mobile money. Moreover, DRC has one of the lowest mobile cellular subscription rates in SSA. A more rapid expansion of the cellular network could be particularly beneficial for financial inclusion.
5
4
11
7
14
16
39
6
17
29
30
24
28
29
7
14
7
12
21
14
9
82
65
53
51
41
42
23
0 10 20 30 40 50 60 70 80 90 100
No money
Farming
Depend on others
Informal employment
Sell to neighbours/ street
Busimess owner
Formal employment
Banked Other formal (non-bank) Informal only Excluded
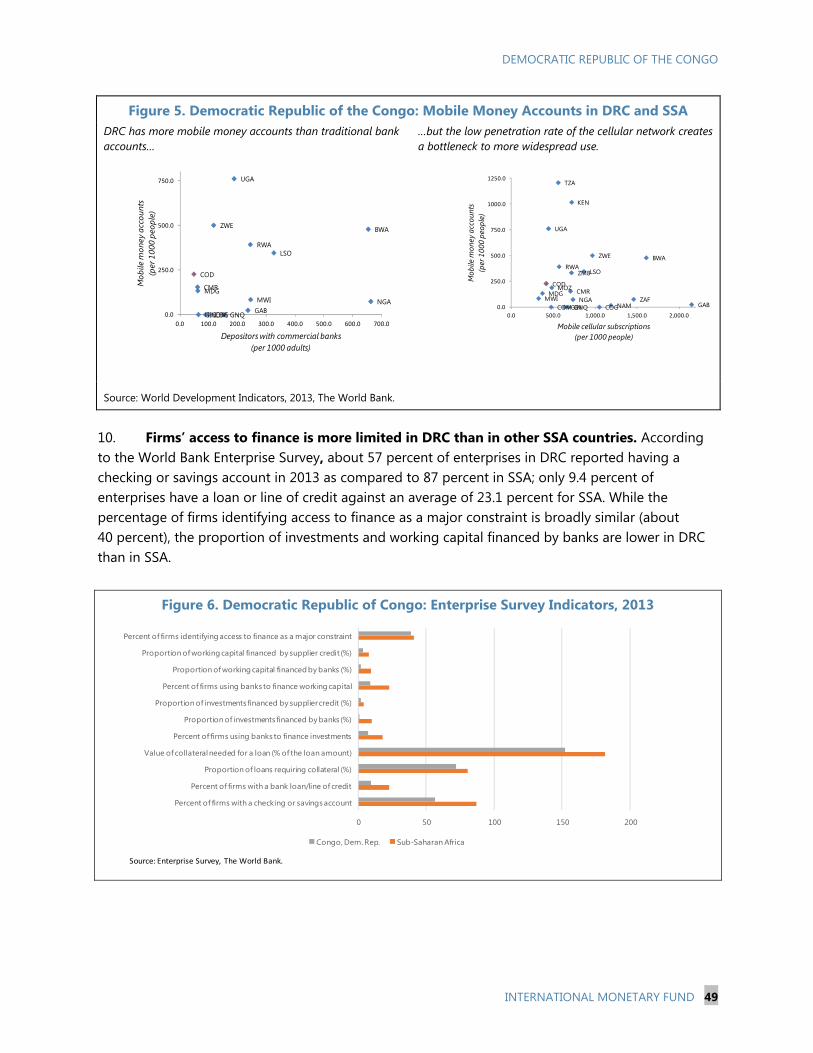
DEMOCRATIC REPUBLIC OF THE CONGO
INTERNATIONAL MONETARY FUND 49
Figure 5. Democratic Republic of the Congo: Mobile Money Accounts in DRC and SSA DRC has more mobile money accounts than traditional bank accounts…
…but the low penetration rate of the cellular network creates a bottleneck to more widespread use.
Source: World Development Indicators, 2013, The World Bank.
10. Firms’ access to finance is more limited in DRC than in other SSA countries. According to the World Bank Enterprise Survey, about 57 percent of enterprises in DRC reported having a checking or savings account in 2013 as compared to 87 percent in SSA; only 9.4 percent of enterprises have a loan or line of credit against an average of 23.1 percent for SSA. While the percentage of firms identifying access to finance as a major constraint is broadly similar (about 40 percent), the proportion of investments and working capital financed by banks are lower in DRC than in SSA.
Figure 6. Democratic Republic of Congo: Enterprise Survey Indicators, 2013
0 50 100 150 200
Percent of firms with a checking or savings account
Percent of firms with a bank loan/line of credit
Proportion of loans requiring collateral (%)
Value of collateral needed for a loan (% of the loan amount)
Percent of firms using banks to finance investments
Proportion of investments financed by banks (%)
Proportion of investments financed by supplier credit (%)
Percent of firms using banks to finance working capital
Proportion of working capital financed by banks (%)
Proportion of working capital financed by supplier credit (%)
Percent of firms identifying access to finance as a major constraint
Congo, Dem. Rep. Sub-Saharan Africa
Source: Enterprise Survey, The World Bank.
BWA
CMR
COM
COD
COGGNQ GABGIN
KEN
LSO
MDGMWI
MOZ
NAMNGA
RWA
ZAF
TZA
UGA
ZMB
ZWE
0.0
250.0
500.0
750.0
1000.0
1250.0
0.0 500.0 1,000.0 1,500.0 2,000.0
Mob
ile m
oney
acc
ount
s (p
er 1
000
peop
le)
Mobile cellular subscriptions (per 1000 people)
BWA
CMR
COM
COD
COG GNQ GABGIN
LSO
MDGMWI NGA
RWA
UGA
ZWE
0.0
250.0
500.0
750.0
0.0 100.0 200.0 300.0 400.0 500.0 600.0 700.0
Mob
ile m
oney
acc
ount
s (p
er 1
000
peop
le)
Depositors with commercial banks (per 1000 adults)
DEMOCRATIC REPUBLIC OF THE CONGO
50 INTERNATIONAL MONETARY FUND
D. Policy Recommendations
Enhancing financial inclusion will carry substantial benefits for the DRC’s economy in terms of resilience to shocks, resource allocation, diversification, and management of risks. In addition, by strengthening policy transmission, further financial inclusion will improve the effectiveness of monetary and fiscal policies. Therefore, fostering access and financial inclusion should be a top priority for the DRC’s authorities. In line with the 2014 Financial Sector Assessment Program (FSAP), priority actions are the following:
11. Filling the information environment gap. The BCC’s credit registry is limited to banks’ data, and a very small share of the population has proper documentation to engage in financial transactions. According to the 2014 Finscope, only 8 percent of the surveyed population has proof of residence, 6 percent has proof of income, and less than 4 percent has ID equivalent (passport, driver’s license or others). Actions are underway to modernize the credit registry and set up a credit bureau. For these reforms to be successful in terms of reducing moral hazard and therefore facilitating access to credit, all stakeholders will have actively participate and a connection between the two systems established. Efforts to provide documentation to the population will help enhance access to financial services.
12. Providing conducive regulatory frameworks. Several regulatory frameworks that govern the activities of the technology-based financial services, such as mobile financial services and payment systems, are missing or need to be updated to harness the potential of technological innovations (mobile banking, mobile payments, internet banking, and biometric identification). Recent evidences show the importance of flexible regulatory environment in encouraging the development of technology-based financial services (the M-PESA in Kenya). Research also underscores the role of flexible regulatory environment in the development of new financial products taking into account specific consumer needs. For instance, there is a need to adopt a specific regulatory framework for leasing to facilitate access to credit by SMEs, as recommended by the 2014 FSAP.
13. Restructuring and strengthening the oversight of the microfinance institutions (MFIs). As pointed out by the 2014 FSAP, the microfinance sector in the DRC has great potential to support financial inclusion, but the financial position of most of the MFIs is precarious. The impaired financial position of MFIs is mainly due to governance and internal audit deficiencies. Some steps have been taken to clean up the sector with the liquidation of 37 inactive MFIs and the withdrawal of 63 licenses. However, much remains to be done to put the sector on a sound footing. Priority actions include enforcing the minimum capital requirement and strengthening the supervision.
14. Promoting contractual savings. The impaired financial situation of the sole non-life insurance company (Société nationale d’assurances—Sonas) and the social security system prevent them for providing a significant contribution to the development of medium-and long-term savings. The authorities have recently taken steps to increase competition with the enactment of a new law liberalizing the insurance industry. In addition, a new Insurance Code aimed at strengthening
DEMOCRATIC REPUBLIC OF THE CONGO
INTERNATIONAL MONETARY FUND 51
governance and the powers of the supervisor has been adopted. Further actions are needed to strengthen the contractual savings sector. In particular, there is a need to raise the minimum capital requirement in the insurance industry and to restructure Sonas. With regards to pensions funds system, the authorities should initiate a reform process to ensure an actuarial balance and explore the possibility of extending the coverage of pensions plan. In addition, they should ensure that institutions responsible for pension management have an adequate organizational structure, tools and resources in place (see 2014 FSAP).
15. Strengthening insolvency and credit rights. Shortcomings in the legal framework and weaknesses in the functioning of the judicial system constitute a major obstacle to financial inclusion. As recommended by the 2014 FSAP, the authorities should strengthen compliance with the Organization for the Harmonization of Business Law in Africa (OHADA) framework, financial and human resources for commercial tribunals and modernize critical professions for the application of the laws.
16. Other specific policies to boost financial inclusion include:
Making use of the formal financial sector to make government payments and collect taxes. In this regard, the policy in place since 2011 to pay all civil servants via bank accounts is a good step, and should be pursued and extended;
Fostering financial literacy. The lack of awareness/knowledge calls for financial literacy program targeted to unschooled and financially illiterate households to show them how technology-based financial services work and the risks involved ;
Improving access of the population to information and communication technologies. Indeed, low levels of access to internet and mobile phone are impairing the widespread use of technology-based financial services.
DEMOCRATIC REPUBLIC OF THE CONGO
52 INTERNATIONAL MONETARY FUND
References Allen, Franklin, Elena Carletti, Robert Cull, Jun Quian, Lemma Senbet and Patricio Balenzuela, 2013,
‘’The African Financial Development and Financial Inclusion Gap,“ Wharton Financial Institutions Center Working Paper 13–09, University of Pennsylvania.
IMF, 2014, “Financial Sector Stability Report, Democratic Republic of the Congo,” IMF country report no.14/315.
FinMark Trust, 2014, “FinScope Consumer Survey, DRC 2014,” FinMark Trust, Johannesburg.
Global Financial Development Report, 2014, Financial Inclusion, Washington, DC: World Bank.
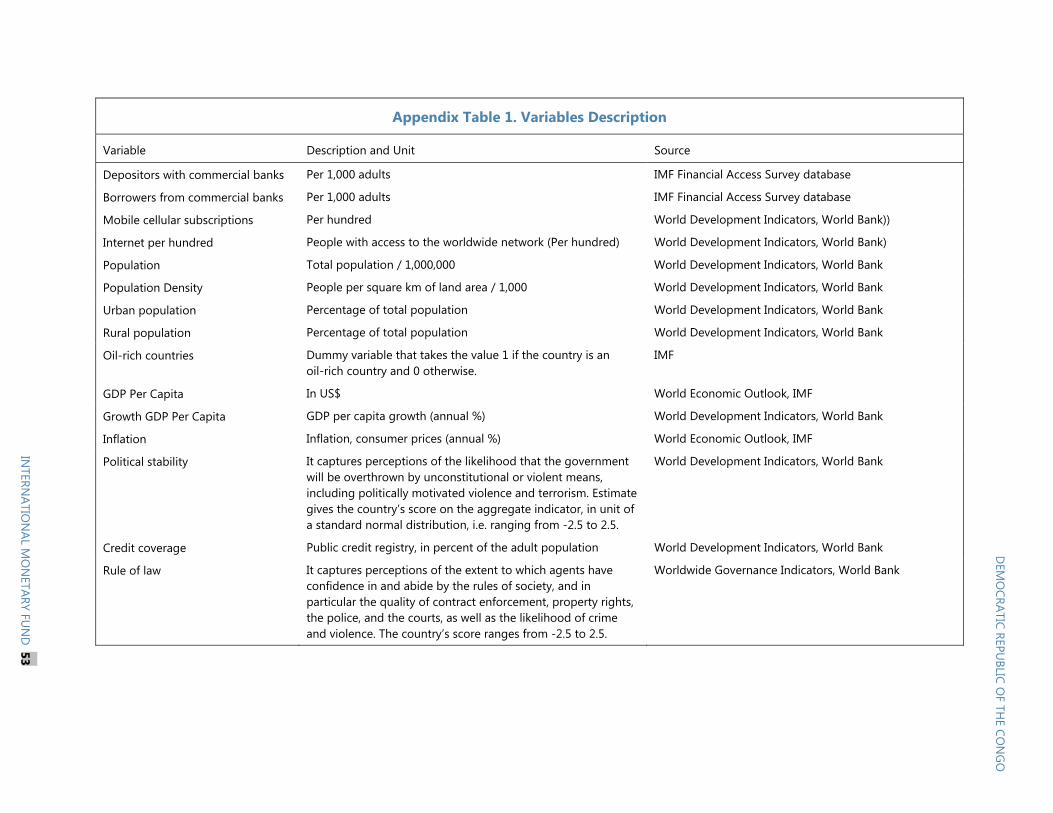
Appendix Table 1. Variables Description
Variable Description and Unit Source
Depositors with commercial banks Per 1,000 adults IMF Financial Access Survey database
Borrowers from commercial banks Per 1,000 adults IMF Financial Access Survey database
Mobile cellular subscriptions Per hundred World Development Indicators, World Bank))
Internet per hundred People with access to the worldwide network (Per hundred) World Development Indicators, World Bank)
Population Total population / 1,000,000 World Development Indicators, World Bank
Population Density People per square km of land area / 1,000 World Development Indicators, World Bank
Urban population Percentage of total population World Development Indicators, World Bank
Rural population Percentage of total population World Development Indicators, World Bank
Oil-rich countries Dummy variable that takes the value 1 if the country is an oil-rich country and 0 otherwise.
IMF
GDP Per Capita In US$ World Economic Outlook, IMF
Growth GDP Per Capita GDP per capita growth (annual %) World Development Indicators, World Bank
Inflation Inflation, consumer prices (annual %) World Economic Outlook, IMF
Political stability It captures perceptions of the likelihood that the government will be overthrown by unconstitutional or violent means, including politically motivated violence and terrorism. Estimate gives the country’s score on the aggregate indicator, in unit of a standard normal distribution, i.e. ranging from -2.5 to 2.5.
World Development Indicators, World Bank
Credit coverage Public credit registry, in percent of the adult population World Development Indicators, World Bank
Rule of law It captures perceptions of the extent to which agents have confidence in and abide by the rules of society, and in particular the quality of contract enforcement, property rights, the police, and the courts, as well as the likelihood of crime and violence. The country’s score ranges from -2.5 to 2.5.
Worldwide Governance Indicators, World Bank
DEM
OCRATIC
REPUBLIC
OF
THE
CON
GO
INTERN
ATION
ALM
ON
ETARYFU
ND
53
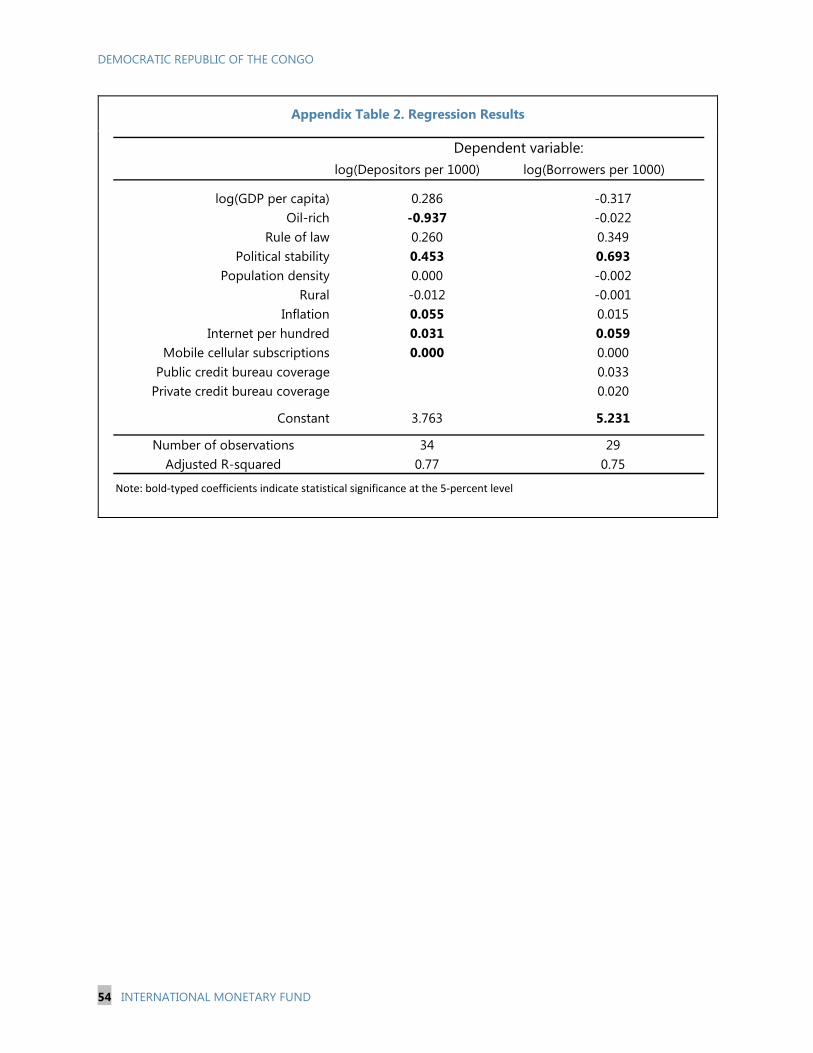
DEMOCRATIC REPUBLIC OF THE CONGO
54 INTERNATIONAL MONETARY FUND
Appendix Table 2. Regression Results
log(Depositors per 1000) log(Borrowers per 1000)
log(GDP per capita) 0.286 -0.317Oil-rich -0.937 -0.022
Rule of law 0.260 0.349Political stability 0.453 0.693
Population density 0.000 -0.002Rural -0.012 -0.001
Inflation 0.055 0.015Internet per hundred 0.031 0.059
Mobile cellular subscriptions 0.000 0.000Public credit bureau coverage 0.033
Private credit bureau coverage 0.020
Constant 3.763 5.231
Number of observations 34 29Adjusted R-squared 0.77 0.75
Note: bold-typed coefficients indicate statistical significance at the 5-percent level
Dependent variable:
Related Documents