1479 IMAGING & THERAPEUTIC TECHNOLOGY Image Processing Algorithms for Digital Mammography: A Pic- torial Essay 1 Etta D. Pisano, MD • Elodia B. Cole • Bradley M. Hemminger, MS Martin J. Yaffe, PhD • Stephen R. Aylward, PhD • Andrew D. A. Maidment, PhD • R. Eugene Johnston, PhD • Mark B. Williams, PhD Loren T. Niklason, PhD • Emily F. Conant, MD • Laurie L. Fajardo, MD Daniel B. Kopans, MD • Marylee E. Brown • Stephen M. Pizer, PhD Digital mammography systems allow manipulation of fine differences in im- age contrast by means of image processing algorithms. Different display algo- rithms have advantages and disadvantages for the specific tasks required in breast imaging––diagnosis and screening. Manual intensity windowing can produce digital mammograms very similar to standard screen-film mammo- grams but is limited by its operator dependence. Histogram-based intensity windowing improves the conspicuity of the lesion edge, but there is loss of detail outside the dense parts of the image. Mixture-model intensity win- dowing enhances the visibility of lesion borders against the fatty background, but the mixed parenchymal densities abutting the lesion may be lost. Con- trast-limited adaptive histogram equalization can also provide subtle edge in- formation but might degrade performance in the screening setting by en- hancing the visibility of nuisance information. Unsharp masking enhances the sharpness of the borders of mass lesions, but this algorithm may make even an indistinct mass appear more circumscribed. Peripheral equalization displays lesion details well and preserves the peripheral information in the surrounding breast, but there may be flattening of image contrast in the nonperipheral portions of the image. Trex processing allows visualization of both lesion detail and breast edge information but reduces image contrast. Abbreviations: CLAHE = contrast-limited adaptive histogram equalization, HIW = histogram-based intensity windowing, MIW = manual in- tensity windowing, MMIW = mixture-model intensity windowing Index terms: Breast radiography, 00.1215 • Images, display, 00.1215 • Images, processing, 00.1215 • Radiography, digital, 00.1215 RadioGraphics 2000; 20:1479–1491 1 From the Department of Radiology (E.D.P., B.M.H., S.R.A., R.E.J., M.E.B.), Lineberger Comprehensive Cancer Center (E.B.C.), and Depart- ment of Computer Science (S.M.P.), University of North Carolina, 101 Manning Dr, Chapel Hill, NC 27514-4226; the Department of Medical Im- aging, University of Toronto, Ontario, Canada (M.J.Y.); the Department of Radiology, Thomas Jefferson University, Philadelphia, Pa (A.D.A.M.); the Department of Radiology, University of Virginia, Charlottesville (M.B.W.); the Department of Radiology, University of Pennsylvania, Philadel- phia (E.F.C.); the Department of Radiology, Johns Hopkins University, Baltimore, Md (L.L.F.); and the Department of Radiology, Massachusetts General Hospital, Boston (D.B.K.). Recipient of a Certificate of Merit award for a scientific exhibit at the 1998 RSNA scientific assembly. Received October 5, 1999; revision requested November 12; final revision received February 7, 2000; accepted February 16. Supported in part by grant RO1- CA60193-05 from the National Cancer Institute; grant 282-97-0078 from the Office of Women’s Health, Department of Health and Human Ser- vices; grant DAMD 17-94-J-4345 from the U.S. Army Medical Research and Material Command; grant 7289 from the Canadian Breast Cancer Re- search Initiative; and grants RO1-CA6019, RO1-CA75145-01A1, and RO1-CA60183 from the National Cancer Institute. Address correspon- dence to E.D.P. (e-mail: [email protected]). © RSNA, 2000

Welcome message from author
This document is posted to help you gain knowledge. Please leave a comment to let me know what you think about it! Share it to your friends and learn new things together.
Transcript

1479IMAGING & THERAPEUTIC TECHNOLOGY
Image ProcessingAlgorithms for DigitalMammography: A Pic-torial Essay1
Etta D. Pisano, MD • Elodia B. Cole • Bradley M. Hemminger, MSMartin J. Yaffe, PhD • Stephen R. Aylward, PhD • Andrew D. A.Maidment, PhD • R. Eugene Johnston, PhD • Mark B. Williams, PhDLoren T. Niklason, PhD • Emily F. Conant, MD • Laurie L. Fajardo, MDDaniel B. Kopans, MD • Marylee E. Brown • Stephen M. Pizer, PhD
Digital mammography systems allow manipulation of fine differences in im-age contrast by means of image processing algorithms. Different display algo-rithms have advantages and disadvantages for the specific tasks required inbreast imaging––diagnosis and screening. Manual intensity windowing canproduce digital mammograms very similar to standard screen-film mammo-grams but is limited by its operator dependence. Histogram-based intensitywindowing improves the conspicuity of the lesion edge, but there is loss ofdetail outside the dense parts of the image. Mixture-model intensity win-dowing enhances the visibility of lesion borders against the fatty background,but the mixed parenchymal densities abutting the lesion may be lost. Con-trast-limited adaptive histogram equalization can also provide subtle edge in-formation but might degrade performance in the screening setting by en-hancing the visibility of nuisance information. Unsharp masking enhancesthe sharpness of the borders of mass lesions, but this algorithm may makeeven an indistinct mass appear more circumscribed. Peripheral equalizationdisplays lesion details well and preserves the peripheral information in thesurrounding breast, but there may be flattening of image contrast in thenonperipheral portions of the image. Trex processing allows visualization ofboth lesion detail and breast edge information but reduces image contrast.
Abbreviations: CLAHE = contrast-limited adaptive histogram equalization, HIW = histogram-based intensity windowing, MIW = manual in-tensity windowing, MMIW = mixture-model intensity windowing
Index terms: Breast radiography, 00.1215 • Images, display, 00.1215 • Images, processing, 00.1215 • Radiography, digital, 00.1215
RadioGraphics 2000; 20:1479–1491
1From the Department of Radiology (E.D.P., B.M.H., S.R.A., R.E.J., M.E.B.), Lineberger Comprehensive Cancer Center (E.B.C.), and Depart-ment of Computer Science (S.M.P.), University of North Carolina, 101 Manning Dr, Chapel Hill, NC 27514-4226; the Department of Medical Im-aging, University of Toronto, Ontario, Canada (M.J.Y.); the Department of Radiology, Thomas Jefferson University, Philadelphia, Pa (A.D.A.M.);the Department of Radiology, University of Virginia, Charlottesville (M.B.W.); the Department of Radiology, University of Pennsylvania, Philadel-phia (E.F.C.); the Department of Radiology, Johns Hopkins University, Baltimore, Md (L.L.F.); and the Department of Radiology, MassachusettsGeneral Hospital, Boston (D.B.K.). Recipient of a Certificate of Merit award for a scientific exhibit at the 1998 RSNA scientific assembly. ReceivedOctober 5, 1999; revision requested November 12; final revision received February 7, 2000; accepted February 16. Supported in part by grant RO1-CA60193-05 from the National Cancer Institute; grant 282-97-0078 from the Office of Women’s Health, Department of Health and Human Ser-vices; grant DAMD 17-94-J-4345 from the U.S. Army Medical Research and Material Command; grant 7289 from the Canadian Breast Cancer Re-search Initiative; and grants RO1-CA6019, RO1-CA75145-01A1, and RO1-CA60183 from the National Cancer Institute. Address correspon-dence to E.D.P. (e-mail: [email protected]).
©RSNA, 2000

1480 September-October 2000 RG � Volume 20 • Number 5
IntroductionThe effectiveness of digital mammography in de-tection of breast cancer is currently under investi-gation. This imaging modality separates imageacquisition and image display, thus allowing opti-mization of both.
In screen-film mammography, film serves asthe medium for both image acquisition and dis-play. Screen-film mammography has limited de-tection capability for low-contrast lesions indense breasts. This limitation poses a problemfor the estimated 40% of women with densebreasts who undergo mammography (1). In thispopulation, diagnosis often requires additionalimaging, which results in more radiation expo-sure for the patient. When additional images failto provide useful diagnostic information, a deci-sion must be made as to whether the suspiciousregions require biopsy or short- or long-term fol-low-up. Because of the expense and risk associ-ated with additional radiation exposure and sur-gery, any method of image presentation that in-creases the diagnostic conspicuity of lesions inbreast tissue, especially in dense tissue, would bea significant advance.
Digital mammography systems, unlike screen-film mammography systems, allow manipulationof fine differences in image contrast by means ofimage processing algorithms. As a result, verysubtle differences between abnormal and normalbut dense tissue can be made more obvious. Inthis article, we illustrate the appearances pro-duced by various image processing algorithms fordisplay of digital mammograms and discuss howthese algorithms may affect the ability of radiolo-gists to interpret the images.
Selected Mammographic LesionsThe four cases used in this article to demonstratethe image processing algorithms were selected toshow the range of types of mammographic le-sions and the potential advantages and disadvan-tages of the different display algorithms. All ofthe digital mammograms shown in this articlewere acquired under research protocols approved
by the investigational review boards at the in-volved institutions.
The first case involves a partially obscured andpartially circumscribed mass at screen-film mam-mography (Fig 1a), which proved to be a simplecyst at ultrasonography and needle aspiration. Adigital mammogram of this case was acquired atthe University of North Carolina, Chapel Hill,with a SenoScan full-field digital mammographyunit (Fischer Imaging, Denver, Colo).
The second case involves two indistinctmasses at screen-film mammography (Fig 2a,2b). Both masses proved to be infiltrating ductalcarcinomas with accompanying ductal carcinomain situ at open surgical biopsy with needle local-ization. A digital mammogram of this case wasacquired at Massachusetts General Hospital,Boston, with a Senographe 2000D full-field digi-tal mammography system (GE Medical Systems,Milwaukee, Wis).
The third case involves a palpable, spiculatedmass at screen-film mammography (Fig 3a, 3b),which proved to be an infiltrating ductal carci-noma with associated cribriform and solid-typeductal carcinoma in situ at open surgical biopsy.A digital mammogram of this case was acquiredat the University of North Carolina with theFischer Imaging unit.
The fourth case involves a pleomorphic clusterof calcifications at screen-film mammography(Fig 4a), which proved to be atrophic breast tis-sue at stereotactically guided core biopsy. A digi-tal mammogram of this case was acquired at theUniversity of Virginia, Charlottesville, with aTrex Digital Mammography System (Trex Medi-cal, Danbury, Conn).
Overview of the DigitalMammography Systems
The Fischer Imaging unit produces images witha spatial resolution of 54 mm/pixel and a matrixsize of 3,072 ´ 4,800 pixels. The GE MedicalSystems unit produces images with a spatial reso-lution of 100 mm/pixel and a matrix size of 1,800 ´2,304 pixels. The Trex Medical unit produces im-ages with a spatial resolution of 41 mm/pixel and amatrix size of 4,800 ´ 6,400 pixels. The smaller
RG � Volume 20 • Number 5 Pisano et al 1481
d. e. f. g.Figure 1. (a) Photographic magnification of a craniocaudal screen-film mammogram shows a cyst. (b–g) Photo-graphic magnifications of a digital mammogram processed with MIW (b), HIW (c), MMIW (d), CLAHE (e),unsharp masking (f), and peripheral equalization (g) show the same lesion.
a. b. c.

1482 September-October 2000 RG � Volume 20 • Number 5
a. d.
b. e.
c. f.
Figure 2. (a) Mediolateral ob-lique screen-film mammogramshows two masses (arrows), whichboth proved to be infiltrating ductalcarcinomas with associated ductalcarcinoma in situ at open surgicalbiopsy. (b) Photographic magnifica-tion of a shows the larger, inferiorcarcinoma. (c) Photographic magni-fication of a digital mammogramprocessed with MIW shows thelarger lesion. (d) Digital mammo-gram processed with MMIW showsboth cancers very well. (e) Photo-graphic magnification of d shows thelarger lesion. (f) Photographic mag-nification of a digital mammogramprocessed with unsharp maskingshows the larger lesion. (Courtesy ofD.B.K.)

RG � Volume 20 • Number 5 Pisano et al 1483
Figure 3. (a) Me-diolateral obliquescreen-film mammo-gram shows a spiculatedmass in the axillary por-tion of the breast, whichproved to be an infiltrat-ing ductal carcinomawith associated cribri-form and solid-typeductal carcinoma in situat open surgical biopsy.(b) Photographic mag-nification of a shows thelesion. (c, d) Digitalmammogram processedwith unsharp masking(c) and photographicmagnification of c (d)show the lesion.
a. c.
b. d.
1484 September-October 2000 RG � Volume 20 • Number 5
a. b. c.
d. e. f.
g. i.
h.

RG � Volume 20 • Number 5 Pisano et al 1485
the number of micrometers per pixel, the smallerthe features that can be measured in the imageproduced. As for contrast resolution, the FischerImaging unit offers 12 bits/pixel, whereas the GEMedical Systems and Trex Medical units offer 14bits/pixel. Increasing contrast gradation providesthe opportunity to distinguish finer and finerdensity differences between features in the image.However, it may not always be possible for a hu-man observer to distinguish finer and finer grada-tions of gray owing to the limitations of visualperception and display devices. Detailed descrip-tions of the image acquisition hardware are pro-vided elsewhere (2).
Image Processing AlgorithmsEach manufacturer has developed image process-ing algorithms to use with its acquisition system.In addition, a number of algorithms have beendeveloped by independent investigators for usewith digital mammograms. The seven algorithmsdemonstrated in this article are manual intensitywindowing (MIW), histogram-based intensitywindowing (HIW), mixture-model intensitywindowing (MMIW), contrast-limited adaptivehistogram equalization (CLAHE), unsharp mask-ing, peripheral equalization, and Trex processing.
Intensity windowing algorithms act on indi-vidual pixels within an image. A small portion ofthe full intensity range of an image is selectedand then remapped to the full intensity range ofthe display device. This process allows selectionof specific intensity values of interest. For ex-ample, intensity values that represent abnormaltissue and dense but normal tissue are selected toallow exaggeration of small differences in inten-sity values between the two objects, thus poten-tially increasing the conspicuity of any abnormalregions. The three versions of intensity window-ing demonstrated in this article are MIW, HIW,and MMIW. These algorithms differ in how in-tensity values of interest are selected.
Manual Intensity WindowingMIW was performed by an expert mammographytechnologist, who interactively adjusted the con-trast levels as appropriate for each image using a
high-brightness monitor (model 1654; Orwin As-sociates, Amityville, NY) and an UltraSPARC2200 workstation (Sun Microsystems, MountainView, Calif). The goal of this algorithm is tomanually reproduce the appearance of a screen-film mammogram.
Digital mammograms processed with MIWcan be very similar to standard screen-filmmammograms of the same patients (Figs 1b, 2c,4b). In the second case, the center of the largermass is very light on the image processed withMIW (Fig 2c). This appearance is due to thetechnologist’s selection of a window that allowedvisualization of both lesions in the image. Bothlesions were obvious to her trained eyes. To keepthe smaller lesion from appearing less obvious oreven disappearing completely, she windowed thelarger lesion so that it was slightly lighter thanideal.
This case points out the obvious limitation ofthis interactive windowing algorithm: It is opera-tor dependent. A less experienced operator mightchoose different windows that could obscuresome of the visible disease.
Histogram-basedIntensity WindowingHIW is a variant of intensity windowing. Inten-sity windowing allows a selected subrange of theimage intensity values to receive the full contrastof the display device. All parts of the image withvalues outside the selected intensity windowrange are set to black (values below the minimumvalue of the intensity window range) or white(values above the maximum value of the intensitywindow range). HIW customizes standard inten-sity windowing by individually selecting the in-tensity window range for each image by statisti-cally analyzing the histogram of each image, lo-cating the “humps” or modes of the histogram,and determining which modes represent the dif-ferent breast tissue types (fatty, dense, muscle) orother parts of the image (background, labels).From these known modes in the histogram, an
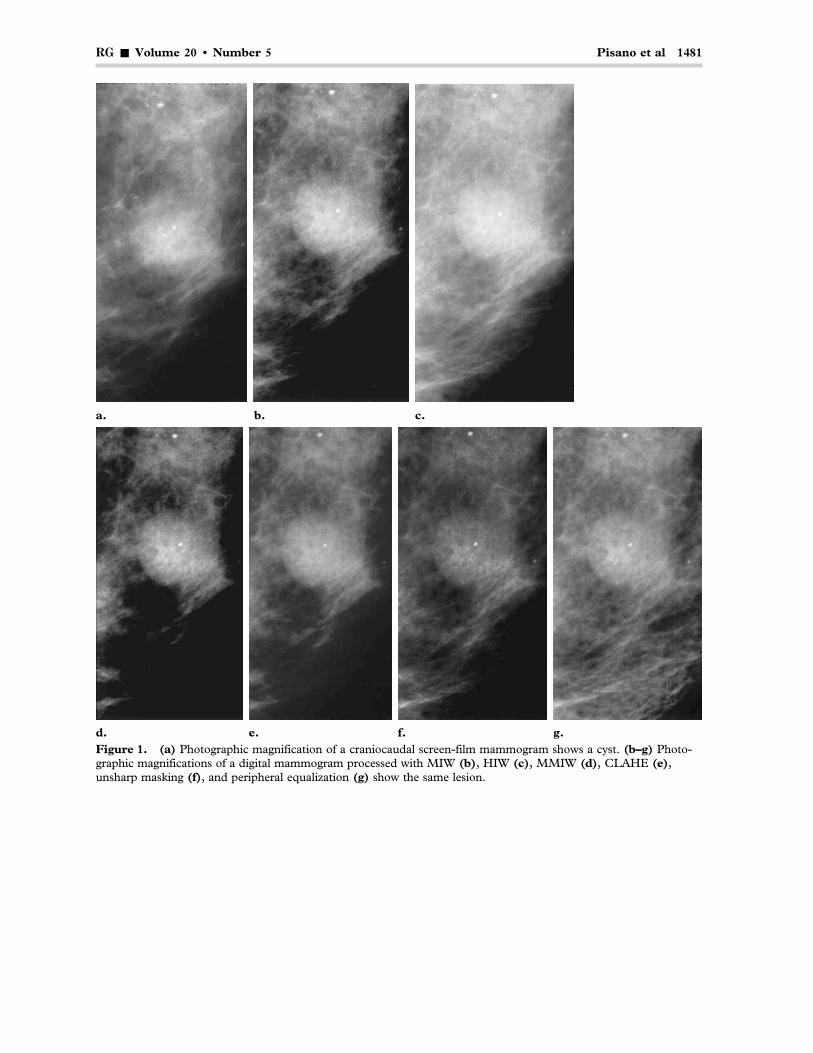
Figure 4. (a) Photographic magnification of a mediolateral oblique screen-film mammogram shows a clusterof calcifications, which proved to be atrophic breast tissue at core biopsy. (b–g) Photographic magnifications of adigital mammogram processed with MIW (b), HIW (c), MMIW (d), CLAHE (e), unsharp masking (f), and pe-ripheral equalization (g) show the clustered calcifications. (h, i) Digital mammogram processed with Trex process-ing (h) and photographic magnification of h (i) show the calcifications. (Courtesy of the University of Virginia andL.L.F.)
u

1486 September-October 2000 RG � Volume 20 • Number 5
intensity window range is automatically selectedon the basis of the percentile position within thecomposite breast tissue class (ie, fatty, dense, andmuscle) that allows windowing over the overallbreast tissue present in that patient (Fig 5).
For example, if the patient’s breast is mainlyfatty, the window selected will allow the full rangeof contrast across the part of the histogram repre-senting the fatty portions of the breast. If thebreast is mixed fatty and dense, the window willbe selected on the basis of the portions of the his-togram that represent those areas. In theory, thisprocess should improve the detection of mammo-graphic features in comparison with fixed intensitywindowing, which cannot adapt to individual im-ages. The adaptability of HIW to individual breasttypes makes it especially appropriate for digitalmammograms because the breast tissue is alwaysimaged with reasonable contrast, but the range ofdigital values containing the breast tissue can varysignificantly depending on the acquisition param-eters.
This automated windowing algorithm was usedin the first and fourth cases (Figs 1c, 4c). In thecase of the cyst, note the improved conspicuity ofthe lesion edge in the digital mammogram (Fig1c) compared with that in the screen-film mam-mogram (Fig 1a). Part of the difference in the vis-ibility of the lesion border and the accompanyingbenign calcifications is attributable to differencesin positioning and compression. There is someloss of detail outside the dense parts of the HIW-processed image (Fig 1c) when compared withthe screen-film image (Fig 1a) and the digitalmammograms processed with other algorithms.This loss of detail might detract from use of thisalgorithm for screening.
Mixture-ModelIntensity WindowingMMIW provides region-specific intensity win-dow settings for mammograms. It operates by au-tomatically identifying the five major regions in amammogram: background, uncompressed fat,compressed fat, dense tissue, and muscle. Itidentifies these regions using a combination ofgeometric (ie, gradient magnitude ridge traversal)and statistical (ie, Gaussian mixture modeling)techniques. Once these regions have been identi-fied, their histograms can be selectively analyzedto determine region-specific intensity windowsettings. In our selected cases, MMIW was usedto determine intensity window settings specific tothe dense regions in the mammogram (3).
The specific steps performed during MMIWare as follows: First, the major regions of a mam-mogram are labeled (Fig 6a). Since mammo-grams are formed by means of projection, theseregion labels reflect the prominent tissue presentat that location, not the absolute quantities of themultiple tissues that affected x-ray absorption ateach point. Second, the regions are segmentedand the image is automatically cropped to reducethe portion of background (Fig 6b). With the re-gions identified, the intensity histogram of eachregion can be calculated. The mean and standarddeviation of the intensities in each region areused to parameterize a sigmoidal intensity win-dow function. These functions map recorded in-tensity to displayed intensity for each region (Fig6c). Application of the dense region–specific in-tensity window function to the entire image pro-duces the final processed image (Fig 6d). EachMMIW-processed image shown in this articlewas processed using its own MMIW-defined,dense region–specific intensity window function.
This algorithm enhances the visibility of thelesion borders against the fatty background (Figs1d, 2d, 2e, 4d). However, the mixed parenchy-mal densities that abut the lesion are lost in somecases. This effect is most dramatic at the edges ofthe mammogram (Fig 2d). Clearly, if this type ofstatistical sampling of the image is used to deter-mine an optimal intensity window, an additionalalgorithm that enhances the visibility of the pe-riphery of the breast should be used to rescue in-formation that is lost at the low-density subcuta-neous regions of the breast.
Figure 5. Histogram for a digital mammogram. Therange of intensity values representing breast tissue isseen on the right. These are automatically recognizedby HIW. HIW then chooses a display range based onthis breast tissue range. In this example, a 30%–100%range is chosen. Then, the output range of the displaydevice is mapped to the selected intensity windowrange (the 30% location maps to black, the 100% loca-tion maps to white).

RG � Volume 20 • Number 5 Pisano et al 1487
Both HIW and MMIW might be useful on aworkstation. At the touch of a button, radiolo-gists could request a processed digital mammo-gram that allows them to see through the densestportions of the breast. However, neither algo-
rithm would probably be acceptable for display ofscreening mammograms because information inthe peripheral and fatty areas of the breast is notvisible when these algorithms are applied.
Contrast-limitedAdaptive Histogram EqualizationCLAHE is a special class of adaptive histogramequalization. Adaptive histogram equalizationmaximizes the contrast throughout an image byadaptively enhancing the contrast of each pixelrelative to its local neighborhood. This processproduces improved contrast for all levels of con-trast (small and large) in the original image. Foradaptive histogram equalization to enhance localcontrast, histograms are calculated for small re-gional areas of pixels, producing local histograms.
a. b. d.
c.
Figure 6. Application of MMIW to digital mammograms. (a) Mediolateral oblique digitalmammogram shows dense tissue (D), fat (F), pectoral muscle (M), and uncompressed fat (UF).The black area is the background. (b) Same image as in a after segmentation and cropping showsthe muscle, dense tissue, compressed fat, and uncompressed fat portions of the image as differentportions of the gray scale of the image. (c) Graph shows how the recorded intensity of the differ-ent regions in the image is mapped to the different displayed intensities in d. (d) Same mammo-gram as in a after automatic application of MMIW.

1488 September-October 2000 RG � Volume 20 • Number 5
These local histograms are then equalized orremapped from the often narrow range of inten-sity values indicative of a central pixel and itsclosest neighbors to the full range of intensity val-ues available in the display.
CLAHE limits the maximum contrast adjust-ment that can be made to any local histogram(Fig 7). This limitation is useful so that the re-sulting image does not become too noisy. Thesize of the neighbor region is controlled by meansof the region size parameter. Smaller regions canbetter enhance the contrast of smaller spatialscale structures. The CLAHE parameter settings(clip 4, region size 32 pixels squared) used in thesample digital mammograms shown in this articlewere selected on the basis of previous experi-ments (4). After CLAHE was applied, MIW wasused so that the contrast of the resulting imagemore closely approximated that of standardscreen-film mammograms.
In digital mammograms processed withCLAHE, lesions appear obvious relative to thebackground and the image detail is very good(Figs 1e, 4e). However, there is obvious graini-ness in the images. This graininess is due to theenhanced visibility of both image signal and im-age noise with this algorithm. Again, this algo-rithm might be helpful in allowing radiologists tosee subtle edge information, such as spiculation.It might degrade performance in the screeningsetting by enhancing the visibility of nuisance in-formation that could simulate calcifications.
Unsharp MaskingWith unsharp masking, a low-pass filtered ver-sion of the original image is created and the im-age values that result are subsequently multipliedby a weighting factor and subtracted from theoriginal image (5). The final image preservesmuch of the detail of the original image, but largestructures are presented with less contrast,thereby reducing the dynamic range required todisplay the image. In preliminary experiments,
Figure 7. Clipping with CLAHE. Graphs show how CLAHE redis-tributes the mapped intensities of the pixels in an image.
Figure 8. Application ofunsharp masking. A weighted,low-pass (LP) filtered image issubtracted from the original im-age. For consistency in display,the data are then rescaled and anoffset is added when necessary.

RG � Volume 20 • Number 5 Pisano et al 1489
we tested a variety of low-pass filters using kernelsizes of 2–33 mm2. In addition, a variety ofweighting factors were tested. A boxcar filter witha window size of 16 mm2 and a weighting factorof 0.8 was found to optimally compress dynamicrange while preserving necessary structures in thebreast and minimizing artifacts. A kernel sizebased on area was chosen so that comparison be-tween manufacturers was possible despite differ-ences in pixel size. The image data were thenrescaled and an offset was added, as necessary, toapproximately match the distribution of gray lev-els in the unprocessed and unsharp masked im-ages (Fig 8). MIW was then applied to the resul-tant image to adjust the contrast to levels moreclosely approximating those of standard screen-film mammograms.
With unsharp masking, the sharpness of theborders of mass lesions is enhanced, as is the in-tended effect of this algorithm (Figs 1f, 2f, 3c,3d, 4f). The spiculations in the third case are es-pecially evident (Fig 3c, 3d). Of course, even an
indistinct mass can appear more circumscribedwhen this algorithm is applied (Fig 2f), obviouslyan undesirable outcome if this appearance wereto lead to inappropriate patient follow-up insteadof biopsy.
Peripheral EqualizationThere are variations in the thickness of breast tis-sue under compression. The outer edges of thebreast, which are thinner than the interior, aretypically overpenetrated by x rays at image acqui-sition. Although a digital acquisition systemshould have adequate dynamic range to recordthis information precisely, the limited latitude ofthe laser film necessitates a compromise in imagedisplay. If the central parenchyma is presentedwith high contrast, then the peripheral tissue willappear very black on the film and may be difficultto distinguish visibly from the black film back-ground (Fig 9).
Figure 9. Effect of varied thickness of compressed breast tissue. Schematics of the compressed breast show that itconsists of two regions: a central region of approximately uniform thickness and a margin where thickness varies. Inthe margin, variation in transmitted x-ray fluence occurs due to changes in both breast thickness and composition.CC = craniocaudal, R = radius, T = thickness.

1490 September-October 2000 RG � Volume 20 • Number 5
Peripheral equalization enhances visualizationof tissue located near the periphery of the breast(6,7). In peripheral equalization, a low-pass spa-tial filter is applied to the image to create ablurred “mask” that represents primarily thecoarsest variations in signal, which are related tovariations in breast thickness. This mask is scaledfrom 0 to 1, and the mammogram is divided bymeans of the mask values on a pixel-by-pixel ba-sis (Figs 10a, 10b, 11). The algorithm is con-strained to act only on pixels that lie within thebreast and where the breast thickness is chang-ing. There are also constraints placed on the totalamount of enhancement to avoid disturbing arti-facts at the skin line. The result is that the digitalvalues of pixels located near the periphery arechanged so that the absolute intensities of the im-age become “flatter” across the mammogram.
The local contrasts between pixels located neareach other, which represent compositional varia-tions in tissue, are not suppressed. In fact, be-cause the part of the dynamic range of the filmrequired to represent thickness changes is nolonger required, it is now possible to increase theoverall contrast of the image if desired. For theimages shown in this article, after peripheralequalization was applied, MIW was used to ad-just the resultant image contrast.
Details of both masses and calcifications arewell depicted in images processed with peripheralequalization (Figs 1g, 4g). In addition, the pe-ripheral information in the surrounding breast ispreserved (Fig 1g). This algorithm might be ef-fective in the screening setting because it pre-serves image features in all breast locations.However, there does appear to be some flatteningof image contrast in the nonperipheral portionsof mammograms when this algorithm is applied.
a.
b.
Figure 10. Peripheral equalization. (a) Asmoothed representation of the image,s(x,y), is obtained with a low-pass filteringoperation. The low-pass filter (shown sche-matically in one dimension) is a first-orderButterworth filter with a cutoff frequency of0.05 cycles per millimeter. (b) Overview ofthe thickness equalization processing tech-nique. For each point in the margin, thesmoothed image is used to determine a cor-rection factor.

RG � Volume 20 • Number 5 Pisano et al 1491
Trex ProcessingTrex processing was developed by Trex Medicalfor use with the Trex Digital Mammography Sys-tem. This method uses a form of histogram-based unsharp masking.
The algorithm allows visualization of both le-sion detail and breast edge information (Fig 4h,4i). However, there is some reduction of imagecontrast, which is evident when a Trex-processedversion is compared with other processed ver-sions of the same image.
ConclusionsIt is obvious from the images shown in this articlethat different digital image processing algorithmsare likely to be useful for different tasks. Charac-terization of lesions and screening will mostprobably require a uniquely adapted image pro-cessing algorithm to provide the best presenta-tion for visualization of different image features.In addition, different types of lesions, masses,and calcifications might benefit from specifically
Figure 11. Profile of brightness as a function of posi-tion across a line of the original and corrected images.The vertical lines identify the margin. Note the reduc-tion in the range of levels in the corrected data as a re-sult of the adjustment in the margin.
tailored algorithms. Such tailoring will not beeasily achieved unless the current method of dis-playing mammograms on film is replaced by asoftcopy display system.
Given the added costs, the efficacy of digitalmammography will ultimately depend on im-proved diagnostic accuracy over that of conven-tional screen-film mammography. Developmentand assessment of image processing methods thatallow detection and characterization of individuallesion types will be instrumental in the accep-tance of this new technology.
Acknowledgments: The unsharp masking algorithmwas provided by A.D.A.M.; the peripheral equalizationalgorithm was provided by M.J.Y. and GordonMawdsley, PhD, University of Toronto, Ontario,Canada.
References1. Shtern F. Digital mammography and related tech-
nologies: a perspective from the National CancerInstitute. Radiology 1992; 183:629–630.
2. Feig SA, Yaffe MJ. Current status of digital mam-mography. Semin Ultrasound CT MR 1996; 17:424–443.
3. Aylward SR, Hemminger BM, Pisano ED. Mixturemodeling for digital mammogram display andanalysis. In: Karssemeijer N, Thijssen M, HendriksJ, van Erning A, eds. Digital mammographyNijmegen, 1998. Dordrecht, the Netherlands:Kluwer Academic, 1998; 305–312.
4. Pisano ED, Zong S, Hemminger BM, et al. Con-trast limited adaptive histogram equalization imageprocessing to improve the detection of simulatedspiculations in dense mammograms. J Digit Imag-ing 1998; 11:193–200.
5. Chan HP, Vyborny CJ, MacMahon H, et al. Digitalmammography ROC studies of the effects of pixelsize and unsharp-mask filtering on the detection ofsubtle microcalcifications. Invest Radiol 1987; 22:581–589.
6. Byng JW, Critten JP, Yaffe MJ. Thickness equaliza-tion processing for mammographic images. Radiol-ogy 1997; 203:564–568.
7. Bick U, Giger ML, Schmidt RA, Nishikawa RM,Doi K. Density correction of peripheral breast tis-sue on digital mammograms. RadioGraphics 1996;16:403–411.
Related Documents


![Essay1 Worldwide Disease Pandemics(New[Sept2010]](https://static.cupdf.com/doc/110x72/577d29701a28ab4e1ea6ca72/essay1-worldwide-disease-pandemicsnewsept2010.jpg)