Journal of Alzheimer’s Disease 26 (2011) 1–27 DOI 10.3233/JAD-2011-0073 IOS Press 1 Introduction Imaging the Alzheimer Brain J. Wesson Ashford, Ahmad Salehi, Ansgar Furst, Peter Bayley, Giovanni B. Frisoni, Clifford R. Jack Jr, Osama Sabri, Maheen M. Adamson, Kerry L. Coburn, John Olichney, Norbert Schuff, Daniel Spielman, Steven D. Edland, Sandra Black, Allyson Rosen, David Kennedy, Michael Weiner and George Perry This supplement to the Journal of Alzheimer’s Dis- ease contains more than half of the chapters from The Handbook of Imaging the Alzheimer Brain, which was first presented at the International Conference on Alzheimer’s Disease in Paris, in July, 2011. While the Handbook contains 27 chapters that are modified articles from 2009, 2010, and 2011 issues of the Journal of Alzheimer’s Disease, this supplement contains the 31 new chapters of that book and an intro- ductory article drawn from the introductions to each section of the book. The Handbook was designed to provide a multi- level overview of the full field of brain imaging related to Alzheimer’s disease (AD). The Handbook, as well as this supplement, contains both reviews of the basic concepts of imaging, the latest developments in imag- ing, and various discussions and perspectives of the problems of the field and promising directions. The Handbook was designed to be useful for stu- dents and clinicians interested in AD as well as scientists studying the brain and pathology related to AD. 1: Imaging the Alzheimer Brain: The Pathology and Pathophysiological Bases of Alzheimer’s Disease: Implications for Advancing Diagnostic Imaging Milan Sanchez M, Hippocampal Network Alterations in Alzheimer’s Disease and Down Syndrome: Basis From Structure to Therapy [1]. Cohen et al., Cerebrospinal fluid biomarkers of neu- rodegenerative and ventricular changes in the elderly (see: [2]). On November 3, 1906, in a presentation for the South-West German Society of Alienists (the term used at that time for superintendents of insane asylums) in T¨ ubingen, Germany, Alois Alzheimer, presented a paper entitled “ ¨ Uber eine eigenartige Erkrankung der Hirnrinde” (“regarding a peculiar disease of the cor- tex”). In this paper, he described for the first time a con- stellation of symptoms in a 51 year-old woman that was associated at autopsy with several new neuropatholog- ical changes. This patient initially showed suspicious- ness of her husband, and then soon developed a rapidly increasing memory impairment, disorientation, and further paranoia with progressive agitation. Clinically, the most severe disturbance was in her ability to encode information, immediately forgetting things after clearly perceiving them. The condition progressed to utter bewilderment with complete disorientation to time and place, leading to a terminal state after 4.5 years. The original description of her brain included both macro and microscopic pathology. Although postmortem examination showed generalized atro- phy of the brain, there was no macroscopic focal degeneration. Upon preparation of tissue samples, neu- ritic plaques, neurofibrillary tangles (NFTs), neuropil threads, and reactive gliosis were evident and appeared to be occurring with the deposition of a “pathological metabolic substance in the neuron” [3, 4]. The modern era of interest was ushered in when in 1968 Blessed, Tomlinson, and Roth linked the com- mon, progressive dementia found in the elderly to ISSN 1387-2877/11/$27.50 © 2011 – IOS Press and the authors. All rights reserved

Welcome message from author
This document is posted to help you gain knowledge. Please leave a comment to let me know what you think about it! Share it to your friends and learn new things together.
Transcript
Journal of Alzheimer’s Disease 26 (2011) 1–27DOI 10.3233/JAD-2011-0073IOS Press
1
Introduction
Imaging the Alzheimer Brain
J. Wesson Ashford, Ahmad Salehi, Ansgar Furst, Peter Bayley, Giovanni B. Frisoni, Clifford R. Jack Jr,Osama Sabri, Maheen M. Adamson, Kerry L. Coburn, John Olichney, Norbert Schuff, Daniel Spielman,Steven D. Edland, Sandra Black, Allyson Rosen, David Kennedy, Michael Weiner and George Perry
This supplement to the Journal of Alzheimer’s Dis-ease contains more than half of the chapters from TheHandbook of Imaging the Alzheimer Brain, whichwas first presented at the International Conference onAlzheimer’s Disease in Paris, in July, 2011.
While the Handbook contains 27 chapters that aremodified articles from 2009, 2010, and 2011 issues ofthe Journal of Alzheimer’s Disease, this supplementcontains the 31 new chapters of that book and an intro-ductory article drawn from the introductions to eachsection of the book.
The Handbook was designed to provide a multi-level overview of the full field of brain imaging relatedto Alzheimer’s disease (AD). The Handbook, as wellas this supplement, contains both reviews of the basicconcepts of imaging, the latest developments in imag-ing, and various discussions and perspectives of theproblems of the field and promising directions.
The Handbook was designed to be useful for stu-dents and clinicians interested in AD as well asscientists studying the brain and pathology related toAD.
1: Imaging the Alzheimer Brain: ThePathology and Pathophysiological Basesof Alzheimer’s Disease: Implications forAdvancing Diagnostic Imaging
Milan Sanchez M, Hippocampal Network Alterationsin Alzheimer’s Disease and Down Syndrome: BasisFrom Structure to Therapy [1].
Cohen et al., Cerebrospinal fluid biomarkers of neu-rodegenerative and ventricular changes in theelderly (see: [2]).
On November 3, 1906, in a presentation for theSouth-West German Society of Alienists (the term usedat that time for superintendents of insane asylums)in Tubingen, Germany, Alois Alzheimer, presented apaper entitled “Uber eine eigenartige Erkrankung derHirnrinde” (“regarding a peculiar disease of the cor-tex”). In this paper, he described for the first time a con-stellation of symptoms in a 51 year-old woman that wasassociated at autopsy with several new neuropatholog-ical changes. This patient initially showed suspicious-ness of her husband, and then soon developed a rapidlyincreasing memory impairment, disorientation, andfurther paranoia with progressive agitation. Clinically,the most severe disturbance was in her ability to encodeinformation, immediately forgetting things afterclearly perceiving them. The condition progressed toutter bewilderment with complete disorientation totime and place, leading to a terminal state after 4.5years. The original description of her brain includedboth macro and microscopic pathology. Althoughpostmortem examination showed generalized atro-phy of the brain, there was no macroscopic focaldegeneration. Upon preparation of tissue samples, neu-ritic plaques, neurofibrillary tangles (NFTs), neuropilthreads, and reactive gliosis were evident and appearedto be occurring with the deposition of a “pathologicalmetabolic substance in the neuron” [3, 4].
The modern era of interest was ushered in when in1968 Blessed, Tomlinson, and Roth linked the com-mon, progressive dementia found in the elderly to
ISSN 1387-2877/11/$27.50 © 2011 – IOS Press and the authors. All rights reserved
2 J.W. Ashford et al. / Imaging the Alzheimer Brain
the same type of pathology described originally byAlzheimer [5]. Today, the disease originally describedby Alzheimer in a younger individual is no longerunique or infrequent. The incidence of AD has progres-sively increased with the great extension of longevityin most parts of the world over the last 100 years[6]. Now, AD is the most common cause of demen-tia, and reported as the sixth leading cause of alldeaths in the United States (Centers for Disease Con-trol (CDC) mortality data, 74,632 deaths attributed toAD in 2007). However, by another analysis, AD isnow associated with more deaths than heart disease(in 2007, the CDC reported 2,423,712 total deathsand 616,067 deaths related to heart disease, 25.4% ofall US deaths, but at the same time, the Alzheimer’sAssociation estimated that 5 million individuals hadAD in the US, with an 8 year life expectancy, lead-ing to the calculation that 625,000 deaths would beAD-related, which is 25.8% of all deaths). Accordingto the World Health Organization (WHO), in 2008,there were more than a half million deaths in theworld attributed to AD, a number still greatly under-estimating the occurrence of AD. These already grimfigures do not take into account the psychological andsocial burdens of AD. Overall, AD patients are morelikely to have mental health conditions, neurologicalconditions, cognitive disorders, cerebrovascular dis-ease, diabetes with acute complications, and injuriesresulting in annual costs for AD patients being 34%higher than for matched controls [7]. Individuals withAD have higher healthcare costs and utilization thandemographically-matched Medicare beneficiaries andeven after adjusting for comorbid illnesses sustainmore emergency room visits and inpatient admissions[8]. As the US population ages, AD rates are expectedto quadruple over the next 50 years [9]. In order todiminish or even sustain the current level of the devas-tating worldwide social and economic impact of AD,there is an urgent need to further our understandingand expedite research and development on all aspectsof AD.
Thanks to enormous advances in science, engineer-ing, and technology in recent decades, new imagingmethods have been developed. The purpose of theHandbook of Imaging the Alzheimer Brain and thissupplement of the Journal of Alzheimer’s Disease isto present the developments and advances in numer-ous imaging modalities that are currently being used toincrease our understanding of the pathophysiologicalbasis of AD and drive us toward new therapies for thiscomplex brain disorder. The chapters of this collection
clearly show that multiple imaging systems are nowavailable for helping understand, diagnose, and treatAD.
UNDERSTANDING THE PATHOLOGICALBASIS OF AD
The fundamental pathological changes in ADare senile plaques (SPs), both primitive and neu-ritic, and neurofibrillary pathology (NP), whichincludes both NFTs and neuropil threads (see [10]).The SPs are thought to progress from a prim-itive to a neuritic form which is composed ofseveral pathological entities including aggregatedextra-cellular amyloid-beta (A�) protein, inflamma-tory glial cells, and pathological neurites containinghyper-phosphorylated microtubule-associated proteintau [11, 12]. The NP is primarily inside neuronsand composed principally of paired-helical filaments(PHFs) which are composed of hyper-phosphorylatedtau [12, 13]. The relationship between these two patho-logical entities, SPs and NP, is not fully understood.The neuropil threads (probably composed the same aspathological neurites) are inside dendrites and linkedfrom the neuropil through dendritic shafts to the neu-ronal cell bodies which contain the NFTs [14]. Thesefundamental pathological entities are thought to begintheir formation long before the first psycho-socialsymptoms appear [15]. A core concern in understand-ing AD has been the question of the nature, origin,and development of AD pathology. There have beentwo schools of thought concerning the developmentof AD pathology, one that has focused on the amy-loid pathology [16] and another that has considered theneurofibrillary pathology to be the fundamental prob-lem [15]. Resolution of the relationship between thesecomponents may lead to the understanding of AD thathas so far eluded research.
THE NEW PERSPECTIVE ON THECONTINUUM OF AD
A new perspective has been developing in the ADfield, that there must be consideration for the earliestdevelopments of pathological changes associated withthis disease. The pioneering discovery in this directionwas from the Nun Study, which showed the linguis-tic ability evident in the writing in women in theirearly 20’s could be associated with their later devel-opment of AD-related dementia [17]. This finding is

J.W. Ashford et al. / Imaging the Alzheimer Brain 3
complemented by recent pathological studies whichhave found that A� decreases in the spinal fluid likelyoccur as early as the fourth decade of life [18] andpathological findings of neurofibrillary pathology inindividuals in their third decade [15]. Further AD-related changes can even be found in the entorhinalcortex of children [19]. This new perspective has ledto the recent division of AD into preclinical [20], mildcognitive impairment [21], and dementia [22], with aparticular focus on biomarkers and brain imaging [23].Now AD can be seen as a continuum [24] that is influ-enced by factors early in life, including genetics [25,26] and education [27]. The purpose of the Handbookand this supplement is to present the numerous modali-ties that are currently being used to estimate the degreeof AD pathology in the brains of living individuals whoare at risk for developing dementia or have alreadysuffered from the impairments caused by this patho-logical condition. Conceptualizing the continuum ofAD is likely to provide greater understanding of thisdisease and help to advance diagnosis and the quest forprevention and treatment.
DEFINING THE CRITICAL AREAS OF ADSTUDY
A central theme of the Handbook and this supple-ment is the imaging of the brain along the continuumof AD, from young individuals who have early ADchanges or have developed a predisposition, throughearly signs of cognitive impairment, through mild toprofound dementia. Associated issues include geneticfactors and environmental events that predispose anindividual to develop A� or NP as well as the associ-ated dementia.
Neurofibrillary pathology (NP)
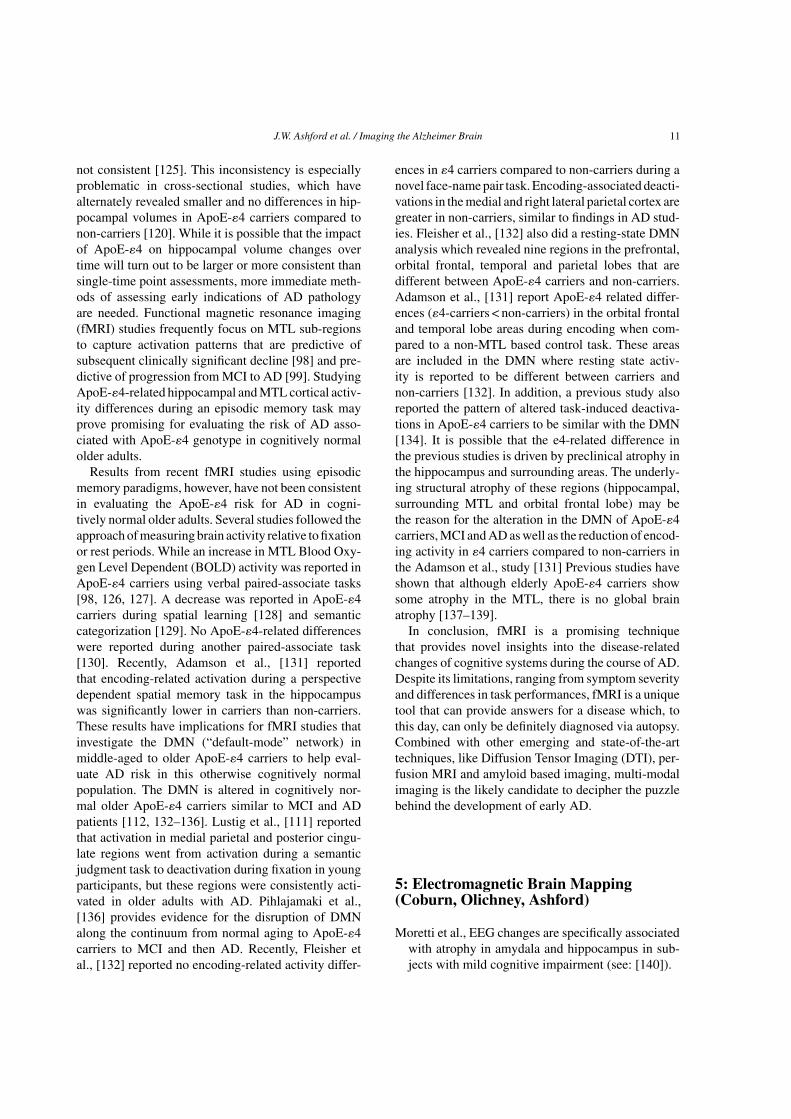
Neurofibrillary pathology relates to the severity ofdementia. The selective appearance of neurofibrillarychanges in specific regions of the brain [28] and itsprogression through the brain [15] correspond closelyto the distribution of loss of perfusion [29] (Fig. 1)and metabolism (Sections 3 and 4 in this volume). Theabnormalities of metabolism are seen prior to the devel-opment of dementia in association with the ApoE-�4genetic factor [30, 31] (see below). Even though theneurofibrillary changes are closely related to dementia,they do not have a clear relationship to genetic factors.However, they do seem to be stimulated by at leastone contributing environmental factor, head-trauma. A
Fig. 1. A single photon emission tomography (SPECT) analysis.Lateral view of the cortical surface (left side is on top). Scale indi-cates range for Pearson correlations with single decimal precisionwith “time-indexed” estimation of dementia severity in 30 proba-ble AD male patients with a broad range of severity. Bottom graphshows relative frequency of each decimal range [29].
specific PET ligand, FDDNP is able to show the dis-tribution of neurofibrillary pathology in humans (seeShin et al., in Section 3 of this supplement [32]).
Amyloid-β accumulation and neurofibrillarydegeneration
Aß plaques constitute an important aspect of ADpathology. While rare genetic mutations associatedwith the production of Aß suggest an important rolefor Aß in AD in the affected younger individuals (seeReiman et al., Section 8 of this supplement [33]), therelationship of Aß to AD in older patients has been less
4 J.W. Ashford et al. / Imaging the Alzheimer Brain
clear. AD is characterized by Aß accumulation in thebrain of affected individuals, and Aß depositions areassociated with the predisposition to dementia. How-ever, Aß depositions relate poorly to the severity ofdementia, and neither Aß accumulation nor the num-ber of plaques has been clearly linked to the severity ofcognitive dysfunction in AD (see [34]). The depositionof Aß in the brain can now be imaged with PET ligands,such as 11C-labelled Pittsburgh-Compound-B (PIB)and 18F-labelled Aß ligands (florbetapir (18F-AV-45),flutemetamol (18F-GE067), florbetaben (18F-BAY94-9172), and 18F-FDDNP) (see Section 3 below and inthis supplement).
Synaptic loss
Synapses are the dynamic infrastructures of cogni-tive processes. The anabolic production, maintenance,remodeling, and removal of these important entities arecrucial for normal cognitive function [35]. Numerousstudies have shown that AD is linked to a significantloss of synapses and synaptic markers in a variety ofbrain regions [36]. The loss of synapses is not onlydue to neuronal loss but also is linked to reducednumber of synapses per neurons, likely related tothe accumulation of hyperphosphorylated tau in den-drites [14]. Indeed compared with other pathologicalhallmarks of AD, the severity of synaptic loss corre-lates best with the severity of cognitive dysfunctionin AD [36]. Excessive synaptic loss in the AD brainis associated with a cascade of pathological events,including hypofunction (decreased metabolism andblood flow), atrophy, and alteration in the chemicalcomposition in various brain regions. For this reason,imaging modalities that can detect either structural(Section 2), metabolic (Section 3), functional (Sec-tion 4), electro-magnetoencephalographic (Section 5),axonal tract (Section 6), or chemical (Section 7) alter-ations in the brain are critical in detecting and assessingthese pathological changes.
Neuronal loss and/or hypofunction of specificsystems
In addition to significant volumetric and numericloss of neurons in the cortex and hippocampus, AD isalso characterized by a significant loss and dysfunc-tion of subcortical neurons projecting extensively tothe hippocampus and cortex (Section 1). These lossesare some of the most critical early changes in the ADbrain and may contribute to the development of pathol-
ogy in the cerebrum. For example, degeneration ofcholinergic neurons in the nucleus basalis of Meyn-ert occurs early in the course of AD [37, 38]. Indeed,cholinergic drugs represent the most successful class ofpharmaceuticals yet developed to treat AD [39]. Otherneurotransmitter systems are also affected early in AD,including, the serotonin nuclei, particularly in the dor-sal raphe nucleus, which may be affected significantlybefore any cerebral changes occur [40], and the nora-drenergic neurons of the locus coeruleus (see MilanSanchez M., in Section 1 of this supplement [1]). Theselective vulnerability of these neurotransmitter sys-tems to AD pathology, as well as the medial temporallobe structures, likely relates to their involvement inneuroplasticity, basically the function of forming thesubstrates of new memories [41, 42]. The atrophy of theneurons of these neurotransmitter systems in AD andthe loss of their trophic effects may specifically leadto degeneration and dysfunction in both hippocampusand cortex. These structural and functional changes inthe hippocampus and cortex are easily detected by MRIand fMRI (Sections 2 and 4). Furthermore, the signifi-cant demise of neurons will also be reflected by the lossof extensive connections between these regions, whichcan be detected by EEG [43] (see Babiloni et al., inSection 5 of this supplement [44]) and DTI (Section 6).
Apolipoprotein E (ApoE) – the principle geneticfactor associated with late-onset AD
The Apolipoprotein E (ApoE) polymorphism is thestrongest genetic risk factor linked to the sporadic formof AD [25, 26]. Interestingly, ApoE-�4 alleles increasethe risk of AD in a dose dependent manner. Althoughthe exact mechanism by which ApoE-�4 alleles leadto increased risk of AD remains to be determined, alink to amyloid binding and neuroplastic mechanismsappears likely, particularly the constant high frequencyof synapse creation and removal [26, 42]. Further,decreased neuronal activity related to ApoE-�4 alle-les is one of the most significant associations betweenany contributing factor and AD pathophysiology [45].Indeed, abnormalities of metabolism are seen priorto the development of dementia in association withthe ApoE-�4 allele [30, 31]. Numerous studies haveshown the link between ApoE-�4 alleles and cerebralmetabolic rate for glucose (CMRgl) in brain regionsincluding posterior cingulate, precuneus, parietal, tem-poral, and prefrontal brain regions in ApoE-�4 carriers[46] (Sections 3 and 4).

J.W. Ashford et al. / Imaging the Alzheimer Brain 5
Metabolic disorders
The relationship of AD to the general status of cere-bral metabolism is also of potential importance. Linksto glucose metabolism and insulin mechanisms havebeen of considerable interest (see Section 10). Thereis also a potential link to fat metabolism and leptin (aprotein hormone that is produced by fat cells and haseffects in the brain) that is still under investigation [47].Further, there are potential associations between riskand sex hormones. The relationship of AD to vascularfactors is also of great importance (see Section 9).
Environmental factors, traumatic brain injury, andcomplex stimulation
While there are clearly genetic factors predisposingto the development of AD, there are numerous envi-ronmental factors that have been considered to havea possible relationship to AD causation. Questions ofgreat interest in the Handbook and this supplement arewhich factors could be better studied through brainimaging and whether brain imaging can help to deter-mine if the manipulation of those factors would lead tomeasurable alterations of the course of AD pathologydevelopment.
The relationship between repetitive brain traumaand progressive neurological abnormalities has longbeen established. Chronic traumatic encephalopathyseems to be a major contributor in cognitive dysfunc-tion seen in athletes, particularly boxers and probablyseveral other groups. Brain trauma may lead to sig-nificant atrophy of multiple brain regions includingcortical and hippocampal areas and enlargement ofventricles. Microscopically, this condition is charac-terized by neuronal loss, gliosis, the occurrence ofneurofibrillary degeneration, particularly in superficialcortical layer neurons, and tau-positive astrocytes [48].Another recent finding is that combat veterans suffer-ing from post-traumatic stress disorder (PTSD) have atwo fold increase risk of dementia [49]. Of note, PTSDis also significantly associated with head trauma in thispopulation [50, 51].
Environmental stimulation such as education [27]may decrease the risk of dementia. Further, asdescribed by Forster et al., [52] and Rosen et al., [53]in Section 8 of this supplement, cognitive stimula-tion may have positive effects on dementia that canbe measured by brain imaging techniques.
IDENTIFYING BIOMARKERS ANDDEVELOPING EARLY DETECTIONMETHODS
The major genetic factor associated with AD in olderindividuals is the ApoE genotype. The variation in inci-dence between the �4/4 to �3/3 to �2/2 individualspotentially explains 95% of the causation of AD [26].Recent data from the Alzheimer’s Disease Neuroimag-ing Initiative (ADNI) had initially suggested that CSFAß and tau levels were associated with the transitionfrom “normal” to “MCI” (mild cognitive impairment)to “mild dementia”. However, re-examination of thedata by genotype indicated that only the tau measureswere associated with dementia, while the Aß levelswere associated with ApoE genotype [54]. Further,the initial association of Aß to diagnosis turned outto be an artifact related to the small number of indi-viduals with the ApoE-�4 allele in the normal group,an intermediate number in the MCI group, and a largenumber in the mild dementia group) (Tables 1, 2). Agewas also a contributing variable in the ADNI data set(Table 3). Thus, ApoE genotype also appears to bethe major factor associated with the development ofdementia and the predisposing biomarkers in the pop-ulation of the ADNI data set. This point is criticalto understand because many studies that examine ADpatients and compare their results to normal individu-als do not address the issue of specific ApoE genotypeand age, which appears to be critical for the develop-ment of AD and for establishing the links leading to itscausation.
There is a further problem with the ApoE genotypethat should be mentioned here. While the ApoE pro-tein is a cholesterol transport protein, it appears tobind to Aß, with the ApoE-�4 protein binding moststrongly to it (see [26, 42] for reviews). Such strongbinding could explain why the ApoE-�4 individualshave lower Aß in their cerebro-spinal fluid and moreAß deposition in the brain. However, Aß deposition
Table 1ADNI data on CSF biomarkers, mean ± SD
Tau A� P-Tau-181P
AD (n = 102) 122 ± 58 143 ± 41 42 ± 20MCI (n = 200) 103 ± 61 164 ± 55 35 ± 18Normal (n = 114) 70 ± 30 206 ± 55 25 ± 15
p < 0.0001, for each of the 3 biomarker tests for AD vs. Normal andfor MCI vs. Normal. For AD vs. MCI: p < 0.005, Tau; p < 0.01, A�;p < 0.01, P-Tau-181P. Mann-Whitney test (ADNI data, 2008) (A� is1-42).

6 J.W. Ashford et al. / Imaging the Alzheimer Brain
Table 2When the same data is analyzed by APOE genotype, different results
are found, mean ± SD
APOE genotype Normal MCI Mild AD
CSF A� levels33 212.4 ± 48.4 189.1 ± 59.8 168.8 ± 52.334 156.0 ± 47.8 148.4 ± 42.4 139.0 ± 27.244 126.0 ± 2.8 119.8 ± 23.5 116.2 ± 22.3
CSF P-Tau levels33 67.8 ± 26.9 83.6 ± 40.8 123.8 ± 68.634 81.8 ± 42.6 122.4 ± 72.7 113.3 ± 42.044 71.0 ± 2.8 110.6 ± 45.9 128.9 ± 53.1
p-value
A� comparison33 vs. 34 <0.000133 vs. 44 <0.000134 vs. 44 0.08Normal vs. MCI 0.57Normal vs. Mild AD 0.15MCI vs. Mild AD 0.20
p-value
P-Tau comparison33 vs. 34 0.0733 vs. 44 0.6734 vs. 44 0.99Normal vs. MCI 0.05Normal vs. Mild AD <0.01MCI vs. Mild AD 0.06
APOE genotype Normal MCI Mild AD
3/3 67 (72%) 82 (44%) 29 (31%)3/4 24 (26%) 81 (44%) 42 (45%)4/4 2 (2%) 22 (12%) 22 (24%)
Number of subjects (note more �4 alleles with higher grade of ADdiagnosis.
in the brain has a high relationship to AD risk butnot to AD dementia (see Section 3 of this supple-ment). Accordingly, there is a question of what thecausal link is between Aß and dementia. While Aßis considered toxic, that toxicity may just be a nor-mal aspect of neuroplasticity [42, 55–57]. It is theloss of synapses which is most closely associatedwith dementia [36], followed by the neurofibrillarypathology [5], with the neurofibrillary pathology likelyleading to the synapse loss [14]. The question thenis how Aß predisposes to the neurofibrillary pathol-ogy, for example, through an effect on the tau protein[58, 59]. Alternatively, some associated factor, evenan adjacent gene like Translocase of Outer Mitochon-drial Membrane 40 homolog (TOMM-40) [60], whichaffects mitochondrial function, could affect the tauphosphorylation/de-phosphorylation balance.
Table 3Ages of ADNI CSF subjects in each APOE genotype and subject
group, mean ± SD
APOE �4 genotype Normal MCI Mild AD
3/3 75.8 ± 5.0 75.4 ± 8.4 76.3 ± 8.63/4 75.8 ± 6.0 73.9 ± 6.7 75.6 ± 6.64/4 77.0 ± 1.4 72.2 ± 6.0 69.8 ± 7.0
EFFECTIVE METHODS OF EVALUATIONOF THERAPIES
Having access to methods that allow unbiasedevaluation of different therapeutic strategies is animportant aspect of developing a successful strat-egy for treating any disorder. Numerous therapeuticstrategies, both invasive and non-invasive, have beenused for the treatment of AD. These methods havefocused either on reducing accumulation of specificproteins and/or elements, restoring the function ofspecific systems, increasing the function of neuronsusing trophic factors, or reducing the reaction of thebrain to protein accumulation and toxicity. Althougha few intervention strategies have shown promisingeffects and have reached advanced stages of clinicaltrials, the only FDA approved methods for coun-tering cognitive dysfunction in AD are drugs thatincrease cholinergic tone through cholinesterase inhi-bition (tacrine, donepezil, galantamine, rivastigmine)and a drug that affects glutamate neurotransmission bymodulating N-methyl-D-aspartate (NMDA) receptoractivation (memantine). Advanced imaging methodshave been instrumental in verifying the effects of dif-ferent treatments in AD. Section 8 discusses importantconsiderations for utilizing the developments in brainimaging to more effectively evaluate the benefit oftreatments for AD.
The development of treatments for AD should beginwith better understanding of the pathophysiology andmore accurate assessments of the state and rate of pro-gression of the disease. The earliest factors in the ADcourse are genetic (for example, see Reiman et al., [33]in Section 8 of this supplement), and the ApoE geno-type appears to reflect a factor that is highly related tothe predisposition to AD, though there have been notreatments yet that appear to block this predisposition.Since ApoE-related brain changes may be detected inchildhood, interventions addressing this factor shouldbegin very early in life (the best model may be the man-agement of phenyl-ketonuria). The changes related toA� have been suggested to occur in middle adulthood[18], so therapeutic strategies that address A� would

J.W. Ashford et al. / Imaging the Alzheimer Brain 7
greatly benefit from brain imaging techniques that candetect A�−deposition at this middle phase of the dis-ease. For therapies that target prevention of dementiaprogression (a later phase of the newly conceived ADcontinuum) early in its course, a greater focus onmeasuring atrophy, metabolism, and tau would be ofmost utility [61]. Recent data suggest that blockingtau hyperphosphorylation may be sufficient to preventthe progression to dementia [59]. Consequently, thebrain imaging approaches most associated with neu-rofibrillary pathology would be of most relevance forassessing the benefits of therapies that target the tran-sition from the state of normal cognitive function todementia.
FUTURE DIRECTIONS OF AD RESEARCHAND CLINICAL DEVELOPMENT
The concordance of the changes seen with patho-logical analysis, brain imaging, and neurocognitivetesting indicate that the visualization of changes inthe brain related to AD has progressed far, but dis-covering the cause of AD and developing appropriateinterventions for cure and prevention have remainedelusive. Future efforts will be needed to continue theincredible advances in neuroimaging (see Section 10).However, there needs to be more focus on the fun-damental causative mechanisms leading to AD. Inparticular, advances in genetics need to determinethe specific contributions of genetic factors to all ofthe pathological changes observed both biologicallyand psycho-socially. Since all adults with Down syn-drome have AD pathology by age 40, there shouldbe more emphasis on understanding the pathophysi-ological basis of Down syndrome which is considereda genetic model of AD. How numerous environmen-tal factors affect AD progression from an apparentlynormal state toward dementia, likely beginning inchildhood, also needs to be understood. Further refine-ments are also needed to improve the measurementsof cognitive function to the point were cognitive mea-sures accurately and precisely reflect the pathologicalchanges seen in brain imaging and other biomarkers.
2: Structural Imaging(Bayley, Frisoni, Jack)
Thomann et al., Cognitive performance and its relationto brain morphology in MCI and AD (see: [62]).
Lehmann et al., Patterns of cortical thickness inpathologically-confirmed typical and atypicalAlzheimer’s disease (see: [63]).
Thomann et al., Volumetry of the olfactory bulb andtract: relation to medial temporal lobe atrophy andto cognitive performance in MCI and AD (see: [64]).
Fennema-Notestine et al., Presence of ApoE epsilon4Allele Associated with Thinner Frontal Cortex inMiddle [65].
Firbank et al., Alzheimer’s disease and dementia withLewy bodies can be differentiated by high resolutionMR imaging of the hippocampus (see: [66]).
Oliveira et al., Automated Volumetric Methods toDetect Alzheimer’s Disease (see: [67]).
Boccardi et al., Survey of Protocols for the ManualSegmentation of the Hippocampus: PreparatorySteps Towards a Joint EADC-ADNI HarmonizedProtocol [68].
Tosun et al., Relationship Between CSF Biomarkers ofAlzheimer’s Disease and Rates of Regional CorticalThinning In ADNI Data [69].
Brys et al., Quantitative Structural MRI And CSFBiomarkers in Early Diagnosis of Alzheimer’s Dis-ease (see: [70]).
Kerchner, Ultra-High Field 7T MRI: A New Tool forStudying Alzheimer’s Disease [71].
Structural MRI provides a measure of the cerebralatrophy that is a central feature of AD. Atrophy in ADis a result of neurodegenerative processes involvingdendritic pruning and loss of synapses, as well as neu-ronal cell body degeneration and death, with relatedloss of axons [14, 72]. A body of literature suggeststhat neurodegeneration in AD is a relatively late event,and is preceded by abnormalities in CSF, tau, Aß, andFDG-PET [61]. While the rate of change of some ofthese other biomarkers may slow before the appearanceof structural atrophy, abnormalities in neurodegenera-tion on MRI accelerate as clinical symptoms appear,and then parallel cognitive decline. As a result, volu-metric or voxel-based measures of brain atrophy retaina close relationship with cognitive performance acrossa broad range of AD severity, and rates of neuronaland synaptic loss indicated by brain atrophy corre-late strongly with rates of concurrent cognitive decline[73]. In addition, the degree of atrophy correlates wellwith Braak staging at autopsy [74–76] and the topo-graphic distribution of atrophy on MRI maps well ontoBraak’s staging of NFT pathology in patients who haveundergone post-mortem staging [77]. Many of thesethemes are explored in the chapters of this Section.

8 J.W. Ashford et al. / Imaging the Alzheimer Brain
For example, brain atrophy and its relationship to cog-nitive performance in patients with AD and MCI areexamined in two articles by Thomann et al., (see: [62,64]). AD is traditionally considered to be the prototyp-ical “cortical” (limbic as well as neocortical) dementiawhich arises through degeneration of the cerebral cor-tex and is typically associated with severe memory loss.Thomann et al., (see: [62]) demonstrate that this maybe an oversimplification, and that although recall andrecognition in AD patients are indeed related to corti-cal atrophy in the bilateral medial temporal lobe andposterior cingulate, they are also related to degenera-tion in subcortical regions including the thalamus. Thesame group of researchers also identified reduced greymatter density in the olfactory bulb and tract suggest-ing that this brain region may provide a potentiallyuseful marker of neurodegeneration in AD and MCI(see: [64]). One of the difficulties of diagnosing ADis that it shares many clinical symptoms with othertypes of dementia and the value of structural MRI inthe diagnosis of AD is explored by several groups. Forexample, Lehmann et al., (see: [63]) show that althoughwidespread cortical thinning occurs in AD, the specificpattern of thinning varies between patients with typicaland atypical presentations of AD. However, thinningof the posterior cingulate is a distinctive feature in bothtypical and atypical cases of AD but not in frontotem-poral lobar degeneration. Cortical thickness is alsoexamined by Fennema-Notestine et al., [65] in relationto ApoE genotype in healthy middle-aged men. TheApoE-�4 allele is associated with significantly thinnerfrontal cortex in this group, which may help explainthe greater susceptibility to AD in individuals withthe �4 allele. Firbank et al. [66], examined the use ofhigh resolution structural imaging of the hippocampusto differentiate between AD and dementia with Lewybodies (DLB). They identified three structural abnor-malities that differentiated AD from DLB and agedhealthy subjects that included the subiculum, CA1, anda hypointense line between CA1 and CA3/4. Oliveiraet al. [67], used image analysis algorithms in orderto automatically discriminate between AD patientsand controls using cortical thickness and volumet-ric data. Results demonstrated that this method couldsuccessfully distinguish between AD patients and con-trols (sensitivity = 93%; specificity = 85%). Althoughthe patient sample size in this study was relativelysmall, this and other specialized statistical classifica-tion methods based on image analysis are promisingtechniques which have the potential to improve thediagnosis and monitoring of AD. Although automated
procedures are increasingly used in the segmentationof structural images, manual segmentation remains thegold standard. However, as reviewed by Boccardi etal. [68], the results obtained by manual segmentationdepends strongly on which protocol is used – and canresult in up to 2.5-fold volume differences when evalu-ating hippocampal atrophy in AD. As a step in address-ing this issue, Boccardi et al., [68] highlight someof the differences between 12 published protocols forhippocampal segmentation. The relationship betweenbiomarkers of AD and rates of cortical thinning arealso explored. It is known that patients with AD havereduced amyloid (A�1-42), elevated phosphorylatedtau (p-tau) and elevated total tau in cerebrospinal fluid.Two groups (Tosun [69] et al., and Brys et al., see:[70]) both show that longitudinal rates of brain atrophyincrease in the presence of lower A�1-42 levels andhigher p-tau levels. Combining CSF biomarkers andstructural imaging biomarkers significantly increasesthe overall predictive accuracy of conversion of MCIto AD and supports the hypothesis that CSF A�1-42and tau are measures of early AD pathology. In thiscontext, it should be noted that a long standing issuein AD is the uncertain relationship between the senileplaque pathology associated with A� and the NP asso-ciated with tau. Recent data have suggested that the A�pathology is more closely associated with the ApoEgenotype and the predisposition to AD and developsover decades, while the tau pathology is more closelyrelated to cognitive function and develops over thecourse of dementia [18]. In view of this, the differenttime courses of these various biomarkers must be takeninto account when using combined measures to esti-mate where an individual lies on the continuum of AD.Finally, new technologies are on the horizon for struc-tural imaging in AD, including the routine use of ultra-high field MRI. Kerchner [71] reviews two AD-relatedapplications for 7T MRI: direct visualization of corti-cal plaques, and high resolution hippocampal imaging.Together, these tools promise to provide an ever greaterinsight for the diagnosis and treatment of AD.
3: Imaging of Cerebral Blood Flow,Metabolism, Amyloid Plaquesand Neurofibrillary Tangles in AD(Furst & Sabri)
Weih et al., Nuclear Medicine Diagnostic Techniquesin the Era of Pathophysiology-based CSF Biomar-kers for Alzheimer’s disease [78].
J.W. Ashford et al. / Imaging the Alzheimer Brain 9
Sedaghat & Baloyannis, Unawareness of Cognitiveand Behavioral Deficits in Alzheimer’s Disease MayBe Reflected By Functional Neuroimaging (see:[79]).
Alegret et al., Brain perfusion and neuropsychologi-cal deficits in Mild Cognitive Impairment and mildAlzheimer’s disease (see: [80]).
Bastin et al., Neural correlates of controlled memoryprocesses in questionable Alzheimer’s disease (see:[81]).
Nobili et al., The value of SPECT in detectingAlzheimer-type neurodegeneration in mild cogni-tive impairment (see: [82]).
Mosconi et al., A tale of two tracers: Glucosemetabolism and amyloid Positron Emission Tomo-graphy imaging in Alzheimer’s disease (see: [83]).
Furst & Lal, Amyloid-ß and glucose metabolism inAlzheimer’s disease [84].
Barthel & Sabri, Florbetaben to trace beta-amyloid inthe Alzheimer brain by means of PET [85].
Austin et al., Effects of Hypoperfusion in Alzheimer’sDisease [86].
Shin et al., The Merits of FDDNP-PET Imaging inAlzheimer’s [32].
Jensen et al., Research towards tau imaging [87].
This section provides an overview of the progressthat has been made in the past decades in imagingAD pathology chiefly using techniques developed innuclear medicine such as positron emission tomogra-phy (PET) and single photon emission tomography(SPECT). Together with new approaches also inte-grating magnetic resonance imaging (MRI) these tech-niques have focused on the detection and quantificationof cerebral hypoperfusion, glucose hypometabolismand the hallmark pathological features of the disease,Aß-SPs and neurofibrillary tangles (NFT).
A brief introductory review of existing imaging tech-niques in the context of AD diagnostics is providedin the article by Weih et al., [78]. This is followedby three articles from the Journal of Alzheimer’s Dis-ease (Sedaghat et al., [79]; Alegret et al., [80]; andBastin et al., [81]) illustrating the usefulness of imag-ing in detecting and exploring the neural correlates ofcognitive deficits associated with AD pathology. Dueto the failure of many clinical trials and the grow-ing need for disease modifying drugs, Reiman et al.,[33] (in Section 8) outline the Alzheimer’s PreventionInitiative (API), an ambitious plan to target popula-tions that are genetically at high risk for developingAD close to their expected onset of the disease with
new drugs using imaging as outcome measures. Simi-larly, Tzimopoulou et al., (see: [88] from Section 8 ofthe Handbook) makes the case for the specific utilityof fluorodeoxyglucose (FDG) imaging in multi-centerclinical trials settings. The value of the more widelyavailable SPECT in mild cognitive impairment andAD is discussed in Nobili et al., (see: [82]). A com-prehensive comparison of the utility of FDG vs. theto-date most widely studied amyloid tracer Pittsburgh-Compound-B (PIB) is provided by Mosconi et al.,(see: [83]) followed by a detailed comparison of theuptake patterns of the two tracers in AD, specificallyin Furst & Lal [84]. Further, the current knowledgeand future research activities for the 18F-labeled-amyloid-targeted PET tracer florbetaben are reviewedby Barthel & Sabri [85]. Austin et al., [86] discussarterial spin labeling (ASL) a more recent MR-basedalternative to measure hypoperfusion in AD. Finallythe last 2 chapters of this section are focused on thechallenges in imaging NFT pathology: Shin et al., [32]discuss this in the context of data of the only availablecompound capable of detecting both Aß and NFTs,FDDNP, and points to the necessity for modificationof current Aß centered disease progression frameworksin order to accommodate these findings. In order toclearly distinguish the contributions of Aß vs. NFT toAD pathology a tracer that is solely binding to NFTis urgently needed for future research. The specificdifficulties in developing such an imaging agent areillustrated in the last article by Jensen et al., [87].
4: Current Advances in FunctionalMagnetic Resonance Imaging forDetecting Alzheimer’s Disease(Adamson)
Sala-Llonch et al., Combining MRI modalities to studyvisual and default-mode networks in a-MCI (see:[89])
Bokde et al., Verbal Working Memory in AmnesticMild Cognitive Impaired subjects: An fMRI study(see: [90])
Drago et al., Disease Tracking Markers forAlzheimer’s Disease at the Prodromal (MCI)Stage [91]
Recent advances in imaging techniques have placedfunctional magnetic resonance imaging (fMRI) on theforefront for improving ways by which to identify indi-

10 J.W. Ashford et al. / Imaging the Alzheimer Brain
viduals with very mild symptoms prior to dementia.Efforts are currently underway to revise the diagnos-tic criteria for AD with the goal being diagnosis priorto not only dementia but also MCI, including pro-dromal disease markers [91]. Such criteria will likelyinclude results of monitoring the changes in functionalbrain activity particularly in the medial temporal lobe(MTL) as measured by fMRI. The MTL is the seatof episodic memory [92–94], including visuo-spatialmemory [95], and the first site affected by AD [96].Even at the preclinical stage, the hippocampus andthe entorhinal and perirhinal cortices show AD-likepathology [97]. Many studies have provided evidencefor neuronal changes that occur in the preclinical stageof AD, and fMRI may be a very useful technique tomeasure these changes in vivo. In the current section,we review recent fMRI studies in MCI, AD and pre-clinical AD.
FUNCTIONAL MRI IN AD & MCI
Functional magnetic resonance imaging (fMRI)studies frequently focus on MTL subregions to captureactivation patterns that are predictive of subsequentclinically significant decline [98] and predictive of pro-gression from MCI to AD [99]. A number of fMRIstudies have identified alteration in task-related blood-oxygen-level-dependent (BOLD) response in not onlymedial temporal lobe (MTL) area but also in frontalregions in AD patients compared to controls [100]. Theuse of a variety of tasks addressing MTL involvementin various memory systems has led to wide-rangingresults in AD and MCI groups (see [90]). For instance,both increased and decreased activations in tempo-ral and frontal regions have been reported previouslyin mild AD patients [101, 102]. Some evidence alsosuggests that decreased hippocampus activity duringencoding may be associated with increased frontalactivity in mild AD patients. The latter is consistentwith the idea that due to atrophy-related changes inMTL, other areas are recruited to perform the tasks athand.
Results from studies in MCI have been veryinconsistent possibly due to variations of cognitiveimpairment of the individuals at this stage. Decreasedhippocampal activation, similar to AD patients, hasbeen reported in MCI patients compared to controlsduring encoding and retrieval [103, 104]. In contrast,several studies investigating memory encoding withface, object, and word stimuli, have found increased
activation in MCI compared to controls [105–107]. Asmentioned earlier, these differences are likely due tothe differences between subjects associated with thewide-range of severity of cognitive impairment in theMCI subjects studied based on the clinical dementiarating scale (CDR) and the numerous MCI definitionsthat have been developed and used in various studies.Some studies have used a more strict range allowingfor only very mild cases to be included in a study. Inaddition to level of clinical impairment, the type offMRI task used and other methodological differencesalso make a difference in the interpretation of resultsobtained in each study.
Whether there is increase or decrease in hippocam-pus activation in MCI and/or AD, fMRI can detectchanges in the brain regions responsible for differentmemory systems that are associated with preclinicalsymptoms of AD. More recently, studies of restingstate (non-task related fMRI) have provided evidencefor the “default mode” network (DMN), comprised ofmedial parietal/posterior cingulate cortex, along withmedial frontal and lateral parietal regions. This net-work is active during rest or when individuals arenot engaged in a task. During a task, these regionsshow deactivation [108]. This DMN has been shownto be disrupted in AD by a number of recent studies[109–112]. Recently, Frings et al., [113] suggested thatthe lack of task-related deactivation in the precuneus,an important node in the DMN, is due to connectiv-ity disruption in MCI and AD patients and may not beatrophy related. Evidence also links regions with amy-loid deposition in AD to areas involved in the DMN[114]. Abnormalities in the DMN even appear in MCI(see: [89]).
FUNCTIONAL MRI ASSOCIATED WITHAPOE GENOTYPES
ApoE-�4 alleles increase the risk of developing lateonset AD [26, 115, 116]. Carrying at least one �4allele is a predictor of clinical progression from MCIto AD [117–119]. In cognitively normal populations,ApoE-�4-related differences in neuropsychologicaltask performance have been detected before age 65[120–123], although differences are typically modest[124]. The medial temporal lobe (MTL) is the seatof episodic memory [92–94], including visuo-spatialmemory [95], and the first cortical sites affected byAD [96]. However, reports of ApoE-�4-related differ-ences in brain structure, particularly in the MTL, are
J.W. Ashford et al. / Imaging the Alzheimer Brain 11
not consistent [125]. This inconsistency is especiallyproblematic in cross-sectional studies, which havealternately revealed smaller and no differences in hip-pocampal volumes in ApoE-�4 carriers compared tonon-carriers [120]. While it is possible that the impactof ApoE-�4 on hippocampal volume changes overtime will turn out to be larger or more consistent thansingle-time point assessments, more immediate meth-ods of assessing early indications of AD pathologyare needed. Functional magnetic resonance imaging(fMRI) studies frequently focus on MTL sub-regionsto capture activation patterns that are predictive ofsubsequent clinically significant decline [98] and pre-dictive of progression from MCI to AD [99]. StudyingApoE-�4-related hippocampal and MTL cortical activ-ity differences during an episodic memory task mayprove promising for evaluating the risk of AD asso-ciated with ApoE-�4 genotype in cognitively normalolder adults.
Results from recent fMRI studies using episodicmemory paradigms, however, have not been consistentin evaluating the ApoE-�4 risk for AD in cogni-tively normal older adults. Several studies followed theapproach of measuring brain activity relative to fixationor rest periods. While an increase in MTL Blood Oxy-gen Level Dependent (BOLD) activity was reported inApoE-�4 carriers using verbal paired-associate tasks[98, 126, 127]. A decrease was reported in ApoE-�4carriers during spatial learning [128] and semanticcategorization [129]. No ApoE-�4-related differenceswere reported during another paired-associate task[130]. Recently, Adamson et al., [131] reportedthat encoding-related activation during a perspectivedependent spatial memory task in the hippocampuswas significantly lower in carriers than non-carriers.These results have implications for fMRI studies thatinvestigate the DMN (“default-mode” network) inmiddle-aged to older ApoE-�4 carriers to help eval-uate AD risk in this otherwise cognitively normalpopulation. The DMN is altered in cognitively nor-mal older ApoE-�4 carriers similar to MCI and ADpatients [112, 132–136]. Lustig et al., [111] reportedthat activation in medial parietal and posterior cingu-late regions went from activation during a semanticjudgment task to deactivation during fixation in youngparticipants, but these regions were consistently acti-vated in older adults with AD. Pihlajamaki et al.,[136] provides evidence for the disruption of DMNalong the continuum from normal aging to ApoE-�4carriers to MCI and then AD. Recently, Fleisher etal., [132] reported no encoding-related activity differ-
ences in �4 carriers compared to non-carriers during anovel face-name pair task. Encoding-associated deacti-vations in the medial and right lateral parietal cortex aregreater in non-carriers, similar to findings in AD stud-ies. Fleisher et al., [132] also did a resting-state DMNanalysis which revealed nine regions in the prefrontal,orbital frontal, temporal and parietal lobes that aredifferent between ApoE-�4 carriers and non-carriers.Adamson et al., [131] report ApoE-�4 related differ-ences (�4-carriers < non-carriers) in the orbital frontaland temporal lobe areas during encoding when com-pared to a non-MTL based control task. These areasare included in the DMN where resting state activ-ity is reported to be different between carriers andnon-carriers [132]. In addition, a previous study alsoreported the pattern of altered task-induced deactiva-tions in ApoE-�4 carriers to be similar with the DMN[134]. It is possible that the e4-related difference inthe previous studies is driven by preclinical atrophy inthe hippocampus and surrounding areas. The underly-ing structural atrophy of these regions (hippocampal,surrounding MTL and orbital frontal lobe) may bethe reason for the alteration in the DMN of ApoE-�4carriers, MCI and AD as well as the reduction of encod-ing activity in �4 carriers compared to non-carriers inthe Adamson et al., study [131] Previous studies haveshown that although elderly ApoE-�4 carriers showsome atrophy in the MTL, there is no global brainatrophy [137–139].
In conclusion, fMRI is a promising techniquethat provides novel insights into the disease-relatedchanges of cognitive systems during the course of AD.Despite its limitations, ranging from symptom severityand differences in task performances, fMRI is a uniquetool that can provide answers for a disease which, tothis day, can only be definitely diagnosed via autopsy.Combined with other emerging and state-of-the-arttechniques, like Diffusion Tensor Imaging (DTI), per-fusion MRI and amyloid based imaging, multi-modalimaging is the likely candidate to decipher the puzzlebehind the development of early AD.
5: Electromagnetic Brain Mapping(Coburn, Olichney, Ashford)
Moretti et al., EEG changes are specifically associatedwith atrophy in amydala and hippocampus in sub-jects with mild cognitive impairment (see: [140]).
12 J.W. Ashford et al. / Imaging the Alzheimer Brain
Babiloni et al., Resting State Cortical Rhythms in MildCognitive Impairment and Alzheimer’s Disease:Electroencephalographic Evidence [44].
Deiber et al., Working memory electroencephalo-graphic patterns in subtypes of amnestic mild cog-nitive impairment (see: [141]).
Olichney et al., Cognitive event-related potentials:Biomarkers of synaptic dysfunction across thestages of Alzheimer’s Disease [142].
Ashford et al., The topography of P300 energy loss inaging and Alzheimer’s disease [143].
Verdoorn et al., Evaluation and tracking of Alzheimer’sdisease severity using resting-state magnetoen-cephalograpy [144].
Although studies of brain electrical activity have along history in psychiatry and neurology, the advent ofquantitative electroencephalography (qEEG) systemsin the 1980 s introduced topographic mapping (“brainmapping”) as a display option. This important devel-opment brought EEG and related techniques squarelyinto the domain of neuroimaging. Onto a standard-ized head or brain template (or more recently ontothe subject’s own brain MRI) could be mapped theraw voltages of EEGs, averaged voltages of EvokedPotentials (EPs) and Event-related Potentials (ERPs),frequency domain measurements of EEG amplitudeand power deriving from fast Fourier transformations(FFTs), results of inferential statistical tests such as sig-nificance probability mapping (SPM), and a wide rangeof other quantitative data. Simultaneously the tech-nique of magnetoencephalography (MEG), recordingmagnetic instead of voltage fields produced by brainactivity, made its debut, introducing magnetic coun-terparts to EEGs, EPs, and ERPs. Application ofthese new techniques to dementia in general andAD in particular was rapid. There are two broadparadigms for studying brain electrical activity. In one,the EEG/MEG eavesdrops on the resting or idling brainwhile the subject sits quietly with his eyes open orclosed. Verdoorn et al., [144] in this supplement presenta vivid example of the use of the resting MEG toinvestigate AD. The other paradigm, subsuming EPs,ERPs and their magnetic equivalents, actively interro-gates brain systems using external stimuli. In evokedpotential (EP) studies auditory, visual, or other stimuliare used to drive the brain’s sensory systems produc-ing a sensory evoked potential containing a series ofwaves (components) corresponding to stages of corti-cal information processing. ERP studies elaborate onthis framework by requiring the subject to perform a
specific cognitive task related to the stimuli. The mostcommon such task is the auditory oddball, in whichthe subject is instructed to ignore one class of stimuli(e.g., low pitch tones) but to respond to a second classof stimuli (e.g., high pitch tones). The brain respondswith an ERP containing the familiar auditory sensorycomponents followed by one or more new components(e.g., N200, P300) reflecting the additional informationprocessing related to the cognitive task.
In many ways EEG offers an ideal method forassessing brain function. Its exquisite temporal reso-lution can track brain activity in the millisecond timedomain characteristic of neuronal activity in the cor-tical substrate. It is entirely noninvasive and employsno ionizing radiation. It records both excitatory andinhibitory signals directly rather than secondary hemo-dynamic processes. It also is inexpensive. MEG offersthese same advantages along with more precise spa-tial localization, although MEG systems are not inwidespread clinical use due to their size and the neces-sity of supercooling their superconducting sensors withliquid helium. In contrast, EEG systems are abundantand in many cases portable.
Another important advantage of EEG is that nor-mative databases are available, allowing statisticalcomparison of a patient’s brain activity with that ofage-matched controls. The use of quantitative tech-niques and inferential statistics moves EEG analysisfrom the realm of qualitative clinical impressions intothe realm of quantitative empirical assessment. Suchcomparison with healthy controls yields informationabout the degree of abnormality of the patient’s brainactivity recorded by each electrode. Some databasesadditionally offer comparison with known clinical con-ditions, allowing a statistically based multivariate “bestfit” classification that can aid clinical diagnosis. EEG’spoor spatial resolution is being overcome by the use ofincreasingly dense electrode arrays, from 20 a decadeago to as many as 256 today. MEG, in addition to hav-ing a theoretically better spatial resolution than EEG,has experienced a similar increase in the number ofsensors.
It has long been known that the typical EEG in ADcontains increased slow activity in the theta (4–8 Hz)frequency range and decreased fast activity in thebeta (13–24 Hz) range over the broad regions of thetemporal and parietal lobes sustaining high levels oftissue damage from the disease [145, 146]. More local-ized cortical damage resulting from strokes producesmore focal theta, and in principle it should be possi-ble to use this to identify individuals suffering from

J.W. Ashford et al. / Imaging the Alzheimer Brain 13
vascular dementia [147]. In practice however, this hasbeen difficult to achieve using traditional univariateanalysis techniques. Applications of multivariate tech-niques have shown more promise.
Quantitative EEG studies applying multivariateanalysis to dementia have been reviewed extensively[148, 149]. Well-replicated studies have shown repeat-edly that individual AD subjects and matched healthycontrols can be classified into their appropriate groupson the basis of multivariate EEG analysis alone withaccuracies as high as 80–90%. Furthermore, individ-ual AD subjects could be discriminated from theirnondemented depressed, alcoholic, or delirious, coun-terparts, and within the dementias AD subjects couldbe separated from those suffering from vascular orfronto-temporal dementia. However, such studies wereperformed using patients with established diagnosesand usually did not attempt to identify subjects in theearliest stages of a dementing process.
More recent work, reviewed in the Bablioni et al.,[44] and Moretti et al., (see: [140]) articles in theHandbook and this supplement, greatly refines ourunderstanding of the earliest frequency domain EEGchanges in dementia. Subjects suffering from MCIwere found to display several promising EEG markers.The markers not only distinguish between groups ofMCI subjects and matched groups of healthy controls,but also between MCI sub-groups that will remain inMCI, progress to AD, or progress to non-AD dementia.It will be interesting to see whether these EEG mark-ers, including integration with ApoE genotype, can beused to accurately classify individual subjects. If so,they could be employed as diagnostic aids and perhapsmore importantly in a prognostic capacity. Addition-ally, the markers could serve as surrogate measures ofdisease progression, greatly aiding the development ofnew therapies.
The frequency domain changes seen in the EEG areparalleled by MEG changes. Verdoorn et al., [144] inthis supplement document MEG differences betweengroups of AD patients and healthy controls, and addi-tionally find several MEG markers that change overtime in parallel with neuropsychological changes totrack disease progression. As with EEG, the criticalquestion is whether MEG markers derived from groupsof subjects can be applied to individuals. If so, theyoffer great potential for early phase development ofnovel treatments.
Pritchard et al., [150] developed a new nonlinearmathematical method of analyzing EEG activity basedon deterministic chaos theory, and derived a measure
of brain activity they termed dimensional complex-ity. They then used dimensional complexity to studyAD and found that not only did this measure reli-ably distinguish between groups of AD patients andgroups of matched healthy controls [151, 152], but italso could reliably classify individuals as belonging toeither of these two groups [146]. Direct comparisonbetween standard frequency analysis and a combina-tion of frequency analysis and dimensional complexityclearly showed the superiority of the combined tech-nique. The use of nonlinear dynamic analysis has beenlimited by the availability of computational power.Indeed, those early studies required collaboration withthe Supercomputer Computations Research Institute atFlorida State University. But in the two decades sincethose seminal studies, rapid increases in computationalpower have allowed the analyses to be run on desk-top computers, and nonlinear analysis has occupied aminor but important role in EEG research. Bablioniet al., [44], in this supplement, reviews some recentnonlinear dynamic findings regarding AD (e.g., thesparing of resting state posterior alpha EEG rhythmsin AD patients with more severe ischemic changes inthe white-matter).
Because AD involves widespread brain pathologyand marked deterioration of cognitive functions onemight expect changes in both EPs and ERPs, and bothare seen. For example, the visual EP in response toa diffuse light flash contains a P2 component thathas been found consistently to be delayed in groupsof AD patients [145, 153–156]. This delay probablyreflects damage to the cholinergic neurons in visualassociation areas of the cortex. Similarly, the ERP pro-duced by AD victims during the oddball task typicallycontains a delayed P300 component, probably reflect-ing the additional processing time necessary for thedamaged higher-order association areas of the cor-tex to perform the cognitive task. The amplitude ofthe P300 component is often found to be diminishedin AD, presumably reflecting a reduced populationof cortical pyramidal neurons involved in the cogni-tive oddball task. Unfortunately, neither the latencyincrease nor the amplitude decrease is sufficiently reli-able to be of clinical value when assessing individualpatients. In an effort to extract a more reliable P300 sig-nal from the background noise, Ashford et al., [143],in this supplement, compute power and energy mea-sures from the recorded P300 voltage record. Bothderived measures appear to track age- and AD-relatedchanges more closely than does the traditional voltagewave.
14 J.W. Ashford et al. / Imaging the Alzheimer Brain
In this supplement, Olichney et al., [142] reviewprior ERP studies of AD, including P300 studies ofattention and N400 studies of linguistic processing.Importantly, ERP studies can be designed to be sensi-tive to the cardinal features of AD. In this regard, recentwork by Olichney and colleagues suggests that a LatePositive Component important for memory processes,sometimes termed the P600, may be particularly sensi-tive to the earliest stage of synaptic dysfunction duringthe ‘Pre-clinical’ (MCI) stage of AD. Olichney et al.,[157] have demonstrated that two late ERP compo-nents (N400 and P600) are also promising in theirability to predict outcome in MCI. As with the EEGmarkers proposed by Bablioni et al., [44], an impor-tant question is whether ERP markers can accuratelyclassify individual subjects during the MCI stage oreven earlier. Recently proposed research criteria forpre-clinical AD [20] divided this entity into 3 stagesbased on the presence/absence of very mild cognitivedeficits and synaptic dysfunction.
This supplement illustrates several applications ofthe EEG, ERP and MEG techniques to characterizesynaptic/neuronal function and their earliest derail-ments in AD. Further research and validation of thesemeasures are needed to test their clinical utility andcost-effectiveness and to determine which informa-tion is most complimentary to the results from otherimaging modalities (e.g., MRI, PET) and other ADbiomarkers.
6: Diffusion Tensor Imaging (Schuff)
Fellgiebel & Yakushev, Diffusion tensor imaging of thehippocampus in MCI and early Alzheimer’s disease[158].
Friese et al., Detection of Alzheimer’s disease withdiffusion tensor imaging and deformation-basedmorphometry (see: [159]).
Canu et al., Mapping the structural brain changes inAlzheimer’s disease: The independent contributionof two imaging modalities [160].
Haller et al., Diffusion tensor imaging (DTI) basedindividual prediction of cognitive decline in mildcognitive impairment using a support vectormachine analysis (see: [161]).
Shu et al., Multiple diffusion indices reveals whitematter degeneration in Alzheimer’s disease and mildcognitive impairment: A tract-based spatial statistics[162].
Oishi et al., DTI analyses and clinical applications inAlzheimer’s Disease [163].
Teipel et al., White matter microstructure in relationto education in aging and Alzheimer’s disease (see:[164]).
Yassa, Searching for novel biomarkers using high re-solution diffusion tensor imaging [165].
For many years, AD has been considered primarily adisorder of the gray matter of the brainstem, hippocam-pus, and cortex. Recently, a broader view has prevailedin which white matter changes are also seen to be rel-evant to assessing the AD process. The changing viewarose to a large part from brain studies using diffusiontensor brain imaging (DTI), a variant of MRI, whichprovides a unique approach for the assessment of whitematter. DTI captures the microstructural architectureof tissue by measuring the systematic directionality ofwater diffusion. The degree of diffusion directional-ity is usually expressed as fractional anisotropy (FA),which ranges theoretically from zero for isotropic dif-fusion to unity for diffusion exclusively along onedirection [166]. It is now well established that FA issensitive to changes in white matter integrity [167],although the biological underpinnings of FA alter-ations are not known in detail. Information from DTIcan also be used for mapping fiber tracts and for studiesof brain connectivity using the concept of tractography[168]. DTI has become the method of choice for study-ing alterations in white matter in normal aging as wellas in a variety of neurological diseases. In AD researchalone, roughly 100 DTI articles have been published inthe past decade with a growing number of new reportsappearing now every year.
The articles in this section of the Handbook andthis supplement represent the status of current DTIresearch in AD and MCI and highlight the charac-teristics of white matter damage associated with AD.The article by Fellgiebel et al., [158] focuses on DTIstudies of the hippocampus and associated limbicstructures, which have received particular attention inAD research because of their critical role in memoryprocessing and function. Several findings suggest thatDTI-based indices of microstructural integrity of lim-bic structures might outperform conventional measuresof macrostructural volume loss as predictors of AD.The diagnostic utility of DTI in direct comparison tothat of brain atrophy for AD is taken up directly in thearticle by Friese et al., (see: [159]). The feasibility ofDTI as a biomarker for AD in clinical research settingsand pharmacological trials is also discussed. Another
J.W. Ashford et al. / Imaging the Alzheimer Brain 15
perspective on using DTI and structural MRI togetheris presented in the article by Canu and colleagues [160],who aimed to identify the extent to which microstruc-tural alterations and macrostructural atrophy provideindependent information for the characterization ofAD pathology in a small group of diagnosed ADpatients and healthy elderly controls. Their findingsfurther expand the understanding of the topography ofpathological changes in AD that can be captured withvarious MRI methods. The value of DTI for predictingcognitive decline from MCI toward dementia is inves-tigated in the article by Haller et al., (see: [161]), usingfractional anisotropy as a primary summary measureof DTI. The value of various other summary measuresof DTI is addressed in the article by Shu et al., [162].The different DTI measures are outlined and the sensi-tivity and interpretation of each measure is discussedin the context of detecting AD at an early stage. Thepotential translation of DTI research into clinical prac-tice is critically examined in the article by Oshi et al.,[163]. In addition, principles of DTI are reviewed andstrategies for investigating white matter alterations aredescribed. In the article by Teipel et al., (see: [164]),DTI is used to study associations between white mat-ter integrity and education in the context of AD andbrain reserve capacity. Finally, in the article by Yassa
[165], a high resolution DTI method is reviewed tomap the intricate structure of the perforant pathway,a connectional route linking the entorhinal cortex tothe hippocampal formation and a target of early ADpathology.
DTI methods present novel and exciting opportu-nities but technical challenges remain. Taken together,the articles in this section demonstrate consistently thatanisotropic diffusion of water in brain tissue measuredby DTI is a highly sensitive probe to assess subtledisease processes in AD, not normally seen with con-ventional MRI contrast mechanisms. DTI holds greatpromise to become a useful clinical tool for early ADdetection.
7: Magnetic Resonance Spectroscopy(Spielman)
Didic et al., Magnetic Resonance Spectroscopic Imag-ing detects metabolic changes within the medialtemporal lobe in aMCI (see: [169]).
Westman et al., Resonance Imaging and Mag-netic Resonance Spectroscopy for detection of earlyAlzheimer’s disease [170].
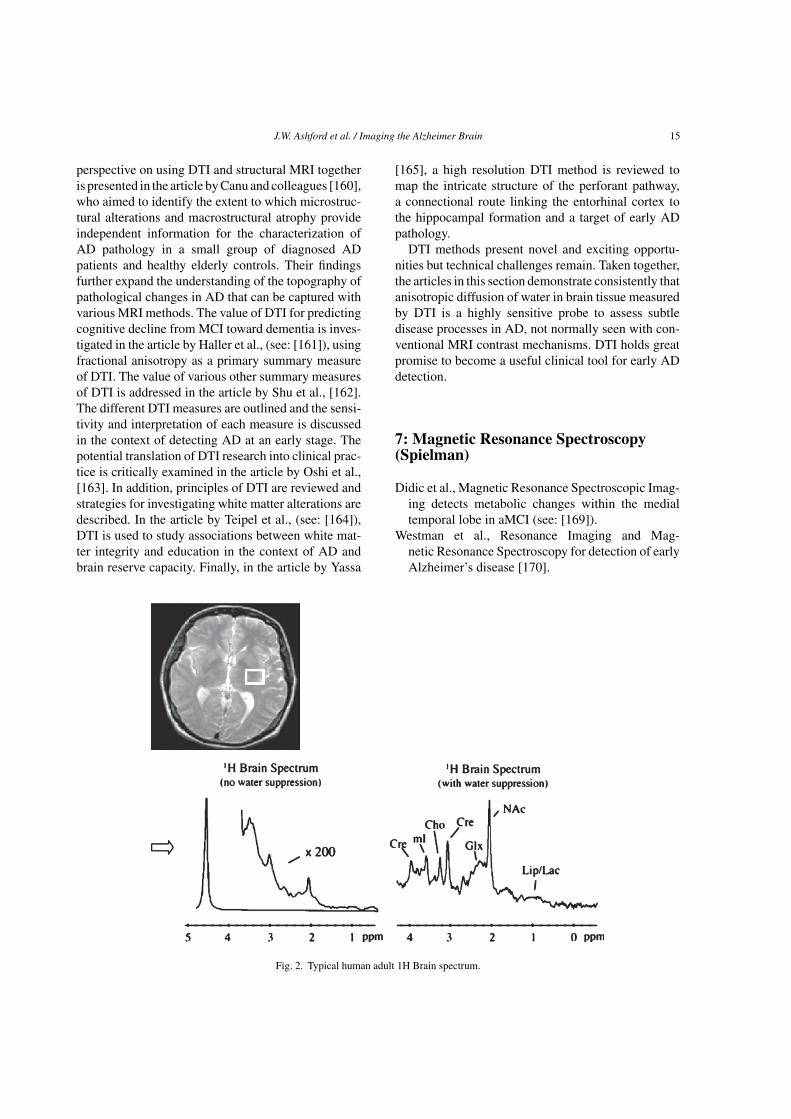
Fig. 2. Typical human adult 1H Brain spectrum.

16 J.W. Ashford et al. / Imaging the Alzheimer Brain
The profound morphological changes that occur inthe human brain in normal aging and neurodegen-erative diseases have molecular, neurochemical, andcellular underpinnings as well as behavioral concomi-tants. Magnetic Resonance Spectroscopy (MRS) andSpectroscopic Imaging (MRSI) provide one of the fewnoninvasive in vivo investigative tools for derivingknowledge about the physiological processes of nor-mal aging and the pathophysiological mechanisms bywhich AD causes dementia. As shown in the represen-tative spectrum depicted in Fig. 2, proton-MRS(1H-MRS) permits visualization of a variety of markersof cellular integrity and function, including thoseof living neurons (N-acetyl compounds comprisingmainly N-acetyl aspartate [NAA] and with contribu-tions also from other N-acetyl compounds, especiallyN-acetyl aspartyl glutamate), glia (myo-Inositol [mI]),high-energy metabolic products (creatine [Cr]), cellmembrane synthesis or degradation (choline [Cho]),plus less well resolved amino acids, including gluta-mate and glutamine). Table 4 contains a brief overviewof the MR characteristics and bio- chemical roles of themost prominent MRS-detectable metabolites.
A large number of in vivo studies have been con-ducted documenting changes associated with AD,MCI, and other dementias [171–178]. These studiesrange from single voxel acquisitions, in which dataare acquired from a single targeted volume of tissue,to multi-voxel MRSI studies, acquiring spectroscopicdata from an array of voxels allowing the assessmentof both spectral and spatial variations. Reduced NAA(or NAA/Cr ratios) and elevated mI (or mI/Cr ratios)have been the most consistent findings with respect toAD. Similar, though somewhat smaller effects, seenin individuals with MCI suggest that MRS may alsohave a predictive role in identifying early stage disease.However, to date, there have been no published studiesof 1H-MRS in combination with confirmed diagno-sis as assessed by histopathology at autopsy. Anotherimportant issue is the assessment of relationships withgenetic (ApoE) and metabolic factors.
A summary of the current literature demonstratesMRSI is a powerful approach for addressing ques-tions about the neurobiology and neurochemistry ofthe living human brain in health and disease and sug-gests that the MRS observable changes in AD are
Table 4Commonly observed proton metabolites and their corresponding biochemical roles
Compound Chemical shift Biochemical role
N-acetyl aspartate (NAA) 2.0 ppm NAA is only present in living neurons and is thus commonly used as a marker of neuronaldensity and viability (i.e., it is absent when neurons die or are absent). Note, the in vivo2.0 ppm peak, while primarily comprised of NAA, actually contains contributions fromseveral other N-acetyl compounds. For this reason the peak is sometimes labeled “NA”or “NAc”.
Creatine (Cre) 3.0, 3.9 The Cre peak reflects the total creatine stores in cells (hence the common notation tCr),and plays a primary role in maintaining the energy storage systems in cells. Cre levelstend to stay relatively stable in a variety of conditions and is thus often used as aninternal standard for comparison to other metabolites. There are actual two peaks due tocreatine, one at 3.0 and the other at 3.9 ppm (although the later peak is often lost due towater suppression).
Choline (Cho) 3.2 The bulk of the in vivo Cho peak comes from constituents of phospholipid metabolism ofcell membranes. It has thus been used as a marker for cellular proliferation and density.
myo-Inositol (mI) 3.6 The biochemical role of myo-Inositol is not fully understood, though some have suggestedin may be used as a glial cell marker, mI levels are relatively high in neonates, and it hasalso been observed to be elevated in Alzheimer’s disease (along with decreased NAA).
Glutamine + Glutamate (Glx) 2.1–2.5 Glutamate is an excitatory neurotransmitter that play a critical role in the action of nervecells in the brain. Glutamine plays a role in regulating neurotransmitter activities as wellas in detoxification processes. These two metabolites resonate very close together andoften cannot be separated at fields <3T (hence the common notation Glx to refer to thesum of these peaks).
Lipids (Lip) 0.9–1.4 Lipids, while common in many tissues in the body, are generally not MRS-detectable inthe brain (lipids found in the brain are generally tightly bound and exhibit very short T2relaxation times). Elevated lipids in the brain may reflect necrosis and cellularbreakdown products. These signals can also obscure the measurement of lactate.
Lactate (Lac) 1.3 The signal due to lactate, which actually consists of two closely spaced peaks called adoublet, is an indicator of anaerobic metabolism. Normal brain tissue typically containsvery low levels of lactate, and elevated lactate is usually an indicator of ischemia orhypoxia.
J.W. Ashford et al. / Imaging the Alzheimer Brain 17
not merely an exaggeration of those seen in normalaging. The method is a safe, noninvasive techniqueideal for longitudinal study, the essential design forcharacterizing aging and disease progression. Char-acterization of NAA, Cr, Cho, and mI, in particular,may provide a diagnostic tool, a monitor of diseaseprogression, and insight into mechanisms of treatmentresponse. Published data thus support the use of 1H-MRS as an important adjunct to the clinical evaluationand diagnosis of dementia. The value of 1H-MRS hasbeen especially noteworthy for monitoring disease pro-gression and identifying group effects for drug trials.However, the most valuable studies use MRS in con-junction with other imaging tools, such as structuralMRI, for tissue segmentation and volumetric analysis,fMRI, and diffusion tensor imaging (DTI), in order toprovide a multi-parametric assessment of brain tissuestructure, function, and integrity. With the increas-ing availability of high-field scanners, which yieldMRS studies with improved signal-to-noise ratios andincreased spectral separation, the role of 1H-MRS inthe study of aging and dementia is anticipated to growin the future.
8: Longitudinal Neuroimaging Measures:Windows into Progression of Diseaseand Potential Endpoints for ClinicalTrials (Edland)
Reiman et al., Alzheimer’s Prevention Initiative: APlan to Accelerate the Evaluation of Presymp-tomatic Treatments [33].
Ashford et al., MR Spectroscopy for Assessment ofMemantine Treatment in Mild to ModerateAlzheimer Dementia [179].
Forster et al., Effects of a 6-month cognitive interven-tion program on brain metabolism in amnestic MCIand mild Alzheimer’s disease [52].
Rosen et al., Cognitive-training changes hippocampalfunction in mild cognitive impairment: A pilot study[53].
Tzimopoulou et al., Validation and Pilot Application of[18F]FDG-PET in Evaluation of a Metabolic The-rapy for Alzheimer’s Disease (see: [88]).
Zhang et al., An MRI brain atrophy and lesion indexto assess the progression of structural changes inAlzheimer’s disease, mild cognitive impairment,and normal aging: A follow-up study [180].
Ard & Edland, Power Calculations for Clinical Trialsin Alzheimer’s Disease [181].
This section explores the application of longitudi-nal imaging measures to studies of aging, AD, and ADtreatments. Imaging allows highly focused assessmentof specific aspects of disease effects, and many imag-ing measures are remarkably precise relative to clinicalmeasures. For these reasons imaging measures holdgreat potential to characterize the natural history ofdisease and as endpoints for clinical trials. In the firstchapter of this Section, Reiman et al., [33] explore thepotential promise of imaging measures as endpoints forclinical trials and outline plans for large scale interven-tion trials. Feasibility is illustrated by four pilot clinicaltrials with novel interventions and imaging endpoints(Chapters 2 through 5). Ashford et al., [179] use mag-netic resonance spectroscopy to assess the impact ofmemantine on mild to moderate AD. Forster et al., [52]use FDG-PET and Rosen et al., [53] use fMRI to assessthe impact of cognitive interventions on brain functionin early AD. Tzimopoulou et al., (see: [88]) describea multicenter clinical trial using FDG-PET to assessthe impact of rosiglitazone on metabolism in AD. Thenext two chapters review additional imaging measures.Olichney et al., [142] (section 5) reviews accumulat-ing data on the response of event related brain potential(ERP) measurements to the progressive stages of AD,and Zhang et al., [180] describe the application of anMRI-based global atrophy and brain lesion index toAD. Finally, Ard and Edland [181] review statisticalconsiderations relevant to planning clinical trials withimaging endpoints, and summarize the potential dra-matic improvement in efficiency of clinical trial usingthose endpoints. Collectively, the chapters of this sec-tion suggest that longitudinal neuroimaging methodshold great promise to advance our understanding ofAD and discover treatments for modifying the courseof disease.
9: Vascular Co-morbidity and Alzheimer’sDisease (Black & Rosen)
Knopman & Roberts, Impact of Vascular Risk Factorson Brain Structure (see: [182])
Gao et al., Complexity of MRI white matter hyperin-tensity assessments in relation to cognition in agingand dementia [183].

18 J.W. Ashford et al. / Imaging the Alzheimer Brain
Bernardi et al., Late onset Alzheimer’s disease withcerebrovascular lesions as a distinctive phenotypeof the AßPP A713T Mutation in southern Italy (see:[184]).
Since the first description of dementia relatedto senile plaques and neurofibrillary changes byAlzheimer in 1907, there has been vacillation betweenthinking that most cognitive impairment in olderindividuals was related either to primary neurode-generative disease or vascular insults. In the lastfew decades, there has been development of criteriafor AD dementia and its underlying pathology andmulti-infarct/vascular dementia, with the recognitionthat many elders harbor both conditions. Accord-ingly, while AD and vascular dementia have long beenviewed as separate disorders, there is now a grow-ing appreciation that vascular insults are an importantcomorbidity that contributes to disability in AD. Fur-thermore, these comorbid disorders may attack thesame neural systems and synergize in disrupting cog-nitive functions.
Knopman & Roberts (see: [182]) describe vari-ous pathological processes that comprise the majorvascular risk factors and review how they relateto AD, including hypertension, diabetes, hyperc-holesterolemia, and obesity. They also comment onpopulation autopsy evidence suggesting that infarctsmay be additive to AD pathology and accelerate itsclinical expression as dementia. Quantifying ischemiclesions visible as hyperintensities on proton density/T2weighted or FLAIR MRI provides an important meansto study and understand, in vivo, the potential inde-pendent effects of covert infarcts in the deep nucleiand white matter lesions on cognition and expres-sion of dementia in AD. Gao et al. [183] comparethe sensitivity and utility of the major methods forquantifying these lesions. They test how well threeexpert rating scales, varying in complexity, comparedto the results of automated, volumetric quantificationin group classification of AD versus elderly controls,and in correlation to cognitive abilities. They find thescales to be highly correlated with each other and withthe volumetrics, but the most complex rating scaleand the continuous volumetric measures better pre-dict cognitive function in different domains. Finally,Bernardi et al., (see: [184]) describe a form of earlyonset, familial AD in which an amyloid-protein pre-cursor (Aß-PP A713T) genetic mutation is associatedwith strokes, cerebral amyloid angiopathy, and ADpathology. This is important as it hints at mecha-
nisms whereby AD and cerebrovascular disease mayinteract, as opposed to just being additive to eachother. This possible interaction may be occurring atthe level of the microvasculature with capillary oblit-eration by amyloid deposition and toxicity, causingischemia and oxidative stress that may further drive theamyloid cascade and tau hyperphosophorylation. Fur-thermore, periarteriolar deposition of A�-1-40, mayinterfere with amyloid clearance, now thought to bea major mechanism resulting in parenchymal amy-loid accumulation in sporadic AD. This deposition canlead to microbleeds and macrohemorrhages and alsoinfarction as described in the A713T mutation familyreported by Bernardi et al., (see: [184]), illustratingthat AD is under-recognized as a risk factor and directcause of stroke. The chapters in this section clearlydescribe some of key issues in the relationship betweenvascular and parenchymal disease in the context ofdementia and its relationship with brain degenerationin the elderly and particularly AD.
10: Neuroimaging in the Context ofAlzheimer’s Disease (Rosen & Kennedy)
Smith, Imaging in Alzheimer’s Disease and Its Pre-States (see: [185]).
Mak et al., Discriminating Alzheimer’s patients fromcognitively normal older adults based on hip-pocampal volumes - voxel-based morphometry withDARTEL and standard registration versus manualvolumetry (see: [186]).
Di Paola et al., Structural MRI investigation of neu-roanatomy of Corpus Callosum in Alzheimer’s Dis-ease and Mild Cognitive Impairment (see: [187]).
Kaufman et al., Using an Eye Movement Task to DetectFrontal Lobe Dysfunction in Alzheimer’s Disease(see: [188]).
Haller et al., Principles of classification analyses inmild cognitive impairment (MCI) and AlzheimerDisease [189].
Furney et al., Combinatorial markers of Mild Cogni-tive Impairment conversion to Alzheimer’s disease -cytokines and MRI measures together predictdisease progression [190].
The purpose of this section is to place the individ-ual neuroimaging techniques in the larger context ofhow they can relate to one another and to the care

J.W. Ashford et al. / Imaging the Alzheimer Brain 19
and evaluation of patients with AD. The first articleby Smith (see: [185]) in this section briefly summa-rizes the current status of the use of neuroimagingtechniques in the context of early diagnosis of AD.As with most technologies, within the next few yearsmany of the limitations we may admit to in this vol-ume will likely have been addressed. However, it isessential that anyone using these techniques be awareof these limitations and appropriate uses. One currentdirection of development is to automate quantifica-tion of pathology. There are substantial advances beingdirected to make imaging techniques previously uti-lized only in select labs available to anyone with acomputer and the resources to implement the analy-sis programs. Hippocampal volume decline is one ofthe most consistently reported imaging findings in ADso that a logical first approach in examining this pro-cess of using imaging in diagnostic decision makingis to use hippocampal volume to discriminate diagnos-tic status between two obviously different populations,AD versus normal elderly. As with many techniquesthat extend clinical work, Mak et al., [186] begin withan expert manually defining hippocampal volume asthe gold standard. They compare these results to someof the most commonly used, automated, approaches. Amore extensive comparison of hippocampal volumet-ric techniques is also described in Boccardi et al., [68]earlier in this supplement.
Another fruitful approach is to compare a givenstructure using different imaging modalities, and this isparticularly useful with respect to white matter regions.Di Paola et al., (see: [187]) review approaches todescribing the integrity of the corpus callosum, a struc-ture whose degeneration in AD is increasingly beingstudied, particularly in the context of vascular diseaseand AD [e.g., [191]]. The authors compare informa-tion from high resolution T1 images and diffusionmethods to study Wallerian degeneration. Walleriandegeneration, or anterograde degeneration, is a processthat occurs when an axon degenerates after damagedisconnects it from a cell body. The importance of con-nectivity between brain regions is a direction in whichthe field of neuroimaging is moving and this articlerelates connectivity to the degenerative process of AD.Section 6 discusses DTI more fully.
Whereas many investigators compare varioussources of clinical information with respect to diagnos-tic sensitivity and specificity, classification and supportvector machine learning offer a way of integratingexisting information to improve the accuracy of diag-nosis. This section finishes with two papers on these
techniques. The tutorial by Haller et al., [189] intro-duces classification in the context of discriminatingMCI from AD patients. The paper by Furney et al.,[190] provides an example of how this method can beapplied to predicting conversion of MCI to AD andincludes both CSF biomarkers and MRI.
The ultimate question a clinician needs to answeris how information from imaging can enhance clini-cal management. Neuroimaging of individual patientsin everyday clinical care will not be useful unlessit can improve what a clinician can do without it.Traditionally structural imaging and FDG-PET con-tribute to AD diagnosis by facilitating exclusion ofalternative etiologies. The Handbook and this sup-plement describe several instances where imaginginformation has the potential to provide convergentinformation supporting early diagnosis. Examples ofpotentially useful techniques include ligands for amy-loid and tau, pathognomonic patterns of FDG-PEThypometabolism (Section 3), and gross hippocampalvolume loss (Section 2). Looking to the near future, ofall the roles in clinical care, imaging is likely to havethe biggest impact on early diagnosis and will be mosthelpful when combined with other sources of converg-ing information [192, 193]. Early diagnosis has beenthe focus of most articles in this section. Classifica-tion techniques are a way of formalizing the process ofintegrating multiple sources of information includingbiomarkers, genetic risk, and other information. Ulti-mately the incremental value of early detection maybe less dependent on the accuracy and sensitivity thanwhether there is a change in care as a result of earlydetection (i.e., treatment or avoidance of risk) to makeit cost-effective.
Even when imaging data are not applied to the man-agement of individual patients, they have the potentialto assist in evaluating other components of care anddiagnosis. To the extent that imaging can more sensi-tively measure brain integrity than existing techniques,novel treatments may be discovered because beneficialeffects of treatments are not detectable with other meth-ods. For example Section 8 applies imaging to evaluatethe efficacy of pharmacologic and non-pharmacologictreatments. For investigators interested in conduct-ing clinical research the discussion by Ard & Edland[181] on power calculations will be extremely valu-able. Therefore, to the extent neuroimaging can serveto detect the effects of treatments in the developmentpipeline, such information can support early detec-tion of cost-effectiveness, and treatments will becomeavailable more quickly and efficiently.

20 J.W. Ashford et al. / Imaging the Alzheimer Brain
An alternative to using neuroimaging in diagnosisand evaluation of treatments is to assist in clinical deci-sions that limit the autonomy of patients in order toprotect them from harm; however, this is unlikely to befeasible any time soon. One good example of a likelycandidate for this use comes from the difficult clini-cal decision as to whether patients can manage theirown financial affairs. This capacity in MCI patientshas been related to angular gyrus volume, measured byMRI, a region previously demonstrated to be importantin math ability [194], and neuronal volume in the pos-terior cingulate cortex, measured by MRS [195]. Thisbrain-behavior association may someday be used in thecontext of an early warning such that patients with afaster rate of change in this region may need specialprotections and monitoring to avoid financial preda-tors who seek to exploit a developing vulnerability.In contrast, using neuroimaging to decide which MCIpatients should lose driving rights is problematic. Theprocesses and neural substrates of unsafe driving in ADare not well understood. Functional imaging studiesthat relate behavioral dysfunction to brain activationhave the potential to indicate which brain regionsunderlie driving deficits; however, assessing driving inthe MRI may not be comparable to assessing it in reallife. In the typical MRI environment patients cannottalk or move a driving wheel but instead respond withminimal movement by pressing buttons. Remember-ing response mapping (e.g., left hand is yes and righthand is no) creates a dual task for patients that distortsand increases the complexity of the process an imagerintends to study. The antisaccade task described byKaufman et al., [188] in this section is an example of atask which is simpler for patients and which can be usedas a measure of executive control. For example it is pos-sible to assess whether the patient moves their gaze ina manner that suggests appropriate attention to trafficand street signs without requiring an artificial responsemodality. This interface has only been possible in thepast few years due to innovations that made thesedevices MR compatible. Ultimately, however, therewould need to be strong data to suggest imaging pro-vided better prediction of driving safety than a road test.
The variety of neuroimaging techniques in allmodalities have great allure with respect to theirpotential to improve diagnosis and care, and anyonewho seeks to perform research with neuroimag-ing data has multiple new tools and resources tofacilitate this work. The Alzheimer’s Disease Neu-roimaging Initiative (ADNI) and affiliated initiatives(European and Japanese ADNI’s) have provided clin-
icians and imagers with acquisition protocols that arestandardized across sites. The benefit is that therecan be multi-site collaborations to increase statisticalpower and facilitate cross-site generalizability. Severalinvestigators in this book have benefited from theseinitiatives. Because neuroimaging data are large, com-plex, and diverse, there needs to be a broad arrayof tools available to analyze them. The Neuroimag-ing Informatics Tools and Resources Clearinghouse(http://www.nitrc.org/) is a site from NIH which makesavailable neuroimaging software packages from a vari-ety of modalities. This site contains reviews whichadvise all potential neuroimagers about the strengthsand limitations of different software packages. Forthose clinicians who do not have resources to acquiretheir own data, there are multiple publicly availabledatasets. The ADNI data have been made availableto researchers around the world and now there areMRI protocols for spectroscopy (Chapter 7), diffusiontensor imaging (Section 6), and arterial spin labeling(Austin et al., [86], Section 3) so this initiative is mov-ing with the speed of innovation. In addition there areneuropsychological and biomarker data so that imag-ing data can be interpreted in context. Ultimately theprospects for neuroimaging to enhance clinical care arebright as researchers collaborate and clinicians becomeinformed about innovations and advances.
REFERENCES
[1] Milan Sanchez M, Moghadam S, Naik P, Martin KJ, SalehiA (2011) Degeneration of Locus Coeruleus in Alzheimer’sDisease and Down Syndrome Basis for NorepinephrineTherapy. J Alzheimers Dis 26 supplement 3,
[2] Ott BR, Cohen RA, Gongvatana A, Okonkwo OC, Johan-son CE, Stopa EG, Donahue JE, Silverberg GD (2010)Alzheimer’s Disease Neuroimaging I Brain ventricular vol-ume and cerebrospinal fluid biomarkers of Alzheimer’sdisease. J Alzheimers Dis 20, 647-657.
[3] Alzheimer A (1907) Uber eine eigenartige Erkrankung derHirnrinde. Allgemeine Zeitschrift fur Psychiatrie 64, 146-148.
[4] Alzheimer A, Stelzmann RA, Schnitzlein HN, Murtagh FR(1995) An English translation of Alzheimer’s 1907 paper,“Uber eine eigenartige Erkankung der Hirnrinde”. Clin Anat8, 429-431.
[5] Blessed G, Tomlinson BE, Roth M (1968) The associationbetween quantitative measures of dementia and of senilechange in the cerebral grey matter of elderly subjects. Br JPsychiatry 114, 797-811.
[6] Ashford JW (2008) Screening for memory disorder, demen-tia, and Alzheimer’s disease. Aging Health 4, 399-432.
[7] Kuo TC, Zhao Y, Weir S, Kramer MS, Ash AS (2008) Impli-cations of comorbidity on costs for patients with Alzheimerdisease. Med Care 46, 839-846.
J.W. Ashford et al. / Imaging the Alzheimer Brain 21
[8] Zhao Y, Kuo TC, Weir S, Kramer MS, Ash AS (2008)Healthcare costs and utilization for Medicare beneficiarieswith Alzheimer’s. BMC Health Serv Re 8, 108.
[9] Aupperle PM (2006) Navigating patients and caregiversthrough the course of Alzheimer’s disease. J Clin Psychiatry67(Suppl 3), 8-14; quiz23.
[10] Geddes JW, Tekirian TL, Soultanian NS, Ashford JW, DavisDG, Markesbery WR (1997) Comparison of neuropatho-logic criteria for the diagnosis of Alzheimer’s disease.Neurobiol Aging 18, S99-S105.
[11] Stromer T, Serpell LC (2005) Structure and morphology ofthe Alzheimer’s amyloid fibril. Microsc Res Tech 67, 210-217.
[12] Perl DP (2000) Neuropathology of Alzheimer’s disease andrelated disorders. Neurol Clin 18, 847-864.
[13] Schochet SS Jr (1998) Neuropathology of aging. Neurol Clin16, 569-580.
[14] Ashford JW, Soultanian NS, Zhang SX, Geddes JW (1998)Neuropil threads are collinear with MAP2 immunostainingin neuronal dendrites of Alzheimer brain. J Neuropathol ExpNeurol 57, 972-978.
[15] Braak H, Braak E (1997) Frequency of stages of Alzheimer-related lesions in different age categories. Neurobiol Aging18, 351-357.
[16] Hardy J, Selkoe DJ (2002) The amyloid hypothesis ofAlzheimer’s disease: Progress and problems on the road totherapeutics. Science 297, 353-356.
[17] Snowdon DA, Kemper SJ, Mortimer JA, Greiner LH, Wek-stein DR, Markesbery WR (1996) Linguistic ability in earlylife and cognitive function and Alzheimer’s disease in latelife. Findings from the Nun Study. Jama 275, 528-532.
[18] Morris JC, Roe CM, Xiong C, Fagan AM, Goate AM,Holtzman DM, Mintun MA (2010) APOE predicts amyloid-beta but not tau Alzheimer pathology in cognitively normalaging. Ann Neurol 67, 122-131.
[19] Shaw P, Lerch JP, Pruessner JC, Taylor KN, Rose AB,Greenstein D, Clasen L, Evans A, Rapoport JL, Giedd JN(2007) Cortical morphology in children and adolescentswith different apolipoprotein E gene polymorphisms: Anobservational study. Lancet Neurol 6, 494-500.
[20] Sperling RA, Aisen PS, Beckett LA, Bennett DA, Craft S,Fagan AM, Iwatsubo T, Jack CR Jr, Kaye J, Montine TJ, ParkDC, Reiman EM, Rowe CC, Siemers E, Stern Y, Yaffe K,Carrillo MC, Thies B, Morrison-Bogorad M, Wagster MV,Phelps CH (2011) Toward defining the preclinical stages ofAlzheimer’s disease: Recommendations from the NationalInstitute on Aging-Alzheimer’s Association workgroups ondiagnostic guidelines for Alzheimer’s disease. AlzheimersDement 7, 280-292.
[21] Albert MS, Dekosky ST, Dickson D, Dubois B, FeldmanHH, Fox NC, Gamst A, Holtzman DM, Jagust WJ, PetersenRC, Snyder PJ, Carrillo MC, Thies B, Phelps CH (2011) Thediagnosis of mild cognitive impairment due to Alzheimer’sdisease: Recommendations from the National Institute onAging-Alzheimer’s Association workgroups on diagnosticguidelines for Alzheimer’s disease. Alzheimers Dement 7,270-279.
[22] McKhann GM, Knopman DS, Chertkow H, Hyman BT,Jack CR Jr, Kawas CH, Klunk WE, Koroshetz WJ, ManlyJJ, Mayeux R, Mohs RC, Morris JC, Rossor MN, Schel-tens P, Carrillo MC, Thies B, Weintraub S, Phelps CH(2011) The diagnosis of dementia due to Alzheimer’s dis-ease: Recommendations from the National Institute onAging-Alzheimer’s Association workgroups on diagnostic
guidelines for Alzheimer’s disease. Alzheimers Dement 7,263-269.
[23] Jack CR Jr, Albert MS, Knopman DS, McKhann GM,Sperling RA, Carrillo MC, Thies B, Phelps CH (2011) Intro-duction to the recommendations from the National Instituteon Aging-Alzheimer’s Association workgroups on diagnos-tic guidelines for Alzheimer’s disease. Alzheimers Dement7, 257-262.
[24] Ashford JW, Schmitt FA (2001) Modeling the time-courseof Alzheimer dementia. Curr Psychiatry Rep 3, 20-28.
[25] Ashford J (2004) APOE genotype effects on Alzheimer’sdisease onset and epidemiology. Journal of Molecular Neu-roscience 23, 155-163.
[26] Raber J, Huang Y, Ashford JW (2004) ApoE genotypeaccounts for the vast majority of AD risk and AD pathology.Neurobiol Aging 25, 641-650.
[27] Butler SM, Ashford JW, Snowdon DA (1996) Age, educa-tion, and changes in the Mini-Mental State Exam scores ofolder women: Findings from the Nun Study. J Am GeriatrSoc 44, 675-681.
[28] Brun A, Englund E (1981) Regional pattern of degenerationin Alzheimer’s disease: Neuronal loss and histopathologicalgrading. Histopathology 5, 549-564.
[29] Ashford JW, Shih WJ, Coupal J, Shetty R, Schneider A, CoolC, Aleem A, Kiefer VH, Mendiondo MS, Schmitt FA (2000)Single SPECT measures of cerebral cortical perfusion reflecttime-index estimation of dementia severity in Alzheimer’sdisease. J Nucl Med 41, 57-64.
[30] Small GW, Kepe V, Ercoli LM, Siddarth P, BookheimerSY, Miller KJ, Lavretsky H, Burggren AC, Cole GM,Vinters HV, Thompson PM, Huang SC, Satyamurthy N,Phelps ME, Barrio JR (2006) PET of brain amyloid andtau in mild cognitive impairment. N Engl J Med 355, 2652-2663.
[31] Reiman EM, Caselli RJ, Yun LS, Chen K, Bandy D,Minoshima S, Thibodeau SN, Osborne D (1996) Preclinicalevidence of Alzheimer’s disease in persons homozygous forthe epsilon 4 allele for apolipoprotein E. N Engl J Med 334,752-758.
[32] Shin J, Kepe V, Barrio JR, SG W (2011) The Merits ofFDDNP-PET Imaging in Alzheimer’s Disease. J AlzheimersDis 26 supplement 3, 135-145.
[33] Reiman EM, Langbaum J, Fleisher AS, Caselli RJ, ChenK, Ayutyanont N, Quiroz YT, Kosik KS, Lopera F, Tar-iot PN (2011) Alzheimer’s prevention initiative: A plan toaccelerate the evaluation of presymptomatic treatments. JAlzheimers Dis 26 supplement 3, 321-329.
[34] Furst AJ, Rabinovici GD, Rostomian AH, Steed T, Alka-lay A, Racine C, Miller BL, Jagust WJ (2010) Cognition,glucose metabolism and amyloid burden in Alzheimer’s dis-ease. Neurobiol Aging Apr 22 [Epub ahead of print].
[35] Ashford JW, Coburn KL, Fuster JM (1998) Functional Cog-nitive Networks in Primates In. Fundamentals of NeuralNetworks: Neuropsychology and Cognitive Neuroscience,Parks RW, Levine DS, eds. The MIT Press Cambridge,Mass.
[36] Scheff SW, Price DA, Schmitt FA, Scheff MA, Mufson EJ(2011) Synaptic loss in the inferior temporal gyrus in mildcognitive impairment and Alzheimer’s disease. J AlzheimersDis 24, 547-557.
[37] Whitehouse PJ, Price DL, Struble RG, Clark AW, Coyle JT,Delon MR (1982) Alzheimer’s disease and senile dementia:Loss of neurons in the basal forebrain. Science 215, 1237-1239.
22 J.W. Ashford et al. / Imaging the Alzheimer Brain
[38] Struble RG, Cork LC, Whitehouse PJ, Price DL (1982)Cholinergic innervation in neuritic plaques. Science 216,413-415.
[39] Tinklenberg JR, Kraemer HC, Yaffe K, Ross L, SheikhJ, Ashford JW, Yesavage JA, Taylor JL (2007) Donepeziltreatment and Alzheimer disease: Can the results of random-ized clinical trials be applied to Alzheimer disease patientsin clinical practice? Am J Geriatr Psychiatry 15, 953-960.
[40] Grinberg LT, Rub U, Ferretti RE, Nitrini R, Farfel JM,Polichiso L, Gierga K, Jacob-Filho W, Heinsen H (2009)The dorsal raphe nucleus shows phospho-tau neurofibrillarychanges before the transentorhinal region in Alzheimer’sdisease. A precocious onset? Neuropathol Appl Neurobiol35, 406-416.
[41] Ashford JW, Jarvik L (1985) Alzheimer’s disease: Doesneuron plasticity predispose to axonal neurofibrillary degen-eration? N Engl J Med 313, 388-389.
[42] Teter B, Ashford JW (2002) Neuroplasticity in Alzheimer’sdisease. J Neurosci Res 70, 402-437.
[43] Babiloni C, Pievani M, Vecchio F, Geroldi C, Eusebi F,Fracassi C, Fletcher E, De Carli C, Boccardi M, Rossini PM,Frisoni GB (2009) White-matter lesions along the choliner-gic tracts are related to cortical sources of EEG rhythms inamnesic mild cognitive impairment. Hum Brain Mapp 30,1431-1443.
[44] Babiloni C, Vecchio F, Lizio R, Ferri R, Rodriguez G,Marzano N, Frisoni GB, Rossin PM (2011) Resting state cor-tical rhythms in mild cognitive impairment and Alzheimer’sdisease: Electroencephalographic evidence. J AlzheimersDis 26 supplement 3, 201-214.
[45] Salehi A, Dubelaar EJ, Mulder M, Swaab DF (1998) Aggra-vated decrease in the activity of nucleus basalis neuronsin Alzheimer’s disease is apolipoprotein E-type dependent.Proc Natl Acad Sci U S A 95, 11445-11449.
[46] Silverman DH, Small GW, Chang CY, Lu CS, Kung DeAburto MA, Chen W, Czernin J, Rapoport SI, Pietrini P,Alexander GE, Schapiro MB, Jagust WJ, Hoffman JM,Welsh-Bohmer KA, Alavi A, Clark CM, Salmon E, de LeonMJ, Mielke R, Cummings JL, Kowell AP, Gambhir SS,Hoh CK, Phelps ME (2001) Positron emission tomographyin evaluation of dementia: Regional brain metabolism andlong-term outcome. Jama 286, 2120-2127.
[47] Tezapsidis N, Johnston JM, Smith MA, Ashford JW,Casadesus G, Robakis NK, Wolozin B, Perry G, Zhu X,Greco SJ, Sarkar S (2009) Leptin: A novel therapeutic strat-egy for Alzheimer’s disease. J Alzheimers Dis 16, 731-740.
[48] McKee AC, Cantu RC, Nowinski CJ, Hedley-Whyte ET,Gavett BE, Budson AE, Santini VE, Lee HS, Kubilus CA,Stern RA (2009) Chronic traumatic encephalopathy in ath-letes: Progressive tauopathy after repetitive head injury. JNeuropathol Exp Neurol 68, 709-735.
[49] Yaffe K, Vittinghoff E, Lindquist K, Barnes D, CovinskyKE, Neylan T, Kluse M, Marmar C (2010) Posttraumaticstress disorder and risk of dementia among US veterans.Arch Gen Psychiatry 67, 608-613.
[50] Hoge CW, McGurk D, Thomas JL, Cox AL, Engel CC, Cas-tro CA (2008) Mild traumatic brain injury in U.S. Soldiersreturning from Iraq. N Engl J Med 358, 453-463.
[51] Schneiderman AI, Braver ER, Kang HK (2008) Under-standing sequelae of injury mechanisms and mild traumaticbrain injury incurred during the conflicts in Iraq andAfghanistan: Persistent postconcussive symptoms and post-traumatic stress disorder. Am J Epidemiol 167, 1446-1452.
[52] Forster S, Buschert VC, Teipel SJ, Friese U, Buchholz H-G,Drzezga A, Hampel H, Bartenstein P, Buerger K (2011)Effects of a 6-month cognitive intervention program on brainmetabolism in amnestic MCI and mild Alzheimer’s disease.J Alzheimers Dis 26 supplement 3, 337-348.
[53] Rosen AC, Sugiura L, Kramer JH, Whitfield-Gabrieli S,Gabrieli JD (2011) Cognitive-training changes hippocam-pal function in mild cognitive impairment: A pilot study. JAlzheimers Dis 26 supplement 3, 349-357.
[54] Kim S, Swaminathan S, Shen L, Risacher SL, Nho K, ForoudT, Shaw LM, Trojanowski JQ, Potkin SG, Huentelman MJ,Craig DW, DeChairo BM, Aisen PS, Petersen RC, WeinerMW, Saykin AJ (2011) Genome-wide association studyof CSF biomarkers Abeta1-42, t-tau, and p-tau181p in theADNI cohort. Neurology 76, 69-79.
[55] Parihar MS, Brewer GJ (2010) Amyloid-beta as a modulatorof synaptic plasticity. J Alzheimers Dis 22, 741-763.
[56] Struble RG, Ala T, Patrylo PR, Brewer GJ, Yan XX (2010)Is brain amyloid production a cause or a result of dementiaof the Alzheimer’s type? J Alzheimers Dis 22, 393-399.
[57] Ashford JW (2002) ApoE4: Is it the absence of good or thepresence of bad? J Alzheimers Dis 4, 141-143.
[58] Oddo S, Billings L, Kesslak JP, Cribbs DH, LaFerla FM(2004) Abeta immunotherapy leads to clearance of early,but not late, hyperphosphorylated tau aggregates via theproteasome. Neuron 43, 321-332.
[59] Roberson ED, Halabisky B, Yoo JW, Yao J, Chin J, YanF, Wu T, Hamto P, Devidze N, Yu GQ, Palop JJ, NoebelsJL, Mucke L Amyloid-beta/Fyn-induced synaptic, network,and cognitive impairments depend on tau levels in multiplemouse models of Alzheimer’s disease. J Neurosci 31, 700-711.
[60] Roses AD (2011) An inherited variable poly-T repeat geno-type in TOMM40 in Alzheimer disease. Arch Neurol 67,536-541.
[61] Jack CR Jr, Knopman DS, Jagust WJ, Shaw LM, Aisen PS,Weiner MW, Petersen RC, Trojanowski JQ (2010) Hypo-thetical model of dynamic biomarkers of the Alzheimer’spathological cascade. Lancet Neurol 9, 119-128.
[62] Dos Santos V, Thomann PA, Wustenberg T, Seidl U, EssigM, Schroder J (2011) Morphological cerebral correlates ofCERAD test performance in mild cognitive impairment andAlzheimer’s disease. J Alzheimers Dis 23, 411-420.
[63] Lehmann M, Rohrer JD, Clarkson MJ, Ridgway GR, ScahillRI, Modat M, Warren JD, Ourselin S, Barnes J, Rossor MN,Fox NC (2010) Reduced cortical thickness in the posteriorcingulate gyrus is characteristic of both typical and atypicalAlzheimer’s disease. J Alzheimers Dis 20, 587-598.
[64] Thomann PA, Dos Santos V, Seidl U, Toro P, Essig M,Schroder J (2009) MRI-derived atrophy of the olfactorybulb and tract in mild cognitive impairment and Alzheimer’sdisease. J Alzheimers Dis 17, 213-221.
[65] Fennema-Notestine C, Panizzon MS, Thompson WR, ChenC-H, Eyler LT, Fischl B, Franz CE, Grant MD, Jak AJ,Jernigan TL, Lyons MJ, Neale MC, Seidman LJ, TsuangMT, Xian H, Dale AM, Kremen WS (2011) Presence ofApoE epsilon4 allele associated with thinner frontal cortexin middle age. J Alzheimers Dis 26 supplement 3, 49-60.
[66] Firbank MJ, Blamire AM, Teodorczuk A, Teper E, BurtonEJ, Mitra D, O’Brien JT (2010) High resolution imaging ofthe medial temporal lobe in Alzheimer’s disease and demen-tia with Lewy bodies. J Alzheimers Dis 21, 1129-1140.
[67] Oliveira PP Jr, Nitrini R, Busatto G, Buchpiguel C, SatoJR, Amaro E, Jr (2010) Use of SVM methods with surface-
J.W. Ashford et al. / Imaging the Alzheimer Brain 23
based cortical and volumetric subcortical measurements todetect Alzheimer’s disease. J Alzheimers Dis 19, 1263-1272.
[68] Boccardi M, Ganzola R, Bocchetta M, Pievani M, RedolfiA, Bartzokis G, Camicioli R, Csernansky JG, de LeonMJ, deToledo-Morrell L, Killiany RJ, Lehericy S, Pantel J,Pruessner JC, Soininen H, Watson C, Duchesne S, Jack CRJ,Frisoni GB (2011) Survey of protocols for the manual seg-mentation of the hippocampus: Preparatory steps towards ajoint EADC-ADNI harmonized protocol. J Alzheimers Dis26 supplement 3, 61-75.
[69] Tosun D, Schuff N, Shaw LM, Trojanowski JQ, WeinerMW (2011) Initiative AsDN. Relationship between CSFbiomarkers of Alzheimer’s disease and rates of regional cor-tical thinning in ADNI data. J Alzheimers Dis 26 supplement3, 77-90.
[70] Brys M, Glodzik L, Mosconi L, Switalski R, De SantiS, Pirraglia E, Rich K, Kim BC, Mehta P, Zinkowski R,Pratico D, Wallin A, Zetterberg H, Tsui WH, Rusinek H,Blennow K, de Leon MJ (2009) Magnetic resonance imag-ing improves cerebrospinal fluid biomarkers in the earlydetection of Alzheimer’s disease. J Alzheimers Dis 16, 351-362.
[71] Kerchner GA (2011) Ultra-high field 7T MRI: A new toolfor studying Alzheimer’s disease. J Alzheimers Dis 26 sup-plement 3, 91-95.
[72] Bobinski M, de Leon MJ, Wegiel J, Desanti S, Convit A,Saint Louis LA, Rusinek H, Wisniewski HM (2000) Thehistological validation of post mortem magnetic resonanceimaging-determined hippocampal volume in Alzheimer’sdisease. Neuroscience 95, 721-725.
[73] Fox NC, Scahill RI, Crum WR, Rossor MN (1999) Corre-lation between rates of brain atrophy and cognitive declinein AD. Neurology 52, 1687-1689.
[74] Jack CR Jr, Dickson DW, Parisi JE, Xu YC, Cha RH,O’Brien PC, Edland SD, Smith GE, Boeve BF, Tangalos EG,Kokmen E, Petersen RC (2002) Antemortem MRI findingscorrelate with hippocampal neuropathology in typical agingand dementia. Neurology 58, 750-757.
[75] Silbert LC, Quinn JF, Moore MM, Corbridge E, Ball MJ,Murdoch G, Sexton G, Kaye JA (2003) Changes in pre-morbid brain volume predict Alzheimer’s disease pathology.Neurology 61, 487-492.
[76] Braak H, Braak E (1991) Neuropathological stageing ofAlzheimer-related changes. Acta Neuropathol 82, 239-259.
[77] Whitwell JL, Josephs KA, Murray ME, Kantarci K, Przy-belski SA, Weigand SD, Vemuri P, Senjem ML, ParisiJE, Knopman DS, Boeve BF, Petersen RC, Dickson DW,Jack CR Jr (2008) MRI correlates of neurofibrillary tanglepathology at autopsy: A voxel-based morphometry study.Neurology 71, 743-749.
[78] Weih M, Degirmenci U, Kreil S, Suttner G, Schmidt D,Kornhuber J, Lewczuk P, Kuwert T (2011) Nuclear medicinediagnostic techniques in the era of pathophysiology-basedCSF biomarkers for Alzheimer’s disease. J Alzheimers Dis26 supplement 3, 97-103.
[79] Sedaghat F, Dedousi E, Baloyannis I, Tegos T, Costa V, Dim-itriadis AS, Baloyannis SJ (2010) Brain SPECT findings ofanosognosia in Alzheimer’s disease. J Alzheimers Dis 21,641-647.
[80] Alegret M, Vinyes-Junque G, Boada M, Martinez-Lage P,Cuberas G, Espinosa A, Roca I, Hernandez I, Valero S,Rosende-Roca M, Mauleon A, Becker And JT, Tarraga L
(2010) Brain perfusion correlates of visuoperceptual deficitsin mild cognitive impairment and mild Alzheimer’s disease.J Alzheimers Dis 21, 557-567.
[81] Bastin C, Kerrouche N, Lekeu F, Adam S, Guillaume B,Lemaire C, Aerts J, d’Ydewalle G, Collette F, SalmonE (2010) Controlled memory processes in questionableAlzheimer’s disease: A view from neuroimaging research.J Alzheimers Dis 20, 547-560.
[82] Nobili F, De Carli F, Frisoni GB, Portet F, Verhey F,Rodriguez G, Caroli A, Touchon J, Morbelli S, Guerra UP,Dessi B, Brugnolo A, Visser PJ (2009) SPECT predictors ofcognitive decline and Alzheimer’s disease in mild cognitiveimpairment. J Alzheimers Dis 17, 761-772.
[83] Mosconi L, Berti V, Glodzik L, Pupi A, De Santi S, deLeon MJ (2010) Pre-clinical detection of Alzheimer’s dis-ease using FDG-PET, with or without amyloid imaging. JAlzheimers Dis 20, 843-854.
[84] Furst AJ, Lal RA (2011) Amyloid-ß and glucose metabolismin Alzheimer’s disease. J Alzheimers Dis 26 supplement 3,105-116.
[85] Barthel H, Sabri O (2011) Florbetaben to trace beta-amyloidin the Alzheimer brain by means of PET. J Alzheimers Dis26 supplement 3, 117-121.
[86] Austin BP, Nair VA, Meier TB, Xu G, Rowley HA, Carls-son CM, Johnson SC, Prabhakaran V (2011) Effects ofhypoperfusion in Alzheimer’s disease. J Alzheimers Dis 26supplement 3, 123-133.
[87] Jensen JR, Cisek K, Funk KE, Naphade S, Schafer KN,Kuret J (2011) Research towards tau imaging. J AlzheimersDis 26 supplement 3, 147-157.
[88] Tzimopoulou S, Cunningham VJ, Nichols TE, Searle G,Bird NP, Mistry P, Dixon IJ, Hallett WA, Whitcher B,Brown AP, Zvartau-Hind M, Lotay N, Lai RY, CastigliaM, Jeter B, Matthews JC, Chen K, Bandy D, ReimanEM, Gold M, Rabiner EA, Matthews PM (2010) A multi-center randomized proof-of-concept clinical trial applying[(1)F]FDG-PET for evaluation of metabolic therapy withrosiglitazone XR in mild to moderate Alzheimer’s disease.J Alzheimers Dis 22, 1241-1256.
[89] Sala-Llonch R, Bosch B, Arenaza-Urquijo EM, Rami L,Bargallo N, Junque C, Molinuevo JL, Bartres-Faz D (2010)Greater default-mode network abnormalities compared tohigh order visual processing systems in amnestic mild cog-nitive impairment: An integrated multi-modal MRI study. JAlzheimers Dis 22, 523-539.
[90] Bokde AL, Karmann M, Born C, Teipel SJ, Omerovic M,Ewers M, Frodl T, Meisenzahl E, Reiser M, Moller HJ,Hampel H (2010) Altered brain activation during a ver-bal working memory task in subjects with amnestic mildcognitive impairment. J Alzheimers Dis 21, 103-118.
[91] Drago V, Babiloni C, Bartres-Faz D, Caroli A, Bosch B,Hensch T, Didic M, Klafki H-W, Pievani M, Jovicich J,Venturi L, Spitzer P, Vecchio F, Schoenknecht P, Wilt-fang J, Redolfi A, Forloni G, Blin O, Irving E, Davis C,Hardemark H-g, B. FG (2011) Disease Tracking Markersfor Alzheimer’s Disease at the Prodromal (MCI) Stage. JAlzheimers Dis 26 supplement 3, 159-199.
[92] Eichenbaum H (2000) A cortical-hippocampal system fordeclarative memory. Nat Rev Neurosci 1, 41-50.
[93] Schacter DL, Wagner AD (1999) Medial temporal lobe acti-vations in fMRI and PET studies of episodic encoding andretrieval. Hippocampus 9, 7-24.
[94] Squire LR, Stark CE, Clark RE (2004) The medial temporallobe. Annu Rev Neurosci 27, 279-306.
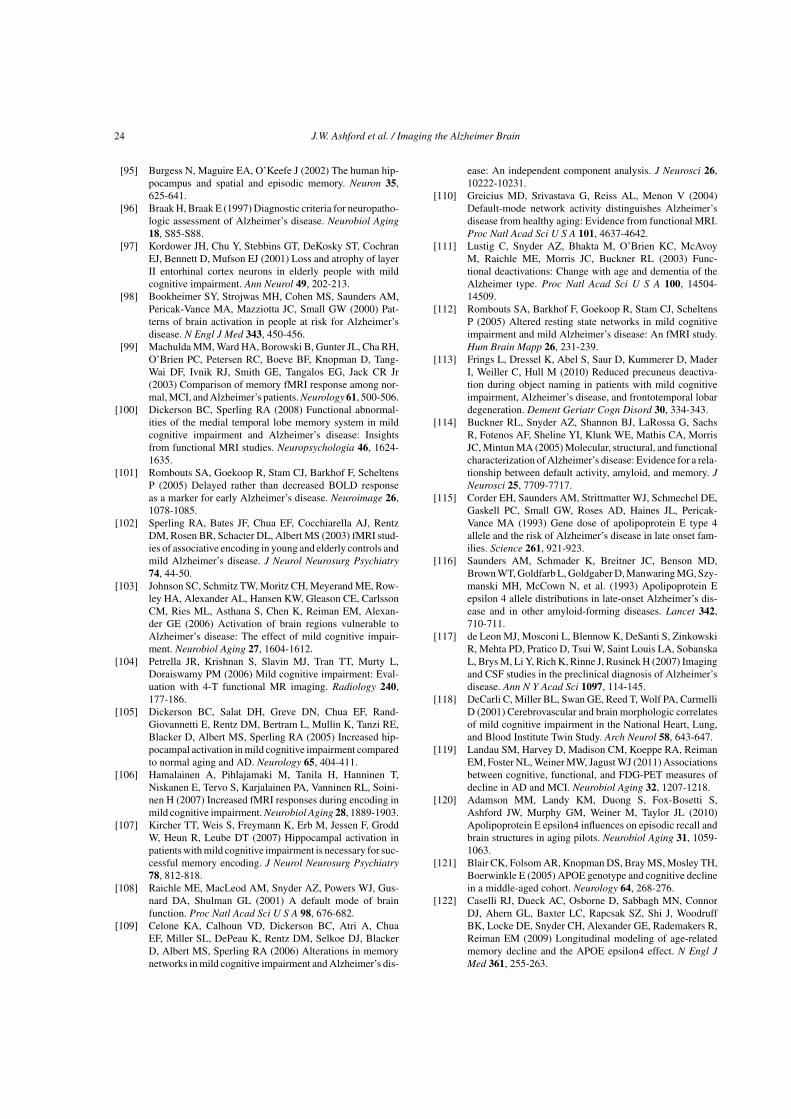
24 J.W. Ashford et al. / Imaging the Alzheimer Brain
[95] Burgess N, Maguire EA, O’Keefe J (2002) The human hip-pocampus and spatial and episodic memory. Neuron 35,625-641.
[96] Braak H, Braak E (1997) Diagnostic criteria for neuropatho-logic assessment of Alzheimer’s disease. Neurobiol Aging18, S85-S88.
[97] Kordower JH, Chu Y, Stebbins GT, DeKosky ST, CochranEJ, Bennett D, Mufson EJ (2001) Loss and atrophy of layerII entorhinal cortex neurons in elderly people with mildcognitive impairment. Ann Neurol 49, 202-213.
[98] Bookheimer SY, Strojwas MH, Cohen MS, Saunders AM,Pericak-Vance MA, Mazziotta JC, Small GW (2000) Pat-terns of brain activation in people at risk for Alzheimer’sdisease. N Engl J Med 343, 450-456.
[99] Machulda MM, Ward HA, Borowski B, Gunter JL, Cha RH,O’Brien PC, Petersen RC, Boeve BF, Knopman D, Tang-Wai DF, Ivnik RJ, Smith GE, Tangalos EG, Jack CR Jr(2003) Comparison of memory fMRI response among nor-mal, MCI, and Alzheimer’s patients. Neurology 61, 500-506.
[100] Dickerson BC, Sperling RA (2008) Functional abnormal-ities of the medial temporal lobe memory system in mildcognitive impairment and Alzheimer’s disease: Insightsfrom functional MRI studies. Neuropsychologia 46, 1624-1635.
[101] Rombouts SA, Goekoop R, Stam CJ, Barkhof F, ScheltensP (2005) Delayed rather than decreased BOLD responseas a marker for early Alzheimer’s disease. Neuroimage 26,1078-1085.
[102] Sperling RA, Bates JF, Chua EF, Cocchiarella AJ, RentzDM, Rosen BR, Schacter DL, Albert MS (2003) fMRI stud-ies of associative encoding in young and elderly controls andmild Alzheimer’s disease. J Neurol Neurosurg Psychiatry74, 44-50.
[103] Johnson SC, Schmitz TW, Moritz CH, Meyerand ME, Row-ley HA, Alexander AL, Hansen KW, Gleason CE, CarlssonCM, Ries ML, Asthana S, Chen K, Reiman EM, Alexan-der GE (2006) Activation of brain regions vulnerable toAlzheimer’s disease: The effect of mild cognitive impair-ment. Neurobiol Aging 27, 1604-1612.
[104] Petrella JR, Krishnan S, Slavin MJ, Tran TT, Murty L,Doraiswamy PM (2006) Mild cognitive impairment: Eval-uation with 4-T functional MR imaging. Radiology 240,177-186.
[105] Dickerson BC, Salat DH, Greve DN, Chua EF, Rand-Giovannetti E, Rentz DM, Bertram L, Mullin K, Tanzi RE,Blacker D, Albert MS, Sperling RA (2005) Increased hip-pocampal activation in mild cognitive impairment comparedto normal aging and AD. Neurology 65, 404-411.
[106] Hamalainen A, Pihlajamaki M, Tanila H, Hanninen T,Niskanen E, Tervo S, Karjalainen PA, Vanninen RL, Soini-nen H (2007) Increased fMRI responses during encoding inmild cognitive impairment. Neurobiol Aging 28, 1889-1903.
[107] Kircher TT, Weis S, Freymann K, Erb M, Jessen F, GroddW, Heun R, Leube DT (2007) Hippocampal activation inpatients with mild cognitive impairment is necessary for suc-cessful memory encoding. J Neurol Neurosurg Psychiatry78, 812-818.
[108] Raichle ME, MacLeod AM, Snyder AZ, Powers WJ, Gus-nard DA, Shulman GL (2001) A default mode of brainfunction. Proc Natl Acad Sci U S A 98, 676-682.
[109] Celone KA, Calhoun VD, Dickerson BC, Atri A, ChuaEF, Miller SL, DePeau K, Rentz DM, Selkoe DJ, BlackerD, Albert MS, Sperling RA (2006) Alterations in memorynetworks in mild cognitive impairment and Alzheimer’s dis-
ease: An independent component analysis. J Neurosci 26,10222-10231.
[110] Greicius MD, Srivastava G, Reiss AL, Menon V (2004)Default-mode network activity distinguishes Alzheimer’sdisease from healthy aging: Evidence from functional MRI.Proc Natl Acad Sci U S A 101, 4637-4642.
[111] Lustig C, Snyder AZ, Bhakta M, O’Brien KC, McAvoyM, Raichle ME, Morris JC, Buckner RL (2003) Func-tional deactivations: Change with age and dementia of theAlzheimer type. Proc Natl Acad Sci U S A 100, 14504-14509.
[112] Rombouts SA, Barkhof F, Goekoop R, Stam CJ, ScheltensP (2005) Altered resting state networks in mild cognitiveimpairment and mild Alzheimer’s disease: An fMRI study.Hum Brain Mapp 26, 231-239.
[113] Frings L, Dressel K, Abel S, Saur D, Kummerer D, MaderI, Weiller C, Hull M (2010) Reduced precuneus deactiva-tion during object naming in patients with mild cognitiveimpairment, Alzheimer’s disease, and frontotemporal lobardegeneration. Dement Geriatr Cogn Disord 30, 334-343.
[114] Buckner RL, Snyder AZ, Shannon BJ, LaRossa G, SachsR, Fotenos AF, Sheline YI, Klunk WE, Mathis CA, MorrisJC, Mintun MA (2005) Molecular, structural, and functionalcharacterization of Alzheimer’s disease: Evidence for a rela-tionship between default activity, amyloid, and memory. JNeurosci 25, 7709-7717.
[115] Corder EH, Saunders AM, Strittmatter WJ, Schmechel DE,Gaskell PC, Small GW, Roses AD, Haines JL, Pericak-Vance MA (1993) Gene dose of apolipoprotein E type 4allele and the risk of Alzheimer’s disease in late onset fam-ilies. Science 261, 921-923.
[116] Saunders AM, Schmader K, Breitner JC, Benson MD,Brown WT, Goldfarb L, Goldgaber D, Manwaring MG, Szy-manski MH, McCown N, et al. (1993) Apolipoprotein Eepsilon 4 allele distributions in late-onset Alzheimer’s dis-ease and in other amyloid-forming diseases. Lancet 342,710-711.
[117] de Leon MJ, Mosconi L, Blennow K, DeSanti S, ZinkowskiR, Mehta PD, Pratico D, Tsui W, Saint Louis LA, SobanskaL, Brys M, Li Y, Rich K, Rinne J, Rusinek H (2007) Imagingand CSF studies in the preclinical diagnosis of Alzheimer’sdisease. Ann N Y Acad Sci 1097, 114-145.
[118] DeCarli C, Miller BL, Swan GE, Reed T, Wolf PA, CarmelliD (2001) Cerebrovascular and brain morphologic correlatesof mild cognitive impairment in the National Heart, Lung,and Blood Institute Twin Study. Arch Neurol 58, 643-647.
[119] Landau SM, Harvey D, Madison CM, Koeppe RA, ReimanEM, Foster NL, Weiner MW, Jagust WJ (2011) Associationsbetween cognitive, functional, and FDG-PET measures ofdecline in AD and MCI. Neurobiol Aging 32, 1207-1218.
[120] Adamson MM, Landy KM, Duong S, Fox-Bosetti S,Ashford JW, Murphy GM, Weiner M, Taylor JL (2010)Apolipoprotein E epsilon4 influences on episodic recall andbrain structures in aging pilots. Neurobiol Aging 31, 1059-1063.
[121] Blair CK, Folsom AR, Knopman DS, Bray MS, Mosley TH,Boerwinkle E (2005) APOE genotype and cognitive declinein a middle-aged cohort. Neurology 64, 268-276.
[122] Caselli RJ, Dueck AC, Osborne D, Sabbagh MN, ConnorDJ, Ahern GL, Baxter LC, Rapcsak SZ, Shi J, WoodruffBK, Locke DE, Snyder CH, Alexander GE, Rademakers R,Reiman EM (2009) Longitudinal modeling of age-relatedmemory decline and the APOE epsilon4 effect. N Engl JMed 361, 255-263.
J.W. Ashford et al. / Imaging the Alzheimer Brain 25
[123] Kozauer NA, Mielke MM, Chan GK, Rebok GW, LyketsosCG (2008) Apolipoprotein E genotype and lifetime cogni-tive decline. Int Psychogeriatr 20, 109-123.
[124] Small BJ, Rosnick CB, Fratiglioni L, Backman L (2004)Apolipoprotein E and cognitive performance: A meta-analysis. Psychol Aging 19, 592-600.
[125] Trachtenberg AJ, Filippini N, Mackay CE (2010) The effectsof APOE-epsilon4 on the BOLD response. Neurobiol AgingApr 19 [Epub ahead of print].
[126] Fleisher A, Grundman M, Jack CR Jr, Petersen RC, Taylor C,Kim HT, Schiller DH, Bagwell V, Sencakova D, Weiner MF,DeCarli C, DeKosky ST, van Dyck CH, Thal LJ (2005) Sex,apolipoprotein E epsilon 4 status, and hippocampal volumein mild cognitive impairment. Arch Neurol 62, 953-957.
[127] Han SD, Houston WS, Jak AJ, Eyler LT, Nagel BJ, FleisherAS, Brown GG, Corey-Bloom J, Salmon DP, Thal LJ, BondiMW (2007) Verbal paired-associate learning by APOEgenotype in non-demented older adults: fMRI evidence of aright hemispheric compensatory response. Neurobiol Aging28, 238-247.
[128] Borghesani PR, Johnson LC, Shelton AL, Peskind ER, Ayl-ward EH, Schellenberg GD, Cherrier MM (2008) Alteredmedial temporal lobe responses during visuospatial encod-ing in healthy APOE*4 carriers. Neurobiol Aging 29,981-991.
[129] Lind J, Larsson A, Persson J, Ingvar M, Nilsson LG, Back-man L, Adolfsson R, Cruts M, Sleegers K, Van BroeckhovenC, Nyberg L (2006) Reduced hippocampal volume in non-demented carriers of the apolipoprotein E epsilon4: Relationto chronological age and recognition memory. Neurosci Lett396, 23-27.
[130] Bassett SS, Yousem DM, Cristinzio C, Kusevic I, Yassa MA,Caffo BS, Zeger SL (2006) Familial risk for Alzheimer’sdisease alters fMRI activation patterns. Brain 129, 1229-1239.
[131] Adamson MM, Hutchinson JB, Shelton AL, Wagner AD,Taylor JL (2011) Reduced hippocampal activity duringencoding in cognitively normal adults carrying the APOEvarepsilon4 allele. Neuropsychologia 49, 2448-2455.
[132] Fleisher AS, Sherzai A, Taylor C, Langbaum JB, ChenK, Buxton RB (2009) Resting-state BOLD networksversus task-associated functional MRI for distinguishingAlzheimer’s disease risk groups. Neuroimage 47, 1678-1690.
[133] Filippini N, MacIntosh BJ, Hough MG, Goodwin GM,Frisoni GB, Smith SM, Matthews PM, Beckmann CF,Mackay CE (2009) Distinct patterns of brain activity inyoung carriers of the APOE-epsilon4 allele. Proc Natl AcadSci U S A 106, 7209-7214.
[134] Persson J, Lind J, Larsson A, Ingvar M, Sleegers K, VanBroeckhoven C, Adolfsson R, Nilsson LG, Nyberg L (2008)Altered deactivation in individuals with genetic risk forAlzheimer’s disease. Neuropsychologia 46, 1679-1687.
[135] Pihlajamaki M, OK K, Bertram L, Tanzi RE, Dickerson BC,Blacker D, Albert MS, Sperling RA (2010) Evidence ofaltered posteromedial cortical FMRI activity in subjects atrisk for Alzheimer disease. Alzheimer Dis Assoc Disord 24,28-36.
[136] Pihlajamaki M, Sperling RA (2009) Functional MRI assess-ment of task-induced deactivation of the default modenetwork in Alzheimer’s disease and at-risk older individuals.Behav Neurol 21, 77-91.
[137] den Heijer T, Oudkerk M, Launer LJ, van Duijn CM, Hof-man A, Breteler MM (2002) Hippocampal, amygdalar, and
global brain atrophy in different apolipoprotein E genotypes.Neurology 59, 746-748.
[138] Geroldi C, Pihlajamaki M, Laakso MP, DeCarli C, Bel-tramello A, Bianchetti A, Soininen H, Trabucchi M, FrisoniGB (1999) APOE-epsilon4 is associated with less frontaland more medial temporal lobe atrophy in AD. Neurology53, 1825-1832.
[139] Soininen H, Partanen K, Pitkanen A, Hallikainen M, Han-ninen T, Helisalmi S, Mannermaa A, Ryynanen M, KoivistoK, Riekkinen P Sr (1995) Decreased hippocampal volumeasymmetry on MRIs in nondemented elderly subjects car-rying the apolipoprotein E epsilon4 allele. Neurology 45,391-392.
[140] Moretti DV, Pievani M, Fracassi C, Binetti G, Rosini S,Geroldi C, Zanetti O, Rossini PM, Frisoni GB (2009)Increase of theta/gamma and alpha3/alpha2 ratio is asso-ciated with amygdalo-hippocampal complex atrophy. JAlzheimers Dis 17, 349-357.
[141] Deiber MP, Ibanez V, Herrmann F, Rodriguez C, EmchJ, Missonnier P, Millet P, Gold G, Giannakopoulos P(2011) Face short-term memory-related electroencephalo-graphic patterns can differentiate multi- versus single-domain amnestic mild cognitive impairment. J AlzheimersDis 26, 157-169.
[142] Olichney JM, Yang J-C, Taylor J, Kutas M (2011) Cognitiveevent-related potentials: Biomarkers of synaptic dysfunctionacross the stages of Alzheimer’s Disease. J Alzheimers Dis26 supplement 3, 215-228.
[143] Ashford JW, Coburn KL, Rose TL, Bayley PJ (2011) Thetopography of P300 energy loss in aging and Alzheimer’sdisease. J Alzheimers Dis 26 supplement 3, 229-238.
[144] Verdoorn TA, McCarten DA Jr, Golden R, Moldauer L,Georgopoulos A, Lewis S, Cassano M, Hemmy L, Orr W,Rojas D (2011) Evaluation and tracking of Alzheimer’s dis-ease severity using resting-state magnetoencephalograpy. JAlzheimers Dis 26 supplement 3, 239-255.
[145] Coburn KL, Parks R, Pritchard W (1993) Electrophysiologi-cal idexes of cortical deterioration and cognitive impairmentin dementia. In. Neuropsychology of Alzheimer’s Diseaseand Other Dementias, Parks RW, Zec RF, Wilson RS, eds.Oxford University Press, New York, pp. 511-533.
[146] Pritchard WS, Duke DW, Coburn KL, Moore NC, TuckerKA, Jann MW, Hostetler RM (1994) EEG-based, neural-net predictive classification of Alzheimer’s disease versuscontrol subjects is augmented by non-linear EEG measures.Electroencephalogr Clin Neurophysiol 91, 118-130.
[147] Parks RW, Zec RF, Kuhn M, Vicari S, Feldman E, CoburnKL, Ashford JW, Crockett DJ, Moreno MA, Rashid A(1991) Electrocortical mapping, MRI, and neuropsycho-logical measures: Evidence of Alzheimer’s disease in thepresence of vascular lesions. Arch Clin Neuropsychol 6,393-408.
[148] Boutros N, Coburn K (2006) Electroencephalography inNeuropsychiatry (Neuropsychiatry Special Report). Psychi-atric Times 23, 39-40.
[149] Coburn KL, Lauterbach EC, Boutros NN, Black KJ, Arcin-iegas DB, Coffey CE (2006) The value of quantitativeelectroencephalography in clinical psychiatry: A report bythe committee on research of the American Neuropsy-chiatric Association. J Neuropsychiatry Clin Neurosci 18,460-500.
[150] Pritchard W, Duke D, Coburn K (1991) Dimensionalanalysis of topographic EEG: Some methodological consid-erations. In. Measuring Chaos in the Human Brain, Duke
26 J.W. Ashford et al. / Imaging the Alzheimer Brain
D, Pritchard W, eds. World Scientific Press, Singapore, pp.181-198.
[151] Pritchard W, Duke D, Coburn K (1991) Altered EEG dynam-ical responsivity associated with normal aging and probableAlzheimer’s disease. Dementia 2, 102-105.
[152] Pritchard W, Duke D, Coburn K, Robinson J (1992)Nonlinear dynamical EEG analysis applied to nicotine psy-chopharmacology and Alzheimer’s disease. In. The Biologyof Nicotine, Lippiello P, et al., eds. Raven Press, New York,pp. 195-214.
[153] Coburn KL, Ashford JW, Moreno MA (1991) Visual evokedpotentials in dementia: Selective delay of flash P2 in prob-able Alzheimer’s disease. J Neuropsychiatry Clin Neurosci3, 431-435.
[154] Coburn KL, Ashford JW, Moreno MA (1993) Delayedlate component of visual global field power in probableAlzheimer’s disease. J Geriatr Psychiatry Neurol 6, 72-77.
[155] Moore NC, Tucker KA, Jann MW, Hostetler RM, CoburnKL (1995) Flash P2 delay in primary degenerative dementiaof the Alzheimer type. Prog Neuropsychopharmacol BiolPsychiatry 19, 403-410.
[156] Moore NC, Vogel RL, Tucker KA, Khairy NM, CoburnKL (1996) P2 flash visual evoked response delay may bea marker of cognitive dysfunction in healthy elderly volun-teers. Int Psychogeriatr 8, 549-559.
[157] Olichney JM, Taylor JR, Gatherwright J, Salmon DP,Bressler AJ, Kutas M, Iragui-Madoz VJ (2008) Patients withMCI and N400 or P600 abnormalities are at very high riskfor conversion to dementia. Neurology 70, 1763-1770.
[158] Fellgiebel A, Yakushev I (2011) Diffusion tensor imagingof the hippocampus in MCI and early Alzheimer’s disease.J Alzheimers Dis 26 supplement 3, 257-262.
[159] Friese U, Meindl T, Herpertz SC, Reiser MF, HampelH, Teipel SJ (2010) Diagnostic utility of novel MRI-based biomarkers for Alzheimer’s disease: Diffusion tensorimaging and deformation-based morphometry. J AlzheimersDis 20, 477-490.
[160] Canu E, McLaren DG, Fitzgerald ME, Bendlin BB,Zoccatelli G, Alessandrini F, Pizzini FB, Ricciardi GK,Beltramello A, Johnson SC, Frisoni GB (2011) Mappingthe structural brain changes in Alzheimer’s disease: Theindependent contribution of two imaging modalities. JAlzheimers Dis 26 supplement 3, 263-274.
[161] Haller S, Nguyen D, Rodriguez C, Emch J, Gold G, BartschA, Lovblad KO, Giannakopoulos P (2010) Individual pre-diction of cognitive decline in mild cognitive impairmentusing support vector machine-based analysis of diffusiontensor imaging data. J Alzheimers Dis 22, 315-327.
[162] Shu N, Wang Z, Qi Z, Li K, He Y (2011) Multiple diffusionindices reveals white matter degeneration in Alzheimer’sdisease and mild cognitive impairment: A tract-based spatialstatistics study. Journal of Alzheimer’s Disease-Supplement.
[163] Oishi K, Mielke MM, Albert M, Lyketsos CG, Mori S (2011)DTI analyses and clinical applications in Alzheimer’s dis-ease. J Alzheimers Dis 26 supplement 3, 287-296.
[164] Teipel SJ, Meindl T, Wagner M, Kohl T, Burger K, ReiserMF, Herpertz S, Moller HJ, Hampel H (2009) White mat-ter microstructure in relation to education in aging andAlzheimer’s disease. J Alzheimers Dis 17, 571-583.
[165] Yassa MA (2011) Searching for novel biomarkers using highresolution diffusion tensor imaging. J Alzheimers Dis 26supplement 3, 297-305.
[166] Pierpaoli C, Basser PJ (1996) Toward a quantitative assess-ment of diffusion anisotropy. Magn Reson Med 36, 893-906.
[167] Beaulieu C (2002) The basis of anisotropic water diffusionin the nervous system - a technical review. NMR Biomed 15,435-455.
[168] Basser PJ, Pajevic S, Pierpaoli C, Duda J, Aldroubi A (2000)In vivo fiber tractography using DT-MRI data. Magn ResonMed 44, 625-632.
[169] Didic M, Ranjeva JP, Barbeau E, Confort-Gouny S, FurYL, Felician O, Mancini J, Poncet M, Ceccaldi M, CozzoneP (2010) Impaired visual recognition memory in amnesticmild cognitive impairment is associated with mesiotempo-ral metabolic changes on magnetic resonance spectroscopicimaging. J Alzheimers Dis 22, 1269-1279.
[170] Westman E, Wahlund L-O, Foy C, Poppe M, Cooper A,Murphy D, Spenger C, Lovestone S, Simmons A (2011)Magnetic Resonance Imaging and Magnetic ResonanceSpectroscopy for detection of early Alzheimer’s disease. JAlzheimers Dis 26 supplement 3, 307-319.
[171] Griffith HR, Stewart CC, den Hollander JA (2009) Protonmagnetic resonance spectroscopy in dementias and mildcognitive impairment. Int Rev Neurobiol 84, 105-131.
[172] Jessen F, Gur O, Block W, Ende G, Frolich L, Hammen T,Wiltfang J, Kucinski T, Jahn H, Heun R, Maier W, KolschH, Kornhuber J, Traber F (2009) A multicenter (1)H-MRSstudy of the medial temporal lobe in AD and MCI. Neurology72, 1735-1740.
[173] Schott JM, Frost C, MacManus DG, Ibrahim F, WaldmanAD, Fox NC (2010) Short echo time proton magnetic reso-nance spectroscopy in Alzheimer’s disease: A longitudinalmultiple time point study. Brain 133, 3315-3322.
[174] Siger M, Schuff N, Zhu X, Miller BL, Weiner MW (2009)Regional myo-inositol concentration in mild cognitiveimpairment Using 1H magnetic resonance spectroscopicimaging. Alzheimer Dis Assoc Disord 23, 57-62.
[175] Adalsteinsson E, Sullivan EV, Kleinhans N, Spielman DM,Pfefferbaum A (2000) Longitudinal decline of the neuronalmarker N-acetyl aspartate in Alzheimer’s disease. Lancet355, 1696-1697.
[176] Kantarci K (2007) 1H magnetic resonance spectroscopy indementia. Br J Radiol 80 Spec No 2, S146-S152.
[177] Martin WR (2007) MR spectroscopy in neurodegenerativedisease. Mol Imaging Biol 9, 196-203.
[178] Mueller SG, Schuff N, Weiner MW (2006) Evaluation oftreatment effects in Alzheimer’s and other neurodegenera-tive diseases by MRI and MRS. NMR Biomed 19, 655-668.
[179] Ashford JW, Adamson MM, Beale T, La D, Hernandez B,Noda A, Rosen A, O’Hara R, Fairchild JK, Spielman D,Yesavage JA (2011) Spectroscopy for assessment of meman-tine treatment in mild to moderate Alzheimer dementia. JAlzheimers Dis 26 supplement 3, 331-336.
[180] Zhang N, Song X, Zhang Y, Chen W, D’Arcy R, DarveshS, Fisk JD, Rockwood K (2011) An MRI brain atrophy andlesion index to assess the progression of structural changes inAlzheimer’s disease, mild cognitive impairment, and normalaging: A follow-up study. J Alzheimers Dis 26 supplement3, 359-368.
[181] Ard MC, Edland SD (2011) Power calculations for clinicaltrials in Alzheimer’s disease. J Alzheimers Dis 26 supple-ment 3, 369-377.
[182] Knopman DS, Roberts R (2010) Vascular risk factors: Imag-ing and neuropathologic correlates. J Alzheimers Dis 20,699-709.

J.W. Ashford et al. / Imaging the Alzheimer Brain 27
[183] Gao F-q, Swartz RH, Scheltens P, Leibovitch FS, Kiss A,Honjo K, Black SE (2011) Complexity of MRI white matterhyperintensity assessments in relation to cognition in agingand dementia. J Alzheimers Dis 26 supplement 3, 379-388.
[184] Bernardi L, Geracitano S, Colao R, Puccio G, Gallo M,Anfossi M, Frangipane F, Curcio SA, Mirabelli M, TomainoC, Vasso F, Smirne N, Maletta R, Bruni AC (2009) AbetaPPA713T mutation in late onset Alzheimer’s disease with cere-brovascular lesions. J Alzheimers Dis 17, 383-389.
[185] Smith CD (2010) Neuroimaging through the course ofAlzheimer’s disease. J Alzheimers Dis 19, 273-290.
[186] Mak HK, Zhang Z, Yau KK, Zhang L, Chan Q, Chu LW(2011) Efficacy of voxel-based morphometry with DAR-TEL and standard registration as imaging biomarkers inAlzheimer’s disease patients and cognitively normal olderadults at 3.0 Tesla MR imaging. J Alzheimers Dis 23, 655-664.
[187] Di Paola M, Spalletta G, Caltagirone C (2010) In vivostructural neuroanatomy of corpus callosum in Alzheimer’sdisease and mild cognitive impairment using different MRItechniques: A review. J Alzheimers Dis 20, 67-95.
[188] Kaufman LD, Pratt J, Levine B, Black SE (2010) Anti-saccades: A probe into the dorsolateral prefrontal cortex inAlzheimer’s disease. A critical review. J Alzheimers Dis 19,781-793.
[189] Haller S, Lovblad KO, Giannakopoulos P (2011) Princi-ples of classification analyses in mild cognitive impairment(MCI) and Alzheimer disease. 389-394.
[190] Furney SJ, Kronenberg D, Simmons A, Guntert A, Dob-son RJ, Proitsi P, Wahlund L-O, Kloszewska I, Mecocci
P, Soininen H, Tsolaki M, Vellas B, Spenger C, LovestoneS (2011) Combinatorial markers of mild cognitive impair-ment conversion to Alzheimer’s disease - cytokines and MRImeasures together predict disease progression. J AlzheimersDis 26 supplement 3, 395-405.
[191] Lee DY, Fletcher E, Martinez O, Zozulya N, Kim J,Tran J, Buonocore M, Carmichael O, DeCarli C (2010)Vascular and degenerative processes differentially affectregional interhemispheric connections in normal aging, mildcognitive impairment, and Alzheimer disease. Stroke 41,1791-1797.
[192] Rosen AC, Bokde AL, Pearl A, Yesavage JA (2002) Ethical,and practical issues in applying functional imaging to theclinical management of Alzheimer’s disease. Brain Cogn50, 498-519.
[193] Illes J, Rosen A, Greicius M, Racine E (2007) Prospects forprediction: Ethics analysis of neuroimaging in Alzheimer’sdisease. Ann N Y Acad Sci 1097, 278-295.
[194] Griffith HR, Stewart CC, Stoeckel LE, Okonkwo OC, denHollander JA, Martin RC, Belue K, Copeland JN, HarrellLE, Brockington JC, Clark DG, Marson DC (2010) Mag-netic resonance imaging volume of the angular gyri predictsfinancial skill deficits in people with amnestic mild cognitiveimpairment. J Am Geriatr Soc 58, 265-274.
[195] Griffith HR, Okonkwo OC, den Hollander JA, Belue K,Copeland J, Harrell LE, Brockington JC, Clark DG, MarsonDC (2010) Brain metabolic correlates of decision makingin amnestic mild cognitive impairment. Neuropsychol DevCogn B Aging Neuropsychol Cogn 17, 492-504.
Related Documents