Imaging Techniques of Relativistic Beams: Issues & Limitations Alex Lumpkin and Manfred Wendt, Fermilab, Presented at the LCWS11 September 27, 2011 Granada, Spain

Imaging Techniques of Relativistic Beams: Issues & Limitations
Jan 02, 2016
Imaging Techniques of Relativistic Beams: Issues & Limitations. Alex Lumpkin and Manfred Wendt , Fermilab , Presented at the LCWS11 September 27, 2011 Granada, Spain. Outline. Introduction Beam profiling with YAG:Ce * scintillation Scintillator resolution Depth-of-focus issue - PowerPoint PPT Presentation
Welcome message from author
This document is posted to help you gain knowledge. Please leave a comment to let me know what you think about it! Share it to your friends and learn new things together.
Transcript

Imaging Techniques of Relativistic Beams:
Issues & Limitations
Alex Lumpkin and Manfred Wendt,
Fermilab,
Presented at the LCWS11
September 27, 2011
Granada, Spain

Outline
I. Introduction
II. Beam profiling with YAG:Ce* scintillation• Scintillator resolution• Depth-of-focus issue
III. Optical Transition Radiation (OTR)• OTR basics• OTR point-spread-function (PSF) aspects• Microbunching instability and coherent OTR
IV. Future tests
V. Summary
A. Lumpkin and M. Wendt LCWS September 26, 2011 2
*Yttrium Aluminum Garnet, Cerium doped

Fermilab A0 Photo Injector
Beamline and diagnostics support for EEX applications
A. Lumpkin and M. Wendt LCWS September 26, 2011 3
3.9 GHz TM110 Cavity
Parameter Units Value
Energy MeV 15
Energy spread keV 10 ‒ 15
transverse emittance mm mrad 2.6±0.3
Bunch length psec 3.1±0.3
Bunch intensity nC ~0.1 ‒ 5

Intro to Beam-Size Imaging
• The charged-particle beam transverse size and profiles are part of the basic characterizations needed in accelerators to determine beam quality, e.g. transverse emittance.
• A basic beam imaging system includes:– conversion mechanism (scintillator,
optical or x-ray synchrotron radiation (OSR or XSR), Cherenkov radiation (CR), optical transition radiation (OTR), undulator radiation (UR), and optical diffraction radiation (ODR).
– optical transport (lenses, mirrors, filters, polarizers).
– imaging sensor such as CCD,CID, CMOS camera, with or without intensifier and/or cooling
– video digitizer– image processing software
A. Lumpkin and M. Wendt LCWS September 26, 2011 4
video digitizer
optical transport
imagingcamera
conversionscreen
beam
image processing& controls software

Identify Corrections to Consider
• System related– YAG:Ce powder and crystal screen spatial resolution.– Camera resolution and depth of focus.– OTR polarization effects and OTR point spread function.– Camera calibration factor.– Finite slit size (if applicable) .
• Accelerator / beam related– Beta star term in spectrometers.– Macropulse blurring effects on energy spread , beam size,
and beam divergence in OTR images.
A. Lumpkin and M. Wendt LCWS September 26, 2011 5

Observed vs Actual Slit Image Size
• Uncorrelated terms are treated as a quadrature sum to actual image size Act (see Lyons’ textbook a).– Observed image size Obs– YAG screen effects YAG– Camera resolution Cam– Finite slit width Slit
• In addition there can be macropulse effects and OTR polarization effects.
A. Lumpkin and M. Wendt LCWS September 26, 2011 6
and solving for the actual beam size we have,
aLouis Lyons, Statistics for Nuclear and Particle Physicists (1986)
𝑂𝑏𝑠2=𝐴𝑐𝑡 2+𝑌𝐴𝐺2+𝐶𝑎𝑚2+𝑆𝑙𝑖𝑡 2
𝐴𝑐𝑡=√𝑂𝑏𝑠2−𝑌𝐴𝐺2−𝐶𝑎𝑚2−𝑆𝑙𝑖𝑡2

Converter Screen Properties
YAG:Ce (Cerium doped)powder or single crystal
OTR screen,e.g. Al or aluminized Si
Efficiency ~100x 1x
Spatial resolution Volume effect, grain size EM surface phenomena
Spectral content Narrow band (~20 nm) Broad band
Saturation, non-linearities at high beam intensities no
Response time ~50 – 100 nsec ~10 fsec (skin depth)
Screen geometry: normal / angular (450)
depth of focus, scattering, effective thickness, system simplicity, etc.
Screen thickness,energy deposition,beam scattering
100 μm rangeminimum: 1 μm (fragile!)maximum: some 100 μm
Light scatteringHalo effects through scintillating volume
None
A. Lumpkin and M. Wendt LCWS September 26, 2011 7

YAG:Ce Powder Scintillator Screens
• YAG:Ce screens, used at the A0 Photoinjector:– The screens have nominally a 5 µm grain size and are coated at
50-µm thickness on various metal substrates.– Substrates are Al or SS and 1 mm thick.– In the A0PI arrangement the scintillator was on the front surface
of the substrate, and oriented at 450 to the beam direction.– Powder screens are kindly provided by Klaus Floettmann (DESY).
• Observed Characteristics– The response time is about 80 ns FWHM.– There have been reports of saturation of the mechanism for
incident electron beam areal charge densities ~10 fC/µm2.• This effect can cause a charge dependence of the observed image
size in addition to the low-charge, screen resolution limit.
A. Lumpkin and M. Wendt LCWS September 26, 2011 8

YAG:Ce Powder vs OTR Screen
# of bunches X5 linear polarization Fit σ (pixel) Size (μm)
YAG:Ce 1 none 5.67 ± 0.05 128.7
vertical 5.71 ± 0.04 129.6
OTR 10 none 5.49 ± 0.05 124.5
vertical 4.47 ± 0.09 101.0
A. Lumpkin and M. Wendt LCWS September 26, 2011 9
• Both screen surfaces at 450 to the beam direction.• Gaussian fits to the projected beam profiles
of 10 images.• Deduced YAG resolution term (page 6): 80 ± 20 μm• YAG resolution,
averaged using three measurement sets: 60 ± 20 μm

Screen Resolution vs. Thickness
A. Lumpkin and M. Wendt LCWS September 26, 2011 10
Scintillator Thickness (m)
0 200 400 600 800
Res
olu
tio
n
( m
)
0
50
100
150
200
250
300
350
Powder Data Crystal Data
2
Chromox,APS/ANL,450
YAG:Ce,A0PI,450
YAG:Ce, single crystalSCSS and Mainz,00
YAG:Tb,BNL,00
Chromox,Elettra,450
YAG 5 μm grain size
• Scintillator screen resolution vs. thickness after applying corrections discussed on page 6.

Identify Corrections to Consider
• System related– YAG:Ce powder and crystal screen spatial resolution.– Camera resolution and depth of focus.– OTR polarization effects and OTR point spread function.– Camera calibration factor.– Finite slit size (if applicable) .
• Accelerator / beam related– Beta star term in spectrometers.– Macropulse blurring effects on energy spread , beam size,
and beam divergence in OTR images.
A. Lumpkin and M. Wendt LCWS September 26, 2011 11

Depth-of-Focus Issues
• 1 mm (X5) / 4 mm (X24) spaced slits, 50 μm wide– Camera calibration ~30 μm / pixel.
• Depth-of-focus issues in extended field of view for 450 arrangement of the YAG:Ce scintillator screen
A. Lumpkin and M. Wendt LCWS September 26, 2011 12
X5 X24

MATLAB Emittance Code
• Application tool provides online emittance and C-S parameter calculations to facilitate operations.
A. Lumpkin and M. Wendt LCWS September 26, 2011 13
courtesy R. Thurman-Keup

Identify Corrections to Consider
• System related– YAG:Ce powder and crystal screen spatial resolution.– Camera resolution and depth of focus.– OTR polarization effects and OTR point spread function.– Camera calibration factor.– Finite slit size (if applicable) .
• Accelerator / beam related– Beta star term in spectrometers.– Macropulse blurring effects on energy spread , beam size,
and beam divergence in OTR images.
A. Lumpkin and M. Wendt LCWS September 26, 2011 14

Optical Transition Radiation (OTR)
A. Lumpkin and M. Wendt LCWS September 26, 2011 15
• OTR can be used for beam– profile / size – position – divergence
• Charged particle passing a media boundary (EM dipole).
– energy, – relative intensity – bunch length
OTR angular intensity distribution of a single charged particle

OTR Calculation
A. Lumpkin and M. Wendt LCWS September 26, 2011 16
2222
22
2
21
2 1
yx
yx
c
e
dd
Nd
Angle (radians)
-0.010 -0.005 0.000 0.005 0.010
Rel
ativ
e In
tens
ity
(arb
. uni
ts)
0.0
0.2
0.4
0.6
0.8
1.0
• OTR single particle spectral-angular distribution:
– Ω spatial angle– ω angular frequency– N1 # of photons
– Θx,y radiation angle
– E, ħ, c, π constants
• Coherent spectral-angulardistribution from a macropulse
– N # of photons from per unit frequency and solid angle (typ. 1 e -> 0.001 photons)
– r reflection coefficient– I interference function (double foil)– F coherence function (can be non-linear)
kk
I
dd
Ndr
dd
Nd
1
22//,
2
E = 220 MeVx’, y’ = 0.2 mrad

Prototype Imaging Station
• New developed imaging station in collaboration with RadiaBeam, Inc.
A. Lumpkin and M. Wendt LCWS September 26, 2011 17

OTR / YAG Configurations
A. Lumpkin and M. Wendt LCWS September 26, 2011 18
• Switchable assemblies to compare options. – Still tweaking!
Impedance Screen
YAG:Ce, plus Al on Si mirror
OTR, normal to beam, plus Al on Si mirror
Impedance Screen
OTR foil, 1µm plus 1µm foil at 450
Option 1 Option 2
OTR,100 µm Al plus Al on Si mirror
screen
mirror
beam
light

Test of OTR Normal to Beam
• Optics focused on crystal location: – gives superposition of focused OTR and
defocused OTR source from mirror.
A. Lumpkin and M. Wendt LCWS September 26, 2011 19
Single-Gaussian Fitσ1 = 16.2 ± 0.2 pix
Double-Gaussian Fitσ1= 9.2 ± 0.1
σ2 = 28.1± 0.2

OTR Polarization and PSF History
• 1996: Lebedev evaluated OTR resolution.• 1998: Castellano, et.al. points out the OTR PSF has a
polarization feature.– Calculated a 12λ (FWHM) effect for the total width
and 0.1 rad collection angle.
• 2007: FNAL & JLAB observed OTR / ODR polarization effects on the beam image size.
• 2007: Xiang, et.al. calculates PSF for OTR and ODR.• 2010: OTR polarization on beam images reported by
FNAL A0 photoinjector staff at the BIW10.• 2010: KEK OTR experiment uses a polarizer to analyze
the details of the PSF (IPAC2010).– In 2005 the experiment was performed without polarizer.
A. Lumpkin and M. Wendt LCWS September 26, 2011 20

Point Spread Function (PSF)
A. Lumpkin and M. Wendt LCWS September 26, 2011 21
• At the diffraction limit the image of a point source radiates a ring pattern defined by the OTR point spread function (PSF):
– maximum acceptance angle– magnification factor– radius
of the lens
∆ 𝑥 ≈1.22𝜆 /∆ 𝜃
22 2
12 20( , , ) [ ( ) ]
m
mf J d
OTR response Point charge diffraction
PSF: convolution integral of
Z
Source Lens Image
a b
𝜃=𝑅𝑖/𝑎 /ikR M
/M b a𝜃𝑚
𝑅𝑖
2 105
1 105
0 1 105
2 105
0
5 104
0.001
0.0015
0.002
Radius on image plane
f^2
Cross sectionExample:M=1, E=4GeV, λ=500nmcourtesy C. Liu

PSF Properties
A. Lumpkin and M. Wendt LCWS September 26, 2011 22
• Insensitive to the beam energy• Sensitive to the acceptance angle• Polarizer mitigates PSF imaging errors
– E.g. horizontal polarizer reduces verticalimage size by
– With a mask blocking rays ofangle ≤Θ1, the PSF will be:
𝑦 /√𝑥2+𝑦 2
2 105
1 105
0 1 105
2 105
0
5 104
0.001
0.0015
0.002
¦Èm=0.1rad¦Èm=0.05rad¦Èm=0.1rad¦Èm=0.05rad
Radius on image plane
f^2
PSF dependence on acceptance angle
2 105
1 105
0 1 105
2 105
0
5 104
0.001
0.0015
0.002
¦Ã=8000¦Ã=100¦Ã=8000¦Ã=100
Radius on image plane
f^
2
PSF dependence on beam energy
2 105
1 105
0 1 105
2 105
0
5 104
0.001
0.0015
0.002
¦È1=0¦È1=0.025rad¦È1=0.050rad
¦È1=0¦È1=0.025rad¦È1=0.050rad
Radius on image plane (m)
f^2
Lens
O I
1
22 2
12 2( , , ) [ ( ) ]
m
mf J d
courtesy C. Liu

OTR PSF Calculations (MATLAB)
• 14.3 MeV, M=1, λ=500 nm, θmax=0.010, sigma =25 µm
• This version with convolutions implemented at FNAL.
A. Lumpkin and M. Wendt LCWS September 26, 2011 23
-1 0 1
x 10-4
-1
0
1
x 10-4
-1 0 1
x 10-4
-1
0
1
x 10-4
-1 0 1
x 10-4
-1
0
1
x 10-4
X
Y
Total PSF Hpol PSF
Vpol PSF At Image plane
courtesy R. Thurman-Keup

PSF Polarization Convolved
• 14.3 MeV, M = 1, λ = 500 nm, θmax=0.010, σ = 25 µm
A. Lumpkin and M. Wendt LCWS September 26, 2011 24
Original Sigma = 25 μmTotal PSF Sigma = 33.18 μmHorPol-HorProj PSF Sigma = 38.01 μmHorPol-VerProj PSF Sigma = 29.39 μm
-150 -100 -50 0 50 100 1500
0.005
0.01
0.015
0.02
0.025
0.03
0.035
0.04
x (m)
Total
HorPol-HorProj
HorPol-VerProj
-150 -100 -50 0 50 100 1500
0.1
0.2
0.3
0.4
0.5
0.6
0.7
0.8
0.9
1
x (m)
Convolution with Beam
None
TotalHorPol-HorProj
HorPol-VerProj
Inte
nsity
Inte
nsity
-1 0 1
x 10-4
-1
0
1
x 10-4
-1 0 1
x 10-4
-1
0
1
x 10-4
-1 0 1
x 10-4
-1
0
1
x 10-4
Hpol PSF
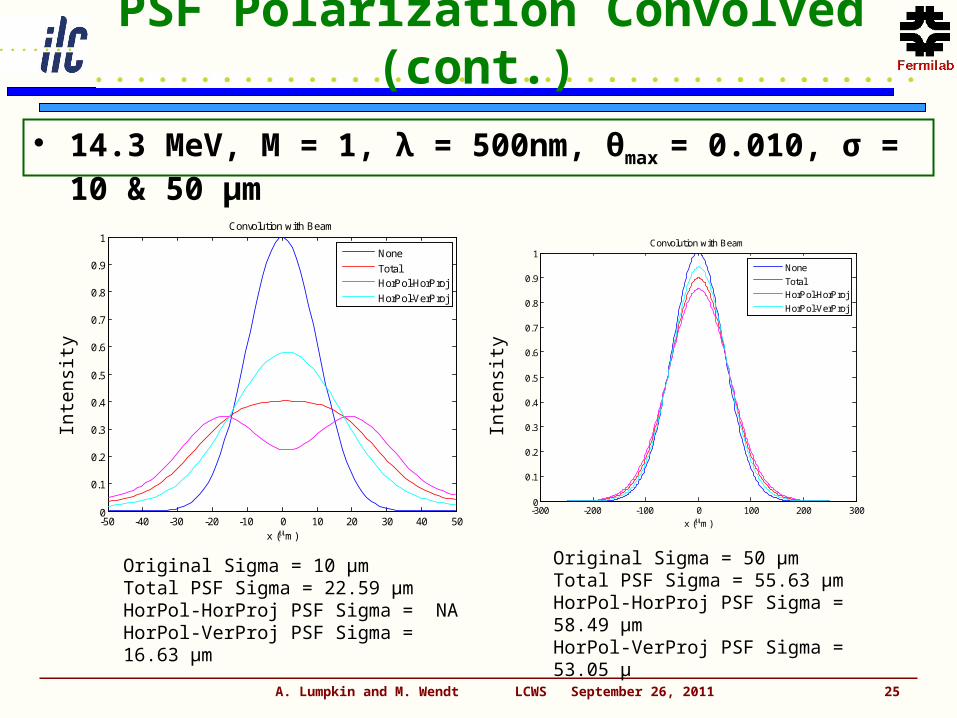
PSF Polarization Convolved (cont.)
• 14.3 MeV, M = 1, λ = 500nm, θmax = 0.010, σ = 10 & 50 µm
A. Lumpkin and M. Wendt LCWS September 26, 2011 25
Original Sigma = 50 μmTotal PSF Sigma = 55.63 μmHorPol-HorProj PSF Sigma = 58.49 μmHorPol-VerProj PSF Sigma = 53.05 μ
-300 -200 -100 0 100 200 3000
0.1
0.2
0.3
0.4
0.5
0.6
0.7
0.8
0.9
1
x (m)
Convolution with Beam
None
TotalHorPol-HorProj
HorPol-VerProj
Inte
nsity
Original Sigma = 10 μmTotal PSF Sigma = 22.59 μmHorPol-HorProj PSF Sigma = NAHorPol-VerProj PSF Sigma = 16.63 μm
-50 -40 -30 -20 -10 0 10 20 30 40 500
0.1
0.2
0.3
0.4
0.5
0.6
0.7
0.8
0.9
1
x (m)
Convolution with Beam
None
TotalHorPol-HorProj
HorPol-VerProj
Inte
nsity

Polarized Beam Images at XUR
• OTR Perpendicular component has 15 % smaller profile.– Beam measurements with a vertical stripe, optics generated.
A. Lumpkin and M. Wendt LCWS September 26, 2011 26
Total Pol.: LeftSingle-Gaussian Fitσ1 = 66.8 ± 0.3 μm
Vert. Pol.: RightSingle-Gaussian Fitσ1 = 55.1 ± 1.1 μm
10µm effect @ 55 µm
(Cal.: 5.3 µm/pixel)

KEK Experimental OTR PSF
A. Lumpkin and M. Wendt LCWS September 26, 2011 27
with respect to zero which included a constantbackground; b is the amplitude of the distribution; c is thedistribution width; σ is the smoothing parameterdominantly defined by the beam size; and Δx is thehorizontal offset of the distribution with respect to zero
courtesy A. Aryshev
*Legend reversed
• KEK staff used vertical polarizer and small beam to observe PSF and suggested potential use of structure.– Use PSF valley for profile measurements at the PSF limit.

OTR vs. COTR
Wavelength (nm)
0 200 400 600 800 1000 1200
Rel
ativ
e In
ten
sity
0
2
4
6
8
10
12
14
16
CC
D R
esp
on
se
0.0
0.2
0.4
0.6
0.8
1.0
1.2
1.4
1.6
OTR Rel. Intensity ModelCCD response COTR with OTR gained up (3 keV)
COTR Case at 250 MeV
• Estimation of OTR/COTR spectral effect for LCLS case.
A. Lumpkin and M. Wendt LCWS September 26, 2011 28
OTR~1/λ2
COTR(3 keV)
CCD Resp.
-UV-

COTR Mitigation Test at St-5/ANL
• Reduction of COTR effects with 400x40 nm BPF, but need more sensitive camera than 40dB analog CCD to see remaining OTR.
A. Lumpkin and M. Wendt LCWS September 26, 2011 29
Y
X(ch)
Y
X(ch)
I I
COTR:ND0.5 COTR:400x40 nm LSO: 400x40 nm
X(ch)
Y
I

40-MeV Injector for ASTA/FNAL
A. Lumpkin and M. Wendt LCWS September 26, 2011 30
• Injector being installed with First beam expected in 2012.
electron gun
booster cavities
3rd harmonic
cavity
flat beam transform
chicane
deflecting mode cavity
beam dump
1st cryomodule
test beamlines beam
dump
spectrometer magnet
40-MeV Injector
Booster cavity 2 (from DESY and Saclay) installed in NML
First cryomodule (from DESY) installed at NML.courtesy M. Church

Summary
• Scintillator resolution terms should be characterized,– Use normal incidence of beam preferred geometry to minimize
depth-of-focus, effective radiation thickness in beam images.
• OTR polarization effects need to be elucidated– Plan to optimize OTR PSF and optical resolution.– Plan to use linear polarizers with OTR imaging for the
perpendicular profile components at ASTA.
• Mitigate microbunching instability effects for profiling of bright beams.– Plan to use 400x40 nm band pass filters and LYSO:Ce* crystals
after bunch compression at ASTA to suppress expected diagnostics complications due to COTR.
• The future remains bright for imaging techniques!
A. Lumpkin and M. Wendt LCWS September 26, 2011 31
*Lutetium Yttrium oxyorthosilicate (420 nm, violet), Cerium doped
Related Documents