237 INTRODUCTION Each imaging facility has its own, often unique, set of examination protocols. For any given CT examination, the protocol will vary according the individual requirement of the imaging site. Factors that influence a specific site’s protocol parameters include the type of equipment available (e.g., 64-slice versus 16-slice), the setting (e.g., inpatient versus outpatient), and the particular preferences of the radiologists in charge. Like all fields of medicine, CT is constantly evolving so it follows that examination protocols constantly undergo re- evaluation and refinement. A cookbook approach to CT scanning is impractical as it cannot possibly account for all possible variables. The protocols presented in this section are intended as examples of just a few of the many possible variations in current practice. There has been no attempt to survey institutions to determine the most prevalent protocols; protocols included here should not be considered either the most common or the best. They are simply one or two options among many. Many other protocol options can be found on the World Wide Web, posted by both equipment manufacturers and various university hospitals. The protocols in this text are in a tabular format to facilitate easy reference. When possible, the protocols include parameter variations for a 16- and a 64-detector system. Again, these are intended be illustrative, providing the reader an idea of the parameters most likely to be adjusted when switching from one type of detector configuration CHAPTER 19 • Neurologic Imaging Procedures CHAPTER 20 • Thoracic Imaging Procedures CHAPTER 21 • Abdomen and Pelvis Imaging Procedures CHAPTER 22 • Musculoskeletal Imaging Procedures CHAPTER 23 • Interventional CT and CT Fluoroscopy CHAPTER 24 • PET/CT Fusion Imaging IMAGING PROCEDURES and PROTOCOLS IMAGING PROCEDURES and PROTOCOLS Section IV Section IV

Welcome message from author
This document is posted to help you gain knowledge. Please leave a comment to let me know what you think about it! Share it to your friends and learn new things together.
Transcript
237
INTRODUCTIONEach imaging facility has its own, often unique, set of examination protocols. For any given CT examination, the protocol will vary according the individual requirement of the imaging site. Factors that infl uence a specifi c site’s protocol parameters include the type of equipment available (e.g., 64-slice versus 16-slice), the setting (e.g., inpatient versus outpatient), and the particular preferences of the radiologists in charge. Like all fi elds of medicine, CT is constantly evolving so it follows that examination protocols constantly undergo re-evaluation and refi nement. A cookbook approach to CT scanning is impractical as it cannot possibly account for all possible variables. The protocols presented in this section are intended as examples of just a few of the many possible variations in current practice. There has been no attempt to survey institutions to determine the most prevalent protocols; protocols included here should not be considered either the most common or the best. They are simply one or two options among many. Many other protocol options can be found on the World Wide Web, posted by both equipment manufacturers and various university hospitals. The protocols in this text are in a tabular format to facilitate easy reference. When possible, the protocols include parameter variations for a 16- and a 64-detector system. Again, these are intended be illustrative, providing the reader an idea of the parameters most likely to be adjusted when switching from one type of detector confi guration
CHAPTER 19 • Neurologic Imaging Procedures
CHAPTER 20 • Thoracic Imaging Procedures
CHAPTER 21 • Abdomen and Pelvis Imaging Procedures
CHAPTER 22 • Musculoskeletal Imaging Procedures
CHAPTER 23 • Interventional CT and CT Fluoroscopy
CHAPTER 24 • PET/CT Fusion Imaging
IMAGING PROCEDURES and
PROTOCOLS
IMAGING PROCEDURES and
PROTOCOLS
Section IVSection IV
Chap19.indd 237Chap19.indd 237 10/9/2009 2:41:02 PM10/9/2009 2:41:02 PM
238 Computed Tomography for Technologists: A Comprehensive Text
to another. Unless otherwise noted, protocols that include intravenous contrast enhancement use a 300 concentration, low- osmolality agent.
CT imaging increasingly relies on the integration of a variety of knowledge and skills. The fi rst three sections of this text provide information on physics, patient care, and cross-sectional anatomy necessary to understand and carry out CT examination protocols. Hence, this section is intended to be a culmination of the sections that precede it. Within most categories of the examination protocols, one or two topics have been selected for expository writing. These essays are included to demonstrate the interdependency of the information provided in previous sections and to encourage the reader to assemble the knowledge gained thus far into a cohesive whole. Readers will notice that these essays provide information that is not strictly necessary to know to perform a high-quality examination. However, both new and seasoned CT technologists will appreciate the “extra” information, such as the signs and symptoms of various diseases and conditions, as these are so often observed in clinical practice.
ROUTINE SCANNING PROCEDURESAlthough in actual practice there are exceptions to every rule, some standards of practice are assumed. We start with a discussion of these assumptions.
In all routine studies, one or two reference images (called “scouts” by some manufacturers) are acquired before scanning. The optimal reference image includes all areas to be scanned and therefore ensures that the anatomy to be imaged is within the range of the scanner (see Chapter 5).
Regardless of the type of scanner used, it is imperative that the operator input the correct directional instructions before scanning. This procedure requires indicating whether the patient is placed head or feet fi rst into the gantry and whether he or she is lying supine, prone, or in the decubitus position. If the operator accurately enters this information into the system, the software correctly annotates the image as to left-right, anterior-posterior, and superior-inferior orientation.
After the scout image is obtained, the operator selects the location of cross-sectional slices. Scan parameters such as mAs, kVp, display fi eld of view, and reconstruction algorithm(s) are selected. Most often, a preprogrammed group of scan parameters is selected so that the technologist must make only minor modifi cations to suit the particular patient or clinical indication.
It is important to correctly annotate the image as to whether contrast material is administered. All CT systems allow a notation concerning the use of contrast agents. Often, the notation +C is inputted after the introduction of contrast medium.
Routine procedure for some CT examinations includes scanning without contrast material, then repeating the study with intravenous contrast enhancement. Some protocols call for repeating the study at diff erent phases of contrast enhancement. Whenever possible, the repeat scans should be taken at the same location as the unenhanced images.
A history should be taken for all patients. For examinations that require contrast enhancement, the history must include allergies as well as any renal complications (see Chapter 11).
Careful breathing instructions should be given to all patients undergoing body scanning. Some manufacturers suggest that technologists use a coaching procedure to increase the length of breath-hold for a helical study. This coaching requires the patient to take several deep breaths before taking one fi nal breath and holding it for the maximum possible time, then exhaling slowly.
After completing a CT study, it is standard procedure to include a scout image that is cross-referenced by lines. These lines represent the location of each cross-sectional image. It is also typical to include patient data at the beginning or end of each examination. Data must then be stored in some fashion. The practice of transferring images to fi lm is dwindling, but by no means has disappeared. When picture, archive, and communication systems (PACS) are used, images must be transmitted to the appropriate radiologist’s workstation (Chapter 9). This information may also be included in a facility’s examination protocols.
Chap19.indd 238Chap19.indd 238 10/9/2009 2:41:06 PM10/9/2009 2:41:06 PM
239
Chapter 19
GENERAL IMAGING METHODS FOR THE HEADThe patient’s head is positioned in the head holder for most protocols of the head. Depending on the design of the head holder, it can sometimes also be used for neck proto-cols. When the head holder is not used, a molded sponge is placed directly on the scan table and the patient’s head is positioned within the sponge. In all cases, the patient should be made as comfortable as possible and immobi-lized as effectively as possible to prevent motion artifact on the images. This is often accomplished by placing small
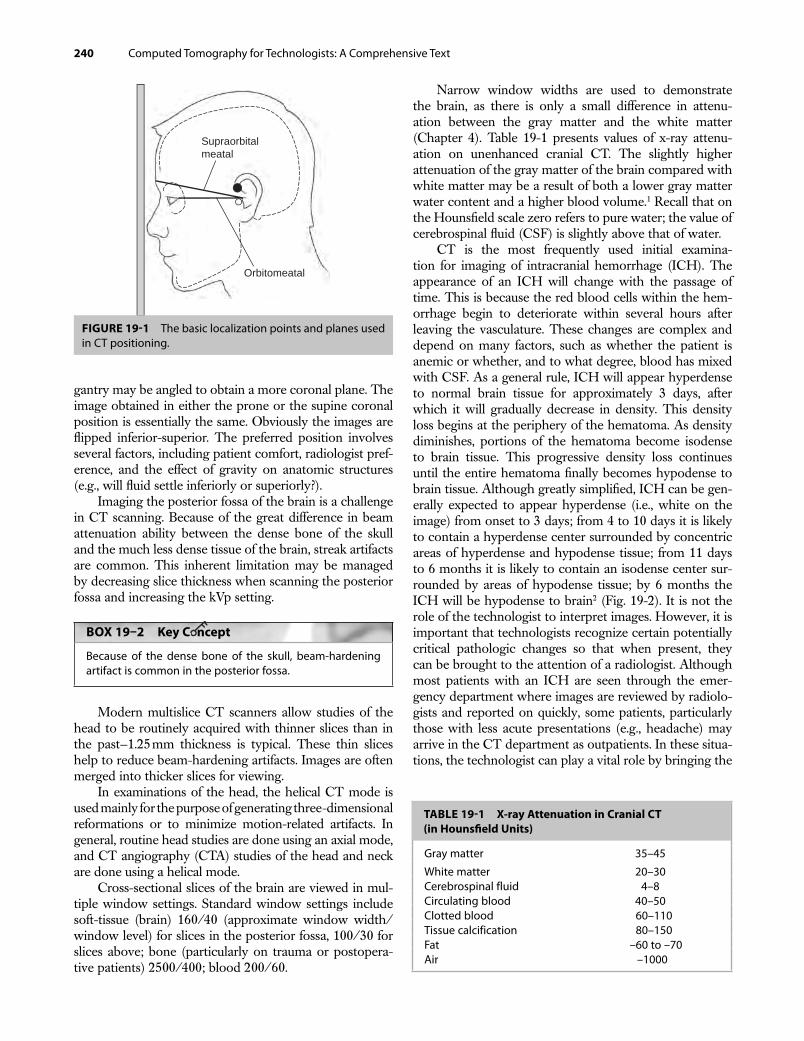
wedge sponges on either side of the patient’s head. In most cases it is not necessary to ask the patient to suspend breathing for CT studies of the head or neck. Anatomy displayed in cross-sectional slices will look slightly differ-ent depending on the angulation used. The slice angle is determined by the position of the patient’s head (i.e., mov-ing the chin up or down) and the angle of the gantry. It was once common to program the cross-sectional slices of the brain to be parallel to the orbitomeatal line; however, more recent practice favors using the supraorbital meatal line (also called the glabellomeatal line) to reduce radia-tion exposure to the lens of the eye. Figure 19-1 illustrates lines used for positioning. A disadvantage of many multi-detector CT systems is that they do not allow the gantry to be tilted when in helical mode. Therefore, axial (step-and-shoot) techniques are often used for routine brain imaging.
BOX 19–1 Key C ncept
Recent practice favors programming slices of the brain parallel to the supraorbital meatal line (rather than the orbital meatal line) to reduce radiation exposure to the lens of the eye.
Changing the image plane from axial to coronal may provide additional information. There are two methods of achieving a coronal position for head scanning. One is to place the patient prone on the scanning table and ask the patient to extend the chin forward. An alternative approach is to place the patient supine and ask him to drop his head back as far as possible. This position usually requires a spe-cialized head holder. In either position, the slice plane will be coronal. If the patient cannot extend the neck fully, the
Key Terms: supraorbital meatal line • glabellomeatal line • intracranial hemorrhage • Valsalva maneuver • split bolus • CT venography • thrombolytic therapy • completed or established stroke • cerebrovascular accident • stroke in evolution • progressive stroke • ischemic • hemorrhagic • thrombotic • embolic • subarachnoid hemorrhagic stroke • arteriovenous malformations • hypotensive stroke • transient ischemic attack (TIA) • atrial fi brillation • tissue plasminogen activator (t-PA) • penumbra • infarction • CT brain perfusion • rCBF • rCBV • MTT • central volume principle • basal ganglia • CVRC
NEUROLOGICIMAGING
PROCEDURES
NEUROLOGICIMAGING
PROCEDURES
Chap19.indd 239Chap19.indd 239 10/9/2009 2:41:10 PM10/9/2009 2:41:10 PM
240 Computed Tomography for Technologists: A Comprehensive Text
gantry may be angled to obtain a more coronal plane. The image obtained in either the prone or the supine coronal position is essentially the same. Obviously the images are fl ipped inferior-superior. The preferred position involves several factors, including patient comfort, radiologist pref-erence, and the effect of gravity on anatomic structures (e.g., will fl uid settle inferiorly or superiorly?).
Imaging the posterior fossa of the brain is a challenge in CT scanning. Because of the great difference in beam attenuation ability between the dense bone of the skull and the much less dense tissue of the brain, streak artifacts are common. This inherent limitation may be managed by decreasing slice thickness when scanning the posterior fossa and increasing the kVp setting.
BOX 19–2 Key C ncept
Because of the dense bone of the skull, beam-hardening artifact is common in the posterior fossa.
Modern multislice CT scanners allow studies of the head to be routinely acquired with thinner slices than in the past—1.25 mm thickness is typical. These thin slices help to reduce beam-hardening artifacts. Images are often merged into thicker slices for viewing.
In examinations of the head, the helical CT mode is used mainly for the purpose of generating three- dimensional reformations or to minimize motion-related artifacts. In general, routine head studies are done using an axial mode, and CT angiography (CTA) studies of the head and neck are done using a helical mode.
Cross-sectional slices of the brain are viewed in mul-tiple window settings. Standard window settings include soft-tissue (brain) 160/40 (approximate window width/window level) for slices in the posterior fossa, 100/30 for slices above; bone (particularly on trauma or postopera-tive patients) 2500/400; blood 200/60.
Narrow window widths are used to demonstrate the brain, as there is only a small difference in attenu-ation between the gray matter and the white matter (Chapter 4). Table 19-1 presents values of x-ray attenu-ation on unenhanced cranial CT. The slightly higher attenuation of the gray matter of the brain compared with white matter may be a result of both a lower gray matter water content and a higher blood volume.1 Recall that on the Hounsfi eld scale zero refers to pure water; the value of cerebrospinal fl uid (CSF) is slightly above that of water.
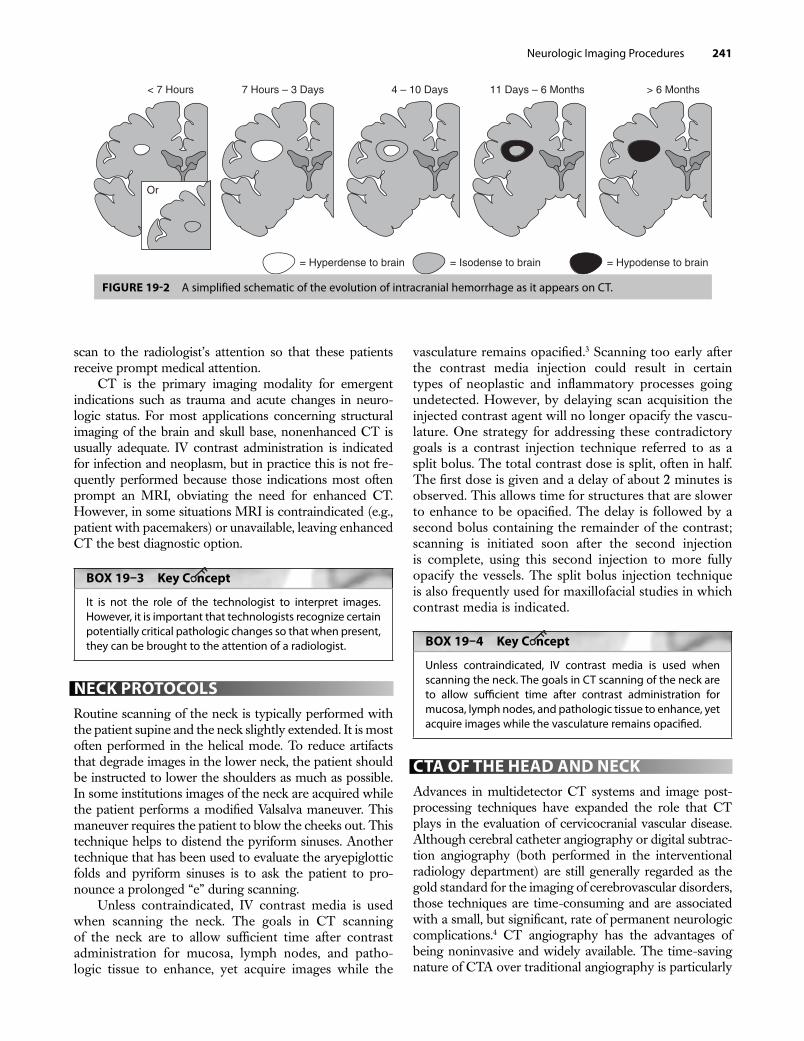
CT is the most frequently used initial examina-tion for imaging of intracranial hemorrhage (ICH). The appearance of an ICH will change with the passage of time. This is because the red blood cells within the hem-orrhage begin to deteriorate within several hours after leaving the vasculature. These changes are complex and depend on many factors, such as whether the patient is anemic or whether, and to what degree, blood has mixed with CSF. As a general rule, ICH will appear hyperdense to normal brain tissue for approximately 3 days, after which it will gradually decrease in density. This density loss begins at the periphery of the hematoma. As density diminishes, portions of the hematoma become isodense to brain tissue. This progressive density loss continues until the entire hematoma fi nally becomes hypodense to brain tissue. Although greatly simplifi ed, ICH can be gen-erally expected to appear hyperdense (i.e., white on the image) from onset to 3 days; from 4 to 10 days it is likely to contain a hyperdense center surrounded by concentric areas of hyperdense and hypodense tissue; from 11 days to 6 months it is likely to contain an isodense center sur-rounded by areas of hypodense tissue; by 6 months the ICH will be hypodense to brain2 (Fig. 19-2). It is not the role of the technologist to interpret images. However, it is important that technologists recognize certain potentially critical pathologic changes so that when present, they can be brought to the attention of a radiologist. Although most patients with an ICH are seen through the emer-gency department where images are reviewed by radiolo-gists and reported on quickly, some patients, particularly those with less acute presentations (e.g., headache) may arrive in the CT department as outpatients. In these situa-tions, the technologist can play a vital role by bringing the
Orbitomeatal
Supraorbital meatal
FIGURE 19-1 The basic localization points and planes used in CT positioning.
Gray matter 35–45
White matter 20–30Cerebrospinal fluid 4–8Circulating blood 40–50Clotted blood 60–110Tissue calcification 80–150Fat –60 to –70Air –1000
TABLE 19-1 X-ray Attenuation in Cranial CT (in Hounsfi eld Units)
Chap19.indd 240Chap19.indd 240 10/9/2009 2:41:12 PM10/9/2009 2:41:12 PM
Neurologic Imaging Procedures 241
scan to the radiologist’s attention so that these patients receive prompt medical attention.
CT is the primary imaging modality for emergent indications such as trauma and acute changes in neuro-logic status. For most applications concerning structural imaging of the brain and skull base, nonenhanced CT is usually adequate. IV contrast administration is indicated for infection and neoplasm, but in practice this is not fre-quently performed because those indications most often prompt an MRI, obviating the need for enhanced CT. However, in some situations MRI is contraindicated (e.g., patient with pacemakers) or unavailable, leaving enhanced CT the best diagnostic option.
BOX 19–3 Key C ncept
It is not the role of the technologist to interpret images. However, it is important that technologists recognize certain potentially critical pathologic changes so that when present, they can be brought to the attention of a radiologist.
NECK PROTOCOLSRoutine scanning of the neck is typically performed with the patient supine and the neck slightly extended. It is most often performed in the helical mode. To reduce artifacts that degrade images in the lower neck, the patient should be instructed to lower the shoulders as much as possible. In some institutions images of the neck are acquired while the patient performs a modifi ed Valsalva maneuver. This maneuver requires the patient to blow the cheeks out. This technique helps to distend the pyriform sinuses. Another technique that has been used to evaluate the aryepiglottic folds and pyriform sinuses is to ask the patient to pro-nounce a prolonged “e” during scanning.
Unless contraindicated, IV contrast media is used when scanning the neck. The goals in CT scanning of the neck are to allow suffi cient time after contrast administration for mucosa, lymph nodes, and patho-logic tissue to enhance, yet acquire images while the
vasculature remains opacifi ed.3 Scanning too early after the contrast media injection could result in certain types of neoplastic and infl ammatory processes going undetected. However, by delaying scan acquisition the injected contrast agent will no longer opacify the vascu-lature. One strategy for addressing these contradictory goals is a contrast injection technique referred to as a split bolus. The total contrast dose is split, often in half. The fi rst dose is given and a delay of about 2 minutes is observed. This allows time for structures that are slower to enhance to be opacifi ed. The delay is followed by a second bolus containing the remainder of the contrast; scanning is initiated soon after the second injection is complete, using this second injection to more fully opacify the vessels. The split bolus injection technique is also frequently used for maxillofacial studies in which contrast media is indicated.
BOX 19–4 Key C ncept
Unless contraindicated, IV contrast media is used when scanning the neck. The goals in CT scanning of the neck are to allow suffi cient time after contrast administration for mucosa, lymph nodes, and pathologic tissue to enhance, yet acquire images while the vasculature remains opacifi ed.
CTA OF THE HEAD AND NECKAdvances in multidetector CT systems and image post-processing techniques have expanded the role that CT plays in the evaluation of cervicocranial vascular disease. Although cerebral catheter angiography or digital subtrac-tion angiography (both performed in the interventional radiology department) are still generally regarded as the gold standard for the imaging of cerebrovascular disorders, those techniques are time-consuming and are associated with a small, but signifi cant, rate of permanent neurologic complications.4 CT angiography has the advantages of being noninvasive and widely available. The time-saving nature of CTA over traditional angiography is particularly
Or
< 7 Hours 7 Hours – 3 Days 4 – 10 Days 11 Days – 6 Months > 6 Months
= Hyperdense to brain = Isodense to brain = Hypodense to brain
FIGURE 19-2 A simplified schematic of the evolution of intracranial hemorrhage as it appears on CT.
Chap19.indd 241Chap19.indd 241 10/9/2009 2:41:13 PM10/9/2009 2:41:13 PM
242 Computed Tomography for Technologists: A Comprehensive Text
important in the case of patients suspected of suffering an acute stroke in which treatment decisions must be made quickly (a more detailed discussion of stroke begins at the end of this page). In addition, cerebral CTA can be com-bined with brain perfusion imaging to assess the viability of brain parenchyma and its vascular supply. Cerebral and carotid CTA techniques provide important information about vessel walls; three-dimensional postprocessing of the image data depicts the spatial relationship of complex vascular lesions to the surrounding structures, provid-ing valuable information for the surgeon. Rapid, high-resolution scans are taken while contrast is in the arterial enhancement phase. The goals of CTA for cervicocra-nial vascular evaluation can be summarized as follows: 1) to accurately measure stenosis of the carotid and verte-bral arteries and their branches, 2) to evaluate the circle of Willis for completeness using three-dimensional reforma-tions of cerebral vasculature in relation to other structures, and 3) to detect other vascular lesions, such as dissections or occlusions. A modifi cation of CTA, called CT venog-raphy (CTV) is used for the depiction of venous anatomy. Scan parameters are quite similar to CTA, except images are acquired while contrast is in the venous enhancement phase.
SPINE PROTOCOLSCompared with conventional radiography, CT exami-nations of the spine produce images with inherently high soft tissue contrast. This contrast permits the visu-alization of structures such as the intervertebral disks, ligaments, and muscle, as well as bone detail. Visualiza-tion of intradural structures is improved by the intrath-ecal administration of water-soluble contrast material (Chapter 12). CT examinations are performed after myelography to enhance or clarify myelographic fi nd-ings of intradural and extradural abnormalities. MRI provides even higher soft tissue sensitivity than CT, and in certain circumstances, it is the modality of choice for imaging the spine (e.g., multiple sclerosis, hydromyelia, syringomyelia). For some conditions, such as spinal stenosis, MRI is equivalent to CT. In some situations, CT is considered superior to MRI, such as in the evalu-ation of bony abnormalities of the spine.
Scans of the spine are often obtained after intrathecal contrast material is given for a fl uoroscopic myelography study. Intrathecal contrast medium may be helpful for the diagnosis of degenerative disk disease and other disk dis-eases, such as extradural neoplasm. Most reports suggest a delay of 1 to 3 hours between the intrathecal injection and scanning. This delay allows the contrast material to dilute. If the scans are performed while the contrast material is too dense, intradural structures may be masked. Rolling the patient once or twice before scanning is recommended to mix the contrast material that may have settled since the myelogram.
BOX 19–5 Key C ncept
When CT is performed after intrathecal contrast administra-tion for fl uoroscopic myelography, a delay of 1 to 3 hours between the contrast injection and scanning is recom-mended. This delay allows the contrast material to become suffi ciently dilute.
Proper localization is essential in scanning the spine. All studies should include scout images in both antero-posterior (AP) and lateral projections. The scouts will per-mit vertebral levels to be readily counted and classifi ed to ensure that scans are taken at the appropriate levels. When scanning the lumbar spine, it is important to note whether the patient has a sixth lumbar vertebra (an ana-tomic variant) that requires additional scans.
SPECIFIC NEUROLOGIC PROTOCOLSConcepts learned in previous chapters can be applied to scanning the head, neck, and spine. Neurologic CT pro-tocols are often designed to meets the needs of a specifi c structure or organ (i.e., circle of Willis) or to adapt to a particular clinical indication (i.e., suspected spinal arterio-venous malformation). Many factors must be considered in the development of a scanning protocol. The follow-ing detailed discussion of stroke and CT brain perfusion is presented here to provide the reader with a broader understanding of the many issues that may be taken into consideration in the design of CT protocols. Examples of various protocols are provided at the end of the chapter.
A Profi le of StrokeIntroductionThe American Heart Association reports that cerebrovascular disorders such as ischemic and hemorrhagic strokes consti-tute the third most frequent cause of death in North America. Equally alarming, stroke is the leading cause of long-term dis-ability. Approximately 20 to 30% of stroke victims do not survive, and 55% of stroke survivors have a disability.5 Despite the signifi cant advances in the treatment of stroke in recent years, cerebrovascular disorders continue to pose a consider-able challenge to acute neurovascular management.
Therapeutic options, such as thrombolytic therapy, can limit the extent of brain injury and improve outcome after stroke when administered to patients who fall within narrow clinical guidelines. Many of these therapies are only effective if given early after the stroke has begun, hence the criticality of emergent imaging. However, these therapies are expensive and may result in potentially life-threatening complications, drawbacks that make it crucial that each case be assessed by its individual risk-benefi t ratio. Most important, the loca-tion and extent of the ischemic lesion, combined with the severity of the blood fl ow reduction, are the main factors that predict outcome in the treatment of stroke.6 These
Chap19.indd 242Chap19.indd 242 10/9/2009 2:41:13 PM10/9/2009 2:41:13 PM
Neurologic Imaging Procedures 243
factors demand an assessment of cerebral blood circulation to determine whether a conservative or a more aggressive therapy is needed in the early stage of stroke.
To adequately explain cerebrovascular disorders it is necessary to begin with an analysis of the basic physi-ologic processes that result in the origin and develop-ment of stroke. This review will defi ne common terms, list symptoms, and present risk factors. In the following sec-tion we discuss CT perfusion, a newer diagnostic option in the assessment of acute stroke.
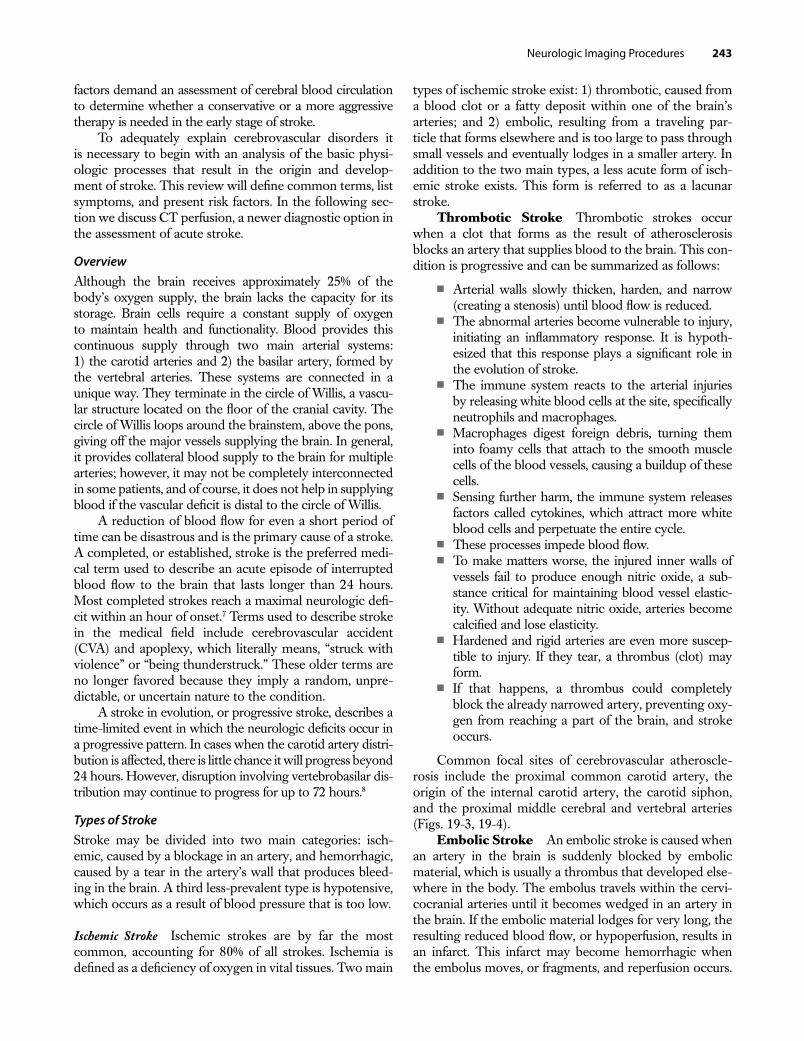
OverviewAlthough the brain receives approximately 25% of the body’s oxygen supply, the brain lacks the capacity for its storage. Brain cells require a constant supply of oxygen to maintain health and functionality. Blood provides this continuous supply through two main arterial systems: 1) the carotid arteries and 2) the basilar artery, formed by the vertebral arteries. These systems are connected in a unique way. They terminate in the circle of Willis, a vascu-lar structure located on the fl oor of the cranial cavity. The circle of Willis loops around the brainstem, above the pons, giving off the major vessels supplying the brain. In general, it provides collateral blood supply to the brain for multiple arteries; however, it may not be completely interconnected in some patients, and of course, it does not help in supplying blood if the vascular defi cit is distal to the circle of Willis.
A reduction of blood fl ow for even a short period of time can be disastrous and is the primary cause of a stroke. A completed, or established, stroke is the preferred medi-cal term used to describe an acute episode of interrupted blood fl ow to the brain that lasts longer than 24 hours. Most completed strokes reach a maximal neurologic defi -cit within an hour of onset.7 Terms used to describe stroke in the medical fi eld include cerebrovascular accident (CVA) and apoplexy, which literally means, “struck with violence” or “being thunderstruck.” These older terms are no longer favored because they imply a random, unpre-dictable, or uncertain nature to the condition.
A stroke in evolution, or progressive stroke, describes a time-limited event in which the neurologic defi cits occur in a progressive pattern. In cases when the carotid artery distri-bution is affected, there is little chance it will progress beyond 24 hours. However, disruption involving vertebrobasilar dis-tribution may continue to progress for up to 72 hours.8
Types of StrokeStroke may be divided into two main categories: isch-emic, caused by a blockage in an artery, and hemorrhagic, caused by a tear in the artery’s wall that produces bleed-ing in the brain. A third less-prevalent type is hypotensive, which occurs as a result of blood pressure that is too low.
Ischemic Stroke Ischemic strokes are by far the most common, accounting for 80% of all strokes. Ischemia is defi ned as a defi ciency of oxygen in vital tissues. Two main
types of ischemic stroke exist: 1) thrombotic, caused from a blood clot or a fatty deposit within one of the brain’s arteries; and 2) embolic, resulting from a traveling par-ticle that forms elsewhere and is too large to pass through small vessels and eventually lodges in a smaller artery. In addition to the two main types, a less acute form of isch-emic stroke exists. This form is referred to as a lacunar stroke.
Thrombotic Stroke Thrombotic strokes occur when a clot that forms as the result of atherosclerosis blocks an artery that supplies blood to the brain. This con-dition is progressive and can be summarized as follows:
■ Arterial walls slowly thicken, harden, and narrow (creating a stenosis) until blood fl ow is reduced.
■ The abnormal arteries become vulnerable to injury, initiating an infl ammatory response. It is hypoth-esized that this response plays a signifi cant role in the evolution of stroke.
■ The immune system reacts to the arterial injuries by releasing white blood cells at the site, specifi cally neutrophils and macrophages.
■ Macrophages digest foreign debris, turning them into foamy cells that attach to the smooth muscle cells of the blood vessels, causing a buildup of these cells.
■ Sensing further harm, the immune system releases factors called cytokines, which attract more white blood cells and perpetuate the entire cycle.
■ These processes impede blood fl ow.■ To make matters worse, the injured inner walls of
vessels fail to produce enough nitric oxide, a sub-stance critical for maintaining blood vessel elastic-ity. Without adequate nitric oxide, arteries become calcifi ed and lose elasticity.
■ Hardened and rigid arteries are even more suscep-tible to injury. If they tear, a thrombus (clot) may form.
■ If that happens, a thrombus could completely block the already narrowed artery, preventing oxy-gen from reaching a part of the brain, and stroke occurs.
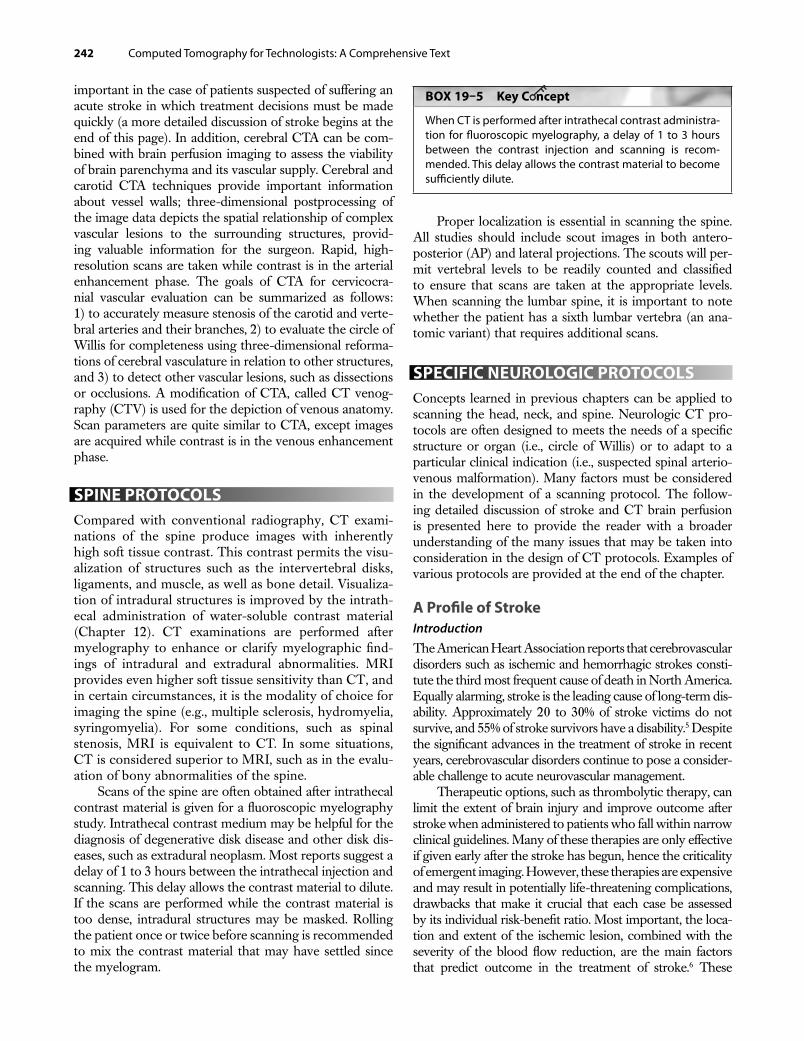
Common focal sites of cerebrovascular atheroscle-rosis include the proximal common carotid artery, the origin of the internal carotid artery, the carotid siphon, and the proximal middle cerebral and vertebral arteries (Figs. 19-3, 19-4).
Embolic Stroke An embolic stroke is caused when an artery in the brain is suddenly blocked by embolic material, which is usually a thrombus that developed else-where in the body. The embolus travels within the cervi-cocranial arteries until it becomes wedged in an artery in the brain. If the embolic material lodges for very long, the resulting reduced blood fl ow, or hypoperfusion, results in an infarct. This infarct may become hemorrhagic when the embolus moves, or fragments, and reperfusion occurs.
Chap19.indd 243Chap19.indd 243 10/9/2009 2:41:13 PM10/9/2009 2:41:13 PM
244 Computed Tomography for Technologists: A Comprehensive Text
The clinical fi ndings depend on the location of the brain artery affected.
Emboli account for about 60% of strokes and may result from the following conditions:
■ Atrial fi brillation, an abnormal rhythm (rapid quiv-ering beat) in the atrium of the heart. The irregu-lar beat may cause some blood to remain in the heart chamber where it forms clots, which then can break off and travel to the brain as emboli. Blood clots originally formed as a result of atrial fi brillation comprise approximately 15% of embolic strokes.
■ At the site of artifi cial heart valves or as a result of heart valve disorders.
■ After a heart attack or in association with heart fail-ure, as a result of areas of the ventricles that do not move properly, allowing blood to stagnate and clot.
■ From fat particles, tumor cells, or air bubbles that travel through the bloodstream. This type of emboli is rare.
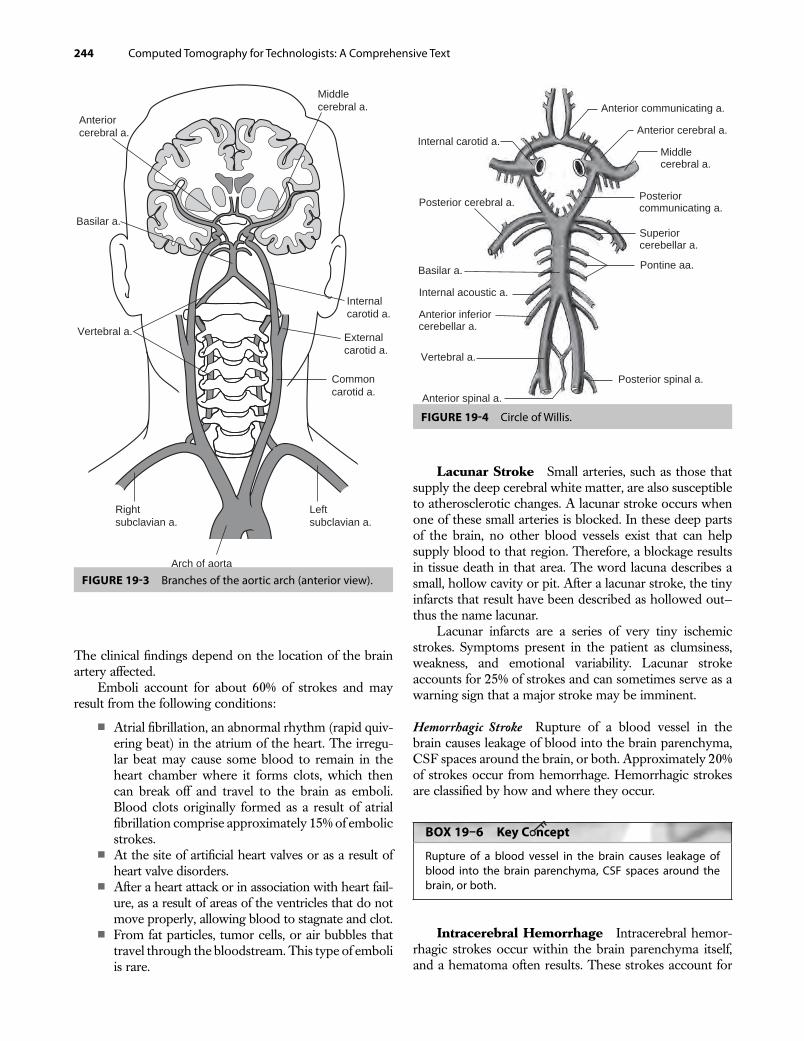
Lacunar Stroke Small arteries, such as those that supply the deep cerebral white matter, are also susceptible to atherosclerotic changes. A lacunar stroke occurs when one of these small arteries is blocked. In these deep parts of the brain, no other blood vessels exist that can help supply blood to that region. Therefore, a blockage results in tissue death in that area. The word lacuna describes a small, hollow cavity or pit. After a lacunar stroke, the tiny infarcts that result have been described as hollowed out—thus the name lacunar.
Lacunar infarcts are a series of very tiny ischemic strokes. Symptoms present in the patient as clumsiness, weakness, and emotional variability. Lacunar stroke accounts for 25% of strokes and can sometimes serve as a warning sign that a major stroke may be imminent.
Hemorrhagic Stroke Rupture of a blood vessel in the brain causes leakage of blood into the brain parenchyma, CSF spaces around the brain, or both. Approximately 20% of strokes occur from hemorrhage. Hemorrhagic strokes are classifi ed by how and where they occur.
BOX 19–6 Key C ncept
Rupture of a blood vessel in the brain causes leakage of blood into the brain parenchyma, CSF spaces around the brain, or both.
Intracerebral Hemorrhage Intracerebral hemor-rhagic strokes occur within the brain parenchyma itself, and a hematoma often results. These strokes account for
Vertebral a.
Arch of aorta
Left subclavian a.
Right subclavian a.
Common carotid a.
External carotid a.
Basilar a.
Internal carotid a.
Middle cerebral a.
Anterior cerebral a.
FIGURE 19-3 Branches of the aortic arch (anterior view).
Anterior communicating a.
Anterior cerebral a.
Middle cerebral a.
Posterior communicating a.
Internal carotid a.
Posterior cerebral a.
Pontine aa.Basilar a.
Internal acoustic a.
Anterior inferior cerebellar a.
Vertebral a.
Superior cerebellar a.
Posterior spinal a.
Anterior spinal a.
FIGURE 19-4 Circle of Willis.
Chap19.indd 244Chap19.indd 244 10/9/2009 2:41:14 PM10/9/2009 2:41:14 PM
Neurologic Imaging Procedures 245
more than half of hemorrhagic strokes. Most often, they result from hypertension, which exerts excessive pres-sure on arterial walls already damaged by atherosclerosis. Heart attack patients who have been given drugs either to break up blood clots or to “thin blood” to reduce the likelihood of developing clots have a slightly elevated risk of this type of stroke.
Subarachnoid Hemorrhage Subarachnoid hem-orrhagic strokes occur when there is bleeding into the subarachnoid spaces and the CSF spaces. These strokes are usually caused by the rupture of an aneurysm.
Arteriovenous Malformation Arteriovenous malformations (AVMs) are composed of tangles of arter-ies and arterialized veins. There is brain tissue interposed between the vessels, but it is usually abnormal and often scarred from previous tiny hemorrhages. The patient may not have been aware of these tiny hemorrhages or may have experienced them as bad headaches.
Normally, blood enters brain tissue through major cerebral arteries, and then passes through smaller arterioles and subsequently into the capillary bed. It is at the capil-lary level that the exchange of oxygen and glucose in brain cells occurs. A drop in pressure usually occurs as the blood travels from the arteries to the veins. The blood, depleted of oxygen, then enters the venous system to continue its systemic circulation.
When an AVM exists, blood is shunted directly from the arterial system to the venous system. This shunting allows oxygenated blood to enter the veins. In AVMs, the fl ow is high and the pressure is elevated within the veins. The elevated pressure can cause the vessels to rupture, resulting in a hemorrhagic stroke.
Hypotensive Stroke Although rare, blood pressure that is too low can reduce oxygen supply to the brain enough to cause a stroke. Systemic hypoperfusion results when blood fl ow to the brain is lowered to a level too severe to be compensated by cerebral autoregulation mecha-nisms. These hypotensive episodes can be caused by car-diac pump failure, a major bleeding episode that causes a global decrease in cerebral blood fl ow, an overwhelming infection, or although rarely, from surgical anesthesia or overtreated high blood pressure. Hypotensive episodes cause infarction in the border zones between the major cerebral arteries, sometimes referred to as a watershed infarction, as well as widespread bilateral cerebral dysfunc-tion. The primary areas of damage are within the circle of Willis between the anterior and middle cerebral arteries, and between the middle and posterior cerebral arteries in the parieto-occipital regions of the cerebral hemispheres6 (Fig. 19-4).
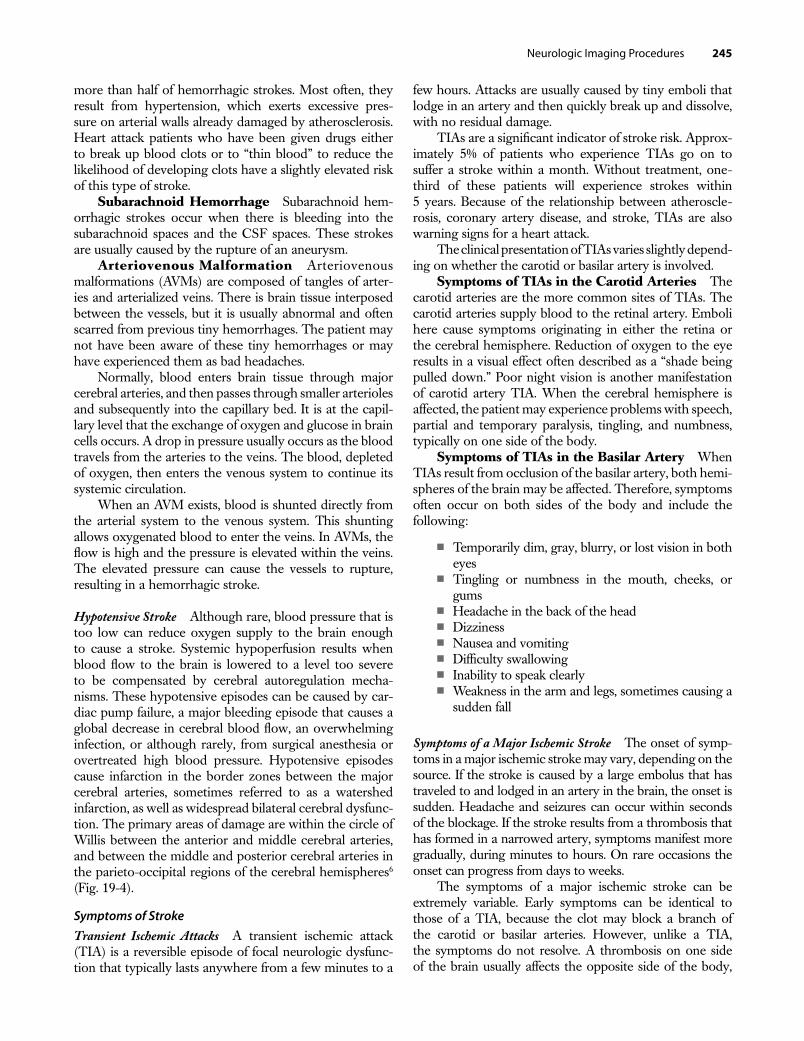
Symptoms of StrokeTransient Ischemic Attacks A transient ischemic attack (TIA) is a reversible episode of focal neurologic dysfunc-tion that typically lasts anywhere from a few minutes to a
few hours. Attacks are usually caused by tiny emboli that lodge in an artery and then quickly break up and dissolve, with no residual damage.
TIAs are a signifi cant indicator of stroke risk. Approx-imately 5% of patients who experience TIAs go on to suffer a stroke within a month. Without treatment, one-third of these patients will experience strokes within 5 years. Because of the relationship between atheroscle-rosis, coronary artery disease, and stroke, TIAs are also warning signs for a heart attack.
The clinical presentation of TIAs varies slightly depend-ing on whether the carotid or basilar artery is involved.
Symptoms of TIAs in the Carotid Arteries The carotid arteries are the more common sites of TIAs. The carotid arteries supply blood to the retinal artery. Emboli here cause symptoms originating in either the retina or the cerebral hemisphere. Reduction of oxygen to the eye results in a visual effect often described as a “shade being pulled down.” Poor night vision is another manifestation of carotid artery TIA. When the cerebral hemisphere is affected, the patient may experience problems with speech, partial and temporary paralysis, tingling, and numbness, typically on one side of the body.
Symptoms of TIAs in the Basilar Artery When TIAs result from occlusion of the basilar artery, both hemi-spheres of the brain may be affected. Therefore, symptoms often occur on both sides of the body and include the following:
■ Temporarily dim, gray, blurry, or lost vision in both eyes
■ Tingling or numbness in the mouth, cheeks, or gums
■ Headache in the back of the head■ Dizziness■ Nausea and vomiting■ Diffi culty swallowing■ Inability to speak clearly■ Weakness in the arm and legs, sometimes causing a
sudden fall
Symptoms of a Major Ischemic Stroke The onset of symp-toms in a major ischemic stroke may vary, depending on the source. If the stroke is caused by a large embolus that has traveled to and lodged in an artery in the brain, the onset is sudden. Headache and seizures can occur within seconds of the blockage. If the stroke results from a thrombosis that has formed in a narrowed artery, symptoms manifest more gradually, during minutes to hours. On rare occasions the onset can progress from days to weeks.
The symptoms of a major ischemic stroke can be extremely variable. Early symptoms can be identical to those of a TIA, because the clot may block a branch of the carotid or basilar arteries. However, unlike a TIA, the symptoms do not resolve. A thrombosis on one side of the brain usually affects the opposite side of the body,
Chap19.indd 245Chap19.indd 245 10/9/2009 2:41:14 PM10/9/2009 2:41:14 PM
246 Computed Tomography for Technologists: A Comprehensive Text
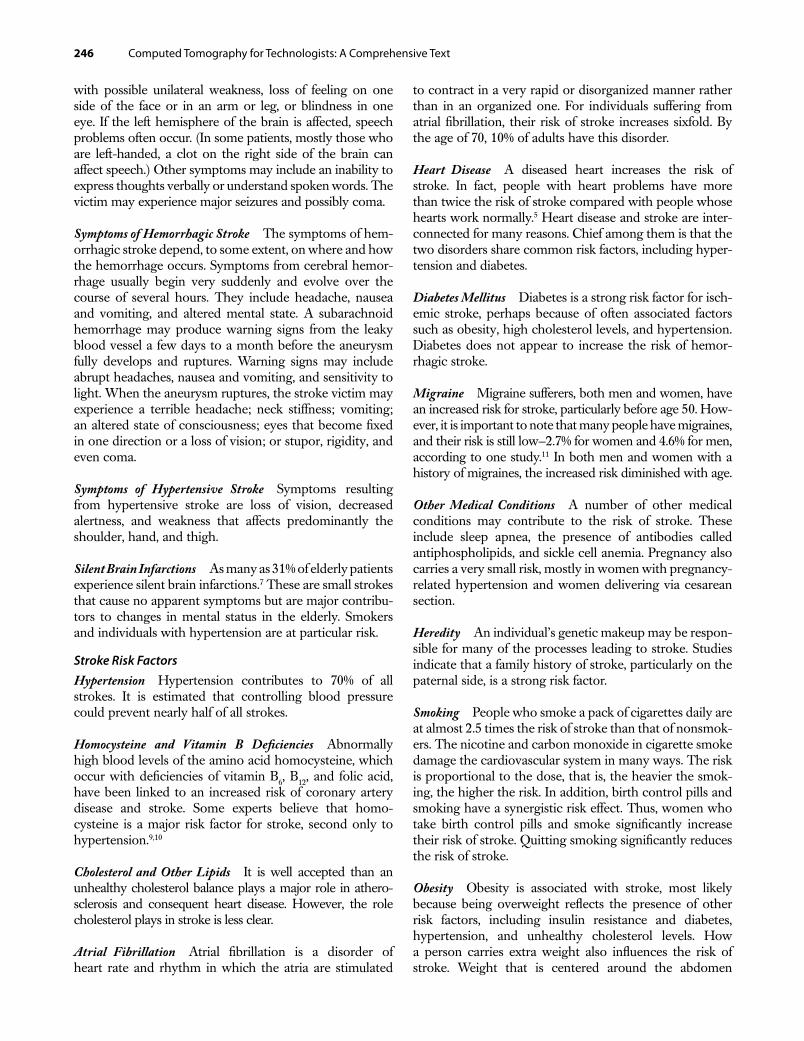
with possible unilateral weakness, loss of feeling on one side of the face or in an arm or leg, or blindness in one eye. If the left hemisphere of the brain is affected, speech problems often occur. (In some patients, mostly those who are left-handed, a clot on the right side of the brain can affect speech.) Other symptoms may include an inability to express thoughts verbally or understand spoken words. The victim may experience major seizures and possibly coma.
Symptoms of Hemorrhagic Stroke The symptoms of hem-orrhagic stroke depend, to some extent, on where and how the hemorrhage occurs. Symptoms from cerebral hemor-rhage usually begin very suddenly and evolve over the course of several hours. They include headache, nausea and vomiting, and altered mental state. A subarachnoid hemorrhage may produce warning signs from the leaky blood vessel a few days to a month before the aneurysm fully develops and ruptures. Warning signs may include abrupt headaches, nausea and vomiting, and sensitivity to light. When the aneurysm ruptures, the stroke victim may experience a terrible headache; neck stiffness; vomiting; an altered state of consciousness; eyes that become fi xed in one direction or a loss of vision; or stupor, rigidity, and even coma.
Symptoms of Hypertensive Stroke Symptoms resulting from hypertensive stroke are loss of vision, decreased alertness, and weakness that affects predominantly the shoulder, hand, and thigh.
Silent Brain Infarctions As many as 31% of elderly patients experience silent brain infarctions.7 These are small strokes that cause no apparent symptoms but are major contribu-tors to changes in mental status in the elderly. Smokers and individuals with hypertension are at particular risk.
Stroke Risk FactorsHypertension Hypertension contributes to 70% of all strokes. It is estimated that controlling blood pressure could prevent nearly half of all strokes.
Homocysteine and Vitamin B Defi ciencies Abnormally high blood levels of the amino acid homocysteine, which occur with defi ciencies of vitamin B6, B12, and folic acid, have been linked to an increased risk of coronary artery disease and stroke. Some experts believe that homo-cysteine is a major risk factor for stroke, second only to hypertension.9,10
Cholesterol and Other Lipids It is well accepted than an unhealthy cholesterol balance plays a major role in athero-sclerosis and consequent heart disease. However, the role cholesterol plays in stroke is less clear.
Atrial Fibrillation Atrial fi brillation is a disorder of heart rate and rhythm in which the atria are stimulated
to contract in a very rapid or disorganized manner rather than in an organized one. For individuals suffering from atrial fi brillation, their risk of stroke increases sixfold. By the age of 70, 10% of adults have this disorder.
Heart Disease A diseased heart increases the risk of stroke. In fact, people with heart problems have more than twice the risk of stroke compared with people whose hearts work normally.5 Heart disease and stroke are inter-connected for many reasons. Chief among them is that the two disorders share common risk factors, including hyper-tension and diabetes.
Diabetes Mellitus Diabetes is a strong risk factor for isch-emic stroke, perhaps because of often associated factors such as obesity, high cholesterol levels, and hypertension. Diabetes does not appear to increase the risk of hemor-rhagic stroke.
Migraine Migraine sufferers, both men and women, have an increased risk for stroke, particularly before age 50. How-ever, it is important to note that many people have migraines, and their risk is still low—2.7% for women and 4.6% for men, according to one study.11 In both men and women with a history of migraines, the increased risk diminished with age.
Other Medical Conditions A number of other medical conditions may contribute to the risk of stroke. These include sleep apnea, the presence of antibodies called antiphospholipids, and sickle cell anemia. Pregnancy also carries a very small risk, mostly in women with pregnancy-related hypertension and women delivering via cesarean section.
Heredity An individual’s genetic makeup may be respon-sible for many of the processes leading to stroke. Studies indicate that a family history of stroke, particularly on the paternal side, is a strong risk factor.
Smoking People who smoke a pack of cigarettes daily are at almost 2.5 times the risk of stroke than that of nonsmok-ers. The nicotine and carbon monoxide in cigarette smoke damage the cardiovascular system in many ways. The risk is proportional to the dose, that is, the heavier the smok-ing, the higher the risk. In addition, birth control pills and smoking have a synergistic risk effect. Thus, women who take birth control pills and smoke signifi cantly increase their risk of stroke. Quitting smoking signifi cantly reduces the risk of stroke.
Obesity Obesity is associated with stroke, most likely because being overweight refl ects the presence of other risk factors, including insulin resistance and diabetes, hypertension, and unhealthy cholesterol levels. How a person carries extra weight also infl uences the risk of stroke. Weight that is centered around the abdomen
Chap19.indd 246Chap19.indd 246 10/9/2009 2:41:14 PM10/9/2009 2:41:14 PM
Neurologic Imaging Procedures 247
(i.e., “apple shape”) has a greater association with stroke than weight distributed around the hips (i.e., “pear shape”).
Alcohol and Drug Abuse Heavy alcohol use is associ-ated with a higher risk of both ischemic and hemorrhagic stroke. However, studies have indicated that moderate alcohol use does not increase an individual’s risk of stroke and may even lower the risk of ischemic stroke.12
Intravenous drug abuse carries a high risk of stroke from cerebral embolism. Cocaine and methamphetamine are major factors in the incidence of stroke in young adults. Steroids used for bodybuilding also increase stroke risk.
Diagnosis and Treatment of Stroke Although a detailed review of the many issues and options surrounding the treatment of stroke is beyond the scope of this text, it is worthwhile to touch on advances made in the past decade that have increased the importance of CT imaging in the diagnosis and treatment of stroke.
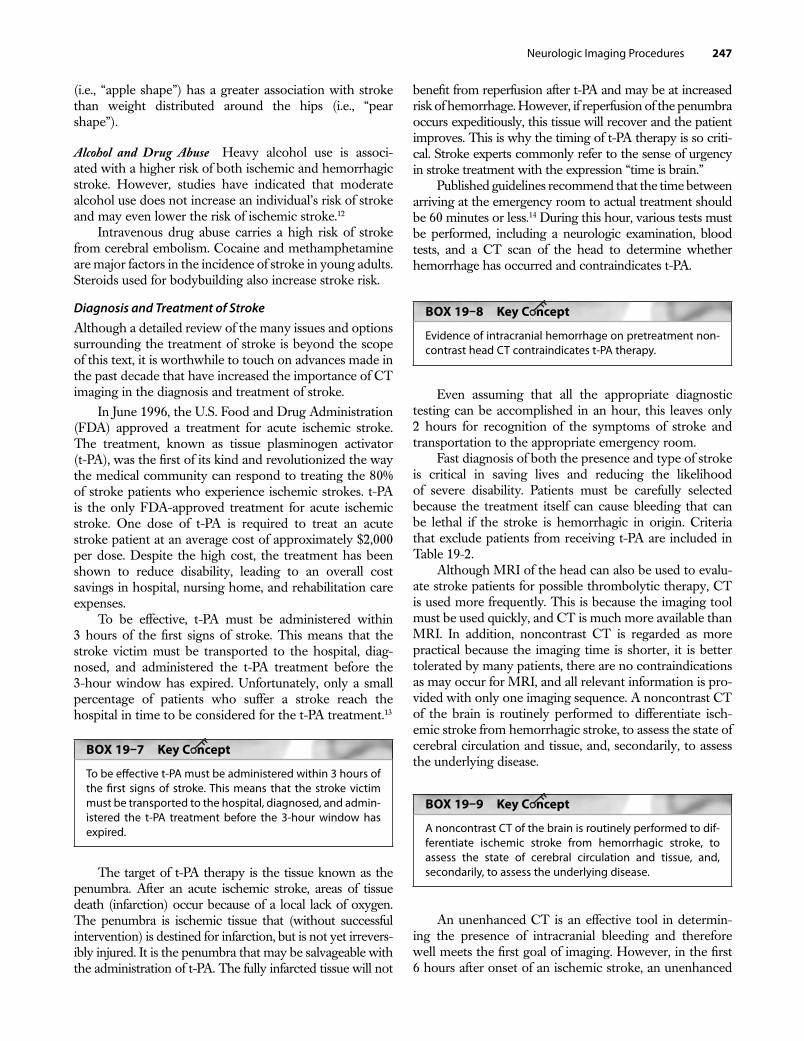
In June 1996, the U.S. Food and Drug Administration (FDA) approved a treatment for acute ischemic stroke. The treatment, known as tissue plasminogen activator (t-PA), was the fi rst of its kind and revolutionized the way the medical community can respond to treating the 80% of stroke patients who experience ischemic strokes. t-PA is the only FDA-approved treatment for acute ischemic stroke. One dose of t-PA is required to treat an acute stroke patient at an average cost of approximately $2,000 per dose. Despite the high cost, the treatment has been shown to reduce disability, leading to an overall cost savings in hospital, nursing home, and rehabilitation care expenses.
To be effective, t-PA must be administered within 3 hours of the fi rst signs of stroke. This means that the stroke victim must be transported to the hospital, diag-nosed, and administered the t-PA treatment before the 3-hour window has expired. Unfortunately, only a small percentage of patients who suffer a stroke reach the hospital in time to be considered for the t-PA treatment.13
BOX 19–7 Key C ncept
To be eff ective t-PA must be administered within 3 hours of the fi rst signs of stroke. This means that the stroke victim must be transported to the hospital, diagnosed, and admin-istered the t-PA treatment before the 3-hour window has expired.
The target of t-PA therapy is the tissue known as the penumbra. After an acute ischemic stroke, areas of tissue death (infarction) occur because of a local lack of oxygen. The penumbra is ischemic tissue that (without successful intervention) is destined for infarction, but is not yet irrevers-ibly injured. It is the penumbra that may be salvageable with the administration of t-PA. The fully infarcted tissue will not
benefi t from reperfusion after t-PA and may be at increased risk of hemorrhage. However, if reperfusion of the penumbra occurs expeditiously, this tissue will recover and the patient improves. This is why the timing of t-PA therapy is so criti-cal. Stroke experts commonly refer to the sense of urgency in stroke treatment with the expression “time is brain.”
Published guidelines recommend that the time between arriving at the emergency room to actual treatment should be 60 minutes or less.14 During this hour, various tests must be performed, including a neurologic examination, blood tests, and a CT scan of the head to determine whether hemorrhage has occurred and contraindicates t-PA.
BOX 19–8 Key C ncept
Evidence of intracranial hemorrhage on pretreatment non-contrast head CT contraindicates t-PA therapy.
Even assuming that all the appropriate diagnostic testing can be accomplished in an hour, this leaves only 2 hours for recognition of the symptoms of stroke and transportation to the appropriate emergency room.
Fast diagnosis of both the presence and type of stroke is critical in saving lives and reducing the likelihood of severe disability. Patients must be carefully selected because the treatment itself can cause bleeding that can be lethal if the stroke is hemorrhagic in origin. Criteria that exclude patients from receiving t-PA are included in Table 19-2.
Although MRI of the head can also be used to evalu-ate stroke patients for possible thrombolytic therapy, CT is used more frequently. This is because the imaging tool must be used quickly, and CT is much more available than MRI. In addition, noncontrast CT is regarded as more practical because the imaging time is shorter, it is better tolerated by many patients, there are no contraindications as may occur for MRI, and all relevant information is pro-vided with only one imaging sequence. A noncontrast CT of the brain is routinely performed to differentiate isch-emic stroke from hemorrhagic stroke, to assess the state of cerebral circulation and tissue, and, secondarily, to assess the underlying disease.
BOX 19–9 Key C ncept
A noncontrast CT of the brain is routinely performed to dif-ferentiate ischemic stroke from hemorrhagic stroke, to assess the state of cerebral circulation and tissue, and, secondarily, to assess the underlying disease.
An unenhanced CT is an effective tool in determin-ing the presence of intracranial bleeding and therefore well meets the fi rst goal of imaging. However, in the fi rst 6 hours after onset of an ischemic stroke, an unenhanced
Chap19.indd 247Chap19.indd 247 10/9/2009 2:41:14 PM10/9/2009 2:41:14 PM
248 Computed Tomography for Technologists: A Comprehensive Text
CT will remain normal in about one-third of patients because the ischemia does not reach the critical level of structural integrity. Studies such as CT perfusion and CT angiography are sometimes done in addition to the non-contrast CT scan to address the other goal of imaging, to assess the state of the cerebral circulation and tissue. CT perfusion techniques measure cerebral blood fl ow, whereas CT angiography of the carotid arteries and vessels of the circle of Willis can demonstrate stenosis or occlusion of extracranial and intracranial arteries.
CT Brain Perfusion ScansVarious attempts have been made to establish a CT method to allow qualitative and quantitative evaluation of cerebral perfusion. CT perfusion provides this information by calcu-lating regional blood fl ow (rCBF) and regional blood volume (rCBV) and mean transit time (MTT). Perfusion studies are obtained by monitoring the passage of iodinated contrast through the cerebral vasculature. Attractive characteristics of this approach are the widespread availability of CT scanners, their high image quality, and relatively low costs. In addition, simply extending the routine CT examination eliminates time-consuming transport of patients between CT and MR scanners that serves to further delay treatment.
BOX 19–10 Key C ncept
Perfusion studies are obtained by monitoring the passage of iodinated contrast through the cerebral vasculature.
CT perfusion software that interfaces with helical scanners can meet the clinical needs for evaluation of acute and subacute stroke. Such applications produce a quantitative measure of regional hemodynamics by demonstrating blood fl ow in each pixel of the cerebral
parenchyma that is imaged. The technique is based on the central volume principle, which states that cerebral blood volume can be calculated as the product of the total cere-bral blood fl ow and the time needed for the cerebral blood passage: CBF = CBV/MTT. A workstation equipped with commercially available perfusion software can perform these complex calculations quickly. The goal in perform-ing perfusion studies for patients with acute stroke is to distinguish infarcted tissue from the penumbra.
Technical FactorsThe most common technique associated with CT perfu-sion scanning is based on the fi rst pass of a contrast bolus through the brain tissue. With this technique a 50-mL IV bolus of a nonionic low osmolality contrast is injected at 4 to 5 mL/s. A helical scanner is used to produce a dynamic set of images at a single location. A 5-second scan delay is used; slices are typically 5 mm thick. Typical scan dura-tions are in the range of 40 to 45 seconds.
The slices are produced by repeatedly scanning the same region at the same table position, a technique some manufacturers refer to as the cine mode. Multislice scanners allow several z position slices to be scanned simultaneously. Scans are typically acquired at 5-mm sections to lessen beam-hardening artifacts, and then reformatted into 10-mm-thick sections for viewing to improve the signal-to-noise ratio.
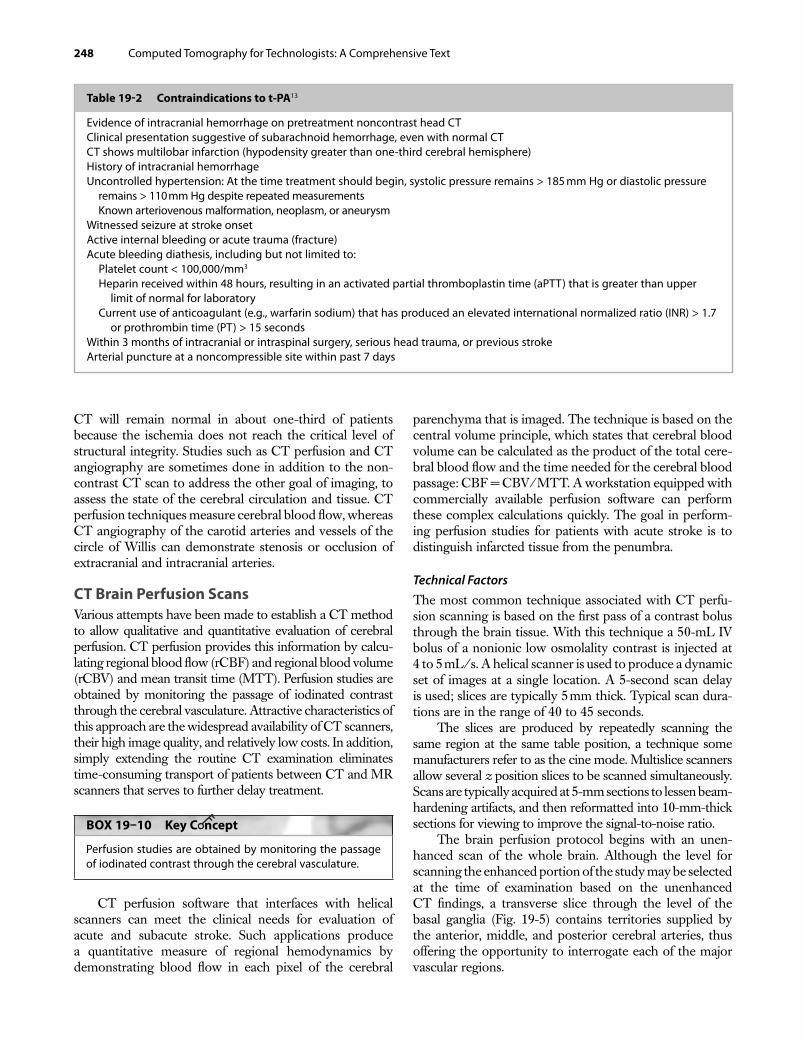
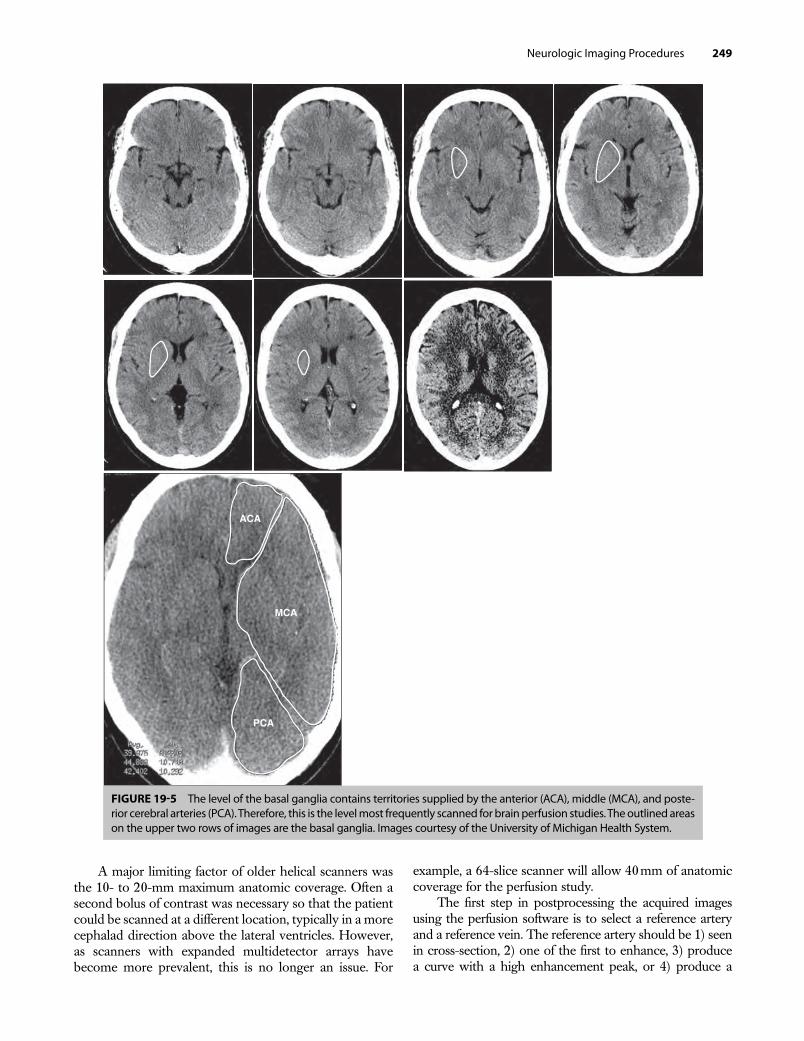
The brain perfusion protocol begins with an unen-hanced scan of the whole brain. Although the level for scanning the enhanced portion of the study may be selected at the time of examination based on the unenhanced CT fi ndings, a transverse slice through the level of the basal ganglia (Fig. 19-5) contains territories supplied by the anterior, middle, and posterior cerebral arteries, thus offering the opportunity to interrogate each of the major vascular regions.
Table 19-2 Contraindications to t-PA13
Evidence of intracranial hemorrhage on pretreatment noncontrast head CTClinical presentation suggestive of subarachnoid hemorrhage, even with normal CT CT shows multilobar infarction (hypodensity greater than one-third cerebral hemisphere) History of intracranial hemorrhage Uncontrolled hypertension: At the time treatment should begin, systolic pressure remains > 185 mm Hg or diastolic pressure remains > 110 mm Hg despite repeated measurements Known arteriovenous malformation, neoplasm, or aneurysm Witnessed seizure at stroke onset Active internal bleeding or acute trauma (fracture) Acute bleeding diathesis, including but not limited to: Platelet count < 100,000/mm3
Heparin received within 48 hours, resulting in an activated partial thromboplastin time (aPTT) that is greater than upper limit of normal for laboratory Current use of anticoagulant (e.g., warfarin sodium) that has produced an elevated international normalized ratio (INR) > 1.7 or prothrombin time (PT) > 15 seconds Within 3 months of intracranial or intraspinal surgery, serious head trauma, or previous stroke Arterial puncture at a noncompressible site within past 7 days
Chap19.indd 248Chap19.indd 248 10/9/2009 2:41:14 PM10/9/2009 2:41:14 PM
Neurologic Imaging Procedures 249
ACA
PCA
MCA
FIGURE 19-5 The level of the basal ganglia contains territories supplied by the anterior (ACA), middle (MCA), and poste-rior cerebral arteries (PCA). Therefore, this is the level most frequently scanned for brain perfusion studies. The outlined areas on the upper two rows of images are the basal ganglia. Images courtesy of the University of Michigan Health System.
example, a 64-slice scanner will allow 40 mm of anatomic coverage for the perfusion study.
The fi rst step in postprocessing the acquired images using the perfusion software is to select a reference artery and a reference vein. The reference artery should be 1) seen in cross-section, 2) one of the fi rst to enhance, 3) produce a curve with a high enhancement peak, or 4) produce a
A major limiting factor of older helical scanners was the 10- to 20-mm maximum anatomic coverage. Often a second bolus of contrast was necessary so that the patient could be scanned at a different location, typically in a more cephalad direction above the lateral ventricles. However, as scanners with expanded multidetector arrays have become more prevalent, this is no longer an issue. For
Chap19.indd 249Chap19.indd 249 10/9/2009 2:41:15 PM10/9/2009 2:41:15 PM
250 Computed Tomography for Technologists: A Comprehensive Text
22
2
11
21
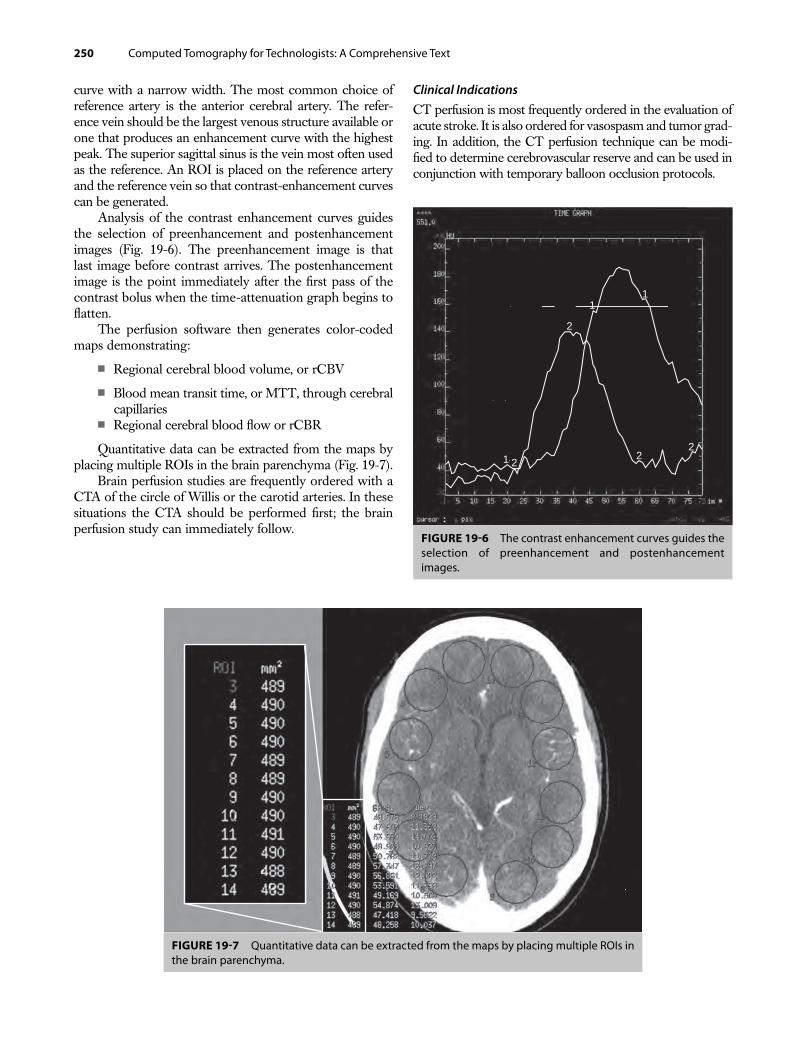
FIGURE 19-6 The contrast enhancement curves guides the selection of preenhancement and postenhancement images.
curve with a narrow width. The most common choice of reference artery is the anterior cerebral artery. The refer-ence vein should be the largest venous structure available or one that produces an enhancement curve with the highest peak. The superior sagittal sinus is the vein most often used as the reference. An ROI is placed on the reference artery and the reference vein so that contrast-enhancement curves can be generated.
Analysis of the contrast enhancement curves guides the selection of preenhancement and postenhancement images (Fig. 19-6). The preenhancement image is that last image before contrast arrives. The postenhancement image is the point immediately after the fi rst pass of the contrast bolus when the time-attenuation graph begins to fl atten.
The perfusion software then generates color-coded maps demonstrating:
■ Regional cerebral blood volume, or rCBV
■ Blood mean transit time, or MTT, through cerebral capillaries
■ Regional cerebral blood fl ow or rCBR
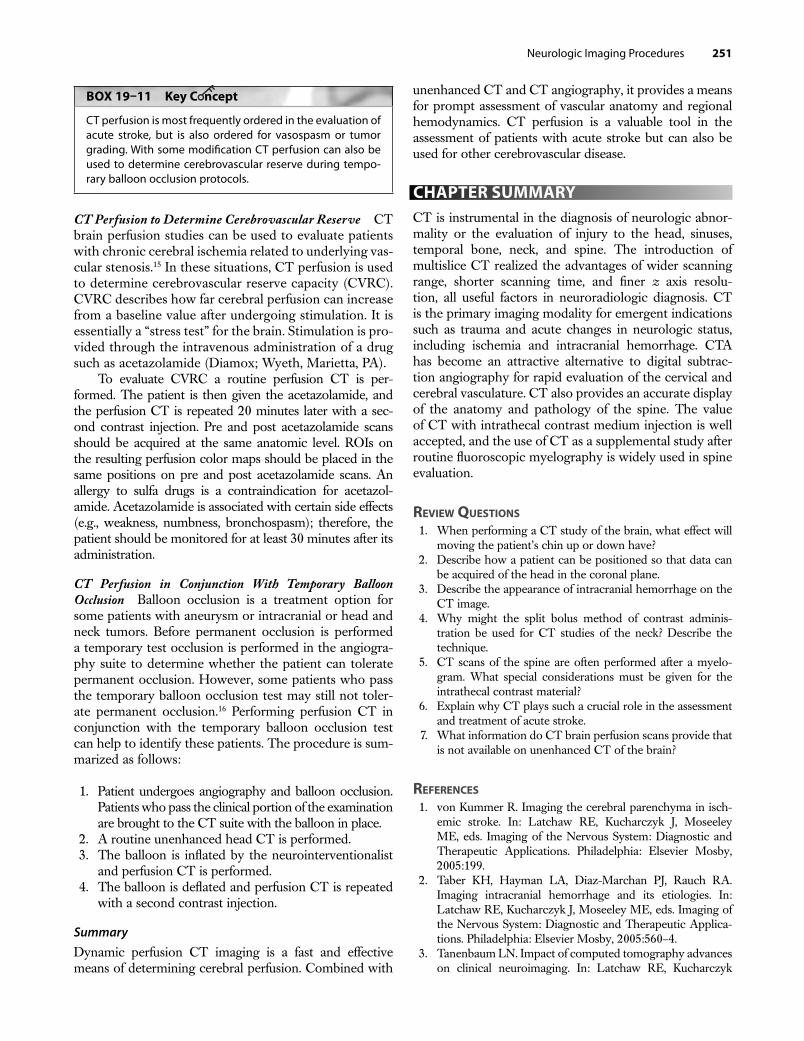
Quantitative data can be extracted from the maps by placing multiple ROIs in the brain parenchyma (Fig. 19-7).
Brain perfusion studies are frequently ordered with a CTA of the circle of Willis or the carotid arteries. In these situations the CTA should be performed fi rst; the brain perfusion study can immediately follow.
FIGURE 19-7 Quantitative data can be extracted from the maps by placing multiple ROIs in the brain parenchyma.
Clinical IndicationsCT perfusion is most frequently ordered in the evaluation of acute stroke. It is also ordered for vasospasm and tumor grad-ing. In addition, the CT perfusion technique can be modi-fi ed to determine cerebrovascular reserve and can be used in conjunction with temporary balloon occlusion protocols.
Chap19.indd 250Chap19.indd 250 10/9/2009 2:41:16 PM10/9/2009 2:41:16 PM
Neurologic Imaging Procedures 251
BOX 19–11 Key C ncept
CT perfusion is most frequently ordered in the evaluation of acute stroke, but is also ordered for vasospasm or tumor grading. With some modifi cation CT perfusion can also be used to determine cerebrovascular reserve during tempo-rary balloon occlusion protocols.
CT Perfusion to Determine Cerebrovascular Reserve CT brain perfusion studies can be used to evaluate patients with chronic cerebral ischemia related to underlying vas-cular stenosis.15 In these situations, CT perfusion is used to determine cerebrovascular reserve capacity (CVRC). CVRC describes how far cerebral perfusion can increase from a baseline value after undergoing stimulation. It is essentially a “stress test” for the brain. Stimulation is pro-vided through the intravenous administration of a drug such as acetazolamide (Diamox; Wyeth, Marietta, PA).
To evaluate CVRC a routine perfusion CT is per-formed. The patient is then given the acetazolamide, and the perfusion CT is repeated 20 minutes later with a sec-ond contrast injection. Pre and post acetazolamide scans should be acquired at the same anatomic level. ROIs on the resulting perfusion color maps should be placed in the same positions on pre and post acetazolamide scans. An allergy to sulfa drugs is a contraindication for acetazol-amide. Acetazolamide is associated with certain side effects (e.g., weakness, numbness, bronchospasm); therefore, the patient should be monitored for at least 30 minutes after its administration.
CT Perfusion in Conjunction With Temporary Balloon
Occlusion Balloon occlusion is a treatment option for some patients with aneurysm or intracranial or head and neck tumors. Before permanent occlusion is performed a temporary test occlusion is performed in the angiogra-phy suite to determine whether the patient can tolerate permanent occlusion. However, some patients who pass the temporary balloon occlusion test may still not toler-ate permanent occlusion.16 Performing perfusion CT in conjunction with the temporary balloon occlusion test can help to identify these patients. The procedure is sum-marized as follows:
1. Patient undergoes angiography and balloon occlusion. Patients who pass the clinical portion of the examination are brought to the CT suite with the balloon in place.
2. A routine unenhanced head CT is performed. 3. The balloon is infl ated by the neurointerventionalist
and perfusion CT is performed. 4. The balloon is defl ated and perfusion CT is repeated
with a second contrast injection.
SummaryDynamic perfusion CT imaging is a fast and effective means of determining cerebral perfusion. Combined with
unenhanced CT and CT angiography, it provides a means for prompt assessment of vascular anatomy and regional hemodynamics. CT perfusion is a valuable tool in the assessment of patients with acute stroke but can also be used for other cerebrovascular disease.
CHAPTER SUMMARYCT is instrumental in the diagnosis of neurologic abnor-mality or the evaluation of injury to the head, sinuses, temporal bone, neck, and spine. The introduction of multislice CT realized the advantages of wider scanning range, shorter scanning time, and fi ner z axis resolu-tion, all useful factors in neuroradiologic diagnosis. CT is the primary imaging modality for emergent indications such as trauma and acute changes in neurologic status, including ischemia and intracranial hemorrhage. CTA has become an attractive alternative to digital subtrac-tion angiography for rapid evaluation of the cervical and cerebral vasculature. CT also provides an accurate display of the anatomy and pathology of the spine. The value of CT with intrathecal contrast medium injection is well accepted, and the use of CT as a supplemental study after routine fl uoroscopic myelography is widely used in spine evaluation.
REVIEW QUESTIONS 1. When performing a CT study of the brain, what effect will
moving the patient’s chin up or down have? 2. Describe how a patient can be positioned so that data can
be acquired of the head in the coronal plane. 3. Describe the appearance of intracranial hemorrhage on the
CT image. 4. Why might the split bolus method of contrast adminis-
tration be used for CT studies of the neck? Describe the technique.
5. CT scans of the spine are often performed after a myelo-gram. What special considerations must be given for the intrathecal contrast material?
6. Explain why CT plays such a crucial role in the assessment and treatment of acute stroke.
7. What information do CT brain perfusion scans provide that is not available on unenhanced CT of the brain?
REFERENCES 1. von Kummer R. Imaging the cerebral parenchyma in isch-
emic stroke. In: Latchaw RE, Kucharczyk J, Moseeley ME, eds. Imaging of the Nervous System: Diagnostic and Therapeutic Applications. Philadelphia: Elsevier Mosby, 2005:199.
2. Taber KH, Hayman LA, Diaz-Marchan PJ, Rauch RA. Imaging intracranial hemorrhage and its etiologies. In: Latchaw RE, Kucharczyk J, Moseeley ME, eds. Imaging of the Nervous System: Diagnostic and Therapeutic Applica-tions. Philadelphia: Elsevier Mosby, 2005:560–4.
3. Tanenbaum LN. Impact of computed tomography advances on clinical neuroimaging. In: Latchaw RE, Kucharczyk
Chap19.indd 251Chap19.indd 251 10/9/2009 2:41:17 PM10/9/2009 2:41:17 PM
252 Computed Tomography for Technologists: A Comprehensive Text
J, Moseeley ME, eds. Imaging of the Nervous System: Diagnostic and Therapeutic Applications. Philadelphia: Elsevier Mosby, 2005:40.
4. Gandhi D. Computed tomography and magnetic reso-nance angiography in cervicocranial vascular disease. J Neuroophthalmol 2004;24:306–14.
5. American Heart Association. 2008 Heart and Stroke Statistical Update. Dallas: American Heart Association, 2008. Available at: http://www.americanheart.org/presenter.jhtml?identifi er=1200026. Accessed September 5, 2008.
6. The NINDS t-PA Stroke Study Group. Generalized effi cacy of t-PA for acute stroke. Subgroup analysis of the NINDS t-PA Stroke Trial. Stroke 1997;28:2119–25.
7. Goetz CG, Pappert EJ. Textbook of Clinical Neurology. 1st Ed. Philadelphia: WB Saunders, 1999:373, 917.
8. Millikan CH, McDowell FH. Treatment of progressing stroke. Stroke 1981;12:397–409.
9. Nygard O, Nordrehaug JE, Refsum H, Ueland PM, Farstad M, Vollset SE. Plasma homocysteine levels and mortality in patients with coronary artery disease. N Engl J Med 1997;337:230–6.
10. Graham IM, Daly LE, Refsum HM, et al. Plasma homo-cysteine as a risk factor for vascular disease. The European Concerted Action Project. JAMA 1997;277:1775–81.
11. Etminan M, Takkouche B, Isorna FC, Samji A. Risk of ischaemic stroke in people with migraine: systematic review and meta-analysis of observational studies. BMJ 2005;330:63.
12. Reynolds K, Lewis B, Nolen JD, Kinney GL, Sathya B, He J. Alcohol consumption and risk of stroke: a meta-anal-ysis. JAMA 2003;289:579–88.
13. Meadows M. Brain Attack: a look at stroke prevention and treatment. FDA Consumer Magazine. March–April 2005. Available at http://www.fda.gov/fdac/features/2005/205_stroke.html. Accessed May 2008.
14. Marler JR, Jones PW, Emr E, eds. Setting new directions for stroke care: proceedings of a national symposium on rapid identifi cation and treatment of acute stroke. Circulation 2005;112(Suppl):IV-111–20.
15. Hoeffner EG, Case I, Jain R, et al. Cerebral perfusion CT: technique and clinical applications. Radiology 2004;231:632–44.
16. Mathis JM, Barr JD, Jungreis CA, et al. Temporary balloon occlusion of the internal carotid artery: experience in 500 cases. AJNR Am J Neuroradiol 1995;16:749–54.
Chap19.indd 252Chap19.indd 252 10/9/2009 2:41:17 PM10/9/2009 2:41:17 PM
Neurologic Imaging Procedures 253
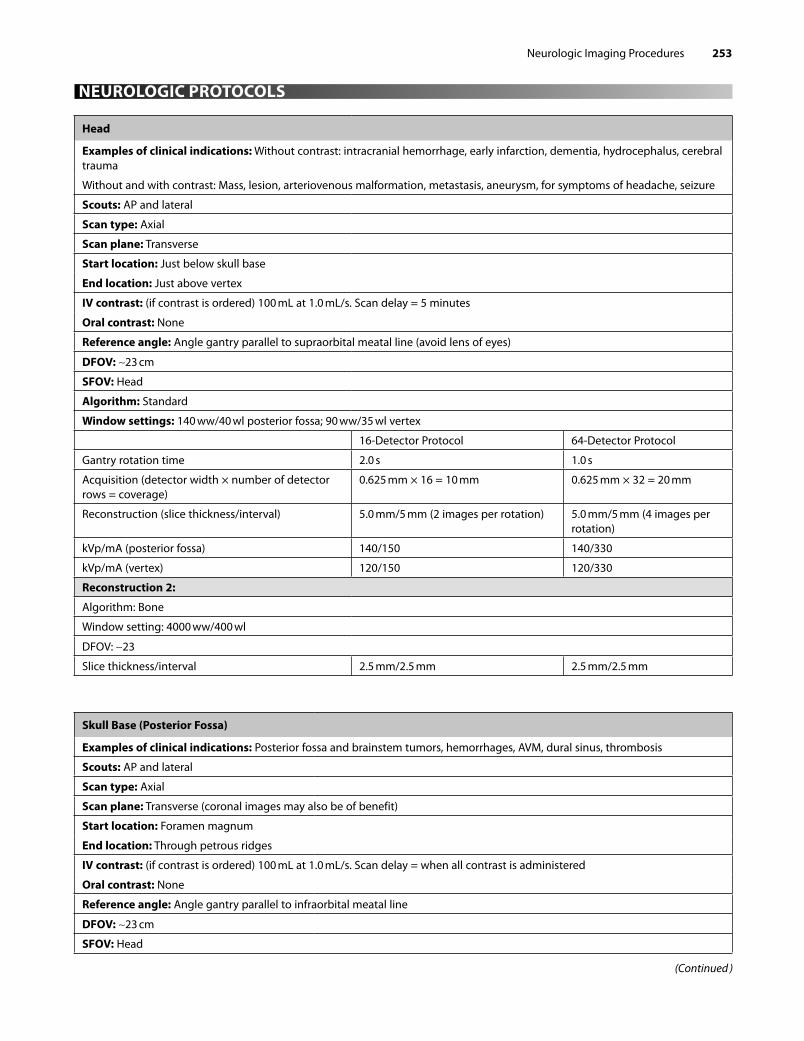
NEUROLOGIC PROTOCOLS
Head
Examples of clinical indications: Without contrast: intracranial hemorrhage, early infarction, dementia, hydrocephalus, cerebral trauma
Without and with contrast: Mass, lesion, arteriovenous malformation, metastasis, aneurysm, for symptoms of headache, seizure
Scouts: AP and lateral
Scan type: Axial
Scan plane: Transverse
Start location: Just below skull base
End location: Just above vertex
IV contrast: (if contrast is ordered) 100 mL at 1.0 mL/s. Scan delay = 5 minutes
Oral contrast: None
Reference angle: Angle gantry parallel to supraorbital meatal line (avoid lens of eyes)
DFOV: ∼23 cm
SFOV: Head
Algorithm: Standard
Window settings: 140 ww/40 wl posterior fossa; 90 ww/35 wl vertex
16-Detector Protocol 64-Detector Protocol
Gantry rotation time 2.0 s 1.0 s
Acquisition (detector width × number of detector rows = coverage)
0.625 mm × 16 = 10 mm 0.625 mm × 32 = 20 mm
Reconstruction (slice thickness/interval) 5.0 mm/5 mm (2 images per rotation) 5.0 mm/5 mm (4 images per rotation)
kVp/mA (posterior fossa) 140/150 140/330
kVp/mA (vertex) 120/150 120/330
Reconstruction 2:
Algorithm: Bone
Window setting: 4000 ww/400 wl
DFOV: ∼23
Slice thickness/interval 2.5 mm/2.5 mm 2.5 mm/2.5 mm
Skull Base (Posterior Fossa)
Examples of clinical indications: Posterior fossa and brainstem tumors, hemorrhages, AVM, dural sinus, thrombosis
Scouts: AP and lateral
Scan type: Axial
Scan plane: Transverse (coronal images may also be of benefit)
Start location: Foramen magnum
End location: Through petrous ridges
IV contrast: (if contrast is ordered) 100 mL at 1.0 mL/s. Scan delay = when all contrast is administered
Oral contrast: None
Reference angle: Angle gantry parallel to infraorbital meatal line
DFOV: ∼23 cm
SFOV: Head
(Continued )
Chap19.indd 253Chap19.indd 253 10/9/2009 2:41:17 PM10/9/2009 2:41:17 PM
254 Computed Tomography for Technologists: A Comprehensive Text
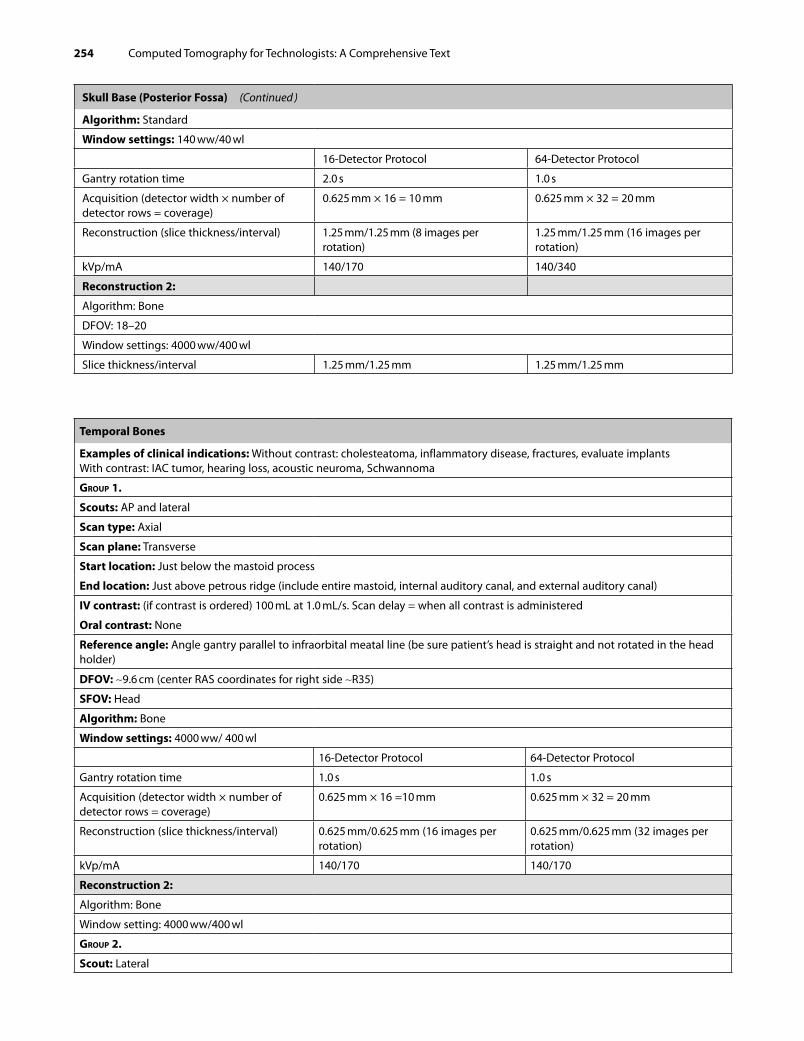
Skull Base (Posterior Fossa) (Continued )
Algorithm: Standard
Window settings: 140 ww/40 wl
16-Detector Protocol 64-Detector Protocol
Gantry rotation time 2.0 s 1.0 s
Acquisition (detector width × number of detector rows = coverage)
0.625 mm × 16 = 10 mm 0.625 mm × 32 = 20 mm
Reconstruction (slice thickness/interval) 1.25 mm/1.25 mm (8 images per rotation)
1.25 mm/1.25 mm (16 images per rotation)
kVp/mA 140/170 140/340
Reconstruction 2:
Algorithm: Bone
DFOV: 18–20
Window settings: 4000 ww/400 wl
Slice thickness/interval 1.25 mm/1.25 mm 1.25 mm/1.25 mm
Temporal Bones
Examples of clinical indications: Without contrast: cholesteatoma, inflammatory disease, fractures, evaluate implants With contrast: IAC tumor, hearing loss, acoustic neuroma, Schwannoma
GROUP 1.
Scouts: AP and lateral
Scan type: Axial
Scan plane: Transverse
Start location: Just below the mastoid process
End location: Just above petrous ridge (include entire mastoid, internal auditory canal, and external auditory canal)
IV contrast: (if contrast is ordered) 100 mL at 1.0 mL/s. Scan delay = when all contrast is administered
Oral contrast: None
Reference angle: Angle gantry parallel to infraorbital meatal line (be sure patient’s head is straight and not rotated in the head holder)
DFOV: ∼9.6 cm (center RAS coordinates for right side ∼R35)
SFOV: Head
Algorithm: Bone
Window settings: 4000 ww/ 400 wl
16-Detector Protocol 64-Detector Protocol
Gantry rotation time 1.0 s 1.0 s
Acquisition (detector width × number of detector rows = coverage)
0.625 mm × 16 =10 mm 0.625 mm × 32 = 20 mm
Reconstruction (slice thickness/interval) 0.625 mm/0.625 mm (16 images per rotation)
0.625 mm/0.625 mm (32 images per rotation)
kVp/mA 140/170 140/170
Reconstruction 2:
Algorithm: Bone
Window setting: 4000 ww/400 wl
GROUP 2.
Scout: Lateral
Chap19.indd 254Chap19.indd 254 10/9/2009 2:41:17 PM10/9/2009 2:41:17 PM
Neurologic Imaging Procedures 255
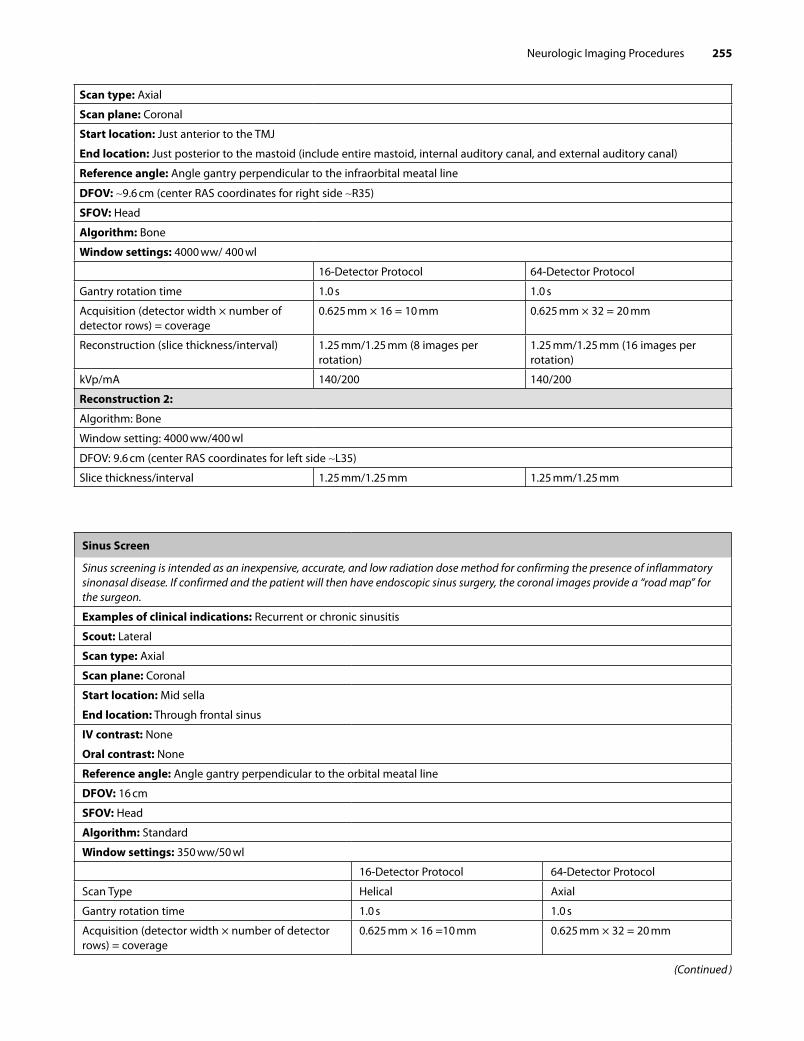
Scan type: Axial
Scan plane: Coronal
Start location: Just anterior to the TMJ
End location: Just posterior to the mastoid (include entire mastoid, internal auditory canal, and external auditory canal)
Reference angle: Angle gantry perpendicular to the infraorbital meatal line
DFOV: ∼9.6 cm (center RAS coordinates for right side ∼R35)
SFOV: Head
Algorithm: Bone
Window settings: 4000 ww/ 400 wl
16-Detector Protocol 64-Detector Protocol
Gantry rotation time 1.0 s 1.0 s
Acquisition (detector width × number of detector rows) = coverage
0.625 mm × 16 = 10 mm 0.625 mm × 32 = 20 mm
Reconstruction (slice thickness/interval) 1.25 mm/1.25 mm (8 images per rotation)
1.25 mm/1.25 mm (16 images per rotation)
kVp/mA 140/200 140/200
Reconstruction 2:
Algorithm: Bone
Window setting: 4000 ww/400 wl
DFOV: 9.6 cm (center RAS coordinates for left side ∼L35)
Slice thickness/interval 1.25 mm/1.25 mm 1.25 mm/1.25 mm
Sinus Screen
Sinus screening is intended as an inexpensive, accurate, and low radiation dose method for confirming the presence of inflammatory sinonasal disease. If confirmed and the patient will then have endoscopic sinus surgery, the coronal images provide a “road map” for the surgeon.
Examples of clinical indications: Recurrent or chronic sinusitis
Scout: Lateral
Scan type: Axial
Scan plane: Coronal
Start location: Mid sella
End location: Through frontal sinus
IV contrast: None
Oral contrast: None
Reference angle: Angle gantry perpendicular to the orbital meatal line
DFOV: 16 cm
SFOV: Head
Algorithm: Standard
Window settings: 350 ww/50 wl
16-Detector Protocol 64-Detector Protocol
Scan Type Helical Axial
Gantry rotation time 1.0 s 1.0 s
Acquisition (detector width × number of detector rows) = coverage
0.625 mm × 16 =10 mm 0.625 mm × 32 = 20 mm
(Continued )
Chap19.indd 255Chap19.indd 255 10/9/2009 2:41:17 PM10/9/2009 2:41:17 PM
256 Computed Tomography for Technologists: A Comprehensive Text
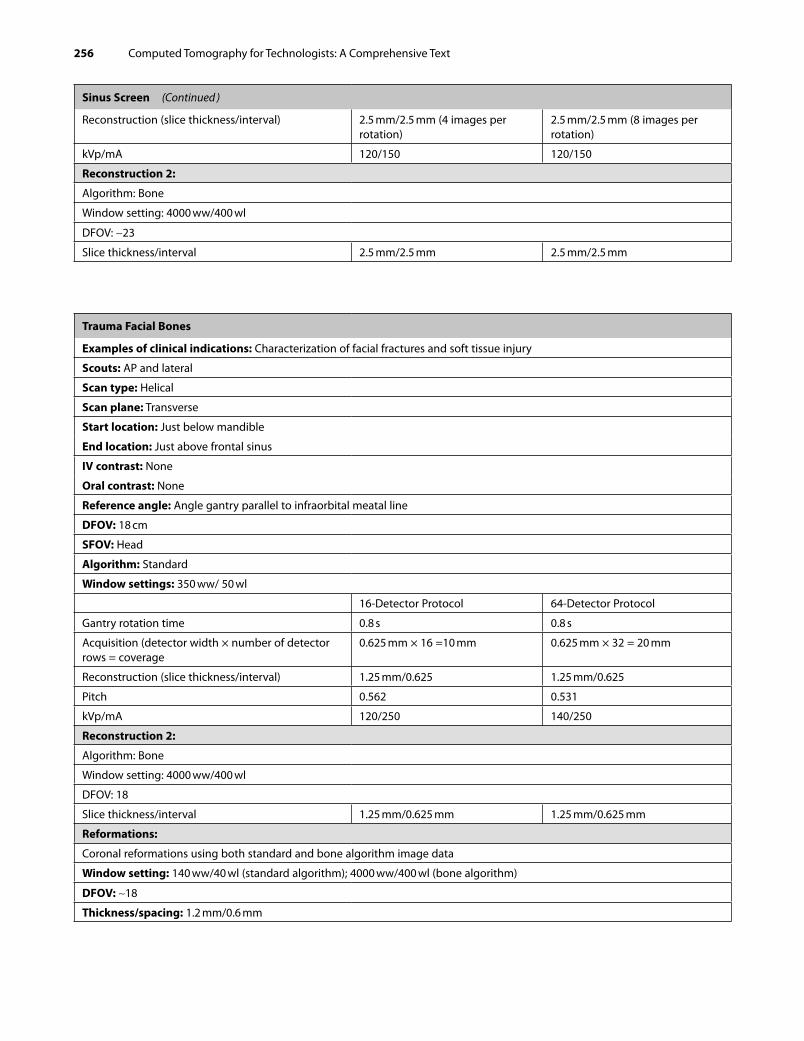
Trauma Facial Bones
Examples of clinical indications: Characterization of facial fractures and soft tissue injury
Scouts: AP and lateral
Scan type: Helical
Scan plane: Transverse
Start location: Just below mandible
End location: Just above frontal sinus
IV contrast: None
Oral contrast: None
Reference angle: Angle gantry parallel to infraorbital meatal line
DFOV: 18 cm
SFOV: Head
Algorithm: Standard
Window settings: 350 ww/ 50 wl
16-Detector Protocol 64-Detector Protocol
Gantry rotation time 0.8 s 0.8 s
Acquisition (detector width × number of detector rows = coverage
0.625 mm × 16 =10 mm 0.625 mm × 32 = 20 mm
Reconstruction (slice thickness/interval) 1.25 mm/0.625 1.25 mm/0.625
Pitch 0.562 0.531
kVp/mA 120/250 140/250
Reconstruction 2:
Algorithm: Bone
Window setting: 4000 ww/400 wl
DFOV: 18
Slice thickness/interval 1.25 mm/0.625 mm 1.25 mm/0.625 mm
Reformations:
Coronal reformations using both standard and bone algorithm image data
Window setting: 140 ww/40 wl (standard algorithm); 4000 ww/400 wl (bone algorithm)
DFOV: ∼18
Thickness/spacing: 1.2 mm/0.6 mm
Sinus Screen (Continued )
Reconstruction (slice thickness/interval) 2.5 mm/2.5 mm (4 images per rotation)
2.5 mm/2.5 mm (8 images per rotation)
kVp/mA 120/150 120/150
Reconstruction 2:
Algorithm: Bone
Window setting: 4000 ww/400 wl
DFOV: ∼23
Slice thickness/interval 2.5 mm/2.5 mm 2.5 mm/2.5 mm
Chap19.indd 256Chap19.indd 256 10/9/2009 2:41:17 PM10/9/2009 2:41:17 PM
Neurologic Imaging Procedures 257
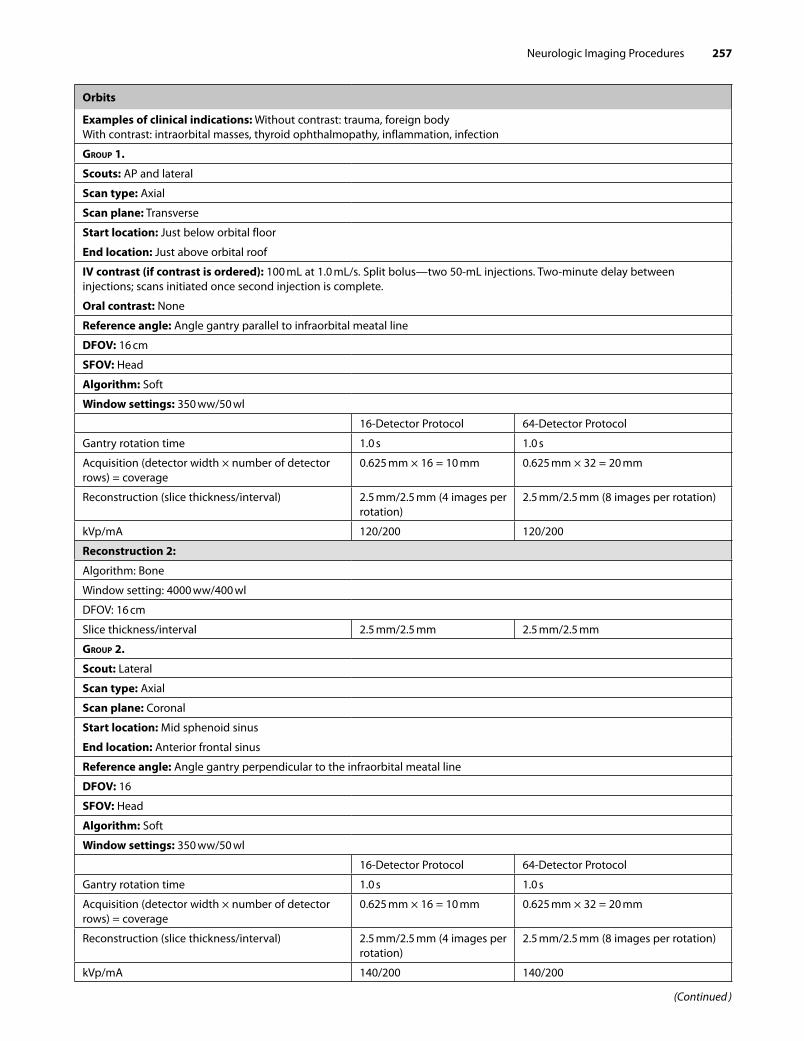
Orbits
Examples of clinical indications: Without contrast: trauma, foreign bodyWith contrast: intraorbital masses, thyroid ophthalmopathy, inflammation, infection
GROUP 1.
Scouts: AP and lateral
Scan type: Axial
Scan plane: Transverse
Start location: Just below orbital floor
End location: Just above orbital roof
IV contrast (if contrast is ordered): 100 mL at 1.0 mL/s. Split bolus—two 50-mL injections. Two-minute delay between injections; scans initiated once second injection is complete.
Oral contrast: None
Reference angle: Angle gantry parallel to infraorbital meatal line
DFOV: 16 cm
SFOV: Head
Algorithm: Soft
Window settings: 350 ww/50 wl
16-Detector Protocol 64-Detector Protocol
Gantry rotation time 1.0 s 1.0 s
Acquisition (detector width × number of detector rows) = coverage
0.625 mm × 16 = 10 mm 0.625 mm × 32 = 20 mm
Reconstruction (slice thickness/interval) 2.5 mm/2.5 mm (4 images per rotation)
2.5 mm/2.5 mm (8 images per rotation)
kVp/mA 120/200 120/200
Reconstruction 2:
Algorithm: Bone
Window setting: 4000 ww/400 wl
DFOV: 16 cm
Slice thickness/interval 2.5 mm/2.5 mm 2.5 mm/2.5 mm
GROUP 2.
Scout: Lateral
Scan type: Axial
Scan plane: Coronal
Start location: Mid sphenoid sinus
End location: Anterior frontal sinus
Reference angle: Angle gantry perpendicular to the infraorbital meatal line
DFOV: 16
SFOV: Head
Algorithm: Soft
Window settings: 350 ww/50 wl
16-Detector Protocol 64-Detector Protocol
Gantry rotation time 1.0 s 1.0 s
Acquisition (detector width × number of detector rows) = coverage
0.625 mm × 16 = 10 mm 0.625 mm × 32 = 20 mm
Reconstruction (slice thickness/interval) 2.5 mm/2.5 mm (4 images per rotation)
2.5 mm/2.5 mm (8 images per rotation)
kVp/mA 140/200 140/200
(Continued )
Chap19.indd 257Chap19.indd 257 10/9/2009 2:41:17 PM10/9/2009 2:41:17 PM
258 Computed Tomography for Technologists: A Comprehensive Text
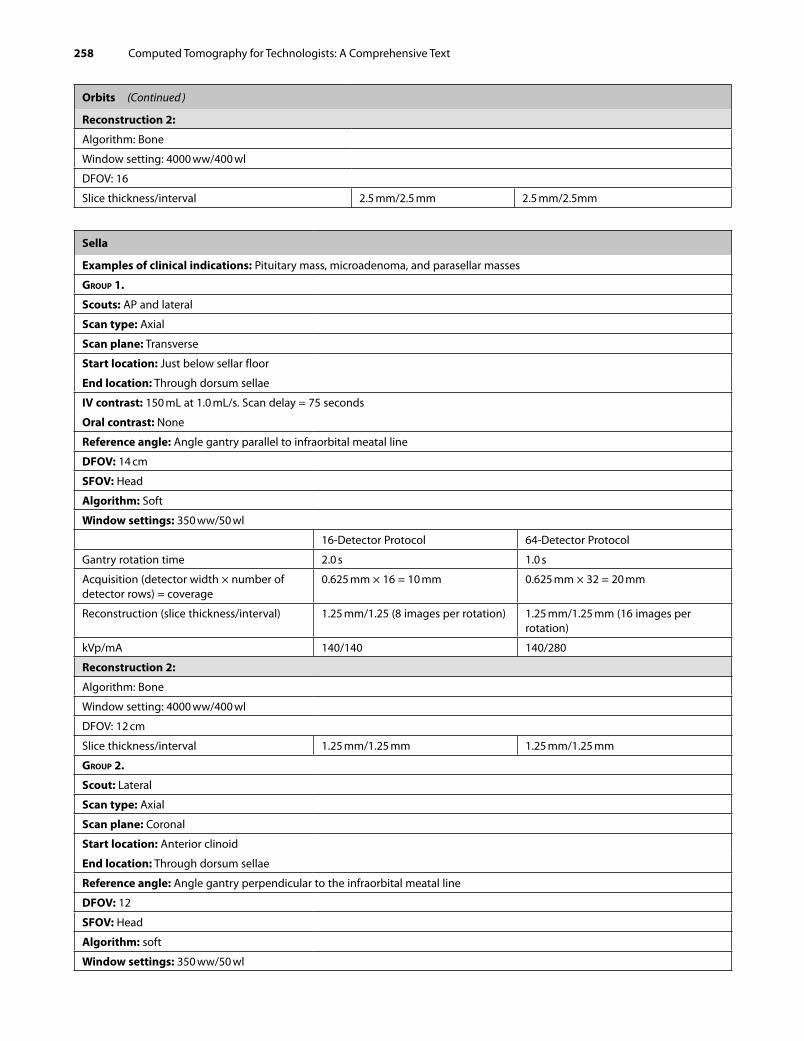
Orbits (Continued )
Reconstruction 2:
Algorithm: Bone
Window setting: 4000 ww/400 wl
DFOV: 16
Slice thickness/interval 2.5 mm/2.5 mm 2.5 mm/2.5mm
Sella
Examples of clinical indications: Pituitary mass, microadenoma, and parasellar masses
GROUP 1.
Scouts: AP and lateral
Scan type: Axial
Scan plane: Transverse
Start location: Just below sellar floor
End location: Through dorsum sellae
IV contrast: 150 mL at 1.0 mL/s. Scan delay = 75 seconds
Oral contrast: None
Reference angle: Angle gantry parallel to infraorbital meatal line
DFOV: 14 cm
SFOV: Head
Algorithm: Soft
Window settings: 350 ww/50 wl
16-Detector Protocol 64-Detector Protocol
Gantry rotation time 2.0 s 1.0 s
Acquisition (detector width × number of detector rows) = coverage
0.625 mm × 16 = 10 mm 0.625 mm × 32 = 20 mm
Reconstruction (slice thickness/interval) 1.25 mm/1.25 (8 images per rotation) 1.25 mm/1.25 mm (16 images per rotation)
kVp/mA 140/140 140/280
Reconstruction 2:
Algorithm: Bone
Window setting: 4000 ww/400 wl
DFOV: 12 cm
Slice thickness/interval 1.25 mm/1.25 mm 1.25 mm/1.25 mm
GROUP 2.
Scout: Lateral
Scan type: Axial
Scan plane: Coronal
Start location: Anterior clinoid
End location: Through dorsum sellae
Reference angle: Angle gantry perpendicular to the infraorbital meatal line
DFOV: 12
SFOV: Head
Algorithm: soft
Window settings: 350 ww/50 wl
Chap19.indd 258Chap19.indd 258 10/9/2009 2:41:17 PM10/9/2009 2:41:17 PM
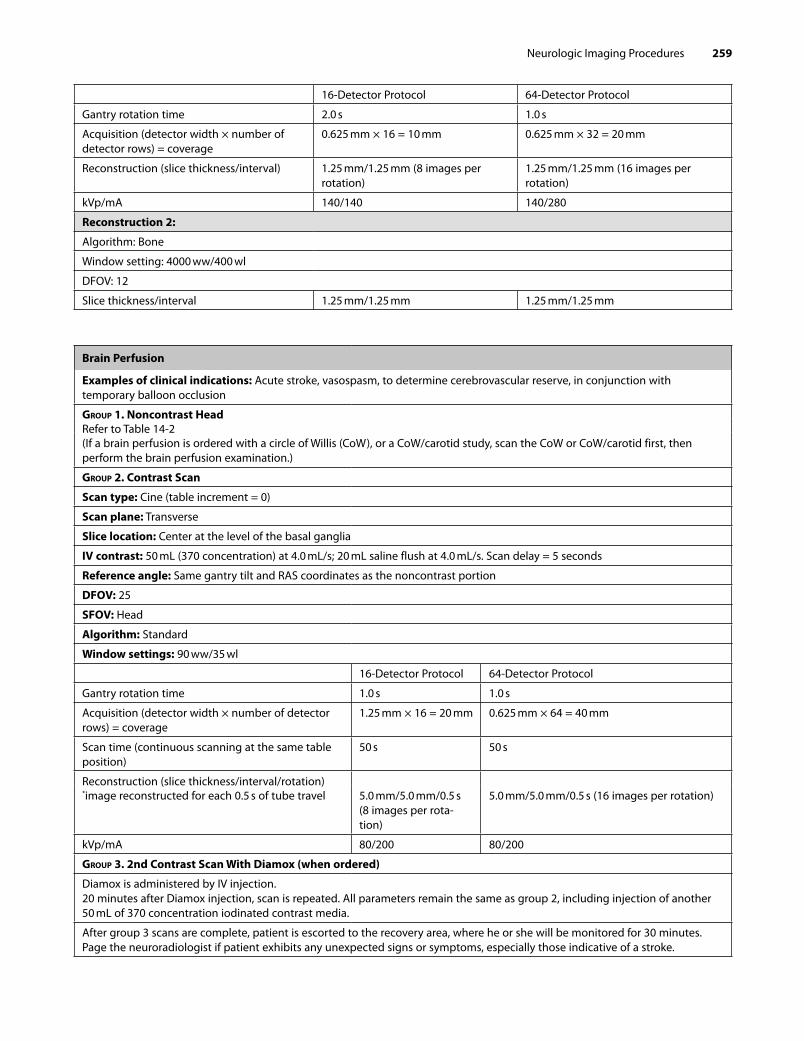
Neurologic Imaging Procedures 259
16-Detector Protocol 64-Detector Protocol
Gantry rotation time 2.0 s 1.0 s
Acquisition (detector width × number of detector rows) = coverage
0.625 mm × 16 = 10 mm 0.625 mm × 32 = 20 mm
Reconstruction (slice thickness/interval) 1.25 mm/1.25 mm (8 images per rotation)
1.25 mm/1.25 mm (16 images per rotation)
kVp/mA 140/140 140/280
Reconstruction 2:
Algorithm: Bone
Window setting: 4000 ww/400 wl
DFOV: 12
Slice thickness/interval 1.25 mm/1.25 mm 1.25 mm/1.25 mm
Brain Perfusion
Examples of clinical indications: Acute stroke, vasospasm, to determine cerebrovascular reserve, in conjunction with temporary balloon occlusion
GROUP 1. Noncontrast HeadRefer to Table 14-2(If a brain perfusion is ordered with a circle of Willis (CoW), or a CoW/carotid study, scan the CoW or CoW/carotid first, then perform the brain perfusion examination.)
GROUP 2. Contrast Scan
Scan type: Cine (table increment = 0)
Scan plane: Transverse
Slice location: Center at the level of the basal ganglia
IV contrast: 50 mL (370 concentration) at 4.0 mL/s; 20 mL saline flush at 4.0 mL/s. Scan delay = 5 seconds
Reference angle: Same gantry tilt and RAS coordinates as the noncontrast portion
DFOV: 25
SFOV: Head
Algorithm: Standard
Window settings: 90 ww/35 wl
16-Detector Protocol 64-Detector Protocol
Gantry rotation time 1.0 s 1.0 s
Acquisition (detector width × number of detector rows) = coverage
1.25 mm × 16 = 20 mm 0.625 mm × 64 = 40 mm
Scan time (continuous scanning at the same table position)
50 s 50 s
Reconstruction (slice thickness/interval/rotation)*image reconstructed for each 0.5 s of tube travel 5.0 mm/5.0 mm/0.5 s
(8 images per rota-tion)
5.0 mm/5.0 mm/0.5 s (16 images per rotation)
kVp/mA 80/200 80/200
GROUP 3. 2nd Contrast Scan With Diamox (when ordered)
Diamox is administered by IV injection.20 minutes after Diamox injection, scan is repeated. All parameters remain the same as group 2, including injection of another 50 mL of 370 concentration iodinated contrast media.
After group 3 scans are complete, patient is escorted to the recovery area, where he or she will be monitored for 30 minutes. Page the neuroradiologist if patient exhibits any unexpected signs or symptoms, especially those indicative of a stroke.
Chap19.indd 259Chap19.indd 259 10/9/2009 2:41:18 PM10/9/2009 2:41:18 PM
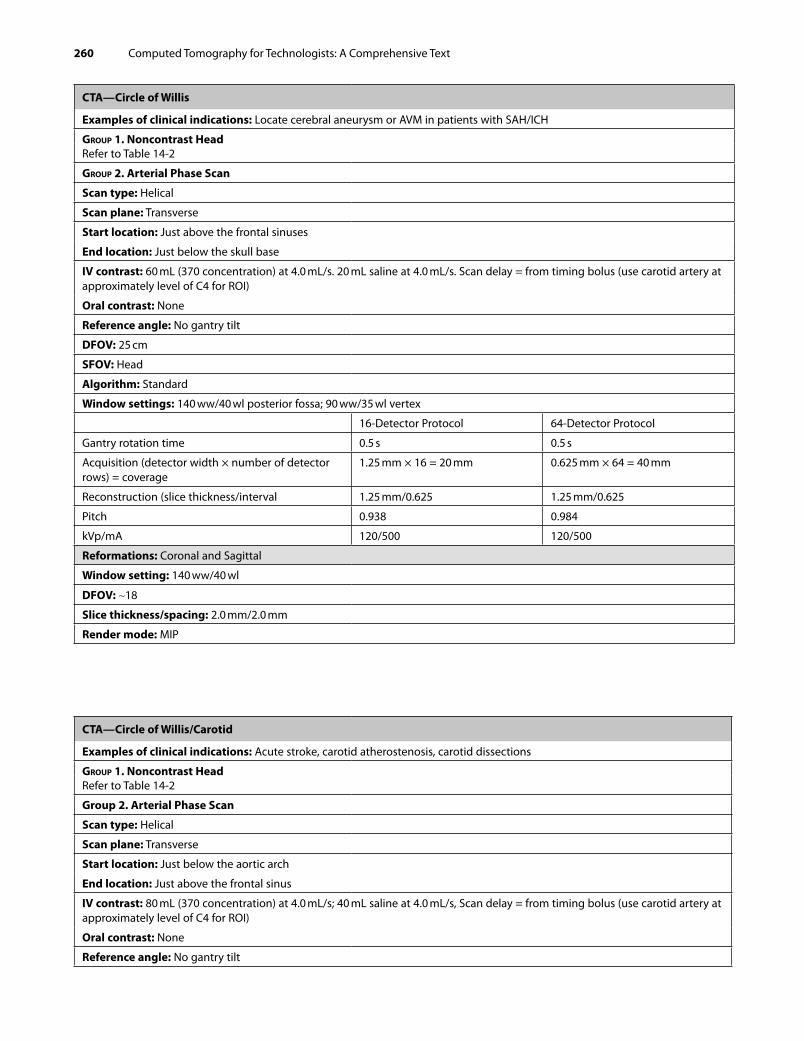
260 Computed Tomography for Technologists: A Comprehensive Text
CTA—Circle of Willis
Examples of clinical indications: Locate cerebral aneurysm or AVM in patients with SAH/ICH
GROUP 1. Noncontrast HeadRefer to Table 14-2
GROUP 2. Arterial Phase Scan
Scan type: Helical
Scan plane: Transverse
Start location: Just above the frontal sinuses
End location: Just below the skull base
IV contrast: 60 mL (370 concentration) at 4.0 mL/s. 20 mL saline at 4.0 mL/s. Scan delay = from timing bolus (use carotid artery at approximately level of C4 for ROI)
Oral contrast: None
Reference angle: No gantry tilt
DFOV: 25 cm
SFOV: Head
Algorithm: Standard
Window settings: 140 ww/40 wl posterior fossa; 90 ww/35 wl vertex
16-Detector Protocol 64-Detector Protocol
Gantry rotation time 0.5 s 0.5 s
Acquisition (detector width × number of detector rows) = coverage
1.25 mm × 16 = 20 mm 0.625 mm × 64 = 40 mm
Reconstruction (slice thickness/interval 1.25 mm/0.625 1.25 mm/0.625
Pitch 0.938 0.984
kVp/mA 120/500 120/500
Reformations: Coronal and Sagittal
Window setting: 140 ww/40 wl
DFOV: ∼18
Slice thickness/spacing: 2.0 mm/2.0 mm
Render mode: MIP
CTA—Circle of Willis/Carotid
Examples of clinical indications: Acute stroke, carotid atherostenosis, carotid dissections
GROUP 1. Noncontrast HeadRefer to Table 14-2
Group 2. Arterial Phase Scan
Scan type: Helical
Scan plane: Transverse
Start location: Just below the aortic arch
End location: Just above the frontal sinus
IV contrast: 80 mL (370 concentration) at 4.0 mL/s; 40 mL saline at 4.0 mL/s, Scan delay = from timing bolus (use carotid artery at approximately level of C4 for ROI)
Oral contrast: None
Reference angle: No gantry tilt
Chap19.indd 260Chap19.indd 260 10/9/2009 2:41:18 PM10/9/2009 2:41:18 PM
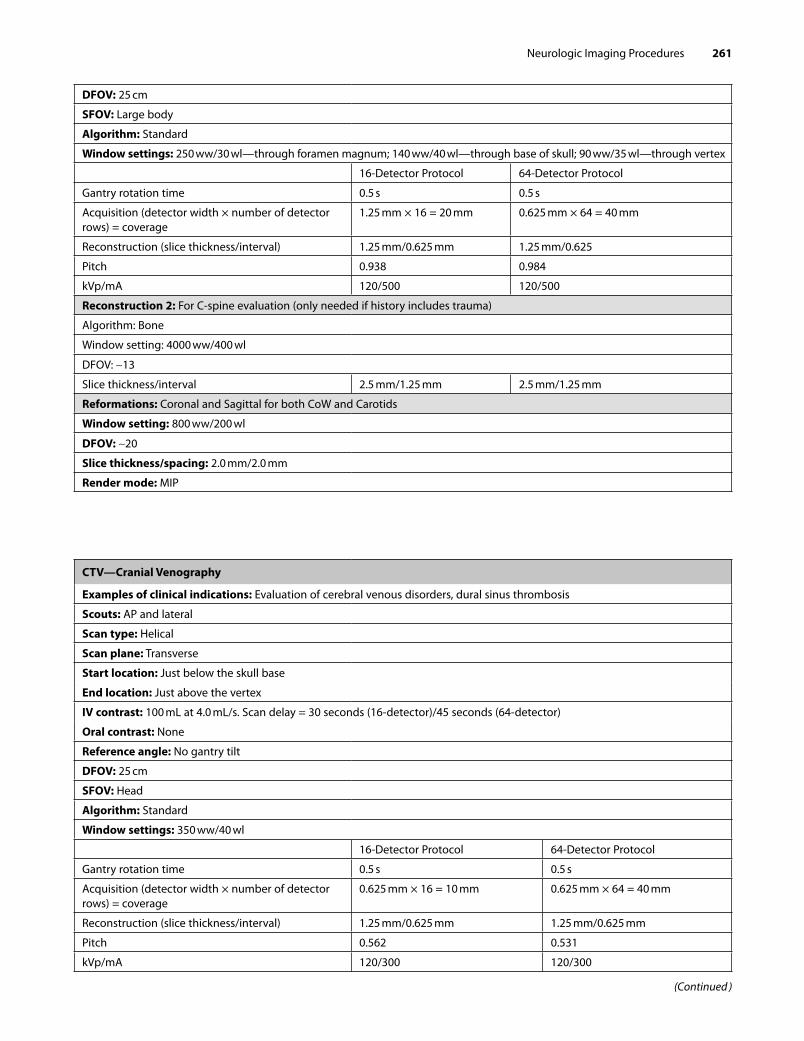
Neurologic Imaging Procedures 261
DFOV: 25 cm
SFOV: Large body
Algorithm: Standard
Window settings: 250 ww/30 wl—through foramen magnum; 140 ww/40 wl—through base of skull; 90 ww/35 wl—through vertex
16-Detector Protocol 64-Detector Protocol
Gantry rotation time 0.5 s 0.5 s
Acquisition (detector width × number of detector rows) = coverage
1.25 mm × 16 = 20 mm 0.625 mm × 64 = 40 mm
Reconstruction (slice thickness/interval) 1.25 mm/0.625 mm 1.25 mm/0.625
Pitch 0.938 0.984
kVp/mA 120/500 120/500
Reconstruction 2: For C-spine evaluation (only needed if history includes trauma)
Algorithm: Bone
Window setting: 4000 ww/400 wl
DFOV: ∼13
Slice thickness/interval 2.5 mm/1.25 mm 2.5 mm/1.25 mm
Reformations: Coronal and Sagittal for both CoW and Carotids
Window setting: 800 ww/200 wl
DFOV: ∼20
Slice thickness/spacing: 2.0 mm/2.0 mm
Render mode: MIP
CTV—Cranial Venography
Examples of clinical indications: Evaluation of cerebral venous disorders, dural sinus thrombosis
Scouts: AP and lateral
Scan type: Helical
Scan plane: Transverse
Start location: Just below the skull base
End location: Just above the vertex
IV contrast: 100 mL at 4.0 mL/s. Scan delay = 30 seconds (16-detector)/45 seconds (64-detector)
Oral contrast: None
Reference angle: No gantry tilt
DFOV: 25 cm
SFOV: Head
Algorithm: Standard
Window settings: 350 ww/40 wl
16-Detector Protocol 64-Detector Protocol
Gantry rotation time 0.5 s 0.5 s
Acquisition (detector width × number of detector rows) = coverage
0.625 mm × 16 = 10 mm 0.625 mm × 64 = 40 mm
Reconstruction (slice thickness/interval) 1.25 mm/0.625 mm 1.25 mm/0.625 mm
Pitch 0.562 0.531
kVp/mA 120/300 120/300
(Continued )
Chap19.indd 261Chap19.indd 261 10/9/2009 2:41:18 PM10/9/2009 2:41:18 PM
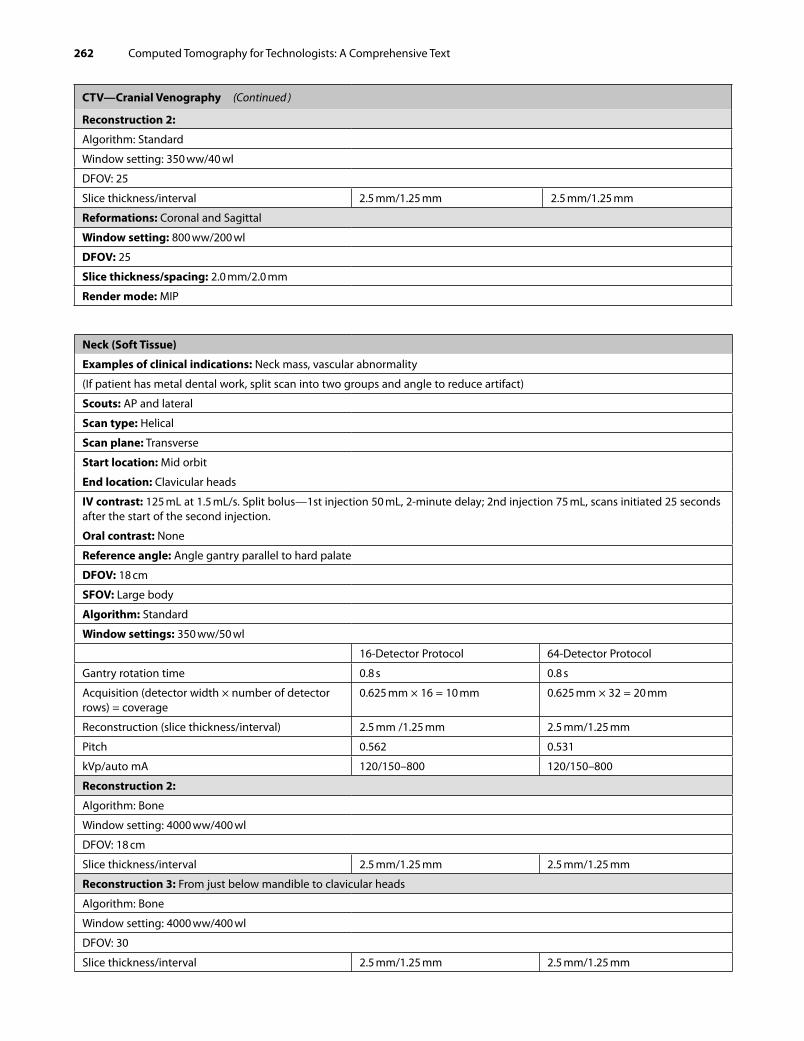
262 Computed Tomography for Technologists: A Comprehensive Text
Neck (Soft Tissue)
Examples of clinical indications: Neck mass, vascular abnormality
(If patient has metal dental work, split scan into two groups and angle to reduce artifact)
Scouts: AP and lateral
Scan type: Helical
Scan plane: Transverse
Start location: Mid orbit
End location: Clavicular heads
IV contrast: 125 mL at 1.5 mL/s. Split bolus—1st injection 50 mL, 2-minute delay; 2nd injection 75 mL, scans initiated 25 seconds after the start of the second injection.
Oral contrast: None
Reference angle: Angle gantry parallel to hard palate
DFOV: 18 cm
SFOV: Large body
Algorithm: Standard
Window settings: 350 ww/50 wl
16-Detector Protocol 64-Detector Protocol
Gantry rotation time 0.8 s 0.8 s
Acquisition (detector width × number of detector rows) = coverage
0.625 mm × 16 = 10 mm 0.625 mm × 32 = 20 mm
Reconstruction (slice thickness/interval) 2.5 mm /1.25 mm 2.5 mm/1.25 mm
Pitch 0.562 0.531
kVp/auto mA 120/150–800 120/150–800
Reconstruction 2:
Algorithm: Bone
Window setting: 4000 ww/400 wl
DFOV: 18 cm
Slice thickness/interval 2.5 mm/1.25 mm 2.5 mm/1.25 mm
Reconstruction 3: From just below mandible to clavicular heads
Algorithm: Bone
Window setting: 4000 ww/400 wl
DFOV: 30
Slice thickness/interval 2.5 mm/1.25 mm 2.5 mm/1.25 mm
CTV—Cranial Venography (Continued )
Reconstruction 2:
Algorithm: Standard
Window setting: 350 ww/40 wl
DFOV: 25
Slice thickness/interval 2.5 mm/1.25 mm 2.5 mm/1.25 mm
Reformations: Coronal and Sagittal
Window setting: 800 ww/200 wl
DFOV: 25
Slice thickness/spacing: 2.0 mm/2.0 mm
Render mode: MIP
Chap19.indd 262Chap19.indd 262 10/9/2009 2:41:18 PM10/9/2009 2:41:18 PM
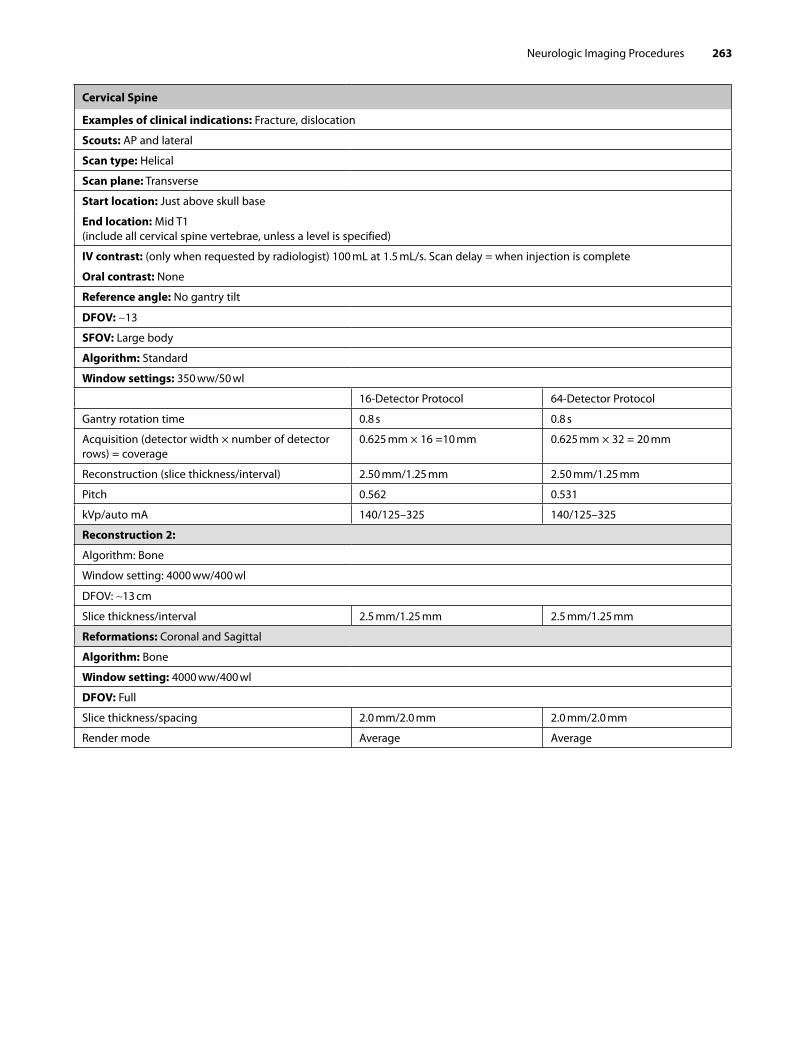
Neurologic Imaging Procedures 263
Cervical Spine
Examples of clinical indications: Fracture, dislocation
Scouts: AP and lateral
Scan type: Helical
Scan plane: Transverse
Start location: Just above skull base
End location: Mid T1(include all cervical spine vertebrae, unless a level is specified)
IV contrast: (only when requested by radiologist) 100 mL at 1.5 mL/s. Scan delay = when injection is complete
Oral contrast: None
Reference angle: No gantry tilt
DFOV: ∼13
SFOV: Large body
Algorithm: Standard
Window settings: 350 ww/50 wl
16-Detector Protocol 64-Detector Protocol
Gantry rotation time 0.8 s 0.8 s
Acquisition (detector width × number of detector rows) = coverage
0.625 mm × 16 =10 mm 0.625 mm × 32 = 20 mm
Reconstruction (slice thickness/interval) 2.50 mm/1.25 mm 2.50 mm/1.25 mm
Pitch 0.562 0.531
kVp/auto mA 140/125–325 140/125–325
Reconstruction 2:
Algorithm: Bone
Window setting: 4000 ww/400 wl
DFOV: ∼13 cm
Slice thickness/interval 2.5 mm/1.25 mm 2.5 mm/1.25 mm
Reformations: Coronal and Sagittal
Algorithm: Bone
Window setting: 4000 ww/400 wl
DFOV: Full
Slice thickness/spacing 2.0 mm/2.0 mm 2.0 mm/2.0 mm
Render mode Average Average
Chap19.indd 263Chap19.indd 263 10/9/2009 2:41:18 PM10/9/2009 2:41:18 PM
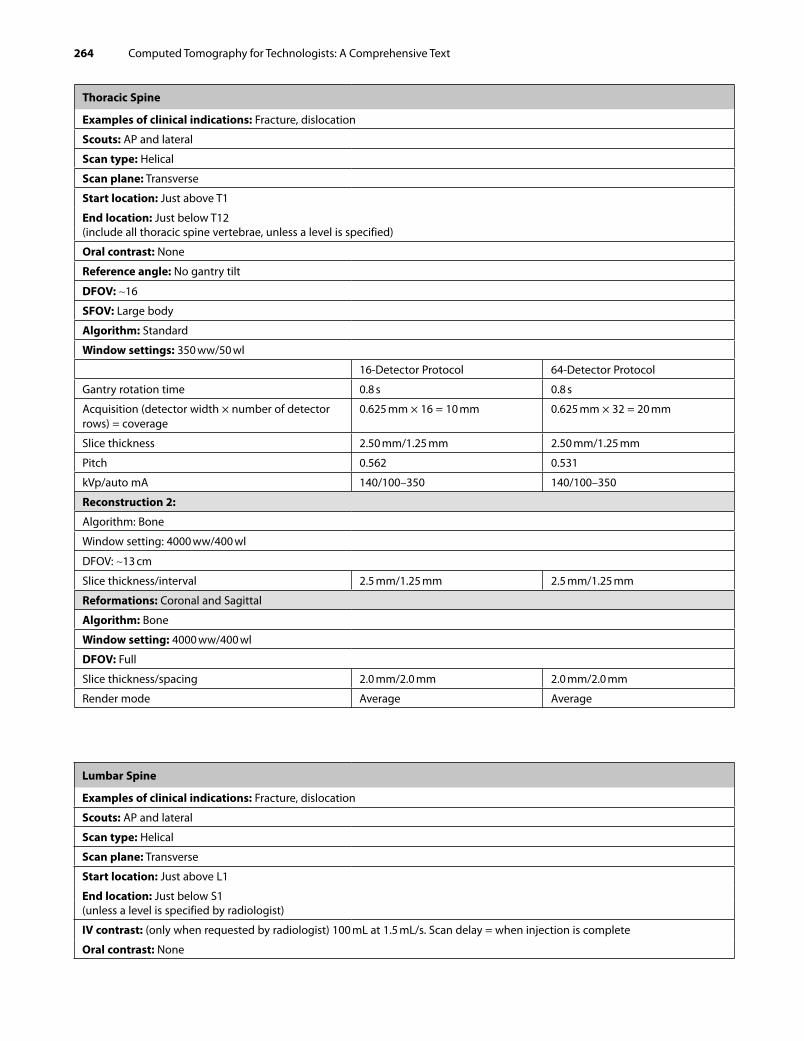
264 Computed Tomography for Technologists: A Comprehensive Text
Thoracic Spine
Examples of clinical indications: Fracture, dislocation
Scouts: AP and lateral
Scan type: Helical
Scan plane: Transverse
Start location: Just above T1
End location: Just below T12(include all thoracic spine vertebrae, unless a level is specified)
Oral contrast: None
Reference angle: No gantry tilt
DFOV: ∼16
SFOV: Large body
Algorithm: Standard
Window settings: 350 ww/50 wl
16-Detector Protocol 64-Detector Protocol
Gantry rotation time 0.8 s 0.8 s
Acquisition (detector width × number of detector rows) = coverage
0.625 mm × 16 = 10 mm 0.625 mm × 32 = 20 mm
Slice thickness 2.50 mm/1.25 mm 2.50 mm/1.25 mm
Pitch 0.562 0.531
kVp/auto mA 140/100–350 140/100–350
Reconstruction 2:
Algorithm: Bone
Window setting: 4000 ww/400 wl
DFOV: ∼13 cm
Slice thickness/interval 2.5 mm/1.25 mm 2.5 mm/1.25 mm
Reformations: Coronal and Sagittal
Algorithm: Bone
Window setting: 4000 ww/400 wl
DFOV: Full
Slice thickness/spacing 2.0 mm/2.0 mm 2.0 mm/2.0 mm
Render mode Average Average
Lumbar Spine
Examples of clinical indications: Fracture, dislocation
Scouts: AP and lateral
Scan type: Helical
Scan plane: Transverse
Start location: Just above L1
End location: Just below S1(unless a level is specified by radiologist)
IV contrast: (only when requested by radiologist) 100 mL at 1.5 mL/s. Scan delay = when injection is complete
Oral contrast: None
Chap19.indd 264Chap19.indd 264 10/9/2009 2:41:18 PM10/9/2009 2:41:18 PM
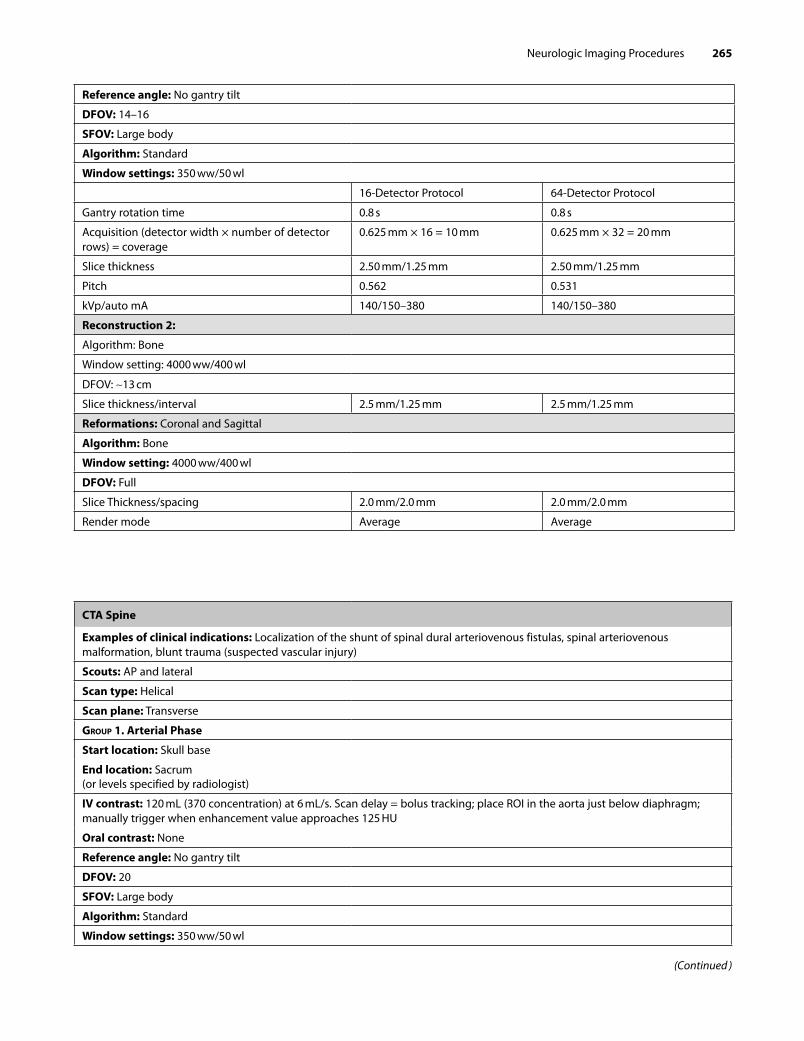
Neurologic Imaging Procedures 265
Reference angle: No gantry tilt
DFOV: 14–16
SFOV: Large body
Algorithm: Standard
Window settings: 350 ww/50 wl
16-Detector Protocol 64-Detector Protocol
Gantry rotation time 0.8 s 0.8 s
Acquisition (detector width × number of detector rows) = coverage
0.625 mm × 16 = 10 mm 0.625 mm × 32 = 20 mm
Slice thickness 2.50 mm/1.25 mm 2.50 mm/1.25 mm
Pitch 0.562 0.531
kVp/auto mA 140/150–380 140/150–380
Reconstruction 2:
Algorithm: Bone
Window setting: 4000 ww/400 wl
DFOV: ∼13 cm
Slice thickness/interval 2.5 mm/1.25 mm 2.5 mm/1.25 mm
Reformations: Coronal and Sagittal
Algorithm: Bone
Window setting: 4000 ww/400 wl
DFOV: Full
Slice Thickness/spacing 2.0 mm/2.0 mm 2.0 mm/2.0 mm
Render mode Average Average
CTA Spine
Examples of clinical indications: Localization of the shunt of spinal dural arteriovenous fistulas, spinal arteriovenous malformation, blunt trauma (suspected vascular injury)
Scouts: AP and lateral
Scan type: Helical
Scan plane: Transverse
GROUP 1. Arterial Phase
Start location: Skull base
End location: Sacrum(or levels specified by radiologist)
IV contrast: 120 mL (370 concentration) at 6 mL/s. Scan delay = bolus tracking; place ROI in the aorta just below diaphragm; manually trigger when enhancement value approaches 125 HU
Oral contrast: None
Reference angle: No gantry tilt
DFOV: 20
SFOV: Large body
Algorithm: Standard
Window settings: 350 ww/50 wl
(Continued )
Chap19.indd 265Chap19.indd 265 10/9/2009 2:41:18 PM10/9/2009 2:41:18 PM
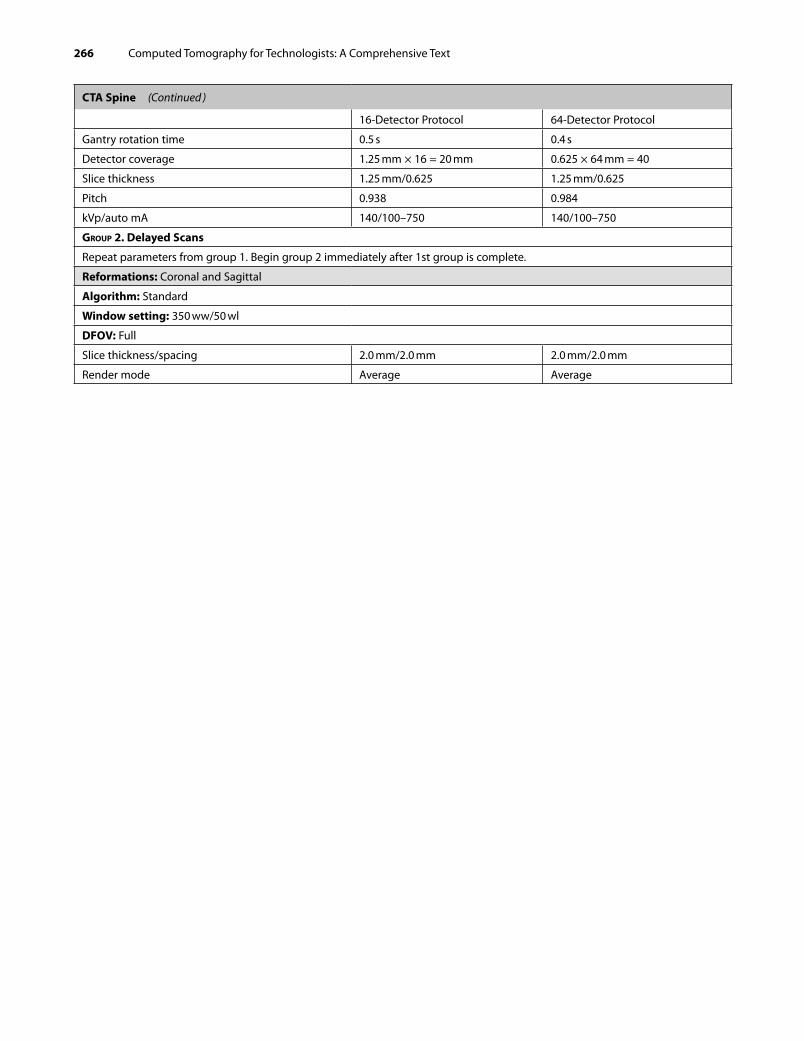
266 Computed Tomography for Technologists: A Comprehensive Text
CTA Spine (Continued )
16-Detector Protocol 64-Detector Protocol
Gantry rotation time 0.5 s 0.4 s
Detector coverage 1.25 mm × 16 = 20 mm 0.625 × 64 mm = 40
Slice thickness 1.25 mm/0.625 1.25 mm/0.625
Pitch 0.938 0.984
kVp/auto mA 140/100–750 140/100–750
GROUP 2. Delayed Scans
Repeat parameters from group 1. Begin group 2 immediately after 1st group is complete.
Reformations: Coronal and Sagittal
Algorithm: Standard
Window setting: 350 ww/50 wl
DFOV: Full
Slice thickness/spacing 2.0 mm/2.0 mm 2.0 mm/2.0 mm
Render mode Average Average
Chap19.indd 266Chap19.indd 266 10/9/2009 2:41:18 PM10/9/2009 2:41:18 PM
Related Documents