Imaging of Titan from the Cassini spacecraft Carolyn C. Porco 1 , Emily Baker 1 , John Barbara 2 , Kevin Beurle 3 , Andre Brahic 4 , Joseph A. Burns 5 , Sebastien Charnoz 4 , Nick Cooper 3 , Douglas D. Dawson 6 , Anthony D. Del Genio 2 , Tilmann Denk 7 , Luke Dones 8 , Ulyana Dyudina 9 , Michael W. Evans 3 , Stephanie Fussner 6 , Bernd Giese 10 , Kevin Grazier 11 , Paul Helfenstein 5 , Andrew P. Ingersoll 9 , Robert A. Jacobson 11 , Torrence V. Johnson 11 , Alfred McEwen 6 , Carl D. Murray 3 , Gerhard Neukum 7 , William M. Owen 11 , Jason Perry 6 , Thomas Roatsch 10 , Joseph Spitale 1 , Steven Squyres 5 , Peter Thomas 5 , Matthew Tiscareno 5 , Elizabeth P. Turtle 6 , Ashwin R. Vasavada 11 , Joseph Veverka 5 , Roland Wagner 10 & Robert West 11 1 Cassini Imaging Central Laboratory for Operations, Space Science Institute, 4750 Walnut Street, Suite 205, Boulder, Colorado 80301, USA 2 NASAGoddard Institute for Space Studies, 2880 Broadway, New York, New York 10025, USA 3 Astronomy Unit, Queen Mary, University of London, London E1 4NS, UK 4 C.E. de Saclay, Universite ´Paris 7, L’Orme des Merisiers, 91191 Gif-sur-Yvette Cedex, France 5 Department of Astronomy, Cornell University, Space Sciences Bldg, Ithaca, New York 14853, USA 6 Department of Planetary Sciences, University of Arizona, 1629 E. University Blvd, Tucson, Arizona 85721, USA 7 Institut fu ¨r Geologische Wissenschaften, Freie Universita ¨t, 12249 Berlin, Germany 8 Department of Space Sciences, Southwest Research Institute, 1050 Walnut Street, Suite 400, Boulder, Colorado 80302, USA 9 Division of Geological and Planetary Sciences, California Institute of Technology, 150-21, Pasadena, California 91125, USA 10 Institute of Planetary Research, German Aerospace Center, Rutherfordstrasse 2, 12489 Berlin, Germany 11 Jet Propulsion Laboratory, California Institute of Technology, 4800 Oak Grove Drive, Pasadena, California 91109, USA ........................................................................................................................................................................................................................... Titan, the largest moon of Saturn, is the only satellite in the Solar System with a substantial atmosphere. The atmosphere is poorly understood and obscures the surface, leading to intense speculation about Titan’s nature. Here we present observations of Titan from the imaging science experiment onboard the Cassini spacecraft that address some of these issues. The images reveal intricate surface albedo features that suggest aeolian, tectonic and fluvial processes; they also show a few circular features that could be impact structures. These observations imply that substantial surface modification has occurred over Titan’s history. We have not directly detected liquids on the surface to date. Convective clouds are found to be common near the south pole, and the motion of mid-latitude clouds consistently indicates eastward winds, from which we infer that the troposphere is rotating faster than the surface. A detached haze at an altitude of 500 km is 150–200 km higher than that observed by Voyager, and more tenuous haze layers are also resolved. In April 2004, as Cassini approached the saturnian system, the Imaging Science Subsystem 1 (ISS) began systematic observations of Titan with a three-month-long sequence, during which the pixel scale improved from ,200 km to 35 km. On 2 July 2004, shortly after entering Saturn orbit, Cassini had a distant (339,000 km) encounter with Titan (referred to as ‘T0’) during which images of the southern part of the sub-saturnian hemisphere and south-polar region were acquired at pixel scales of 2–3 km. The first close (1,200km) targeted flyby of Titan (‘TA’) occurred on 26 October 2004, followed by another close pass with similar geometry (‘TB’) on 13 December 2004. Both achieved pixel scales of a few hundred metres. These new observations of Titan have major implications for the nature of the surface and atmosphere, and raise important new questions. Titan’s atmosphere consists primarily of nitrogen, with methane being the second-most abundant species (2–6%) 2–4 . Photochemical reactions and escape of the lighter hydrogen produce a rich variety of complex hydrocarbons, which form a haze layer that obscures the surface at visible wavelengths and from which substantial quantities of organics may have precipitated onto the surface 5 . As a result, atmospheric methane has a short photochemical lifetime, suggesting that there is a source or reservoir of methane on or below Titan’s surface. At Titan’s surface temperature (,94 K) and pressure (1.5 bar), methane and ethane could be liquids, leading to suggestions of rainfall and lakes or seas of light hydrocarbons 6 . Earth-based telescopic observations had revealed bright and dark regions on the surface 7–9 and ephemeral tropospheric clouds 10 . However, we knew very little about either Titan’s surface or meteorology. The new Cassini ISS observations reported here show intricate albedo markings as small as a kilometre on the surface, ,100 times finer than the best Earth-based images. In equatorial regions these markings exhibit east–west and other trends suggestive of aeolian transport and tectonic processes. Concentric or circular albedo patterns that could mark impact structures are rare, suggesting a relatively young surface modified by other geologic and atmos- pheric processes. Long, curvilinear features, which are primarily dark, but sometimes bright, may mark fluvial channels. However, no enhanced mirror-like (specular) reflections —which would indi- cate the presence of liquids on the surface —have been detected. The images have also revealed important information about Titan’s atmosphere. In addition to convective clouds in the south- polar (summer) region, we have detected mid-latitude tropospheric clouds. Some cloud features are elongated east–west; these are observed to occur preferentially at certain latitudes and, in the only case where height information is available, at lower altitude than the polar clouds. Tracking of cloud motions consistently yields eastward winds with speeds as high as 34 m s 21 , providing the first direct evidence of super-rotation in Titan’s troposphere. Upper- atmospheric zonal banding is also apparent, being especially promi- nent in Titan’s north-polar region. A well-defined haze layer is seen at an altitude of 500 km, significantly higher than the 300–350-km altitude layer seen during the Voyager 2 flyby in 1981 (ref. 11), and finer structure is resolved in higher-resolution images of the haze. On the basis of the chemistry of its atmosphere, Titan is considered to be an important analogue to the early (pre-biotic) Earth 12 . The Cassini ISS observations of Titan’s surface suggest another strong similarity between these two bodies: the wide variety articles NATURE | VOL 434 | 10 MARCH 2005 | www.nature.com/nature 159 © 2005 Nature Publishing Group

Welcome message from author
This document is posted to help you gain knowledge. Please leave a comment to let me know what you think about it! Share it to your friends and learn new things together.
Transcript
Imaging of Titan from the CassinispacecraftCarolyn C. Porco1, Emily Baker1, John Barbara2, Kevin Beurle3, Andre Brahic4, Joseph A. Burns5, Sebastien Charnoz4, Nick Cooper3,Douglas D. Dawson6, Anthony D. Del Genio2, Tilmann Denk7, Luke Dones8, Ulyana Dyudina9, Michael W. Evans3, Stephanie Fussner6,Bernd Giese10, Kevin Grazier11, Paul Helfenstein5, Andrew P. Ingersoll9, Robert A. Jacobson11, Torrence V. Johnson11, Alfred McEwen6,Carl D. Murray3, Gerhard Neukum7, William M. Owen11, Jason Perry6, Thomas Roatsch10, Joseph Spitale1, Steven Squyres5, Peter Thomas5,Matthew Tiscareno5, Elizabeth P. Turtle6, Ashwin R. Vasavada11, Joseph Veverka5, Roland Wagner10 & Robert West11
1Cassini Imaging Central Laboratory for Operations, Space Science Institute, 4750 Walnut Street, Suite 205, Boulder, Colorado 80301, USA2NASA Goddard Institute for Space Studies, 2880 Broadway, New York, New York 10025, USA3Astronomy Unit, Queen Mary, University of London, London E1 4NS, UK4C.E. de Saclay, Universite Paris 7, L’Orme des Merisiers, 91191 Gif-sur-Yvette Cedex, France5Department of Astronomy, Cornell University, Space Sciences Bldg, Ithaca, New York 14853, USA6Department of Planetary Sciences, University of Arizona, 1629 E. University Blvd, Tucson, Arizona 85721, USA7Institut fur Geologische Wissenschaften, Freie Universitat, 12249 Berlin, Germany8Department of Space Sciences, Southwest Research Institute, 1050 Walnut Street, Suite 400, Boulder, Colorado 80302, USA9Division of Geological and Planetary Sciences, California Institute of Technology, 150-21, Pasadena, California 91125, USA10Institute of Planetary Research, German Aerospace Center, Rutherfordstrasse 2, 12489 Berlin, Germany11Jet Propulsion Laboratory, California Institute of Technology, 4800 Oak Grove Drive, Pasadena, California 91109, USA
...........................................................................................................................................................................................................................
Titan, the largest moon of Saturn, is the only satellite in the Solar System with a substantial atmosphere. The atmosphere is poorlyunderstood and obscures the surface, leading to intense speculation about Titan’s nature. Here we present observations of Titanfrom the imaging science experiment onboard the Cassini spacecraft that address some of these issues. The images revealintricate surface albedo features that suggest aeolian, tectonic and fluvial processes; they also show a few circular features thatcould be impact structures. These observations imply that substantial surface modification has occurred over Titan’s history. Wehave not directly detected liquids on the surface to date. Convective clouds are found to be common near the south pole, and themotion of mid-latitude clouds consistently indicates eastward winds, from which we infer that the troposphere is rotating fasterthan the surface. A detached haze at an altitude of 500 km is 150–200 km higher than that observed by Voyager, and more tenuoushaze layers are also resolved.
In April 2004, as Cassini approached the saturnian system, theImaging Science Subsystem1 (ISS) began systematic observations ofTitan with a three-month-long sequence, during which the pixelscale improved from ,200 km to 35 km. On 2 July 2004, shortlyafter entering Saturn orbit, Cassini had a distant (339,000 km)encounter with Titan (referred to as ‘T0’) during which images ofthe southern part of the sub-saturnian hemisphere and south-polarregion were acquired at pixel scales of 2–3 km. The first close(1,200 km) targeted flyby of Titan (‘TA’) occurred on 26 October2004, followed by another close pass with similar geometry (‘TB’)on 13 December 2004. Both achieved pixel scales of a few hundredmetres. These new observations of Titan have major implicationsfor the nature of the surface and atmosphere, and raise importantnew questions.
Titan’s atmosphere consists primarily of nitrogen, with methanebeing the second-most abundant species (2–6%)2–4. Photochemicalreactions and escape of the lighter hydrogen produce a rich varietyof complex hydrocarbons, which form a haze layer that obscures thesurface at visible wavelengths and from which substantial quantitiesof organics may have precipitated onto the surface5. As a result,atmospheric methane has a short photochemical lifetime,suggesting that there is a source or reservoir of methane on orbelow Titan’s surface. At Titan’s surface temperature (,94 K) andpressure (1.5 bar), methane and ethane could be liquids, leading tosuggestions of rainfall and lakes or seas of light hydrocarbons6.Earth-based telescopic observations had revealed bright and darkregions on the surface7–9 and ephemeral tropospheric clouds10.However, we knew very little about either Titan’s surface ormeteorology.
The new Cassini ISS observations reported here show intricatealbedo markings as small as a kilometre on the surface, ,100 timesfiner than the best Earth-based images. In equatorial regions thesemarkings exhibit east–west and other trends suggestive of aeoliantransport and tectonic processes. Concentric or circular albedopatterns that could mark impact structures are rare, suggesting arelatively young surface modified by other geologic and atmos-pheric processes. Long, curvilinear features, which are primarilydark, but sometimes bright, may mark fluvial channels. However,no enhanced mirror-like (specular) reflections—which would indi-cate the presence of liquids on the surface—have been detected.
The images have also revealed important information aboutTitan’s atmosphere. In addition to convective clouds in the south-polar (summer) region, we have detected mid-latitude troposphericclouds. Some cloud features are elongated east–west; these areobserved to occur preferentially at certain latitudes and, in theonly case where height information is available, at lower altitudethan the polar clouds. Tracking of cloud motions consistently yieldseastward winds with speeds as high as 34 m s21, providing the firstdirect evidence of super-rotation in Titan’s troposphere. Upper-atmospheric zonal banding is also apparent, being especially promi-nent in Titan’s north-polar region. A well-defined haze layer is seenat an altitude of 500 km, significantly higher than the 300–350-kmaltitude layer seen during the Voyager 2 flyby in 1981 (ref. 11), andfiner structure is resolved in higher-resolution images of the haze.
On the basis of the chemistry of its atmosphere, Titan isconsidered to be an important analogue to the early (pre-biotic)Earth12. The Cassini ISS observations of Titan’s surface suggestanother strong similarity between these two bodies: the wide variety
articles
NATURE | VOL 434 | 10 MARCH 2005 | www.nature.com/nature 159© 2005 Nature Publishing Group
of surface modification processes and their relative importance.Craters on Earth are relatively rare, being quickly modified bytectonism, erosion, burial and volcanism. Furthermore, on Earth allof these processes are continuous, so it is rare to be able to attributethe morphology of a particular region to a single process. Similarly,the diversity of the albedo patterns revealed on Titan’s surfacesuggests a complex interaction between different processes actingconcurrently to modify the surface.
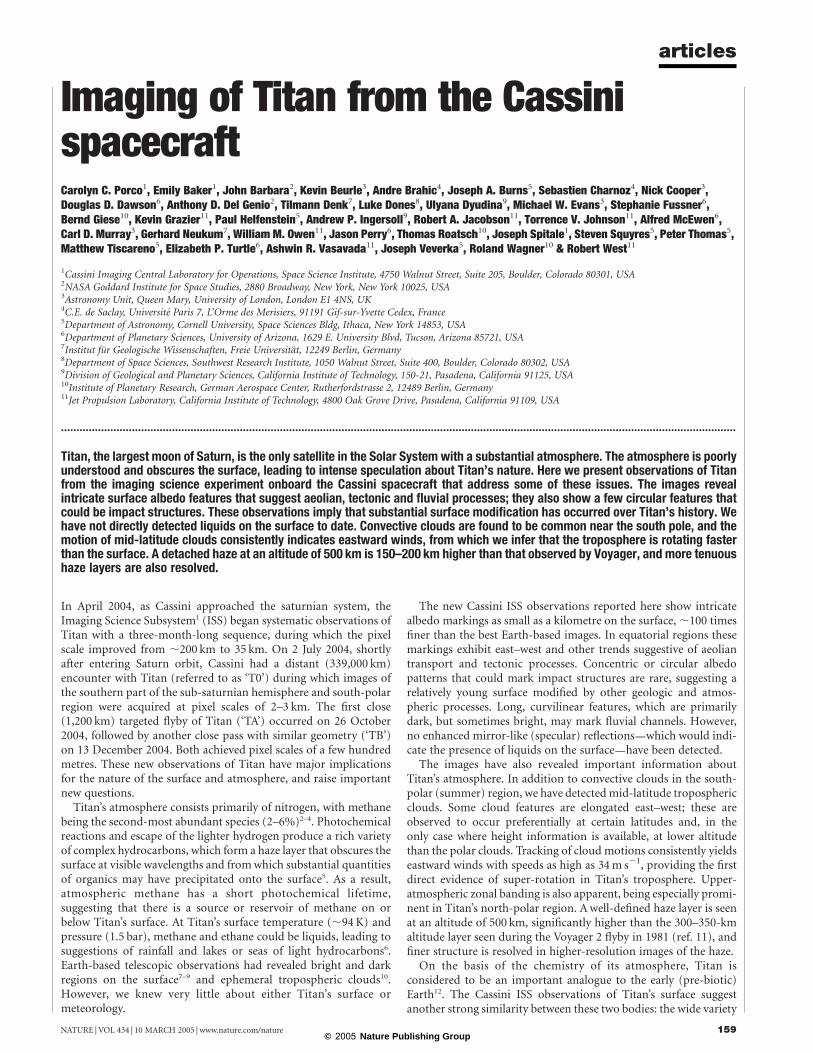
Titan’s surfaceThe surface of Titan was barely detected in Voyager visible-wave-length images acquired in 1981 (ref. 13). The Cassini ISS wasdesigned1 to take advantage of the improved surface visibility atparticular infrared wavelengths where the optical depth of theatmospheric haze is lower and where methane gas is not stronglyabsorbing14. Observations acquired during approach were pro-cessed to produce a surface map with near-global coverage, exceptfor the unilluminated north (winter) pole (Fig. 1). This map wassimilar to, but sharper than, the best Earth-based observations at2.0–2.3 mm (refs 15, 16) where the haze optical depth is low, and itstill provides the best-resolution view of the sub-saturnian, equa-torial regions. Relatively low-albedo features with scales down to,100 km, some with strikingly linear boundaries, are seen near theequator, whereas the middle latitudes appear more uniformly brightand the south-polar region is relatively dark. The large bright regioncentred at 108 S, 1008W has been named ‘Xanadu Regio’; this is atpresent the only officially named feature on Titan.
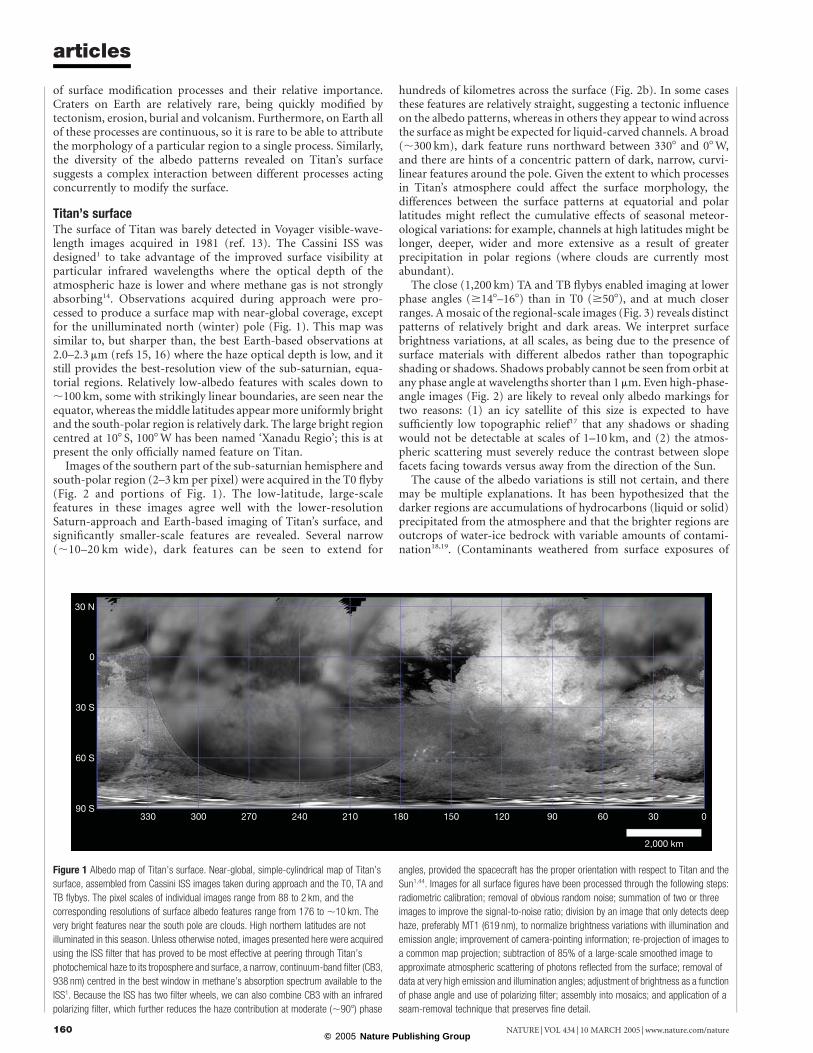
Images of the southern part of the sub-saturnian hemisphere andsouth-polar region (2–3 km per pixel) were acquired in the T0 flyby(Fig. 2 and portions of Fig. 1). The low-latitude, large-scalefeatures in these images agree well with the lower-resolutionSaturn-approach and Earth-based imaging of Titan’s surface, andsignificantly smaller-scale features are revealed. Several narrow(,10–20 km wide), dark features can be seen to extend for
hundreds of kilometres across the surface (Fig. 2b). In some casesthese features are relatively straight, suggesting a tectonic influenceon the albedo patterns, whereas in others they appear to wind acrossthe surface as might be expected for liquid-carved channels. A broad(,300 km), dark feature runs northward between 3308 and 08W,and there are hints of a concentric pattern of dark, narrow, curvi-linear features around the pole. Given the extent to which processesin Titan’s atmosphere could affect the surface morphology, thedifferences between the surface patterns at equatorial and polarlatitudes might reflect the cumulative effects of seasonal meteor-ological variations: for example, channels at high latitudes might belonger, deeper, wider and more extensive as a result of greaterprecipitation in polar regions (where clouds are currently mostabundant).
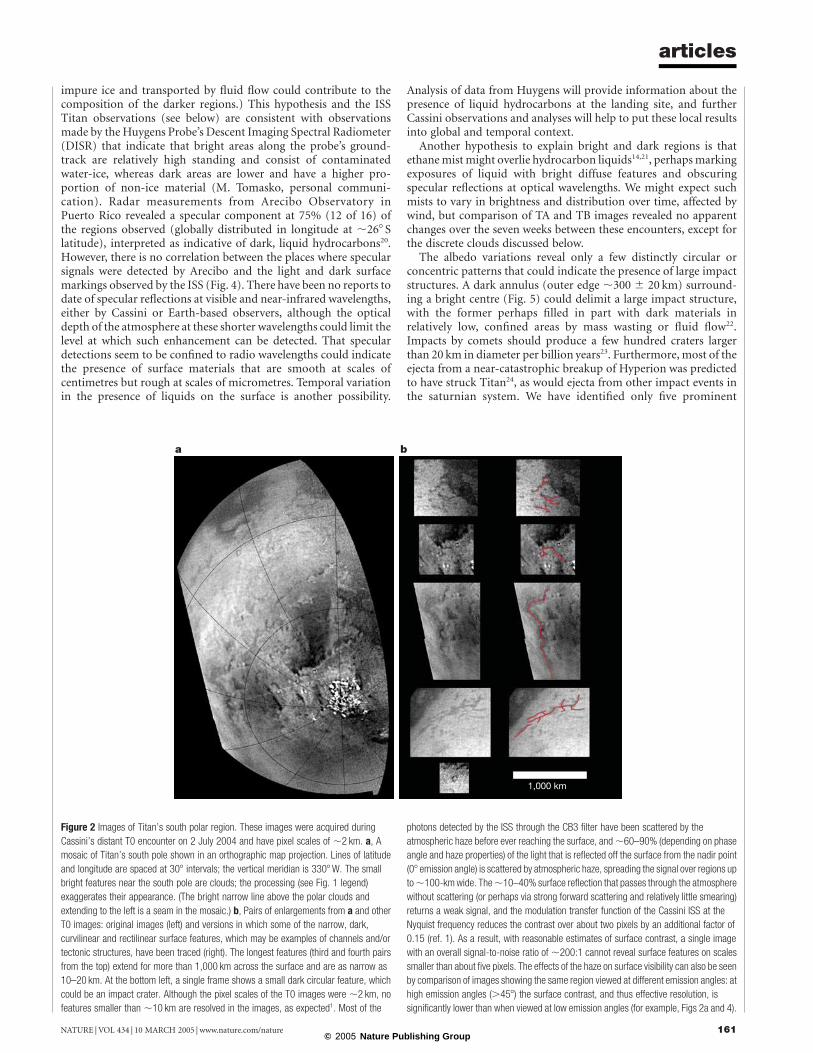
The close (1,200 km) TA and TB flybys enabled imaging at lowerphase angles ($148–168) than in T0 ($508), and at much closerranges. A mosaic of the regional-scale images (Fig. 3) reveals distinctpatterns of relatively bright and dark areas. We interpret surfacebrightness variations, at all scales, as being due to the presence ofsurface materials with different albedos rather than topographicshading or shadows. Shadows probably cannot be seen from orbit atany phase angle at wavelengths shorter than 1 mm. Even high-phase-angle images (Fig. 2) are likely to reveal only albedo markings fortwo reasons: (1) an icy satellite of this size is expected to havesufficiently low topographic relief17 that any shadows or shadingwould not be detectable at scales of 1–10 km, and (2) the atmos-pheric scattering must severely reduce the contrast between slopefacets facing towards versus away from the direction of the Sun.
The cause of the albedo variations is still not certain, and theremay be multiple explanations. It has been hypothesized that thedarker regions are accumulations of hydrocarbons (liquid or solid)precipitated from the atmosphere and that the brighter regions areoutcrops of water-ice bedrock with variable amounts of contami-nation18,19. (Contaminants weathered from surface exposures of
Figure 1 Albedo map of Titan’s surface. Near-global, simple-cylindrical map of Titan’s
surface, assembled from Cassini ISS images taken during approach and the T0, TA and
TB flybys. The pixel scales of individual images range from 88 to 2 km, and the
corresponding resolutions of surface albedo features range from 176 to ,10 km. The
very bright features near the south pole are clouds. High northern latitudes are not
illuminated in this season. Unless otherwise noted, images presented here were acquired
using the ISS filter that has proved to be most effective at peering through Titan’s
photochemical haze to its troposphere and surface, a narrow, continuum-band filter (CB3,
938 nm) centred in the best window in methane’s absorption spectrum available to the
ISS1. Because the ISS has two filter wheels, we can also combine CB3 with an infrared
polarizing filter, which further reduces the haze contribution at moderate (,908) phase
angles, provided the spacecraft has the proper orientation with respect to Titan and the
Sun1,44. Images for all surface figures have been processed through the following steps:
radiometric calibration; removal of obvious random noise; summation of two or three
images to improve the signal-to-noise ratio; division by an image that only detects deep
haze, preferably MT1 (619 nm), to normalize brightness variations with illumination and
emission angle; improvement of camera-pointing information; re-projection of images to
a common map projection; subtraction of 85% of a large-scale smoothed image to
approximate atmospheric scattering of photons reflected from the surface; removal of
data at very high emission and illumination angles; adjustment of brightness as a function
of phase angle and use of polarizing filter; assembly into mosaics; and application of a
seam-removal technique that preserves fine detail.
articles
NATURE | VOL 434 | 10 MARCH 2005 | www.nature.com/nature160© 2005 Nature Publishing Group
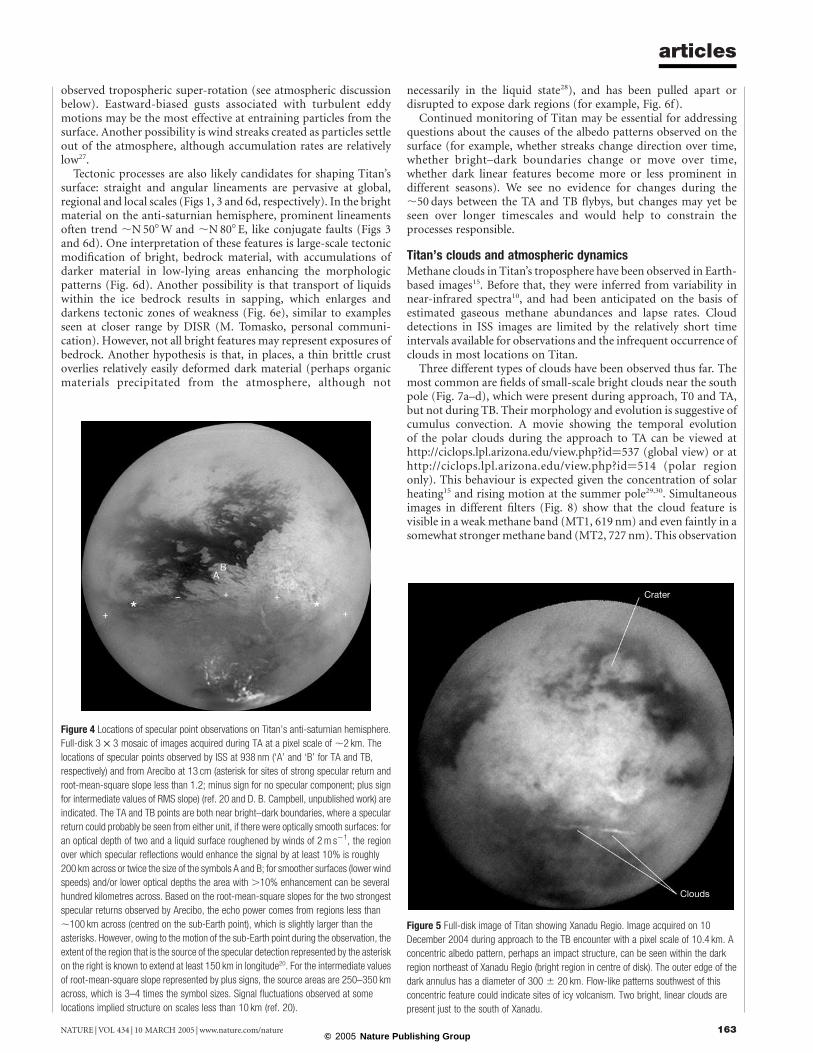
impure ice and transported by fluid flow could contribute to thecomposition of the darker regions.) This hypothesis and the ISSTitan observations (see below) are consistent with observationsmade by the Huygens Probe’s Descent Imaging Spectral Radiometer(DISR) that indicate that bright areas along the probe’s ground-track are relatively high standing and consist of contaminatedwater-ice, whereas dark areas are lower and have a higher pro-portion of non-ice material (M. Tomasko, personal communi-cation). Radar measurements from Arecibo Observatory inPuerto Rico revealed a specular component at 75% (12 of 16) ofthe regions observed (globally distributed in longitude at ,268 Slatitude), interpreted as indicative of dark, liquid hydrocarbons20.However, there is no correlation between the places where specularsignals were detected by Arecibo and the light and dark surfacemarkings observed by the ISS (Fig. 4). There have been no reports todate of specular reflections at visible and near-infrared wavelengths,either by Cassini or Earth-based observers, although the opticaldepth of the atmosphere at these shorter wavelengths could limit thelevel at which such enhancement can be detected. That speculardetections seem to be confined to radio wavelengths could indicatethe presence of surface materials that are smooth at scales ofcentimetres but rough at scales of micrometres. Temporal variationin the presence of liquids on the surface is another possibility.
Analysis of data from Huygens will provide information about thepresence of liquid hydrocarbons at the landing site, and furtherCassini observations and analyses will help to put these local resultsinto global and temporal context.
Another hypothesis to explain bright and dark regions is thatethane mist might overlie hydrocarbon liquids14,21, perhaps markingexposures of liquid with bright diffuse features and obscuringspecular reflections at optical wavelengths. We might expect suchmists to vary in brightness and distribution over time, affected bywind, but comparison of TA and TB images revealed no apparentchanges over the seven weeks between these encounters, except forthe discrete clouds discussed below.
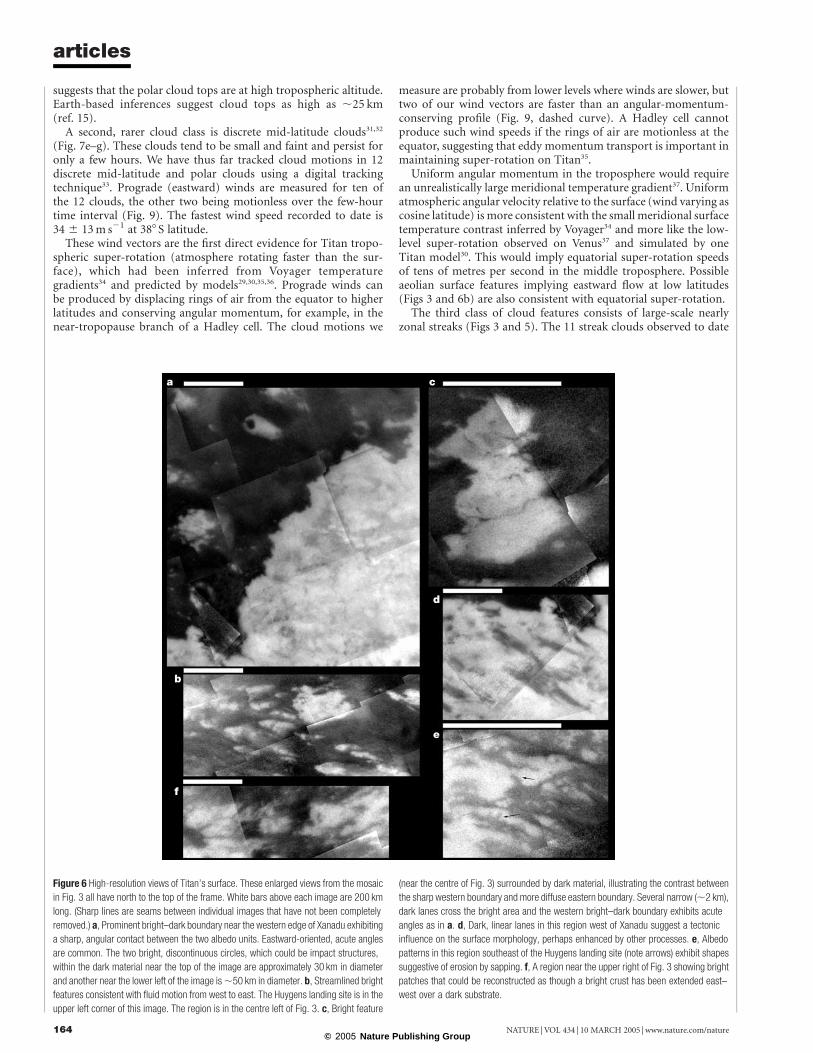
The albedo variations reveal only a few distinctly circular orconcentric patterns that could indicate the presence of large impactstructures. A dark annulus (outer edge ,300 ^ 20 km) surround-ing a bright centre (Fig. 5) could delimit a large impact structure,with the former perhaps filled in part with dark materials inrelatively low, confined areas by mass wasting or fluid flow22.Impacts by comets should produce a few hundred craters largerthan 20 km in diameter per billion years23. Furthermore, most of theejecta from a near-catastrophic breakup of Hyperion was predictedto have struck Titan24, as would ejecta from other impact events inthe saturnian system. We have identified only five prominent
Figure 2 Images of Titan’s south polar region. These images were acquired during
Cassini’s distant T0 encounter on 2 July 2004 and have pixel scales of ,2 km. a, A
mosaic of Titan’s south pole shown in an orthographic map projection. Lines of latitude
and longitude are spaced at 308 intervals; the vertical meridian is 3308W. The small
bright features near the south pole are clouds; the processing (see Fig. 1 legend)
exaggerates their appearance. (The bright narrow line above the polar clouds and
extending to the left is a seam in the mosaic.) b, Pairs of enlargements from a and other
T0 images: original images (left) and versions in which some of the narrow, dark,
curvilinear and rectilinear surface features, which may be examples of channels and/or
tectonic structures, have been traced (right). The longest features (third and fourth pairs
from the top) extend for more than 1,000 km across the surface and are as narrow as
10–20 km. At the bottom left, a single frame shows a small dark circular feature, which
could be an impact crater. Although the pixel scales of the T0 images were ,2 km, no
features smaller than ,10 km are resolved in the images, as expected1. Most of the
photons detected by the ISS through the CB3 filter have been scattered by the
atmospheric haze before ever reaching the surface, and ,60–90% (depending on phase
angle and haze properties) of the light that is reflected off the surface from the nadir point
(08 emission angle) is scattered by atmospheric haze, spreading the signal over regions up
to,100-km wide. The,10–40% surface reflection that passes through the atmosphere
without scattering (or perhaps via strong forward scattering and relatively little smearing)
returns a weak signal, and the modulation transfer function of the Cassini ISS at the
Nyquist frequency reduces the contrast over about two pixels by an additional factor of
0.15 (ref. 1). As a result, with reasonable estimates of surface contrast, a single image
with an overall signal-to-noise ratio of ,200:1 cannot reveal surface features on scales
smaller than about five pixels. The effects of the haze on surface visibility can also be seen
by comparison of images showing the same region viewed at different emission angles: at
high emission angles (.458) the surface contrast, and thus effective resolution, is
significantly lower than when viewed at low emission angles (for example, Figs 2a and 4).
articles
NATURE | VOL 434 | 10 MARCH 2005 | www.nature.com/nature 161© 2005 Nature Publishing Group
circular or concentric albedo features larger than 20 km in diameter(Figs 2b, 3, 5, 6a) over the,30% of Titan imaged at better than 2 kmper pixel. In particular, there are three bright circular features30–50 km in diameter within the dark region west of Xanadu(Fig. 6a), which represents ,5% of the surface area of Titan.Given the lack of topographic information, craters might best bedetected by the ISS as albedo features within dark regions whereraised crater rims, presumably ice bedrock, would project above thedark infilling material. On the basis of the expected cratering rate23,if these features are impact structures and we have detected all of thelarge craters in this region, the age of this part of Titan’s surface (thatis, the ice bedrock down to a depth of a few kilometres) is only,130–300 Myr. If large impact structures are this rare on Titan, itsuggests that the rates of surface modification processes such asviscous relaxation, tectonic resurfacing, erosion, deposition, andperhaps icy volcanism, have been sufficient to eliminate kilometre-scale relief over timescales of the order of 108 years. In contrast,surface ages for Ganymede and Callisto, which are expected to havelevels of radiogenic heating comparable to Titan, generally exceed109 years (ref. 23). One possible explanation for a geologicallyyounger surface is that Titan is richer in ammonia, which lowersthe melting point of water-ice and makes the resulting liquidneutrally buoyant25, thereby allowing more extensive endogenicresurfacing at comparable levels of heat flow.
The albedo patterns we do see on Titan’s surface are quite varied,and include diffuse bright streaks, narrow dark lineaments (bothstraight and curved), bright and dark patches with curved or
straight edges and often angular boundaries, and dark and brightspots (Figs 3 and 6). It is difficult to identify the processesresponsible for many of these patterns, but likely candidates includeaeolian and fluvial processes (perhaps sapping), icy volcanism, andtectonics. In many cases a combination of these processes isprobably responsible for the features we observe, for example,tectonic structures modified by fluvial activity.
The prominent albedo boundary on the western side of Xanaduvaries along its length (Fig. 3). In some places it is quite sharp andexhibits linear and angular shapes (Fig. 6a), whose form andorientation (at this resolution) are consistent with the dark materialhaving embayed the bright terrain, an interpretation in agreementwith the DISR findings that the bright regions near the Huygenslanding site are higher than the dark regions (M. Tomasko, personalcommunication).
Streaks are ubiquitous in the equatorial region observed in TAand TB, generally trending west to east (Fig. 3). In addition, manybright patches within the large dark region have sharp westernmargins and diffuse, elongated eastern margins (Fig. 6b, c), alsosuggesting eastward flow. Finally, some of the bright patches havestreamlined shapes consistent with movement of a fluid from westto east (Figs 3 and 6b). Given the large scale and extent of thesefeatures, the atmosphere seems the most likely fluid to be respon-sible for the patterns. The well-developed eastward pattern is notconsistent with a tidal source, because tidal winds should reversedirection twice per Titan day26. Instead, the preferred orientationsuggests that aeolian features are controlled in some way by the
Figure 3 Mosaic of the equatorial region of Titan’s anti-saturnian hemisphere. The
background is a 3 £ 3 mosaic acquired during TA at a scale of ,2 km per pixel (Fig. 4),
with closer-range images (0.4–1.2 km per pixel, which means that the approximate scale
of features that are resolved is 2–6 km) acquired during TA and TB covering most of the
region. This is a simple-cylindrical map projection. Apart from the obvious clouds
(described below), which are observed to move and change over timescales of several
hours, we are confident that the local brightness variations in CB3 images represent
surface features, because: (1) they have well-defined boundaries and have not been
observed to change over time; and (2) the larger-scale features agree well with long-term,
Earth-based observations and those of the Cassini Visual and Infrared Mapping
Spectrometer (VIMS)45, acquired at longer wavelengths where atmospheric opacity is
lower. The top-of-the-atmosphere normalized brightness I/F, where I is the intensity
corrected to normal illumination and pF is the incident solar flux, varies from 0.26 to 0.39
in the CB3 images without the polarizer filter, but much of this brightness is due to haze.
Because the haze is spatially uniform on the scale of the brightness variations, the ratio of
the brightest to the darkest surface features is at least 0.39/0.26 ¼ 1.5. For the brightest
surface features I/F is at least 0.13 ( ¼ 0.39 2 0.26) brighter than the dark material.
articles
NATURE | VOL 434 | 10 MARCH 2005 | www.nature.com/nature162© 2005 Nature Publishing Group
observed tropospheric super-rotation (see atmospheric discussionbelow). Eastward-biased gusts associated with turbulent eddymotions may be the most effective at entraining particles from thesurface. Another possibility is wind streaks created as particles settleout of the atmosphere, although accumulation rates are relativelylow27.
Tectonic processes are also likely candidates for shaping Titan’ssurface: straight and angular lineaments are pervasive at global,regional and local scales (Figs 1, 3 and 6d, respectively). In the brightmaterial on the anti-saturnian hemisphere, prominent lineamentsoften trend ,N 508W and ,N 808 E, like conjugate faults (Figs 3and 6d). One interpretation of these features is large-scale tectonicmodification of bright, bedrock material, with accumulations ofdarker material in low-lying areas enhancing the morphologicpatterns (Fig. 6d). Another possibility is that transport of liquidswithin the ice bedrock results in sapping, which enlarges anddarkens tectonic zones of weakness (Fig. 6e), similar to examplesseen at closer range by DISR (M. Tomasko, personal communi-cation). However, not all bright features may represent exposures ofbedrock. Another hypothesis is that, in places, a thin brittle crustoverlies relatively easily deformed dark material (perhaps organicmaterials precipitated from the atmosphere, although not
necessarily in the liquid state28), and has been pulled apart ordisrupted to expose dark regions (for example, Fig. 6f).
Continued monitoring of Titan may be essential for addressingquestions about the causes of the albedo patterns observed on thesurface (for example, whether streaks change direction over time,whether bright–dark boundaries change or move over time,whether dark linear features become more or less prominent indifferent seasons). We see no evidence for changes during the,50 days between the TA and TB flybys, but changes may yet beseen over longer timescales and would help to constrain theprocesses responsible.
Titan’s clouds and atmospheric dynamicsMethane clouds in Titan’s troposphere have been observed in Earth-based images15. Before that, they were inferred from variability innear-infrared spectra10, and had been anticipated on the basis ofestimated gaseous methane abundances and lapse rates. Clouddetections in ISS images are limited by the relatively short timeintervals available for observations and the infrequent occurrence ofclouds in most locations on Titan.
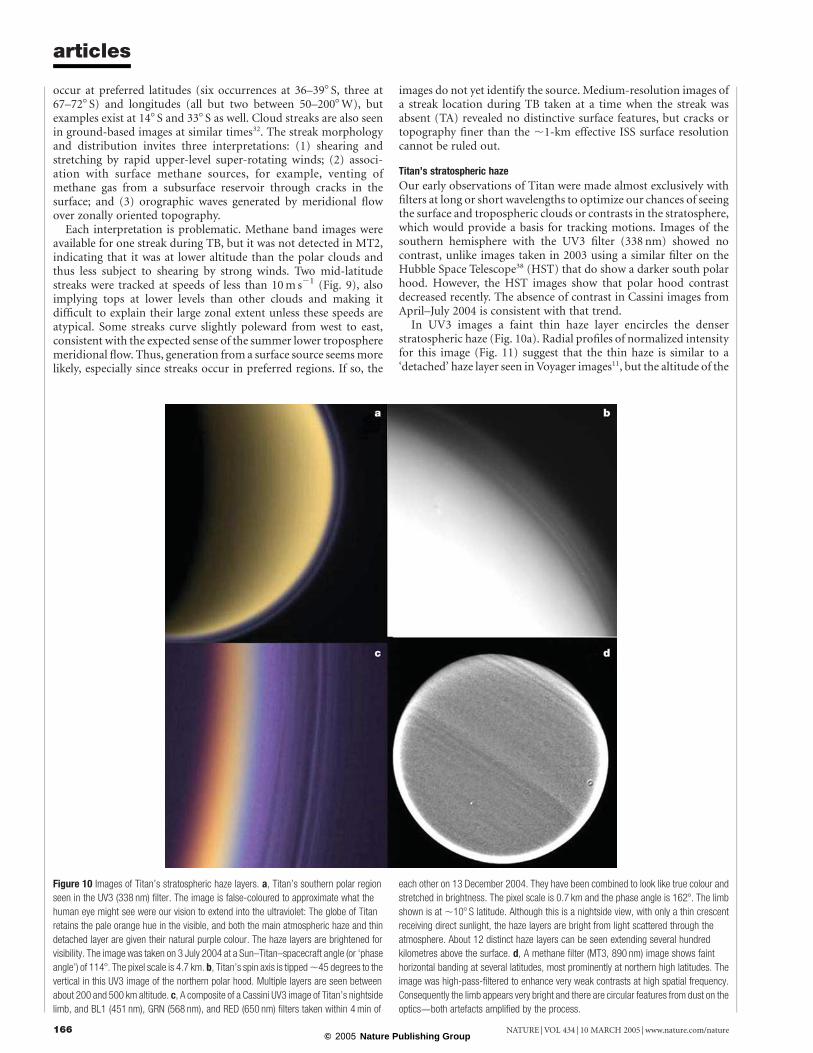
Three different types of clouds have been observed thus far. Themost common are fields of small-scale bright clouds near the southpole (Fig. 7a–d), which were present during approach, T0 and TA,but not during TB. Their morphology and evolution is suggestive ofcumulus convection. A movie showing the temporal evolutionof the polar clouds during the approach to TA can be viewed athttp://ciclops.lpl.arizona.edu/view.php?id¼537 (global view) or athttp://ciclops.lpl.arizona.edu/view.php?id¼514 (polar regiononly). This behaviour is expected given the concentration of solarheating15 and rising motion at the summer pole29,30. Simultaneousimages in different filters (Fig. 8) show that the cloud feature isvisible in a weak methane band (MT1, 619 nm) and even faintly in asomewhat stronger methane band (MT2, 727 nm). This observation
Figure 5 Full-disk image of Titan showing Xanadu Regio. Image acquired on 10
December 2004 during approach to the TB encounter with a pixel scale of 10.4 km. A
concentric albedo pattern, perhaps an impact structure, can be seen within the dark
region northeast of Xanadu Regio (bright region in centre of disk). The outer edge of the
dark annulus has a diameter of 300 ^ 20 km. Flow-like patterns southwest of this
concentric feature could indicate sites of icy volcanism. Two bright, linear clouds are
present just to the south of Xanadu.
Figure 4 Locations of specular point observations on Titan’s anti-saturnian hemisphere.
Full-disk 3 £ 3 mosaic of images acquired during TA at a pixel scale of ,2 km. The
locations of specular points observed by ISS at 938 nm (‘A’ and ‘B’ for TA and TB,
respectively) and from Arecibo at 13 cm (asterisk for sites of strong specular return and
root-mean-square slope less than 1.2; minus sign for no specular component; plus sign
for intermediate values of RMS slope) (ref. 20 and D. B. Campbell, unpublished work) are
indicated. The TA and TB points are both near bright–dark boundaries, where a specular
return could probably be seen from either unit, if there were optically smooth surfaces: for
an optical depth of two and a liquid surface roughened by winds of 2 m s21, the region
over which specular reflections would enhance the signal by at least 10% is roughly
200 km across or twice the size of the symbols A and B; for smoother surfaces (lower wind
speeds) and/or lower optical depths the area with .10% enhancement can be several
hundred kilometres across. Based on the root-mean-square slopes for the two strongest
specular returns observed by Arecibo, the echo power comes from regions less than
,100 km across (centred on the sub-Earth point), which is slightly larger than the
asterisks. However, owing to the motion of the sub-Earth point during the observation, the
extent of the region that is the source of the specular detection represented by the asterisk
on the right is known to extend at least 150 km in longitude20. For the intermediate values
of root-mean-square slope represented by plus signs, the source areas are 250–350 km
across, which is 3–4 times the symbol sizes. Signal fluctuations observed at some
locations implied structure on scales less than 10 km (ref. 20).
articles
NATURE | VOL 434 | 10 MARCH 2005 | www.nature.com/nature 163© 2005 Nature Publishing Group
suggests that the polar cloud tops are at high tropospheric altitude.Earth-based inferences suggest cloud tops as high as ,25 km(ref. 15).
A second, rarer cloud class is discrete mid-latitude clouds31,32
(Fig. 7e–g). These clouds tend to be small and faint and persist foronly a few hours. We have thus far tracked cloud motions in 12discrete mid-latitude and polar clouds using a digital trackingtechnique33. Prograde (eastward) winds are measured for ten ofthe 12 clouds, the other two being motionless over the few-hourtime interval (Fig. 9). The fastest wind speed recorded to date is34 ^ 13 m s21 at 388 S latitude.
These wind vectors are the first direct evidence for Titan tropo-spheric super-rotation (atmosphere rotating faster than the sur-face), which had been inferred from Voyager temperaturegradients34 and predicted by models29,30,35,36. Prograde winds canbe produced by displacing rings of air from the equator to higherlatitudes and conserving angular momentum, for example, in thenear-tropopause branch of a Hadley cell. The cloud motions we
measure are probably from lower levels where winds are slower, buttwo of our wind vectors are faster than an angular-momentum-conserving profile (Fig. 9, dashed curve). A Hadley cell cannotproduce such wind speeds if the rings of air are motionless at theequator, suggesting that eddy momentum transport is important inmaintaining super-rotation on Titan35.
Uniform angular momentum in the troposphere would requirean unrealistically large meridional temperature gradient37. Uniformatmospheric angular velocity relative to the surface (wind varying ascosine latitude) is more consistent with the small meridional surfacetemperature contrast inferred by Voyager34 and more like the low-level super-rotation observed on Venus37 and simulated by oneTitan model30. This would imply equatorial super-rotation speedsof tens of metres per second in the middle troposphere. Possibleaeolian surface features implying eastward flow at low latitudes(Figs 3 and 6b) are also consistent with equatorial super-rotation.
The third class of cloud features consists of large-scale nearlyzonal streaks (Figs 3 and 5). The 11 streak clouds observed to date
Figure 6 High-resolution views of Titan’s surface. These enlarged views from the mosaic
in Fig. 3 all have north to the top of the frame. White bars above each image are 200 km
long. (Sharp lines are seams between individual images that have not been completely
removed.) a, Prominent bright–dark boundary near the western edge of Xanadu exhibiting
a sharp, angular contact between the two albedo units. Eastward-oriented, acute angles
are common. The two bright, discontinuous circles, which could be impact structures,
within the dark material near the top of the image are approximately 30 km in diameter
and another near the lower left of the image is ,50 km in diameter. b, Streamlined bright
features consistent with fluid motion from west to east. The Huygens landing site is in the
upper left corner of this image. The region is in the centre left of Fig. 3. c, Bright feature
(near the centre of Fig. 3) surrounded by dark material, illustrating the contrast between
the sharp western boundary and more diffuse eastern boundary. Several narrow (,2 km),
dark lanes cross the bright area and the western bright–dark boundary exhibits acute
angles as in a. d, Dark, linear lanes in this region west of Xanadu suggest a tectonic
influence on the surface morphology, perhaps enhanced by other processes. e, Albedo
patterns in this region southeast of the Huygens landing site (note arrows) exhibit shapes
suggestive of erosion by sapping. f, A region near the upper right of Fig. 3 showing bright
patches that could be reconstructed as though a bright crust has been extended east–
west over a dark substrate.
articles
NATURE | VOL 434 | 10 MARCH 2005 | www.nature.com/nature164© 2005 Nature Publishing Group
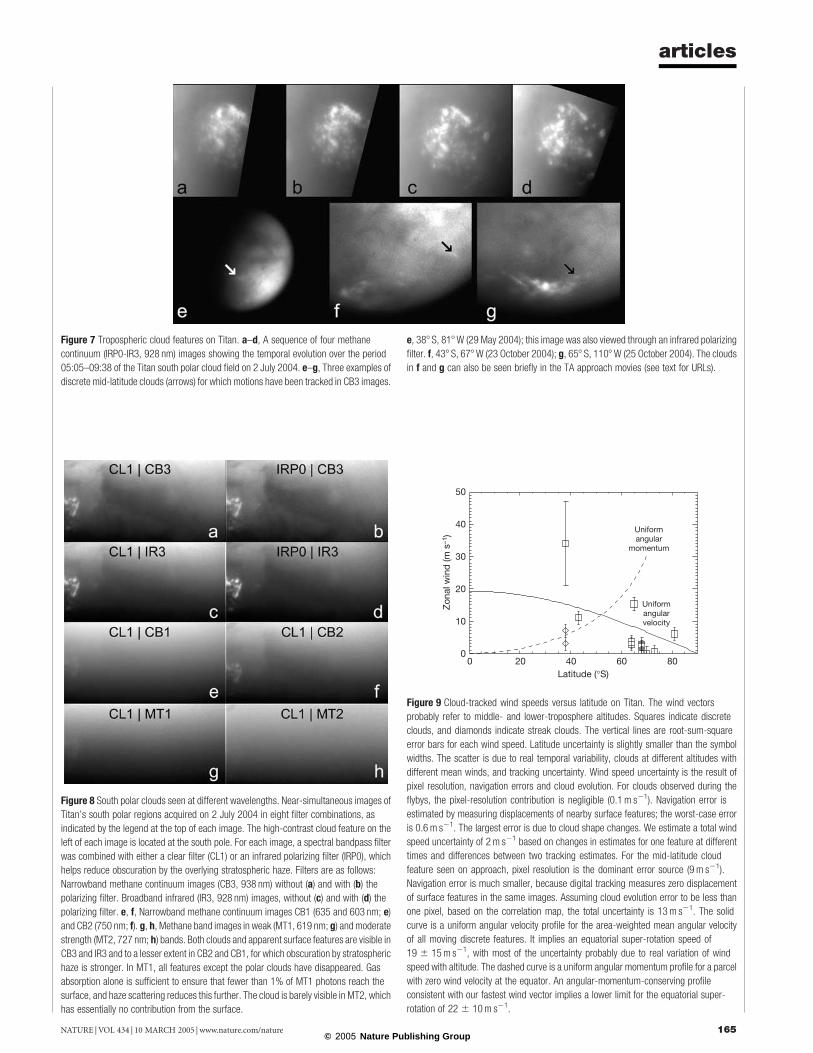
Figure 8 South polar clouds seen at different wavelengths. Near-simultaneous images of
Titan’s south polar regions acquired on 2 July 2004 in eight filter combinations, as
indicated by the legend at the top of each image. The high-contrast cloud feature on the
left of each image is located at the south pole. For each image, a spectral bandpass filter
was combined with either a clear filter (CL1) or an infrared polarizing filter (IRP0), which
helps reduce obscuration by the overlying stratospheric haze. Filters are as follows:
Narrowband methane continuum images (CB3, 938 nm) without (a) and with (b) the
polarizing filter. Broadband infrared (IR3, 928 nm) images, without (c) and with (d) the
polarizing filter. e, f, Narrowband methane continuum images CB1 (635 and 603 nm; e)
and CB2 (750 nm; f). g, h, Methane band images in weak (MT1, 619 nm; g) and moderate
strength (MT2, 727 nm; h) bands. Both clouds and apparent surface features are visible in
CB3 and IR3 and to a lesser extent in CB2 and CB1, for which obscuration by stratospheric
haze is stronger. In MT1, all features except the polar clouds have disappeared. Gas
absorption alone is sufficient to ensure that fewer than 1% of MT1 photons reach the
surface, and haze scattering reduces this further. The cloud is barely visible in MT2, which
has essentially no contribution from the surface.
Figure 9 Cloud-tracked wind speeds versus latitude on Titan. The wind vectors
probably refer to middle- and lower-troposphere altitudes. Squares indicate discrete
clouds, and diamonds indicate streak clouds. The vertical lines are root-sum-square
error bars for each wind speed. Latitude uncertainty is slightly smaller than the symbol
widths. The scatter is due to real temporal variability, clouds at different altitudes with
different mean winds, and tracking uncertainty. Wind speed uncertainty is the result of
pixel resolution, navigation errors and cloud evolution. For clouds observed during the
flybys, the pixel-resolution contribution is negligible (0.1 m s21). Navigation error is
estimated by measuring displacements of nearby surface features; the worst-case error
is 0.6 m s21. The largest error is due to cloud shape changes. We estimate a total wind
speed uncertainty of 2 m s21 based on changes in estimates for one feature at different
times and differences between two tracking estimates. For the mid-latitude cloud
feature seen on approach, pixel resolution is the dominant error source (9 m s21).
Navigation error is much smaller, because digital tracking measures zero displacement
of surface features in the same images. Assuming cloud evolution error to be less than
one pixel, based on the correlation map, the total uncertainty is 13 m s21. The solid
curve is a uniform angular velocity profile for the area-weighted mean angular velocity
of all moving discrete features. It implies an equatorial super-rotation speed of
19 ^ 15 m s21, with most of the uncertainty probably due to real variation of wind
speed with altitude. The dashed curve is a uniform angular momentum profile for a parcel
with zero wind velocity at the equator. An angular-momentum-conserving profile
consistent with our fastest wind vector implies a lower limit for the equatorial super-
rotation of 22 ^ 10 m s21.
Figure 7 Tropospheric cloud features on Titan. a–d, A sequence of four methane
continuum (IRP0-IR3, 928 nm) images showing the temporal evolution over the period
05:05–09:38 of the Titan south polar cloud field on 2 July 2004. e–g, Three examples of
discrete mid-latitude clouds (arrows) for which motions have been tracked in CB3 images.
e, 388 S, 818W (29 May 2004); this image was also viewed through an infrared polarizing
filter. f, 438 S, 678W (23 October 2004); g, 658 S, 1108W (25 October 2004). The clouds
in f and g can also be seen briefly in the TA approach movies (see text for URLs).
articles
NATURE | VOL 434 | 10 MARCH 2005 | www.nature.com/nature 165© 2005 Nature Publishing Group
occur at preferred latitudes (six occurrences at 36–398 S, three at67–728 S) and longitudes (all but two between 50–2008W), butexamples exist at 148 S and 338 S as well. Cloud streaks are also seenin ground-based images at similar times32. The streak morphologyand distribution invites three interpretations: (1) shearing andstretching by rapid upper-level super-rotating winds; (2) associ-ation with surface methane sources, for example, venting ofmethane gas from a subsurface reservoir through cracks in thesurface; and (3) orographic waves generated by meridional flowover zonally oriented topography.
Each interpretation is problematic. Methane band images wereavailable for one streak during TB, but it was not detected in MT2,indicating that it was at lower altitude than the polar clouds andthus less subject to shearing by strong winds. Two mid-latitudestreaks were tracked at speeds of less than 10 m s21 (Fig. 9), alsoimplying tops at lower levels than other clouds and making itdifficult to explain their large zonal extent unless these speeds areatypical. Some streaks curve slightly poleward from west to east,consistent with the expected sense of the summer lower tropospheremeridional flow. Thus, generation from a surface source seems morelikely, especially since streaks occur in preferred regions. If so, the
images do not yet identify the source. Medium-resolution images ofa streak location during TB taken at a time when the streak wasabsent (TA) revealed no distinctive surface features, but cracks ortopography finer than the ,1-km effective ISS surface resolutioncannot be ruled out.
Titan’s stratospheric haze
Our early observations of Titan were made almost exclusively withfilters at long or short wavelengths to optimize our chances of seeingthe surface and tropospheric clouds or contrasts in the stratosphere,which would provide a basis for tracking motions. Images of thesouthern hemisphere with the UV3 filter (338 nm) showed nocontrast, unlike images taken in 2003 using a similar filter on theHubble Space Telescope38 (HST) that do show a darker south polarhood. However, the HST images show that polar hood contrastdecreased recently. The absence of contrast in Cassini images fromApril–July 2004 is consistent with that trend.
In UV3 images a faint thin haze layer encircles the denserstratospheric haze (Fig. 10a). Radial profiles of normalized intensityfor this image (Fig. 11) suggest that the thin haze is similar to a‘detached’ haze layer seen in Voyager images11, but the altitude of the
Figure 10 Images of Titan’s stratospheric haze layers. a, Titan’s southern polar region
seen in the UV3 (338 nm) filter. The image is false-coloured to approximate what the
human eye might see were our vision to extend into the ultraviolet: The globe of Titan
retains the pale orange hue in the visible, and both the main atmospheric haze and thin
detached layer are given their natural purple colour. The haze layers are brightened for
visibility. The image was taken on 3 July 2004 at a Sun–Titan–spacecraft angle (or ‘phase
angle’) of 1148. The pixel scale is 4.7 km. b, Titan’s spin axis is tipped,45 degrees to the
vertical in this UV3 image of the northern polar hood. Multiple layers are seen between
about 200 and 500 km altitude. c, A composite of a Cassini UV3 image of Titan’s nightside
limb, and BL1 (451 nm), GRN (568 nm), and RED (650 nm) filters taken within 4 min of
each other on 13 December 2004. They have been combined to look like true colour and
stretched in brightness. The pixel scale is 0.7 km and the phase angle is 1628. The limb
shown is at ,108 S latitude. Although this is a nightside view, with only a thin crescent
receiving direct sunlight, the haze layers are bright from light scattered through the
atmosphere. About 12 distinct haze layers can be seen extending several hundred
kilometres above the surface. d, A methane filter (MT3, 890 nm) image shows faint
horizontal banding at several latitudes, most prominently at northern high latitudes. The
image was high-pass-filtered to enhance very weak contrasts at high spatial frequency.
Consequently the limb appears very bright and there are circular features from dust on the
optics—both artefacts amplified by the process.
articles
NATURE | VOL 434 | 10 MARCH 2005 | www.nature.com/nature166© 2005 Nature Publishing Group
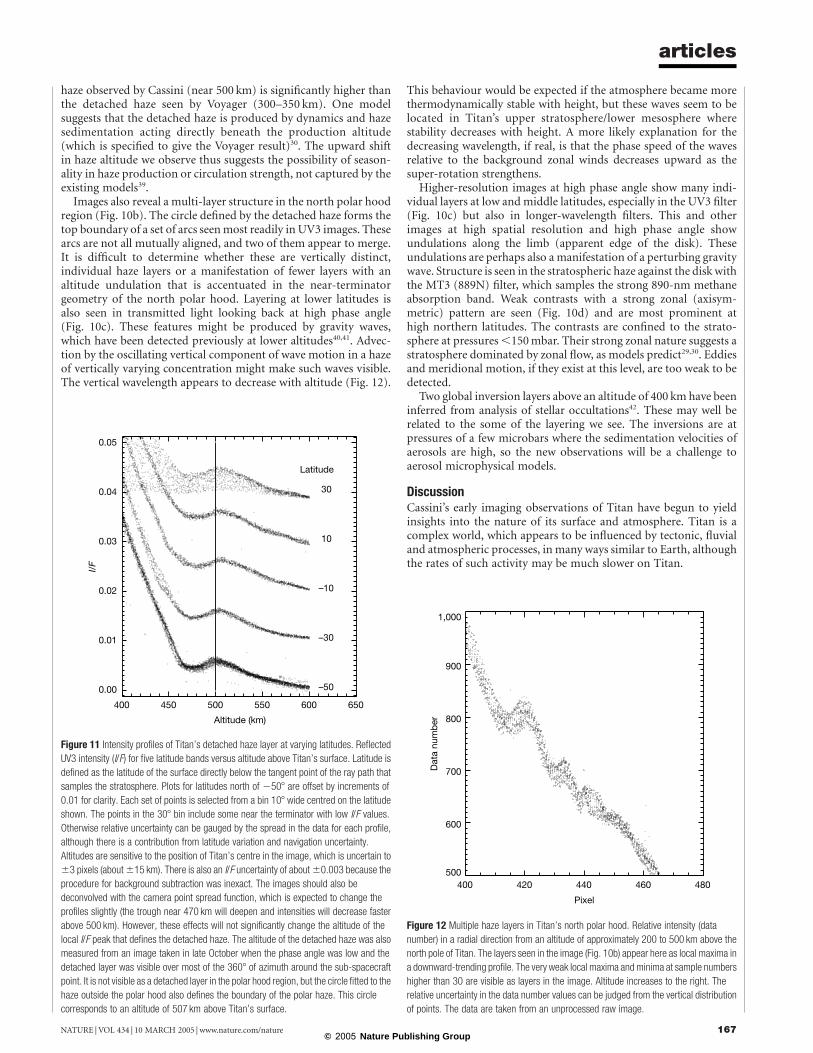
haze observed by Cassini (near 500 km) is significantly higher thanthe detached haze seen by Voyager (300–350 km). One modelsuggests that the detached haze is produced by dynamics and hazesedimentation acting directly beneath the production altitude(which is specified to give the Voyager result)30. The upward shiftin haze altitude we observe thus suggests the possibility of season-ality in haze production or circulation strength, not captured by theexisting models39.
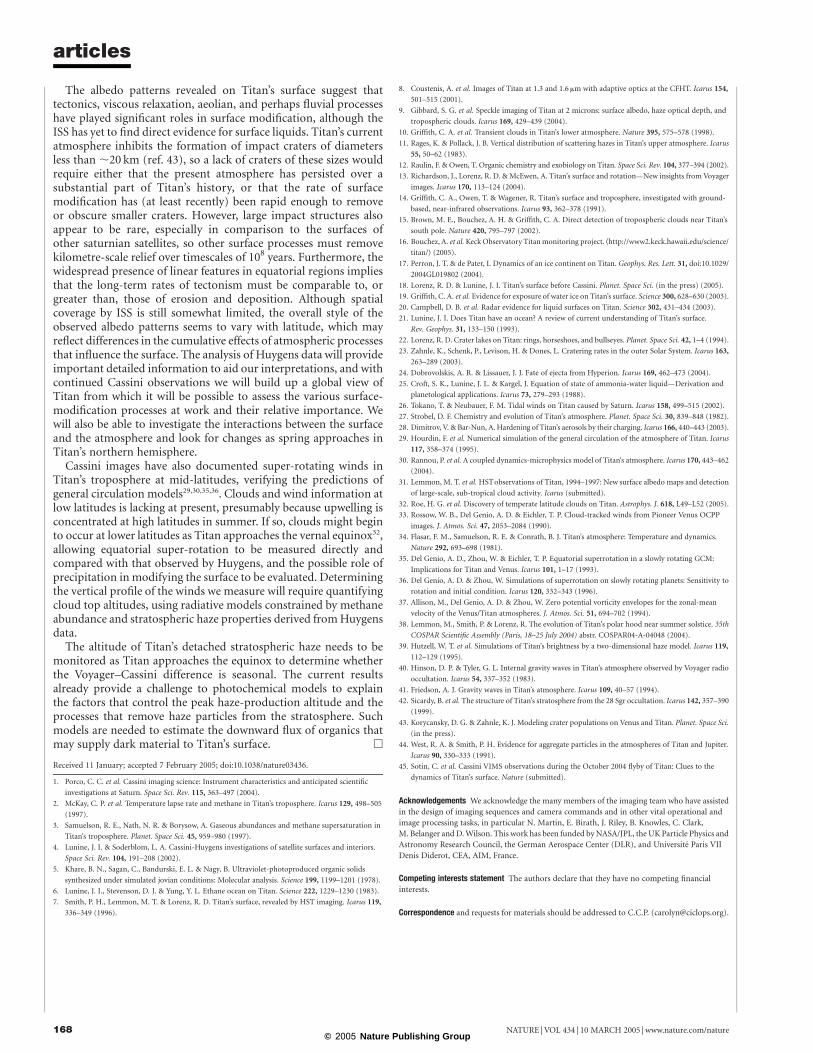
Images also reveal a multi-layer structure in the north polar hoodregion (Fig. 10b). The circle defined by the detached haze forms thetop boundary of a set of arcs seen most readily in UV3 images. Thesearcs are not all mutually aligned, and two of them appear to merge.It is difficult to determine whether these are vertically distinct,individual haze layers or a manifestation of fewer layers with analtitude undulation that is accentuated in the near-terminatorgeometry of the north polar hood. Layering at lower latitudes isalso seen in transmitted light looking back at high phase angle(Fig. 10c). These features might be produced by gravity waves,which have been detected previously at lower altitudes40,41. Advec-tion by the oscillating vertical component of wave motion in a hazeof vertically varying concentration might make such waves visible.The vertical wavelength appears to decrease with altitude (Fig. 12).
This behaviour would be expected if the atmosphere became morethermodynamically stable with height, but these waves seem to belocated in Titan’s upper stratosphere/lower mesosphere wherestability decreases with height. A more likely explanation for thedecreasing wavelength, if real, is that the phase speed of the wavesrelative to the background zonal winds decreases upward as thesuper-rotation strengthens.
Higher-resolution images at high phase angle show many indi-vidual layers at low and middle latitudes, especially in the UV3 filter(Fig. 10c) but also in longer-wavelength filters. This and otherimages at high spatial resolution and high phase angle showundulations along the limb (apparent edge of the disk). Theseundulations are perhaps also a manifestation of a perturbing gravitywave. Structure is seen in the stratospheric haze against the disk withthe MT3 (889N) filter, which samples the strong 890-nm methaneabsorption band. Weak contrasts with a strong zonal (axisym-metric) pattern are seen (Fig. 10d) and are most prominent athigh northern latitudes. The contrasts are confined to the strato-sphere at pressures ,150 mbar. Their strong zonal nature suggests astratosphere dominated by zonal flow, as models predict29,30. Eddiesand meridional motion, if they exist at this level, are too weak to bedetected.
Two global inversion layers above an altitude of 400 km have beeninferred from analysis of stellar occultations42. These may well berelated to the some of the layering we see. The inversions are atpressures of a few microbars where the sedimentation velocities ofaerosols are high, so the new observations will be a challenge toaerosol microphysical models.
DiscussionCassini’s early imaging observations of Titan have begun to yieldinsights into the nature of its surface and atmosphere. Titan is acomplex world, which appears to be influenced by tectonic, fluvialand atmospheric processes, in many ways similar to Earth, althoughthe rates of such activity may be much slower on Titan.
Figure 12 Multiple haze layers in Titan’s north polar hood. Relative intensity (data
number) in a radial direction from an altitude of approximately 200 to 500 km above the
north pole of Titan. The layers seen in the image (Fig. 10b) appear here as local maxima in
a downward-trending profile. The very weak local maxima and minima at sample numbers
higher than 30 are visible as layers in the image. Altitude increases to the right. The
relative uncertainty in the data number values can be judged from the vertical distribution
of points. The data are taken from an unprocessed raw image.
Figure 11 Intensity profiles of Titan’s detached haze layer at varying latitudes. Reflected
UV3 intensity (I/F) for five latitude bands versus altitude above Titan’s surface. Latitude is
defined as the latitude of the surface directly below the tangent point of the ray path that
samples the stratosphere. Plots for latitudes north of 2508 are offset by increments of
0.01 for clarity. Each set of points is selected from a bin 108 wide centred on the latitude
shown. The points in the 308 bin include some near the terminator with low I/F values.
Otherwise relative uncertainty can be gauged by the spread in the data for each profile,
although there is a contribution from latitude variation and navigation uncertainty.
Altitudes are sensitive to the position of Titan’s centre in the image, which is uncertain to
^3 pixels (about ^15 km). There is also an I/F uncertainty of about ^0.003 because the
procedure for background subtraction was inexact. The images should also be
deconvolved with the camera point spread function, which is expected to change the
profiles slightly (the trough near 470 km will deepen and intensities will decrease faster
above 500 km). However, these effects will not significantly change the altitude of the
local I/F peak that defines the detached haze. The altitude of the detached haze was also
measured from an image taken in late October when the phase angle was low and the
detached layer was visible over most of the 3608 of azimuth around the sub-spacecraft
point. It is not visible as a detached layer in the polar hood region, but the circle fitted to the
haze outside the polar hood also defines the boundary of the polar haze. This circle
corresponds to an altitude of 507 km above Titan’s surface.
articles
NATURE | VOL 434 | 10 MARCH 2005 | www.nature.com/nature 167© 2005 Nature Publishing Group
The albedo patterns revealed on Titan’s surface suggest thattectonics, viscous relaxation, aeolian, and perhaps fluvial processeshave played significant roles in surface modification, although theISS has yet to find direct evidence for surface liquids. Titan’s currentatmosphere inhibits the formation of impact craters of diametersless than ,20 km (ref. 43), so a lack of craters of these sizes wouldrequire either that the present atmosphere has persisted over asubstantial part of Titan’s history, or that the rate of surfacemodification has (at least recently) been rapid enough to removeor obscure smaller craters. However, large impact structures alsoappear to be rare, especially in comparison to the surfaces ofother saturnian satellites, so other surface processes must removekilometre-scale relief over timescales of 108 years. Furthermore, thewidespread presence of linear features in equatorial regions impliesthat the long-term rates of tectonism must be comparable to, orgreater than, those of erosion and deposition. Although spatialcoverage by ISS is still somewhat limited, the overall style of theobserved albedo patterns seems to vary with latitude, which mayreflect differences in the cumulative effects of atmospheric processesthat influence the surface. The analysis of Huygens data will provideimportant detailed information to aid our interpretations, and withcontinued Cassini observations we will build up a global view ofTitan from which it will be possible to assess the various surface-modification processes at work and their relative importance. Wewill also be able to investigate the interactions between the surfaceand the atmosphere and look for changes as spring approaches inTitan’s northern hemisphere.
Cassini images have also documented super-rotating winds inTitan’s troposphere at mid-latitudes, verifying the predictions ofgeneral circulation models29,30,35,36. Clouds and wind information atlow latitudes is lacking at present, presumably because upwelling isconcentrated at high latitudes in summer. If so, clouds might beginto occur at lower latitudes as Titan approaches the vernal equinox32,allowing equatorial super-rotation to be measured directly andcompared with that observed by Huygens, and the possible role ofprecipitation in modifying the surface to be evaluated. Determiningthe vertical profile of the winds we measure will require quantifyingcloud top altitudes, using radiative models constrained by methaneabundance and stratospheric haze properties derived from Huygensdata.
The altitude of Titan’s detached stratospheric haze needs to bemonitored as Titan approaches the equinox to determine whetherthe Voyager–Cassini difference is seasonal. The current resultsalready provide a challenge to photochemical models to explainthe factors that control the peak haze-production altitude and theprocesses that remove haze particles from the stratosphere. Suchmodels are needed to estimate the downward flux of organics thatmay supply dark material to Titan’s surface. A
Received 11 January; accepted 7 February 2005; doi:10.1038/nature03436.
1. Porco, C. C. et al. Cassini imaging science: Instrument characteristics and anticipated scientific
investigations at Saturn. Space Sci. Rev. 115, 363–497 (2004).
2. McKay, C. P. et al. Temperature lapse rate and methane in Titan’s troposphere. Icarus 129, 498–505
(1997).
3. Samuelson, R. E., Nath, N. R. & Borysow, A. Gaseous abundances and methane supersaturation in
Titan’s troposphere. Planet. Space Sci. 45, 959–980 (1997).
4. Lunine, J. I. & Soderblom, L. A. Cassini-Huygens investigations of satellite surfaces and interiors.
Space Sci. Rev. 104, 191–208 (2002).
5. Khare, B. N., Sagan, C., Bandurski, E. L. & Nagy, B. Ultraviolet-photoproduced organic solids
synthesized under simulated jovian conditions: Molecular analysis. Science 199, 1199–1201 (1978).
6. Lunine, J. I., Stevenson, D. J. & Yung, Y. L. Ethane ocean on Titan. Science 222, 1229–1230 (1983).
7. Smith, P. H., Lemmon, M. T. & Lorenz, R. D. Titan’s surface, revealed by HST imaging. Icarus 119,
336–349 (1996).
8. Coustenis, A. et al. Images of Titan at 1.3 and 1.6 mm with adaptive optics at the CFHT. Icarus 154,
501–515 (2001).
9. Gibbard, S. G. et al. Speckle imaging of Titan at 2 microns: surface albedo, haze optical depth, and
tropospheric clouds. Icarus 169, 429–439 (2004).
10. Griffith, C. A. et al. Transient clouds in Titan’s lower atmosphere. Nature 395, 575–578 (1998).
11. Rages, K. & Pollack, J. B. Vertical distribution of scattering hazes in Titan’s upper atmosphere. Icarus
55, 50–62 (1983).
12. Raulin, F. & Owen, T. Organic chemistry and exobiology on Titan. Space Sci. Rev. 104, 377–394 (2002).
13. Richardson, J., Lorenz, R. D. & McEwen, A. Titan’s surface and rotation—New insights from Voyager
images. Icarus 170, 113–124 (2004).
14. Griffith, C. A., Owen, T. & Wagener, R. Titan’s surface and troposphere, investigated with ground-
based, near-infrared observations. Icarus 93, 362–378 (1991).
15. Brown, M. E., Bouchez, A. H. & Griffith, C. A. Direct detection of tropospheric clouds near Titan’s
south pole. Nature 420, 795–797 (2002).
16. Bouchez, A. et al. Keck Observatory Titan monitoring project. khttp://www2.keck.hawaii.edu/science/
titan/l (2005).
17. Perron, J. T. & de Pater, I. Dynamics of an ice continent on Titan. Geophys. Res. Lett. 31, doi:10.1029/
2004GL019802 (2004).
18. Lorenz, R. D. & Lunine, J. I. Titan’s surface before Cassini. Planet. Space Sci. (in the press) (2005).
19. Griffith, C. A. et al. Evidence for exposure of water ice on Titan’s surface. Science 300, 628–630 (2003).
20. Campbell, D. B. et al. Radar evidence for liquid surfaces on Titan. Science 302, 431–434 (2003).
21. Lunine, J. I. Does Titan have an ocean? A review of current understanding of Titan’s surface.
Rev. Geophys. 31, 133–150 (1993).
22. Lorenz, R. D. Crater lakes on Titan: rings, horseshoes, and bullseyes. Planet. Space Sci. 42, 1–4 (1994).
23. Zahnle, K., Schenk, P., Levison, H. & Dones, L. Cratering rates in the outer Solar System. Icarus 163,
263–289 (2003).
24. Dobrovolskis, A. R. & Lissauer, J. J. Fate of ejecta from Hyperion. Icarus 169, 462–473 (2004).
25. Croft, S. K., Lunine, J. L. & Kargel, J. Equation of state of ammonia-water liquid—Derivation and
planetological applications. Icarus 73, 279–293 (1988).
26. Tokano, T. & Neubauer, F. M. Tidal winds on Titan caused by Saturn. Icarus 158, 499–515 (2002).
27. Strobel, D. F. Chemistry and evolution of Titan’s atmosphere. Planet. Space Sci. 30, 839–848 (1982).
28. Dimitrov, V. & Bar-Nun, A. Hardening of Titan’s aerosols by their charging. Icarus 166, 440–443 (2003).
29. Hourdin, F. et al. Numerical simulation of the general circulation of the atmosphere of Titan. Icarus
117, 358–374 (1995).
30. Rannou, P. et al. A coupled dynamics-microphysics model of Titan’s atmosphere. Icarus 170, 443–462
(2004).
31. Lemmon, M. T. et al. HSTobservations of Titan, 1994–1997: New surface albedo maps and detection
of large-scale, sub-tropical cloud activity. Icarus (submitted).
32. Roe, H. G. et al. Discovery of temperate latitude clouds on Titan. Astrophys. J. 618, L49–L52 (2005).
33. Rossow, W. B., Del Genio, A. D. & Eichler, T. P. Cloud-tracked winds from Pioneer Venus OCPP
images. J. Atmos. Sci. 47, 2053–2084 (1990).
34. Flasar, F. M., Samuelson, R. E. & Conrath, B. J. Titan’s atmosphere: Temperature and dynamics.
Nature 292, 693–698 (1981).
35. Del Genio, A. D., Zhou, W. & Eichler, T. P. Equatorial superrotation in a slowly rotating GCM:
Implications for Titan and Venus. Icarus 101, 1–17 (1993).
36. Del Genio, A. D. & Zhou, W. Simulations of superrotation on slowly rotating planets: Sensitivity to
rotation and initial condition. Icarus 120, 332–343 (1996).
37. Allison, M., Del Genio, A. D. & Zhou, W. Zero potential vorticity envelopes for the zonal-mean
velocity of the Venus/Titan atmospheres. J. Atmos. Sci. 51, 694–702 (1994).
38. Lemmon, M., Smith, P. & Lorenz, R. The evolution of Titan’s polar hood near summer solstice. 35th
COSPAR Scientific Assembly (Paris, 18–25 July 2004) abstr. COSPAR04-A-04048 (2004).
39. Hutzell, W. T. et al. Simulations of Titan’s brightness by a two-dimensional haze model. Icarus 119,
112–129 (1995).
40. Hinson, D. P. & Tyler, G. L. Internal gravity waves in Titan’s atmosphere observed by Voyager radio
occultation. Icarus 54, 337–352 (1983).
41. Friedson, A. J. Gravity waves in Titan’s atmosphere. Icarus 109, 40–57 (1994).
42. Sicardy, B. et al. The structure of Titan’s stratosphere from the 28 Sgr occultation. Icarus 142, 357–390
(1999).
43. Korycansky, D. G. & Zahnle, K. J. Modeling crater populations on Venus and Titan. Planet. Space Sci.
(in the press).
44. West, R. A. & Smith, P. H. Evidence for aggregate particles in the atmospheres of Titan and Jupiter.
Icarus 90, 330–333 (1991).
45. Sotin, C. et al. Cassini VIMS observations during the October 2004 flyby of Titan: Clues to the
dynamics of Titan’s surface. Nature (submitted).
Acknowledgements We acknowledge the many members of the imaging team who have assisted
in the design of imaging sequences and camera commands and in other vital operational and
image processing tasks, in particular N. Martin, E. Birath, J. Riley, B. Knowles, C. Clark,
M. Belanger and D. Wilson. This work has been funded by NASA/JPL, the UK Particle Physics and
Astronomy Research Council, the German Aerospace Center (DLR), and Universite Paris VII
Denis Diderot, CEA, AIM, France.
Competing interests statement The authors declare that they have no competing financial
interests.
Correspondence and requests for materials should be addressed to C.C.P. ([email protected]).
articles
NATURE | VOL 434 | 10 MARCH 2005 | www.nature.com/nature168© 2005 Nature Publishing Group
Related Documents


