Imaging Brain Dynamics Using Independent Component Analysis Tzyy-Ping Jung [Member, IEEE], University of California at San Diego, La Jolla, CA 92093-0523 USA and also with The Salk Institute for Biological Studies, La Jolla, CA 92037 USA Scott Makeig, University of California at San Diego, La Jolla, CA 92093-0523 USA and also with The Salk Institute for Biological Studies, La Jolla, CA 92037 USA Martin J. McKeown, Department of Medicine (Neurology), the Brain Imaging and Analysis Center (BIAC), and the Department of Biomedical Engineering, Duke University, Durham, NC 27708 USA Anthony J. Bell, University of California at San Diego, La Jolla, CA 92093-0523 USA and also with The Salk Institute for Biological Studies, La Jolla, CA 92037 USA Te-Won Lee [Member, IEEE], and University of California at San Diego, La Jolla, CA 92093-0523 USA and also with The Salk Institute for Biological Studies, La Jolla, CA 92037 USA Terrence J. Sejnowski [Fellow, IEEE] University of California at San Diego, La Jolla, CA 92093-0523 USA and also with The Salk Institute for Biological Studies, La Jolla, CA 92037 USA Tzyy-Ping Jung: [email protected]; Scott Makeig: [email protected]; Martin J. McKeown: [email protected]; Anthony J. Bell: [email protected]; Te-Won Lee: [email protected]; Terrence J. Sejnowski: [email protected] Abstract The analysis of electroencephalographic (EEG) and magnetoencephalographic (MEG) recordings is important both for basic brain research and for medical diagnosis and treatment. Independent component analysis (ICA) is an effective method for removing artifacts and separating sources of the brain signals from these recordings. A similar approach is proving useful for analyzing functional magnetic resonance brain imaging (fMRI) data. In this paper, we outline the assumptions underlying ICA and demonstrate its application to a variety of electrical and hemodynamic recordings from the human brain. Keywords Blind source separation; EEG; fMRI; independent component analysis I. INTRODUCTION Independent component analysis (ICA) refers to a family of related algorithms [1]–[10] that exploit independence to perform blind source separation. In Section II, an ICA algorithm based on the Infomax principle [6] is briefly introduced. In Section III, ICA is applied to electroencephalographic (EEG) recordings. Although these weak signals recorded from the surface of the scalp have been studied for nearly 100 years, their origins, exact dynamics, and relationship to brain function has been difficult to assess because signals recorded at the scalp are mixtures of signals from multiple brain generators. ICA may be helpful in identifying Published as: Proc IEEE Inst Electr Electron Eng. 2001 July 1; 89(7): 1107–1122. HHMI Author Manuscript HHMI Author Manuscript HHMI Author Manuscript

Welcome message from author
This document is posted to help you gain knowledge. Please leave a comment to let me know what you think about it! Share it to your friends and learn new things together.
Transcript
Imaging Brain Dynamics Using Independent Component Analysis
Tzyy-Ping Jung [Member, IEEE],University of California at San Diego, La Jolla, CA 92093-0523 USA and also with The Salk Institutefor Biological Studies, La Jolla, CA 92037 USA
Scott Makeig,University of California at San Diego, La Jolla, CA 92093-0523 USA and also with The Salk Institutefor Biological Studies, La Jolla, CA 92037 USA
Martin J. McKeown,Department of Medicine (Neurology), the Brain Imaging and Analysis Center (BIAC), and theDepartment of Biomedical Engineering, Duke University, Durham, NC 27708 USA
Anthony J. Bell,University of California at San Diego, La Jolla, CA 92093-0523 USA and also with The Salk Institutefor Biological Studies, La Jolla, CA 92037 USA
Te-Won Lee [Member, IEEE], andUniversity of California at San Diego, La Jolla, CA 92093-0523 USA and also with The Salk Institutefor Biological Studies, La Jolla, CA 92037 USA
Terrence J. Sejnowski [Fellow, IEEE]University of California at San Diego, La Jolla, CA 92093-0523 USA and also with The Salk Institutefor Biological Studies, La Jolla, CA 92037 USATzyy-Ping Jung: [email protected]; Scott Makeig: [email protected]; Martin J. McKeown: [email protected]; AnthonyJ. Bell: [email protected]; Te-Won Lee: [email protected]; Terrence J. Sejnowski: [email protected]
AbstractThe analysis of electroencephalographic (EEG) and magnetoencephalographic (MEG) recordings isimportant both for basic brain research and for medical diagnosis and treatment. Independentcomponent analysis (ICA) is an effective method for removing artifacts and separating sources ofthe brain signals from these recordings. A similar approach is proving useful for analyzing functionalmagnetic resonance brain imaging (fMRI) data. In this paper, we outline the assumptions underlyingICA and demonstrate its application to a variety of electrical and hemodynamic recordings from thehuman brain.
KeywordsBlind source separation; EEG; fMRI; independent component analysis
I. INTRODUCTIONIndependent component analysis (ICA) refers to a family of related algorithms [1]–[10] thatexploit independence to perform blind source separation. In Section II, an ICA algorithm basedon the Infomax principle [6] is briefly introduced. In Section III, ICA is applied toelectroencephalographic (EEG) recordings. Although these weak signals recorded from thesurface of the scalp have been studied for nearly 100 years, their origins, exact dynamics, andrelationship to brain function has been difficult to assess because signals recorded at the scalpare mixtures of signals from multiple brain generators. ICA may be helpful in identifying
Published as: Proc IEEE Inst Electr Electron Eng. 2001 July 1; 89(7): 1107–1122.
HH
MI Author M
anuscriptH
HM
I Author Manuscript
HH
MI Author M
anuscript
different types of generators of the EEG as well as its magnetic counterpart, themagnetoencephalogram (MEG). This application also illustrates questions concerning theassumptions required to apply ICA to biological time series. In Section IV, we show that ICAcan also be used to analyze hemodynamic signals from the brain recorded using functionalmagnetic resonance imaging (fMRI). This exciting new area of research allows neuroscientiststo noninvasively measure brain activity in humans indirectly through slower changes in brainblood flow. In all of these examples, great care must be taken to examine the validity of theassumptions that are used by ICA to derive a decomposition of the observed signals and/or toevaluate the reliability and functional significance of the resulting components.
II. INDEPENDENT COMPONENT ANALYSISICA [4] was originally proposed to solve the blind source separation problem, to recover Nsource signals,s = {s1(t), …,xN(t)}, (e.g., different voice, music, or noise sources) after theyare linearly mixed by multiplying by A, an unknown matrix, x = {x1(t). …,xN(t)} = As, whileassuming as little as possible about the natures of A or the component signals. Specifically,one tries to recover a version, u = Wx, of the original sources, s, identical save for scaling andpermutation, by finding a square matrix, W, specifying spatial filters that linearly invert themixing process. The key assumption used in ICA to solve this problem is that the time coursesof activation of the sources (or in other cases the spatial weights) are as statistically independentas possible. Most ICA is performed using information-theoretic unsupervised learningalgorithms. Despite its relatively short history, ICA is rapidly becoming a standard techniquein multivariate analysis.
Mathematically, the ICA problem is as follows: We are given a collection of N-dimensionalrandom vectors, x (sound pressure levels at N microphones, N-pixel patches of a larger image,outputs of N scalp electrodes recording brain potentials, or nearly any other kind ofmultidimensional signal). Typically there are diffuse and complex patterns of correlationbetween the elements of the vectors. ICA, like principal component analysis (PCA), is a methodto remove those correlations by multiplying the data by a matrix as follows:
(1)
(Here, we imagine the data is zero-mean; see below for pre-processing details.) But while PCAonly uses second-order statistics (the data covariance matrix), ICA uses statistics of all ordersand pursues a more ambitious objective. While PCA simply decorrelates the outputs (using anorthogonal matrix W), ICA attempts to make the outputs statistically independent, whileplacing no constraints on the matrix W. Statistical independence means the joint probabilitydensity function (pdf) of the output factorizes
(2)
while decorrelation means only that ⟨uuT⟩, the covariance matrix of u, is diagonal (here, ⟨⟩means average).
Another way to think of the transform in (1) is as
(3)
Jung et al. Page 2
Proc IEEE Inst Electr Electron Eng. Author manuscript; available in PMC 2010 September 2.
HH
MI Author M
anuscriptH
HM
I Author Manuscript
HH
MI Author M
anuscript
Here, x is considered the linear superposition of basis functions (columns of W−1), each ofwhich is activated by an independent component, ui. We call the rows of W filters becausethey extract the independent components. In orthogonal transforms such as PCA, the Fouriertransform and many wavelet transforms, the basis functions and filters are the same (becauseWT = W−1), but in ICA they are different.
The usefulness of a nonorthogonal transform sensitive to higher order statistics can be seen inFig. 1, which shows the PCA and ICA basis functions for a simulated two-dimensional (2-D)non-Gaussian data distribution. Clearly the ICA axes capture much more about the structureof these data than the PCA. Similar data distributions are actually more common in naturaldata than those who model data by “mixtures of Gaussians” might suppose. This fact arisesfrom the common nonorthogonal “mixing together” of highly sparse independent components.By sparse, we typically mean a distribution that is much “peakier” (e.g., near zero) than aGaussian distribution, and with longer tails. A more technical term for sparse is super-Gaussian,usually identified with positive kurtosis.
The ICA problem was introduced by Herault and Jutten [1]. The results of their algorithm werepoorly understood and led to Comon’s 1994 paper defining the problem, and to his solutionusing fourth-order statistics. Much work took place in this period in the French signalprocessing community, including Pham et al.’s [3] Maximum Likelihood approach thatsubsequently formed the basis of Cardoso and Laheld’s [7] EASI method. These methods arevery close to the “Infomax” approach [6], so this algorithm may be called Infomax/ML ICA.Earlier, Cichocki et al. [5] had proposed an algorithm which motivated Amari [8] andcolleagues to show that its success was due to its relation to a “natural gradient” modificationof the Infomax/ML ICA gradient. This modification greatly simplified the algorithm, and madeconvergence faster and more stable.
The resulting gradient-descent algorithm (implemented for routine use by Makeig et al.(http://www.cnl.salk.edu/~scott/ica.html [11]) has proved useful in a wide range of biomedicalapplications. Batch algorithms for ICA also exist, such as Hyvärinen’s FastICA and severalcumulant-based techniques, including Cardoso’s widely used fourth-order algorithm JADE.When these well-known algorithms are compared, they generally perform near equally well.However, applied to actual data sets for which no ground truth solutions exist, and for whichthe exactness of the ICA assumptions cannot be tested, they may produce differences whoserelative value and significance are difficult to evaluate. Review papers comparing differentICA algorithms and their interrelationships are available [12], [13], as are two edited collectionsof papers [14], [15] and proceedings from two international workshops (ICA99, ICA2000). Athird workshop in this series is planned (see http://ica2001.org). Matlab code for severalalgorithms, including those mentioned above, is also available through the World Wide Web.Below, we sketch the derivation and development of Infomax ICA.
A. The Infomax ICA AlgorithmA more general linear transform of u is the affine transform: u = Wx + w where w is an N-by-1 “bias” vector that centers the data on the origin. If we assume the independent componentpdfs, pi(ui) are roughly symmetrical, then it is simpler to subtract the mean, ⟨x⟩, from the databefore-hand. A second preprocessing step that speeds convergence is to first “sphere” the databy diagonalizing its covariance matrix
(4)
Jung et al. Page 3
Proc IEEE Inst Electr Electron Eng. Author manuscript; available in PMC 2010 September 2.
HH
MI Author M
anuscriptH
HM
I Author Manuscript
HH
MI Author M
anuscript

This yields a decorrelated data ensemble whose covariance matrix satisfies ⟨xxT⟩ = 4I, whereI is the identity matrix. This is a useful starting point for ICA decomposition. This spheringmethod is not PCA, but rather zero-phase whitening which constrains the matrix W to besymmetric. By contrast, PCA constrains it to be orthogonal, and ICA, also a decorrelationtechnique but without constraints on W, finds its constraints in the higher order statistics ofthe data.
The objective of the Infomax ICA algorithm is to minimize redundancy between the outputs.This is a generalization of the mutual information
(5)
This redundancy measure has value 0 when the pdf p(u) factorizes, as in (2), and is a difficultfunction to minimize directly. The insight that led to the Infomax ICA algorithm was that I(u) is related to the joint entropy, H(g(u)), of the out-puts passed through a set of sigmoidalnonlinear functions, gi
(6)
Thus, if the absolute values of the slopes of the sigmoid functions, are the same as theindependent component pdf’s, pi(ui) then Infomax [maximizing the joint entropy of the g(u)vector], will be the same as ICA (minimizing the redundancy in the u vector).
The principle of “matching” the is illustrated in Fig. 2, where a single Infomaxunit attempts to match an input Gaussian distribution to a logistic sigmoid unit, for which
(7)
The match cannot be perfect, but it does approach the maximum entropy pdf for the unitdistribution by maximizing the expected log slope, E[log|g′(Wx)|].
The generalization of this idea to N dimensions leads to maximizing the expected logdeterminant of the absolute value of the Jacobian matrix |[∂gi(ui)/∂xj]ij|. This optimizationattempts to map the input vectors uniformly into the unit N-cube (assuming that the g-functionsare still 0–1 bounded). Intuitively, if the outputs are spread evenly (like molecules of a gas)throughout their (N-cube) range, then learning the value of a data point on one axis gives noinformation about its values on the other axes and maximum independence has been achieved.Bell and Sejnowski [6] showed that the stochastic gradient descent algorithm that maximizesH(g(u)) is
(8)
where −T denotes inverse transpose, and the vector-function, f, has elements
Jung et al. Page 4
Proc IEEE Inst Electr Electron Eng. Author manuscript; available in PMC 2010 September 2.
HH
MI Author M
anuscriptH
HM
I Author Manuscript
HH
MI Author M
anuscript
(9)
When for all i, then, according to (6), the ICA algorithm is exact. Unfortunately,this leaves a difficulty. Either one has to estimate the functions g during training, or one needsto assume that the final term in (6) does not interfere with Infomax performing ICA. We haveempirically observed a systematic robustness to misestimation of the prior,
. Although unproven, this robustness conjecture can be stated [16]: Anysuper-Gaussian prior will suffice to extract super-Gaussian independent components. Any sub-Gaussian prior will suffice to extract sub-Gaussian independent components. This conjecturealso leads to the generally successful “extended ICA” algorithms [9], [10] that switch thecomponent priors, p̂i(ui), between super- and sub-Gaussian functions. In practice, as therobustness principle suggests, this switching may be all the estimation needed to obtain acorrect solution. The same insight underlies “negentropy” approaches to ICA that maximizethe distance of the pi(ui) from Gaussian, described in [13] and by Lee et al. [10].
For most natural data (images, sounds, etc.), the independent component pdfs are all super-Gaussian, so many good results have been achieved using “logistic ICA,” in which the super-
Gaussian prior is the slope, , of the common logistic sigmoid function (8) so often usedin neural networks. For this choice of g, the function f in (8) evaluates simply to f(u) = 1 − 2g(u).
Infomax ICA is almost identical to the maximum likelihood approach [3]. In maximumlikelihood density estimation, one maximizes a parameterized estimate of the log of the pdf ofthe input, log p̂(x|W, g). A simple argument shows that the absolute value of the determinantof the Jacobian matrix, |det[∂gi(ui)/∂xj]ij| is exactly such a density estimate [for much the same
reason that is a density estimate for pi(ui) in (6)]. Infomax maximizes this log likelihood,and therefore inherits the useful properties of maximum likelihood methods while preservingan information-theoretic perspective on the problem.
An additional and important feature was added to the Infomax ICA algorithm by Amari andcolleagues [8], who observed that a simpler learning rule, with much faster and more stableconvergence, could be obtained by multiplying the Infomax gradient of (8) by WTW, obtaining
(10)
Since WTW, which scales the gradient, is positive-definite, it does not change the minima andmaxima of the optimization. Its optimality has been explained using information geometry[8] and equivariance—the gradient vector local to W is normalized to behave as if it were closeto I (see [14]). Both interpretations reflect the fact that the parameter space of W is not trulyEuclidean, since its axes are entries of a matrix. Equation (10) is clearly a nonlineardecorrelation rule, stabilizing when ⟨−f(u)uT⟩ = I. (The minus sign is required because the ffunctions are typically decreasing.) The Taylor series expansion of the f functions providesinformation about higher order correlations necessary to perform ICA.
In addition to its effective use in solving blind source separation problems in signal processingwhere known independent “ground truth” sources are known, at least for test examples, ICAhas also been applied to data from the natural world where the degree to which the ICA
Jung et al. Page 5
Proc IEEE Inst Electr Electron Eng. Author manuscript; available in PMC 2010 September 2.
HH
MI Author M
anuscriptH
HM
I Author Manuscript
HH
MI Author M
anuscript

assumptions are satisfied is unknown and for which no clear idea of what the maximallyindependent sources may be. First, we will examine an application of ICA to natural imagesthat supports an Infomax-based theory of perceptual brain organization [17] and also illustratesthe nature of independence.
III. DECOMPOSITION OF NATURAL IMAGESThe classic experiments of Hubel and Wiesel on neurons in primary visual cortex revealed thatmany of them are orientation-selective feature detectors. This raised the question “Why do wehave edge detectors?” In other words, are there coding principles that predict the formation oflocalized, oriented receptive fields? Horace Barlow proposed that our visual cortical featuredetectors might be the end result of a redundancy reduction process, in which the activationof each feature detector is supposed to be as statistically independent from the others aspossible. However, algorithms based only on second-order statistics failed to give local filters.In particular, the principal components of natural images are Fourier filters ranked in frequency,quite unlike oriented localized filters. Other researchers have proposed “projection pursuit”-style approaches to this problem, culminating in Olshausen and Field’s [18] demonstration ofthe self-organization of local, oriented receptive fields using a sparseness criterion.
The assumption implicit in this approach is that early visual processing should attempt to invertthe simplest possible image formation process, in which the image is formed by linearsuperposition of basis vectors (columns of W−1), each activated by independent (or sparse)causes, ui. Bell and Sejnowski [19] showed that ICA basis images for a set of small imagepatches taken at random from natural images do consist of oriented, localized contrast-sensitivefunctions [“edge-detectors” (Fig. 3)]. Since sparseness is often related to super-Gaussianity, itis clear why logistic ICA produced filters sensitive to sparse patterns. These distributions,furthest from Gaussian on the super-Gaussian side, are the most likely to be as statisticallyindependent as possible, through the Central Limit Theorem argument that any mixture of twoindependent distributions should produce a distribution that is closer to Gaussian. Note thatnone of the independent components of these data were sub-Gaussian, as was verified usingthe “extended ICA” algorithm [10]. Later, van Hateren and Ruderman derived basis movies ofmoving images (http://hlab.phys.rug.nl/demos/ica) [20], which were localized, oriented andmoving perpendicular to their orientation direction, as in monkey visual cortex.
IV. ANALYSIS OF EEG AND AVERAGED EVENT-RELATED POTENTIAL (ERP)DATA
The EEG is a noninvasive measure of brain electrical activity recorded as changes in potentialdifference between points on the human scalp. Because of volume conduction throughcerebrospinal fluid, skull and scalp, EEG data collected from any point on the scalp may includeactivity from multiple processes occurring within a large brain volume. This has made itdifficult to relate EEG measurements to underlying brain processes or to localize the sourcesof the EEG signals. Furthermore, the general problem of determining the distribution of brainelectrical sources from electromagnetic field patterns recorded on the scalp surface ismathematically underdetermined.
Event-related potentials (ERPs), time series of voltages from the ongoing EEG that are time-locked to a set of similar experimental events, are usually averaged prior to analysis to increasetheir signal/noise relative to other nontime and phase-locked EEG activity and nonneuralartifacts. For several decades, ERP researchers have proposed a number of techniques tolocalize the sources of stimulus-evoked potentials, either by assuming a known or simple spatialconfiguration [21], or by restricting generator dipoles to lie within and point outward from thecortical surface [22].
Jung et al. Page 6
Proc IEEE Inst Electr Electron Eng. Author manuscript; available in PMC 2010 September 2.
HH
MI Author M
anuscriptH
HM
I Author Manuscript
HH
MI Author M
anuscript
Makeig et al. [23] noted that ICA could be used to separate the problem of EEG (or MEG)source identification from the problem of source localization. That is, ICA (or other blindsource separation algorithm) may tell what temporally independent activations compose thecollected scalp recordings without specifying directly where in the brain these activations arise.By separating the contributions of different brain and nonbrain sources to the data, however,ICA is also proving to be an efficient preprocessing step prior to source localization [24].
Subsequent work has explored the application of ICA to collections of averaged ERPs [11],[25]–[27] to unaveraged single-trial ERP epochs [28]–[32], and to clinical EEG data [33].Many other groups, including MEG researchers [34]–[37], have now begun working in thisarea.
A. Assumptions of ICA Applied to EEG/MEG DataFour main assumptions underlie ICA decomposition of EEG (or MEG) time series. 1) Signalconduction times are equal and summation of currents at the scalp sensors is linear, bothreasonable assumptions for currents carried to the scalp electrodes by volume conduction atEEG frequencies [38] or for superposition of magnetic fields at SQUID sensors. 2) Spatialprojections of components are fixed across time and conditions. 3) Source activations aretemporally independent of one another across the input data. 4) Statistical distributions of thecomponent activation values are not Gaussian.
What are the Independent Components? For biomedical time series analysis (EEG, MEG, etc.),the rows of the input matrix, x, are EEG/ERP signals recorded at different electrodes and thecolumns are measurements recorded at different time points. ICA finds an “unmixing” matrix,W, that decomposes or linearly unmixes the multichannel scalp data into a sum of temporallyindependent and spatially fixed components, u = Wx. The rows of the output data matrix, u,are time courses of activation of the ICA components. The columns of the inverse matrix,W−1, give the relative projection strengths of the respective components at each of the scalpsensors. These scalp weights give the scalp topography of each component, and provideevidence for the components’ physiological origins (e.g., eye activity projects mainly to frontalsites). The projection of the ith independent component onto the original data channels is givenby the outer product of the ith row of the component activation matrix, u, with the ith columnof the inverse unmixing matrix, and is in the original channel locations and units (e.g., µV).Thus, brain activities of interest accounted for by single or by multiple components can beobtained by projecting selected ICA component(s) back onto the scalp, x0 = W−1u0, whereu0 is the matrix, u of activation wave-forms with rows representing activations of irrelevantcomponent activation(s) set to zero.
B. Analyzing Collections of Averaged ERPsMany studies employ ERP peak measures to test clinical or developmental hypotheses.However, ERPs cannot be easily decomposed into functionally distinct components, becausetime courses and scalp projections of different brain generators generally overlap. We haveshown, however, that ICA can effectively decompose multiple overlapping components fromselected sets of related ERP averages [25].
Fig. 4 illustrates results of decomposing a collection of 25 to 75 1-s averages from differenttask and/or stimulus conditions, each summing a relatively large number of single trials (250–7000). Participating subjects, eight males and two females, were right-handed with normal orcorrected to normal vision. During 76-s trial blocks, subjects were instructed to attend to oneof five squares continuously displayed on a back background 0.8 cm above a centrally locatedfixation point. The (1.6 × 1.6 cm) squares were positioned horizontally at angles of 0°, ±2.7°,and ±5.5° in the visual field 2° above from the point of fixation. Four squares were outlined in
Jung et al. Page 7
Proc IEEE Inst Electr Electron Eng. Author manuscript; available in PMC 2010 September 2.
HH
MI Author M
anuscriptH
HM
I Author Manuscript
HH
MI Author M
anuscript
blue while one, marking the attended location, was outlined in green. The location of theattended location was counterbalanced across trial blocks. In the “Detection” task condition,all stimuli were filled circles and subjects were required to press a right-hand held thumb buttonas soon as possible following stimuli presented in the attended location. In the “Discrimination”task condition, 75% of the presented stimuli were filled circles, the other 25% filled squares.Subjects were required to press the response button only in response to filled squares appearingin the attended location, and to ignore filled circles. In this condition, 35 blocks of trials werecollected from each subject, seven blocks at each of the five possible attended locations. Eachblock included 35 target squares and 105 distractor (or “nogo”) circles presented at the attendedlocation, plus 560 circles and squares presented at the four unattended locations.
EEG data were collected from 29 scalp electrodes mounted in a standard electrode cap(Electrocap, Inc.) at locations based on a modified International 10–20 System, and from twoperiocular electrodes placed below the right eye and at the left outer canthus. All channels werereferenced to the right mastoid with input impedance less than 5 kΩ. Data were sampled at 512Hz within an analog passband of 0.01–50 Hz.
Responses evoked by target stimuli [their grand mean shown in Fig. 4(a), colored traces]contained a prominent “late positive complex” (LPC, often called “P300”) following expectedearly peaks P1, N1, P2, and N2. In the grand-mean detection-task response, the scalptopography of the response varied continuously [Fig. 4(a), scalp maps].
ICA was applied to all 75 31-channel responses from both tasks (1-s ERPs from 25 detection-task and 50 discrimination-task conditions, each a grand average over ten subjects) producing31 temporally independent components. Of these, just three accounted for 95%–98% of thevariance in the ten target responses from both tasks.
Component P3f (blue traces) became active near the N1 peak. Its active period continuedthrough the P2 and N2 peaks and the upward slope of the LPC. That is, P3f accounted for aslow shift beginning before LPC onset, positive at periocular and frontal channels and weaklynegative at lateral parietal sites (top rows). Fig. 4(c) shows the 31-channel projections of P3fas (red) filled data envelopes within the outlined envelope of the whole responses in eachcondition.
Component P3b, the largest of the three independent LPC components, had a central parietalmaximum and a right-frontal bias, like the LPC peak itself. In the Detection task, its peakamplitude appeared inversely related to median RT. In the Discrimination task, the ~90 msdelay between RT and the P3b peak observed in the detection task was reproduced only in thefast-responder response. These characteristics of the central LPC component (P3b) identifiedby ICA appear consistent with those of the LPC peak in the Detection task. However, in theDiscrimination-task subaverages, the ERP and P3b peaks did not coincide. The P3b componentalso accounted for some early response activity. This appeared to reflect a tendency of thealgorithm to make very large components “spill over” to account for periods of weak activitywith related scalp distributions. Subsequent decompositions of the Detection-task data by PCAwith our without Varimax, and Promax rotation (see [25]) produced P3b analogs in which this“spillover” was stronger than for ICA.
Component Pmp. Pmp was activated only following target stimuli followed by button presses.Its posterior maximum was contralateral to response hand, and its latency and topographicvariability across subjects strongly resembled that of the 200-ms post-movement positivity inthe voluntary motor response [39]. However, in the discrimination task no Pmp was presentin target responses of the five faster responders. Pmp accounted for the later post-responseportion of the LPC originally called SW (for “slow wave”) [40].
Jung et al. Page 8
Proc IEEE Inst Electr Electron Eng. Author manuscript; available in PMC 2010 September 2.
HH
MI Author M
anuscriptH
HM
I Author Manuscript
HH
MI Author M
anuscript
Component Pnt. A fourth LPC component was active only in response to nontarget stimulipresented in the target location. Inhibiting a quick motor response to these stimuli requiredconscious effort. Component Pnt (for nontarget) had a left-sided scalp projection, consistentwith lesion and fMRI studies showing that a brain area below these electrodes is involved inresponse inhibition.
These results suggested that ICA can parsimoniously decompose complex ERP data setscomprised of many scalp channels, stimulus types, and task conditions into temporallyindependent, spatially fixed, and physiologically plausible components without necessarilyrequiring the presence of multiple local response peaks to separate meaningful responsecomponents. Although the results reported here and elsewhere [11], [25], [26] are encouraging,we need to keep in mind that for averaged ERP data, the ICA assumptions may only beapproximately satisfied. That is, as illustrated in Fig. 4(d), given real data, any ICA algorithmcan return at best maximally independent components.
Spatial stationarity. Spatial stationarity of the component scalp maps, assumed in ICA, iscompatible with the observation made in large numbers of functional imaging reports thatperformance of particular tasks increases blood flow within small (≈cm3), discrete brainregions [41]. ERP sources reflecting task-related information processing are generally assumedto sum activity from spatially stationary generators, although stationarity might not apply tosubcentimeter scales or to some spontaneous macroscopic EEG phenomena such as spreadingdepression or sleep spindles [42]. Our results to date suggest that most EEG oscillations,including alpha rhythms, can be better modeled as composed of temporally independent islandsof coherent cortical activity, rather than as traveling waves [32].
Temporal independence. ICA assumes that sources of the EEG must be temporallyindependent. However, brain components of averaged ERPs most often have temporallyoverlapping active periods. Independence of ERP features may be maximized by, first,sufficiently and systematically varying the experimental stimulus and task conditions, and,next, training the algorithm on the concatenated collection of resulting event-related responseaverages. Fortunately, the first goal of experimental design, to attain independent control ofthe relevant output variables, is compatible with the ICA requirement that the activations ofthe relevant data components be independent. Thus, for example, the subject group-mean ERPdata we analyzed successfully using ICA (Fig. 4) consisted of collections of 25 to 75 1-saverages from different task and/or stimulus conditions, each summing a relatively largenumber of single trials (250–7000). Unfortunately, however, independent control of temporallyoverlapping ERP components may be difficult or impossible to achieve. Simply varying stimuliand subject task does not guarantee that all the spatiotemporally overlapping responsecomponents appearing in the averaged responses will be activated independently in theresulting data. Thus, the suitability of ICA for decomposition of small sets of ERP averagescannot be assumed, and such decompositions must be examined carefully, using convergentbehavioral and/or physiological evidence, before accepting the functional independence of thederived components. Also, ERP components, even those derived by ICA, may actuallyrepresent sums of event-related phase and amplitude perturbations in components of theongoing EEG (see below).
Dependence on source distribution. Because of the tendency described by the Central LimitTheorem, mixtures that appear normally distributed may be the sum of non-Gaussian sources.In theory, ICA cannot separate multiple Gaussian processes, although in practice even smalldeviations from normality can suffice to give good results. Also, not all ICA algorithms arecapable of unmixing independent components with sub-Gaussian (negative-kurtosis)distributions. For example, the original Infomax ICA algorithm using the logistic nonlinearityis biased toward finding super-Gaussian (sparsely activated) independent components (i.e.,
Jung et al. Page 9
Proc IEEE Inst Electr Electron Eng. Author manuscript; available in PMC 2010 September 2.
HH
MI Author M
anuscriptH
HM
I Author Manuscript
HH
MI Author M
anuscript

sources with positive kurtosis). Super-Gaussian sources, which have more near-zero valuesthan the best-fitting Gaussian process, are common in speech and many other natural soundsand visual images (see Section III) [19], [43].
The assumption that source distributions are super-Gaussian is compatible with thephysiologically plausible assumption that an averaged ERP is composed of one or moreoverlapping series of relatively brief activations within spatially fixed brain areas performingseparable stages of stimulus information processing. Nonetheless, sub-Gaussian independentcomponents have been demonstrated in EEG data [28], including line noise, sensor noise andlow frequency activity. In practice, however, sub-Gaussian components rarely appear in ERPsor in spontaneous EEG. The super-Gaussian statistics of independent components of ERP datamay indicate that brain information processing is dominated by spatially sparse, intermittentlysynchronous brain structures.
C. Analyzing Collections of Event-Related EEG EpochsResponse averaging ignores the fact that response activity may vary widely between trials inboth time course and scalp distribution. This temporal and spatial variability may in fact reflectchanges in subject performance or in subject state (possibly linked to changes in attention,arousal, task strategy, or other factors). Thus conventional averaging methods may not besuitable for investigating brain dynamics arising from intermittent changes in subject state and/or from complex interactions between task events. Further, response averaging makes possiblyunwarranted assumptions about the relationship between ERP features and the dynamics ofthe ongoing EEG.
Analysis of single event-related trial epochs may potentially reveal more information aboutevent-related brain dynamics than simple response averaging, but faces three signal processingchallenges: 1) difficulties in identifying and removing artifacts associated with blinks, eye-movements and muscle noise, which are a serious problem for EEG interpretation and analysis;2) poor signal-to-noise ratio arising from the fact that nonphase locked background EEGactivities often are larger than phase-locked response components; and 3) trial-to-trialvariability in latencies and amplitudes of both event-related responses and endogenous EEGcomponents. Additional interest in analysis of single-trial event-related EEG (or MEG) epochscomes from the realization that filtering out time- and phase-locked activity (by responseaveraging) isolates only a small subset of the actual event-related brain dynamics of the EEGsignals themselves [44].
Recently, a set of promising analysis and visualization methods for multichannel single-trialEEG records have been developed that may overcome these problems [23], [29], [45]. Thesetools were first used to analyze data from the aforementioned visual Detection experiment on28 control subjects plus 22 neurological patients whose EEG data, recorded at 29 scalp andtwo EOG sites, were often heavily contaminated with blink and other eye-movement artifacts.
To visualize collections of single-trial EEG records, “ERP image” plots [29], [45] are usefuland often reveal unexpected inter-trial consistencies and variations. Fig. 5(a) shows all 641single-trial ERP epochs recorded from an autistic subject time-locked to onsets of target stimuli(left vertical line). Single-trial event-related EEG epochs recorded at the vertex (Cz) and at acentral parietal (Pz) site are plotted as color-coded horizontal traces (see color bar) sorted inorder of the subject’s reaction time latencies (thick black line). The ERP average of these trialsis plotted below the ERP image.
ICA, applied to these 641 31-channel EEG records, separated out (clockwise): 1) artifactcomponents arising from blinks or eye movements, whose contributions could be removedfrom the EEG records by subtracting the component projection from the data [30], [46]; 2)
Jung et al. Page 10
Proc IEEE Inst Electr Electron Eng. Author manuscript; available in PMC 2010 September 2.
HH
MI Author M
anuscriptH
HM
I Author Manuscript
HH
MI Author M
anuscript
components showing stimulus time-locked potential fluctuations of consistent polarity manyor all trials; 3) components showing response-locked activity covarying in latency with subjectresponse times; 4) “mu-rhythm” components [47] at approximately 10 Hz that decreased inamplitude when the subject responds; 5) other components having prominent alpha band (8–12 Hz) activity whose intertrial coherence [Fig. 5(b), lower middle panel, bottom trace],measuring phase-locking to stimulus onsets, increased significantly after stimulus presentation,even in the absence of any alpha band power increase (middle trace); and 6) other EEGcomponents whose activities were either unaffected by experimental events or were affectedin ways not revealed by these measures. This taxonomy could not have been obtained fromsignal averaging or other conventional frequency-domain approaches.
Better understanding of trial-to-trial changes in brain responses may allow a betterunderstanding of normal human performance in repetitive tasks, and a more detailed study ofchanges in cognitive dynamics in normal, brain-damaged, diseased, aged, or geneticallyabnormal individuals. ICA-based analysis also allows investigation of the interaction betweenphenomena seen in ERP records and its origins in the ongoing EEG. Contrary to the commonsupposition that ERPs are brief stereotyped responses elicited by some events and independentof ongoing background EEG activity, many ERP features may be generated by ongoing EEGprocesses (see Fig. 5).
Decomposition of unaveraged single-trial EEG records allows: 1) removal of pervasiveartifacts from single-trial EEG records, making possible analysis of highly contaminated EEGrecords from clinical populations [46]; 2) identification and segregation of stimulus- andresponse-locked EEG components; 3) realignment of the time courses of response-lockedcomponents to prevent temporal smearing in the average; 4) investigation of temporal andspatial variability between trials; and 5) separation of spatially overlapping EEG activities thatmay show a variety of distinct relationships to task events. The ICA-based analysis andvisualization tools increase the amount and quality of information in event- or response-relatedbrain signals that can be extracted from event-related EEG (or MEG) data. ICA thus may helpresearchers to take fuller advantage of what until now has been an only partially realizedstrength of event-related paradigms—the ability to examine systematic relationships betweensingle trials within subjects [29], [32], [45], [48].
Although ICA appears to be a promising method for analyzing for EEG and MEG data, resultsof ICA must be interpreted with caution. In general, the effective number of independentcomponents contributing to the scalp EEG is unknown and between-subject variability isdifficult to resolve. One approach is to sort components into between-subject clustersrecognizable by their spatial and temporal patterns as well as by their time-domain (ERP) andfrequency-domain (e.g., ERSP, event-related spectral perturbation) reactivities [32].
D. Case Study: Stimulus-Induced “Alpha Ringing”EEG data were recorded from a subject performing the selective attention experiment describedabove. Fig. 6 shows an ERP-image plot giving the time course of activation of one independentcomponent whose activity spectrum (lower left) had a strong peak (near 10 Hz) in the alpharange. Its map (lower right) could be well approximated by the projection of a single equivalentdipole, suggesting that its source might be a small patch of unknown size in left medial occipitalcortex.
The “ERP-image” view shows the time course of activation of this component in over 500single trials each time locked to the presentation of a target stimulus (vertical line). Here, thetrials have been sorted not in order of response time (as in Fig. 5), but rather in order of theirphase at 10 Hz in a three-cycle window ending at stimulus onset. Phase sorting produces anapparent autocorrelation of the signals. The ERP (uppermost trace) suggests that following the
Jung et al. Page 11
Proc IEEE Inst Electr Electron Eng. Author manuscript; available in PMC 2010 September 2.
HH
MI Author M
anuscriptH
HM
I Author Manuscript
HH
MI Author M
anuscript

stimulus this component produced nearly a second of increased alpha activity superimposedon a slow negative wave. Note, however, that the slope of the negative-phase lines (darkstripes) becomes near-vertical a half second (at the first tick mark) after stimulus presentation.This change in slope represents a systematic phase resetting of the component alpha activityinduced by the stimulus.
The vertically time-aligned phase maxima between 200 and 700 ms after the stimulus producesthe appearance of increased 10-Hz activity in the ERP (upper trace). However (as the middletrace shows), mean power at 10 Hz in the single-trial EEG itself does not increase above itsbaseline. Instead (as the lower trace shows), the phase resetting of the component process bythe stimulus, becomes significant (horizontal thin line) about 200 ms after stimulus onset,producing the 10-Hz ripples in the ERP.
Here, ICA allows the actual event-related EEG dynamics producing the observed (normal)“alpha-ringing” in the averaged evoked response to be accurately modeled, whereas measuringthe average evoked response alone could suggest a quite different (and incorrect) interpretation.As Makeig et al. [32] have shown, ICA identifies several clusters of independent EEG alphacomponents, each with a scalp map resembling the projection of one (or in one cluster of cases,two) dipoles located in the posterior cortex. Typically, several of these sum to form a subject’sspatially complex and variable recorded “alpha rhythm.”
E. Component StabilityWe have investigated the component stability of ICA decomposition of EEG/ERPs at threedifferent scales: 1) the replicability of components from repeated ICA trainings on the samedata set; 2) within-subject spatiotemporal stability of independent components of collectionsof temporally overlapping or distinct subepochs of the single-trial EEG records; and 3)between-subject replicability of independent components of 1- or 3-s single-trial EEG epochs.
Infomax ICA decomposition is relatively robust and insensitive to the exact choice or learningrate or data batch size [25], [26], [31], [49]. Training with data in different random orders haslittle effect on the outcome: Independent components with large projections are stable, thoughtypically the smallest components vary.
The within-subject spatiotemporal stability of independent components of the EEG was testedby applying moving-window ICA to overlapping event-related subepochs of the same single-trial recordings used in this study [32]. ICA decomposition of multichannel single-trial event-related EEG data gave stable and reproducible spatiotemporal structure and dynamics of theEEG before, during and after experimental events. In addition, component clusters identifiedin single ICA decompositions of concatenated whole target-response epochs stronglyresembled those produced by the sub-window decompositions.
We then investigated the between-subject stability of independent components of the single-trial EEG epochs by applying a component clustering analysis (component- matching basedon the component scalp maps and power spectra of component activations) to 713 componentsderived from 23 normal controls participating in the same visual selective attention task.Clusters accounting for eye blinks, lateral eye movement, and temporal muscle activitiescontained components from almost all subjects. In general, clusters accounting for earlystimulus-locked activity, late response-locked activity (P300), event-modulated mu and alphaband activities (see Fig. 5) were largely replicated in many subjects.
Jung et al. Page 12
Proc IEEE Inst Electr Electron Eng. Author manuscript; available in PMC 2010 September 2.
HH
MI Author M
anuscriptH
HM
I Author Manuscript
HH
MI Author M
anuscript
V. FUNCTIONAL MAGNETIC RESONANCE IMAGEThe fMRI technique is a noninvasive technique making it possible to localize dynamic brainprocesses in intact living brains [50]. It is based on the magnetic susceptibilities of oxygenatedhemoglobin (HbO2) and deoxygenated hemoglobin (HbR) and is used to track blood-flow-related phenomena accompanying or following neuronal activations. The most commonly usedfMRI signal is the blood-oxygen-level-dependent (BOLD) contrast [51]. The analysis of fMRIbrain data is a challenging enterprise, as the fMRI signals have varied, unpredictable timecourses that represent the summation of signals from hemodynamic changes as a result ofneural activities, from subject motion and machine artifacts, and from physiological cardiac,respiratory and other pulsations. The relative contribution and exact form of each of thesecomponents in a given session is largely unknown to the experimenter, suggesting a role forblind separation methods if the data have properties that are consistent with these models[52]–[55].
The assumptions of ICA apply to fMRI data in a different way than to other time series analysis.Here, the principle of brain modularity suggests that, as different brain regions perform distinctfunctions, their time courses of activity should be separable (though not necessarilyindependent, particularly when, typically, only a few hundred or fewer time points areavailable). Spatial modularity, plus the relatively high 3-D spatial resolution of fMRI, allowsthe use of ICA to identify maximally spatially independent regions with distinguishable timecourses. Decreases as well as increases in brain activity are observed, which allows componentsto have overlapping spatial regions and still be approximately independent. However, thespatial independence of active brain areas is not perfect, and therefore the nature and functionalsignificance of independent fMRI components must be validated by convergent physiologicaland behavioral evidence.
A. General Linear Model (GLM)Traditional methods of fMRI analysis [41] are based on variants of the general linear model(GLM), i.e.,
(11)
Where
X n by υ row mean-zero data matrix with n thenumber of time points in the experiment;
υ total number of voxels in all slices;
G specified n by p design matrix containing the timecourses of all p factors hypothesized to modulatethe BOLD signal, including the behavioral manip-ulations of the fMRI experiment;
β P by υ matrix of parameters to be estimated;
ε matrix of noise or residual errors typically assumedto be independent, zero-mean and Gaussian dis-tributed, i.e., N(0, σ2).
Once G is specified, standard regression techniques can be used to provide a least squaresestimate for the parameters in β. The statistical significance of these parameters can beconsidered to constitute spatial maps [41], one for each row in β, which correspond to the timecourses specified in the columns of the design matrix. The GLM assumes: 1) the design matrixis known exactly; 2) time courses are white; 3) the βs follow a Gaussian distribution; and 4)the residuals are thus well-modeled by Gaussian noise.
Jung et al. Page 13
Proc IEEE Inst Electr Electron Eng. Author manuscript; available in PMC 2010 September 2.
HH
MI Author M
anuscriptH
HM
I Author Manuscript
HH
MI Author M
anuscript
B. ICA Applied to fMRI DataUsing ICA, we can calculate an unmixing matrix, W, to calculate spatially independentcomponents
(12)
where again, X is the n by υ row mean-zero data matrix with n the number of time points inthe experiment and υ the total number of voxels. W is an n by n unmixing matrix, and C is ann by υ matrix of n spatially independent component maps (sICs).
If W is invertible, we could write
(13)
An attractive interpretation of (13) is that the columns of W−1 represent temporal basiswaveforms used to construct the observed voxel time courses described in the columns of X.Since the rows of C are maximally independent, the spatial projection of any basis waveformin the data is maximally independent of the spatial projection of any other.
The similarity between ICA and the GLM can be seen by comparing (11) and (13). Startingwith (13) and performing the initial simple notation substitutions, W−1 → G and C → β, wehave
(14)
which is equivalent to (11) without the Gaussian error term. Note, however, the importantteleological differences between (11) and (14): When regression equation (11) is used, thedesign matrix G is specified by the examiner, while in (14) the matrix G, computed from thedata by the ICA algorithm, also determines β. That is, ICA does not reply on the experimenter’sa priori knowledge or assumptions about the time courses of brain activities and recordingnoise during the recording, and makes only weak assumptions about their probabilitydistributions.
C. An fMRI Case StudyFig. 7 shows the results of applying ICA to an fMRI data set. The fMRI data were acquiredwhile a subject performed 15-s blocks of visually cued or self-paced right wrist supinations/pronations, alternating with 15-s blocks in which the subject rested. ICA found a maximallyspatially independent component that was active during both modes of motor activity andinactive during rest [Fig. 7(b)]. Fig. 7(c) shows results from a similar fMRI experiment inwhich the subject was asked to supinate/pronate both wrists simultaneously. Here, ICAdetected a component more active during self-paced movements than during either visuallycued movement blocks or rest periods. Its midline, frontal polar location (depicted) is consistentwith animal studies showing relative activation in this area during self-paced but not duringvisually cued tasks.
D. Future DirectionsIn many respects, uses for the GLM and ICA are complementary [56], [57]. The advantage ofthe GLM is that it allows the experimenter (given several statistical assumptions) to check thestatistical significance of activation corresponding to the experimental hypothesis. Thedisadvantages of the GLM are related to the fact that these assumptions outlined do not fairly
Jung et al. Page 14
Proc IEEE Inst Electr Electron Eng. Author manuscript; available in PMC 2010 September 2.
HH
MI Author M
anuscriptH
HM
I Author Manuscript
HH
MI Author M
anuscript

represent the fMRI data. Also, dynamic, distributed patterns of brain activity [58] may not bewell modeled by the GLM regression framework, which incorrectly considers each voxel tobe a discrete, independent unit.
ICA, on the other hand, has proved to be an effective method for detecting unknownunanticipated activations [52]–[54], [59]–[61] without requiring a priori assumptions of timecourses and spatial distributions of different brain processes, but does not provide a significanceestimate for each activation, which makes difficult for experimenters to interpret their results.McKeown has recently proposed a method that uses ICA to characterize portions of the dataand then enables the experimenter to test hypotheses in the context of this data-definedcharacterization [55] by defining a metric that allows a qualitative assessment of the relativemismatch between hypothesis and data.
VI. DISCUSSIONBiomedical signals are a rich source of information about physiological processes, but they areoften contaminated with artifacts or noise and are typically mixtures of unknown combinationsof sources summing differently at each of the sensors. Further, for many data sets even thenature of the sources is an open question. Here, we have focused on applications of ICA toanalyze EEG and fMRI signals. ICA has also been applied to MEG recordings [37] which carrysignals from brain sources and are in part complementary to EEG signals, and to data frompositron emission tomography (PET), a method for following changes in blood flow in thebrain on slower time scales following the injection of radioactive isotopes into the bloodstream[62]. Other interesting applications of ICA are to the electrocorticogram (EcoG)—directmeasurements of electrical activity from the surface of the cortex [63], and to optical recordingsof electrical activity from the surface of the cortex using voltage-sensitive dyes [64]. Finally,ICA has proven effective at analyzing single-unit activity from the cerebral cortex [65], [66]and in separating neurons in optical recordings from invertebrate ganglia [67]. Early clinicalresearch applications of ICA include the analysis of EEG recordings during epileptic seizures[33].
In addition to the brain signals that were the focus of this paper, signals from others organs,including the heart [31] and endocrine system [68] have similar problems with artifacts thatcould also benefit from ICA. ICA holds great promise for blindly separating artifacts fromrelevant signals and for further decomposing the mixed signals into subcomponents that mayreflect the activity of functionally distinct generators of physiological activity.
Strength of ICA Applied to EEG/ERP and fMRI DataICA of single-trial or averaged ERP data allows blind separation of multichannel complex EEGdata into a sum of temporally independent and spatially fixed components. Our results showthat ICA can separate artifactual, stimulus-locked, response-locked, and nonevent relatedbackground EEG activities into separate components, allowing:
1. removal of pervasive artifacts of all types from single-trial EEG records, makingpossible analysis of highly contaminated EEG records from clinical populations;
2. identification and segregation of stimulus- and response-locked event-related activityin single-trail EEG epochs;
3. separation of spatially overlapping EEG activities over the entire scalp and frequencyband that may show a variety of distinct relationships to task events, rather thanfocusing on activity at single frequencies in single scalp channels or channel pairs;
4. investigation of the interaction between ERPs and ongoing EEG.
Jung et al. Page 15
Proc IEEE Inst Electr Electron Eng. Author manuscript; available in PMC 2010 September 2.
HH
MI Author M
anuscriptH
HM
I Author Manuscript
HH
MI Author M
anuscript

Historically, there has been a separation between related research in ERPs and EEG. The ERPcommunity has largely ignored the interaction between ERPs and ongoing EEG, whereas theEEG community has primarily analyzed EEG signals in the frequency domain, most oftenusing measures of power in standardized frequency bands. Researchers studying averaged ERPwaveforms assume that evoked responses are produced by brief synchronous neural activationsin brain areas briefly engaged in successive stages of stimulus-related information processing.In this view, response averaging removes background EEG activity since its phase distributionis independent of experimental events. Our recent results [32], on the contrary, showed thatmany features of an evoked response may actually be produced by event-related changes inthe autocorrelation and cross-correlation structure of ongoing EEG processes, each reflectingsynchronous activity occurring continuously in one or more brain regions, or by more subtleperturbations in their dynamics. These new insights would have been difficult to obtain withoutfirst separating spatially overlapping stimulus-locked, response-locked event-related activityand event-modulated oscillatory activity into different components by ICA in single-trial EEGepochs. Applying these new techniques reveals that the EEG (and MEG) data are a rich sourceof information about mechanisms of neural synchronization within and between brain areas.
ICA, applied to fMRI data, has proven to be a powerful method for detecting task-relatedactivations, including unanticipated activations [52]–[54], [59]–[61] that could not be detectedby standard hypothesis-driven analyses. This may expand the types of fMRI experiments thatcan be performed and meaningfully interpreted.
Limitations of ICA Applied to EG and fMRI DataAlthough ICA appears to be generally useful for EEG and fMRI analysis, it also has someinherent limitations.
First, ICA can decompose at most N sources from data collected at N scalp electrodes. Usually,the effective number of statistically independent signals contributing to the scalp EEG isunknown, and it is likely that observed brain activity arises from more physically separableeffective sources than the available number of EEG electrodes. To explore the effects of alarger number of sources on the results of the ICA decomposition of a limited number ofavailable channels, we have analyzed simulated EEG recordings generated from a head modeland dipole sources that include intrinsic noise and sensor noise [63]. This identifies theconditions when ICA fails to separate correlated sources of ERP signals. Results confirmedthat the ICA algorithm can accurately identify the time courses of activation and the scalptopographies of relatively large and temporally independent sources from simulated scalprecordings, even in the presence of a large number of simulated low-level source activities.Another approach to validating ICA is to simultaneously record and compare more than onetype of signal, such as concurrent EEG and fMRI which, respectively, have good spatial (fMRI)and temporal resolution (EEG) [70], if these prove to be correlated. However, very small orbriefly active EEG sources may be too numerous to separate, particularly in data sets with largenumbers of electrodes in which small artifacts may be abundant.
Second, the assumption of temporal independence used by ICA cannot be satisfied when thetraining data set is small, or when separate topographically distinguishable phenomena nearlyalways co-occur in the data. In the latter case, simulations show that ICA may derive singlecomponents accounting for the co-occurring phenomena, along with additional componentsaccounting for their brief periods of separate activation [63]. Such confounds imply thatbehavioral or other experimental evidence must be obtained before concluding that ICAcomponents with spatiotemporally overlapping projections are functionally distinct.Independent components may be considered functionally distinct when they exhibit distinctreactivities to experimental events, or when their activations correspond to otherwiseobservable signal sources.
Jung et al. Page 16
Proc IEEE Inst Electr Electron Eng. Author manuscript; available in PMC 2010 September 2.
HH
MI Author M
anuscriptH
HM
I Author Manuscript
HH
MI Author M
anuscript
Third, ICA assumes that physical sources of artifacts and cerebral activity are spatially fixedover time. In general, there is no reason to believe that cerebral and artifactual sources in thespontaneous EEG might not move over time. However, in our data, the relatively small numbersof components in the stimulus-locked, response-locked, and nonphase locked categories, eachaccounting for activity occurring across sets of 500 or more 1-s trials, suggests that the ERPfeatures of our data were primarily stationary, consistent with repeated observations infunctional brain imaging experiments that discrete and spatially restricted areas of cortex areactivated during task performance [71]. One general observation that has emerged fromapplying ICA to brain data is the effectiveness of the independence assumption. In the case ofERP and EEG analysis, the largest components had scalp maps that could be accurately fittedwith one or two dipoles. This is unlikely to occur unless time courses of coherently synchronousneural activity in patches of cortical neuropil generating the EEG are nearly independent ofone another [32].
Fourth, applied to fMRI data, ICA does not provide an experimenter with a significanceestimate for each component activation, which may discourage experimenters from attemptingto interpret the results. By placing ICA in a regression framework, it is possible to combinesome of the benefits of ICA with the hypothesis-testing approach of the GLM [55].
Although results of applying ICA to biomedical signals have already shown great promise andgiven new insights into brain function, the analysis of these results is still in its infancy. Theymust be validated using other direct or convergent evidence (such as behavior and/or otherphysiological measurements) before we can interpret their functional significance. Currentresearch on ICA algorithms is focused on incorporating domain-specific constraints into theICA framework. This would allow information maximization to be applied to the precise formand statistics of biomedical data.
AcknowledgmentsThis work was supported in part by the Office of Naval Research under Grant ONR.Reimb.30020.6429, by the HowardHughes Medical Institute, and by the Swartz Foundation. The work of T.-P. Jung was supported by NASA under GrantN66001-92-D-0092. The work of T. J. Sejnowski was supported by the National Institute of Health (NIH) under GrantNIMH 1-RO1-MH/RR-61619-01.
REFERENCES1. Herault, J.; Jutten, C. Space or time adaptive signal processing by neural network models; presented
at the Neural Networks for Computing: AIP Conf; 1986.2. Jutten C, Herault J. Blind separation of sources I. An adaptive algorithm based on neuromimetic
architecture. Signal Process 1991;vol. 24:1–10.3. Pham DT, Garat P, Jutten C. Separation of a mixture of independent sources through a maximum
likelihood approach. presented at the Proc. EUSIPCO. 19924. Comon P. Independent component analysis, a new concept? Signal Process 1994;vol. 36:287–314.5. Cichocki A, Unbehauen R, Rummert E. Robust learning algorithm for blind separation of signals.
Electron. Lett 1994;vol. 30:1386–1387.6. Bell AJ, Sejnowski TJ. An information-maximization approach to blind separation and blind
deconvolution. Neural Comput 1995;vol. 7:1129–1159. [PubMed: 7584893]7. Cardoso JF, Laheld BH. Equivariant adaptive source separation. IEEE Trans. Signal Processing
1996;vol. 44:3017–3030.8. Amari S. Natural gradient works efficiently in learning. Neural Comput 1998;vol. 10:251–276.9. Girolami M. An alternative perspective on adaptive independent component analysis algorithm. Neural
Comput 1998;vol. 10:2103–2114. [PubMed: 9804673]
Jung et al. Page 17
Proc IEEE Inst Electr Electron Eng. Author manuscript; available in PMC 2010 September 2.
HH
MI Author M
anuscriptH
HM
I Author Manuscript
HH
MI Author M
anuscript

10. Lee TW, Girolami M, Sejnowski TJ. Independent component analysis using an extended infomaxalgorithm for mixed sub-Gaussian and superGaussian sources. Neural Comput 1999;vol. 11:417–441. [PubMed: 9950738]
11. Makeig S, Jung T-P, Bell AJ, Ghahremani D, Sejnowski TJ. Blind separation of auditory event-relatedbrain responses into independent components. Proc. Nat. Acad. Sci. USA 1997;vol. 94:10 979–10984.
12. Lee TW, Girolami M, Bell AJ, Sejnowski TJ. A unifying information-theoretic framework forindependent component analysis. Comput. Math. Applicat 2000;vol. 39:1–21.
13. Hyvaerinen A. Survey on independent component analysis. Neural Comput. Sur 1999;vol. 2:94–128.14. Haykin, S. Unsupervised Adaptive Filtering. Englewood Cliffs, NJ: Prentice-Hall; 2000.15. Girolami, M. Advances in Independent Component Analysis. New York: Springer-Verlag; 2000.16. Bell, AJ. Independent component analysis. In: Arbib, M., editor. Handbook of Neural Networks. to
be published.17. Bell AJ, Sejnowski TJ. The ‘independent components’ of natural scenes are edge filters. Vision Res
1997;vol. 37:3327–3338. [PubMed: 9425547]18. Olshausen BA, Field DJ. Emergence of simple-cell receptive field properties by learning a sparse
code for natural images. Nature 1996;vol. 381:607–609. [PubMed: 8637596]19. Bell AJ, Sejnowski TJ. Edges are the independent components of natural scenes. Adv. Neural Inform.
Process. Syst 1997;vol. 9:831–837.20. van Hateren JH, Ruderman DL. Independent component analysis of natural image sequences yields
spatio-temporal filters similar to simple cells in primary visual cortex. Proc. R. Soc. London B, Biol.Sci 1998;vol. 265:2315–2320. ser.
21. Scherg M, Von Cramon D. Evoked dipole source potentials of the human auditory cortex.Electroencephalogr. Clin. Neurophysiol 1986;vol. 65:344–360. [PubMed: 2427326]
22. Liu A, Belliveau J, Dale A. Spatiotemporal imaging of human brain activity using functional MRIconstrained magnetoencephalography data: Monte Carlo simulations. Proc. Nat. Academy ofSciences USA 1998;vol. 95:8945–8950.
23. Makeig S, Bell AJ, Jung T-P, Sejnowski TJ. Independent component analysis ofelectroencephalographic data. Adv. Neural Inform. Process. Syst 1996;vol. 8:145–151.
24. Zhukov L, Weinstein D, Johnson C. Independent component analysis for EEG source localization.IEEE Eng. Med. Biol. Mag 2000;vol. 19:87–96. [PubMed: 10834122]
25. Makeig S, Westerfield M, Jung T-P, Covington J, Townsend J, Sejnowski TJ, Courchesne E.Functionally independent components of the late positive event-related potential during visual spatialattention. J. Neurosci 1999;vol. 19:2665–2680. [PubMed: 10087080]
26. Makeig S, Westerfield M, Townsend J, Jung T-P, Courchesne E, Sejnowski TJ. Functionallyindependent components of early event-related potentials in a visual spatial attention task. Philos.Trans. R. Soc. London B, Biol. Sci 1999;vol. 354:1135–1144. [PubMed: 10466141]
27. Jung T-P, Humphries C, Lee T-W, Makeig S, McKeown MJ, Iragui V, Sejnowski TJ. Removingelectroencephalographic artifacts: Comparison between ICA and PCA. Neural Netw. Signal Process1998;vol. VIII:63–72.
28. Jung T-P, Humphries C, Lee T-W, Makeig S, McKeown MJ, Iragui V, Sejnowski TJ. Extended ICAremoves artifacts from electroencephalographic data. Adv. Neural Inform. Process. Syst 1998;vol.10:894–900.
29. Jung T-P, Makeig S, Westerfield M, Townsend J, Courchesne E, Sejnowski TJ. Analyzing andvisualizing single-trial event-related potentials. Adv. Neural Inform. Process. Syst 1999;vol. 11:118–124.
30. Jung T-P, Makeig S, Humphries C, Lee TW, McKeown MJ, Iragui V, Sejnowski TJ. Removingelectroencephalographic artifacts by blind source separation. Psychophysiology 2000;vol. 37:163–178. [PubMed: 10731767]
31. Jung T-P, Makeig S, Lee T-W, McKeown MJ, Brown G, Bell AJ, Sejnowski TJ. Independentcomponent analysis of biomedical signals. 2nd Int. Workshop on Independent Component Analysisand Signal Separation 2000:633–644.
Jung et al. Page 18
Proc IEEE Inst Electr Electron Eng. Author manuscript; available in PMC 2010 September 2.
HH
MI Author M
anuscriptH
HM
I Author Manuscript
HH
MI Author M
anuscript

32. Makeig S, Enghoff S, Jung T-P, Sejnowski TJ. Moving-window ICA decomposition of EEG datareveals event-related changes in oscillatory brain activity. 2nd Int. Workshop on IndependentComponent Analysis and Signal Separation 2000:627–632.
33. McKeown MJ, Humphries C, Iragui V, Sejnowski TJ. Spatially fixed patterns account for the spikeand wave features in absence seizures. Br. Topogr 1999;vol. V12:107–116.
34. Barros AK, Vigário R, Jousmäki V, Ohnishi N. Extraction of event-related signals from multichannelbioelectrical measurements. IEEE Trans. Biomed. Eng 2000;vol. 47:583–588. [PubMed: 10851801]
35. Ikeda S, Toyama K. Independent component analysis for noisy data—MEG data analysis. NeuralNetworks 2000;vol. 13:1063–1074. [PubMed: 11156188]
36. Tang AC, Pearlmutter BA, Zibulevsky M. Blind source separation of multichannel neuromagneticresponses. Comput. Neurosci. Proc. Neurocomput 2000;vol. 32–33:1115–1120.
37. Vigário R, Särelä J, Jousmäki V, Hämäläinen M, Oja E. Independent component approach to theanalysis of EEG and MEG recordings. IEEE Trans. Biomed. Eng 2000;vol. 47:589–593.
38. Nunez, P. Electric Fields of the Brain. London, U.K: Oxford Univ. Press; 1981.39. Makeig S, Mueller M, Rockstroh B. Effects of voluntary movements on early auditory brain responses.
Exp. Br. Res 1996;vol. 110:487–492.40. Simson R, Vaughn HG Jr, Ritter W. The scalp topography of potentials in auditory and visual
discrimination tasks. Electroencephalogr. Clin. Neurophysiol 1977;vol. 42:528–535. [PubMed:66136]
41. Friston, KJ. Statistical parametric mapping and other analyzes of functional imaging data. In: Toga,AW.; Mazziotta, JC., editors. Brain Mapping, The Methods. San Diego: Academic; 1996. p. 363-396.
42. McKeown MJ, Humphries C, Achermann P, Borbely AA, Sejnowski TJ. A new method for detectingstate changes in the EEG: Exploratory application to sleep data. J. Sleep Res 1998;vol. V7:48–56.[PubMed: 9682194]
43. Bell AJ, Sejnowski TJ. Learning the higher-order structure of a natural sound. Netw. Comput. NeuralSyst 1996;vol. 7:261–266.
44. Makeig S. Auditory event-related dynamics of the EEG spectrum and effects of exposure to tones.Electroencephalogr. Clin. Neurophysiol 1993;vol. 86:283–293. [PubMed: 7682932]
45. Jung T-P, Makeig S, Westerfield M, Townsend J, Courchesne E, Sejnowski TJ. Analysis andvisualization of single-trial event-related potentials. Hum. Br. Map. to be published.
46. Jung T-P, Makeig S, Westerfield M, Townsend J, Courchesne E, Sejnowski TJ. Removal of eyeactivity artifacts from visual event-related potentials in normal and clinical subjects. Clin.Neurophysiol 2000;vol. 111:1745–1758. [PubMed: 11018488]
47. Makeig S, Enghoff S, Jung T-P, Sejnowski TJ. A natural basis for brain-actuated control. IEEE Trans.Rehab. Eng 2000;vol. 8:208–211.
48. Kobayashi K, James CJ, Nakahori T, Akiyama T, Gotman J. Isolation of epileptiform discharges fromunaveraged EEG by independent component analysis. Clin. Neurophysiol 1999;vol. 110:1755–1763.[PubMed: 10574290]
49. Makeig S, Jung T-P, Sejnowski TJ. Independent component analysis of single-trial event-relatedpotentials. Soc. Neurosci. Abstr 1997;vol. 23:1061.
50. Kwong KK, Belliveau JW, Chesler DA, Goldberg IE, Weisskoff RM, Poncelet BP, Kennedy DN,Hoppel BE, Cohen MS, Turner R, et al. Dynamic magnetic resonance imaging of human brain activityduring primary sensory stimulation. Proc. Nat. Academy of Sciences USA 1992;vol. 89:5675–5679.
51. Ogawa S, Tank D, Menon R, Ellermann J, Kim S, Merkle H, U K. Intrinsic signal changesaccompanying sensory stimulation: Functional brain mapping with magnetic resonance imaging.Proc. Nat. Academy of Sciences USA 1992;vol. 89:51–55.
52. McKeown MJ, Makeig S, Brown GG, Jung T-P, Kindermann SS, Bell AJ, Sejnowski TJ. Analysisof fMRI data by blind separation into independent spatial components. Hum. Br. Map 1998;vol.6:160–188.
53. McKeown MJ, Jung T-P, Makeig S, Brown G, Kindermann SS, Lee T-W, Sejnowski TJ. Spatiallyindependent activity patterns in functional MRI data during the Stroop color-naming task. Proc. Nat.Acad. Sci. USA 1998;vol. 95:803–810. [PubMed: 9448244]
Jung et al. Page 19
Proc IEEE Inst Electr Electron Eng. Author manuscript; available in PMC 2010 September 2.
HH
MI Author M
anuscriptH
HM
I Author Manuscript
HH
MI Author M
anuscript
54. McKeown MJ, Sejnowski TJ. Independent component analysis of fMRI data: Examining theassumptions. Hum. Br. Map 1998;vol. 6:368–372.
55. McKeown MJ. Detection of consistently task-related activations in fMRI data with hybridindependent component analysis. Neuroimage 2000;vol. V11:24–35. [PubMed: 10686114]
56. Friston KJ. Modes or models: A critique on independent component analysis for fMRI [Comment].Trends Cogn. Sci 1998;vol. 2:373–375.
57. McKeown MJ, Makeig S, Brown GG, Jung T-P, Kindermann SS, Bell AJ, Sejnowski TJ. Responsefrom McKeown, Makeig, Brown, Jung, Kindermann, Bell, and Sejnowski [Comment]. Trends Cogn.Sci 1998;vol. 2:375.
58. Kelso J, Fuchs A, Lancaster R, Holroyd T, Cheyne D, Weinberg H. Dynamic cortical activity in thehuman brain reveals motor equivalence. Nature 1998;vol. 392:814–818. [PubMed: 9572140]
59. Berns GS SA, Mao H. Continuous functional magnetic resonance imaging reveals dynamicnonlinearities of ‘dose-response’ curves for finger opposition. J. Neurosci 1999;vol. 19:RC17.[PubMed: 10407059]
60. Moritz C, Haughton V, Cordes D, Quigley M, Meyerand M. Whole-brain functional MR imagingactivation from a finger-tapping task examined with independent component analysis. Amer. J.Neuroradiol 2000;vol. 21:1629–1635. [PubMed: 11039341]
61. Arfanakis K, Cordes D, Haughton V, Moritz C, Quigley M, Meyerand. Combining independentcomponent analysis and correlation analysis to probe interregional connectivity in fMRI taskactivation datasets. Magn. Res. Imag 2000;vol. 18:921–930.
62. Petersen K, Hansen L, Kolenda T, Rostrup E, Strother S. On the independent components of functionalneuroimages. Int. Workshop on Independent Component Analysis (ICA 2000). 2000
63. Makeig, S.; Jung, T-P.; Ghahremani, D.; Sejnowski, TJ. Independent component analysis of simulatedERP data. In: Nakada, T., editor. Hum. High. Func. I: Adv. Meth. 2000.
64. Schiessbl I, Stetter M, Mayhew JE, M N, Lund JS, Obermayer K. Blind signal separation from opticalimaging recordings with extended spatial decorrelation. IEEE Trans. Biomed. Eng 2000;vol. 47:573–577.
65. Laubach M, Shuler M, Nicolelis MAL. Independent component analyzes for quantifying neuronalensemble interactions. J. Neurosci. Meth 1999;vol. 94:141–154.
66. Laubach M, Wessberg J, Nicolelis MAL. Cortical ensemble activity increasingly predicts behavioraloutcomes during learning of a motor task. Nature 2000;vol. 405:567–571. [PubMed: 10850715]
67. Brown GD, Yamada S, Sejnowski TJ. Independent component analysis (ICA) at the neural cocktailparty. Trends Neurosci 2001;vol. 24:54–63. [PubMed: 11163888]
68. Prank K, Borger J, von zur Muhlen A, Brabant G, Schofl C. Independent component analysis ofintracellular calcium spike data. Adv. Neural Inform. Process. Syst 1999;vol. 11:931–937.
69. Kermadi I LY, Tempini A, Rouiller EM. Effects of reversible inactivation of the supplementary motorarea (SMA) on uni-manual grasp and bimanual pull and grasp performance in monkeys. Somatosens.Motor Res 1997;vol. 14:268–280.
70. Jung T-P, Makeig S, Townsend J, Westerfield M, Hicks B, Courchesne E, Sejnowski TJ. Single-trialERP’s during continuous fMRI scanning. Soc. Neurosci. Abstr 1999;vol. 25:1389.
71. Friston KJ, Fletcher P, Josephs O, Holmes A, Rugg MD, Turner R. Event-related fMRI:Characterizing differential responses. Neuroimage 1998;vol. 7:30–40. [PubMed: 9500830]
Jung et al. Page 20
Proc IEEE Inst Electr Electron Eng. Author manuscript; available in PMC 2010 September 2.
HH
MI Author M
anuscriptH
HM
I Author Manuscript
HH
MI Author M
anuscript
Biographies
Tzyy-Ping Jung (Member, IEEE) received the B.S. degree in electronics engineering fromNational Chiao Tung University, Taiwan, in 1984, and the M.S. and Ph.D. degrees in electricalengineering from The Ohio State University in 1989 and 1993, respectively.
He was a Research Associate at the National Research Council of the National Academy ofSciences and at the Computational Neurobiology Laboratory, The Salk Institute, San Diego,CA. In 1998, he became a Research Scientist in the Institute for Neural Computation ofUniversity of California, San Diego, where he heads the Neuroengineering Lab. His researchinterests are in the areas of biomedical signal processing, cognitive neuroscience, artificialneural networks, time-frequency analysis of human EEG and functional magnetic resonanceimaging, and the development of neural human–system interfaces.
Jung et al. Page 21
Proc IEEE Inst Electr Electron Eng. Author manuscript; available in PMC 2010 September 2.
HH
MI Author M
anuscriptH
HM
I Author Manuscript
HH
MI Author M
anuscript

Scott Makeig received the Ph.D. degree in music psychobiology from the University ofCalifornia, San Diego (UCSD), in 1985. His dissertation concerned the use of frequencydomain measures of the auditory 40-Hz steady-state response for monitoring changes in centralstate. Thereafter, he expanded his study to considering the relation of changes in the wholeEEG spectrum to changes in alertness, results that he and colleagues used to develop a methodfor objective real-time alertness monitoring. In 1996, he and colleagues published the firstapplication of independent component analysis (ICA) to EEG data.
In 2000, he joined the staff of The Salk Institute, La Jolla, CA, and became a researcher in theInstitute for Neural Computation of UCSD where he heads a computational neurosciencelaboratory applying new signal processing methods to cognitive neuroscience.
Jung et al. Page 22
Proc IEEE Inst Electr Electron Eng. Author manuscript; available in PMC 2010 September 2.
HH
MI Author M
anuscriptH
HM
I Author Manuscript
HH
MI Author M
anuscript

Martin J. McKeown in an Assistant Professor of Medicine (Neurology) and BiomedicalEngineering at Duke University, and one of the core faculty at Duke University’s Brain Imagingand Analysis Center (BIAC). He is a U.S. board-certified Neurologist and an attendingphysician at the Durham Rehabilitation Institute. After completing undergraduate training inengineering physics at McMaster University in 1986, he attended medical school at theUniversity of Toronto, graduating in 1990. He specialized in Neurology at the University ofWestern Ontario, becoming a fellow of the Royal College of Physicians of Canada in 1994.After completing a year of clinical electrophysiology training, he studied blind sourceseparation techniques for fMRI analysis for three years at the Computational NeurobiologyLab, Salk Institute for Biological Studies. Since 1998, he has been on faculty at DukeUniversity. His primary interests are in brain plasticity and rehabilitation. This work involvesthe application of ICA and other multivariate signal processing techniques to fMRI, EMG, andEEG to explore the brain and muscle activity related to motor recovery after stroke. Other workinvolves the application of ICA to the clinical EEG and fMRI to aid in the diagnosis, treatmentand prognosis of epileptic populations.
Jung et al. Page 23
Proc IEEE Inst Electr Electron Eng. Author manuscript; available in PMC 2010 September 2.
HH
MI Author M
anuscriptH
HM
I Author Manuscript
HH
MI Author M
anuscript
Anthony J. (Tony) Bell received the M.A. degree in computer science and philosophy fromthe University of St. Andrews, Scotland, in 1987 and the Ph.D. degree in artificial intelligencefrom the Free University of Brussels, Belgium, in 1993.
Since 1990, he has been associated with the Computational Neurobiology Laboratory of theSalk Institute, San Diego, as a visitor or postdoctoral researcher, and has also worked at IntervalResearch, Palo Alto, CA.
Jung et al. Page 24
Proc IEEE Inst Electr Electron Eng. Author manuscript; available in PMC 2010 September 2.
HH
MI Author M
anuscriptH
HM
I Author Manuscript
HH
MI Author M
anuscript
Te-Won Lee (Member, IEEE) received the diploma degree in March 1995 and his Ph.D. degreein October 1997 (summa cum laude) in electrical engineering from the University ofTechnology, Berlin.
He is an Assistant Research Professor at the Institute for Neural Computation, University ofCalifornia, San Diego, CA. He is also a research associate at the Salk Institute for BiologicalStudies, La Jolla, CA. He was a visiting graduate student at the Institute NationalePolytechnique de Grenoble, the University of California, Berkeley, and Carnegie MellonUniversity. From 1995 to 1997, he was a Max-Planck Institute fellow and in 1999, he was aVisiting Professor at the Korea Advanced Institute of Science and Technology (KAIST). Hisresearch interests are in the areas of unsupervised learning algorithms, artificial neuralnetworks and Bayesian probability theory with applications in signal and image processing.
Jung et al. Page 25
Proc IEEE Inst Electr Electron Eng. Author manuscript; available in PMC 2010 September 2.
HH
MI Author M
anuscriptH
HM
I Author Manuscript
HH
MI Author M
anuscript

Terrence J. Sejnowski (Fellow, IEEE) received the B.S. degree from the Case-WesternReserve University, the M.A. degree from Princeton University, and the Ph.D. degree fromPrinceton University in 1978, all in physics.
He is an Investigator with Howard Hughes Medical Institute and a Professor at the Salk Institutefor Biological Studies, where he directs the Computational Neurobiology Laboratory. He isalso Professor of Biology at the University of California, San Diego, where he is Director ofthe Institute for Neural Computation. In 1988, he founded Neural Computation, (MIT Press).The long-range goal of his research is to build linking principles from brain to behavior usingcomputational models.
Jung et al. Page 26
Proc IEEE Inst Electr Electron Eng. Author manuscript; available in PMC 2010 September 2.
HH
MI Author M
anuscriptH
HM
I Author Manuscript
HH
MI Author M
anuscript

Fig. 1.The difference between PCA and ICA on a nonorthogonal mixture of two distributions thatare independent and highly sparse (peaked with long tails). An example of a sparse distributionis the Laplacian: p(x) = ke|−x|. PCA, looking for orthogonal axes ranked in terms of maximumvariance, completely misses the structure of the data. Although these distributions may lookstrange, they are quite common in natural data.
Jung et al. Page 27
Proc IEEE Inst Electr Electron Eng. Author manuscript; available in PMC 2010 September 2.
HH
MI Author M
anuscriptH
HM
I Author Manuscript
HH
MI Author M
anuscript

Fig. 2.Optimal information flow in sigmoidal neurons. (left) Input x raving probability densityfunction p(x), n this case a Gaussian, is passed through a nonlinear function g(x). Theinformation in the resulting density, p(x) depends on matching the mean and variance of x tothe threshold, w0, and slope, w, of g(x) (Nicol Schraudolph, personal communication). (right)p(y) is plotted for different values of the weight w. The optimal weight, wopt transmits mostinformation (from [2] by permission.)
Jung et al. Page 28
Proc IEEE Inst Electr Electron Eng. Author manuscript; available in PMC 2010 September 2.
HH
MI Author M
anuscriptH
HM
I Author Manuscript
HH
MI Author M
anuscript

Fig. 3.A selection of 144 basis functions (columns of W−1) obtained from training on patches of 12-by-12 pixels from pictures of natural scenes.
Jung et al. Page 29
Proc IEEE Inst Electr Electron Eng. Author manuscript; available in PMC 2010 September 2.
HH
MI Author M
anuscriptH
HM
I Author Manuscript
HH
MI Author M
anuscript
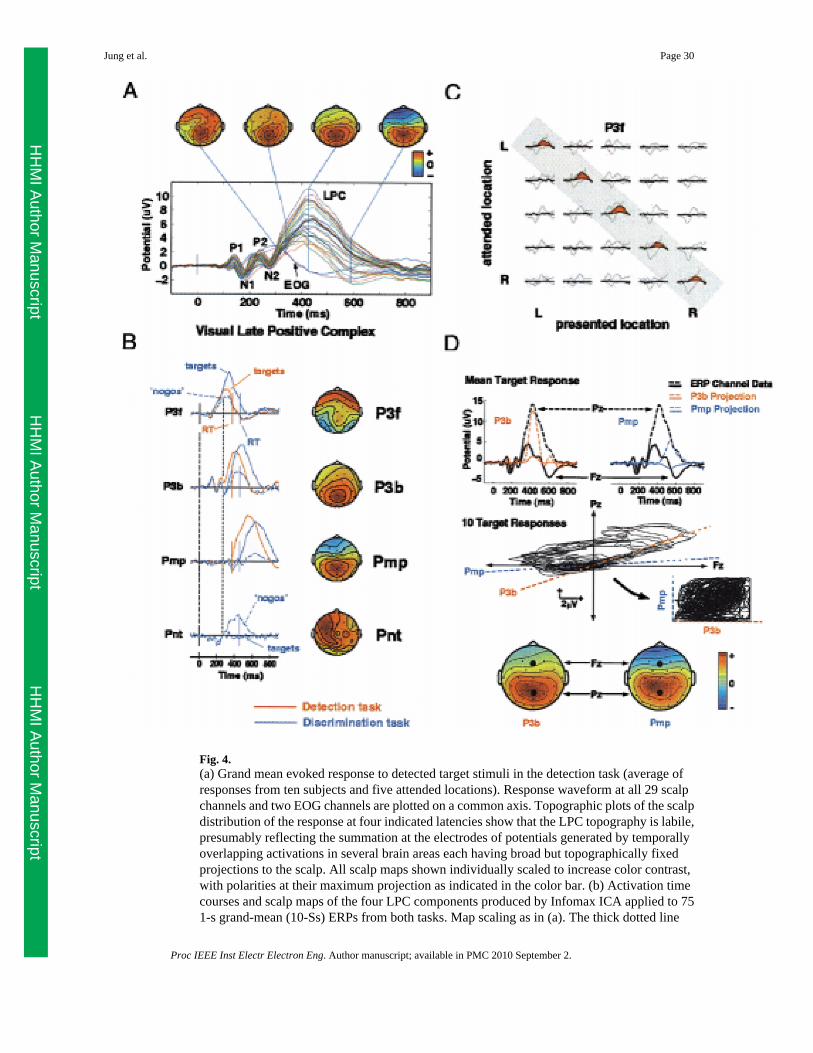
Fig. 4.(a) Grand mean evoked response to detected target stimuli in the detection task (average ofresponses from ten subjects and five attended locations). Response waveform at all 29 scalpchannels and two EOG channels are plotted on a common axis. Topographic plots of the scalpdistribution of the response at four indicated latencies show that the LPC topography is labile,presumably reflecting the summation at the electrodes of potentials generated by temporallyoverlapping activations in several brain areas each having broad but topographically fixedprojections to the scalp. All scalp maps shown individually scaled to increase color contrast,with polarities at their maximum projection as indicated in the color bar. (b) Activation timecourses and scalp maps of the four LPC components produced by Infomax ICA applied to 751-s grand-mean (10-Ss) ERPs from both tasks. Map scaling as in (a). The thick dotted line
Jung et al. Page 30
Proc IEEE Inst Electr Electron Eng. Author manuscript; available in PMC 2010 September 2.
HH
MI Author M
anuscriptH
HM
I Author Manuscript
HH
MI Author M
anuscript

(left) indicates stimulus onset. Mean subject-median response times (RTs) in the Detection task(red) and Discrimination task (blue) are indicated by solid vertical bars. Three independentcomponents (P3f, P3b, Pmp) accounted for 95%–98% of response variance in both tasks. Inboth tasks, median RT coincided with Pmp onset. The faint vertical dotted line near 250 msshows that the P3f time courses for targets and “nogo” nontargets (presented in the targetlocation) just at the onset of the left-sided Pnt component, which was active only in thiscondition. (c) Envelopes of the scalp projections of maximally independent component P3f,(red filled) superimposed on the mean response envelopes (black outlines) for all 5 × 5 responseconditions of the Detection task. (d) The top panels show the grand mean target response attwo scalp channels, Fz and Pz (thick traces), and the projections of the two largest ICAcomponents, P3b and Pmp, to the same channels (thin traces). The central panel shows a scatterplot of ten average target ERPs at the two electrodes. The data contain two strongly radial (and,therefore, spatially fixed) features. The dashed lines (middle panel) show the directionsassociated with components P3b and Pmp in these data, as determined by the relative projectionstrengths of each component to these two scalp channels (shown below as black dots on thecomponent scalp maps). The degree of data entropy attained by ICA training is illustrated bythe (center right) plot insert, which shows the (31-channel) scatter-plotted data after logistictransformation and rotation to the two component axes (from [25] by permission).
Jung et al. Page 31
Proc IEEE Inst Electr Electron Eng. Author manuscript; available in PMC 2010 September 2.
HH
MI Author M
anuscriptH
HM
I Author Manuscript
HH
MI Author M
anuscript

Fig. 5.ERP-image plots of target response data from a visual selective attention experiment andvarious independent component categories. (a) Single-trial ERPs recorded at a central (Cz) anda parietal electrode (Pz) from an autistic subject and timelocked to onsets of visual target stimuli(left thin vertical line) with superimposed subject response times (RT). (b) Single-trialactivations of sample independent components accounting for (clockwise) eye blink artifacts,stimulus-locked and response-locked ERP components, response-blocked oscillatory mu,stimulus phase-reset alpha, and nonphase locked activities.
Jung et al. Page 32
Proc IEEE Inst Electr Electron Eng. Author manuscript; available in PMC 2010 September 2.
HH
MI Author M
anuscriptH
HM
I Author Manuscript
HH
MI Author M
anuscript
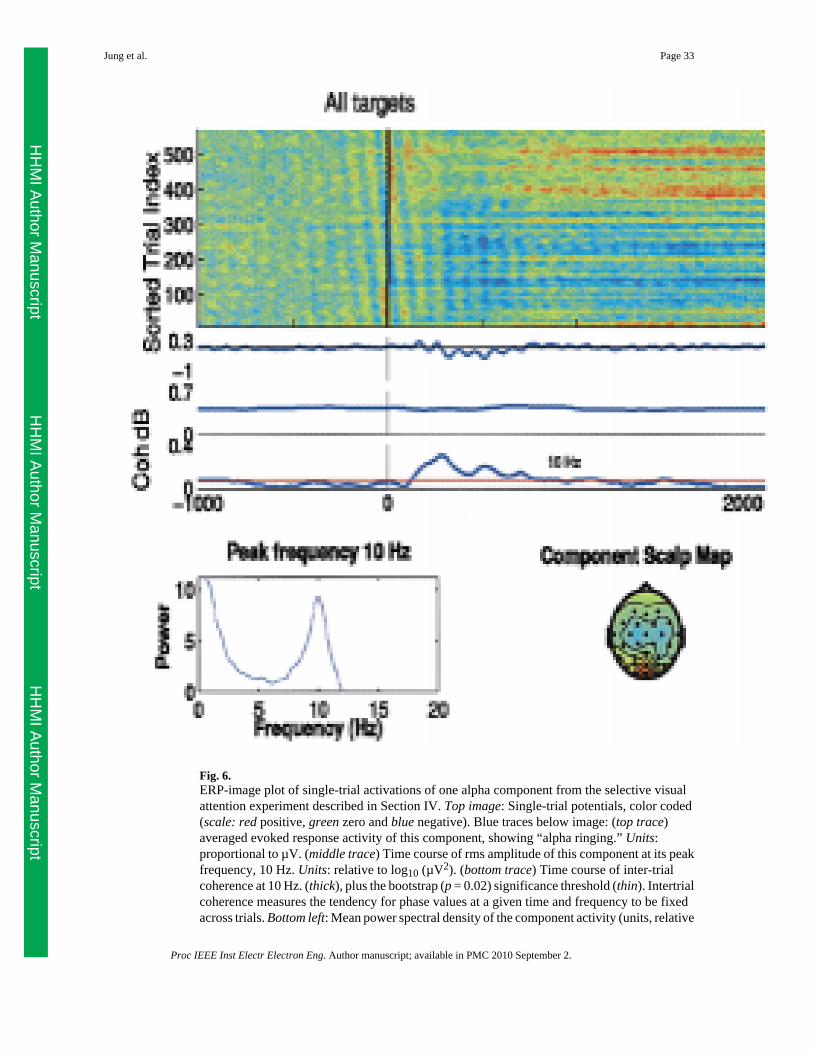
Fig. 6.ERP-image plot of single-trial activations of one alpha component from the selective visualattention experiment described in Section IV. Top image: Single-trial potentials, color coded(scale: red positive, green zero and blue negative). Blue traces below image: (top trace)averaged evoked response activity of this component, showing “alpha ringing.” Units:proportional to µV. (middle trace) Time course of rms amplitude of this component at its peakfrequency, 10 Hz. Units: relative to log10 (µV2). (bottom trace) Time course of inter-trialcoherence at 10 Hz. (thick), plus the bootstrap (p = 0.02) significance threshold (thin). Intertrialcoherence measures the tendency for phase values at a given time and frequency to be fixedacross trials. Bottom left: Mean power spectral density of the component activity (units, relative
Jung et al. Page 33
Proc IEEE Inst Electr Electron Eng. Author manuscript; available in PMC 2010 September 2.
HH
MI Author M
anuscriptH
HM
I Author Manuscript
HH
MI Author M
anuscript

decibels). Bottom right: scalp map showing the interpolated projection of the component to thescalp electrodes.
Jung et al. Page 34
Proc IEEE Inst Electr Electron Eng. Author manuscript; available in PMC 2010 September 2.
HH
MI Author M
anuscriptH
HM
I Author Manuscript
HH
MI Author M
anuscript
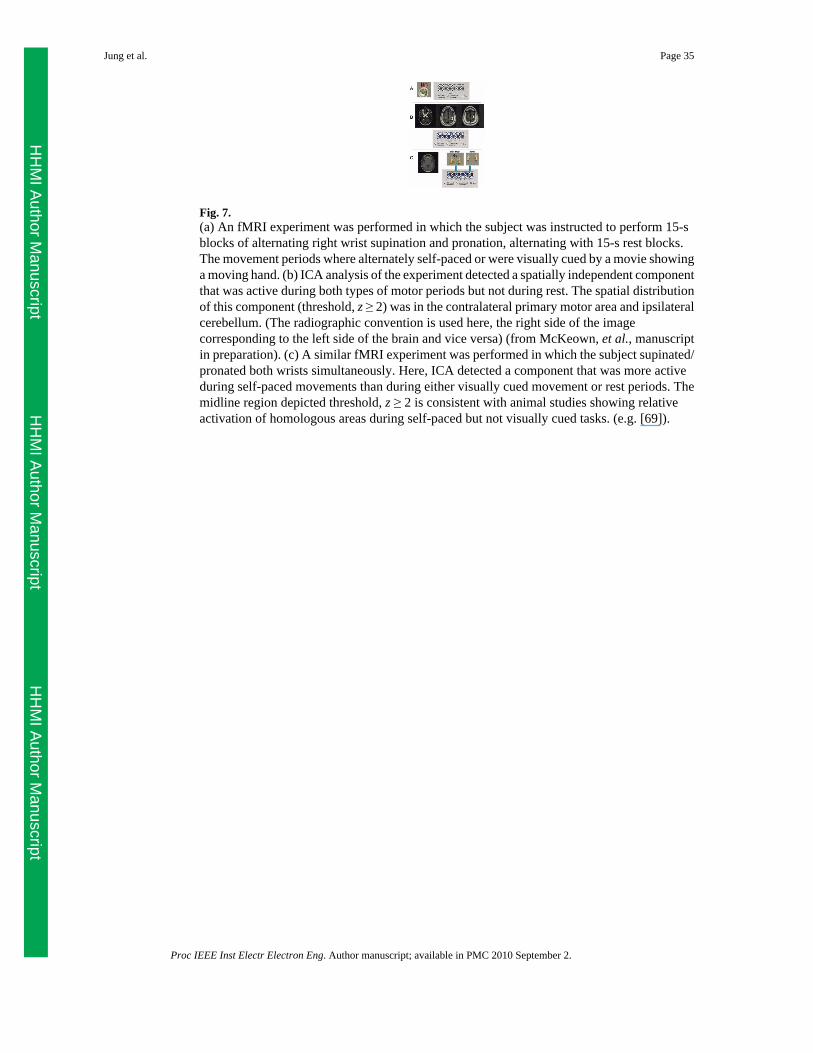
Fig. 7.(a) An fMRI experiment was performed in which the subject was instructed to perform 15-sblocks of alternating right wrist supination and pronation, alternating with 15-s rest blocks.The movement periods where alternately self-paced or were visually cued by a movie showinga moving hand. (b) ICA analysis of the experiment detected a spatially independent componentthat was active during both types of motor periods but not during rest. The spatial distributionof this component (threshold, z ≥ 2) was in the contralateral primary motor area and ipsilateralcerebellum. (The radiographic convention is used here, the right side of the imagecorresponding to the left side of the brain and vice versa) (from McKeown, et al., manuscriptin preparation). (c) A similar fMRI experiment was performed in which the subject supinated/pronated both wrists simultaneously. Here, ICA detected a component that was more activeduring self-paced movements than during either visually cued movement or rest periods. Themidline region depicted threshold, z ≥ 2 is consistent with animal studies showing relativeactivation of homologous areas during self-paced but not visually cued tasks. (e.g. [69]).
Jung et al. Page 35
Proc IEEE Inst Electr Electron Eng. Author manuscript; available in PMC 2010 September 2.
HH
MI Author M
anuscriptH
HM
I Author Manuscript
HH
MI Author M
anuscript
Related Documents