IEEE TRANSACTIONS ON IMAGE PROCESSING, VOL. 15, NO. 6, JUNE 2006 1555 Image Segmentation Based on Fuzzy Connectedness Using Dynamic Weights Amol S. Pednekar and Ioannis A. Kakadiaris Abstract—Traditional segmentation techniques do not quite meet the challenges posed by inherently fuzzy medical images. Image segmentation based on fuzzy connectedness addresses this problem by attempting to capture both closeness, based on characteristic intensity, and “hanging togetherness,” based on intensity homogeneity, of image elements to the target object. This paper presents a modification and extension of previously published image segmentation algorithms based on fuzzy con- nectedness, which is computed as a linear combination of an object-feature-based and a homogeneity-based component using fixed weights. We provide a method, called fuzzy connectedness using dynamic weights (DyW), to introduce directional sensitivity to the homogeneity-based component and to dynamically adjust the linear weights in the functional form of fuzzy connectedness. Dynamic computation of the weights relieves the user of the exhaustive search process to find the best combination of weights suited to a particular application. This is critical in applications such as analysis of cardiac cine magnetic resonance (MR) images, where the optimal combination of affinity component weights can vary for each slice, each phase, and each subject, in spite of data being acquired from the same MR scanner with identical protocols. We present selected results of applying DyW to segment phantom images and actual MR, computed tomography, and infrared data. The accuracy of DyW is assessed by comparing it to two different formulations of fuzzy connectedness. Our method consistently achieves accuracy of more than 99.15% for a range of image complexities: contrast 5%–65%, noise-to-contrast ratio of 6%–18%, and bias field of four types with maximum gain factor of up to 10%. Index Terms—Dynamic weights, fuzzy connectedness, image segmentation. I. INTRODUCTION M EDICAL image computing has revolutionized the field of medicine by providing novel methods to extract and visualize information from medical data acquired using various acquisition modalities. Image segmentation is one of the most important steps in the higher level analysis of preprocessed pa- tient image data, and can aid in diagnosis, functional catego- rization, and prognosis, as well as evaluation of therapeutic in- terventions. The main goal of the image segmentation process is to divide an image into parts that have a strong correlation Manuscript received June 24, 2004; revised April 8, 2005. This work was supported in part by the National Science Foundation (NSF) under Grant IIS- 0431144, Grant IIS-0335578, Grant IIS-035578, and Grant IIS-9985482. The associate editor coordinating the review of this manuscript and approving it for publication was Dr. Luca Lucchese. A. S. Pednekar is with the MR Clinical Science group, Philips Medical Sys- tems North America, Bothell, WA 98021 USA ([email protected]). I. A. Kakadiaris is with the Computational Biomedicine Lab (formerly known as Visual Computing Laboratory), Department of Computer Science, MS CSC 3010, University of Houston, Houston, TX 77204-3010 USA (e-mail: ioan- [email protected]; [email protected]). Digital Object Identifier 10.1109/TIP.2006.871165 with objects or regions of the real world depicted in the image. When the object or region of interest has intensity features sig- nificantly different from the rest of the image, it is often possible to threshold the region of interest to produce a binary image. However, medical images are not incisive; they are character- ized by a composition of small differences in signal intensities between different tissue types, noise, blurring, background vari- ation, partial voluming, and certain acquisition-specific effects, e.g., surface coil intensity falloff in magnetic resonance imaging (MRI). Ambiguities and uncertainties are introduced in image formation due to approximations made during image acquisi- tion, limited spatial, temporal, and parametric resolutions, and heterogeneous tissue composition of the human body, in addi- tion to movement of the subject. This imprecision makes it ex- tremely difficult to determine the exact location of the boundary points of the object of interest purely based on the intensity values assigned to the individual image elements. Nevertheless, anatomical objects in medical data are char- acterized by certain intensity level and intensity homogeneity features. The image elements seem to “hang together” to form a certain perception of the object region. Thus, medical image segmentation would benefit from a method based on the “hanging togetherness” property of the object of interest. The image segmentation framework based on fuzzy connectedness developed by Udupa and his collaborators [1] effectively cap- tures the “hanging togetherness” of image elements specified by their strength of fuzzy connectedness. Fuzzy connectedness is constructed by combining an object-feature based and a homogeneity based affinity component in a fixed manner with various functional forms [2]. The best combination of affinity component weights for a particular functional form and par- ticular application is determined by performing an exhaustive search. In applications involving a large number of studies based on a fixed image acquisition protocol, the affinity parameters and the threshold may be fixed without requiring per-case adjustment. However, without the same protocol-specific tissue indication for intensity values, it becomes very difficult to set values for the affinity parameters and the threshold in a manner indepen- dent of patient studies. Cardiac cine MR images as an example pose numerous challenges. MRI generally requires several cy- cles of signal generation followed by signal measurement. Thus, any motion of tissues between the excitation cycles causes blur- ring and other motion artifacts. The heart-motion and respiration cause a shift in the overall position of the heart throughout the image acquisition process. In addition, uneven breath holding and patient motion introduce further artifacts. Thus, the quality of cardiac cine magnetic resonance (MR) relies on the ability of the operator and scanner to compensate for these changes and the ability of the postprocessor to rectify the intensity falloff 1057-7149/$20.00 © 2006 IEEE

Welcome message from author
This document is posted to help you gain knowledge. Please leave a comment to let me know what you think about it! Share it to your friends and learn new things together.
Transcript
IEEE TRANSACTIONS ON IMAGE PROCESSING, VOL. 15, NO. 6, JUNE 2006 1555
Image Segmentation Based on Fuzzy ConnectednessUsing Dynamic Weights
Amol S. Pednekar and Ioannis A. Kakadiaris
Abstract—Traditional segmentation techniques do not quitemeet the challenges posed by inherently fuzzy medical images.Image segmentation based on fuzzy connectedness addressesthis problem by attempting to capture both closeness, based oncharacteristic intensity, and “hanging togetherness,” based onintensity homogeneity, of image elements to the target object.This paper presents a modification and extension of previouslypublished image segmentation algorithms based on fuzzy con-nectedness, which is computed as a linear combination of anobject-feature-based and a homogeneity-based component usingfixed weights. We provide a method, called fuzzy connectednessusing dynamic weights (DyW), to introduce directional sensitivityto the homogeneity-based component and to dynamically adjustthe linear weights in the functional form of fuzzy connectedness.Dynamic computation of the weights relieves the user of theexhaustive search process to find the best combination of weightssuited to a particular application. This is critical in applicationssuch as analysis of cardiac cine magnetic resonance (MR) images,where the optimal combination of affinity component weightscan vary for each slice, each phase, and each subject, in spite ofdata being acquired from the same MR scanner with identicalprotocols. We present selected results of applying DyW to segmentphantom images and actual MR, computed tomography, andinfrared data. The accuracy of DyW is assessed by comparing itto two different formulations of fuzzy connectedness. Our methodconsistently achieves accuracy of more than 99.15% for a range ofimage complexities: contrast 5%–65%, noise-to-contrast ratio of6%–18%, and bias field of four types with maximum gain factorof up to 10%.
Index Terms—Dynamic weights, fuzzy connectedness, imagesegmentation.
I. INTRODUCTION
MEDICAL image computing has revolutionized the fieldof medicine by providing novel methods to extract and
visualize information from medical data acquired using variousacquisition modalities. Image segmentation is one of the mostimportant steps in the higher level analysis of preprocessed pa-tient image data, and can aid in diagnosis, functional catego-rization, and prognosis, as well as evaluation of therapeutic in-terventions. The main goal of the image segmentation processis to divide an image into parts that have a strong correlation
Manuscript received June 24, 2004; revised April 8, 2005. This work wassupported in part by the National Science Foundation (NSF) under Grant IIS-0431144, Grant IIS-0335578, Grant IIS-035578, and Grant IIS-9985482. Theassociate editor coordinating the review of this manuscript and approving it forpublication was Dr. Luca Lucchese.
A. S. Pednekar is with the MR Clinical Science group, Philips Medical Sys-tems North America, Bothell, WA 98021 USA ([email protected]).
I. A. Kakadiaris is with the Computational Biomedicine Lab (formerly knownas Visual Computing Laboratory), Department of Computer Science, MS CSC3010, University of Houston, Houston, TX 77204-3010 USA (e-mail: [email protected]; [email protected]).
Digital Object Identifier 10.1109/TIP.2006.871165
with objects or regions of the real world depicted in the image.When the object or region of interest has intensity features sig-nificantly different from the rest of the image, it is often possibleto threshold the region of interest to produce a binary image.
However, medical images are not incisive; they are character-ized by a composition of small differences in signal intensitiesbetween different tissue types, noise, blurring, background vari-ation, partial voluming, and certain acquisition-specific effects,e.g., surface coil intensity falloff in magnetic resonance imaging(MRI). Ambiguities and uncertainties are introduced in imageformation due to approximations made during image acquisi-tion, limited spatial, temporal, and parametric resolutions, andheterogeneous tissue composition of the human body, in addi-tion to movement of the subject. This imprecision makes it ex-tremely difficult to determine the exact location of the boundarypoints of the object of interest purely based on the intensityvalues assigned to the individual image elements.
Nevertheless, anatomical objects in medical data are char-acterized by certain intensity level and intensity homogeneityfeatures. The image elements seem to “hang together” toform a certain perception of the object region. Thus, medicalimage segmentation would benefit from a method based on the“hanging togetherness” property of the object of interest. Theimage segmentation framework based on fuzzy connectednessdeveloped by Udupa and his collaborators [1] effectively cap-tures the “hanging togetherness” of image elements specifiedby their strength of fuzzy connectedness. Fuzzy connectednessis constructed by combining an object-feature based and ahomogeneity based affinity component in a fixed manner withvarious functional forms [2]. The best combination of affinitycomponent weights for a particular functional form and par-ticular application is determined by performing an exhaustivesearch.
In applications involving a large number of studies based on afixed image acquisition protocol, the affinity parameters and thethreshold may be fixed without requiring per-case adjustment.However, without the same protocol-specific tissue indicationfor intensity values, it becomes very difficult to set values forthe affinity parameters and the threshold in a manner indepen-dent of patient studies. Cardiac cine MR images as an examplepose numerous challenges. MRI generally requires several cy-cles of signal generation followed by signal measurement. Thus,any motion of tissues between the excitation cycles causes blur-ring and other motion artifacts. The heart-motion and respirationcause a shift in the overall position of the heart throughout theimage acquisition process. In addition, uneven breath holdingand patient motion introduce further artifacts. Thus, the qualityof cardiac cine magnetic resonance (MR) relies on the ability ofthe operator and scanner to compensate for these changes andthe ability of the postprocessor to rectify the intensity falloff
1057-7149/$20.00 © 2006 IEEE
1556 IEEE TRANSACTIONS ON IMAGE PROCESSING, VOL. 15, NO. 6, JUNE 2006
in surface coil MRI. In general, the blood intensity value (ob-ject-feature) varies from the base to apex of the heart in everyslice in the same phase of the cardiac cycle without any genericpattern of variation within a single patient. Furthermore, theblood pool intensity (homogeneity) changes within a slice due topartial voluming, while anatomical features like papillary mus-cles and valves cause blood flow artifacts.
Thus, in this application area, the optimal combination ofthe affinity component weights and the threshold for the con-nectivity scene varies for each slice, each phase, and each pa-tient in spite of the data being acquired from the same MRscanner with identical protocol. As a result, precision, accu-racy, and efficiency of segmentation may be compromised [3].It may be necessary to adjust the parameters for each study tohandle image-dependent variations in intensity. Our goal is torelieve the user from the task of selection or computation ofthese affinity component weights while preserving the qualityof segmentation achieved using the framework based on fuzzyconnectedness, by providing a method to dynamically adjust theweights of the two affinity components in the linear functionalform of fuzzy connectedness. In addition, we introduce direc-tional sensitivity to the homogeneity-based component to ac-count for directional background inhomogeneity (e.g., bias fieldin MR). We call this image segmentation method fuzzy connect-edness using dynamic weights (DyW).
The remainder of this paper1 is organized as follows. InSection II, we provide a brief overview of image segmentationmethods based on fuzzy connectedness. In Section III, weprovide the particular fuzzy connectedness framework that weemploy, and in Section IV we explain our modifications to thisframework and describe DyW in detail. In Section V, we presentresults of an evaluation study of DyW on synthetic phantomdata, a comparison of results using two other functional formsof fuzzy connectedness, and results obtained on real medicaldata acquired using different imaging modalities. Section VIconcludes by summarizing our findings.
II. PREVIOUS WORK
The challenges in analyzing medical image data encouragedresearchers to develop segmentation algorithms which regardregions as fuzzy subsets of the image, where an image data ele-ment may be classified partially into multiple potential classes.The theory of fuzzy sets [5] is believed to effectively model thefuzziness of medical image data. However, apart from fuzzyclassification, segmentation needs to address the intensity in-homogeneities within an object of interest. The fuzzy geomet-rical connectedness approach added spatial measures to handlethe spatial uncertainties in the images [6], [7]. Fuzzy connected-ness represented an important topological property of images. Inaddition, “hanging togetherness” was incorporated in the samefuzzy settings [8], [9].
The notion of a fuzzy object, based on ideas of fuzzy connect-edness of image elements in an -dimensional digital space forimage segmentation was first developed by Udupa and Sama-rasekera [1]. This fuzzy connectedness-based image segmenta-tion framework effectively captures the fuzzy “hanging togeth-erness” of image elements specified by their strength of connect-edness. Specifically, a fuzzy connectedness between two image
1Parts of this paper have appeared in [4].
elements is computed based on their spatial nearness as well asthe similarity of their intensity-based features, which capturesthe local hanging togetherness of image elements. The globalfuzzy connectedness between any two spatial elements (spels) inthe image considers the strengths of all possible paths betweenthem, where the strength of a particular path is the weakestaffinity between the successive pairs of spels along the path.Thus, the strongest connectedness path between any two spelsspecifies the degree of hanging togetherness between them. Thefuzzy extent of an object is computed by expanding it from theinitial seed points based on this global fuzzy connectedness.
This framework was further extended with the introductionof object scale, which allowed the size of the neighborhood tobe changed in different parts of the image and the introductionof a variety of functional forms for each affinity componentseparately [2]. In the relative fuzzy connectedness approach,all the important objects in the image are allowed to competeamong themselves to seize the membership of image elementsbased on their relative strength of connectedness to referenceelements [10]. The fuzzy connectedness-based image segmen-tation framework was also generalized for the identification ofmultiple elements in an image [11]. A recent approach usingtensor scale in affinity computation allows for an effective uti-lization of local size, orientation, and anisotropy in a unifiedmanner [12].
In previous approaches, connectedness, in general, consists ofthree major affinity components: 1) spel adjacency, 2) intensityhomogeneity, 3) and object-feature. One may devise a varietyof functional forms for each component separately and com-bine them to the affinity relation suited for a specific application[2]. To effectively capture the degree of local hanging together-ness of the spels, both the homogeneity and object-feature-basedcomponents should be considered in the design of fuzzy spelaffinities. However, in the previous approaches the homogeneityand object-feature-based components are treated totally inde-pendent of each other. The functional forms and the parametersassociated with these components allow many possible choicesfor fuzzy spel affinities. Saha et al. [2] conducted experimentalstudies for obtaining an insight into the best choices. One of theshortcomings of these approaches is the need for determinationof optimal affinity parameters and the threshold for the connec-tivity scene (Note: In relative fuzzy connectedness, the need fora threshold is obviated).
III. A FRAMEWORK FOR FUZZY CONNECTEDNESS
A. Preliminaries
A minimal set of terminology and definitions are presented toprovide the preliminaries of the fuzzy connectedness formula-tion we employ. We follow the terminology of Udupa et al. [1],[2].
Let be any reference set. A fuzzy subset of is a set ofordered pairs , where
is the membership function of in ( is subscriptedby the fuzzy subset under consideration). A fuzzy relation in
is a fuzzy subset of . We shall call a fuzzy relationin that is reflexive and symmetric
a proximity in , and thepair a fuzzy space. Let , the set of -tuplesof integers. A proximity in is called an adjacency and
PEDNEKAR AND KAKADIARIS: IMAGE SEGMENTATION BASED ON FUZZY CONNECTEDNESS USING DYNAMIC WEIGHTS 1557
the pair is called a digital fuzzy space. The conceptof fuzzy digital space characterizes the underlying digital gridindependent of any image related concepts, and it is desirablethat is a nonincreasing function of the distance in . Inthis fuzzy digital space, any scalar functionfrom a finite subset of to a finite subset of theintegers defines a scene over . In a scene ,a proximity in is called an affinity. An affinity relation iscalled a similitude if it is also transitive: , ,
Starting from any affinity in , and using the notion ofpath strength, one can construct a similitude in , called
-connectedness and denoted by the upper case form of thesymbol used for the corresponding affinity. A path fromto in is a sequence of elements of , not necessarilydistinct, such that .Each pair is a link in the path. The set of allpaths in between and is denoted by . The strengthof each link in a path is simply the affinity
. The strength of connectivity along a pathis determined by its weakest link, namely:
.The fuzzy -connectedness of and is the strength of thestrongest path in(Note: is an infinite set, but the use of instead of isjustified since a scene is a finite subset of and, thus,can only assume a finite number of values). The relation is asimilitude relation in [1].
Given a -connectedness similitude in a scene and aspecific scene element , the —connectedness sceneis defined by for all in . This defines afamily of equivalence relations in , since the relation definedby is an equivalence relation forany threshold . Thus, segmentation of the initial scene
results from thresholding this final scene at aselected -connectedness level [1].
B. Fuzzy Affinity
For the sake of simplicity and clarity of exposition, we re-strict our presentation to the two-dimensional (2-D) case, butour method is not dimension-specific. This is because we followthe framework of Udupa et al. [1], [2], so the extension to threeor higher dimensional problems is straightforward.
For processing of 2-D data, the fuzzy digital space is ,where
if
otherwise
the scene represents acquired image data, and isa pair of pixels in this scene. The generic form of an affinityrelation between and is given by [1]
where is a scalar-valued function with range . In this gen-eral form may be shift variant, meaning it may dependon the locations of pixels and .
It was recognized early on that there should be two specific,shift-invariant components of affinity in this design- , whichis based on homogeneity and , which is based on object-fea-tures [2]. The two components can be combined in the followinggeneric functional form for :
where is an affinity based on average intensityand is an affinity based
on intensity homogeneity .The component measures affinity based on average inten-
sity and describes how close the feature value (intensity) is tosome specified object feature. As an example, a Gaussian func-tion can be used
where
and and are the mean and standard deviation of the inten-sity of the object to be segmented.
The component measures affinity based on intensity ho-mogeneity and describes how similar the intensity value stayswithin a region. Again, a Gaussian function provides an example
where
and and are the mean and standard deviation of the inten-sity homogeneity of the object to be segmented.
There are several choices that have been proposed for thefunction . The original is a simple linear combination [1]
where . The more homogeneous the region to whichand belong, the greater is the value of . On the other hand,
takes a high value when and are both close to the expectedintensity value for the object. The weighted linear combinationof these two components strives to effectively capture both theglobal connectedness and local hanging togetherness of the ob-ject to be defined.
Note that these components are considered independent ofeach other and the weights for these components are static.This assumes that the level of dominance of one componentover the other is constant over the entire object. However,in scale-based fuzzy connectedness [2] there is some adap-tivity of these components via the concept of local scaleregion and via the geometric mean formulation of affinity as
IV. MODIFICATIONS AND EXTENSIONS TO THE FRAMEWORK
In this section, we propose a modified functional form for ,where directional sensitivity along with magnitude account fordirectional background inhomogeneity (e.g., bias field in MR).
1558 IEEE TRANSACTIONS ON IMAGE PROCESSING, VOL. 15, NO. 6, JUNE 2006
In addition, we discuss the dynamic determination of weightsfor and in detail.
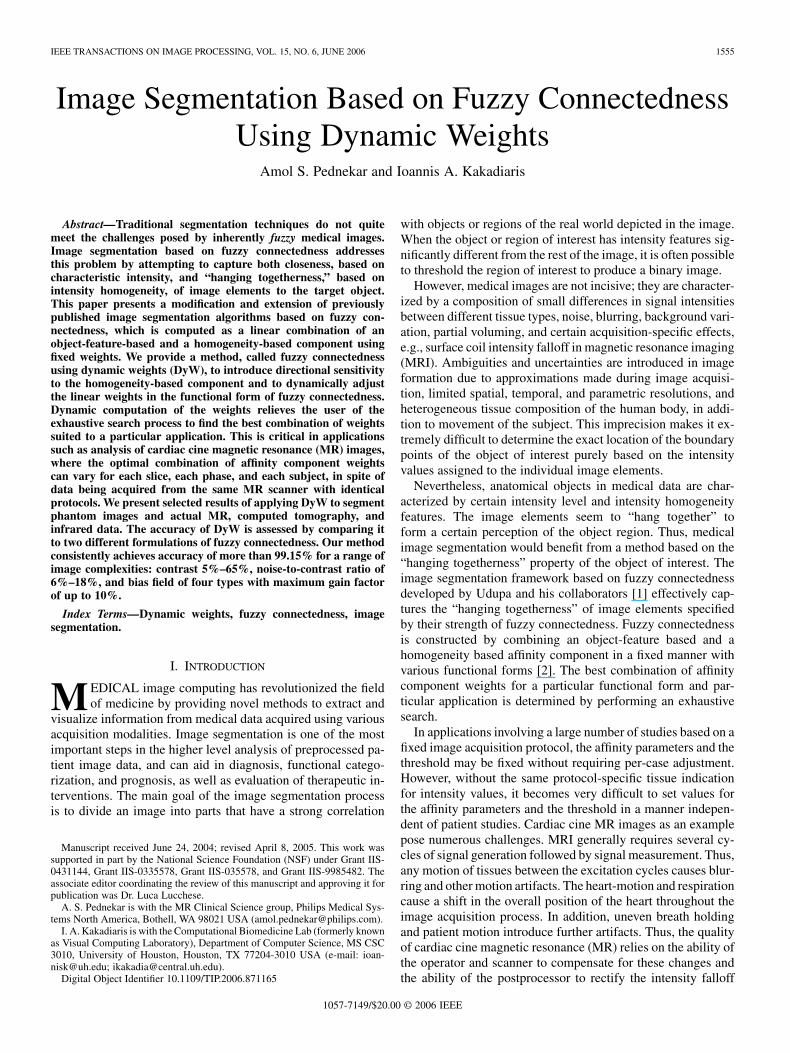
We start by providing some motivation, based on the field ofMR imaging. Suppose, as in the case of MR, that the image ofthe object has a slow varying background intensity componentin a horizontal direction. Then, pixels and that belong to thesame object but are far apart from each other in the horizontaldirection will have very different intensities. By increasing theweight for we can find a path between and such thatthe intensities of all the horizontal links on the path are similarenough to indicate the connectedness between and . How-ever, this might create a path between pixels and which arevertically apart in the image, but belong to two different objects.This will happen because the increased weight for is toler-ating the same amount of dissimilarity between the intensitiesin each vertical link. Fig. 1 depicts how the affinities assigned topixels vary with the change in value of . Thus, it is intuitive totreat path links differently depending on their direction and thecharacteristic magnitude of increase or decrease in object inten-sity in that direction. This suggests that weights for andneed to vary in accordance with the dominance of one affinitycomponent over the other and the direction of links in the chain.
One way to address this problem is to assign the weights toand components based on the relative degree of near-
ness of the link in the respective component domains. InMR images, the intensity of the object changes gradually nearthe inter-object boundaries, making the boundaries diffused (forcardiac MR images, flow artifacts and partial voluming of bloodwith the heart wall and papillary muscles have the same effect).In these cases, even though the object-feature (characteristic in-tensity) is disparate near the object boundaries, the intensitiesof each link may still be similar, resulting in increasedweight for the intensity-homogeneity component . However,this may merge two objects when intensity change is very slowand gradual at the boundary [2]. This effect is counteracted byallowing the weight for to increase only to the point where
is still within from the characteristic object intensity. Inthe definition of , corresponds to distance fromthe characteristic intensity of the target object. Thus, dynami-cally computed weights for affinity components, along with adirectionally sensitive , effectively capture the fuzzy extentof the object.
A. Directionally Sensitive Intensity Homogeneity for FuzzyAffinity
In the original formulation of , the direction of intensity in-homogeneity and its sign are not taken into consideration. Thistype of formulation allows equal amounts of intensity dissimi-larities in path links irrespective of the direction of the link anddoes not consider the increase or decrease in intensity acrossthe link due to directional background variation. We propose tomodify to be directionally sensitive by computing four dif-ferent pairs from the sample region, one for each ofthe four possible directions , , ,and . The affinity on each link is thencomputed using the parameter pair computed in thedirection of that link. The bias in intensity in a specific direc-tion is, thus, accounted for by allowing different levels and signsof dissimilarities in different link directions. This modified re-lation is still an affinity because symmetry is preserved (since
Fig. 1. (a) Fuzzy affinity maps of (a) a short-axis cardiac MR image, for whichthe weight for object-feature intensity (� ) is set to (b) 1.0, (c) 0.75, (d) 0.50,and (e) 0.25, respectively.
, and similarly for all the other compass di-rections).
B. Dynamic Weights for Fuzzy Affinity
The bias field and noise in an image can change the near-ness of object pixels in terms of characteristic object intensity;however, the nearness may still be maintained in terms of inten-sity homogeneity. We have developed a method to determine theweights for and dynamically based on the level of domi-nance of one component over the other. We determine the levelof dominance by the ratio of the two components. Specifically,we compute and as follows:
and
Thus, becomes high in the regions of the image with in-tensity almost similar to the intensity of the object to be seg-mented in the scene. Conversely, in regions where intensity isdifferent from the characteristic object intensity but intensityhomogeneity is maintained, is increased to capture the localchain homogeneity. However, when the object-based intensity
falls below 0.01 (i.e., ), both and are set to zero,to avoid merging of different objects with similar intensity ho-mogeneity.
C. The DyW Algorithm
Starting with a small (5 5 pixels) sample region of the seg-mentation target as a seed, we compute , and the fourpairs , , ,and , which correspond to the four differentcompass directions. We then follow the dynamic program-ming-based algorithm for the extraction of the -connectednessscene as presented by Udupa and Samarasekera [1].In order to objectively compute the best possible thresholdlevel for segmentation, we use Otsu’s automatic thresholdingmethod [13]. This process is entirely objective and void of anyuser interaction or manipulation.
V. RESULTS AND DISCUSSION
In this section, we present the performance of our DyW imagesegmentation method. First, we present the results of image seg-mentation using the DyW algorithm on a phantom data set toevaluate its robustness and accuracy. Then, we present the com-parison of DyW with two different formulations of fuzzy con-nectedness, as the arithmetic (EqW) or geometric (Sqrt) meanof its affinity components and . In particular, the EqW andSqrt fuzzy connectedness similitudes are defined using the fol-lowing fuzzy affinity formulations: ,and , respectively. Finally, we present the results
PEDNEKAR AND KAKADIARIS: IMAGE SEGMENTATION BASED ON FUZZY CONNECTEDNESS USING DYNAMIC WEIGHTS 1559
of applying DyW on actual MR, infrared, and computed tomog-raphy (CT) data.
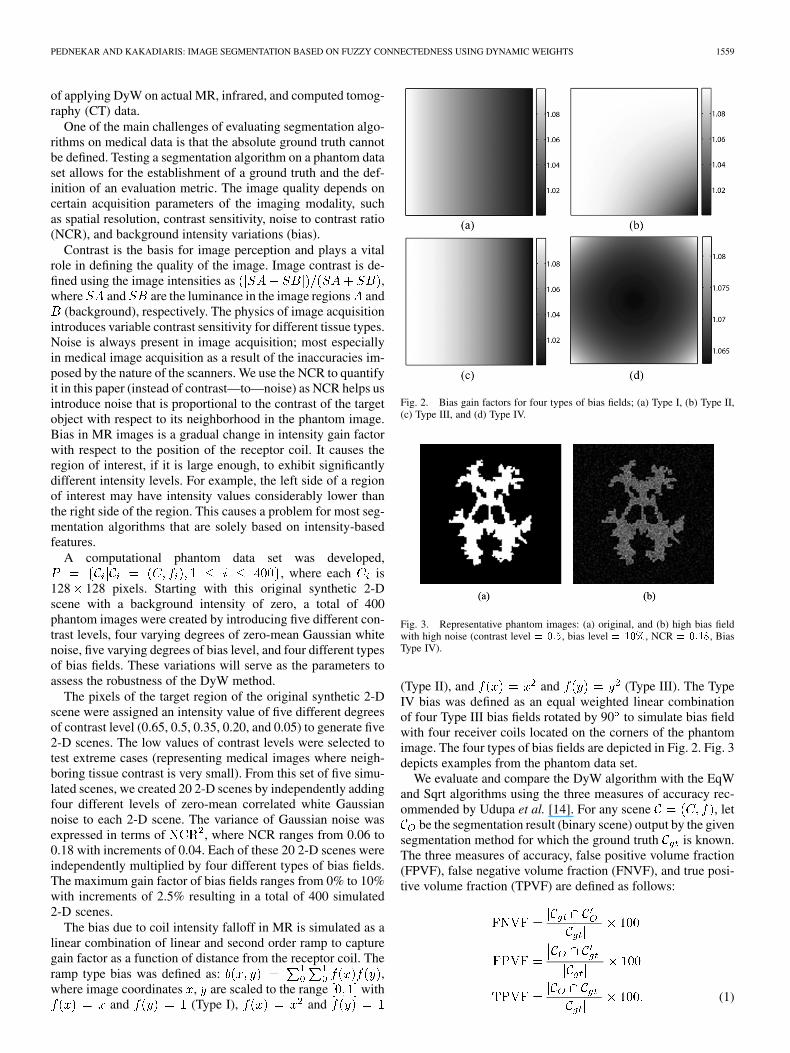
One of the main challenges of evaluating segmentation algo-rithms on medical data is that the absolute ground truth cannotbe defined. Testing a segmentation algorithm on a phantom dataset allows for the establishment of a ground truth and the def-inition of an evaluation metric. The image quality depends oncertain acquisition parameters of the imaging modality, suchas spatial resolution, contrast sensitivity, noise to contrast ratio(NCR), and background intensity variations (bias).
Contrast is the basis for image perception and plays a vitalrole in defining the quality of the image. Image contrast is de-fined using the image intensities as ,where and are the luminance in the image regions and
(background), respectively. The physics of image acquisitionintroduces variable contrast sensitivity for different tissue types.Noise is always present in image acquisition; most especiallyin medical image acquisition as a result of the inaccuracies im-posed by the nature of the scanners. We use the NCR to quantifyit in this paper (instead of contrast—to—noise) as NCR helps usintroduce noise that is proportional to the contrast of the targetobject with respect to its neighborhood in the phantom image.Bias in MR images is a gradual change in intensity gain factorwith respect to the position of the receptor coil. It causes theregion of interest, if it is large enough, to exhibit significantlydifferent intensity levels. For example, the left side of a regionof interest may have intensity values considerably lower thanthe right side of the region. This causes a problem for most seg-mentation algorithms that are solely based on intensity-basedfeatures.
A computational phantom data set was developed,, where each is
128 128 pixels. Starting with this original synthetic 2-Dscene with a background intensity of zero, a total of 400phantom images were created by introducing five different con-trast levels, four varying degrees of zero-mean Gaussian whitenoise, five varying degrees of bias level, and four different typesof bias fields. These variations will serve as the parameters toassess the robustness of the DyW method.
The pixels of the target region of the original synthetic 2-Dscene were assigned an intensity value of five different degreesof contrast level (0.65, 0.5, 0.35, 0.20, and 0.05) to generate five2-D scenes. The low values of contrast levels were selected totest extreme cases (representing medical images where neigh-boring tissue contrast is very small). From this set of five simu-lated scenes, we created 20 2-D scenes by independently addingfour different levels of zero-mean correlated white Gaussiannoise to each 2-D scene. The variance of Gaussian noise wasexpressed in terms of , where NCR ranges from 0.06 to0.18 with increments of 0.04. Each of these 20 2-D scenes wereindependently multiplied by four different types of bias fields.The maximum gain factor of bias fields ranges from 0% to 10%with increments of 2.5% resulting in a total of 400 simulated2-D scenes.
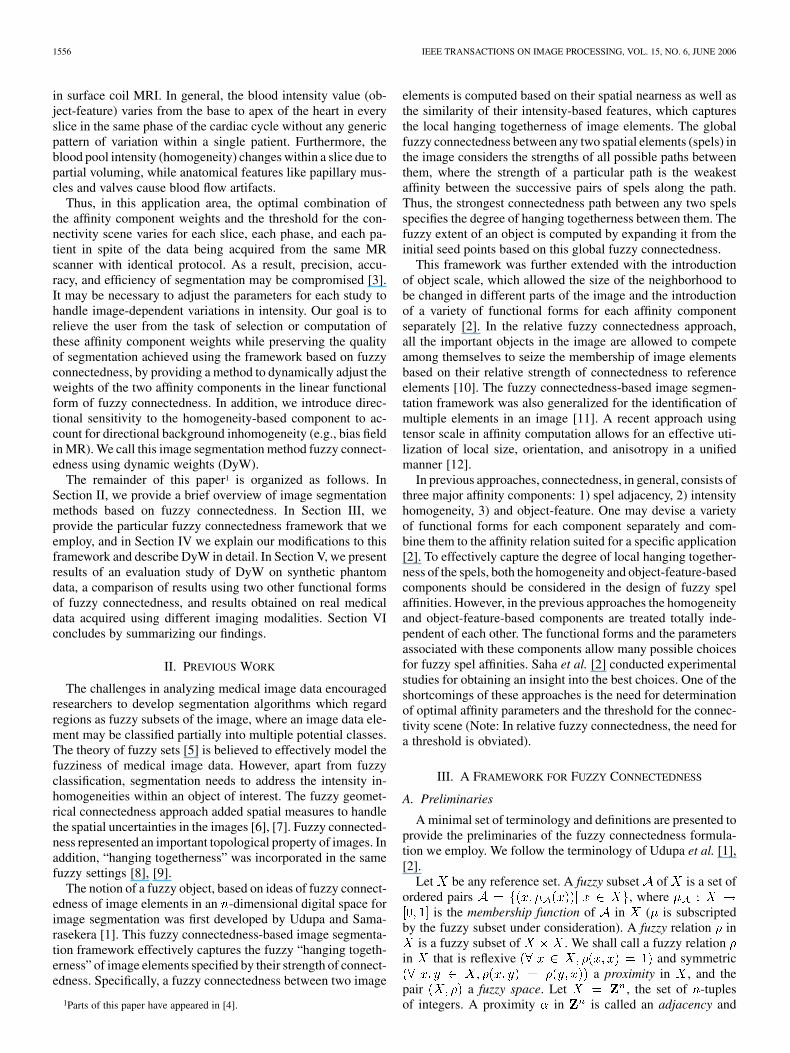
The bias due to coil intensity falloff in MR is simulated as alinear combination of linear and second order ramp to capturegain factor as a function of distance from the receptor coil. Theramp type bias was defined as: ,where image coordinates , are scaled to the range with
and (Type I), and
Fig. 2. Bias gain factors for four types of bias fields; (a) Type I, (b) Type II,(c) Type III, and (d) Type IV.
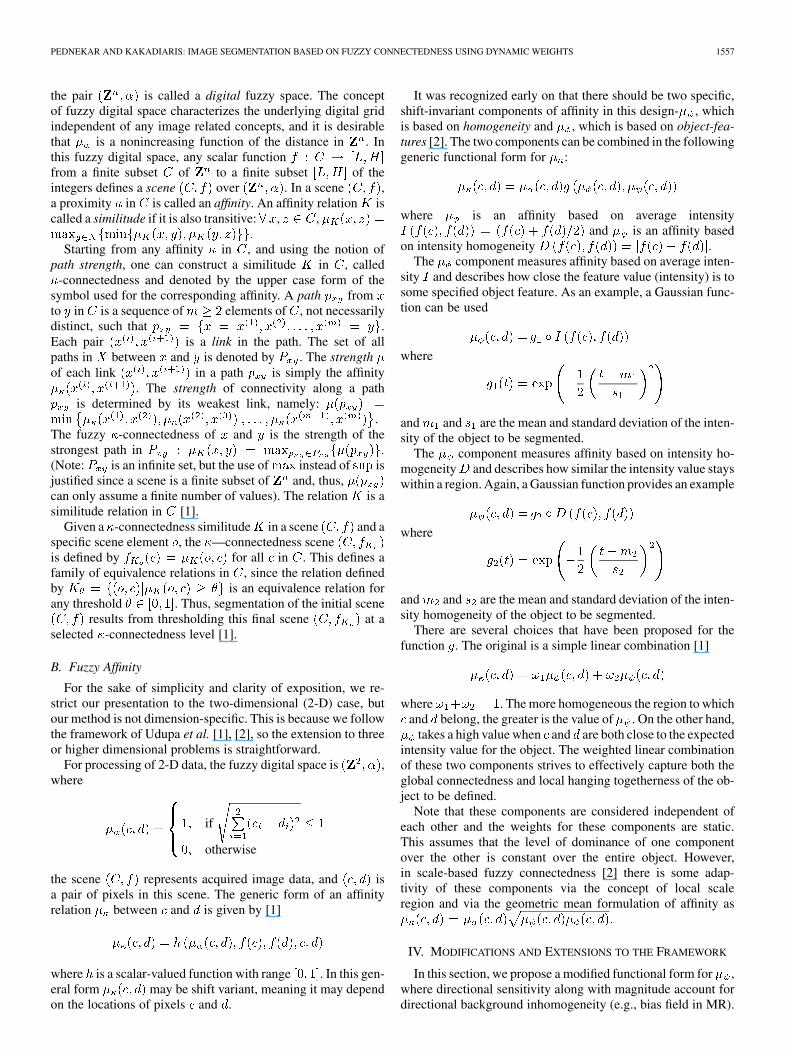
Fig. 3. Representative phantom images: (a) original, and (b) high bias fieldwith high noise (contrast level = 0:5, bias level = 10%, NCR = 0:18, BiasType IV).
(Type II), and and (Type III). The TypeIV bias was defined as an equal weighted linear combinationof four Type III bias fields rotated by 90 to simulate bias fieldwith four receiver coils located on the corners of the phantomimage. The four types of bias fields are depicted in Fig. 2. Fig. 3depicts examples from the phantom data set.
We evaluate and compare the DyW algorithm with the EqWand Sqrt algorithms using the three measures of accuracy rec-ommended by Udupa et al. [14]. For any scene , let
be the segmentation result (binary scene) output by the givensegmentation method for which the ground truth is known.The three measures of accuracy, false positive volume fraction(FPVF), false negative volume fraction (FNVF), and true posi-tive volume fraction (TPVF) are defined as follows:
(1)
1560 IEEE TRANSACTIONS ON IMAGE PROCESSING, VOL. 15, NO. 6, JUNE 2006
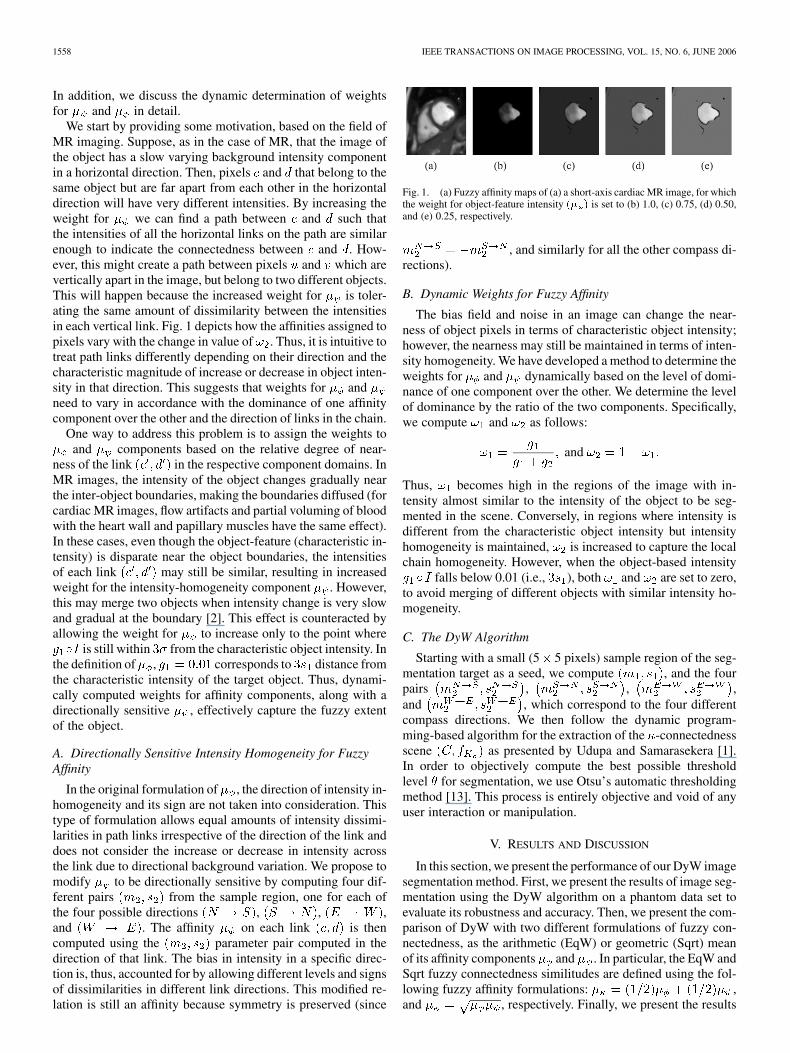
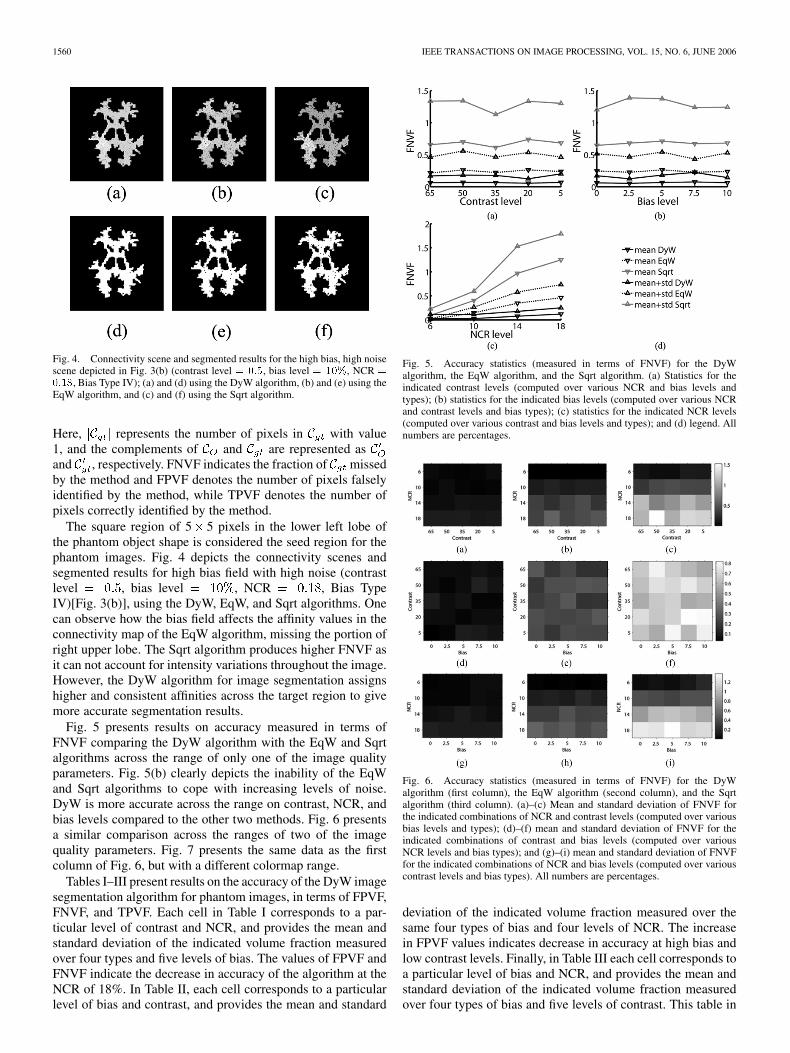
Fig. 4. Connectivity scene and segmented results for the high bias, high noisescene depicted in Fig. 3(b) (contrast level = 0:5, bias level = 10%, NCR =
0:18, Bias Type IV); (a) and (d) using the DyW algorithm, (b) and (e) using theEqW algorithm, and (c) and (f) using the Sqrt algorithm.
Here, represents the number of pixels in with value1, and the complements of and are represented asand , respectively. FNVF indicates the fraction of missedby the method and FPVF denotes the number of pixels falselyidentified by the method, while TPVF denotes the number ofpixels correctly identified by the method.
The square region of 5 5 pixels in the lower left lobe ofthe phantom object shape is considered the seed region for thephantom images. Fig. 4 depicts the connectivity scenes andsegmented results for high bias field with high noise (contrastlevel , bias level , NCR , Bias TypeIV)[Fig. 3(b)], using the DyW, EqW, and Sqrt algorithms. Onecan observe how the bias field affects the affinity values in theconnectivity map of the EqW algorithm, missing the portion ofright upper lobe. The Sqrt algorithm produces higher FNVF asit can not account for intensity variations throughout the image.However, the DyW algorithm for image segmentation assignshigher and consistent affinities across the target region to givemore accurate segmentation results.
Fig. 5 presents results on accuracy measured in terms ofFNVF comparing the DyW algorithm with the EqW and Sqrtalgorithms across the range of only one of the image qualityparameters. Fig. 5(b) clearly depicts the inability of the EqWand Sqrt algorithms to cope with increasing levels of noise.DyW is more accurate across the range on contrast, NCR, andbias levels compared to the other two methods. Fig. 6 presentsa similar comparison across the ranges of two of the imagequality parameters. Fig. 7 presents the same data as the firstcolumn of Fig. 6, but with a different colormap range.
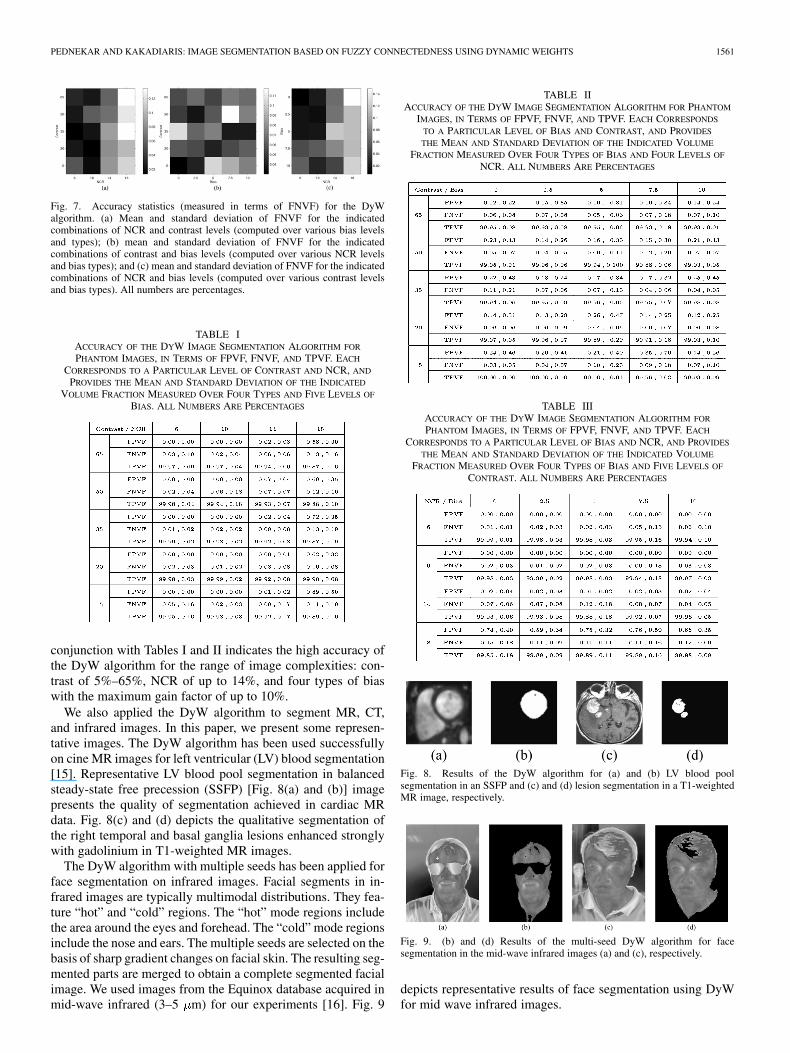
Tables I–III present results on the accuracy of the DyW imagesegmentation algorithm for phantom images, in terms of FPVF,FNVF, and TPVF. Each cell in Table I corresponds to a par-ticular level of contrast and NCR, and provides the mean andstandard deviation of the indicated volume fraction measuredover four types and five levels of bias. The values of FPVF andFNVF indicate the decrease in accuracy of the algorithm at theNCR of 18%. In Table II, each cell corresponds to a particularlevel of bias and contrast, and provides the mean and standard
Fig. 5. Accuracy statistics (measured in terms of FNVF) for the DyWalgorithm, the EqW algorithm, and the Sqrt algorithm. (a) Statistics for theindicated contrast levels (computed over various NCR and bias levels andtypes); (b) statistics for the indicated bias levels (computed over various NCRand contrast levels and bias types); (c) statistics for the indicated NCR levels(computed over various contrast and bias levels and types); and (d) legend. Allnumbers are percentages.
Fig. 6. Accuracy statistics (measured in terms of FNVF) for the DyWalgorithm (first column), the EqW algorithm (second column), and the Sqrtalgorithm (third column). (a)–(c) Mean and standard deviation of FNVF forthe indicated combinations of NCR and contrast levels (computed over variousbias levels and types); (d)–(f) mean and standard deviation of FNVF for theindicated combinations of contrast and bias levels (computed over variousNCR levels and bias types); and (g)–(i) mean and standard deviation of FNVFfor the indicated combinations of NCR and bias levels (computed over variouscontrast levels and bias types). All numbers are percentages.
deviation of the indicated volume fraction measured over thesame four types of bias and four levels of NCR. The increasein FPVF values indicates decrease in accuracy at high bias andlow contrast levels. Finally, in Table III each cell corresponds toa particular level of bias and NCR, and provides the mean andstandard deviation of the indicated volume fraction measuredover four types of bias and five levels of contrast. This table in
PEDNEKAR AND KAKADIARIS: IMAGE SEGMENTATION BASED ON FUZZY CONNECTEDNESS USING DYNAMIC WEIGHTS 1561
Fig. 7. Accuracy statistics (measured in terms of FNVF) for the DyWalgorithm. (a) Mean and standard deviation of FNVF for the indicatedcombinations of NCR and contrast levels (computed over various bias levelsand types); (b) mean and standard deviation of FNVF for the indicatedcombinations of contrast and bias levels (computed over various NCR levelsand bias types); and (c) mean and standard deviation of FNVF for the indicatedcombinations of NCR and bias levels (computed over various contrast levelsand bias types). All numbers are percentages.
TABLE IACCURACY OF THE DYW IMAGE SEGMENTATION ALGORITHM FOR
PHANTOM IMAGES, IN TERMS OF FPVF, FNVF, AND TPVF. EACH
CORRESPONDS TO A PARTICULAR LEVEL OF CONTRAST AND NCR, AND
PROVIDES THE MEAN AND STANDARD DEVIATION OF THE INDICATED
VOLUME FRACTION MEASURED OVER FOUR TYPES AND FIVE LEVELS OF
BIAS. ALL NUMBERS ARE PERCENTAGES
conjunction with Tables I and II indicates the high accuracy ofthe DyW algorithm for the range of image complexities: con-trast of 5%–65%, NCR of up to 14%, and four types of biaswith the maximum gain factor of up to 10%.
We also applied the DyW algorithm to segment MR, CT,and infrared images. In this paper, we present some represen-tative images. The DyW algorithm has been used successfullyon cine MR images for left ventricular (LV) blood segmentation[15]. Representative LV blood pool segmentation in balancedsteady-state free precession (SSFP) [Fig. 8(a) and (b)] imagepresents the quality of segmentation achieved in cardiac MRdata. Fig. 8(c) and (d) depicts the qualitative segmentation ofthe right temporal and basal ganglia lesions enhanced stronglywith gadolinium in T1-weighted MR images.
The DyW algorithm with multiple seeds has been applied forface segmentation on infrared images. Facial segments in in-frared images are typically multimodal distributions. They fea-ture “hot” and “cold” regions. The “hot” mode regions includethe area around the eyes and forehead. The “cold” mode regionsinclude the nose and ears. The multiple seeds are selected on thebasis of sharp gradient changes on facial skin. The resulting seg-mented parts are merged to obtain a complete segmented facialimage. We used images from the Equinox database acquired inmid-wave infrared (3–5 m) for our experiments [16]. Fig. 9
TABLE IIACCURACY OF THE DYW IMAGE SEGMENTATION ALGORITHM FOR PHANTOM
IMAGES, IN TERMS OF FPVF, FNVF, AND TPVF. EACH CORRESPONDS
TO A PARTICULAR LEVEL OF BIAS AND CONTRAST, AND PROVIDES
THE MEAN AND STANDARD DEVIATION OF THE INDICATED VOLUME
FRACTION MEASURED OVER FOUR TYPES OF BIAS AND FOUR LEVELS OF
NCR. ALL NUMBERS ARE PERCENTAGES
TABLE IIIACCURACY OF THE DYW IMAGE SEGMENTATION ALGORITHM FOR
PHANTOM IMAGES, IN TERMS OF FPVF, FNVF, AND TPVF. EACH
CORRESPONDS TO A PARTICULAR LEVEL OF BIAS AND NCR, AND PROVIDES
THE MEAN AND STANDARD DEVIATION OF THE INDICATED VOLUME
FRACTION MEASURED OVER FOUR TYPES OF BIAS AND FIVE LEVELS OF
CONTRAST. ALL NUMBERS ARE PERCENTAGES
Fig. 8. Results of the DyW algorithm for (a) and (b) LV blood poolsegmentation in an SSFP and (c) and (d) lesion segmentation in a T1-weightedMR image, respectively.
Fig. 9. (b) and (d) Results of the multi-seed DyW algorithm for facesegmentation in the mid-wave infrared images (a) and (c), respectively.
depicts representative results of face segmentation using DyWfor mid wave infrared images.
1562 IEEE TRANSACTIONS ON IMAGE PROCESSING, VOL. 15, NO. 6, JUNE 2006
VI. CONCLUSION
In this paper we have presented a modification and extensionof previously published image segmentation algorithms basedon fuzzy connectedness, which is computed as a linear com-bination of an object-feature-based and a homogeneity-basedcomponent using fixed weights. Our DyW algorithm introducesdirectional sensitivity to the homogeneity-based component anddynamically adjusts the linear weights in the functional form offuzzy connectedness.
Various other enhancements of the fuzzy connectednessframework exist. They include attempts in the directions of 1)the adaptivity of affinity components, and 2) obviating the needfor thresholding (relative fuzzy connectedness). However, themain contribution of this paper is to the very basic (linear com-bination of components) formulation of fuzzy connectedness,in terms of adding directional sensitivity to the homogeneitycomponent and a dynamic adjustment of the weights of theaffinity components. Dynamic computation of the weights andautomatic computation of a threshold relieves the user of anexhaustive search process. This is very critical in applicationssuch as analysis of cardiac cine MR images, where optimalcombination of affinity component weights varies for eachslice, each phase, and each subject in spite of data being ac-quired from the same MR scanner with identical protocol. Theintention of this paper is to show that significant improvementscan be achieved even in this basic form with our modifications.These modifications, being at the lower level, can be combinedwith more sophisticated fuzzy connectedness methods, suchas the vectorial-scale-based fuzzy connectedness, which mayfurther improve the segmentation performance. Using the basicform allows us to evaluate the improvements that are dueexclusively to our modifications.
The single seed DyW algorithm has been applied success-fully to images acquired with different modalities and exhibitsaccuracy of segmentation within the range of inter and intra-ob-server variations and a multiple seed approach has been used ef-fectively in infrared face segmentation. Other methods exist thathandle the two components of affinity in an adaptive manner,such as Sqrt, however, DyW is more effective in terms of accu-racy of segmentation. The DyW image segmentation algorithmconsistently achieves accuracy of more than 99.15% for a rangeof image complexities: contrast 5%–65%, NCR of 6% to 18%and bias field of different types with the maximum gain factorup to 10%.
ACKNOWLEDGMENT
The authors would like to thank the anonymous reviewersand the Associate Editor who provided valuable comments andsuggestions to enhance this paper. Any opinions, findings, andconclusions or recommendations expressed in this material arethose of the authors and do not necessarily reflect the views ofthe NSF.
REFERENCES
[1] J. Udupa and S. Samarasekera, “Fuzzy connectedness and object def-inition: Theory, algorithms, and applications in image segmentation,”Graphical Models Image Process., vol. 58, no. 3, pp. 246–261, 1996.
[2] P. Saha, J. Udupa, and D. Odhner, “Scale-based fuzzy connected imagesegmentation: Theory, algorithms, and validation,” Comput. Vis. ImageUnderstanding, vol. 77, pp. 145–174, Apr. 2000.
[3] J. Udupa, L. Nyul, Y. Ge, and R. Grossman, “Multiprotocol MR imagesegmentation in multiple sclerosis: Experience with over 1,000 studies,”Academic Radiol., vol. 8, no. 11, pp. 1116–1126, Nov. 2001.
[4] A. S. Pednekar, I. A. Kakadiaris, and U. Kurkure, “Adaptive fuzzy con-nectedness-based medical image segmentation,” in Proc. Indian Conf.Computer Vision, Graphics, and Image Processing (ICVGIP), Ahmed-abad, India, Dec. 2002, pp. 457–462.
[5] L. A. Zadeh, “Fuzzy sets,” Inf. Control, vol. 8, no. 3, pp. 338–353, 1965.[6] A. Rosenfeld, “Fuzzy digital topology,” Inf. Control, vol. 40, no. 1, pp.
76–87, Jan. 1979.[7] , “On connectivity properties of grayscale pictures,” Pattern
Recognit., vol. 16, no. 1, pp. 47–50, 1983.[8] I. Bloch, “Fuzzy connectivity and mathematical morphology,” Pattern
Recognit. Lett., vol. 14, no. 6, pp. 483–488, 1993.[9] S. Dellepiane and F. Fontana, “Extraction of intensity connectedness for
image processing,” Pattern Recognit. Lett., vol. 16, pp. 313–324, 1995.[10] P. Saha and J. Udupa, “Relative fuzzy connectedness among multiple
objects: Theory, algorithms, and applications in image segmentation,”Comput. Vis. Image Understanding, vol. 82, pp. 42–56, 2000.
[11] , “Fuzzy connected object delineation: Axiomatic path strength def-inition and the case of mulitiple seeds,” Comput. Vis. Image Under-standing, vol. 83, pp. 275–295, 2001.
[12] , “Tensor scale-based fuzzy connectedness image segmentation,”Proc. SPIE (Medical Imaging: Image Processing), vol. 5032, pp.1580–1590, 2003.
[13] N. Otsu, “A threshold selection method from gray-level histograms,”IEEE Trans. Syst., Man, Cybern., vol. 9, no. 1, pp. 62–66, Jan. 1979.
[14] J. Udupa, V. LaBlanc, H. Schmidt, C. Imielinska, P. Saha, G. Grevera, Y.Zhuge, L. Currie, P. Molholt, and Y. Jin, “Methodology for evaluatingimage segmentation algorithms,” Proc. SPIE (Medical Imaging), vol.4684, no. 1, pp. 266–277, 2002.
[15] A. Pednekar, I. Kakadiaris, U. Kurkure, R. Muthupillai, and S.Flamm, “Validation of automatic computation of ejection fraction,” inProc. Medical Image Computing and Computer-Assisted Intervention(MICCAI), Nov. 2003, pp. 987–987.
[16] P. Buddharaju, I. Pavlidis, and I. Kakadiaris, “Face recognition in thethermal infrared spectrum,” in Proc. Joint IEEE Int. Workshop on ObjectTracking and Classification Beyond the Visible Spectrum, Washington,DC, Jun. 2004.
Amol S. Pednekar was born in Mumbai, India, on March 6, 1975. He re-ceived the B.Engg. degree from Victoria Jubilee Technical Institute, Universityof Mumbai, in 1996. He received the Ph.D. degree in computer science fromUniversity of Houston, Houston, TX, in 2003.
From June 2004 to October 2005, he was a Radiology Research Specialistwith Cardiovascular MRI research group at St. Luke’s Episcopal Hospital andTexas Heart Institute. Since November 2006, he has been a MR Clinical Scien-tist with Philips Medical Systems North America. His research interests are incardiac magnetic resonance imaging and analysis. These include work on imageprocessing, and cardiac segmentation and motion analysis.
Ioannis A. Kakadiaris received the Ptychion (B.Sc.) degree in physics from theUniversity of Athens, Athens, Greece, in 1989, the M.Sc. in computer sciencefrom Northeastern University, Boston, MA, in 2001, and the Ph.D. in computerscience from University of Pennsylvania, Philadelphia, PA, in 2007.
He joined the University of Houston in August 1997 after completing aPostdoctoral Fellowship at the University of Pennsylvania. He is the Directorof the Division of Bio-Imaging and Bio-Computation at the University ofHouston (UH), Houston, TX, Institute for Digital Informatics and Analysis andthe founder and Co-Director of UH’s Computational Biomedicine Laboratory.His research interests include biomedical image analysis, modeling and sim-ulation, computational biomedicine, biometrics, computer vision and patternrecognition.
Dr. Kakadiaris is the recipient of the year 2000 NSF Early Career Develop-ment Award, UH Computer Science Research Excellence Award, UH EnronTeaching Excellence Award, James Muller VP Young Investigator Prize, andthe Schlumberger Technical Foundation Award.
Related Documents


