Image reconstruction in photoacoustic tomography involving layered acoustic media Robert W. Schoonover 1,2,* and Mark A. Anastasio 2 1 Pritzker Institute of Biomedical Science and Engineering, Medical Imaging Research Center, Illinois Institute of Technology, Chicago, Illinois, USA 2 Department of Biomedical Engineering, Washington University in St. Louis, St. Louis, Missouri, USA Abstract Photoacoustic tomography (PAT), also known as thermoacoustic or optoacoustic tomography, is a rapidly emerging biomedical imaging technique that combines optical image contrast with ultrasound detection principles. Most existing reconstruction algorithms for PAT assume the object of interest possesses homogeneous acoustic properties. The images produced by such algorithms can contain significant distortions and artifacts when the object’s acoustic properties are spatially variant. In this work, we establish an image reconstruction formula for PAT applications in which a planar detection surface is employed and the to-be-imaged optical absorber is embedded in a known planar layered acoustic medium. The reconstruction formula is exact in a mathematical sense and accounts for multiple acoustic reflections between the layers of the medium. Computer-simulation studies are conducted to demonstrate and investigate the proposed method. 1. INTRODUCTION Photoacoustic tomography (PAT), also known as thermoacoustic or optoacoustic tomography, is a rapidly emerging imaging technique that holds great promise for biomedical applications [1–4]. PAT is a hybrid technique that exploits the high optical contrast of tissue with the high spatial resolution of ultrasonic methods. The goal of PAT is to determine an estimate of an object’s spatially variant absorbed optical energy density from measurements of pressure wave fields that are induced via the thermoacoustic effect [2]. Because the optical absorption characteristics of tissue vary strongly with hemoglobin content, knowledge of the absorbed optical energy distribution can yield both structural and functional information. Accordingly, PAT may facilitate a variety of important human and animal imaging studies and is being developed actively by numerous research groups worldwide [2,3,5–10]. When a short laser pulse is used to irradiate biological tissue, the thermoacoustic effect results in the emission of acoustic pressure signals that can be measured outside the object by use of wideband ultrasonic transducers. The PAT image reconstruction problem can be interpreted as an acoustic inverse source problem [11], and a variety of analytic image reconstruction algorithms have been developed for three-dimensional (3D) PAT assuming canonical measurement apertures [2,12–18]. Most existing PAT image reconstruction © 2011 Optical Society of America * Corresponding author: [email protected]. OCIS codes: 110.5120, 110.3010. NIH Public Access Author Manuscript J Opt Soc Am A Opt Image Sci Vis. Author manuscript; available in PMC 2012 February 7. Published in final edited form as: J Opt Soc Am A Opt Image Sci Vis. 2011 June 1; 28(6): 1114–1120. NIH-PA Author Manuscript NIH-PA Author Manuscript NIH-PA Author Manuscript

Welcome message from author
This document is posted to help you gain knowledge. Please leave a comment to let me know what you think about it! Share it to your friends and learn new things together.
Transcript
Image reconstruction in photoacoustic tomography involvinglayered acoustic media
Robert W. Schoonover1,2,* and Mark A. Anastasio2
1Pritzker Institute of Biomedical Science and Engineering, Medical Imaging Research Center,Illinois Institute of Technology, Chicago, Illinois, USA2Department of Biomedical Engineering, Washington University in St. Louis, St. Louis, Missouri,USA
AbstractPhotoacoustic tomography (PAT), also known as thermoacoustic or optoacoustic tomography, is arapidly emerging biomedical imaging technique that combines optical image contrast withultrasound detection principles. Most existing reconstruction algorithms for PAT assume theobject of interest possesses homogeneous acoustic properties. The images produced by suchalgorithms can contain significant distortions and artifacts when the object’s acoustic propertiesare spatially variant. In this work, we establish an image reconstruction formula for PATapplications in which a planar detection surface is employed and the to-be-imaged optical absorberis embedded in a known planar layered acoustic medium. The reconstruction formula is exact in amathematical sense and accounts for multiple acoustic reflections between the layers of themedium. Computer-simulation studies are conducted to demonstrate and investigate the proposedmethod.
1. INTRODUCTIONPhotoacoustic tomography (PAT), also known as thermoacoustic or optoacoustictomography, is a rapidly emerging imaging technique that holds great promise forbiomedical applications [1–4]. PAT is a hybrid technique that exploits the high opticalcontrast of tissue with the high spatial resolution of ultrasonic methods. The goal of PAT isto determine an estimate of an object’s spatially variant absorbed optical energy densityfrom measurements of pressure wave fields that are induced via the thermoacoustic effect[2]. Because the optical absorption characteristics of tissue vary strongly with hemoglobincontent, knowledge of the absorbed optical energy distribution can yield both structural andfunctional information. Accordingly, PAT may facilitate a variety of important human andanimal imaging studies and is being developed actively by numerous research groupsworldwide [2,3,5–10].
When a short laser pulse is used to irradiate biological tissue, the thermoacoustic effectresults in the emission of acoustic pressure signals that can be measured outside the objectby use of wideband ultrasonic transducers. The PAT image reconstruction problem can beinterpreted as an acoustic inverse source problem [11], and a variety of analytic imagereconstruction algorithms have been developed for three-dimensional (3D) PAT assumingcanonical measurement apertures [2,12–18]. Most existing PAT image reconstruction
© 2011 Optical Society of America*Corresponding author: [email protected] codes: 110.5120, 110.3010.
NIH Public AccessAuthor ManuscriptJ Opt Soc Am A Opt Image Sci Vis. Author manuscript; available in PMC 2012 February 7.
Published in final edited form as:J Opt Soc Am A Opt Image Sci Vis. 2011 June 1; 28(6): 1114–1120.
NIH
-PA Author Manuscript
NIH
-PA Author Manuscript
NIH
-PA Author Manuscript
algorithms assume the object of interest possesses homogeneous acoustic properties.However, the images produced by such algorithms can contain significant distortions andartifacts when the object’s speed-of-sound and density distributions are spatially variant[19,20]. The development of PAT image reconstruction algorithms that can compensate forvariations in the acoustical properties of an object remains an important area of currentresearch [21–26].
In this work, we develop a PAT reconstruction formula for applications in which a planardetection surface is employed, and the to-be-imaged optical absorber is embedded in aplanar-layered acoustic medium. The speed of sound, density, thickness of each layer, andnumber of layers are assumed to be known, and the illuminated optical absorber is assumedto be confined to only one layer. The reconstruction formula is exact in a mathematicalsense and accounts for multiple reflections of the induced photoacoustic wave field betweenthe layers of the medium. The formula establishes a mapping that relates the 3D Fouriercomponents of the sought-after optical energy density distribution to those of the measuredpressure data that correspond to propagating wave modes. In the special case of an objectwith homogeneous speed-of-sound and density distributions, the reconstruction formulareduces to a previously published one [16] when the number of layers is set to one.Computer-simulation studies are conducted to demonstrate and investigate the proposedmethod.
2. BACKGROUND: STANDARD FORMULATION OF PAT WITH A PLANARMEASUREMENT APERTURE
The standard imaging model for PAT is derived from the acoustic wave equation in eitherthe space–time or space–frequency domain. The space–frequency domain representation p̃(r, ω) of the acoustic field is related to the space–time representation p(r, t) by a Fouriertransform, viz.
(1)
where ω is the temporal frequency coordinate and r = (x, y, z).
In PAT applications, the acoustic field obeys an inhomogeneous Helmholtz equation:
(2)
where k(r) = ω/c(r) is the spatially varying wavenumber, c(r) is the local speed of sound, βis the thermal expansion coefficient, CP is the specific heat capacity (at constant pressure),A(r) is the absorbed optical energy density, and H(ω) describes the spectral content of theexciting optical or microwave pulse. We will let A(x, y, z) denote A(r) expressed explicitlyin Cartesian coordinates. The pressure field away from the acoustic source can be expressedas
(3)
where G(r, r′, ω) is an appropriate Green function [27] and V denotes the support volume ofA(r). Equation (3) represents an imaging model for PAT expressed in the temporal
Schoonover and Anastasio Page 2
J Opt Soc Am A Opt Image Sci Vis. Author manuscript; available in PMC 2012 February 7.
NIH
-PA Author Manuscript
NIH
-PA Author Manuscript
NIH
-PA Author Manuscript
frequency domain. For homogenous acoustic media, . In general, the Greenfunction can only be found analytically when the speed-of-sound map possesses certainsymmetries. Otherwise, numerical methods must be employed to approximate the Greenfunction needed to specify the imaging model in Eq. (3).
The solution to the inverse problem for PAT, i.e., the estimation of A(r) based on knowledgeof p̃(r, ω) and H(ω), is based on Eq. (3) but also incorporates information about themeasurement geometry. In the case where the medium is acoustically homogeneous with thespeed of sound c and the measurement aperture corresponds to a plane, taken to be z = 0without loss of generality, a Fourier-transform-based solution to the inverse problem hasbeen established [16,17]. Let p̄(kx, ky, ω) denote the two-dimensional (2D) spatial Fouriertransform of the pressure data p̃(x, y, z, ω) evaluated on the measurement plane z = 0:
(4)
Similarly, let (kx, ky, kz) denote the 3D Fourier transform of A(x, y, z):
(5)
It has been demonstrated [16] that the values of (kx, ky, kz) that reside within a sphere ofradius centered at the origin of 3D Fourier space can be determined from the measuredpressure data as
(6)
where effects related to the transducer response have been suppressed. One notes that the kzcoordinate of (kx, ky, kz) is found via a nonlinear mapping of kx, ky, and ω. Fromknowledge of the estimated Fourier components, a low-pass-filtered estimate of A(r) can bedetermined by use of the 3D inverse Fourier transform [28]. In Section 3 a generalization ofEq. (6) is established for the case where the optical absorber described by A(r) is embeddedin a stratified planar acoustic medium. The effects of the finite size of the detector and thefinite length of the excitation pulse can be readily included in the reconstruction algorithmas described in [16].
3. PAT RECONSTRUCTION FORMULA FOR LAYERED ACOUSTIC MEDIAMany PAT reconstruction methods developed to date are predicated on the assumption thatthe medium surrounding the source is acoustically homogenous. Below we develop areconstruction formula for PAT employing a planar measurement aperture for the case of aninhomogeneous layered acoustic medium. The optical absorber described by A(r) isassumed to be confined to only one layer. The speed-of-sound and density values of themedium within each layer are assumed to be constant but can be different in each layer. Theplanar boundaries of the layers are assumed to be parallel to the measurement plane z = 0.The solution strategy comprises two steps: (1) determine the Green function for the statedlayered medium, thereby specifying the imaging model in Eq. (3), and (2) invert theresulting imaging model to obtain a Fourier-based inversion formula.
Schoonover and Anastasio Page 3
J Opt Soc Am A Opt Image Sci Vis. Author manuscript; available in PMC 2012 February 7.
NIH
-PA Author Manuscript
NIH
-PA Author Manuscript
NIH
-PA Author Manuscript
A. Green Function for Layered Acoustic MediaConsider a medium whose local speed of sound and density are functions of only one spatialvariable, z, and the variation takes the form of discontinuous jumps at specific values of z.Specifically, as depicted in Fig. 1, the speed of sound c(r) and density ρ(r) distributions aredefined as
(7a)
(7b)
where the index m = 0, 1, …, N indicates the layer in the medium, ρm and cm denote thevalues of ρ(r) and c(r) within the mth layer, and the planes z = zm and z = zm−1 bound themth layer.
Time domain solutions for the photoacoustic field induced in such a medium arecomplicated, and solutions are more tractable in the frequency domain. In the frequencydomain, the pressure field in the layered medium satisfies the Helmholtz equation:
(8)
where km = ω/cm. Note that the analysis that follows can be extended to compensate foracoustic wave field dispersion and frequency-dependent absorption [29] by consideration ofan appropriately defined complex-valued km. The acoustic field must also obey thefollowing boundary conditions:
(9)
(10)
The Green function for a homogeneous medium, where c(r) = c and ρ(r) = ρ, satisfies theequation
(11)
where δ(r) is the 3D Dirac delta function and has a well-known angular spectrumrepresentation [30]:
(12)
Here k|| is a 3D vector with units of inverse length and of the form [kx, ky, 0]T, d2k|| = dkxdky,
, and k = ω/c is the wavenumber for the medium.
The Green function for the layered medium defined by Eq. (7) may be found through anumber of methods, including modal analysis [27]. In this method, the Green function is
Schoonover and Anastasio Page 4
J Opt Soc Am A Opt Image Sci Vis. Author manuscript; available in PMC 2012 February 7.
NIH
-PA Author Manuscript
NIH
-PA Author Manuscript
NIH
-PA Author Manuscript
generally expressed as a summation over expansion functions. For the case of the layeredmedium, the expansion functions in each layer will be the plane-wave functions.
Consider that the photoacoustic source described by A(r) is confined to layer m = P in themedium. The associated Green function will be denoted as GP(r, r′; ω) and by definitionsatisfies
(13)
(14)
The angular spectrum representation of GP(r, r′; ω) takes the form
(15)
where δmn is the Kronecker delta function and . The quantities am(k||) andbm(k||) are layer-dependent coefficients that can be interpreted as plane-wave amplitudesassociated with the forward and backward travelling field components in each layer. Notethat the third quantity in the integrand of Eq. (15) describes the unscattered field within layerP produced by a point source at location r′ within that layer [e.g., see Eq. (12)].
In order to specify GP(r, r′; ω) the unknown quantities am(k||) and bm(k||) must bedetermined. This can be accomplished by forcing GP(r, r′; ω) to satisfy the boundaryconditions described by Eqs. (9) and (10) at each interface z = zm. By use of Eqs. (9), (10),and (15), a system of 2N − 2 linear equations containing the 2N − 2 unknowns {a1, a2, · · ·aN−1} and {b2, b3, · · · bN } can be established. These equations are of the form
(16)
(17)
where the dependence on k|| has been suppressed in the functions am(k||), bm(k||), and kz(k||),
(18)
(19)
and dm are the distances between successive layers (dm = zm−1 − zm). Note that the abovelinear system must be solved for every temporal frequency, ω, and every spatial frequency,k||, of interest.
Schoonover and Anastasio Page 5
J Opt Soc Am A Opt Image Sci Vis. Author manuscript; available in PMC 2012 February 7.
NIH
-PA Author Manuscript
NIH
-PA Author Manuscript
NIH
-PA Author Manuscript
The system of equations described above can be represented as M · g⃗ = s ⃗, where M is a (2N− 2) × (2N − 2) matrix whose elements are functions of k||, ω, and the acoustical propertiesof the layers; g⃗ is a vector of length 2N − 2 of plane-wave amplitudes associated with thespecified k|| and ω with elements g⃗ = [a1, b2, a2, b3, …, aN−1, bN ]; and s ⃗ is a vector withfour nonzero elements, two of which are proportional to and two of which areproportional to . The placement of these four nonzero elements in s ⃗ depends onthe layer in which the optical absorber resides. For example, in the case where the opticalabsorber resides in layer P, the four nonzero elements are given by
(20a)
(20b)
(20c)
(20d)
where [s ⃗]n denotes the nth component of the vector s ⃗.
The values of the coefficients am(k||) and bm(k||) are found for one angular frequency, ω, andone spatial frequency, k||, by solving
(21)
By iterating this process through all combinations of angular and spatial frequencies, GP(r, r′; ω) can be fully determined via Eq. (15).
B. Image Reconstruction FormulaBecause of the form of the forcing terms in Eqs. (18) and (19), each plane-wave amplitudefor the Green function takes the form
(22)
where, again, P denotes the layer that contains the optical absorber and Tn and Rn are foundby explicit solution of Eq. (21). The functions Tn and Rn are explicitly functions of k||, butalso depend on all of the system parameters: {dm}, {ρm}, and {cm}.
It is assumed that detection of the acoustic field is performed on the plane z = 0. In thisregion, Eq. (15) takes on the simplified form
Schoonover and Anastasio Page 6
J Opt Soc Am A Opt Image Sci Vis. Author manuscript; available in PMC 2012 February 7.
NIH
-PA Author Manuscript
NIH
-PA Author Manuscript
NIH
-PA Author Manuscript
(23)
where a1(k||; r′) = [g⃗]1 is the outgoing plane-wave amplitude in the final (detection) layer.The acoustic pressure, p(r, ω), evaluated on the detection plane z = 0, is given by theequation
(24)
On substitution from Eq. (23) into Eq. (24), and using Eq. (22) and the 2D Fouriertransform, it can be verified that
(25)
where and p̃(k||, ω) is used to denote p̃(kx, ky, ω). Eachplane-wave component of the detected field is made up of two components: one is related to
, and the other is related to . Note that, when the illuminated object isin the leftmost layer (layer N), all of the Rn(k||) are identically zero.
Using the fact that A(r) is real, and that both R and T are functions only of the magnitude ofk||, the measured pressure on a plane parallel to the interface is sufficient to estimate thespatial Fourier components of A(r) as
(26)
Equation (26) is the main result of this paper. It shows that the Fourier components of theobject are simply related to the Fourier components of the acoustic signal measured on aplane. It can be verified that, in the special case of an object with homogeneous speed-of-sound and density distributions, i.e., a medium described by a single layer, Eq. (26) reducesto Eq. (6).
4. COMPUTER SIMULATIONSComputer simulations were performed to verify the proposed reconstruction method. Anumerical phantom was considered that contained two small spheres located within the firstof three layers. The spheres were centered at positions (1, −1.34, −1.5) cm and (0, 1.4, −1.4)cm, had radii of 1 cm, and were band limited by convolving each with a 3D Gaussianfunction of width 0.5 mm. The value of A(r) was assigned to be one for each sphere.Spheres were used in the simulations because they have a known Fourier representation,eliminating machine error in calculating the Fourier transform of the object. The first layerof the background was assumed to be unbounded in the −z direction and have a speed ofsound of 1550 m/s (consistent with muscle tissue). The second layer had a thickness 3 mmand has a speed of sound of 1476 m/s (consistent with fat tissue). The third layer had a speedof sound of 1498 m/s (consistent with skin). The densities of each layer were considered to
Schoonover and Anastasio Page 7
J Opt Soc Am A Opt Image Sci Vis. Author manuscript; available in PMC 2012 February 7.
NIH
-PA Author Manuscript
NIH
-PA Author Manuscript
NIH
-PA Author Manuscript
be equal. The pressure wave field was assumed to be recorded in the a layer that is matchedto the skin layer a distance of d = 1 mm away from the skin edge.
Samples of p̃(r, ω) were generated according to Eq. (24), where the integral in Eq. (23) wasevaluated numerically for |k||| < 3k0. Temporal frequency domain data were generated at asampling rate of 1.59 MHz on a rectangular grid of 128 × 128 idealized, pointlike,transducers, with lateral spacing Δx = 0.5 mm. The effects of an imperfect transducerresponse on the reconstructed images are expected be the same as described elsewhere[11,31].
Sampled values of p(r, t) were obtained by application of the one-dimensional inverse fastFourier transform (FFT) to the computed values of p̃(r, ω). Noisy versions of p(r, t) werecreated by addition of identically distributed white Gaussian noise at each transducerlocation. The noise level was referenced to the average value of p(r, t) computed over allvalues of t and transducer locations r.
For the three layer object described above, Eq. (26) can be expressed explicitly as
(27)
where is the z component of the wave vector for muscle (l = m), fat (l = f ) or skin (l = s),df is the thickness of the fat layer (3 mm in these simulations), and t and r are the standardamplitude transmission and reflection coefficients for acoustic fields [32]:
(28a)
(28b)
The reconstruction algorithm was implemented as follows. The 3D FFT algorithm wasemployed to compute sampled values of p(kx, ky, ω) from the noiseless or noisymeasurement data p(r, t). A low-pass filter was applied so that p(kx, ky, ω) = 0 for
, where cP is the speed of sound in the layer in which the object resides. Thefiltering is performed to preserve the relationship expressed in Eq. (26). For
is imaginary, and is thus a Fourier–Laplace transform and not aFourier transform. The resulting data were employed in Eq. (27) to obtain an estimate of theobject’s Fourier transform on a uniform grid in kx and ky and a nonuniform grid in kz. For a
given kx and ky, the sampled values of kz corresponded to , where cP isthe speed of sound in the layer containing the objects. The object estimate was theninterpolated onto a uniform grid in kz for kz > 0 for each kx and ky using linear interpolation.Because the object being reconstructed was purely real, the Fourier relation (−k) = (k)was used to obtain the Fourier components of the object for kz < 0. Finally, the Fouriertransform of the object was performed using a 3D FFT to obtain the estimate of the originalphantom.
Schoonover and Anastasio Page 8
J Opt Soc Am A Opt Image Sci Vis. Author manuscript; available in PMC 2012 February 7.
NIH
-PA Author Manuscript
NIH
-PA Author Manuscript
NIH
-PA Author Manuscript
5. RESULTSThe estimate of A(r) that was reconstructed by use of Eq. (27) from the noiseless simulationdata is displayed in Fig. 2. Specifically, a 2D slice corresponding to the plane z = −1.37 cmis shown in the top-left panel. The other three panels contain line plots through thereconstructed image (in black) and through the original phantom along the lines x = 0.75 cmand z = −1.37 cm (top right), y = −1.33 cm and z = −1.51 cm (bottom left), and y = 1.42 cmand z = −1.42 cm (bottom right). Note that the reconstructed and original objects are sosimilar as to be indistinguishable. This is expected and corroborates the mathematicalcorrectness of the reconstruction formula.
To demonstrate the improvement in reconstruction accuracy that can be obtained by use ofthe proposed reconstruction algorithm, images were reconstructed from the noiselesssimulation data by use of Eq. (6) [see Eq. (17) of [16] ], which assumes an acousticallyhomogeneous background. In Fig. 3, a 2D slice through the reconstruction of the originalphantom based on the assumption of a homogeneous background is shown in the plane z =−1.37 cm. The assumed speed of sound employed by the reconstruction algorithm wasconsistent with muscle tissue (i.e., the speed of sound in the layer containing the opticalabsorbers). One notes that the image reconstructed by use of Eq. (6) is qualitatively similarto the original object but does not accurately estimate the two sphere’s radii or the values ofA(r). In the line plots (in the upper-right and bottom two panels), one can see more clearlythe failure of the homogenous model in quantitatively reconstructing objects in a layeredmedium. In cases where the acoustic properties of the layers are not so closely matched, e.g.,when one layer is bone, the degradation in the accuracy of images produced by use of thehomogeneous medium assumption can be expected to be even more dramatic.
As the acoustical properties of the medium layers may not precisely known in practice,robustness tests were performed to determine how well the algorithm performs with respectto imprecise knowledge of various system parameters, e.g., the speed of sound. To this end,a number of simulations were performed in which the speeds of sound assumed in theinversion algorithm were varied from the true values. In Fig. 4, a 2D slice of thereconstruction through the plane z = −1.37 cm is shown in which the speed of soundassumed in the inversion algorithm differed from the actual value in the first layer only.Specifically, the speed of sound assumed by the inversion algorithm is 1627 m/s (5% largerthan the actual value of 1550 m/s). One can see that the reconstructed spheres have a largerradius than both the original phantoms and the reconstruction based on the assumption ofhomogeneity. The value for the estimated absorbed energy density is also less accurate thanin either of the previous reconstructions. By misestimating the speed of sound cP in the layer
containing the optical absorbers, the mapping employed in Eq. (27)produces an erroneous set of kz values and therefore error in the estimated Fouriercomponents of A(r). This results in either a compression (when the speed of sound used issmaller than actual value) or expansion (when the speed of sound used is larger than theactual value) of the object in the z direction (the interpolated direction in Fourier space).
As a further test of the robustness of the algorithm, we investigated the case when thereconstruction algorithm employed the correct the speed-of-sound value in the layercontaining the optical absorber but employed the wrong values for the other two layers. InFig. 5, a 2D slice through the plane z = −1.37 cm of the reconstruction of the originalphantoms is shown in which the speed of sound assumed in the inversion algorithm differsfrom the actual value in the second and third layer only. In the second layer, the assumedspeed of sound (1535 m/s) is 4% larger than the actual speed of sound (1476 m/s), and in thethird layer, the assumed speed of sound (1543 m/s) is 3% larger than the actual speed of
Schoonover and Anastasio Page 9
J Opt Soc Am A Opt Image Sci Vis. Author manuscript; available in PMC 2012 February 7.
NIH
-PA Author Manuscript
NIH
-PA Author Manuscript
NIH
-PA Author Manuscript
sound (1498 m/s). One sees immediately that misestimating the acoustical properties of thelayers that do not contain the object has a less deleterious effect on the reconstruction thanmisestimating the acoustical properties in the object layer.
Finally, a preliminary investigation of the proposed reconstruction algorithm’s robustness tostochastic measurement noise was performed. In the top-left panel of Fig. 6, a 2D slice ofthe image reconstructed by use of Eq. (27) from one realization of the noisy data isdisplayed for the plane z = −1.37 cm. The noise level in the pressure data was 1%, asdefined in Section 4. To quantify the noise level, empirical estimates of the image variancewere computed [33]. To compare the imaging model presented in this paper to a previousmodel [16], the image variance over 1000 realizations of the noise process was calculatedfor two situations. In the first, the phantoms were embedded in a known, layered medium,and Eq. (27) was used to estimate the image. In the second, the phantoms were embedded ina known, homogeneous medium, and Eq. (6) was used to estimate the image. The variancefor the two cases is shown in Fig. 6 along the lines x = 0.75 cm and z = −1.37 cm (top-rightpanel), y = −1.33 cm and z = −1.51 cm (bottom-left panel), and y = 1.42 cm and z = −1.42cm (bottom-right panel), where the blue, dashed lines denote the variance of the image whenthe object is embedded in the layered medium and the black, solid lines denote the varianceof the image when the object is embedded in a homogenous medium. The image variance inboth cases are reasonably flat. The imaging model presented in this paper has a similarrobustness to noise to the previously introduced imaging model [16]. A more detailedinvestigation of the statistical properties of the reconstruction presented in this paper is thesubject of future research.
6. CONCLUSIONIn this paper, a reconstruction formula has been introduced for PAT in the case that theoptical absorber is embedded in a layered medium and acoustical detection is performed ona planar surface. The reconstruction formula demonstrates a mapping between the 3DFourier transform of the optical absorber and the 2D spatial Fourier transform of theacoustic pressure data acquired on the detection plane. Through the use of simulations, thereconstruction formula was compared to a previous formula valid only for the case when theoptical absorber is embedded in a homogenous medium and acoustical detection occurs on aplanar surface. It was shown that the formula that is valid for a homogeneous medium doesnot return accurate estimates of object structure when the object is embedded in a layeredmedium, although there is qualitative similarity between the output of the reconstructionformula and the original phantom. The robustness of the formula has been explored whenimprecise knowledge of the layered medium is used as an input to the reconstructionformula. The stability of the inversion formula with respect to additive noise has also beeninvestigated.
Further work is required to extend the layered media formalism for PAT to the case whenthe acoustic properties of each layer are dispersive and absorptive. Absorptive processescomplicate the simple Fourier relationship between acoustic pressure and optical absorptiondensity presented in this paper. Additionally, experimental applications of this work inbiological imaging need to be explored.
AcknowledgmentsThis research was supported in part by National Institutes of Health (NIH) awards EB010049 and EB009715.
Schoonover and Anastasio Page 10
J Opt Soc Am A Opt Image Sci Vis. Author manuscript; available in PMC 2012 February 7.
NIH
-PA Author Manuscript
NIH
-PA Author Manuscript
NIH
-PA Author Manuscript
References1. Wang LV. Prospects of photoacoustic tomography. Med Phys. 2008; 35:5758. [PubMed: 19175133]2. Xu M, Wang LV. Biomedical photoacoustics. Rev Sci Instrum. 2006; 77:041101.3. Oraevsky, AA.; Karabutov, AA. Optoacoustic tomography. In: Vo-Dinh, T., editor. Biomedical
Photonics Handbook. CRC Press; 2003.4. Wang, L., editor. Photoacoustic Imaging and Spectroscopy. CRC Press; 2009.5. Ntziachristos V, Razansky D. Molecular imaging by means of multispectral optoacoustic
tomography (MSOT). Chem Rev. 2010; 110:2783–2794. [PubMed: 20387910]6. Kruger R, Reinecke D, Kruger G. Thermoacoustic computed tomography—technical
considerations. Med Phys. 1999; 26:1832–1837. [PubMed: 10505871]7. Haltmeier M, Scherzer O, Burgholzer P, Paltauf G. Thermoacoustic computed tomography with
large planar receivers. Inverse Probl. 2004; 20:1663–1673.8. Ephrat P, Keenliside L, Seabrook A, Prato FS, Carson JJL. Three-dimensional photoacoustic
imaging by sparse-array detection and iterative image reconstruction. J Biomed Opt. 2008;13:054052. [PubMed: 19021432]
9. Cox BT, Arridge SR, Köstli KP, Beard PC. Two-dimensional quantitative photoacoustic imagereconstruction of absorption distributions in scattering media by use of a simple iterative method.Appl Opt. 2006; 45:1866–1875. [PubMed: 16572706]
10. Wang K, Ermilov S, Su R, Brecht H, Oraevsky A, Anastasio M. An imaging model incorporatingultrasonic transducer properties for three-dimensional optoacoustic tomography. IEEE Trans MedImag. 2010; 30:203–214.
11. Anastasio MA, Zhang J, Modgil D, Riviere PJL. Application of inverse source concepts tophotoacoustic tomography. Inverse Probl. 2007; 23:S21–S35.
12. Kunyansky LA. Explicit inversion formulae for the spherical mean radon transform. Inverse Probl.2007; 23:373–383.
13. Finch D, Haltmeier M, Rakesh. Inversion of spherical means and the wave equation in evendimensions. SIAM J Appl Math. 2007; 68:392–412.
14. Xu M, Wang LV. Universal back-projection algorithm for photoacoustic computed tomography.Phys Rev E. 2005; 71:016706.
15. Finch D, Patch S, Rakesh. Determining a function from its mean values over a family of spheres.SIAM J Math Anal. 2004; 35:1213–1240.
16. Xu Y, Feng D, Wang LV. Exact frequency-domain reconstruction for thermoacoustic tomography:I. Planar geometry. IEEE Trans Med Imag. 2002; 21:823–828.
17. Köstli KP, Frenz M, Bebie H, Weber HP. Temporal backward projection of optoacoustic pressuretransients using Fourier transform methods. Phys Med Biol. 2001; 46:1863–1872. [PubMed:11474930]
18. Kruger RA, Liu P, Fang R, Appledorn C. Photoacoustic ultrasound (PAUS) reconstructiontomography. Med Phys. 1995; 22:1605–1609. [PubMed: 8551984]
19. Xu Y, Wang LV. Effects of acoustic heterogeneity in breast thermoacoustic tomography. IEEETrans Ultrason Ferroelectr Freq Control. 2003; 50:1134–1146. [PubMed: 14561030]
20. Anastasio MA, Zhang J, Pan X, Zou Y, Keng G, Wang LV. Half-time image reconstruction inthermoacoustic tomography. IEEE Trans Med Imag. 2005; 24:199–210.
21. Modgil D, Anastasio MA, Rivière PJL. Image reconstruction in photoacoustic tomography withvariable speed of sound using a higher-order geometrical acoustics approximation. J Biomed Opt.2010; 15:021308. [PubMed: 20459230]
22. Agranovsky M, Kuchment P. Uniqueness of reconstruction and an inversion procedure forthermoacoustic and photoacoustic tomography with variable sound speed. Inverse Probl. 2007;23:2089–2102.
23. Jin X, Wang LV. Thermoacoustic tomography with correction for acoustic speed variations. PhysMed Biol. 2006; 51:6437–6448. [PubMed: 17148827]
Schoonover and Anastasio Page 11
J Opt Soc Am A Opt Image Sci Vis. Author manuscript; available in PMC 2012 February 7.
NIH
-PA Author Manuscript
NIH
-PA Author Manuscript
NIH
-PA Author Manuscript
24. Willemink R, Manohar S, Purwar Y, Slump C, van der Heijden F, van Leeuwen T. Imaging ofacoustic attenuation and speed of sound maps using photoacoustic measurements. Proc SPIE.2008; 6920:692013.
25. Hristova Y, Kuchment P, Nguyen L. Reconstruction and time reversal in thermoacoustictomography in acoustically homogeneous and inhomogeneous media. Inverse Probl. 2008;24:055006.
26. Stefanov P, Uhlmann G. Thermoacoustic tomography with variable sound speed. Inverse Probl.2009; 25:075011.
27. Tai, C. Dyadic Green Functions in Electromagnetic Theory. IEEE; 1994.28. Haltmeier M, Scherzer O, Zangerl G. A reconstruction algorithm for photoacoustic imaging based
on the nonuniform FFT. IEEE Trans Med Imag. 2009; 28:1727–1735.29. Riviere PJL, Zhang J, Anastasio MA. Image reconstruction in optoacoustic tomography for
dispersive acoustic media. Opt Lett. 2006; 31:781–783. [PubMed: 16544622]30. Mandel, L.; Wolf, E. Optical Coherence and Quantum Optics. Cambridge University; 1995.31. Xu M, Wang LV. Analytic explanation of spatial resolution related to bandwidth and detector
aperture size in thermoacoustic or photoacoustic reconstruction. Phys Rev E. 2003; 67:056605.32. Morse, P.; Ingard, K. Theoretical Acoustics. Princeton University Press; 1986.33. Anastasio MA, Kupinski M, Pan X. Noise properties of reconstructed images in ultrasound
diffraction tomography. IEEE Trans Nucl Sci. 1998; 45:2216–2223.
Schoonover and Anastasio Page 12
J Opt Soc Am A Opt Image Sci Vis. Author manuscript; available in PMC 2012 February 7.
NIH
-PA Author Manuscript
NIH
-PA Author Manuscript
NIH
-PA Author Manuscript
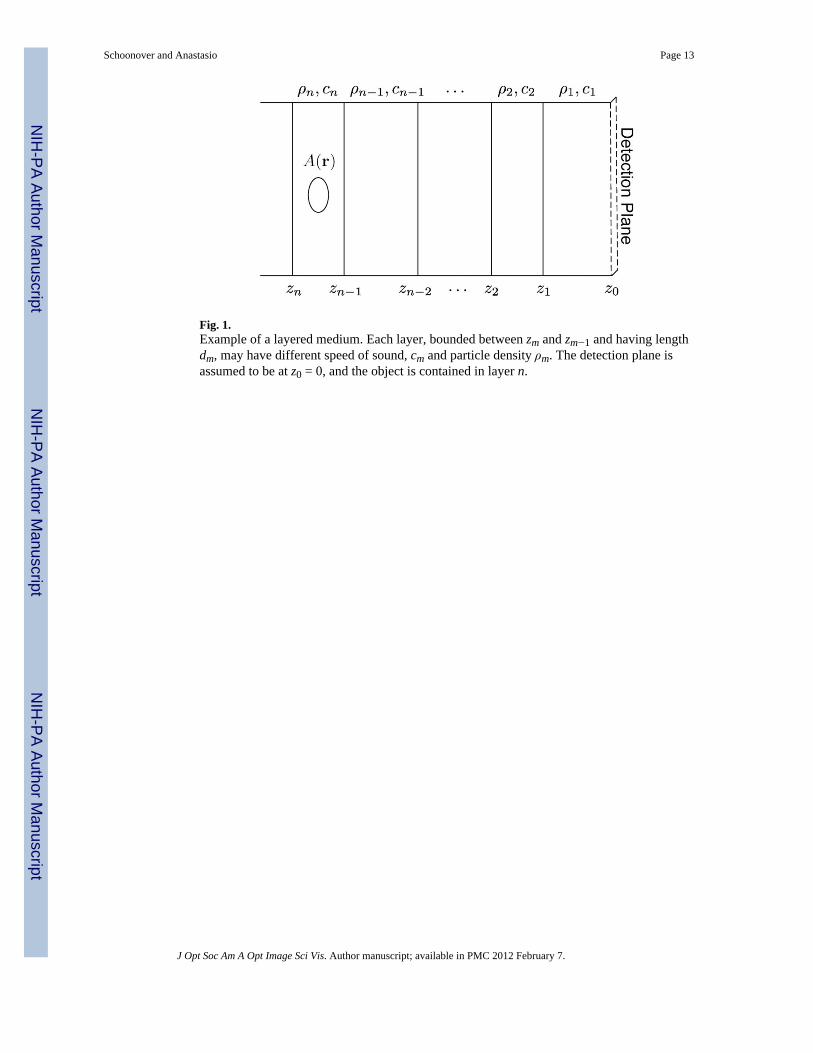
Fig. 1.Example of a layered medium. Each layer, bounded between zm and zm−1 and having lengthdm, may have different speed of sound, cm and particle density ρm. The detection plane isassumed to be at z0 = 0, and the object is contained in layer n.
Schoonover and Anastasio Page 13
J Opt Soc Am A Opt Image Sci Vis. Author manuscript; available in PMC 2012 February 7.
NIH
-PA Author Manuscript
NIH
-PA Author Manuscript
NIH
-PA Author Manuscript

Fig. 2.(Color online) (top left) Image of the numerical phantom in the plane z = −1.37 cmreconstructed by use of Eq. (27) from noiseless data. (top right) Profile through thereconstructed image (black) and original phantom (blue dashed) along the line x = 0.75 cmand z = −1.37 cm. (bottom left) Corresponding profiles along the line y = −1.33 cm and z =−1.51 cm. (bottom right) Corresponding profiles along the line y = 1.42 cm and z = −1.42cm.
Schoonover and Anastasio Page 14
J Opt Soc Am A Opt Image Sci Vis. Author manuscript; available in PMC 2012 February 7.
NIH
-PA Author Manuscript
NIH
-PA Author Manuscript
NIH
-PA Author Manuscript
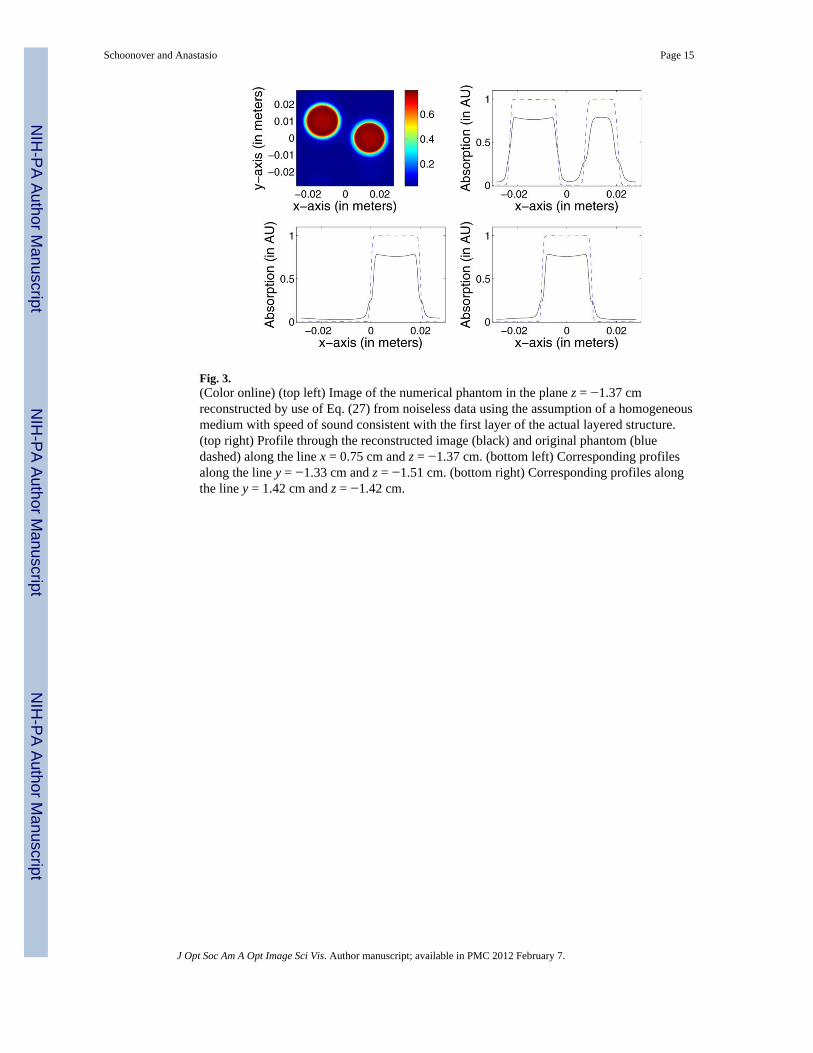
Fig. 3.(Color online) (top left) Image of the numerical phantom in the plane z = −1.37 cmreconstructed by use of Eq. (27) from noiseless data using the assumption of a homogeneousmedium with speed of sound consistent with the first layer of the actual layered structure.(top right) Profile through the reconstructed image (black) and original phantom (bluedashed) along the line x = 0.75 cm and z = −1.37 cm. (bottom left) Corresponding profilesalong the line y = −1.33 cm and z = −1.51 cm. (bottom right) Corresponding profiles alongthe line y = 1.42 cm and z = −1.42 cm.
Schoonover and Anastasio Page 15
J Opt Soc Am A Opt Image Sci Vis. Author manuscript; available in PMC 2012 February 7.
NIH
-PA Author Manuscript
NIH
-PA Author Manuscript
NIH
-PA Author Manuscript
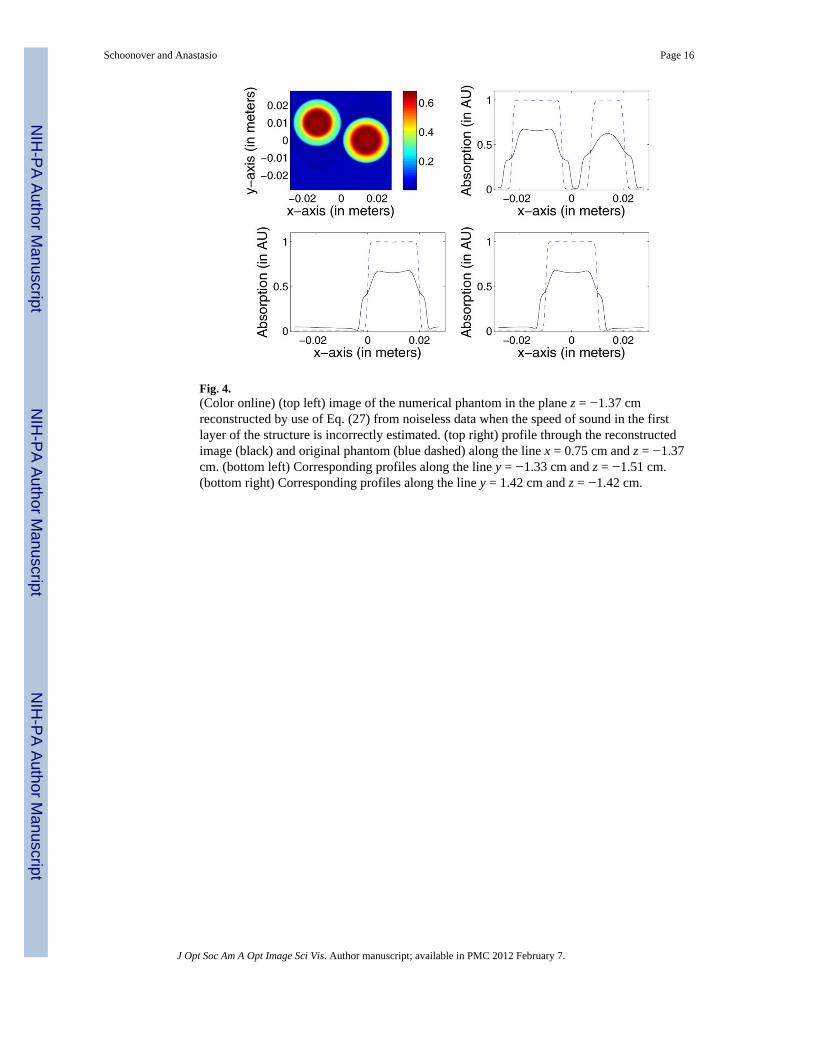
Fig. 4.(Color online) (top left) image of the numerical phantom in the plane z = −1.37 cmreconstructed by use of Eq. (27) from noiseless data when the speed of sound in the firstlayer of the structure is incorrectly estimated. (top right) profile through the reconstructedimage (black) and original phantom (blue dashed) along the line x = 0.75 cm and z = −1.37cm. (bottom left) Corresponding profiles along the line y = −1.33 cm and z = −1.51 cm.(bottom right) Corresponding profiles along the line y = 1.42 cm and z = −1.42 cm.
Schoonover and Anastasio Page 16
J Opt Soc Am A Opt Image Sci Vis. Author manuscript; available in PMC 2012 February 7.
NIH
-PA Author Manuscript
NIH
-PA Author Manuscript
NIH
-PA Author Manuscript
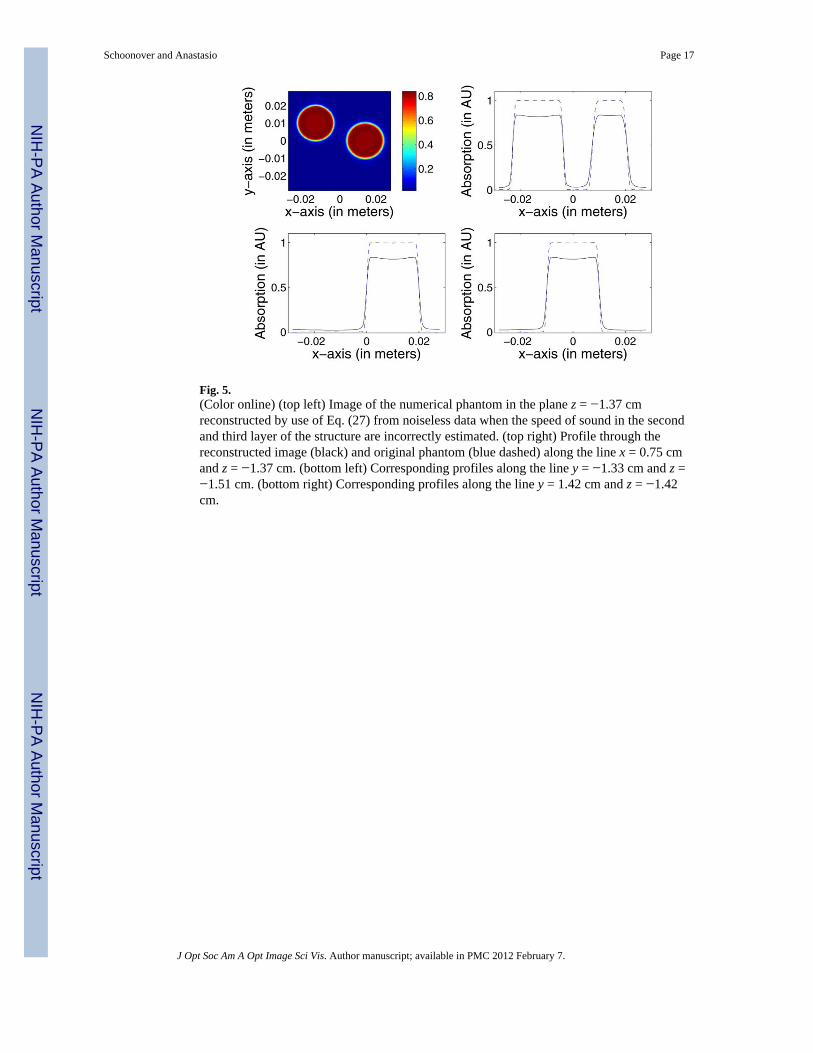
Fig. 5.(Color online) (top left) Image of the numerical phantom in the plane z = −1.37 cmreconstructed by use of Eq. (27) from noiseless data when the speed of sound in the secondand third layer of the structure are incorrectly estimated. (top right) Profile through thereconstructed image (black) and original phantom (blue dashed) along the line x = 0.75 cmand z = −1.37 cm. (bottom left) Corresponding profiles along the line y = −1.33 cm and z =−1.51 cm. (bottom right) Corresponding profiles along the line y = 1.42 cm and z = −1.42cm.
Schoonover and Anastasio Page 17
J Opt Soc Am A Opt Image Sci Vis. Author manuscript; available in PMC 2012 February 7.
NIH
-PA Author Manuscript
NIH
-PA Author Manuscript
NIH
-PA Author Manuscript
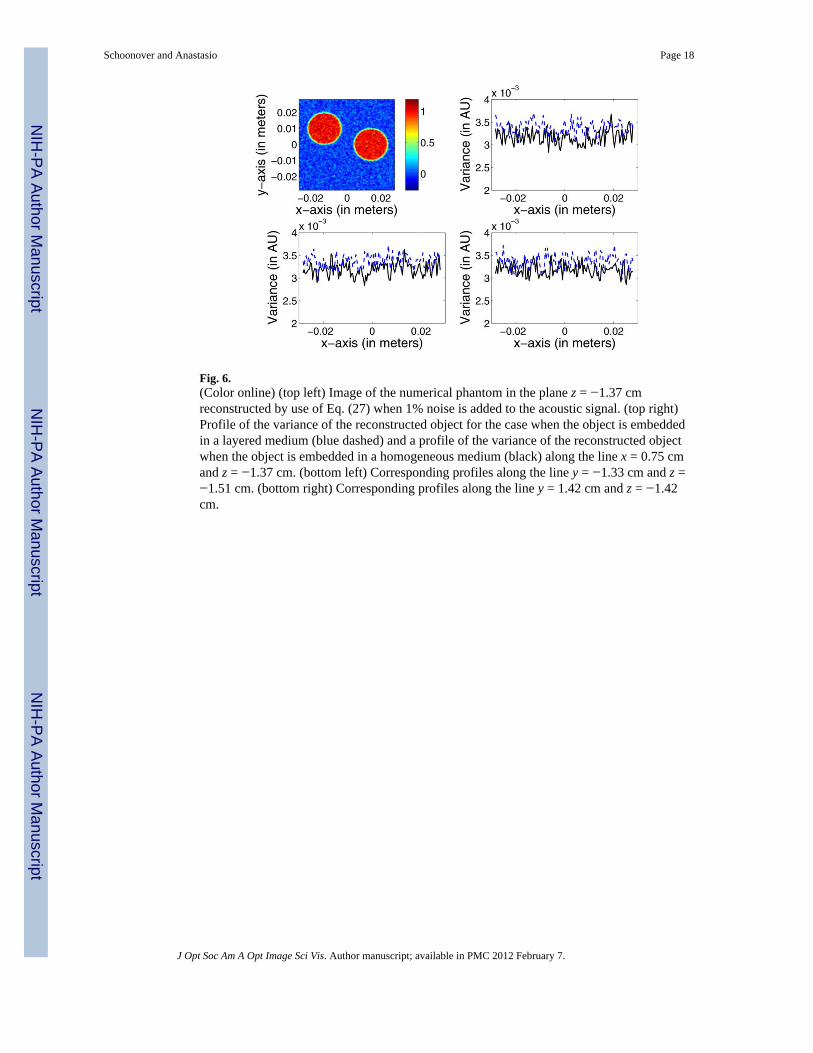
Fig. 6.(Color online) (top left) Image of the numerical phantom in the plane z = −1.37 cmreconstructed by use of Eq. (27) when 1% noise is added to the acoustic signal. (top right)Profile of the variance of the reconstructed object for the case when the object is embeddedin a layered medium (blue dashed) and a profile of the variance of the reconstructed objectwhen the object is embedded in a homogeneous medium (black) along the line x = 0.75 cmand z = −1.37 cm. (bottom left) Corresponding profiles along the line y = −1.33 cm and z =−1.51 cm. (bottom right) Corresponding profiles along the line y = 1.42 cm and z = −1.42cm.
Schoonover and Anastasio Page 18
J Opt Soc Am A Opt Image Sci Vis. Author manuscript; available in PMC 2012 February 7.
NIH
-PA Author Manuscript
NIH
-PA Author Manuscript
NIH
-PA Author Manuscript
Related Documents


![Nonlinear quantitative photoacoustic tomography with two …kr2002/publication_files/Ren-Zhang-TP-PAT-2016.pdf · Two-photon photoacoustic tomography (TP-PAT) [35,36,51,53,56,57,58,60,59]](https://static.cupdf.com/doc/110x72/5e26be0daa2e5d594541a49c/nonlinear-quantitative-photoacoustic-tomography-with-two-kr2002publicationfilesren-zhang-tp-pat-2016pdf.jpg)