Image processing in MATLAB Linguaggio Programmazione Matlab-Simulink (2018/2019)

Welcome message from author
This document is posted to help you gain knowledge. Please leave a comment to let me know what you think about it! Share it to your friends and learn new things together.
Transcript

Image processing in MATLAB
Linguaggio Programmazione Matlab-Simulink (20182019)
Images in MATLAB MATLAB can importexport
several image formats BMP (Microsoft Windows Bitmap)
GIF (Graphics Interchange Files)
HDF (Hierarchical Data Format)
JPEG (Joint Photographic Experts Group)
PCX (Paintbrush)
PNG (Portable Network Graphics)
TIFF (Tagged Image File Format)
XWD (X Window Dump)
MATLAB can also load raw-data or other types of image data
DICOM data (dicomreadhellip)
bull Data types in MATLABbull Double (64-bit double-precision
floating point)
bull Single (32-bit single-precision floating point)
bull Int32 (32-bit signed integer)
bull Int16 (16-bit signed integer)
bull Int8 (8-bit signed integer)
bull Uint32 (32-bit unsigned integer)
bull Uint16 (16-bit unsigned integer)
bull Uint8 (8-bit unsigned integer)
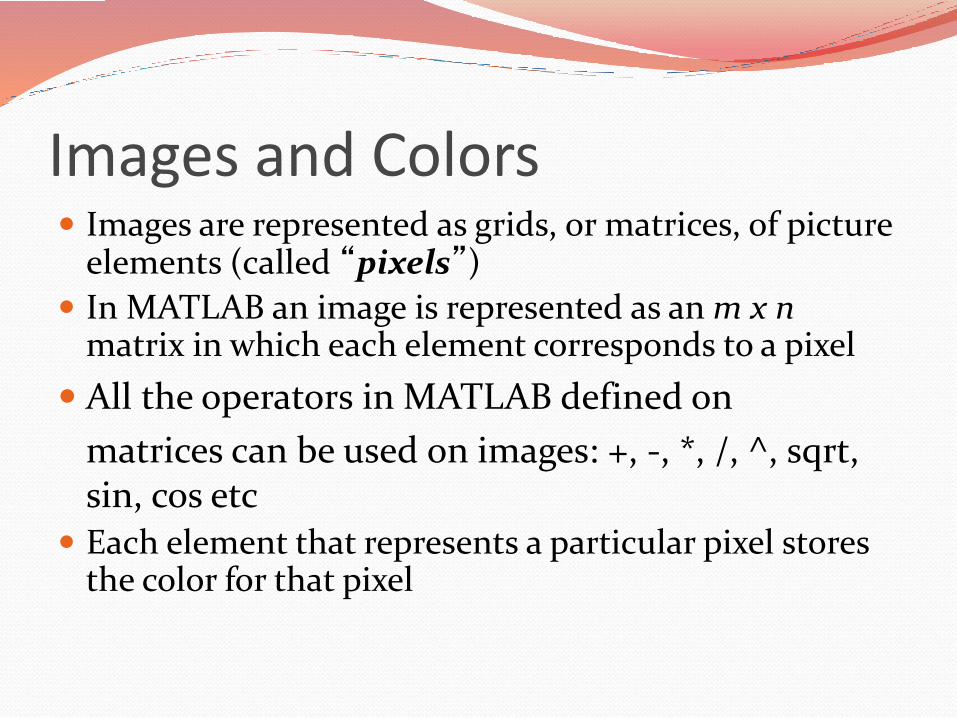
Images and Colors Images are represented as grids or matrices of picture
elements (called ldquopixelsrdquo)
In MATLAB an image is represented as an m x nmatrix in which each element corresponds to a pixel
All the operators in MATLAB defined on
matrices can be used on images + - ^ sqrt sin cos etc
Each element that represents a particular pixel stores the color for that pixel
Images in MATLAB Binary images 01
Intensity images [01] or uint8 double etc
RGB images m-by-n-by-3 (one for each color channel)
Indexed images m-by-n matrix p-by-3 color map
Multidimensional images m-by-n-by-p (p is the number of layers)
There are two basic ways that the color can be represented for a pixel
true color or RGB in which the three color components are stored (red green and blue in that order)
the matrix is
m x n x 3
Representing Color
Representing Color index into a colormap the value stored in each element
of the m x n matrix is an integer which refers to a row in another matrix which is called a colormap
The colormap stores the red green and blue components in three separate columns so its size is p x 3 where p is the number of colors
Matlab
pre-defined
colormaps
Colormaps every element in the m x n image matrix mat is an integer in the
range from 1 to p which refers to a row in another matrix which is called a colormap
The colormap stores the red green and blue components of different colors in three separate columns so its size is p x 3 where p is the number of colors
If the type of the elements is double the numbers range from 0 (which represents the absence of that color) to 1 (which is the brightest possible hue)
the image function displays the image matrix using the current colormap
image(mat)
the colormap function can be used two ways if no argument is passed it returns the current colormap if a p x 3 matrix is passed it sets that matrix to be the current colormap
Reading an image
gtgtA = imread(filename) reads the image from the file specified by filename
inferring the format of the file from its contents
gtgtA = imread(filenamefmt) additionally specifies the format of the file with
the standard file extension indicated by fmt If imread cannot find a file with the
name specified by filename it looks for a file named filenamefmt
gtgt[Amap] = imread(___) reads the indexed image in filename into A and
reads its associated colormap into map Colormap values in the image file are
automatically rescaled into the range [01]
gtgt[Xmapalpha] = imread(pepperspngrsquo)
gtgtwhos alpha
Name Size Bytes Class Attributes
alpha 0x0 0 double
No alpha channel is present so alpha is empty
Using imread The function reads color images into a 3D matrix
gtgt myimage1 = imread(lsquoxyzJPGrsquo)
Functions now in MATLAB (were in Image Processing Toolbox)
imshow displays an image
rgb2gray converts from RGB to gray scale
im2double converts an image matrix to double
Showing an image (1)
gtgtimage(C)
displays the data in array C as an image Each element of C specifies the
color for 1 pixel of the image The resulting image is an m-by-n grid of pixels
where m is the number of rows and n is the number of columns in C
gtgtimage(xyC) xy specifies the image location Use x and y to specify the
locations of the corners corresponding to C(11) and C(mn) To specify both
corners set x and y as two-element vectors
gtgtimagesc(C) similar with image
Observation these functions uses the current colormap
gtgt x = [5 8]
gtgt y = [3 6]
gtgt C = [0 2 4 6 8 10 12 14 16 18 20 22]
gtgt image(xyC)
gtgt image(C)
gtgt imagesc (xyC)
Showing an image (2)
gtgtimshow(I)
displays the grayscale image I in a figure imshow optimizes figure axes and
image object properties for image display
gtgtimshow(RGB) displays the truecolor image RGB in a figure
gtgtimshow(I[low high]) displays the grayscale image I specifying the display
range as a two-element vector [low high]
gtgtimshow(I[]) displays the grayscale image I scaling the display based on
the range of pixel values in I imshow uses [min(I()) max(I())] as the display
range
gtgtimshow(Xmap) displays the indexed image X with the colormap map
Observation this function uses the colormap specified by lsquomaprsquo Otherwise a
m-by-n image will be shown as a grayscale image while a m-by-n-by-3 will be
shown in RGB
Built-in colormaps There are several built-in colormaps eg parula (which is the default)
jet autumn pink etc
All of these all have 64 colors so the size of the colormap is 64 x 3
For example the first four colors from jet are shades of bluegtgt colormap(jet)
gtgt colormap
ans =
0 0 05625
0 0 06250
0 0 06875
0 0 07500
etc
gtgt colormap default
gtgt size(colormap)
ans =
64 3
gtgt mat = randi([1 64]1515)
gtgt imagesc(mat)
gtgt colormap(jet)
gtgt size(jet)
gtgt imagesc(mat)
Example user-defined colormap
[1 0 0] is red
[0 1 0] is green
[0 0 1] is blue
[1 1 0] is yellow
[0 0 0] is black
[1 1 1] is white
gtgt mycolors = [1 0 0 0 1 0 0 0 1
1 1 0 0 0 0 1 1 1]
gtgt colormap(mycolors)
gtgt mat = randi([1 6]1515)
gtgt imagesc(mat)
gtgt colorbar
2 4 6 8 10 12 14
2
4
6
8
10
12
14
Create a colormap with 6 colors and use a random matrix to display them
Example indexed image
gtgt [Xmap] = imread(treestif rsquo)
gtgt size(X)
ans =
258 350
gtgt size(map)
ans =
256 3
gtgt image(X)
gtgt colormap summer
gtgt image(X)
gtgt imshow(Xmap)
colormap shades The numbers in the colormap do not have to be integers real numbers
represent different shades The following shows four shades of red from no red (black) to the
brightest possible redgtgt colors = [0 0 0 03 0 0 07 0 0 1 0 0]
gtgt colormap(colors)
gtgt vec = 14
gtgt image(vec)
05 1 15 2 25 3 35 4 45
05
06
07
08
09
1
11
12
13
14
15
True Color Matrices True color matrices are three-dimensional matrices with size m x n x 3
The first two indices are the coordinates of the pixel The third index is the color component (1) is the red (2) is the green
and (3) is the blue component
If every element in the matrix is of the type uint8 which is an unsigned integer type using 8 bits the range of values is 0 to 255
Therefore the minimum value 0 represents the darkest hue available so all 0rsquos results in a black pixel
The maximum value 255 represents the brightest hue For example in the following the pixel in location 11 will be red
gtgt mat(111) = 255gtgt mat(112) = 0gtgt mat(113) = 0
The image function shows the imagegtgt mat = uint8(mat)gtgt image(mat)
Display Image of 3-D Array of True Colors
Display an image of the data in C gtgtimage(C)
True Color Matrices
gtgtC = zeros(333)
C(1) = [1 2 3 4 5 6 7 8 9]
C =
C(1) =
01000 02000 03000
04000 05000 06000
07000 08000 09000
C(2) =
0 0 0
0 0 0
0 0 0
C(3) =
0 0 0
0 0 0
0 0 0
Image import and export example Read and write images in Matlab
gtgt I=imread(ngc6543ajpg)
gtgt imshow(I)
gtgt size(I)
ans = 479 600 3 (RGB image)
gtgt Igrey=rgb2gray(I)
gtgt imshow(Igrey)
gtgt imwrite(lgrey cell_graytif tiff rsquo)
Alternatives to imshowgtgtimagesc(I)
gtgtimtool(I)
gtgtimage(I)
Esercizio trasformare un
Imagine colormap in RGB
Images and Matrices Building matrices (or images)
gtgt A = [ 1 2 3 4 5 6 7 8 9 ]
A = 1 2 3
4 5 6
7 8 9
gtgt B = zeros(33)
B = 0 0 0
0 0 0
0 0 0
gtgt C = ones(33)
C = 1 1 1
1 1 1
1 1 1
gtgtimshow(A) (imshow(A[]) to get automatic pixel range)
Images and Matrices Accesing image elements (row column)
gtgt A(21)
ans = 4
can be used to extract a whole column or row
gtgt A(2)
ans =
2
5
8
or a part of a column or row
gtgt A(122)
ans =
2
5
X
Y
A =1 2 34 5 67 8 9
Image Arithmetic Arithmetic operations such as addition subtraction multiplication and division can be applied to
images in MATLAB
+ - performs matrix operations
gtgt A+A
ans = 2 4 6
8 10 12
14 16 18
gtgt AA
ans = 30 36 42
66 81 96
102 126 150
To perform an elementwise operation use ( ^ etc)
gtgt AA
ans = 1 4 9
16 25 36
49 64 81
Logical Conditions equal (==) less than and greater than (lt and gt) not equal (~=) and not (~)
find(lsquoconditionrsquo) - Returns indexes of Arsquos elements that satisfies the condition
gtgt [row col]=find(A==7)
row = 3
col = 1
gtgt [row col]=find(Agt7)
row = 3
3
col = 2
3
gtgt Indx=find(Alt5)
Indx = 1
2
4
7
A =1 2 34 5 67 8 9
Flow control Flow control in MATLAB
- if else and elseif statements
(row=123 col=123)
if row==col
A(row col)=1
elseif abs(row-col)==1
A(row col)=2
else
A(row col)=0
end A =1 2 34 5 67 8 9
Flow control for loops
for row=13
for col=13
if row==col
A(row col)=1
elseif abs(row-col)==1
A(row col)=2
else
A(row col)=0
end
end
end
A =
1 2 02 1 20 2 1
Image histogram The histogram plots the number of pixels in the image (vertical axis)
with a particular brightness value (horizontal axis)
Algorithms in the digital editor allow the user to visually adjust the brightness value of each pixel and to dynamically display the results as adjustments are made Improvements in picture brightness and contrast can thus be obtained
In the field of computer vision image histograms can be useful tools for thresholding Because the information contained in the graph is a representation of pixel distribution as a function of tonal variation image histograms can be analyzed for peaks andor valleys This threshold value can then be used for edge detection image segmentation and co-occurrence matrices (Wikipedia)
Image histogram imhist(I) calculates the histogram for the intensity image I and displays a plot
of the histogram The number of bins in the histogram is determined by the image type
imhist(In) calculates the histogram where n specifies the number of bins used in the histogram
imhist(Xmap) calculates the histogram for the indexed image X with colormap map The histogram has one bin for each entry in the colormap
Syntax [countsbinLocations] = imhist(I) [countsbinLocations] = imhist(In)
[countsbinLocations] = imhist(Xmap)
Image histogram examplegtgtI = imread(pouttif rsquo)gtgtimhist(I)gtgt imhist(I40)
gtgt[Xmap] = imread(lsquotreestif rsquo)gtgtimshow(Xmap)gtgtimhist(Xmap)
imhist(I)
Exercises Given I = imread(pouttif rsquo)
Use the lsquohisteqrsquo function to increase contrast Represent the image before and after histogram equalization
Use histogram to divide an image in lsquoBackroundrsquo andlsquoForegroundrsquo To do this choose an image frominternet and read the image directly from Matlabcommand line Try the Otsu method
EggtgtI=imread(lsquohttpsuploadwikimediaorgwikipediacommons44bImage_processing_pre_otsus_algorithmjpgrsquo)
gtgtimshow(I)

Images in MATLAB MATLAB can importexport
several image formats BMP (Microsoft Windows Bitmap)
GIF (Graphics Interchange Files)
HDF (Hierarchical Data Format)
JPEG (Joint Photographic Experts Group)
PCX (Paintbrush)
PNG (Portable Network Graphics)
TIFF (Tagged Image File Format)
XWD (X Window Dump)
MATLAB can also load raw-data or other types of image data
DICOM data (dicomreadhellip)
bull Data types in MATLABbull Double (64-bit double-precision
floating point)
bull Single (32-bit single-precision floating point)
bull Int32 (32-bit signed integer)
bull Int16 (16-bit signed integer)
bull Int8 (8-bit signed integer)
bull Uint32 (32-bit unsigned integer)
bull Uint16 (16-bit unsigned integer)
bull Uint8 (8-bit unsigned integer)
Images and Colors Images are represented as grids or matrices of picture
elements (called ldquopixelsrdquo)
In MATLAB an image is represented as an m x nmatrix in which each element corresponds to a pixel
All the operators in MATLAB defined on
matrices can be used on images + - ^ sqrt sin cos etc
Each element that represents a particular pixel stores the color for that pixel
Images in MATLAB Binary images 01
Intensity images [01] or uint8 double etc
RGB images m-by-n-by-3 (one for each color channel)
Indexed images m-by-n matrix p-by-3 color map
Multidimensional images m-by-n-by-p (p is the number of layers)
There are two basic ways that the color can be represented for a pixel
true color or RGB in which the three color components are stored (red green and blue in that order)
the matrix is
m x n x 3
Representing Color
Representing Color index into a colormap the value stored in each element
of the m x n matrix is an integer which refers to a row in another matrix which is called a colormap
The colormap stores the red green and blue components in three separate columns so its size is p x 3 where p is the number of colors
Matlab
pre-defined
colormaps
Colormaps every element in the m x n image matrix mat is an integer in the
range from 1 to p which refers to a row in another matrix which is called a colormap
The colormap stores the red green and blue components of different colors in three separate columns so its size is p x 3 where p is the number of colors
If the type of the elements is double the numbers range from 0 (which represents the absence of that color) to 1 (which is the brightest possible hue)
the image function displays the image matrix using the current colormap
image(mat)
the colormap function can be used two ways if no argument is passed it returns the current colormap if a p x 3 matrix is passed it sets that matrix to be the current colormap
Reading an image
gtgtA = imread(filename) reads the image from the file specified by filename
inferring the format of the file from its contents
gtgtA = imread(filenamefmt) additionally specifies the format of the file with
the standard file extension indicated by fmt If imread cannot find a file with the
name specified by filename it looks for a file named filenamefmt
gtgt[Amap] = imread(___) reads the indexed image in filename into A and
reads its associated colormap into map Colormap values in the image file are
automatically rescaled into the range [01]
gtgt[Xmapalpha] = imread(pepperspngrsquo)
gtgtwhos alpha
Name Size Bytes Class Attributes
alpha 0x0 0 double
No alpha channel is present so alpha is empty
Using imread The function reads color images into a 3D matrix
gtgt myimage1 = imread(lsquoxyzJPGrsquo)
Functions now in MATLAB (were in Image Processing Toolbox)
imshow displays an image
rgb2gray converts from RGB to gray scale
im2double converts an image matrix to double
Showing an image (1)
gtgtimage(C)
displays the data in array C as an image Each element of C specifies the
color for 1 pixel of the image The resulting image is an m-by-n grid of pixels
where m is the number of rows and n is the number of columns in C
gtgtimage(xyC) xy specifies the image location Use x and y to specify the
locations of the corners corresponding to C(11) and C(mn) To specify both
corners set x and y as two-element vectors
gtgtimagesc(C) similar with image
Observation these functions uses the current colormap
gtgt x = [5 8]
gtgt y = [3 6]
gtgt C = [0 2 4 6 8 10 12 14 16 18 20 22]
gtgt image(xyC)
gtgt image(C)
gtgt imagesc (xyC)
Showing an image (2)
gtgtimshow(I)
displays the grayscale image I in a figure imshow optimizes figure axes and
image object properties for image display
gtgtimshow(RGB) displays the truecolor image RGB in a figure
gtgtimshow(I[low high]) displays the grayscale image I specifying the display
range as a two-element vector [low high]
gtgtimshow(I[]) displays the grayscale image I scaling the display based on
the range of pixel values in I imshow uses [min(I()) max(I())] as the display
range
gtgtimshow(Xmap) displays the indexed image X with the colormap map
Observation this function uses the colormap specified by lsquomaprsquo Otherwise a
m-by-n image will be shown as a grayscale image while a m-by-n-by-3 will be
shown in RGB
Built-in colormaps There are several built-in colormaps eg parula (which is the default)
jet autumn pink etc
All of these all have 64 colors so the size of the colormap is 64 x 3
For example the first four colors from jet are shades of bluegtgt colormap(jet)
gtgt colormap
ans =
0 0 05625
0 0 06250
0 0 06875
0 0 07500
etc
gtgt colormap default
gtgt size(colormap)
ans =
64 3
gtgt mat = randi([1 64]1515)
gtgt imagesc(mat)
gtgt colormap(jet)
gtgt size(jet)
gtgt imagesc(mat)
Example user-defined colormap
[1 0 0] is red
[0 1 0] is green
[0 0 1] is blue
[1 1 0] is yellow
[0 0 0] is black
[1 1 1] is white
gtgt mycolors = [1 0 0 0 1 0 0 0 1
1 1 0 0 0 0 1 1 1]
gtgt colormap(mycolors)
gtgt mat = randi([1 6]1515)
gtgt imagesc(mat)
gtgt colorbar
2 4 6 8 10 12 14
2
4
6
8
10
12
14
Create a colormap with 6 colors and use a random matrix to display them
Example indexed image
gtgt [Xmap] = imread(treestif rsquo)
gtgt size(X)
ans =
258 350
gtgt size(map)
ans =
256 3
gtgt image(X)
gtgt colormap summer
gtgt image(X)
gtgt imshow(Xmap)
colormap shades The numbers in the colormap do not have to be integers real numbers
represent different shades The following shows four shades of red from no red (black) to the
brightest possible redgtgt colors = [0 0 0 03 0 0 07 0 0 1 0 0]
gtgt colormap(colors)
gtgt vec = 14
gtgt image(vec)
05 1 15 2 25 3 35 4 45
05
06
07
08
09
1
11
12
13
14
15
True Color Matrices True color matrices are three-dimensional matrices with size m x n x 3
The first two indices are the coordinates of the pixel The third index is the color component (1) is the red (2) is the green
and (3) is the blue component
If every element in the matrix is of the type uint8 which is an unsigned integer type using 8 bits the range of values is 0 to 255
Therefore the minimum value 0 represents the darkest hue available so all 0rsquos results in a black pixel
The maximum value 255 represents the brightest hue For example in the following the pixel in location 11 will be red
gtgt mat(111) = 255gtgt mat(112) = 0gtgt mat(113) = 0
The image function shows the imagegtgt mat = uint8(mat)gtgt image(mat)
Display Image of 3-D Array of True Colors
Display an image of the data in C gtgtimage(C)
True Color Matrices
gtgtC = zeros(333)
C(1) = [1 2 3 4 5 6 7 8 9]
C =
C(1) =
01000 02000 03000
04000 05000 06000
07000 08000 09000
C(2) =
0 0 0
0 0 0
0 0 0
C(3) =
0 0 0
0 0 0
0 0 0
Image import and export example Read and write images in Matlab
gtgt I=imread(ngc6543ajpg)
gtgt imshow(I)
gtgt size(I)
ans = 479 600 3 (RGB image)
gtgt Igrey=rgb2gray(I)
gtgt imshow(Igrey)
gtgt imwrite(lgrey cell_graytif tiff rsquo)
Alternatives to imshowgtgtimagesc(I)
gtgtimtool(I)
gtgtimage(I)
Esercizio trasformare un
Imagine colormap in RGB
Images and Matrices Building matrices (or images)
gtgt A = [ 1 2 3 4 5 6 7 8 9 ]
A = 1 2 3
4 5 6
7 8 9
gtgt B = zeros(33)
B = 0 0 0
0 0 0
0 0 0
gtgt C = ones(33)
C = 1 1 1
1 1 1
1 1 1
gtgtimshow(A) (imshow(A[]) to get automatic pixel range)
Images and Matrices Accesing image elements (row column)
gtgt A(21)
ans = 4
can be used to extract a whole column or row
gtgt A(2)
ans =
2
5
8
or a part of a column or row
gtgt A(122)
ans =
2
5
X
Y
A =1 2 34 5 67 8 9
Image Arithmetic Arithmetic operations such as addition subtraction multiplication and division can be applied to
images in MATLAB
+ - performs matrix operations
gtgt A+A
ans = 2 4 6
8 10 12
14 16 18
gtgt AA
ans = 30 36 42
66 81 96
102 126 150
To perform an elementwise operation use ( ^ etc)
gtgt AA
ans = 1 4 9
16 25 36
49 64 81
Logical Conditions equal (==) less than and greater than (lt and gt) not equal (~=) and not (~)
find(lsquoconditionrsquo) - Returns indexes of Arsquos elements that satisfies the condition
gtgt [row col]=find(A==7)
row = 3
col = 1
gtgt [row col]=find(Agt7)
row = 3
3
col = 2
3
gtgt Indx=find(Alt5)
Indx = 1
2
4
7
A =1 2 34 5 67 8 9
Flow control Flow control in MATLAB
- if else and elseif statements
(row=123 col=123)
if row==col
A(row col)=1
elseif abs(row-col)==1
A(row col)=2
else
A(row col)=0
end A =1 2 34 5 67 8 9
Flow control for loops
for row=13
for col=13
if row==col
A(row col)=1
elseif abs(row-col)==1
A(row col)=2
else
A(row col)=0
end
end
end
A =
1 2 02 1 20 2 1
Image histogram The histogram plots the number of pixels in the image (vertical axis)
with a particular brightness value (horizontal axis)
Algorithms in the digital editor allow the user to visually adjust the brightness value of each pixel and to dynamically display the results as adjustments are made Improvements in picture brightness and contrast can thus be obtained
In the field of computer vision image histograms can be useful tools for thresholding Because the information contained in the graph is a representation of pixel distribution as a function of tonal variation image histograms can be analyzed for peaks andor valleys This threshold value can then be used for edge detection image segmentation and co-occurrence matrices (Wikipedia)
Image histogram imhist(I) calculates the histogram for the intensity image I and displays a plot
of the histogram The number of bins in the histogram is determined by the image type
imhist(In) calculates the histogram where n specifies the number of bins used in the histogram
imhist(Xmap) calculates the histogram for the indexed image X with colormap map The histogram has one bin for each entry in the colormap
Syntax [countsbinLocations] = imhist(I) [countsbinLocations] = imhist(In)
[countsbinLocations] = imhist(Xmap)
Image histogram examplegtgtI = imread(pouttif rsquo)gtgtimhist(I)gtgt imhist(I40)
gtgt[Xmap] = imread(lsquotreestif rsquo)gtgtimshow(Xmap)gtgtimhist(Xmap)
imhist(I)
Exercises Given I = imread(pouttif rsquo)
Use the lsquohisteqrsquo function to increase contrast Represent the image before and after histogram equalization
Use histogram to divide an image in lsquoBackroundrsquo andlsquoForegroundrsquo To do this choose an image frominternet and read the image directly from Matlabcommand line Try the Otsu method
EggtgtI=imread(lsquohttpsuploadwikimediaorgwikipediacommons44bImage_processing_pre_otsus_algorithmjpgrsquo)
gtgtimshow(I)
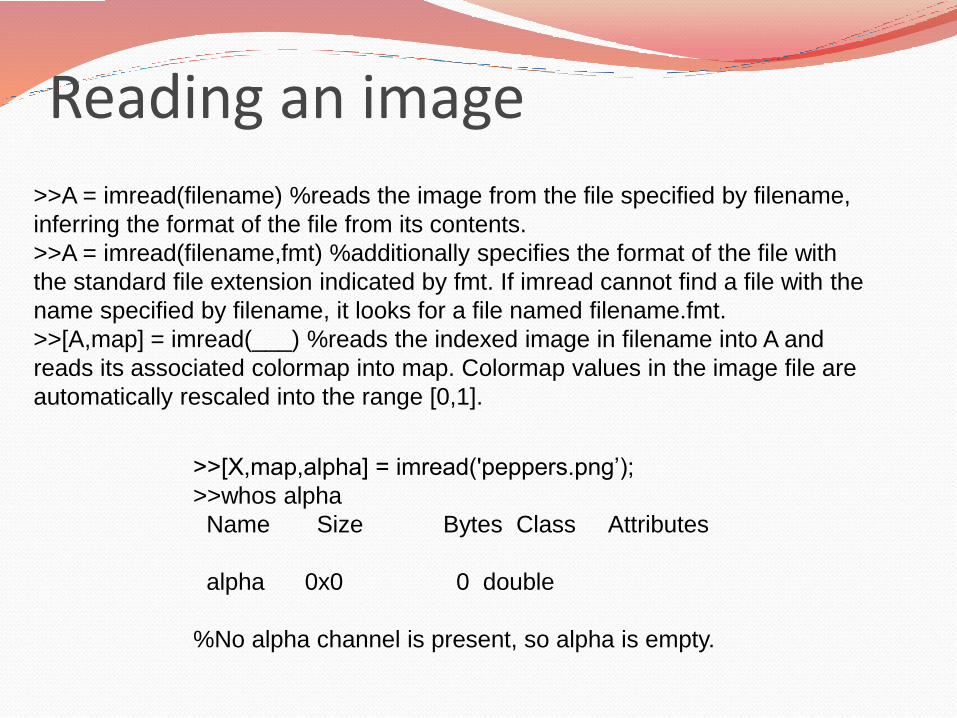
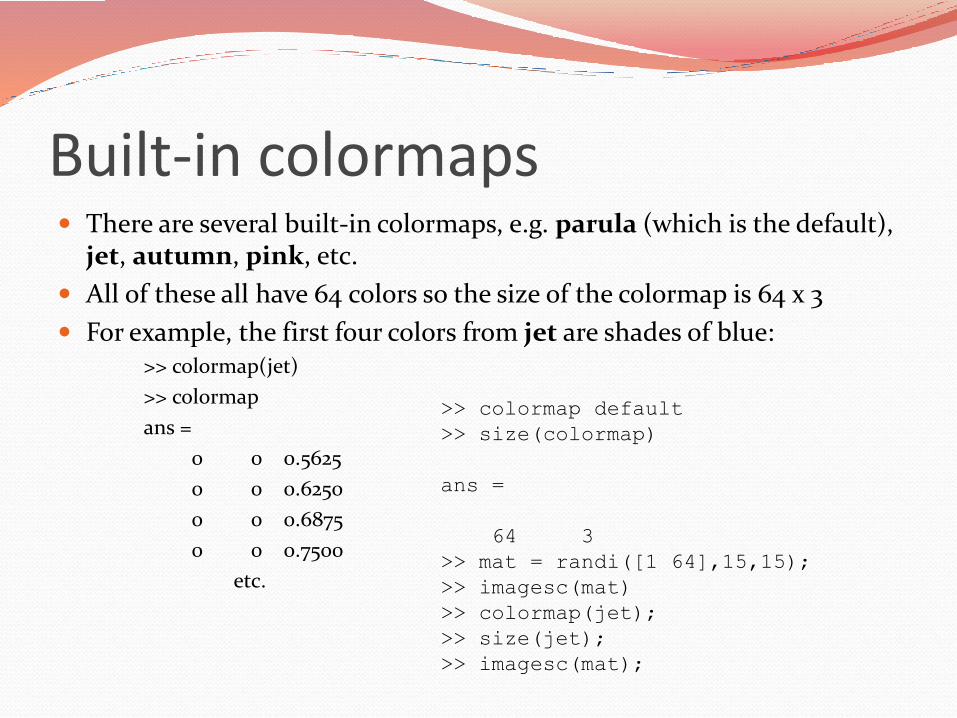
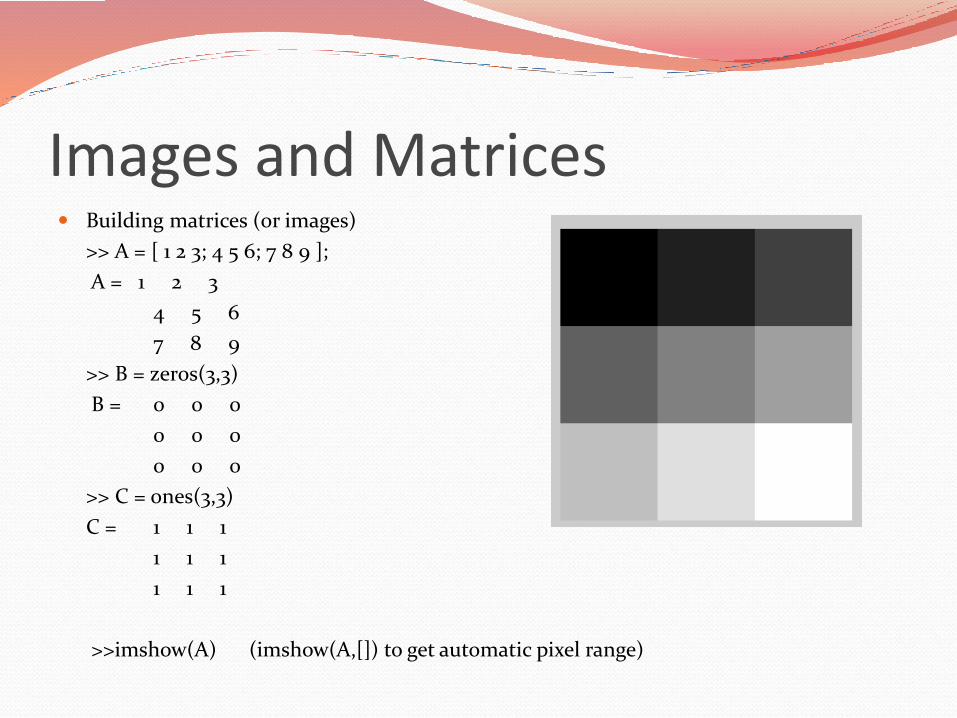
Related Documents