Image Processing Image Processing IB Paper 8 – Part A IB Paper 8 – Part A Ognjen Arandjelovi Ognjen Arandjelovi ć ć http://mi.eng.cam.ac.uk/~oa214/

Image Processing IB Paper 8 – Part A Ognjen Arandjelović Ognjen Arandjelović oa214
Dec 17, 2015
Welcome message from author
This document is posted to help you gain knowledge. Please leave a comment to let me know what you think about it! Share it to your friends and learn new things together.
Transcript

Image ProcessingImage ProcessingIB Paper 8 – Part AIB Paper 8 – Part A
Ognjen ArandjeloviOgnjen Arandjelovićć
http://mi.eng.cam.ac.uk/~oa214/

– – Image Essentials, Sampling –Image Essentials, Sampling –

Image Processing ParadigmImage Processing Paradigm
We can think of image processing as a black box that takes an input image and produces an output image.
Feature extraction, for example, does not fall under the umbrella of image processing.
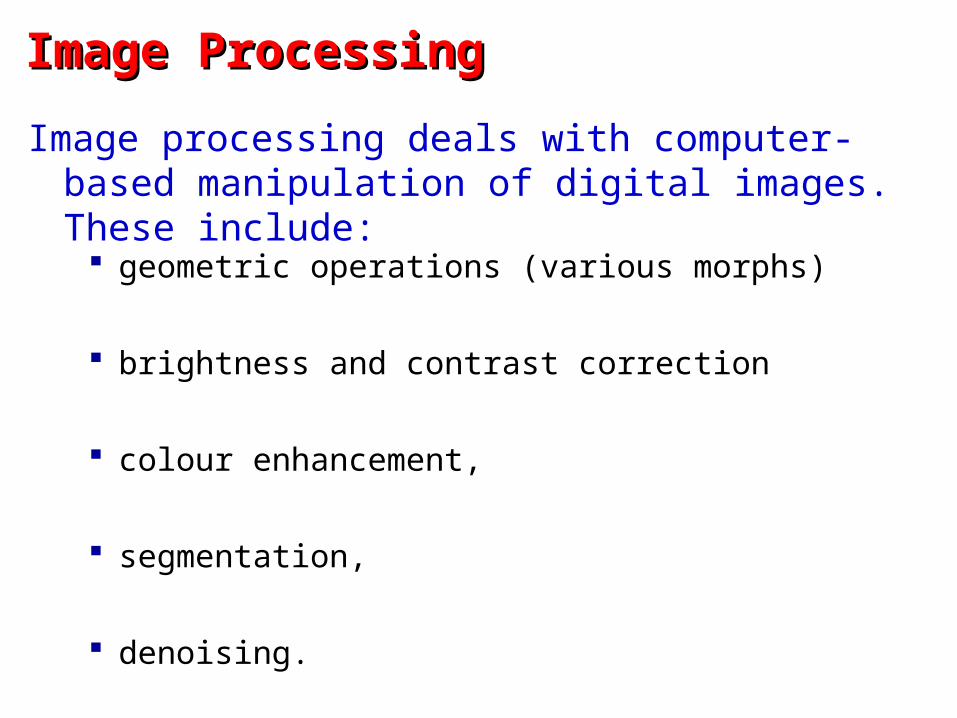
Image ProcessingImage Processing
Image processing deals with computer-based manipulation of digital images. These include:
geometric operations (various morphs)
brightness and contrast correction
colour enhancement,
segmentation,
denoising.

Fingerprint enhancement for analysis and recognition:
Image Processing ApplicationsImage Processing Applications
Original fingerprint image
After denoising and contrast enhancement
After binarization and morphological processing
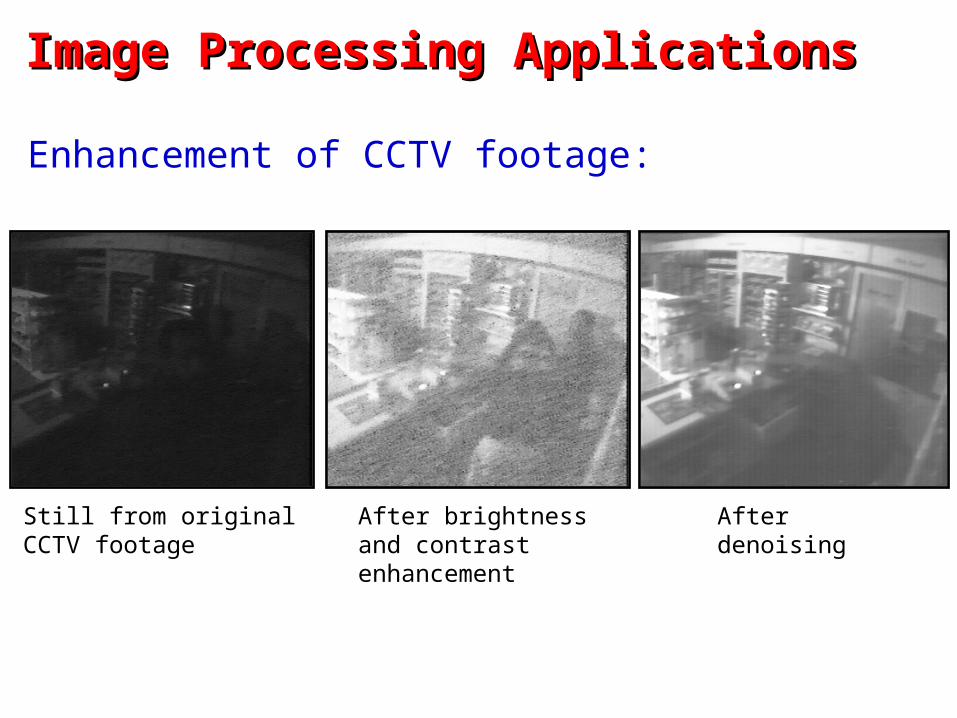
Image Processing ApplicationsImage Processing Applications
Enhancement of CCTV footage:
Still from original CCTV footage
After brightness and contrast enhancement
After denoising

Image Processing ApplicationsImage Processing Applications
Achieving illumination and pose invariance for automatic face recognition:
Still from original authentication video
After face detection and cropping
After adaptive high-pass filtering

DiscretizationDiscretization
Face geometryAn inherent cause of information loss when representing physical signals on a computer:
Two types:
Level / numericalIt is impossible to represent infinite numbers (e.g. Pi)
using a finite amount of storage space
Temporal or spatialIt is impossible to sample a signal at infinite frequency or
at infinite number of locations

Discretization Under a Magnifying GlassDiscretization Under a Magnifying Glass
An example on an image of a face:
Pixels = spatial discretization Values = numerical
discretization

Numerical QuantizationNumerical Quantization
Face geometryThe luminance of each pixel can be represented only with finite precision. This loss of information is called quantization noise.
We can compute the average quantization noise energy per pixel:
Minimal luminance difference that can be represented

Numerical Quantization – An ExampleNumerical Quantization – An Example

Spatial Discretization – An ExampleSpatial Discretization – An Example

1D Sampling1D Sampling
In 1D, we model sampling of a continuous function as multiplication by a train of delta functions:

1D Sampling – Frequency Domain1D Sampling – Frequency Domain
Multiplication in the spatial domain goes into convolution in the frequency domain:
A train of delta functions Fourier spectrum of the original 1D signal
Fourier spectrum of the sampled 1D signal

2D Sampling2D Sampling
Image as a 2D function / surface
A comb of delta functions
Much like in 1D, in 2D we model sampling of a continuous function as multiplication by a comb of delta functions:

2D Sampling – Frequency Domain2D Sampling – Frequency Domain
Fourier spectrum of a 2D signal
A comb of delta functions
Fourier spectrum of the sampled 2D signal
Much like in 1D, in 2D we model sampling of a continuous function as multiplication by a comb of delta functions:

Geometric TransformationsGeometric Transformations
Geometric transformations warp images without (in principle) changing the value of the corresponding 2D signal. Examples include:
Scaling
Cropping
Rotation
Arbitrary morphs

Geometric Transformations – AppsGeometric Transformations – Apps
Image registration for face recognition (correction of mild pose variations):

Geometric Transformations – AppsGeometric Transformations – Apps
Image warping for mosaicing of photographs:
How to perform seamless concatenation of images?

Geometric Transformations – Main IdeaGeometric Transformations – Main Idea
All geometric transformations of images at their core concern the problem of resampling.
As the original (not sampled) 2D signal cannot be accessed, we need to first reconstruct it from the set of samples we have i.e. pixels.

Signal ReconstructionSignal Reconstruction
Remember that in the case of a band-limited signal, we can obtain a perfect reconstruction using the ideal low-pass filter:
Frequency spectrum of the sampled signal
Ideal low-pass filter
Perfectly reconstructed signal
What is the problem with this?

The Ideal Low-Pass FilterThe Ideal Low-Pass Filter
Recall the Fourier transform of the ideal low-pass filter (i.e. the pulse function):
Ideal low-pass filter
Fourier transform
The sinc function
N.B.

The Ideal Low-Pass Filter in 2DThe Ideal Low-Pass Filter in 2D
Recall the Fourier transform of the ideal low-pass filter (i.e. the pulse function):
Fourier transform
Ideal 2D low-pass filterThe 2D sinc function

Reconstruction in Spatial DomainReconstruction in Spatial Domain
Using duality, we can see that the original signal can be reconstructed by convolving its sampled version with a sinc function:
The Ideal LPF in the Spatial DomainThe Ideal LPF in the Spatial Domain
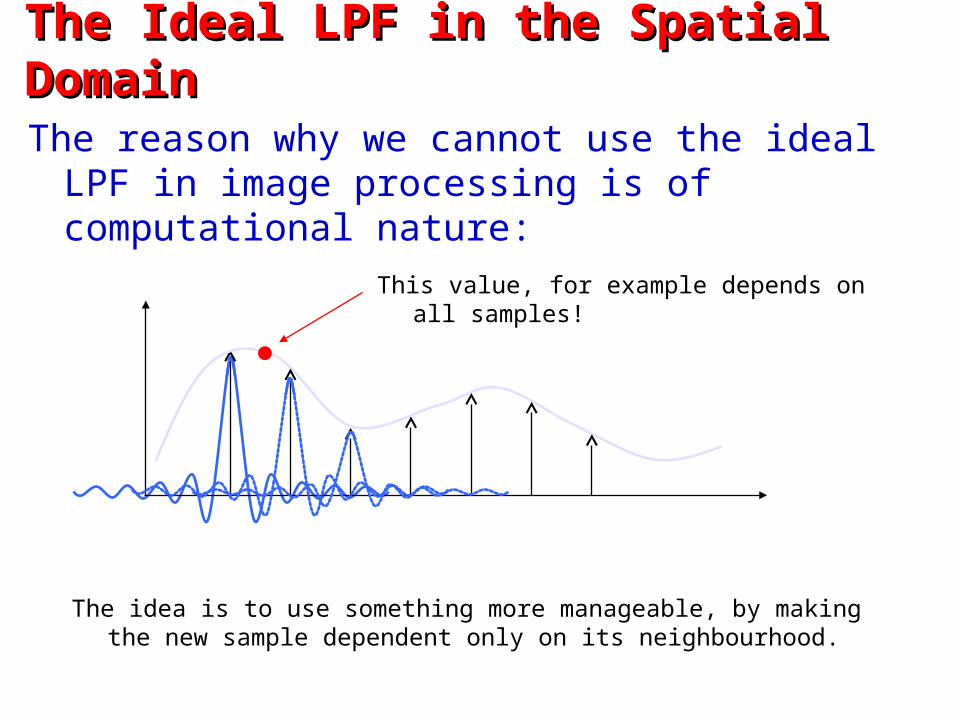
The reason why we cannot use the ideal LPF in image processing is of computational nature:
This value, for example depends on all samples!
The idea is to use something more manageable, by making the new sample dependent only on its neighbourhood.

Linear InterpolationLinear Interpolation
In linear interpolation, the signal between two samples is approximated by a straight line:
Clearly not perfect
We can thus say that the constraint is that the line should pass through the two sample points – there are 2 DOFs (a point on the line and the slope).

Linear InterpolationLinear Interpolation
We can then write an expression for the value of the function at an arbitrary location between two original samples:
Value at the new sample
Value of “pixel a” Value of “pixel b”

Bi-Linear InterpolationBi-Linear Interpolation
Bi-linear interpolation is simply a 2D extension of linear interpolation:
What is the value at this location?
Original sampling locations
Bi-Linear InterpolationBi-Linear Interpolation
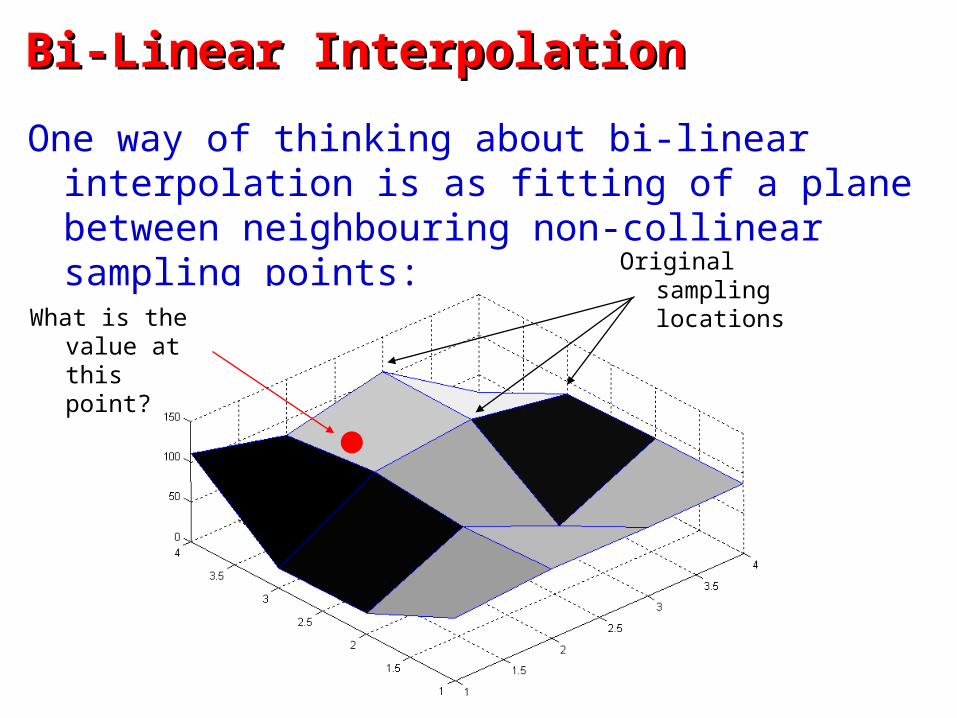
One way of thinking about bi-linear interpolation is as fitting of a plane between neighbouring non-collinear sampling points:
What is the value at this point?
Original sampling locations
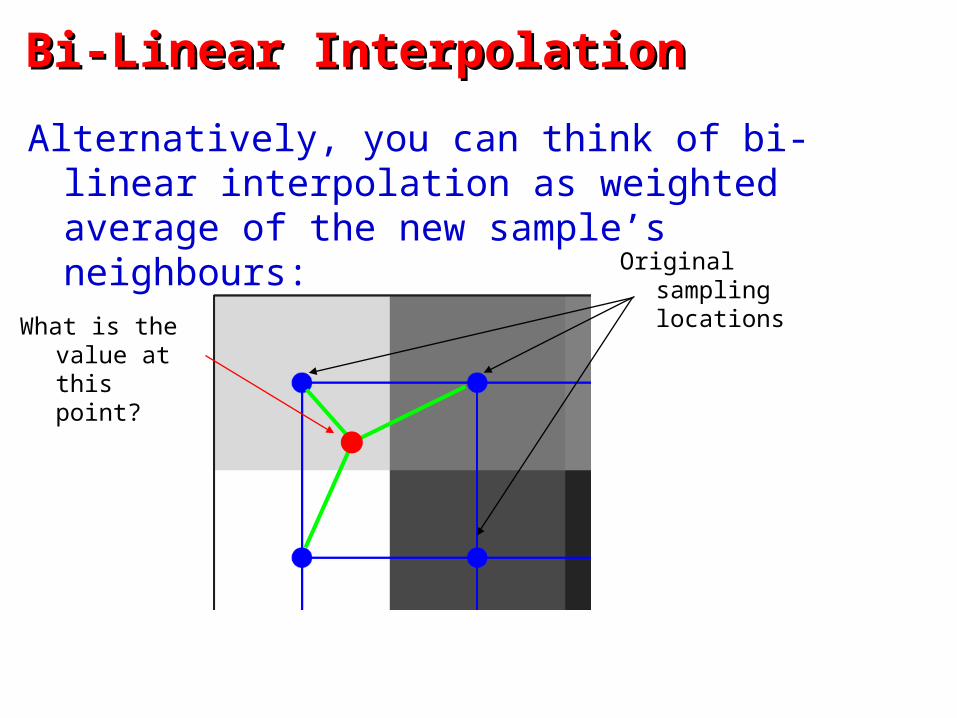
Bi-Linear InterpolationBi-Linear Interpolation
Alternatively, you can think of bi-linear interpolation as weighted average of the new sample’s neighbours:
What is the value at this point?
Original sampling locations

Cubic InterpolationCubic Interpolation
We have seen that linear interpolation is far from perfect. Cubic interpolation does better:
Much better!

Cubic Interpolation ConstraintsCubic Interpolation Constraints
In cubic interpolation we have the following constraints for segment between x2 and x3, given 4 consecutive samples x1, x2, x3, x4:
C0 Continuity:Value at x2 and x3 should be exact(as with linear interpolation)
C1 Continuity:Gradient at x2 should be (x3-x1) / 2and at x3 should be (x4-x2) / 2

The Gradient ConstraintThe Gradient Constraint
The see why the gradient at say x2 should be(x3-x1) / 2, consider 1st order Taylor series expansions around x2:
Now subtract (1) from (2):

Cubic Interpolation in 1DCubic Interpolation in 1D
The expression for cubic interpolation is thus more complicated:

Bi-Cubic InterpolationBi-Cubic Interpolation
The expression for bi-cubic interpolation gets very messy, so we do not give it here.
The principle, however, is the same – you can think of it as cubic interpolation in the x direction, followed by cubic interpolation in the y direction.

Bi-Linear vs. Bi-Cubic InterpolationBi-Linear vs. Bi-Cubic Interpolation
A summary of key differences:
Cubic produces less smoothing of the signal than linear
Cubic is about 4 times more computationally demanding and is hence seldom used for resampling of large images

Impulse Response of Linear Interp.Impulse Response of Linear Interp.
We can analyse the performance of the two interpolators by looking at their impulse responses:
An impulse
Impulse response of the linear interpolation process

Impulse Response of Linear Interp.Impulse Response of Linear Interp.
By taking the Fourier transform of impulse responses of the two interpolators, we can see how they affect different frequencies:
Frequency response of cubic interpolation is much flatter at higher frequencies – closer to the ideal LPF.
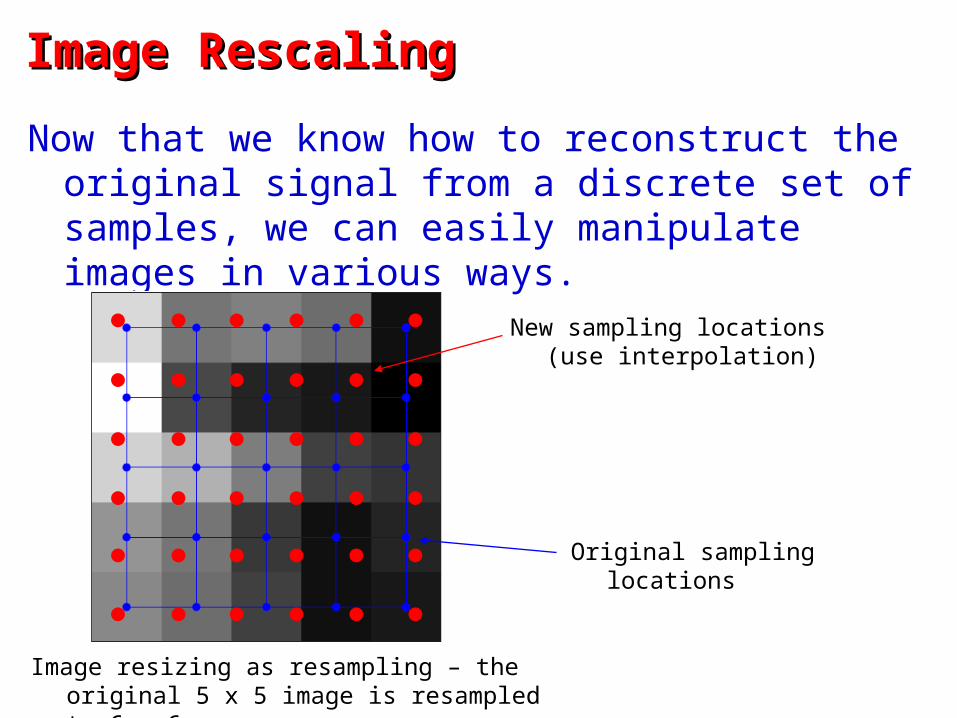
Image RescalingImage Rescaling
Now that we know how to reconstruct the original signal from a discrete set of samples, we can easily manipulate images in various ways.
Image resizing as resampling – the original 5 х 5 image is resampled to 6 х 6.
New sampling locations(use interpolation)
Original sampling locations

Image Rescaling ExampleImage Rescaling Example
To examine the effects of resampling, let us look at a small rectangular patch extracted from CCTV footage:
Magnified patch – 50 х 90 pixels

Image Rescaling ExampleImage Rescaling Example
Let us now compare the results of bi-linear and bi-cubic interpolation-based magnification for a factor of 2:
Bi-linear Bi-cubic
Note that bi-linear magnification produces a much smoother result.

Rescaling Comparison – An ExampleRescaling Comparison – An Example
Quantitative insight can be gained by looking at the image difference of two results:
As expected from theory, the difference is mainly in the high-frequency content.

Downsampling CaveatsDownsampling Caveats
Remember that the original signal can be reconstructed from a set of samples using a LPF only if it is band-limited:
A train of delta functions Fourier spectrum of the original 1D signal
Fourier spectrum of the sampled 1D signal
No overlap of spectrum ‘replicas’ (this overlap is called aliasing)
It is crucial to ensure that the signal is band-limited before downsampling.
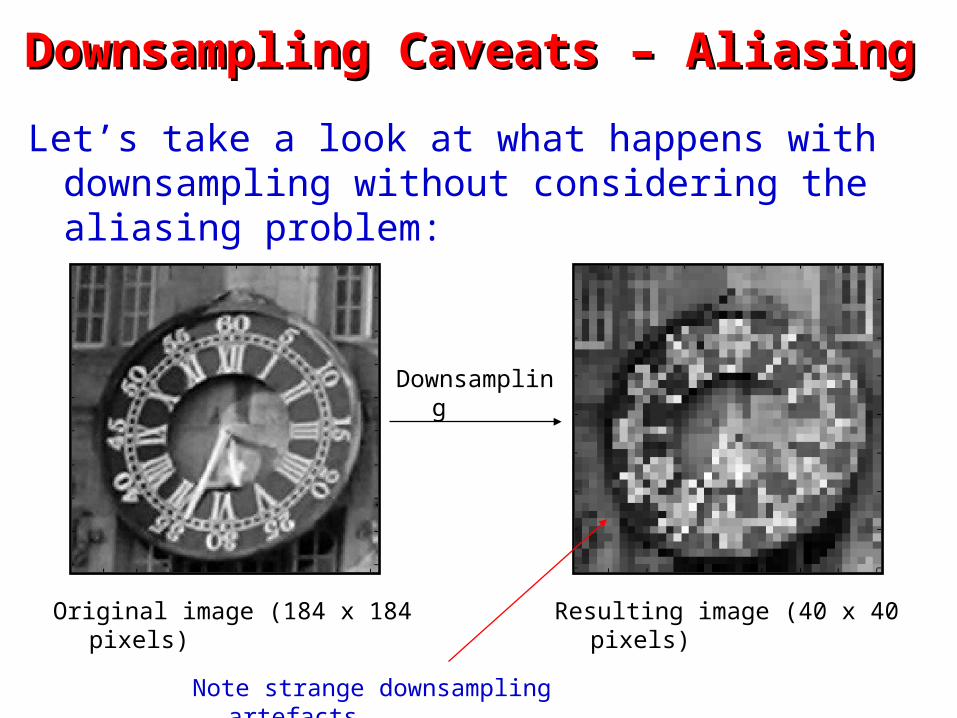
Downsampling Caveats – AliasingDownsampling Caveats – Aliasing
Let’s take a look at what happens with downsampling without considering the aliasing problem:
Original image (184 х 184 pixels) Resulting image (40 х 40 pixels)
Downsampling
Note strange downsampling artefacts.

Downsampling Caveats – AliasingDownsampling Caveats – Aliasing
To ensure that high frequencies are suppressed, the original image should first be LP filtered:
Original image (184 х 184 pixels) Low-pass smoothed image
Gaussian Smoothing

Downsampling Caveats – AliasingDownsampling Caveats – Aliasing
Now we can downsample as before, without worrying about aliasing:
Low-pass smoothed image Resulting image (40 х 40 pixels)
Downsampling

Downsampling Caveats – AliasingDownsampling Caveats – Aliasing
Compare the results (or try switching anti-aliasing off in your Acrobat Reader!):
Without LP filtering With LP filtering

Image RotationImage Rotation
Now that we know how to reconstruct the original signal from a discrete set of samples, we can easily manipulate images in various ways.
Image rotation as resampling – the original 5 х 5 image is rotated ~30 degrees clockwise.
New sampling locations(use interpolation)
Original sampling locations
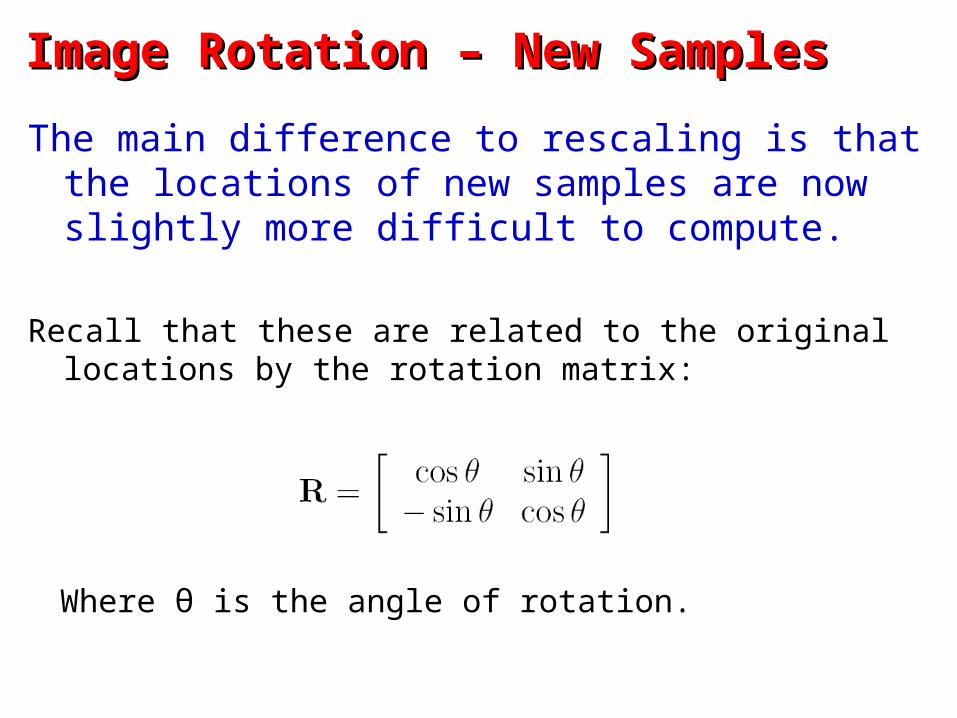
Image Rotation – New SamplesImage Rotation – New Samples
The main difference to rescaling is that the locations of new samples are now slightly more difficult to compute.
Recall that these are related to the original locations by the rotation matrix:
Where θ is the angle of rotation.

Image Rotation – Image SizeImage Rotation – Image Size
Note that the size of the resulting, rotated image is in general different than the size of the original image.
If the input image is of size H х W pixels, then the output image is of size H' х W' pixels, where:
The ceiling operator

Image Rotation – Image SizeImage Rotation – Image Size
Note that the size of the resulting, rotated image is in general different than the size of the original image.

Image Rotation – An ExampleImage Rotation – An Example
Original fingerprint
(480 х 400 pixels)
Fingerprint rotated by 60 degrees
(586 х 615 pixels)

– – That is All for Today –That is All for Today –
Related Documents