1986 IEEE JOURNAL OF SELECTED TOPICS INAPPLIED EARTH OBSERVATIONS AND REMOTE SENSING, VOL. 8, NO. 5, MAY2015 Image Enhancement and Feature Extraction Based on Low-Resolution Satellite Data Vasileios Syrris, Stefano Ferri, Daniele Ehrlich, and Martino Pesaresi Abstract—The purpose of this study is to investigate the sensi- tivity of contrast-based textural measurements and morphological characteristics that derive from high-resolution satellite imagery (three-band SPOT-5) when diverse image enhancements tech- niques are piloted. The general framework of the application is the built-up/nonbuilt-up detection. In the existence of a low-resolution reference layer, we apply supervised learning that indirectly reduces the uncertainty and improves the quality of the reference layer. Based on the new class label assignments, the image his- togram is adjusted suitably for the computation of contrast-based textural/morphological features. A case study is presented where we test a mixture of image enhancement operations like linear and decorrelation stretching and assess the performance through ROC analysis against available building footprints. Experimental results demonstrate that spectral band combination is the key factor that conditions the contrast of grayscale images. Contrast adjustment (before or after the band combination and merging) supports considerably the extraction of informative features from a low-contrast image; in case of a well-contrasted image, the improvement is marginal. Index Terms—Built-up detection, contrast adjustment, feature extraction, high-resolution image enhancement, low-resolution reference data, morphological, supervised learning, support vector machines (SVMs), textural. I. I NTRODUCTION I N the context of contrast-based feature extraction from high-resolution satellite imagery, image enhancement tech- niques are utilized to modify the band intensities and decrease the noise that covers significant information. Typical image enhancement techniques are as follows: linear contrast adjustment, decorrelation stretching, histogram equalization, and adaptive filtering [1]–[4] classified as pixel/spatial-based approaches. Fourier decomposition, wavelet transform, and dis- crete cosine transform [2], [5], [6] are alternative approaches that belong to the frequency-domain techniques. The majority of the aforementioned techniques aim at improving the visual inspection of the image and usually involves manual parame- ter tuning. The requirements of our application, as delineated further down, impose a fully automated approach combined Manuscript received September 30, 2014; revised February 01, 2015; accepted March 13, 2015. Date of publication April 12, 2015; date of current version July 20, 2015. The authors are with the European Commission, Joint Research Centre (JRC), Institute for the Protection and Security of the Citizen (IPSC), Global Security and Crisis Management Unit, I-21027 Ispra, Italy (e-mail: [email protected]; [email protected]; [email protected]; [email protected]). Color versions of one or more of the figures in this paper are available online at http://ieeexplore.ieee.org. Digital Object Identifier 10.1109/JSTARS.2015.2417864 with a low-complexity algorithm for massive image process- ing. The framework of the specific application is defined by the following considerations and assumptions. 1) Within the operational project of generating a wall-to- wall layer of human settlements in Europe, we pro- cessed in a massive and automated way more than 2000 very high-resolution (VHR) satellite images pro- vided by the Copernicus European Earth Observation Program by means of the Copernicus Core_003 SPOT- 5 satellite imagery dataset [7], [8]. These data consist of SPOT-5 images with continental coverage of Europe and the following basic technical characteristics: a) ETRS89 Lambert equal area (LAEA) projection; b) spatial resolu- tion at 2.5 m; and c) three spectral bands: green (bG), red (bR), and near infrared (bNI). 2) The images were not calibrated to account for seasonal and atmospheric factors. As such and without further amplification, they have been treated directly by the processing modules. 3) The resulting classification was based on textural and morphological features. Analytical description of the fea- tures can be found in [10]. The ground for this study shaped from the need of finding a consistent and automatic way for the standardization of the uncalibrated images. Our main goal was to test the sensitiv- ity of contrast-based textural measurements and morphological characteristics when computed over different gray representa- tions. Thereafter, a second objective was the investigation of alternative ways, statistical in their nature, which might provide a suitable means for conducting standardized feature extraction. Accordingly, we present herein some experimental results and we put forward a statistical learning approach for the sta- bilization of the image contrast sensitivity to different prepro- cessing conditions. In particular, a simple algorithmic schema is proposed as described briefly below. 1) A binary classifier [support vector machine (SVM)] is trained in the light of a low-resolution reference layer. 2) The optimal hyperplane that separates the two classes: 1) built-up (BU); and 2) nonbuilt-up (NBU) is estimated through a nonlinear mapping. 3) The class labels of the reference layer are modified via ad hoc treatment of the respective training samples that delimit the hyperplane into a high-dimensional feature space. 4) A histogram adjustment driven by the reference layer is applied per class. In practice, this turns out to instruct and facilitate mostly the extraction of the textural measure- ments. 1939-1404 © 2015 IEEE. Translations and content mining are permitted for academic research only. Personal use is also permitted, but republication/redistribution requires IEEE permission. See http://www.ieee.org/publications_standards/publications/rights/index.html for more information.

Welcome message from author
This document is posted to help you gain knowledge. Please leave a comment to let me know what you think about it! Share it to your friends and learn new things together.
Transcript
1986 IEEE JOURNAL OF SELECTED TOPICS IN APPLIED EARTH OBSERVATIONS AND REMOTE SENSING, VOL. 8, NO. 5, MAY 2015
Image Enhancement and Feature Extraction Basedon Low-Resolution Satellite Data
Vasileios Syrris, Stefano Ferri, Daniele Ehrlich, and Martino Pesaresi
Abstract—The purpose of this study is to investigate the sensi-tivity of contrast-based textural measurements and morphologicalcharacteristics that derive from high-resolution satellite imagery(three-band SPOT-5) when diverse image enhancements tech-niques are piloted. The general framework of the application is thebuilt-up/nonbuilt-up detection. In the existence of a low-resolutionreference layer, we apply supervised learning that indirectlyreduces the uncertainty and improves the quality of the referencelayer. Based on the new class label assignments, the image his-togram is adjusted suitably for the computation of contrast-basedtextural/morphological features. A case study is presented wherewe test a mixture of image enhancement operations like linearand decorrelation stretching and assess the performance throughROC analysis against available building footprints. Experimentalresults demonstrate that spectral band combination is the keyfactor that conditions the contrast of grayscale images. Contrastadjustment (before or after the band combination and merging)supports considerably the extraction of informative features froma low-contrast image; in case of a well-contrasted image, theimprovement is marginal.
Index Terms—Built-up detection, contrast adjustment, featureextraction, high-resolution image enhancement, low-resolutionreference data, morphological, supervised learning, support vectormachines (SVMs), textural.
I. INTRODUCTION
I N the context of contrast-based feature extraction fromhigh-resolution satellite imagery, image enhancement tech-
niques are utilized to modify the band intensities anddecrease the noise that covers significant information. Typicalimage enhancement techniques are as follows: linear contrastadjustment, decorrelation stretching, histogram equalization,and adaptive filtering [1]–[4] classified as pixel/spatial-basedapproaches. Fourier decomposition, wavelet transform, and dis-crete cosine transform [2], [5], [6] are alternative approachesthat belong to the frequency-domain techniques. The majorityof the aforementioned techniques aim at improving the visualinspection of the image and usually involves manual parame-ter tuning. The requirements of our application, as delineatedfurther down, impose a fully automated approach combined
Manuscript received September 30, 2014; revised February 01, 2015;accepted March 13, 2015. Date of publication April 12, 2015; date of currentversion July 20, 2015.
The authors are with the European Commission, Joint ResearchCentre (JRC), Institute for the Protection and Security of the Citizen(IPSC), Global Security and Crisis Management Unit, I-21027 Ispra,Italy (e-mail: [email protected]; [email protected];[email protected]; [email protected]).
Color versions of one or more of the figures in this paper are available onlineat http://ieeexplore.ieee.org.
Digital Object Identifier 10.1109/JSTARS.2015.2417864
with a low-complexity algorithm for massive image process-ing. The framework of the specific application is defined by thefollowing considerations and assumptions.
1) Within the operational project of generating a wall-to-wall layer of human settlements in Europe, we pro-cessed in a massive and automated way more than2000 very high-resolution (VHR) satellite images pro-vided by the Copernicus European Earth ObservationProgram by means of the Copernicus Core_003 SPOT-5 satellite imagery dataset [7], [8]. These data consist ofSPOT-5 images with continental coverage of Europe andthe following basic technical characteristics: a) ETRS89Lambert equal area (LAEA) projection; b) spatial resolu-tion at 2.5 m; and c) three spectral bands: green (bG), red(bR), and near infrared (bNI).
2) The images were not calibrated to account for seasonaland atmospheric factors. As such and without furtheramplification, they have been treated directly by theprocessing modules.
3) The resulting classification was based on textural andmorphological features. Analytical description of the fea-tures can be found in [10].
The ground for this study shaped from the need of findinga consistent and automatic way for the standardization of theuncalibrated images. Our main goal was to test the sensitiv-ity of contrast-based textural measurements and morphologicalcharacteristics when computed over different gray representa-tions. Thereafter, a second objective was the investigation ofalternative ways, statistical in their nature, which might providea suitable means for conducting standardized feature extraction.
Accordingly, we present herein some experimental resultsand we put forward a statistical learning approach for the sta-bilization of the image contrast sensitivity to different prepro-cessing conditions. In particular, a simple algorithmic schemais proposed as described briefly below.
1) A binary classifier [support vector machine (SVM)] istrained in the light of a low-resolution reference layer.
2) The optimal hyperplane that separates the two classes:1) built-up (BU); and 2) nonbuilt-up (NBU) is estimatedthrough a nonlinear mapping.
3) The class labels of the reference layer are modified viaad hoc treatment of the respective training samples thatdelimit the hyperplane into a high-dimensional featurespace.
4) A histogram adjustment driven by the reference layer isapplied per class. In practice, this turns out to instruct andfacilitate mostly the extraction of the textural measure-ments.
1939-1404 © 2015 IEEE. Translations and content mining are permitted for academic research only. Personal use is also permitted, but republication/redistributionrequires IEEE permission. See http://www.ieee.org/publications_standards/publications/rights/index.html for more information.
SYRRIS et al.: IMAGE ENHANCEMENT AND FEATURE EXTRACTION BASED ON LOW-RESOLUTION SATELLITE DATA 1987
For the needs of supervised learning, we exploited the exis-tence of the soil sealing layer (SSL). This is a raster datasetof European areas providing information of the degree of soilsealing in aggregated spatial resolution of 100 m× 100 m [11].Main traits of the specific product are its completeness and itsrelatively high overall accuracy, observed largely in dense BUareas [12].
The proposed approach constitutes a data preparation phasejust before the feature extraction. It attempts to improvethe quality of the textural/morphological characteristics whileretaining the computational burden in low levels. Generallyspeaking, it moves inside the concept of synergy betweenmachine learning and image processing; one contiguous appli-cation has been presented recently in [13].
This paper is organized as follows. Section II describes thealgorithmic schema, the assumptions, and the parameterization.Section III explains the experimental setup; results are demon-strated for the city of Torino, Italy, while the performance isassessed through ROC analysis with the aid of a footprint layerat 2.5-m spatial resolution. Section IV discusses the findings ofthe experimental study and Section V summarizes and providessuggestions for future work.
II. SCHEMA DEFINITION
A. Image Features
The textural measurements we are interested in are esti-mated through the Haralick’s measure for the intensity contrastbetween a pixel and its neighbors [14]. The factors (quanti-zation, length, and orientation) and the operators like fuzzycomposition are defined in [15]; the produced textural layer isknown as PANTEX.
Regarding the morphological features, we included in ourtests a recently introduced index named morphological buildingindex (MBI) [16], [17]. It is a quite accurate indicator that con-siders the characteristics of buildings (brightness, size, contrast,directionality, and shape) by integrating multiscale and multidi-rectional morphological operators. Note that both PANTEX andMBI are automatic indices and their operation is not based onstatistical learning and training samples.
Trying to reduce the high dimensionality of the cooccurrencematrix over which the textural measurements are computed,we convert the multiband images to 8-bit grayscale. Besides,the graylevel images are suitable to work with morphologicaloperators. The challenge now is to adjust selectively the imageintensities, so that the difference between the pixel values thatrefer to BU and NBU to be as high as possible; in this manner,the BU representation becomes distinguishable. The contrastadjustment can be done either during the image conversion tograyscale by means of a suitable spectral band combination orby modifying the histogram of the image intensities.
B. Syllogism
The typical reasoning of supervised learning suggests the useof a BU/NBU template to drive the contrast tuning. Given thatthe specific application has to do with satellite images that cover
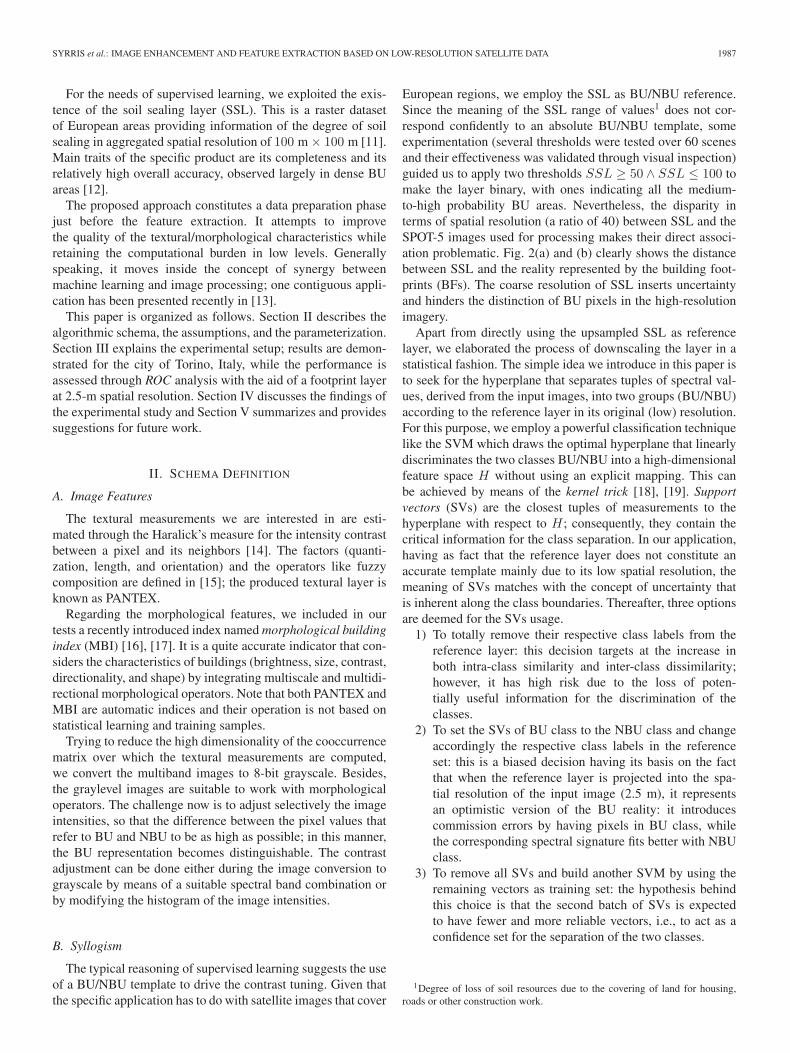
European regions, we employ the SSL as BU/NBU reference.Since the meaning of the SSL range of values1 does not cor-respond confidently to an absolute BU/NBU template, someexperimentation (several thresholds were tested over 60 scenesand their effectiveness was validated through visual inspection)guided us to apply two thresholds SSL ≥ 50 ∧ SSL ≤ 100 tomake the layer binary, with ones indicating all the medium-to-high probability BU areas. Nevertheless, the disparity interms of spatial resolution (a ratio of 40) between SSL and theSPOT-5 images used for processing makes their direct associ-ation problematic. Fig. 2(a) and (b) clearly shows the distancebetween SSL and the reality represented by the building foot-prints (BFs). The coarse resolution of SSL inserts uncertaintyand hinders the distinction of BU pixels in the high-resolutionimagery.
Apart from directly using the upsampled SSL as referencelayer, we elaborated the process of downscaling the layer in astatistical fashion. The simple idea we introduce in this paper isto seek for the hyperplane that separates tuples of spectral val-ues, derived from the input images, into two groups (BU/NBU)according to the reference layer in its original (low) resolution.For this purpose, we employ a powerful classification techniquelike the SVM which draws the optimal hyperplane that linearlydiscriminates the two classes BU/NBU into a high-dimensionalfeature space H without using an explicit mapping. This canbe achieved by means of the kernel trick [18], [19]. Supportvectors (SVs) are the closest tuples of measurements to thehyperplane with respect to H; consequently, they contain thecritical information for the class separation. In our application,having as fact that the reference layer does not constitute anaccurate template mainly due to its low spatial resolution, themeaning of SVs matches with the concept of uncertainty thatis inherent along the class boundaries. Thereafter, three optionsare deemed for the SVs usage.
1) To totally remove their respective class labels from thereference layer: this decision targets at the increase inboth intra-class similarity and inter-class dissimilarity;however, it has high risk due to the loss of poten-tially useful information for the discrimination of theclasses.
2) To set the SVs of BU class to the NBU class and changeaccordingly the respective class labels in the referenceset: this is a biased decision having its basis on the factthat when the reference layer is projected into the spa-tial resolution of the input image (2.5 m), it representsan optimistic version of the BU reality: it introducescommission errors by having pixels in BU class, whilethe corresponding spectral signature fits better with NBUclass.
3) To remove all SVs and build another SVM by using theremaining vectors as training set: the hypothesis behindthis choice is that the second batch of SVs is expectedto have fewer and more reliable vectors, i.e., to act as aconfidence set for the separation of the two classes.
1Degree of loss of soil resources due to the covering of land for housing,roads or other construction work.
1988 IEEE JOURNAL OF SELECTED TOPICS IN APPLIED EARTH OBSERVATIONS AND REMOTE SENSING, VOL. 8, NO. 5, MAY 2015
C. Generating Reference Sets
Let Im×n×3 be the input image with m and n denoting thenumber of rows and columns, respectively, per image band.Next, I is downsampled to the spatial resolution of the referencelayer using interpolation and the average operator; it becomesX = [bNI bR bG]k×3 = [xi=1,...,k] with column vectors bNI ,bR, and bG denoting the bands near infrared, red, and green,respectively; xi signifies triplets and k denotes the number ofpixels per band. The downsampling saves much of the compu-tational burden to compute the kernel/similarity matrix requiredby the SVM [training complexity O(3k2)]. The binary refer-ence layer is represented by the vector SSL
(1)k = [yi=1,...,k],
yi ∈ {−1, 1}, where −1 refers to the class NBU and 1 to theclass BU. The superscript of SSL notation indicates the versionof the reference layer and the subscript denotes the number ofpixels.
Subsequently, we solve the dual soft margin problem throughLagrange formulation
max∑
ai − 1
2
∑∑aiajyiyjK(xi, xj)
subject to∑
aiyi = 0 and 0 ≤ ai ≤ C.(1)
The kernel function K(xi, xj) = 〈Φ(xi),Φ(xj)〉 expressesthe inner product in a high-dimensional feature space H =Φ(X)where the two classes can potentially be linearly separa-ble; it encapsulates the notion of similarity between two vectorsinto Φ(X). The dual variables ai are the Lagrange multipliersand essentially play the role of weights for the kernel functions.The control variable C > 0 is used to penalize classificationerrors during training. The solution of (1) leads to the definitionof the discrimination function: f(x) =
∑v avyvK(x, xv) + b,
where xv : v ∈ V ⊂ {1, . . . , k} are the SVs and b isthe bias.
Then, we generate a new reference layer by following one ofthe three options described in Section II-B.
1) SSL(2)k =
{yj , j /∈ V
0, otherwise.
2) SSL(3)k =
{yj , j /∈ V
−1, otherwise.
3) Build a new SVM by using X = [xj ] ∀j /∈ V as train-ing set and define the respective discrimination function.Subsequently, utilize this function to classify the pixelsof the original image Imn×3. The resulting binary imageSSL
(4)m×nbecomes the new reference. Actually, it repre-
sents the downscaled version of SSL(1). Note that thenumber of SVs derived from the second SVM is 30–40 times less than the number of the first SVs. Thisreduces a lot the classification complexity that scaleslinearly with the number of SVs.
The following listing describes the generation of the alterna-tive reference images and the downscaling method using a typeof pseudocode.
Algorithm 1. Generate Reference Images Pseudocode
1: I ← Input multiband image2: Ref ← Binary image (−1, 1) used as reference3: X ← Downsample(I) according to Ref dimensions4: Train SVM(X,Ref)5: SV = {xv : v ∈ V }6: Generate new reference Y ← Ref:
Option (i) : Set 0 to the pixels of Y that correspond tothe support vectors of SVOption (ii) : Set −1 to the pixels of Y that correspondto the support vectors of SVOption (iii): Train SVM(X\SV,Y{yj , j ∈ V })
SV1 = {new support vectors}Y = SVMclassify(I, SV1)
Output Y
Fig. 1. Two experimental configurations.
D. Contrast Adjustment
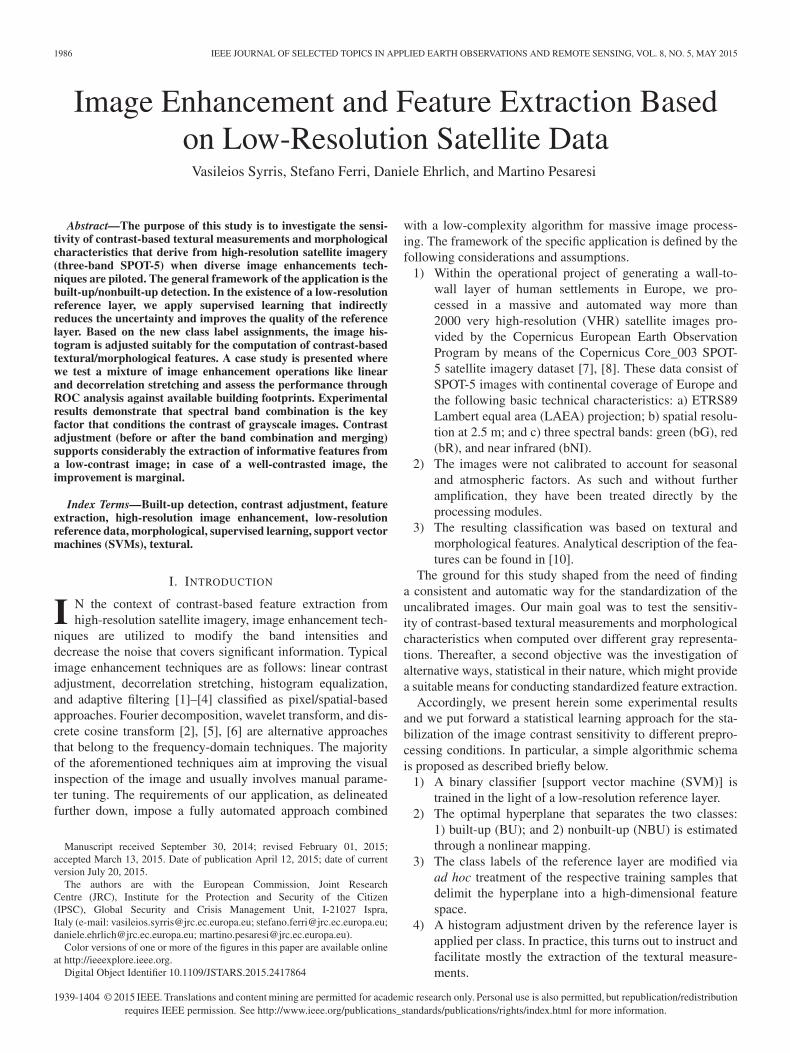
The last processing stage refers to the adjustment of theimage histogram. At this point, we explore two scenar-ios. (C1) The original image is converted to grayscale, andthen, the contrast adjustment takes place. (C2) The histogramadjustment is done separately for each band of the origi-nal image (multichannel histogram stretching), and then, thebands are merged to form a grayscale image. Fig. 1 dis-plays the two experimental scenarios using flow charts. Inboth cases, the operation occurs in the spatial domain ofsize m× n. Accordingly, SSL
(1)k , SSL(2)
k , SSL(3)k become
SSL(1)m×n, SSL(2)
m×n, SSL(3)m×n through nearest neighbor (NN)
interpolation. All the reference images are displayed in Fig. 2.Let Bm×n denote the input image and SSLm×nrepresent
one of the four available reference images. Herein, we describeand put in the test eight different computations for the stretchingof image values
∀l : yl = −1 ∨ yl = 1, yl ∈ SSLm×n
→ pupdatedl =min (max (pl, a) , b)− a
b− a, pl ∈ Bm×n
(M1.1) Where a = p̄l − rspland b = p̄l + rspl
with p̄l denoting the mean of pl and spldenoting the
respective standard deviation; r = 2 for both classes.
SYRRIS et al.: IMAGE ENHANCEMENT AND FEATURE EXTRACTION BASED ON LOW-RESOLUTION SATELLITE DATA 1989
Fig. 2. Reference layers at 2.5-m spatial resolution: (a) City of Torino: building footprints covered an area of 6.5× 8.24 km; (b) SSL(1); (c) SSL(2);(d) SSL(3); and (e) SSL(4). The images in (b), (c), and (d) have been resized via nearest neighbor interpolation to match the resolution of the input image. In(c), the darker pixels have been omitted completely.
(M1.2) The same as in (M1.1) but r =
{1, yl = 1
2, yl = −1.
(M1.3) The same as in (M1.1) but r =
{2, yl = 1
1, yl = −1.(M1.4) The same as in (M1.1) but for the class 1, i.e., only the
values that refer to BU are modified, whereas the othervalues remain intact.
(M2.1) a = max(min(pl), r1) and b = min(max(pl), r2),r1 = 0, r2 = 255
(M2.2) The same as in (M2.1) but r1 = 0.1 ∗ 255 and r2 =0.9 ∗ 255.
(M2.3) The same as in (M2.1) but only for the class 1.(M2.4) The same as in (M2.2) but only for the class 1.
III. EXPERIMENTAL SETUP
The central question in this paper is whether a low-resolutionreference layer can improve the contrast adjustment of animage. A further significant issue in the case of a positiveanswer is to find the most effective processing stage: duringimage conversion to grayscale via a good band combination orthrough operations over the image intensities?
In order to test the band combinations, we established sevenscenarios. (O1) RGmax = max(bR, bG) refers to the maxi-mum decomposition of a multichannel image and results in abrighter grayscale image. It is also related to the Value com-ponent of the HSV color model. (O2) RGlinear = 0.3559bR+0.6441bG constitutes a modification of luma that is defined asthe weighted average of gamma-corrected RGB; it is a standardband combination fitted on how human eye perceives color. Theweight for the blue band has been shared equally to the othertwo weights. (O3) RGNIlinear = 0.2989bR+ 0.5870bG+0.1140bNI: the luma linear combination with the blue bandto have been substituted by the infrared. (O4) NIRGlinear =0.2989bNI + 0.5870bR+ 0.1140bG: the same weights as in(O3) but following a different band order; the next linearcombinations (O5) RGlinearD, (O6) RGNIlinearD, and (O7)NIRGlinearD are defined in the same way as (O2), (O3),and (O4), respectively, with the difference that the bands arethe decorrelated versions of the original ones. The specificapplication of decorrelation stretch keeps the same image statis-tics in both input and output images. At the end, we tested
7 input images × 2 histogram adjustment scenarios × (4 ref-erence layers + 1 test without reference) × 8 ways of contraststretching = 560 cases.
Regarding the SVM parameter settings, the Gaussian radialbasis function (RBF) was selected as kernel
K(xi, xj) = exp(−‖xi − xj‖2/2σ2
)with σ = 0.6 width/scaling factor; the control parameter
C was set to 1 for all the vectors. The hyper-parameterswere defined and optimized through cross-validation, usingas test cases areas where BFs are available. As regards thekernel selection, we also experimented with the linear andthe quadratic kernel, mainly due to their relatively low com-putational cost; however, the Gaussian RBF kernel turnedout to define better the separation hyperplane and to capturethe nonlinearity in the original feature space. Concerning theextraction of the textural measurements, a squared windowof size 25 m was considered suitable for the computation ofcooccurrence matrices at 2.5-m resolution. For the MBI, weselected four directions (45◦, 90◦, 135◦, and 180◦) and threescales (5, 17, and 29).
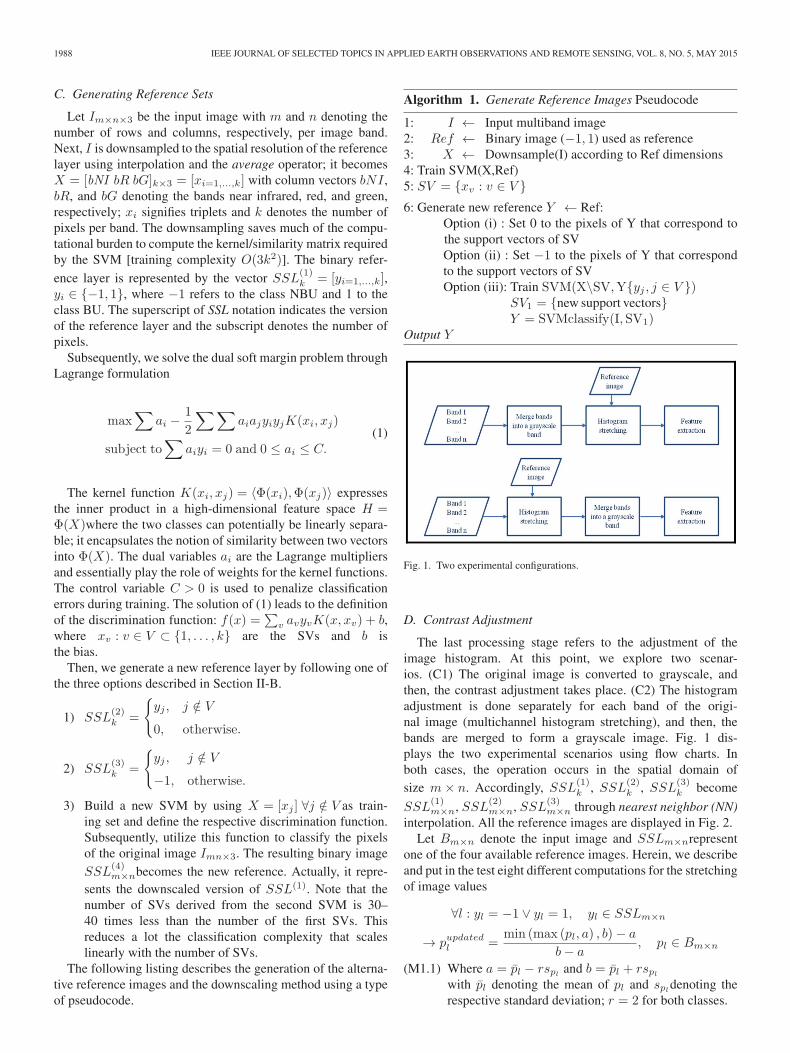
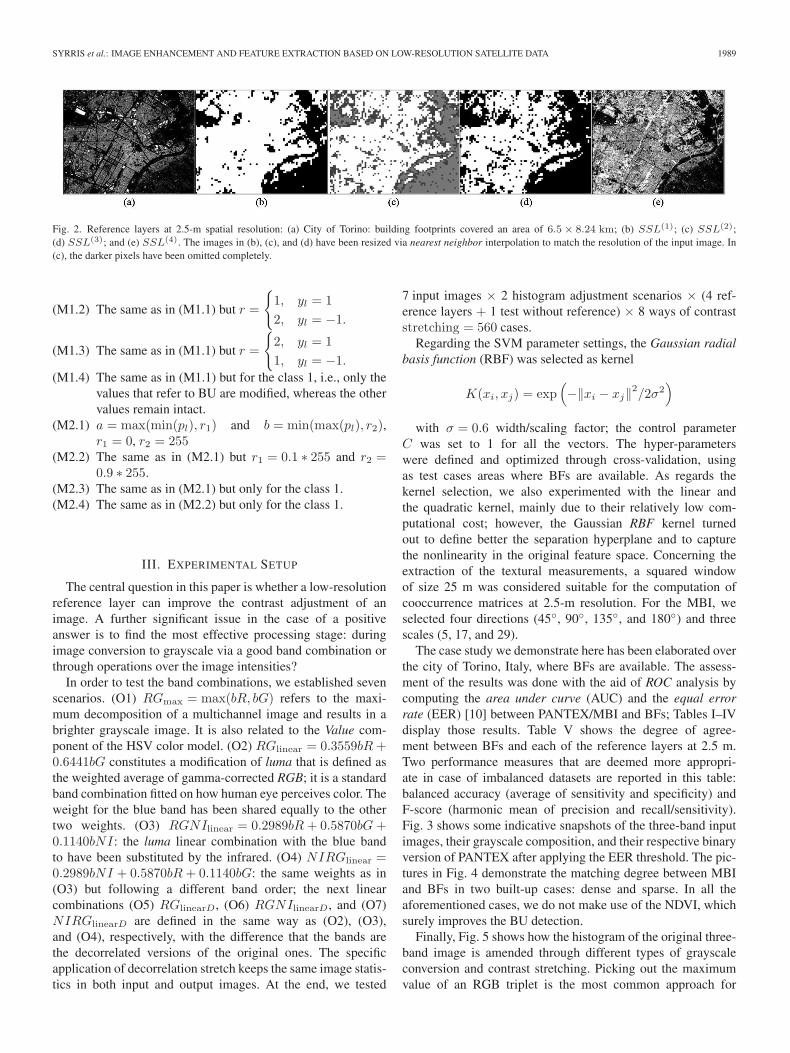
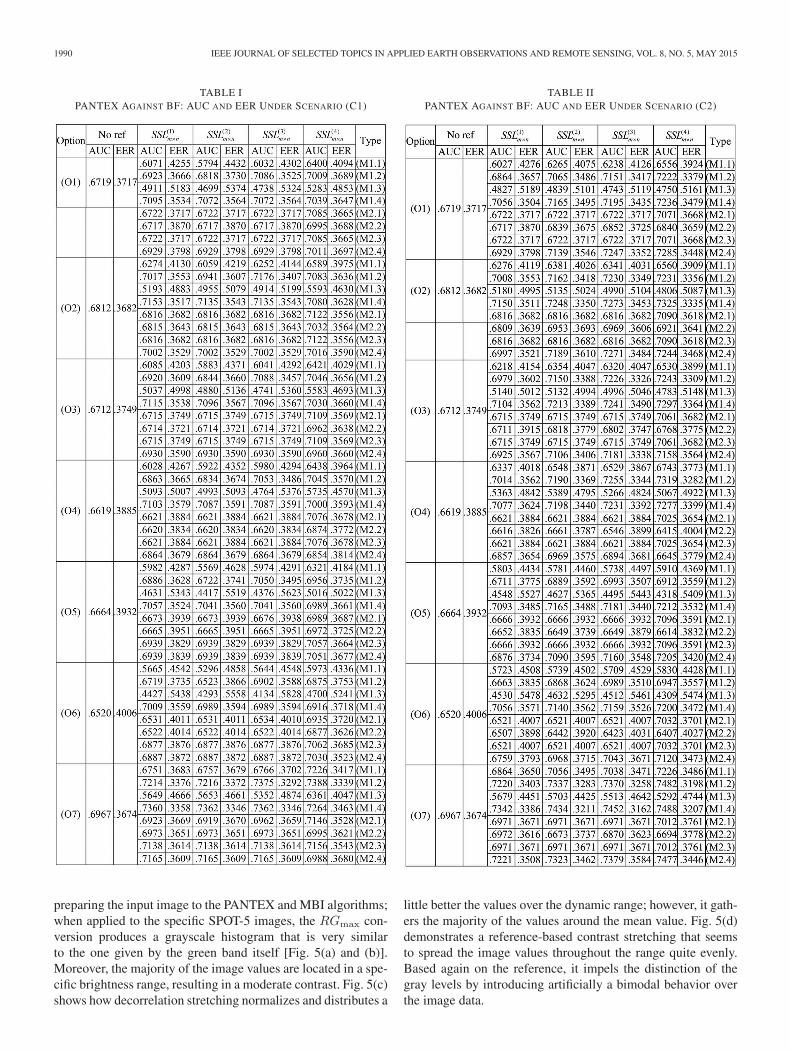
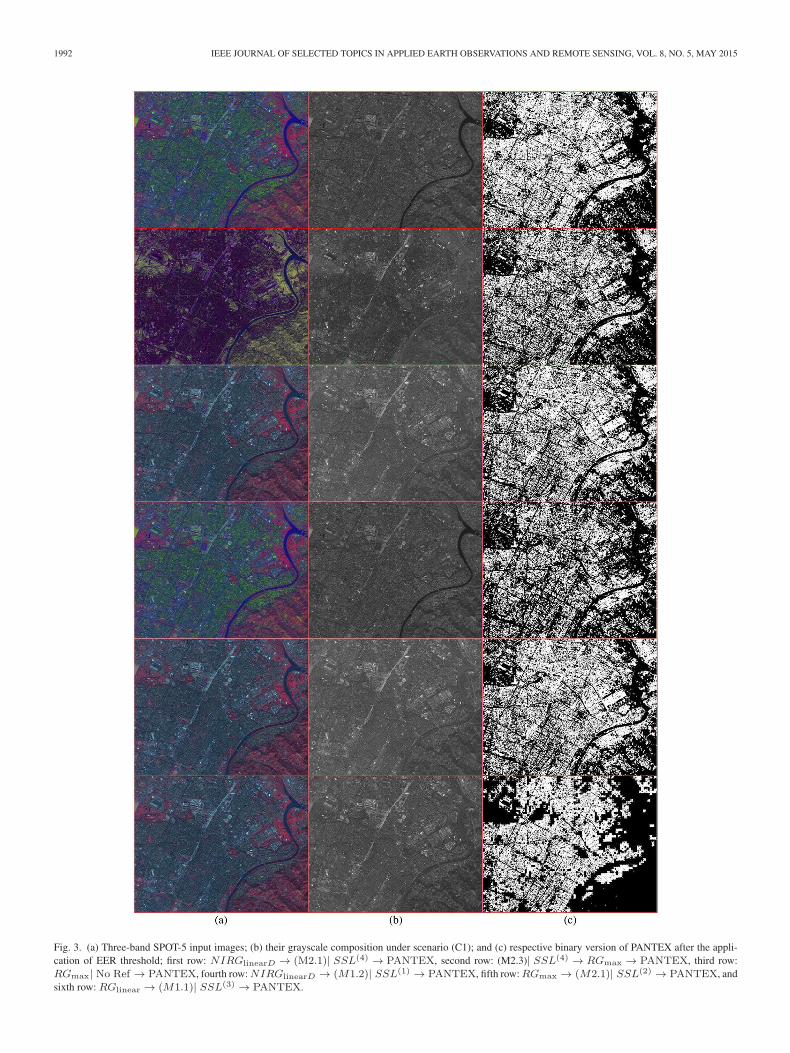
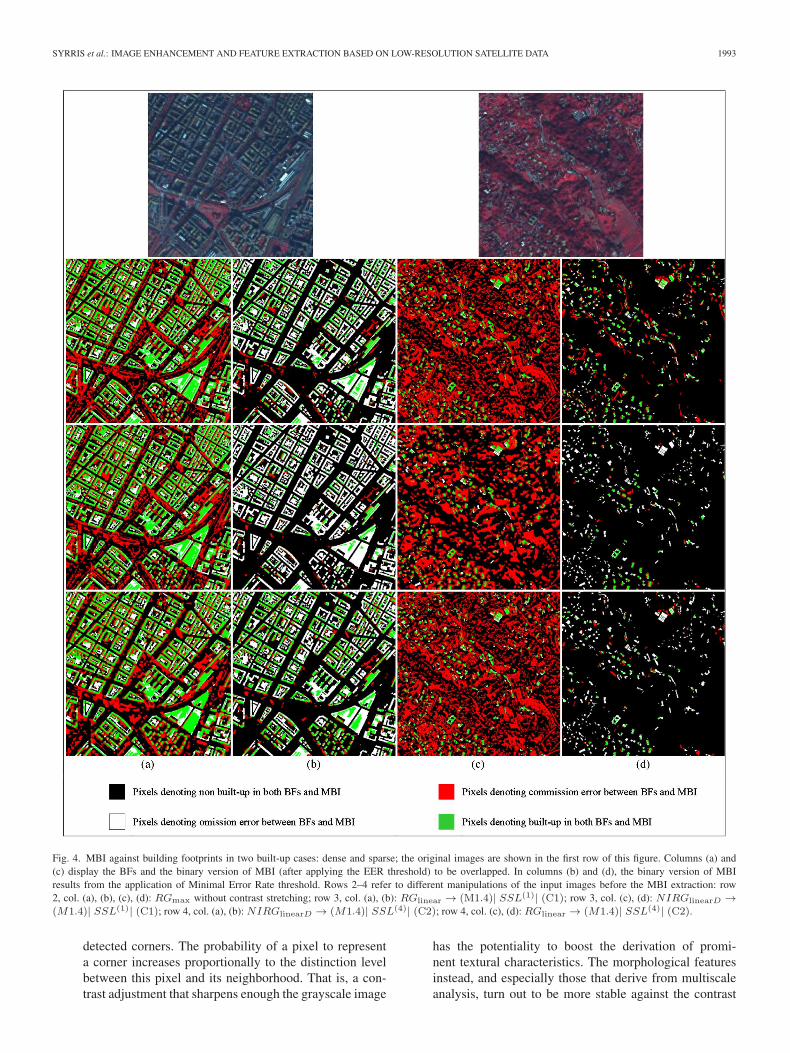
The case study we demonstrate here has been elaborated overthe city of Torino, Italy, where BFs are available. The assess-ment of the results was done with the aid of ROC analysis bycomputing the area under curve (AUC) and the equal errorrate (EER) [10] between PANTEX/MBI and BFs; Tables I–IVdisplay those results. Table V shows the degree of agree-ment between BFs and each of the reference layers at 2.5 m.Two performance measures that are deemed more appropri-ate in case of imbalanced datasets are reported in this table:balanced accuracy (average of sensitivity and specificity) andF-score (harmonic mean of precision and recall/sensitivity).Fig. 3 shows some indicative snapshots of the three-band inputimages, their grayscale composition, and their respective binaryversion of PANTEX after applying the EER threshold. The pic-tures in Fig. 4 demonstrate the matching degree between MBIand BFs in two built-up cases: dense and sparse. In all theaforementioned cases, we do not make use of the NDVI, whichsurely improves the BU detection.
Finally, Fig. 5 shows how the histogram of the original three-band image is amended through different types of grayscaleconversion and contrast stretching. Picking out the maximumvalue of an RGB triplet is the most common approach for
1990 IEEE JOURNAL OF SELECTED TOPICS IN APPLIED EARTH OBSERVATIONS AND REMOTE SENSING, VOL. 8, NO. 5, MAY 2015
TABLE IPANTEX AGAINST BF: AUC AND EER UNDER SCENARIO (C1)
preparing the input image to the PANTEX and MBI algorithms;when applied to the specific SPOT-5 images, the RGmax con-version produces a grayscale histogram that is very similarto the one given by the green band itself [Fig. 5(a) and (b)].Moreover, the majority of the image values are located in a spe-cific brightness range, resulting in a moderate contrast. Fig. 5(c)shows how decorrelation stretching normalizes and distributes a
TABLE IIPANTEX AGAINST BF: AUC AND EER UNDER SCENARIO (C2)
little better the values over the dynamic range; however, it gath-ers the majority of the values around the mean value. Fig. 5(d)demonstrates a reference-based contrast stretching that seemsto spread the image values throughout the range quite evenly.Based again on the reference, it impels the distinction of thegray levels by introducing artificially a bimodal behavior overthe image data.

SYRRIS et al.: IMAGE ENHANCEMENT AND FEATURE EXTRACTION BASED ON LOW-RESOLUTION SATELLITE DATA 1991
TABLE IIIMBI AGAINST BF: AUC AND EER UNDER SCENARIO (C1)
IV. DISCUSSION
This section analyzes the results of the experimental process.Some interesting findings are listed as follows.
1) The contrast adjustment seems to have more influenceon the extraction of textural measurements rather thanon the morphological characterization. In this application,the texture is determined uniquely by the density of the
TABLE IVMBI AGAINST BF: AUC AND EER UNDER SCENARIO (C2)
TABLE VAGREEMENT BETWEEN BUILDING FOOTPRINTS AND REFERENCE
LAYERS AT 2.5-M SPATIAL RESOLUTION
1992 IEEE JOURNAL OF SELECTED TOPICS IN APPLIED EARTH OBSERVATIONS AND REMOTE SENSING, VOL. 8, NO. 5, MAY 2015
Fig. 3. (a) Three-band SPOT-5 input images; (b) their grayscale composition under scenario (C1); and (c) respective binary version of PANTEX after the appli-cation of EER threshold; first row: NIRGlinearD → (M2.1)| SSL(4) → PANTEX, second row: (M2.3)| SSL(4) → RGmax → PANTEX, third row:RGmax| No Ref → PANTEX, fourth row: NIRGlinearD → (M1.2)| SSL(1) → PANTEX, fifth row: RGmax → (M2.1)| SSL(2) → PANTEX, andsixth row: RGlinear → (M1.1)| SSL(3) → PANTEX.
SYRRIS et al.: IMAGE ENHANCEMENT AND FEATURE EXTRACTION BASED ON LOW-RESOLUTION SATELLITE DATA 1993
Fig. 4. MBI against building footprints in two built-up cases: dense and sparse; the original images are shown in the first row of this figure. Columns (a) and(c) display the BFs and the binary version of MBI (after applying the EER threshold) to be overlapped. In columns (b) and (d), the binary version of MBIresults from the application of Minimal Error Rate threshold. Rows 2–4 refer to different manipulations of the input images before the MBI extraction: row2, col. (a), (b), (c), (d): RGmax without contrast stretching; row 3, col. (a), (b): RGlinear → (M1.4)| SSL(1)| (C1); row 3, col. (c), (d): NIRGlinearD →(M1.4)| SSL(1)| (C1); row 4, col. (a), (b): NIRGlinearD → (M1.4)| SSL(4)| (C2); row 4, col. (c), (d): RGlinear → (M1.4)| SSL(4)| (C2).
detected corners. The probability of a pixel to representa corner increases proportionally to the distinction levelbetween this pixel and its neighborhood. That is, a con-trast adjustment that sharpens enough the grayscale image
has the potentiality to boost the derivation of promi-nent textural characteristics. The morphological featuresinstead, and especially those that derive from multiscaleanalysis, turn out to be more stable against the contrast

1994 IEEE JOURNAL OF SELECTED TOPICS IN APPLIED EARTH OBSERVATIONS AND REMOTE SENSING, VOL. 8, NO. 5, MAY 2015
Fig. 5. Image histogram and contrast stretching: (a) three-band histogram of the original image; (b) RGmax; (c) NIRGlinearD ; (d) RGmax →(M2.1)| SSL(4)| (C1).
variations. The successive use of structural elements ofincreasing size and the subsequent process of differenti-ating between objects detected at dissimilar scales some-how manage to compensate the influence of a moderatecontrast. Besides, the morphological characterization hasto do, not only with brightness and contrast but also takesinto consideration the size and the shape of the objects tobe detected.
2) The feature extraction as described herein requires agrayscale image as input. The typical approach for thecalculation of both PANTEX and MBI is to provide asinput an image consisting of the maximum values of theRGB triplet. However, the experimental results show thatthere are other band combinations (like the luma, with orwithout decorrelation stretching) that, in many cases, leadto a better contrast. Selecting the right band combinationseems to be a key factor especially for the extraction ofgood textural measurements.
3) The results show that in some cases (M1.4, M2.4, M1.2),the reference-based contrast adjustment can boost theperformance. As we explained previously, PANTEX isstrongly dependent from the contrast level; the use ofa detailed reference layer (like SSL(4)), which makesfeasible the contrast correction in smaller image areas,appears to fit better with the second-order statistics andthe single-scale processing that the PANTEX algorithmutilizes. On the contrary, MBI appears to work better witha moderate contrast level and starts to show instability athigher levels of image sharpness. Good contrast stretch-ing approaches for MBI can consider the cases (M1.2)and (M1.4).
4) In the two scenarios (C1) and (C2), the stage at whichthe histogram adjustment takes place is examined. Nosignificant difference or notable effect in terms of per-formance is observed from the results [exceptions are thePANTEX cases (M1.4) and (M2.4) using learning againstSSL
(4)m×n]. Hence, we conclude that the histogram adjust-
ment before or after the image conversion to grayscaleleads, in average, to similar outcome.
V. CONCLUSION
Image enhancement and contrast adjustment play a substan-tial role for the extraction of trustworthy textural and morpho-logical characteristics. In order to investigate and measure the
sensitivity of those features against variations in contrast, aseries of tests were carried out; different scenarios were exam-ined regarding mainly the image bands’ combination and theimage histogram adjustment guided by low-resolution refer-ence data. From the reported results, a number of approachescan be distinguished for improving the image contrast and forinstructing effectively the feature extraction.
Finally, a meaningful result of this work is the introduction ofa simple and relatively fast approach that can “correct” the low-resolution reference and transfer it smoothly in finer resolutions(the SSL(4)case).
Future work includes tests with adaptive histogram adjust-ment, usage of different reference layers, and application ofradiometric feature selection and transformation techniques.The presented work is in experimental phase and still remainsto be scaled up and adapt to the conditions of the operationalmode.
ACKNOWLEDGMENT
The authors would like to thank Dr. X. Huang for kindlyproviding the source code of the MBI.
REFERENCES
[1] F. Y. Shih, Image Processing and Pattern Recognition-Fundamentals andTechniques. Hoboken, NJ, USA: Wiley, 2010.
[2] R. C. Gonzalez and R. E. Woods, Digital Image Processing, 2nd ed.Englewood Cliffs, NJ, USA: Prentice Hall, 2002.
[3] S. Kim, W. Kang, E. Lee, and J. Paik, “Wavelet-domain color imageenhancement using filtered directional bases and frequency-adaptiveshrinkage,” IEEE Trans. Consum. Electron., vol. 56, no. 2, pp. 1063–1070, May 2010.
[4] A. R. Gillespie, A. B. Kahle, and R. E. Walker, “Color enhancement ofhighly correlated images. I. Decorrelation and HSI contrast stretches,”Remote Sens. Environ., vol. 20, no. 3, pp. 209–235, Dec. 1986.
[5] H. Demirel, C. Ozcinar, and G. Anbarjafari, “Satellite image contrastenhancement using discrete wavelet transform and singular value decom-position,” IEEE Geosci. Remote Sens. Lett., vol. 7, no. 2, pp. 333–337,Apr. 2010.
[6] G. Srilekha, V. K. Kumar, and B. Jyothi, “Satellite image resolutionenhancement using DWT and contrast enhancement using SVD,” Int. J.Eng. Res. Technol. (IJERT), vol. 2, no. 5, pp. 1227–1230, May 2013.
[7] [Online]. Available: http://cidportal.jrc.ec.europa.eu/copernicus/services/webviewer/core003
[8] S. Ferri et al., “A new map of the European settlements by automaticclassification of 2.5m resolution SPOT data,” in Proc. IEEE Int. Geosci.Remote Sens. Symp. (IGARSS), Quebec City, QC, Canada, Jul. 2014,pp. 1160–1163.
[9] A. Burger, G. Di Matteo, and P. J. Åstrand, “Specifications of view ser-vices for GMES Core_003 VHR2 coverage,” European Commission, JRCTech. Rep., 2012, doi: 10.2788/21898.

SYRRIS et al.: IMAGE ENHANCEMENT AND FEATURE EXTRACTION BASED ON LOW-RESOLUTION SATELLITE DATA 1995
[10] M. Pesaresi et al., “A global human settlement layer from opticalHR/VHR RS data: Concept and first results,” IEEE J. Sel. Topics Appl.Earth Observ. Remote Sens., vol. 6, no. 5, pp. 2102–2131, Oct. 2013.
[11] [Online]. Available: http://www.eea.europa.eu/articles/urban-soil-sealing-in-europe
[12] G. Maucha, G. Büttner, and B. Kosztra, “European validation of GMESFTS soil sealing enhancement data,” European Environment Agency,Final draft, Jun. 2010.
[13] G. K. Ouzounis, V. Syrris, and M. Pesaresi, “Multiscale quality assess-ment of global human settlement layer scenes against reference data usingstatistical learning,” Pattern Recognit. Lett., vol. 34, no. 14, pp. 1636–1647, Oct. 2013.
[14] R. M. Haralick, K. Shanmugan, and I. Dinstein, “Textural features forimage classification,” IEEE Trans. Syst. Man Cybern., vol. 3, no. 6,pp. 610–621, Nov. 1973.
[15] M. Pesaresi, A. Gerhardinger, and F. Kayitakire, “A robust built-up areapresence index by anisotropic rotation-invariant textural measure,” IEEEJ. Sel. Topics Appl. Earth Observ. Remote Sens., vol. 1, no. 3, pp. 180–192, Sep. 2008.
[16] X. Huang and L. Zhang, “A multidirectional and multiscale morpholog-ical index for automatic building extraction from mutispectral GeoEye-1imagery,” Photogramm. Eng. Remote Sens., vol. 77, no. 7, pp. 721–732,2011.
[17] X. Huang and L. Zhang, “Morphological building/shadow index forbuilding extraction from high-resolution imagery over urban areas,”IEEE J. Sel. Topics Appl. Earth Observ. Remote Sens., vol. 5, no. 1,pp. 161–172, Feb. 2012.
[18] V. Vapnik, Statistical Learning Theory. Hoboken, NJ, USA: Wiley, 1998.[19] C. Cortes and V. Vapnik, “Support vector networks,” Mach. Learn.,
vol. 20, pp. 273–297, 1995.
Vasileios Syrris received the B.Math. degree in math-ematics from Aristotle University of Thessaloniki,Thessaloniki, Greece, in 1995, the M.Sc. degree inartificial intelligence: knowledge-based systems fromthe University of Edinburgh, Edinburgh, Scotland,U.K., in 1996, and the Ph.D. degree in compu-tational intelligence from Aristotle University ofThessaloniki, Thessaloniki, Greece, in 2010.
He worked as an Assistant Lecturer/Tutor withAutomation and Robotics Laboratory, AristotleUniversity of Thessaloniki and with the Informatics
and Electronics Department, Technological Educational Institute ofThessaloniki, Thessaloniki, Greece. Currently, he is working as a Researcherwith Global Security and Crisis Management Unit, Joint Research Centre,European Commission, Institute for the Protection and Security of the Citizen,Ispra, Italy. His research interests include high-performance computing,machine learning, robotics, automation, computer vision, remote sensing,control engineering, statistics, and data analysis.
Stefano Ferri received the M.S. degree in envi-ronmental engineering from Politecnico di Milano,Milan, Italy, in 2004.
From 2009, he has been collaborated as aGIS expert with the Joint Research Centre (JRC),European Commission, Ispra, Italy. He has beeninvolved in various international projects supportedby European Commission. In 2012, he became aGrantholder with the Institute for the Protection andSecurity of the Citizen, JRC. His research inter-ests include processing of remote sensing images,
urban analysis, development of systems, and applications for very large datamanagement.
Daniele Ehrlich received the B.S. degree in forestryfrom the University of Padua, Padua, Italy, in1984, and the Ph.D. degree in geography from theUniversity of California, Santa Barbara, CA, USA, in1992.
He is a Senior Staff Member with the JointResearch Centre, the European Commission, Ispra,Italy. He has over 20 years of experience in remotesensing and GIS applied to a variety of disci-plines including crop area estimation, tropical forestmapping, crisis management with focus on damage
assessment, and humanitarian assistance. His research interests include quanti-fying the extent and the dynamics of settlements using high-resolution satelliteimagery. He uses the derived settlement information for a systematic analysis ofthe global built-up environment, for population estimations and for generatingphysical exposure databases for global disaster risk assessments.
Martino Pesaresi received the degree in town andregional planning from IUA, Venice, Italy, in 1991–1992.
He pursued research activities on remote sens-ing, spatial statistics, and urban analysis with theCentre d’Analyse et de Mathématique Sociales, Ecolein Haute études in Sciences Sociales (EHESS),Paris, France, in 1991–1992, with the Laboratoired’Informatique Appliquée, ORSTOM, Paris, France,in 1992–1993, and for the Department of Urbanand Regional Planning, University of Venice, Venice,
Italy, until 1995. From 1992 to 1997, he was an Independent Consultanton satellite data exploitation for town and regional planning activities. From1997 to 2000, he was a Postdoctoral Research Contract on urban analysisusing satellite data with the EC Joint Research Center, Space ApplicationsInstitute. From 2001 to 2004, he worked in the map production industry, leadingthe Digital Mapping Sector of the Environmental Technologies and ServicesArea, INFORM Srl, Padova, Italy. Since 2004, he works with the GlobalSecurity and Crisis Management Unit, EC Joint Research Center, Institute forProtection and Security of the Citizen (IPSC), Ispra, Italy, contributing to sev-eral programs dealing with the use of space technologies for automatic imageinformation retrieval and decision support systems. From 2005 to 2007, hewas a Scientific Coordinator with Global Monitoring for Security and Stability(GMOSS) Network of Excellence in the aeronautics and space priority of the6th research Framework Program. From 2007 to 2013, he was the Team Leader“Information support for effective and rapid external action” (ISFEREA) ofthe same JRC Institute developing remote sensing applications in the areasof postnatural-disaster and postconflict damage assessment, conflict-relatedresource monitoring, risk, and exposure mapping. Since 2014, he has been aScientific Leader with GLOB-HS and E-URBAN projects exploiting remotesensing technologies for fine-scale systematic analysis of human settlements,respectively, at the global and European level.
Related Documents


![arXiv:1610.01240v2 [physics.optics] 14 Oct 2016 · Spontaneous Emission and Light Extraction Enhancement of Light Emitting Diode Using Partially-Reflecting Metasurface Cavity (PRMC)](https://static.cupdf.com/doc/110x72/5aef60547f8b9a8b4c8c3782/arxiv161001240v2-14-oct-2016-emission-and-light-extraction-enhancement-of.jpg)

![Utilization of [Bmim]BF4-MAE on enhancement of γ-oryzanol … · 2020-04-02 · Utiliation of mimF 4-MAE on enhancement of γ-oryzanol extraction from rice bran and its tyrosinase](https://static.cupdf.com/doc/110x72/5f7fac570572bc575a141adb/utilization-of-bmimbf4-mae-on-enhancement-of-oryzanol-2020-04-02-utiliation.jpg)