Fast image enhancement in compressed wavelet domain $ Dongwook Cho n , Tien D. Bui Department of Computer Science and Software Engineering, Concordia University, 1455 De Maisonneuve Blvd. West, Montréal, Québec, Canada H3G 1M8 article info Article history: Received 24 March 2013 Received in revised form 2 November 2013 Accepted 7 November 2013 Available online 16 November 2013 Keywords: Image enhancement Contrast enhancement Wavelet transform JPEG 2000 Denoising abstract This paper presents computationally efficient framework for color image enhancement in the compressed wavelet domain. The proposed approach is capable of enhancing both global and local contrast and brightness as well as preserving color consistency. The framework does not require inverse transform for image enhancement since linear scale factors are directly applied to both scaling and wavelet coefficients in the compressed domain, which results in high computational efficiency. Also contaminated noise in the image can be efficiently reduced by introducing wavelet shrinkage terms adaptively in different scales. The proposed method is able to enhance a wavelet-coded image computationally efficiently with high image quality and less noise or other artifacts. The experimental results show that the proposed method produces encouraging results both visually and numerically compared to some existing approaches. Crown Copyright & 2013 Published by Elsevier B.V. All rights reserved. 1. Introduction Natural images can be degraded when they are acquired due to lighting condition, sensor resolution and quality, or limitation or noise of optical system. In addition, most of natural images are compressed with a certain degree of data loss for more efficient storage and communication. An image enhancement algorithm makes such degraded images visually better perceived. It is a fundamental problem in image processing field and somehow subjective since the quality is decided by human visual system (HVS). The enhanced image is expected to have better brightness and contrast, good color consistency, reduced noise or defect, less visual artifacts, or better resolution. Depending on the quality of a given degraded image, each of these improve- ment factors has become an important topic separately in areas such as denoising, contrast enhancement, white balance, deblurring, demosaicking, deblocking, super-resolu- tion, inpainting. Among them, comfortable brightness, con- trast, and color consistency are major enhancement factors to HVS since photoreceptors in retina (rod and cones) are mainly stimulated differently by light strength levels and wavelengths, and transduce different levels of stimuli to send the analyzed signal to the brain. In this paper, the image contrast, brightness, color consistency, and level of noise are considered as major enhancement factors. There have been various works along this line. In the spatial domain, there have been many good methods that can be easily found in introductory image processing books. Retinex-based approaches, one of the successful meth- ods, express HVS adaptive dynamic ranges with different lighting conditions in the spatial domain [11,12,17]. Some efficient image enhancement approaches for the com- pressed discrete cosine transform (DCT) domain have been recently proposed in [14,19]. Since they can be applied directly to the encoded data, it is not required to decode the image for image enhancement. These methods also consider the degradation caused by the compression approach such as blocking artifact or related noise. Contents lists available at ScienceDirect journal homepage: www.elsevier.com/locate/sigpro Signal Processing 0165-1684/$ -see front matter Crown Copyright & 2013 Published by Elsevier B.V. All rights reserved. http://dx.doi.org/10.1016/j.sigpro.2013.11.007 ☆ This paper is an improved extension of the preliminary work presented in ICIP 2011 [7]. n Corresponding author. E-mail addresses: [email protected] (D. Cho), [email protected] (T.D. Bui). Signal Processing 98 (2014) 295–307

Welcome message from author
This document is posted to help you gain knowledge. Please leave a comment to let me know what you think about it! Share it to your friends and learn new things together.
Transcript
Contents lists available at ScienceDirect
Signal Processing
Signal Processing 98 (2014) 295–307
0165-16http://d
☆ Thispresent
n CorrE-m
bui@cse
journal homepage: www.elsevier.com/locate/sigpro
Fast image enhancement in compressed wavelet domain$
Dongwook Cho n, Tien D. BuiDepartment of Computer Science and Software Engineering, Concordia University, 1455 De Maisonneuve Blvd. West, Montréal, Québec,Canada H3G 1M8
a r t i c l e i n f o
Article history:Received 24 March 2013Received in revised form2 November 2013Accepted 7 November 2013Available online 16 November 2013
Keywords:Image enhancementContrast enhancementWavelet transformJPEG 2000Denoising
84/$ - see front matter Crown Copyright & 2x.doi.org/10.1016/j.sigpro.2013.11.007
paper is an improved extension of the preled in ICIP 2011 [7].esponding author.ail addresses: [email protected] (D. Cho),.concordia.ca (T.D. Bui).
a b s t r a c t
This paper presents computationally efficient framework for color image enhancement inthe compressed wavelet domain. The proposed approach is capable of enhancing bothglobal and local contrast and brightness as well as preserving color consistency. Theframework does not require inverse transform for image enhancement since linear scalefactors are directly applied to both scaling and wavelet coefficients in the compresseddomain, which results in high computational efficiency. Also contaminated noise in theimage can be efficiently reduced by introducing wavelet shrinkage terms adaptively indifferent scales. The proposed method is able to enhance a wavelet-coded imagecomputationally efficiently with high image quality and less noise or other artifacts. Theexperimental results show that the proposed method produces encouraging results bothvisually and numerically compared to some existing approaches.
Crown Copyright & 2013 Published by Elsevier B.V. All rights reserved.
1. Introduction
Natural images can be degraded when they are acquireddue to lighting condition, sensor resolution and quality, orlimitation or noise of optical system. In addition, most ofnatural images are compressed with a certain degree of dataloss for more efficient storage and communication. An imageenhancement algorithm makes such degraded imagesvisually better perceived. It is a fundamental problem inimage processing field and somehow subjective since thequality is decided by human visual system (HVS). Theenhanced image is expected to have better brightness andcontrast, good color consistency, reduced noise or defect, lessvisual artifacts, or better resolution. Depending on thequality of a given degraded image, each of these improve-ment factors has become an important topic separately inareas such as denoising, contrast enhancement, white
013 Published by Elsevier B
iminary work
balance, deblurring, demosaicking, deblocking, super-resolu-tion, inpainting. Among them, comfortable brightness, con-trast, and color consistency are major enhancement factorsto HVS since photoreceptors in retina (rod and cones) aremainly stimulated differently by light strength levels andwavelengths, and transduce different levels of stimuli to sendthe analyzed signal to the brain. In this paper, the imagecontrast, brightness, color consistency, and level of noise areconsidered as major enhancement factors.
There have been various works along this line. In thespatial domain, there have been many good methodsthat can be easily found in introductory image processingbooks.
Retinex-based approaches, one of the successful meth-ods, express HVS adaptive dynamic ranges with differentlighting conditions in the spatial domain [11,12,17]. Someefficient image enhancement approaches for the com-pressed discrete cosine transform (DCT) domain have beenrecently proposed in [14,19]. Since they can be applieddirectly to the encoded data, it is not required to decodethe image for image enhancement. These methods alsoconsider the degradation caused by the compressionapproach such as blocking artifact or related noise.
.V. All rights reserved.

Fig. 1. Transmission of image data.
D. Cho, T.D. Bui / Signal Processing 98 (2014) 295–307296
Wavelet transforms have been used for image contrastenhancement to take advantage of the multi-scale proper-ties in the wavelet domain [24]. Curvelet is also used topreserve better the multi-scale edges [22]. The methodproposed in [5] automatically chooses one discrete waveletfilter that can produce the best enhancement result for agiven image. These methods are designed to use wavelettransforms to achieve a better image enhancement quality.Therefore, computational efficiency regarding transforma-tion or data transmission was not considered. On the otherhand, our method puts an emphasis on the image dataprocessing in the wavelet compressed domain itself. Fig. 1shows a conceptual diagram for the communication pro-cess of compressed image data. In the process, imageenhancement can be implemented directly in the com-pressed domain.
In this paper, we propose a new, fast image enhance-ment framework in the compressed wavelet domain,especially for JPEG 2000. The framework is required toestimate the enhanced transformed image data by apply-ing scale factors of scaling and wavelet coefficients. Sinceeach meaningful wavelet coefficient is simply scaled by aproposed formulation, the framework is computationallyefficient. In addition, the framework is flexible since theresulting scaling factor for wavelet coefficients is a combi-nation of global scaling enhancement factor for a scalingcoefficient, shrinkage factor for noise suppression, andwavelet enhancement factor. We derive the scaling factorsby taking into account the multi-scale property andthe low- and high-pass representation of the wavelettransforms.
The paper is organized as follows. In the followingsection, we briefly review the discrete wavelet transform andits properties for image enhancement problem. Proposedalgorithm is described in Section 3. Then experimentalresults and performance evaluation are demonstrated beforeconcluding this work.
2. Brief wavelet theory
Wavelet transform has been used for better qualitycompression due to its efficient separability into densescaling coefficients and sparse wavelet coefficients. JPEG2000 is a representative standard which can replace theDCT-based JPEG. In JPEG 2000, symmetric filters withbiorthogonal property such as Le Gall 5/3 and CDF 9/7have been chosen. Unlike orthonormal wavelet filters withsome nice mathematical properties, biorthogonal waveletcauses a difference between the scaling and wavelet filters
in their filter lengths; However, biorthogonal waveletmakes it possible for simple and fast implementation. Inthis section, basic notions and mathematical properties forwavelet-based image enhancement approaches used inthis paper are briefly described. More details on wavelettheory or JPEG 2000 standard can be found in variouspapers including [10,15,21,23]. The one-dimensional for-ward discrete wavelet transform can be expressed asfollows:
sjþ1;k ¼ ∑⌊p=2⌋
m ¼ �⌊ðp�1Þ=2⌋ϕmsj;2k�m ð1Þ
wjþ1;k ¼ ∑⌊q=2⌋
m ¼ � ⌊ðq�1Þ=2⌋ψmsj;2k�mþ1; ð2Þ
where sj;k and wj;k are scaling and wavelet coefficients inj-th level and ϕm and ψm are the scaling and wavelet filterswith length p and q respectively. Also, ∑ϕm ¼
ffiffiffi2
pand
∑ψm ¼ 0. For instance, the forward transform by Le Gall5/3 filter can be defined as
sjþ1;k ¼ffiffiffi2
p34 sj;2kþ1
4 sj;2k�1þsj;2kþ1� ��1
8 sj;2k�2þsj;2kþ2� �� �
ð3Þ
wjþ1;k ¼ 1ffiffi2
p sj;2kþ1�12 sj;2kþsj;2kþ2� �� �
: ð4Þ
The inverse wavelet transform for synthesis can beexpressed as follows:
sj;k ¼12
∑⌊p=2⌋
m ¼ � ⌊ðp�1Þ=2⌋ψ˘msjþ1;k�mþ ∑
⌊q=2⌋
m ¼ � ⌊ðq�1Þ=2⌋ϕ˘
mwjþ1;k�m
" #;
ð5Þwhere ψ
˘m and ϕ
˘
m are the synthesis filters of the scaling andwavelet functions and the coefficients sjþ1; k and wjþ1; k areupsampled. In the case of Le Gall 5/3 using Eq. (5), even andodd sampled scaling coefficients in the j-th level are obtainedby
sj;2k ¼ 1ffiffi2
p sjþ1;k�12 wj;k�1þwj;k� �� � ð6Þ
sj;2kþ1 ¼ffiffiffi2
p34 wj;kþ1
4 sj;kþsj;kþ1� ��1
8 wj;k�1þwj;kþ1� �� �
: ð7ÞThe shapes of the analysis and synthesis filters for Le Gall 5/3are illustrated in Fig. 2.
In 2D wavelet transform, j-th level scaling coefficientsare located in LLj subband while wavelet coefficients areseparated into HLj, LHj, and HHj subbands. The 2D imple-mentation can be made straightforward by applying 1Dtransform to rows and then columns of the image or thescaling subband in the previous decomposition level.
3. Proposed wavelet framework for image enhancement
The proposed framework enhances an image in thewavelet transform domain that produces scaling and wave-let coefficients. Therefore, it is essential to estimate appro-priate scaling and wavelet coefficients. We propose a fastand efficient image enhancement framework that uses fastscale factors with a flexible mapping criteria. The estimationof scale factors for scaling coefficients is proposed inSection 3.1. and for wavelet coefficients in Section 3.2.

−2 −1.5 −1 −0.5 0 0.5 1 1.5 2−0.2
−0.1
0
0.1
0.2
0.3
0.4
0.5
0.6
0.7
0.8
−2 −1.5 −1 −0.5 0 0.5 1 1.5 2−0.5
0
0.5
1
−2 −1.5 −1 −0.5 0 0.5 1 1.5 20
0.1
0.2
0.3
0.4
0.5
0.6
0.7
0.8
0.9
1
−2 −1.5 −1 −0.5 0 0.5 1 1.5 2−0.4
−0.2
0
0.2
0.4
0.6
0.8
1
Fig. 2. Le Gall 5/3 analysis and synthesis filters. (a) Scaling analysis filter, (b) wavelet analysis filter, (c) scaling synthesis filter, and (d) wavelet synthesis filter.
Degraded Image (spatial domain)
Enhanced Image (spatial domain)
WaveletEncoding
(compression)
Decoding(inverse
transform)
x
x
g(·)
(·)
(·)
EnhancedScaling
Coefficients
ScalingCoefficients
WaveletCoefficients(non-zero)
EnhancedWavelet
Coefficients
h(·)
3.1
3.2
Fig. 3. Block diagram of wavelet-based enhancement framework.
D. Cho, T.D. Bui / Signal Processing 98 (2014) 295–307 297
Their application to chrominance color components ispresented in Section 3.3. The overview block diagram ofthe proposed framework is shown in Fig. 3.
Our proposed approach is performed in the com-pressed wavelet domain. In other words, the approachdoes not require any information in the spatial domain andbenefits from the wavelet properties. Therefore, someadvantages are expected as follows:
�
First, computational cost can be tremendously reducedwhen the image is compressed by the wavelet transform(e.g. JPEG 2000). Actual enhancement process is per-formed only in the compressed domain.�
Second, low and high frequency information are treatedseparately. Scaling subband contains the compact infor-mation that also describes the brightness of the image.Each scaling coefficient represents local brightness.Wavelet subbands contain small number of significantcoefficients and a large number of trivial coefficients.Significant coefficients mainly preserve the edge struc-ture while trivial coefficients represent noise ordetailed texture. Therefore, it is possible to develop atechnique for emphasizing important edges whilesuppressing noise.�
Finally, the multi-resolution property of wavelet trans-form can help analyzing images in different scales.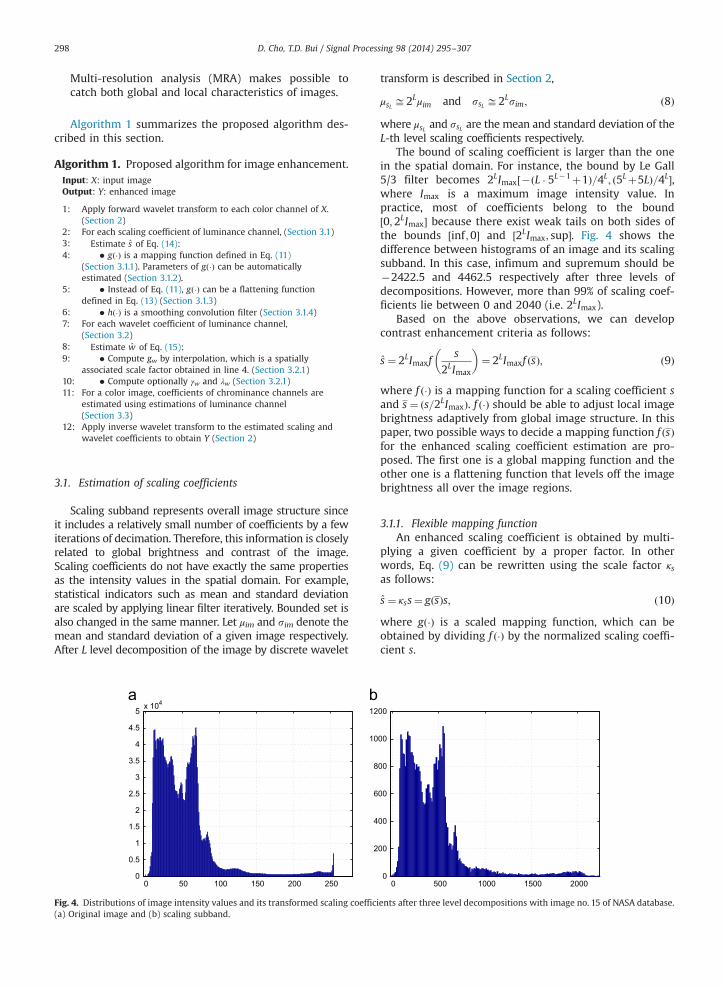
D. Cho, T.D. Bui / Signal Processing 98 (2014) 295–307298
Multi-resolution analysis (MRA) makes possible tocatch both global and local characteristics of images.
Algorithm 1 summarizes the proposed algorithm des-cribed in this section.
Algorithm 1. Proposed algorithm for image enhancement.
Fig. 4.(a) Ori
Input: X: input imageOutput: Y: enhanced image
1:
Apply forward wavelet transform to each color channel of X.(Section 2)2:
For each scaling coefficient of luminance channel, (Section 3.1) 3: Estimate s of Eq. (14): 4: � gð�Þ is a mapping function defined in Eq. (11)(Section 3.1.1). Parameters of gð�Þ can be automaticallyestimated (Section 3.1.2).
5:
� Instead of Eq. (11), gð�Þ can be a flattening functiondefined in Eq. (13) (Section 3.1.3)6:
� hð�Þ is a smoothing convolution filter (Section 3.1.4) 7: For each wavelet coefficient of luminance channel,(Section 3.2)
8: Estimate w of Eq. (15): 9: � Compute gw by interpolation, which is a spatiallyassociated scale factor obtained in line 4. (Section 3.2.1)
10: � Compute optionally γw and λw (Section 3.2.1) 11: For a color image, coefficients of chrominance channels areestimated using estimations of luminance channel(Section 3.3)
12:
Apply inverse wavelet transform to the estimated scaling andwavelet coefficients to obtain Y (Section 2)3.1. Estimation of scaling coefficients
Scaling subband represents overall image structure sinceit includes a relatively small number of coefficients by a fewiterations of decimation. Therefore, this information is closelyrelated to global brightness and contrast of the image.Scaling coefficients do not have exactly the same propertiesas the intensity values in the spatial domain. For example,statistical indicators such as mean and standard deviationare scaled by applying linear filter iteratively. Bounded set isalso changed in the same manner. Let μim and sim denote themean and standard deviation of a given image respectively.After L level decomposition of the image by discrete wavelet
0 50 100 150 200 2500
0.5
1
1.5
2
2.5
3
3.5
4
4.5
5 x 10⁴
2
4
6
8
10
12
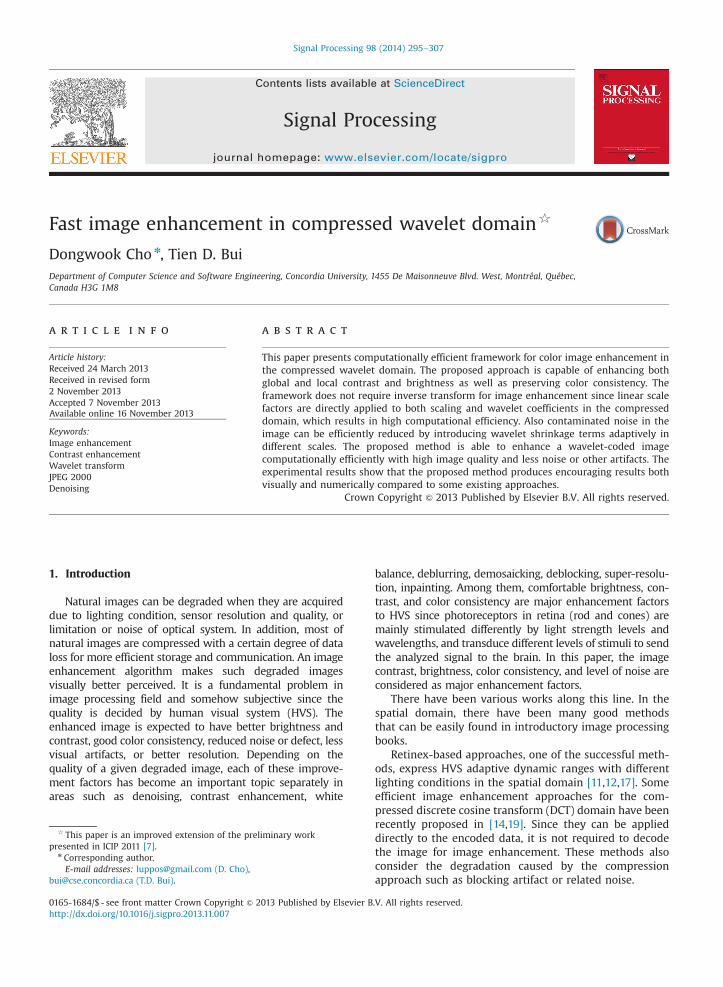
Distributions of image intensity values and its transformed scaling coefficiginal image and (b) scaling subband.
transform is described in Section 2,
μsL ffi2Lμim and ssL ffi2Lsim; ð8Þ
where μsL and ssL are the mean and standard deviation of theL-th level scaling coefficients respectively.
The bound of scaling coefficient is larger than the onein the spatial domain. For instance, the bound by Le Gall5/3 filter becomes 2LImax½�ðL � 5L�1þ1Þ=4L; ð5Lþ5LÞ=4L�,where Imax is a maximum image intensity value. Inpractice, most of coefficients belong to the bound½0;2LImax� because there exist weak tails on both sides ofthe bounds ½inf ;0� and ½2LImax; sup�. Fig. 4 shows thedifference between histograms of an image and its scalingsubband. In this case, infimum and supremum should be�2422.5 and 4462.5 respectively after three levels ofdecompositions. However, more than 99% of scaling coef-ficients lie between 0 and 2040 (i.e. 2LImax).
Based on the above observations, we can developcontrast enhancement criteria as follows:
s ¼ 2LImaxfs
2LImax
� �¼ 2LImaxf sð Þ; ð9Þ
where f ð�Þ is a mapping function for a scaling coefficient sand s ¼ ðs=2LImaxÞ. f ð�Þ should be able to adjust local imagebrightness adaptively from global image structure. In thispaper, two possible ways to decide a mapping function f ðsÞfor the enhanced scaling coefficient estimation are pro-posed. The first one is a global mapping function and theother one is a flattening function that levels off the imagebrightness all over the image regions.
3.1.1. Flexible mapping functionAn enhanced scaling coefficient is obtained by multi-
plying a given coefficient by a proper factor. In otherwords, Eq. (9) can be rewritten using the scale factor κsas follows:
s ¼ κss¼ gðsÞs; ð10Þwhere gð�Þ is a scaled mapping function, which can beobtained by dividing f ð�Þ by the normalized scaling coeffi-cient s.
0 500 1000 1500 20000
00
00
00
00
00
00
ents after three level decompositions with image no. 15 of NASA database.

D. Cho, T.D. Bui / Signal Processing 98 (2014) 295–307 299
The scaled mapping function gðsÞ is defined with thefollowing conditions:
1.
Figima
s ranges between 0 and 1.
2. f ðsÞ ¼ sgðsÞ 3. 0r f ðsÞr1. 4. f ðsÞ is monotonically increasing, i.e. gðsÞþsg′ðsÞZ0.If gðsÞ is greater than 1, the coefficient s is scaled-up. Onthe other hand, s is scaled-down if gðsÞ is less than 1. Themapping functions introduced in [14,19] have the form off ðsÞ and satisfy these conditions. However, it is possible todesign a mapping function with great flexibility. In thispaper, we propose the following scaling mapping function:
g sð Þ ¼1þc1 m�sð Þ exp �js�mj2
s21
!; 0rsrm
1þc2 m�sð Þ exp �js�mj2s22
!; otherwise
8>>>>><>>>>>:
; ð11Þ
with the assumption that the above-mentioned conditionsare satisfied for the mapping function gðsÞ; and theparameters should be chosen accordingly. The proposed
0 0.2 0.4 0.6 0.8 11
1.1
1.2
1.3
1.4
1.5
1.6
1.7
1.8
1.9
σ=0.2
σ=0.4
σ=0.6σ=0.8
0 0.2 0.40
0.5
1
1.5
2
σ=0.1σ=0.2
σ=0.3
σ=0.4
Fig. 5. Examples of proposed scale mapping function g with different par
0 50 100 150 200 2500
0.1
0.2
0.3
0.4
0 50 100 150 200 2500
0.005
0.01
0.015
0.02
0.025
. 6. Sample images from RIT MCSL High Dynamic Range Image Database [1ge, (b) underexposed image, (c) locally over- or under-exposed and (d) narr
scaling function is continuous and its shape can be flexiblydecided by the parameters. The balance control parameter,m, is between 0 and 1. It provides a balanced position foran equal state, i.e. gðsÞ ¼ 1. s1 and s2 are shape parametersthat determine the shapes of scale-up or down. c1 and c2are amplitude constants that decide the maximum andminimum scale factors. The shape flexibility plays animportant role in dealing with different statistical proper-ties of images and some examples of Eq. (11) with differentparameters are presented in Fig. 5.
It is important to choose the right parameters dependingon the type of images. The parameters could be chosenmanually, but we use automatic parametrization based onimage statistics, which is described in the following section.
3.1.2. Automatic parametrization of mapping functionNatural images can be visually and statistically very
different from each other. Fig. 6 shows different imagestatistics on different images. An image could be globallyvery bright (Fig. 6(a)) or very dark (Fig. 6(b)). Some regionsof an image could be very bright while other local regionsare too dark (Fig. 6(c)). Or an image like Fig. 6(d) has
0.6 0.8 1 0 0.2 0.4 0.6 0.8 11
1.1
1.2
1.3
1.4
1.5
1.6
1.7
1.8
1.9
σ=0.2
σ=0.4
σ=0.6
σ=0.8
ameters. (a) m¼ 0, ci ¼ 2, (b) m¼ 0:5, ci ¼ 2 and (c) m¼ 1, ci ¼ �2.
0 50 100 150 200 2500
0.02
0.04
0.06
0.08
0.1
0.12
0 50 100 150 200 2500
0.005
0.01
0.015
0.02
3] and their image histograms of pixel intensity values. (a) Overexposedow dynamic range.
D. Cho, T.D. Bui / Signal Processing 98 (2014) 295–307300
narrow dynamic range. Statistically balanced image withhigher dynamic range is desirable in many cases. Onepopular way to achieve this idea is to use histogramequalization. However, general histogram equalization isnot good for some cases. For example, the brightness ofbackground can be very different from the brightness offoreground objects; or some background noise can be toomuch emphasized, etc. Although there are some extremecases, histogram equalization is still useful for manysituations.
As shown in Fig. 4, scaling coefficients have similarstatistical distribution as in the spatial domain. In order toget a good global mapping function described in Eq. (11),we estimate a good parameter set that fits into the idealstatistical model. In this paper, we assume that the idealstatistical model for scaling coefficients after applying amapping function is simply a uniform distribution likehistogram equalization approach. The parameter set Θ iscomposed of the unknown parameters defined in Eq. (11),i.e. c1, c2, s1, s2, and m. In this case, the estimate Θ isobtained by solving the following optimization problem:
Θ ¼ arg minΘ
∑n
k ¼ 1
1n�pi
ing
in;Θ
� �� �2; ð12Þ
where pi is a probability density function with i-th inten-sity among n levels and Θ¼ fc1; c2; s1;s2;mg. In order tosolve Eq. (12), we have employed simulated annealingapproach to reduce the probability of obtaining a localminima instead of the optimal solution. More theoreticaland practical issues on simulated annealing can be foundin [1]. In our implementation, a function simulan-
nealbnd in Matlab Global Optimization Toolbox was used.
3.1.3. Flattening functionThe scaling coefficients in the wavelet domain repre-
sent the local brightness of an image. HVS feels morecomfortable when a local region is neither too dark nor toobright. A local region could have well-balanced brightnessby modifying the scaling coefficients to a proper bright-ness that is comfortable to HVS. Let us assume that theproper mean brightness is a mid intensity value, Imax=2,
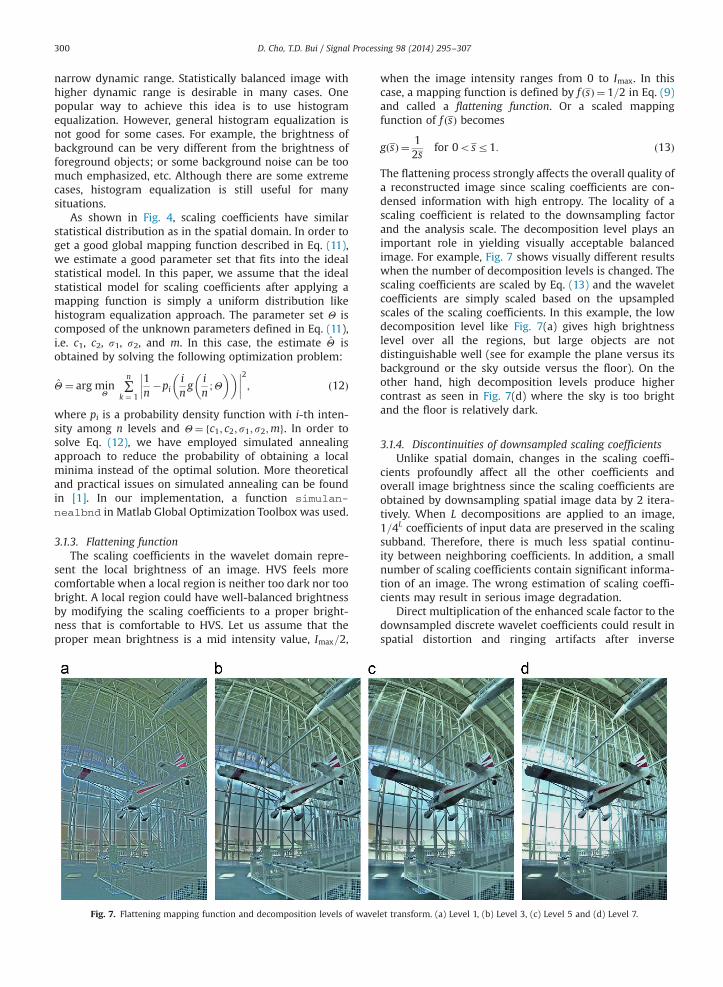
Fig. 7. Flattening mapping function and decomposition levels of wave
when the image intensity ranges from 0 to Imax. In thiscase, a mapping function is defined by f ðsÞ ¼ 1=2 in Eq. (9)and called a flattening function. Or a scaled mappingfunction of f ðsÞ becomes
g sð Þ ¼ 12s
for 0osr1: ð13Þ
The flattening process strongly affects the overall quality ofa reconstructed image since scaling coefficients are con-densed information with high entropy. The locality of ascaling coefficient is related to the downsampling factorand the analysis scale. The decomposition level plays animportant role in yielding visually acceptable balancedimage. For example, Fig. 7 shows visually different resultswhen the number of decomposition levels is changed. Thescaling coefficients are scaled by Eq. (13) and the waveletcoefficients are simply scaled based on the upsampledscales of the scaling coefficients. In this example, the lowdecomposition level like Fig. 7(a) gives high brightnesslevel over all the regions, but large objects are notdistinguishable well (see for example the plane versus itsbackground or the sky outside versus the floor). On theother hand, high decomposition levels produce highercontrast as seen in Fig. 7(d) where the sky is too brightand the floor is relatively dark.
3.1.4. Discontinuities of downsampled scaling coefficientsUnlike spatial domain, changes in the scaling coeffi-
cients profoundly affect all the other coefficients andoverall image brightness since the scaling coefficients areobtained by downsampling spatial image data by 2 itera-tively. When L decompositions are applied to an image,1=4L coefficients of input data are preserved in the scalingsubband. Therefore, there is much less spatial continu-ity between neighboring coefficients. In addition, a smallnumber of scaling coefficients contain significant informa-tion of an image. The wrong estimation of scaling coeffi-cients may result in serious image degradation.
Direct multiplication of the enhanced scale factor to thedownsampled discrete wavelet coefficients could result inspatial distortion and ringing artifacts after inverse
let transform. (a) Level 1, (b) Level 3, (c) Level 5 and (d) Level 7.
D. Cho, T.D. Bui / Signal Processing 98 (2014) 295–307 301
transform. In fact, independent estimation of each scalingcoefficient by global mapping function without consider-ing neighbors in the scaling subband easily produces stainson the image. Such visual artifacts can be suppressed byguaranteeing smooth intra-dependency. We propose toconsider neighboring dependency of scaling coefficientsand reduce discontinuity by applying smoothing opera-tion. Eq. (10) can be rewritten as follows:
s ¼ ghðsÞ
2LImax
� �s; ð14Þ
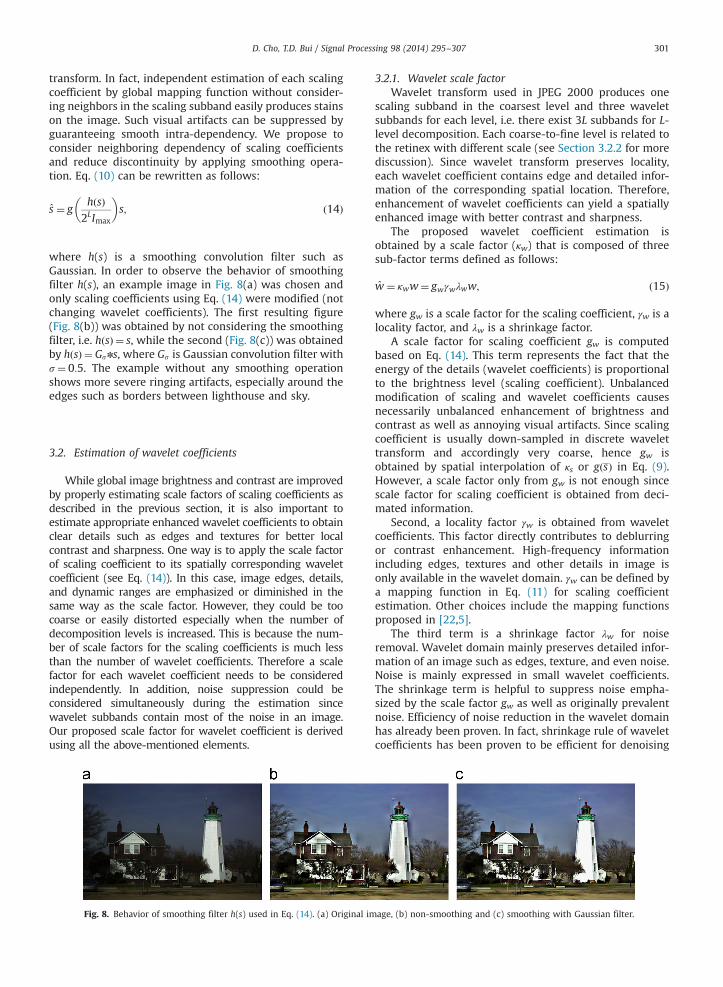
where h(s) is a smoothing convolution filter such asGaussian. In order to observe the behavior of smoothingfilter h(s), an example image in Fig. 8(a) was chosen andonly scaling coefficients using Eq. (14) were modified (notchanging wavelet coefficients). The first resulting figure(Fig. 8(b)) was obtained by not considering the smoothingfilter, i.e. hðsÞ ¼ s, while the second (Fig. 8(c)) was obtainedby hðsÞ ¼ Gsns, where Gs is Gaussian convolution filter withs¼ 0:5. The example without any smoothing operationshows more severe ringing artifacts, especially around theedges such as borders between lighthouse and sky.
3.2. Estimation of wavelet coefficients
While global image brightness and contrast are improvedby properly estimating scale factors of scaling coefficients asdescribed in the previous section, it is also important toestimate appropriate enhanced wavelet coefficients to obtainclear details such as edges and textures for better localcontrast and sharpness. One way is to apply the scale factorof scaling coefficient to its spatially corresponding waveletcoefficient (see Eq. (14)). In this case, image edges, details,and dynamic ranges are emphasized or diminished in thesame way as the scale factor. However, they could be toocoarse or easily distorted especially when the number ofdecomposition levels is increased. This is because the num-ber of scale factors for the scaling coefficients is much lessthan the number of wavelet coefficients. Therefore a scalefactor for each wavelet coefficient needs to be consideredindependently. In addition, noise suppression could beconsidered simultaneously during the estimation sincewavelet subbands contain most of the noise in an image.Our proposed scale factor for wavelet coefficient is derivedusing all the above-mentioned elements.
Fig. 8. Behavior of smoothing filter h(s) used in Eq. (14). (a) Original im
3.2.1. Wavelet scale factorWavelet transform used in JPEG 2000 produces one
scaling subband in the coarsest level and three waveletsubbands for each level, i.e. there exist 3L subbands for L-level decomposition. Each coarse-to-fine level is related tothe retinex with different scale (see Section 3.2.2 for morediscussion). Since wavelet transform preserves locality,each wavelet coefficient contains edge and detailed infor-mation of the corresponding spatial location. Therefore,enhancement of wavelet coefficients can yield a spatiallyenhanced image with better contrast and sharpness.
The proposed wavelet coefficient estimation isobtained by a scale factor (κw) that is composed of threesub-factor terms defined as follows:
w ¼ κww¼ gwγwλww; ð15Þ
where gw is a scale factor for the scaling coefficient, γw is alocality factor, and λw is a shrinkage factor.
A scale factor for scaling coefficient gw is computedbased on Eq. (14). This term represents the fact that theenergy of the details (wavelet coefficients) is proportionalto the brightness level (scaling coefficient). Unbalancedmodification of scaling and wavelet coefficients causesnecessarily unbalanced enhancement of brightness andcontrast as well as annoying visual artifacts. Since scalingcoefficient is usually down-sampled in discrete wavelettransform and accordingly very coarse, hence gw isobtained by spatial interpolation of κs or gðsÞ in Eq. (9).However, a scale factor only from gw is not enough sincescale factor for scaling coefficient is obtained from deci-mated information.
Second, a locality factor γw is obtained from waveletcoefficients. This factor directly contributes to deblurringor contrast enhancement. High-frequency informationincluding edges, textures and other details in image isonly available in the wavelet domain. γw can be defined bya mapping function in Eq. (11) for scaling coefficientestimation. Other choices include the mapping functionsproposed in [22,5].
The third term is a shrinkage factor λw for noiseremoval. Wavelet domain mainly preserves detailed infor-mation of an image such as edges, texture, and even noise.Noise is mainly expressed in small wavelet coefficients.The shrinkage term is helpful to suppress noise empha-sized by the scale factor gw as well as originally prevalentnoise. Efficiency of noise reduction in the wavelet domainhas already been proven. In fact, shrinkage rule of waveletcoefficients has been proven to be efficient for denoising
age, (b) non-smoothing and (c) smoothing with Gaussian filter.
D. Cho, T.D. Bui / Signal Processing 98 (2014) 295–307302
problem. λw should be between 0 and 1. In this paper, weadopt a technique used in [6].
3.2.2. Retinex and waveletRetinex formulation in [11] is defined as R¼ log Iðx; yÞ�
log½Fðx; yÞnIðx; yÞ�, where Fðx; yÞ is a surround function withupper-concave shape such as Gaussian filter. Since theformulation is a special case of the difference between twologged convolved images, it can be rewritten as
R¼ log½F1ðx; yÞnIðx; yÞ�� log½F2ðx; yÞnIðx; yÞ�; ð16Þwhere F1 is Dirac delta function. On the other hand,wavelet function is often derived from the Laplacian. Forexample, Mexican hat wavelet is equivalent to Laplacian ofGaussian and can be approximated as Difference of Gaus-sian (DoG), i.e.
ΔGnIðx; yÞ �Gs1 ðx; yÞnIðx; yÞ�Gs2 ðx; yÞnIðx; yÞ: ð17ÞIt can be easily noticed that the only difference between Eqs.(16) and (17) is the logarithmic function that is consideredfor shunting inhibition in Retinex formulation. This reflectsthat wavelet coefficients contain information related tolocally adaptive contrast level for HVS stimulation. In otherwords, efficient enhancement in the wavelet domain willresult in visual improvement that can satisfy HVS.
3.3. Color treatment
Wavelet transform of JPEG 2000 is applied to each colorchannel directly. Color space used in JPEG 2000 is usuallyeither RGB or YCbCr. While RGB channels are stronglycorrelated to each other, luminance channel is less corre-lated to chrominance channels in YCbCr space. In practice,chrominance channels are obtained by conversion matrixfrom RGB channels and preserve the edge structures [19].Instead of computing scale factors for each channel, weapply the scale factors of luminance channel computed inEqs. (10) and (15) to the corresponding coefficients in thechromatic channels for better color consistency.
4. Experimental results and performance evaluation
In this section, the proposed image enhancementapproach is applied to various images and we observehow it behaves. The experiments are performed based onthe following consideration:
�
First, the influence and behavior of scale factors intro-duced in the proposed approach are observed.�
The effects of different parameters are related to theenhanced image quality.�
All the experimental results are evaluated by visualobservation and some numerical measurements.�
Finally, the proposed method is compared to the otherstate-of-the-art approaches.4.1. Measures
Some image processing problems such as compressionand denoising can be quantified by comparing the processed
image to a reference image. On the other hand, quantifica-tion of the enhanced image quality cannot be performed bya reference image because a good enhanced image is asubjective matter and fully depends on HVS. Therefore,quality measure of the enhanced image should be assessedwithout reference image. There exist some quantitativemeasures using image brightness, edge contrast, or statis-tical distribution without reference images to compare.These measures are not fully reliable since they usuallyreflect one aspect of image characteristics rather thanshowing satisfaction of HVS. Final quality judgment shouldbe performed visually by human observer because the goalof image enhancement is to satisfy HVS. In this paper, imagequality is quantified by calculating mean brightness (MB),mean contrast (MC) [16], absolute mean brightness error(AMBE) [4], AME [2], no-reference quality assessment forJPEG2000 compressed images using natural scene statistics(JP2KNR) [20], and naturalness image quality evaluator(NIQE) [18].
MB is defined as a global mean intensity, whichindicates whether the image is globally too dark or toobright rather than using it as a reliable quality measurebecause it depends on the image content and whether HVSis efficiently adapted to brightness. A desirable MB is amid-intensity value, ðIminþ ImaxÞ=2 (e.g. 127.5 for 8-bit grayscale image). MC represents image contrast and clear edgequality relatively well, but too much contrast and sharp-ness could be uncomfortable to HVS. If the value is higher,the image quality is better. AMBE describes brightnesspreservation and AMBE¼ jEðXÞ�EðYÞj, where X is a givenimage and Y is output image by histogram equalization.EðYÞ ¼ ðXmþXGÞ=2 if Xm is mean of image X and XG ¼ðIminþ ImaxÞ=2, where Imin and Imax are the lowest andhighest luminance values respectively. Lower AMBE meansbetter brightness preservation. AME is defined based onHVS by combining Weber's Contrast Law and modulation-based Michelson's Contrast Law. A recent measure, NIQE, isa blind measure that considers statistical regularities ofnatural images without training image database. JP2KNRblindly measures natural scene statistics and is specificallydesigned for the compressed images by wavelet-basedcoder. We use this measure mainly for the lossy compres-sion images by JPEG2000 format.
4.2. Example images
Our experiments have been mainly performed withNASA image set [3], which contains total 27 differentimages and their resized images. These images are widelyused in the community for evaluation of image enhance-ment algorithms. Large size images are composed of 25color images with 2000�1312 or 1312�2000 resolutionand two smaller images. Their resized small images havesize of either 360�236 or 283�432 pixels. Experimentshave been mainly done with small size images, but largeones have also been used.
4.3. Evaluation
In order to evaluate the proposed algorithm, severalother approaches are employed for comparative studies.

D. Cho, T.D. Bui / Signal Processing 98 (2014) 295–307 303
Among many existing approaches, we have chosen McCann'sretinex-based algorithm [17], color enhancement by scaling(CES) [19], automatic wavelet base selection (AWBS) [5], andCurvelet-based approaches [22]. A retinex-based approach isone of the most popular image enhancement methods in thespatial domain. We use Matlab implementation for McCann'salgorithm that was implemented and contained in [9]. CESalgorithm is performed in the compressed DCT domain used
Fig. 9. Image enhancement results (lg-image 15). (a) Original
in JPEG image format and the enhancement estimation isdone by scaling the DCT coefficients. Among various CEStechniques proposed in [19], the evaluation is made withTW-CES-BLK since it gives the best performance. Also someworks using wavelet transforms have been considered, i.e.AWBS and Curvelet. We have used Le Gall 5/3 filters toproduce compressed scaling and wavelet domains. Fig. 9shows one of the experimental results. It can be seen that the
image, (b) McCann [17], (c) proposed and (d) CES [19].
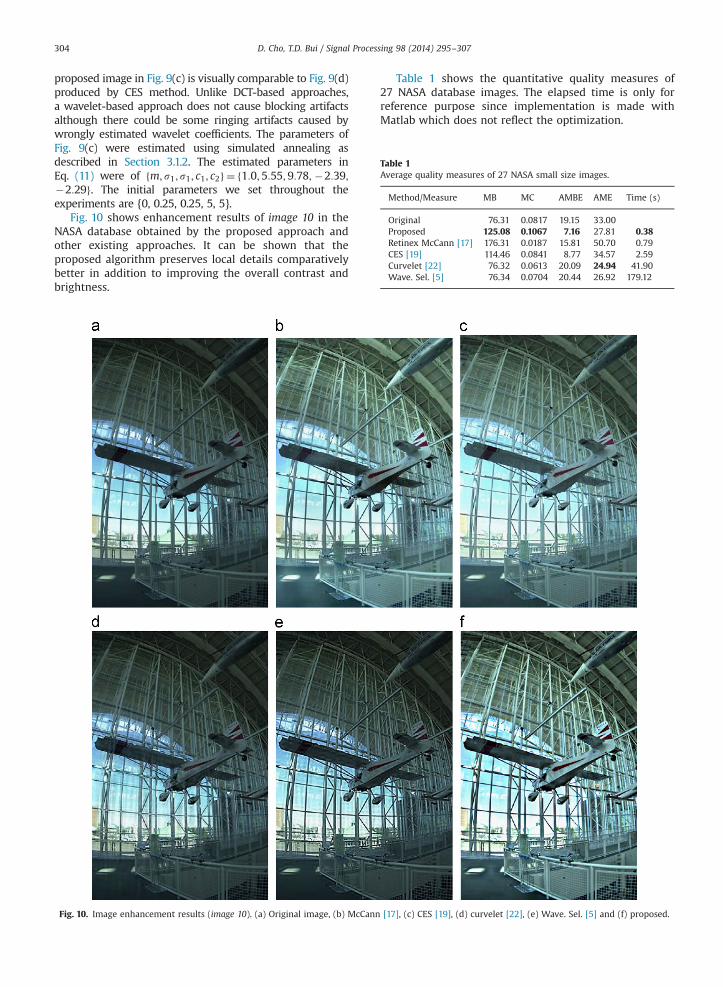
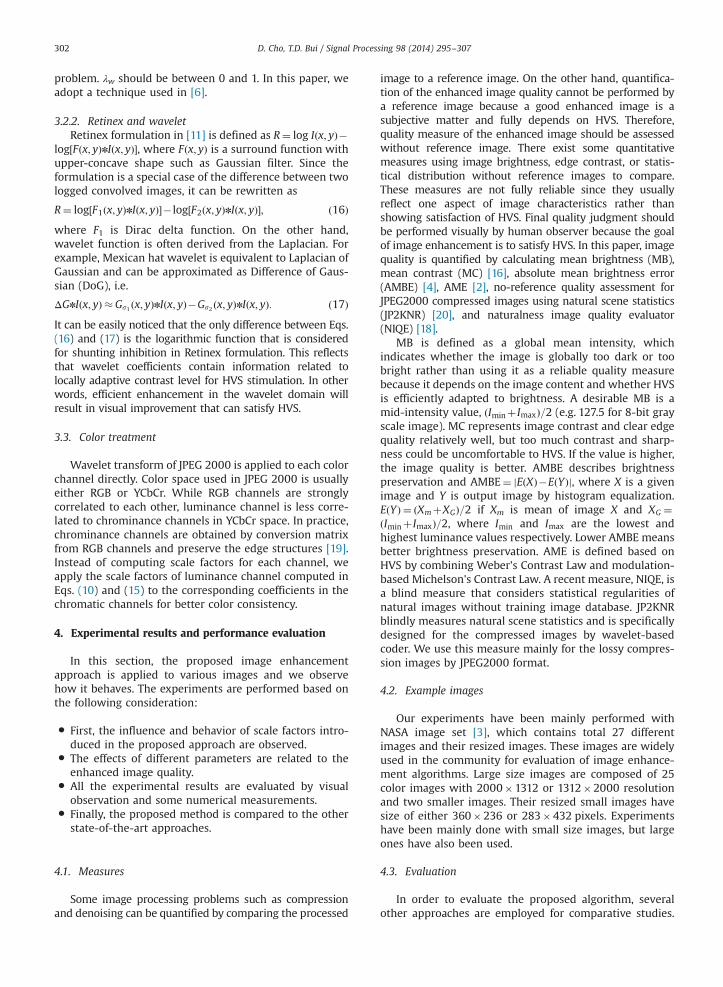
Table 1Average quality measures of 27 NASA small size images.
Method/Measure MB MC AMBE AME Time (s)
Original 76.31 0.0817 19.15 33.00Proposed 125.08 0.1067 7.16 27.81 0.38Retinex McCann [17] 176.31 0.0187 15.81 50.70 0.79CES [19] 114.46 0.0841 8.77 34.57 2.59Curvelet [22] 76.32 0.0613 20.09 24.94 41.90Wave. Sel. [5] 76.34 0.0704 20.44 26.92 179.12
D. Cho, T.D. Bui / Signal Processing 98 (2014) 295–307304
proposed image in Fig. 9(c) is visually comparable to Fig. 9(d)produced by CES method. Unlike DCT-based approaches,a wavelet-based approach does not cause blocking artifactsalthough there could be some ringing artifacts caused bywrongly estimated wavelet coefficients. The parameters ofFig. 9(c) were estimated using simulated annealing asdescribed in Section 3.1.2. The estimated parameters inEq. (11) were of fm; s1; s1; c1; c2g ¼ f1:0;5:55;9:78; �2:39;�2:29g. The initial parameters we set throughout theexperiments are {0, 0.25, 0.25, 5, 5}.
Fig. 10 shows enhancement results of image 10 in theNASA database obtained by the proposed approach andother existing approaches. It can be shown that theproposed algorithm preserves local details comparativelybetter in addition to improving the overall contrast andbrightness.
Fig. 10. Image enhancement results (image 10). (a) Original image, (b) McCann
Table 1 shows the quantitative quality measures of27 NASA database images. The elapsed time is only forreference purpose since implementation is made withMatlab which does not reflect the optimization.
[17], (c) CES [19], (d) curvelet [22], (e) Wave. Sel. [5] and (f) proposed.
D. Cho, T.D. Bui / Signal Processing 98 (2014) 295–307 305
4.4. Noisy image enhancement
Fig. 11 presents the role of shrinkage term γw in Eq. (15).One simple shrinkage function can be considered asfollows:
γw ¼ s2
s2þs2x; ð18Þ
where s is noise standard deviation and sx is standarddeviation of the clean image. s can be estimated by usings ¼medianðjHH1jÞ=0:6745 as proposed in [8]. If we assume
independency of noise and signal, sx ¼ffiffiffiffiffiffiffiffiffiffiffiffiffiffiffiffiffiffiffiffiffiffiffiffiffiffiffiffiffiffiffiffimaxðs2y�s2;0Þ
q,
where medianðjHH1jÞ denotes the median of the absolutevalues in the finest wavelet subband in diagonal directionand sy is standard deviation from a given noisy image. InFig. 11, Gaussian random noise with s¼ 5 has been addedin order to see how the shrinkage term affects image
Fig. 11. Influence of denoising term γw (s¼ 5). (a) Original image
Fig. 12. Results with and without using denoising term for dif
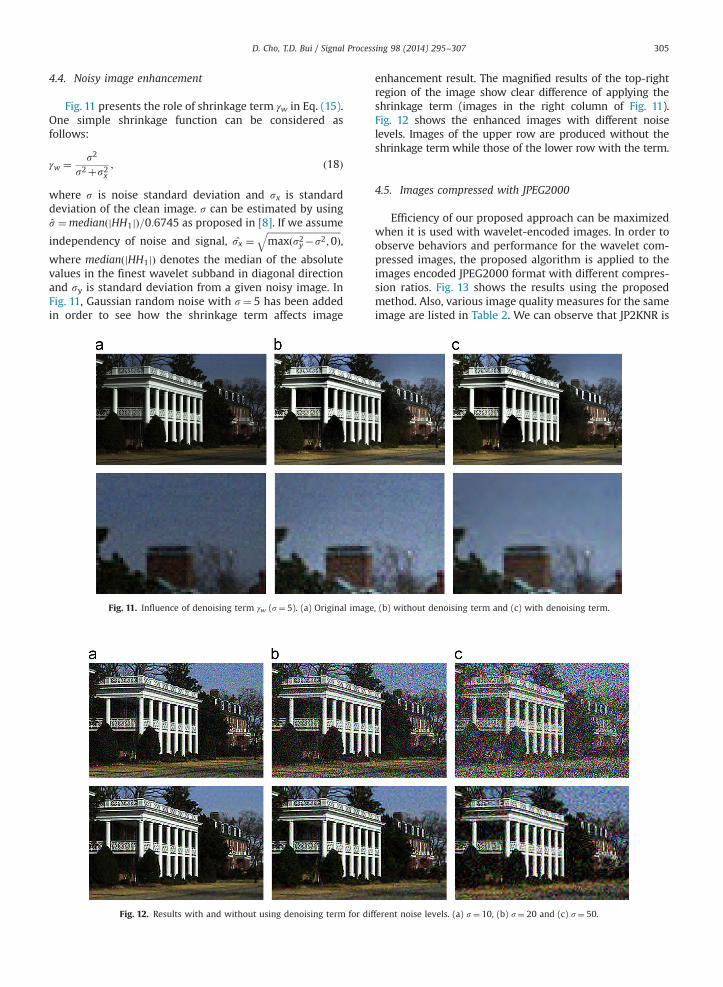
enhancement result. The magnified results of the top-rightregion of the image show clear difference of applying theshrinkage term (images in the right column of Fig. 11).Fig. 12 shows the enhanced images with different noiselevels. Images of the upper row are produced without theshrinkage term while those of the lower row with the term.
4.5. Images compressed with JPEG2000
Efficiency of our proposed approach can be maximizedwhen it is used with wavelet-encoded images. In order toobserve behaviors and performance for the wavelet com-pressed images, the proposed algorithm is applied to theimages encoded JPEG2000 format with different compres-sion ratios. Fig. 13 shows the results using the proposedmethod. Also, various image quality measures for the sameimage are listed in Table 2. We can observe that JP2KNR is
, (b) without denoising term and (c) with denoising term.
ferent noise levels. (a) s¼ 10, (b) s¼ 20 and (c) s¼ 50.
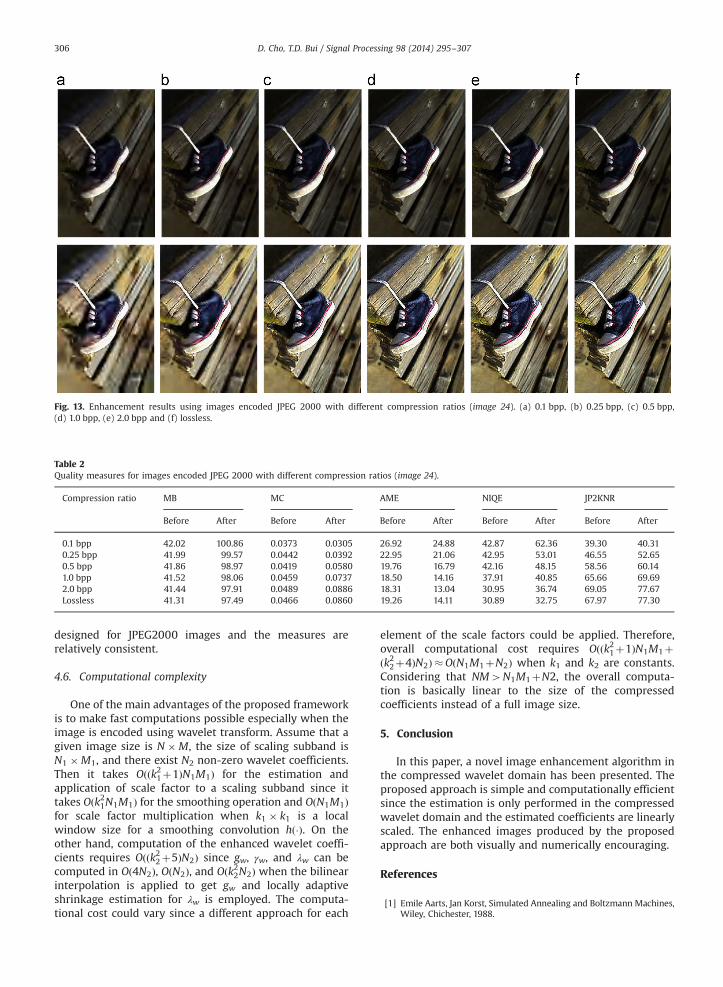
Fig. 13. Enhancement results using images encoded JPEG 2000 with different compression ratios (image 24). (a) 0.1 bpp, (b) 0.25 bpp, (c) 0.5 bpp,(d) 1.0 bpp, (e) 2.0 bpp and (f) lossless.
Table 2Quality measures for images encoded JPEG 2000 with different compression ratios (image 24).
Compression ratio MB MC AME NIQE JP2KNR
Before After Before After Before After Before After Before After
0.1 bpp 42.02 100.86 0.0373 0.0305 26.92 24.88 42.87 62.36 39.30 40.310.25 bpp 41.99 99.57 0.0442 0.0392 22.95 21.06 42.95 53.01 46.55 52.650.5 bpp 41.86 98.97 0.0419 0.0580 19.76 16.79 42.16 48.15 58.56 60.141.0 bpp 41.52 98.06 0.0459 0.0737 18.50 14.16 37.91 40.85 65.66 69.692.0 bpp 41.44 97.91 0.0489 0.0886 18.31 13.04 30.95 36.74 69.05 77.67Lossless 41.31 97.49 0.0466 0.0860 19.26 14.11 30.89 32.75 67.97 77.30
D. Cho, T.D. Bui / Signal Processing 98 (2014) 295–307306
designed for JPEG2000 images and the measures arerelatively consistent.
4.6. Computational complexity
One of the main advantages of the proposed frameworkis to make fast computations possible especially when theimage is encoded using wavelet transform. Assume that agiven image size is N �M, the size of scaling subband isN1 �M1, and there exist N2 non-zero wavelet coefficients.Then it takes Oððk21þ1ÞN1M1Þ for the estimation andapplication of scale factor to a scaling subband since ittakes Oðk21N1M1Þ for the smoothing operation and OðN1M1Þfor scale factor multiplication when k1 � k1 is a localwindow size for a smoothing convolution hð�Þ. On theother hand, computation of the enhanced wavelet coeffi-cients requires Oððk22þ5ÞN2Þ since gw, γw, and λw can becomputed in Oð4N2Þ, OðN2Þ, and Oðk22N2Þ when the bilinearinterpolation is applied to get gw and locally adaptiveshrinkage estimation for λw is employed. The computa-tional cost could vary since a different approach for each
element of the scale factors could be applied. Therefore,overall computational cost requires Oððk21þ1ÞN1M1þðk22þ4ÞN2Þ �OðN1M1þN2Þ when k1 and k2 are constants.Considering that NM4N1M1þN2, the overall computa-tion is basically linear to the size of the compressedcoefficients instead of a full image size.
5. Conclusion
In this paper, a novel image enhancement algorithm inthe compressed wavelet domain has been presented. Theproposed approach is simple and computationally efficientsince the estimation is only performed in the compressedwavelet domain and the estimated coefficients are linearlyscaled. The enhanced images produced by the proposedapproach are both visually and numerically encouraging.
References
[1] Emile Aarts, Jan Korst, Simulated Annealing and Boltzmann Machines,Wiley, Chichester, 1988.
D. Cho, T.D. Bui / Signal Processing 98 (2014) 295–307 307
[2] S.S. Agaian, B. Silver, K.A. Panetta, Transform coefficient histogram-based image enhancement algorithms using contrast entropy, IEEETrans. Image Process. 16 (3) (2007) 741–758.
[3] M. Braukus, K. Henry, Retinex Image Processing. NASA News Release01-086, August 2001. ⟨http://dragon.larc.nasa.gov/retinex/pao/news/⟩.
[4] S.-D. Chen, A.R. Ramli, Minimum mean brightness error bi-histogram equalization in contrast enhancement, IEEE Trans.Consum. Electron. 49 (4) (2003) 1310–1319.
[5] H.D. Cheng, R. Min, M. Zhang, Automatic wavelet base selection andits application to contrast enhancement, Signal Process. 90 (2010)1279–1289.
[6] D. Cho, T.D. Bui, Multivariate statistical modeling for image denois-ing using wavelet transforms, Signal Process.: Image Commun.20 (1) (2005) 77–89.
[7] D. Cho, T.D. Bui, Image contrast enhancement in compressed waveletdomain, in: IEEE International Conference on Image Processing(ICIP), September 2011, pp. 3421–3424.
[8] D. Donoho, I. Johnstone, Ideal spatial adaptation by wavelet shrink-age, Biometrika 81 (3) (1994) 425–455.
[9] B. Funt, F. Ciurea, J. McCann, Retinex in MATLAB, J. Electron. Imaging13 (1) (2004) 48–57.
[10] ISO/IEC. ISO/IEC FCD 15444-1, ITU-T Rec. T.800 Information Technol-ogy – JPEG 2000 Image Coding System: Core Coding System, 2004.
[11] D.J. Jobson, Z. Rahman, G.A. Woodell, A multiscale retinex forbridging the gap between color images and the human observationof scenes, IEEE Trans. Image Process. 6 (7) (1997) 965–976.
[12] D.J. Jobson, Z. Rahman, G.A. Woodell, Properties and performance ofa center/surround retinex, IEEE Trans. Image Process. 6 (3) (1997)451–462.
[13] J. Kuang, G. Johnson, M. Fairchild, RIT MCSL High Dynamic RangeImage Database. Web Site of Munsell Color Science Laboratory.⟨http://www.cis.rit.edu/research/mcsl2/icam/hdr/rit_hdr/⟩ (accessedJan. 2012).
[14] S. Lee, An efficient content-based image enhancement in thecompressed domain using retinex theory, IEEE Trans. Circ. Syst.Video Technol. 17 (2) (2007) 199–213.
[15] Stephane Mallat, A Wavelet Tour of Signal Processing: The SparseWay, Academic press, 2008.
[16] S.C. Matz, R.J.P. de Figueiredo, A nonlinear image contrast sharpen-ing approach based on Munsell's scale, IEEE Trans. Image Process.15 (4) (2006) 900–909.
[17] J.J. McCann, Lessons learned from Mondrians applied to real imagesand color gamuts, in: Proceedings of the IS&T/SID 7th Color ImagingConference, 1999, pp. 1–8.
[18] A. Mittal, R. Soundararajan, A.C. Bovik, Making a completely blindimage quality analyzer, IEEE Signal Process. Lett. 22 (3) (2013)209–212.
[19] J. Mukherjee, S.K. Mitra, Enhancement of color images by scaling theDCT coefficients, IEEE Trans. Image Process. 17 (10) (2008)1783–1794.
[20] H.R. Sheikh, A.C. Bovik, L.K. Cormack, No-reference quality assess-ment using natural scene statistics: JPEG2000, IEEE Trans. ImageProcess. 14 (12) (2005) 1918–1927.
[21] A. Skodras, C. Christopoulos, T. Ebrahimi, The JPEG 2000 stillimage compression standard, IEEE Signal Process. Mag. 18 (5) (2001)36–58.
[22] J.L. Starck, F. Murtagh, E.J. Candes, D.L. Donoho, Gray and color imagecontrast enhancement by the curvelet transform, IEEE Trans. ImageProcess. 12 (6) (2003) 706–717.
[23] Bryan E. Usevitch, A tutorial on modern lossy wavelet imagecompression: foundations of JPEG 2000, IEEE Trans. Signal Process.Mag. 18 (5) (2001) 22–35.
[24] K.V. Velde, Multi-scale color image enhancement, in: IEEE InternationalConference on Image Processing (ICIP), vol. 3, 1999, pp. 584–587.
Related Documents