1 Image Based Appraisal of Real Estate Properties Quanzeng You, Ran Pang, Liangliang Cao, and Jiebo Luo, Fellow, IEEE Basic Property Detailed Information Images Fig. 1. Example of homes for sale from Realtor. I. I NTRODUCTION R Eal estate appraisal, which is the process of estimating the price for real estate properties, is crucial for both buys and sellers as the basis for negotiation and transaction. Real estate plays a vital role in all aspects of our contemporary society. In a report published by the European Public Real Es- tate Association (EPRA http://alturl.com/7snxx), it was shown that real estate in all its forms accounts for nearly 20% of the economic activity. Therefore, accurate prediction of real estate prices or the trends of real estate prices help governments and companies make informed decisions. On the other hand, for most of the working class, housing has been one of the largest expenses. A right decision on a house, which heavily depends on their judgement on the value of the property, can possibly help them save money or even make profits from their investment in their homes. From this perspective, real estate appraisal is also closely related to people’s lives. Current research from both estate industry and academia has reached the conclusion that real estate value is closely related to property infrastructure [1], traffic [2], online user Copyright (c) 2013 IEEE. Personal use of this material is permitted. However, permission to use this material for any other purposes must be obtained from the IEEE by sending a request to [email protected]. Manuscript received March 28, 2016; accepted February 10, 2017. Q. You and J. Luo are with the Department of Computer Science, University of Rochester, Rochester, NY 14623 USA. E-mail: {qyou, jluo}@cs.rochester.edu. R. Pang is with PayPaI. E-mail: [email protected] L. Cao is with Electrical Engineering & Computer Sciences, Columbia University and customerserviceAI. E-mail: [email protected] reviews [3] and so on. Generally speaking, there are several different types of appraisal values. In particular, we are in- terested in the market value, which refers to the trade price in a competitive Walrasian auction setting [4]. Today, people are likely to trade through real estate brokers, who provide easy access online websites for browsing real estate property in an interactive and convenient way. Fig. 1 shows an example of house listing from Realtor (http://www.realtor.com/), which is the largest real estate broker in North America. From the figure, we see that a typical piece of listing on a real estate property will introduce the infrastructure data in text for the house along with some pictures of the house. Typically, a buyer will look at those pictures to obtain a general idea of the overall property in a selected area before making his next move. Traditionally, both real estate industry professionals and researchers have relied on a number of factors, such as economic index, house age, history trade and neighborhood environment [5] and so on to estimate the price. Indeed, these factors have been proved to be related to the house price, which is quite difficult to estimate and sensitive to many different human activities. Therefore, researchers have devoted much effort in building a robust house price index [6], [7], [8], [9]. In addition, quantitative features including Area, Year, Storeys, Rooms and Centre [10], [11] are also employed to build neural network models for estimating house prices. However, pictures, which is probably the most important factor on a buyer’s initial decision making process [12], have been ignored in this process. This is partially due to the fact that visual content is very difficult to interpret or quantify by computers compared with human beings. A picture is worth a thousand words. One advantage with images and videos is that they act like universal languages. People with different backgrounds can easily understand the main content of an image or video. In the real estate industry, pictures can easily tell people exactly how the house looks like, which is impossible to be described in many ways using lan- guage. For the given house pictures, people can easily have an overall feeling of the house, e.g. what is the overall construc- tion style, how the neighboring environment looks like. These high-level attributes are difficult to be quantitatively described. On the other hand, today’s computational infrastructure is also much cheaper and more powerful to make the analysis of computationally intensive visual content analysis feasible. Indeed, there are existing works on focusing the analysis of visual content for tasks such as prediction [13], [14], and online user profiling [15]. Due to the recently developed deep learning, computers have become smart enough to interpret visual content in a way similar to human beings. Recently, deep learning has enabled robust and accurate feature learning, which in turn produces the state-of-the-art arXiv:1611.09180v2 [cs.CV] 27 Jul 2017

Welcome message from author
This document is posted to help you gain knowledge. Please leave a comment to let me know what you think about it! Share it to your friends and learn new things together.
Transcript

1
Image Based Appraisal of Real Estate PropertiesQuanzeng You, Ran Pang, Liangliang Cao, and Jiebo Luo, Fellow, IEEE
Basic Property Detailed Information
Images
Fig. 1. Example of homes for sale from Realtor.
I. INTRODUCTION
REal estate appraisal, which is the process of estimatingthe price for real estate properties, is crucial for both
buys and sellers as the basis for negotiation and transaction.Real estate plays a vital role in all aspects of our contemporarysociety. In a report published by the European Public Real Es-tate Association (EPRA http://alturl.com/7snxx), it was shownthat real estate in all its forms accounts for nearly 20% of theeconomic activity. Therefore, accurate prediction of real estateprices or the trends of real estate prices help governmentsand companies make informed decisions. On the other hand,for most of the working class, housing has been one of thelargest expenses. A right decision on a house, which heavilydepends on their judgement on the value of the property, canpossibly help them save money or even make profits from theirinvestment in their homes. From this perspective, real estateappraisal is also closely related to people’s lives.
Current research from both estate industry and academiahas reached the conclusion that real estate value is closelyrelated to property infrastructure [1], traffic [2], online user
Copyright (c) 2013 IEEE. Personal use of this material is permitted.However, permission to use this material for any other purposes must beobtained from the IEEE by sending a request to [email protected].
Manuscript received March 28, 2016; accepted February 10, 2017.Q. You and J. Luo are with the Department of Computer Science,
University of Rochester, Rochester, NY 14623 USA. E-mail: {qyou,jluo}@cs.rochester.edu.
R. Pang is with PayPaI. E-mail: [email protected]. Cao is with Electrical Engineering & Computer Sciences, Columbia
University and customerserviceAI. E-mail: [email protected]
reviews [3] and so on. Generally speaking, there are severaldifferent types of appraisal values. In particular, we are in-terested in the market value, which refers to the trade pricein a competitive Walrasian auction setting [4]. Today, peopleare likely to trade through real estate brokers, who provideeasy access online websites for browsing real estate propertyin an interactive and convenient way. Fig. 1 shows an exampleof house listing from Realtor (http://www.realtor.com/), whichis the largest real estate broker in North America. From thefigure, we see that a typical piece of listing on a real estateproperty will introduce the infrastructure data in text for thehouse along with some pictures of the house. Typically, abuyer will look at those pictures to obtain a general idea ofthe overall property in a selected area before making his nextmove.
Traditionally, both real estate industry professionals andresearchers have relied on a number of factors, such aseconomic index, house age, history trade and neighborhoodenvironment [5] and so on to estimate the price. Indeed, thesefactors have been proved to be related to the house price, whichis quite difficult to estimate and sensitive to many differenthuman activities. Therefore, researchers have devoted mucheffort in building a robust house price index [6], [7], [8], [9].In addition, quantitative features including Area, Year, Storeys,Rooms and Centre [10], [11] are also employed to buildneural network models for estimating house prices. However,pictures, which is probably the most important factor on abuyer’s initial decision making process [12], have been ignoredin this process. This is partially due to the fact that visualcontent is very difficult to interpret or quantify by computerscompared with human beings.
A picture is worth a thousand words. One advantage withimages and videos is that they act like universal languages.People with different backgrounds can easily understand themain content of an image or video. In the real estate industry,pictures can easily tell people exactly how the house looks like,which is impossible to be described in many ways using lan-guage. For the given house pictures, people can easily have anoverall feeling of the house, e.g. what is the overall construc-tion style, how the neighboring environment looks like. Thesehigh-level attributes are difficult to be quantitatively described.On the other hand, today’s computational infrastructure isalso much cheaper and more powerful to make the analysisof computationally intensive visual content analysis feasible.Indeed, there are existing works on focusing the analysis ofvisual content for tasks such as prediction [13], [14], andonline user profiling [15]. Due to the recently developed deeplearning, computers have become smart enough to interpretvisual content in a way similar to human beings.
Recently, deep learning has enabled robust and accuratefeature learning, which in turn produces the state-of-the-art
arX
iv:1
611.
0918
0v2
[cs
.CV
] 2
7 Ju
l 201
7
2
performance on many computer vision related tasks, e.g. digitrecognition [16], [17], image classification [18], [19], aesthet-ics estimation [20] and scene recognition [21]. These systemssuggest that deep learning is very effective in learning robustfeatures in a supervised or unsupervised fashion. Even thoughdeep neural networks may be trapped in local optima [22],[23], using different optimization techniques, one can achievethe state-of-the-art performance on many challenging tasksmentioned above.
Inspired by the recent successes of deep learning, in thiswork we are interested in solving the challenging real estateappraisal problem using deep visual features. In particular, forimages related tasks, Convolutional Neural Network (CNN)are widely used due to the usage of convolutional layers. Ittakes into consideration the locations and neighbors of imagepixels, which are important to capture useful features for visualtasks. Convolutional Neural Networks [24], [18], [19] havebeen proved very powerful in solving computer vision relatedtasks.
We intend to employ the pictures for the task of real estateprice estimation. We want to know whether visual features,which is a reflection of a real estate property, can helpestimate the real estate price. Intuitively, if visual features cancharacterize a property in a way similar to human beings, weshould be able to quantify the house features using those visualresponses. Meanwhile, real estate properties are closely relatedto the neighborhood. In this work, we develop algorithmswhich only rely on 1) the neighbor information and 2) theattributes from pictures to estimate real estate property price.
To preserve the local relation among properties we employa novel approach, which employs random walks to generatehouse sequences. In building the random walk graph, only thelocations of houses are utilized. In this way, the problem of realestate appraisal has been transformed into a sequence learningproblem. Recurrent Neural Network (RNN) is particularlydesigned to solve sequence related problems. Recently, RNNshave been successfully applied to challenging tasks includingmachine translation [25], image captioning [26], and speechrecognition [27]. Inspired by the success of RNN, we deployRNN to learn regression models on the transformed problem.
The main contributions of our work are as follows:• To the best of our knowledge, we are the first to quantify
the impact of visual content on real estate price esti-mation. We attribute the possibility of our work to thenewly designed computer vision algorithms, in particularConvolutional Neural Networks (CNNs).
• We employ random walks to generate house sequencesaccording to the locations of each house. In this way, weare able to transform the problem into a novel sequenceprediction problem, which is able to preserve the relationamong houses.
• We employ the novel Recurrent Neural Networks (RNNs)to predict real estate properties and achieve accurateresults.
II. RELATED WORK
Real estate appraisal has been studied by both real estateindustrial professionals and academia researchers. Earlier work
focused on building price indexes for real properties. Theseminal work in [6] built price index according to the repeatprices of the same property at different times. They employedregression analysis to build the price index, which shows goodperformances. Another widely used regression model, Hedonicregression, is developed on the assumption that the character-istics of a house can predict its price [7], [8]. However, itis argued that the Hedonic regression model requires moreassumptions in terms of explaining its target [28]. They alsomentioned that for repeat sales model, the main problem islack of data, which may lead to failure of the model. Recentwork in [9] employed locations and sale price series to buildan autoregressive component. Their model is able to use bothsingle sale homes and repeat sales homes, which can offer amore robust sale price index.
More studies are conducted on employing feed forwardneural networks for real estate appraisal [29], [30], [31], [32].However, their results suggest that neural network modelsare unstable even using the same package with different runtimes [29]. The performance of neural networks are closelyrelated to the features and data size [32]. Recently, Kontrimasand Verikas [33] empirically studied several different modelson selected 12 dimensional features, e.g. type of the house,size, and construction year. Their results show that linearregression outperforms neural network on their selected 100houses.
More recent studies in [1] propose a ranking objective,which takes geographical individual, peer and zone dependen-cies into consideration. Their method is able to use variousestate related data, which helps improve their ranking resultsbased on properties’ investment values. Furthermore, the workin [3] studied online user’s reviews and mobile users’ mov-ing behaviors on the problem of real estate ranking. Theirproposed sparsity regularized learning model demonstratedcompetitive performance.
In contrast, we are trying to solve this problem using theattributes reflected in the visual appearances of houses. Inparticular, our model does not use the meta data of a house(e.g. size, number of rooms, and construction year). We intendto utilize the location information in a novel way such thatour model is able to use the state-of-the-art deep learning forfeature extraction (Convolutional Neural Network) and modellearning (Recurrent Neural Network).
III. RECURRENT NEURAL NETWORK FOR REAL ESTATEPRICE ESTIMATION
In this section, we present the main components of ourframework. We describe how to transform the problem into aproblem that can be solved by the Recurrent Neural Network.The architecture of our model is also presented.
A. Random Walks
One main feature of real estate properties is its location. Inparticular, for houses in the same neighborhood, they tend tohave similar extrinsic features including traffic, schools andso on. We build an undirected graph G for all the housescollected, where each node vi represent the i-th house in our
3
data set. The similarity sij between house hi and house hj isdefined using the Gaussian kernel function, which is a widelyused similarity measure1:
sij = exp
(dist(hi, hj)
2σ2
), (1)
where dist(hi, hj) is the geodesic distance between house hiand hj . σ is the hyper-parameter, which controls the similaritydecaying velocity with the increase of distance. In all of ourexperiments, we set σ to 0.5 miles so that houses within the1.5 (within 3σ) miles will have a relatively larger similarity.The ε-neighborhood graph [34] is employed to build G in ourimplementation. We assign the weight of each edge eij as thesimilarity sij between house hi and the house hj .
Given this graph G, we can then employ random walksto generate sequences. In particular, every time, we randomlychoose one node vi as the root node, then we proportionallyjump to its neighboring nodes vj according to the weightsbetween vi and its neighbors. The probability of jumping tonode vj is defined as
pj =eji∑
k∈N(i) eki, (2)
where N(i) is the set of neighbor nodes of vi. We continueto employ this process until we generate the desired lengthof sequence. The employment of random walks is mainlymotivated by the recent proposed DeepWalk [35] to learnfeature representations for graph nodes. It has been shown thatrandom walks can capture the local structure of the graphs. Inthis way, we can keep the local location structure of housesand build sequences for houses in the graph. Algorithm 1summarizes the detailed steps for generating sequences froma similarity graph.
We have generated sequences by employing random walks.In each sequence, we have a number of houses, which isrelated in terms of their locations. Since we build the graph ontop of house locations, the houses within the same sequenceare highly possible to be close to each other. In other words,the prices of houses in the same sequence are related toeach other. We can employ this context for estimating realestate property price, which can be solved by recurrent neuralnetwork discussed in following sections.
B. Recurrent Neural Network
With a Recurrent Neural Network (RNN), we are trying topredict the output sequence {y1, y2, . . . , yT } given the inputsequence {x1, x2, . . . , xT }. Between the input layer and theoutput layer, there is a hidden layer, which is usually estimatedas in Eq.(3).
ht = ∆(W ihht−1 +Wxxt + bh) (3)
∆ represents some selected activation function or other com-plex architecture employed to process the input xt and ht.One of the most widely deployed architectures is Long Short-Term Memory (LSTM) cell [36], which can overcome thevanishing and exploding gradient problem [37] when training
1http://en.wikipedia.org/wiki/Radial basis function kernel
RNN with gradient descent. Fig. 2 shows the details of asingle Long Short-Term Memory (LSTM) block [38]. EachLSTM cell contains an input gate, an output gate and an forgetgate, which is also called a memory cell in that it is able toremember the error in the error propagation stage [39]. In thisway, LSTM is capable of modeling long-range dependenciesthan conventional RNNs.
it
ft
ct
xt
ht-1
ot
ht
Input Gate
Forget Gate
Output Gate
Cell
Fig. 2. An illustration of a single Long Short-Term Memory (LSTM) Cell.
For completeness, we give the detailed calculation of htgiven input xt and ht−1 in the following equations. LetW i
. , W f. , W o
. represent the parameters related to input,forget and output gate respectively. � denotes the element-wise multiplication between two vectors. φ and ψ are someselected activation functions and σ is the fixed logistic sigmoidfunction. Following [38], [27], [40], we employ tanh for bothφ in Eq.(6) and ψ in Eq.(8).
it = σ(W ixxt +W i
hht−1 +W icct−1 + bi) (4)
ft = σ(W fx xt +W f
h ht−1 +W fc ct−1 + bf ) (5)
ct = ft � ct−1 + it � φ(W cxxt +W c
hht−1 + bc) (6)ot = σ(W o
xxt +W ohht−1 +W o
c ct + bo) (7)ht = ot � ψ(ct) (8)
C. Multi-layer Bidirectional LSTM
In previous sections, we have discussed the generation ofsequences as well as Recurrent Neural Network. Recall thatwe have built an undirected graph in generating the sequences,which indicates that the price of one house is related to allthe houses in the same sequence including those in the laterpart. Bidirectional Recurrent Neural Network (BRNN) [41]has been proposed to enable the usage of both earlier andfuture contexts. In bidirectional recurrent neural network, thereis an additional backward hidden layer iterating from the lastof the sequence to the first. The output layer is calculated byemploying both forward and backward hidden layer.
Bidirectional-LSTM (B-LSTM) is a particular type ofBRNN, where each hidden node is calculated by the longshort-term memory as shown in Fig. 2. Graves et al. [40] haveemployed Bidirectional-LSTM for speech recognition. Fig. 3shows the architecture of the bidirectional recurrent neuralnetwork. We have two Bidirectional-LSTM layers. During the

4
1bth1
1bh 1
1bth
1bTh
11fh 1
1f
th 1f
Th
1x tx 1tx TxInput Layer
1st Forward Layer
1st Backward Layer
Output Layer
1fth
1y ty 1ty Ty
21fh 2
1f
th 2f
Th2fth
2bth2
1bh 2
1bth
2bTh
2nd Forward Layer
2nd Backward Layer
11
bth
1tx
11
fth
ty
21
fth
21
bth
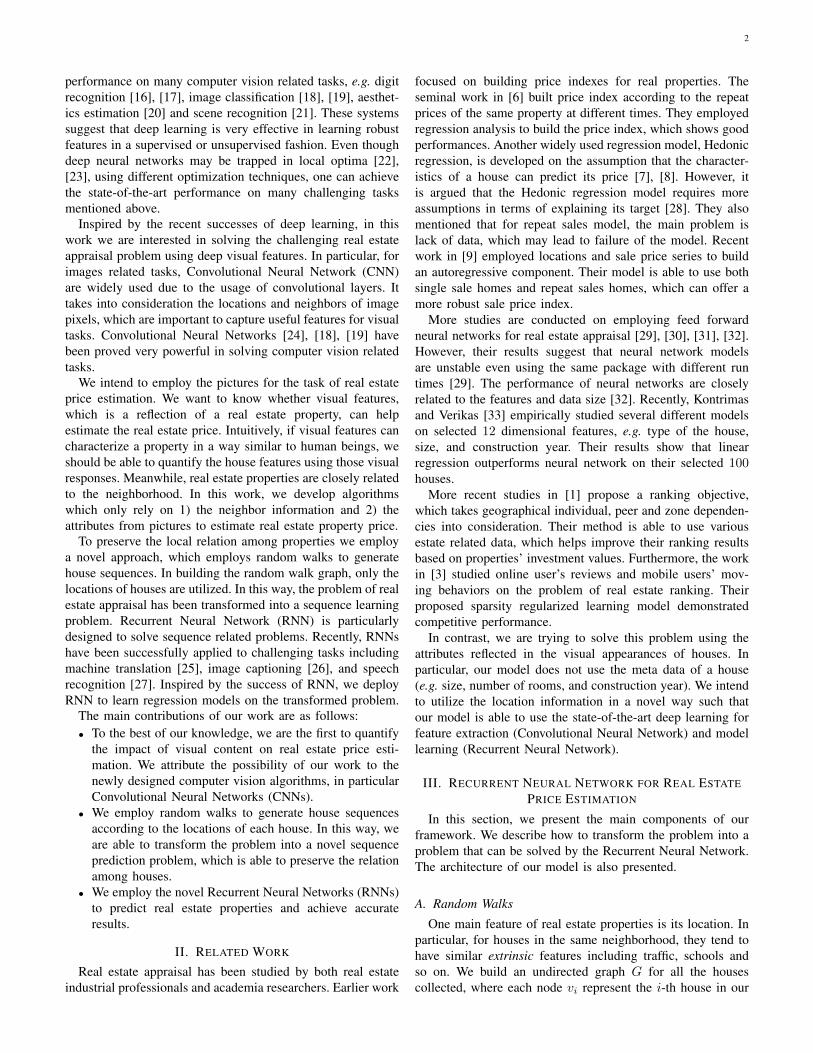
Fig. 3. The Multi-layer Bidirectional Recurrent Neural Network (BRNN) architecture for real estate price estimation. There are two bidirectional recurrentlayers in this architecture. For real estate price estimation, the price of each house is related to all houses in the same sequence, which is the main motivationto employ bidirectional recurrent layers.
forward pass of the network, we calculate the response of boththe forward and the backward hidden layers in the 1st-LSTMand 2nd-LSTM layer respectively. Next, the output (in ourproblem, the output is the price of each house) of each houseis calculated using the output of the 2nd-LSTM layer as inputto the output layer.
Algorithm 1 RandomWalksRequire: H = {h1, h2, . . . , hn} geo-coordinates of n houses
σ hyper-parameter for Gaussian Kernelt threshold for distanceM total number of desired sequences
1: Calculate the Vincenty distance between any pair ofhouses
2: Calculate the similarity between houses according to theGaussian kernel function (see Eq.(1)).
3: repeat4: Initialize sc = {}5: Randomly pick one node hi and add hi to sc6: set hc = hi7: while size(sc) < L do8: Pick hc’s neighbor node hj with probability pj
defined in Eq.(2)9: add hj to sc
10: set hc = hj11: end whileadd sc to S12: until size (S) = M13: return The set of sequence S
The objective function for training the Multi-Layer Bidirec-tional LSTM is defined as follows:
L =1
N
N∑n=1
∑j
‖ yij − yij ‖2 (9)
where W is the the set of all the weights between differentlayers.yij is the actual trade price for the j-th house in the
generated i-th sequence and yij is the corresponding estimatedprice for this house.
When training our Multi-Layer B-LSTM model, we employthe RMSProp [42] optimizer, which is an adaptive method forautomatically adjust the learning rates. In particular, it normal-izes the gradients by the average of its recent magnitude.
Algorithm 2 Training Multi-Layer B-LSTMRequire: H = {h1, h2, . . . , hn} geo-coordinates of n houses
X = {x1, x2, . . . , xn} features of the n houseY = {y1, y2, . . . , yn} prices of the n houses
1: S = RandomWalks (see Algorithm 1)2: Split S into mini-batches3: repeat4: Calculate the gradient of L in Eq.(9) and update the
parameters using RMSProp.5: until Convergence6: return The learned model M
We conduct the back propagation in a mini-batch approach.Algorithm 2 summarizes the main steps for our proposedalgorithm.
D. PredictionIn the prediction stage, the first step is also generating
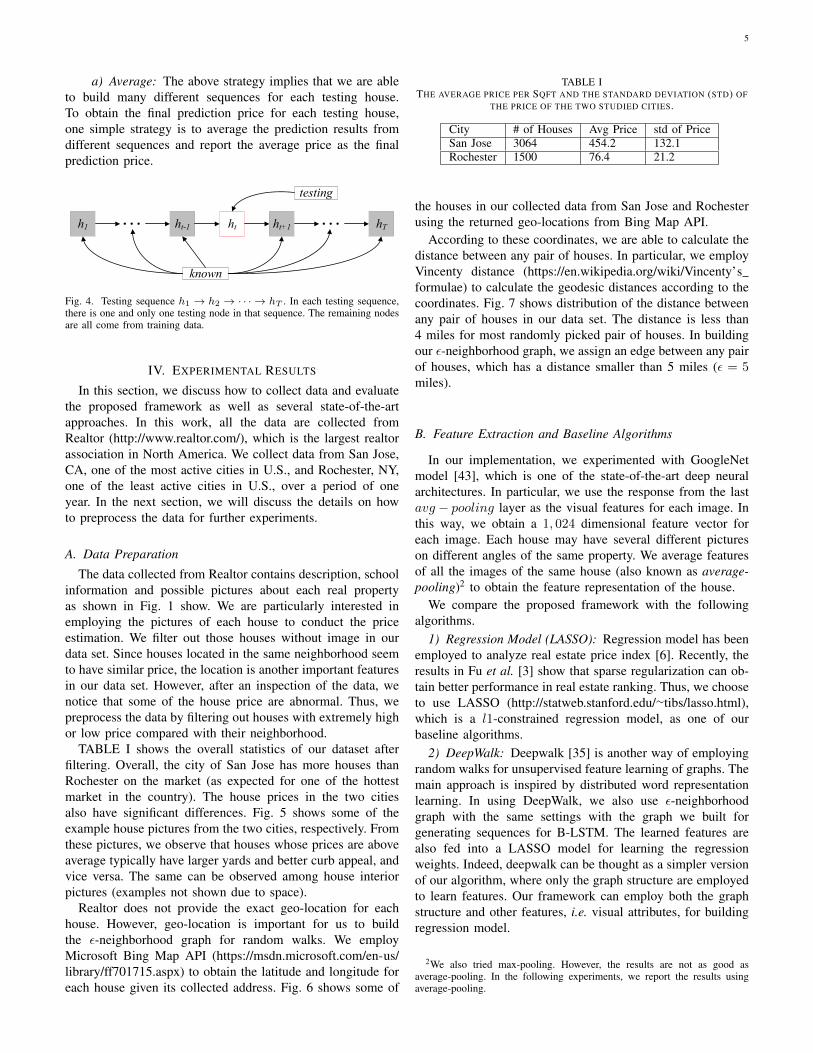
sequence. For each testing house, we add it as a new node intoour previously build similarity graph on the training data. Eachtesting house is a new node in the graph. Next, we add edgesto the testing nodes and the training nodes. We use the samesettings when adding edges to the new ε-neighborhood graph.Given the new graph G′, we randomly generate sequences andkeep those sequences that contain one and only one testingnode. In this way, for each house, we are able to generatemany different sequences that contain this house. Fig. 4 showsthe idea. Each testing sequence only has one testing house.The remaining nodes in the sequence are the known traininghouses.
5
a) Average: The above strategy implies that we are ableto build many different sequences for each testing house.To obtain the final prediction price for each testing house,one simple strategy is to average the prediction results fromdifferent sequences and report the average price as the finalprediction price.
h1 ht ht+1 hT ht-1
testing
known
Fig. 4. Testing sequence h1 → h2 → · · · → hT . In each testing sequence,there is one and only one testing node in that sequence. The remaining nodesare all come from training data.
IV. EXPERIMENTAL RESULTS
In this section, we discuss how to collect data and evaluatethe proposed framework as well as several state-of-the-artapproaches. In this work, all the data are collected fromRealtor (http://www.realtor.com/), which is the largest realtorassociation in North America. We collect data from San Jose,CA, one of the most active cities in U.S., and Rochester, NY,one of the least active cities in U.S., over a period of oneyear. In the next section, we will discuss the details on howto preprocess the data for further experiments.
A. Data Preparation
The data collected from Realtor contains description, schoolinformation and possible pictures about each real propertyas shown in Fig. 1 show. We are particularly interested inemploying the pictures of each house to conduct the priceestimation. We filter out those houses without image in ourdata set. Since houses located in the same neighborhood seemto have similar price, the location is another important featuresin our data set. However, after an inspection of the data, wenotice that some of the house price are abnormal. Thus, wepreprocess the data by filtering out houses with extremely highor low price compared with their neighborhood.
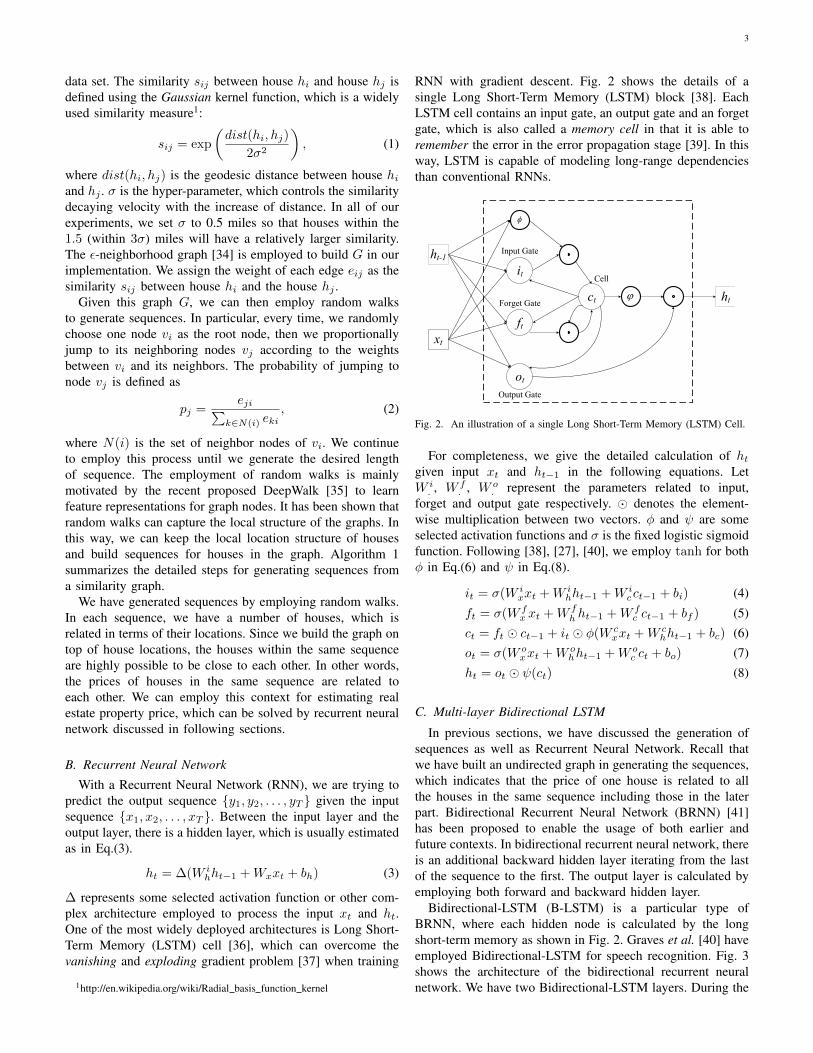
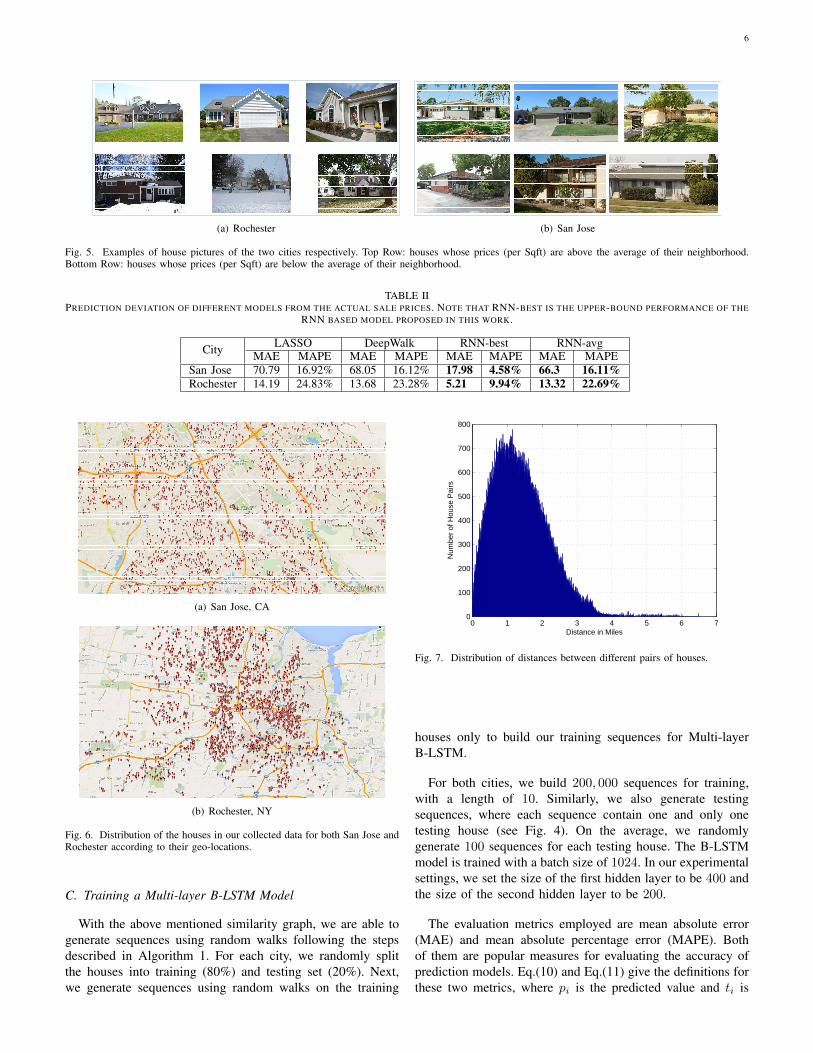
TABLE I shows the overall statistics of our dataset afterfiltering. Overall, the city of San Jose has more houses thanRochester on the market (as expected for one of the hottestmarket in the country). The house prices in the two citiesalso have significant differences. Fig. 5 shows some of theexample house pictures from the two cities, respectively. Fromthese pictures, we observe that houses whose prices are aboveaverage typically have larger yards and better curb appeal, andvice versa. The same can be observed among house interiorpictures (examples not shown due to space).
Realtor does not provide the exact geo-location for eachhouse. However, geo-location is important for us to buildthe ε-neighborhood graph for random walks. We employMicrosoft Bing Map API (https://msdn.microsoft.com/en-us/library/ff701715.aspx) to obtain the latitude and longitude foreach house given its collected address. Fig. 6 shows some of
TABLE ITHE AVERAGE PRICE PER SQFT AND THE STANDARD DEVIATION (STD) OF
THE PRICE OF THE TWO STUDIED CITIES.
City # of Houses Avg Price std of PriceSan Jose 3064 454.2 132.1Rochester 1500 76.4 21.2
the houses in our collected data from San Jose and Rochesterusing the returned geo-locations from Bing Map API.
According to these coordinates, we are able to calculate thedistance between any pair of houses. In particular, we employVincenty distance (https://en.wikipedia.org/wiki/Vincenty’sformulae) to calculate the geodesic distances according to thecoordinates. Fig. 7 shows distribution of the distance betweenany pair of houses in our data set. The distance is less than4 miles for most randomly picked pair of houses. In buildingour ε-neighborhood graph, we assign an edge between any pairof houses, which has a distance smaller than 5 miles (ε = 5miles).
B. Feature Extraction and Baseline Algorithms
In our implementation, we experimented with GoogleNetmodel [43], which is one of the state-of-the-art deep neuralarchitectures. In particular, we use the response from the lastavg − pooling layer as the visual features for each image. Inthis way, we obtain a 1, 024 dimensional feature vector foreach image. Each house may have several different pictureson different angles of the same property. We average featuresof all the images of the same house (also known as average-pooling)2 to obtain the feature representation of the house.
We compare the proposed framework with the followingalgorithms.
1) Regression Model (LASSO): Regression model has beenemployed to analyze real estate price index [6]. Recently, theresults in Fu et al. [3] show that sparse regularization can ob-tain better performance in real estate ranking. Thus, we chooseto use LASSO (http://statweb.stanford.edu/∼tibs/lasso.html),which is a l1-constrained regression model, as one of ourbaseline algorithms.
2) DeepWalk: Deepwalk [35] is another way of employingrandom walks for unsupervised feature learning of graphs. Themain approach is inspired by distributed word representationlearning. In using DeepWalk, we also use ε-neighborhoodgraph with the same settings with the graph we built forgenerating sequences for B-LSTM. The learned features arealso fed into a LASSO model for learning the regressionweights. Indeed, deepwalk can be thought as a simpler versionof our algorithm, where only the graph structure are employedto learn features. Our framework can employ both the graphstructure and other features, i.e. visual attributes, for buildingregression model.
2We also tried max-pooling. However, the results are not as good asaverage-pooling. In the following experiments, we report the results usingaverage-pooling.
6
(a) Rochester (b) San Jose
Fig. 5. Examples of house pictures of the two cities respectively. Top Row: houses whose prices (per Sqft) are above the average of their neighborhood.Bottom Row: houses whose prices (per Sqft) are below the average of their neighborhood.
TABLE IIPREDICTION DEVIATION OF DIFFERENT MODELS FROM THE ACTUAL SALE PRICES. NOTE THAT RNN-BEST IS THE UPPER-BOUND PERFORMANCE OF THE
RNN BASED MODEL PROPOSED IN THIS WORK.
City LASSO DeepWalk RNN-best RNN-avgMAE MAPE MAE MAPE MAE MAPE MAE MAPE
San Jose 70.79 16.92% 68.05 16.12% 17.98 4.58% 66.3 16.11%Rochester 14.19 24.83% 13.68 23.28% 5.21 9.94% 13.32 22.69%
(a) San Jose, CA
(b) Rochester, NY
Fig. 6. Distribution of the houses in our collected data for both San Jose andRochester according to their geo-locations.
C. Training a Multi-layer B-LSTM Model
With the above mentioned similarity graph, we are able togenerate sequences using random walks following the stepsdescribed in Algorithm 1. For each city, we randomly splitthe houses into training (80%) and testing set (20%). Next,we generate sequences using random walks on the training
0 1 2 3 4 5 6 70
100
200
300
400
500
600
700
800
Distance in Miles
Num
ber
of H
ouse
Pai
rs
Fig. 7. Distribution of distances between different pairs of houses.
houses only to build our training sequences for Multi-layerB-LSTM.
For both cities, we build 200, 000 sequences for training,with a length of 10. Similarly, we also generate testingsequences, where each sequence contain one and only onetesting house (see Fig. 4). On the average, we randomlygenerate 100 sequences for each testing house. The B-LSTMmodel is trained with a batch size of 1024. In our experimentalsettings, we set the size of the first hidden layer to be 400 andthe size of the second hidden layer to be 200.
The evaluation metrics employed are mean absolute error(MAE) and mean absolute percentage error (MAPE). Bothof them are popular measures for evaluating the accuracy ofprediction models. Eq.(10) and Eq.(11) give the definitions forthese two metrics, where pi is the predicted value and ti is

7
the true value for the i-th instance.
MAE =1
N
N∑i=1
|ti − pi| (10)
MAPE =1
N
N∑i=1
| ti − piti| (11)
We use the same training and testing split to evaluate allthe approaches. TABLE II shows the regression results for allthe different approaches in the two selected cities. For eachtesting house, we generate about 100 sequences. In TABLE II,we report both the best and the average price of the predictedprice. For Rochester, the average standard deviation of thepredicted prices over all the houses is 5.6, which is 7.33% ofthe average price in Rochester (see TABLE I). Comparably,the average standard deviation for San Jose is 34.64, which is7.63% of the average price in San Jose. The best is the priceclosest to the true price among all the available sequences foreach house3. Overall, our B-LSTM model outperforms othertwo baseline algorithms in both cities. All of the evaluationapproaches perform better in San Jose than in Rochester interms of MAPE. This is possible due to the availability ofmore training data in the city of San Jose. DeepWalk showsslightly better performance than LASSO, which suggests thatlocation is relatively more important than the visual featuresin the realtor business. This is expected
1 1.5 2 2.5 3
Group by SD
0
20
40
60
80
Pric
e ($
)
MAE ROCMAE SJ
(a) MAE
1 1.5 2 2.5 3
Group by SD
10
20
30
40
Per
cent
age
MAPE ROCMAPE SJ
(b) MAPE
Fig. 8. Performance of B-LSTM-avg in different groups. All the testinghouses are grouped by the predicted standard deviation.
3This is the upper bound of the prediction results. We choose the closestprice using the ground truth price as reference.
D. Confidence Level
For each testing house, the proposed model can give a groupof predictions. We want to know whether or not the proposedmodel can distinguish the confidence level of its prediction.In particular, we group the testing houses evenly into threegroups for each city. The first group has the smallest standarddeviation of the prediction prices. The second group is themiddle one and the last group is the one with the largeststandard deviation.
Fig. 8 shows the MAE and MAPE for the different groups.The results show that standard deviation can be viewed as arough measure of the confidence level of the proposed modelon the current testing house. Small standard deviation tendsto indicate a high confidence of the model and overall it alsosuggests a smaller prediction error.
V. CONCLUSION
In this work, we propose a novel framework for real estateappraisal. In particular, the proposed framework is able to takeboth the location and the visual attributes into consideration.The evaluation of the proposed model on two selected citiessuggests the effectiveness and flexibility of the model. Indeed,our work has also offered new approaches of applying deepneural networks on graph structured data. We hope our modelcan not only give insights on real estate appraisal, but also caninspire others on employing deep neural networks on graphstructured data.
REFERENCES
[1] Y. Fu, H. Xiong, Y. Ge, Z. Yao, Y. Zheng, and Z.-H. Zhou, “Exploitinggeographic dependencies for real estate appraisal: a mutual perspectiveof ranking and clustering,” in SIGKDD. ACM, 2014, pp. 1047–1056.
[2] K. Wardrip, “Public transits impact on housing costs: a review of theliterature,” 2011.
[3] Y. Fu, Y. Ge, Y. Zheng, Z. Yao, Y. Liu, H. Xiong, and N. Yuan,“Sparse real estate ranking with online user reviews and offline movingbehaviors,” p. 120129, 2014.
[4] A. Beja and M. B. Goldman, “On the dynamic behavior of prices indisequilibrium,” The Journal of Finance, vol. 35, no. 2, pp. 235–248,1980.
[5] E. L’Eplattenier, “How to run a comparative market analysis (cma) theright way,” http://fitsmallbusiness.com/comparative-market-analysis/,2016.
[6] M. J. Bailey, R. F. Muth, and H. O. Nourse, “A regression method forreal estate price index construction,” Journal of the American StatisticalAssociation, vol. 58, no. 304, pp. 933–942, 1963.
[7] R. Meese and N. Wallace, “Nonparametric estimation of dynamichedonic price models and the construction of residential housing priceindices,” Real Estate Economics, vol. 19, no. 3, pp. 308–332, 1991.
[8] S. Sheppard, “Hedonic analysis of housing markets,” Handbook ofregional and urban economics, vol. 3, pp. 1595–1635, 1999.
[9] C. H. Nagaraja, L. D. Brown, L. H. Zhao et al., “An autoregressiveapproach to house price modeling,” The Annals of Applied Statistics,vol. 5, no. 1, pp. 124–149, 2011.
[10] T. Lasota, Z. Telec, G. Trawinski, and B. Trawinski, “Empirical compar-ison of resampling methods using genetic fuzzy systems for a regressionproblem,” in Intelligent Data Engineering and Automated Learning-IDEAL 2011. Springer, 2011, pp. 17–24.
[11] O. Kempa, T. Lasota, Z. Telec, and B. Trawinski, “Investigation ofbagging ensembles of genetic neural networks and fuzzy systems forreal estate appraisal,” in Intelligent Information and Database Systems.Springer, 2011, pp. 323–332.
[12] W. Di, N. Sundaresan, R. Piramuthu, and A. Bhardwaj, “Is a picturereally worth a thousand words?:-on the role of images in e-commerce,”in Proceedings of the 7th ACM international conference on Web searchand data mining. ACM, 2014, pp. 633–642.
8
[13] X. Jin, A. Gallagher, L. Cao, J. Luo, and J. Han, “The wisdom of socialmultimedia: using flickr for prediction and forecast,” in Proceedings ofthe international conference on Multimedia. ACM, 2010, pp. 1235–1244.
[14] Q. You, L. Cao, Y. Cong, X. Zhang, and J. Luo, “A multifaceted ap-proach to social multimedia-based prediction of elections,” Multimedia,IEEE Transactions on, vol. 17, no. 12, pp. 2271–2280, Dec 2015.
[15] Q. You, S. Bhatia, and J. Luo, “A picture tells a thousand words?aboutyou! user interest profiling from user generated visual content,” SignalProcessing, vol. 124, pp. 45–53, 2016.
[16] Y. LeCun, B. Boser, J. S. Denker, D. Henderson, R. E. Howard,W. Hubbard, and L. D. Jackel, “Backpropagation applied to handwrittenzip code recognition,” Neural computation, vol. 1, no. 4, pp. 541–551,1989.
[17] G. E. Hinton, S. Osindero, and Y.-W. Teh, “A fast learning algorithm fordeep belief nets,” Neural computation, vol. 18, no. 7, pp. 1527–1554,2006.
[18] D. C. Ciresan, U. Meier, J. Masci, L. M. Gambardella, and J. Schmid-huber, “Flexible, high performance convolutional neural networks forimage classification,” in IJCAI. AAAI Press, 2011, pp. 1237–1242.
[19] A. Krizhevsky, I. Sutskever, and G. E. Hinton, “Imagenet classificationwith deep convolutional neural networks.” in NIPS, vol. 1, no. 2, 2012,p. 4.
[20] X. Lu, Z. Lin, H. Jin, J. Yang, and J. Z. Wang, “Rapid: Rating pictorialaesthetics using deep learning,” in ACM MM. ACM, 2014, pp. 457–466.
[21] B. Zhou, A. Lapedriza, J. Xiao, A. Torralba, and A. Oliva, “Learningdeep features for scene recognition using places database,” in NIPS,2014, pp. 487–495.
[22] G. Hinton, “A practical guide to training restricted boltzmann machines,”Momentum, vol. 9, no. 1, p. 926, 2010.
[23] Y. Bengio, “Practical recommendations for gradient-based training ofdeep architectures,” in Neural Networks: Tricks of the Trade. Springer,2012, pp. 437–478.
[24] Y. LeCun, L. Bottou, Y. Bengio, and P. Haffner, “Gradient-based learningapplied to document recognition,” Proceedings of the IEEE, vol. 86,no. 11, pp. 2278–2324, 1998.
[25] D. Bahdanau, K. Cho, and Y. Bengio, “Neural machine translation byjointly learning to align and translate,” ICLR, 2014.
[26] O. Vinyals, A. Toshev, S. Bengio, and D. Erhan, “Show and tell: Aneural image caption generator,” in CVPR, 2015, pp. 3156–3164.
[27] A. Graves, A.-r. Mohamed, and G. Hinton, “Speech recognition withdeep recurrent neural networks,” in ICASSP. IEEE, 2013, pp. 6645–6649.
[28] F. T. Wang and P. M. Zorn, “Estimating house price growth with repeatsales data: what’s the aim of the game?” Journal of Housing Economics,vol. 6, no. 2, pp. 93–118, 1997.
[29] E. Worzala, M. Lenk, and A. Silva, “An exploration of neural networksand its application to real estate valuation,” Journal of Real EstateResearch, vol. 10, no. 2, pp. 185–201, 1995.
[30] P. Rossini, “Improving the results of artificial neural network models forresidential valuation,” in Fourth Annual Pacific-Rim Real Estate SocietyConference, Perth, Western Australia, 1998.
[31] P. Kershaw and P. Rossini, “Using neural networks to estimate constantquality house price indices,” Ph.D. dissertation, INTERNATIONALREAL ESTATE SOCIETY, 1999.
[32] N. Nghiep and C. Al, “Predicting housing value: A comparison ofmultiple regression analysis and artificial neural networks,” Journal ofReal Estate Research, vol. 22, no. 3, pp. 313–336, 2001.
[33] V. Kontrimas and A. Verikas, “The mass appraisal of the real estate bycomputational intelligence,” Applied Soft Computing, vol. 11, no. 1, pp.443–448, 2011.
[34] U. Von Luxburg, “A tutorial on spectral clustering,” Statistics andcomputing, vol. 17, no. 4, pp. 395–416, 2007.
[35] B. Perozzi, R. Al-Rfou, and S. Skiena, “Deepwalk: Online learning ofsocial representations,” in SIGKDD. ACM, 2014, pp. 701–710.
[36] F. Gers, “Long short-term memory in recurrent neural networks,” Un-published PhD dissertation, Ecole Polytechnique Federale de Lausanne,Lausanne, Switzerland, 2001.
[37] R. Pascanu, T. Mikolov, and Y. Bengio, “On the difficulty of trainingrecurrent neural networks,” in ICML, 2013, pp. 1310–1318.
[38] F. A. Gers, N. N. Schraudolph, and J. Schmidhuber, “Learning precisetiming with lstm recurrent networks,” The Journal of Machine LearningResearch, vol. 3, pp. 115–143, 2003.
[39] S. Hochreiter and J. Schmidhuber, “Long short-term memory,” Neuralcomputation, vol. 9, no. 8, pp. 1735–1780, 1997.
[40] A. Graves, N. Jaitly, and A.-R. Mohamed, “Hybrid speech recognitionwith deep bidirectional lstm,” in Workshop on Automatic Speech Recog-nition and Understanding (ASRU). IEEE, 2013, pp. 273–278.
[41] M. Schuster and K. K. Paliwal, “Bidirectional recurrent neural net-works,” Signal Processing, IEEE Transactions on, vol. 45, no. 11, pp.2673–2681, 1997.
[42] T. Tieleman and G. Hinton, “Lecture 6.5 - rmsprop, coursera: Neuralnetworks for machine learning,” University of Toronto, Tech. Rep., 2012.
[43] C. Szegedy, W. Liu, Y. Jia, P. Sermanet, S. Reed, D. Anguelov, D. Erhan,V. Vanhoucke, and A. Rabinovich, “Going deeper with convolutions,”in CVPR, June 2015.
Related Documents