I’m a Relationship Person! What Do I Do with Prospect Screening Data? Please take this time before the start of the session to silence your cell phone.
Dec 18, 2015
Welcome message from author
This document is posted to help you gain knowledge. Please leave a comment to let me know what you think about it! Share it to your friends and learn new things together.
Transcript


I’m a Relationship Person! What Do I Do with Prospect Screening Data?
Please take this time before the start ofthe session to silence your cell phone or pager.
Your feedback is valuable. At the end of the session, we ask that you take a moment to complete an
evaluation form.
Thank you.

I’m a Relationship Person! What Do I Do with Prospect Screening Data?
Presented by:
Brian Chapman, President Grenzebach Glier Philanthropic Analytics
and
David W. Howie, Director Leadership CircleWETA, Inc.
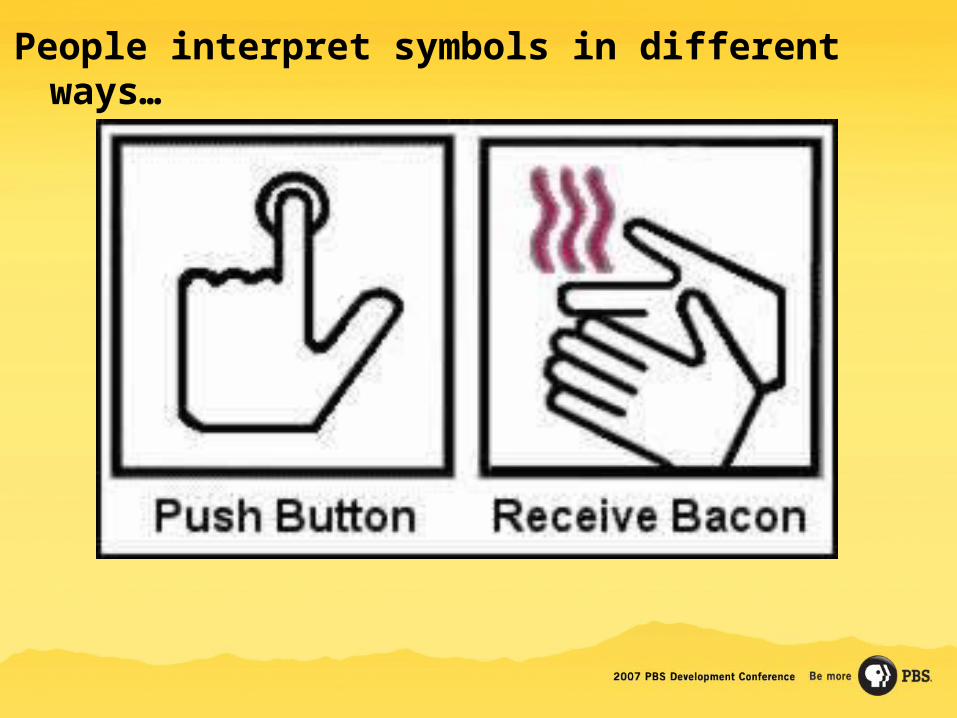
People interpret symbols in different ways…
And so they do with data…
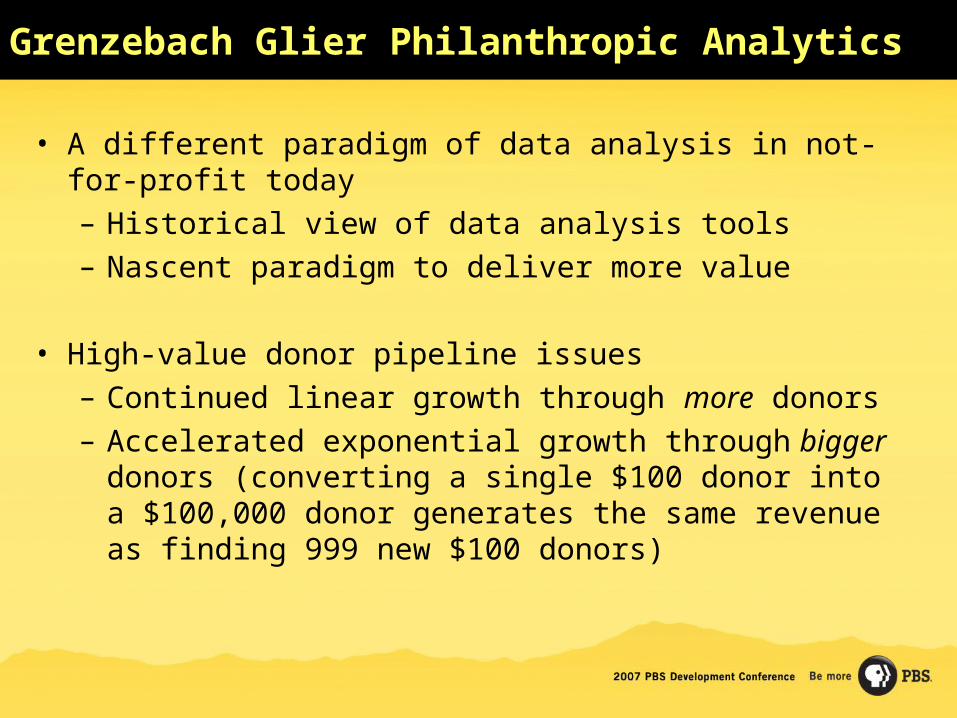
Grenzebach Glier Philanthropic Analytics
• A different paradigm of data analysis in not-for-profit today– Historical view of data analysis tools– Nascent paradigm to deliver more value
• High-value donor pipeline issues– Continued linear growth through more donors– Accelerated exponential growth through bigger donors
(converting a single $100 donor into a $100,000 donor generates the same revenue as finding 999 new $100 donors)

Historical View of Data Analysis
• Prospect screening
– Mostly based on hard asset data
• Predictive models
– Generic, based on averages of non-peer institutions
– Speculative, based on even less
• Subordinate to market/viewership/financial analysis done by the private sector

A New Paradigm Is Emerging That Will Deliver More Value
● Not just hard assets
● Marketing segments
● Demographics
Append constituent information
Analyze historical giving
behavior
● Who gave● How they gave
How frequently
When● Benchmarked
against peers
Create custom predictive
models/resource plans
● Who should we be cultivating, visiting, soliciting, calling, emailing
● With what likelihood of success
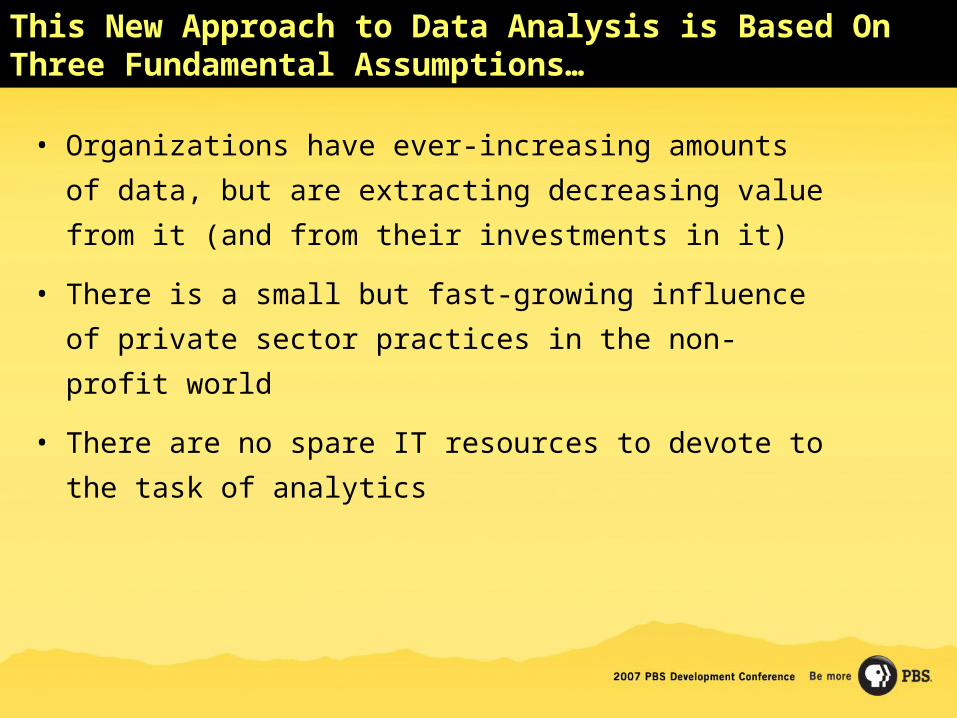
This New Approach to Data Analysis is Based On Three Fundamental Assumptions…
• Organizations have ever-increasing amounts of data,
but are extracting decreasing value from it (and from
their investments in it)
• There is a small but fast-growing influence of private
sector practices in the non-profit world
• There are no spare IT resources to devote to the task
of analytics

…And One Key Objective
• Help make resource allocation decisions about how to deploy staff and programs to:
– Raise money effectively in current/upcoming development programs
– Keep the pipeline full for subsequent programs and future priorities
– Expand resources in areas with the greatest yield, and reduce resources elsewhere
Appended Data: More Than Just Hard Assets

The Information Available to Us Is Much Greater Than Hard Assets
• Hard Asset Data• Company affiliation
• Non-profit board affiliation
• Real estate ownership
• Insider stock holdings
• Some retirement accounts
• FEC and some charitable contributions
• Demographic/Marketing Data, e.g.,• Age• Income• Home Market Value• Marital status• Presence of Children• Vehicles• Mail response behavior
• Market Segmentation• Relative wealth• Lifestyle preferences• Consumer behaviors• Philanthropic tendencies

Market Segmentation is Used Widely for Big Decisions in Private and Non-Profit Sectors
To develop its predictive model of store performance and site location
For market and sales performance analysis; drove higher U.S. sales among target audiences
Marketing segmentation to drive communication messaging

Key Findings from Screening 29 PBS Stations
• Effective segmentation means people with more capacity are asked to give more, and are in fact responding– Increasing the ask amounts in direct mail and
telephone programs for higher-income people has resulted in larger gifts
– Selection of the most promising prospects (longer-term, loyal donors with high incomes, high home values, and a highly philanthropic market segment) for personal visits prioritizes resources and identifies actionable steps

Key Findings from Screening 29 PBS Stations
Even on a station-by-station level, donors to Public Broadcasting have a similar wealth distribution to donors to other leading organizations
Income Range% of Enhanced Records
(PBS Sample)
% of RecordsAcross all GG&A
Clients
Under $15,000 5.6% 3.4%
$15,000 to $19,999 2.7% 3.0%
$20,000 to $29,999 5.9% 5.7%
$30,000 to $39,999 9.2% 8.3%
$40,000 to $49,999 7.8% 8.5%
$50,000 to $74,999 17.6% 20.8%
$75,000 to $99,999 13.5% 14.9%
$100,000 to $124,999 9.3% 7.2%
$125,000 or more 28.3% 28.2%
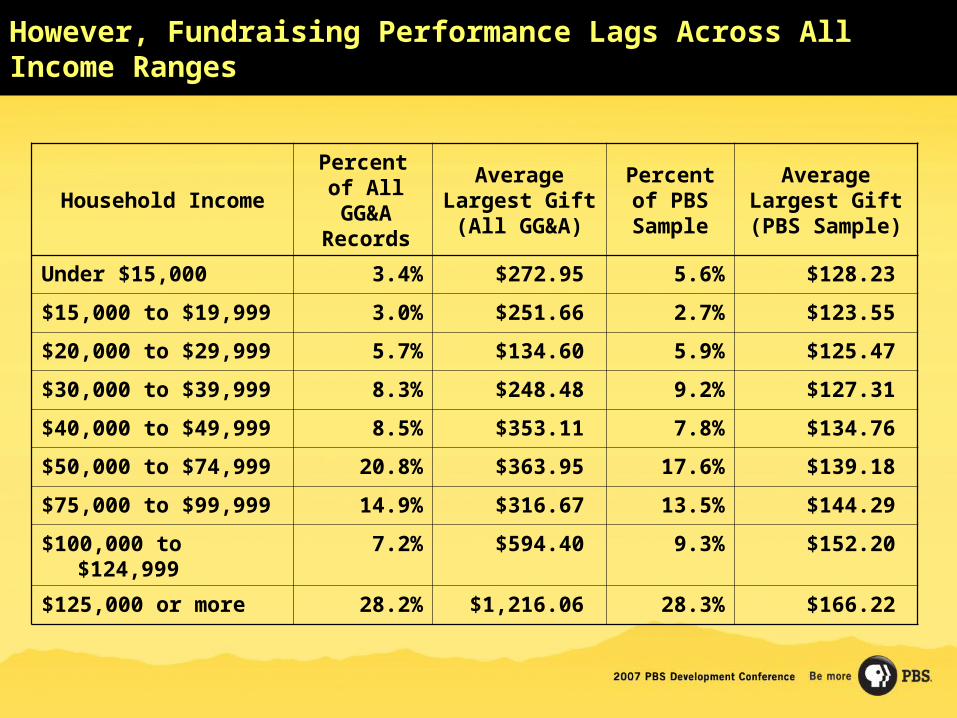
However, Fundraising Performance Lags Across All Income Ranges
Household IncomePercent of All GG&A Records
Average Largest Gift (All GG&A)
Percent of PBS
Sample
Average Largest Gift
(PBS Sample)
Under $15,000 3.4% $272.95 5.6% $128.23
$15,000 to $19,999 3.0% $251.66 2.7% $123.55
$20,000 to $29,999 5.7% $134.60 5.9% $125.47
$30,000 to $39,999 8.3% $248.48 9.2% $127.31
$40,000 to $49,999 8.5% $353.11 7.8% $134.76
$50,000 to $74,999 20.8% $363.95 17.6% $139.18
$75,000 to $99,999 14.9% $316.67 13.5% $144.29
$100,000 to $124,999 7.2% $594.40 9.3% $152.20
$125,000 or more 28.2% $1,216.06 28.3% $166.22

Effective Segmentation is Critically Important
• Across PBS Stations, the largest gifts from high income donors were very similar to the largest gifts from lower-income donors
• Through Pledge Drives and other vehicles, all donors are receiving the same messages—and same solicitations
• Simply asking higher-value donors for larger gifts will have an immediate benefit

Example: They were going to ask her for $10,000
Ms. Cecilia Q. Prospect MQR:ENPS 09/ 12/ 2007
Submitted Prospect I nformation
Name Cecilia Prospect Address 520 El Dorado Rd Palm Desert CA Employer Cyberdyne Technologies Business Address 700 W Main Ave
Downey, CA
GG&A Rating Summary Gift Capacity Estimate More than $10 Million Gift Capacity Rating 1 Major Gift Rating A Annual Gift Rating 1 Planned Gift Rating P PCR Code Special Focus Indicator
Client Supplied Data
Assigned Solicitor Unassigned Relationship Constituent Type Individual Number of Gifts 16 Member Since 03/09/1989 * Total Cumulative Giving $7,550.00
Household Information & Demographics Prospect Age 64 Martial Status M Spouse Name Bob Children Present No * Est Household Income GREATER THAN $124,999 * Home Market Value $1,000,000 PLUS
Lexis-Nexis Real Estate
Number of Properties 2 * Total Property Value $21,771,958.00
Larkspur Pension Number of Matches 0 * Total Net Assets $0.00
FEC Contributions
REP Contributions $5,000.00 DEM Contributions $2,000.00 UNK Contributions $0.00 * Total Contributions $7,000.00
Thomsons Financial SEC Stock Disclosures Mkt Value Direct Holdings $89,312,862.30 Mkt Value Indirect Holdings $0.00 * Total Holdings $89,312,862.30 * Total Sales $64,165,679.18
Market Guide
Number of Matches 2 match(es) * Total Compensation $724,555
Dun & Bradstreet Number of Matches 1 match(es) * Total Sales $1,433,894,900
Biographical Sources
Guidestar Non Profits 2 match(es) Guidestar Pvt Foundation 1 match(es) Marquis Who's Who 0 match(es) Corp Tech 0 match(es)
* The values in these fields are used in the GG&A Gift Capacity Rating calculation.
$21 million
in real estate $89 million
in stock
Salary $724,000
Serves on at least 3 not-for- profit
boards
16 gifts to the station totaling
over $7,500

Using Screening To Qualify Prospects
• This prospect:– Is worth tens of millions of dollars– Has made 16 gifts over an 18 year period– Has made $1 million+ gifts to other organizations
• Next steps were:– Scratch the $10,000 ask plan– Personal invitation to meet the CEO– Preparation of a proposal for a $100,000 capital gift with
naming opportunities, and a $10,000 annual commitment
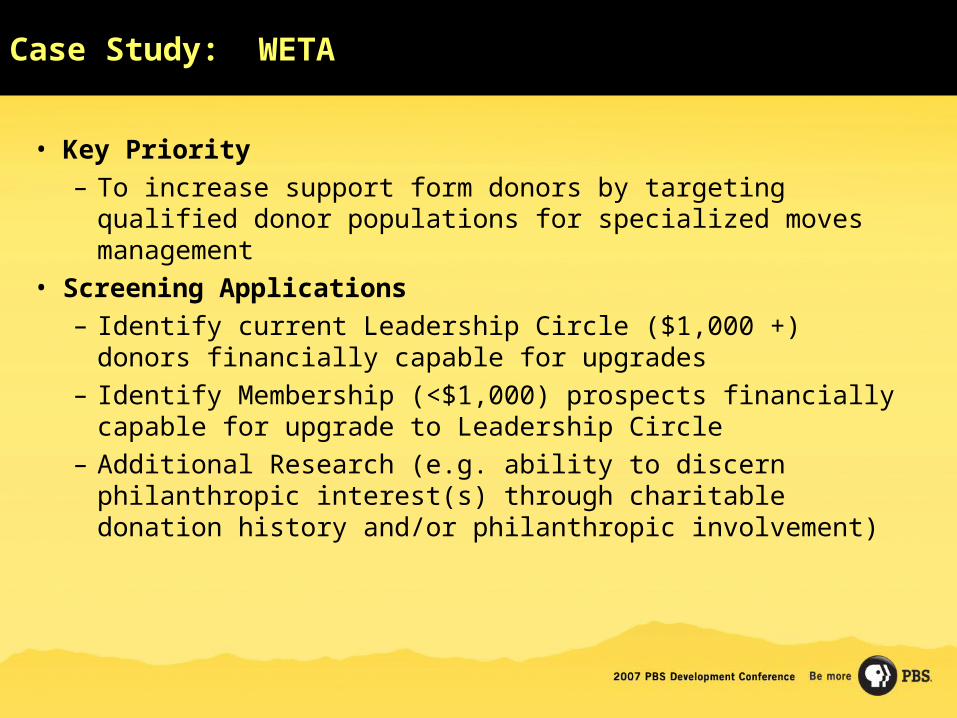
Case Study: WETA
• Key Priority– To increase support form donors by targeting qualified donor
populations for specialized moves management• Screening Applications
– Identify current Leadership Circle ($1,000 +) donors financially capable for upgrades
– Identify Membership (<$1,000) prospects financially capable for upgrade to Leadership Circle
– Additional Research (e.g. ability to discern philanthropic interest(s) through charitable donation history and/or philanthropic involvement)

Case Study: WETA
• Submittal Strategy– Selection Criteria (handout)– Proposed and Revised Timeline of
Submittals (handout)– Client Defined Fields– Segment donors into discrete groups for
selective events, solicitations, etc.– Example submittals
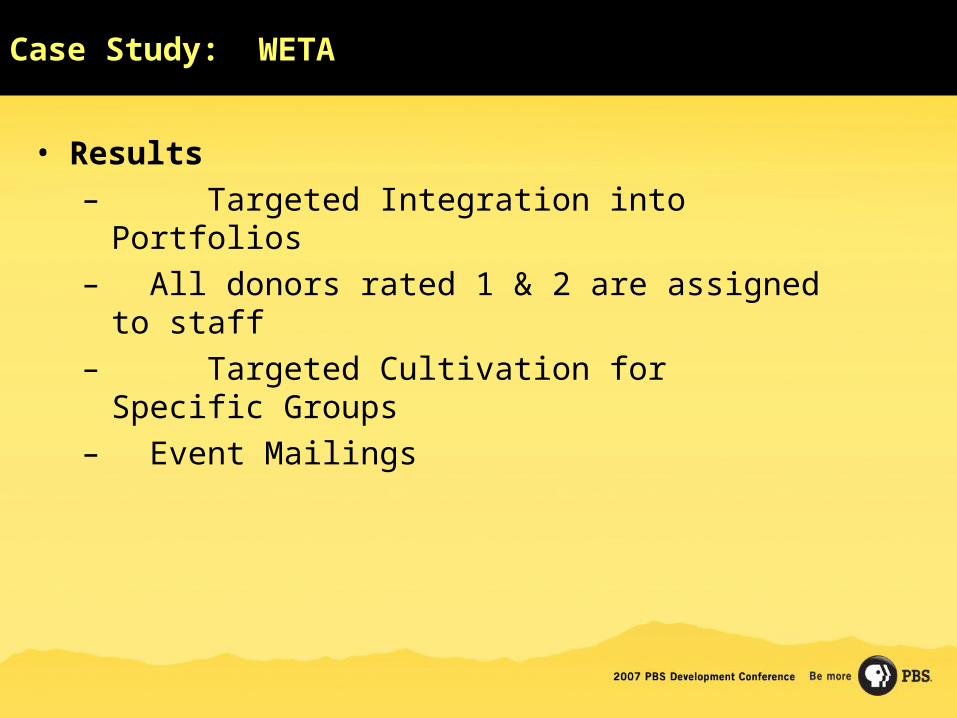
• Results– Targeted Integration into Portfolios– All donors rated 1 & 2 are assigned to staff – Targeted Cultivation for Specific Groups– Event Mailings
Case Study: WETA
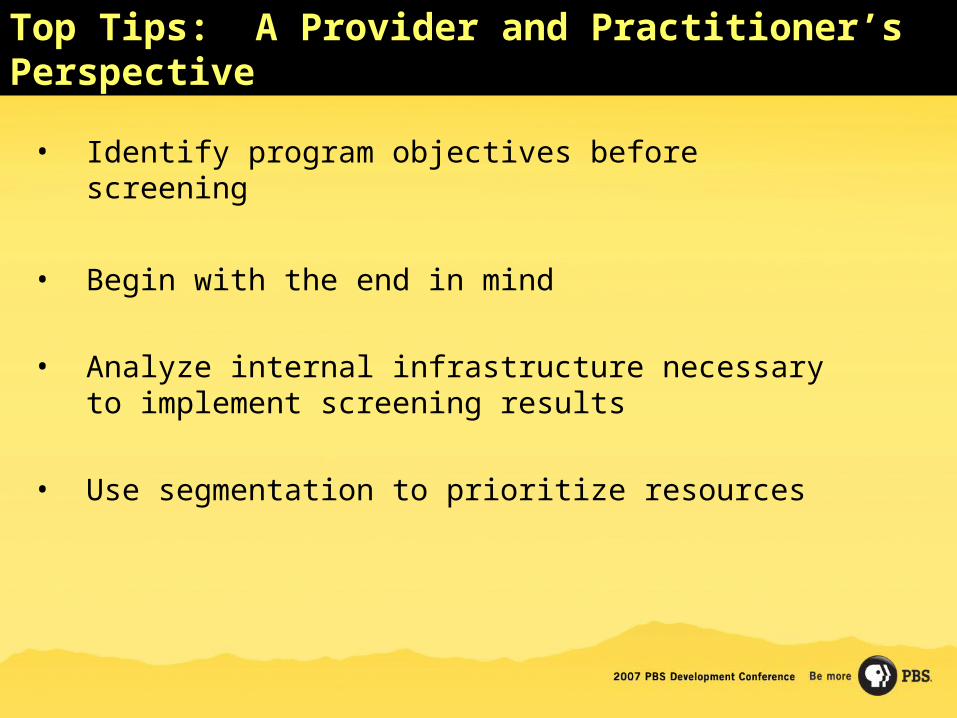
Top Tips: A Provider and Practitioner’s Perspective
• Identify program objectives before screening
• Begin with the end in mind
• Analyze internal infrastructure necessary to implement screening results
• Use segmentation to prioritize resources

Top Tips: A Provider and Practitioner’s Perspective
• Identify actionable steps
• Consider all data to establish appropriate strategies to achieve program objectives
Contact Information
Brian Chapman
President, Grenzebach Glier Philanthropic Analytics
Grenzebach Glier & Associates, Inc.
401 N Michigan Avenue, Suite 2800
Chicago, IL 60610
(312) 372-4040
David W. Howie
Director, Leadership Circle
WETA, Inc.
2775 South Quincy Street
Arlington, VA 22206
(703) 998-2443
Related Documents


![I’m [name]. And I’m big.](https://static.cupdf.com/doc/110x72/56815fb3550346895dceb092/im-name-and-im-big.jpg)