ILO DWT for South Asia and Country Office for India Vinoj Abraham and S.K. Sasikumar December 2017 ILO Asia-Pacific Working Paper Series Declining wage share in India’s organized manufacturing sector: Trends, patterns and determinants DWT for South Asia and Country Office for India

Welcome message from author
This document is posted to help you gain knowledge. Please leave a comment to let me know what you think about it! Share it to your friends and learn new things together.
Transcript

ILO DWT for South Asia and Country Office for India
Vinoj Abraham and S.K. Sasikumar
December 2017
I LO As ia - Pa c i f i c Wor k i n g Pa per Se r i es
Declining wage share in India’s organized manufacturing
sector: Trends, patterns and determinants
DWT for South Asia and Country Off ice for India


ILO Asia-Pacific Working Paper Series
Declining wage share in India’s organized
manufacturing sector: Trends, patterns and
determinants
Vinoj Abraham 1 and S.K. Sasikumar 2
December 2017
DWT for South Asia and Country Off ice for India
1 Dr. Vinoj Abraham, Centre for Development Studies, Trivandrum, Kerala 2 Dr.S.K. Sasikumar, V.V. Giri National Labour Institute, Noida, Uttar Pradesh
Copyright © International Labour Organization 2017
First published 2017
Publications of the International Labour Office enjoy copyright under Protocol 2 of the Universal Copyright
Convention. Nevertheless, short excerpts from them may be reproduced without authorization, on condition that the
source is indicated. For rights of reproduction or translation, application should be made to ILO Publications (Rights
and Permissions), International Labour Office, CH-1211 Geneva 22, Switzerland, or by email: [email protected]. The
International Labour Office welcomes such applications.
Libraries, institutions and other users registered with reproduction rights organizations may make copies in accordance
with the licences issued to them for this purpose. Visit www.ifrro.org to find the reproduction rights organization in
your country.
48 p. (ILO Asia-Pacific working paper series)
ISSN: 2227-4405 (web pdf)
ILO Regional Office for Asia and the Pacific
The designations employed in ILO publications, which are in conformity with United Nations practice, and the
presentation of material therein do not imply the expression of any opinion whatsoever on the part of the International
Labour Office concerning the legal status of any country, area or territory or of its authorities, or concerning the
delimitation of its frontiers.
The responsibility for opinions expressed in signed articles, studies and other contributions rests solely with their
authors, and publication does not constitute an endorsement by the International Labour Office of the opinions
expressed in them.
Reference to names of firms and commercial products and processes does not imply their endorsement by the
International Labour Office, and any failure to mention a particular firm, commercial product or process is not a sign
of disapproval.
ILO publications and electronic products can be obtained through major booksellers or ILO local offices in many
countries, or direct from ILO Publications, International Labour Office, CH-1211 Geneva 22, Switzerland, or ILO
Regional Office for Asia and the Pacific, 11th Floor, United Nations Building, RajdamnernNok Avenue, Bangkok
10200, Thailand, or by email: [email protected]. Catalogues or lists of new publications are available free of
charge from the above address, or by email: [email protected].
Visit our website: www.ilo.org/publns or www.ilo.org/asia.
Printed in India

Preface A persistent decline in labour share has been visible in many developed and developing economies since
the 1980s. Declining labour share in terms of wages and emoluments portends widening income inequality,
demand constriction and slowdown of economic growth. In India, too, declining wages and emoluments
share in gross value added has been noted at least since the 1980s. Effective policy intervention in the issue
entails a detailed analysis of this process. This research is aimed at understanding the phenomenon of
declining labour share in India.
Using the Annual Survey of Industries data, this study analyses the patterns, trends and determinants of
declining labour share in organized manufacturing in India from 1980–81 to 2012–13. Specifically, the
study addresses three core issues. First, it undertakes a comprehensive analysis of the trends and patterns
in factor payments in the organized manufacturing sector. Long-term trends are explored across dimensions
such as states, size classification and industrial classification. Second, the various sources contributing to
this decline in wage share are identified through decomposition and shift share analysis. Third, factors that
explain the change in wage share are identified through a first-difference regression analysis.
We hope that the findings of this research study will spark intensification of debates on labour share in
gross value added, on the one hand, and provide valuable inputs for all concerned to evolve and implement
appropriate programmes and policies related to wages, on the other.


ILO DWT for South Asia and Country Office for India iii
Table of contents Preface ………………………………………………………………………………………………….. i
Acknowledgements …………………………………………………………………………………….. v
Abbreviations …………………………………………………………………………………………. vii
1. Introduction ……………………………………………………………………………………..1
1.1 Literature review and analytical context …………………………………………………....3
1.1.1 Literature review …………………………………………………………………….3
1.1.2 Analytical background ……………………………………………………………....6
2. Trends and patterns of factor shares in GVA …………………………………………………..7
2.1 Share of factor payments in GVA ………………………………………………………….7
2.2 Share of factor payments: A disaggregated picture ……………………………………......14
3. Wage share: Accounting for the drop ………………………………………………………….23
3.1 Relative contribution of regions and industries …………………………………………....23
3.2 Change in wage share from 2000–01 to 2011–12: A shift share analysis …………………24
4. Composition of workforce and worker emoluments ………………………………………......27
4.1 Composition of employees ………………………………………………………...............27
4.2 Employees and person days ……………………………………………………………….29
4.3 Wages and emoluments ……………………………………………………………………31
4.4 Capital intensity and technology …………………………………………………………..33
5. What is behind the drop in wage share? A first-difference model ………………………........35
5.1 Data ……………………………………………………………………………………......35
5.2 Analytical method …………………………………………………………………………35
5.3 Hypothesis …………………………………………………………………………………36
5.4 Estimated results …………………………………………………………………………...39
6. Conclusion …………………………………………………………………………………………...41
References ……………………………………………………………………………………………...44
Appendix ………………………………………………………………………………………………..L
ILO DWT for South Asia and Country Office for India iv
List of figures
1. Share of factor payments in GVA (nominal prices) ………………………………………………….10
2. Share of labour in GVA: Comparing nominal and real values ……………………………………….12
3. Trends in labour productivity and annual earnings per employee
(rupees thousand (INR), constant prices at 2004–05 base year) ……………………………………..13
4. Share of total emoluments in GVA: Size classification by number of employees …………………...18
List of tables
1. Share of factor payments in GVA (nominal prices) ……………………………………….……………9
2. Contribution of factor payments to growth in GVA …………………………………………………...11
3. CAGR in labour productivity and annual earnings per employee
(constant prices at 2004–05 base year) ………………………………………………………………..13
4. Share of total emoluments to workers in GVA ………………………………………………………...14
5. Change in emoluments share across states …………………………………………………………….15
6. Share of profits in GVA ………………………………………………………………………………..16
7. Change in profit share across states ……………………………………………………………………17
8. Correlation between state-wise share of emoluments, profits, interest, rent and wages in GVA ……...17
9. Share and change in share of total emoluments in GVA of firms by employment size ……………….19
10. Share and change in share of wages in GVA of firms by employment size ………………………….20
11. Share of emoluments in GVA by industry ……………………………………………………………20
12. Change in share of emoluments in GVA by industry ………………………………………………...22
13. Decomposition of wage share drop …………………………………………………………………...26
14. Share of workers in total employment ………………………………………………………………..28
15. Number of days of work per worker in a year………………………………………………………...30
16. Relative wages and emoluments ……………………………………………………………………...32
17. Trends in capital intensity and composition of capital ……………………………………………….34
18. Labour Market Regulation (LMR) across states in India …………………………………………….38
19. Estimated model of wage share and emolument share ……………………………………………….38

ILO DWT for South Asia and Country Office for India v
Acknowledgements
We are grateful to Dr Sher Verick and Dr Xavier Estupinan for extending invaluable support during the
preparation of this research paper. We sincerely acknowledge the comments received from various
participants who attended the Technical Consultation on Wages organized by the International Labour
Organization and V.V. Giri National Labour Institute on 31 January 2017 during which the draft version of
this paper was presented and discussed. We are also grateful to Balakrushna Padhi and Sanjay Kumar
Mallick for excellent research support for this study.

ILO DWT for South Asia and Country Office for India

ILO DWT for South Asia and Country Office for India vii
Abbreviations
CAGR Compound Annual Growth Rate
CPI Consumer Price Index
CSO Central Statistics Office
CPIIW Consumer Price Index for Industrial Workers
EPWRF Economic and Political Weekly Research Foundation
FDI Foreign Direct Investment
GDP Gross Domestic Product
GVA Gross Value Added
OECD Organisation for Economic Co-operation and Development
SBTC Skill-Biased Technological Changes
WPI Wholesale Price Index

ILO DWT for South Asia and Country Office for India

ILO DWT for South Asia and Country Office for India 1
`
1. Introduction Widening income inequality across the world in recent years has emerged as a core concern in development
policy discourses. This current phase of rising interpersonal inequality has been marked by its functional
nature, with a large part of it emerging from the earning inequality between employers and employees.3
This concern for the distribution of the value added stems from perspectives of social justice as well as its
ability to affect economic growth.4 Declining labour share can reduce household consumption, limit
aggregate demand, and weaken investment and exports, in turn affecting the growth of gross domestic
product (GDP) (ILO, IMF, OECD and WB, 2015).
One of the persistent trends noted in the functional distribution of factor shares is the remarkable stability
in relative factor shares throughout the nineteenth and early twentieth centuries. Kaldor (1957) in fact
regarded this stability in factor shares as a “growth fact” of many economies in the long run. The stability
in labour shares was an empirical reality in most developed economies for such a long period in the early
twentieth century that scholars even considered it futile to study this distribution any longer.5
However, since the 1980s, visible changes in factor shares have been reported in developed economies.
Giovannoni (2014a) shows that while the labour share in the United States (US) remained in the narrow
band between 68 per cent and 72 per cent from 1947 to 1983, by 2012 it declined to about 64 per cent.
Studies indicate that wage share had declined in all Organisation for Economic Co-operation and
Development (OECD) countries between 1970 and 2010 and that the wage-productivity gap had been
widening in the developed world (Stockhammer, 2012). Moreover, this phenomenon was not restricted to
the developed world. Goldberg and Pavcnik (2007) reported widening inequality in many developing
economies as well. Charpe (2011) records that since the early 1990s the decline in wage share had in fact
been much sharper in the developing and emerging economies than in the developed economies. This study
reports that the wage share in Asian economies declined by roughly 20 per cent and in African economies
by approximately 15 per cent, with a large part of the drop occurring in more recent decades. Trapp (2015)
shows that the share of wages in the gross value added (GVA) has been declining since the early 1990s and
also that labour’s relative income in developing countries has been declining by about 10 percentage points.
In India, a persistent decline of wage share in GVA of the organized manufacturing sector and a widening
gap between real wages per worker and labour productivity have been noted at least since the early 1980s
(Guha, 2009; Kannan and Raveendran, 2009; Kumar and Felipe, 2011). Given that the organized
manufacturing sector represents only a small share of the total employment in the Indian economy (about
5 per cent),6 the extent of this decline in wage share may not be the same across the country. Moreover, a
large share of the employed in the economy appears to be self-employed (about 50 per cent), whose labour
contribution is not easily tractable. Nevertheless, this persisting trend in the organized manufacturing sector
may be reflected in the rest of the Indian economy as well, according to the National Accounts Statistics of
3 The ILO, IMF, OECD, WB (2015) study shows that in a large number of countries, including India, widening interpersonal
inequality was strongly associated with the declining labour share in gross value added (GVA).
4 Most literature on the linkage between growth and inequality has argued the causation from growth to inequality. However, a
growing literature argues that the causation could be the reverse. For instance, see ILO, 2013; ILO, 2014.
5 See Giovannoni, 2014a.
6 Estimates based on the India Employment Report 2016 (Ghose, 2016).

2 ILO DWT for South Asia and Country Office for India
India. The estimated figures from the National Accounts Statistics, which covers the entire economy,
including both organized and unorganized sectors, shows that in 1980–81 the compensation to employees
as a share of the GDP at factor cost stood at 38.5 per cent, which declined to 22.5 per cent by 2012–13.7
This paper analyses this persistent decline in the labour share in India. We restrict our study to the organized
manufacturing sector due to the lack of data in other sectors. First, we undertake an examination of the
trends and patterns in factor payments in the organized manufacturing sector. Second, we examine the
extent of decline in wage share and identify the sources of this drop. Third, we look into the factors that
explain the change in wage share. The paper is divided into six sections. Section 1 provides the literature
review and analytical context. Section 2 explores the trends and patterns of factor shares in GVA in the
organized manufacturing sector. In section 3 we undertake a decomposition of the drop in wage share in
GVA to identify the sources of this decline. Section 4 examines the changes in the composition of labour
and capital. In section 5, a regression model is specified and estimated to explain the drop in wage share.
Finally, section 6 draws the main conclusions.
Data and scope of the study: For this study we used the Annual Survey of Industries (ASI), including both
unit-level and aggregate data. For the published aggregate data we used data provided by the Central
Statistics Office (CSO) and compiled by the Economic and Political Weekly Research Foundation
(EPWRF). To look into the long-term trends, we analysed data from 1980–81 to 2012–13, the latest period
for which data is available. The analysis for this part of the study has been done for all of India and 16
major states. To specifically address the issue of wage share decline in the recent past, we have considered
from the years 2000–01 and 2011–12. For this we compiled data from the unit-level data of the ASI and
aggregated it at the three-digit level for 35 states and Union Territories.
Definitions: This paper uses mainly two concepts – wages and emoluments. Detailed definitions are
provided in the appendix. Briefly, wages include all wage payments made to the workers of a factory, not
including non-wage benefits. Emoluments include wages and all non-wage benefits accrued to the workers.
Wage share refers to wages as a share of GVA.8 One caveat needs to be added. Wages and emoluments do
not include the proprietor’s income, while the denominator GVA would also include this. There is no way
to separate the proprietor’s income as the ASI does not collect this separately. To that extent the wages may
be underestimated, since the proprietor’s income is excluded while his work effort is included in the GVA.
But given that in large factories covered by the ASI the proprietor’s contribution as worker would be
minimal in both absolute and relative terms, this will not bias the results. Other factor shares used are rent,
interest and profits, as given in ASI; all figures used are as reported in ASI.
7 Estimates also show a declining dependence on wage income relative to the total household income in India (Papola and Kannan,
forthcoming).
8 A major hurdle in estimating the share of labour in GVA for developing countries is the presence of a large segment of the self-
employed, whose income gets accounted as “mixed income”. However, in the context of this study, this does not pose a problem
as the focus is purely on the organized manufacturing sector, where there are hardly any employers with mixed income. In the
organized sector, the division of GVA into workers’ emoluments and other payments is distinct. For a treatment of methods of
accounting for self-employed income in share of GVA, see Trapp, 2015.

ILO DWT for South Asia and Country Office for India 3
`
The figures for GVA and wages, wherever used in real terms and mentioned as real values, have been
deflated by the Wholesale Price Index (WPI)9 with 2004–05 as base year and Consumer Price Index for
Industrial Workers (CPIIW) with 2001 as base year at the two-digit industry level. The CPIIW series was
spliced to arrive at 2004–05 base year prices. Capital, including IT capital, was deflated using the WPI for
Machinery and Machine Tools with 2004–05 as the base year.
1.1 Literature review and analytical context 1.1.1 Literature review
The functional distribution of income was of central concern to the classical thinkers. Scarcity produced
rent while labour produced value, according to Ricardo. Wage share depended on the wage fund, which in
turn was associated with capital availability. The residual was accounted for as profits. For Marx, capitalist
production of labour surplus drove wages to the subsistence level which created larger surpluses as profit
share while progressively contracting the labour share. The neoclassicals regarded the market structure as
crucial in explaining distributive shares. In perfectly competitive markets, all factors would be paid
according to factor productivity, while as monopoly power of the firms increase, the factor productivity
may not reflect returns to factor and a greater proportion of the marginal product gets appropriated as profits.
However, post-classicals such as Kalecki argued that the neoclassical argument of marginal contribution
and its returns is a special case with little general applicability as markets are never perfect. Kalecki instead
regarded the mark-up price, which is the excess profit over and above costs, as determining the share of
factors in different market conditions. Keynes held that the share of profit in income depended on the ratio
of investment to output if the marginal propensity to save for workers and employers differed and that of
workers was lower than that of employers.10
The recent literature on distribution of value added has focused on the compositional changes in inputs,
technological change, institutions and globalization, including financial globalization. We shall briefly look
at the arguments and their empirical evidences.
Wage-rental ratio and choice of technology: Labour share – the product of total employment and wage
rates – is argued to be affected by the relative price of labour to that of capital or the rental-wage ratio. As
the ratio of wages to capital price rises, the choice of production technology shifts to capital deepening.
Bentolila and Saint-Paul (2003) in their study on OECD countries identify the rise in wage-rental ratio as a
prime factor in explaining the fall in labour share. Similarly, Arpaia, Pérez and Pichelmann (2009) and
Driver and Muñoz-Bugarin (2010) find that capital deepening and capital augmenting technology was
responsible for the declining share of labour in European economies. Studies on India also show that the
relative price of capital has been declining; consequently, employment and wage share have been shrinking
(Chandrasekhar, 2008; Goldar, 2013; Kannan and Raveendran, 2009). From 1990–91 to 2009–10, the
employment elasticity of manufacturing output was a measly 0.05 (Sen and Das, 2015), in effect implying
9 Due to unavailability of appropriate price deflators, “WPI of Machinery and Machine Tools” is used as a proxy deflator for
Division 30 and Division 33 of NIC-2004; and “WPI of Manufactured Products” as the proxy deflator for Divisions 23, 36 and
37 of NIC-2004.
10 For a detailed review of early theoretical developments in distribution, see Kaldor, 1955. For a review of theoretical and empirical
literature on labour share, see Giovannoni, 2014b, 2014c, and Schneider, 2011.

4 ILO DWT for South Asia and Country Office for India
an almost complete stagnation of employment growth in the sector. Sen and Das identify the prime reason
for this stagnation in employment growth to be the consistent decrease in labour intensity across all
industries, whether capital-intensive or labour-intensive. This decrease in labour intensity was in turn
caused by the rising relative wage-rental price ratio. The wage-rental price ratio had been rising both due
to rising real wages and declining capital rental price. The declining capital rental price occurred because
of trade liberalization and the reduction of tariff walls for capital goods. However, the rise in real wages
did not compensate for the decline in employment, thus reducing the labour share in GVA.
Technological change: Apart from the capital–labour substitution owing to relative price differences,
technological change and new forms of industrial organization can alter labour shares. Depending on the
direction of technological change, capital deepening or labour deepening, the labour share could vary. Any
technological change that alters relative productivity between the factors of production would enhance the
relative demand for the more productive input. Bentolila and Saint-Paul (2003) showed that in the OECD
countries, apart from capital deepening due to relative factor price difference, capital augmenting
technological progress had led to a drop of labour share in value added. Recent developments in capital-
deepening technological change created capital-skill complementarities while unskilled labour was
substituted. It has been argued that, globally, skill-biased technological changes (SBTC) cause stagnation
in overall employment; increase the demand for skilled workers and capital; and decrease the overall wage
share in the value added. A plethora of studies of this nature have been done in the US (see, for instance,
Berman, 2000; Doms, Dunne and Troske, 1997; Jorgenson and Stiroh, 1999). Studies done on the Indian
case by Berman, Somanathan and Tan (2005), Ramaswamy (2008), Abraham (2010) and Goldar (2013)
also argue that the widening wage inequalities between skilled and unskilled workers have their roots in
capital deepening and SBTC.
Globalization: Globalization essentially involves an enhanced pace of the international mobility of outputs
and factor inputs, including mobility of outputs through exports and imports, factor mobility through capital
flows, and labour migration. Mobility of both outputs and factor inputs may impact labour share through
multiple channels. In the output market channel, decline in aggregate labour share could occur due to sector-
biased changes in final goods demand. Following the Heckscher–Ohlin model, international trade could
make labour-intensive production concentrated in labour-abundant developing countries, which implies
that the share of labour relative to capital would be higher in such economies. On the other hand, increasing
competition in the output market, following trade, could reduce profits and hence increase wage share.
Guscina (2006) found that in developed economies labour share declined as a result of trade openness
following the Heckscher–Ohlin route. Trade openness was found to reduce labour share in both developed
and developing economies (Harrison, 2002) through the trade route and factor endowments. Additionally,
the author identifies exchange rate fluctuations as causing drop in labour share, while controls on capital
mobility, such as foreign direct investments (FDIs), increased labour share.
The relative difference in international mobility of factor inputs would create wedges in the wage-rental
ratio. For instance, higher capital mobility relative to labour reduces the quasi-rent for capital, making
capital cheaper, leading to rising capital intensity, while institutional rigidities in labour mobility increases
quasi-rent for labour. Jayadev (2007), in a cross-country panel study, argues that capital openness has led
to reduction in labour shares in developed countries and middle-income countries, though there is not much
evidence in the case of low-income countries. He interprets this finding as the reduced bargaining position
of labour share owing to increased capital mobility in the developed and middle-income countries. The lack
ILO DWT for South Asia and Country Office for India 5
`
of evidence of such an association in the low-income countries is attributed to the fact that most workers
are already in the informal sector and they earn at subsistence level, hence there is hardly any space for
squeezing of their wage share. Alderson and Nielsen (2002) find evidence for a decline in the bargaining
power of labour because of multinational corporations, leading to waning labour share. Pollin (2000) argues
that the threat of unemployment among the less skilled workers due to outsourcing and capital substitution
also reduced the wage rates and labour share.
Studies on India have focused on the trade effect on employment, with very limited evidence on the other
facets of globalization, as well as their effect on labour share. Most of these studies analysed the linkage
between trade liberalization of the Indian economy and jobless growth in the Indian organized
manufacturing sector (for example, Banga, 2005; Bhalotra, 1998; Ghose, 2000; Goldar, 2009; Hasan, Mitra
and Ramaswamy, 2007; Kambhampati and Howell, 1998; Nagraj, 2004; Sankaran, Abraham and Joseph,
2010; Sen, 2008). Though labour share is not the prime concern of these studies it may be inferred that the
effect of trade liberalization on employment elasticity may have a bearing on labour share as well, due to
the relatively slower growth in employment vis-à-vis output growth. However, Bhalotra (1998) does show
that the sluggish growth in employment in the 1980s was offset by rising product wage rates in the Indian
manufacturing sector. Further, Goldar (2013) shows that increasing exports in the Indian manufacturing
sector may have a depressing effect on labour share.
Institutional factors: The Indian economy has witnessed vast changes in its market structure, moving from
being a regulated closed economy to an increasingly open, deregulated economy. While the output market
and the capital market were progressively being deregulated, the labour market functioned without any
major changes in its regulatory structure. Deregulation in the output sector can have cascading effects on
the labour market, by reducing the bargaining power of workers (Blanchard and Giavazzi, 2003). One of
the important features of deregulation of the industrial sector in India was the privatization of the public
sector and encouraging private foreign capital in the industrial sector. The infusion of the private sector and
private foreign capital may have implications on labour share. Azmat, Manning and Van Reenen (2012), in
a study of network industries in the OECD countries, show that privatization of firms lead to a fall in wage
share. This occurs mainly due to a shift in incentive for managers towards maximizing shareholder value
and moving away from job protection. The fall in wage share in privatization occurs mainly due to the fall
in employment, though the real wages may increase.
Though labour market institutions have remained largely unchanged in India, their roles have witnessed
major changes in the period after liberalization. Much has been written about the rigid nature of labour
market regulations in India, which have caused employment growth to stagnate (Besley and Burgess, 2004;
Fallon and Lucas, 1991). In the Indian context, labour market regulations have arguably increased the hiring
and firing costs along with other quasi-fixed costs that discourage employment growth, precipitating
substitution of capital for labour. Trade unions strengthen the bargaining power of workers, which in turn
raises labour share in value added. Fichtenbaum (2009) and Stockhammer (2009) show that unionization
had a positive impact on labour share in the US and OECD countries, respectively. However, globalization
has increasingly weakened the trade unions through various mechanisms (Brady and Wallace, 2000).The
weakening of bargaining power and employment protection could lead to a fall in labour share, as shown
by Blanchard and Giavazzi (2003). In India, it has been noted, the bargaining power of the workers has
been declining vis-à-vis employers (Papola, 1994; Sundar, 2005), as indicated by the declining strength of
6 ILO DWT for South Asia and Country Office for India
trade unions in terms of number of unions and union memberships, and the ratio of man-days lost due to
employer lockouts versus employee strikes. It is possible that while capital intensity or technological change
has been enhancing labour productivity, the fruits of these gains are not passed on to the workers owing to
their weakened bargaining position in the relationship. Goldar (2013) shows that the declining bargaining
power of trade unions may also be instrumental in explaining the decline in labour share.
1.1.2 Analytical background
A wage bill is the sum total of wages received by individuals of all firms in all industries. A change in wage
bill arises out of a change in wage rate or number of employees. Labour share is the proportion of the wage
bill in the value added. Any change in labour share is the relative change in wage bill to that of other
components in the value added, namely interest, rent and profits.
Profit-maximizing firms substitute factors of production depending upon unit factor price and marginal
productivity. Firms may see as substitutes not only labour and capital, but also different types of labour
when the unit prices of different types of labour are different. Further, firms may also view not only different
types of labour, but also workers and worker-time as substitutes, if they present different unit costs to the
firm. Thus profit-maximizing firms may optimize the use of different types of labour, thereby changing the
composition of labour, along with the quantity of labour used.
The firm views labour as heterogeneous, not only due to perceived productivity differences as manifested
in skill differences, but also due to the structural and institutional features of the labour market. Firms facing
dual labour markets would factor in quasi-fixed costs of hiring and retaining workers from the formal labour
market vis-à-vis hiring from the informal market. Further, institutional norms, such as gender norms that
distort labour markets, may appear to create different types of labour pools with different prices, making
them substitutable.
Similarly, firms may alter the quantum of capital as well as the composition of capital if the factor price for
capital changes and the marginal productivity of capital changes with a change in the composition of capital.
Further, firms may alter the demand for capital depending upon the availability and price of other gross
complements. The quantum of capital may change owing to the rental-wage ratio, while the marginal
productivity of capital may change because of technological changes. Technological change may also usher
in capital-skill complementarities.
Apart from firm-specific effects of composition and quantity of labour and capital, the aggregate share of
wages in GVA could be affected due to the changes in firm-specific factors within industries. Profit rate
may vary according to market structure and competition. Firms in an industry with a higher degree of
monopoly may have a large share in profits, in turn reducing the share of other factors including labour
share.
Depending on the differences in factor intensity across industries, the inter-industry variations in growth
could lead to changes in the aggregate wage share in GVA. It is possible that such a decline in wage share
could also be ushered in by sector-biased changes through international trade.
ILO DWT for South Asia and Country Office for India 7
`
The Indian labour market is characterized by its dual nature. There is a relatively small formal sector
consisting of regular employees with permanent job contracts and clearly laid-out conditions of work, while
the informal sector consists of a large share of workers with contractual or casual wage employment with
ambiguous conditions of work and job security. The formal labour market is protected through a wide range
of labour market regulations, but the informal sector has negligible legal coverage. Also, the labour market
is distorted due to pre-market discrimination, occupational segregation and wage discrimination along caste
and gender lines. These institutional features of the labour market provide different types of labour with
different prices to the typical Indian firm, which exploits these divisions within the labour market towards
profit maximizing.
Liberalization has also led to privatization of the economy, while the rhetoric of competitiveness in
international markets has raised the demand for flexibility in the labour markets. Labour market regulations
have become a weak instrument owing to poor implementation and loopholes in the regulations themselves.
The bargaining power of workers has also been waning, as indicated in trade union statistics.
Since the liberalization of the economy, the cost of capital has been declining due to two important changes.
First, liberalization of capital imports through tariff reductions and dismantling of quotas has substantially
increased the supply of capital and reduced the price of capital. Second, liberalization of foreign investment
norms has augmented investment in India. Both these factors have been instrumental in changing the
technology content of capital as well.
We analyse the decline in labour share in the organized manufacturing sector in India in light of the above
detailed analytical context.
2. Trends and patterns of factor shares in GVA
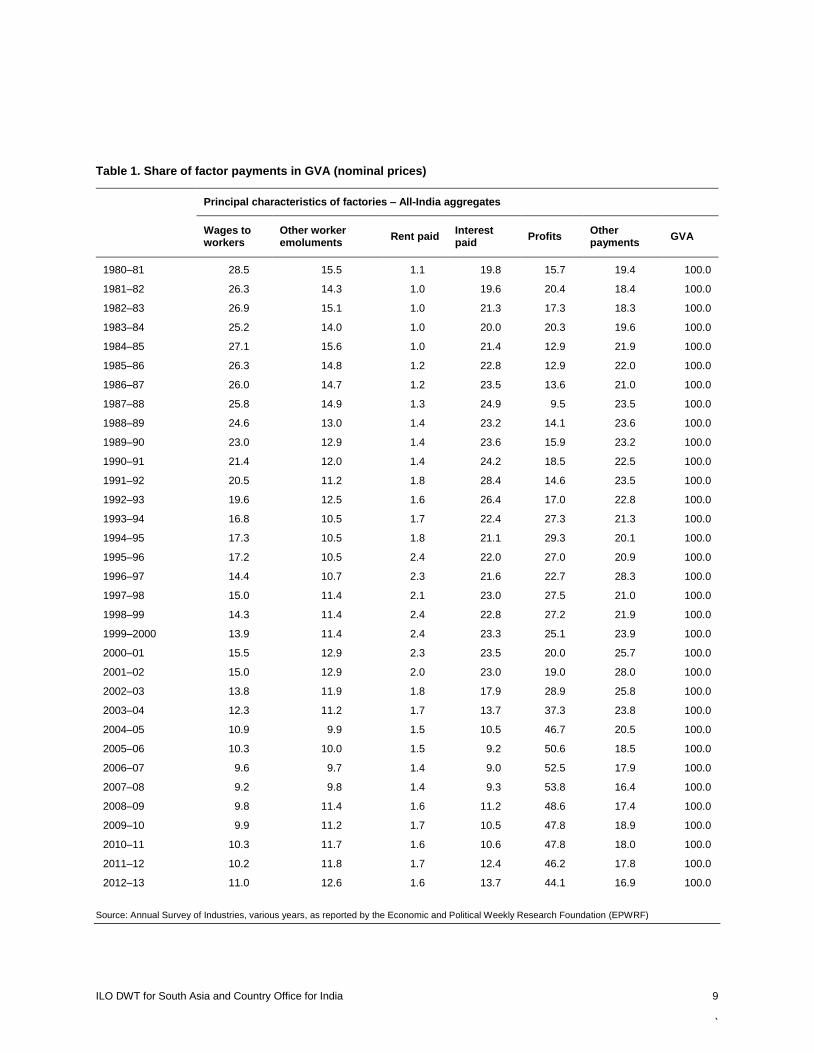
2.1 Share of factor payments in GVA The share of factor payments in GVA for the organized manufacturing sector is given in table 1. As can be
seen from the table, the share of factor payments has undergone vast changes from 1980–81 to 2012–13.
The share of wages in GVA declined from 28.5 per cent in 1980–81 to 11 per cent in 2012–13. The share
of all emoluments other than wages also declined from 15.5 per cent to 12.6 per cent during the same period.
Total emoluments11 to workers declined from 44 per cent to 23.6 per cent in the same period. The share of
other factor payments including rent and interest declined as well, while the share of profits in GVA jumped
from 15.7 per cent to 44.1 per cent during the period of the study.
It is obvious from figure 1 that the composition of factor payments started changing from the late 1980s.
Wage share was stable at about 25 to 28 per cent from 1980–81 to 1987–88; thereafter it started declining
11 Total emoluments – wages = all other payments (provident fund, gratuity, bonus, other material and monetary costs borne by
the firm as labour cost).

8 ILO DWT for South Asia and Country Office for India
steadily. During the same period, profit share shrank from about 15.7 per cent to a mere 9.5 per cent, while
interest payments rose from 19.8 per cent to 25 per cent. In fact, the share of interest payments increased to
28.4 per cent by 1990–91, declining thereafter. The graph shows that the wage share declined continuously
from 1980–81 to 2012–13. While during the 1980s the decline in wage share led to the rise in other factor
shares, in the 1990s, with a rise in profit share, both wage share and interest payments declined. In the
2000s, though the wage share continued to fall, the high rise in profit share largely corresponded to the
decline in interest payment shares from 23.5 per cent to 13.5 per cent.
ILO DWT for South Asia and Country Office for India 9
`
Table 1. Share of factor payments in GVA (nominal prices)
Principal characteristics of factories – All-India aggregates
Wages to workers
Other worker emoluments
Rent paid Interest paid
Profits Other payments
GVA
1980–81 28.5 15.5 1.1 19.8 15.7 19.4 100.0
1981–82 26.3 14.3 1.0 19.6 20.4 18.4 100.0
1982–83 26.9 15.1 1.0 21.3 17.3 18.3 100.0
1983–84 25.2 14.0 1.0 20.0 20.3 19.6 100.0
1984–85 27.1 15.6 1.0 21.4 12.9 21.9 100.0
1985–86 26.3 14.8 1.2 22.8 12.9 22.0 100.0
1986–87 26.0 14.7 1.2 23.5 13.6 21.0 100.0
1987–88 25.8 14.9 1.3 24.9 9.5 23.5 100.0
1988–89 24.6 13.0 1.4 23.2 14.1 23.6 100.0
1989–90 23.0 12.9 1.4 23.6 15.9 23.2 100.0
1990–91 21.4 12.0 1.4 24.2 18.5 22.5 100.0
1991–92 20.5 11.2 1.8 28.4 14.6 23.5 100.0
1992–93 19.6 12.5 1.6 26.4 17.0 22.8 100.0
1993–94 16.8 10.5 1.7 22.4 27.3 21.3 100.0
1994–95 17.3 10.5 1.8 21.1 29.3 20.1 100.0
1995–96 17.2 10.5 2.4 22.0 27.0 20.9 100.0
1996–97 14.4 10.7 2.3 21.6 22.7 28.3 100.0
1997–98 15.0 11.4 2.1 23.0 27.5 21.0 100.0
1998–99 14.3 11.4 2.4 22.8 27.2 21.9 100.0
1999–2000 13.9 11.4 2.4 23.3 25.1 23.9 100.0
2000–01 15.5 12.9 2.3 23.5 20.0 25.7 100.0
2001–02 15.0 12.9 2.0 23.0 19.0 28.0 100.0
2002–03 13.8 11.9 1.8 17.9 28.9 25.8 100.0
2003–04 12.3 11.2 1.7 13.7 37.3 23.8 100.0
2004–05 10.9 9.9 1.5 10.5 46.7 20.5 100.0
2005–06 10.3 10.0 1.5 9.2 50.6 18.5 100.0
2006–07 9.6 9.7 1.4 9.0 52.5 17.9 100.0
2007–08 9.2 9.8 1.4 9.3 53.8 16.4 100.0
2008–09 9.8 11.4 1.6 11.2 48.6 17.4 100.0
2009–10 9.9 11.2 1.7 10.5 47.8 18.9 100.0
2010–11 10.3 11.7 1.6 10.6 47.8 18.0 100.0
2011–12 10.2 11.8 1.7 12.4 46.2 17.8 100.0
2012–13 11.0 12.6 1.6 13.7 44.1 16.9 100.0
Source: Annual Survey of Industries, various years, as reported by the Economic and Political Weekly Research Foundation (EPWRF)

10 ILO DWT for South Asia and Country Office for India
Figure 1. Share of factor payments in GVA (nominal prices)
Source: Annual Survey of Industries, various years, as reported by the Economic and Political Weekly Research Foundation
(EPWRF)
It is also to be noted that though the emoluments share dropped during the entire period from 1980 to 2011–
12, the decline was concentrated in the first decade of analysis. The decline from 1980 to 1990 accounted
for more than 50 per cent of the total drop in emoluments share, while the decades of the 1990s and 2000s
accounted for only about 25 and 24 per cent, respectively, of the total decline. Also, the reduction in the
share of total emoluments was largely due to the decline in the share of wages in the emoluments, while the
share of other benefits (such as provident fund, bonus, etc.) remained more or less the same, at around 12
to 15 per cent throughout the period.
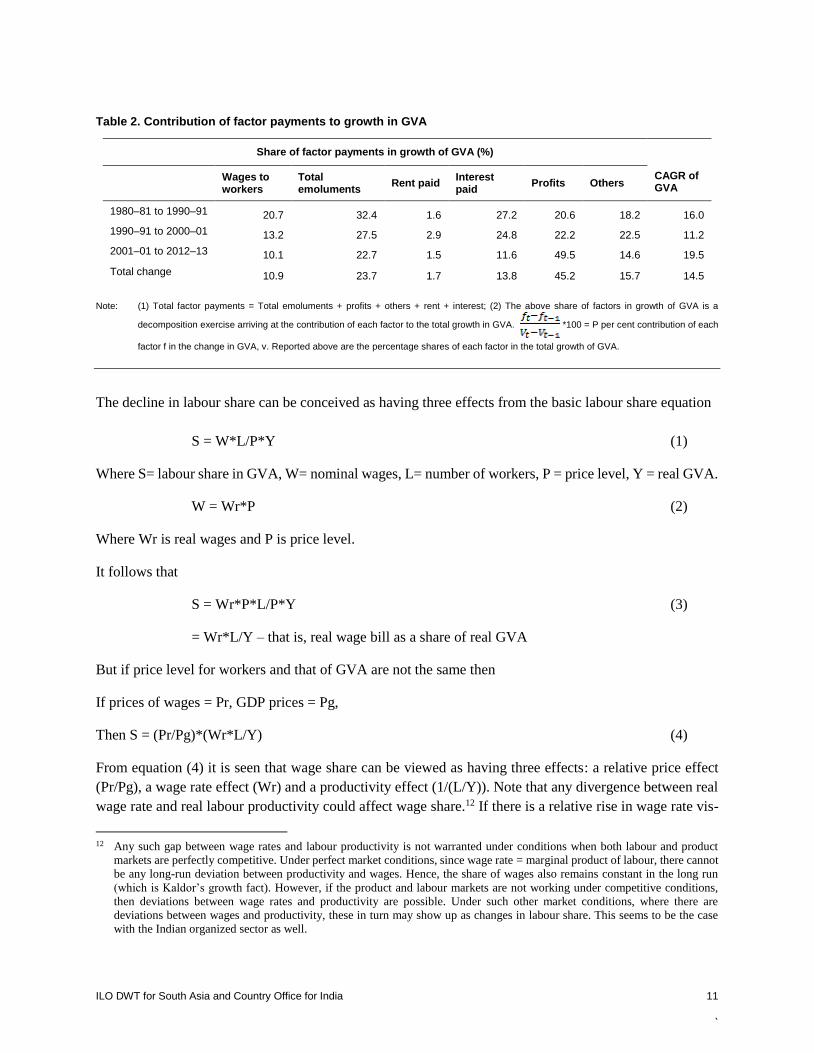
Table 2 shows the relative contribution of each factor in the growth of nominal GVA. It can be seen that
the largest contribution to the change in GVA was from profits. When GVA grew at 14.5 per cent per
annum from 1980–81 to 2012–13, nearly 45.2 per cent of the addition in GVA was appropriated as profits,
while total emoluments accounted for only 23.7 per cent of the total rise in GVA. It is noteworthy that
during every consecutive decade, the wage contribution to GVA had been declining, from 20.7 per cent
(1980–81 to 1990–91) to 13.2 per cent (1990–91 to 2000–01) to 10.1 per cent (2000–01 to 2012–13). On
the other hand, the share of profits in the change in GVA increased from 20.6 per cent to 22.2 per cent to a
whopping 49.5 per cent from 2000–01 to 2012–13. However, it is also to be noted that the spike in the
contribution of profit share to GVA growth during the 2000s was mainly due to a decline in the contribution
of interest payments, which declined from 24.8 per cent to 11.6 per cent between the 1990s and the 2000s.
In short, profit share rose throughout the 1990s and 2000s, and the wage shares declined. However, the
sudden spurt in profit share in the 2000s was largely because of the decline in factor payments other than
labour payments – mainly the drop in interest payments.
0%10%20%30%40%50%60%70%80%90%
100%
198
0 -
198
1
1981
- 1
982
198
2 -
198
3
198
3 -
198
4
198
4 -
198
5
198
5 -
198
6
198
6 -
198
7
198
7 -
198
8
198
8 -
198
9
198
9 -
199
0
199
0 -
199
1
199
1 -
199
2
1992
- 1
993
199
3 -
199
4
199
4 -
199
5
199
5 -
199
6
199
6 -
199
7
199
7 -
199
8
199
8 -
199
9
199
9 -
200
0
200
0 -
200
1
200
1 -
200
2
200
2 -
200
3
2003
- 2
004
200
4 -
200
5
200
5 -
200
6
200
6 -
200
7
200
7 -
200
8
200
8 -
200
9
200
9 -
201
0
201
0 -
201
1
201
1 -
201
2
201
2 -
201
3
Wages to Workers Other Emoluments Rent Paid
Interest Paid Profits Other payments
ILO DWT for South Asia and Country Office for India 11
`
Table 2. Contribution of factor payments to growth in GVA
Share of factor payments in growth of GVA (%) CAGR of GVA
Wages to workers
Total emoluments
Rent paid Interest paid
Profits Others
1980–81 to 1990–91 20.7 32.4 1.6 27.2 20.6 18.2 16.0
1990–91 to 2000–01 13.2 27.5 2.9 24.8 22.2 22.5 11.2
2001–01 to 2012–13 10.1 22.7 1.5 11.6 49.5 14.6 19.5
Total change 10.9 23.7 1.7 13.8 45.2 15.7 14.5
Note: (1) Total factor payments = Total emoluments + profits + others + rent + interest; (2) The above share of factors in growth of GVA is a
decomposition exercise arriving at the contribution of each factor to the total growth in GVA. *100 = P per cent contribution of each
factor f in the change in GVA, v. Reported above are the percentage shares of each factor in the total growth of GVA.
The decline in labour share can be conceived as having three effects from the basic labour share equation
S = W*L/P*Y (1)
Where S= labour share in GVA, W= nominal wages, L= number of workers, P = price level, Y = real GVA.
W = Wr*P (2)
Where Wr is real wages and P is price level.
It follows that
S = Wr*P*L/P*Y (3)
= Wr*L/Y – that is, real wage bill as a share of real GVA
But if price level for workers and that of GVA are not the same then
If prices of wages = Pr, GDP prices = Pg,
Then S = (Pr/Pg)*(Wr*L/Y) (4)
From equation (4) it is seen that wage share can be viewed as having three effects: a relative price effect
(Pr/Pg), a wage rate effect (Wr) and a productivity effect (1/(L/Y)). Note that any divergence between real
wage rate and real labour productivity could affect wage share.12 If there is a relative rise in wage rate vis-
12 Any such gap between wage rates and labour productivity is not warranted under conditions when both labour and product
markets are perfectly competitive. Under perfect market conditions, since wage rate = marginal product of labour, there cannot
be any long-run deviation between productivity and wages. Hence, the share of wages also remains constant in the long run
(which is Kaldor’s growth fact). However, if the product and labour markets are not working under competitive conditions,
then deviations between wage rates and productivity are possible. Under such other market conditions, where there are
deviations between wages and productivity, these in turn may show up as changes in labour share. This seems to be the case
with the Indian organized sector as well.
12 ILO DWT for South Asia and Country Office for India
à-vis productivity, then wage share increases and vice versa. To understand the relation between prices,
wages and productivity in explaining labour share we must examine these three variables.
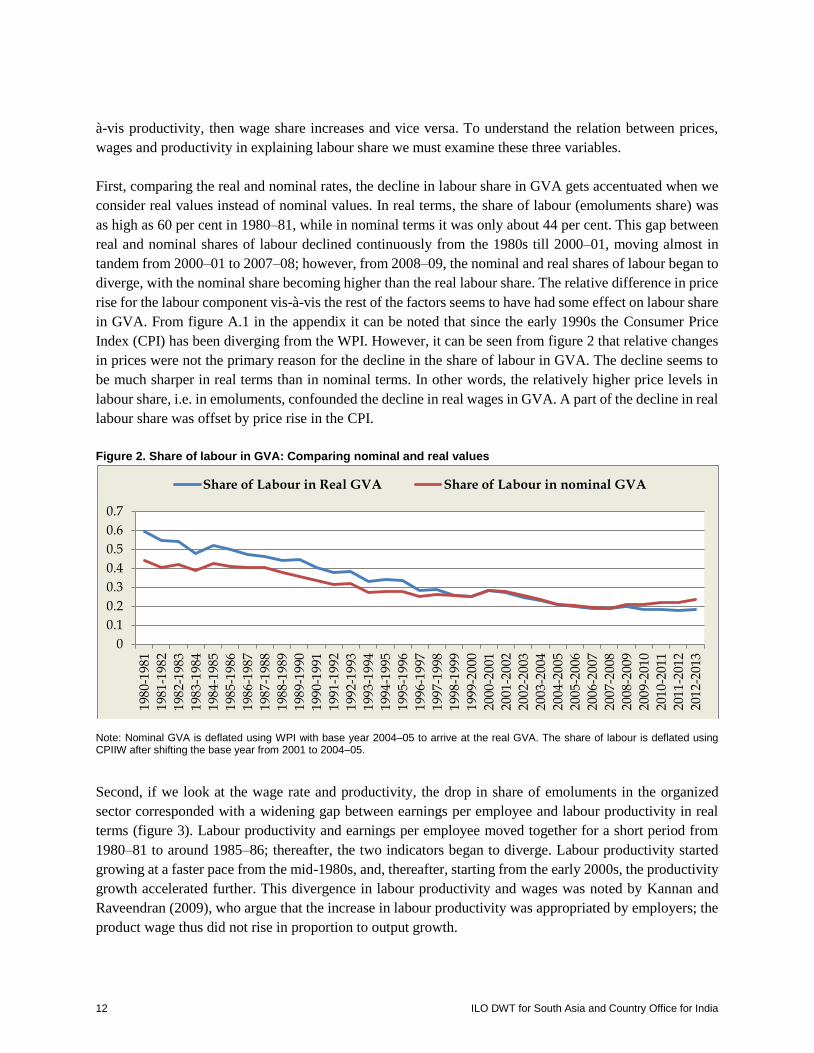
First, comparing the real and nominal rates, the decline in labour share in GVA gets accentuated when we
consider real values instead of nominal values. In real terms, the share of labour (emoluments share) was
as high as 60 per cent in 1980–81, while in nominal terms it was only about 44 per cent. This gap between
real and nominal shares of labour declined continuously from the 1980s till 2000–01, moving almost in
tandem from 2000–01 to 2007–08; however, from 2008–09, the nominal and real shares of labour began to
diverge, with the nominal share becoming higher than the real labour share. The relative difference in price
rise for the labour component vis-à-vis the rest of the factors seems to have had some effect on labour share
in GVA. From figure A.1 in the appendix it can be noted that since the early 1990s the Consumer Price
Index (CPI) has been diverging from the WPI. However, it can be seen from figure 2 that relative changes
in prices were not the primary reason for the decline in the share of labour in GVA. The decline seems to
be much sharper in real terms than in nominal terms. In other words, the relatively higher price levels in
labour share, i.e. in emoluments, confounded the decline in real wages in GVA. A part of the decline in real
labour share was offset by price rise in the CPI.
Figure 2. Share of labour in GVA: Comparing nominal and real values
Note: Nominal GVA is deflated using WPI with base year 2004–05 to arrive at the real GVA. The share of labour is deflated using CPIIW after shifting the base year from 2001 to 2004–05.
Second, if we look at the wage rate and productivity, the drop in share of emoluments in the organized
sector corresponded with a widening gap between earnings per employee and labour productivity in real
terms (figure 3). Labour productivity and earnings per employee moved together for a short period from
1980–81 to around 1985–86; thereafter, the two indicators began to diverge. Labour productivity started
growing at a faster pace from the mid-1980s, and, thereafter, starting from the early 2000s, the productivity
growth accelerated further. This divergence in labour productivity and wages was noted by Kannan and
Raveendran (2009), who argue that the increase in labour productivity was appropriated by employers; the
product wage thus did not rise in proportion to output growth.
0
0.1
0.2
0.3
0.4
0.5
0.6
0.7
198
0-1
981
198
1-1
982
198
2-1
983
198
3-1
984
198
4-1
985
198
5-1
986
198
6-1
987
198
7-1
988
198
8-1
989
198
9-1
990
199
0-1
991
199
1-1
992
199
2-1
993
199
3-1
994
199
4-1
995
199
5-1
996
199
6-1
997
199
7-1
998
199
8-1
999
199
9-2
000
200
0-2
001
2001
-200
2
200
2-2
003
200
3-2
004
200
4-2
005
200
5-2
006
200
6-2
007
200
7-2
008
2008
-200
9
200
9-2
010
201
0-2
011
201
1-2
012
201
2-2
013
Share of Labour in Real GVA Share of Labour in nominal GVA

ILO DWT for South Asia and Country Office for India 13
`
From the above discussion, it can be seen that the wage share decline is due to the widening gap between
labour productivity and wage rates, while the price effect confounds the wage share decline.
Figure 3. Trends in labour productivity and annual earnings per employee (rupees thousand (INR), constant
prices at 2004–05 base year)
Note: Labour productivity is measured as real GVA per employee; earnings per employee are all real earnings including wages and all other emoluments.
Table 3. CAGR in labour productivity and annual earnings per employee (constant prices at 2004–05 base year)
Growth of labour productivity Growth of real average earnings per employee
1980–81 to 1990–91 7.5 3.5
1990–91 to 2000–01 5.1 1.0
2000–01 to 2012–13 5.7 2.4
1980 to 2012–13 6.1 2.3
Table 3 depicts the divergence in the growth rates of labour productivity and earnings per employee.
Throughout the period the Compound Annual Growth Rate (CAGR) of labour productivity was higher by
at least 2.5 percentage points. This divergence in the two indicators implies that while the employee
contribution to GVA was growing substantially, the returns for the employees did not keep pace; the
productivity gains made in the period benefited the non-labour factors, bypassing the employees.
Thus six important trends can be noted from the above. First, the share of emoluments in GVA declined
drastically during the last three decades. Second, about 50 per cent of the decline in share of emoluments
was concentrated in the first decade; the next two decades accounted for almost equal parts of it. Third, the
decline in share of emolument was mostly due to the wage component; other quasi-fixed costs declined
only marginally. Fourth, while GVA grew substantially, the share of returns to labour in the expanded GVA
has been declining progressively decade after decade. Fifth, the decline in labour share was not created by
changes in relative prices; rather, the relative difference in price rise confounded the decline in labour share.
0.0
100.0
200.0
300.0
400.0
500.0
600.0
198
1-1
982
198
2-1
983
198
3-1
984
198
4-1
985
198
5-1
986
198
6-1
987
198
7-1
988
198
8-1
989
198
9-1
990
1990
-199
11
991
-19
921
992
-19
931
993
-19
941
994
-19
951
995
-19
961
996
-19
971
997
-19
981
998
-19
991
999
-20
002
000
-20
0120
01-2
002
200
2-2
003
200
3-2
004
200
4-2
005
200
5-2
006
200
6-2
007
200
7-2
008
200
8-2
009
200
9-2
010
201
0-2
011
201
1-2
012
2012
-201
3
Labour Productivity Earning Per Labour

14 ILO DWT for South Asia and Country Office for India
Sixth, the decline in share of emoluments can be accounted for by the widening gap between labour
productivity and earnings per worker.
Now let us look at the changes in factor shares at the disaggregate levels. We shall look at the trends in
emoluments share at the regional (state), sectoral, employment size, and ownership type levels.
2.2 Share of factor payments: A disaggregated picture Factor shares by states: The decline in share of emoluments in GVA was a pan-India phenomenon, with
almost all states experiencing this decline by some measure. Only in two states – Kerala and Haryana –
among the 16 major states did the share of emoluments in GVA either increase or remain at status quo
(table 4). All other states experienced this drop in share of emoluments. The drop in emoluments share was
the highest in Bihar, followed by Karnataka, West Bengal, Andhra Pradesh, Odisha, and Uttar Pradesh, the
reduction being 25 percentage points or more.
During the 1980s (1980–90), the emoluments share in GVA rose in the north-western states of Punjab,
Haryana and Himachal Pradesh. In the politically left-dominated states of Kerala and West Bengal, there
was only a marginal decline (less than 5 percentage points) during this period. The largest drop in
emoluments share was in the eastern states of Assam, Bihar, Odisha, and Uttar Pradesh, which recorded a
decline of more than 20 percentage points.
In the 1990s (1990–2000), five out of the 16 states witnessed a rise in emoluments share by varying levels
(table 5). Of these five states, three – Assam, Odisha and Andhra Pradesh – had experienced a sharp fall in
share of emoluments in the previous decade. The southern states of Kerala, Karnataka, Tamil Nadu and
Andhra Pradesh, as well as the western state of Maharashtra, saw only a marginal drop in emoluments share
in this period, with Himachal Pradesh, Uttar Pradesh and Rajasthan recording the steepest decline.
In the 2000s (2000–12), only two states – Kerala and Uttar Pradesh – experienced a rise in emoluments
share. A marginal drop of less than 5 percentage point was seen in five other states. In nine of the 16 states
there was a substantially large fall in emoluments share. The decline in emoluments share in these nine
states in the 2000s was responsible for the overall sharp drop in this period.
Table 4. Share of total emoluments to workers in GVA
States 1980–81 1985–86 1990– 91 1995–96 2000–01 2005–06 2010–11 2011–12
Andhra Pradesh 48.4 42.6 31.9 28.8 32.8 25.2 20.5 20.9
Assam 32.4 17.0 13.9 21.3 27.1 14.8 20.2 21.6
Bihar 51.4 40.5 39.6 33.9 35.0 43.7 17.7 13.7
Gujarat 38.7 34.1 28.3 19.5 21.1 13.2 17.8 21.0
Haryana 30.7 37.0 33.1 27.7 30.4 23.0 30.1 30.7
Himachal Pradesh 20.8 23.5 30.4 28.1 14.4 8.3 11.9 13.1
Karnataka 42.0 42.1 34.8 31.6 30.6 23.0 27.1 13.7
Kerala 38.2 36.9 37.7 33.5 35.2 36.6 37.1 38.9
Madhya Pradesh 35.4 30.4 28.1 23.3 23.1 21.0 22.3 22.9

ILO DWT for South Asia and Country Office for India 15
`
Maharashtra 41.6 37.4 32.8 26.6 28.2 18.0 20.9 24.3
Odisha 46.1 53.5 27.0 26.6 31.2 18.1 21.7 20.8
Punjab 32.4 37.4 37.1 34.0 31.7 32.4 25.0 18.3
Rajasthan 37.6 41.7 31.6 26.2 20.9 21.0 25.0 14.4
Tamil Nadu 41.3 39.1 30.9 28.3 28.7 25.8 28.0 29.1
Uttar Pradesh 53.9 49.6 32.5 25.3 25.2 24.5 21.8 28.6
West Bengal 62.4 59.9 55.9 51.0 54.2 35.5 33.7 34.4
Table 5. Change in emoluments share across states
States 1980–90 1990–2000 2000–12 1980–2012
Andhra Pradesh -16.5 0.9 -11.9 -27.5
Assam -18.5 13.2 -5.5 -10.8
Bihar -11.8 -4.6 -21.3 -37.7
Gujarat -10.4 -7.2 -0.1 -17.7
Haryana 2.4 -2.7 0.3 0.0
Himachal Pradesh 9.6 -16.0 -1.3 -7.7
Karnataka -7.2 -4.2 -16.9 -28.3
Kerala -0.5 -2.5 3.7 0.7
Madhya Pradesh -7.3 -5.0 -0.2 -12.5
Maharashtra -8.8 -4.6 -3.9 -17.3
Odisha -19.1 4.2 -10.4 -25.3
Punjab 4.7 -5.4 -13.4 -14.1
Rajasthan -6.0 -10.7 -6.5 -23.2
Tamil Nadu -10.4 -2.2 0.4 -12.2
Uttar Pradesh -21.4 -7.3 3.4 -25.3
West Bengal -6.5 -1.7 -19.8 -28.0
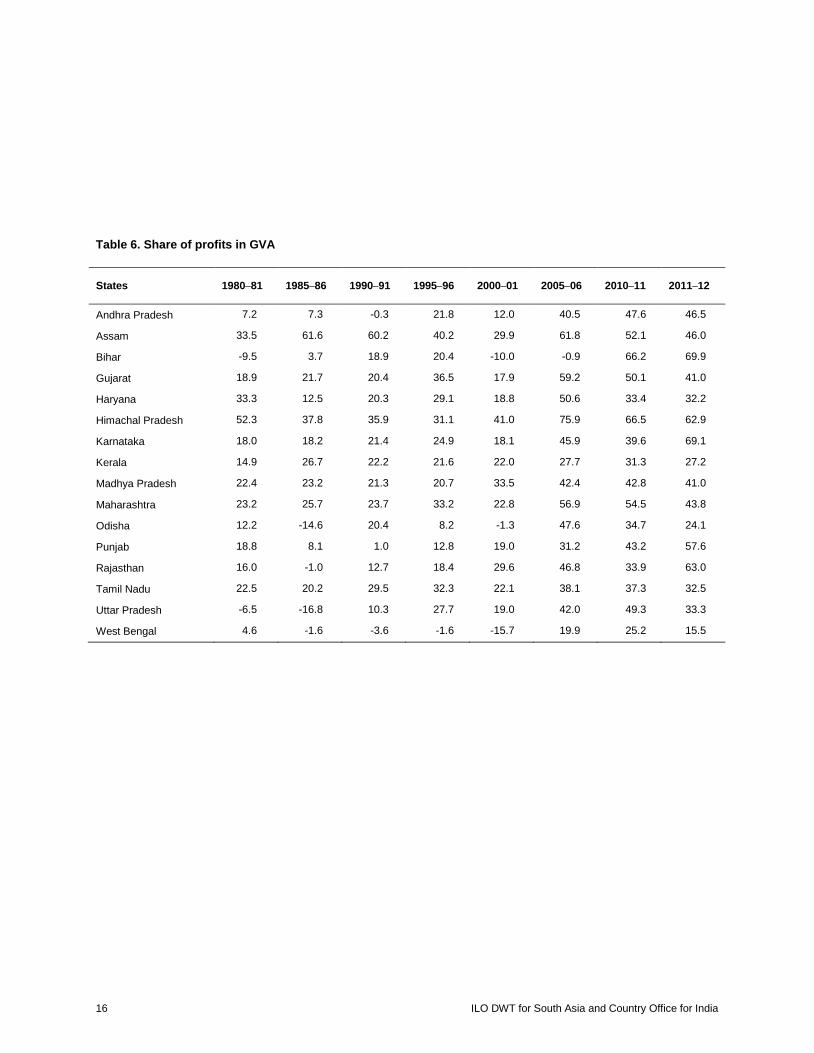
Corresponding to the decline in emoluments share, the profit share in GVA increased substantially in all
the states except Haryana from 1980 to 2011–12. The states which recorded the largest decline in
emoluments share were the same as those that recorded the largest rise in profit share, namely Bihar,
Karnataka, Rajasthan, Uttar Pradesh, and Andhra Pradesh. It is also interesting that the states with a lower
profit share in the 1980s were the ones that recorded the largest increase in profit share from 1980 to 2011–
12 (tables 6 and 7).
16 ILO DWT for South Asia and Country Office for India
Table 6. Share of profits in GVA
States 1980–81 1985–86 1990–91 1995–96 2000–01 2005–06 2010–11 2011–12
Andhra Pradesh 7.2 7.3 -0.3 21.8 12.0 40.5 47.6 46.5
Assam 33.5 61.6 60.2 40.2 29.9 61.8 52.1 46.0
Bihar -9.5 3.7 18.9 20.4 -10.0 -0.9 66.2 69.9
Gujarat 18.9 21.7 20.4 36.5 17.9 59.2 50.1 41.0
Haryana 33.3 12.5 20.3 29.1 18.8 50.6 33.4 32.2
Himachal Pradesh 52.3 37.8 35.9 31.1 41.0 75.9 66.5 62.9
Karnataka 18.0 18.2 21.4 24.9 18.1 45.9 39.6 69.1
Kerala 14.9 26.7 22.2 21.6 22.0 27.7 31.3 27.2
Madhya Pradesh 22.4 23.2 21.3 20.7 33.5 42.4 42.8 41.0
Maharashtra 23.2 25.7 23.7 33.2 22.8 56.9 54.5 43.8
Odisha 12.2 -14.6 20.4 8.2 -1.3 47.6 34.7 24.1
Punjab 18.8 8.1 1.0 12.8 19.0 31.2 43.2 57.6
Rajasthan 16.0 -1.0 12.7 18.4 29.6 46.8 33.9 63.0
Tamil Nadu 22.5 20.2 29.5 32.3 22.1 38.1 37.3 32.5
Uttar Pradesh -6.5 -16.8 10.3 27.7 19.0 42.0 49.3 33.3
West Bengal 4.6 -1.6 -3.6 -1.6 -15.7 19.9 25.2 15.5

ILO DWT for South Asia and Country Office for India 17
`
Table 7. Change in profit share across states
States 1980–90 1990–2000 2000–12 1980–2012
Andhra Pradesh -7.4 12.2 34.5 39.3
Assam 26.7 -30.3 16.0 12.4
Bihar 28.4 -28.9 79.9 79.5
Gujarat 1.5 -2.5 23.1 22.1
Haryana -13.0 -1.5 13.4 -1.0
Himachal Pradesh -16.4 5.1 22.0 10.7
Karnataka 3.4 -3.2 51.0 51.2
Kerala 7.3 -0.2 5.2 12.3
Madhya Pradesh -1.1 12.2 7.5 18.7
Maharashtra 0.5 -0.9 21.0 20.6
Odisha 8.2 -21.7 25.4 11.9
Punjab -17.8 18.0 38.6 38.8
Rajasthan -3.3 16.9 33.4 47.1
Tamil Nadu 6.9 -7.3 10.4 10.0
Uttar Pradesh 16.8 8.7 14.3 39.8
West Bengal -8.2 -12.1 31.2 10.9
During 1980–90, a sharp rise in profit share, of over 20 percentage points, was noted in Bihar and Assam.
Seven states saw a decline in profit share during this period and the rest witnessed a marginal increase in
profit share. During 1990–2000, we find a complete reversal of the trend, with almost all states that saw a
rise in profit share in the previous period experiencing a decline and vice versa. However, from 2000 to
2011–12, all states experienced a rise in profit share by some measure. In effect, the decline in emoluments
share is closely linked to the rise in profit share across all states.
This is visible from table 8, which reports the correlation coefficients between the share of emoluments and
share of profits across states for the entire period. The table shows the correlation between all the factor
shares in GVA for the period across 16 Indian states. As can be seen, the correlation coefficients between
share of emoluments and share of profits across states are as high as -0.87 and never fall below -0.74,
showing the negative relation between the two. It can be interpreted thus: those states that had low
emoluments share in GVA had a high share of profits in GVA and vice versa.
Table 8. Correlation between state-wise share of emoluments, profits, interest, rent and wages in GVA
Correlates 1980–81 1985–86 1990–91 1995–96 2000–01 2004–05 2010–11 2011–12
Emoluments-Wages 0.98 0.90 0.96 0.96 0.98 0.96 0.91 0.93
Emoluments -Profit -0.87 -0.85 -0.74 -0.74 -0.81 -0.77 -0.86 -0.87
Emoluments-Interest 0.26 0.50 0.23 0.11 0.19 0.25 0.39 0.46
Emoluments-Rent 0.32 0.36 0.33 0.10 0.29 0.14 0.53 0.72
Profit-Interest -0.57 -0.73 -0.79 -0.53 -0.69 -0.79 -0.75 -0.83
Profit-Rent -0.16
-0.47 -0.53 -0.17 -0.33 0.07 -0.55 -0.74
18 ILO DWT for South Asia and Country Office for India
It can also be seen that after 2000–01 the correlation coefficient between emoluments share in GVA and
interest payments in GVA becomes much stronger than in the earlier periods. Yet the negative relationship
between profit share in GVA and interest payments has been strong from the early 1980s. Reading together
the decline in emoluments share and the correlation between emoluments share and interest share after the
2000s, it may be inferred that the decline in emoluments share occurred in the states that saw a decline in
interest payments as well. In other words, both emoluments and interest payments declined in nearly the
same set of states that allowed the profit share to rise in the post-2000s period.
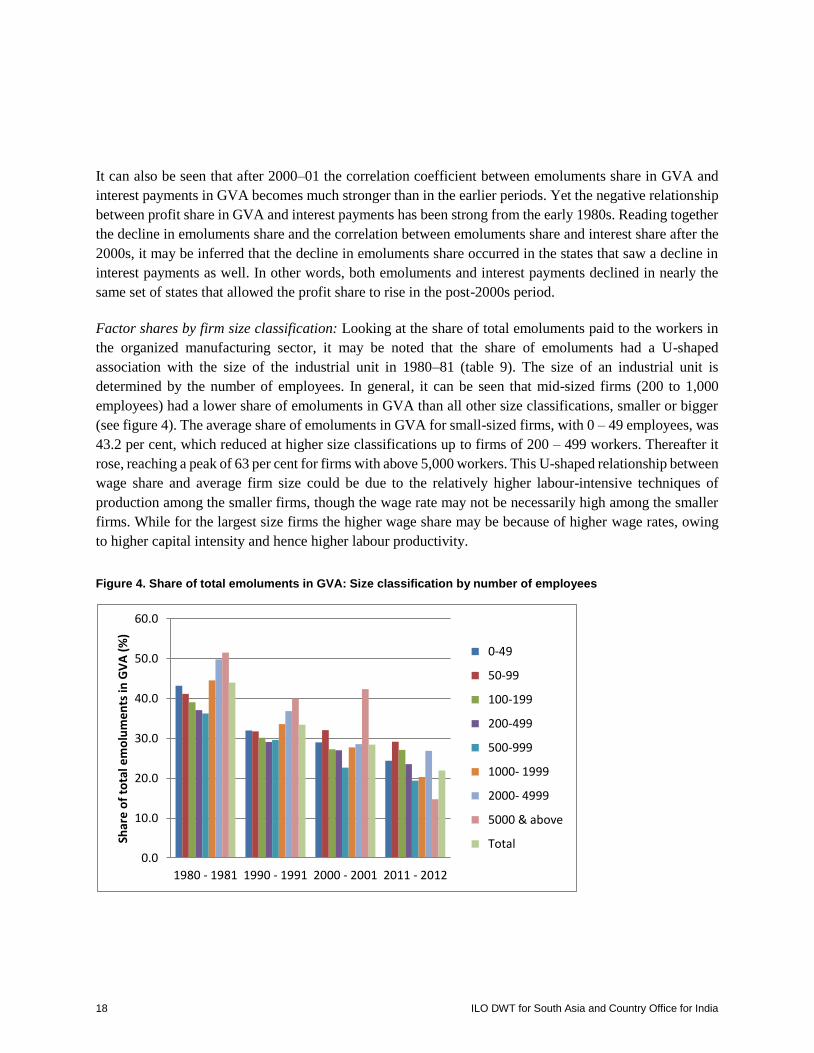
Factor shares by firm size classification: Looking at the share of total emoluments paid to the workers in
the organized manufacturing sector, it may be noted that the share of emoluments had a U-shaped
association with the size of the industrial unit in 1980–81 (table 9). The size of an industrial unit is
determined by the number of employees. In general, it can be seen that mid-sized firms (200 to 1,000
employees) had a lower share of emoluments in GVA than all other size classifications, smaller or bigger
(see figure 4). The average share of emoluments in GVA for small-sized firms, with 0 – 49 employees, was
43.2 per cent, which reduced at higher size classifications up to firms of 200 – 499 workers. Thereafter it
rose, reaching a peak of 63 per cent for firms with above 5,000 workers. This U-shaped relationship between
wage share and average firm size could be due to the relatively higher labour-intensive techniques of
production among the smaller firms, though the wage rate may not be necessarily high among the smaller
firms. While for the largest size firms the higher wage share may be because of higher wage rates, owing
to higher capital intensity and hence higher labour productivity.
Figure 4. Share of total emoluments in GVA: Size classification by number of employees
0.0
10.0
20.0
30.0
40.0
50.0
60.0
1980 - 1981 1990 - 1991 2000 - 2001 2011 - 2012
Shar
e o
f to
tal e
mo
lum
en
ts in
GV
A (
%)
0-49
50-99
100-199
200-499
500-999
1000- 1999
2000- 4999
5000 & above
Total

ILO DWT for South Asia and Country Office for India 19
`
Between 1980–81 and 2011–12, the share of emoluments of all size classes declined by some measure. It
may be noted that decline in the share of emoluments is related to the size of establishments. Though the
share of emoluments did decline across size classes, the relatively larger drop was in the larger-sized
establishments, with above 500 employees; as the size increases, the drop seems to be larger. The drop in
emoluments was relatively larger in the size classes 500 and above, with the largest decline recorded in
firms with above 5,000 employees. For the largest size class firms, the share of emoluments dropped steeply
from 51.5 per cent to a mere 14.8 per cent during this period. However, it may be noted that the drop in
emoluments share in GVA was the highest from 1980–81 to 1990–91 across all size classes except the
largest. Between 1990–91 and 2000–01, though the decline continued across all size classes, in most of
them the fall in this period was much lower compared to the decade before or after. However, one exception
is the case of the largest size class firms, which saw the sharpest drop from 2000–01 to 2011–12, wherein
emoluments share dropped by 27.6 percentage points, the highest decline experienced by any size class in
any period. This is also the period when we saw the largest drop in share of interest payment, as stated
earlier. It appears that the fall in the cost of capital has benefited capital-intensive, large-sized firms the
most. This fall in cost of capital has been entirely appropriated as profits by large-sized firms, leading to
the largest drop in wage share in the largest firms across various size classes.
Table 9. Share and change in share of total emoluments in GVA of firms by employment size
Year
Share of total emoluments in GVA (%)
Total Size classification by number of employees
0–49 50–99 100–199
200–499 500–999 1000– 1999 2000– 4999 5000 & above
1980–81 43.2 41.2 39.1 37.1 36.3 44.6 49.8 51.5 44.0
1990–91 32.0 31.8 30.2 29.1 29.6 33.6 36.9 40.0 33.4
2000–01 29.0 32.1 27.3 27.1 22.7 27.8 28.6 42.4 28.4
2011–12 24.4 29.1 27.1 23.5 19.4 20.3 26.9 14.8 22.0
Change in share of total emoluments by GVA (%)
1980–81 to 1990–91 -11.2 -9.4 -8.9 -8.0 -6.6 -11.0 -13.0 -11.6 -10.6
1990–91 to 2000–01 -3.0 0.3 -2.9 -2.1 -6.9 -5.8 -8.3 2.4 -5.0
2000–01 to 2011–12 -4.6 -2.9 -0.2 -3.5 -3.2 -7.5 -1.7 -27.6 -6.5
1980–81 to 2011–12 -18.8 -12.0 -12.0 -13.5 -16.8 -24.3 -22.9 -36.8 -22.1
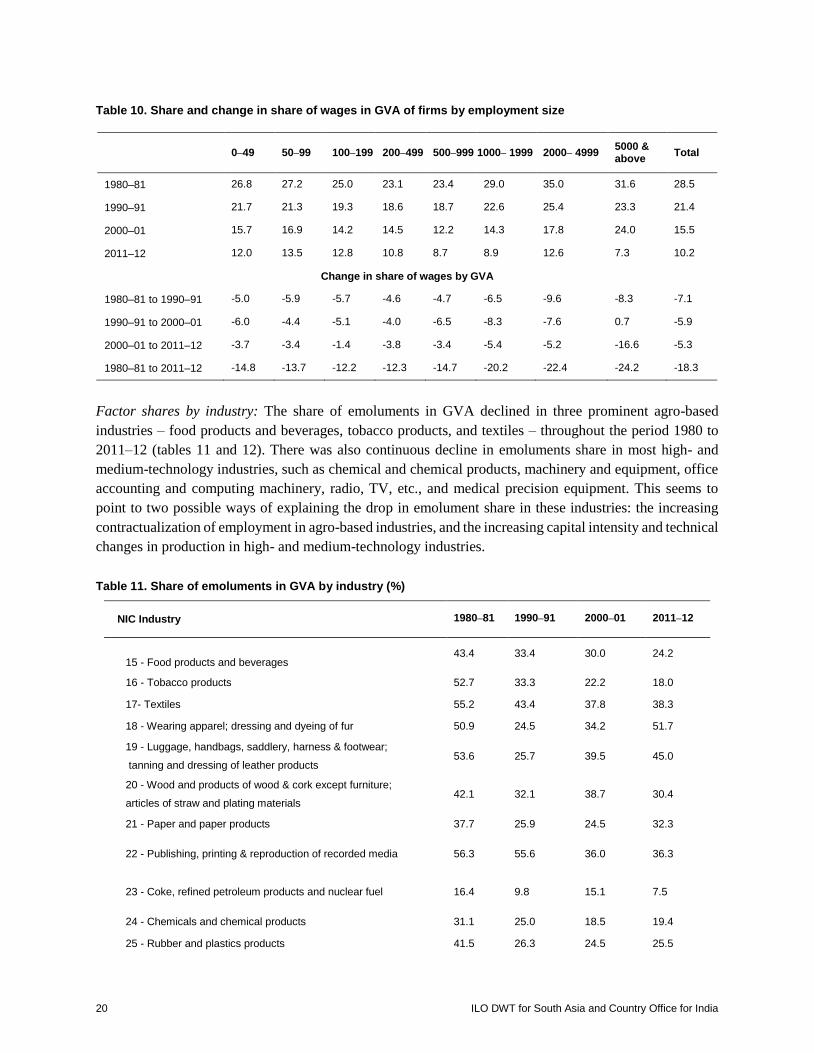
Very similar observations can be made for the share of wages in GVA as well as in terms of temporal
changes. The decline in share of wages is higher amongst the larger-sized establishments compared to
smaller ones (table 10).
20 ILO DWT for South Asia and Country Office for India
Table 10. Share and change in share of wages in GVA of firms by employment size
0–49 50–99 100–199 200–499 500–999 1000– 1999 2000– 4999 5000 & above
Total
1980–81 26.8 27.2 25.0 23.1 23.4 29.0 35.0 31.6 28.5
1990–91 21.7 21.3 19.3 18.6 18.7 22.6 25.4 23.3 21.4
2000–01 15.7 16.9 14.2 14.5 12.2 14.3 17.8 24.0 15.5
2011–12 12.0 13.5 12.8 10.8 8.7 8.9 12.6 7.3 10.2
Change in share of wages by GVA
1980–81 to 1990–91 -5.0 -5.9 -5.7 -4.6 -4.7 -6.5 -9.6 -8.3 -7.1
1990–91 to 2000–01 -6.0 -4.4 -5.1 -4.0 -6.5 -8.3 -7.6 0.7 -5.9
2000–01 to 2011–12 -3.7 -3.4 -1.4 -3.8 -3.4 -5.4 -5.2 -16.6 -5.3
1980–81 to 2011–12 -14.8 -13.7 -12.2 -12.3 -14.7 -20.2 -22.4 -24.2 -18.3
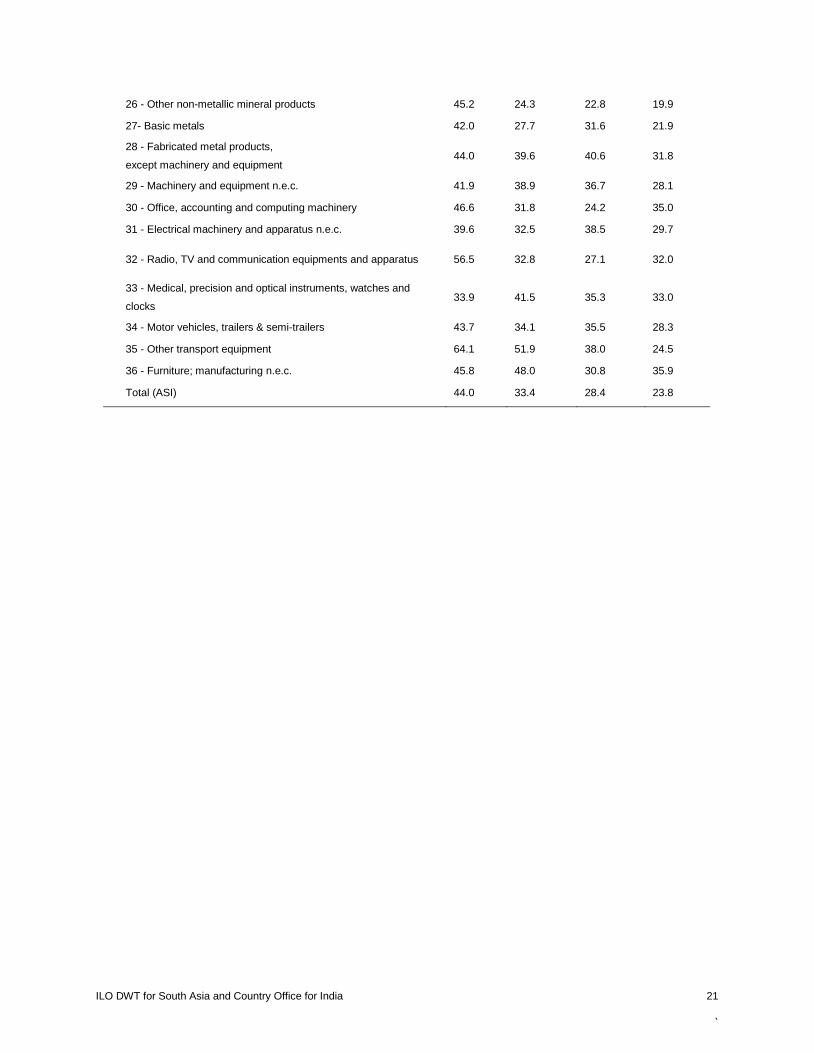
Factor shares by industry: The share of emoluments in GVA declined in three prominent agro-based
industries – food products and beverages, tobacco products, and textiles – throughout the period 1980 to
2011–12 (tables 11 and 12). There was also continuous decline in emoluments share in most high- and
medium-technology industries, such as chemical and chemical products, machinery and equipment, office
accounting and computing machinery, radio, TV, etc., and medical precision equipment. This seems to
point to two possible ways of explaining the drop in emolument share in these industries: the increasing
contractualization of employment in agro-based industries, and the increasing capital intensity and technical
changes in production in high- and medium-technology industries.
Table 11. Share of emoluments in GVA by industry (%)
NIC Industry 1980–81 1990–91 2000–01 2011–12
15 - Food products and beverages 43.4 33.4 30.0 24.2
16 - Tobacco products 52.7 33.3 22.2 18.0
17- Textiles 55.2 43.4 37.8 38.3
18 - Wearing apparel; dressing and dyeing of fur 50.9 24.5 34.2 51.7
19 - Luggage, handbags, saddlery, harness & footwear;
tanning and dressing of leather products 53.6 25.7 39.5 45.0
20 - Wood and products of wood & cork except furniture;
articles of straw and plating materials 42.1 32.1 38.7 30.4
21 - Paper and paper products 37.7 25.9 24.5 32.3
22 - Publishing, printing & reproduction of recorded media 56.3 55.6 36.0 36.3
23 - Coke, refined petroleum products and nuclear fuel 16.4 9.8 15.1 7.5
24 - Chemicals and chemical products 31.1 25.0 18.5 19.4
25 - Rubber and plastics products 41.5 26.3 24.5 25.5
ILO DWT for South Asia and Country Office for India 21
`
26 - Other non-metallic mineral products 45.2 24.3 22.8 19.9
27- Basic metals 42.0 27.7 31.6 21.9
28 - Fabricated metal products,
except machinery and equipment 44.0 39.6 40.6 31.8
29 - Machinery and equipment n.e.c. 41.9 38.9 36.7 28.1
30 - Office, accounting and computing machinery 46.6 31.8 24.2 35.0
31 - Electrical machinery and apparatus n.e.c. 39.6 32.5 38.5 29.7
32 - Radio, TV and communication equipments and apparatus 56.5 32.8 27.1 32.0
33 - Medical, precision and optical instruments, watches and
clocks 33.9 41.5 35.3 33.0
34 - Motor vehicles, trailers & semi-trailers 43.7 34.1 35.5 28.3
35 - Other transport equipment 64.1 51.9 38.0 24.5
36 - Furniture; manufacturing n.e.c. 45.8 48.0 30.8 35.9
Total (ASI) 44.0 33.4 28.4 23.8

22 ILO DWT for South Asia and Country Office for India
Table 12. Change in share of emoluments in GVA by industry
Industry 1980–81 to 1990–91
1990–91 to 2000–01
2000–01 to 2011–12
1980–81 to 2011–12
15 - Food products and beverages -9.9 -3.4 -5.8 -19.1
16 - Tobacco products -19.5 -11.1 -4.2 -34.8
17– Textiles -11.7 -5.6 0.5 -16.9
18 - Wearing apparel; dressing and dyeing of fur -26.4 9.7 17.5 0.8
19 - Luggage, handbags, saddlery, harness & footwear;
tanning and dressing of leather products -27.8 13.8 5.5 -8.6
20 - Wood and products of wood & cork except furniture;
articles of straw and plating materials -10.0 6.6 -8.2 -11.6
21 - Paper and paper products -11.8 -1.3 7.8 -5.4
22 - Publishing, printing & reproduction of recorded media -0.7 -19.6 0.4 -20.0
23 - Coke, refined petroleum products and nuclear fuel -6.6 5.3 -7.5 -8.9
24 - Chemicals and chemical products -6.1 -6.4 0.8 -11.7
25 - Rubber and plastics products -15.2 -1.8 1.0 -16.0
26 - Other non-metallic mineral products -20.9 -1.5 -2.9 -25.3
27-Basic metals -14.3 3.9 -9.7 -20.1
28 - Fabricated metal products,
except machinery and equipment -4.3 0.9 -8.7 -12.1
29 - Machinery and equipment n.e.c. -3.0 -2.3 -8.6 -13.8
30 - Office, accounting and computing machinery -14.8 -7.6 10.8 -11.6
31 - Electrical machinery and apparatus n.e.c. -7.1 5.9 -8.7 -9.9
32 - Radio, TV and communication equipments and
apparatus -23.7 -5.7 4.9 -24.5
33 - Medical, precision and optical instruments,
watches and clocks 7.6 -6.2 -2.3 -0.9
34 - Motor vehicles, trailers & semi-trailers -9.6 1.5 -7.3 -15.4
35 - Other transport equipment -12.2 -13.9 -13.5 -39.6
36 - Furniture; manufacturing n.e.c. 2.2 -17.2 5.2 -9.8
Total (ASI) -10.6 -5.0 -4.7 -20.3
ILO DWT for South Asia and Country Office for India 23
`
3. Wage share: Accounting for the drop
After having analysed the trends and patterns, let us now examine the change in wage shares from 2000–
01 to 2011–12. First, we shall try to estimate the relative contribution of states and regions to the drop in
wage share during this period. Second, we shall do a decomposition of the change in wage share in an
attempt to see the relative contribution of within-industry effects versus between-industry effects in the fall
in wage share.
3.1 Relative contribution of regions and industries To arrive at the relative contribution of regions and industries in the change in wage share from 2000–01
to 2011–12, we work out the following:
∆𝛾𝑖𝑦 = 𝛾𝑖𝑦𝑡 ∗𝑋𝑖𝑦𝑡
∑ 𝑋𝑡− 𝛾𝑖𝑦𝑡−1 ∗
𝑋𝑖𝑦𝑡−1
∑ 𝑋𝑡−1 (1)
𝛾𝑖𝑦 is the share of wages of ‘i’th industry belonging to ‘y’th state in value added of the same industry and
state; is change; t is period; X is employment.
Basically, the right side of the above equation captures the wage share of each industry of each state in
India, weighted by the size (taking employment as a proxy) of the particular industry, in the whole economy.
Further, we take the change of this weighted share between the two periods to arrive at the relative
contribution of industries and states. This contribution to the change in wage share is expressed in
percentages and represented in table A.1 in the appendix. Table A.1 shows the relative contribution of each
industry in each state in the total drop in wage share from 2000–01 to 2011–12. It also captures the
contribution of all industries and all states.
We had noted earlier that the overall decline in wage share in GVA was by 24 percentage points. After
decomposition we find that of the total 24 percentage point decline in wage share in GVA from 2000–01
to 2011–12, about 68 per cent was concentrated in the states of Punjab, Uttar Pradesh, West Bengal, Gujarat,
Maharashtra, Andhra Pradesh, Karnataka, and Tamil Nadu. And in each of these states, the drop in wage
share was concentrated in the following industries: food products and beverages, textiles, chemicals and
chemical products, other non-metallic mineral products, fabricated metal products except machinery and
equipment, and machinery and equipment n.e.c. Tamil Nadu alone accounted for nearly 15 per cent of the
change in wage share from 2000–01 to 2011–12, followed by Maharashtra which accounted for 12.7 per
cent of the drop, Gujarat (8.1 per cent), and West Bengal and Uttar Pradesh (6.2 per cent each). Given that
these are the industrially - developed states in India, the fall in wage share seems to be concentrated in these
states. But this is not to say that other states did not experience a drop: all states have experienced some
decline in wage share. Similarly, the industries that experienced the largest drop in wage share were food
products and beverages (16 per cent) and textiles (14.3 per cent). Thus the decline in wage share was
steepest in the large labour-intensive industries. Yet all industries experienced some decline in wage share
during this period.
24 ILO DWT for South Asia and Country Office for India
3.2 Change in wage share from 2000–01 to 2011–12: A shift share analysis We have established that though the drop in wage share has some regional and industrial specificities, it is
a pan-India phenomenon – cutting across the country and across industries. It may now be appropriate to
look into the factors that explain the drop in wage share in GVA during the last three decades. Since there
are substantial gaps in data, we examine in detail the decline from 2000-01 to 2011-12, a period identified
as one with a sharp drop in wage share in GVA. The first step towards analysing the fall in wage share is
to identify its source. A shift share analysis would be able to answer a major question with regard to the
change in wage share. Inter-industry variations in the growth of the economy may be a prime factor behind
this wage share decline. If growth is concentrated in the sectors that have a higher capital–labour ratio, then
assuming that both factors are paid according to their contribution to the final product, this sectoral shift
can reduce the share of wages in GVA for the economy as a whole. Thus in the above argument it is the
inter-industry variations in growth of GVA that explain the decline in wage share.
It is also possible that it is not inter-industry variations in GVA growth, but intra - industry variations or
within-industry variations that are behind the drop in wage share. This would imply that there are changes
affecting the production process that are not industry-specific; rather, they may be affecting most
industries and it is the changes in the inputs utilized in the production process that are the reason for the
decline in wage share.
A commonly used analytical tool for comparing the within-industry versus between-industry effect is the
shift share analysis. Equation (2) below, which has been adapted from Elsby, Hobijn and Sahin (2013),
provides the decomposition of the change in wage share.
∆𝑦𝜌 = ∑ 𝜔𝑖
𝑖∆𝑦𝑖
𝜌+ ∑ ∆𝜔𝑖
𝑖𝑦𝑖
𝜌 (2)
where 𝑦𝜌 = ∑ 𝑊𝑖
𝜌 𝐿𝑖
𝜌𝑖
𝑃𝑌= ∑ 𝜔𝑖 𝑖 𝑦𝑖
𝜌
and 𝜔𝑖 = 𝑃𝑖 𝑌𝑖
𝑃𝑌
and 𝑦𝑖𝜌
= 𝑊𝑖
𝜌𝐿𝑖
𝜌
𝑃𝑖𝑌𝑖
P = price level, Y = value added, W = wage rate, L = number of workers, “i” is the industry
𝑦𝑖𝜌
is the share of wages of “i"th industry in value added of the same industry
𝜔𝑖 = share of GVA of “i”th industry in the GVA of the economy

ILO DWT for South Asia and Country Office for India 25
`
= share of wages in GVA in the economy
In equation (2), the first part of the right side of the equation represents the “shift” component while the
second part provides the “share” component. The shift component captures the intra-industry variations in
wage share and the share component captures the inter-industry variations.
The results of the decomposition exercise are given in table 13 below. Column (1) provides the share of
wages in GVA for 31 Indian states, union territories, and all-India for the years 2000-01 and 2011-12. The
change in wage share in GVA for each state is given in column (2). The decomposition of this change in
wage share is reported in columns (3) and (4) as shift and share. First, it may be noted that between 2000-
01 and 2011-12 all states experienced a reduction in wage share in GVA by some measure, except for
Tripura. The average drop in wage share during the period for the country as a whole was by 25.6 percentage
points. This drop varied between states, the highest drop being in West Bengal and the Andaman Islands.
Second, it may be noted that the decomposition of the change in wage share shows that much of the change
is explained by the shift component while the share component has only a minor role in explaining it. Of
the total drop in wage share of 25.6 percentage points, 19.3 percentage points (75.6 per cent of the drop) is
explained by the shift component, i.e. an overwhelmingly large component of the drop was due to changes
in intra-industry variations in wage share in GVA. As for the share component, we see that it does not
explain the drop in wage share. In fact, changes in inter-industry variations in wage share in GVA would
actually increase wage share, but the impact is too small to seriously influence the intra-industry effect on
wage share drop.
These results - of a very dominant shift effect and weak share effect - are consistent across most states,
though the strength of these effects varied. However, a major part of the change in wage share of all states
could be explained through the shift effect. In most states, more than 90 per cent of the drop was explained
by the shift component. It is therefore safe to conclude that the intra-industry variations in wage shares in
all states need to be analysed by looking into the explanatory factors. Having established the importance of
intra-industry factors that affect the drop in wage share in GVA, we shall now look into the intra-industry
factors.
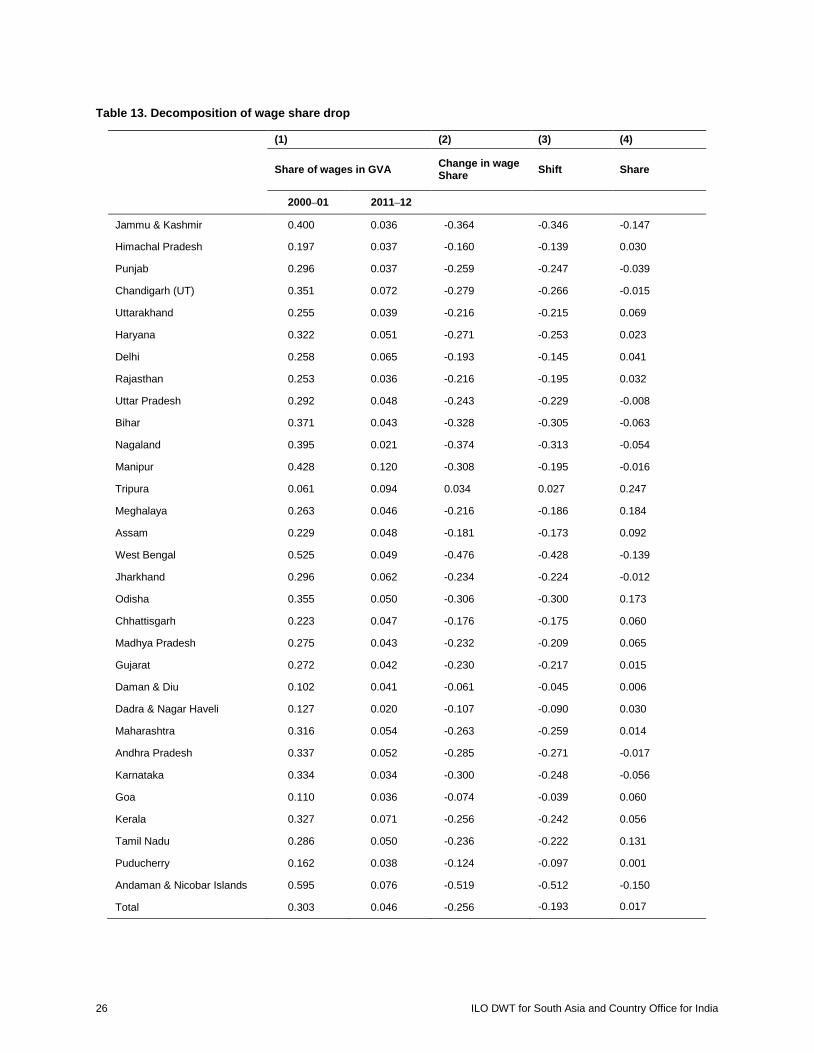
26 ILO DWT for South Asia and Country Office for India
Table 13. Decomposition of wage share drop
(1) (2) (3) (4)
Share of wages in GVA Change in wage Share
Shift Share
2000–01 2011–12
Jammu & Kashmir 0.400 0.036 -0.364 -0.346 -0.147
Himachal Pradesh 0.197 0.037 -0.160 -0.139 0.030
Punjab 0.296 0.037 -0.259 -0.247 -0.039
Chandigarh (UT) 0.351 0.072 -0.279 -0.266 -0.015
Uttarakhand 0.255 0.039 -0.216 -0.215 0.069
Haryana 0.322 0.051 -0.271 -0.253 0.023
Delhi 0.258 0.065 -0.193 -0.145 0.041
Rajasthan 0.253 0.036 -0.216 -0.195 0.032
Uttar Pradesh 0.292 0.048 -0.243 -0.229 -0.008
Bihar 0.371 0.043 -0.328 -0.305 -0.063
Nagaland 0.395 0.021 -0.374 -0.313 -0.054
Manipur 0.428 0.120 -0.308 -0.195 -0.016
Tripura 0.061 0.094 0.034 0.027 0.247
Meghalaya 0.263 0.046 -0.216 -0.186 0.184
Assam 0.229 0.048 -0.181 -0.173 0.092
West Bengal 0.525 0.049 -0.476 -0.428 -0.139
Jharkhand 0.296 0.062 -0.234 -0.224 -0.012
Odisha 0.355 0.050 -0.306 -0.300 0.173
Chhattisgarh 0.223 0.047 -0.176 -0.175 0.060
Madhya Pradesh 0.275 0.043 -0.232 -0.209 0.065
Gujarat 0.272 0.042 -0.230 -0.217 0.015
Daman & Diu 0.102 0.041 -0.061 -0.045 0.006
Dadra & Nagar Haveli 0.127 0.020 -0.107 -0.090 0.030
Maharashtra 0.316 0.054 -0.263 -0.259 0.014
Andhra Pradesh 0.337 0.052 -0.285 -0.271 -0.017
Karnataka 0.334 0.034 -0.300 -0.248 -0.056
Goa 0.110 0.036 -0.074 -0.039 0.060
Kerala 0.327 0.071 -0.256 -0.242 0.056
Tamil Nadu 0.286 0.050 -0.236 -0.222 0.131
Puducherry 0.162 0.038 -0.124 -0.097 0.001
Andaman & Nicobar Islands 0.595 0.076 -0.519 -0.512 -0.150
Total 0.303 0.046 -0.256 -0.193 0.017
ILO DWT for South Asia and Country Office for India 27
`
Towards understanding the intra-industry factors, we start with the basic premise that GVA in each sector
is the sum total of all factor payments. Any change in GVA is caused by a change in the aggregate rate of
returns to factors and/or a change in the aggregate quantity of factors. And any change in the aggregate rate
of returns to factors could be due to either an average change in rate of returns to all factors, or a
compositional change, wherein the aggregate change is caused by a relative change in rate of returns to
factors. Further, this change may be caused by changes in the aggregate quantum of factors or changes in
the composition of factors. We shall now proceed to examine the two aspects – quantum and composition
of labour and capital - in understanding the decline in wage share.
4. Composition of workforce and worker
emoluments
4.1 Composition of employees Workforce in the organized sector can be categorized into various types based on the analytical
classification that we follow. The ASI provides the following category of workers: Male direct, Female
direct, Child direct (not in later years) and employed through contractors. Non-production workers are
accounted for as supervisors and managerial staff. There are also unpaid workers, who are probably
entrepreneurs themselves, and other employees as well. From the unit-level data of ASI we get the average
number of persons who worked per year and also the number of days of work done by each of the above
categories. This rich information can be utilized to analyse the composition of employment in the sector.
For the above categories we also get the wage earned and the payments made as bonus, gratuity and
provident fund. This data thus enables us to also analyse the composition of the wage bill. In this context
we could bring in the argument of flexibility versus rigidity in the sector.
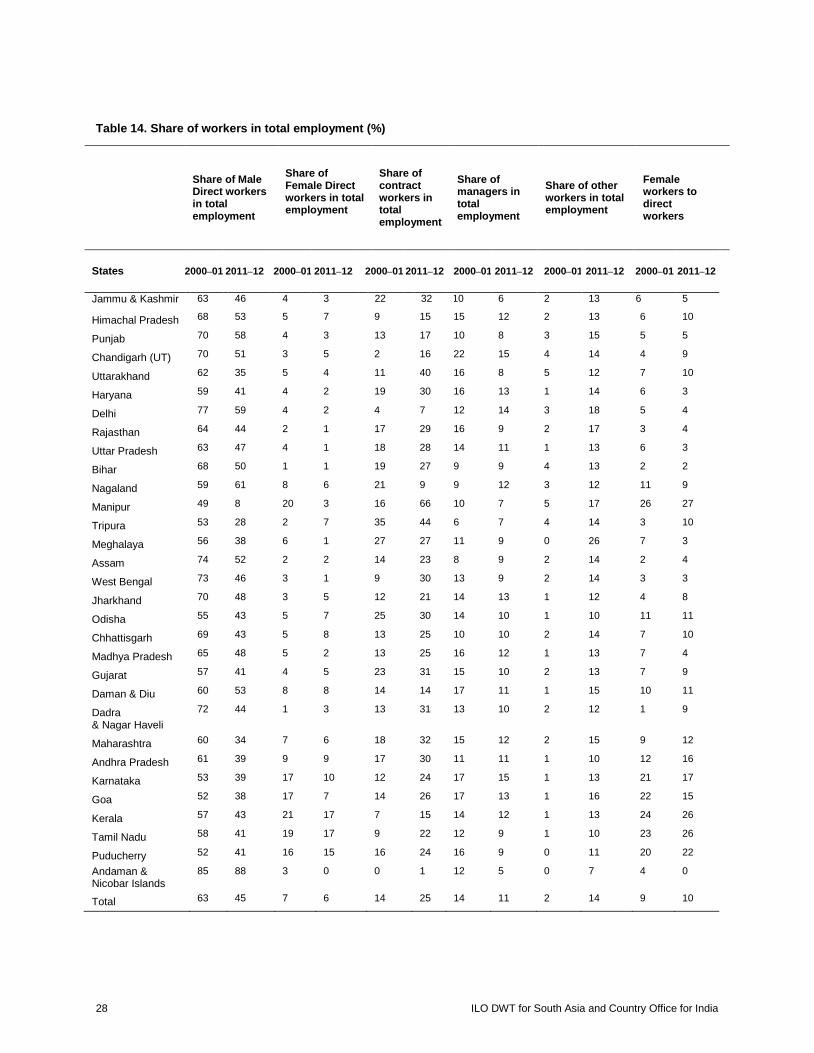
28 ILO DWT for South Asia and Country Office for India
Table 14. Share of workers in total employment (%)
Share of Male Direct workers in total employment
Share of Female Direct workers in total employment
Share of contract workers in total employment
Share of managers in total employment
Share of other workers in total employment
Female workers to direct workers
States 2000–01 2011–12 2000–01 2011–12 2000–01 2011–12 2000–01 2011–12 2000–01 2011–12 2000–01 2011–12
Jammu & Kashmir
63 46 4 3 22 32 10 6 2 13 6 5
Himachal Pradesh 68 53 5 7 9 15 15 12 2 13 6 10
Punjab 70 58 4 3 13 17 10 8 3 15 5 5
Chandigarh (UT) 70 51 3 5 2 16 22 15 4 14 4 9
Uttarakhand 62 35 5 4 11 40 16 8 5 12 7 10
Haryana 59 41 4 2 19 30 16 13 1 14 6 3
Delhi 77 59 4 2 4 7 12 14 3 18 5 4
Rajasthan 64 44 2 1 17 29 16 9 2 17 3 4
Uttar Pradesh 63 47 4 1 18 28 14 11 1 13 6 3
Bihar 68 50 1 1 19 27 9 9 4 13 2 2
Nagaland 59 61 8 6 21 9 9 12 3 12 11 9
Manipur 49 8 20 3 16 66 10 7 5 17 26 27
Tripura 53 28 2 7 35 44 6 7 4 14 3 10
Meghalaya 56 38 6 1 27 27 11 9 0 26 7 3
Assam 74 52 2 2 14 23 8 9 2 14 2 4
West Bengal 73 46 3 1 9 30 13 9 2 14 3 3
Jharkhand 70 48 3 5 12 21 14 13 1 12 4 8
Odisha 55 43 5 7 25 30 14 10 1 10 11 11
Chhattisgarh 69 43 5 8 13 25 10 10 2 14 7 10
Madhya Pradesh 65 48 5 2 13 25 16 12 1 13 7 4
Gujarat 57 41 4 5 23 31 15 10 2 13 7 9
Daman & Diu 60 53 8 8 14 14 17 11 1 15 10 11
Dadra & Nagar Haveli
72 44 1 3 13 31 13 10 2 12 1 9
Maharashtra 60 34 7 6 18 32 15 12 2 15 9 12
Andhra Pradesh 61 39 9 9 17 30 11 11 1 10 12 16
Karnataka 53 39 17 10 12 24 17 15 1 13 21 17
Goa 52 38 17 7 14 26 17 13 1 16 22 15
Kerala 57 43 21 17 7 15 14 12 1 13 24 26
Tamil Nadu 58 41 19 17 9 22 12 9 1 10 23 26
Puducherry 52 41 16 15 16 24 16 9 0 11 20 22
Andaman & Nicobar Islands
85 88 3 0 0 1 12 5 0 7 4 0
Total 63 45 7 6 14 25 14 11 2 14 9 10
ILO DWT for South Asia and Country Office for India 29
`
Table 14 shows the composition of workers in the organized manufacturing sector in India. Of the total
employees, male shop-floor workers who are permanent employees accounted for the largest share – 63 per
cent of all employees – in 2000–01. This share, however, dropped to 45 per cent by 2011–12. The share
of permanent female shop-floor workers among all employees as well as of permanent managers and
supervisors also declined from 7 to 6 per cent and 14 to 10 per cent, respectively, during the same period.
However, during the same period, the share of contract workers increased from 14 per cent to 25 per
cent. This is shown in other studies as well (Kannan and Raveendran, 2009; Kapoor, 2014). In fact, what
we see during this period is a decline in all permanent forms of employment which is compensated by
temporary forms of employment, such as contract employment. The only other component that shows a
substantial rise is the category “Others”, a substantial share of whom are unpaid employees. It is important
to note that this reduction in permanent forms of employment is widespread in India, across states. The
magnitude of decline in the share of permanent workers varied across states, but the direction is clearly that
of decline, except for a few states.
Also, though the share of females in overall employment declined from 7 to 6 per cent, their share in total
permanent shop-floor workers increased from 9 to 10 per cent during the same period. Again, the direction
of these trends is almost the same across the country, with some regional variations in magnitude.
Thus the two notable trends in composition of employees are increasing contractualization of employment
and increasing feminization of permanent employment.
4.2 Employees and person days The next notable feature is the change in the days of work per year for all employees (table 15). The average
employee in 2000–01 worked for 299 days per year, which increased to 307 days per year by 2011–12.13
This addition of work of nearly eight days a year would imply that these extra days of production per
employee could be achieved without any additional labour costs incurred to the employer. Since wage
payment has to be done for the entire year for permanent employees, increasing the days of work would, in
effect, reduce the per unit labour cost. It can be seen that the days of employment per worker have increased
the most for the permanent direct employees, both males and females. For males this increased from 306
days to 310 days, and for females from 299 to 310 days. For contract workers, whose wage payment would
be attached to the days of work, this has risen too but to a much lesser extent compared to the permanent
employees.
13 Bhalotra (1998) shows that the hours of work grew at the rate of 1.64 per cent per annum during 1979–87 in the Indian
manufacturing sector – an equivalent to a shift from a five- to a six-day week. The author also shows that adding more time per
worker is more productive than adding workers, given the Indian working conditions.

30 ILO DWT for South Asia and Country Office for India
Table 15. Number of days of work per worker in a year
Days of work in year per Male Direct worker
Days of work in year per Female Direct worker
Days of work in year per contract worker
Days of work in year per manager
Days of work in year per employee
2000–01 2011–12 2000–01 2011–12 2000–01 2011–12 2000–01 2011–12 2000–01 2011–12
Jammu & Kashmir 299 301 295 303 303 300 298 302 296 298
Himachal Pradesh 306 306 310 313 308 310 305 308 300 306
Punjab 306 311 298 304 311 314 308 311 299 309
Chandigarh (UT) 299 302 350 303 304 330 280 300 272 310
Uttarakhand 304 310 297 307 314 311 298 309 290 310
Haryana 305 309 298 324 303 309 298 304 299 307
Delhi 297 303 296 307 293 309 297 302 288 300
Rajasthan 311 317 305 319 301 306 308 307 302 294
Uttar Pradesh 308 310 305 300 311 304 309 308 306 308
Bihar 290 286 307 236 281 280 283 285 274 275
Nagaland 269 273 297 277 249 288 263 299 261 276
Manipur 247 277 222 287 268 260 230 270 223 242
Tripura 292 292 275 307 263 264 269 271 266 257
Meghalaya 301 302 282 270 297 390 302 300 301 319
Assam 300 308 289 286 275 267 300 276 293 300
West Bengal 303 306 303 299 312 313 305 310 297 308
Jharkhand 310 314 297 310 316 312 310 316 306 311
Odisha 313 329 288 314 312 329 315 324 308 327
Chhattisgarh 307 316 297 310 308 316 308 316 299 311
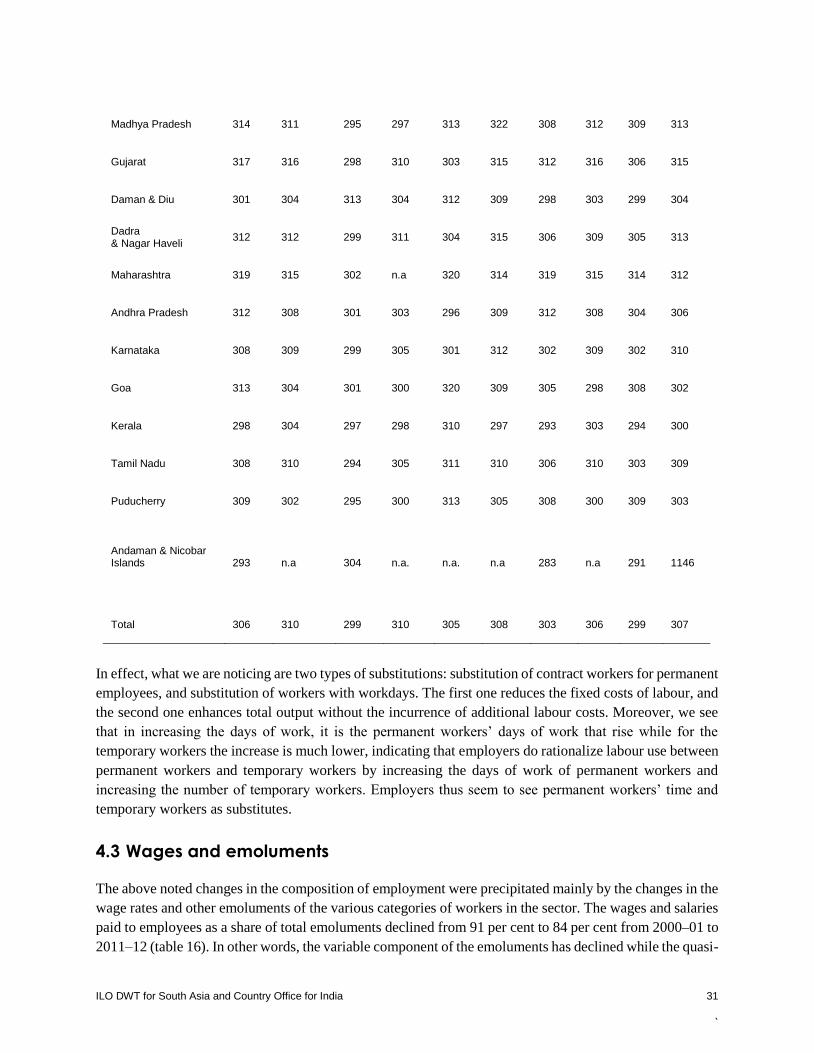
ILO DWT for South Asia and Country Office for India 31
`
Madhya Pradesh 314 311 295 297 313 322 308 312 309 313
Gujarat 317 316 298 310 303 315 312 316 306 315
Daman & Diu 301 304 313 304 312 309 298 303 299 304
Dadra & Nagar Haveli
312 312 299 311 304 315 306 309 305 313
Maharashtra 319 315 302 n.a 320 314 319 315 314 312
Andhra Pradesh 312 308 301 303 296 309 312 308 304 306
Karnataka 308 309 299 305 301 312 302 309 302 310
Goa 313 304 301 300 320 309 305 298 308 302
Kerala 298 304 297 298 310 297 293 303 294 300
Tamil Nadu 308 310 294 305 311 310 306 310 303 309
Puducherry 309 302 295 300 313 305 308 300 309 303
Andaman & Nicobar Islands
293 n.a 304 n.a. n.a. n.a 283 n.a 291 1146
Total 306 310 299 310 305 308 303 306 299 307
In effect, what we are noticing are two types of substitutions: substitution of contract workers for permanent
employees, and substitution of workers with workdays. The first one reduces the fixed costs of labour, and
the second one enhances total output without the incurrence of additional labour costs. Moreover, we see
that in increasing the days of work, it is the permanent workers’ days of work that rise while for the
temporary workers the increase is much lower, indicating that employers do rationalize labour use between
permanent workers and temporary workers by increasing the days of work of permanent workers and
increasing the number of temporary workers. Employers thus seem to see permanent workers’ time and
temporary workers as substitutes.
4.3 Wages and emoluments The above noted changes in the composition of employment were precipitated mainly by the changes in the
wage rates and other emoluments of the various categories of workers in the sector. The wages and salaries
paid to employees as a share of total emoluments declined from 91 per cent to 84 per cent from 2000–01 to
2011–12 (table 16). In other words, the variable component of the emoluments has declined while the quasi-

32 ILO DWT for South Asia and Country Office for India
fixed component has increased. This seems surprising in the wake of the fact that there has been a rise in
the share of contractual employment and total employment has been declining. But the contractualization
of employment occurs mostly among the floor workers while the supervisory and managerial staff continues
to be permanent employees, whose quasi-fixed component of emoluments is substantially larger than
that of the workers. Thus it is possible that the shift in the composition of employees towards a greater share
of supervisory and managerial staff (who are permanent employees) may be a key reason for this increase
in the share of quasi-fixed cost in total emoluments. Further, it can be noted that the wages of workers as a
ratio to that of the supervisory and managerial staff declined from 45 per cent in 2000–01 to 21 per cent in
2011–12. This increasing wage disparity between floor workers and managerial staff signals a rising
demand for skilled workers.
The rise in contractual employment is visible in terms of wages as well. Of all wage payments made to
floor workers, only 36 per cent belonged to contract workers in 2000–01, which rose to 60 per cent by the
year 2011–12.
Table 16. Relative wages and emoluments
Male–female ratio in wages
Contract wage ratio to wages of all workers
Ratio of wages of workers to salaries of managers
All wages and salaries as a share of total emoluments
2000 2012 2000 2012 2000 2012 2000 2012
Jammu & Kashmir 0.31 0.33 0.46 0.69 0.55 0.26 0.99 0.88
Himachal Pradesh 0.60 0.63 0.37 0.87 0.40 0.15 0.94 0.85
Punjab 0.44 0.55 0.50 0.61 0.41 0.18 0.93 0.85
Chandigarh (UT) 0.34 0.35 0.03 0.30 0.54 0.14 0.93 0.89
Uttarakhand 0.33 0.55 0.30 0.63 0.55 0.22 0.95 0.86
Haryana 0.57 0.75 0.43 0.60 0.35 0.17 0.94 0.84
Delhi 0.64 0.45 0.25 0.42 0.48 0.23 0.88 0.85
Rajasthan 0.41 1.17 0.48 0.62 0.38 0.20 0.89 0.86
Uttar Pradesh 0.57 0.69 0.44 0.60 0.39 0.17 0.90 0.85
Bihar 0.23 0.15 0.41 0.63 0.40 0.28 0.93 0.88
Nagaland 0.68 0.52 0.55 3.21 0.49 0.51 0.96 0.92
Manipur 0.40 0.48 0.58 1.04 1.05 0.70 0.95 0.96
Tripura 0.16 0.11 0.57 1.70 0.49 0.27 0.92 0.86
Meghalaya 0.40 0.24 0.49 0.56 0.52 0.25 0.98 0.86
Assam 0.21 0.38 0.25 0.54 0.49 0.14 0.88 0.86
West Bengal 0.64 0.65 0.31 0.58 0.52 0.22 0.87 0.81
Jharkhand 0.50 0.65 0.14 0.44 0.46 0.37 0.87 0.84
Odisha 0.42 0.63 0.46 0.48 0.40 0.32 0.93 0.85
Chhattisgarh 0.38 0.59 0.38 0.49 0.43 0.24 0.92 0.86

ILO DWT for South Asia and Country Office for India 33
`
Madhya Pradesh 0.51 0.56 0.42 0.59 0.46 0.26 0.88 0.84
Gujarat 0.50 0.68 0.37 0.62 0.50 0.18 0.92 0.85
Daman & Diu 0.30 0.80 0.31 0.59 0.45 0.15 0.92 0.85
Dadra
&NagarHaveli
0.16 0.63 0.39 0.98 0.40 0.21 0.92 0.86 Maharashtra
0.50 1.78 0.36 0.66 0.48 0.23 0.90 0.83 Andhra Pradesh
0.56 0.71 0.40 0.63 0.42 0.27 0.93 0.85 Karnataka
0.54 0.74 0.31 0.61 0.46 0.24 0.91 0.82 Goa
0.61 0.49 0.29 0.43 0.43 0.24 0.92 0.84 Kerala
0.64 0.55 0.38 0.57 0.58 0.35 0.89 0.80 Tamil Nadu
0.52 0.51 0.35 0.62 0.42 0.19 0.89 0.78 Puducherry
0.41 0.79 0.39 0.50 0.39 0.14 0.92 0.78 Andaman & Nicobar Islands
0.42 0.00 0.00 0.15 0.27 3.53 0.89 0.84 Total
0.49 0.71 0.36 0.60 0.45 0.21 0.91 0.84
4.4 Capital intensity and technology On examining the changes in quantum and composition of capital, during the period of analysis, a rise in
the capital–labour ratio in 19 states/UTs of the total 31 regions (table 17) is evident. Other studies also
corroborate the fact there has been rising capital intensity in the organized manufacturing sector (Kapoor,
2014). Though in the aggregate there has been no particular rise in the capital–labour ratio, a large number
of states experienced an increase in this ratio during this period. This rise in the capital–labour ratio is
accompanied by three aspects. One is the fall in the lending interest rates and the other is the decline in
tariff rates. The fall in prime lending rates implies that the cost of acquiring capital was becoming cheaper,
while the declining tariff rates imply that importation of capital was cheaper. A third aspect is the capital
subsidies provided to enhance industrial investment. These three aspects reduced the cost of capital
dramatically in relation to that of labour. This decline in the cost of capital is a key factor that influenced
the shift in production technology from labour-intensive to capital-intensive and also reduced the factor
payment share to labour. The falling lending rates also probably enabled the purchase of capital inputs with
technology content. In our data it can be seen that the spending on capital inputs based on information
technology (IT) rose substantially during this period. It is probable that the rise in capital–labour intensity
was also enabled by a rise in technology-intensive capital as well. Both these measures, capital intensity
and technology intensity, act as substitutes for routinized manual activities; they are essentially labour-
substituting changes.
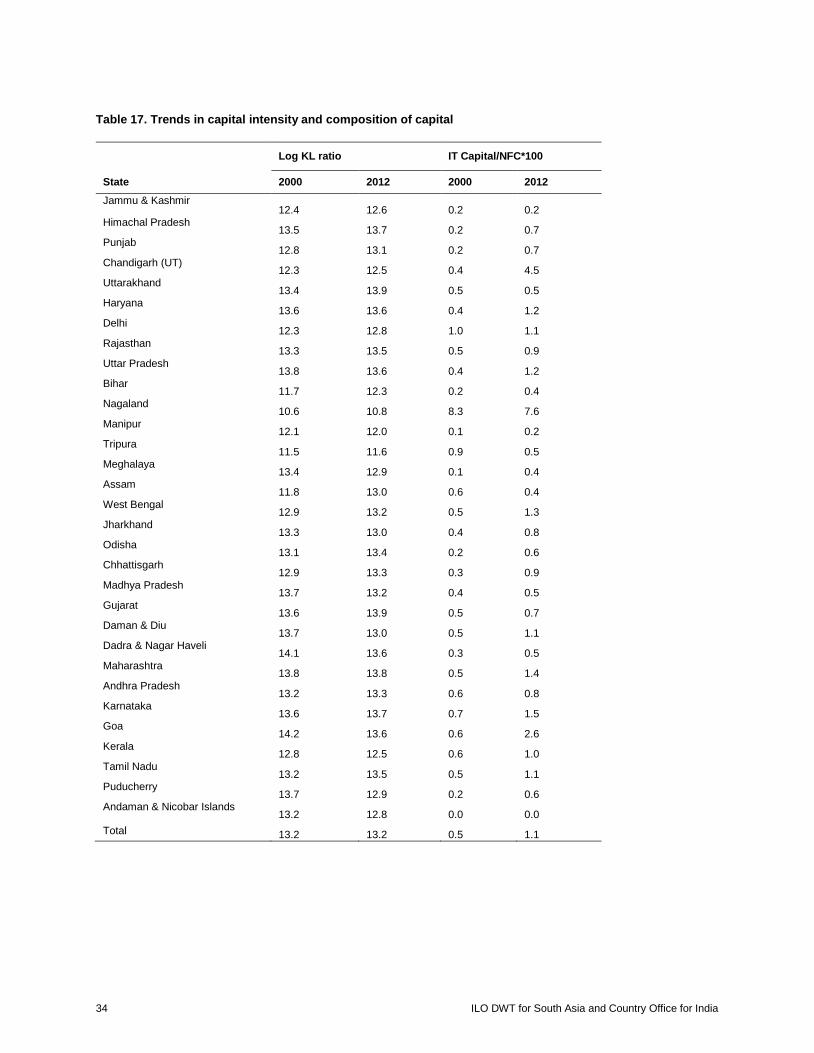
34 ILO DWT for South Asia and Country Office for India
Table 17. Trends in capital intensity and composition of capital
Log KL ratio IT Capital/NFC*100
State 2000 2012 2000 2012
Jammu & Kashmir 12.4 12.6 0.2 0.2
Himachal Pradesh 13.5 13.7 0.2 0.7
Punjab 12.8 13.1 0.2 0.7
Chandigarh (UT) 12.3 12.5 0.4 4.5
Uttarakhand 13.4 13.9 0.5 0.5
Haryana 13.6 13.6 0.4 1.2
Delhi 12.3 12.8 1.0 1.1
Rajasthan 13.3 13.5 0.5 0.9
Uttar Pradesh 13.8 13.6 0.4 1.2
Bihar 11.7 12.3 0.2 0.4
Nagaland 10.6 10.8 8.3 7.6
Manipur 12.1 12.0 0.1 0.2
Tripura 11.5 11.6 0.9 0.5
Meghalaya 13.4 12.9 0.1 0.4
Assam 11.8 13.0 0.6 0.4
West Bengal 12.9 13.2 0.5 1.3
Jharkhand 13.3 13.0 0.4 0.8
Odisha 13.1 13.4 0.2 0.6
Chhattisgarh 12.9 13.3 0.3 0.9
Madhya Pradesh 13.7 13.2 0.4 0.5
Gujarat 13.6 13.9 0.5 0.7
Daman & Diu 13.7 13.0 0.5 1.1
Dadra & Nagar Haveli 14.1 13.6 0.3 0.5
Maharashtra 13.8 13.8 0.5 1.4
Andhra Pradesh 13.2 13.3 0.6 0.8
Karnataka 13.6 13.7 0.7 1.5
Goa 14.2 13.6 0.6 2.6
Kerala 12.8 12.5 0.6 1.0
Tamil Nadu 13.2 13.5 0.5 1.1
Puducherry 13.7 12.9 0.2 0.6
Andaman & Nicobar Islands 13.2 12.8 0.0 0.0
Total 13.2 13.2 0.5 1.1
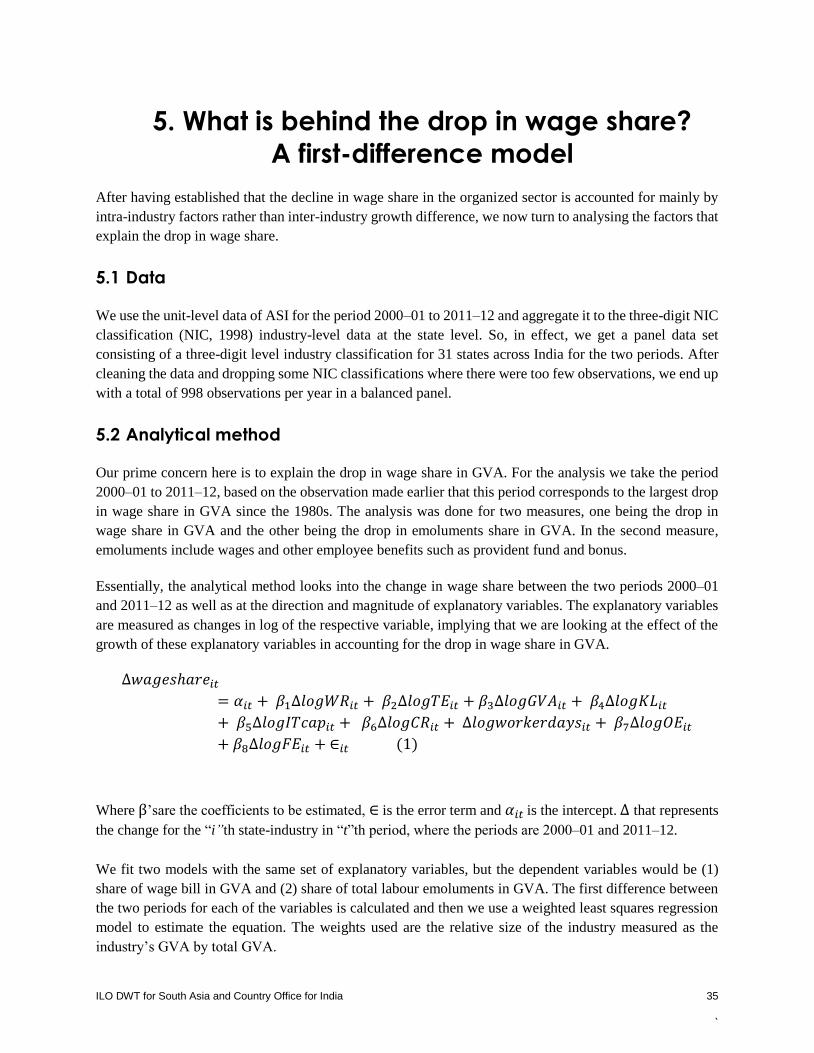
ILO DWT for South Asia and Country Office for India 35
`
5. What is behind the drop in wage share?
A first-difference model After having established that the decline in wage share in the organized sector is accounted for mainly by
intra-industry factors rather than inter-industry growth difference, we now turn to analysing the factors that
explain the drop in wage share.
5.1 Data We use the unit-level data of ASI for the period 2000–01 to 2011–12 and aggregate it to the three-digit NIC
classification (NIC, 1998) industry-level data at the state level. So, in effect, we get a panel data set
consisting of a three-digit level industry classification for 31 states across India for the two periods. After
cleaning the data and dropping some NIC classifications where there were too few observations, we end up
with a total of 998 observations per year in a balanced panel.
5.2 Analytical method Our prime concern here is to explain the drop in wage share in GVA. For the analysis we take the period
2000–01 to 2011–12, based on the observation made earlier that this period corresponds to the largest drop
in wage share in GVA since the 1980s. The analysis was done for two measures, one being the drop in
wage share in GVA and the other being the drop in emoluments share in GVA. In the second measure,
emoluments include wages and other employee benefits such as provident fund and bonus.
Essentially, the analytical method looks into the change in wage share between the two periods 2000–01
and 2011–12 as well as at the direction and magnitude of explanatory variables. The explanatory variables
are measured as changes in log of the respective variable, implying that we are looking at the effect of the
growth of these explanatory variables in accounting for the drop in wage share in GVA.
∆𝑤𝑎𝑔𝑒𝑠ℎ𝑎𝑟𝑒𝑖𝑡
= 𝛼𝑖𝑡 + 𝛽1∆𝑙𝑜𝑔𝑊𝑅𝑖𝑡 + 𝛽2∆𝑙𝑜𝑔𝑇𝐸𝑖𝑡 + 𝛽3∆𝑙𝑜𝑔𝐺𝑉𝐴𝑖𝑡 + 𝛽4∆𝑙𝑜𝑔𝐾𝐿𝑖𝑡
+ 𝛽5∆𝑙𝑜𝑔𝐼𝑇𝑐𝑎𝑝𝑖𝑡 + 𝛽6∆𝑙𝑜𝑔𝐶𝑅𝑖𝑡 + ∆𝑙𝑜𝑔𝑤𝑜𝑟𝑘𝑒𝑟𝑑𝑎𝑦𝑠𝑖𝑡 + 𝛽7∆𝑙𝑜𝑔𝑂𝐸𝑖𝑡
+ 𝛽8∆𝑙𝑜𝑔𝐹𝐸𝑖𝑡 + ∈𝑖𝑡 (1)
Where β’sare the coefficients to be estimated, ∈ is the error term and 𝛼𝑖𝑡 is the intercept. ∆ that represents
the change for the “i”th state-industry in “t”th period, where the periods are 2000–01 and 2011–12.
We fit two models with the same set of explanatory variables, but the dependent variables would be (1)
share of wage bill in GVA and (2) share of total labour emoluments in GVA. The first difference between
the two periods for each of the variables is calculated and then we use a weighted least squares regression
model to estimate the equation. The weights used are the relative size of the industry measured as the
industry’s GVA by total GVA.
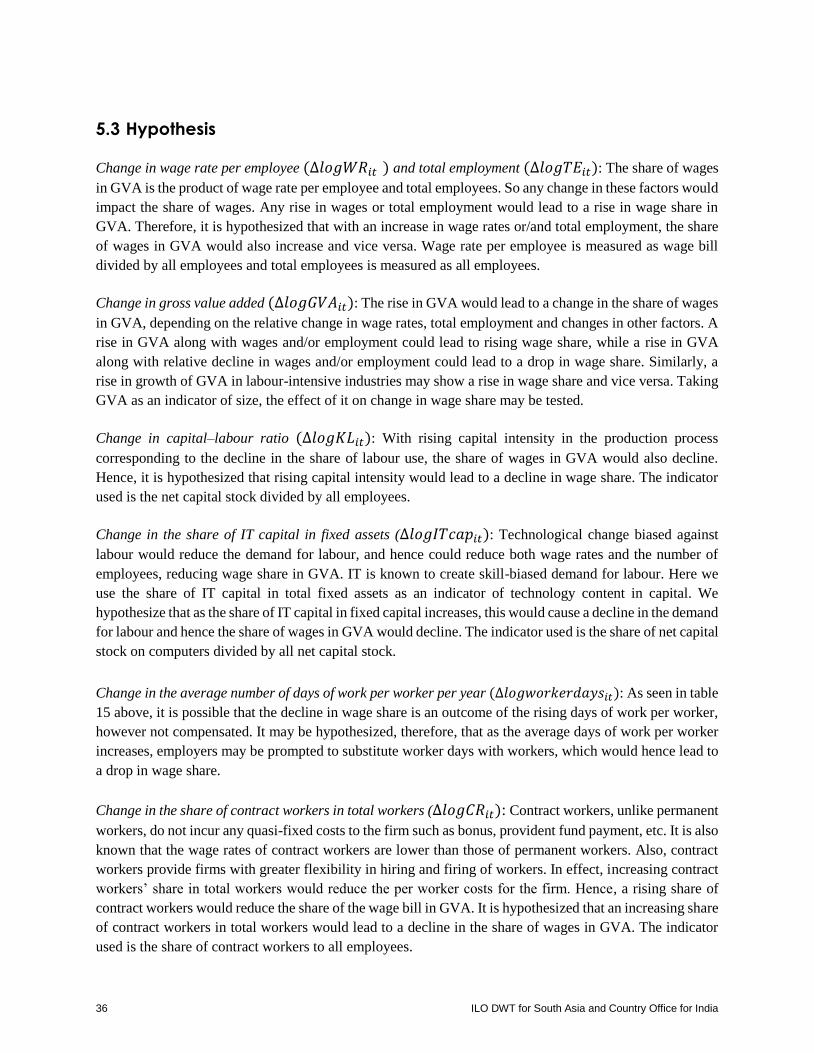
36 ILO DWT for South Asia and Country Office for India
5.3 Hypothesis Change in wage rate per employee (∆𝑙𝑜𝑔𝑊𝑅𝑖𝑡 ) and total employment (∆𝑙𝑜𝑔𝑇𝐸𝑖𝑡): The share of wages
in GVA is the product of wage rate per employee and total employees. So any change in these factors would
impact the share of wages. Any rise in wages or total employment would lead to a rise in wage share in
GVA. Therefore, it is hypothesized that with an increase in wage rates or/and total employment, the share
of wages in GVA would also increase and vice versa. Wage rate per employee is measured as wage bill
divided by all employees and total employees is measured as all employees.
Change in gross value added (∆𝑙𝑜𝑔𝐺𝑉𝐴𝑖𝑡): The rise in GVA would lead to a change in the share of wages
in GVA, depending on the relative change in wage rates, total employment and changes in other factors. A
rise in GVA along with wages and/or employment could lead to rising wage share, while a rise in GVA
along with relative decline in wages and/or employment could lead to a drop in wage share. Similarly, a
rise in growth of GVA in labour-intensive industries may show a rise in wage share and vice versa. Taking
GVA as an indicator of size, the effect of it on change in wage share may be tested.
Change in capital–labour ratio (∆𝑙𝑜𝑔𝐾𝐿𝑖𝑡): With rising capital intensity in the production process
corresponding to the decline in the share of labour use, the share of wages in GVA would also decline.
Hence, it is hypothesized that rising capital intensity would lead to a decline in wage share. The indicator
used is the net capital stock divided by all employees.
Change in the share of IT capital in fixed assets (∆𝑙𝑜𝑔𝐼𝑇𝑐𝑎𝑝𝑖𝑡): Technological change biased against
labour would reduce the demand for labour, and hence could reduce both wage rates and the number of
employees, reducing wage share in GVA. IT is known to create skill-biased demand for labour. Here we
use the share of IT capital in total fixed assets as an indicator of technology content in capital. We
hypothesize that as the share of IT capital in fixed capital increases, this would cause a decline in the demand
for labour and hence the share of wages in GVA would decline. The indicator used is the share of net capital
stock on computers divided by all net capital stock.
Change in the average number of days of work per worker per year (∆𝑙𝑜𝑔𝑤𝑜𝑟𝑘𝑒𝑟𝑑𝑎𝑦𝑠𝑖𝑡): As seen in table
15 above, it is possible that the decline in wage share is an outcome of the rising days of work per worker,
however not compensated. It may be hypothesized, therefore, that as the average days of work per worker
increases, employers may be prompted to substitute worker days with workers, which would hence lead to
a drop in wage share.
Change in the share of contract workers in total workers (∆𝑙𝑜𝑔𝐶𝑅𝑖𝑡): Contract workers, unlike permanent
workers, do not incur any quasi-fixed costs to the firm such as bonus, provident fund payment, etc. It is also
known that the wage rates of contract workers are lower than those of permanent workers. Also, contract
workers provide firms with greater flexibility in hiring and firing of workers. In effect, increasing contract
workers’ share in total workers would reduce the per worker costs for the firm. Hence, a rising share of
contract workers would reduce the share of the wage bill in GVA. It is hypothesized that an increasing share
of contract workers in total workers would lead to a decline in the share of wages in GVA. The indicator
used is the share of contract workers to all employees.

ILO DWT for South Asia and Country Office for India 37
`
Change in other emoluments per worker (∆𝑙𝑜𝑔𝑂𝐸𝑖𝑡): Emoluments other than wages such as provident
fund payments and bonus payments are quasi-fixed costs that the employer incurs. These costs are quasi-
fixed in nature as they are usually in some proportion of wages and also need to be paid to all permanent
workers. So any rise in emoluments per worker would increase the labour cost for the employer. For the
profit-maximizing employer, reducing these fixed costs would allow him to operate at optimal levels of
wage payment. Hence, it may be hypothesized that as the emoluments per worker increase, the employer
would rationalize costs by reducing the number of workers and would encourage the currently employed
workers to work for longer periods. Rise in other emoluments may thus lead to a decline in the share of
wages. The indicator used is the share of emoluments other than wages per employee.
Change in share of female employees in permanent employees (∆𝑙𝑜𝑔𝐹𝐸𝑖𝑡): Given that wages of female
workers are lower than those of male workers, a rising share of female employees in total permanent
employees would reduce the overall wage bill and hence may reduce the wage share in GVA. The study by
Finnoff and Jayadev (2006) shows that with the increasing share of female labour in the workforce in the
OECD countries, the labour share for workers declined. Hence it is hypothesized that as the share of females
in employment increases, the share of wages in GVA declines. The indicator used is the share of females
in direct employment.
Labour regulations: Labour market regulations aim to reduce vulnerabilities of the employees in factories
in terms of jobs, income and conditions of work. Such regulations provide workers their basic social
security. However, these regulations also work as an impediment to industrial growth as institutional
rigidities created in the hiring and firing of workers, social security provisions, etc., add to the indivisibilities
of labour and make labour costs quasi-fixed in nature. Hence industrialists often argue in favour of making
labour market regulations more flexible. Though most labour market regulations are placed by the central
government and there have been no major changes in provisions of labour regulations, the state
governments are empowered to amend these provisions. Additionally, the implementation of these
provisions has been ineffective, such that in many states labour regulations remain in letter and not in spirit.
Based on this understanding, Gupta, Hasan and Kumar (2009, p. 59) calculated a “Labour Market
Regulation (LMR)” by using a simple majority rule across different indicators. Based on this rule they have
coded the states as pro-labour, pro-business or neutral (inflexible, flexible or neutral, respectively) if the
majority of the studies which have calculated these codes do so (table 18). We have utilized this grouping
of states to account for labour market regulations and have introduced a dummy variable (LR) with the
category “inflexible” as the base category.
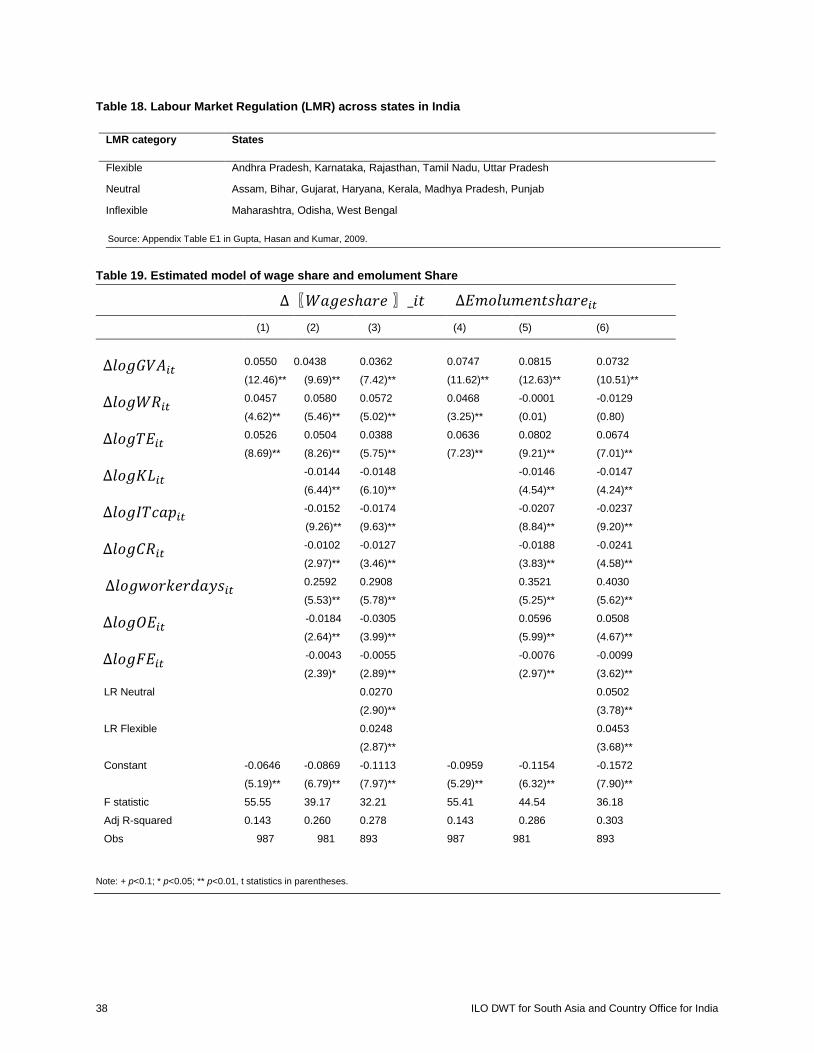
38 ILO DWT for South Asia and Country Office for India
Table 18. Labour Market Regulation (LMR) across states in India
LMR category States
Flexible Andhra Pradesh, Karnataka, Rajasthan, Tamil Nadu, Uttar Pradesh
Neutral Assam, Bihar, Gujarat, Haryana, Kerala, Madhya Pradesh, Punjab
Inflexible Maharashtra, Odisha, West Bengal
Source: Appendix Table E1 in Gupta, Hasan and Kumar, 2009.
Table 19. Estimated model of wage share and emolument Share
∆〖𝑊𝑎𝑔𝑒𝑠ℎ𝑎𝑟𝑒 〗_𝑖𝑡 ∆𝐸𝑚𝑜𝑙𝑢𝑚𝑒𝑛𝑡𝑠ℎ𝑎𝑟𝑒𝑖𝑡
(1) (2) (3) (4) (5) (6)
∆𝑙𝑜𝑔𝐺𝑉𝐴𝑖𝑡 0.0550 0.0438 0.0362 0.0747 0.0815 0.0732
(12.46)** (9.69)** (7.42)** (11.62)** (12.63)** (10.51)**
∆𝑙𝑜𝑔𝑊𝑅𝑖𝑡 0.0457 0.0580 0.0572 0.0468 -0.0001 -0.0129
(4.62)** (5.46)** (5.02)** (3.25)** (0.01) (0.80)
∆𝑙𝑜𝑔𝑇𝐸𝑖𝑡 0.0526 0.0504 0.0388 0.0636 0.0802 0.0674
(8.69)** (8.26)** (5.75)** (7.23)** (9.21)** (7.01)**
∆𝑙𝑜𝑔𝐾𝐿𝑖𝑡 -0.0144 -0.0148 -0.0146 -0.0147
(6.44)** (6.10)** (4.54)** (4.24)**
∆𝑙𝑜𝑔𝐼𝑇𝑐𝑎𝑝𝑖𝑡 -0.0152 -0.0174 -0.0207 -0.0237
(9.26)** (9.63)** (8.84)** (9.20)**
∆𝑙𝑜𝑔𝐶𝑅𝑖𝑡 -0.0102 -0.0127 -0.0188 -0.0241
(2.97)** (3.46)** (3.83)** (4.58)**
∆𝑙𝑜𝑔𝑤𝑜𝑟𝑘𝑒𝑟𝑑𝑎𝑦𝑠𝑖𝑡 0.2592 0.2908 0.3521 0.4030
(5.53)** (5.78)** (5.25)** (5.62)**
∆𝑙𝑜𝑔𝑂𝐸𝑖𝑡 -0.0184 -0.0305 0.0596 0.0508
(2.64)** (3.99)** (5.99)** (4.67)**
∆𝑙𝑜𝑔𝐹𝐸𝑖𝑡 -0.0043 -0.0055 -0.0076 -0.0099
(2.39)* (2.89)** (2.97)** (3.62)**
LR Neutral 0.0270 0.0502
(2.90)** (3.78)**
LR Flexible 0.0248 0.0453
(2.87)** (3.68)**
Constant -0.0646 -0.0869 -0.1113 -0.0959 -0.1154 -0.1572
(5.19)** (6.79)** (7.97)** (5.29)** (6.32)** (7.90)**
F statistic 55.55 39.17 32.21 55.41 44.54 36.18
Adj R-squared 0.143 0.260 0.278 0.143 0.286 0.303
Obs 987 981 893 987 981 893
Note: + p<0.1; * p<0.05; ** p<0.01, t statistics in parentheses.

ILO DWT for South Asia and Country Office for India 39
`
5.4 Estimated results Table 19 provides the estimated regression results of Model (1) in section 5.2 described above. As detailed
earlier, the model is estimated as a first-difference model trying to explain the drop in wage share in GVA
and emoluments share in GVA. Results are reported for the baseline models for wage share and emoluments
share, respectively, in columns (1) and (3). Columns (2) and (4), respectively, report the results, including
all labour and labour-substituting variables; columns (5) and (6) add the labour regulation state dummies to
the model.
All the models are statistically significant as is evident from the F-statistic. The base variables have
expected signs in all the models. Growth of GVA has a positive effect and significant effect (at 1 per cent
level) on the changes in wage share and emoluments share. The variable shows consistency across all
models. As GVA grew, the share of the wages and emoluments in GVA increased, implying that the growth
of GVA was lower than the growth of the wage bill. In other words, part of the drop in wage share is due
to a faster deceleration in growth of GVA compared to wage share. But given that the overall sector did not
face a deceleration in GVA growth, it could also imply that there were industry- and region-specific effects.
The growth of both wage rate and total employment has a positive effect on the share of wages. Positive
growth in wage rate or total employment could lead to a rising share of wages in GVA. These variables
behave as theoretically expected. Both the variables are significant at 1 per cent level across the three
models on wage share (columns 1, 2 and 3). The variable employment has a positive effect on the change
in share of emoluments as well (columns 4, 5 and 6). However, the variable on wage rates, though
significant in the base model for emoluments (column 4), turns out to be insignificant and the sign changes
to negative in other specifications relating to emoluments (columns 5 and 6). This negative and statistically
non-significant coefficient for wage rates occurs when we add the variable “log of change in other
emoluments per worker” to the models in columns 5 and 6. This implies that while wage rate does play a
significant role in wage share determination, its role in total emoluments paid to the worker is not
significant. Rather, the positive and significant sign of the variable “log of change in other emoluments per
worker” on change implies that it changes in quasi-fixed payments that have a say in emoluments share and
not wage rates.
This can be further corroborated with the wage models. In columns (2) and (3), “log of change in other
emoluments per worker” has a negative and significant effect on wage share, but has a positive effect on
emoluments share (columns 5 and 6). This points to the negative effect of quasi-fixed forms of employment
costs on wage share. As such costs associated with permanent forms of employment increase, there is a
tendency towards reducing the share of wages, probably by substituting with other factors of production,
including non-permanent forms of employment and employment that incurs a lower wage cost. Yet it is the
rise in quasi-fixed costs that increases the emoluments share and not wage rates per se. In short, quasi-fixed
payments have a negative effect on wage share while variable payments have a positive effect on wage
share.
Now turning to capital’s relation with labour, as expected, growth of the capital–labour ratio has a negative
effect on the change in wage share. This is found to be negative and significant at 1 per cent level across all
specifications, both in wage share and emoluments share models. Keeping other factors constant, there is
40 ILO DWT for South Asia and Country Office for India
clear evidence for the argument that capital is indeed displacing labour and the rising capital intensity is a
key explanation for the declining share of wages and emoluments in the organized sector.
The changing composition of capital, or, in other words, technological changes in production, measured as
the share of net spending on IT in net capital, again seems to have a negative and significant effect on wage
share. The growth in IT-based capital within total capital reduces the share of wages and emoluments. This
again is consistent with the argument that capital-deepening technological change would lead to a decline
in wage share.
Looking at the composition of employment, the share of contract workers in total employment seems to
have a negative effect on the share of wages in total GVA. The coefficient is negative and statistically
significant at 1 per cent level. This again is true for the emoluments model and across all specifications.
The negative coefficient in the wage model confirms that contractualization reduces wage share, probably
through the payment of lower wages to contractual employees in the organized sector. The negative
coefficient in the emoluments model supports the view that the decline in emoluments share, in addition to
the lower wage rates, is also because the hiring of contractual employees does not incur quasi-fixed
payments for the firm. With the increase in contractual employment the share of both wages and
emoluments decline. Thus it can be seen that contractualization of employment in the Indian manufacturing
sector is an important factor behind the decline in wage share.
Increasing the intensity of work, or increasing the days of work per year for the average worker, has a
positive effect on both wage share and emoluments share. As the number of days of work per year increases,
the share of wages and emoluments increases. The coefficients of both the models have positive signs and
are significant at 1 per cent. Increasing work intensity, apart from wage rates and number of workers, is
thus an important factor that determines the changes in the share of wages and emoluments. In case of
emoluments share, we see that the growth in wage rates did not have any significant effect on it, while
increasing work intensity continues to have a positive effect on it. This implies that increasing work
intensity, and the wage costs incurred in doing so, are used as a means to increase employment. This helps
in restricting the growth of quasi-fixed costs associated with additional employment. Thus increasing work
intensity seems to act as a substitute for permanent forms of employment, just as contractual employment
does.
The increasing presence of women in direct permanent employment also seems to explain the decline in
wage share and emoluments share. In all the models this variable turns out to be negative and significant as
hypothesized. Since, conventionally, the wage rates of women are lower than men, the rising share of
women in the sector would mean a decline in the share of men in permanent employment and hence would
cause a decline in the wage share. This shift in preference towards female workers as permanent workers
may be due to the argument that they remain relatively passive in bargaining and negotiations, thus making
it easier to impose managerial decisions. Another possibility is the rising technology content in capital, thus
reducing manual physical labour requirements of many of the production operations on the shop-floor.
Lastly, we see that labour market regulations do impact wage share. States that were classified as either
neutral or states with flexible regulatory structures had a greater share of wages and emoluments in GVA
compared to states with inflexible regulatory regimes. The dummy variables in both the models are
significant and positive. This indicates that states with rigid labour market regimes had a lower wage share

ILO DWT for South Asia and Country Office for India 41
`
compared to other states. One possible explanation, as argued by Gupta, Hasan and Kumar (2009), is that
such states with inflexible labour regulations had relatively lower labour intensity and, consequently, slower
growth of employment, thus reducing the labour share in the states.
From the above analysis, what emerges is that the composition of labour, composition of capital and the
relative compensation to these factors would determine the share of factor payments in GVA. Given the
conditions in India, it seems that three changes in the composition of labour are important: (i)
contractualization; (ii) increasing female share in permanent workers; and (iii) substitution of workers with
more days of work. All three factors have a substantial effect on the drop in wage share in GVA. Further,
the nature of emoluments, in the form of variable versus quasi-fixed costs on employment, does seem to
make firms view flexible forms of employment and work intensification as substitutes for permanent forms
of employment. Also, the effect of both the quantity and quality of capital on labour and hence on wage
share is very significant. The increasing capital intensity has reduced the demand for labour, and the
changing composition of capital has created biases in the demand for labour; both together reduce the share
of wages in GVA.
6. Conclusion
This study examined the trends, patterns and causes for the declining share of wages in value addition in
the organized manufacturing sector of India. During 1980–2012, the share of total emoluments to workers
declined from 51.1 per cent to 27.9 per cent and the share of wages declined from 33 per cent to 13 per
cent. Correspondingly, there has been a steady increase of profit share in GVA. Throughout this period,
there was a decline in the share of emoluments and wages, with much of the drop concentrated in the periods
1980–90 and 2000–12. Moreover, though profit share was increasing all through this period, much of this
rise occurred during 2000–12. Also, during this period, the rise of profit share coincided with a decline in
interest payment share. In effect, the large rise in profit share in the period after 2000 was mainly due to the
declining share of interest payment, though wage share was also dropping throughout this period.
The drop in emoluments share during this period was experienced in almost all major states, the exceptions
being Kerala and Haryana. However, the decline in emoluments share differed across states. Also, while
the drop in emoluments was experienced across all industries, the intensity varied vastly across industries,
with the traditional industries witnessing a sharper decline. Further, the decrease in emoluments share is
associated with the size of the establishments, with very large establishments recording the greatest decline
in wage and emoluments share in GVA.
Having looked at the broad trends in the long run, we now focus on the period 2000–01 to 2011–12 which
we had recorded as the second period with a sharp decline in the emoluments share. Using the unit-level
data of ASI we aggregate at three-digit level industrial classification for 35 Indian states. During this period
the share of wages in GVA declined by 24 percentage points. Of this, 24 percentage points (about 68 per
cent of the drop) was concentrated in the following states: Punjab, Uttar Pradesh, West Bengal, Gujarat,
Maharashtra, Andhra Pradesh, Karnataka and Tamil Nadu. And in each of these states the fall in wage share
was concentrated in the following industries: food products and beverages, textiles, chemicals and chemical

42 ILO DWT for South Asia and Country Office for India
products, other non-metallic mineral products, fabricated metal products other than machinery and
equipment, machinery and equipment n.e.c.
A shift share analysis of the decline in wage share showed that the change is primarily explained by the
shift component, i.e. an overwhelmingly large component of the drop was due to changes in intra-industry
variations in wage share in GVA rather than inter-industry variations. Looking at the factors that affect
wage share within an industry, it can be noted that increasing flexibility in the labour market is the key
factor behind this decline in wage share. Flexibility in the labour market has been engendered by various
types of substitutions of labour in the production process. This has occurred not only through substitution
of other factors but also by changing the composition of labour. These measures include substitution of
contract workers for permanent employees, substitution of workers with work hours, substitution of women
for men as permanent workers, substitution of capital for labour, and substitution of technology for less
skilled labour.
A first-difference regression model shows that the composition of labour, composition of capital and the
relative compensation to these factors would determine the share of factor payments in GVA. Given the
conditions in India, it seems that three changes in the composition of labour are important:
contractualization; increasing female share in permanent workers; and, substitution of workers with more
days of work. All these three factors have a substantial effect on the drop in wage share in GVA. Also, the
quantum and changing composition of capital does reduce wage share significantly.
Thus the declining share of wages and emoluments in the organized sector may be viewed as an indication
of rising forms of flexibility in the labour market, in terms of different types of employment. This rising
flexibility is precipitated by changes in the capital availability and its composition. This rising capital
intensity and changing composition of capital need to be viewed in light of the global rise in capital mobility
and falling cost of capital, making labour further vulnerable and amenable to flexibility, control and
disciplining.

ILO DWT for South Asia and Country Office for India 43
`
44 ILO DWT for South Asia and Country Office for India
References
Abraham, V. 2010. The effect of information technology on wage inequality: Evidence from Indian
manufacturing sector, Working Paper No. 437 (Kerala, Centre for Development Studies).
Alderson, A.; Nielsen, F. 2002. “Globalization and the great U-turn: Income inequality trends in 16 OECD
countries”, in American Journal of Sociology, Vol. 107, No. 5, pp. 1244–99.
Arpaia, A.; Pérez, E.; Pichelmann, K. 2009. Understanding labour income share dynamics in Europe,
Economic Papers 379 (Brussels, Directorate-General for Economic and Financial Affairs).
Azmat, G.; Manning, A.; Van Reenen, J.M. 2012. “Privatization, entry regulation and the decline of labor's
share of GDP: A cross-country analysis of the network industries”, in Economica, Vol. 79, No. 315, pp.
470–92.
Banga, R. 2005. Impact of liberalisation on wages and employment in Indian manufacturing industries,
WP No. 153, February (New Delhi, Indian Council for Research on International Economic Relations).
Bentolila, S.; Saint-Paul, G. 2003. “Explaining movements in the labor share”, in Contributions to
Macroeconomics, Vol. 3, No. 1.
Berman, E. 2000. Does factor-biased technological change stifle international convergence? Evidence
from manufacturing, National Bureau of Economic Research (NBER) Working Paper No. 7964 (Boston
University, National Bureau of Economic Research).
—; Somanathan, R.; Tan, H.W. 2005. Is skill-biased technological change here yet? Evidence from Indian
manufacturing in the 1990s, Policy Research Working Paper Series No. 3761 (Washington, D.C., World
Bank).
Besley, T.; Burgess, R. 2004. “Can labor regulation hinder economic performance? Evidence from India”,
in Quarterly Journal of Economics, Vol. 119, No. 1, pp. 91–134.
Bhalotra, S.R. 1998. “The puzzle of jobless growth in Indian manufacturing”, in Oxford Bulletin of
Economics and Statistics, Vol. 60, No. 1, pp. 5–32.
ILO DWT for South Asia and Country Office for India 45
`
Blanchard, O.; Giavazzi, F. 2003. “Macroeconomic effects of regulation and deregulation in goods and
labour markets”, in Quarterly Journal of Economics, Vol. 118, No. 3, pp. 879–907.
Brady, D.; Wallace, M. 2000. “Spatialization, foreign direct investment, and labor outcomes in the
American states, 1978–1996”, Social Forces, Vol. 79, No. 1, pp. 67–99.
Chandrasekhar, C.P. 2008. Revisiting the policy environment for engendering employment intensive
economic growth (New Delhi, ILO).
Charpe, M. 2011. “The labour share of income: Determinants and potential contribution to exiting the
financial crisis”, World of Work Report 2011: Making markets work for jobs, No. 1, pp. 55–73.
Doms, M.; Dunne, T.; Troske, K.R. 1997. “Workers, wages and technology”, in Quarterly Journal of
Economics, Vol. 112, No. 1, pp. 253–90.
Driver, C.; Muñoz-Bugarin, J. 2010. “Capital investment and unemployment in Europe: Neutrality or not?”
in Journal of Macroeconomics, Vol. 32, No. 1, pp. 492–496.
Elsby, M.W.L.; Hobijn, B.; Sahin, A. 2013. The decline of the US labor share, Brookings Papers on
Economic Activity, Fall (Washington, D.C., Brookings Institution).
Fallon, P.R.; Lucas, R.E. 1991. “The impact of changes in job security in India and Zimbabwe”, in World
Bank Economic Review, Vol. 5, No. 3, pp. 395–413.
Fichtenbaum, R. 2009. “The impact of unions on labor’s share of income: A time-series analysis”, in Review
of Political Economy, Vol. 21, No. 4, pp. 567–88.
Finnoff, K.; Jayadev, A. 2006. Feminization and the Labor Share of Income, Working Paper 06-4,
Department of Economics, University of Utah, Salt Lake City, U.T. (The International Working Group on
Gender, Macroeconomics, and International Economics (GEM-IWG)).
Ghose, A.K. 2000. Trade liberalisation and manufacturing employment, Employment Paper 2000/3
(Geneva, ILO).
46 ILO DWT for South Asia and Country Office for India
—. 2016. India Employment Report 2016: Challenges and the Imperative of Manufacturing-Led Growth
(New Delhi, Oxford University Press).
Giovannoni, O. 2014a. What do we know about the labor share and the profit share? Part III: Measures
and structural factors, Working Paper No. 805 (New York, Levy Economics Institute of Bard College).
—. 2014b. What do we know about the labor share and the profit share? Part I: Theories, Working Paper
No. 803 (New York, The Levy Economics Institute of Bard College).
—. 2014c. What do we know about the labor share and the profit share? Part II: Empirical evidence,
Working Paper No. 804 (New York, The Levy Economics Institute of Bard College).
Goldar, B. 2009. “Trade liberalisation and labour demand elasticity in Indian manufacturing”, in Economic
and Political Weekly, Vol. 44, No. 34, pp. 51–57.
—. 2013. “Wages and wage share in India during the post-reform period”, in Indian Journal of Labour
Economics, Vol. 56, No. 1, pp. 75–94.
Goldberg, P.K.; Pavcnik, N. 2007. Distributional effects of globalization in developing countries, NBER
Working Paper No. 12885 (Cambridge, M.A., National Bureau of Economic Research).
Guha, A. 2009. “Labour market flexibility: An empirical inquiry into neoliberal propositions”, in Economic
and Political Weekly, Vol. 44, No. 19, pp. 45–52.
Gupta, P.; Hasan, R.; Kumar, U. 2009. Big reforms but small payoffs: Explaining the weak record of growth
and employment in Indian manufacturing, MPRA Paper No. 13496. Available at http://mpra.ub.uni-
muenchen.de/13496/ [accessed 15 December 2016].
Guscina, A. 2006. “Effects of globalization on labor’s share in national income”, IMF Working Paper
series, No. WP/06/294 (Washington, D.C., International Monetary Fund).
Harrison, A.E. 2002. Has globalization eroded labor’s share? Some cross-country evidence, October, UC
Berkeley and NBER. Available at http://www.iadb.org/res/publications/pubfiles/pubS-FDI-9.pdf [accessed
15 December 2016].

ILO DWT for South Asia and Country Office for India 47
`
Hasan, R.; Mitra, D.; Ramaswamy, K.V. 2007. “Trade reforms, labour regulations, and labour–demand
elasticities: Empirical evidence from India”, in The Review of Economics and Statistics, Vol. 89, No. 3, pp.
466–81.
International Labour Organization (ILO). 2013. Global Wage Report 2012/13: Wages and equitable growth
(Geneva).
—. 2014. World of Work Report 2014: Developing with jobs (Geneva).
—; International Monetary Fund (IMF); Organisation for Economic Co-operation and Development
(OECD); World Bank (WB). 2015. Income inequality and labour income share in G20 countries: Trends,
impacts and causes, Prepared for the G20 Labour and Employment Ministers Meeting and Joint Meeting
with the G20 Finance Ministers, Ankara, Turkey, 3-4 September.
Jayadev, A. 2007. “Capital account openness and the labour share of income”, in Cambridge Journal of
Economics, Vol. 31, No. 3 pp. 423–43.
Jorgenson, W.D.; Stiroh, K.J. 1999. “Information technology and growth”, in American Economic Review,
Vol. 89, No. 2, pp. 109–115.
Kaldor, N. 1955. “Alternative theories of distribution”, in The Review of Economic Studies, Vol. 23, No.2,
pp. 83–100.
—. 1957. “A model of economic growth”, in The Economic Journal, Vol. 67, No. 268, pp. 591–624.
Kambhampati, U.; Howell, J. 1998. “Liberalisation and labour: The effect on formal sector employment”,
in Journal of International Development, Vol. 10, No. 4, pp. 439–52.
Kannan, K.P.; Raveendran, G. 2009. “Growth sans employment: A quarter century of jobless growth in
India’s organised manufacturing”, in Economic and Political Weekly, Vol. 44, No. 10, pp. 80–91.
Kapoor, R. 2014. Creating jobs in India’s organised manufacturing sector, Working Paper No. 286
(September) (New Delhi, Indian Council for Research on International Economic Relations).
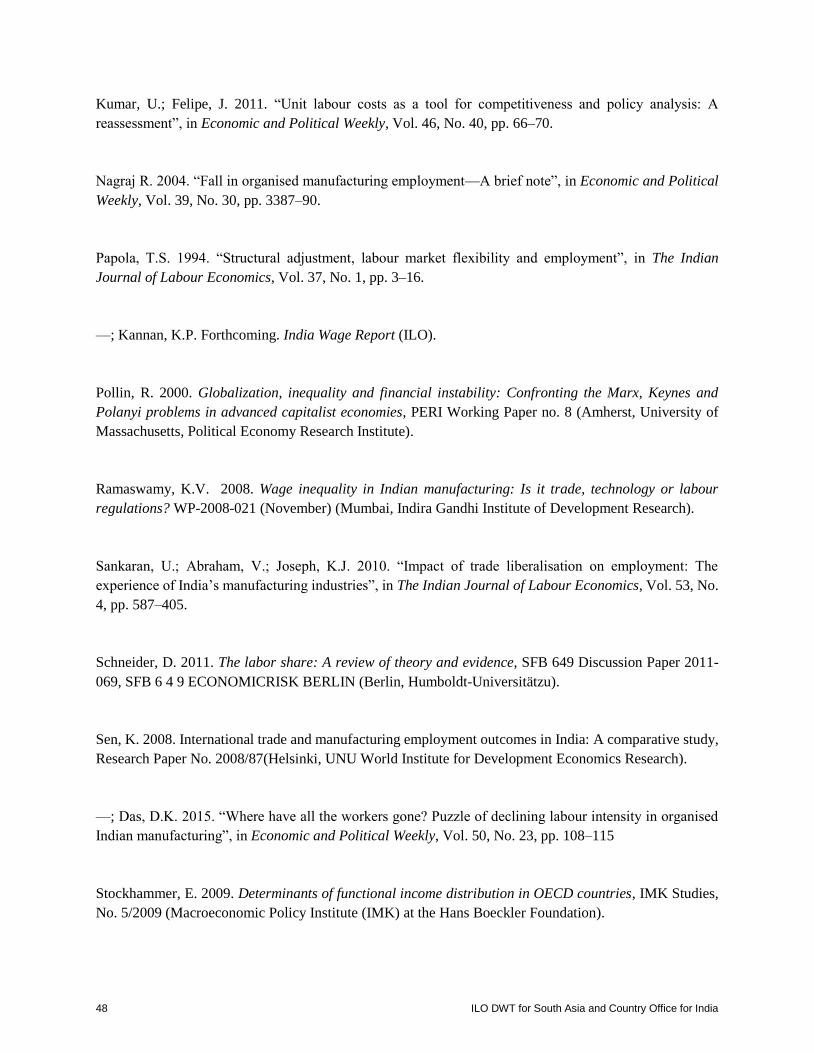
48 ILO DWT for South Asia and Country Office for India
Kumar, U.; Felipe, J. 2011. “Unit labour costs as a tool for competitiveness and policy analysis: A
reassessment”, in Economic and Political Weekly, Vol. 46, No. 40, pp. 66–70.
Nagraj R. 2004. “Fall in organised manufacturing employment—A brief note”, in Economic and Political
Weekly, Vol. 39, No. 30, pp. 3387–90.
Papola, T.S. 1994. “Structural adjustment, labour market flexibility and employment”, in The Indian
Journal of Labour Economics, Vol. 37, No. 1, pp. 3–16.
—; Kannan, K.P. Forthcoming. India Wage Report (ILO).
Pollin, R. 2000. Globalization, inequality and financial instability: Confronting the Marx, Keynes and
Polanyi problems in advanced capitalist economies, PERI Working Paper no. 8 (Amherst, University of
Massachusetts, Political Economy Research Institute).
Ramaswamy, K.V. 2008. Wage inequality in Indian manufacturing: Is it trade, technology or labour
regulations? WP-2008-021 (November) (Mumbai, Indira Gandhi Institute of Development Research).
Sankaran, U.; Abraham, V.; Joseph, K.J. 2010. “Impact of trade liberalisation on employment: The
experience of India’s manufacturing industries”, in The Indian Journal of Labour Economics, Vol. 53, No.
4, pp. 587–405.
Schneider, D. 2011. The labor share: A review of theory and evidence, SFB 649 Discussion Paper 2011-
069, SFB 6 4 9 ECONOMICRISK BERLIN (Berlin, Humboldt-Universitätzu).
Sen, K. 2008. International trade and manufacturing employment outcomes in India: A comparative study,
Research Paper No. 2008/87(Helsinki, UNU World Institute for Development Economics Research).
—; Das, D.K. 2015. “Where have all the workers gone? Puzzle of declining labour intensity in organised
Indian manufacturing”, in Economic and Political Weekly, Vol. 50, No. 23, pp. 108–115
Stockhammer, E. 2009. Determinants of functional income distribution in OECD countries, IMK Studies,
No. 5/2009 (Macroeconomic Policy Institute (IMK) at the Hans Boeckler Foundation).

ILO DWT for South Asia and Country Office for India 49
`
—2012. Rising inequality as a root cause of the present crisis, Working Paper Series No. 282
(Massachusetts, Amherst, Political Economy Research Institute, University of Massachusetts).
Sundar, K.R.S. 2005. “Labour flexibility debate in India: A comprehensive review and some suggestions”,
in Economic and Political Weekly, Vol. 40, No. 22/23, pp. 2274–2285.
Trapp, K. 2015. Measuring the labour income share of developing countries: Learning from social
accounting matrices, WIDER Working Paper 2015/041 (April) (Helinski, UNU-WIDER).

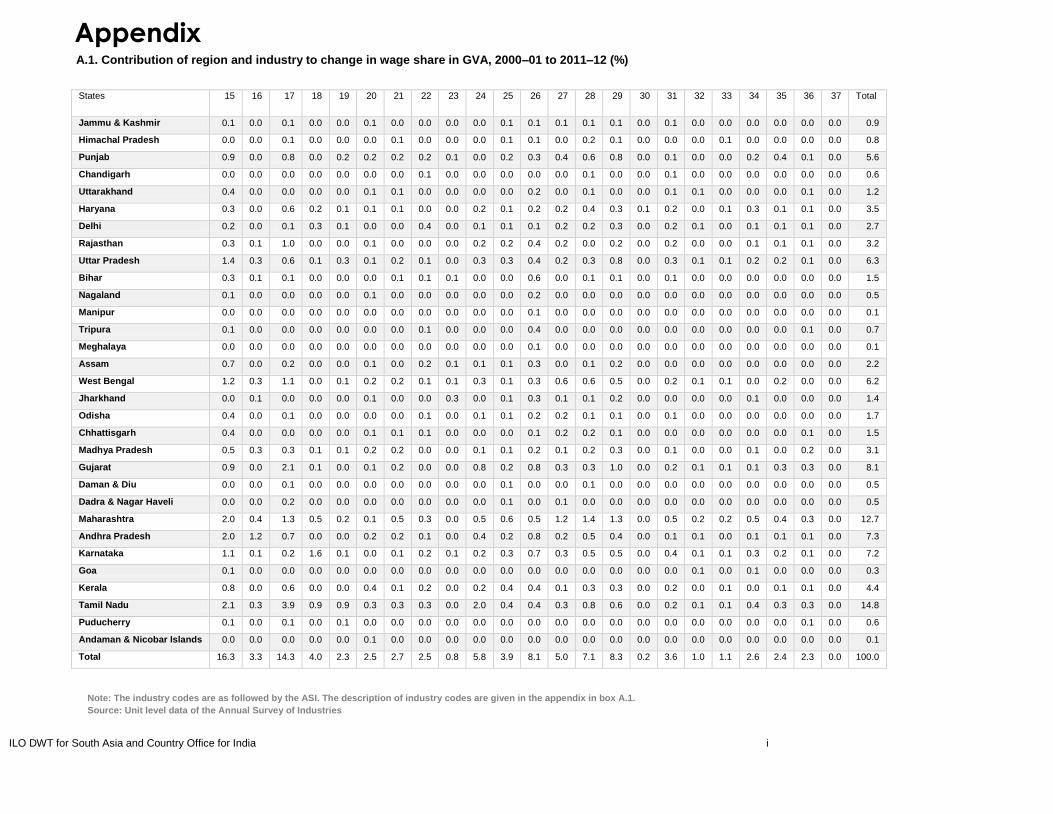
ILO DWT for South Asia and Country Office for India i
Appendix
Table A.1. Contribution of region and industry to change in wage share in GVA, 2000–01 to 2011–12 (%)
Note: The industry codes are as followed by
the ASI. The description of industry codes are
given in
States
15 16 17 18 19 20 21 22 23 24 25 26 27 28 29 30 31 32 33 34 35 36 37 Total
Jammu & Kashmir 0.1 0.0 0.1 0.0 0.0 0.1 0.0 0.0 0.0 0.0 0.1 0.1 0.1 0.1 0.1 0.0 0.1 0.0 0.0 0.0 0.0 0.0 0.0 0.9
Himachal Pradesh 0.0 0.0 0.1 0.0 0.0 0.0 0.1 0.0 0.0 0.0 0.1 0.1 0.0 0.2 0.1 0.0 0.0 0.0 0.1 0.0 0.0 0.0 0.0 0.8
Punjab 0.9 0.0 0.8 0.0 0.2 0.2 0.2 0.2 0.1 0.0 0.2 0.3 0.4 0.6 0.8 0.0 0.1 0.0 0.0 0.2 0.4 0.1 0.0 5.6
Chandigarh 0.0 0.0 0.0 0.0 0.0 0.0 0.0 0.1 0.0 0.0 0.0 0.0 0.0 0.1 0.0 0.0 0.1 0.0 0.0 0.0 0.0 0.0 0.0 0.6
Uttarakhand 0.4 0.0 0.0 0.0 0.0 0.1 0.1 0.0 0.0 0.0 0.0 0.2 0.0 0.1 0.0 0.0 0.1 0.1 0.0 0.0 0.0 0.1 0.0 1.2
Haryana 0.3 0.0 0.6 0.2 0.1 0.1 0.1 0.0 0.0 0.2 0.1 0.2 0.2 0.4 0.3 0.1 0.2 0.0 0.1 0.3 0.1 0.1 0.0 3.5
Delhi 0.2 0.0 0.1 0.3 0.1 0.0 0.0 0.4 0.0 0.1 0.1 0.1 0.2 0.2 0.3 0.0 0.2 0.1 0.0 0.1 0.1 0.1 0.0 2.7
Rajasthan 0.3 0.1 1.0 0.0 0.0 0.1 0.0 0.0 0.0 0.2 0.2 0.4 0.2 0.0 0.2 0.0 0.2 0.0 0.0 0.1 0.1 0.1 0.0 3.2
Uttar Pradesh 1.4 0.3 0.6 0.1 0.3 0.1 0.2 0.1 0.0 0.3 0.3 0.4 0.2 0.3 0.8 0.0 0.3 0.1 0.1 0.2 0.2 0.1 0.0 6.3
Bihar 0.3 0.1 0.1 0.0 0.0 0.0 0.1 0.1 0.1 0.0 0.0 0.6 0.0 0.1 0.1 0.0 0.1 0.0 0.0 0.0 0.0 0.0 0.0 1.5
Nagaland 0.1 0.0 0.0 0.0 0.0 0.1 0.0 0.0 0.0 0.0 0.0 0.2 0.0 0.0 0.0 0.0 0.0 0.0 0.0 0.0 0.0 0.0 0.0 0.5
Manipur 0.0 0.0 0.0 0.0 0.0 0.0 0.0 0.0 0.0 0.0 0.0 0.1 0.0 0.0 0.0 0.0 0.0 0.0 0.0 0.0 0.0 0.0 0.0 0.1
Tripura 0.1 0.0 0.0 0.0 0.0 0.0 0.0 0.1 0.0 0.0 0.0 0.4 0.0 0.0 0.0 0.0 0.0 0.0 0.0 0.0 0.0 0.1 0.0 0.7
Meghalaya 0.0 0.0 0.0 0.0 0.0 0.0 0.0 0.0 0.0 0.0 0.0 0.1 0.0 0.0 0.0 0.0 0.0 0.0 0.0 0.0 0.0 0.0 0.0 0.1
Assam 0.7 0.0 0.2 0.0 0.0 0.1 0.0 0.2 0.1 0.1 0.1 0.3 0.0 0.1 0.2 0.0 0.0 0.0 0.0 0.0 0.0 0.0 0.0 2.2
West Bengal 1.2 0.3 1.1 0.0 0.1 0.2 0.2 0.1 0.1 0.3 0.1 0.3 0.6 0.6 0.5 0.0 0.2 0.1 0.1 0.0 0.2 0.0 0.0 6.2
Jharkhand 0.0 0.1 0.0 0.0 0.0 0.1 0.0 0.0 0.3 0.0 0.1 0.3 0.1 0.1 0.2 0.0 0.0 0.0 0.0 0.1 0.0 0.0 0.0 1.4
Odisha 0.4 0.0 0.1 0.0 0.0 0.0 0.0 0.1 0.0 0.1 0.1 0.2 0.2 0.1 0.1 0.0 0.1 0.0 0.0 0.0 0.0 0.0 0.0 1.7
Chhattisgarh 0.4 0.0 0.0 0.0 0.0 0.1 0.1 0.1 0.0 0.0 0.0 0.1 0.2 0.2 0.1 0.0 0.0 0.0 0.0 0.0 0.0 0.1 0.0 1.5
Madhya Pradesh 0.5 0.3 0.3 0.1 0.1 0.2 0.2 0.0 0.0 0.1 0.1 0.2 0.1 0.2 0.3 0.0 0.1 0.0 0.0 0.1 0.0 0.2 0.0 3.1
Gujarat 0.9 0.0 2.1 0.1 0.0 0.1 0.2 0.0 0.0 0.8 0.2 0.8 0.3 0.3 1.0 0.0 0.2 0.1 0.1 0.1 0.3 0.3 0.0 8.1
Daman & Diu 0.0 0.0 0.1 0.0 0.0 0.0 0.0 0.0 0.0 0.0 0.1 0.0 0.0 0.1 0.0 0.0 0.0 0.0 0.0 0.0 0.0 0.0 0.0 0.5
Dadra & Nagar Haveli 0.0 0.0 0.2 0.0 0.0 0.0 0.0 0.0 0.0 0.0 0.1 0.0 0.1 0.0 0.0 0.0 0.0 0.0 0.0 0.0 0.0 0.0 0.0 0.5
Maharashtra 2.0 0.4 1.3 0.5 0.2 0.1 0.5 0.3 0.0 0.5 0.6 0.5 1.2 1.4 1.3 0.0 0.5 0.2 0.2 0.5 0.4 0.3 0.0 12.7
Andhra Pradesh 2.0 1.2 0.7 0.0 0.0 0.2 0.2 0.1 0.0 0.4 0.2 0.8 0.2 0.5 0.4 0.0 0.1 0.1 0.0 0.1 0.1 0.1 0.0 7.3
Karnataka 1.1 0.1 0.2 1.6 0.1 0.0 0.1 0.2 0.1 0.2 0.3 0.7 0.3 0.5 0.5 0.0 0.4 0.1 0.1 0.3 0.2 0.1 0.0 7.2
Goa 0.1 0.0 0.0 0.0 0.0 0.0 0.0 0.0 0.0 0.0 0.0 0.0 0.0 0.0 0.0 0.0 0.0 0.1 0.0 0.1 0.0 0.0 0.0 0.3
Kerala 0.8 0.0 0.6 0.0 0.0 0.4 0.1 0.2 0.0 0.2 0.4 0.4 0.1 0.3 0.3 0.0 0.2 0.0 0.1 0.0 0.1 0.1 0.0 4.4
Tamil Nadu 2.1 0.3 3.9 0.9 0.9 0.3 0.3 0.3 0.0 2.0 0.4 0.4 0.3 0.8 0.6 0.0 0.2 0.1 0.1 0.4 0.3 0.3 0.0 14.8
Puducherry 0.1 0.0 0.1 0.0 0.1 0.0 0.0 0.0 0.0 0.0 0.0 0.0 0.0 0.0 0.0 0.0 0.0 0.0 0.0 0.0 0.0 0.1 0.0 0.6
Andaman & Nicobar Islands 0.0 0.0 0.0 0.0 0.0 0.1 0.0 0.0 0.0 0.0 0.0 0.0 0.0 0.0 0.0 0.0 0.0 0.0 0.0 0.0 0.0 0.0 0.0 0.1
Total 16.3 3.3 14.3 4.0 2.3 2.5 2.7 2.5 0.8 5.8 3.9 8.1 5.0 7.1 8.3 0.2 3.6 1.0 1.1 2.6 2.4 2.3 0.0 100.0
Note: The industry codes are as followed by the ASI. The description of industry codes are given in the appendix in box A.1.
Source: Unit level data of the Annual Survey of Industries
ii ILO DWT for South Asia and Country Office for India
Figure A.1. Deviations in Wholesale Price Index and Consumer Price Index
To measure the deviations in the WPI and CPI, we shift the base year 2001 of CPIIW to 2004–05 so that
we have the same year as the base year for both WPI and CPIIW. Then we convert both the series into
indices starting at 1 for the initial year so that they are made comparable. From the above graph it is evident
that the price rise for consumers was much higher than the WPI and that the two indices began to deviate
from the early 1990s.
Definition of wages and emoluments as measured by ASI
Emoluments: These are defined in the same way as wages but paid to all employees; they also include the
imputed value of benefits in kind, i.e. the net cost to the employers on those goods and services provided
to employees free of charge or at markedly reduced cost which are clearly and primarily of benefit to the
employees as consumers. It includes profit sharing, festival and other bonuses, and ex-gratia payments paid
at less frequent intervals (i.e. other than bonuses paid more or less regularly for each period). Benefits in
kind include supplies or services rendered, such as housing, medical, education and recreation facilities.
Personal insurance, income tax, house rent allowance, conveyance, etc. for payment by the employer are
also included in the emoluments.
Supplement to emoluments: These include (i) employer’s contribution to old-age benefits, i.e. provident
fund, pension, gratuity, etc.; (ii) employer’s contribution towards other social security charges such as
employees’ state insurance, compensation for work injuries, occupational diseases, maternity benefits,
retrenchment and lay-off benefits, etc.; (iii) group benefits like direct expenditure on maternity, crèches,
canteen facilities, educational, cultural and recreational facilities, and grants to trade unions, cooperative
stores, etc.
0
2
4
6
8
10
12
14
WPI CPIIW
ILO DWT for South Asia and Country Office for India iii
`
Wages: Wages are defined as including all remuneration capable of being expressed in monetary terms and
also paid more or less regularly in each pay period to workers (defined above) as compensation for work
done during the accounting year. It includes:
a) Direct wages and salary (i.e. basic wages/salaries, payment of overtime, dearness, compensatory,
house rent and other allowances).
b) Remuneration for period not worked (i.e. basic wages, salaries and allowances payable for leave
period), paid holidays, lay-off payments and compensation for unemployment (if not paid from
source other than employers).
c) Bonus and ex-gratia payment paid both at regular and less frequent intervals (i.e. incentive bonuses
and good attendance bonuses, production bonuses, profit-sharing bonuses, festival or year-end
bonuses, etc.). It excludes lay-off payments and compensation for employment, except where such
payments are not made by the employer. It excludes employer’s contribution to old-age benefits
and other social security charges, direct expenditure on maternity benefits, crèches and other group
benefits in kind, and travelling and other expenditure incurred for business purposes and
reimbursed by the employer. The wages are expressed in terms of gross value, i.e. before deductions
for fines, damages, taxes, provident fund, employees’ state insurance contribution, etc. Benefits in
kind (perquisites) of an individual nature only are included.
Interest paid: Includes all interest paid on factory account on loan, whether short term or long term,
irrespective of the duration and the nature of the agency from which the loan was taken. Interest paid to
partners and proprietors on capital or loan are excluded.
Source: Manual of Annual Survey of Industries, CSO, MOSPI, Government of India.
iv ILO DWT for South Asia and Country Office for India
Box A.1. Industry codes as per the Annual Survey of Industries
15 - Food products and beverages
16 - Tobacco products
17 – Textiles
18 - Wearing apparel; dressing and dyeing of fur
19 - Luggage, handbags, saddlery, harness & footwear; tanning and dressing of leather products
20 - Wood and products of wood & cork except furniture; articles of straw and plating materials
21 - Paper and paper products
22 - Publishing, printing & reproduction of recorded media
23 - Coke, refined petroleum products and nuclear fuel
24 - Chemicals and chemical products
25 - Rubber and plastics products
27- Basic Metals
28 - Fabricated metal products, except machinery and equipment
29 - Machinery and equipment n.e.c.
30 - Office, accounting and computing machinery
31 - Electrical machinery and apparatus n.e.c.
32 - Radio, TV and communication equipments and apparatus
33 - Medical, precision and optical instruments, watches and clocks
34 - Motor vehicles, trailers & semi-trailers
35 - Other transport equipment
36 - Furniture; manufacturing n.e.c.
37- Others
ILO DWT for South Asia and Country Office for India v
`
ILO DWT for South Asia and Country Office for India
India Habitat Centre, Core 4B, 3rd Floor
Lodhi road, New Delhi-110 003
India
Tel.: +91 11 4750 9200, Fax: +91 11 2460 2111
Email: [email protected]
www.ilo.org/india
Declining wage share in India’s organized manufacturing
sector: Trends, patterns and determinants
Using the Annual Survey of Industries data of the organized manufacturing sector in India for over three
decades, this study identifies a persistent and significant decline in wages and emoluments share in the
gross value added. The drop in the share of emoluments in the organized sector corresponded with
rising profit shares and a widening gap between earnings per employee and labour productivity in real
terms. The decline in labour share was evident across all states, all industries and among large-sized firms.
From the analysis, what emerges is that the composition of labour, composition of capital, and the
relative compensation to these factors determine the share of factor payments in gross value added.
Given the conditions in India, it appears that three changes in the composition of labour are important:
(i) contractualization; (ii) increasing female share in permanent workers; and (iii) substitution of workers
with more days of work. Also, increasing capital intensity has reduced the demand for labour while the
changing composition of capital has created biases in the demand for labour, both together reducing
the share of wages in gross value added. The declining share of wages and emoluments in the
organized sector may be viewed as an indication of rising forms of flexibility in the labour market, making
labour further vulnerable and amenable to flexibility and control.
ISBN: 2227-4405 (web pdf)
Related Documents