Illuminating reactive microbial transport in saturated porous media: Demonstration of a visualization method and conceptual transport model Peter M. Oates a , Catherine Castenson a , Charles F. Harvey a, T , Martin Polz a , Patricia Culligan b a 48-321 Parsons Laboratory, Department of Civil and Environmental Engineering, Massachusetts Institute of Technology, Cambridge, MA 02139, United States b Department of Civil Engineering and Engineering Mechanics, Columbia University, NY, United States Received 5 May 2004; received in revised form 25 August 2004; accepted 9 December 2004 Abstract We demonstrate a method to study reactive microbial transport in saturated translucent porous media using the bacteria Pseudomonas fluorescens 5RL genetically engineered to carry a plasmid with bioluminescence genes inducible by salicylate. Induced bacteria were injected into a cryolite grain filled chamber saturated with a sterile non-growth-promoting (phosphorus limited) chemical mixture containing salicylate as an aromatic hydrocarbon analogue. The amount of light produced by the bacteria serves as an estimator of the relative efficiency of aerobic biodegradation since bioluminescence is dependent on both salicylate and oxygen but only consumes oxygen. Bioluminescence was captured with a digital camera and analyzed to study the evolving spatial pattern of the bulk oxygen consuming reactions. As fluid flow transported the bacteria through the chamber, bioluminescence was observed to initially increase until an oxygen depletion zone developed behind the advective front. Bacterial transport was modeled with the advection dispersion equation and oxygen concentration was modeled assuming bacterial consumption via Monod kinetics with consideration of additional effects of rate-limited mass transfer from residual gas bubbles. Consistent with previous measurements, bioluminescence was considered proportional to oxygen consumed. Using the observed bioluminescence, model parameters were fit that were consistent with literature values and produced results in good agreement with the experimental data. 0169-7722/$ - see front matter D 2005 Published by Elsevier B.V. doi:10.1016/j.jconhyd.2004.12.005 T Corresponding author. Tel.: +1 617 258 0392; fax: +1 617 258 8850. E-mail address: [email protected] (C.F. Harvey). Journal of Contaminant Hydrology 77 (2005) 233 – 245 www.elsevier.com/locate/jconhyd

Welcome message from author
This document is posted to help you gain knowledge. Please leave a comment to let me know what you think about it! Share it to your friends and learn new things together.
Transcript
Journal of Contaminant Hydrology 77 (2005) 233–245
www.elsevier.com/locate/jconhyd
Illuminating reactive microbial transport in saturated
porous media: Demonstration of a visualization
method and conceptual transport model
Peter M. Oatesa, Catherine Castensona, Charles F. Harveya,T,Martin Polza, Patricia Culliganb
a48-321 Parsons Laboratory, Department of Civil and Environmental Engineering,
Massachusetts Institute of Technology, Cambridge, MA 02139, United StatesbDepartment of Civil Engineering and Engineering Mechanics, Columbia University, NY, United States
Received 5 May 2004; received in revised form 25 August 2004; accepted 9 December 2004
Abstract
We demonstrate a method to study reactive microbial transport in saturated translucent porous
media using the bacteria Pseudomonas fluorescens 5RL genetically engineered to carry a plasmid
with bioluminescence genes inducible by salicylate. Induced bacteria were injected into a cryolite
grain filled chamber saturated with a sterile non-growth-promoting (phosphorus limited) chemical
mixture containing salicylate as an aromatic hydrocarbon analogue. The amount of light produced by
the bacteria serves as an estimator of the relative efficiency of aerobic biodegradation since
bioluminescence is dependent on both salicylate and oxygen but only consumes oxygen.
Bioluminescence was captured with a digital camera and analyzed to study the evolving spatial
pattern of the bulk oxygen consuming reactions. As fluid flow transported the bacteria through the
chamber, bioluminescence was observed to initially increase until an oxygen depletion zone
developed behind the advective front. Bacterial transport was modeled with the advection dispersion
equation and oxygen concentration was modeled assuming bacterial consumption via Monod
kinetics with consideration of additional effects of rate-limited mass transfer from residual gas
bubbles. Consistent with previous measurements, bioluminescence was considered proportional to
oxygen consumed. Using the observed bioluminescence, model parameters were fit that were
consistent with literature values and produced results in good agreement with the experimental data.
0169-7722/$ -
doi:10.1016/j.
T Correspon
E-mail add
see front matter D 2005 Published by Elsevier B.V.
jconhyd.2004.12.005
ding author. Tel.: +1 617 258 0392; fax: +1 617 258 8850.
ress: [email protected] (C.F. Harvey).
P.M. Oates et al. / Journal of Contaminant Hydrology 77 (2005) 233–245234
These findings demonstrate potential for using this method to investigate the complex spatial and
temporal dynamics of reactive microbial transport in saturated porous media.
D 2005 Published by Elsevier B.V.
Keywords: Bioluminescence; Reactive transport visualization
1. Introduction
Transport and reaction of microorganisms in the subsurface is important for processes
ranging from contaminant degradation during in situ bioremediation to the movement of
harmful microorganisms from surface waters to groundwater supply wells. Effective
application of in situ bioremediation requires understanding of the complex biotic and
abiotic interactions in natural and engineered systems (Lee et al., 1988; Thomas and Ward,
1989; Harvey et al., 1989). These include metabolic activity, supply of nutrients and
electron acceptors, growth, and predation. Furthermore, passive mechanisms such as
advection, dispersion, sorption, filtration, and adhesion of microbial cells have to be
adequately understood to predict both microbial transport during bioremediation and
harmful organism movement through the subsurface.
One of the most difficult challenges in investigating subsurface microbial processes is
the inability to simultaneously estimate cell position or movement, and metabolic
reactions. Current methods measure microbial reactions and position/transport separately.
Microbial reactions are most commonly studied by substrate or terminal electron acceptor
utilization, cell mass increase, carbon dioxide production, and enzyme activity analysis
(Maier et al., 2000). Bacterial transport is typically analyzed by breakthrough curves
(Wollum and Cassel, 1978; Smith et al., 1985; Tan et al., 1994; Camper et al., 1993;
Fontes et al., 1991). Additionally, bacterial position/transport has been visualized by using
small glass models of porous media (Peden and Hussain, 1985; Conrad et al., 1992) in
conjunction with scanning electron microscopy (Shaw et al., 1985) and cinemicrographic
techniques such as video and time-lapse video recording (Kjelleberg et al., 1982; Caldwell,
1985; Power and Marshall, 1988). While these techniques provide valuable information,
none reveal both real-time metabolic activity and reactive microbial locations in an in situ
state and at a relevant resolution for microbial processes.
Progress in comprehension of many of these complex and coupled phenomena requires
non-invasive techniques that allow direct observation of both microbial position during
transport and reactive state. Uesugi et al. (2001) used a charge-coupled device (CCD) to
follow the induction kinetics of lux gene-dependent bioluminescence of Pseudomonas
fluorescens HK44 in a batch reaction and speculated it should be possible to follow
growth, via bioluminescence, in response to unsaturated solute flow in translucent porous
media. In a follow up study, Yarwood et al. (2002) demonstrated that it was indeed
possible to use a light transmission chamber, microbial bioluminescence, and a CCD
camera to visualize microbial growth under unsaturated flow conditions in porous media.
Recently, Huang et al. (2003) used non-invasive imaging with an oxygen sensitive
fluorescent indicator to investigate the biodegradation processes in a light transmission
P.M. Oates et al. / Journal of Contaminant Hydrology 77 (2005) 233–245 235
chamber. Because, the indicators’ fluorescence depends on oxygen concentrations, oxygen
concentrations were monitored during biodegradation by exciting the fluorescence
indicator with UV light and recording the emission with a CCD camera.
Bacteria genetically engineered to produce light (bioluminesce) proportionally to the
concentration of a metabolic substrate of interest hold great promise for the study of reactive
transport. For example, P. fluorescens 5RL carries a plasmid in which metabolic genes for
salicylate degradation have been replaced with lux genes responsible for bioluminescence.
Thus, salicylate induces bioluminescence but is not degraded, and within limits, the
resulting light is proportional to salicylate concentrations. P. fluorescens HK44 has been
proposed as a simple model for studying hydrocarbon degradation under non-invasive
conditions because salicylate is a simple hydrocarbon analogue and because biolumines-
cence, like oxygenase-dependent hydrocarbon degradation, is dependent on oxygen.
Here, we describe a pilot experiment that characterizes the spatial and temporal
dynamics of reactive microbial transport in saturated translucent porous media. This
experiment was an analogue for coupled transport and reaction of microbes, and oxygen in
an aquifer or soil. P. fluorescens 5RL were transported through clear granular porous
media and underwent an oxygen dependent bioluminescent reaction comparable to aerobic
biodegradation. The resulting bioluminescence pattern was captured with a digital camera
as it evolved, and was then analyzed by fitting with a numerical model that simulated the
coupled physical and biochemical dynamics.
2. Materials and methods
2.1. In situ visualization
A translucent porous medium was constructed by filling a glass tank with grains of the natural
mineral cryolite (Na3AlF6) and saturating it with water. Cryolite was chosen over glass because it has
an index of refraction close to water permitting better in situ visualization (Gramling et al., 2002).
2.2. Bacteria
P. fluorescens 5RL was obtained from the University of Tennessee Center for Environmental
Technology and used for this experiment. Bacteria were grown in a liquid YEPG medium at room
temperature over night. The YEPG medium consisted of glucose (1 g/l), peptone (2 g/l), yeast extract
(0.2 g/l), NH4NO3 (0.2 g/l), tris buffer to pH 7, tetracycline (14 mg/l), and salicylate (10 mg/l).
Tetracycline was used to kill other microorganisms but is ineffective against P. fluorescens 5RL since
its engineered plasmid contains a tetracycline resistance gene. Preliminary tests determined that the
cryolite was not toxic to the bacteria and did not depress bioluminescence (data not shown).
2.3. Flow chamber
The entire experimental setup was located in a dark room to ensure minimal interference of other
light sources with the bioluminescence measurements. Fluid was pumped through a Lexan
polycarbonate tank (inner dimensions of 30.48�6.35�1.91 cm) filled with cryolite grains (between
0.71–1.19 mm average grain size) saturated with an aqueous maintenance medium (see below) (Fig.
1). RTV silicone adhesive was used to seal all of the joints except the back face, which was sealed with
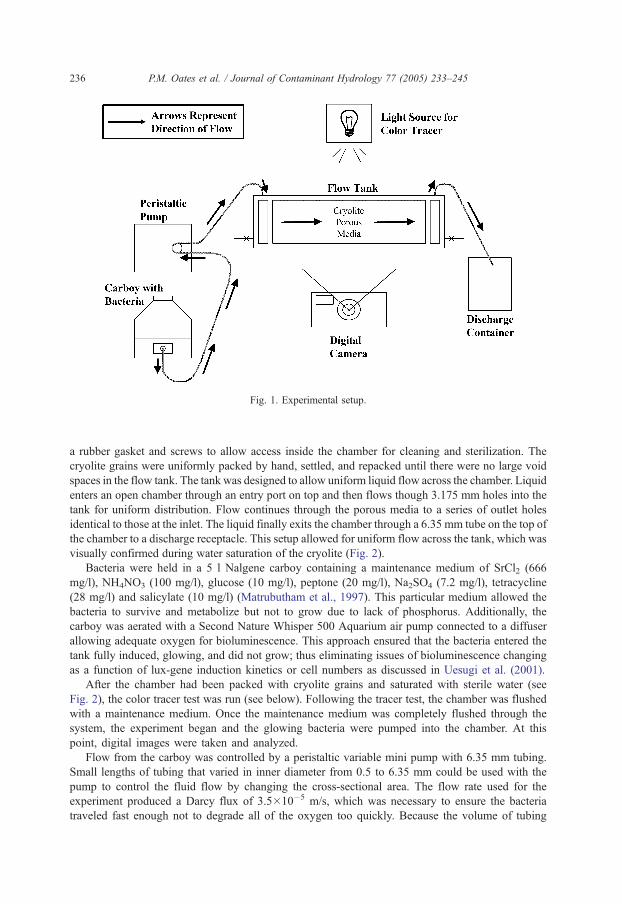
Fig. 1. Experimental setup.
P.M. Oates et al. / Journal of Contaminant Hydrology 77 (2005) 233–245236
a rubber gasket and screws to allow access inside the chamber for cleaning and sterilization. The
cryolite grains were uniformly packed by hand, settled, and repacked until there were no large void
spaces in the flow tank. The tank was designed to allow uniform liquid flow across the chamber. Liquid
enters an open chamber through an entry port on top and then flows though 3.175 mm holes into the
tank for uniform distribution. Flow continues through the porous media to a series of outlet holes
identical to those at the inlet. The liquid finally exits the chamber through a 6.35 mm tube on the top of
the chamber to a discharge receptacle. This setup allowed for uniform flow across the tank, which was
visually confirmed during water saturation of the cryolite (Fig. 2).
Bacteria were held in a 5 l Nalgene carboy containing a maintenance medium of SrCl2 (666
mg/l), NH4NO3 (100 mg/l), glucose (10 mg/l), peptone (20 mg/l), Na2SO4 (7.2 mg/l), tetracycline
(28 mg/l) and salicylate (10 mg/l) (Matrubutham et al., 1997). This particular medium allowed the
bacteria to survive and metabolize but not to grow due to lack of phosphorus. Additionally, the
carboy was aerated with a Second Nature Whisper 500 Aquarium air pump connected to a diffuser
allowing adequate oxygen for bioluminescence. This approach ensured that the bacteria entered the
tank fully induced, glowing, and did not grow; thus eliminating issues of bioluminescence changing
as a function of lux-gene induction kinetics or cell numbers as discussed in Uesugi et al. (2001).
After the chamber had been packed with cryolite grains and saturated with sterile water (see
Fig. 2), the color tracer test was run (see below). Following the tracer test, the chamber was flushed
with a maintenance medium. Once the maintenance medium was completely flushed through the
system, the experiment began and the glowing bacteria were pumped into the chamber. At this
point, digital images were taken and analyzed.
Flow from the carboy was controlled by a peristaltic variable mini pump with 6.35 mm tubing.
Small lengths of tubing that varied in inner diameter from 0.5 to 6.35 mm could be used with the
pump to control the fluid flow by changing the cross-sectional area. The flow rate used for the
experiment produced a Darcy flux of 3.5�10�5 m/s, which was necessary to ensure the bacteria
traveled fast enough not to degrade all of the oxygen too quickly. Because the volume of tubing
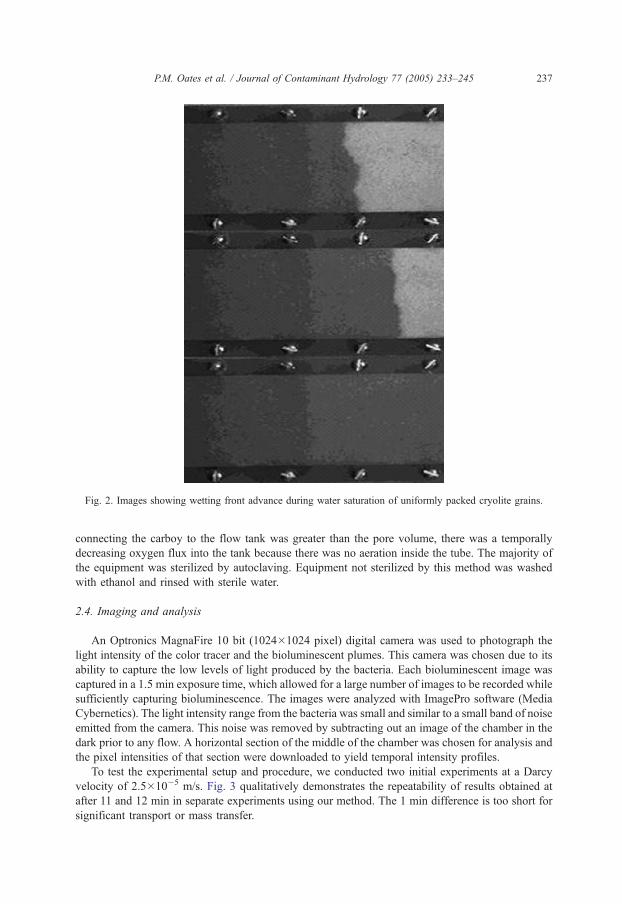
Fig. 2. Images showing wetting front advance during water saturation of uniformly packed cryolite grains.
P.M. Oates et al. / Journal of Contaminant Hydrology 77 (2005) 233–245 237
connecting the carboy to the flow tank was greater than the pore volume, there was a temporally
decreasing oxygen flux into the tank because there was no aeration inside the tube. The majority of
the equipment was sterilized by autoclaving. Equipment not sterilized by this method was washed
with ethanol and rinsed with sterile water.
2.4. Imaging and analysis
An Optronics MagnaFire 10 bit (1024�1024 pixel) digital camera was used to photograph the
light intensity of the color tracer and the bioluminescent plumes. This camera was chosen due to its
ability to capture the low levels of light produced by the bacteria. Each bioluminescent image was
captured in a 1.5 min exposure time, which allowed for a large number of images to be recorded while
sufficiently capturing bioluminescence. The images were analyzed with ImagePro software (Media
Cybernetics). The light intensity range from the bacteria was small and similar to a small band of noise
emitted from the camera. This noise was removed by subtracting out an image of the chamber in the
dark prior to any flow. A horizontal section of the middle of the chamber was chosen for analysis and
the pixel intensities of that section were downloaded to yield temporal intensity profiles.
To test the experimental setup and procedure, we conducted two initial experiments at a Darcy
velocity of 2.5�10�5 m/s. Fig. 3 qualitatively demonstrates the repeatability of results obtained at
after 11 and 12 min in separate experiments using our method. The 1 min difference is too short for
significant transport or mass transfer.
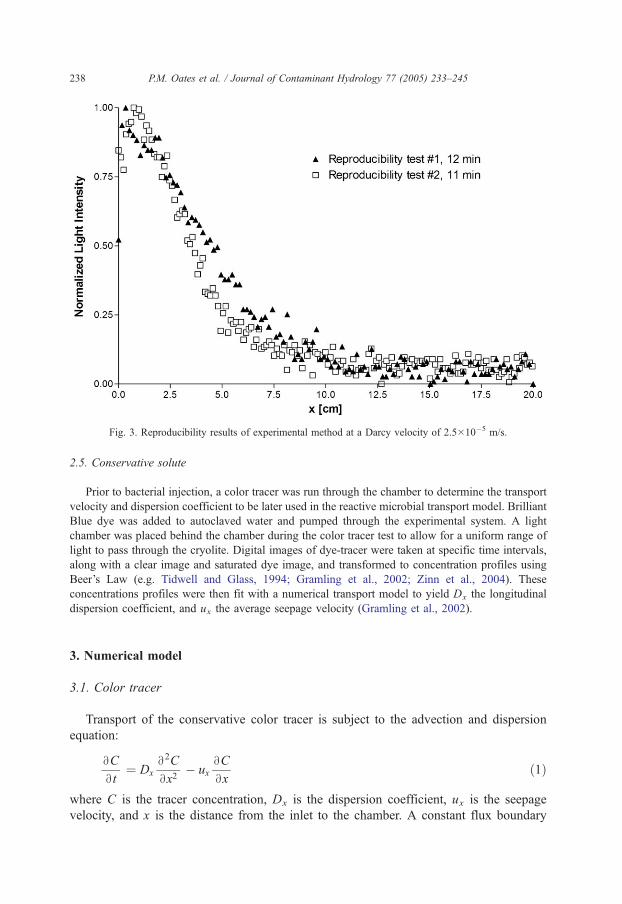
Fig. 3. Reproducibility results of experimental method at a Darcy velocity of 2.5�10�5 m/s.
P.M. Oates et al. / Journal of Contaminant Hydrology 77 (2005) 233–245238
2.5. Conservative solute
Prior to bacterial injection, a color tracer was run through the chamber to determine the transport
velocity and dispersion coefficient to be later used in the reactive microbial transport model. Brilliant
Blue dye was added to autoclaved water and pumped through the experimental system. A light
chamber was placed behind the chamber during the color tracer test to allow for a uniform range of
light to pass through the cryolite. Digital images of dye-tracer were taken at specific time intervals,
along with a clear image and saturated dye image, and transformed to concentration profiles using
Beer’s Law (e.g. Tidwell and Glass, 1994; Gramling et al., 2002; Zinn et al., 2004). These
concentrations profiles were then fit with a numerical transport model to yield Dx the longitudinal
dispersion coefficient, and ux the average seepage velocity (Gramling et al., 2002).
3. Numerical model
3.1. Color tracer
Transport of the conservative color tracer is subject to the advection and dispersion
equation:
BC
Bt¼ Dx
B2C
Bx2� ux
BC
Bxð1Þ
where C is the tracer concentration, Dx is the dispersion coefficient, ux is the seepage
velocity, and x is the distance from the inlet to the chamber. A constant flux boundary
P.M. Oates et al. / Journal of Contaminant Hydrology 77 (2005) 233–245 239
was used for the inflow side of the chamber and zero gradient was applied at the
outflow:
� Dx
BC
Bxþ uxC ¼ uxCi d ¼ 0; t ð2aÞ
BC
Bx¼ 0 d ¼ L; t ð2bÞ
where Ci is the initial concentration of the tracer; and L is the tank length. This equation
was solved numerically by a central in space Crank–Nicholson finite difference scheme
with Matlab. Matlab’s lsqnonlin.m function was used to perform a preconditioned
conjugate gradient non-linear least squares optimization between the simulated
normalized tracer concentrations and the observed normalized tracer profile to produce
the best-fit Dx and ux for the experiment.
3.2. Reactive microbial transport
The processes controlling microorganisms, oxygen, and ultimately light production for
this experiment are advection, dispersion, reaction, and mass transfer of oxygen between a
gas phase (small bubbles) and the water phase. The high flow rate made bacterial adhesion
unlikely (Yates and Yates, 1988) allowing bacterial sorption, if any, to be modeled with a
simple retardation factor, Rm. The phosphorus deficiency, tetracycline addition, and short
time scales eliminated issues of bacterial growth, predation and competition, and death
thereby allowing microbial concentrations, M, to be governed by conservative solute
transport with retardation:
Rm
BM
Bt¼ Dx
B2M
Bx2� ux
BM
Bxð3Þ
The microorganisms are subject to the same boundary conditions as a conservative
tracer:
� Dx
BM
Bxþ uxM ¼ uxMi x ¼ 0; t ð4aÞ
BM
Br¼ 0 x ¼ L; t ð4bÞ
where Mi is the initial concentrations of microorganisms being injected.
In addition to the effects of advection and dispersion, bioavailable oxygen concen-
trations, Om, are subject to decrease by microbial consumption following Monod kinetics
and rate-limited mass transfer. (Bedient et al., 1999):
BOm
Bt¼ Dx
B2Om
Bx2� ux
BOm
Bx�MVm;e
Om
KO;e þ Om
�� b
BOim
Bt
�ð5Þ
where Vm,e is the effective maximum utilization rate and KO,e is the effective half
saturation constant accounting for all of the cellular oxygen processes; Oim is the
P.M. Oates et al. / Journal of Contaminant Hydrology 77 (2005) 233–245240
concentration in the immobile domain; and b is the ratio of immobile to mobile mass.
Incorporating rate-limited oxygen mass transfer into the model was necessary to describe
the observed bioluminescence. Given that the cryolite was solid and homogenous, the
immobile oxygen likely originated from small air bubbles that were entrapped behind the
wetting front during saturation of the cryolite (Black and Lee, 1973). Therefore, we can
define b as:
b ¼ himKH
hmð6Þ
where him is the immobile air-bubble porosity; hm is the mobile porosity; and KH is the
dimensionless Henry’s Law constant for oxygen (Cg/Caq). The mobile and immobile
porosity values represent an average over the experiment as mass transfer might slightly
increase the mobile porosity and decrease the immobile porosity. Oxygen mass transfer
between the mobile pore space and the immobile bubble regions is approximated as linear
non-equilibrium mass transfer:
BOim
Bt¼ a Om � Oim
KH
��ð7Þ
where a is a rate coefficient. Oxygen was modeled with the same boundary conditions as
the conservative tracer, except that the flux concentration was assumed to undergo first-
order degradation in the tube as it flowed with the bacteria from the carboy to the tank
(refer to Flow chamber section):
� Dx
BO
Bxþ uxO ¼ uxOt;fl &
dOt;B
dt¼ � jOOi;B x ¼ 0; t ð8aÞ
BO
Bx¼ 0 x ¼ L; t ð8bÞ
where Ot,B is the time dependent oxygen concentration at the boundary; Oi,B is the initial
oxygen concentration at the boundary; and jO is a first-order rate constant. A background
oxygen concentration, Om,b, was initialized throughout the domain and the initial
immobile oxygen, Oim,i/KH, was in equilibrium with the mobile concentration.
Since salicylate was spatially and temporally constant, oxygen was the limiting reagent.
Oxygen has one-to-one stoichiometry with a photon of produced light. Thus, it was
assumed that when the microorganisms use oxygen for metabolism in the presence of
salicylate, a portion of the oxygen is consumed for cellular maintenance, while the rest is
used for bioluminescence. Hence, the amount of light produced is directly proportional to
the amount of oxygen consumed:
Lt ¼ LOBOm
Btð9Þ
where Lt is the light produced, and LO is the relative amount of light produced per oxygen
consumed. Eqs. (3) (5) (6) (7) (8) and (9) are coupled and they were solved numerically
with a central in space Crank–Nicholson finite difference scheme. Matlab’s lsqnonlin.m
function was again used to fit the following model parameters to the observed
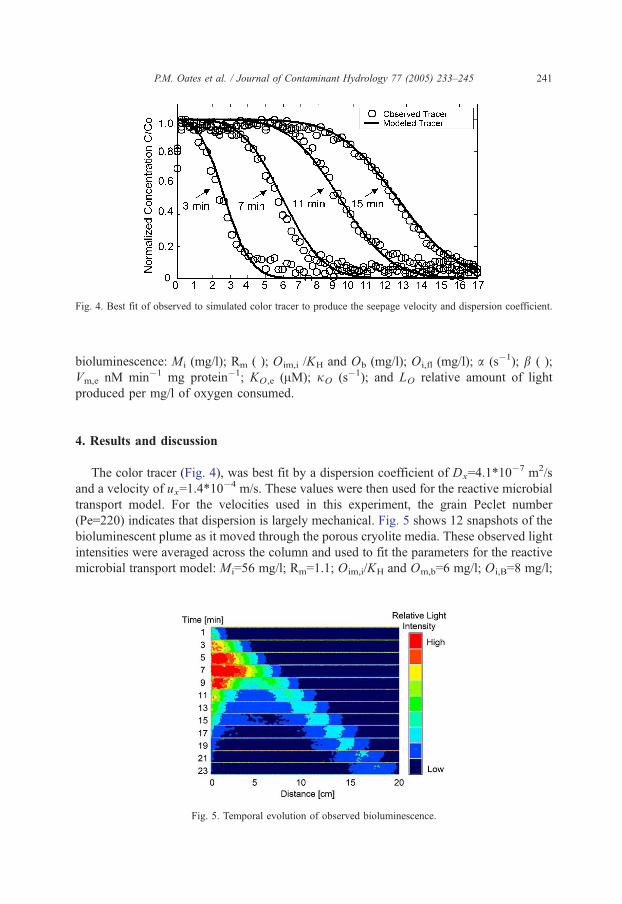
Fig. 4. Best fit of observed to simulated color tracer to produce the seepage velocity and dispersion coefficient.
P.M. Oates et al. / Journal of Contaminant Hydrology 77 (2005) 233–245 241
bioluminescence: Mi (mg/l); Rm ( ); Oim,i /KH and Ob (mg/l); Oi,fl (mg/l); a (s�1); b ( );
Vm,e nM min�1 mg protein�1; KO,e (AM); jO (s�1); and LO relative amount of light
produced per mg/l of oxygen consumed.
4. Results and discussion
The color tracer (Fig. 4), was best fit by a dispersion coefficient of Dx=4.1*10�7 m2/s
and a velocity of ux=1.4*10�4 m/s. These values were then used for the reactive microbial
transport model. For the velocities used in this experiment, the grain Peclet number
(Pe=220) indicates that dispersion is largely mechanical. Fig. 5 shows 12 snapshots of the
bioluminescent plume as it moved through the porous cryolite media. These observed light
intensities were averaged across the column and used to fit the parameters for the reactive
microbial transport model: Mi=56 mg/l; Rm=1.1; Oim,i/KH and Om,b=6 mg/l; Oi,B=8 mg/l;
Fig. 5. Temporal evolution of observed bioluminescence.
P.M. Oates et al. / Journal of Contaminant Hydrology 77 (2005) 233–245242
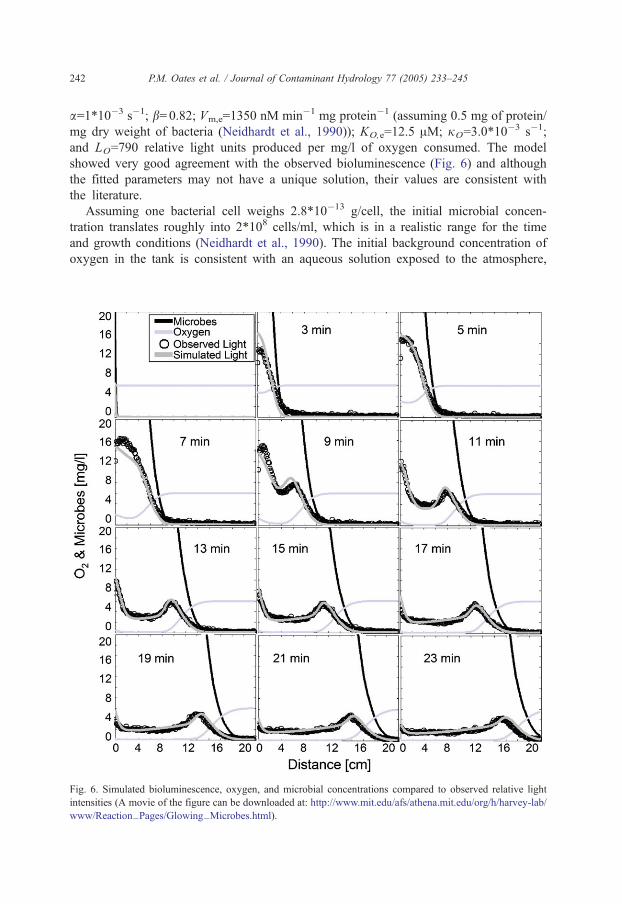
a=1*10�3 s�1; b=0.82; Vm,e=1350 nM min�1 mg protein�1 (assuming 0.5 mg of protein/
mg dry weight of bacteria (Neidhardt et al., 1990)); KO,e=12.5 AM; jO=3.0*10�3 s�1;
and LO=790 relative light units produced per mg/l of oxygen consumed. The model
showed very good agreement with the observed bioluminescence (Fig. 6) and although
the fitted parameters may not have a unique solution, their values are consistent with
the literature.
Assuming one bacterial cell weighs 2.8*10�13 g/cell, the initial microbial concen-
tration translates roughly into 2*108 cells/ml, which is in a realistic range for the time
and growth conditions (Neidhardt et al., 1990). The initial background concentration of
oxygen in the tank is consistent with an aqueous solution exposed to the atmosphere,
Fig. 6. Simulated bioluminescence, oxygen, and microbial concentrations compared to observed relative light
intensities (A movie of the figure can be downloaded at: http://www.mit.edu/afs/athena.mit.edu/org/h/harvey-lab/
www/Reaction_Pages/Glowing_Microbes.html).
P.M. Oates et al. / Journal of Contaminant Hydrology 77 (2005) 233–245 243
while the initial concentration of the oxygen in the tube being injected into the tank was
2 mg/l higher due to the aeration in the Carboy. Approximating the effective diffusivity
of oxygen in water to be 2*10�6 cm2/s, a yields a characteristic length of diffusion to be
0.045 cm or about half the size of a cryolite grain. Black and Lee (1973) demonstrate
that one cannot remove more than 97% of the entrapped air bubbles from a dry porous
medium without using back pressure or vacuum saturating techniques. Taking a
dimensionless Henry’s Law constant for oxygen to be 26 (Hemond and Fechner, 2000)
and the fitted value of b to be 0.82, we calculate the bubble volume to mobile pore
volume is 3.2%. Good agreement between our estimated volume of entrapped air and
Black and Lee’s observations suggests that the immobile oxygen is present in entrapped
air bubbles. Kukor and Olsen (1996) reported P. fluorescens CFS215 Monod parameters
values for oxygen utilization during catechol degradation of Vm=400 nM min�1 mg
protein�1 and Km=0.9 AM. While these values are not directly comparable to light
production, it shows our fitted Monod values are within a physiological range.
Unfortunately, the flow and transport of oxygen and bacteria between the carboy and the
flow tank was not well characterized making inferences on jO difficult. Note that both
LO and the luminescent data are given in relative units.
With adequate amounts of bacteria, salicylate, and substrate, the limiting factor of light
emissions is bioavailable oxygen. Maximum bioluminescence is observed when the
bacteria are first introduced into the system and oxygen levels are high. As time goes on,
oxygen is depleted in the middle of the plume and bioluminescence decreases (see Fig. 5).
The front of the plume continues to bioluminesce as the bacteria mix with new oxygen in
the tank while the boundary experiences a decaying flux of oxygen to sustain some
glowing. When the bacteria deplete oxygen in the middle of the plume, they create an
oxygen gradient between the mobile and immobile zone producing rate-limited mass
transfer. This diffusion of oxygen into the mobile domain makes it bioavailable and
sustains residual glowing behind the plume front.
The clearly observed pattern of bioluminescence that evolved during the experiment,
demonstrates that this visualization method combined with numerical modeling is
potentially a powerful approach for quantifying reactive microbial transport in saturated
porous media. That the numerical model closely matched the observed bioluminescence,
and that the fitted parameters agreed well with values reported in the literature, together
suggest that the measured transient spatial patterns of bioluminescence can provide
valuable information about the underlying physical, biochemical and microbial processes.
By combining this tool with other methods (e.g. visualization of in situ oxygen
concentrations, using an oxygen sensitive fluorescent indicator as described by Huang
et al., 2003 and controlled oxygen kinetics experiments with P. fluorescens 5RL to
determine Vm,e, and KO,e for light production as described by Kukor and Olsen (1996)) the
methods described here could be extended to separate oxygen use specifically for
bioluminescence from use for other cellular activities. With such additional steps, this
method could provide insight into many areas of reactive microbial transport such as:
sorption and biofilm growth at lower flow rates as P. fluorescens are biofilm-forming
organisms, effective delivery of oxygen and mixing of microbes with contaminants to
maximize biodegradation, and microbial transport and colonization and how this
colonization effects continued transport, dispersion, and mixing of solutes and microbes.
P.M. Oates et al. / Journal of Contaminant Hydrology 77 (2005) 233–245244
References
Bedient, P.B., Rifai, H.S., Newell, C.J., 1999. Ground Water Contamination: Transport and Remediation. Second
edition. PTR Prentice-Hall, Inc., Englewood Cliffs, NJ.
Black, D.K., Lee, K.L., 1973. Saturating laboratory samples by back pressure. J. Soil Mech. Found. Eng.
ASCE 99 (1), 75–93.
Caldwell, D.E., 1985. New developments in computer-enhanced microscopy. J. Microbiol. Methods 4, 117–125.
Camper, A.K., Hayes, J.T., Sturman, P.J., Jones, W.L., Cunningham, A.B., 1993. Effects of motility and
adsorption rate coefficient on transport of bacteria through saturated porous media. Appl. Environ. Microbiol.
59, 3455–3462.
Conrad, S.H., Wilson, J.L., Mason, W.R., Peplinski, W.J., 1992. Visualization of residual organic liquid trapped in
aquifers. Water Resour. Res. 28, 467–478.
Fontes, D.E., Mills, A.L., Hornberger, G.M., Herman, J.S., 1991. Physical and chemical factors influencing
transport of microorganisms though porous media. Appl. Environ. Microbiol. 57, 2473–2481.
Gramling, C., Meigs, L., Harvey, C.F., 2002. Reactive transport in porous media: a comparison of model
prediction with laboratory visualization. Environ. Sci. Technol. 23, 2508–2514.
Harvey, R.W., George, L.H., Smith, R.L., LeBlanc, R.D., 1989. Transport of microspheres and indigenous
bacteria through a sandy aquifer: results of natural and forced gradient tracer experiments. Environ. Sci.
Technol. 23, 51–56.
Hemond, H.F., Fechner, E.J., 2000. Chemical Fate and Transport in the Environment. Academic Press, USA.
Huang, W.E., Oswald, S.E., Lerner, D.N., Smith, C.C., Zheng, C., 2003. Dissolved oxygen imaging in a porous
medium to investigate biodegradation in a plume with limited electron acceptor supply. Environ. Sci. Technol.
37, 1905–1911.
Kjelleberg, S., Humphrey, B.A., Marshall, K.C., 1982. The effect of interfaces on small, starved marine bacteria.
Appl. Environ. Microbiol. 43, 1166–1172.
Kukor, J.J., Olsen, R.H., 1996. Catechol 2,3—Dioxygenases Functional in Oxygen-Limited (Hpoxic) Environ-
ments. Appl. Environ. Microbiol. 62 (5), 1728–1740.
Lee, M.D., Thomas, J.M., Borden, R.C., Bedient, P.B., Wilson, J.T., Ward, C.H., 1988. Biorestoration of aquifers
contaminated with organic compounds. Crit. Rev. Environ. Control 18, 28–89.
Maier, R.M., Pepper, I.L., Gerba, C.P., 2000. Environmental Microbiology. Academic Press, Canada.
Matrubutham, U., Thonnard, J.E., Sayler, G.S., 1997. Bioluminescence induction response and survival of the
bioreporter bacterium Pseudomonas fluorescens HK44 in nutrient-deprived conditions. Appl. Microbiol.
Biotechnol. 47, 604–609.
Neidhardt, F.C., Ingraham, J., Schaechter, M., 1990. Physiology of the Bacterial Cell: A Molecular Approach.
Sinauer Associates, Sunderland, MA.
Peden, J.M., Hussain, M., 1985. Visual studies in reservoir engineering: the development of a novel technique for
the preparation of real pore space structure glass micromodels and their application in displacement
experiments under simulated reservoir conditions. Third European Meeting on Improved Oil Recovery,
Rome, 16–18 April 1985, pp. 37–48.
Power, K., Marshall, K.C., 1988. Cellular growth and reproduction of marine bacteria on surface-bound
substrates. Biofouling 1, 163–174.
Shaw, J.C., Bramhill, B., Wardlaw, N.C., Costerton, J.W., 1985. Bacterial fouling in a model core system. Appl.
Environ. Microbiol. 49, 693–701.
Smith, M.S., Thomas, G.W., White, R.E., Ritonga, D., 1985. Transport of Escherichia coli through intact and
disturbed columns. J. Environ. Qual. 14, 87–91.
Tan, Y., Gannon, J.T., Bavaye, P., Alexander, M., 1994. Transport of bacteria in an aquifer sand: experiments and
model simulations. Water Resour. Res. 30, 3243–3252.
Tidwell, V.C., Glass, R.J., 1994. Water Resour. Res. 30 (11), 2873–2882.
Thomas, J.M., Ward, C.H., 1989. In situ biorestoration of organic contaminants in the subsurface. Environ. Sci.
Technol. 23, 76–766.
Uesugi, S.L., Yarwood, R.R., Selker, J.S., Bottomley, P.J., 2001. A model that uses the induction phase of lux
gene-dependent bioluminescence in Pseudomonas fluorescens HK44 to quantify cell density in translucent
porous media. J. Microb. Methods 47, 315–322.

P.M. Oates et al. / Journal of Contaminant Hydrology 77 (2005) 233–245 245
Wollum, A.G., Cassel, D.K., 1978. Transport of microorganisms in sand columns. Soil Sci. Soc. Am. J. 42,
72–76.
Yarwood, R.R., Rockhoold, M.L., Niemet, M.R., Selker, J.S., Bottomley, P.J., 2002. Noninvasive quantitative
measurement of bacterial growth in porous media under unsaturated-flow conditions. Appl. Environ.
Microbiol. 68 (7), 3597–3605.
Yates, M.V., Yates, S.R., 1988. Modeling microbial fate in the subsurface environment. CRC Crit. Rev. Environ.
Control 17, 307–343.
Zinn, B., Meigs, L.C., Harvey, C.F., Haggerty, R., Peplinski, W.J., Freiherr von Schwerin, C., 2004. Experimental
visualization of solute transport and mass transfer processes in heterogeneous conductivity fields. Environ.
Sci. Technol. 38 (14), 3916–3926.
Related Documents


