International Journal of Scientific and Research Publications ISSN 2250-3153 www.ijsrp.org January 2020 Print Version International Journal of Scientific and Research Publications Print Version, Volume 10, Issue 1 January 2020 Edition ISSN 2250-3153 IJSRP Inc. www.ijsrp.org DOI: 10.29322/ijsrp

Welcome message from author
This document is posted to help you gain knowledge. Please leave a comment to let me know what you think about it! Share it to your friends and learn new things together.
Transcript

International Journal of Scientific and Research Publications
ISSN 2250-3153
www.ijsrp.org
January 2020
Print Version
International Journal of Scientific and Research Publications
Print Version, Volume 10, Issue 1
January 2020 Edition ISSN 2250-3153
IJSRP Inc. www.ijsrp.org DOI: 10.29322/ijsrp

International Journal of Scientific and Research Publications
ISSN 2250-3153
www.ijsrp.org
International Journal of Scientific and Research Publications
GENERAL INFORMAION:
IJSRP, International Journal of Scientific and Research Publications publish monthly journal under ISSN
2250-3153.
ONLINE VERSION
http://www.ijsrp.org/e-journal.php
PRINT VERSION (E-book)
http://www.ijsrp.org/print-journal.php
All the respective authors are the sole owner and responsible of published research and research papers
are published after full consent of respective author or co-author(s).
For any discussion on research subject or research matter, the reader should directly contact to
undersigned authors.
COPYRIGHT
Copyright©2018 IJSRP.ORG
All Rights Reserved. No part of this publication may be reproduced, stored in a retrieval system, or
transmitted, in any form or by any means, electronic, mechanical, photocopying, recording, scanning or
otherwise, except as described below, without the permission in writing of the Publisher.
Copying of articles is not permitted except for personal and mentioned use, to the extent permitted by
national copyright law, or under the terms of a license issued by the national Reproduction Rights
Organization. University Library, Indexing partners and researchers are allowed to use, store published
content under open access policy.
All the published research can be referenced by readers/scholars/researchers in their further research with
proper citation given to original authors.
DISCLAIMER
Statements and opinions expressed in the published papers are those of the individual contributors and not
the statements and opinion of IJSRP. We assumes no responsibility or liability for any damage or injury
to persons or property arising out of the use of any materials, instructions, methods or ideas contained
herein. We expressly disclaim any implied warranties of merchantability or fitness for a particular
purpose. If expert assistance is required, the services of a competent professional person should be sought.
Contact Information:
Editor: [email protected]
Website: http://www.ijsrp.org
International Journal of Scientific and Research Publications
ISSN 2250-3153
www.ijsrp.org
Table of Contents Effect of Nickel on Different Physiological Parameters of Raphanus Sativus........................................................1
Hamza Rafeeq, Muhammad Awais Arshad, Syeda Fasiha Amjad, Muhammad Haseeb Ullah, Hafiz
Muhammad Imran, Rija Khalid,Maria Yaseen, Hadia Ajmal.................................................................................1
Exploring and Analyzing Students’ Algebraic Misconceptions and Errors............................................................7
Mukunda Prakash Kshetree.....................................................................................................................................7
Uses, Advantages and Opportunities of Kanban methods in Mechanical Engineering and Product
Manufacturing........................................................................................................................................................18
Shivangi Agarwal, Ashish Agrawal.......................................................................................................................18
Factors Influence on Usage of Information Systems in Small and Medium Sized Enterprises in
Ambagamuwa Secretariat Division in Sri Lanka...................................................................................................22
Munasinghe PG, Chandradasa KGSN and Wimalasiri..........................................................................................22
The Relationship Between Homocysteine Levels With The Degree of Severity In Patients With Acute
Phase Ischemic Stroke At Haji Adam Malik General Hospital Medan.................................................................27
Rosa Zorayatamin Damanik, Ratna Akbari Ganie, Iskandar Nasution.................................................................27
Cloud Computing Adoption by Public Hospitals in Kenya: A Technological, Organisational and
Behavioural Perspective.........................................................................................................................................33
Billy Ogwel, Gabriel Otieno, George Odhiambo-Otieno......................................................................................33
Determination of Normal Thyroid Gland Volume On Ultrasound In Normal Adults In Jos, North Central
Nigeria....................................................................................................................................................................44
AJ. Salaam, S. M. Danjem, A. A. Salaam, H. A. Angba and P. O. Ibinaiye.........................................................44
The geology and petrography of the ultramafic rocks at north-northeastern margin of Kandahar city,
Afghanistan............................................................................................................................................................55
Attiqullah Ayaz, Shirsha Rashad...........................................................................................................................55
Comparative analysis of Percutaneous Needle Aspiration of Breast abscess with antibiotic cover versus
Traditional Surgical Incision and Drainage...........................................................................................................62
Dr. Prashant Kumar, Dr. Bhuvan...........................................................................................................................62
Comparative study of early vs late enteral feeding following intestinal anastomosis...........................................67
Dr. Ikrar Ali, Dr. Bhuvan.......................................................................................................................................67
Tackling Cancer using the method of CRISPR.....................................................................................................71
Ahmed Hamed Radwan Rehan..............................................................................................................................71
The Role Of Managerial Performance In Creating Corporate Entrepreneurship..................................................75
Edy Susanto, Budiyanto, Suhermin.......................................................................................................................75
Validity, Effectiveness, and Practicality of Learning Media Using Advance Organizer to Increase Critical
Thinking on Colloid Material of Senior High School...........................................................................................87
A Pascalia Lalian, L Yuanita, U Azizah................................................................................................................87
International Journal of Scientific and Research Publications
ISSN 2250-3153
www.ijsrp.org
Factors Affecting for E-Waste Recycling in Sri Lanka.......................................................................................101
K. S. H. Sarathchandra, H. A. H. Hettiarachchib................................................................................................101
Assessment of Heavy Metals Concentration in Agriculture Soil of Kolfe Area, Addis Ababa, Ethiopia...........108
Nega Fikru Alemu, Yang Changming, Yang Yang.............................................................................................108
Comparing of job satisfaction due to coping of stress in government and private sector...................................115
Shivani Singhvi, Dr. Shikha Sharma...................................................................................................................115
Development Of Analytical Method For The Simultaneous Estimation Of Diclofenac Sodium And
Pantoprazole In Pharmaceutical Formulation By RP-HPLC...............................................................................124
S.S.Ajmire, L.R.Gandhi, Anil Dewani, Ravi Bakal, Dr. A.V. Chandewar.........................................................124
Modelling the Universe of Data (DataVerse)......................................................................................................129
Ashutosh Gupta....................................................................................................................................................129
Diversity V Multiculturalism Advantages And Disadvantages Of Workplace Diversity...................................135
Ositadima Emeka Alozie.....................................................................................................................................135
Real Time Eye Gaze Detection Using Machine Learning Techniques...............................................................142
Achudan TS, Gobinath N.....................................................................................................................................142
Translation and Tribal Areas and the Valley: Meitei language in the Socio-Cultural Context...........................148
Thokchom Premlata Devi....................................................................................................................................148
A Study about the cognomens that were adopted by the kings during Anuradhapura Era.................................153
Professor Anurin Indika Diwakara......................................................................................................................153
Quality of Life of Seborrheic Keratosis Patients................................................................................................158
Imam Budi Putra, Nelva Karmila Jusuf, Evita Lourdes Pinem..........................................................................158
Comparison The Events Of Postoperative Sore Throat In Patients Undergoing Surgery With General
Anesthesia Endotracheal Tube After The Administration Of Dexamethason And NACL 0.9% At Haji
Adam Malik Ho...................................................................................................................................................162
Wicak Kunto Wibowo, Achsanuddin Hanafie, Muhammad Arshad, Akhyar Hamonangan Nasution...............162
A Study of Attitude of Geography Teachers towards Geographic Education in Arunachal Pradesh.................166
Tangkheso Tamai, Prof. T. Lhungdim.................................................................................................................166
Determinants of Undergraduate Students’ Academic Performance: The Case of University of Sri
Jayewardenepura, Sri Lanka................................................................................................................................171
A.J.M. Priyadarshana, H.G.M.D. Kumari...........................................................................................................171
Knowledge, Attitude and Practice Towards Malnutrition among Mothers of Sunsari, Nepal............................178
Srijat Dahal, Mausam Shrestha, Sanjeeb Shah, Babita Sharma, Mandip Pokharel, Prakritee Guragai,
Bibek Shah...........................................................................................................................................................178
International Journal of Scientific and Research Publications
ISSN 2250-3153
www.ijsrp.org
The Ability to Know the Concept of Numbering at Children Group A through Dakon’s Game
Modification.........................................................................................................................................................183
Nia Aminatus Sholihah, Mustaji, Miftakhul Jannah............................................................................................183
Development and implementation of virtual academy for enhancement of distance learning............................188
N.R.Meddage , V.G.S. Pradeepika......................................................................................................................188
To Evaluate the Functional Outcome of Close Reduction and Percutaneous Fixation of Fracture Proximal
Humerus By K Wires...........................................................................................................................................196
Dr.Satish Agarwal, Dr.Amit Sehgal....................................................................................................................196
How Quality of Life Affects Emotional Intelligence and Marital Adjustment in Menopausal
Women.................................................................................................................................................................201
Gayatri Sahu, Dr. Shikha Sharma........................................................................................................................201
The Process of Representation of Junior High School Students’ in Solving Integers Word Problems...............209
Annisah, Masriyah, Rooselyna Ekawati..............................................................................................................209
Differences of Superoxide Dismutase (SOD) Enzyme Levels Based on the Severity of Androgenetic
Alopecia in Men...................................................................................................................................................219
Erty W.L Toruan, Rointan Simanungkalit, Ariyati Yosi.....................................................................................219
Assessment of public awareness on e-waste management: A case study of Kigali............................................224
Nkusi REVOCATTE, Haochen ZHU, Uwabimfura JACKSON, Shyaka CHRISTOTHE.................................224
Phytogeographic Distribution of Sorghum in Nigeria.........................................................................................232
Arinze JP. Chukwu and Ikechukwu O. Agbagwa................................................................................................232
Strategic and tactical level decision making styles and their impact on the company performance: A
study in private sector apparel manufacturing firms in Sri Lanka.......................................................................237
Nadeeja Dodamgoda, Furkan Ziyard...................................................................................................................237
Profile of Condyloma Acuminatum Patients with Syphilis and HIV/AIDS in Haji Adam Malik General
Hospital January 2013 - December 2018.............................................................................................................259
Benjamin Ricardo R. Lbn Tobing, Richard Hutapea, Kristina Nadeak...............................................................259
The Socialization Effect Of The Clean River By The West Jakarta Sanitary Office On Healthy Life
Consciousness In Kedaung, Kali Angke Communities Period (2015-2016).......................................................263
A Rahman HI.......................................................................................................................................................263
Prevalence of Cholelithiasis in Sickle Cell Hemoglobinopathy, Central Indian Scenario..................................268
J R Tijare, R K Pohekar, A A Dani, A V Shrikhande..........................................................................................268
Role of Project Managers in the Stakeholder Management.................................................................................273
Dr. Cross Ogohi Daniel, Victor Inim...................................................................................................................273
Comparative performance analysis of machine learning models for breast cancer diagnosis............................279
Ghufran Ullah, HaiYan........................................................................................................................................279
Green synthesis and characterization of Ceria nanoparticles using Ricinus communis leaf extract……….......286
International Journal of Scientific and Research Publications
ISSN 2250-3153
www.ijsrp.org
J.Suvetha Rani......................................................................................................................................................286
Influence Of Entrepreneurial Development Training Programme On Psycho-Social And Economic
Stability Of Widows In South Senatorial District Of Ondo State, Nigeria.........................................................292
Erinsakin, Martins Ojo (Ph.D), Agun, Paulinah Olusola, Mr. Akinbebije John.................................................292
Impact of Nutritional Health Services over the Nutritional Status of Under five Children in the City
of Barishal, Bangladesh: A Community Based Survey.......................................................................................298
Md. Hasib, Md. Nazmul Hassan, Mehedi Hasan.................................................................................................298
“Learning Steps” An Innovative Teaching Technique Implementing STEM-AI Protocols...............................303
Preetam Kumar Panda, Prateek Kumar Singh, Capt. Shweta Singh...................................................................303
The Effect of Multisensory Methods of Early Childhood’s Fine Motor Development.......................................307
Kurnia Oktafianto, Siti Masitoh, Hendratno........................................................................................................307
Public Sector Collaboration Management In Coremap Implementation In Kabupaten Buton, Southeast
Sulawesi...............................................................................................................................................................310
Asmiddin, Zainul Abidin and Abdul Madjid.......................................................................................................310
The Relationship between Serum Zinc Level and Severity of Melasma.............................................................317
Puspita Sari Rambe, Rointan Simanungkalit, Ariyati Yosi.................................................................................317
Correlation between Serum 25-Hydroxyvitamin D Level with Acne Vulgaris Severity....................................322
Fitri Puspita, Rointan Simanungkalit, AriyatiYosi..............................................................................................322
Management of Recurrent Periapical Abscess with Platelet Rich Fibrin............................................................326
Maj (Dr) Deepak Sharma, Surg Lt Cdr (Dr) Muneesh Joshi, Lt Col (Dr) Manab Kosala, Col (Dr) T
Prasanth................................................................................................................................................................326
Investigating Gender Disparity between Female and Male Heads of Department (Infant) in Primary
Schools in Botswana: The Perspectives of Primary Deputy School Heads.........................................................333
Grace T. Seetso, Kefilwe J. P. Batsalelwang, Philip Bulawa, Shirley Kekana...................................................333
An Unconventional Framework for Smile Detection using Eye States.....................................................................
C.L.I. Fonseka, L.S Erandika, S.Sotheeswaran.........................................................................................................
The Description of Wood’s Lamp and Dermoscopy on Patients suspected of Melasma in Adam Malik
Hospital Medan....................................................................................................................................................344
Maristella Rosalina, Rointan Simanungkalit, Lukmanul Hakim Nasution..........................................................344
Effectiveness of Using Discovery Learning Model Assisted Tracker on Improvement of Physics
Learning Outcomes Observed From Students’ Initial Knowledge......................................................................349
Nurfadilah, Dwi Sulisworo, Guntur Maruto, Suritno Fayanto............................................................................349
Utilization of Health Facilities for Under-five Children with Diarrhea in Indonesia: Data Analysis of the
IDHS 2017...........................................................................................................................................................357
Mussar Hadist, Artha Prabawa............................................................................................................................357
International Journal of Scientific and Research Publications
ISSN 2250-3153
www.ijsrp.org
Accuracy Between Dermoscopy Overview And Moisture Checker In Assessing Skin Moisture Level On
Pediatric Nephrotic Syndrome Patients...............................................................................................................366
Ramayanti boru Simandjuntak, Sri Wahyuni Purnama, Irma Damayanti Roesyanto-Mahadi............................366
Determine the Type of Diatoms in the Batangtoru River and Parsariran River in Tapanuli Selatan
Regency by means of Acid Destruction...............................................................................................................372
Amalan Surya Hutabarat, Asan Petrus, Nasib Mangoloi Situmorang.................................................................372
Determining The Types Of Diatoms Padang River And Bahilang River In Tebing Tinggi City.......................376
Edwin Parlindungan Lubis, Asan Petrus, Abdul Gafar Parinduri.......................................................................376
Knowledge And Practice Regarding Oral Hygiene Among Primary School Children Of Selected Schools,
Dhangadhi, Kailali...............................................................................................................................................381
Chandani Malla, Anita Mehta..............................................................................................................................381
The Impact of Online Consumer Reviews Dimension on Online Purchase Intentions In Tokopedia................387
Andreanus Kevin, Zakaria Wahab, Muchsin Saggaff Shihab.............................................................................387
Sustainability in Nepalese Tourism Industry.......................................................................................................394
Niranjan Ojha (Ph.D.)..........................................................................................................................................394
Correlational Study Of Mathematics And Physics Students’ Performance For 2015-2017 Mock
Examinations: A Case Study Of Senior Secondary Two (Ss2) Students In Ibesikpo Asutan Local
Government Area Of Ak......................................................................................................................................399
Ado, I. B., Edet, A. O...........................................................................................................................................399
Performance Evaluation of Solar Bubble Dryer..................................................................................................410
Anand Mishra, Sanjeet Kumar Jha, Ganga Ram Bhandari, Shailendra Khatri, Shreemat Shrestha, and
Pravin Ojha..........................................................................................................................................................410
Effects of Milking Methods on Milk Yield, Milk Flow Rate, and Milk Composition in Cow...........................416
Anand Mishra, Shailendra Khatri, Sanjeet Kumar Jha and Shamshad Ansari....................................................416
Study on Zero Energy Cool Chamber (ZECC) for Storage of Mango................................................................421
Anand Mishra, Sanjeet Kumar Jha, Kriti Ghimire and Ujjwol Subedi...............................................................421
Study on Zero Energy Cool Chamber (ZECC) for Storage of Vegetables…......................................................427
Anand Mishra, Sanjeet Kumar Jha, and Pravin Ojha..........................................................................................427
Performance Evaluation of Onion Grader...........................................................................................................434
Anand Mishra, Sanjeet Kumar Jha, and Shreemat Shrestha...............................................................................434
Develompemnt Electronic Four Tier Diagnostic Test Based Multirepresentation Using Model 4-D For
Measuring the Level of Conception of Prospective Physics Teacher Candidates on Force Concepts................439
Wisnu Yudha Prawira, Suparwoto, Yudhiakto Pramudya, Ishafit......................................................................439
Controlling Water Pollution In Batumerah Village Ambon City........................................................................449
FAUZIA RAHAWARIN.....................................................................................................................................449
Modern Reflection In Shakespeare’s Plays.........................................................................................................456
International Journal of Scientific and Research Publications
ISSN 2250-3153
www.ijsrp.org
Md. Abdul Qader.................................................................................................................................................456
Behavior of Mothers for Malaria in Children Under Five Years of Age in Fobur, JOS East LGA, Plateau
State......................................................................................................................................................................462
Oahimire, Oise Joan, Pofung, Zachariah Freejob................................................................................................462
Comparative Scrotal Ultrasound Findings in Fertile and Infertile Males in Jos, North Central Nigeria............474
Igoh E.O, Ofoha C.G, Atsukwei D,Ekwere E.O, Salaam A.J, Gabkwet E.A, Taiwo Y.F, Danjem S.M,
Igoh C.S...............................................................................................................................................................474
Efficacy of Audio-Visual Teaching Materials in EFL Classes: The Case of Two Elementary Schools in
Addis Ababa, Ethiopia.........................................................................................................................................481
Fikremariam Yirgu Wondimtegegn.....................................................................................................................481
Communal Riots and Plight of Women...............................................................................................................489
Jyoti Tiwari..........................................................................................................................................................489
Quality Management in Theory...........................................................................................................................492
Khalifa Isa............................................................................................................................................................492
Rules Of Engagement: A Case Of Employees In Jubilee Insurance...................................................................496
Dr. Medina Halako Twalib..................................................................................................................................496
Media Framing of Human Papillomavirus (HPV) Health Issues and HPV Vaccine-Related Sentiment
in English Language News Media in India (2015-2018).....................................................................................510
Prabhjot Sohal......................................................................................................................................................510
Status of Education for Sustainable Development in teacher training institutions in Botswana.........................519
Spar Mathews, Reginald Oats, Fana Moffat Kgotlaetsile....................................................................................519
Effectiveness of Integrated Watershed Management Intervention for Sustainable Development in Meskan
District, Southern Ethiopia...................................................................................................................................528
Wunde Sebsibe Teka, Haochen Zhu, M. Mehari, N. Muhammedamin, B.Yonas...............................................528
Assessing Barriers To Household Waste Recycling: A Case Study Of Coventry University Postgraduate
Students................................................................................................................................................................542
Jatau Sarah and Binbol N.L.................................................................................................................................542
Association of Programmed Death Ligand1(PDL1)Immunoexpression with Histopathology Grade of
Rhabdomyosarcoma At The Unit Anatomical Pathology of Adam Malik Hospital In 2016-2018.....................550
Fitrikalinda, Delyuzar, Jessy Chrestella...............................................................................................................550
The Relationship Between the Application of Neuromarketing and Competitiveness.......................................554
Dr. Fidaa O. D. Safi, Dr. Marwan S. Alagha......................................................................................................554
Evaluation of knowledge regarding adverse drug reaction and its reporting among dentists in GDC,
Hyderabad - A KAP study...................................................................................................................................564
Sneha Menga........................................................................................................................................................564
Differences of Skin Normal Microbiota in Adult Men and Elderly....................................................................569
International Journal of Scientific and Research Publications
ISSN 2250-3153
www.ijsrp.org
Silvia Christie, Syahril R Lubis, Ariyati Yosi, Dian D Wahyuni........................................................................569
The competitiveness of tourism enterprises.........................................................................................................574
Nguyen Van Tan, Luu Thi Thanh Mai................................................................................................................574
The Effect of Advertising and Personal Selling of Brand Awareness in Vocational High School YPT
Palembang............................................................................................................................................................577
Fitri Adhisti, Zakaria Wahab, Isnurhadi..............................................................................................................577
Comparison of Richmond Agitation Sedation Scale (RASS) And Ramsay Sedation Scale (RSS) With
Bispectral Index to Evaluate Depth of Sedation in Patients at The Intensive Care Unit in Adam Malik
General.................................................................................................................................................................585
Riza Stya Yulianda, Akhyar Hamonangan Nasution, Fadli Armi Lubis.............................................................585
Professional Identity Construction of Three Teachers Based in Community of Practice in a University in
Vietnam................................................................................................................................................................588
Duong Thanh Hao, Duong Thi Hong An.............................................................................................................588
Profile of Implanon Acceptors at The Rivers State University Teaching Hospital, Southern Nigeria: Ten
Years Review.......................................................................................................................................................594
Nonye-Enyidah EI, Akpo CS...............................................................................................................................594
The Effect of FlexiTime on Employee Performance in Financial Institutions in Kericho Town........................598
Joseph Mwendwa Musinga, Dr. Hellen W. Sang, Dr. Andrew Kipkosgei..........................................................598
Management of Endo-Perio Lesion: A Case Report............................................................................................603
Surg Lt Cdr (Dr) Muneesh Joshi, Lt Col (Dr) Manab Kosala, Maj (Dr) Deepak Sharma, Col (Dr) T Prasanth.603
The Effects of Khat Consumption on Family Relationships in Kamukunji Constituency, Nairobi County,
Kenya...................................................................................................................................................................615
Rashid Ali Omar, Kennedy K. Mutundu, Felix N. Kioli, Lucy W. Maina.........................................................615
Toxicological and Histological Studies of the Ethyl Acetate, Aqueous and N-Butanol Fractions of the
Leaf of Combretum Molle (R.Br. Ex. G. Don) to Wistar Rats............................................................................620
D. Kulawe, Z. A. Abubakar and J. S. Hena.........................................................................................................620
Mobility of charge carriers in the novel green organic semiconductor, Iodine doped Cis 1,4 polyisoprene
(Natural Rubber) using SCLC method................................................................................................................628
Jayan Manuvel, P. Predeep..................................................................................................................................628
Electronic Cargo Tracking System and Its Effects On Revenue Realization in East Africa Member
Countries..............................................................................................................................................................633
Felix Kilonzi, Cyrus Kamau Kanai......................................................................................................................633
Existence Of Indigenous Legal Communities On Land In Procurement Of Land For Public Interest...............640
Marulak Togatorop, Nirahua Salmon E.M..........................................................................................................640
Some Theorems on Intuitionistic Multi Fuzzy Subgroups..................................................................................653
KR. Balasubramaniyan, R. Revathy....................................................................................................................653
International Journal of Scientific and Research Publications
ISSN 2250-3153
www.ijsrp.org
Complementary and alternative medicine (CAM) use among patients presenting in OPD at tertiary
care hospital, Rajasthan; a Questionnaire based study........................................................................................656
Parul Gupta, Riya Gupta......................................................................................................................................656
The Effect of Expression Box Media on The Ability to Express Language and Self-Confidence in
Group B Children in AR Rasyid Kindergarten Sidoarjo.....................................................................................661
Liez fitri Machfudzoh, Budi Purwoko , Muhammad Turhan Yani.....................................................................661
Oil Price Volatility And External Debt Management In Nigeria: Empirical Evidence.......................................669
Gbalam Peter Eze, Tonye Richard Apiri.............................................................................................................669
Scribal copies of pre-modern texts and the digital environment: A case study of the Odia Sarala
Mahabharata.........................................................................................................................................................706
Dr. Bijayalaxmi Dash...........................................................................................................................................706
A Clinical Study on the Effect and Efficacy of Traditional Formulation Derived by Ola Leaves Manuscript
In The Management of Overweight And Obesity................................................................................................709
R. M. D. Jayasena, K.G.C.Dissanayake...............................................................................................................709
Intangible Service Quality on Customer Satisfaction of Hotel Guest in Nigeria................................................713
Juliana Mbum Edike, Uduak Joseph...................................................................................................................713
Effect of Reciprocal Teaching Model against Social Studies Activities and Learning Outcomes of Class IV
Elementary School Students................................................................................................................................721
Siti Machmudah, Muhammad Turhan Yani, Waspodo Tjipto Subroto...............................................................721
A Comprehensive Review on Enhancing Algal Biology to Reduce Production Costs.......................................727
M.Tech. HusamTalibAl Shammari, Dr.Santhosh kumar, Dr. Sridevi, Padala Satish kumar, K.P.C. Ravi
kiran.....................................................................................................................................................................727
Food Waste: Waste or Resource? Current Practices and Status..........................................................................735
Ithabeleng Anna Moleli, Bing WU, Jianglin CAO, Ahyana Maxine Bowen, Fangnon Firmin Fangninou,
Tchamo Joaquim Minnuse...................................................................................................................................735
International Journal of Scientific and Research Publications, Volume 10, Issue 1, January 2020 1
ISSN 2250-3153
http://dx.doi.org/10.29322/IJSRP.10.01.2020.p9702 www.ijsrp.org
Effect of Nickel on Different Physiological
Parameters of Raphanus Sativus
Hamza Rafeeq1,Muhammad Awais Arshad3*,Syeda Fasiha Amjad4 ,Muhammad Haseeb Ullah2,Hafiz Muhammad
Imran2,Rija Khalid1,Maria Yaseen2, Hadia Ajmal1
1Department of Biochemistry, University of Agriculture, Faisalabad, Pakistan
2Department of Biochemistry, Government College University Faisalabad, Pakistan
3Department of Agronomy, University of Agriculture, Faisalabad, Pakistan
4Department of Botany, University of Agriculture, Faisalabad, Pakistan
DOI: 10.29322/IJSRP.10.01.2020.p9702
http://dx.doi.org/10.29322/IJSRP.10.01.2020.p9702
Abstract- To check the activity of nickel sulphate (0, 10, 20 and
30 mM) on radish seedlings through Foliar medium, whole soil
culture experiment was performed in the wire house of old
Botanical Garden, University of Agriculture Faisalabad. In this
study it was noticed that nickle sulphate act as suppressor on
growth of the plant and it also decreased the content of carotenoids
and chlorophyll contents (Chlorophyll-a, b). Statistical analysis
was achieved after collection of data by using appropriate
computer software such as ANOVA. All morphological changes
were observed to collect the data for the biochemical analysis. A
marked reduction in chlorophyll a and chlorophyll b was noticed
with slight elevation of carotenoid.
I. INTRODUCTION
adish (Raphanus sativus L.) belongs to genus Raphanus,
family Cruciferae that is mostly found in the central and south
Asia (Thamburaj and Singh, 2005). Epidermis outer covering
protects plants againt stress (Raza et al., 2019). Being the cheapest
source of natural protective minerals, the consumption of
vegetables plays protective role against various diseases. The per
day consumption of vegetables decided by dietitians is 300 g that
includes 125 g of green leafy vegetables, 175 g of roots and other
vegetables and its recommended availability should be 145 g per
day (Salaria, 2009). Nutraceuticals obtained from plants have
basic health benefits (Usman et al., 2019).
Radish has spicy taste as well as have anti-cancer activity
due to presence of rich amount of chemical substances such as
myrosinase, glucosinolate, and isothiocyanate. Some varieties of
plants designed for experimental determination of molecular
studies (Ahmad et al., 2019, Ahsan et al., 2019). A variety of
plants products used for herbal treatments( Naeem et al.,2019). A
selective study was done in Germany in 2009 in which 11,405
male participated that showed the relation between nutritional
intake of glucosinolate and the high risk of prostate cancer
(Steinbrecher et al., 2009). Apoptosis of cancer cells in human
lung is mediated by 4-Methylsulfinyl-3-butenyl isothiocyanate
that is present in radish (Wang et al., 2014).Some of the plants
contained materials that identify as DNA barcodes ( Naeem et al.,
2019).
Recently a study has revealed that sulforaphane
(isothiocyanate)that is present in radish, has inhibitory role against
proliferation ofcancer cells in breast(Pawlik et al., 2017). A
variety of climate and soil conditions and suitable nutritional
amount and agro-techniques have great effect on the optimum
growth and production of radish.Cadmium toxicity may affect
various parts of plants (Shafiq et al., 2019).Soil fertility and
various agro-climatic conditions mostly depends on nutritional
requirement. Plants have opening called stomata and epidermis is
the outer layer of cells(Naeem et al., 2019). The root of radish has
rapid growth rate at very short duration of time. The optimum
growth of radish can easily be achieved by adding essential
organic and inorganic fertilizers(Dhanajaya, 2007). Different
herbs are used for medical purposes (Usman et al., 2019).
II. MATERIALS AND METHODS
To check the activity of nickel on on radish seedlings, an
experiment was carried out in jar by applying the nickle in the
solution form by using Foliar application in various concentration
ranging from 0-30mM to the early seedling afterward 2 weeks of
germination.
Sowing and culture medium:
Plastic pots with underneath hole filled with 2.5 kg of sand
were used for directly sowing of seeds of radish genotype Mooli
Day-40 that were purchased from Ayyub Agriculture Research
Institute (AARI) Faisalabad and then these pots were covered by
cotton cloth. Before starting of my experiment, I waited for
germination of seedlings by maintaining the 5 plants per pot of
equal size through thinning and then, I applied Nickle to check its
effect.
3.2. Treatments and Source:
To make the one litter solution of nickle sulphate, I
usedsimple water taken from the filler plants present in the
University of Agriculture, Faisalabad and nickle sulphate was
taken from botany department. Then the solution was applied to
the plants.
1- Normal water or 0mMNickel solution
2- 10mMNickel solution
3- 20mMNickelsolution
4-30mMNickel solution
3.3. Harvests:
R

International Journal of Scientific and Research Publications, Volume 10, Issue 1, January 2020 2
ISSN 2250-3153
http://dx.doi.org/10.29322/IJSRP.10.01.2020.p9702 www.ijsrp.org
Before harvesting, plants were treated with solution for 45 days by
following the parameters.
Photosynthetic pigments:
To evaluate the amount of carotenoids and chlorophyll a and
b, methodology of Arnon (1949) was used. 0.10g of leaf samples
were collected through cutting and socked them into a beaker
containing 10ml of 80% acetone then these sample were
centrifuged after 24 hours at 10,000 rpm for 5min and then
spectrophotometer was used to check the supernatant’s
absorbance 480, 645 and 663 nm(Hitachi-U2001, Tokyo, Japan).
Statistical Analysis :
For statistical analysis of collected data, I applied CO-state and
draw the Anova tables, through filling of tables.
III. RESULTS AND DISCUSSION
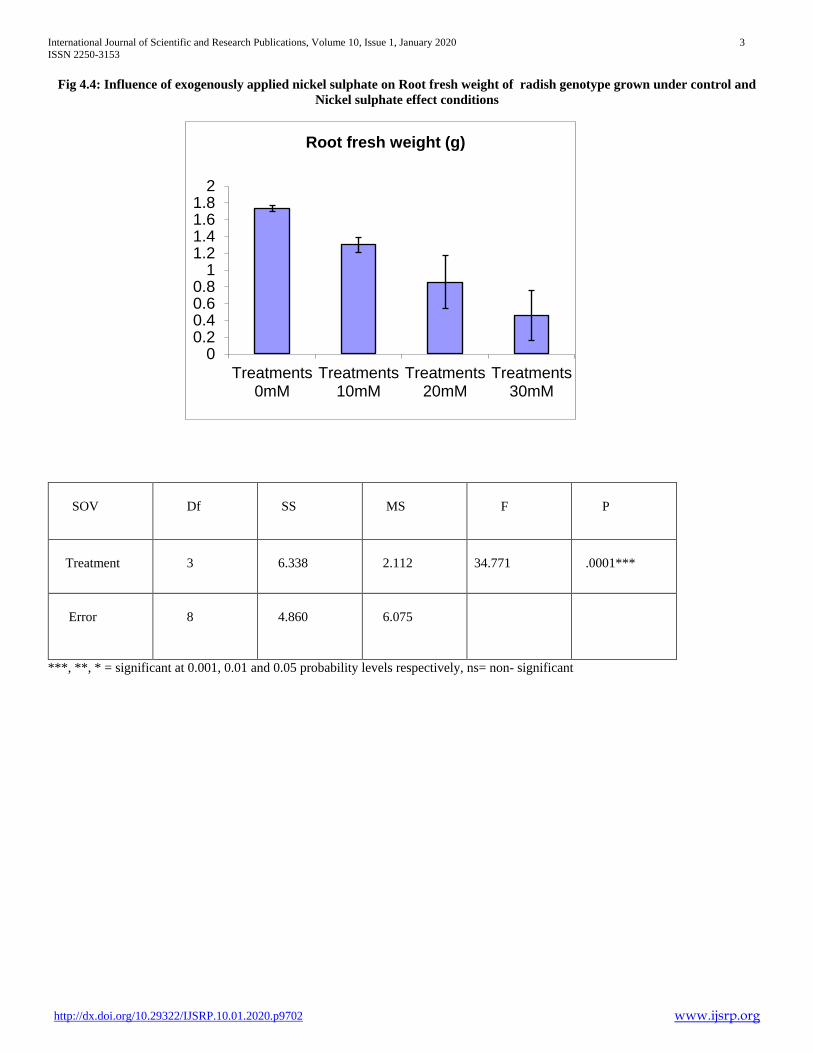
Root fresh weight (g)
The analysis of collected data from fresh weight of radish’s
roots that were grown under controlled conditions is presented in
table (Table 4.4, Fig 4.4). Nickle sulphate act as suppressor that
bring the reduction in growth as well as weight of fresh root
(P≥0.001). Under controlled conditions maximum reduction was
observed as compared at 30mM Nickel sulphate that was applied
in Foliar medium (Fig 4.4).
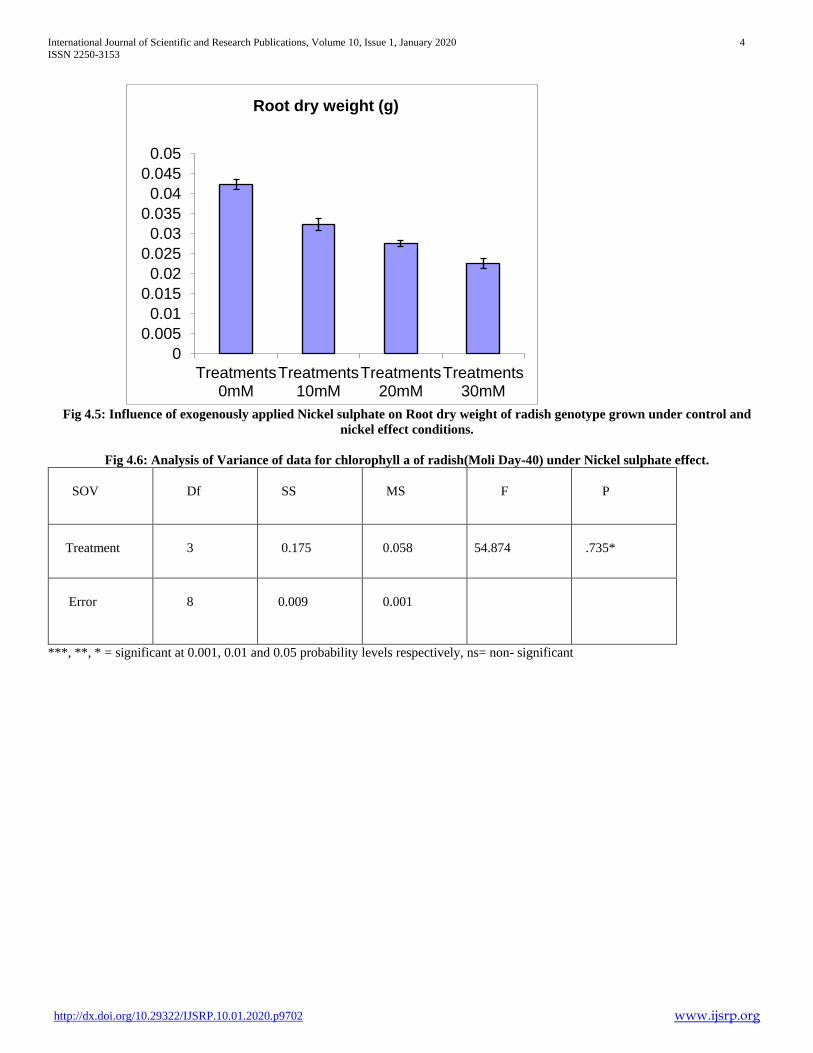
Root dry weight (g)
The analysis of collected data from dried weight of radish’s
roots that were grown under controlled conditions is presented in
table (Table 4.4, Fig 4..5). Nickle sulphate act as suppressor that
bring the reduction in growth as well as weight of dried root
(P≥0.001). Under controlled conditions maximum reduction was
observed as compared at 30mM Nickel sulphate that was applied
in Foliar medium (Fig 4.5).
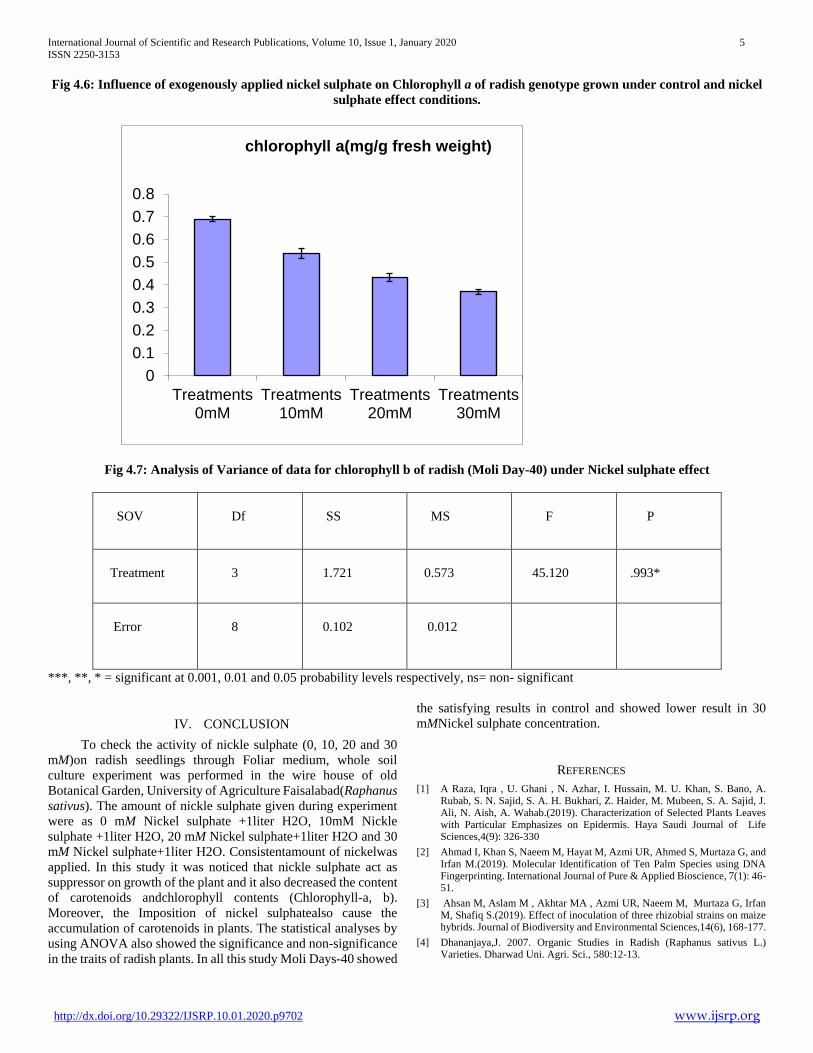
Chlorophyll a (mg/g fresh weight)
The analysis of collected data from radish’s chlorophyll a
that were grown under controlled conditions is presented in table
(Table 4.4, Fig 4.6). Nickle sulphate act as suppressor that bring
the reduction in growth as well as chlorophyll a(P≥0.001). Under
controlled conditions maximum reduction was observed as
compared at 30mM Nickel sulphate that was applied in Foliar
medium (Fig 4.6).
Chlorophyll b (mg/g fresh weight) The analysis of collected data from radish’s chlorophyll b
that were grown under controlled conditions is presented in table
(Table 4.4, Fig 4.7). Nickle sulphate act as suppressor that bring
the reduction in growth as well as chlorophyllb (P≥0.001). Under
controlled conditions maximum reduction was observed as
compared at 30mM Nickel sulphate that was applied in Foliar
medium (Fig 4.7).
Table.4.4: Analysis of Variance of data for root fresh weight of radish (Moli Day-40) under Nickel sulphate effect
SOV
Df
SS
MS
F
P
Treatment
3
2.806
0.935
5.506
.0240*
Error
8
1.359
0.169
***, **, * = significant at 0.001, 0.01 and 0.05 probability levels respectively, ns= non- significant
International Journal of Scientific and Research Publications, Volume 10, Issue 1, January 2020 3
ISSN 2250-3153
http://dx.doi.org/10.29322/IJSRP.10.01.2020.p9702 www.ijsrp.org
Fig 4.4: Influence of exogenously applied nickel sulphate on Root fresh weight of radish genotype grown under control and
Nickel sulphate effect conditions
SOV
Df
SS
MS
F
P
Treatment
3
6.338
2.112
34.771
.0001***
Error
8
4.860
6.075
***, **, * = significant at 0.001, 0.01 and 0.05 probability levels respectively, ns= non- significant
00.20.40.60.8
11.21.41.61.8
2
Treatments0mM
Treatments10mM
Treatments20mM
Treatments30mM
Root fresh weight (g)
International Journal of Scientific and Research Publications, Volume 10, Issue 1, January 2020 4
ISSN 2250-3153
http://dx.doi.org/10.29322/IJSRP.10.01.2020.p9702 www.ijsrp.org
Fig 4.5: Influence of exogenously applied Nickel sulphate on Root dry weight of radish genotype grown under control and
nickel effect conditions.
Fig 4.6: Analysis of Variance of data for chlorophyll a of radish(Moli Day-40) under Nickel sulphate effect.
SOV
Df
SS
MS
F
P
Treatment
3
0.175
0.058
54.874
.735*
Error
8
0.009
0.001
***, **, * = significant at 0.001, 0.01 and 0.05 probability levels respectively, ns= non- significant
0
0.005
0.01
0.015
0.02
0.025
0.03
0.035
0.04
0.045
0.05
Treatments0mM
Treatments10mM
Treatments20mM
Treatments30mM
Root dry weight (g)
International Journal of Scientific and Research Publications, Volume 10, Issue 1, January 2020 5
ISSN 2250-3153
http://dx.doi.org/10.29322/IJSRP.10.01.2020.p9702 www.ijsrp.org
Fig 4.6: Influence of exogenously applied nickel sulphate on Chlorophyll a of radish genotype grown under control and nickel
sulphate effect conditions.
Fig 4.7: Analysis of Variance of data for chlorophyll b of radish (Moli Day-40) under Nickel sulphate effect
SOV
Df
SS
MS
F
P
Treatment
3
1.721
0.573
45.120
.993*
Error
8
0.102
0.012
***, **, * = significant at 0.001, 0.01 and 0.05 probability levels respectively, ns= non- significant
IV. CONCLUSION
To check the activity of nickle sulphate (0, 10, 20 and 30
mM)on radish seedlings through Foliar medium, whole soil
culture experiment was performed in the wire house of old
Botanical Garden, University of Agriculture Faisalabad(Raphanus
sativus). The amount of nickle sulphate given during experiment
were as 0 mM Nickel sulphate +1liter H2O, 10mM Nickle
sulphate +1liter H2O, 20 mM Nickel sulphate+1liter H2O and 30
mM Nickel sulphate+1liter H2O. Consistentamount of nickelwas
applied. In this study it was noticed that nickle sulphate act as
suppressor on growth of the plant and it also decreased the content
of carotenoids andchlorophyll contents (Chlorophyll-a, b).
Moreover, the Imposition of nickel sulphatealso cause the
accumulation of carotenoids in plants. The statistical analyses by
using ANOVA also showed the significance and non-significance
in the traits of radish plants. In all this study Moli Days-40 showed
the satisfying results in control and showed lower result in 30
mMNickel sulphate concentration.
REFERENCES
[1] A Raza, Iqra , U. Ghani , N. Azhar, I. Hussain, M. U. Khan, S. Bano, A. Rubab, S. N. Sajid, S. A. H. Bukhari, Z. Haider, M. Mubeen, S. A. Sajid, J. Ali, N. Aish, A. Wahab.(2019). Characterization of Selected Plants Leaves with Particular Emphasizes on Epidermis. Haya Saudi Journal of Life Sciences,4(9): 326-330
[2] Ahmad I, Khan S, Naeem M, Hayat M, Azmi UR, Ahmed S, Murtaza G, and Irfan M.(2019). Molecular Identification of Ten Palm Species using DNA Fingerprinting. International Journal of Pure & Applied Bioscience, 7(1): 46-51.
[3] Ahsan M, Aslam M , Akhtar MA , Azmi UR, Naeem M, Murtaza G, Irfan M, Shafiq S.(2019). Effect of inoculation of three rhizobial strains on maize hybrids. Journal of Biodiversity and Environmental Sciences,14(6), 168-177.
[4] Dhananjaya,J. 2007. Organic Studies in Radish (Raphanus sativus L.) Varieties. Dharwad Uni. Agri. Sci., 580:12-13.
0
0.1
0.2
0.3
0.4
0.5
0.6
0.7
0.8
Treatments0mM
Treatments10mM
Treatments20mM
Treatments30mM
chlorophyll a(mg/g fresh weight)

International Journal of Scientific and Research Publications, Volume 10, Issue 1, January 2020 6
ISSN 2250-3153
http://dx.doi.org/10.29322/IJSRP.10.01.2020.p9702 www.ijsrp.org
[5] Ghani U, Bukhari SSH, Ullah S, Rafeeq H, Saeed MM, Amjad A, Hussain M, Akmal A, Zahra FT, Qasim F, Taufiq T, Chand SC.(2019). A review on Nutraceuticals as a Therapeutic Agents. International Journal of Biosciences. 15(5), 326-340
[6] Muhammad Naeem,,et al.(2019).Principles of Biochemistry and Biological Sciences. Nish tar Publications(Pvt).Ltd.pp.138
[7] Naeem M ,Hayat M, Qamar SA, Mehmood T, Munir A, Ahmad G, Azmi UR, Faryad MA, Talib MZ, Irfan M, Hussain A, Hayder MA, Ghani U, Mehmood F.(2019).Risk factors, genetic mutations and prevention of breast cancer. International Journal of Biosciences, 14(4), 492-496.
[8] Naeem M, Hussain A, Azmi UR, Maqsood S, Imtiaz U, Ali H, Rehman SU, Kaleemullah, Munir HM, Ghani U.(2019). Comparative Anatomical Studies of Epidermis with Different Stomatal Patterns in Some Selected Plants Using Compound Light Microscopy. International Journal of Scientific and Research Publications ,9(10):375-380
[9] Naeem M,Ali J,Hassan MZ,Arshad B,Rao MHI,Sarmad MSK,Irfan U,Khan NA,Sohail MS,Umar M, Hassan MU(2019).Novel Approach Towards DNA Barcoding as a Tool in Molecular Biologyand Biological Activities of Cyclotides with Particular Emphasizes at Molecular Level. Biological Forum-An InternationalJournal,11(2):83-96.
[10] Pawlik, A., M. Wała, A. Hać, A. Felczykowska and A. Herman-Antosiewicz. 2017. Sulforaphene, an isothiocyanate present in radish plants, inhibits proliferation of human breast cancer cells. Phyto. Med., 29:1-10.
[11] Salaria, A. S. and B. S. Salaria. 2009. Horticulture at a Glance. Jain Bro. New DL., 2:7-8.
[12] Shafiq S, Adeel M, Raza H, Iqbal R, Ahmad Z, Naeem M, Sheraz M, Ahmed U and Azmi UR.(2019).Effects of Foliar Application of Selenium in Maize (Zea MaysL.) under Cadmium Toxicity. Biological Forum-An International Journal,11(2): 27-37.
[13] Steinbrecher, A., K. Nimptsch, A. Hüsing, S. Rohrmann and J. Linseisen. 2009. Dietary glucosinolate intake and risk of prostate cancer in the EPIC‐Heidelberg cohort study. Int. J. Cancer. 125:2179-218.
[14] Thamburaj, S. and N. Singh. 2005. Vegetables, tuber crops and spices. Ind. Coun. Agri. Res., 40:468-470.
[15] Usman G, Ammara B, Hamza R, Muhammad N, Syed S.H.B, Hafiz A, Amna N, Sara,S, Shahid, AC.(2019).Saudi Advancement and Future Directions towards Herbal Treatment for Various Diseases. Saudi Journal of Medical and Pharmaceutical Sciences, 5(11): 931-941
[16] Usman G, Muhammad N, Hamza R, Usman I, Ayesha A, Saqib U, Asim R, Fatima Q.(2019). A Novel Approach towards Nutraceuticals and Biomedical Applications. Scholars International Journal of Biochemistry , 2(10): 245-252
[17] Wang, N., W. Wang, P. Huo, C. Q. Liu, J. C. Jin and L. Q. Shen. 2014. Mitochondria-mediated apoptosis in human lung cancer a549 cells by 4-methylsulfinyl-3-butenyl isothiocyanate from radish seeds. Asian Pac. J. Cancer Prev., 15:2133-2139.
[18] Wang, S. H., Z. M. Yang, H. Yang, B. Lu, S. Q. Li. And Y. P. Lu. 2004. Copper-induced stress and antioxidative responses in roots of Brassica juncea L. Bot. Bulle. Academ. Sin., 45:203-212.
AUTHORS
First Author – Hamza Rafiq, Department of Biochemistry,
University of Agriculture, Faisalabad, Pakistan
Second Author – Muhammad Awais Arshad, Department of
Agronomy, University of Agriculture, Faisalabad, Pakistan
Third Author – Muhammad Haseeb Ullah, Government College
University Faisalabad, Pakistan.

International Journal of Scientific and Research Publications, Volume 10, Issue 1, January 2020 7
ISSN 2250-3153
http://dx.doi.org/10.29322/IJSRP.10.01.2020.p9703 www.ijsrp.org
Exploring and Analyzing Students’ Algebraic
Misconceptions and Errors
Mukunda Prakash Kshetree, PhD
Associate Professor, Department of Mathematics Education
Tribhuvan University, Kathmandu, Nepal
DOI: 10.29322/IJSRP.10.01.2020.p9703 http://dx.doi.org/10.29322/IJSRP.10.01.2020.p9703
Abstract
This research based paper presents the exploring and analyzing students’ algebraic misconceptions and errors (M/Es).
Along with minute observation of students’ classroom tasks and their peer groups’ algebraic activities, the exploration of students’
M/Es was carried out by conducting in-depth interview with students (based on their work sheets). The study had analyzed
misconceptions and errors of the students of grade eighth. It was carried out especially in the area of algebraic content. This study
has revealed altogether 63 different types of M/Es which have been framed up into seven categories. While diagnosing the origin,
nature, patterns and causes of M/Es, some non-cognitive causes of M/Es have also been traced out. The study showed that diagnosis
of students’ M/Es on time should be the fundamental system of teaching/learning (T/L) school algebra.
Keywords: Exploring, analyzing, misconceptions, errors, causes, patterns, constructivism, fallibilism
I. INTRODUCTION
The mathematics education is a body of knowledge and area of science with its own terminology, symbolism, contents,
theorems and T/L methodology. Students must know the mathematical language with lots of mathematical concepts, theories, and
relations with its own syntax, grammar, words, phrases, sentences, symbols, graphs, visuals, models etc. But most of the students pass
their time by listening and reading instead of writing, thinking, analyzing and using the mathematical language. As a result, they miss
the logical power and cannot develop a creative power to think.
In this situation, students follow rote learning, and their mathematical knowledge is developed with a lot of misconceptions.
For example, students start solving a problem but cannot reach the end with correct answer as they are lost somewhere in the middle
of the process where they are misguided due to misconceptions and hence produce errors. When students study and explain incorrect
skills, they directly meet misconceptions and are likely to maintain incorrect ways of thinking about problems (Warren & Cooper,
2006). If such misconceptions are not addressed as early as possible before they get matured, students integrate useless new
information into their immature conceptions which cause further misconceptions and errors.
Piaget’s (1970) fundamental assumption is that knowledge is a process, not a state. So, misconceptions are acquired during
students’ learning process. Actually, conceptions and misconceptions grow together, side by side. Students construct their
misconceptions through their own experience.The intuitive interpretation based on a primitive, limited and unrelated individual

International Journal of Scientific and Research Publications, Volume 10, Issue 1, January 2020 8
ISSN 2250-3153
http://dx.doi.org/10.29322/IJSRP.10.01.2020.p9703 www.ijsrp.org
experience disturbs learning process and distorts correct conceptions which cause misconceptions (Fischbein, 1994). They occur
while obtaining, processing, retaining and reproducing the information along with assimilating and accommodating new conceptions
into existing conceptions. Since M/Es are emotionally attached with students, they are not easy to dislodge and remove (Egodawatte,
2011).
To err is human; however, the main point is concerned with what conclusions are drawn and learnt from errors. If errors are
committed, it is said that they arise because the children are thinking and not because they are careless. The teacher should generate
an environment of engaging students for the correction of errors with reasons instead of correcting them mechanically. Thus, teachers
have to accept students’ errors for the purpose of analysis.
The analysis of error pattern provides us an effective and efficient method for pinpointing the specific misconceptions and
problems that students are having while solving problems. By investigating students’ M/Es, the teacher can provide instruction
targeted to their area of need. In this regard, Upadhyay (2017) claimed that if one could find out weaknesses and misconceptions of
students, more than half of the problems of T/L tasks are done. Similarly, Ausubel (1968) said that if he had to reduce the entire body
of knowledge in the field of educational psychology to just one principle, he would say: The most important single factor influencing
learning is to ascertain what the learner already knows, and teach him/her accordingly. It shows the crucial role of M/Es in a whole
learning process.
Students’ errors are the symptoms of misconception like fever for the disease. So, it was imperative to identify students’
conceptions, procedures, reasoning, and how students’ wrong responses and errors expose their misconceptions. Further, it was more
important to carry out such a research in algebraic area as it is a gate keeper for all branches of mathematics. However, a clear
understanding is needed as regards how to identify, diagnose and address students’ M/Es so that students would have a learning
algebra meaningfully. For these reasons, I had conducted the study with two major research questions.
II. RESEARCH QUESITONS
The study was conducted to bestow the answers of the following two major questions.
(i) What are the students’ algebraic misconceptions and errors?
(ii) What are the causes of students’ algebraic misconceptions and errors?
III. THEORETICAL FRAMEWORK OF THE STUDY
One of the main things that makes human being different from other animals is the human’s ability to learn very complex
behaviors and skills. Though, the knowledge constructing routes are very complicated and often include backward and forward
movements, suggesting that frequently making errors may be an unavoidable part of the learning process which does not mean that a
learning strategy got unsuccessful (Campbell, 2009, cited in Kshetree, 2015). Further, he added that errors are logically consistent and
rule-based rather than random. Thus, exploring errors presents an opportunity for uncovering the mental representations with
mathematical reasoning and misconceptions. For this, the researcher considered different perspectives of constructivism such as

International Journal of Scientific and Research Publications, Volume 10, Issue 1, January 2020 9
ISSN 2250-3153
http://dx.doi.org/10.29322/IJSRP.10.01.2020.p9703 www.ijsrp.org
neural network, psychological, generate and degenerate, and buggy algorithm in learning algebra. They provided the various root
causes of originating M/Es.
In addition, the different scholars and mathematicians have considered the nature of mathematics and its ontology,
epistemology and axiology differently (Ernest, 1995). Platonist philosophers on the extreme right conclude that mathematics is
objective, unhistorical, unchallengeable truth existing independent of consciousness. But the fallibilist philosophers argue that
mathematics is subjective; socio-cultural, M/Es prone, and no mathematical truth can exist outside what learners have consciously
constructed in their minds. Along with these different philosophical lenses, the researcher has used especially fallibilist view to study
students’ algebraic learning ways, committing M/Es including their remedy.
Actually, it is important to understand student’s inclination towards different mathematical philosophies (though they may
not clearly express them) to find out their M/Es particularly while interviewing them. Their views enable teachers to help students
more as the teachers make world-view of mathematics from the student’s point of view. Sometimes, there may be the need for
modification in the learner’s philosophies if they are found to be unhelpful.
While students are constructing concepts, they sometimes construct incomplete, immature, alternative and transitional
concepts (Makonye, 2013, cited in Kshetree, 2015). Those concepts constructed by students may be fully correct or partially correct
or completely wrong. In this way, the students’ construction of algebraic concepts is a fallible process. Though students used intuition
and trial and error process while guessing mathematical results and checking them, fallibilist approach was the main philosophy
adopted in this research study with the assumption that the students construct algebraic concepts in their own endeavors.
In this way, out of five major mathematical philosophies, fallibilism was taken as a guiding philosophy for this research
study. In order to study, analyze and diagnose the nature, origin, causes and different forms of M/Es, the theoretical foundations
considered in this study included constructivism through different perspectives such as neural network, psychological, generate and
degenerate, and buggy algorithm.
IV. CONCEPTUAL FRAMEWORK OF THE STUDY
As per the nature of the study, the researcher followed the qualitative research design. The qualitative information was
collected through in-depth interview based on students’ test and class-work copies, which was supported by the information gathered
from classroom observations of T/L practices and field notes. After reviewing theoretical and empirical literatures, the exploration of
students’ M/Es was planned to carry out through the fallibilism and constructivism theories whereas they were analyzed through
thematic approach by using critical judgment process. In this way, for the exploring and analyzing students’ misconceptions and
errors, the blue print of the researcher’s mental map was sketched in the form of a ‘conceptual framework’ for this study.

International Journal of Scientific and Research Publications, Volume 10, Issue 1, January 2020 10
ISSN 2250-3153
http://dx.doi.org/10.29322/IJSRP.10.01.2020.p9703 www.ijsrp.org
V. METHODOLOGY
Research Design
As per the nature of information and data of the study, the research design adopted was qualitative. Creswell (2012) claims
that interviewer gains holistic picture in qualitative research by analyzing words and phrases, reporting the views of the informants in
detail, and carrying out research in a natural setting. Regarding collecting and processing method of data, the researcher collected and
analyzed the data for the purposes of obtaining a deeper understanding of the phenomenon. The researcher was not limited in
interview rather he was interacted with the students based on their class works and some tests in addition to tracing regular
observations and making field notes. The notes were also made with reference to discussion held with mathematics teachers and
students. Further, he combined these research strategies which were found to be mutually reinforcing.
Population and Sampling
As per the disposition of the study, a single visit and contact with students could not work well, so the researcher needed to
have field work for a long time. Thus, the researcher had to be confined in few of the schools of Kathmandu Valley. So, the
population of the study was all the community schools of the Valley.
At first, the researcher purposively made a list of seven schools then he visited and observed those schools. In the visits, he
consulted the head teachers, teachers, and students for their consent, interest and cooperation. Then he selected four from those seven
schools. Out of altogether 95 students, the study analyzed the test scores of only those 80 students who were regular and took part in
the tests, interaction and interviews taken, time and again.
Selection of students’ standard. Regarding selection of T/L class, the researcher had reviewed some relevant literatures. According to
Booth (1988), the learning of algebra has received more attention at the lower secondary level school which is the critical stage of
transition from arithmetic to algebra. Kieran (2007) claimed that most algebra studies have targeted learning of school algebra.
Ginsburg (1997, cited in Kshetree, 2015) added that the results of the study of school algebra apply more to the students younger than
high school age. So, it was important to know the M/Es that middle school students commit. Compared with the goal of arithmetic
which has to find the answer, the focus of algebra was to find the general method and use algebraic symbols to express them in a
general form. Further, Booth (1988) claimed that the structural representation, symmetric and transitive character means
understanding equation as object which should become the goal of school algebra at the end of Basic Education level (eighth grade).
That is why, the study was conducted among the students of eighth grade.
Development of Research Tools
In order to collect the required data for this study, the researcher prepared, standardized and intervened important research
tools which include: Observation forms, field notes, test items, and interview guideline. Then, the researcher consulted with senior
researchers, subject experts, trainers and teachers for feedback, suggestions and necessary modifications. Some of the tools were
adapted from other researches with some modifications as per the need of the research.
Observation checklist for exploring M/Es

International Journal of Scientific and Research Publications, Volume 10, Issue 1, January 2020 11
ISSN 2250-3153
http://dx.doi.org/10.29322/IJSRP.10.01.2020.p9703 www.ijsrp.org
The researcher had to observe the practices of students’ algebraic knowledge and understanding translated into problem
solving skills even in the peer groups. For this, out of three types of observation (informal observations, structured observations and
interactive observational assessment), the researcher had followed the modality of interactive observational assessment. While
observing group work activities, six behaviors of mathematization were captured as suggested by Millory (1992, cited in Upadhyay,
2001) which include; explaining something to the group, taking some action over task, engaging in reflection, offering some
arguments for verification, appraising some works critically and acting as a more able peer.
Thus, in order to explore students’ misconceptions and errors, an observation checklist based on Newmann’s Error Analysis
Tool (1983), Perso’s Diagnostic model (1991) and Blessing’s testing (2004) was prepared and used it by the researcher while
observing classroom T/L practices. While observing class works of the students, an attention was given for groups’ discussion,
exchanging the peer groups’ work, and allowing the students to reform their peer groups. After the class is over, it used to have
review meetings among teachers and researcher. A field note was also updated appropriately to collect all the relevant information
explored while observing class works and discussion taken with the students and teachers.
Field notes
The field notes contain the ongoing data that were being collected. They consisted of the descriptions of what was being
experienced and observed, the observer's feeling and reactions to what were observed, and field-generated insights and interpretations
as claimed by Newman (1983). In the same manner, the researcher had observed and experienced the different types of
representations such as strategic solutions to the given problems, the way of content of the algebra transmitted, and appropriateness of
the use of T/L aids including the response of teacher when a student gives a wrong answer to a question. The field notes were taken
lively on T/L classroom practices and activities where researcher traced his insight regarding making meaning upon what students
observe, hear, communicate, and take part in peer works. In this way, the field notes strengthened and systematized the classroom
observation tasks.
Development of test items
In order to identify and locate students’ M/Es, the researcher developed and standardized the test tools. For this, he prepared
the test items by using textbook, specification grid-chart, curriculum and teacher’s guidebook developed and prescribed by the
Curriculum Development Center (CDC). The specific misconceptions could easily be dealt with if algebra was seen through
generalizing, forming and solving equations, and working with formulae. In this way, the test items were prepared based on Perso’s

International Journal of Scientific and Research Publications, Volume 10, Issue 1, January 2020 12
ISSN 2250-3153
http://dx.doi.org/10.29322/IJSRP.10.01.2020.p9703 www.ijsrp.org
Diagnostic Test(1991) and Blessing’s Algebraic Thinking Content Knowledge Test(2004). The test model was prepared on the basis
of seven categories of students’ M/Es. The test items included three categories of questions (knowledge for concepts, comprehension
for process and application for academic skills) as per the Bloom’s Taxonomy.
Interview guideline
In order to explore and fix the students’ algebraic M/Es with reference to their test copies, an interview guideline was
prepared and administered among the students of the sampled schools. The guideline was prepared being based on the conceptual
understanding of the algebraic concepts, problem solving procedure and application of the knowledge in required steps of solving
problems.
The interviews of the students were taken by the researcher himself. The interviews enabled the researcher to examine and
obtain valid and reliable information about students’ knowledge and understanding held in each test item of pre-test. More
importantly, in order to explore students’ M/Es, the interviews were used to follow up unexpected results or to validate other methods
or to go deeper into the understanding of their reasons. For this purpose semi-structured open-ended questions were developed on the
basis of the results of the test.
In order to know students’ thinking patterns, conceptual status, constructions, interpretations and arguing ability, sequential
questions were asked on the basis of their response in each stage. Further, unstructured interview with semi-structured questions was
used as its purpose was to obtain a free flow of information, move forward and backward in the process of interviewing to clarify
points, go over earlier points and again raise fresh questions, and create an atmosphere where the interviewee would feel free to come
out with subjective and personal information. So, the interviews proceeded ahead more like a normal conversation, but with a purpose
of locating students’ M/Es.
Real interview
Before starting each interview, every student used to be informed about what was the objective of interview including
expectation from the student. The initial conversation used to begin with, “I am going to ask you some of the questions based on your
test answer-sheet. I would like you to try and explain to me your thinking while you are working. What I am interested in is how you
are going to arrive at your answers. Sometimes I may ask you some short questions for further clarifications”.
Further, the researcher made clear that it was quite acceptable to make any errors in the interview since the learners’ thinking
underlying their errors was more important than answers. Further, they were made to understand that the primary goal of this exercise
was not to evaluate them or to offer them a mark. The interviews were taken on the basis of their answer sheets of test in order to
identify their misconceptions in each typical and non-common answer. The interviews were also taken even in the correctly answered
International Journal of Scientific and Research Publications, Volume 10, Issue 1, January 2020 13
ISSN 2250-3153
http://dx.doi.org/10.29322/IJSRP.10.01.2020.p9703 www.ijsrp.org
questions in order to ensure their answer and confirm their existing knowledge. The duration of the interview was largely dependent
on the responses given during the interview but did not last longer than thirty minutes.
In order to make them comfortable in delivering their opinion without any hesitation, a liberty of sitting two friends at a time
for the interview was also permitted. As expected, the students were found more confident and comfortable in the interviews taken
with pair of friends chosen by them. Actually, it was an idea developed in interview sites as seeing the weak students could not put
their conceptual understanding clearly. In addition, two separate informal group discussions were also conducted among 7 students of
one school and 9 students of another school. In the discussion, students were presented with their own test copies so that their ideas
and arguments could be compared and exchanged among their friends. Further, few of the students were also interviewed informally
while observing their group works.
In each interview, the researcher was interested in how students’ incorrect responses could expose their M/Es. It helped
further to explore their M/Es. In the end of each interview session, students’ work sheets used in interview process were also
collected. Further, each interview was audio taped and later transcribed and analyzed.
VI. ANALYSIS AND INTERPRETATION OF THE DATA
In order to identify students’ common patterns of M/Es, it was taken in-depth interviews of the students based on their test
and class work copies. Also at the time of observation, students’ experiences were drawn by making them discuss and interact in peer
groups, present each group’s work in whole classroom, and notice teachers’ guidance and support. The students were encouraged to
put forth their reasons individually so that each one could explain how s/he arrived at the solution. Doing so was important than
showing their answer sheets to the teacher in order to explore and verify students’ M/Es identified from test-based interviews.
In order to organize the qualitative information systematically and standardize the supporting system through theorizing the
findings of research, the thematic approach with critical judgment was applied. In this context, the study was focused on three areas of
M/Es: Sources, causes and categories. The analysis of qualitative information obtained from the interviews, classroom observations of
individual and peer groups’ activities, and field notes was carried out with reference to theory of mathematical fallibilism,
constructivism and findings of the previously carried out related researches. The M/Es were diagnosed based on the tools developed
by Perso (1991), Blessing (2004) and Newmann (1983). Further, the data were categorically analyzed and interpreted as per their
three levels of cognitive domain (conceptual, procedural, and application).
In this way, the students’ M/Es were explored and triangulated through five different ways:

International Journal of Scientific and Research Publications, Volume 10, Issue 1, January 2020 14
ISSN 2250-3153
http://dx.doi.org/10.29322/IJSRP.10.01.2020.p9703 www.ijsrp.org
(i) Examination of test copies of all students,
(ii) In-depth interviews of the students based on their test answer sheets,
(iii) Scanned copies of class work and their analysis,
(iv) Field notes on observed peers’ group tasks, interaction, and discussion,
(v) Reviewed researches and literatures
VII. FINDINGS OF THE STUDY
The findings regarding exploration and diagnosis of students’ 63 different M/Es have been put forth in sequential order on
the basis of their seven categories such as (i) building block of algebra, (ii) mis-manipulations, (iii) application, (iv) solving problems
by patterns, (v) translation of word problems, (vi) generalization of algebraic concepts, and (vii) dealing symbolic expressions and
equations. In addition, there were some miscellaneous proto type M/Es and their non-cognitive causes. The categorical findings have
been specified, turn by turn, as follows.
Regarding the M/Es based on basic building block of algebra about the use of letters, symbols and variables, it was found
that the students had few misconceptions such as: variables always have the same meanings and interpretations even in different
contexts and situations, one variable is for one specific value only, variables are used to label name of words and objects, letters are
meaningless symbols, and there is one-to-one correspondence of English alphabets with positive integers.
The M/Es related to mis-manipulation of algebraic symbols were mainly the perceiving incomplete answers as far as they see
operating signs, taking equal sign as step maker, and missing some parts of terms and signs in the lack of comprehending procedural
skills.
Incorrect application of rules and formula was another category of M/Es which consists of overgeneralization of rules,
thinking backward in arithmetical way, and misuse of order of operations which forces to adopt inconsistent procedures.
With reference to use of numerical pattern and predictable visual to solve problems; the students were found misled by
superficial structure of some algebraic formula and expressions, lacking discrimination ability of similar concepts, and having low
confidence level in attempting given algebraic problems.
The common practices of M/Es with regard to solving word problems were related to understanding the problem,
transformation of given language into algebraic equations, solving the problem correctly, and even encoding the solution. Further,
they also had a problem in finding the relationship of variables to form equations; as a result, sometimes they guessed the answers and
used trial and error method.
The overall image that emerged out from the findings of M/Es related to generalization of algebraic concepts was that
students have lack of required concepts in formulation and use of general rules. Similarly, they had inter-subject messy concepts and
even lack of the idea about where and how to start solving the problem.

International Journal of Scientific and Research Publications, Volume 10, Issue 1, January 2020 15
ISSN 2250-3153
http://dx.doi.org/10.29322/IJSRP.10.01.2020.p9703 www.ijsrp.org
Regarding the category of M/Es in solving problems using symbolic expressions, mainly three types of difficulties were
found which caused M/Es. They were: lack of making the learning meaningful as a result following mechanical drill and practice,
running through several steps to reach the so-called final step any way, and indulging into many mish-mashing concepts which
deviated them from getting correct conceptions.
Furthermore, it was explored that students’ M/Es were based on some psychological matters such as anxiety, hurriedness,
poor attention, rigid thinking, recalling problem, nervousness, and time pressure including some technical parts like slips and
carelessness. It was also observed in peer groups that some of the M/Es were based on students’ own incomplete ideas, hazy
instructions provided by teachers, some unclear sharing of ideas among friends, and use of own irrelevant life experience. However,
students’ M/Es were based on lack of conceptual clarity, low ability in comprehending procedural steps, and applying incorrect
schemas in solving problems.
VIII. IMPLICATIONS OF THE STUDY
This study has drawn many prominent implications which can be used primarily by students and teachers in daily T/L
practices of algebra. Further, the implications have been identified for subject experts and institutions as well.
For students, the study is much useful since the exploration of students’ M/Es is based on their pre-existed knowledge and
practices. Similarly, it identifies their learning schema and shortcomings, required treatments and determines its dose as per the nature
of their M/Es which are essential ingredients to make the learning meaningful.
For teachers, they provide inputs as per the students’ M/Es, ability, and interest where they encourage students to talk inside
out and share with teachers. In this approach of T/L system, the role of teachers changes from talking to listening, describing to feed
backing, relaying information to using creativity, being teacher centric to students centric, and as a whole lecturing system to
facilitating the learning.
At expert level, it is expected to be equally applicable to policy makers of school education reform, curriculum developers,
training package designers, examination experts, teacher educators, book writers, and trainers to name few of the representative
professionals of education sector. This new approach of T/L through exploring and diagnosing students’ M/Es can be a training
material for pre-service and in-service mathematics teachers as well.
For institution, with regard to the intervention of this new approach in Nepalese classroom and context, the institutes will get
overall conducive environment and tremendous improvements not only in mathematics but also in other subjects if they follow this
approach of T/L system. However, it recommends some pre-requisites such as training for the teachers, specific lesson plans, and
improved classroom situation. In this way, this new approach to T/L system did not only connect teachers and students for their
betterment but also showed much significant benefits in the favor of institutions as a whole.
IX. CONCLUSION
The students and teachers together must reach the schemata of students to explore their M/Es. Teachers should not be
anxious of students’ M/Es because their wrong answers can guide reach to the origin of M/Es that they may be the best tools for
crafting their learning experiences. The teachers’ belief system in mathematics as absolute knowledge needs to be changed into

International Journal of Scientific and Research Publications, Volume 10, Issue 1, January 2020 16
ISSN 2250-3153
http://dx.doi.org/10.29322/IJSRP.10.01.2020.p9703 www.ijsrp.org
mathematical knowledge guided by fallibillism philosophy and human conscience. As a result, teachers could give importance to
every reasoning of the students as the construction of knowledge needs own way, pace, experience, context and culture. Thus,
exploring and analyzing students’ misconceptions and errors should be the fundamental system of T/L algebra. Further, the study has
also set up a norm in mathematics education like ‘prevention of students’ M/Es is better than their treatment’. Similarly, it has
established a new knowledge as ‘determine the ways and dose of treatment on the basis of students’ diagnosed M/Es’ in order to make
T/L algebra meaningful.
X. ACKNOWLEDGEMENT
I express my sincere thanks to my supervisor Prof. Dr. Hari Prasad Upadhyay for his outstanding guidance, suggestions and
scholarly touch in every corner of this study. My appreciation goes to those sample schools’ teachers and students who provided me
excellent working environment for this study. Similarly, I am thankful with my all senior professors and colleagues of the Department
of Mathematics Education for their kind cooperation and genuine feedbacks provided while carrying out this study.
XI. REFERENCES
[1] Ausubel, D. P. (1968). Educational psychology: A cognitive view. New York: Holt, Rinehart and Winston.
[2] Blessing, L. H. (2004). Elementary school algebra: The relationship between teachers’ content knowledge, student achievement and attitudes, and classroom
environment. Doctoral dissertation. Curtin University of Technology.
[3] Booth, L. R. (1988). Children's difficulties in beginning algebra. In A. F. Coxford & A. P. Shulte (Eds.). The ideas of algebra, K-12 (pp. 20-32). Reston, VA:
National Council of Teachers of Mathematics.
[4] Creswell, J. W. ( 2012). Educational research: Planning, conducting and evaluating quantitative and qualitative research (4th Ed.). Boston, MA: Pearson Education.
[5] Egodawatte, G., ( 2011). Secondary school students’ misconceptions in algebra. An unpublished dissertation. Canada. University of Toronto. Retrieved on June 7,
2019 from http://hdl.handle.net/1807/29712
[6] Ernest, P. (1995). Values, gender, images of mathematics. A Philosophical perspective. International Journal for Mathematical Education in Science and
Technology, 26(3), 449-462.
[7] Fischbein, E. (1994). The interaction between the formal, the algorithmic, and the intuitive components in a mathenmatical activity. In R. Biehler, R. W. Scholz,
R. Straber, & B. Winkelmann (Eds.). Didactics of mathematics as a scientific discipline (pp.231-245). Dordrecht: Kluwer.
[8] Kieran, C. (2007). Learning and teaching of algebra at the middle school through college levels: Building meaning for symbols and their manipulation. In F. K. J.
Lester (Ed.). Second handbook of research on teaching and learning mathematics (pp. 707-762). Charlotte: Information Age.
[9] Kshetree, M. P. (2015). Thorny in Learning Mathematics: The Major Sources of Errors. In (ed), Mathematics Education Forum. I (37) (pp 14-17). Kathmandu:
CME.
[10] Newman, M. A. (1983). Strategies for diagnosis and remediation. Sydney: Harcourt, Brace.
[11] Perso, T. F. (1991). Misconceptions in algebra: Identification, diagnosis and treatment. Unpublished doctoral thesis. Perth: Curtin University of Technology.
[12] Piaget, J. (1970). Genetic epistemology. New York: Columbia University Press.

International Journal of Scientific and Research Publications, Volume 10, Issue 1, January 2020 17
ISSN 2250-3153
http://dx.doi.org/10.29322/IJSRP.10.01.2020.p9703 www.ijsrp.org
[13] Upadhyay, H. P. (2017). Teaching mathematics. Kathmandu: Ratna Pustak Bhandar.
[14] Warren, E. & Cooper, T. J. (2006). Young children’s ability to use the balance strategy to solve for unknowns. In (ed), Mathematics Education Research Journal,
17(1), 58-72. Retrieved on March 9, 2016 from http://www.pearsonhighered.com/asset
*******
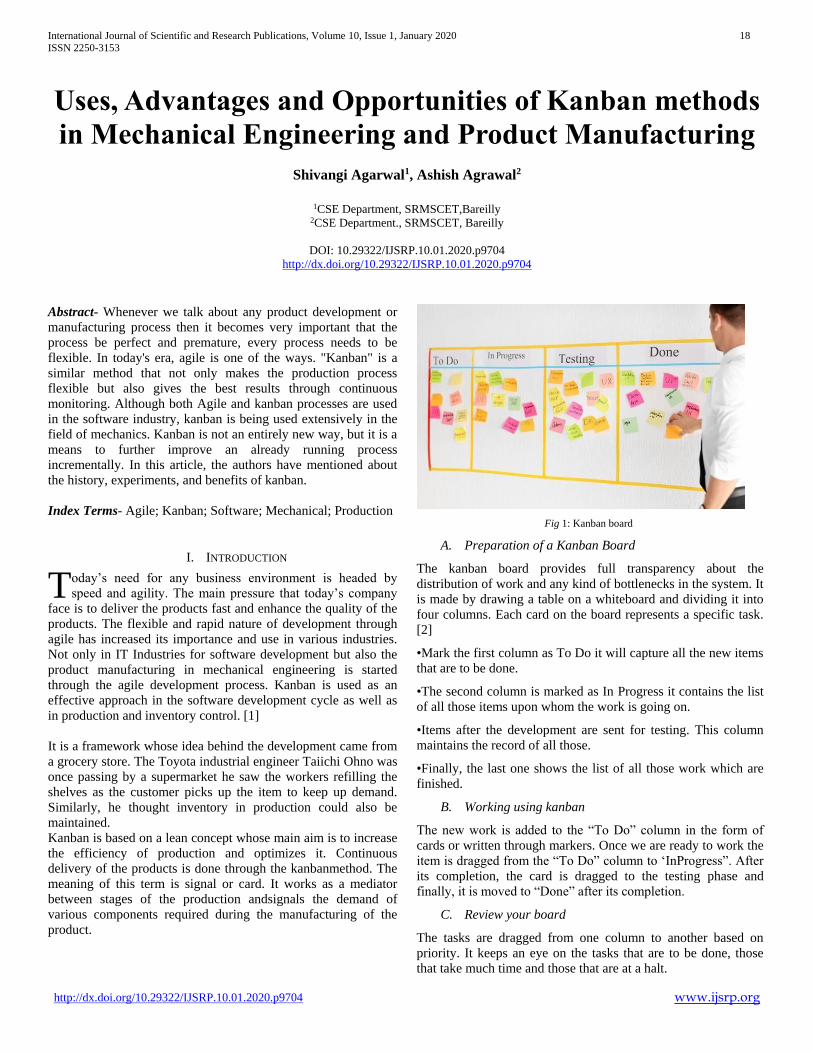
International Journal of Scientific and Research Publications, Volume 10, Issue 1, January 2020 18
ISSN 2250-3153
http://dx.doi.org/10.29322/IJSRP.10.01.2020.p9704 www.ijsrp.org
Uses, Advantages and Opportunities of Kanban methods
in Mechanical Engineering and Product Manufacturing
Shivangi Agarwal1, Ashish Agrawal2
1CSE Department, SRMSCET,Bareilly
2CSE Department., SRMSCET, Bareilly
DOI: 10.29322/IJSRP.10.01.2020.p9704
http://dx.doi.org/10.29322/IJSRP.10.01.2020.p9704
Abstract- Whenever we talk about any product development or
manufacturing process then it becomes very important that the
process be perfect and premature, every process needs to be
flexible. In today's era, agile is one of the ways. "Kanban" is a
similar method that not only makes the production process
flexible but also gives the best results through continuous
monitoring. Although both Agile and kanban processes are used
in the software industry, kanban is being used extensively in the
field of mechanics. Kanban is not an entirely new way, but it is a
means to further improve an already running process
incrementally. In this article, the authors have mentioned about
the history, experiments, and benefits of kanban.
Index Terms- Agile; Kanban; Software; Mechanical; Production
I. INTRODUCTION
oday’s need for any business environment is headed by
speed and agility. The main pressure that today’s company
face is to deliver the products fast and enhance the quality of the
products. The flexible and rapid nature of development through
agile has increased its importance and use in various industries.
Not only in IT Industries for software development but also the
product manufacturing in mechanical engineering is started
through the agile development process. Kanban is used as an
effective approach in the software development cycle as well as
in production and inventory control. [1]
It is a framework whose idea behind the development came from
a grocery store. The Toyota industrial engineer Taiichi Ohno was
once passing by a supermarket he saw the workers refilling the
shelves as the customer picks up the item to keep up demand.
Similarly, he thought inventory in production could also be
maintained.
Kanban is based on a lean concept whose main aim is to increase
the efficiency of production and optimizes it. Continuous
delivery of the products is done through the kanbanmethod. The
meaning of this term is signal or card. It works as a mediator
between stages of the production andsignals the demand of
various components required during the manufacturing of the
product.
Fig 1: Kanban board
A. Preparation of a Kanban Board
The kanban board provides full transparency about the
distribution of work and any kind of bottlenecks in the system. It
is made by drawing a table on a whiteboard and dividing it into
four columns. Each card on the board represents a specific task.
[2]
•Mark the first column as To Do it will capture all the new items
that are to be done.
•The second column is marked as In Progress it contains the list
of all those items upon whom the work is going on.
•Items after the development are sent for testing. This column
maintains the record of all those.
•Finally, the last one shows the list of all those work which are
finished.
B. Working using kanban
The new work is added to the “To Do” column in the form of
cards or written through markers. Once we are ready to work the
item is dragged from the “To Do” column to ‘InProgress”. After
its completion, the card is dragged to the testing phase and
finally, it is moved to “Done” after its completion.
C. Review your board
The tasks are dragged from one column to another based on
priority. It keeps an eye on the tasks that are to be done, those
that take much time and those that are at a halt.
T
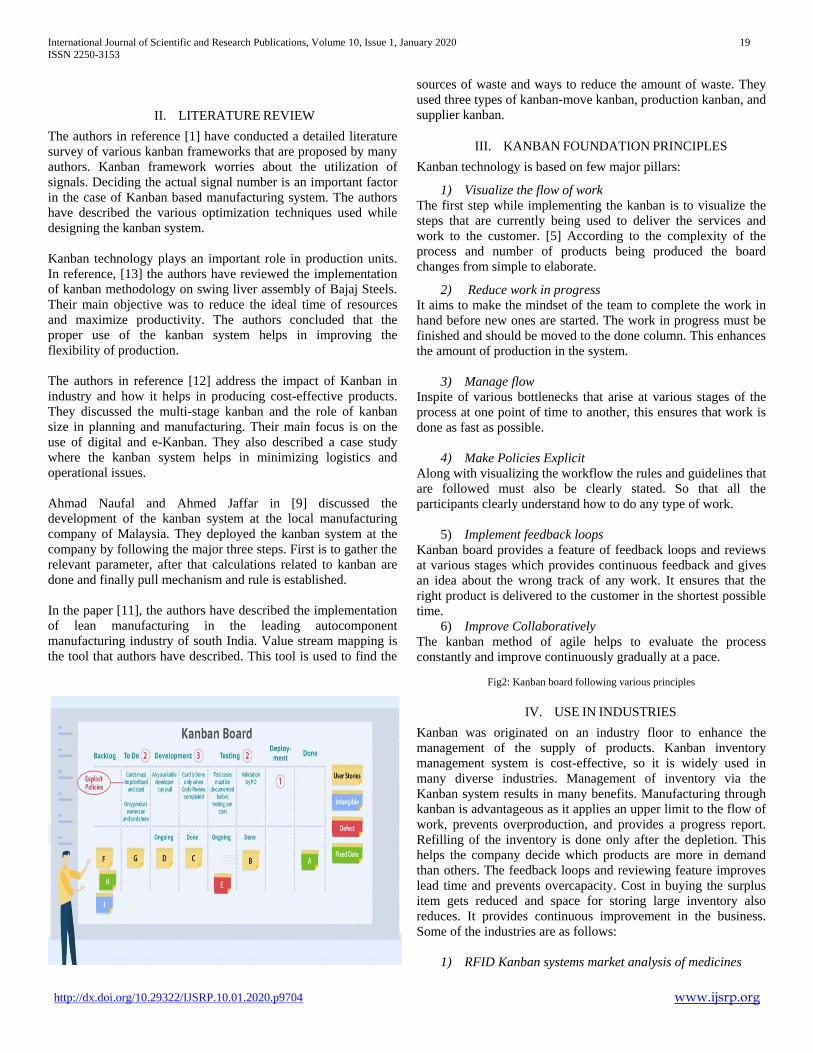
International Journal of Scientific and Research Publications, Volume 10, Issue 1, January 2020 19
ISSN 2250-3153
http://dx.doi.org/10.29322/IJSRP.10.01.2020.p9704 www.ijsrp.org
II. LITERATURE REVIEW
The authors in reference [1] have conducted a detailed literature
survey of various kanban frameworks that are proposed by many
authors. Kanban framework worries about the utilization of
signals. Deciding the actual signal number is an important factor
in the case of Kanban based manufacturing system. The authors
have described the various optimization techniques used while
designing the kanban system.
Kanban technology plays an important role in production units.
In reference, [13] the authors have reviewed the implementation
of kanban methodology on swing liver assembly of Bajaj Steels.
Their main objective was to reduce the ideal time of resources
and maximize productivity. The authors concluded that the
proper use of the kanban system helps in improving the
flexibility of production.
The authors in reference [12] address the impact of Kanban in
industry and how it helps in producing cost-effective products.
They discussed the multi-stage kanban and the role of kanban
size in planning and manufacturing. Their main focus is on the
use of digital and e-Kanban. They also described a case study
where the kanban system helps in minimizing logistics and
operational issues.
Ahmad Naufal and Ahmed Jaffar in [9] discussed the
development of the kanban system at the local manufacturing
company of Malaysia. They deployed the kanban system at the
company by following the major three steps. First is to gather the
relevant parameter, after that calculations related to kanban are
done and finally pull mechanism and rule is established.
In the paper [11], the authors have described the implementation
of lean manufacturing in the leading autocomponent
manufacturing industry of south India. Value stream mapping is
the tool that authors have described. This tool is used to find the
sources of waste and ways to reduce the amount of waste. They
used three types of kanban-move kanban, production kanban, and
supplier kanban.
III. KANBAN FOUNDATION PRINCIPLES
Kanban technology is based on few major pillars:
1) Visualize the flow of work
The first step while implementing the kanban is to visualize the
steps that are currently being used to deliver the services and
work to the customer. [5] According to the complexity of the
process and number of products being produced the board
changes from simple to elaborate.
2) Reduce work in progress
It aims to make the mindset of the team to complete the work in
hand before new ones are started. The work in progress must be
finished and should be moved to the done column. This enhances
the amount of production in the system.
3) Manage flow
Inspite of various bottlenecks that arise at various stages of the
process at one point of time to another, this ensures that work is
done as fast as possible.
4) Make Policies Explicit
Along with visualizing the workflow the rules and guidelines that
are followed must also be clearly stated. So that all the
participants clearly understand how to do any type of work.
5) Implement feedback loops
Kanban board provides a feature of feedback loops and reviews
at various stages which provides continuous feedback and gives
an idea about the wrong track of any work. It ensures that the
right product is delivered to the customer in the shortest possible
time.
6) Improve Collaboratively
The kanban method of agile helps to evaluate the process
constantly and improve continuously gradually at a pace.
Fig2: Kanban board following various principles
IV. USE IN INDUSTRIES
Kanban was originated on an industry floor to enhance the
management of the supply of products. Kanban inventory
management system is cost-effective, so it is widely used in
many diverse industries. Management of inventory via the
Kanban system results in many benefits. Manufacturing through
kanban is advantageous as it applies an upper limit to the flow of
work, prevents overproduction, and provides a progress report.
Refilling of the inventory is done only after the depletion. This
helps the company decide which products are more in demand
than others. The feedback loops and reviewing feature improves
lead time and prevents overcapacity. Cost in buying the surplus
item gets reduced and space for storing large inventory also
reduces. It provides continuous improvement in the business.
Some of the industries are as follows:
1) RFID Kanban systems market analysis of medicines
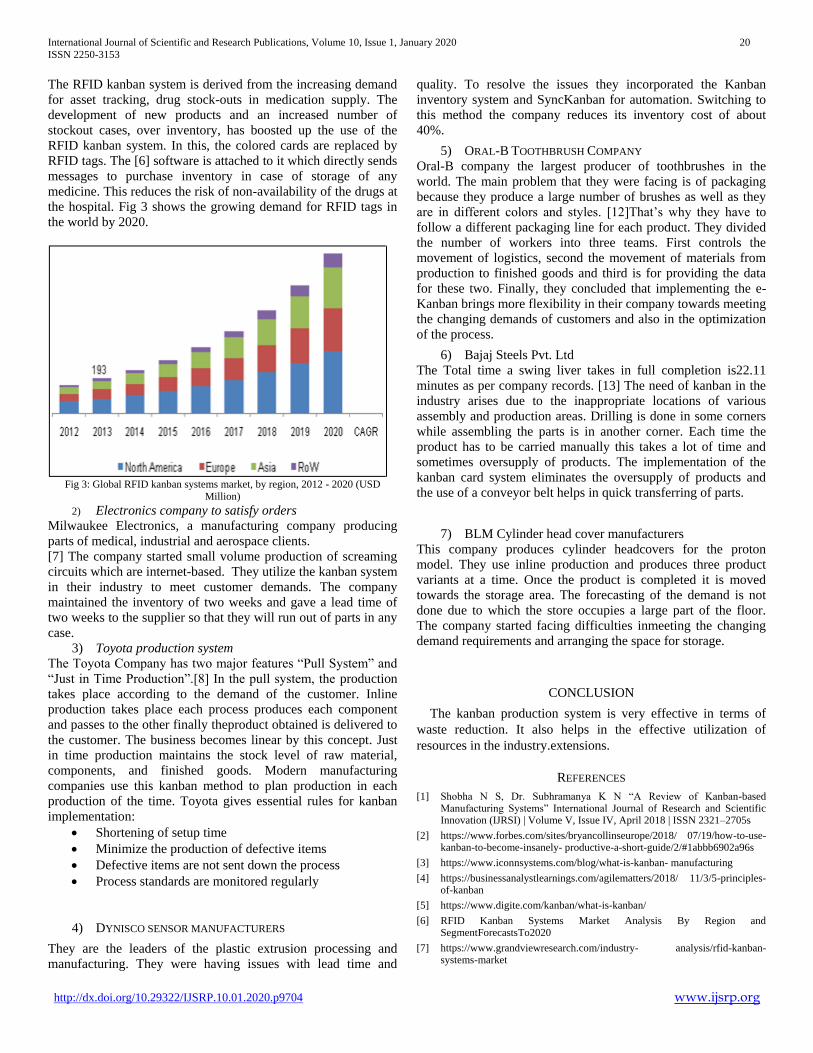
International Journal of Scientific and Research Publications, Volume 10, Issue 1, January 2020 20
ISSN 2250-3153
http://dx.doi.org/10.29322/IJSRP.10.01.2020.p9704 www.ijsrp.org
The RFID kanban system is derived from the increasing demand
for asset tracking, drug stock-outs in medication supply. The
development of new products and an increased number of
stockout cases, over inventory, has boosted up the use of the
RFID kanban system. In this, the colored cards are replaced by
RFID tags. The [6] software is attached to it which directly sends
messages to purchase inventory in case of storage of any
medicine. This reduces the risk of non-availability of the drugs at
the hospital. Fig 3 shows the growing demand for RFID tags in
the world by 2020.
Fig 3: Global RFID kanban systems market, by region, 2012 - 2020 (USD
Million)
2) Electronics company to satisfy orders
Milwaukee Electronics, a manufacturing company producing
parts of medical, industrial and aerospace clients.
[7] The company started small volume production of screaming
circuits which are internet-based. They utilize the kanban system
in their industry to meet customer demands. The company
maintained the inventory of two weeks and gave a lead time of
two weeks to the supplier so that they will run out of parts in any
case.
3) Toyota production system
The Toyota Company has two major features “Pull System” and
“Just in Time Production”.[8] In the pull system, the production
takes place according to the demand of the customer. Inline
production takes place each process produces each component
and passes to the other finally theproduct obtained is delivered to
the customer. The business becomes linear by this concept. Just
in time production maintains the stock level of raw material,
components, and finished goods. Modern manufacturing
companies use this kanban method to plan production in each
production of the time. Toyota gives essential rules for kanban
implementation:
Shortening of setup time
Minimize the production of defective items
Defective items are not sent down the process
Process standards are monitored regularly
4) DYNISCO SENSOR MANUFACTURERS
They are the leaders of the plastic extrusion processing and
manufacturing. They were having issues with lead time and
quality. To resolve the issues they incorporated the Kanban
inventory system and SyncKanban for automation. Switching to
this method the company reduces its inventory cost of about
40%.
5) ORAL-B TOOTHBRUSH COMPANY
Oral-B company the largest producer of toothbrushes in the
world. The main problem that they were facing is of packaging
because they produce a large number of brushes as well as they
are in different colors and styles. [12]That’s why they have to
follow a different packaging line for each product. They divided
the number of workers into three teams. First controls the
movement of logistics, second the movement of materials from
production to finished goods and third is for providing the data
for these two. Finally, they concluded that implementing the e-
Kanban brings more flexibility in their company towards meeting
the changing demands of customers and also in the optimization
of the process.
6) Bajaj Steels Pvt. Ltd
The Total time a swing liver takes in full completion is22.11
minutes as per company records. [13] The need of kanban in the
industry arises due to the inappropriate locations of various
assembly and production areas. Drilling is done in some corners
while assembling the parts is in another corner. Each time the
product has to be carried manually this takes a lot of time and
sometimes oversupply of products. The implementation of the
kanban card system eliminates the oversupply of products and
the use of a conveyor belt helps in quick transferring of parts.
7) BLM Cylinder head cover manufacturers
This company produces cylinder headcovers for the proton
model. They use inline production and produces three product
variants at a time. Once the product is completed it is moved
towards the storage area. The forecasting of the demand is not
done due to which the store occupies a large part of the floor.
The company started facing difficulties inmeeting the changing
demand requirements and arranging the space for storage.
CONCLUSION
The kanban production system is very effective in terms of
waste reduction. It also helps in the effective utilization of
resources in the industry.extensions.
REFERENCES
[1] Shobha N S, Dr. Subhramanya K N “A Review of Kanban-based Manufacturing Systems” International Journal of Research and Scientific Innovation (IJRSI) | Volume V, Issue IV, April 2018 | ISSN 2321–2705s
[2] https://www.forbes.com/sites/bryancollinseurope/2018/ 07/19/how-to-use-kanban-to-become-insanely- productive-a-short-guide/2/#1abbb6902a96s
[3] https://www.iconnsystems.com/blog/what-is-kanban- manufacturing
[4] https://businessanalystlearnings.com/agilematters/2018/ 11/3/5-principles-of-kanban
[5] https://www.digite.com/kanban/what-is-kanban/
[6] RFID Kanban Systems Market Analysis By Region and SegmentForecastsTo2020
[7] https://www.grandviewresearch.com/industry- analysis/rfid-kanban-systems-market

International Journal of Scientific and Research Publications, Volume 10, Issue 1, January 2020 21
ISSN 2250-3153
http://dx.doi.org/10.29322/IJSRP.10.01.2020.p9704 www.ijsrp.org
[8] https://www.smartsheet.com/understanding-kanban-inventory-management-and-its-uses-across-multiple- industries
[9] https://elsmar.com/pdf_files/Toyota%20Kanban%20System.p df
[10] Naufal, Ahmad A., Ahmed Jaffer, Noriah Yusoff & Nurul Hayati (2012). Development of kanban system at local manufacturing company in Malaysia – case study. Procedia Engineering, Vol. 41, 1721–1726. Elsevier Ltd
[11] https://medium.com/@digite/implementing-a- successful-kanban-system-for-manufacturing-and- inventory-management-be6d27147986
[12] [11] B.Vijaya Ramnath, C. Elanchezhian, R. Kesavan,” application of kanban system for implementing lean manufacturing”Journal of Engineering Research and Studies, Article 15 Jers Vol I Issue I July-Sept.2010
[13] [12] M.Raju Naik, E.Vijaya Kumar, B.Upender Goud,” Electronic Kanban System”, International Journal of Scientific and Research Publications, Volume 3, Issue 3, March 2013 1 ISSN 2250-3153
[14] Rajat B. Wakode, Laukik P. Raut, Pravin Talmale,” Overview on Kanban Methodology and its Implementation”,IJSRD - International Journal for Scientific Research & Development| Vol. 3, Issue 02, 2015 | ISSN (online): 2321-0613
[15] Vikram Abrol,ketan Shah,”Assessing Kanban fitment in the fliud and fast-paced world of software development”,Infosys 2018.
AUTHORS
First Author – Shivangi Agarwal is a M.Tech Student at SRMS
CET, Bareilly. She is doing her research in the field of Soft
Computing. She has published papers related to agile software
development and fuzzy logic. Her contact information is
Second Author – Mr. Ashish Agrawal is an assistant professor
at SRMS CET, Bareilly. He has been working in the field of
Agile software development for a long time. He has published
many research papers in international and national journal of
repute and conferences in collaboration with IEEE, Elsevier, CSi
etc. He is a life time member of Institute of Engineers India (IEI).
He has been felicitated with a citation by Dr. APJAKTU in 2019.
His contact information is [email protected]
International Journal of Scientific and Research Publications, Volume 10, Issue 1, January 2020 22
ISSN 2250-3153
http://dx.doi.org/10.29322/IJSRP.10.01.2020.p9705 www.ijsrp.org
Factors Influence on Usage of Information Systems
in Small and Medium Sized Enterprises in Ambagamuwa
Secretariat Division in Sri Lanka
Munasinghe PG1, Chandradasa KGSN2 and Wimalasiri PD
Faculty of Management Studies, Rajarata University of Sri Lanka
[email protected],[email protected], [email protected]
DOI: 10.29322/IJSRP.10.01.2020.p9705
http://dx.doi.org/10.29322/IJSRP.10.01.2020.p9705
Abstract- Small and Medium Sized Enterprises (SMEs) do
pivotal role in economy of a country. SMEs adapt to change
business environments to overcome challenges faster than larger
enterprises. The use of information systems (ISs) is very
important factor to adapt in changing business environment. The
majority of SMEs in Sri Lanka do not use ISs due to various
reasons. Therefore, objective of this study is to identify factors
influence on usage of ISs in SMEs. The research model was
developed using independent variables of Manager
Characteristics, Firm Characteristics, Cost, Infrastructure,
External Pressure, Legal & Regulations and dependent variable
of Use of ISs in SMEs. The administrative questionnaire was
developed and data were collected from 100 SMEs in
Ambagamuwa Secretariat Division in Sri Lanka using purposive
sampling. The results revealed that Manager Characteristics,
Firm Characteristics, Legal & Regulation and Cost were
statistically significant on influence to use of ISs by SMEs while
the Infrastructure Facilities and External Pressure were not
statistically significant. SMEs have to be enlightened the
advantages of use of ISs. The cost of technology has to be
reduced. Further, the government has to consider the legal and
regulation factors to influence the use of ISs by SMEs in Sri
Lanka.
.
Key Words- Small and Medium Sized Enterprises, Manager
Characteristics, Firm Characteristics, Legal & Regulation, Cost
1. Background of the Study
SMEs are seen as critical components in the economic growth of
developing countries because they are a major source of income,
promote entrepreneurship and provide employment. For this
reason, considerable attention is paid to positioning SMEs to
capture emerging business opportunities that have been created
by the emergence of knowledge-based societies (Nandan, 2012).
SMEs are considered key agents of social and economic growth
and they are increasingly becoming the most vital part of the
economy since they play a key role in fostering growth, creating
jobs and reducing poverty (Namani, 2009).
ISs support the decision-making process of SMEs. ISs can
provide a strategic role through using modern information
technology to assist in the creation and growth of creative and
unique products to SMEs that are hard to emulate. Activating the
strategic role of ISs are important for providing organizational
and technical requirements for information requirement of
strategic information planning as an important resource to
provide hardware and sophisticated systems ready for such
strategic planning, like decision support systems (Zafar,
Almaleh, Alshahri, Alqahtani, & Alqahtani, 2015).
SMEs adapt to the changing business environment and innovate
to overcome challenges faster than larger enterprises, while being
quick to change directions if the economic conditions change.
However, it is difficult to retain these capabilities more and more
without the adoption of Information and Communications
Technologies (ICT) to support their business processes. It has
been often said that ICT empower SMEs to overcome the
competitive disadvantages that they face due to small size,
limited resources, geographical locations and access to market
(Bose, 2011).
In spite of the potential benefits of ICT, found that the adoption
and use of these technologies have been challenging and slow
(Bose, 2011). The study of Munasinghe (2015) emphasize that
use of ISs are not success in every context due to various
reasons. Further, the study stated that the reasons of use of ISs
are not clear due to various reasons. More, Munasinghe &
Munasinghe (2015) mentioned that the growth of SMEs with the
technology is in Sri Lankan context unclear. Therefore, knowing
the reasons of not using ISs by SMEs are important for an
economy of a country and hence the objective of the study is to
find out the factors influence on usage of ISs in SMEs in
Ambagamuwa Secretariat Division in Sri Lanka.
Next section of the study reviews the literature relating to the
reasons of using ISs by organizations. Then it describes the
methodology, which was used to do the study. Then provides the
International Journal of Scientific and Research Publications, Volume 10, Issue 1, January 2020 23
ISSN 2250-3153
http://dx.doi.org/10.29322/IJSRP.10.01.2020.p9705 www.ijsrp.org
results of data analysis in detail and final section conclude the
study along with the implications of the study by providing
avenues for the future research.
II. Literature Review
The study of Jayasinghe & Wijayanayake (2013) mentioned that
there is no universal definition for SMEs. SMEs definition can
differ among different countries as well as within the country.
There are mainly three criteria used to define SMEs that is
Number of employees, Annual turnover and Asset value. Based
on the research study of the Munasinghe and Munasinghe (2015)
there were various kind of terms for address SMEs. They were
rural enterprises, micro enterprise, Small and medium industries,
small and medium activities cottage and small-scale industries
etc. SMEs defined as variation of ways by several countries,
various government agency, institutes and non-governmental
organization (NGO) using different parameters; such as amount
of capital invested, number of persons employed, amount of
turnover, nature of business etc.
The World Bank define enterprise size in Sri Lanka based on the
number of employees: those with fewer than 49 employees are
small; those with 50-99 employees are medium sized; and those
with more than 100 employees are large. A more recent World
Bank survey on Sri Lanka records approximately one million
people working in the manufacturing sector while the Survey of
Industries finds around 400,000 working in establishments
employing 25 or more workers. These numbers suggest that
SMEs contribute substantially to employment and income
generation (Kapurubandara & Lawson, 2006).
ICT has brought about changes in the way businesses are
conducted among SMEs as they play a major role in storing,
retrieving, processing and disseminating information. ICT tools
can significantly assist SMEs by supplying the required
infrastructure, which is necessary for providing appropriate types
of information at the right time (Olise, Anigbogu, Edoko, &
Okoli, 2014). Factors related to the CEO’s knowledge of ICT,
innovativeness, experience and active participation in the
implementation of significant systems in the firm. The factors
identified for use of ISs were separated into two main categories:
owner/manager characteristics, with the addition of return on
investment as an influencing factor (Akkeren & Cavaye, 1999).
Thong (1995) examined 166 small businesses that adopted ICT
and found that managers who are highly innovative and have a
positive attitude toward ICT together with a skilled ICT
background are more likely to be successful in adopting ICT. In
addition, the study describes two main categories of factors
influencing ICT adoption in small businesses. They were
individual characteristics (CEO innovativeness, attitudes towards
adoption of ICT and ICT knowledge) and organizational
characteristics (business size, competitiveness of environment,
information intensity).
According Akkeren & Cavaye (1999) to financial issues were
vitally important to owner/managers and often drive technology
adoption in small firms. An innovative small business owner may
recognize all the benefits to his firm in adopting ICT in terms of
both a short or long-term investment. Bose (2011) highlighted of
his study financial commitment includes both direct and indirect
costs were important for ISs usage. Direct costs include initial
cost of software and hardware, the cost of training personnel and
maintaining the system. The indirect costs can have longer
impacts and are often unforeseen by owner/managers of small
businesses due to lack of experience with enterprise IT project.
The study of Ladokun, Osunwole & Olaoye (2013) reveled that
infrastructure was one of the factors that inhibit ICT adoption by
SMEs. Thong (1999) mentioned that Small businesses typically
have less slack resources with which to absorb the shocks of an
unsuccessful investment in ISs adoption. According to
Kapurubandara & Lowson (2006) Lack of telecommunication
infrastructure includes poor internet connectivity, lack of fixed
telephone lines for end user dial-up access and the
underdeveloped state of Internet Service Providers were the
factors that hinder to adopt ICT in SMEs in developing countries.
External pressure like pressure from business trading partners is
one of the important predictor that has strong influence on
adoption of ICT. Lacking of pressure from their trading partners,
the business owner may perceived the technology as a waste of
resources (Thong, 1995). Environmental factors include markets,
competitive pressures, government rules and regulations, external
ICT advice, and pressure from suppliers, vendors, partners and
customers make reasons not to adopt ISs by SMEs. The adoption
and utilization of ICT increases if trading partners and customers
use the new technology (Elbeltagi & Elsetouhi, 2013).
According to Ladokun, Osunwole & Olaoye (2013) government
should enabling environment for SMEs to integrate ICT into
their operations in order for them to access global markets.
According to Namani (2003) the commitment of the government
is reflected in its steadily increasing investment in information
technology. The government should be involved in providing
environment to support and help SMEs to better use of
information technology and increase the countries
competitiveness, productivity and growth through investment in
information technology, e-business and new business models.
Alam and Noor (2009) examined the relationship between ICT
adoption and its five factors, which were perceived benefits,
perceived cost, ICT knowledge, external pressure and
government support. According to Kapurubandara & Lawson
(2006) revealed that the SMEs were hesitant to invest probably
due to fear of changing policies to suit changes of government.
The study of Munasinghe (2015) highlighted that the factors
behind the use of ISs were information quality, system quality
and user quality that are factors of ISs.
Based on the above literature review the study identified the
factors that influences to use ISs were Owner/Manager
Characteristics, Firms’ Characteristics, Cost, Infrastructure,
External Pressure and Legal & Regulations. Further, the study
focuses the following research model with the six hypotheses
(H1 to H6).
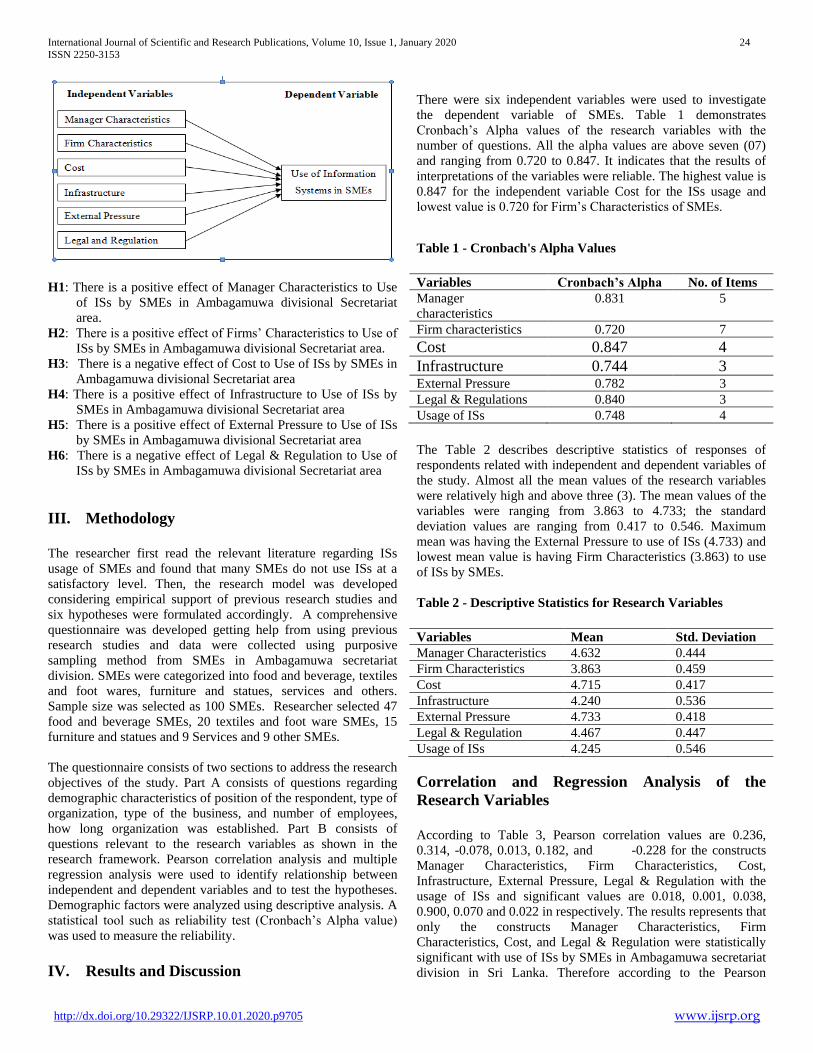
International Journal of Scientific and Research Publications, Volume 10, Issue 1, January 2020 24
ISSN 2250-3153
http://dx.doi.org/10.29322/IJSRP.10.01.2020.p9705 www.ijsrp.org
H1: There is a positive effect of Manager Characteristics to Use
of ISs by SMEs in Ambagamuwa divisional Secretariat
area.
H2: There is a positive effect of Firms’ Characteristics to Use of
ISs by SMEs in Ambagamuwa divisional Secretariat area.
H3: There is a negative effect of Cost to Use of ISs by SMEs in
Ambagamuwa divisional Secretariat area
H4: There is a positive effect of Infrastructure to Use of ISs by
SMEs in Ambagamuwa divisional Secretariat area
H5: There is a positive effect of External Pressure to Use of ISs
by SMEs in Ambagamuwa divisional Secretariat area
H6: There is a negative effect of Legal & Regulation to Use of
ISs by SMEs in Ambagamuwa divisional Secretariat area
III. Methodology
The researcher first read the relevant literature regarding ISs
usage of SMEs and found that many SMEs do not use ISs at a
satisfactory level. Then, the research model was developed
considering empirical support of previous research studies and
six hypotheses were formulated accordingly. A comprehensive
questionnaire was developed getting help from using previous
research studies and data were collected using purposive
sampling method from SMEs in Ambagamuwa secretariat
division. SMEs were categorized into food and beverage, textiles
and foot wares, furniture and statues, services and others.
Sample size was selected as 100 SMEs. Researcher selected 47
food and beverage SMEs, 20 textiles and foot ware SMEs, 15
furniture and statues and 9 Services and 9 other SMEs.
The questionnaire consists of two sections to address the research
objectives of the study. Part A consists of questions regarding
demographic characteristics of position of the respondent, type of
organization, type of the business, and number of employees,
how long organization was established. Part B consists of
questions relevant to the research variables as shown in the
research framework. Pearson correlation analysis and multiple
regression analysis were used to identify relationship between
independent and dependent variables and to test the hypotheses.
Demographic factors were analyzed using descriptive analysis. A
statistical tool such as reliability test (Cronbach’s Alpha value)
was used to measure the reliability.
IV. Results and Discussion
There were six independent variables were used to investigate
the dependent variable of SMEs. Table 1 demonstrates
Cronbach’s Alpha values of the research variables with the
number of questions. All the alpha values are above seven (07)
and ranging from 0.720 to 0.847. It indicates that the results of
interpretations of the variables were reliable. The highest value is
0.847 for the independent variable Cost for the ISs usage and
lowest value is 0.720 for Firm’s Characteristics of SMEs.
Table 1 - Cronbach's Alpha Values
Variables Cronbach’s Alpha No. of Items
Manager
characteristics
0.831 5
Firm characteristics 0.720 7
Cost 0.847 4
Infrastructure 0.744 3 External Pressure 0.782 3
Legal & Regulations 0.840 3
Usage of ISs 0.748 4
The Table 2 describes descriptive statistics of responses of
respondents related with independent and dependent variables of
the study. Almost all the mean values of the research variables
were relatively high and above three (3). The mean values of the
variables were ranging from 3.863 to 4.733; the standard
deviation values are ranging from 0.417 to 0.546. Maximum
mean was having the External Pressure to use of ISs (4.733) and
lowest mean value is having Firm Characteristics (3.863) to use
of ISs by SMEs.
Table 2 - Descriptive Statistics for Research Variables
Variables Mean Std. Deviation
Manager Characteristics 4.632 0.444
Firm Characteristics 3.863 0.459
Cost 4.715 0.417
Infrastructure 4.240 0.536
External Pressure 4.733 0.418
Legal & Regulation 4.467 0.447
Usage of ISs 4.245 0.546
Correlation and Regression Analysis of the
Research Variables
According to Table 3, Pearson correlation values are 0.236,
0.314, -0.078, 0.013, 0.182, and -0.228 for the constructs
Manager Characteristics, Firm Characteristics, Cost,
Infrastructure, External Pressure, Legal & Regulation with the
usage of ISs and significant values are 0.018, 0.001, 0.038,
0.900, 0.070 and 0.022 in respectively. The results represents that
only the constructs Manager Characteristics, Firm
Characteristics, Cost, and Legal & Regulation were statistically
significant with use of ISs by SMEs in Ambagamuwa secretariat
division in Sri Lanka. Therefore according to the Pearson

International Journal of Scientific and Research Publications, Volume 10, Issue 1, January 2020 25
ISSN 2250-3153
http://dx.doi.org/10.29322/IJSRP.10.01.2020.p9705 www.ijsrp.org
correlation values the hypothesis H1, H2, H3, H6 were accepted
and H4 and H5 were rejected.
Table 3 - Correlation Analysis (Pearson Correlation Value, (Sig. value)
Variable MC FC C I EP LR UISs
Manager
Characteristics (MC)
1
Firm Characteristics
(FC)
-0.110
(0.276)
1
Cost (C) 0.491**
(0.000)
.-0.069
(0.498)
1
Infrastructure (I) 0.140
(0.165)
0.090
(0.373)
0.245*
(0.014)
1
External Pressure (EP) 0.054
0.596
0.288*
(0.004)
0.033
0.746
-0.027
(0.790)
1
Legal & Regulation
(LR)
-0.069
(0.494)
-0.172
(0.086)
-0.205*
(0.041)
-0.219*
(0.028)
-0.120
0.234
1
Usage of ISs (UISs) 0.236*
(0.018)
0.314**
(0.001)
-0.078*
(0.038)
0.013
(0.900)
0.182
(0.070)
-0.228*
(0.022)
1
** Correlation is significant at the 0.01 level (2-tailed)
* Correlation is significant at the 0.05 level (2-tailed)
Table 4 display the output of regression analysis. Hence,
Adjusted R-Square value is 0.466, which means 46.6% of the
variation in influence to use of information systems can be
explained by the constructs of Manager Characteristics, Firm
Characteristics, Cost, Infrastructure, External Pressure, and Legal
& Regulation. The Durbin-Watson statistic of 1.585 is not too far
from 2. The p-value from the ANOVA table is 0.000 which less
than 0.001, which means that at least one of the six variables:
Manager Characteristics, Firm Characteristics, Cost,
Infrastructure, External Pressure, Legal & Regulation can be
used to model use of ISs by SMEs. The VIF values are below 5,
indicating that there is no problem of multicollinearity.
Table 4 - Regression Analysis
Variable B Sig VIF
(Constant) 3.413 0.005
Manager Characteristics
(MC)
.490 .000 1.339
Firm Characteristics (FC) .341 .003 1.152
Cost (C) -.378 .008 1.419
Infrastructure (I) -.044 .648 1.115
External Pressure (EP) .079 .519 1.113
Legal & Regulation (LR) -.260 .026 1.120
Adjusted R Square = 0.466, ANOVA Sig. = 0.000, F =
5.615 , Durbin-Watson = 1.585
Predictors: (Constant),MC, FC, C, I, EP, LR Dependent
Variable: UISs
According to Table 5, it is concluded that the hypotheses H1, H2,
H3 and H6 are supported considering the Correlation and
Regression Analysis. The hypothesis H4 and H5 are not
supported based on the correlation analysis and regression
analysis.
Table 5 - Summary of hypotheses testin
Hypotheses Correlation
Analysis
Regression
Analysis
H1 Supported Supported
H2 Supported Supported
H3 Supported Supported
H4 Not Supported Not Supported
H5 Not Supported Not Supported
H6 Supported Supported
V. Conclusion and Recommendation
Role of SMEs is very important for economy of a country. Use
of ISs improves the functions of SMEs in competitive and
changing business environment. Most of SMEs do not use ISs at
satisfactory level due to various reasons. Therefore, the study
focuses the factors behind the influence to use of ISs in
Ambagamuwa secretariat division in Sri Lanka.
The identified factors of the study to influence to use of ISs by
SMEs were Manager Characteristics, Firm Characteristics, Cost,
Infrastructures, External Pressure, Legal and Regulations. The
research model was developed using above factors as
independent variables and Use of ISs as dependent variable.
Using an administrative questionnaire data were collected using
purposive sampling. Among the factors, only Manager
Characteristics, Firm Characteristics, Cost, Legal and
Regulations were statistically significant to use of ISs by SMEs

International Journal of Scientific and Research Publications, Volume 10, Issue 1, January 2020 26
ISSN 2250-3153
http://dx.doi.org/10.29322/IJSRP.10.01.2020.p9705 www.ijsrp.org
in Ambagamuwa secretariat division. SMEs have to be
enlightened the advantages of use of ISs and the same time the
cost for technology is to be used in SMEs has to be reduced by
the relevant stakeholders. The government has to consider the
legal and regulation factors to influence the use of ISs by SMEs
in Sri Lanka.
According to the analysis, only a 46% explain the variances of
independent variables by influence to use of ISs in
Ambagamuwa secretariat division. This implies that more
research variables such as perceived usefulness, perceived ease
of use, information quality, system quality and user quality etc.
have to be considered to identify the factors, which influence to
use of ISs, by SMEs. Further, more samples have to be
considered which are covering all secretariats divisional in Sri
Lanka to generalize the results in local context.
VI. References
[1] Akkeren, J. V., & Cavaye, A. (1999). Factors Affecting Entry-Level Internet
Technology Adoption By Small Business In Australia: An Empirical Study.
Proc. 10 th Australasian Conference on Information Systems, 1071-1083
[2] Alam, S. S., & Noor, K. M. (2009). ICT Adoption in Small and Medium
Enterprises: An Empirical Evidence of Service Sectors in Malaysia.
International Journal of Business and Management, 4(2), 112-125
[3] Bose, U. (2011). An Exploratory Study of Adoption of Information
Technology by Small and Medium Businesses. Issues in Information
Systems, 12(1), 373-381.
[4] Elbeltagi, I., & Elsetouhi, A. (2013, April-June). The Role of the Owner-
Manager in SMEs' Adoption of Information and Communication Technology
in the United. Journal of Global Information Management, 21(2), 23-50
[5] Jayasinghe, S. S., & Wijayanayake, J. I. (2013). Feasibility Assessment
Model for Successful Adoption of Information Systems in Small and
Medium Enterprises. J. Sci. Univ. Kelaniya, 01-18.
[6] Kapurubandara, M., & Lawson, R. (2006, December 9). Barriers to
Adopting ICT and E-Commerce with SMEs in Developing Countries: An
Exploratory Study in Sri Lanka. Collecter, CollECTeR ’06, 9
[7] Ladokun, I. O., Osunwole, O. O., & Olaoye, B. O. (2013, November).
Information and Communication Technology in Small and Medium
Enterprises: Factors Affecting the Adoption and Use of ICT in Nigeria.
International Journal of Academic Research in Economics and
Management Sciences, 2(6), 74-84.
[8] Munasinghe, P. G. and Munasinghe, D. S. (2015). Factors Influence on
Usage of Computerized Accounting System on Small and Medium Scale
Enterprises (June 12, 2015). International Conference on Contemporary
Management, Faculty of Management Studies and Commerce, University
of Jaffna, 2015. Available at SSRN: https://ssrn.com/abstract=2644741.
[9] Munasinghe, P. G.(2015). Success of Information Systems Usage in
Government Organizations in the North Central Province in Sri Lanka
(January 26, 2016). Third International Research Symposium, Rajarata
University of Sri Lanka, p.422-427. Available at SSRN:
https://ssrn.com/abstract=2723353.
[10] Namani, M. B. (2009). The Role of Information Technology in Small and
Medium Sized Enterprises in Kosova. Fulbright Academy 2009
Conference. Sri Lankan Journal of Management.
[11] Nandan, S. (2012). Adoption of Information and Communication
Technology in Small and Medium Enterprises: A Synthesis of Literature.
Sri Lankan Journal of Management. 14(2), 18-40.
[12] Olise, M. C., Anigbogu, T. U., Edoko, T. D., & Okoli, M. I. (2014, July).
Determinants of ICT Adoption for Improved SME's Performance in
Anambra State, Nigeria. American International Journal of Contemporary
Research, 4(7).
[13] Thong, J. (1995). CEO Characteristics, Organizational Characteristics and
Information Technology Adoption in Small Businesses. Information
Technology. Omega, Int. J. Mgmt Sci., 23(4), 429-442.
[14] Thong, J. Y. (1999). An Intergrated Model of Informtion Systems
Adoption in Small Business. Journal of Management Information Systems,
15(4), 187-214.
[15] Zafar, A., Almaleh, A., Alshashri, S., Alqahtani, S. S., & Alqahtani, N. D.
(2015, May). Role of Information Systems in KSA Small and Medium
Enterprises (SMEs). International Journal of Advanced Research in
Computer and Communication Engineering, 4(5), 6-11.
VII. Authors
First Author – Munasinghe PG (B.Sc,M.Sc.), Senior Lecturer,
Faculty of Management Studies, Rajarata University of Sri Lanka.
Second Author – Wimalasiri (B.Sc,M.Sc.), Lecturer, Faculty of
Management Studies, Rajarata University of Sri Lanka.
Third Author – Chandradasa KGSN, (B.Sc) , Faculty of
Management Studies, Rajarata University of Sri Lanka.
Correspondence Author – Wimalasiri (B.Sc,M.Sc.), Lecturer, Faculty of Management Studies, Rajarata University of Sri Lanka
International Journal of Scientific and Research Publications, Volume 10, Issue 1, January 2020 27
ISSN 2250-3153
http://dx.doi.org/10.29322/IJSRP.10.01.2020.p9706 www.ijsrp.org
The Relationship Between Homocysteine Levels With
The Degree of Severity In Patients With Acute Phase
Ischemic Stroke At Haji Adam Malik General Hospital
Medan
Rosa Zorayatamin Damanik*, Ratna Akbari Ganie**, Iskandar Nasution***
*Post Graduate of Clinical Pathology, Faculty of Medicine Universitas Sumatera Utara,Medan,Indonesia
** Departement of Clinical Pathology, Faculty of Medicine,Universitas Sumatera Utara,Medan,Indonesia
***Departement of Neurology, Faculty of medicine,Universitas Sumatera Utara,Medan,Indonesia
DOI: 10.29322/IJSRP.10.01.2020.p9706
http://dx.doi.org/10.29322/IJSRP.10.01.2020.p9706
Abstract:
Background: Elevated homocysteine levels are an independent risk factor for ischemic stroke patients.
Besides being an independent risk factor, homocysteine is also a factor that affects the prognosis of stroke,
but the results are still controversial.
Objective: To Determine the relationship between homocysteine levels with the degree of severity in
patients with acute phase ischemic stroke.
Methods: An analytical study with cross sectional design, involving 45 acute phase ischemic stroke patients
who were hospitalized in the stroke corner room at Haji Adam Malik General Hospital, Medan.
Homocysteine levels are grouped into 2 categories, namely high homocysteine levels (> 15 μmol / l) normal
(≤15 μmol / l). The severity of acute phase ischemic stroke was examined using National Institute of Health
Stroke Scale (NIHSS).
Results: Acute phase ischemic stroke patients have homocysteine levels of at least 4,4 μmol/l and
maximum 24.1 μmol / l with average 11.5 μmol / l. 34 peoples (75,6%) suffers mild stroke and 11 people
(24,4%) with moderate stroke. The logistic regression test results showed homocysteine levels were related
to the severity of acute phase ischemic stroke. This means that acute phase ischemic stroke patients who
have high homocysteine levels are estimated as predictors to increase the risk of acute phase ischemic stroke
severity by 6,960 times compared to normal homocysteine levels (p = 0,005; OR = 6,960; 95% CI; 1,523-
31,811).
Conclusions: Homocysteine levels show a strong relationship with the severity of acute phase ischemic
stroke.
Index term- Homocysteine levels, acute phase ischemic stroke, NIHSS
I. Introduction
International Journal of Scientific and Research Publications, Volume 10, Issue 1, January 2020 28
ISSN 2250-3153
http://dx.doi.org/10.29322/IJSRP.10.01.2020.p9706 www.ijsrp.org
Stroke is a clinical sign that develops rapidly due to focal (or global) brain disorders with
symptoms that last for 24 hours or more and can cause death without any other obvious cause other than
vascular.1 Each year there are 795,000 peoples diagnosed with First or recurrent stroke. Approximately
610,000 of the population are patients with the first stroke and 185,000 are patients with recurrent stroke.2
Countries in the Asian, Russian and Eastern European regions experience the highest mortality rates
and disabilities due to stroke.3 In China, the incidence of stroke is expected to increase dramatically due to
a combination of an aging population and high prevalence of smoking and hypertension.
Mortality rates in ASEAN countries are more varied. Data from the South East Asia Medical
Information Center (SEAMIC) shows that stroke is the number four cause of death in ASEAN countries
since 1992, number one is Indonesia, second are the Philippines and Singapore, third are Brunei, Malaysia
and Thailand.
Data from Basic Health Research (Riskesdas) in 2007 showed that stroke is the leading cause of
death at all ages with percentage of 15.4%. Every 7 people who died in Indonesia, 1 of them due to a
stroke.5 Riskesdas( 2013) data reported the prevalence of stroke in Indonesia was 7.0 per 1,000 population.
This number has increased from 2007 with a prevalence of 6 per 1,000 population.6
Patient who has stroke will experience a rapid decline in some functions of the brain because there
is an interruption of blood supply to the brain.7 In general, NSA (National Stroke Association) USA divides
the stroke into ischemic stroke and Hemorrhagic stroke.8 Ischemic stroke can be caused by three
mechanisms, namely thrombosis, embolism, and reduction of overall systemic perfusion that causes
hypoxia, where thrombosis and embolism are based on atherosclerotic plaque.9,10
there are several conventional risk factors due to abnormalities in the brain vessel wall, including:
genetic, stress, hypertension, smoking, hyperlipidemia, and Diabetes Mellitus (DM).12 In recent years there
is independent risk factor that holds an important role in the occurrence of abnormalities of blood vessel
walls, namely homocysteine. Homocysteine is an amino acid that has a sulfur group involved in the
methionine cycle, namely in the remetilation pathway and the transulfuration pathway. The function of this
cycle is to donate the required methyl groups to various body molecules and the synthesis of glutathione.13,14
Total Normal Homocysteine concentration (tHcy) ranges from 5-15 μmol / L in the fasting state.
Hyperhomocysteinemia (HHcy) are classified as moderate (plasma tHcy concentration 15–30 µmol / L),
intermediate (plasma tHcy concentration 31–100 µmol / L), and high (plasma tHcy concentration > 100
μmol / L). genetic factors can have an impact on plasma tHcy. Sex, aging, smoking, impaired kidney
function, and some drugs such as corticosteroids and cyclosporine are some examples of acquired causes.
C677T homozygous mutation of 5.10 Methylene Tetra Hydro Folate Reductase (MTHFR) is the main
genetic factor.16,17
Several studies reported that high tHcy is a strong and independent risk factor for vascular disease
including cerebral ischemic stroke in 109 young Asian adults (Chinese, Indian, and Malay) with ischemic
stroke and had strong association between increased Hcy and ischemic stroke (OR = 5.17, 95% CI: 1.96–
13.63, p = 0.001) .18 Other studies of 120 Indian patients with acute ischemic stroke and reported that there
was a significant relationship between HHcy and ischemic stroke (p = 0.001 ) .19
Research results in the Krishna District, Andhra Pradesh, India conclude that increased serum
homocysteine is a strong and modifiable risk factor for cerebral ischemic stroke. Many studies show the
importance of the development of complications such as cardiac vascular and cerebral ischemic stroke. The
results of this study support the consideration of serum homocysteine as a marker of routine screening.20
The results from research in Iran, conclude that high levels of Hcy is an independent risk factor for ischemic
stroke patients living in the Iranian province of Fars. In addition, there is a significant relationship between
increased levels of Hcy and the risk of death. 21
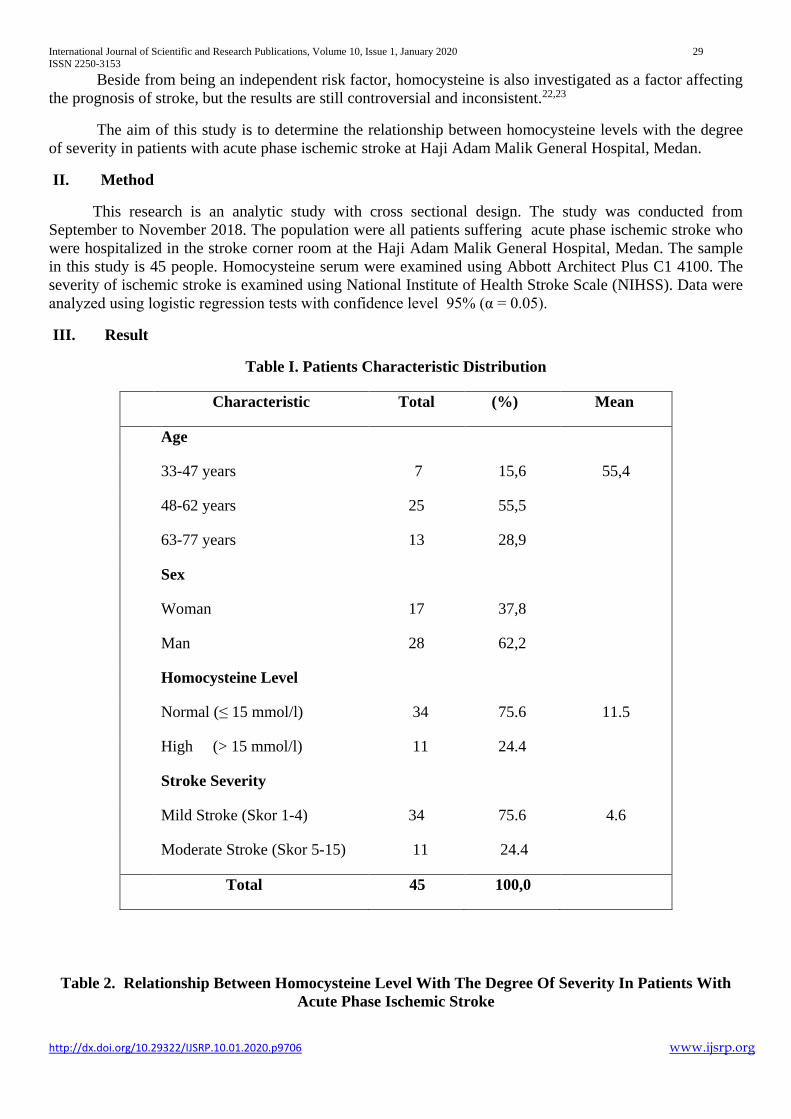
International Journal of Scientific and Research Publications, Volume 10, Issue 1, January 2020 29
ISSN 2250-3153
http://dx.doi.org/10.29322/IJSRP.10.01.2020.p9706 www.ijsrp.org
Beside from being an independent risk factor, homocysteine is also investigated as a factor affecting
the prognosis of stroke, but the results are still controversial and inconsistent.22,23
The aim of this study is to determine the relationship between homocysteine levels with the degree
of severity in patients with acute phase ischemic stroke at Haji Adam Malik General Hospital, Medan.
II. Method
This research is an analytic study with cross sectional design. The study was conducted from
September to November 2018. The population were all patients suffering acute phase ischemic stroke who
were hospitalized in the stroke corner room at the Haji Adam Malik General Hospital, Medan. The sample
in this study is 45 people. Homocysteine serum were examined using Abbott Architect Plus C1 4100. The
severity of ischemic stroke is examined using National Institute of Health Stroke Scale (NIHSS). Data were
analyzed using logistic regression tests with confidence level 95% (α = 0.05).
III. Result
Table I. Patients Characteristic Distribution
Characteristic Total (%) Mean
Age
33-47 years 7 15,6 55,4
48-62 years 25 55,5
63-77 years 13 28,9
Sex
Woman 17 37,8
Man 28 62,2
Homocysteine Level
Normal (≤ 15 mmol/l) 34 75.6 11.5
High (> 15 mmol/l) 11 24.4
Stroke Severity
Mild Stroke (Skor 1-4) 34 75.6 4.6
Moderate Stroke (Skor 5-15) 11 24.4
Total 45 100,0
Table 2. Relationship Between Homocysteine Level With The Degree Of Severity In Patients With
Acute Phase Ischemic Stroke
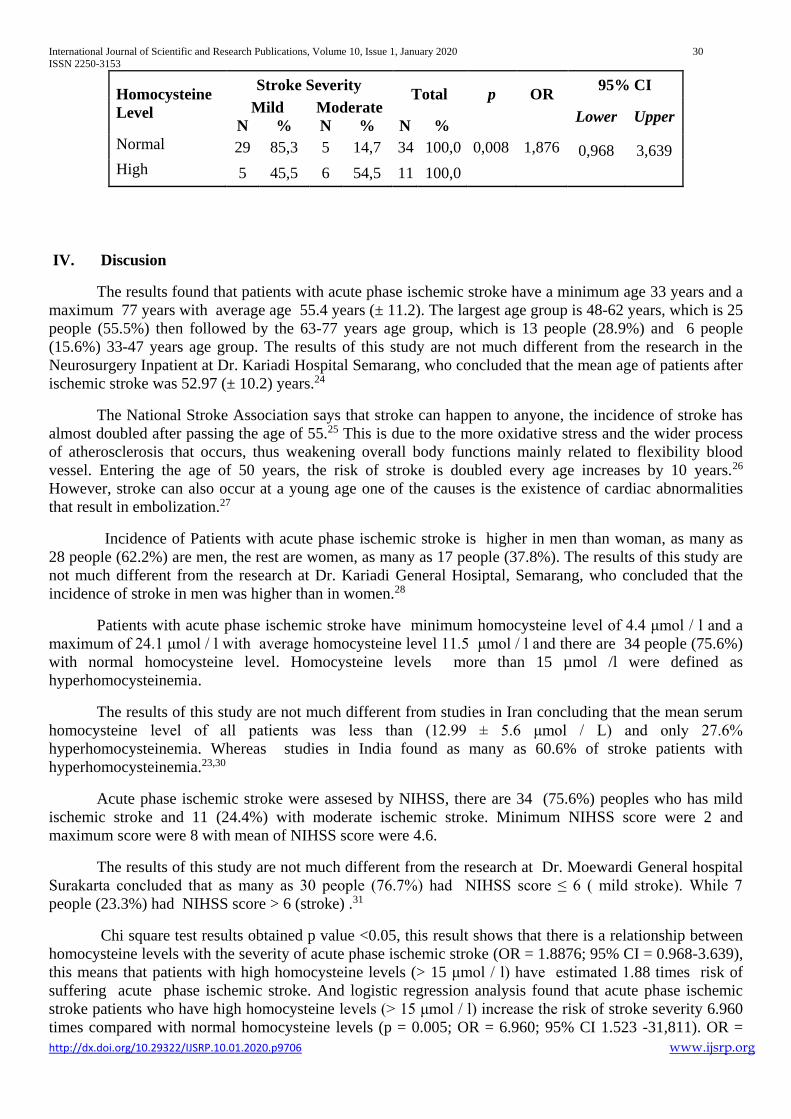
International Journal of Scientific and Research Publications, Volume 10, Issue 1, January 2020 30
ISSN 2250-3153
http://dx.doi.org/10.29322/IJSRP.10.01.2020.p9706 www.ijsrp.org
Homocysteine
Level
Stroke Severity Total p
OR
95% CI
Mild Moderate Lower Upper
N % N % N %
Normal 29 85,3 5 14,7 34 100,0 0,008 1,876 0,968 3,639
High 5 45,5 6 54,5 11 100,0
IV. Discusion
The results found that patients with acute phase ischemic stroke have a minimum age 33 years and a
maximum 77 years with average age 55.4 years (± 11.2). The largest age group is 48-62 years, which is 25
people (55.5%) then followed by the 63-77 years age group, which is 13 people (28.9%) and 6 people
(15.6%) 33-47 years age group. The results of this study are not much different from the research in the
Neurosurgery Inpatient at Dr. Kariadi Hospital Semarang, who concluded that the mean age of patients after
ischemic stroke was 52.97 (± 10.2) years.24
The National Stroke Association says that stroke can happen to anyone, the incidence of stroke has
almost doubled after passing the age of 55.25 This is due to the more oxidative stress and the wider process
of atherosclerosis that occurs, thus weakening overall body functions mainly related to flexibility blood
vessel. Entering the age of 50 years, the risk of stroke is doubled every age increases by 10 years.26
However, stroke can also occur at a young age one of the causes is the existence of cardiac abnormalities
that result in embolization.27
Incidence of Patients with acute phase ischemic stroke is higher in men than woman, as many as
28 people (62.2%) are men, the rest are women, as many as 17 people (37.8%). The results of this study are
not much different from the research at Dr. Kariadi General Hosiptal, Semarang, who concluded that the
incidence of stroke in men was higher than in women.28
Patients with acute phase ischemic stroke have minimum homocysteine level of 4.4 μmol / l and a
maximum of 24.1 μmol / l with average homocysteine level 11.5 μmol / l and there are 34 people (75.6%)
with normal homocysteine level. Homocysteine levels more than 15 µmol /l were defined as
hyperhomocysteinemia.
The results of this study are not much different from studies in Iran concluding that the mean serum
homocysteine level of all patients was less than (12.99 ± 5.6 μmol / L) and only 27.6%
hyperhomocysteinemia. Whereas studies in India found as many as 60.6% of stroke patients with
hyperhomocysteinemia.23,30
Acute phase ischemic stroke were assesed by NIHSS, there are 34 (75.6%) peoples who has mild
ischemic stroke and 11 (24.4%) with moderate ischemic stroke. Minimum NIHSS score were 2 and
maximum score were 8 with mean of NIHSS score were 4.6.
The results of this study are not much different from the research at Dr. Moewardi General hospital
Surakarta concluded that as many as 30 people (76.7%) had NIHSS score ≤ 6 ( mild stroke). While 7
people (23.3%) had NIHSS score > 6 (stroke) .31
Chi square test results obtained p value <0.05, this result shows that there is a relationship between
homocysteine levels with the severity of acute phase ischemic stroke (OR = 1.8876; 95% CI = 0.968-3.639),
this means that patients with high homocysteine levels (> 15 μmol / l) have estimated 1.88 times risk of
suffering acute phase ischemic stroke. And logistic regression analysis found that acute phase ischemic
stroke patients who have high homocysteine levels (> 15 μmol / l) increase the risk of stroke severity 6.960
times compared with normal homocysteine levels (p = 0.005; OR = 6.960; 95% CI 1.523 -31,811). OR =
International Journal of Scientific and Research Publications, Volume 10, Issue 1, January 2020 31
ISSN 2250-3153
http://dx.doi.org/10.29322/IJSRP.10.01.2020.p9706 www.ijsrp.org
6.960 shows a strong relationship between the levels of comocysteine and the severity of acute phase
ischemic stroke.
The results of this study are not much different with the results of a study of 109 Asian adults
(Chinese, Indian, and Malay) finding a strong relationship between increased homocysteine levels and
ischemic stroke (OR = 5.17, 95% CI: 1.96–13.63, p = 0.001) .18 meanwhile the results of studies in India
with 120 patients with acute ischemic stroke showed that there was a significant relationship between levels
of homocysteine and ischemic stroke (p = 0.001) .19
The limitation of this study is that the evaluation of homocysteine levels was not measured before
the acute phase ischemic stroke occurs, so it cannot be compared with the acute phase ischemic
homocysteine levels.
V. Conclusion
Homocysteine levels have strong relationship with the severity of acute phase ischemic stroke. This
means that acute phase ischemic stroke patients who have high homocysteine levels are estimated to
increase the risk of the severity of acute phase ischemic stroke 6,960 times compared with normal
homocysteine levels (p = 0.005; OR = 6.960; 95% CI; 1.523–31.811). OR value = 6.960 shows a strong
relationship between the levels of comocysteine and the severity of acute phase ischemic stroke.
VI. Reference
1. World Health Organization (WHO). WHO STEPS Stroke Manual: the WHO STEPwise approach to stroke surveillance.
Geneva: World Health Organization; 2006. 4-6.
2. Benjamin, Emelia J., et al. Heart disease and stroke statistics-2017 update: a report from the American Heart Association.
Circulation, 2017, 135.10: e146-e603.
3. KIM, Anthony S.; Johnston, S. Claiborne. Global variation in the relative burden of stroke and ischemic heart disease.
Circulation, 2011, 124.3: 314-323.
4. Moran, Andrew, et al. Future cardiovascular disease in China: Markov model and risk factor scenario projections from the
coronary heart disease policy model–China. Circulation: Cardiovascular Quality and Outcomes, 2010, 3.3: 243-252.
5. Depkes RI. Riset Kesehatan Dasar (RISKESDAS) 2007. Lembaga Penerbitan Badan Litbangkes. Jakarta: Departemen
Kesehatan Republik Indonesia, 2007
6. Kemenkes RI. Riset Kesehatan Dasar (RISKESDAS) 2013. Lembaga Penerbitan Badan Litbangkes. Jakarta, 2013
7. Khan, Muhammad Nazim, et al. Serum total and HDL-cholesterol in ischemic and hemorrhagic stroke. Ann. Pak. Inst. Med.
Sci, 2014, 10.1: 22-6.
8. Soeharto, Iman. Serangan jantung dan stroke hubungannya dengan lemak & kolestrol. 2nd ed. Jakarta: PT Gramedia Pustaka
Utama, 2004.
9. Sjahrir H. Stroke Iskemik. Yandira Agung, Medan, 2003, 1-3.
10. Aminoff MJ, Greenberg DA, Simon RP. Clinical neurology. 6th ed. New York/Toronto: Lange Medical Books, 2005; p. 285-
319.
11. Bogousslavsky J, Lausanne P, Hennerici M.G,. Stroke prevention by the practitioner cerebrovascular disease. 2000: 9, 2-43.
12. Christina BG, Focus On Homocysateine, Springer Verlag Frence, 2001 : 11-79.
13. Clarke S, Banfield K. S-Adenosylmethionine-dependent methyltransferases. In: Carmel R, Jacobsen DW,
editors. Homocysteine in health and disease. Cambridge. Cambridge university press; 2001.p. 63-78.
14. Agarwal, Soumya, et al. Study of serum levels of Vitamin B12, folic acid, and homocysteine in vitiligo. Pigment
International, 2015, 2.2: 76.
15. Kuller, L. H., et al. Multiple Risk Factor Intervention Trial Research G. Lipoprotein particles, insulin, adiponectin, C-reactive
protein and risk of coronary heart disease among men with metabolic syndrome. Atherosclerosis, 2007, 195: 122-128.
16. Dierkes, Jutta; Westphal, Sabine. Effect of drugs on homocysteine concentrations. In: Seminars in vascular medicine.
Copyright© 2005 by Thieme Medical Publishers, Inc., 333 Seventh Avenue, New York, NY 10001 USA., 2005. p. 124-139..
17. Christopher, R., Nagaraja, D., Shankar, S.K.. Homocysteine and cerebral stroke in developing countries. Current Medicinal
Chemistry. 2007; 14(22): 2393-2401 [Pubmed]
18. Tan, Nigel Choon-Kiat, et al. Hyperhomocyst (e) inemia and risk of ischemic stroke among young Asian adults. Stroke,
2002, 33.8: 1956-1962.
19. Biswas, Arijit, et al. Homocystine levels, polymorphisms and the risk of ischemic stroke in young Asian Indians. Journal of
Stroke and Cerebrovascular Diseases, 2009, 18.2: 103-110.
International Journal of Scientific and Research Publications, Volume 10, Issue 1, January 2020 32
ISSN 2250-3153
http://dx.doi.org/10.29322/IJSRP.10.01.2020.p9706 www.ijsrp.org
20. Venkata Madhav, M., Anjaneya Prasad, V. and Pradeep Babu, K.V. Homocysteine as an Independent Risk Factor for
Cerebral Ischemic Stroke in South Indian Population in Rural Tertiary Care Centre. IOSR Journal of Dental and Medical
Sciences (IOSR-JDMS) e-ISSN: 2279-0853, p-ISSN: 2279-0861. Volume 6, Issue 5 (May.- Jun. 2013), PP 49-53.
21. Ashjazadeh, Nahid; Fathi, Morteza; Shariat, Abdohamid. Evaluation of homocysteine level as a risk factor among patients
with ischemic stroke and its subtypes. Iranian journal of medical sciences, 2013, 38.3: 233.
22. Okubadejo, Njideka U., et al. Exploratory study of plasma total homocysteine and its relationship to short-term outcome in
acute ischaemic stroke in Nigerians. BMC neurology, 2008, 8.1: 26.
23. Saberi, Alia, et al. Serum homocysteine and the short-term outcome of ischemic stroke. Journal of Neurology Research,
2014, 4.1: 15-21.
24. Yudawijaya, Agus; Kustiowati, Endang; Pemayun, Tjokorda Gde Dalem. Homosistein plasma dan perubahan skor fungsi
kognitif pada pasien pasca stroke iskemik. Media Medika Indonesiana, 2011, 45.1: 8-15.
25. ABD, Basim A. Mean platelet volume and its influence on the severity of acute ischemic stroke. Medical Journal of Babylon,
2014, 11.3: 500-506.
26. Lingga, Lanny. All About Stroke. Elex Media Komputindo, 2013.
27. Irfan, Muhammad. Fisioterapi bagi insan stroke. Yogyakarta: Graha Ilmu, 2010.
28. Widyayanto, Isnawan. Hubungan Antara Kadar Homosistein Serum Fase Akut dengan Kemandirian Fungsional Jangka
Pendek Pasien Stroke Iskemik. Medica Hospitalia-Journal Of Clinical Medicine, 2017, 3.1.
29. Burhanuddin, Mutmainna, et al. Faktor risiko kejadian stroke pada dewasa awal (18-40 tahun) di kota Makassar tahun 2010-
2012. 2013.
30. Kalita, Jayantee, et al. Relationship of homocysteine with other risk factors and outcome of ischemic stroke. Clinical
neurology and neurosurgery, 2009, 111.4: 364-367.
31. Sudianto, Rut Pamela. Hubungan Kadar Hemoglobin dengan Prognosis pada Pasien Stroke Iskemik di RSUD Dr. Moewardi.
2015.
32. Markišić, Merdin; Pavlović, Aleksandra M.; Pavlović, Dragan M. The impact of homocysteine, vitamin B12, and vitamin D
levels on functional outcome after first-ever Ischaemic stroke. BioMed research international, 2017, 2017.
33. Yaseen, Zainab, et al. “Prognostic Significance of Plasma Homocysteine and Malondialdehyde in Patients with Acute
Ischemic Stroke.” International Journal of Pharma Research and Health Sciences, 2015, 3. 727-736
Authors
First Author-Rosa Zorayatamin Damanik,Post Graduate of Clinical Pathology, Faculty of Medicine
Universitas Sumatera Utara, [email protected]
Second Author-Ratna Akbari Ganie Departement of Clinical Pathology, Faculty of Medicine,Universitas
Sumatera Utara
Third Author-Iskandar nasution,Departement of Neurology, Faculty of medicine,Universitas Sumatera
Utara

International Journal of Scientific and Research Publications, Volume 10, Issue 1, January 2020 33
ISSN 2250-3153
http://dx.doi.org/10.29322/IJSRP.10.01.2020.p9707 www.ijsrp.org
Cloud Computing Adoption by Public Hospitals in
Kenya: A Technological, Organisational and Behavioural
Perspective
Billy Ogwel*, Gabriel Otieno* George Odhiambo-Otieno*
* Department of Information Sciences, Rongo University
DOI: 10.29322/IJSRP.10.01.2020.p9707
http://dx.doi.org/10.29322/IJSRP.10.01.2020.p9707
Abstract- Cloud computing has emerged as a technological
paradigm to reduce Information Technology costs, foster
collaboration while increasing productivity, availability,
reliability, flexibility and minimizing response times. Despite
cloud computing offering numerous benefits to the health sector,
there are only few successful implementations. Adoption is slower
in healthcare sector compared to other industries. Furthermore,
there is little concerning the adoption and benefits of cloud
computing in Kenyan healthcare sector. This study integrated the
Technological Acceptance Model, Technology-Organization-
Environment model and the Theory of Planned Behaviour to
provide a richer theoretical lens for assessing factors affecting
cloud adoption. This study sought to determine the influence of
technological, organisational and behavioural contexts in cloud
computing adoption. The target population for this study were 114
healthcare personnel (facility in-charges and health records and
information officers) in Public hospitals. The study employed a
cross sectional survey in one-time data collection using
questionnaires from sampled personnel. Logistic regression was
used to establish the correlation between the projected factors and
adoption of cloud computing, and to show the strength of this
relationship. The cloud computing adoption prevalence was at
58% among public hospitals. In terms of cloud computing service
models among adopters, Software-as-a-Service was at 100%,
followed by Platform-as-a-Service at 5% while none had
implemented Infrastructure–as-a-Service. The study found out
that technological readiness, service quality, expert scarcity, top
management support, firm size, perceived usefulness, perceived
ease of use and social influence have a significant effect on cloud
computing adoption. The findings from this study will help
healthcare organisations to better understand what affects cloud
computing adoption and to guide them in the adoption process.
Cloud computing providers can also use the findings of this work
to address areas of concern thereby offering products and services
that have the confidence of healthcare institutions in Kenya.
Index Terms- Adoption, Cloud computing, Hospitals, Kenya,
Technology-Organization-Environment
1. INTRODUCTION
Organizations are under increasing pressure to cut on costs,
increase profitability and improve productivity in order to remain
relevant in a dynamic business environment [1].The Healthcare
industry is also evolving towards a consumer driven approach to
care and the need for greater collaboration [2] [3]. Cloud
computing has emerged as a major technological innovation to
reduce information technology(IT)costs, foster collaboration
while increasing productivity, availability, reliability, flexibility
and minimizing response times [4] [5].Cloud computing is
therefore an effective platform for healthcare organizations to
leverage so as to remain germane.
Cloud computing is the on-demand delivery of network access to
a shared pool of configurable computing resources-data storage
,networks, servers, applications and services-with minimal
management effort or provider interaction [6] .The healthcare
sector can greatly benefit from cloud computing. Healthcare
organizations can use cloud computing to achieve cost saving and
scalability. Cloud computing provides for pay-for-use computing
resources that supports the shift from capital-intensive technology
investments to operational costs. When a cloud infrastructure is
introduced in an enterprise, majority of the IT tasks is shifted to
providers, according to IBM IT labor costs is reduced by
50%.Energy costs for small business is also reduced by 90 % [7].
Cloud computing can also be leveraged to support data driven
healthcare delivery, enhance collaboration between different
stakeholders and support patient and family-centered care models.
Collaboration is vital to the healthcare industry; by allowing
professionals to store and access data remotely; healthcare
professionals around the world can gain access to patient data
immediately and offer care immediately. In addition ,cloud
computing allows remote conferencing, up-to-the-second updates
on healthcare developments and patient conditions; which
enhance collaboration and care quality [8].Data analytics has a
great potential to support clinical decision-making, enhance
patient safety and enable continuous learning process in the care
delivery process. However, traditional IT network platforms may
not easily fulfil the computational capabilities and flexibility it
demands. Healthcare providers can turn to cloud computing for
International Journal of Scientific and Research Publications, Volume 10, Issue 1, January 2020 34
ISSN 2250-3153
http://dx.doi.org/10.29322/IJSRP.10.01.2020.p9707 www.ijsrp.org
scalable storage capacity, greater processing power and timely
access [9].
Cloud computing can therefore be an effective platform for
healthcare organizations to leverage, in light of the evolution of
healthcare industry towards a consumer driven approach to care
and the need for greater collaboration. It has however not yet
placed a significant footprint in the healthcare sector in Kenya and
the decision to adopt a cloud-computing model is often
complicated by challenges and uncertainties about the expected
business value related to the new technology [10].
The global healthcare cloud computing market is expected to
reach $9.48 billion by 2020 up from $3.73 Billion in 2015
[11].This market is expected to be dominated by North America,
followed by Europe, Asia, and the Rest of the World. Cloud
computing and storage infrastructure is growing at an annual rate
of 33% worldwide [12]. Review of publications on cloud
computing at the global scene has revealed that research on the
Adoption aspect was only at 10% compared to the Technology
aspect that stood at 85%; this was explained that cloud computing
being a new paradigm is facing many technological challenges
[13].However more research efforts are needed to address this
worrying gap. Health Information Management Systems survey
[14] found out that 83% of IT healthcare organizations in the USA
are using cloud services with SaaS being the most popular service
model at 67%, however an earlier survey found Healthcare sector
to be ranked 7th out of Eight industries in cloud adoption , just
ahead of State and local government.
Cloud computing, in Europe, has evolved substantially; becoming
more robust, secure, open and interoperable. However, the uptake
in the European Healthcare sector has been slow; mainly due to a
fragmented regulatory framework and security concerns. The
fragmented regulatory framework has led to significant
differences among European Union (EU) countries concerning
cloud computing adoption. Denmark, Sweden, Finland, Austria
and Estonia have been much more open to remote storage and
archiving of patient data than the Leading EU economies; France,
Britain and Germany. Nordic countries lead in terms of cloud
computing market maturity in the healthcare sector; the
Netherlands, Estonia and Austria are in maturation phase while
Belgium, France, Germany, Italy, Spain, Switzerland and Britain
are emerging markets; each progressing at a different speed
[9].The EU healthcare sector has a higher adoption in primary care
and outpatient settings than in acute care. This is mainly due to the
need to host basic IT functions like scheduling, administration and
billing and patient records.
Researchers have indicated that actual adoption depends on sector
and enterprise size because of the different features and security
levels they need and that cloud adoption studies should be industry
specific [15] [16] [17]. Healthcare sector has also been slower to
adopt cloud computing compared with other industries as was seen
in USA and Europe [9]. The adoption has been slowed by
inadequate communication infrastructure, security concerns and a
fragmented regulatory framework [9].Despite the growing interest
in cloud computing in healthcare only, few successful
implementations yet exist [18].
The prevalence of cloud computing in Kenya is at 48% for
Medium and Large business [19].A survey by Communications
Authority and Kenya National Bureau of Statistics found out that
35.6% of public sector institutions use cloud computing services
compared to 22.9% of private ventures [20]. Despite the cloud
computing adoption accelerating, majority of public institutions
and private businesses are not on the cloud. The survey found out
that most businesses and public sector did not have a cogent plan
of adopting cloud computing. It further shows that the biggest
drawback was lack of knowledge; 53.1% of public institutions not
on the cloud and 37.1% of private businesses reported insufficient
knowledge about cloud services. Cost, a poor regulatory
framework and security concerns were also cited as hurdles.
As the quantity of electronically generated information in
healthcare increases, so does the need to be able to store, access
and share that data in an increasingly mobile world [21]. Deciding
how and where to store healthcare information, while allowing
secure, easy and shared access to that data, has been a persistent
problem. The acceptance of a person-centered care model within
healthcare has necessitated the need for shared access to the
information in a person’s electronic health record.
Cloud computing adoption processes faces a number of
challenges; technological uncertainty, software functionality,
demand uncertainty, organizational influence, importance of IT
applications and integration [22].Legal hurdles ,the possibility of
organizational transition, cost benefit evaluation drawbacks and
the choice of cloud vendors are other impediments that have to be
solved [23].There is need to understand the determinants, hurdles
and challenges involved in the adoption of cloud computing.
Cloud computing adoption in Kenya has been looked at in certain
sectors; insurance companies in Nairobi [24], Kenyan Universities
[25] and Tech industries in Nairobi [26]. However, there is limited
research within the Kenyan healthcare sector and because of the
sector specific-nature of cloud computing adoption, there exists a
gap in the healthcare sector that this study sought to close by
addressing the determinants of cloud computing adoption in the
healthcare industry within Kisumu County. The aim of this study
was to determine the prevalence of cloud computing and the
factors (technological, organizational and behavioural) affecting
cloud computing adoption among public hospitals in Kisumu
county, western Kenya.
2. Literature Review
2.1 cloud computing
Cloud computing is offered using three standard models; Software
as a Service (SaaS), Platform as a Service (PaaS) and
Infrastructure as a Service (IaaS) [27].SaaS entails the consumer
using provider applications over a cloud infrastructure through
either a program interface or a client interface like a web browser.
PaaS involves the consumer deploying consumer created or
acquired applications created using programming languages,
libraries, tools and services supported by the provider over a cloud
infrastructure managed by the provider. IaaS involves the
consumer accessing, processing, storage, networks and other
computing resources over which they can deploy and run software
like operating systems and applications.
International Journal of Scientific and Research Publications, Volume 10, Issue 1, January 2020 35
ISSN 2250-3153
http://dx.doi.org/10.29322/IJSRP.10.01.2020.p9707 www.ijsrp.org
Cloud computing can be deployed as a Private cloud, Public cloud
or Hybrid cloud. Private cloud refers to a cloud infrastructure run
solely for an organization while a public cloud refers to cloud
infrastructure rendered over a network that is open to the public
and Hybrid cloud refers to a combination of two or more clouds
offering the benefits of multiple deployment methods but remain
distinct entities [28].
Cloud computing offers healthcare organizations an array of
benefits; economic, operational and functional benefits. The
economic benefits of cloud computing include cost flexibility and
the potential for reduced costs. Heavy capital expenditure can be
avoided, since IT; resources are acquired on demand as needed
and paid for on a pay-per-use basis. Also, the cost of personnel
resources required to deploy and maintain IT resources are
included in the cost of cloud computing. Therefore, the need for
additional healthcare provider skilled IT staff resources and
related costs are reduced when using cloud services for IaaS and
PaaS platforms but even more so for SaaS solutions where the
cloud provider takes majority of the responsibility [29] [30].
From an operational outlook, cloud computing offers scalability
and the ability to adjust to demand rapidly. Cloud computing
offers better security and privacy for health data and health
systems. Cloud service provider data centers are highly secure and
well protected against outsider and insider threats using
administrative, physical and technical methods implemented and
maintained by expert professional staff. Cloud computing offers
sophisticated security controls, including data encryption and fine-
grained access controls and access logging. Medical systems built
using cloud services can provide web access to data, avoiding the
need to store information on client devices. The need for scarce IT
security skills within the healthcare organization also is
minimized. Cloud service providers typically operate on such a
scale that they have all the necessary IT skills, with the costs of
those skills spread across many customers [29].
In terms of functional perspective, cloud-based healthcare IT
systems offer the potential for broad interoperability and
integration. Healthcare cloud services are internet-based and
generally use standard protocols, so connecting them to other
systems and applications is typically straightforward. The critical
capability of cloud computing to share information easily and
securely enhances collaboration. Cloud computing offers remote
access to applications and data via the Internet to enable access at
anytime from anywhere [29].
2.2 Conceptual Framework
This study draws from the integrated Technology-Organization-
Environment (TOE), Technological Acceptance Model (TAM)
and Theory of Planned Behavior (TPB) frameworks to study the
adoption of cloud computing by public hospitals in Kisumu,
Western Kenya. Accordingly we looked at the influence of
technological, organizational and behavioral contexts on the
adoption of cloud computing .The TAM constructs of individual
different factors, perceived trust and perceived service quality
were integrated into TOE as well as the Behavior control and
Social Influence to provide a richer theoretical lens for
understanding cloud computing adoption as shown in Figure 1.
2.2.1 Technological context
Technological context refers to internal and external technologies
that health organizations can use in their operations [31].External
technologies are those that are available in the market but are not
used by the organization while internal technologies are those in
use by the organization. Technological context has three
constructs: technological readiness, service quality and expert
scarcity.
Technological readiness refers to availability of infrastructure and
human resource which influence adoption of new technology [31]
[32].Infrastructure refers to installed network technologies and
enterprise systems that provide a platform on which cloud
computing can be built on while human resource refers to
knowledge and skills needed to implement cloud computing.
Service Quality refers to the customer’s perception of the overall
quality or superiority of a service with respect to its intended
purpose. It is a reflection of cloud computing in the eyes of the
client’s. Expert Scarcity refers to lack of qualified and reputable
IT professionals in the cloud service market.
2.2.2 Organisational context
The organizational context refers to the characteristics and
resources of the organization .Organisational structure is
important in technology adoption and has an impact on the social
interaction among the company’s employees [33].The constructs
in organizational context are top management support, policy, firm
size and individual difference factors.
Top management support has a role in initiating, implementing
and adopting new technologies [34]. Top managers typically
support initiatives and get involved in making decisions of
adopting new technologies. Top managers set organizational
strategy and establish direction for new technologies like cloud
computing. Policy refers to principles, rules, and guidelines
formulated to reach certain long-term goals and provide an
enabling environment. Cloud computing transcends location,
geography and involves cross border data hosting and outsourcing
and because of this very nature several grey areas arise concerning
privacy, security and intellectual property. Government regulation
plays an important role in adoption of technological innovation
and as such cloud computing adoption can be encouraged or
discouraged by existing regulation [33] [35].
Firm size is a major factor affecting adoption of new technology
and it acts as resilience for environmental shocks. [36].Larger
enterprises have extra resources that motivate innovation
adoption. The uptake of internet and its infrastructures in business
is slower in smaller than in larger firms indicating that financial
constraints ,lack of professional expertise and short term
management perspectives are characteristics of small business, all
these are hindrances to adoption of cloud computing. The
individual difference factors can be measured by the education,
experience, age and gender. The adoption of cloud computing is
largely dependent on the individual difference factors of the
decision makers. The Idiosyncrasy of an organization is dependent
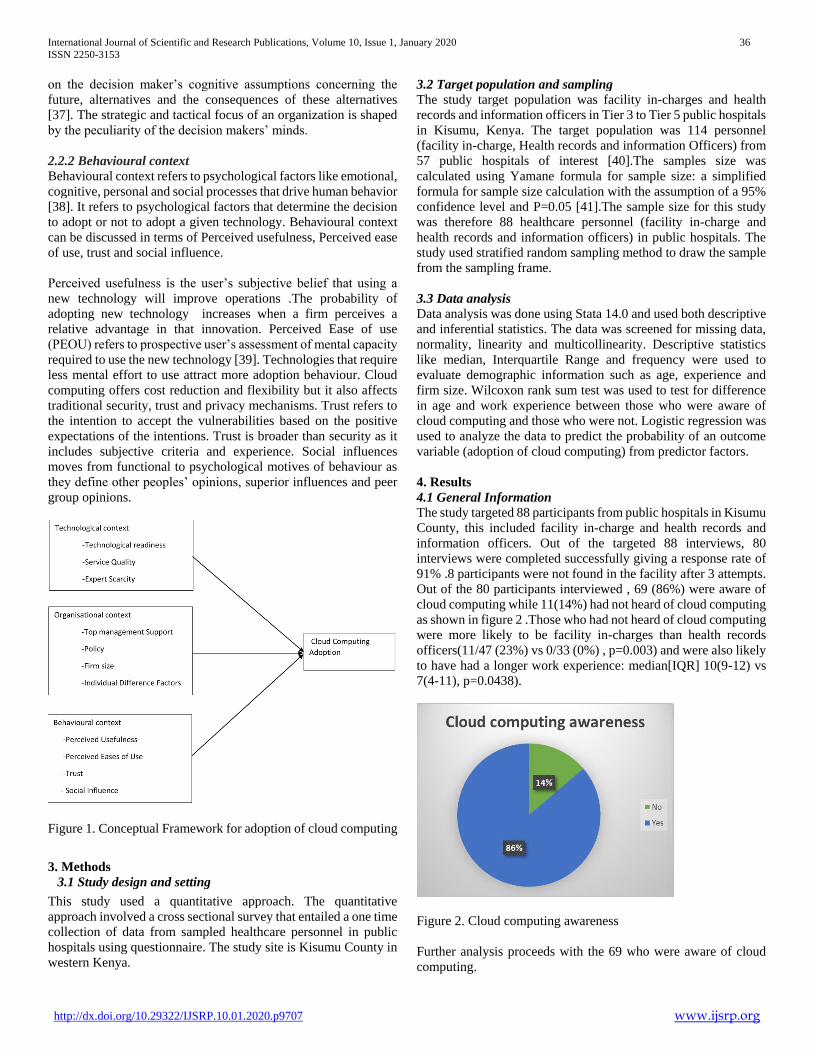
International Journal of Scientific and Research Publications, Volume 10, Issue 1, January 2020 36
ISSN 2250-3153
http://dx.doi.org/10.29322/IJSRP.10.01.2020.p9707 www.ijsrp.org
on the decision maker’s cognitive assumptions concerning the
future, alternatives and the consequences of these alternatives
[37]. The strategic and tactical focus of an organization is shaped
by the peculiarity of the decision makers’ minds.
2.2.2 Behavioural context
Behavioural context refers to psychological factors like emotional,
cognitive, personal and social processes that drive human behavior
[38]. It refers to psychological factors that determine the decision
to adopt or not to adopt a given technology. Behavioural context
can be discussed in terms of Perceived usefulness, Perceived ease
of use, trust and social influence.
Perceived usefulness is the user’s subjective belief that using a
new technology will improve operations .The probability of
adopting new technology increases when a firm perceives a
relative advantage in that innovation. Perceived Ease of use
(PEOU) refers to prospective user’s assessment of mental capacity
required to use the new technology [39]. Technologies that require
less mental effort to use attract more adoption behaviour. Cloud
computing offers cost reduction and flexibility but it also affects
traditional security, trust and privacy mechanisms. Trust refers to
the intention to accept the vulnerabilities based on the positive
expectations of the intentions. Trust is broader than security as it
includes subjective criteria and experience. Social influences
moves from functional to psychological motives of behaviour as
they define other peoples’ opinions, superior influences and peer
group opinions.
Figure 1. Conceptual Framework for adoption of cloud computing
3. Methods
3.1 Study design and setting
This study used a quantitative approach. The quantitative
approach involved a cross sectional survey that entailed a one time
collection of data from sampled healthcare personnel in public
hospitals using questionnaire. The study site is Kisumu County in
western Kenya.
3.2 Target population and sampling
The study target population was facility in-charges and health
records and information officers in Tier 3 to Tier 5 public hospitals
in Kisumu, Kenya. The target population was 114 personnel
(facility in-charge, Health records and information Officers) from
57 public hospitals of interest [40].The samples size was
calculated using Yamane formula for sample size: a simplified
formula for sample size calculation with the assumption of a 95%
confidence level and P=0.05 [41].The sample size for this study
was therefore 88 healthcare personnel (facility in-charge and
health records and information officers) in public hospitals. The
study used stratified random sampling method to draw the sample
from the sampling frame.
3.3 Data analysis
Data analysis was done using Stata 14.0 and used both descriptive
and inferential statistics. The data was screened for missing data,
normality, linearity and multicollinearity. Descriptive statistics
like median, Interquartile Range and frequency were used to
evaluate demographic information such as age, experience and
firm size. Wilcoxon rank sum test was used to test for difference
in age and work experience between those who were aware of
cloud computing and those who were not. Logistic regression was
used to analyze the data to predict the probability of an outcome
variable (adoption of cloud computing) from predictor factors.
4. Results
4.1 General Information
The study targeted 88 participants from public hospitals in Kisumu
County, this included facility in-charge and health records and
information officers. Out of the targeted 88 interviews, 80
interviews were completed successfully giving a response rate of
91% .8 participants were not found in the facility after 3 attempts.
Out of the 80 participants interviewed , 69 (86%) were aware of
cloud computing while 11(14%) had not heard of cloud computing
as shown in figure 2 .Those who had not heard of cloud computing
were more likely to be facility in-charges than health records
officers(11/47 (23%) vs 0/33 (0%) , p=0.003) and were also likely
to have had a longer work experience: median[IQR] 10(9-12) vs
7(4-11), p=0.0438).
Figure 2. Cloud computing awareness
Further analysis proceeds with the 69 who were aware of cloud
computing.
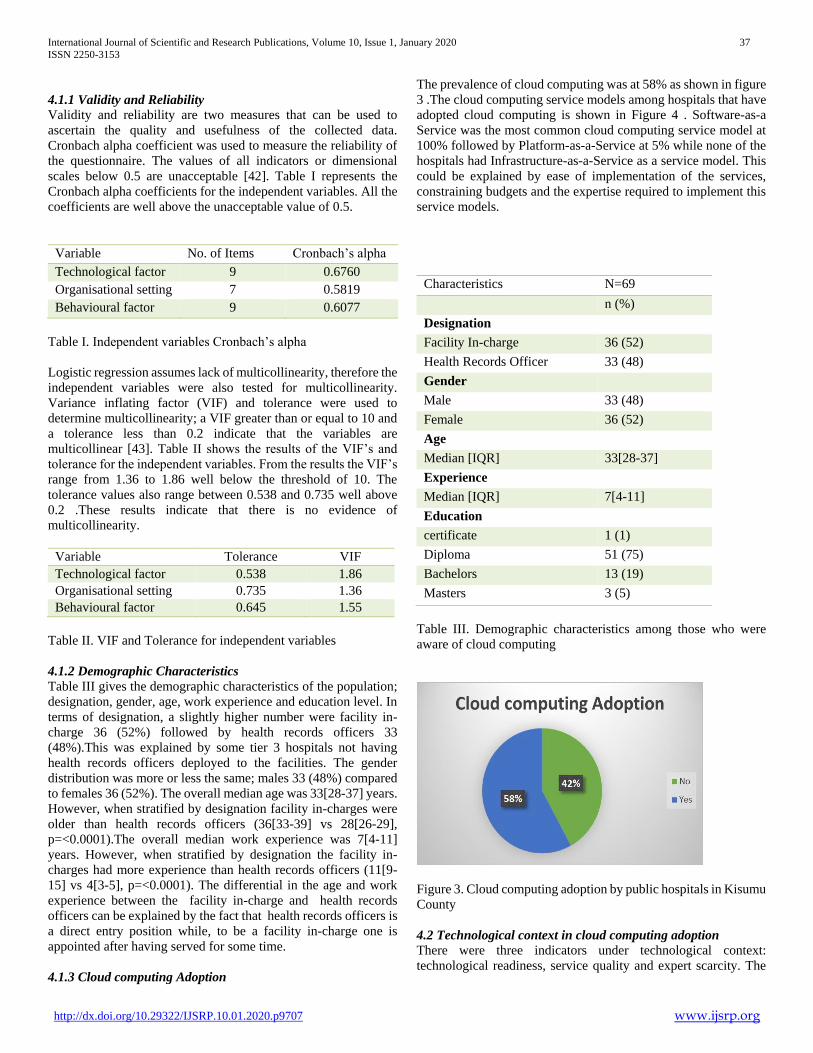
International Journal of Scientific and Research Publications, Volume 10, Issue 1, January 2020 37
ISSN 2250-3153
http://dx.doi.org/10.29322/IJSRP.10.01.2020.p9707 www.ijsrp.org
4.1.1 Validity and Reliability
Validity and reliability are two measures that can be used to
ascertain the quality and usefulness of the collected data.
Cronbach alpha coefficient was used to measure the reliability of
the questionnaire. The values of all indicators or dimensional
scales below 0.5 are unacceptable [42]. Table I represents the
Cronbach alpha coefficients for the independent variables. All the
coefficients are well above the unacceptable value of 0.5.
Variable No. of Items Cronbach’s alpha
Technological factor 9 0.6760
Organisational setting 7 0.5819
Behavioural factor 9 0.6077
Table I. Independent variables Cronbach’s alpha
Logistic regression assumes lack of multicollinearity, therefore the
independent variables were also tested for multicollinearity.
Variance inflating factor (VIF) and tolerance were used to
determine multicollinearity; a VIF greater than or equal to 10 and
a tolerance less than 0.2 indicate that the variables are
multicollinear [43]. Table II shows the results of the VIF’s and
tolerance for the independent variables. From the results the VIF’s
range from 1.36 to 1.86 well below the threshold of 10. The
tolerance values also range between 0.538 and 0.735 well above
0.2 .These results indicate that there is no evidence of
multicollinearity.
Variable Tolerance VIF
Technological factor 0.538 1.86
Organisational setting 0.735 1.36
Behavioural factor 0.645 1.55
Table II. VIF and Tolerance for independent variables
4.1.2 Demographic Characteristics
Table III gives the demographic characteristics of the population;
designation, gender, age, work experience and education level. In
terms of designation, a slightly higher number were facility in-
charge 36 (52%) followed by health records officers 33
(48%).This was explained by some tier 3 hospitals not having
health records officers deployed to the facilities. The gender
distribution was more or less the same; males 33 (48%) compared
to females 36 (52%). The overall median age was 33[28-37] years.
However, when stratified by designation facility in-charges were
older than health records officers (36[33-39] vs 28[26-29],
p=<0.0001).The overall median work experience was 7[4-11]
years. However, when stratified by designation the facility in-
charges had more experience than health records officers (11[9-
15] vs 4[3-5], p=<0.0001). The differential in the age and work
experience between the facility in-charge and health records
officers can be explained by the fact that health records officers is
a direct entry position while, to be a facility in-charge one is
appointed after having served for some time.
4.1.3 Cloud computing Adoption
The prevalence of cloud computing was at 58% as shown in figure
3 .The cloud computing service models among hospitals that have
adopted cloud computing is shown in Figure 4 . Software-as-a
Service was the most common cloud computing service model at
100% followed by Platform-as-a-Service at 5% while none of the
hospitals had Infrastructure-as-a-Service as a service model. This
could be explained by ease of implementation of the services,
constraining budgets and the expertise required to implement this
service models.
Characteristics N=69
n (%)
Designation
Facility In-charge 36 (52)
Health Records Officer 33 (48)
Gender
Male 33 (48)
Female 36 (52)
Age
Median [IQR] 33[28-37]
Experience
Median [IQR] 7[4-11]
Education
certificate 1 (1)
Diploma 51 (75)
Bachelors 13 (19)
Masters 3 (5)
Table III. Demographic characteristics among those who were
aware of cloud computing
Figure 3. Cloud computing adoption by public hospitals in Kisumu
County
4.2 Technological context in cloud computing adoption
There were three indicators under technological context:
technological readiness, service quality and expert scarcity. The
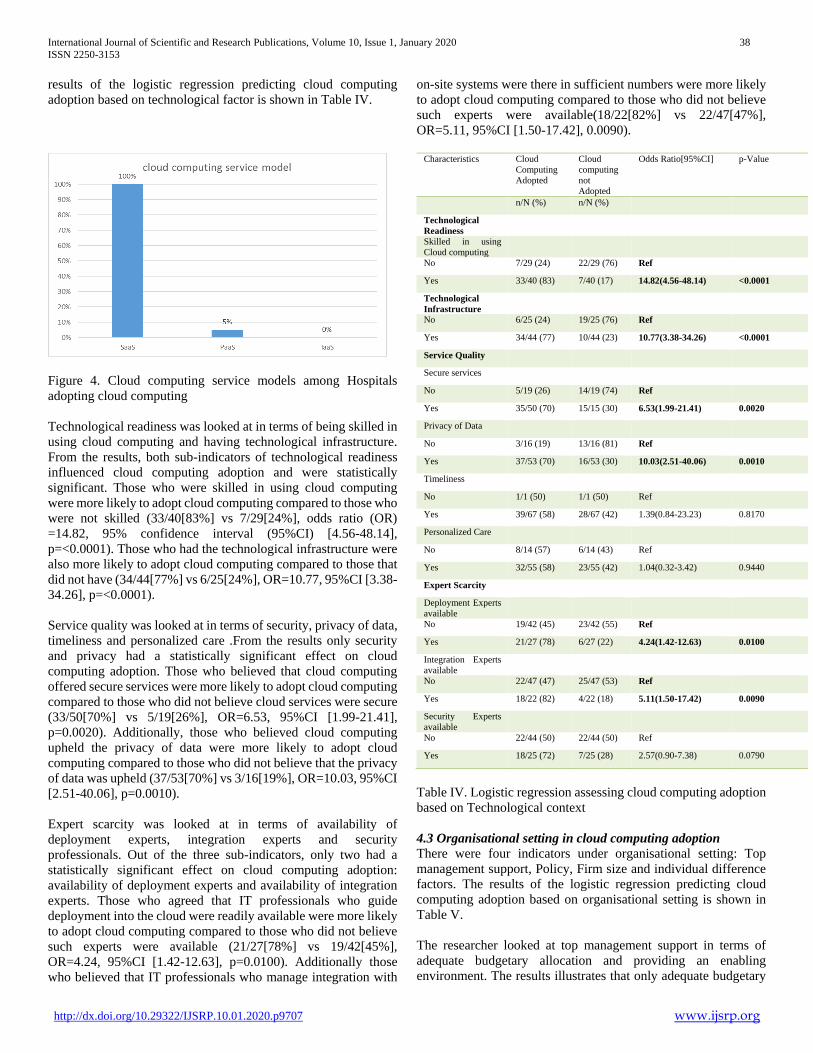
International Journal of Scientific and Research Publications, Volume 10, Issue 1, January 2020 38
ISSN 2250-3153
http://dx.doi.org/10.29322/IJSRP.10.01.2020.p9707 www.ijsrp.org
results of the logistic regression predicting cloud computing
adoption based on technological factor is shown in Table IV.
Figure 4. Cloud computing service models among Hospitals
adopting cloud computing
Technological readiness was looked at in terms of being skilled in
using cloud computing and having technological infrastructure.
From the results, both sub-indicators of technological readiness
influenced cloud computing adoption and were statistically
significant. Those who were skilled in using cloud computing
were more likely to adopt cloud computing compared to those who
were not skilled (33/40[83%] vs 7/29[24%], odds ratio (OR)
=14.82, 95% confidence interval (95%CI) [4.56-48.14],
p=<0.0001). Those who had the technological infrastructure were
also more likely to adopt cloud computing compared to those that
did not have (34/44[77%] vs 6/25[24%], OR=10.77, 95%CI [3.38-
34.26], p=<0.0001).
Service quality was looked at in terms of security, privacy of data,
timeliness and personalized care .From the results only security
and privacy had a statistically significant effect on cloud
computing adoption. Those who believed that cloud computing
offered secure services were more likely to adopt cloud computing
compared to those who did not believe cloud services were secure
(33/50[70%] vs 5/19[26%], OR=6.53, 95%CI [1.99-21.41],
p=0.0020). Additionally, those who believed cloud computing
upheld the privacy of data were more likely to adopt cloud
computing compared to those who did not believe that the privacy
of data was upheld (37/53[70%] vs 3/16[19%], OR=10.03, 95%CI
[2.51-40.06], p=0.0010).
Expert scarcity was looked at in terms of availability of
deployment experts, integration experts and security
professionals. Out of the three sub-indicators, only two had a
statistically significant effect on cloud computing adoption:
availability of deployment experts and availability of integration
experts. Those who agreed that IT professionals who guide
deployment into the cloud were readily available were more likely
to adopt cloud computing compared to those who did not believe
such experts were available (21/27[78%] vs 19/42[45%],
OR=4.24, 95%CI [1.42-12.63], p=0.0100). Additionally those
who believed that IT professionals who manage integration with
on-site systems were there in sufficient numbers were more likely
to adopt cloud computing compared to those who did not believe
such experts were available(18/22[82%] vs 22/47[47%],
OR=5.11, 95%CI [1.50-17.42], 0.0090).
Characteristics Cloud
Computing
Adopted
Cloud
computing
not
Adopted
Odds Ratio[95%CI] p-Value
n/N (%) n/N (%)
Technological
Readiness
Skilled in using
Cloud computing
No 7/29 (24) 22/29 (76) Ref
Yes 33/40 (83) 7/40 (17) 14.82(4.56-48.14) <0.0001
Technological
Infrastructure
No 6/25 (24) 19/25 (76) Ref
Yes 34/44 (77) 10/44 (23) 10.77(3.38-34.26) <0.0001
Service Quality
Secure services
No 5/19 (26) 14/19 (74) Ref
Yes 35/50 (70) 15/15 (30) 6.53(1.99-21.41) 0.0020
Privacy of Data
No 3/16 (19) 13/16 (81) Ref
Yes 37/53 (70) 16/53 (30) 10.03(2.51-40.06) 0.0010
Timeliness
No 1/1 (50) 1/1 (50) Ref
Yes 39/67 (58) 28/67 (42) 1.39(0.84-23.23) 0.8170
Personalized Care
No 8/14 (57) 6/14 (43) Ref
Yes 32/55 (58) 23/55 (42) 1.04(0.32-3.42) 0.9440
Expert Scarcity
Deployment Experts
available
No 19/42 (45) 23/42 (55) Ref
Yes 21/27 (78) 6/27 (22) 4.24(1.42-12.63) 0.0100
Integration Experts
available
No 22/47 (47) 25/47 (53) Ref
Yes 18/22 (82) 4/22 (18) 5.11(1.50-17.42) 0.0090
Security Experts
available
No 22/44 (50) 22/44 (50) Ref
Yes 18/25 (72) 7/25 (28) 2.57(0.90-7.38) 0.0790
Table IV. Logistic regression assessing cloud computing adoption
based on Technological context
4.3 Organisational setting in cloud computing adoption
There were four indicators under organisational setting: Top
management support, Policy, Firm size and individual difference
factors. The results of the logistic regression predicting cloud
computing adoption based on organisational setting is shown in
Table V.
The researcher looked at top management support in terms of
adequate budgetary allocation and providing an enabling
environment. The results illustrates that only adequate budgetary
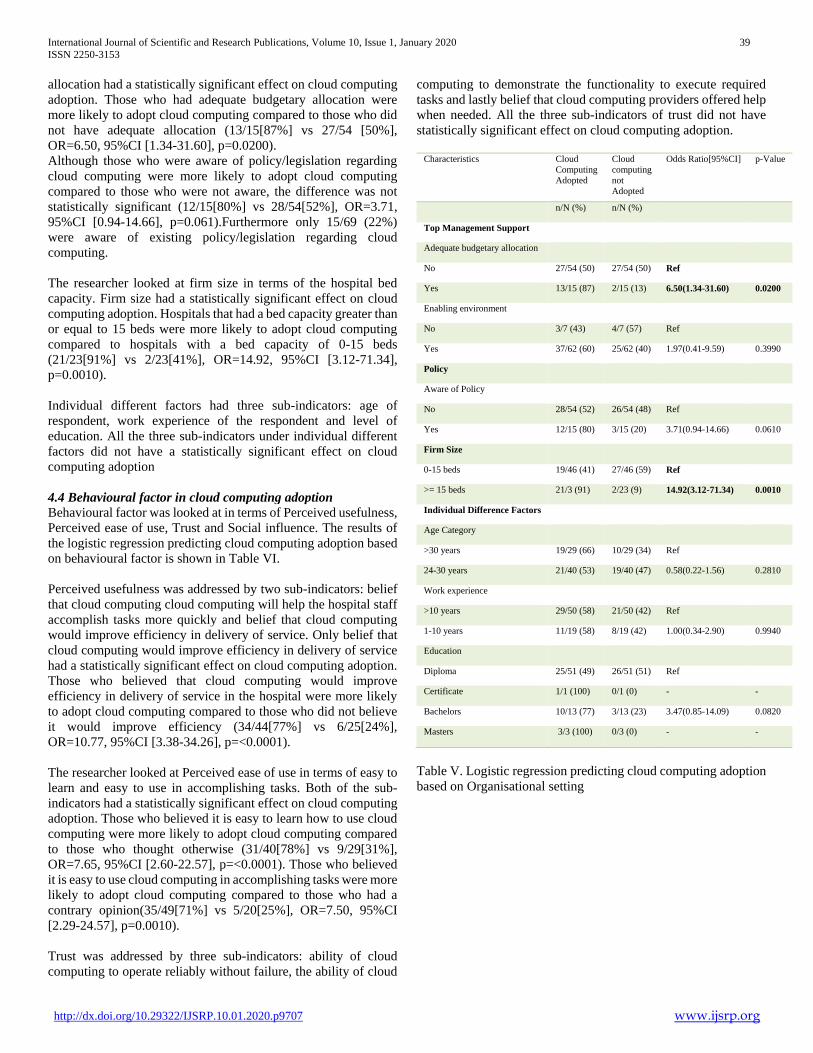
International Journal of Scientific and Research Publications, Volume 10, Issue 1, January 2020 39
ISSN 2250-3153
http://dx.doi.org/10.29322/IJSRP.10.01.2020.p9707 www.ijsrp.org
allocation had a statistically significant effect on cloud computing
adoption. Those who had adequate budgetary allocation were
more likely to adopt cloud computing compared to those who did
not have adequate allocation (13/15[87%] vs 27/54 [50%],
OR=6.50, 95%CI [1.34-31.60], p=0.0200).
Although those who were aware of policy/legislation regarding
cloud computing were more likely to adopt cloud computing
compared to those who were not aware, the difference was not
statistically significant (12/15[80%] vs 28/54[52%], OR=3.71,
95%CI [0.94-14.66], p=0.061).Furthermore only 15/69 (22%)
were aware of existing policy/legislation regarding cloud
computing.
The researcher looked at firm size in terms of the hospital bed
capacity. Firm size had a statistically significant effect on cloud
computing adoption. Hospitals that had a bed capacity greater than
or equal to 15 beds were more likely to adopt cloud computing
compared to hospitals with a bed capacity of 0-15 beds
(21/23[91%] vs 2/23[41%], OR=14.92, 95%CI [3.12-71.34],
p=0.0010).
Individual different factors had three sub-indicators: age of
respondent, work experience of the respondent and level of
education. All the three sub-indicators under individual different
factors did not have a statistically significant effect on cloud
computing adoption
4.4 Behavioural factor in cloud computing adoption
Behavioural factor was looked at in terms of Perceived usefulness,
Perceived ease of use, Trust and Social influence. The results of
the logistic regression predicting cloud computing adoption based
on behavioural factor is shown in Table VI.
Perceived usefulness was addressed by two sub-indicators: belief
that cloud computing cloud computing will help the hospital staff
accomplish tasks more quickly and belief that cloud computing
would improve efficiency in delivery of service. Only belief that
cloud computing would improve efficiency in delivery of service
had a statistically significant effect on cloud computing adoption.
Those who believed that cloud computing would improve
efficiency in delivery of service in the hospital were more likely
to adopt cloud computing compared to those who did not believe
it would improve efficiency (34/44[77%] vs 6/25[24%],
OR=10.77, 95%CI [3.38-34.26], p=<0.0001).
The researcher looked at Perceived ease of use in terms of easy to
learn and easy to use in accomplishing tasks. Both of the sub-
indicators had a statistically significant effect on cloud computing
adoption. Those who believed it is easy to learn how to use cloud
computing were more likely to adopt cloud computing compared
to those who thought otherwise (31/40[78%] vs 9/29[31%],
OR=7.65, 95%CI [2.60-22.57], p=<0.0001). Those who believed
it is easy to use cloud computing in accomplishing tasks were more
likely to adopt cloud computing compared to those who had a
contrary opinion(35/49[71%] vs 5/20[25%], OR=7.50, 95%CI
[2.29-24.57], p=0.0010).
Trust was addressed by three sub-indicators: ability of cloud
computing to operate reliably without failure, the ability of cloud
computing to demonstrate the functionality to execute required
tasks and lastly belief that cloud computing providers offered help
when needed. All the three sub-indicators of trust did not have
statistically significant effect on cloud computing adoption.
Characteristics Cloud
Computing
Adopted
Cloud
computing
not
Adopted
Odds Ratio[95%CI] p-Value
n/N (%) n/N (%)
Top Management Support
Adequate budgetary allocation
No 27/54 (50) 27/54 (50) Ref
Yes 13/15 (87) 2/15 (13) 6.50(1.34-31.60) 0.0200
Enabling environment
No 3/7 (43) 4/7 (57) Ref
Yes 37/62 (60) 25/62 (40) 1.97(0.41-9.59) 0.3990
Policy
Aware of Policy
No 28/54 (52) 26/54 (48) Ref
Yes 12/15 (80) 3/15 (20) 3.71(0.94-14.66) 0.0610
Firm Size
0-15 beds 19/46 (41) 27/46 (59) Ref
>= 15 beds 21/3 (91) 2/23 (9) 14.92(3.12-71.34) 0.0010
Individual Difference Factors
Age Category
>30 years 19/29 (66) 10/29 (34) Ref
24-30 years 21/40 (53) 19/40 (47) 0.58(0.22-1.56) 0.2810
Work experience
>10 years 29/50 (58) 21/50 (42) Ref
1-10 years 11/19 (58) 8/19 (42) 1.00(0.34-2.90) 0.9940
Education
Diploma 25/51 (49) 26/51 (51) Ref
Certificate 1/1 (100) 0/1 (0) - -
Bachelors 10/13 (77) 3/13 (23) 3.47(0.85-14.09) 0.0820
Masters 3/3 (100) 0/3 (0) - -
Table V. Logistic regression predicting cloud computing adoption
based on Organisational setting
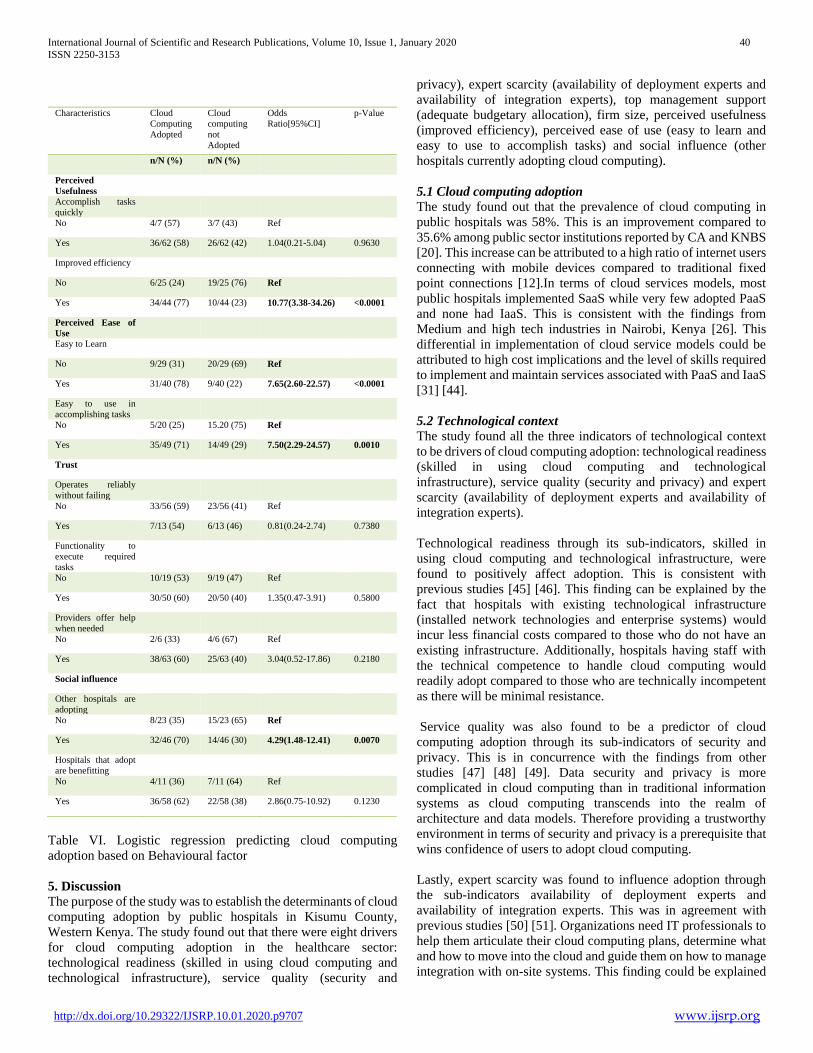
International Journal of Scientific and Research Publications, Volume 10, Issue 1, January 2020 40
ISSN 2250-3153
http://dx.doi.org/10.29322/IJSRP.10.01.2020.p9707 www.ijsrp.org
Characteristics Cloud
Computing
Adopted
Cloud
computing
not
Adopted
Odds
Ratio[95%CI]
p-Value
n/N (%) n/N (%)
Perceived
Usefulness
Accomplish tasks
quickly
No 4/7 (57) 3/7 (43) Ref
Yes 36/62 (58) 26/62 (42) 1.04(0.21-5.04) 0.9630
Improved efficiency
No 6/25 (24) 19/25 (76) Ref
Yes 34/44 (77) 10/44 (23) 10.77(3.38-34.26) <0.0001
Perceived Ease of
Use
Easy to Learn
No 9/29 (31) 20/29 (69) Ref
Yes 31/40 (78) 9/40 (22) 7.65(2.60-22.57) <0.0001
Easy to use in
accomplishing tasks
No 5/20 (25) 15.20 (75) Ref
Yes 35/49 (71) 14/49 (29) 7.50(2.29-24.57) 0.0010
Trust
Operates reliably
without failing
No 33/56 (59) 23/56 (41) Ref
Yes 7/13 (54) 6/13 (46) 0.81(0.24-2.74) 0.7380
Functionality to
execute required
tasks
No 10/19 (53) 9/19 (47) Ref
Yes 30/50 (60) 20/50 (40) 1.35(0.47-3.91) 0.5800
Providers offer help
when needed
No 2/6 (33) 4/6 (67) Ref
Yes 38/63 (60) 25/63 (40) 3.04(0.52-17.86) 0.2180
Social influence
Other hospitals are
adopting
No 8/23 (35) 15/23 (65) Ref
Yes 32/46 (70) 14/46 (30) 4.29(1.48-12.41) 0.0070
Hospitals that adopt
are benefitting
No 4/11 (36) 7/11 (64) Ref
Yes 36/58 (62) 22/58 (38) 2.86(0.75-10.92) 0.1230
Table VI. Logistic regression predicting cloud computing
adoption based on Behavioural factor
5. Discussion
The purpose of the study was to establish the determinants of cloud
computing adoption by public hospitals in Kisumu County,
Western Kenya. The study found out that there were eight drivers
for cloud computing adoption in the healthcare sector:
technological readiness (skilled in using cloud computing and
technological infrastructure), service quality (security and
privacy), expert scarcity (availability of deployment experts and
availability of integration experts), top management support
(adequate budgetary allocation), firm size, perceived usefulness
(improved efficiency), perceived ease of use (easy to learn and
easy to use to accomplish tasks) and social influence (other
hospitals currently adopting cloud computing).
5.1 Cloud computing adoption
The study found out that the prevalence of cloud computing in
public hospitals was 58%. This is an improvement compared to
35.6% among public sector institutions reported by CA and KNBS
[20]. This increase can be attributed to a high ratio of internet users
connecting with mobile devices compared to traditional fixed
point connections [12].In terms of cloud services models, most
public hospitals implemented SaaS while very few adopted PaaS
and none had IaaS. This is consistent with the findings from
Medium and high tech industries in Nairobi, Kenya [26]. This
differential in implementation of cloud service models could be
attributed to high cost implications and the level of skills required
to implement and maintain services associated with PaaS and IaaS
[31] [44].
5.2 Technological context
The study found all the three indicators of technological context
to be drivers of cloud computing adoption: technological readiness
(skilled in using cloud computing and technological
infrastructure), service quality (security and privacy) and expert
scarcity (availability of deployment experts and availability of
integration experts).
Technological readiness through its sub-indicators, skilled in
using cloud computing and technological infrastructure, were
found to positively affect adoption. This is consistent with
previous studies [45] [46]. This finding can be explained by the
fact that hospitals with existing technological infrastructure
(installed network technologies and enterprise systems) would
incur less financial costs compared to those who do not have an
existing infrastructure. Additionally, hospitals having staff with
the technical competence to handle cloud computing would
readily adopt compared to those who are technically incompetent
as there will be minimal resistance.
Service quality was also found to be a predictor of cloud
computing adoption through its sub-indicators of security and
privacy. This is in concurrence with the findings from other
studies [47] [48] [49]. Data security and privacy is more
complicated in cloud computing than in traditional information
systems as cloud computing transcends into the realm of
architecture and data models. Therefore providing a trustworthy
environment in terms of security and privacy is a prerequisite that
wins confidence of users to adopt cloud computing.
Lastly, expert scarcity was found to influence adoption through
the sub-indicators availability of deployment experts and
availability of integration experts. This was in agreement with
previous studies [50] [51]. Organizations need IT professionals to
help them articulate their cloud computing plans, determine what
and how to move into the cloud and guide them on how to manage
integration with on-site systems. This finding could be explained
International Journal of Scientific and Research Publications, Volume 10, Issue 1, January 2020 41
ISSN 2250-3153
http://dx.doi.org/10.29322/IJSRP.10.01.2020.p9707 www.ijsrp.org
by the fact that adequate technical support guarantees smooth and
seamless transition to the cloud and institutions who believed this
experts are readily available would be predisposed to adopt cloud
computing. The study found out that only 39% and 31% of the
respondents believed deployment and integration experts were
available respectively. This is in concurrence with existing
literature that have reported scarcity of IT professionals in the
area of cloud computing [50] [52] [53] and this shortfall is
projected to hit 5 million globally within the next decade, if
nothing is done to mitigate it .
5.3 Organisational setting
The study found only top management support (adequate
budgetary allocation) and firm size constructs of organizational
setting to be predictors of cloud computing adoption. Top
management support under the sub-indicator of adequate
budgetary allocation was found to influence adoption. This is
concurrent with existing literature on cloud computing adoption
[54] [55] [56]. This can be explained by the fact that cloud
computing comes with additional costs as it is a pay-per-use
platform and it also heavily relies on the internet, institutions with
adequate budgetary allocation for IT would therefore be more
inclined to adopt cloud computing compared to those with
inadequate allocations. However, overall only 22% of respondents
indicated they had adequate budgetary allocation for IT. This
small proportion compared to 89% who indicated that top
management was supportive of cloud computing illustrates that
not lack of interest in cloud computing but rather budget
constrains from allocations by county governments as the possible
reason for inadequate budgetary allocations for IT .This brings
to the front the need for implementation of the Abuja declaration
on health budget[57] which would in turn translate to improved
allocations to the counties and consequently the hospitals and IT
department.
Firm size was also found to be a predictor of cloud computing
adoption. This is consistent with findings from previous studies
[31] [55]. Hospitals with a higher bed capacity are more likely to
have a bigger budget than those with lower bed capacity and in
turn be more likely to adopt cloud computing than their counter
parts from hospitals with a smaller bed capacity. Additionally, the
uptake of internet and its infrastructures in hospitals is slower
among smaller hospitals than in large ones.
Policy was not a predictor of cloud computing adoption from the
findings of the study. This is consistent with results from previous
adoption studies [35][55].This could possibly be explained by the
fact that despite deliberate government policy to promote new
computing technologies, their advancement is largely due to
corporate focus on technology [58] and this is justified by the 89%
of top management that provided an enabling environment.
5.4 Behavioural factor
The study found three indicators under behavioural factor to be
predictors of cloud computing adoption: perceived usefulness
(improved efficiency), perceived ease of use (easy to learn and
easy to use to accomplish tasks) and social influence (other
hospitals currently adopting cloud computing).
Perceived usefulness in terms of improved efficiency in delivery
of services was found to influence cloud computing. This is
consistent with existing literature [31] [34] [59]. This could be
explained by the fact that adoption of new technology increases
when a firm perceives a relative advantage in that innovation.
Additionally, the study reported operational benefits of cloud
computing at 69% indicating confidence of respondents that cloud
computing provided a relative advantage.
Both sub-indicators of perceived ease of use were found to be
predictors of cloud computing adoption: easy to learn and easy to
use to accomplish tasks. This finding is in agreement with results
from previous studies [60] [61] [62].This can be explained by the
proliferation of cloud computing services that can be accessed by
mobile devices. Services like email and storage(google drive and
drop box) have reduced complexities in user interface and learning
curve thereby bolstering the belief of users that cloud computing
requires less mental effort to learn and use.
The study did not find trust to be a significant factor in adoption
cloud computing. This is contrary to results from previous studies
that found trust to be a predictor of adoption [63] [64].
Lastly, social influence in terms of other hospitals currently
adopting cloud computing was found to be a predictor of cloud
computing. This is in concurrence with existing literature [65] [66]
[67].This can be explained by the need for non-adopter hospitals
to conform to the current trend in the sector. Sociologists believe
that often group member’s exhibit cohesiveness even against their
own feelings in order to show commitment to group norms [68].
6. Conclusion
This study was motivated by the desire to see the healthcare sector
compete favorably with other industries in adoption of cloud
computing and consequently realize the associated operational,
financial and functional benefits thereby remaining relevant in a
dynamic business environment.
The study results showed that the following factors significantly
affect adoption: technological readiness (skilled in using cloud
computing and technological infrastructure), service quality
(security and privacy), expert scarcity (availability of deployment
experts and availability of integration experts), top management
support (adequate budgetary allocation), firm size, perceived
usefulness (improved efficiency), perceived ease of use (easy to
learn and easy to use to accomplish tasks) and social influence
(other hospitals currently adopting cloud computing) were all
significant constructs of cloud computing adoption. Policy,
individual difference factors and trust were found to be
insignificant predictors of cloud computing adoption.
REFERENCES
[1] Winans, T. and Brown, J. (2009) Moving Information Technology Platforms to
the Clouds: Insights into IT Platform Architecture Transformation.
Journal of Service Science, 2, 23.
[2] WHO (2013). Interprofessional collaborative practice in primary health care:
nursing and midwifery perspectives: six case studies
[3] Green, B., and Johnson, C. (2015) Interprofessional collaboration in research,
education, and clinical practice: working together for a better future
International Journal of Scientific and Research Publications, Volume 10, Issue 1, January 2020 42
ISSN 2250-3153
http://dx.doi.org/10.29322/IJSRP.10.01.2020.p9707 www.ijsrp.org
[4] Dwivedi, Y.K. and Mustafee, N. (2010) It’s Unwritten in the Cloud: The
Technology Enablers for Realising the Promise of Cloud Computing.
Journal of Enterprise Information Management, 23, 673-679.
[5] Choudary, V. and Vithayathil, J. (2013) The Impact of Cloud Computing:
Should the IT Department be Organized as Cost Centre or a Profit
Center? Journal of Management Information Systems, 30, 67-100.
[6] Peter, M., and Grance, T. (2010) The NIST Definition of Cloud Computing.
Association for Computing Machinery.
[7] Netmetix (2011) “Top 10 cloud computing statististics” Retrieved September
3 2016, from https://netmetix.wordpress.com/2011/11/09/top-10-
cloud-computing-statistics/
[8] Ferkuon, M. (2014) Five ways the healthcare industry benefits from cloud
computing
[9] European Coordination Committee of the Radiological, Electromedical and
Health IT industry COCIR (2016) “Leveraging Cloud Computing for
HealthCare”
[10] Ross, V.W. (2010) Factors Influencing the Adoption of Cloud Computing by
Decision Making Managers. Ph.D. Thesis, Capella University,
Minneapolis
[11] Markets and Markets (2015) Healthcare Cloud Computing Market by
Application-Analysis and Global Forecasts 2020.Retrieved September
10 2016, from http://www.marketsandmarkets.com/Market-
Reports/cloud-computing-healthcare-market-347.html
[12] Cisco, (2018) Cisco Global Cloud Index: Forecast and Methodology, 2016–
2021 White Paper
[13] Zhao, L., Zhang, L., Liu, T. (2014) Research Gaps and Trends in Cloud
Computing: A Systematic Mapping Study
[14] Health Information Management Systems survey (2014) .2014 HIMSS
Analytics cloud Survey
[15] Pallian, J. (2018) “How Cloud Computing Adoption varies Across Industries”
Retrieved January 11 2018, from
https://www.expedient.com/blog/how-cloud-computing-adoption-
varies-across-industries/
[16] Sawlani, M. (2017) How Cloud Computing adoption Varies Across Industries
Retrieved January 11 2018, from
https://www.cloud28plus.com/lac/content/How-Cloud-Computing-
Adoption-Varies-Across-Industries-
[17] Haug, K., Kretschmer, T. and Strobel, T. (2015) Cloud adaptiveness within
industry sectors–Measurement and observations
[18] Griebel, L., Prokosch, H., Kopcke, F., Toddenroth, D., Christoph, J., Leb, I.,
Engel, I. Sedlmayr, M. (2015). “A scoping review of cloud computing
in healthcare”
[19] Cisco and World Wide Worx (2013) “Research Study across Organizations in
South Africa, Nigeria and Kenya Highlights Considerable Investment
in Cloud within Next Year.” Retrieved 20 August 2016 from
https://www.cisco.com/web/ZA/press/2013/112813.html
[20] Business Daily Africa (2017) “Why Kenya is yet to fully embrace cloud
computing” retrieved on 3 April 2018 from
https://www.businessdailyafrica.com/corporate/Why-Kenya-is-yet-to-
fully-embrace-cloud-computing/539550-4217388-t575ubz/index.html
[21] Goldcare, 2018 Healthcare Information management: Cloud Computing to
the Rescue Retrieved 24 March 2018 from
http://www.mygoldcare.com/cloud-computing-rescue/
[22] Xin, M. and Levina, N. (2008) Software-as-a Service Model: Elaborating
Client-Side Adoption Factors.
[23] Heinle, C. and Strebel, J. (2010) IaaS Adoption Determinants in Enterprises.
[24] Akhusama, P. and Moturi, C. (2016) Cloud Computing Adoption in Insurance
Companies in Kenya. American Journal of Information Systems.4. 11-
16
[25] Muli, M. E. and Kimutai, J. (2014) Adoption of Cloud Computing for
Education in Kenya Universities
[26] Wanjiku, W. P. and Moturi, C. (2016) Cloud Computing: Transforming
Medium and High Tech Industries in Kenya
[27] Voorsluys, William; Broberg, James; Buyya, Rajkumar (2011). "Introduction
to Cloud Computing". In R. Buyya; J. Broberg; A.Goscinski. Cloud
Computing: Principles and Paradigms (PDF). New York, USA: Wiley
Press. pp. 1–44.
[28] Zhang, Q., Cheng, L. and Boutaba, R. (2010), “Cloud computing: state-of-
the-art and research challenges,” Journal of Internet Services and
Applications, vol. 1, pp. 7–18.
[29] Cloud Council, (2017) Impact of Cloud Computing on Healthcare Version 2.0
[30] Saslow, S. (2014) The 7 Benefits of Cloud Computing for Healthcare
Retrieved 17 April 2018 from https://itgcloud.com/the-7-benefits-of-
cloud-computing-for-healthcare/
[31] Low, C., Chen, Y. and Wu, M. (2011) Understanding the Determinants of
Cloud Computing Adoption. Industrial Management & Data Systems,
111, 1006-1023. http://dx.doi.org/10.1108/02635571111161262
[32] Olivieira, T. , and Martins, F. M. (2011) Literature Review of Information
Technology Adoption Models at Firm level
[33] Baker, J., Dwivedi, Y. K., Wade, M. R. and Schneberger, S. L. (2012) “The
Technology–Organization–Environment Framework,” in Information
Systems Theory: Explaining and Predicting Our Digital Society, vol.28,
Eds. New York, NY: Springer New York, 2012, pp. 231–245.
[34] Gangwar, H., Date, H. and Ramaswamy, R. (2015) Understanding
Determinants of Cloud Computing Adoption Using an Integrated
TAM-TOE Model. Journal of Enterprise Information Management, 28,
107-130.
[35] Oliveira, T., Thomas, M. and Espadanal, M. (2014) “Assessing the
determinants of cloud computing adoption: An analysis of the
manufacturing and services sectors,” Inf. Manag., vol. 51, no. 5, pp.
497–510, Jul. 2014.
[36] Jeyaraj, A., Rottman, J., and Lacity, M. (2006). A review of the predictors,
linkages, and biases in IT innovation adoption research. Journal of
Information Technology, 21(1), 1-23.
[37] Hambrick, D., and Mason, P. (1984). Upper echelons: The organization as a
reflection of its top managers. Academy of Management Review, 9(2),
193-205.
[38] American Psychological Association. (2018). Psychology – APA Dictionary
of Psychology. Retrieved July 20, 2018, from
https://dictionary.apa.org/psychology
[39] Davis, F. (1993) User acceptance of information technology: System
characteristics, user perceptions and behaviour impacts. International
Journal of Man-Machine Studies, 38, 475-487.
[40] Ministry of Health, Kenya (2018) Kenya Master Health Facility List.
Retrieved January 12 2019 from
http://kmhfl.health.go.ke/#/facility_filter/results?county=6f256e8c-
5d8f-4f07-89a0-81e245081030
[41] Yamane, T. (1967) Statistics, An Introductory Analysis 2nd Ed., New York:
Harper and Row
[42] Tavakol, M. and Dennick, R. (2011) Making Sense of Cronbach’s Alpha
[43] Stephanie (2015) Variance Inflating Factor Retrieved 04 October 2019 from
https://www.statisticshowto.datasciencecentral.com/variance-
inflation-factor/
[44] Omwansa K. T., Waema M. T. and Omwenga B. (2014) Cloud Computing in
Kenya, a 2013 Baseline Survey
[45] Cegielski, C.G., Farmer, L.A., Wu, Y. and Hazen, B.T. (2012) Adoption of
Cloud Computing Technologies in Supply Chains. The International
Journal of Logistics Management, 23, 184-211.
[46] Tweel, A. (2012) Examining the Relationship between Technological,
Organisational, and Environmental Factors and Cloud Computing
Adoption. Ph.D. Thesis, Northcentral University, San Diego
[47] Padilla, S. R., Milton, K. S. and Johnston, W. L. (2015) Components of
Service Value in Business-to-Business Cloud Computing.
[48] Egedigwe, E. (2015) Service Quality and Perceived Value of Cloud
Computing-Based Service Encounters: Evaluation of Instructor
Perceived Service Quality in Higher Education in Texas. [49] Feuerlicht, G. (2010). Next generation soa: Can Soa survive cloud computing?
Advances in intelligent web mastering -2. In V. Snášel, P. Szczepaniak,
A. Abraham & J.Kacprzyk (Eds.), (Vol. 67, pp. 19-29): Springer Berlin
/ Heidelberg
[50] Hameurlin, A., Kung, J., Wagner, R., Sakr, S., Razzak, I., and Riyad, A.
(2017) Transactions on Large-scale Data and Knowledge-Centered
Systems XXXV
[51] Almabhouh, A. (2015) Opportunities of Adopting Cloud Computing in
Palestinian Industries
[52] Hudson, G. (2013) “Experts express concern over lack of skilled cloud
computing staff” Retrieved 7 February, 2018 from
https://daisygroup.com/2013/09/experts-express-concern-over-lack-
of-skilled-cloud-computing-staff/
[53] Mishra, N. (2017) “Addressing the CIO’s Biggest Problem with Cloud
Adoption: Skills Shortage” Retrieved 7 February, 2018 from
https://www.netmagicsolutions.com/blog/addressing-the-cios-biggest-
problem-with-cloud-adoption-skills-shortage/
[54] Ramdani, B. and Kawalek, P. (2007) SME Adoption of Enterprise Systems in
the Northwest of England: An Environmental, Technological and
Organisational Perspective

International Journal of Scientific and Research Publications, Volume 10, Issue 1, January 2020 43
ISSN 2250-3153
http://dx.doi.org/10.29322/IJSRP.10.01.2020.p9707 www.ijsrp.org
[55] Borgman, H., Bahli, B., Heier, H., and Schewski, F. (2013) Cloud rise:
Exploring Computing Adoption and Governance with TOE
Framework. [56] Yigitbasioglu, M. O. (2015) The role of instutional pressures and top
management support in the intention to adopt cloud computing
solutions [57] WHO (2011) The Abuja Declaration: 10 Years on [58] Jha, M. (2015) Technology adoption is the driving force in economic growth
as users reap more benefits than inventors Retrieved 09 October 2019
from https://www.sc.com/en/navigate-the-future/adoption-not-
invention-key-technology-success/
[59] Gupta, P., Seetharaman, A., and Raj, J.R. (2013) “The usage and adoption of
cloud computing by small and medium businesses” [60] Tiwana, A. and Bush, A. (2007) A comparison of transaction cost, agency and
knowledge-based predictors of IT outsourcing decisions:a US-japan
cross-cultural field study. [61] Harindranath, G., Dyerson, R. and Barnes, D. (2008) ICT in small firms:
factors affecting the adoption and use of ICT in Southest England SMEs [62] Chaudhury, A., and Bharati, P. (2008) IT outsourcing by small and medium
enterprises: a diffusion innovation approach. [63] Hashemmi, S., (2013) Cloud Computing Technology: Security and Trust
Challenges [64] Moqbel, M., Bartelt, V., and Cicala, E. J. (2014) Personal Cloud User
Acceptance: The role of Trust and Perceived Risk in the Technology
Acceptance Model [65] Moqbel, M., Bartelt, V., and Al-Suqri, M. (2014) A study of Personal Cloud
Computing: Compatibility, Social Influence and Moderating Role of
Perceived Familiarity
[66] Lian, J.W., (2015). Critical factors for cloud based e-invoice service adoption
in Taiwan: An empirical study. International Journal of Information
Management, 35(1): 98-109.
[67] Amponsah, A R.., Panford, K. J. and Hayfron-Acquah (2016) Factors
affecting Cloud Computing Adoption in a Developing Country-Ghana:
Using Extended Unified Theory of Acceptance and Use of Technology
Model
[68] Venkatesh, V., and Morris, M. G. 2000. "Why Don't Men Ever Stop to Ask
for Directions? Gender, Social Influence, and Their Role in Technology
Acceptance and Usage Behavior,"
AUTHORS
First Author – Billy Ogwel, BSc, Rongo University,
Second Author – Dr. Gabriel Otieno, PhD, Rongo University,
Third Author – Prof. G.W. Odhiambo-Otieno, PhD, Rongo
University, [email protected]
Correspondence Author – Billy Ogwel, [email protected],
[email protected], +254 737 225 000.

International Journal of Scientific and Research Publications, Volume 10, Issue 1, January 2020 44
ISSN 2250-3153
http://dx.doi.org/10.29322/IJSRP.10.01.2020.p9708 www.ijsrp.org
Determination of Normal Thyroid Gland Volume On
Ultrasound In Normal Adults In Jos, North Central
Nigeria.
A. J. Salaam1*, S. M. Danjem1, A. A. Salaam2, H. A. Angba1 and P. O. Ibinaiye3
1Department of Radiology, Jos University Teaching Hospital, Nigeria.
2Department of Family Medicine, Jos University Teaching Hospital, Nigeria. 3Department of Radiology, Ahmadu Bello University Teaching Hospital, Nigeria.
DOI: 10.29322/IJSRP.10.01.2020.p9708
http://dx.doi.org/10.29322/IJSRP.10.01.2020.p9708
Authors’ contributions: This work was carried out in
collaboration among all authors. The author AJS designed the
study and literature review, author POI co-designed the study,
author SMD managed the analysis and literature review, author
AAS performed statistical analysis and the author HAA managed
literature review. All authors read and approved the final
manuscript.
Abstract- AIM AND OBJECTIVES: This study was done to
establish a standard ultrasonographic measurement of the thyroid
gland volume in normal adults in Jos University Teaching
Hospital.
Background: The thyroid gland is one of the largest
endocrine glands in the body weighing about 10-25g. It regulates
the rate of metabolism, the growth and rate of function of many
other systems in the body. These it does, by producing thyroid
hormones, principally thyroxine (T4) and triiodothyronine (T3).
The accurate estimation of the size of the thyroid is very important
for the evaluation and management of thyroid disorders. Thus,
knowing the normal size in a geographic location would form a
baseline for detecting abnormalities. Ultrasonography is a cheap,
readily available, easy to perform and non-invasive method to
image the thyroid gland, hence its use in this resource limited
setting.
METHODOLOGY: This is a cross sectional study of
sonographic measurement of thyroid gland volume on 400 normal
(healthy) adults in Jos, Plateau State, Northern part of Nigeria. All
examinations were performed using LOGIC 5, a real-time
ultrasound machine using a 10MHZ linear transducer and
ultrasound transmission gel to act as a coupling gel. Measurements
of each lobes and isthmus were obtained in longitudinal (length),
transverse (width) and depth (breath) in centimeters (cm). Blood
samples were taken for thyroid function tests. The weight and
heights were obtained. The data obtained were statistically
analyzed using SPSS software version 17. The results were
presented in forms of tables, graphs and chart.
RESULTS: The mean thyroid volume for males 6.03cm3 ±
2.22 was higher than that of females 5.62cm3 ± 2.14. The mean
right lobe volume (RLV) was 3.09cm3 ± 1.47 and that of males
and females were 3.16cm3 ± 1.34 and 3.04cm3 ± 1.55 respectively.
The mean left lobe volume (LLV) was 2.69cm3 ± 1.37 and that of
males and females were 2.89cm3 ± 1.32 and 2.57cm3 ± 1.39
respectively. The right lobe volume was significantly greater than
the left lobe (p=0.000).The total mean isthmus volume was
0.27cm3 ± 0.31. The mean isthmus volume in males 0.3±0.28 is
significantly higher than that of females 0.24±0.23 (p=0.025)
CONCLUSION: The volume obtained in this study was
slightly lower than those reported by previous studies in Nigerian
adults. The right lobe volume was higher than that of the left and
the volume was higher in males compared to females.
I. INTRODUCTION
he thyroid gland is one of the largest endocrine glands in the
body weighing about 10-25g. It regulates the rate of
metabolism and control the growth and rate of function of many
other systems in the body. These it does, by producing thyroid
hormones, principally thyroxine (T4) and triiodothyronine (T3)1,2,3.
The accurate estimation of the size of the thyroid is very important
for the evaluation and management of thyroid disorders. Thus,
knowing the normal size in a geographic location would form a
baseline for detecting abnormalities. Ultrasonography is a cheap,
readily available, easy to perform and non-invasive method to
image the thyroid gland, hence its use in this resource limited
setting4,5,6,.
The evaluation of thyroid volume by ultrasonography in
adults and children has been discussed in many Caucassian
reports7,8 as well as in Africans, Iranians9 and indians8. In Nigeria
most of the studies have been conducted in the North-Western10,
North-Eastern,4 South-Western11,12,South-South13 and South-
Eastern6 parts of the country. But none in North Central Nigeria.
The evaluation of thyroid volume by ultrasonography in adults and
children has been discussed in many Caucassian reports7,8 as well
as in Africans, Iranians9 and indians8. In Nigeria most of the
studies have been conducted in the North-Western10, North-
Eastern,4 South-Western11,12,South-South13 and South-Eastern6
parts of the country. But none in North Central Nigeria.
The total thyroid volume(TTV) is a summation of the left
and right lobes, the isthmus was not included in the measurement.
Several studies done in the past showed a good relationship
between the TTV with age in adults. In the study by Ahidjo et al4,
the volume of the thyroid gland was 8.55cm3±1.82 in adults.
Mohammed14 et al in Sudan, obtained a value of 6.44±2.44mls;
this value was lower than that obtained by Ahidjo et al in Nigeria.
T
International Journal of Scientific and Research Publications, Volume 10, Issue 1, January 2020 45
ISSN 2250-3153
http://dx.doi.org/10.29322/IJSRP.10.01.2020.p9708 www.ijsrp.org
In both studies, their sample sizes was small, compared to the 400
used in this study. However, Mohammed14 et al used 10MHz
transducer as was done in this study. Ivanac15 et al in a study
among adult females obtained TTV of 10.68±2.83ml. All of them
healthy and with normal thyroid hormonal status. Short-comings
of the study includes the fact that only female population was
selected, isthmus was included in calculation of TTV; and the fact
that Zagreb, a region in Croatia, was in an earlier investigations
indicted as one with iodine deficiency problem, thus accounting
for the apparently slightly elevated figures.
Another study by Adibi9 in healthy adults of Isfahan, a
centrally located city in Iran, an iodine replete area using 200
subjects (123 Males, 77 females, average age: 37.27 ± 11.80
Years). The overall thyroid volume was 9.53 ± 3.68 ml. Males
thyroid volume (10.73 ± 3.44 ml) was significantly higher than the
females one(7.71 ± 2.63 ml) (P<0.001). The thyroid volume
ranges from 3-23.9 ml, 3.6-23.9 ml and 3-14.3 ml in all, males and
females, respectively. The knowledge of the fact that sex plays a
role in determining the thyroid volume is essential in interpreting
results obtained based on the sex of the patient.
The thyroid gland has two lobes that are joined together by
isthmus. They are usually of different sizes, with the right being
larger. The vascular supply of the right is larger than that of the
left.16 The right lobe is larger than the left in the study done by
Suwaid 10et al among school children. Marchie13 et al and Anele17
found no difference in sizes between the right and left lobes in
children and adults. Anele17 also observed that there was no
difference in volume between males and females in his study.
Ahidjo4 et al found difference in the sizes of the lobes. The mean
volume for both lobes in males and females were 4.48cm3 and
4.07cm3 respectively. The right thyroid lobe volume was higher
than the left (p=0.000). Ying and Yung18 in a prospective study of
106 healthy subjects without family history of thyroid diseases,
were recruited in the study aimed at investigating the association
of handedness and position of esophagus with thyroid size
asymmetry using 41 men and 65 women: age range of the subjects
was 16–59 years old (mean age 5-37.1 years). For normal thyroid,
the right lobe (6.8 ml) was significantly larger than the left lobe
(5.66 ml) (P < 0.05). Right-handed subjects (mean, 7.11 ml) had a
significantly larger right lobe than left-handed subjects (mean,
5.82 ml) (P < 0.05). There was no significant difference in the left
lobe volume between right-handers (mean, 5.81 ml) and left-
handers (mean, 5.18 ml) (P > 0.05). Subjects with an esophagus
deviated to the left (mean, 7.15 ml) had a significantly larger right
lobe than those with a centrally located esophagus (mean, 5.7 ml)
(P < 0.05). There was no significant difference in the left lobe
volume between subjects with different esophageal positions
(deviated to left: mean 5.76 ml; centrally located: mean, 5.19 ml)
(P > 0.05).
Thyroid asymmetry is suggested to be related to the
unilateral differentiation of the hypothalamus on the thyroid gland.
However, besides the association of the CNS and thyroid gland
asymmetry, the asymmetry of paired organs may also be
associated with the presence and the size of their adjacent organs.
For example, it has been found that the right kidney is significantly
smaller than the left kidney, and the asymmetry of renal size is
suggested to be related to the smaller size of the spleen than the
liver, and thus, the left kidney has more space for growth. In the
neck, the esophagus is commonly deviated to the left. Hence, the
hypothesis that the smaller size of the left thyroid lobe may be
related to the position of the esophagus. The study found scanty
information about the association of handedness with thyroid lobe
volume asymmetry. The limitation of this study is the small
sample size of left-handers and subjects with centrally located
esophagus. Moreover, no subject with esophagus deviated to the
right was recruited. Another limitation of this study was that the
subjects are mainly in the younger population.
The thyroid isthmus is the part of the thyroid gland that
connects together the lower thirds of the right and left lobes. The
isthmus may be absent in which the two lobes are not connected
as noted by Taty-Anna19 et al. The size of the isthmus is usually
assessed separate from the thyroid lobes. Servet20 et al assessed
the isthmus separately. The mean isthmus thickness was
3.23±1.10mm (men; 3.42±1.14, women; 3.10±1.05).
Growth is seen with increase in age in human. The thyroid
gland increases with growth of man. Suwaid10 et al observed that
the thyroid volume increases with increase with age. There has
been steady increase in the mean thyroid lobe volume with
increase in age. The mean thyroid volume at 6years is 2.94 ± 0.79
cm3 and increases to 8.55 ± 2.79cm3 at 13years. Marchie13 et al
showed strong correlation between the median thyroid volume and
subjects' age (r = 0.804, P <0.001). Anele17 also found strong
correlation between subjects' age and median thyroid gland
volume. Barrer21 et al also noted increase in thyroid volume with
increase in age, they, however observed that the increase ceases
after the age of 65years. No volume increase was noted in the
elderly.
The evaluation of thyroid volume by ultrasonography in
adults and children has been discussed in many Caucassian
reports7,8 as well as in Africans, Iranians9 and indians8. In Nigeria
most of the studies have been conducted in the North-Western10,
North-Eastern,4 South-Western11,12,South-South13 and South-
Eastern6 parts of the country. But none in North Central Nigeria.
The total thyroid volume(TTV) is a summation of the left and right
lobes, the isthmus was not included in the measurement. Several
studies done in the past showed a good relationship between the
TTV with age in adults. In the study by Ahidjo et al4, the volume
of the thyroid gland was 8.55cm3±1.82 in adults. Mohammed14 et
al in Sudan, obtained a value of 6.44±2.44mls; this value was
lower than that obtained by Ahidjo et al in Nigeria. In both studies,
their sample sizes was small, compared to the 400 used in this
study. However, Mohammed14 et al used 10MHz transducer as
was done in this study. Ivanac15 et al in a study among adult
females obtained TTV of 10.68±2.83ml. All of them healthy and
with normal thyroid hormonal status. Short-comings of the study
includes the fact that only female population was selected, isthmus
was included in calculation of TTV; and the fact that Zagreb, a
region in Croatia, was in an earlier investigations indicted as one
with iodine deficiency problem, thus accounting for the
apparently slightly elevated figures.
Another study by Adibi9 in healthy adults of Isfahan, a
centrally located city in Iran, an iodine replete area using 200
subjects (123 Males, 77 females, average age: 37.27 ± 11.80
Years). The overall thyroid volume was 9.53 ± 3.68 ml. Males
thyroid volume (10.73 ± 3.44 ml) was significantly higher than the
females one(7.71 ± 2.63 ml) (P<0.001). The thyroid volume
ranges from 3-23.9 ml, 3.6-23.9 ml and 3-14.3 ml in all, males and
females, respectively. The knowledge of the fact that sex plays a
International Journal of Scientific and Research Publications, Volume 10, Issue 1, January 2020 46
ISSN 2250-3153
http://dx.doi.org/10.29322/IJSRP.10.01.2020.p9708 www.ijsrp.org
role in determining the thyroid volume is essential in interpreting
results obtained based on the sex of the patient.
The thyroid gland has two lobes that are joined together by
isthmus. They are usually of different sizes, with the right being
larger. The vascular supply of the right is larger than that of the
left.16 The right lobe is larger than the left in the study done by
Suwaid 10et al among school children. Marchie13 et al and Anele17
found no difference in sizes between the right and left lobes in
children and adults. Anele17 also observed that there was no
difference in volume between males and females in his study.
Ahidjo4 et al found difference in the sizes of the lobes. The mean
volume for both lobes in males and females were 4.48cm3 and
4.07cm3 respectively. The right thyroid lobe volume was higher
than the left (p=0.000). Ying and Yung18 in a prospective study of
106 healthy subjects without family history of thyroid diseases,
were recruited in the study aimed at investigating the association
of handedness and position of esophagus with thyroid size
asymmetry using 41 men and 65 women: age range of the subjects
was 16–59 years old (mean age 5-37.1 years). For normal thyroid,
the right lobe (6.8 ml) was significantly larger than the left lobe
(5.66 ml) (P < 0.05). Right-handed subjects (mean, 7.11 ml) had a
significantly larger right lobe than left-handed subjects (mean,
5.82 ml) (P < 0.05). There was no significant difference in the left
lobe volume between right-handers (mean, 5.81 ml) and left-
handers (mean, 5.18 ml) (P > 0.05). Subjects with an esophagus
deviated to the left (mean, 7.15 ml) had a significantly larger right
lobe than those with a centrally located esophagus (mean, 5.7 ml)
(P < 0.05). There was no significant difference in the left lobe
volume between subjects with different esophageal positions
(deviated to left: mean 5.76 ml; centrally located: mean, 5.19 ml)
(P > 0.05).
Thyroid asymmetry is suggested to be related to the
unilateral differentiation of the hypothalamus on the thyroid gland.
However, besides the association of the CNS and thyroid gland
asymmetry, the asymmetry of paired organs may also be
associated with the presence and the size of their adjacent organs.
For example, it has been found that the right kidney is significantly
smaller than the left kidney, and the asymmetry of renal size is
suggested to be related to the smaller size of the spleen than the
liver, and thus, the left kidney has more space for growth. In the
neck, the esophagus is commonly deviated to the left. Hence, the
hypothesis that the smaller size of the left thyroid lobe may be
related to the position of the esophagus. The study found scanty
information about the association of handedness with thyroid lobe
volume asymmetry. The limitation of this study is the small
sample size of left-handers and subjects with centrally located
esophagus. Moreover, no subject with esophagus deviated to the
right was recruited. Another limitation of this study was that the
subjects are mainly in the younger population.
The thyroid isthmus is the part of the thyroid gland that
connects together the lower thirds of the right and left lobes. The
isthmus may be absent in which the two lobes are not connected
as noted by Taty-Anna19 et al. The size of the isthmus is usually
assessed separate from the thyroid lobes. Servet20 et al assessed
the isthmus separately. The mean isthmus thickness was
3.23±1.10mm (men; 3.42±1.14, women; 3.10±1.05).
Growth is seen with increase in age in human. The thyroid
gland increases with growth of man. Suwaid10 et al observed that
the thyroid volume increases with increase with age. There has
been steady increase in the mean thyroid lobe volume with
increase in age. The mean thyroid volume at 6years is 2.94 ± 0.79
cm3 and increases to 8.55 ± 2.79cm3 at 13years. Marchie13 et al
showed strong correlation between the median thyroid volume and
subjects' age (r = 0.804, P <0.001). Anele17 also found strong
correlation between subjects' age and median thyroid gland
volume. Barrer21 et al also noted increase in thyroid volume with
increase in age, they, however observed that the increase ceases
after the age of 65years. No volume increase was noted in the
elderly.
II. MATERIALS AND METHODS
STUDY AREA
Jos is the capital city of Plateau State. Plateau state has over
30 different ethnic groups. The 2006 Nigerian census put the
population of Plateau State at 3,178,712.22 Jos University
Teaching Hospital (JUTH) is one of the three teaching hospitals in
the North-Central Zone of Nigeria. It serves as a referral center for
the neighbouring states of Bauchi, Gombe, Benue, Kogi,
Nassarawa, Taraba, Adamawa and parts of Kaduna State.
STUDY POPULATION AND DESIGN
This was a hospital-based Cross-sectional study that was done in
the Department of Radiology, Jos University Teaching Hospital
(JUTH), a tertiary health institution situated in the central part of
Jos, for the period of twelve months (June 2011-June 2012)
III. INCLUSION CRITERIA
Patients that consented to have the procedure
(sonographic evaluation of thyroid gland volume and
laboratory assessment of thyroid function)
Patients referred for ultrasound examination, other than
thyroid ultrasound scan.
Patients 18 years and above
Patients with normal laboratory values of T3(0.6-
2ng/ml), T4(45-115ng/ml) and TSH(0.3-6.5ng/ml)
IV. EXCLUSION CRITERIA
Female during menstruation, pregnancy or who have
delivered within the last twelve (12) months
Subjects with anterior neck swelling or clinical evidence
of thyroid/endocrine disorder
Subjects with previous thyroid surgery.
Subject with abnormal laboratory values of T3, T4 and
TSH.
Subjects who did not consent to participate in the study
V. SAMPLE SIZE DETERMINATION
The sample size was determined using Fisher’s statistical14
formula n=z2pq/ d2 for population greater than 10,000 and it was
calculated to be 384 as shown below:
The formula n=z2pq/ d2

International Journal of Scientific and Research Publications, Volume 10, Issue 1, January 2020 47
ISSN 2250-3153
http://dx.doi.org/10.29322/IJSRP.10.01.2020.p9708 www.ijsrp.org
Where n = Desired sample size.
z = Standard deviation, using set at 1.96, which correspond to
95% confidence level.
p = Proportion in target population estimated to have a particular
characteristic. If no reasonable estimate, 50% (0.5) is used.
q = 1.0 – p
d = degree of accuracy desired, usually set at 0.05
Therefore n=1.962 x0.5x0.5/0.052=384.
However a sample size of 400 was used.
VI. TECHNIQUE
The procedure was explained to all participants, and
informed consent was obtained. A data sheet (appendix I&II) was
completed for the all participants in which the ages were obtained
and weights and heights were obtained by the participants
climbing a weighing scale and standing by a wall that was marked
in meters. The participants were asked questions on history of
previous thyroid disease or surgery as stated in the questionnaire.
Questions on alcohol consumption, cigarette smoking and parity
of women were asked as seen in the questionnaires. Patients were
examined in supine position with a pillow placed under the
shoulders to aid in the extension of the head. All examinations
were performed using LOGIC 5, a real-time ultrasound machine
fitted with a 10MHZ linear transducer. Ultrasound gel was applied
over the anterior neck (thyroid area) and the transducer placed
directly on the skin over the thyroid area. Images of each lobe and
the isthmus were obtained in transverse (Fig 1) and longitudinal
planes (Fig 2). Longitudinal (length) as well as transverse (width)
and depth (AP) were measured in centimeters (cm).The right and
left thyroid volume data were obtained and analyzed separately.
The isthmus was not included in the sum. The lobe volume (cm3)
was calculated from the equation of Brunn et al20,23 using the
ellipsoid model formula by multiplying length (L) by width (w) by
depth (d) in cm by a correction factor 0.52 and the lobe volumes
are summed. The isthmus volume was calculated from V isthmus
(cm3) equals length isthmus by width isthmus by depth isthmus all in cm
multiplied by 0.47924. Total Thyroid volume (cm3) = total sum of
lobe volumes (cm3)
Isthmus volume (cm3) = length isthmus x width isthmus x depth isthmus x
0.52
The body surface area was calculated using the formula of Dubois
and Dubois25
Body surface area BSA (m2) = Weight 0.425 x Height 0.725 x 71.84
x 10-4
and Body mass index (BMI) (Kg/m2) was calculated from
weight/height2.
Blood samples were taken for thyroid function tests(
T3,T4 and TSH) in which results that were not within
normal range were not included. The normal laboratory
values of T3(0.6-2ng/ml), T4(45-115ng/ml) and
TSH(0.3-6.5ng/ml)
Underweight < 20 kg/m2 Normal weight 20-25kg/m2
Overweight >25kg/m2
BSA CATEGORIZE14
Normal 1.91m2(male)
1.6m2(female)
Abnormal >1.91m2(male)
>1.71m2(female)
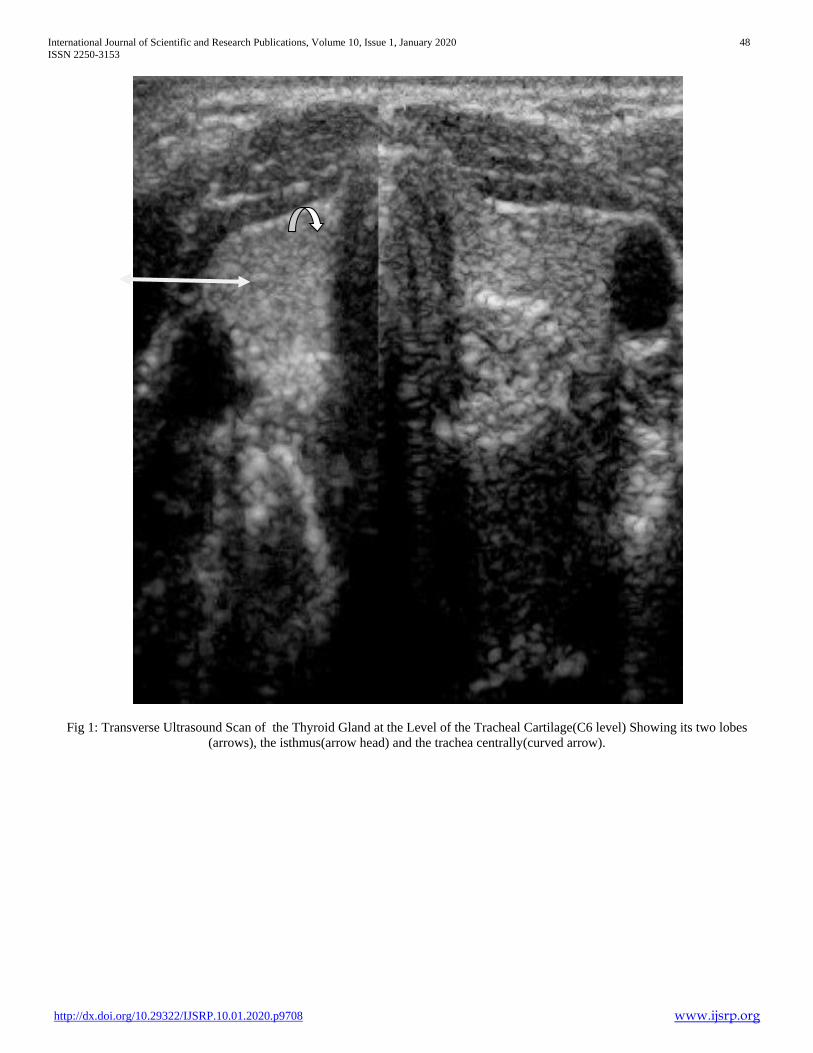
International Journal of Scientific and Research Publications, Volume 10, Issue 1, January 2020 48
ISSN 2250-3153
http://dx.doi.org/10.29322/IJSRP.10.01.2020.p9708 www.ijsrp.org
Fig 1: Transverse Ultrasound Scan of the Thyroid Gland at the Level of the Tracheal Cartilage(C6 level) Showing its two lobes
(arrows), the isthmus(arrow head) and the trachea centrally(curved arrow).

International Journal of Scientific and Research Publications, Volume 10, Issue 1, January 2020 49
ISSN 2250-3153
http://dx.doi.org/10.29322/IJSRP.10.01.2020.p9708 www.ijsrp.org
Fig 2: Longitudinal ultrasound scan of the thyroid, showing measurement of the longitudinal (LS) and anteroposterior
diameters of the thyroid lobe.
VII. DATA ANALYSIS
The data obtained from the structured questionnaire was
entered into a computer to generate a computerized data base for
subsequent analysis and processing using SPSS version 17.
Statistical parameters such as student’s test were used for
association between different variables. P value of 0.05 or less was
considered statistically significant. The results were presented in
the form of tables, chart and graphs.
VIII. ETHICAL CONSIDERATION
Approval was obtained from Research and Ethical
Committee of Jos University Teaching Hospital. Informed signed
consent was obtained from the volunteers before enrollment for
the study and they were given the freedom to withdraw from the
study at any stage without consequences. The data collected from
the participants were recorded serially and kept with utmost
confidentiality.
IX. RESULTS
A total of 400 adults were recruited comprising 150(37.5%)
males and 250(62.5%) females (Figure 3).The number of females
were more than the males.
Tables 1a and 1b shows the age-sex distribution pattern of
the male and female subjects in the study population
The total mean thyroid volume was 6.03±2.49 (range of
1.38-11.34). There is steady increase in thyroid volume with
increase in age. The lowest total mean volume of 5.52cm3 was
seen in 20-29years age groups, whereas the highest of 6.12cm3
was noted on the greater than 50years age groups. There was no
statistically significant increase in thyroid volume with increase in
age.
The total mean thyroid volume for males was 6.30cm3±2.37
(range1.38-11.34). The lowest volume of 5.80±1.51cm3 was seen
in 20-29years age groups and the highest of 6.28±3.31cm3 in
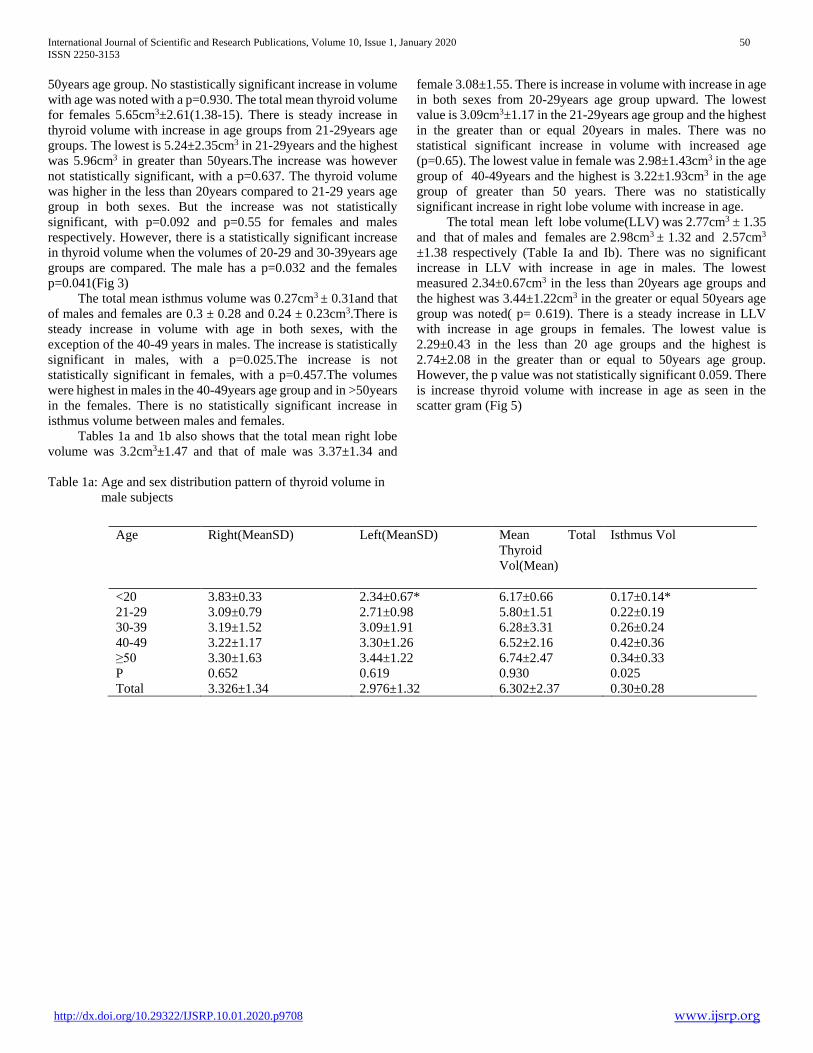
International Journal of Scientific and Research Publications, Volume 10, Issue 1, January 2020 50
ISSN 2250-3153
http://dx.doi.org/10.29322/IJSRP.10.01.2020.p9708 www.ijsrp.org
50years age group. No stastistically significant increase in volume
with age was noted with a p=0.930. The total mean thyroid volume
for females 5.65cm3±2.61(1.38-15). There is steady increase in
thyroid volume with increase in age groups from 21-29years age
groups. The lowest is 5.24±2.35cm3 in 21-29years and the highest
was 5.96cm3 in greater than 50years.The increase was however
not statistically significant, with a p=0.637. The thyroid volume
was higher in the less than 20years compared to 21-29 years age
group in both sexes. But the increase was not statistically
significant, with p=0.092 and p=0.55 for females and males
respectively. However, there is a statistically significant increase
in thyroid volume when the volumes of 20-29 and 30-39years age
groups are compared. The male has a p=0.032 and the females
p=0.041(Fig 3)
The total mean isthmus volume was 0.27cm3 ± 0.31and that
of males and females are 0.3 ± 0.28 and 0.24 ± 0.23cm3.There is
steady increase in volume with age in both sexes, with the
exception of the 40-49 years in males. The increase is statistically
significant in males, with a p=0.025.The increase is not
statistically significant in females, with a p=0.457.The volumes
were highest in males in the 40-49years age group and in >50years
in the females. There is no statistically significant increase in
isthmus volume between males and females.
Tables 1a and 1b also shows that the total mean right lobe
volume was 3.2cm3±1.47 and that of male was 3.37±1.34 and
female 3.08±1.55. There is increase in volume with increase in age
in both sexes from 20-29years age group upward. The lowest
value is 3.09cm3±1.17 in the 21-29years age group and the highest
in the greater than or equal 20years in males. There was no
statistical significant increase in volume with increased age
(p=0.65). The lowest value in female was 2.98±1.43cm3 in the age
group of 40-49years and the highest is 3.22±1.93cm3 in the age
group of greater than 50 years. There was no statistically
significant increase in right lobe volume with increase in age.
The total mean left lobe volume(LLV) was 2.77cm3 ± 1.35
and that of males and females are 2.98cm3 ± 1.32 and 2.57cm3
±1.38 respectively (Table Ia and Ib). There was no significant
increase in LLV with increase in age in males. The lowest
measured 2.34±0.67cm3 in the less than 20years age groups and
the highest was 3.44±1.22cm3 in the greater or equal 50years age
group was noted( p= 0.619). There is a steady increase in LLV
with increase in age groups in females. The lowest value is
2.29±0.43 in the less than 20 age groups and the highest is
2.74±2.08 in the greater than or equal to 50years age group.
However, the p value was not statistically significant 0.059. There
is increase thyroid volume with increase in age as seen in the
scatter gram (Fig 5)
Table 1a: Age and sex distribution pattern of thyroid volume in
male subjects
Age Right(MeanSD) Left(MeanSD) Mean Total
Thyroid
Vol(Mean)
Isthmus Vol
<20 3.83±0.33 2.34±0.67* 6.17±0.66 0.17±0.14*
21-29 3.09±0.79 2.71±0.98 5.80±1.51 0.22±0.19
30-39 3.19±1.52 3.09±1.91 6.28±3.31 0.26±0.24
40-49 3.22±1.17 3.30±1.26 6.52±2.16 0.42±0.36
≥50 3.30±1.63 3.44±1.22 6.74±2.47 0.34±0.33
P 0.652 0.619 0.930 0.025
Total 3.326±1.34 2.976±1.32 6.302±2.37 0.30±0.28
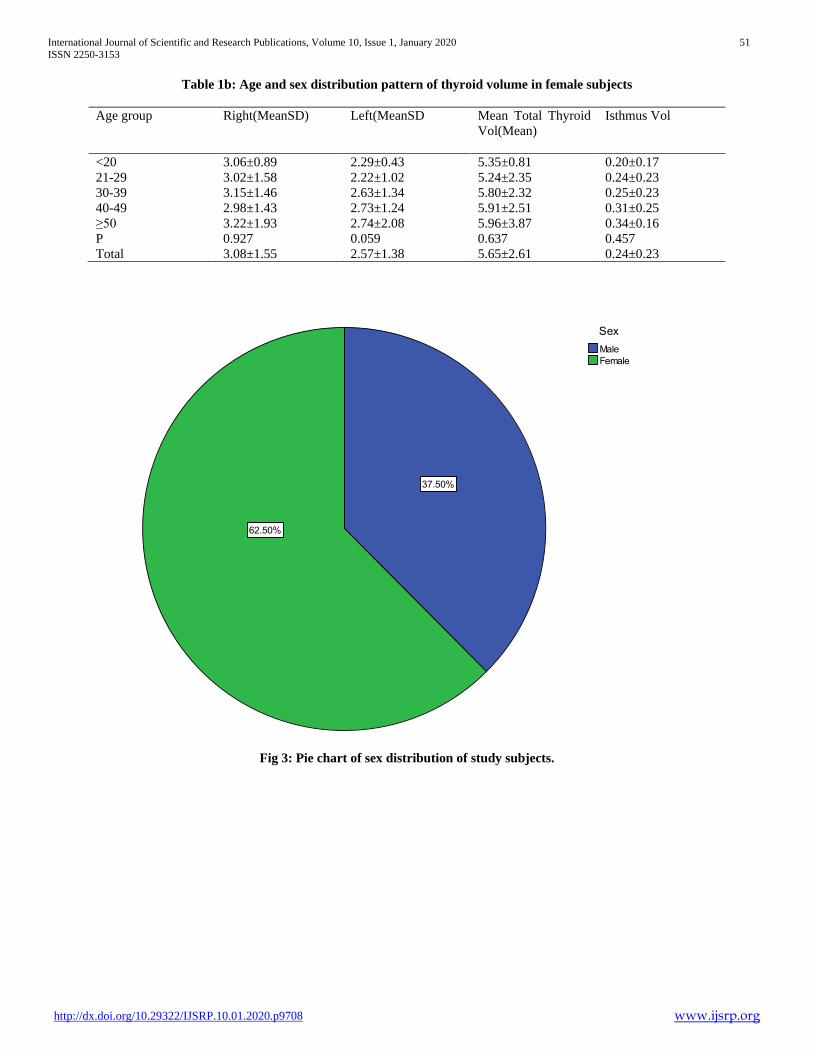
International Journal of Scientific and Research Publications, Volume 10, Issue 1, January 2020 51
ISSN 2250-3153
http://dx.doi.org/10.29322/IJSRP.10.01.2020.p9708 www.ijsrp.org
Table 1b: Age and sex distribution pattern of thyroid volume in female subjects
Age group Right(MeanSD) Left(MeanSD Mean Total Thyroid
Vol(Mean)
Isthmus Vol
<20 3.06±0.89 2.29±0.43 5.35±0.81 0.20±0.17
21-29 3.02±1.58 2.22±1.02 5.24±2.35 0.24±0.23
30-39 3.15±1.46 2.63±1.34 5.80±2.32 0.25±0.23
40-49 2.98±1.43 2.73±1.24 5.91±2.51 0.31±0.25
≥50 3.22±1.93 2.74±2.08 5.96±3.87 0.34±0.16
P 0.927 0.059 0.637 0.457
Total 3.08±1.55 2.57±1.38 5.65±2.61 0.24±0.23
Fig 3: Pie chart of sex distribution of study subjects.
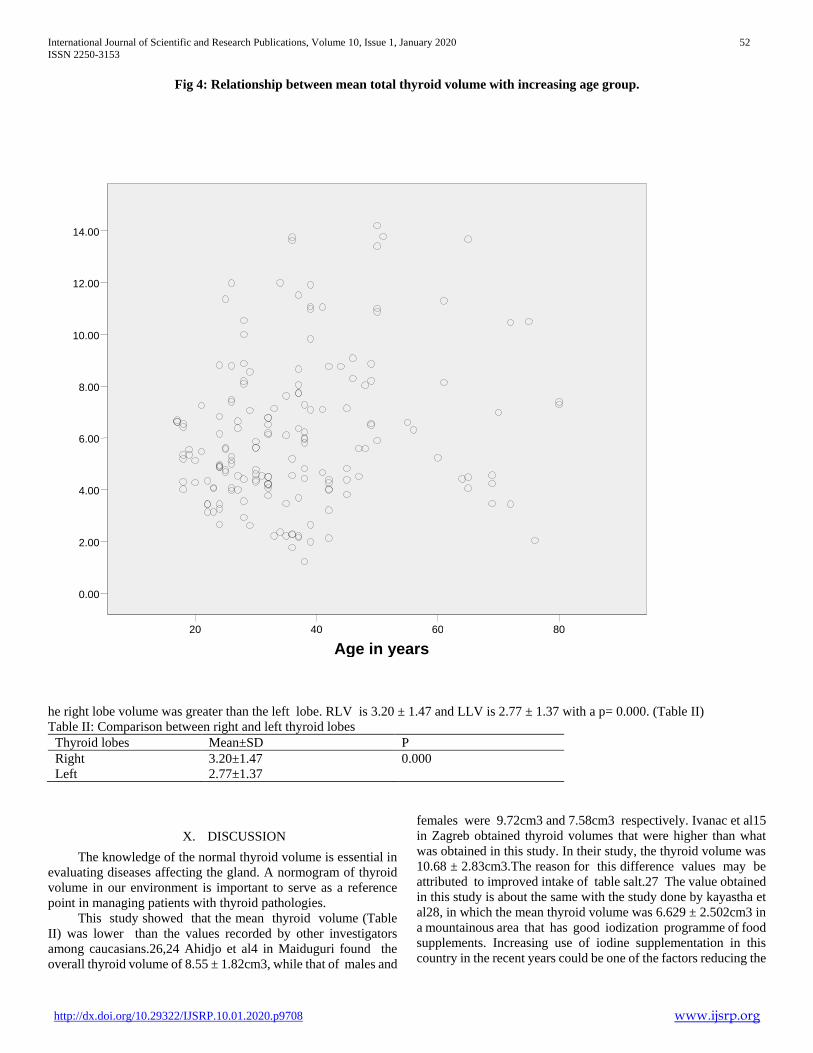
International Journal of Scientific and Research Publications, Volume 10, Issue 1, January 2020 52
ISSN 2250-3153
http://dx.doi.org/10.29322/IJSRP.10.01.2020.p9708 www.ijsrp.org
Fig 4: Relationship between mean total thyroid volume with increasing age group.
Fig 5: Relationship between thyroid volume and age of study
he right lobe volume was greater than the left lobe. RLV is 3.20 ± 1.47 and LLV is 2.77 ± 1.37 with a p= 0.000. (Table II)
Table II: Comparison between right and left thyroid lobes
Thyroid lobes Mean±SD P
Right 3.20±1.47 0.000
Left 2.77±1.37
X. DISCUSSION
The knowledge of the normal thyroid volume is essential in
evaluating diseases affecting the gland. A normogram of thyroid
volume in our environment is important to serve as a reference
point in managing patients with thyroid pathologies.
This study showed that the mean thyroid volume (Table
II) was lower than the values recorded by other investigators
among caucasians.26,24 Ahidjo et al4 in Maiduguri found the
overall thyroid volume of 8.55 ± 1.82cm3, while that of males and
females were 9.72cm3 and 7.58cm3 respectively. Ivanac et al15
in Zagreb obtained thyroid volumes that were higher than what
was obtained in this study. In their study, the thyroid volume was
10.68 ± 2.83cm3.The reason for this difference values may be
attributed to improved intake of table salt.27 The value obtained
in this study is about the same with the study done by kayastha et
al28, in which the mean thyroid volume was 6.629 ± 2.502cm3 in
a mountainous area that has good iodization programme of food
supplements. Increasing use of iodine supplementation in this
country in the recent years could be one of the factors reducing the
Age in years
80 60 40 20
14.00
12.00
10.00
8.00
6.00
4.00
2.00
0.00
International Journal of Scientific and Research Publications, Volume 10, Issue 1, January 2020 53
ISSN 2250-3153
http://dx.doi.org/10.29322/IJSRP.10.01.2020.p9708 www.ijsrp.org
iodine deficiency prevalent in the country and thus reducing the
total thyroid volume.
The male’s thyroid volumes (6.30±2.37) were higher than
that of females (5.65±2.61). This finding was similar to that of
other investigators 4,29,10,30,21. This may be due to the fact males
have increased body mass index than females of the same age.
However, Anele T17 and Marchie et al13 found no significant
difference between males and females thyroid volumes.
The mean right lobe volume was higher than that of the left,
and it was statistically significant. Similar findings were noted by
other investigators.4,10,30,21 This increase may likely be due to
increased vascularization of the right lobe compared to the left10.
The mean heights of males were higher than that of females.
There was a positive correlation of thyroid and isthmus volume
with height. Similar findings were noted by other investigators 4,31,15,20.
Thyroid volume increases steadily with increase in age in the
females and male subjects. This increase was however, not
statistically significant. Similar findings by Suwaid et al10 and
Barrer et al21 were statistically significant. It was thought that
thyroid volume increases with age up to 65 years as noted by
Barrer et al21. The thyroid volume was higher in the less than
20years compared with 20-29years age groups in both sexes. The
increase was not statistically significant. No obvious reason was
found for such. It was however thought to be due to a growth spurt
at less than 20years age groups.
The isthmus volume was higher in males (0.30±0.28)
compared to females (0.24±0.23) and also increased with age.
Servet et al20 in Turkey obtained values that were similar to this
study. They recorded positive correlation between the mean
isthmus volume with age, weight, height and BSA. The mean total
isthmus volume was 0.45 ± 0.31 and that of males and females
was 0.44 ± 0.34 and 0.46 ± 0.29 respectively. However, the mean
isthmus volume in this study was lower than what they obtained
in their study. The reasons attributed to difference in thyroid
lobes volume in my study compared with others may also be
applicable here.
In conclusion, there was no statistically significant increase
in thyroid volume with increase in age. There was steady increase
in isthmus volume with increase in age. The males thyroid volume
was higher than that of females across the age groups. Also, the
right lobe volume was noted to be bigger than the left.
REFERENCES
[1] Tan S Y, Shigaki D. Medicine in Stamps. Singapore Med J 2008; 49 (9) : 662
[2] Guyton A C, John E H. Thyroid Metabolic Hormones In: Arthur C. Guyton, John E. Hall (eds) Textbook of Medical Physiology.11th edition. Philadelphia, Pennsylvania. Elsevier Inc. 2006; 931-932.
[3] Yalcin B, Ozan H.”Detailed investigation of the relationship between the inferior laryngeal nerve including laryngeal branches and ligament of Berry”. Journal of American College of Surgeons. 202(2):291-6.
[4] Ahidjo A,Tahir A,Tukur M. Ultrasound Determination of Thyroid Gland Volume Among Adult Nigerians. The Internet Journal of Radiology (online) 2006;4(2).AvailableatURL:www.ispub.com/ostia/index.php?xmlFilePath=journals/ijra/vol4n2/thyroid.xml(accessed 30th January 2011).
[5] Rasmussen SN, Hjorth L. Determination of thyroid volume by ultrasonic scanning. Journal of Clinical Ultrasound. 1974; 2: 143–147.
[6] EKPECHI O L. Pathogenesis of endemic goiter in Eastern Nigeria. British Journal of Nutrition.1967; 21:537-545.
[7] Martin PS and James AP. Multimodality Imaging of the Thyroid and Parathyroid Glands. Journal of Nuclear Medicine. 1987;28:122-129.
[8] Normal thyroid size. In: Thyroid talk (online).Available at URL: http://www.thyroid talk.com/normal thyroid size.html. Accessed 13th December 2010).
[9] Adibi A, Sirous M, Aminorroaya A, Roohi E, Mostafavi M, Fallah Z et al. Normal values of thyroid Gland in Isfahan, an iodine replete area. Journal of Research in Medical Sciences. 2008;13(2):55-60.
[10] Suwaid MA, Tabari AM, Isyaku K, Idris SK, Saleh MK, Abdulkadir AY: Sonographic measurement of normal thyroid gland volume in School Children in Kano, Nigeria. West Afr Journal of ultrasound. 2009;8(1):14-22.
[11] Yokoyama N, Nagayama Y, Kakezono F, Kiriyama T, Morita S, Ohtakara S. Determination of the Volume of the Thyroid Gland by a High Resolutional Ultrasonic Scanner. Journal Nuclear Medicine (online). 1986; 27:1475-1479.
[12] Egbuta J, Onyezili F, Vanormelingen K. Impact evaluation of efforts to eliminate iodine deficiency disorders in Nigeria. Journal of Public Health Nutrition. 2002;6(2):169-173.
[13] Marchie TT, Oyobere O, Eze KC. Comparative ultrasound measurement of normal thyroid gland dimensions in school aged children in our local environment. Niger J of Clin Pract. 2012; 15: 3: 285-292.
[14] Mohammed Y,Abdelmoneim S,Bushra A,Alsafi A and Khaled E.Local Reference Ranges of Thyroid Volume in Sudanese Normal Subjects using Ultrasound.J of Throid Research.Vol 2011(2011),Article ID 935141,4Pages.
[15] Ivanac G, Rozman B, Skreb F, Brkljacic B, Pavic L. Ultrasonographic Measurement of the Thyroid Volume . Collegium Antropologicum 2004; 28(1): 287–291
[16] Kapil U. Health Consequences of Iodine Deficiency. Indian Journal for the PracticingDoctor.2009;5(6):110.Availableat:http://www.indmedica.com/journals.php?journalid=3&issueid=137&articleid=1816&action=article(accessed 2nd Dec 2010).
[17] Anele T. Ultrasound volumetric measurement of normal thyroid in Nigerians. West Africa Journal of Ultrasound. 2001; 2(1): 10-12.
[18] Ying M,Yung MC. Assymetry of Thyroid Lobe Volume in Normal Chinese Subjects: Association with Handedness and Position of Esophagus. The Anatomical Record. 2009; 292:169-174.
[19] Taty-Anna K,Farihah HS,Norzara AG,Farida H,Das S.Absence of the isthmus of the thyroid gland:anatomical and clinical consideration.Clin. Ter.2012 Nov;163(6):503-4.
[20] Servet S, Ismet T. Determination of thyroid volume and its relation with isthmus thickness. European journal of general medicine 2010;7(2):125-129
[21] Barrer X, valeix P, Preziosi P. Determinants of thyroid volume in healthy French adults participating in SU.VI.MAX.cohort. Clin Endocrinol (oxf). 2000;52:273-8.
[22] Plateau State Government. At http: /www.plateaustategov.org history/geo-info.html. Accessed on 11/3/2011
[23] Ozgen A, Erol C, Kaya A, Ozmen NM, Akata D, Akhan O. Interobserver and intraobserver variations in sonographic measurement of thyroid volume in children. European journal of Endocrinology 1999;140:213-220
[24] Berthold B. Normal Sonographic Dimensions of the Prostate and Thyroid Gland.In:Color Atlas of Ultrasound Anatomy. Stuttgart, Germany.Thieme. 2004; 283.
[25] Dubois D, Dubois EF. A formula to estimate the approximate surface area if height and weight be known. Arch Intern Med. 1916;17: 863-71.
[26] Matthias H, Tatjana R, Peter FW. Thyroid gland. In: Ultrasound teaching manual. New York.Thieme.1999;74.
[27] NIGERIA: Universal salt Iodisation Assessment: Towards a sustainable elimination of iodine deficiency. Review 27th Nov-3rd Dec 2005.
[28] Kayastha P, Pandel S, Shretha DM, Ghimire RK, Pradhan S. Study of Thyroid volume by ultrasonography in Clinically euthyroid Patients. Journal of institute of medicine. 2010; 32(2):36-43.
[29] Edwards CRW, Toft AD, Walker BR. Endocrine Disease. In: Davidson’s Principles and Practice of Medicine. 18th Ed. Edinburgh. 2000; Pg 543-598.
[30] Langer P. Normal thyroid Size versus goiter-postmortem thyroid weight and ultrasonographic volumetry versus physical examinations. Endocrinol exp.1989; 23(2): 67-76.
[31] Shabana W, Peeters E, Maeseneer MD. Measuring Thyroid Gland Volume: Should We Change the Correction Factor? American Journal of Radiology. 2006;186:234-236

International Journal of Scientific and Research Publications, Volume 10, Issue 1, January 2020 54
ISSN 2250-3153
http://dx.doi.org/10.29322/IJSRP.10.01.2020.p9708 www.ijsrp.org
AUTHORS
First Author – A. J. Salaam, Department of Radiology, Jos
University Teaching Hospital, Nigeria.
Second Author – S. M. Danjem, Department of Radiology, Jos
University Teaching Hospital, Nigeria.
Third Author – A. A. Salaam, Department of Family Medicine,
Jos University Teaching Hospital, Nigeria.
Fourth Author – H. A. Angba, Department of Radiology, Jos
University Teaching Hospital, Nigeria.
Fifth Author – P. O. Ibinaiye, Department of Radiology,
Ahmadu Bello University Teaching Hospital, Nigeria.
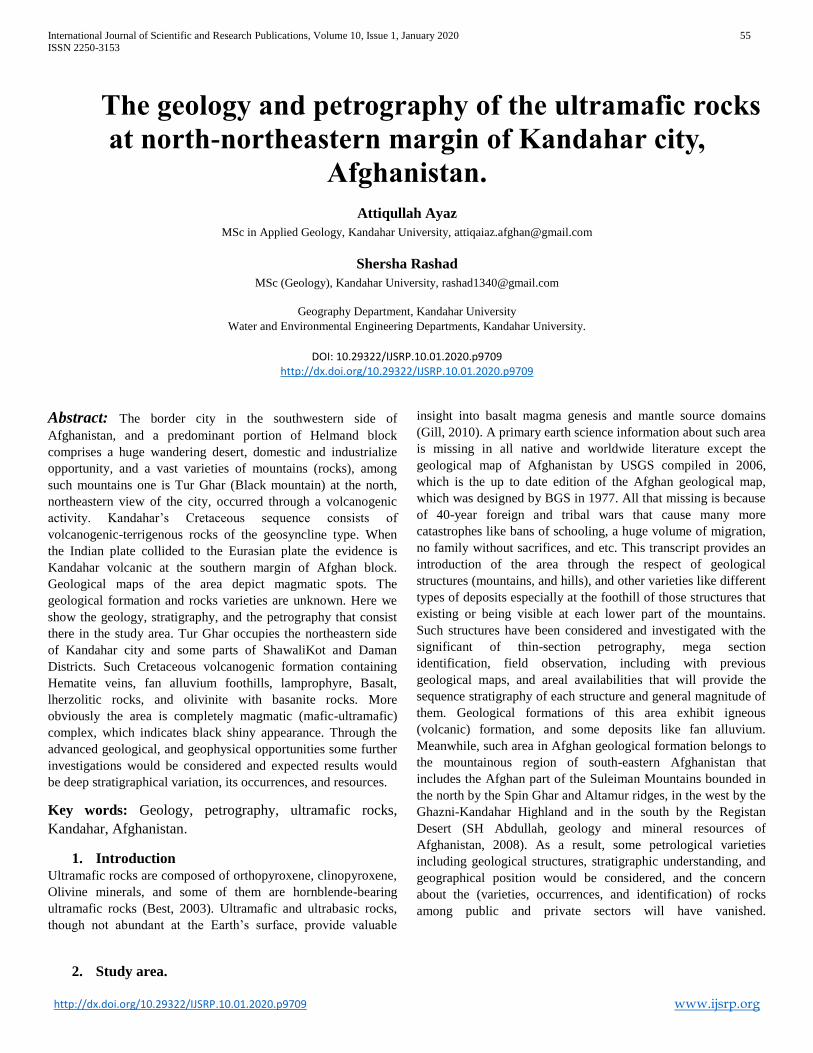
International Journal of Scientific and Research Publications, Volume 10, Issue 1, January 2020 55 ISSN 2250-3153
http://dx.doi.org/10.29322/IJSRP.10.01.2020.p9709 www.ijsrp.org
The geology and petrography of the ultramafic rocks
at north-northeastern margin of Kandahar city,
Afghanistan.
Attiqullah Ayaz
MSc in Applied Geology, Kandahar University, [email protected]
Shersha Rashad
MSc (Geology), Kandahar University, [email protected]
Geography Department, Kandahar University
Water and Environmental Engineering Departments, Kandahar University.
DOI: 10.29322/IJSRP.10.01.2020.p9709 http://dx.doi.org/10.29322/IJSRP.10.01.2020.p9709
Abstract: The border city in the southwestern side of
Afghanistan, and a predominant portion of Helmand block
comprises a huge wandering desert, domestic and industrialize
opportunity, and a vast varieties of mountains (rocks), among
such mountains one is Tur Ghar (Black mountain) at the north,
northeastern view of the city, occurred through a volcanogenic
activity. Kandahar’s Cretaceous sequence consists of
volcanogenic-terrigenous rocks of the geosyncline type. When
the Indian plate collided to the Eurasian plate the evidence is
Kandahar volcanic at the southern margin of Afghan block.
Geological maps of the area depict magmatic spots. The
geological formation and rocks varieties are unknown. Here we
show the geology, stratigraphy, and the petrography that consist
there in the study area. Tur Ghar occupies the northeastern side
of Kandahar city and some parts of ShawaliKot and Daman
Districts. Such Cretaceous volcanogenic formation containing
Hematite veins, fan alluvium foothills, lamprophyre, Basalt,
lherzolitic rocks, and olivinite with basanite rocks. More
obviously the area is completely magmatic (mafic-ultramafic)
complex, which indicates black shiny appearance. Through the
advanced geological, and geophysical opportunities some further
investigations would be considered and expected results would
be deep stratigraphical variation, its occurrences, and resources.
Key words: Geology, petrography, ultramafic rocks,
Kandahar, Afghanistan.
1. Introduction
Ultramafic rocks are composed of orthopyroxene, clinopyroxene,
Olivine minerals, and some of them are hornblende-bearing
ultramafic rocks (Best, 2003). Ultramafic and ultrabasic rocks,
though not abundant at the Earth’s surface, provide valuable
insight into basalt magma genesis and mantle source domains
(Gill, 2010). A primary earth science information about such area
is missing in all native and worldwide literature except the
geological map of Afghanistan by USGS compiled in 2006,
which is the up to date edition of the Afghan geological map,
which was designed by BGS in 1977. All that missing is because
of 40-year foreign and tribal wars that cause many more
catastrophes like bans of schooling, a huge volume of migration,
no family without sacrifices, and etc. This transcript provides an
introduction of the area through the respect of geological
structures (mountains, and hills), and other varieties like different
types of deposits especially at the foothill of those structures that
existing or being visible at each lower part of the mountains.
Such structures have been considered and investigated with the
significant of thin-section petrography, mega section
identification, field observation, including with previous
geological maps, and areal availabilities that will provide the
sequence stratigraphy of each structure and general magnitude of
them. Geological formations of this area exhibit igneous
(volcanic) formation, and some deposits like fan alluvium.
Meanwhile, such area in Afghan geological formation belongs to
the mountainous region of south-eastern Afghanistan that
includes the Afghan part of the Suleiman Mountains bounded in
the north by the Spin Ghar and Altamur ridges, in the west by the
Ghazni-Kandahar Highland and in the south by the Registan
Desert (SH Abdullah, geology and mineral resources of
Afghanistan, 2008). As a result, some petrological varieties
including geological structures, stratigraphic understanding, and
geographical position would be considered, and the concern
about the (varieties, occurrences, and identification) of rocks
among public and private sectors will have vanished.
2. Study area.
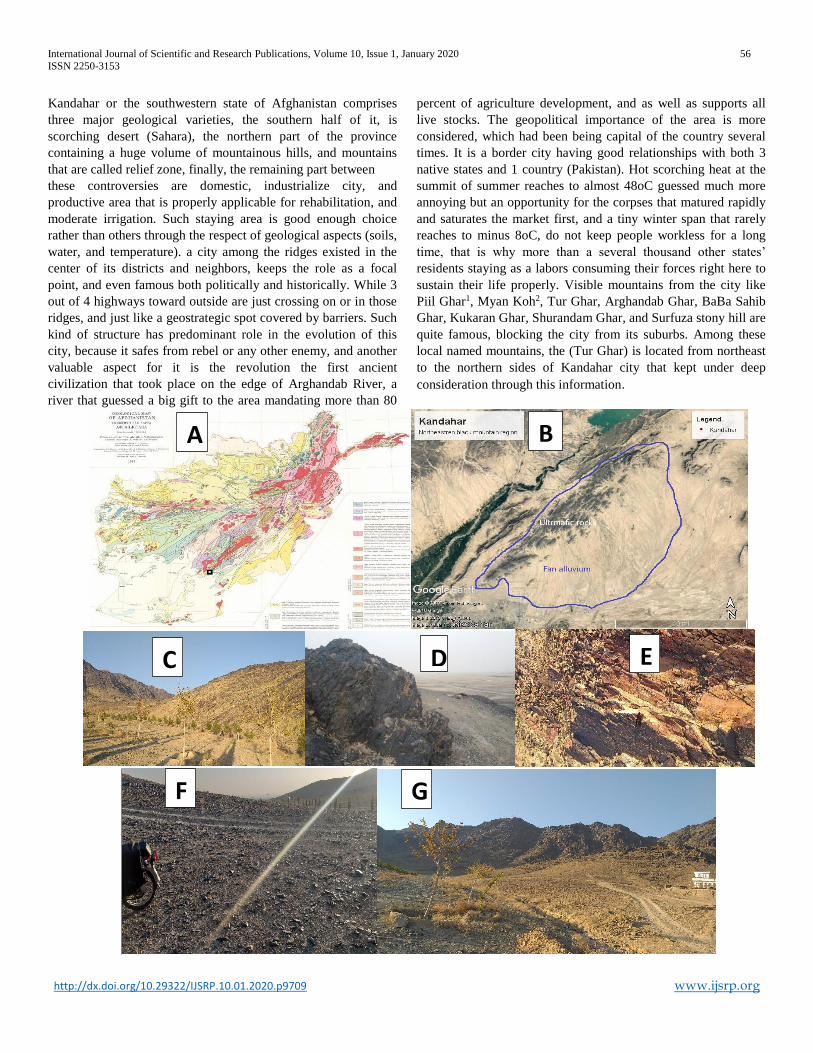
International Journal of Scientific and Research Publications, Volume 10, Issue 1, January 2020 56
ISSN 2250-3153
http://dx.doi.org/10.29322/IJSRP.10.01.2020.p9709 www.ijsrp.org
Kandahar or the southwestern state of Afghanistan comprises
three major geological varieties, the southern half of it, is
scorching desert (Sahara), the northern part of the province
containing a huge volume of mountainous hills, and mountains
that are called relief zone, finally, the remaining part between
these controversies are domestic, industrialize city, and
productive area that is properly applicable for rehabilitation, and
moderate irrigation. Such staying area is good enough choice
rather than others through the respect of geological aspects (soils,
water, and temperature). a city among the ridges existed in the
center of its districts and neighbors, keeps the role as a focal
point, and even famous both politically and historically. While 3
out of 4 highways toward outside are just crossing on or in those
ridges, and just like a geostrategic spot covered by barriers. Such
kind of structure has predominant role in the evolution of this
city, because it safes from rebel or any other enemy, and another
valuable aspect for it is the revolution the first ancient
civilization that took place on the edge of Arghandab River, a
river that guessed a big gift to the area mandating more than 80
percent of agriculture development, and as well as supports all
live stocks. The geopolitical importance of the area is more
considered, which had been being capital of the country several
times. It is a border city having good relationships with both 3
native states and 1 country (Pakistan). Hot scorching heat at the
summit of summer reaches to almost 48oC guessed much more
annoying but an opportunity for the corpses that matured rapidly
and saturates the market first, and a tiny winter span that rarely
reaches to minus 8oC, do not keep people workless for a long
time, that is why more than a several thousand other states’
residents staying as a labors consuming their forces right here to
sustain their life properly. Visible mountains from the city like
Piil Ghar1, Myan Koh2, Tur Ghar, Arghandab Ghar, BaBa Sahib
Ghar, Kukaran Ghar, Shurandam Ghar, and Surfuza stony hill are
quite famous, blocking the city from its suburbs. Among these
local named mountains, the (Tur Ghar) is located from northeast
to the northern sides of Kandahar city that kept under deep
consideration through this information.
A B
C D E
F G
International Journal of Scientific and Research Publications, Volume 10, Issue 1, January 2020 57
ISSN 2250-3153
http://dx.doi.org/10.29322/IJSRP.10.01.2020.p9709 www.ijsrp.org
Figure 1: (A) Geological map of Afghanistan published 1977, the block square at the southwestern corner is the study
area indicates a magmatic structure. (B) Google earth image showing the area, including fan alluvium in the
basement of the mountain. (C) Dykes at hematite hill. (D) Volcanic dome shows the mode of occurrences of the
mountain comprises basalt rocks. (E) Hematite vein structures in a single hill at the southern margin of the
mountain, hand specimen figure (#). (F) foothill of the mountains and hills containing basaltic bolder and conducted
to fan alluvium. (G) a view of magmatic rocks mountain.
3. Review of the literature
An overall geological depiction of two provinces in the
southwestern zone of Afghanistan revealed in a quadrangle 3146,
Kandahar (606) sheet (1: 250,000) by USGS and AGC
(Afghanistan Geodesy & Cartography Head Office, that
complied by (Dennis W. O’Leary and John W. Whitney 2005),
such map introduces the updated version of the Magmatic map of
Afghanistan that complied in 1977. The geological formation
that exposed in the north-east of the town of Kandahar is known
by Anagay Formation, consisting of pre-Barremian beds, some
intrusion, and volcanic-terrigenous rocks (BGS,2008, p. 165).
Kandahar volcanic-region is depicted in the Helmand-Arghandab
uplift zone (Map of magmatic formation of Afghanistan.1977, 1:
2,500,000). The Kandahar forearc basin developed during late
Jurassic-mid-Cretaceous times along the present SE margin of
the Helmand Block, and it is separated from the latter by Moqor-
Tarnak Fault. The volcano-sedimentary basin was located on the
margin of the Neotethys realm of Baluchistan. The basin is
narrow in the NE, broadening towards the SW, where it
continues below the Sistan Desert in the Chagai are along the
Afghan-Pakistan border. To the east, the basin is truncated by the
Chaman Fault, which separated it from the Paleogene sediments
of the Katawaz Basin belonging to the Himalayan tectonic
domain (Siehl, 2017, p.76). The first evidence that India drifted
north, away from Gondwanaland toward the enlarged Eurasian
plate with the Afghan block at its southern margin is the
Kandahar volcanic and that marked the beginning of the
development of a volcanic arc on the margins of the Eurasian
supper plate. These were intruded by subduction-related, I-type’
granitoid in the Helmand and west Nuristan blocks (during the
Cretaceous to early tertiary). The Farad block was subsequently
overlain by Upper Jurassic-Cretaceous sediments and the
Helmand block by Cretaceous sediments only. During this period
the Pamir and West Nuristan blocks of northeast Afghanistan
were also accreted onto Eurasia. These four blocks, together with
the Tadjik block, are collectively known as the Afghan Block
(Ministry of Mine AGS. n. d). All the igneous extrusions in the
area including mountains and hills in a wide distribution are
Neogene volcanoes (AFG Geology). Early in the Mesozoic,
Pangaea began to break apart into two major pieces: Laurasia to
the north of the Tethys Sea and Gondwana to the south. Smaller
landmasses split off from Gondwana into the Tethys Sea. During
the Cretaceous, one of these landmasses, now part of central
Afghanistan south of the Hari Rud fault, was sutured against
Laurasia. India was another one of these landmasses, migrating
during the Cretaceous and Paleocene across the Tethys; by the
middle Eocene, it had begun to collide with Laurasia northeast of
Afghanistan, forming the beginning of the Himalayan orogeny. A
tongue of the Tethys Sea remained between Afghanistan and
India until the Pliocene. Deposited upon this remnant of oceanic
crust was marine sediments. As this oceanic crust was subducted
westward beneath Afghanistan, igneous activity increased along
the eastern margin of Afghanistan that is now west of the
Chaman fault (Schindler, 2002). Petrographic study of the
chromite samples recorded between 5-10% interstitial silicate
minerals in the ultramafic lithology. In chromite sample LGR
013 this consists largely of olivine with minor alteration to
serpentine, whilst the other samples are more altered with mainly
serpentine, chlorite and a few remnants of olivine. A
photomicrograph of chromite LGR 010 showing olivine with the
serpentine alteration. The chromite itself is generally fresh
showing red to red-brown colors with some minor darkening
along with fractures, but LGR 001 (chromitite) is much more
intensely darkened indicating alteration to ‘ferrit-chromite’ and
magnetite (Styles, June 2009). The most prospective areas for
gold-bearing skarn are the south-central provinces of Zabul,
Ghazni, and Kandahar which contain over 50 gold-bearing sites
including the largest gold resource currently known in
Afghanistan. The occurrences are associated with Cretaceous
subduction-related volcanic arcs within the Helmand Block
(Coats, January 2006). The beginning of the development of a
magmatic arc on the southern margin of the Eurasia Plate was
marked by the Late Jurassic and middle Cretaceous Kandahar
volcanic (Klaus Steinmuller, Dec 2010, p. 10). Cu and Pb-Zn
skarn deposits and their related vein and manto style deposits are
found adjacent to both late Triassic intrusions formed during the
Cimmerian orogeny in Herat and Baghlan provinces, and to
Oligocene intrusions in Uruzgan and Kandahar. Many of these
occurrences are small but those at DarraAlasang in the Baghlan,
as well as Darra-i-Nur and Kalai-Assad in the Kandahar
province, are larger and more economically significant (Klaus
Steinmuller, Dec 2010, p. 28). Organic remains are scarce.
Poorly preserved remains of ammonites were collected in an area
20 kilometers east of Kandahar along the road to Spin Boldak.
After preliminary examination, N.P Luppov identified
Costidiscus sp., Paraspiticeras sp., and Leptoceras sp. On this
basis, he dated the enclosing rocks as Barremian. Later he
succeeded in identifying one of the forms as cotidiscus ex gr.
Recticotatus Orb., and placed the rocks into a range of Upper
Barremain-Lower Aptian (SH Abdullah, geology and Mineral
resources of Afghanistan, 2008). The report of Pajwak Afghan
news about Kandahar prescribed estimated iron mine around 8.5
million tons in Khakriz district, Marble mine in Dara-e-Noor in
Maiwand district, fluorite mine in Bakhtu mountain in Nish
district, Stacoo mine around 2.5m deep and 5m wide in Dama
district 22,242 cubic meters extracted annually, Cement mine in
Zakir Shirif in Dand district 14 kilometer east to Kandahar city,
Coal in Spin Buldak pajwak news. Iron bearing deposits in
Kandahar province like Haji Alam mine in Khakriz district, Asad
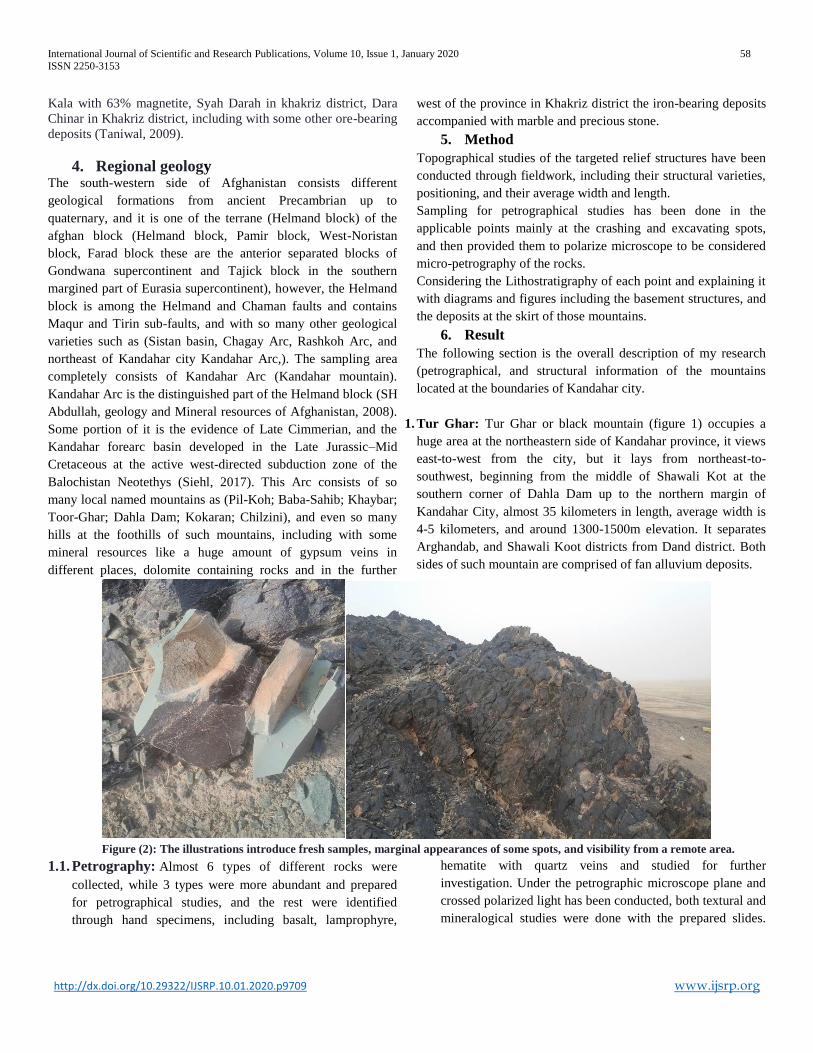
International Journal of Scientific and Research Publications, Volume 10, Issue 1, January 2020 58
ISSN 2250-3153
http://dx.doi.org/10.29322/IJSRP.10.01.2020.p9709 www.ijsrp.org
Kala with 63% magnetite, Syah Darah in khakriz district, Dara
Chinar in Khakriz district, including with some other ore-bearing
deposits (Taniwal, 2009).
4. Regional geology The south-western side of Afghanistan consists different
geological formations from ancient Precambrian up to
quaternary, and it is one of the terrane (Helmand block) of the
afghan block (Helmand block, Pamir block, West-Noristan
block, Farad block these are the anterior separated blocks of
Gondwana supercontinent and Tajick block in the southern
margined part of Eurasia supercontinent), however, the Helmand
block is among the Helmand and Chaman faults and contains
Maqur and Tirin sub-faults, and with so many other geological
varieties such as (Sistan basin, Chagay Arc, Rashkoh Arc, and
northeast of Kandahar city Kandahar Arc,). The sampling area
completely consists of Kandahar Arc (Kandahar mountain).
Kandahar Arc is the distinguished part of the Helmand block (SH
Abdullah, geology and Mineral resources of Afghanistan, 2008).
Some portion of it is the evidence of Late Cimmerian, and the
Kandahar forearc basin developed in the Late Jurassic–Mid
Cretaceous at the active west-directed subduction zone of the
Balochistan Neotethys (Siehl, 2017). This Arc consists of so
many local named mountains as (Pil-Koh; Baba-Sahib; Khaybar;
Toor-Ghar; Dahla Dam; Kokaran; Chilzini), and even so many
hills at the foothills of such mountains, including with some
mineral resources like a huge amount of gypsum veins in
different places, dolomite containing rocks and in the further
west of the province in Khakriz district the iron-bearing deposits
accompanied with marble and precious stone.
5. Method
Topographical studies of the targeted relief structures have been
conducted through fieldwork, including their structural varieties,
positioning, and their average width and length.
Sampling for petrographical studies has been done in the
applicable points mainly at the crashing and excavating spots,
and then provided them to polarize microscope to be considered
micro-petrography of the rocks.
Considering the Lithostratigraphy of each point and explaining it
with diagrams and figures including the basement structures, and
the deposits at the skirt of those mountains.
6. Result
The following section is the overall description of my research
(petrographical, and structural information of the mountains
located at the boundaries of Kandahar city.
1. Tur Ghar: Tur Ghar or black mountain (figure 1) occupies a
huge area at the northeastern side of Kandahar province, it views
east-to-west from the city, but it lays from northeast-to-
southwest, beginning from the middle of Shawali Kot at the
southern corner of Dahla Dam up to the northern margin of
Kandahar City, almost 35 kilometers in length, average width is
4-5 kilometers, and around 1300-1500m elevation. It separates
Arghandab, and Shawali Koot districts from Dand district. Both
sides of such mountain are comprised of fan alluvium deposits.
Figure (2): The illustrations introduce fresh samples, marginal appearances of some spots, and visibility from a remote area.
1.1. Petrography: Almost 6 types of different rocks were
collected, while 3 types were more abundant and prepared
for petrographical studies, and the rest were identified
through hand specimens, including basalt, lamprophyre,
hematite with quartz veins and studied for further
investigation. Under the petrographic microscope plane and
crossed polarized light has been conducted, both textural and
mineralogical studies were done with the prepared slides.

International Journal of Scientific and Research Publications, Volume 10, Issue 1, January 2020 59
ISSN 2250-3153
http://dx.doi.org/10.29322/IJSRP.10.01.2020.p9709 www.ijsrp.org
Figure (3): Magnesium-rich olivinite of Tur Ghar and microphotograph of PPL and XPL. The study area of the
samples is located at the southern portion of Tur Ghar at the further north of Ayno Mina new city at the northeastern
side of Kandahar old city. Its aphanitic texture covered a huge area such as domes and isolated peaky structures,
including enough soils or sand deposits at the basement that makes clear it's adjusting to easy weathering rather than
others (figure 2). Such rocks occur at the margin of other siblings like dunite rocks, serpentinite, and basalt. The
specimens are free from any injected veins and vessels but only surficial variation at weathered spots that causes the
easy brittle in such a portion. Compose of it is 90% olivine mineral with quarts, and magnesium accessories. Under
microphotography, the rock looks green with white spots and the crystals of the rock are not distinguishable, which
means very fine grains with the result of rapid cooling through cold atmospheric surroundings. The specimens look
free from relief structures and no twining with zero cleavage. Hand specimen or seeing from the remote area it looks
like a black monster, but when you take it out or took a broken sample it looks like green leaves of arid zone tree.
Figure (4): Hematite with magnesite veins of Tur Ghar and microphotograph of PPL and XPL Samples area at the
further north of Ayno new city almost 15 km at the northeastern side of Kandahar old city, appeared just like a middle
reddish hill in front of that black mountain, and just separated by a valley (figure 1c). The geology of the hill looks like
layers around 10 cm to 1m of such reddish hematite, between those layers fragments of such hematite deposited that
introducing its adjustment to the dominated weather phenomenon. With its aphanitic texture no, one capable to
distinguish the grains. Low metallic luster with the reddish streak, and with massive structure. The samples with its
heavy scale rather than its neighbor rocks (serpentinite, dunite, lherzolite). The rock composition with its opaque
diaphaneity containing a huge amount of Hematite with magnesite veins. No more accessories are applicable.
2mm 2mm
2mm 2mm

International Journal of Scientific and Research Publications, Volume 10, Issue 1, January 2020 60
ISSN 2250-3153
http://dx.doi.org/10.29322/IJSRP.10.01.2020.p9709 www.ijsrp.org
Figure (5): Lherzolitic of Tur Ghar and microphotograph of PPL and XPL. Lherzolitic from such Tur Ghar complex
containing more than 70 percent volume, such rock with blackish basanite blanket occurred at near beneath of basalt
rocks, mainly contact with basalt. Geographically located at the northeastern side of Kandahar city, well known by a
black mountain in the local area but after taking a fresh hand sample except a thin black layer the whole body is
greenish to dark greenish lherzolite rocks. This rocks with its massive appearance containing medium grains which are
enabled to see through the necked eye. By containing visible grains introduce us to a phaneritic igneous texture. The
colorless in thin section is Clinopyroxene, the green and greenish are orthopyroxene, the brown indicates the spinal
minerals, the reddish is the chromite accessories. With a no twining containing, that has relief structures.
Figure (5): Lherzolitic of Tur Ghar and microphotograph of PPL and XPL. Lherzolitic from such Tur Ghar complex containing more than
70 percent volume, such rock with blackish basanite blanket occurred at near beneath of basalt rocks, mainly contact with basalt.
Geographically located at the northeastern side of Kandahar city, well known by a black mountain in the local area but after taking a fresh
hand sample except a thin black layer the whole body is greenish to dark greenish lherzolitic rocks. This rocks with its massive appearance
containing medium grains which are enabled to see through the necked eye. By containing visible grains introduce the phaneritic igneous
texture. The colorless in thin section is Clinopyroxene, the green and greenish are orthopyroxene, the brown indicates the spinal minerals, the
reddish is the chromite accessories. With a no twining containing, that has relief structures.
1.2. Stratigraphy: The area containing varieties of
stratification that is distinguishable during field observation.
Both sides along the strike covered through alluvium fan that
comprises rock samples including from tiny particles up to the
size of a boulder, and at the near margin solitary hills comprising
hematite veins with eroded soil’s particles, apart from that the
valley shape between hill and mountain is again alluvial fan
(figure). The vertical lithostratigraphical variation forms the
bottom of the mountain started by lherzolitic, Basanite-Dunite
and at the top a massive basalt.
Figure (7): diagram shows surficial stratigraphy
A B C
2mm 2mm
International Journal of Scientific and Research Publications, Volume 10, Issue 1, January 2020 61
ISSN 2250-3153
http://dx.doi.org/10.29322/IJSRP.10.01.2020.p9709 www.ijsrp.org
7. Discussion
This geological spot is at the middle of Helmand
terrain (Kandahar province) occupies the central, south-
southwestern geography of Afghan block, depicts completely
mafic-ultramafic rock containing geological structures
(mountains, and hill), and easily distinguishable from the rest
geological structures (sedimentary, metamorphic, losses, and vast
area of sand Sahara). Such mountainous ridge is a subpart of
Afghanistan central mountains that started from the north of
Ghuzni and Bamyan provinces crossing the north of Zabul and
Uruzgan provinces reaches to the north of Helmand Kajakie
water dam, and southeastern wing of such enlarged structure
become weak at the north of Kandahar city, but more furtherly
vanished at the periphery of Kandahar Registan Desert (Taniwal,
2009). It is volcanos geological formation that may have
occurred at the age of mega colliding or some convergent
geological formation at the peripheries of this terrane. In the
Kandahar, in contrast to all others, the Cretaceous sequence
consists of volcanogenic-terrigenous rocks of the geosyncline
type (BGS,2008, p. 26). On behalf of the field observation
majority of the rocks are basalts, regarding its physical, and
chemical properties, basalt rock weathers fast, so that is why
soils and other weathered particles are accompanied up to the
upper peaky points of the mountains. Stratigraphical formation of
the area shows (1) fan alluvium, (2) hematite dikes containing
hills, (3) volcanogenic valley full of basanite rocks boulders, (4)
soil aggregated with fine grains olivinite rock, (5) combination of
lherzolitic, lamprophyre, and magnesium-rich serpentine, (6) and
finally the whole surficial rocks structures containing basalt, and
basanite rocks. It strikes from northeastern to the northwestern
direction. The foothill of the southern side of the mountain that
consists of soil and boulder particles in the form of a huge vast
plain was free and weapon’s storage zone called (Kishla Jijid) in
the previous government, but right now changed to a very new
urbanized area. One unexpected idea that I have such rock would
not good enough capable to industrialize at the bridge, and dam
area while continuously faced to water flow because these rocks
are unresisting against erodible agents, and the discharging of the
gravels should be avoided from the visible attractive area
because it destroys the landscape of the mountains. The lack of
petrological, and geophysical opportunities limited me from
further beneath, and advanced consideration, by such advanced
instruments the garnet, and lamprophyre formation will be
available. However; the area with dark and greenish color
explains volcanic rocks, the darkish foothill and rested plain area
have occurred during magmatic activities and latter geological
and environmental impacts. The resources are quite applicable
industrializing objects rather than liquid confrontation
foundation.
8. Conclusion The northeastern portion of Kandahar city including some parts
of Shawalikot, and Daman districts occupied by mafic-ultramafic
intrusive, and extrusive rocks containing hematite veins,
basanite, lamprophyre, and basalt. Stratigraphical variation from
bottom to top is indicated by the grain size of the rocks, while the
coarse grains rocks at the foundation and the very fine grains
rocks at the top. Soils and rock’s weathered particles being
visible up to the very peaky point of the mountains, that is
because of the non-consistency of extrusive basalt rocks. Deep
stratigraphical (borehole) researches should be conducted for
garnet and other related valuable resources. Extracting of
construction sands at random spots should be avoided regarding
the landscape of the area.
References
Best, M. G. (2003). igneous and metamorphic petrology second edition . uk: blackwell .
Coats, J. S. (january 2006). Minerals in Afghanistan ; the potential for gold. BGS.
Gill, R. (2010). Igneous Rocks and Processes A practical Guide . London: wiley-blackwell.
Klaus Steinmuller, J. S. (Dec 2010). the metlliferous mineral potential of Afghanistan. 10, 28.
Schindler, J. S. (2002, February). Geotimes. Retrieved from www.geotimes.org: http://www.geotimes.org/feb02/feature_afghan.html
SH Abdullah, V. M. (2008). geology and Mineral resources of Afghanistan . england: BGS.
SH Abdullah, V. M. (2008). geology and miveral resources of Afghanistan . England : BGS.
Styles, M. P. (June 2009). Chromite in PGE in the Logar Ophilite Complex, Afghanistan . Applied Earth science IMM, 9.
Taniwal, M. Z. (2009). General geoghraphy of Afghanistan . Kabul: Kabul university .

International Journal of Scientific and Research Publications, Volume 10, Issue 1, January 2020 62
ISSN 2250-3153
http://dx.doi.org/10.29322/IJSRP.10.01.2020.p9710 www.ijsrp.org
Comparative analysis of Percutaneous Needle
Aspiration of Breast abscess with antibiotic cover versus
Traditional Surgical Incision and Drainage
Dr. Prashant Kumar *, Dr. Bhuvan **
* Post Graduate Resident, Department of General Surgery, Government Medical College, Haldwani, District – Nainital Uttarakhand PIN – 263139
** Associate Professor, Department of General Surgery, Government Medical College, Haldwani, District – Nainital, Uttarakhand PIN – 263139
DOI: 10.29322/IJSRP.10.01.2020.p9710
http://dx.doi.org/10.29322/IJSRP.10.01.2020.p9710
Abstract- INTRODUCTION – Observing the poor satisfaction
and morbidity following incision & drainage of breast abscess, the
need for alternate treatment modalities is frequently being
questioned. Repeated needle aspiration with antiobiotic cover is
an effective and satisfactory treatment modality.
METHODS - In study group, percutaneous needle aspiration
of abscess under local anesthesia was done with 18/16G needle.
Empirical antibiotic therapy with amoxicillin clavulanic acid was
started which was changed in accordance to pus culture &
sensitivity report if needed. In the control group, breast abscess
was treated by conventional Incision & drainage under general
anesthesia in operation theatre. Breast abscess treatment
acceptance was assessed at the last visit.
RESULTS – The patients treated by repeated needle
aspiration had lower complication rate and scar formation
compared to incision & drainage group (P<0.001). The patient
satisfaction was excellent, as there were no scar and cosmesis
result was good (P<0.001).
CONCLUSION - Percutaneous aspiration of breast abscess
is simple, painless, day care procedure and effective alternative
method of treatment to incision and drainage in properly selected
patient with better outcomes in terms of better cosmetics and
shorter duration hospital stay.
Index Terms- Breast abscess, Incision & drainage, Aspiration,
Patient Satisfaction
I. INTRODUCTION
reast abscess is one of the most common form of abscess in
surgical emergencies, usually seen in lactating woman [1,2].
The frequency of occurrence is highly related to pregnancy and
mainly caused due to minor trauma to nipple by a child during
feeding and bacterial colonization due to improper nursing
technique and incomplete emptying of the breast [3,4]. Immediate
diagnosis and treatment are necessary if breast feeding is to be
continued and for the prevention of further complications [5]. At an
early stage, acute mastitis may be treated by the use of appropriate
antibiotics [6]. Once an abscess is established, management
involves incision and drainage by providing general anesthesia
however this is associated with regular dressing, prolonged
healing time, and difficulty in breast feeding, possible
unsatisfactory cosmetic outcome, rupture and recurrent breast
abscess [7]. Hence now-a-days treatment of breast abscess by
repeated needle aspiration with or without ultrasound guidance
gained importance [8]. This procedure has been used successfully
and is associated with less recurrence, excellent cosmetic results
and has lesser cost [9]. The purpose of this study was to compare
the outcome and effectiveness of traditional incision and drainage
against needle aspiration in the treatment of breast abscess in
postoperative pain, duration of hospital stay, healing time,
cosmetic outcome and patient satisfaction.
II. MATERIAL AND METHODS
SOURCE OF DATA
Cases coming to the OPD and emergency department at Dr.
Susgila Tiwari Government Hospital, Haldwani with breast
abscess were clinically evaluated.
METHOD OF COLLECTION OF DATA
Data was collected from patient diagnosed between January
2018 to September 2019 with breast abscess in each group of
study. Randomization was done with the alternate patient
being placed in case and control group. Total 60 patients were
studied.
INCLUSION CRITERIA
Patient who will be coming in the OPD and emergency with
a breast abscess.
Patient giving consent to be part of this study
EXCLUSION CRITERIA
• Patient not giving consent to be part of study
III. METHODOLOGY
Percutaneous needle aspiration of pus under local anesthesia
was done with 18/16G needle. Empirical antibiotic therapy
with amoxicillin clavulanic acid was started. Aspirated pus
was sent for bacteriological study. The antibiotics were
changed in accordance to sensitivity report if needed.
B
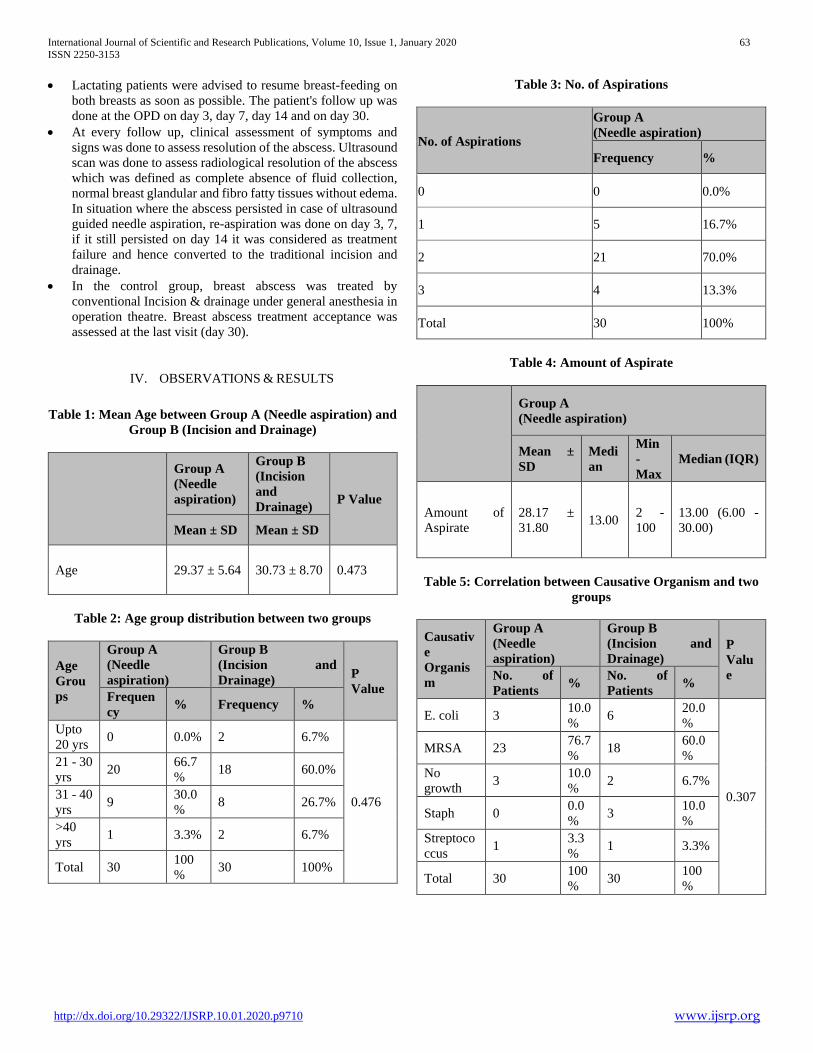
International Journal of Scientific and Research Publications, Volume 10, Issue 1, January 2020 63
ISSN 2250-3153
http://dx.doi.org/10.29322/IJSRP.10.01.2020.p9710 www.ijsrp.org
Lactating patients were advised to resume breast-feeding on
both breasts as soon as possible. The patient's follow up was
done at the OPD on day 3, day 7, day 14 and on day 30.
At every follow up, clinical assessment of symptoms and
signs was done to assess resolution of the abscess. Ultrasound
scan was done to assess radiological resolution of the abscess
which was defined as complete absence of fluid collection,
normal breast glandular and fibro fatty tissues without edema.
In situation where the abscess persisted in case of ultrasound
guided needle aspiration, re-aspiration was done on day 3, 7,
if it still persisted on day 14 it was considered as treatment
failure and hence converted to the traditional incision and
drainage.
In the control group, breast abscess was treated by
conventional Incision & drainage under general anesthesia in
operation theatre. Breast abscess treatment acceptance was
assessed at the last visit (day 30).
IV. OBSERVATIONS & RESULTS
Table 1: Mean Age between Group A (Needle aspiration) and
Group B (Incision and Drainage)
Group A
(Needle
aspiration)
Group B
(Incision
and
Drainage) P Value
Mean ± SD Mean ± SD
Age 29.37 ± 5.64 30.73 ± 8.70 0.473
Table 2: Age group distribution between two groups
Age
Grou
ps
Group A
(Needle
aspiration)
Group B
(Incision and
Drainage) P
Value Frequen
cy % Frequency %
Upto
20 yrs 0 0.0% 2 6.7%
0.476
21 - 30
yrs 20
66.7
% 18 60.0%
31 - 40
yrs 9
30.0
% 8 26.7%
>40
yrs 1 3.3% 2 6.7%
Total 30 100
% 30 100%
Table 3: No. of Aspirations
No. of Aspirations
Group A
(Needle aspiration)
Frequency %
0 0 0.0%
1 5 16.7%
2 21 70.0%
3 4 13.3%
Total 30 100%
Table 4: Amount of Aspirate
Group A
(Needle aspiration)
Mean ±
SD
Medi
an
Min
-
Max
Median (IQR)
Amount of
Aspirate
28.17 ±
31.80 13.00
2 -
100
13.00 (6.00 -
30.00)
Table 5: Correlation between Causative Organism and two
groups
Causativ
e
Organis
m
Group A
(Needle
aspiration)
Group B
(Incision and
Drainage) P
Valu
e No. of
Patients %
No. of
Patients %
E. coli 3 10.0
% 6
20.0
%
0.307
MRSA 23 76.7
% 18
60.0
%
No
growth 3
10.0
% 2 6.7%
Staph 0 0.0
% 3
10.0
%
Streptoco
ccus 1
3.3
% 1 3.3%
Total 30 100
% 30
100
%
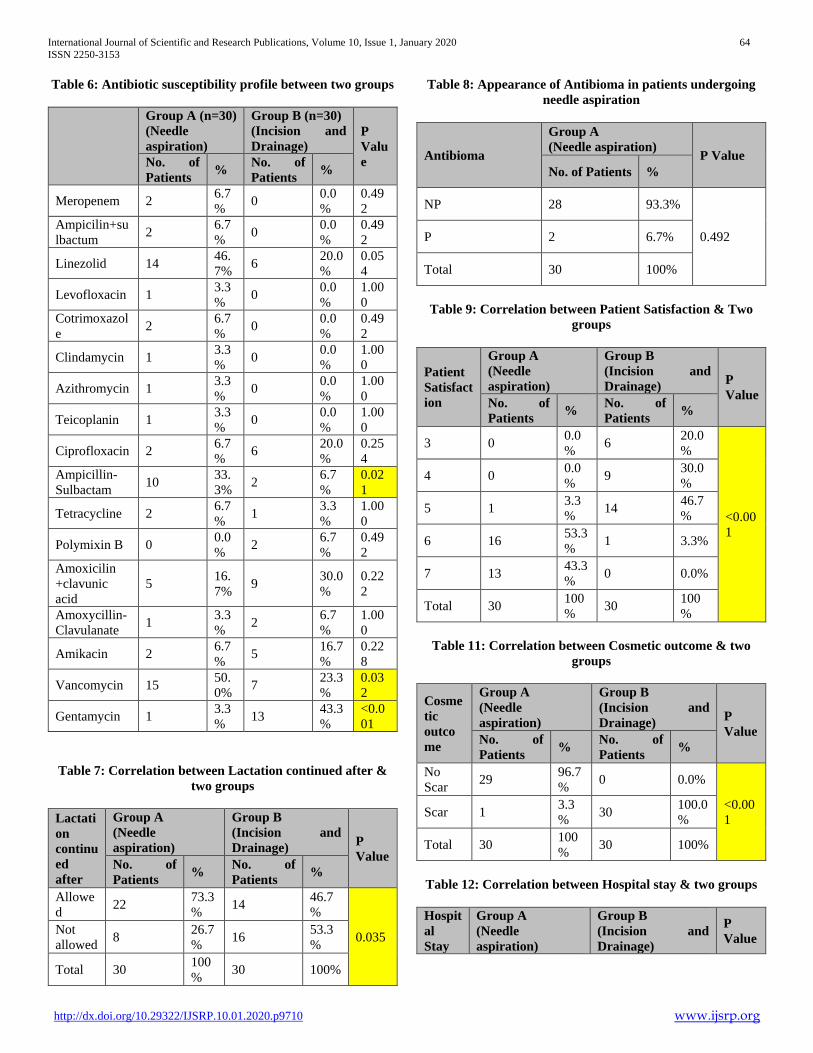
International Journal of Scientific and Research Publications, Volume 10, Issue 1, January 2020 64
ISSN 2250-3153
http://dx.doi.org/10.29322/IJSRP.10.01.2020.p9710 www.ijsrp.org
Table 6: Antibiotic susceptibility profile between two groups
Group A (n=30)
(Needle
aspiration)
Group B (n=30)
(Incision and
Drainage)
P
Valu
e No. of
Patients %
No. of
Patients %
Meropenem 2 6.7
% 0
0.0
%
0.49
2
Ampicilin+su
lbactum 2
6.7
% 0
0.0
%
0.49
2
Linezolid 14 46.
7% 6
20.0
%
0.05
4
Levofloxacin 1 3.3
% 0
0.0
%
1.00
0
Cotrimoxazol
e 2
6.7
% 0
0.0
%
0.49
2
Clindamycin 1 3.3
% 0
0.0
%
1.00
0
Azithromycin 1 3.3
% 0
0.0
%
1.00
0
Teicoplanin 1 3.3
% 0
0.0
%
1.00
0
Ciprofloxacin 2 6.7
% 6
20.0
%
0.25
4
Ampicillin-
Sulbactam 10
33.
3% 2
6.7
%
0.02
1
Tetracycline 2 6.7
% 1
3.3
%
1.00
0
Polymixin B 0 0.0
% 2
6.7
%
0.49
2
Amoxicilin
+clavunic
acid
5 16.
7% 9
30.0
%
0.22
2
Amoxycillin-
Clavulanate 1
3.3
% 2
6.7
%
1.00
0
Amikacin 2 6.7
% 5
16.7
%
0.22
8
Vancomycin 15 50.
0% 7
23.3
%
0.03
2
Gentamycin 1 3.3
% 13
43.3
%
<0.0
01
Table 7: Correlation between Lactation continued after &
two groups
Lactati
on
continu
ed
after
Group A
(Needle
aspiration)
Group B
(Incision and
Drainage) P
Value No. of
Patients %
No. of
Patients %
Allowe
d 22
73.3
% 14
46.7
%
0.035 Not
allowed 8
26.7
% 16
53.3
%
Total 30 100
% 30 100%
Table 8: Appearance of Antibioma in patients undergoing
needle aspiration
Antibioma
Group A
(Needle aspiration) P Value
No. of Patients %
NP 28 93.3%
0.492 P 2 6.7%
Total 30 100%
Table 9: Correlation between Patient Satisfaction & Two
groups
Patient
Satisfact
ion
Group A
(Needle
aspiration)
Group B
(Incision and
Drainage) P
Value No. of
Patients %
No. of
Patients %
3 0 0.0
% 6
20.0
%
<0.00
1
4 0 0.0
% 9
30.0
%
5 1 3.3
% 14
46.7
%
6 16 53.3
% 1 3.3%
7 13 43.3
% 0 0.0%
Total 30 100
% 30
100
%
Table 11: Correlation between Cosmetic outcome & two
groups
Cosme
tic
outco
me
Group A
(Needle
aspiration)
Group B
(Incision and
Drainage) P
Value No. of
Patients %
No. of
Patients %
No
Scar 29
96.7
% 0 0.0%
<0.00
1 Scar 1
3.3
% 30
100.0
%
Total 30 100
% 30 100%
Table 12: Correlation between Hospital stay & two groups
Hospit
al
Stay
Group A
(Needle
aspiration)
Group B
(Incision and
Drainage)
P
Value
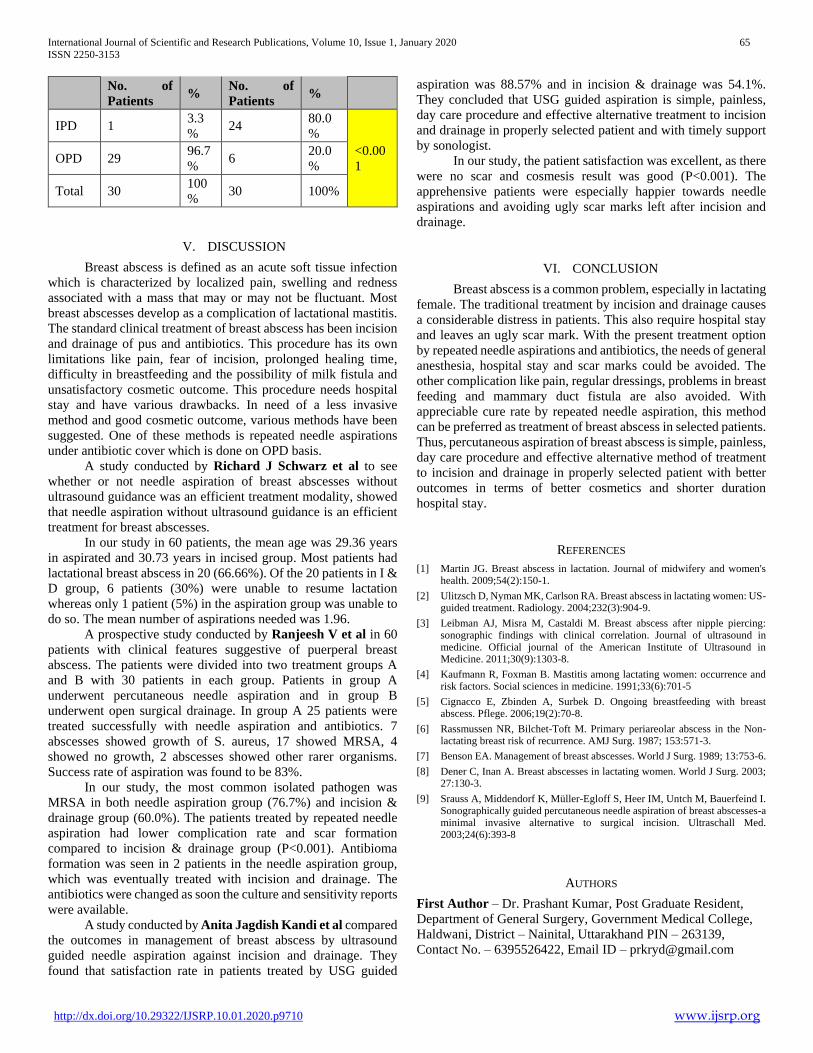
International Journal of Scientific and Research Publications, Volume 10, Issue 1, January 2020 65
ISSN 2250-3153
http://dx.doi.org/10.29322/IJSRP.10.01.2020.p9710 www.ijsrp.org
No. of
Patients %
No. of
Patients %
IPD 1 3.3
% 24
80.0
%
<0.00
1 OPD 29
96.7
% 6
20.0
%
Total 30 100
% 30 100%
V. DISCUSSION
Breast abscess is defined as an acute soft tissue infection
which is characterized by localized pain, swelling and redness
associated with a mass that may or may not be fluctuant. Most
breast abscesses develop as a complication of lactational mastitis.
The standard clinical treatment of breast abscess has been incision
and drainage of pus and antibiotics. This procedure has its own
limitations like pain, fear of incision, prolonged healing time,
difficulty in breastfeeding and the possibility of milk fistula and
unsatisfactory cosmetic outcome. This procedure needs hospital
stay and have various drawbacks. In need of a less invasive
method and good cosmetic outcome, various methods have been
suggested. One of these methods is repeated needle aspirations
under antibiotic cover which is done on OPD basis.
A study conducted by Richard J Schwarz et al to see
whether or not needle aspiration of breast abscesses without
ultrasound guidance was an efficient treatment modality, showed
that needle aspiration without ultrasound guidance is an efficient
treatment for breast abscesses.
In our study in 60 patients, the mean age was 29.36 years
in aspirated and 30.73 years in incised group. Most patients had
lactational breast abscess in 20 (66.66%). Of the 20 patients in I &
D group, 6 patients (30%) were unable to resume lactation
whereas only 1 patient (5%) in the aspiration group was unable to
do so. The mean number of aspirations needed was 1.96.
A prospective study conducted by Ranjeesh V et al in 60
patients with clinical features suggestive of puerperal breast
abscess. The patients were divided into two treatment groups A
and B with 30 patients in each group. Patients in group A
underwent percutaneous needle aspiration and in group B
underwent open surgical drainage. In group A 25 patients were
treated successfully with needle aspiration and antibiotics. 7
abscesses showed growth of S. aureus, 17 showed MRSA, 4
showed no growth, 2 abscesses showed other rarer organisms.
Success rate of aspiration was found to be 83%.
In our study, the most common isolated pathogen was
MRSA in both needle aspiration group (76.7%) and incision &
drainage group (60.0%). The patients treated by repeated needle
aspiration had lower complication rate and scar formation
compared to incision & drainage group (P<0.001). Antibioma
formation was seen in 2 patients in the needle aspiration group,
which was eventually treated with incision and drainage. The
antibiotics were changed as soon the culture and sensitivity reports
were available.
A study conducted by Anita Jagdish Kandi et al compared
the outcomes in management of breast abscess by ultrasound
guided needle aspiration against incision and drainage. They
found that satisfaction rate in patients treated by USG guided
aspiration was 88.57% and in incision & drainage was 54.1%.
They concluded that USG guided aspiration is simple, painless,
day care procedure and effective alternative treatment to incision
and drainage in properly selected patient and with timely support
by sonologist.
In our study, the patient satisfaction was excellent, as there
were no scar and cosmesis result was good (P<0.001). The
apprehensive patients were especially happier towards needle
aspirations and avoiding ugly scar marks left after incision and
drainage.
VI. CONCLUSION
Breast abscess is a common problem, especially in lactating
female. The traditional treatment by incision and drainage causes
a considerable distress in patients. This also require hospital stay
and leaves an ugly scar mark. With the present treatment option
by repeated needle aspirations and antibiotics, the needs of general
anesthesia, hospital stay and scar marks could be avoided. The
other complication like pain, regular dressings, problems in breast
feeding and mammary duct fistula are also avoided. With
appreciable cure rate by repeated needle aspiration, this method
can be preferred as treatment of breast abscess in selected patients.
Thus, percutaneous aspiration of breast abscess is simple, painless,
day care procedure and effective alternative method of treatment
to incision and drainage in properly selected patient with better
outcomes in terms of better cosmetics and shorter duration
hospital stay.
REFERENCES
[1] Martin JG. Breast abscess in lactation. Journal of midwifery and women's health. 2009;54(2):150-1.
[2] Ulitzsch D, Nyman MK, Carlson RA. Breast abscess in lactating women: US-guided treatment. Radiology. 2004;232(3):904-9.
[3] Leibman AJ, Misra M, Castaldi M. Breast abscess after nipple piercing: sonographic findings with clinical correlation. Journal of ultrasound in medicine. Official journal of the American Institute of Ultrasound in Medicine. 2011;30(9):1303-8.
[4] Kaufmann R, Foxman B. Mastitis among lactating women: occurrence and risk factors. Social sciences in medicine. 1991;33(6):701-5
[5] Cignacco E, Zbinden A, Surbek D. Ongoing breastfeeding with breast abscess. Pflege. 2006;19(2):70-8.
[6] Rassmussen NR, Bilchet-Toft M. Primary periareolar abscess in the Non-lactating breast risk of recurrence. AMJ Surg. 1987; 153:571-3.
[7] Benson EA. Management of breast abscesses. World J Surg. 1989; 13:753-6.
[8] Dener C, Inan A. Breast abscesses in lactating women. World J Surg. 2003; 27:130-3.
[9] Srauss A, Middendorf K, Müller-Egloff S, Heer IM, Untch M, Bauerfeind I. Sonographically guided percutaneous needle aspiration of breast abscesses-a minimal invasive alternative to surgical incision. Ultraschall Med. 2003;24(6):393-8
AUTHORS
First Author – Dr. Prashant Kumar, Post Graduate Resident,
Department of General Surgery, Government Medical College,
Haldwani, District – Nainital, Uttarakhand PIN – 263139,
Contact No. – 6395526422, Email ID – [email protected]

International Journal of Scientific and Research Publications, Volume 10, Issue 1, January 2020 66
ISSN 2250-3153
http://dx.doi.org/10.29322/IJSRP.10.01.2020.p9710 www.ijsrp.org
Second Author – Dr. Bhuvan, Associate Professor, Department
of General Surgery, Government Medical College, Haldwani,
District – Nainital, Uttarakhand PIN – 263139, Contact No. –
968159808, Email ID – [email protected]

International Journal of Scientific and Research Publications, Volume 10, Issue 1, January 2020 67
ISSN 2250-3153
http://dx.doi.org/10.29322/IJSRP.10.01.2020.p9711 www.ijsrp.org
Comparative study of early vs late enteral feeding
following intestinal anastomosis
Dr. Ikrar Ali*, Dr. Bhuvan **
* Post Graduate Resident, Department of General Surgery, Government Medical College, Haldwani, District – Nainital, Uttarakhand PIN – 263139
** Associate Professor, Department of General Surgery, Government Medical College, Haldwani, District – Nainital, Uttarakhand PIN – 263139
DOI: 10.29322/IJSRP.10.01.2020.p9711
http://dx.doi.org/10.29322/IJSRP.10.01.2020.p9711
Abstract- INTRODUCTION – Observing the low incidence of
complications following early feeding in patients undergoing
intestinal anastomosis, the need for delayed feeding is frequently
being questioned. The early enteral feeding in intestinal
anastomosis can be safely started.
METHODS - In study group we started the feeding after 12-
14 hours of surgery with clear water at the rate of 50ml/hr. Well
tolerated patients were taken on semi-solid diet after 24-36 hours
and on normal regular diet after 36-48 hours of surgery. Patients
general vital charting, assessment of time of passage of first stool,
appearance of bowel sounds and assessment of complains was
done at 12 hourly all complications is recorded.
RESULTS – The average length of hospital stay was shorter
in the early feeding group and was statistically significant with a
(P<0·001). There were no complications of anastomotic leakage
in both the delayed feeding group and early feeding group.
CONCLUSION - Early feeding after intestinal anastomoses
is a safe method that improves the condition of the patients without
increasing the post-operative complications and this increases
patient’s satisfaction irrespective of the surgical technique used.
Index Terms- Anastomoses, Early Feeding, Delayed Feeding,
Leakage
I. INTRODUCTION
he concept of delayed oral feeding following gut surgery only
after passage of flatus or stool has been adopted over the years
with the notion that restriction of oral feeding offers the GIT
longer to heal and recover and reduces stress on anastomosis site
and prevent leakage thus reducing post-operative complications,
[1] but even if we do not give oral feeding, about 2-2.5 L of
gastrointestinal and pancreatic secretions enters the small bowel
and transit from the anastomosis site. It was antecedently assumed
that the fasting would defend the anastomosis from any
complication like abdominal distention, vomiting, ileus,
anastomotic dehiscence or leaks, wound infection and would
allow a hermetic closure of the anastomosis before the beginning
of enteral feeding. [2-4]. It is clearly demonstrated that the
mucosal epithelium of the bowel is perfectly sealed after the first
24 hours of the post-operative period. According to Davila-Perez
et al. [5], it is not necessary to keep the 5-day fasting in order to
prevent post-operative complications and should not be used
routinely. ESPEN guidelines suggested early initiation of enteral
feeding within twenty-four hours after gastrointestinal surgery
however conjointly state that it has to be adapted in keeping with
the individual tolerance and type of surgery [6]. Initiation of
feeding ought to be progressive and a 24-hr liquid diet should be
maintained before starting a bland diet just in case of
complications ought to arise. Gulsen Ekigen et al. reported in their
study that early small-volume feed tends to be tolerated and are
valuable despite the kind of abdominal surgery and in different
study the time for reaching a complete diet were significantly
earlier in the early feeding group, also hospital stay decreased [7].
II. MATERIAL & METHODS
SOURCE OF DATA
Cases admitted and operated in surgery department at Dr.
Susgila Tiwari Government Hospital, Haldwani undergoing
intestinal anastomsosis were clinically evaluated.
METHOD OF COLLECTION OF DATA
Data was collected from patient admitted between January
2018 to September 2019 who underwent intestinal
anastomosis in each group of study. Randomization was done
with the alternate patient being placed in case and control
group. Total 60 patients were studied.
INCLUSION CRITERIA :
• All patients fit for surgery
• Patient giving consent to be part of study
EXCLUSION CRITERIA :
• Patient not giving consent to be part of study
III. METHODOLOGY
In study group we started the feeding after 12-14 hours of
surgery with clear water at the rate of 50ml/hr. Well tolerated
patients were taken on semi-solid diet after 24-36 hours and
on normal regular diet after 36-48 hours of surgery.
Patients who were not tolerating early feeding i.e. having
abdominal distention and vomiting, feeding was stopped for
12 hours and refeeding was started afterwards. In late feeding
groups, we started the feeding in traditional method (after
bowel sounds and passage of flatus) after 5th day and same
feeding plan was given as in early feeding group.
Patients general vital charting (pulse rate, blood pressure,
fever), assessment of time of passage of first stool, appearance
of bowel sounds and assessment of time of passage of first
stool, appearance of bowel sounds and assessment of
T
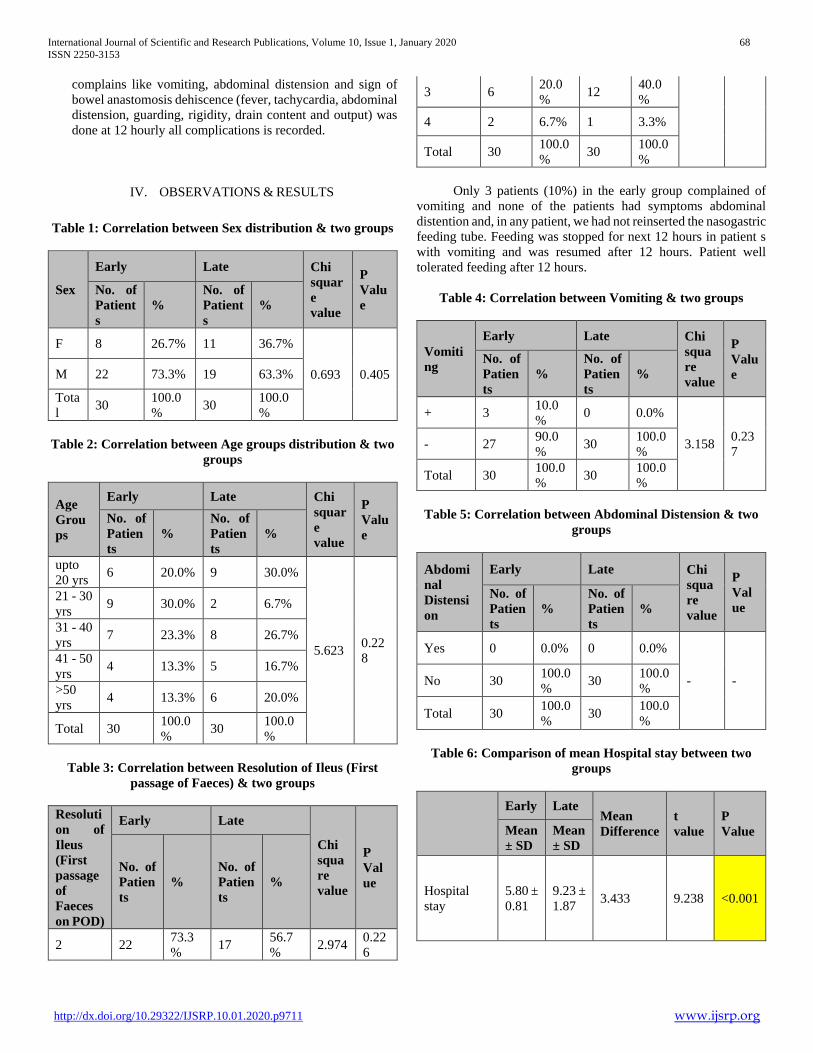
International Journal of Scientific and Research Publications, Volume 10, Issue 1, January 2020 68
ISSN 2250-3153
http://dx.doi.org/10.29322/IJSRP.10.01.2020.p9711 www.ijsrp.org
complains like vomiting, abdominal distension and sign of
bowel anastomosis dehiscence (fever, tachycardia, abdominal
distension, guarding, rigidity, drain content and output) was
done at 12 hourly all complications is recorded.
IV. OBSERVATIONS & RESULTS
Table 1: Correlation between Sex distribution & two groups
Sex
Early Late Chi
squar
e
value
P
Valu
e
No. of
Patient
s
%
No. of
Patient
s
%
F 8 26.7% 11 36.7%
0.693 0.405 M 22 73.3% 19 63.3%
Tota
l 30
100.0
% 30
100.0
%
Table 2: Correlation between Age groups distribution & two
groups
Age
Grou
ps
Early Late Chi
squar
e
value
P
Valu
e
No. of
Patien
ts
%
No. of
Patien
ts
%
upto
20 yrs 6 20.0% 9 30.0%
5.623 0.22
8
21 - 30
yrs 9 30.0% 2 6.7%
31 - 40
yrs 7 23.3% 8 26.7%
41 - 50
yrs 4 13.3% 5 16.7%
>50
yrs 4 13.3% 6 20.0%
Total 30 100.0
% 30
100.0
%
Table 3: Correlation between Resolution of Ileus (First
passage of Faeces) & two groups
Resoluti
on of
Ileus
(First
passage
of
Faeces
on POD)
Early Late
Chi
squa
re
value
P
Val
ue
No. of
Patien
ts
%
No. of
Patien
ts
%
2 22 73.3
% 17
56.7
% 2.974
0.22
6
3 6 20.0
% 12
40.0
%
4 2 6.7% 1 3.3%
Total 30 100.0
% 30
100.0
%
Only 3 patients (10%) in the early group complained of
vomiting and none of the patients had symptoms abdominal
distention and, in any patient, we had not reinserted the nasogastric
feeding tube. Feeding was stopped for next 12 hours in patient s
with vomiting and was resumed after 12 hours. Patient well
tolerated feeding after 12 hours.
Table 4: Correlation between Vomiting & two groups
Vomiti
ng
Early Late Chi
squa
re
value
P
Valu
e
No. of
Patien
ts
%
No. of
Patien
ts
%
+ 3 10.0
% 0 0.0%
3.158 0.23
7 - 27
90.0
% 30
100.0
%
Total 30 100.0
% 30
100.0
%
Table 5: Correlation between Abdominal Distension & two
groups
Abdomi
nal
Distensi
on
Early Late Chi
squa
re
value
P
Val
ue No. of
Patien
ts
%
No. of
Patien
ts
%
Yes 0 0.0% 0 0.0%
- - No 30 100.0
% 30
100.0
%
Total 30 100.0
% 30
100.0
%
Table 6: Comparison of mean Hospital stay between two
groups
Early Late Mean
Difference
t
value
P
Value Mean
± SD
Mean
± SD
Hospital
stay
5.80 ±
0.81
9.23 ±
1.87 3.433 9.238 <0.001
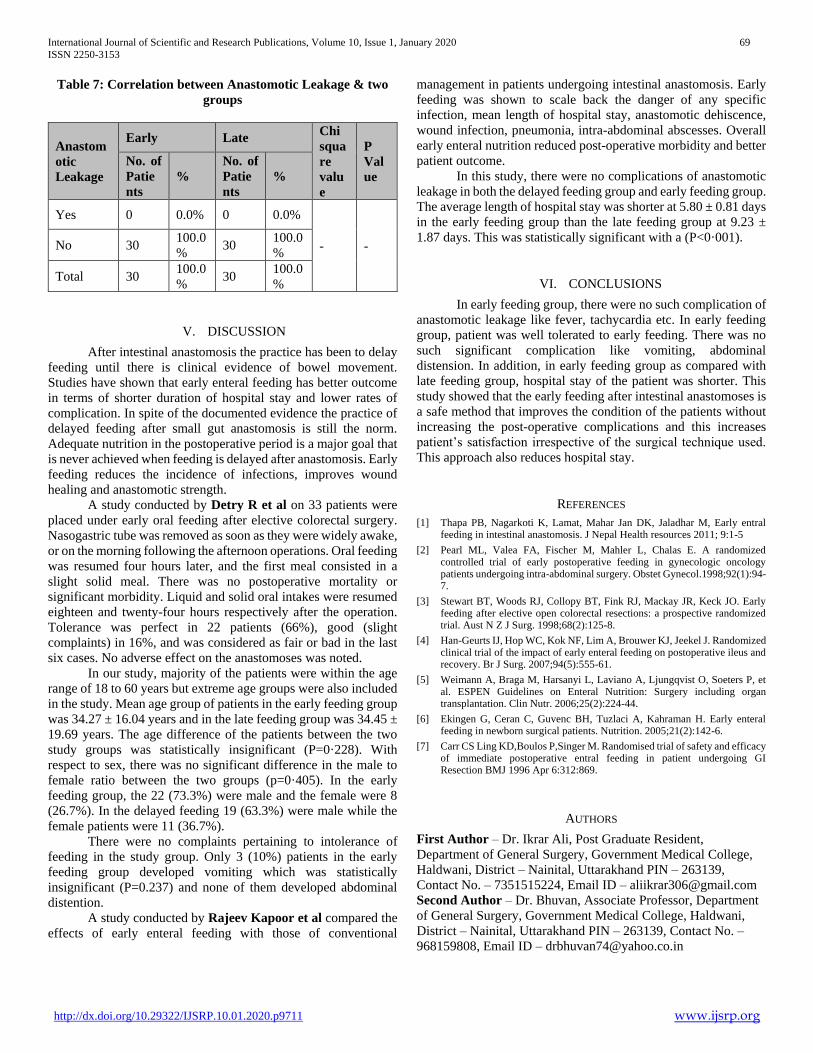
International Journal of Scientific and Research Publications, Volume 10, Issue 1, January 2020 69
ISSN 2250-3153
http://dx.doi.org/10.29322/IJSRP.10.01.2020.p9711 www.ijsrp.org
Table 7: Correlation between Anastomotic Leakage & two
groups
Anastom
otic
Leakage
Early Late Chi
squa
re
valu
e
P
Val
ue
No. of
Patie
nts
%
No. of
Patie
nts
%
Yes 0 0.0% 0 0.0%
- - No 30 100.0
% 30
100.0
%
Total 30 100.0
% 30
100.0
%
V. DISCUSSION
After intestinal anastomosis the practice has been to delay
feeding until there is clinical evidence of bowel movement.
Studies have shown that early enteral feeding has better outcome
in terms of shorter duration of hospital stay and lower rates of
complication. In spite of the documented evidence the practice of
delayed feeding after small gut anastomosis is still the norm.
Adequate nutrition in the postoperative period is a major goal that
is never achieved when feeding is delayed after anastomosis. Early
feeding reduces the incidence of infections, improves wound
healing and anastomotic strength.
A study conducted by Detry R et al on 33 patients were
placed under early oral feeding after elective colorectal surgery.
Nasogastric tube was removed as soon as they were widely awake,
or on the morning following the afternoon operations. Oral feeding
was resumed four hours later, and the first meal consisted in a
slight solid meal. There was no postoperative mortality or
significant morbidity. Liquid and solid oral intakes were resumed
eighteen and twenty-four hours respectively after the operation.
Tolerance was perfect in 22 patients (66%), good (slight
complaints) in 16%, and was considered as fair or bad in the last
six cases. No adverse effect on the anastomoses was noted.
In our study, majority of the patients were within the age
range of 18 to 60 years but extreme age groups were also included
in the study. Mean age group of patients in the early feeding group
was 34.27 ± 16.04 years and in the late feeding group was 34.45 ±
19.69 years. The age difference of the patients between the two
study groups was statistically insignificant (P=0·228). With
respect to sex, there was no significant difference in the male to
female ratio between the two groups (p=0·405). In the early
feeding group, the 22 (73.3%) were male and the female were 8
(26.7%). In the delayed feeding 19 (63.3%) were male while the
female patients were 11 (36.7%).
There were no complaints pertaining to intolerance of
feeding in the study group. Only 3 (10%) patients in the early
feeding group developed vomiting which was statistically
insignificant (P=0.237) and none of them developed abdominal
distention.
A study conducted by Rajeev Kapoor et al compared the
effects of early enteral feeding with those of conventional
management in patients undergoing intestinal anastomosis. Early
feeding was shown to scale back the danger of any specific
infection, mean length of hospital stay, anastomotic dehiscence,
wound infection, pneumonia, intra-abdominal abscesses. Overall
early enteral nutrition reduced post-operative morbidity and better
patient outcome.
In this study, there were no complications of anastomotic
leakage in both the delayed feeding group and early feeding group.
The average length of hospital stay was shorter at 5.80 ± 0.81 days
in the early feeding group than the late feeding group at 9.23 ±
1.87 days. This was statistically significant with a (P<0·001).
VI. CONCLUSIONS
In early feeding group, there were no such complication of
anastomotic leakage like fever, tachycardia etc. In early feeding
group, patient was well tolerated to early feeding. There was no
such significant complication like vomiting, abdominal
distension. In addition, in early feeding group as compared with
late feeding group, hospital stay of the patient was shorter. This
study showed that the early feeding after intestinal anastomoses is
a safe method that improves the condition of the patients without
increasing the post-operative complications and this increases
patient’s satisfaction irrespective of the surgical technique used.
This approach also reduces hospital stay.
REFERENCES
[1] Thapa PB, Nagarkoti K, Lamat, Mahar Jan DK, Jaladhar M, Early entral feeding in intestinal anastomosis. J Nepal Health resources 2011; 9:1-5
[2] Pearl ML, Valea FA, Fischer M, Mahler L, Chalas E. A randomized controlled trial of early postoperative feeding in gynecologic oncology patients undergoing intra-abdominal surgery. Obstet Gynecol.1998;92(1):94-7.
[3] Stewart BT, Woods RJ, Collopy BT, Fink RJ, Mackay JR, Keck JO. Early feeding after elective open colorectal resections: a prospective randomized trial. Aust N Z J Surg. 1998;68(2):125-8.
[4] Han-Geurts IJ, Hop WC, Kok NF, Lim A, Brouwer KJ, Jeekel J. Randomized clinical trial of the impact of early enteral feeding on postoperative ileus and recovery. Br J Surg. 2007;94(5):555-61.
[5] Weimann A, Braga M, Harsanyi L, Laviano A, Ljungqvist O, Soeters P, et al. ESPEN Guidelines on Enteral Nutrition: Surgery including organ transplantation. Clin Nutr. 2006;25(2):224-44.
[6] Ekingen G, Ceran C, Guvenc BH, Tuzlaci A, Kahraman H. Early enteral feeding in newborn surgical patients. Nutrition. 2005;21(2):142-6.
[7] Carr CS Ling KD,Boulos P,Singer M. Randomised trial of safety and efficacy of immediate postoperative entral feeding in patient undergoing GI Resection BMJ 1996 Apr 6:312:869.
AUTHORS
First Author – Dr. Ikrar Ali, Post Graduate Resident,
Department of General Surgery, Government Medical College,
Haldwani, District – Nainital, Uttarakhand PIN – 263139,
Contact No. – 7351515224, Email ID – [email protected]
Second Author – Dr. Bhuvan, Associate Professor, Department
of General Surgery, Government Medical College, Haldwani,
District – Nainital, Uttarakhand PIN – 263139, Contact No. –
968159808, Email ID – [email protected]

International Journal of Scientific and Research Publications, Volume 7, Issue 8, August 2017 70
ISSN 2250-3153
www.ijsrp.org
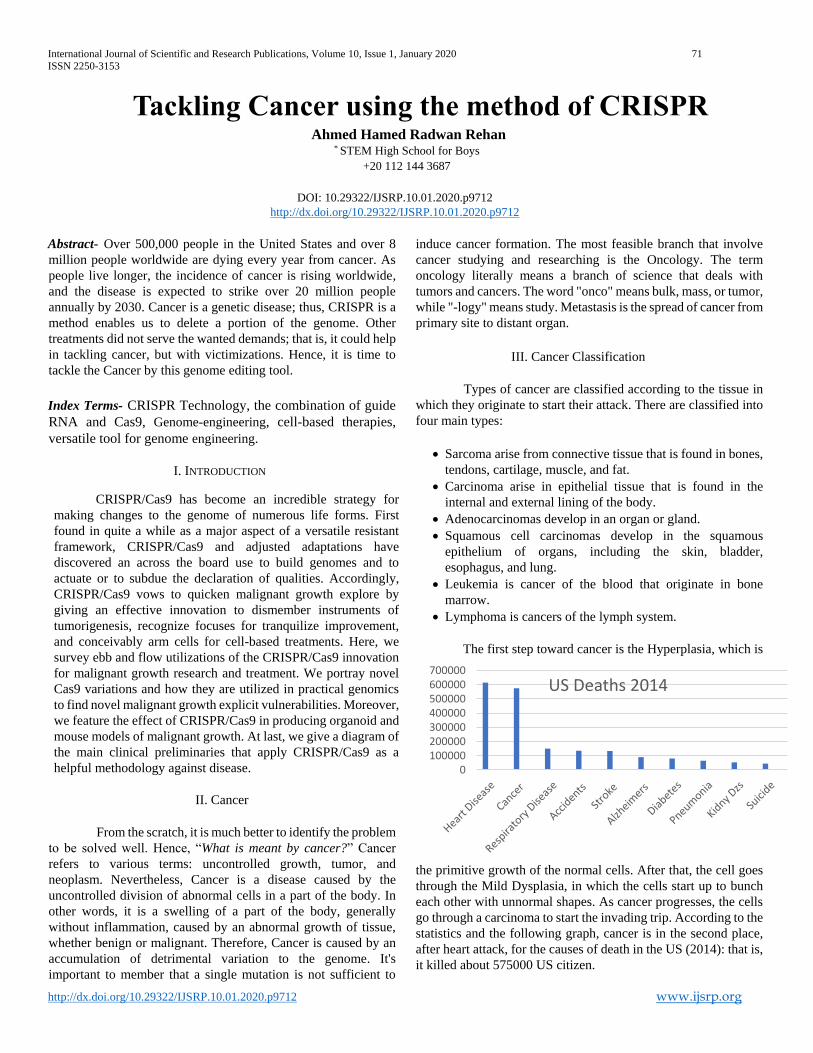
International Journal of Scientific and Research Publications, Volume 10, Issue 1, January 2020 71
ISSN 2250-3153
http://dx.doi.org/10.29322/IJSRP.10.01.2020.p9712 www.ijsrp.org
Tackling Cancer using the method of CRISPR Ahmed Hamed Radwan Rehan
* STEM High School for Boys
+20 112 144 3687
DOI: 10.29322/IJSRP.10.01.2020.p9712
http://dx.doi.org/10.29322/IJSRP.10.01.2020.p9712
Abstract- Over 500,000 people in the United States and over 8
million people worldwide are dying every year from cancer. As
people live longer, the incidence of cancer is rising worldwide,
and the disease is expected to strike over 20 million people
annually by 2030. Cancer is a genetic disease; thus, CRISPR is a
method enables us to delete a portion of the genome. Other
treatments did not serve the wanted demands; that is, it could help
in tackling cancer, but with victimizations. Hence, it is time to
tackle the Cancer by this genome editing tool.
Index Terms- CRISPR Technology, the combination of guide
RNA and Cas9, Genome-engineering, cell-based therapies,
versatile tool for genome engineering.
I. INTRODUCTION
CRISPR/Cas9 has become an incredible strategy for
making changes to the genome of numerous life forms. First
found in quite a while as a major aspect of a versatile resistant
framework, CRISPR/Cas9 and adjusted adaptations have
discovered an across the board use to build genomes and to
actuate or to subdue the declaration of qualities. Accordingly,
CRISPR/Cas9 vows to quicken malignant growth explore by
giving an effective innovation to dismember instruments of
tumorigenesis, recognize focuses for tranquilize improvement,
and conceivably arm cells for cell-based treatments. Here, we
survey ebb and flow utilizations of the CRISPR/Cas9 innovation
for malignant growth research and treatment. We portray novel
Cas9 variations and how they are utilized in practical genomics
to find novel malignant growth explicit vulnerabilities. Moreover,
we feature the effect of CRISPR/Cas9 in producing organoid and
mouse models of malignant growth. At last, we give a diagram of
the main clinical preliminaries that apply CRISPR/Cas9 as a
helpful methodology against disease.
II. Cancer
From the scratch, it is much better to identify the problem
to be solved well. Hence, “What is meant by cancer?” Cancer
refers to various terms: uncontrolled growth, tumor, and
neoplasm. Nevertheless, Cancer is a disease caused by the
uncontrolled division of abnormal cells in a part of the body. In
other words, it is a swelling of a part of the body, generally
without inflammation, caused by an abnormal growth of tissue,
whether benign or malignant. Therefore, Cancer is caused by an
accumulation of detrimental variation to the genome. It's
important to member that a single mutation is not sufficient to
induce cancer formation. The most feasible branch that involve
cancer studying and researching is the Oncology. The term
oncology literally means a branch of science that deals with
tumors and cancers. The word "onco" means bulk, mass, or tumor,
while "-logy" means study. Metastasis is the spread of cancer from
primary site to distant organ.
III. Cancer Classification
Types of cancer are classified according to the tissue in
which they originate to start their attack. There are classified into
four main types:
Sarcoma arise from connective tissue that is found in bones,
tendons, cartilage, muscle, and fat.
Carcinoma arise in epithelial tissue that is found in the
internal and external lining of the body.
Adenocarcinomas develop in an organ or gland.
Squamous cell carcinomas develop in the squamous
epithelium of organs, including the skin, bladder,
esophagus, and lung.
Leukemia is cancer of the blood that originate in bone
marrow.
Lymphoma is cancers of the lymph system.
The first step toward cancer is the Hyperplasia, which is
the primitive growth of the normal cells. After that, the cell goes
through the Mild Dysplasia, in which the cells start up to bunch
each other with unnormal shapes. As cancer progresses, the cells
go through a carcinoma to start the invading trip. According to the
statistics and the following graph, cancer is in the second place,
after heart attack, for the causes of death in the US (2014): that is,
it killed about 575000 US citizen.
0100000200000300000400000500000600000700000
US Deaths 2014
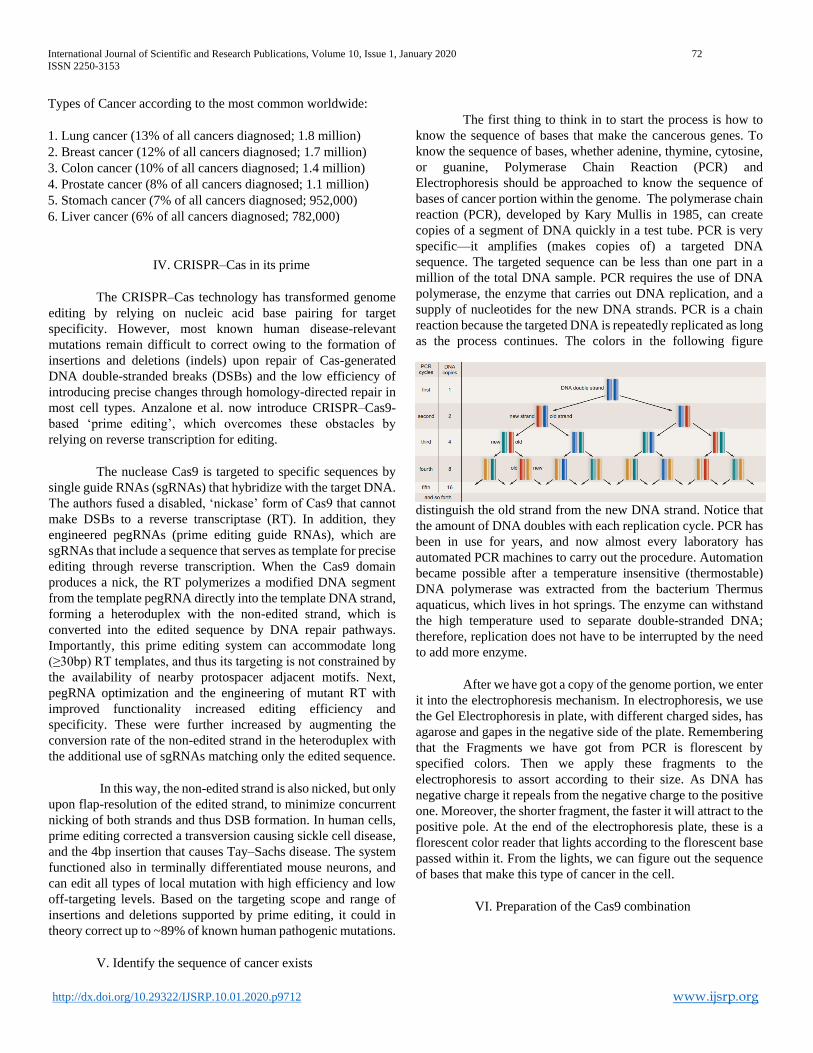
International Journal of Scientific and Research Publications, Volume 10, Issue 1, January 2020 72
ISSN 2250-3153
http://dx.doi.org/10.29322/IJSRP.10.01.2020.p9712 www.ijsrp.org
Types of Cancer according to the most common worldwide:
1. Lung cancer (13% of all cancers diagnosed; 1.8 million)
2. Breast cancer (12% of all cancers diagnosed; 1.7 million)
3. Colon cancer (10% of all cancers diagnosed; 1.4 million)
4. Prostate cancer (8% of all cancers diagnosed; 1.1 million)
5. Stomach cancer (7% of all cancers diagnosed; 952,000)
6. Liver cancer (6% of all cancers diagnosed; 782,000)
IV. CRISPR–Cas in its prime
The CRISPR–Cas technology has transformed genome
editing by relying on nucleic acid base pairing for target
specificity. However, most known human disease-relevant
mutations remain difficult to correct owing to the formation of
insertions and deletions (indels) upon repair of Cas-generated
DNA double-stranded breaks (DSBs) and the low efficiency of
introducing precise changes through homology-directed repair in
most cell types. Anzalone et al. now introduce CRISPR–Cas9-
based ‘prime editing’, which overcomes these obstacles by
relying on reverse transcription for editing.
The nuclease Cas9 is targeted to specific sequences by
single guide RNAs (sgRNAs) that hybridize with the target DNA.
The authors fused a disabled, ‘nickase’ form of Cas9 that cannot
make DSBs to a reverse transcriptase (RT). In addition, they
engineered pegRNAs (prime editing guide RNAs), which are
sgRNAs that include a sequence that serves as template for precise
editing through reverse transcription. When the Cas9 domain
produces a nick, the RT polymerizes a modified DNA segment
from the template pegRNA directly into the template DNA strand,
forming a heteroduplex with the non-edited strand, which is
converted into the edited sequence by DNA repair pathways.
Importantly, this prime editing system can accommodate long
(≥30bp) RT templates, and thus its targeting is not constrained by
the availability of nearby protospacer adjacent motifs. Next,
pegRNA optimization and the engineering of mutant RT with
improved functionality increased editing efficiency and
specificity. These were further increased by augmenting the
conversion rate of the non-edited strand in the heteroduplex with
the additional use of sgRNAs matching only the edited sequence.
In this way, the non-edited strand is also nicked, but only
upon flap-resolution of the edited strand, to minimize concurrent
nicking of both strands and thus DSB formation. In human cells,
prime editing corrected a transversion causing sickle cell disease,
and the 4bp insertion that causes Tay–Sachs disease. The system
functioned also in terminally differentiated mouse neurons, and
can edit all types of local mutation with high efficiency and low
off-targeting levels. Based on the targeting scope and range of
insertions and deletions supported by prime editing, it could in
theory correct up to ~89% of known human pathogenic mutations.
V. Identify the sequence of cancer exists
The first thing to think in to start the process is how to
know the sequence of bases that make the cancerous genes. To
know the sequence of bases, whether adenine, thymine, cytosine,
or guanine, Polymerase Chain Reaction (PCR) and
Electrophoresis should be approached to know the sequence of
bases of cancer portion within the genome. The polymerase chain
reaction (PCR), developed by Kary Mullis in 1985, can create
copies of a segment of DNA quickly in a test tube. PCR is very
specific—it amplifies (makes copies of) a targeted DNA
sequence. The targeted sequence can be less than one part in a
million of the total DNA sample. PCR requires the use of DNA
polymerase, the enzyme that carries out DNA replication, and a
supply of nucleotides for the new DNA strands. PCR is a chain
reaction because the targeted DNA is repeatedly replicated as long
as the process continues. The colors in the following figure
distinguish the old strand from the new DNA strand. Notice that
the amount of DNA doubles with each replication cycle. PCR has
been in use for years, and now almost every laboratory has
automated PCR machines to carry out the procedure. Automation
became possible after a temperature insensitive (thermostable)
DNA polymerase was extracted from the bacterium Thermus
aquaticus, which lives in hot springs. The enzyme can withstand
the high temperature used to separate double-stranded DNA;
therefore, replication does not have to be interrupted by the need
to add more enzyme.
After we have got a copy of the genome portion, we enter
it into the electrophoresis mechanism. In electrophoresis, we use
the Gel Electrophoresis in plate, with different charged sides, has
agarose and gapes in the negative side of the plate. Remembering
that the Fragments we have got from PCR is florescent by
specified colors. Then we apply these fragments to the
electrophoresis to assort according to their size. As DNA has
negative charge it repeals from the negative charge to the positive
one. Moreover, the shorter fragment, the faster it will attract to the
positive pole. At the end of the electrophoresis plate, these is a
florescent color reader that lights according to the florescent base
passed within it. From the lights, we can figure out the sequence
of bases that make this type of cancer in the cell.
VI. Preparation of the Cas9 combination

International Journal of Scientific and Research Publications, Volume 10, Issue 1, January 2020 73
ISSN 2250-3153
http://dx.doi.org/10.29322/IJSRP.10.01.2020.p9712 www.ijsrp.org
Consequently, we have accomplished the Guide RNA
portion that will be combined with the Cas9 protein to make the
CRISPR combination. In contract, we will enter the guide RNA
into the Cas9 protein, after being extracted from the cell by
fractionation, by using plasmids as shown in the following figure.
Finally, we have got that combination of Cas9/ Guide RNA
protein ready to be injected into the targeted tumors to detect
cancer.
The combination will enter the cell and each ingredient
will do his function; that is, the Cas9 protein, carrying the sgRNA,
will attach to the DNA of the cell and start to sperate the double
stranded DNA searching for the portion that 100% analogous to
the sgRNA inside it.
Cas9 protein work as slasher that slash the DNA quickly
once it finds the analogous portion if the DNA according to its
sgRNA. Once it finds that portion it slashes the DNA at that part
from the end and the start to get rid of that portion which
represents the Cancerous bases within the cell’s DNA.
After slashing the cancer part of the genes from the
whole genome, it is time for ligase enzyme to do its job. Ligase is
a catalyst that can catalyze the joining of two enormous particles
by framing another substance bond, for the most part with going
with hydrolysis of a little pendant concoction bunch on one of the
bigger atoms or the chemical catalyzing the connecting together
of two mixes; hence, it attaches that sticky ends of the slashed
DNA to combine their ends again.
Finally, we have aimed the cancer from
its roots in the cell and get rid of it for
long time.
VII. Summary
As a whole process, it all revolves around maintaining CRISPR
method in dealing with this rooted disease from its origin.
Clustered Regularly Interspaced Short Palindromic Repeats
(CRISPR) is method designed to engage with DNA sequencing.
The whole idea revolves around using Cas9 protein and Guide
RNA analogous to the targeted DNA we want to abolish which
are the cancer mutations in the cell. This combination of protein
and guide RNA induced the cell to scan the DNA till detecting the
part of nucleotides similar to the guide RNA. After finding it, the
two strands of DNA separates and the one corresponding to the
guide RNA attach to it. Then the Cas9 protein receives a sign for
slashing the DNA from this part to delete it and to be considered
among DNA fragments.
Affording us the advantage of editing the DNA
molecules, CRISPR technology is a simple effective tool for
editing genomes. It allows scientists to easily alter DNA
sequences and modify gene functionality. Its high potential
applications include correcting genetic defects, treating and
stopping the spread of diseases and enhancing crops that seem
harmful or unwanted in the form of mutations or diseases.
VIII. CONCLUSION
In conclusion, CRISPR is an effective technology affords
us the opportunity to edit the human genome by the removal of
undesirable treats beyond the gene expression. Applying it to
cancer is one of the ideas in new lights in medicine and sciences;
however, with the study and research, it was expected that it is
applicable and have met the achievements. Hence, why not use it?
I think that CRISPR is going through considerable growth the
coming years-growth will save the world.
IX. REFERENCES
[1] Stout, C., Öner, E., Tastan, C., Thompson, C. M., Feeney, O., Castro, O., … KuicK Research. (n.d.). CRISPR. Retrieved from https://www.academia.edu/Documents/in/CRISPR.
[2] CRISPR Guide. (n.d.). Retrieved from https://www.addgene.org/guides/crispr/.
[3] What is genome editing and CRISPR-Cas9? - Genetics Home Reference - NIH. (n.d.). Retrieved from

International Journal of Scientific and Research Publications, Volume 10, Issue 1, January 2020 74
ISSN 2250-3153
http://dx.doi.org/10.29322/IJSRP.10.01.2020.p9712 www.ijsrp.org
https://ghr.nlm.nih.gov/primer/genomicresearch/genomeediting.
[4] What Is Cancer? (n.d.). Retrieved from https://www.cancer.gov/about-cancer/understanding/what-is-cancer.
[5] Cancer. (2018, December 12). Retrieved from https://www.mayoclinic.org/diseases-conditions/cancer/symptoms-causes/syc-20370588.
[6] Stein, R. (2019, November 6). CRISPR Approach To Fighting Cancer Called 'Promising' In 1st Safety Test. Retrieved from https://www.npr.org/sections/health-shots/2019/11/06/776169331/crispr-approach-to-fighting-cancer-called-promising-in-1st-safety-test.
[7] Armitage, H. (2019, August 27). Scientists zero in on cancer treatments using CRISPR. Retrieved from https://phys.org/news/2019-08-scientists-cancer-treatments-crispr.html.
International Journal of Scientific and Research Publications, Volume 10, Issue 1, January 2020 75
ISSN 2250-3153
http://dx.doi.org/10.29322/IJSRP.10.01.2020.p9713 www.ijsrp.org
The Role Of Managerial Performance In Creating
Corporate Entrepreneurship
Edy Susanto
Student of Doctoral Program of
Sekolah Tinggi Ilmu Ekonomi Indonesia (STIESIA) Surabaya
Budiyanto
Sekolah Tinggi Ilmu Ekonomi Indonesia (STIESIA) Surabaya
Suhermin
Sekolah Tinggi Ilmu Ekonomi Indonesia (STIESIA) Surabaya
DOI: 10.29322/IJSRP.10.01.2020.p9713
http://dx.doi.org/10.29322/IJSRP.10.01.2020.p9713
Abstract: This study investigated the effect of managerial competence, organizational culture on managerial
performance and their impact on corporate entrepreneurship. The samples of this study were 95 KCP Bank
BCA in East Java Region. The respondents were considered by 3 leaders who are responsible for the office, so
the number of research respondents were 285 people. For data analysis, this study applied Partial Least Square
(PLS). The results of this study indicated that managerial competence, organizational culture, and managerial
performance were variables that could explain and predict corporate entrepreneurship variables. Moreover, the
managerial competence had no direct or indirect effect on corporate entrepreneurship, while organizational
culture had a direct or indirect effect on corporate entrepreneurship.
Keywords: managerial competence, organizational culture, manajerial performance corporate entrepreneurship.
I. INTRODUCTION
Both banking and entrepreneurship worlds are inseparable from one another. The development of banking
does not outflow from entrepreneur processes. A bank must have competitive power and be constantly ready to
face incoming threats; a bank must also be more creative and innovative by creating innovations in its service
and products so that it can possess the competitive advantage in order to survive as competitive company
(Morris and Laforge, 2002). Being creative and innovative are elements of corporate entrepreneurship
(Abosede et.al., 2018). Being a company with corporate entrepreneurship is highly required in banking world
nowadays.
Abosede et al. (2018) explains that the elements of corporate entrepreneurship (e.g.: innovative,
proactive, risk taking, strategic renewal and corporate venturing) have positive significant impacts on
international bank in Nigeria. Specifically, a research conducted by Bobby and Harry (2013) in Malaysia
International Journal of Scientific and Research Publications, Volume 10, Issue 1, January 2020 76
ISSN 2250-3153
http://dx.doi.org/10.29322/IJSRP.10.01.2020.p9713 www.ijsrp.org
mention that there is a strong relationship between corporate entrepreneurship and performance in banking
industry. Researche by Guth and Ginsberg (1990); Covin and Slevin (1991); and Zahra (1991) show that the
higher the concept of corporate entrepreneurship is, the higher the organization performance will become.
Burgelman (1983c); Kanter (1989); Stevenson and Jarillo (1990); Elenkov et al. (2005) identify
organization internal factors influencing the capability of corporate entrepreneurship. Those internal factors
include organization leadership, company culture and value system, structure and process, system and the
availability of resources (Covin and Slevin, 1991; Damanpour, 1991; Zahra, 1991, 1993, 1995; Zahra and
Covin, 1995; Hornsby et al., 2002; Goosen, 2002). These factors facilitate the activities of corporate
entrepreneurship either individually or jointly.
Some studies also explain that there are relationships between organization performance and corporate
entrepreneurship (Ghina, 2012; Ghina and Larso, 2011; Dyduch, 2008; Utama, 2013; Karacaoglu et al., 2013;
Shafinaz et al., 2014; Shamsuddin et al., 2012). However, the research results are various; one generates
significant relationship (Ghina, 2012; Ghina and Larso, 2011; Dyduch, 2008; Utama, 2013; Karacaoglu et al.,
2013) and the other generates insignificant relationship (Shafinaz et al., 2014; Shamsuddin et al., 2012).
Moreover, Shafinaz et al. (2014) in their research mentions four dimensions in corporate entrepreneurship,
namely innovativeness, reactiveness, risk taking and competitive aggressiveness which have significant
influence on business performance. While autonomy dimension does not influence business performance.
Other researches also confirm that the relationship between business performance and corporate
entrepreneurship are negative (Karacaoglu et al., 2013; George et al., 2001; Shamsuddin et al., 2012). Another
research result conducted by Karacaoglu et al., (2013) shows that corporate entrepreneurship dimensions such
as innovation, risk taking and proactive one have positive significant relationship with financial performance.
Meanwhile, the autonomy and competitive aggressiveness variables are not related to company financial
performance. Moreover, there is a different argument on the impact of corporate entrepreneurship on business
performance.
II. THEORETICAL REVIEW
Corporate Entrepreneurship
Nowadays, entrepreneurship plays an important role in improving productivity and spurring economic
growth (Covin and Slevin, 1991; Zahra, 1991, 1993; Yu, 1998). Dyduch (2008) states that entrepreneurship is
an approach of management strategy. Human resource is a factor that plays an important role in the success of
corporate entrepreneurship.
International Journal of Scientific and Research Publications, Volume 10, Issue 1, January 2020 77
ISSN 2250-3153
http://dx.doi.org/10.29322/IJSRP.10.01.2020.p9713 www.ijsrp.org
Hornsby et al. (1999) identifies five factors that must be applied by human resource management in order
to support the success of corporate entrepreneurship. These five factors include appreciation or reward,
management facilities that support innovation, the availability of resource for innovation and conducive
organization structure for learning and cooperation, and the ability to take risks from all individuals. One of the
aspects of corporate entrepreneurship of human resource management that has been highly investigated is
innovation. While all researches in relation to human resource management and compensation towards
innovation refer to one factor that draws the most attentions (Balkin and Bannister, 1993; Balkin and Gomez,
1984, 1987; Balkin et al., 2000). Corporate entrepreneurship is a factor that triggers innovations by utilizing
new markets, offering new products, or both (Sharma and Chrisman, 1999).
Research done by Hornsby et al., (2002) examines the measurement nature of Corporate Entrepreneurship
Assessment Instrument (CEAI) that includes factors such as reliability analysis and assessment. From
managerial perspective, the result shows that Corporate Entrepreneurship Assessment Instrument (CEAI) can
be a useful instrument in diagnosing company environment in order to become corporate entrepreneurship. In
addition, a company must also possess entrepreneurial orientation in order to actualize entrepreneurship
activities (Lumpkin and Dess, 2001).
Managerial Performance
Managerial performance is the ability or the work performance that has been achieved by a person or a
group of person in an organization (Sonnentag and Frese, 2002). Managerial performance can also interpreted
as an achievement or level of success achieved by an individual within an organization in reaching the goals or
targets that have been set (Stoner, 2002).
An organization with good performance can benefit more from the existing environment
opportunity, can more easily solve problems created by environment, can meet the social needs segment both
quantitatively and qualitatively in an excellent way and can gain competitive excellence in the market
(Verboncu and Corcodel, 2014).
Managerial competencies
Competencies have impact on company performance (Sánchez, 2012; Tehseen and Ramayah, 2015;
Wickramaratne et al., 2014). Competencies have characteristics that are used to distinguish an individual’s
performance. Then, Deist and Winterton (2005) mention that holistic typology of competencies is essential in
understanding the combination of knowledge, skill and social competencies. The three competencies are
International Journal of Scientific and Research Publications, Volume 10, Issue 1, January 2020 78
ISSN 2250-3153
http://dx.doi.org/10.29322/IJSRP.10.01.2020.p9713 www.ijsrp.org
necessary in a job, both conceptual (cognitive, knowledge and comprehension) and operational competencies
(functional, psycho-motor and applied skill).
The result of research conducted by Sánchez (2012) mentions that entrepreneurial competencies play very
important roles in the organization ability in enhancing its competitiveness; and they also have direct effect to
company performance. Otherwise, Tehseen and Ramayah (2015) examine the effect of entrepreneurial
competencies to the success of Small and Medium Enterprise (SME) with SMEs in Malaysia as the objects. The
result of the research states that external integration moderates the effect of entrepreneurial competencies to the
success of Small and Medium Enterprise (SME) in Malaysia. Therefore, entrepreneurs should have
competencies in managing relationships with customers and suppliers in order to improve company
competitiveness.
Then, Wickramaratne et al. (2014) examine the impact of entrepreneurial competencies of the owner or
manager to entrepreneurial orientation in a tea company in Sri Lanka and the relationship between the
backgrounds of the owner or manager to entrepreneurial competencies. In this research, entrepreneurial
competencies are put into operation with opportunity, organizing, strategic, relationship, commitment and
conceptual competencies. The research result shows that the characteristic background of the owner or manager
has direct effect to entrepreneurial competencies which then have implications to the existence of positive and
direct relation between entrepreneur strategy and the commitment of the entrepreneurship oriented owner or
manager.
Organizational Culture
Mejia and Balkin (2012) define organizational culture as a system of value, assumption, belief, and norms
that unites the members of an organization. Organizational culture reflects the views of employees in the way
things are done. Organizational culture give meaning to actions and procedures in an organization which can be
considered as the personality of an organization.
Organizational culture is a predictor of entrepreneurial orientation. The success of entrepreneurial
orientation can be achieved if it is supported by the right organizational culture. Denison and Mishra (1990)
mentions that organizational culture refers to the basic values, belief and principle which serve as the
foundation of the management system of an organization, and also a series of management practice and
behavior which set examples and reinforce the foundation.
Research conducted by Shihab et al. (2011) shows there is a significant relation between organizational
culture and entrepreneurial orientation. Organizational culture is a predictor of entrepreneurial orientation. The
success of entrepreneurial orientation can be achieved if it is supported by the right organizational culture. The
organizational culture dimensions mentioned in the research cinducted by Shihab et al. (2011) consist of
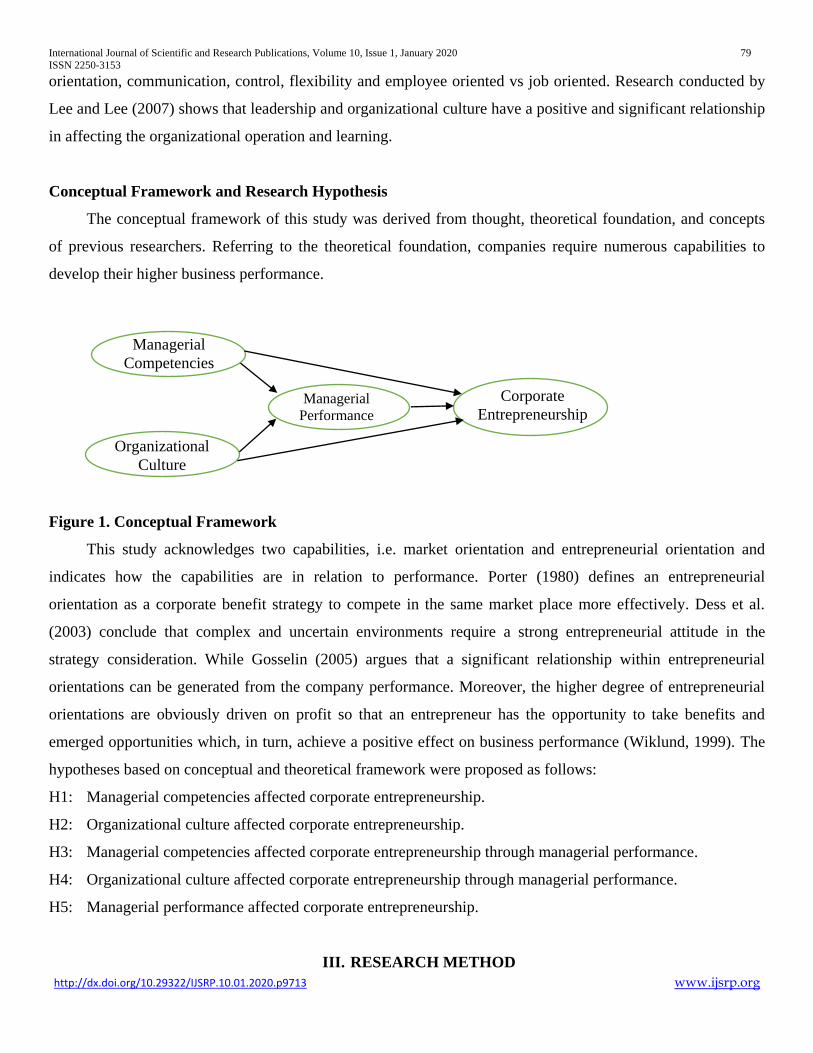
International Journal of Scientific and Research Publications, Volume 10, Issue 1, January 2020 79
ISSN 2250-3153
http://dx.doi.org/10.29322/IJSRP.10.01.2020.p9713 www.ijsrp.org
orientation, communication, control, flexibility and employee oriented vs job oriented. Research conducted by
Lee and Lee (2007) shows that leadership and organizational culture have a positive and significant relationship
in affecting the organizational operation and learning.
Conceptual Framework and Research Hypothesis
The conceptual framework of this study was derived from thought, theoretical foundation, and concepts
of previous researchers. Referring to the theoretical foundation, companies require numerous capabilities to
develop their higher business performance.
Figure 1. Conceptual Framework
This study acknowledges two capabilities, i.e. market orientation and entrepreneurial orientation and
indicates how the capabilities are in relation to performance. Porter (1980) defines an entrepreneurial
orientation as a corporate benefit strategy to compete in the same market place more effectively. Dess et al.
(2003) conclude that complex and uncertain environments require a strong entrepreneurial attitude in the
strategy consideration. While Gosselin (2005) argues that a significant relationship within entrepreneurial
orientations can be generated from the company performance. Moreover, the higher degree of entrepreneurial
orientations are obviously driven on profit so that an entrepreneur has the opportunity to take benefits and
emerged opportunities which, in turn, achieve a positive effect on business performance (Wiklund, 1999). The
hypotheses based on conceptual and theoretical framework were proposed as follows:
H1: Managerial competencies affected corporate entrepreneurship.
H2: Organizational culture affected corporate entrepreneurship.
H3: Managerial competencies affected corporate entrepreneurship through managerial performance.
H4: Organizational culture affected corporate entrepreneurship through managerial performance.
H5: Managerial performance affected corporate entrepreneurship.
III. RESEARCH METHOD
Managerial
Competencies
Organizational
Culture
Managerial
Performance
Corporate
Entrepreneurship
International Journal of Scientific and Research Publications, Volume 10, Issue 1, January 2020 80
ISSN 2250-3153
http://dx.doi.org/10.29322/IJSRP.10.01.2020.p9713 www.ijsrp.org
This research employed quantitative approach. The populations of this research were the Branch
Offices of PT. Bank Central Asia within 16 cities in East Java. The sample selection in every city was
conducted by lottery method. The number of samples in this research were 95 Branch Offices of BCA in East
Java. There were 3 managers as respondents from each Branch Office; hence the number of respondents in this
research were 285 individuals. Data analysis technique used in this research were classified into two groups,
namely descriptive data analysis technique and inferential statistics analysis technique using PLS (Partial Least
Square).
IV. ANALYSIS AND DISCUSSION
Descriptive Analysis
The age range of respondents in this research falls into 4 categories, namely 21–30 years old, 31–40
years old, 41–50 years old and above 50 years old. 64.9% of respondents are in the category of 41–50 years old.
25.6% of respondents are in the category of above 50 years old. 7% of respondents were in the category of 21–
30 years old. It is clear that based on the age, the category of 41–50 years old has the most respondents. This
shows that the maturity level in making decision for their subordinates is pretty good. In that range of age most
people tend to be more thoughtful and less emotional in making decisions.
The service period in this research was classified into 4 groups, respondents with years of service
within 0-10 years of service, between 11–20 years of service, 21–30 years of service, and above 30 years of
service. The percentage of respondents within 21–30 years of service were 53.3%; and the above 30 years of
service was 42.8%. While the group of 21–30 years was quite long period to learn problems and find the right
solution.
The length of service as managers in this research was classified into 4 categories, which were
within 0–3 years, 4–7 years, 8–11 years and above 11 years. Most respondents or as much as 40.0% had been
serving their managerial position for 4–7 years. The percentage of respondents who had been serving their
managerial position for more than 11 years was 14.4%. Instead, the percentage of respondents who had been
serving their managerial position for 0–3 years were 15.4%, while the percentage of respondents who had been
serving their managerial position for 8–11 years is 30.2%. This indicated that the managers as respondents in
this research possess had adequate experience in facing problems in their field. Having 4 to 7 years of
experience not only enabled them to face problems and find solutions, but also empowered them in generating
new ideas for the success of the company.
Factor Loading and Average Score for Each Indicator
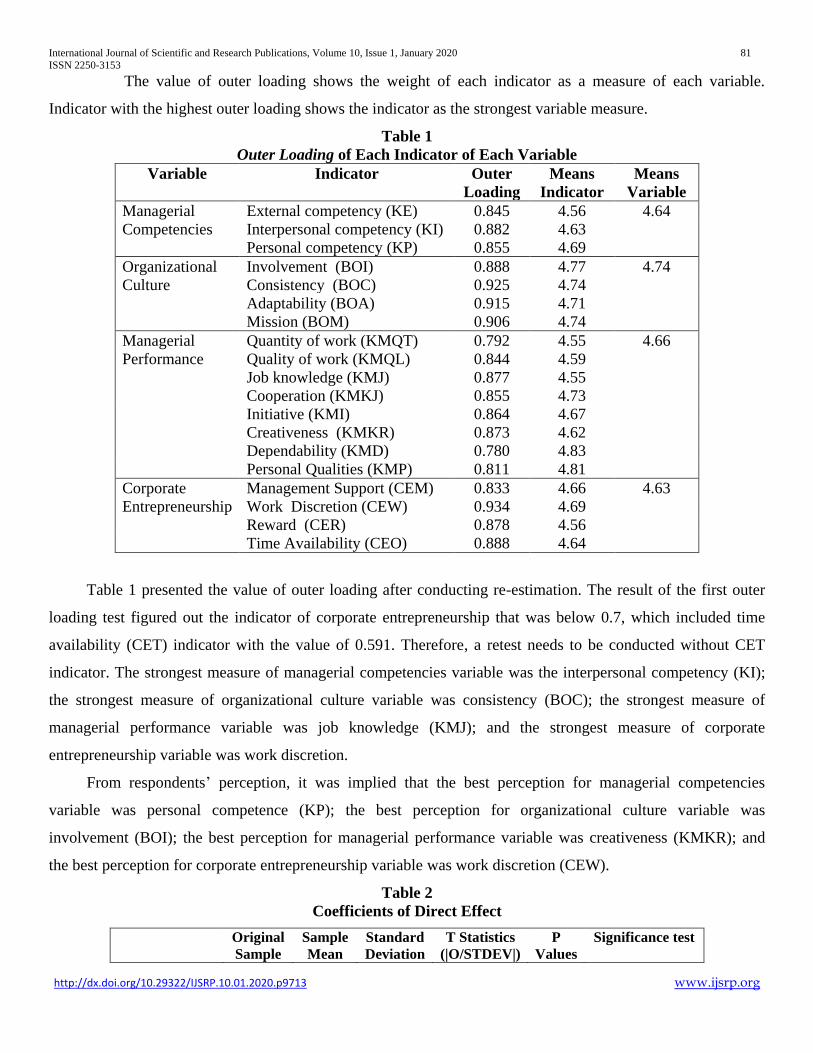
International Journal of Scientific and Research Publications, Volume 10, Issue 1, January 2020 81
ISSN 2250-3153
http://dx.doi.org/10.29322/IJSRP.10.01.2020.p9713 www.ijsrp.org
The value of outer loading shows the weight of each indicator as a measure of each variable.
Indicator with the highest outer loading shows the indicator as the strongest variable measure.
Table 1
Outer Loading of Each Indicator of Each Variable
Variable Indicator Outer
Loading
Means
Indicator
Means
Variable
Managerial
Competencies
External competency (KE) 0.845 4.56 4.64
Interpersonal competency (KI) 0.882 4.63
Personal competency (KP) 0.855 4.69
Organizational
Culture
Involvement (BOI) 0.888 4.77 4.74
Consistency (BOC) 0.925 4.74
Adaptability (BOA) 0.915 4.71
Mission (BOM) 0.906 4.74
Managerial
Performance
Quantity of work (KMQT) 0.792 4.55 4.66
Quality of work (KMQL) 0.844 4.59
Job knowledge (KMJ) 0.877 4.55
Cooperation (KMKJ) 0.855 4.73
Initiative (KMI) 0.864 4.67
Creativeness (KMKR) 0.873 4.62
Dependability (KMD) 0.780 4.83
Personal Qualities (KMP) 0.811 4.81
Corporate
Entrepreneurship
Management Support (CEM) 0.833 4.66 4.63
Work Discretion (CEW) 0.934 4.69
Reward (CER) 0.878 4.56
Time Availability (CEO) 0.888 4.64
Table 1 presented the value of outer loading after conducting re-estimation. The result of the first outer
loading test figured out the indicator of corporate entrepreneurship that was below 0.7, which included time
availability (CET) indicator with the value of 0.591. Therefore, a retest needs to be conducted without CET
indicator. The strongest measure of managerial competencies variable was the interpersonal competency (KI);
the strongest measure of organizational culture variable was consistency (BOC); the strongest measure of
managerial performance variable was job knowledge (KMJ); and the strongest measure of corporate
entrepreneurship variable was work discretion.
From respondents’ perception, it was implied that the best perception for managerial competencies
variable was personal competence (KP); the best perception for organizational culture variable was
involvement (BOI); the best perception for managerial performance variable was creativeness (KMKR); and
the best perception for corporate entrepreneurship variable was work discretion (CEW).
Table 2
Coefficients of Direct Effect
Original
Sample
Sample
Mean
Standard
Deviation
T Statistics
(|O/STDEV|)
P
Values
Significance test
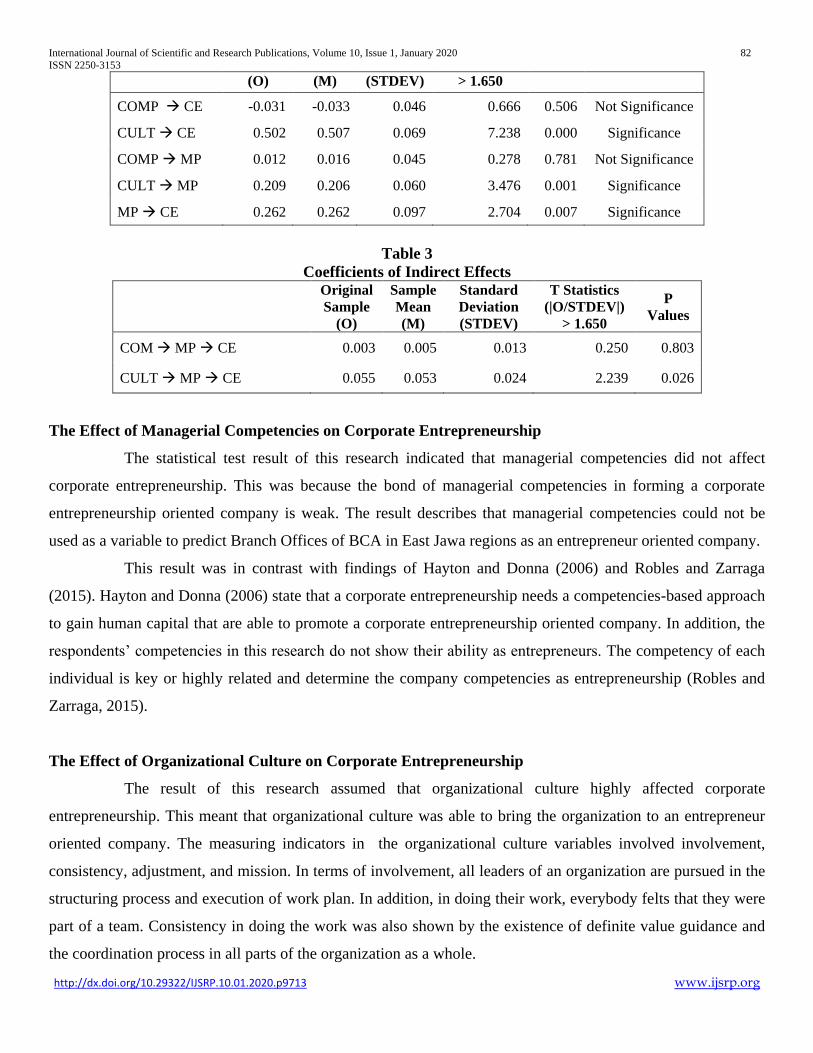
International Journal of Scientific and Research Publications, Volume 10, Issue 1, January 2020 82
ISSN 2250-3153
http://dx.doi.org/10.29322/IJSRP.10.01.2020.p9713 www.ijsrp.org
(O) (M) (STDEV) > 1.650
COMP CE -0.031 -0.033 0.046 0.666 0.506 Not Significance
CULT CE 0.502 0.507 0.069 7.238 0.000 Significance
COMP MP 0.012 0.016 0.045 0.278 0.781 Not Significance
CULT MP 0.209 0.206 0.060 3.476 0.001 Significance
MP CE 0.262 0.262 0.097 2.704 0.007 Significance
Table 3
Coefficients of Indirect Effects
Original
Sample
(O)
Sample
Mean
(M)
Standard
Deviation
(STDEV)
T Statistics
(|O/STDEV|)
> 1.650
P
Values
COM MP CE 0.003 0.005 0.013 0.250 0.803
CULT MP CE 0.055 0.053 0.024 2.239 0.026
The Effect of Managerial Competencies on Corporate Entrepreneurship
The statistical test result of this research indicated that managerial competencies did not affect
corporate entrepreneurship. This was because the bond of managerial competencies in forming a corporate
entrepreneurship oriented company is weak. The result describes that managerial competencies could not be
used as a variable to predict Branch Offices of BCA in East Jawa regions as an entrepreneur oriented company.
This result was in contrast with findings of Hayton and Donna (2006) and Robles and Zarraga
(2015). Hayton and Donna (2006) state that a corporate entrepreneurship needs a competencies-based approach
to gain human capital that are able to promote a corporate entrepreneurship oriented company. In addition, the
respondents’ competencies in this research do not show their ability as entrepreneurs. The competency of each
individual is key or highly related and determine the company competencies as entrepreneurship (Robles and
Zarraga, 2015).
The Effect of Organizational Culture on Corporate Entrepreneurship
The result of this research assumed that organizational culture highly affected corporate
entrepreneurship. This meant that organizational culture was able to bring the organization to an entrepreneur
oriented company. The measuring indicators in the organizational culture variables involved involvement,
consistency, adjustment, and mission. In terms of involvement, all leaders of an organization are pursued in the
structuring process and execution of work plan. In addition, in doing their work, everybody felts that they were
part of a team. Consistency in doing the work was also shown by the existence of definite value guidance and
the coordination process in all parts of the organization as a whole.
International Journal of Scientific and Research Publications, Volume 10, Issue 1, January 2020 83
ISSN 2250-3153
http://dx.doi.org/10.29322/IJSRP.10.01.2020.p9713 www.ijsrp.org
This research result supports Paunovic and Dima (2014) stating that one of key elements of
corporate entrepreneurship is the creation of cultural organization that includes cultural entrepreneurship
values. Moreover, Paunovic and Dima (2014) mention that motivation factor supporting the implementation of
cultural values are vitally needed. This research is in line with the research conducted by Bau and Wagner
(2015) that mention that corporate entrepreneurship and intrapreneurship reflect behavior and culture that can
help a company to grow competitively. The research also develops index that measures culture and market
related factors that might influence employee ability to behave in entrepreneurial behavior.
The Effect of Competencies on Corporate Entrepreneurship on Managerial Performance
The statistical test result of the managerial competencies affected corporate entrepreneurship on
managerial performance as an intervening variable was p value 0.803 > 0.05, which means insignificant. This
indicated that managerial competencies had no significant effect of corporate entrepreneurship on managerial
performance as an intervening variable.
The calculation indicated that managerial competencies did not have direct and indirect effect on
corporate entrepreneurship. Therefore, the managerial competencies were predicated to be unable to bring
Branch Offices of BCA in East Java regions as a corporate entrepreneurship oriented company. It can be
concluded that managerial competencies are unable to form a corporate entrepreneurship oriented company
especially on the level of branch offices.
The Effect of Organizational Culture on Corporate Entrepreneurship on Managerial Performance
The statistical test result of this research found that the effect of organizational culture on corporate
entrepreneurship with managerial performance an intervening variable was p value 0.026 < 0.05. This result
revealed that organizational culture had a significant effect on corporate entrepreneurship with managerial
performance an intervening variable.
The path coefficient value of direct effect of organizational culture on corporate entrepreneurship (0.502)
was higher than the path coefficient of indirect effect of organizational culture on corporate entrepreneurship
with managerial performance an intervening variable (0.055). Based on that path coefficient value, it can be
concluded that managerial performance serves as partial mediation. In other words, the existing organizational
culture in Branch Offices of BCA in East Java regions has successfully bring the organization as a corporate
entrepreneurship oriented company.
V. CONCLUSION AND SUGGESTION
International Journal of Scientific and Research Publications, Volume 10, Issue 1, January 2020 84
ISSN 2250-3153
http://dx.doi.org/10.29322/IJSRP.10.01.2020.p9713 www.ijsrp.org
Conclusion
Managerial competencies, organizational culture, and managerial performance were considered as
variables that could explain and predict the corporate entrepreneurship variable at Branch Offices of Bank
Central Asia in East Java as a company that was oriented to corporate entrepreneurship.
Managerial competencies did not have direct and indirect effect to corporate entrepreneurship, while
organizational culture had both direct and indirect effect to corporate entrepreneurship. The direct effect of
organizational culture to corporate entrepreneurship was larger than the indirect effect. This meant that
managerial competencies as an intervening variable was as partial mediation.
Suggestion
Organizational culture should be used as a framework and daily behavior guidance in working and
reaching goals. Managerial competencies become crucial in making the Branch Offices of Bank Central Asia as
a corporate entrepreneurship oriented company by improving the managerial ability of Branch Offices, as
explained by Hsu et al., (2014) that entrepreneurial leadership has an impact to innovative behavior. By
possessing the ability as entrepreneur, the Branch Offices managerial persons of Bank Central Asia are able to
see opportunities and improve their performance which then influences the company competitiveness.
REFERENCES
Abosede, A.J., J. Fayose, and B.U. Eze. 2018. Corporate entrepreneurship and international performance of banks in Nigeria. Journal
of Economics and Management, 32(2), 5-17.
Balkin, D.B. and B.D Bannister. 1993. Explaining pay forms for strategic employee groups in organizations: A resource dependence
perspective. J. Occup. Organ. Psychol. 66(2): 139-
Balkin, D.B. and L.R. Gomez. 1984. Determinants of R&D compensation strategies in the high tech industry. Person. Psychol. 37(4):
635-640.
Balkin, D.B. and L.R Gomez-Mejia. 1987. Toward a contingency theory of compensation strategy. Strat. Manag. J 8(2): 169-
182.151.
Balkin, D.B., G.D. Markman, and L.R. Gomez-Mejia. 2000. Is CEO pay in high technology firms related to innovation? Acad. Manag.
J. 43(6): 1118-1129.
Bau, F., and K. Wagner. 2015. Measuring corporate entrepreneurship culture. Int. J. Entrepreneurship and Small Business 25(2).
Bobby, B.H.C. and Harry, E. 2013. A Conceptual Model of Corporate Entrepreneurship in Banking Industry. Proceedings of 2013
International Conference on Technology Innovation and Industrial Management 29-31 May 2013, Phuket, Thailand.
Burgelman, R. A. 1983c. Corporate entrepreneurship and strategic management: Insights from a process study. Management Science,
29(12), 1349–1364.
Covin, J.G. and D.P. Slevin. 1991. A Conceptual Model of Entrepreneurship as Firm Behavior. Entrepreneurship Theory and
Practice 16: 7-25.
Damanpour, F. 1991. Organisational innovation: a meta-analysis of effects of determinant and moderators. Academy of Management
Journal, 34:55-390.
Denison and A.K. Mishra. 1995. Organizational Culture and Organizational Effectiveness. Organization Science 6(2).
https://doi.org/10.1080/0898562011005811

International Journal of Scientific and Research Publications, Volume 10, Issue 1, January 2020 85
ISSN 2250-3153
http://dx.doi.org/10.29322/IJSRP.10.01.2020.p9713 www.ijsrp.org
Dyduch, W. 2008. Corporate Entrepreneurship Measurement for Improving Organizational Performance. Journal of Economics &
Management 4.
Ghina, A. and D. Larso. 2011. Corporate Entrepreneurship di Sektor Pelayanan Publik Studi Kasus: Badan Pelayanan Perizinan
Terpadu Kota dan Kabupaten Bandung Astri Ghina Dwi Larso Kelompok Keahlian Manajemen Manusia dan Kewirausahaan
Sekolah Bisnis dan Manajemen Institut Teknologi Ban. Jurnal Manajemen Teknologi 10(1).
Ghina, A. 2012. Corporate Entrepreneurship at Public Service Sector: Measurement and the Influence toward Government
Performance. International Journal of Basic and Applied Science 22–32. Retrieved from www.insikapub.com
Goosen, G.J. 2002. Key factor intrapreneurship: The development of a systems model to facilitate the perpetuation of
entrepreneurship in large South African organisations. Unpublished PhD thesis, University of Stellenbosch.
Guth, W.D. and A. Ginsberg. 1990. Guest Editors: Introduction: Corporate Entrepreneurship. Strategic Management Journal 11: 5-15.
Hayton, J.C. and J.K. Donna. 2006. A competency-based framework for promoting corporate entrepreneurship. Hum. Res. Manag
45(3): 407-427.
Hsu, C. T., W. C. Fei, dan H. D. Lu. 2014. The Relationship between Entrepreneurial Leadership and Innovative Behavior : The
Mediating Effect of Entrepreneurial Self-Efficacy and the Moderating Effect of Openness to Experience and Extraversion.
Information Technology Journal 13: 1035–1044
Hornsby, J.S., D.F. Kuratko, and R.V. Montagno. 1999. Perception of internal factors for corporate entrepreneurship: A comparison
of Canadian and U.S. managers. Entrepreneurship Theory and Practice 24(2): 9–24.
Hornsby, J.S., D.F. Kuratko, and S.A. Zahra. 2002. Middle managers’ perception of the internal environment for corporate
entrepreneurship: assessing a measurement scale. Journal of Business Venturing 17: 253–273
Kanter, R.M. 1989. Swimming in Newstreams: Mastering Innovation Dilemas. Calif. Manag. Rev. Berkel. 31, 45.
Karacaoglu, K., A. Bayrakdaro, and F.B. San. 2013. The Impact of Corporate Entrepreneurship on Firms’ Financial Performance :
Evidence from Istanbul Stock Exchange Firms. International Business Research 6(1): 163–175.
Lee, S.C.M. and M. Lee. 2007. A study on relationship among leadership, organizational culture, the operation of learning
organization and employees job satisfaction. The Learning Organization.
Lumpkin, G. and G.G. Dess. 2001. Linking two dimensions of entrepreneurial orientation to firm performance: The moderating role
of environment and industry life cycle. Journal of Business Venturing 16(5): 429–451. https://doi.org/10.1016/S0883-
9026(00)00048-3
Mejia, L.R.G. and D.B. Balkin. 2012. Management. New Jersey: Pearson Education, Inc.
Morris, H.M., M. Schindehutte, and R.W. Laforge. 2002. Entrepreneurial marketing: a construct for integrating emerging
entrepreneurship and marketing perspectives. Journal of Marketing Theory and Practice (Fall): 1-18.
Paunovic, S. and I.C. Dima. 2014. Organizational Culture and Corporate Entrepreneurship. Annals of the University of Petroşani,
Economics 14(1): 269–276.
Robles, L. and M. Zárraga. 2015. Key Competencies for Entrepreneurship. Procedia Economics and Finance 23(October 2014):
828–832.
Sánchez, J. 2012. The influence of entrepreneurial competencies on small firm performance. Revista Latinoamericana de Psicologia
44(2): 165–177.
Shafinaz, A., A. Rasli, A. Azura, and Z. Mohd. 2014. The Impact of Entrepreneurial Orientation on Business Performance : A Study
of Technology-based SMEs in Malaysia. Procedia - Social and Behavioral Sciences 130(1996): 46–53.
Shamsuddin, S., J. Othman, and M.A. Shahadan. 2012. The dimensions of corporate entrepreneurship and the performance of
established organization. ACRN Journal of Entrepreneurship Perspectives 1(2): 111–131.
Sharma, P. and S. J.J. Chrisman. 1999. Toward a reconciliation of the definitional issues in the field of corporate entrepreneurship.
Entrepreneurship: Concepts, Theory and Perspective 83–103. http://doi.org/10.1007/978-3-540-48543-8_4
Shihab, M.S., T. Wismiarsi, and K. Sine. 2011. Relationship between Organisational Culture and Entrepreneurial Orientation :
Indonesian SMEs Context. IPEDR 24: 93–97.
Sonnentag, S. and M. Frese. 2002. Psychological Management of Individual Performance. John Wiley & Sons, Ltd.
Stevenson, H.H. and J.C. Jarillo, J.C. 1990. A paradigm of entrepreneurship: entrepreneurial management. Strategic Management
Journal. Vol. 11, pp.17-27.
Tehseen, S. and T. Ramayah. 2015. Entrepreneurial Competencies and SMEs Business Success: The Contingent Role of External
Integration. Mediterranean Journal of Social Sciences 6(1): 50–61.
Utama, I. G. S. 2013. Analisis Pengaruh Corporate Entrepreneurship Terhadap Kinerja Industri Manufaktur Di Jawa Timur. AGORA
1(3): 1–5.

International Journal of Scientific and Research Publications, Volume 10, Issue 1, January 2020 86
ISSN 2250-3153
http://dx.doi.org/10.29322/IJSRP.10.01.2020.p9713 www.ijsrp.org
Verboncu, I. and S. E. Corcodel. 2014. Managerial Performance – Factors of Influence. Review of International Comparative
Management 15(3): 273–283.
Wickramaratne, A., A. Kiminami, and H. Yagi. 2014. Entrepreneurial competencies and entrepreneurial orientation of tea
manufacturing firms in Sri Lanka. Asian Social Science 10(18): 50–62
Yu, T.F.-L. 1998. Adaptive entrepreneurship and the economic development of Hongkong, World Development 16(5): 897-911.
Zahra, S. 1991. Predictors and Financial Outcomes of Corporate Entrepreneurship: An Exploratory Study. Journal of Business
Venturing 6: 259-286.
Zahra, S. 1993. Environment, corporate entrepreneurship and financial performance: A taxonomic approach. Journal of Business
Venturing 8: 319 – 340.
Zahra, S. 1995. Corporate entrepreneurship and company performance: The case of management leveraged buyouts. Journal of
Business Venturing 10(3): 225-247.
International Journal of Scientific and Research Publications, Volume 10, Issue 1, January 2020 87
ISSN 2250-3153
http://dx.doi.org/10.29322/IJSRP.10.01.2020.p9714 www.ijsrp.org
Validity, Effectiveness, and Practicality of Learning
Media Using Advance Organizer to Increase Critical
Thinking on Colloid Material of Senior High School A Pascalia Lalian1,*,, L Yuanita1, U Azizah1
Science Education, Post Graduate, State Univercity of Surabaya
DOI: 10.29322/IJSRP.10.01.2020.p9714
http://dx.doi.org/10.29322/IJSRP.10.01.2020.p9714
Abstract
The purpose of this study is to determine the validity, effectiveness, and practicality of learning tools to improve student’s critical
thinking skills by using an advanced organizer learning model on colloidal material. The test was conducted in grade XI-5 of 7th
Senior High School of Surabaya with 24 students. The learning device development model in this study uses the 4D model from
Thiagarajan, but only 3 stages are applied (define, design, develop). The implementation phase of learning in the class uses one
group pretest-posttest design. The assessment is carried out by using a validation sheet filled out by the validator, pretest-posttest
questions based on the critical thinking skills, and an observation sheet on the implementation of the lesson plan by the observer.
Based on the research conducted, it is founded that: (a) the results of the validation of learning devices in general have an average
score of 3 to 4 with a reliability of 80 to 100%. (b) the average of critical thinking ability data of students is 63.12 with the
categories less critical, critical and very critical. Furthermore, it is also obtained the results of the increment in each indicator of
critical thinking ability, namely (i) the indicatorof formulating the problem gets an increase of 31.25, (ii) the indicator of giving an
argument gets an increase of 16.06, (iii) the analyzing indicator gets an increase of 6, (iv) the indicator of doing induction or
concluding gets an increase of 40.62, and (v) the indicator of applying gets an increase of 39.58, and (c) the observation of the
implementation of the lesson plan of three meetings obtain an average score of 3.33 to 4 with reliability of 86 to100 %. Based on
the data analysis, it can be concluded that the learning tools developed are valid, effective, and practical to improve student’s
critical thinking skills.
Keywords: validity, effectiveness, practicality, advance organizer, student’s critical thinking skills
A. Introduction
According to the Chairman of the National Education Standard Agency, Bambang Suryadi, the procurement of
High Order Thinking Skill (HOTS) questions make Indonesian education standard even higher to catch up with other
countries. Therefore, this question will continue to be held, but with more preparation, namely increased learning both
for students and teachers (Okezone News, 2018). Referring to the standard of National Exam questions, namely
HOTS based questions, the teacher must prepare provisions for students from an early age, where the priority of a
teacher as an educator is to teach students how to learn and how to think HOTS based so that when dealing with
National Exam questions, students do not experience difficulties. The 2013 curriculum was developed with the
completing mindset of the following: teacher center learning into student centers, one-way learning (teacher-student
interaction) into interactive learning (teacher-student-community-environment-source-other media interactions),
passive learning becomes a scientific learning, and individual learning becomes group learning.
The results of the pre-research test by giving questions about colloids to the 12th grade students of Science as
many as 12 students at 7th Senior High School of Surabaya showed that students had difficulty learning when faced
with chemical problems. Students are also lacking in critical thinking seen from the achievement of an average score
that has not reached the minimum standard of the school which is 70. This is evidenced by the pre-research test scores

International Journal of Scientific and Research Publications, Volume 10, Issue 1, January 2020 88
ISSN 2250-3153
http://dx.doi.org/10.29322/IJSRP.10.01.2020.p9714 www.ijsrp.org
of 33% or as many as 4 out of 12 students who have achieved the minimum standard, while 66.67% or as many as 8
out of 12 students have not reached the minimum standard.
Students must have good critical thinking skills in order to overcome this problem. And the teacher's job is to
help the students, one of it is to develop devices using an advanced organizer model.
B. Method
1. Learning Tool Validation Analysis
The data analysis which includes the device validation and assessment is done by calculating the average
score of each component obtained from the validator. The average score results are described in the following table.
Learning device is said to be valid for use if the average score obtained is at least 2.6.
Table 1 DataValidation Analysis
Interval Category Explanation
1,0 ≤ to ≤ 1,5 Invalid Cannot be used yet, consultation is
needed
1,6 ≤ to ≤ 2,5 Less Valid Can be used with a lot of revisions
2,6 ≤ to ≤ 3,5 Valid Can be used with a little revisions
3.6 ≤ to ≤ 4,0 Very Valid Can be used without revisions
(adapted from Ratumanan & Laurens, 2011)
The reliability of the instrument is determined based on the assessment data from the validator. The level of reliability
can be calculated by using the formula below:
R = (1 – 𝐴−𝐵
A+𝐵) x 100%
(adapted from Borich, 1994)
Explanation:
R = Percentage of instrument reliability
A = Higher average score than the validator
B = Average number of scores lower than the validator
The instrument is said to be reliable if it has a reliability value ≥ 75% (Borich, 1994).
2. The learning tool effectiveness analysis
a. Analysis The ability to think critically
The analysis of student’s critical thinking skill is carried out to determine the increase in student’s
critical thinking skill through pretest and posttest. Critical thinking ability data is analyzed through the critical
thinking rubric.

International Journal of Scientific and Research Publications, Volume 10, Issue 1, January 2020 89
ISSN 2250-3153
http://dx.doi.org/10.29322/IJSRP.10.01.2020.p9714 www.ijsrp.org
Critical thinking skill rubric used in this study is a multilevel scale, which is a question followed by
columns that indicate the level of scoring with a scaling scale in accordance with predetermined criteria as in
Table 2.
Table 2 Categories ofStudent’s Critical Thinking Ability
No. Criteria Score
1. Very Correct 4
2. Correct 3
3. Correct Enough 2
4. Less Correct 1
5. Is not done 0
(adapted from Purwanto, 2008)
The data that has been obtained is analyzed to determine the increase in critical thinking skills.
Level of critical thinking = 𝑆𝑐𝑜𝑟𝑒 𝑜𝑏𝑡𝑎ined by students
𝑇𝑜𝑡𝑎𝑙 𝑠𝑐𝑜𝑟𝑒 𝑥 100
After obtaining the results of student’s critical thinking skill, researchers adjust to the category of student’s
critical thinking abilities. The categories of critical thinking skill can be seen in Table 3.
Tabel 3 The Guidelines for Critical Thinking Categories
No. Obtained Scale Category
1. > 81,25 to ≤ 100 Very Critical
2. > 62,50 to ≤ 81,25 Critical
3. > 43,75 to ≤ 62,50 Less Critical
4. ≤ 25,00 to 43,75 Very Less Critical
(Source: Setyowati et al, 2010)
3. Student Response Questionnaire Analysis
The results of the student response questionnaire will be obtained, are analyzed by using the following
formula:
Percentage = 𝑁𝑢𝑚𝑏𝑒𝑟 𝑜𝑓 𝑠𝑡𝑢𝑑𝑒𝑛𝑡𝑠 𝑎𝑛𝑠𝑤𝑒𝑟ing items
𝑛𝑢𝑚𝑏𝑒𝑟 𝑜𝑓 𝑟𝑒𝑠𝑝𝑜𝑛𝑑𝑒𝑛𝑡𝑠 𝑥 100%
The percentage criteria for student responses are presented in the following table:
Table 4 The Criteria for Percentage of Student Responses
No. Scale Obtained Category
1. 0 – 20 % Very Less
2. 21 – 40% Less
3. 41 – 60% Enough
4. 61 – 80% Good
5. 81 – 100% Very Good
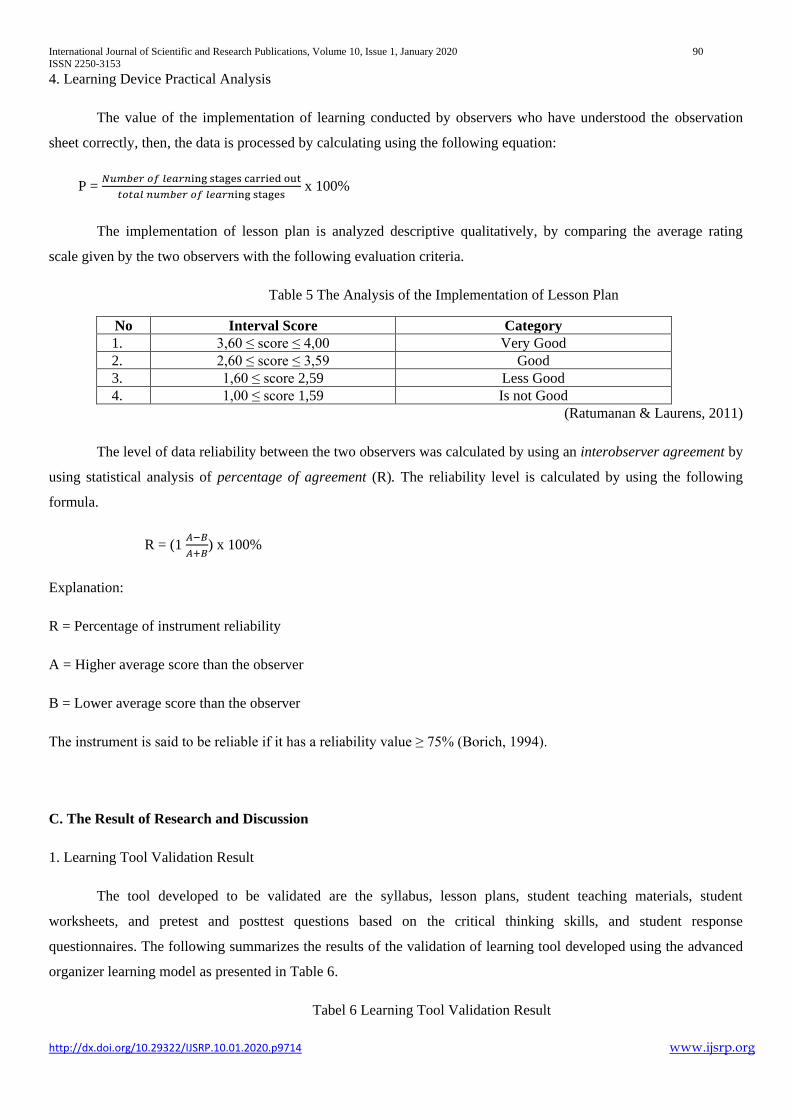
International Journal of Scientific and Research Publications, Volume 10, Issue 1, January 2020 90
ISSN 2250-3153
http://dx.doi.org/10.29322/IJSRP.10.01.2020.p9714 www.ijsrp.org
4. Learning Device Practical Analysis
The value of the implementation of learning conducted by observers who have understood the observation
sheet correctly, then, the data is processed by calculating using the following equation:
P = 𝑁𝑢𝑚𝑏𝑒𝑟 𝑜𝑓 𝑙𝑒𝑎𝑟𝑛ing stages carried out
𝑡𝑜𝑡𝑎𝑙 𝑛𝑢𝑚𝑏𝑒𝑟 𝑜𝑓 𝑙𝑒𝑎𝑟𝑛ing stages x 100%
The implementation of lesson plan is analyzed descriptive qualitatively, by comparing the average rating
scale given by the two observers with the following evaluation criteria.
Table 5 The Analysis of the Implementation of Lesson Plan
No Interval Score Category
1. 3,60 ≤ score ≤ 4,00 Very Good
2. 2,60 ≤ score ≤ 3,59 Good
3. 1,60 ≤ score 2,59 Less Good
4. 1,00 ≤ score 1,59 Is not Good
(Ratumanan & Laurens, 2011)
The level of data reliability between the two observers was calculated by using an interobserver agreement by
using statistical analysis of percentage of agreement (R). The reliability level is calculated by using the following
formula.
R = (1 𝐴−𝐵
𝐴+𝐵) x 100%
Explanation:
R = Percentage of instrument reliability
A = Higher average score than the observer
B = Lower average score than the observer
The instrument is said to be reliable if it has a reliability value ≥ 75% (Borich, 1994).
C. The Result of Research and Discussion
1. Learning Tool Validation Result
The tool developed to be validated are the syllabus, lesson plans, student teaching materials, student
worksheets, and pretest and posttest questions based on the critical thinking skills, and student response
questionnaires. The following summarizes the results of the validation of learning tool developed using the advanced
organizer learning model as presented in Table 6.
Tabel 6 Learning Tool Validation Result

International Journal of Scientific and Research Publications, Volume 10, Issue 1, January 2020 91
ISSN 2250-3153
http://dx.doi.org/10.29322/IJSRP.10.01.2020.p9714 www.ijsrp.org
No. Tool’s Name Score
Obtained
Category Reliability
1. Syllabus 3,33 – 4 V, VV 86 – 100%
2. Lesson Plan 2,67 – 4 V, VV 80 – 100%
3. Student Teaching Material 2,67 – 4 V, VV 80 – 100%
4. Student Worksheet 2,67 – 4 V, VV 80 – 100%
4. Pretest Question 3,33 – 4 V, VV 86 – 100%
6. Posttest Question 3,33 – 4 V, VV 86 – 100%
7. Student Response Questionnaire 3,33 – 4 V, VV 86 – 100%
Explanation: V: Valid; VV: Very Valid
Based on the Table 6, it is known that all devices get an average score that ranges from 2.67 to 4 with a valid
category and is very valid. In addition, each device also has reliability ranging from 80-100%, it means that the
devices developed using the advanced organizer model are appropriate for use in improving critical thinking skills on
colloidal material. Thus, all devices developed can be used in the process of learning colloidal material because it has
met the criteria for proper use, namely valid and appropriate.
2. Learning Tool Effectiveness Result
a. Critical Thinking Ability Assessment Result
The data of student’s critical thinking skill before learning was obtained based on the pretest scores carried
out before the first meeting, while the student’s critical thinking skill after learning was obtained based on the
posttest scores after the third meeting. The indicators of student’s critical thinking skill is assessed namely
formulating the problem, giving arguments, analyzing, inducing or concluding, and applying those assessed by
using the rubric of critical thinking with a range of 0-4. The results of the student’s critical thinking skill are
presented in Table 7.
Table 7 The Score of Student’s Critical Thinking Skill
Code Pretest Posttest
Score Category Score Category
S1 45 LK 62,5 LC
S2 57,5 C 70 C
S3 62,5 C 72,5 C
S4 42.5 VLC 60 LC
S5 57,5 LC 75 C
S6 40 VLC 60 LC
S7 42,5 VLC 60 LC
S8 42,5 VLC 67,5 C
S9 42,5 VLC 60 LC
S10 42,5 VLC 72,5 C
S11 40 VLC 60 LC
S12 35 VLC 47,5 LC
S13 52,5 LC 67,5 C
S14 45 LC 72,5 C
S15 30 VLC 55 LC

International Journal of Scientific and Research Publications, Volume 10, Issue 1, January 2020 92
ISSN 2250-3153
http://dx.doi.org/10.29322/IJSRP.10.01.2020.p9714 www.ijsrp.org
Code Pretest Posttest
Score Category Score Category
S16 45 LC 75 C
S17 65 C 80 C
S18 57,5 LC 75 C
S19 60 LC 80 C
S20 52,5 LC 77,5 C
S21 47,5 LC 67,5 C
S22 40 VLC 65 C
S23 45 LC 67,5 C
S24 60 LC 85 VC
Average 47,71 LC 63,12 C Explanation: VLC = Very Less Critical; LC = Less Critical; C = Critical, VC = Very Critical
Based on Table 7, it is known that before the learning activities there are 3 critical students and 21 less critical
students with grades ranging from 30 – 62,5. After learning the student’s grades have increased, there are still 8 less
critical students, 15 critical students, and 1 very critical student with grades ranging from 47.5 – 85.
Furthermore, the analysis of each indicator of critical thinking skill that are formulating the problem,
providing arguments, analyzing, inducing or concluding, and applying can be seen in Table 8.
Table 8 The Analysis of Each Indicator of Critical Thinking Skill
No. Indicator Average Score
Pretest Explanation Posttest Explanation
1. Formulating the problem 25 VLC 56,25 LC
1. Providing arguments 44,87 LC 60,93 LC
2. Analyzing 77,07 C 83,07 VC
3. Inducing or concluding 16,67 VLC 57,29 LC
4. Applying 17,18 VLC 56,76 LC Explanation: VLC :Very Less Critical; LC : Less Critical; C : Critical; VC : Very Critical
Based on Table 8, it is known that there is an increase in the five indicators of critical thinking skills after
learning by using an advanced organizer model. The indicator of formulating the problem gets an increase of 31,25,
the indicator of giving an argument gets an increase of 16,06, the analyzing indicator gets an increase of 6, the
indicator of inducing or concluding gets an increase of 40,62, and the indicator of applying gets an increase of 39,58.
The indicator that experienced the highest increase is the indicator of inducing or concluding a value of 40,62,
while the indicator that experienced the lowest increase is analyzing with a value of 6.
b. The Analysis Result of Student Response Questionnaire
The result of the student questionnaire responses to the learning activities that have been carried out and the
learning tools that have been developed by using the advanced organizer learning model presented in Table 9.
Table 9 The Result of Student Response Questionnaire
Goal Declaration Respond
Percentage
Category
Yes No
Interest The design of LKS
andcoloid student’s
material are interesting
100 - Very Good
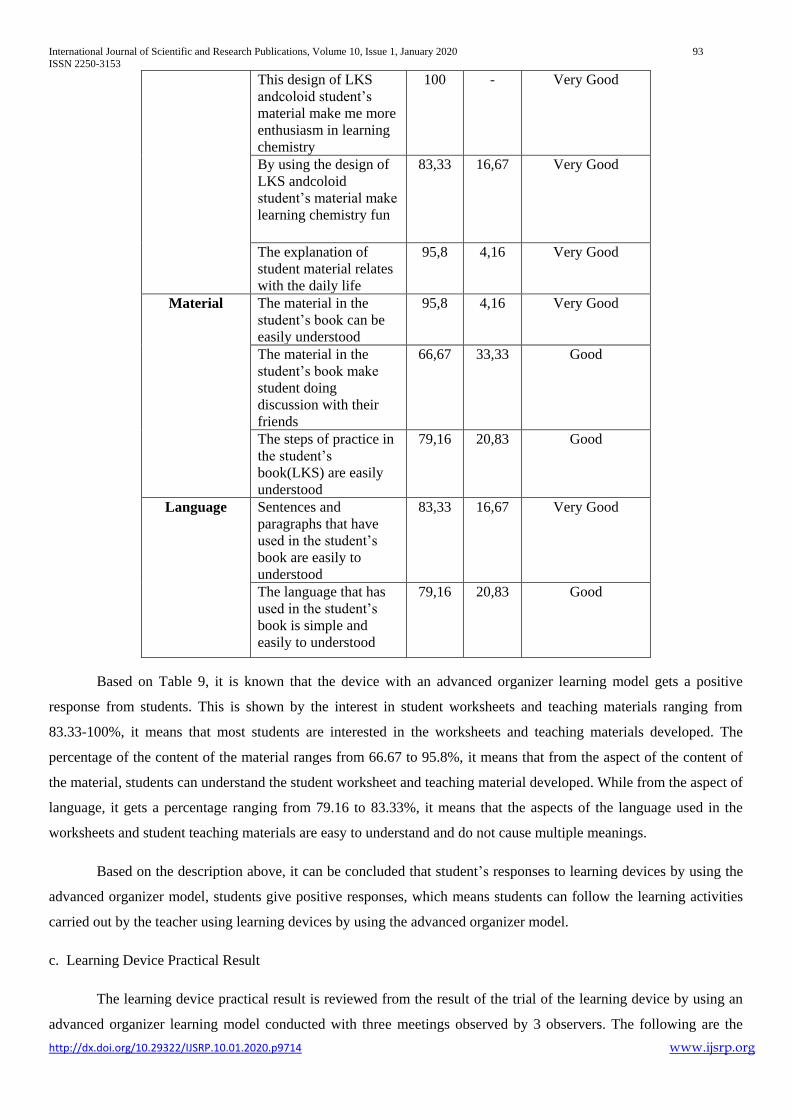
International Journal of Scientific and Research Publications, Volume 10, Issue 1, January 2020 93
ISSN 2250-3153
http://dx.doi.org/10.29322/IJSRP.10.01.2020.p9714 www.ijsrp.org
Based on Table 9, it is known that the device with an advanced organizer learning model gets a positive
response from students. This is shown by the interest in student worksheets and teaching materials ranging from
83.33-100%, it means that most students are interested in the worksheets and teaching materials developed. The
percentage of the content of the material ranges from 66.67 to 95.8%, it means that from the aspect of the content of
the material, students can understand the student worksheet and teaching material developed. While from the aspect of
language, it gets a percentage ranging from 79.16 to 83.33%, it means that the aspects of the language used in the
worksheets and student teaching materials are easy to understand and do not cause multiple meanings.
Based on the description above, it can be concluded that student’s responses to learning devices by using the
advanced organizer model, students give positive responses, which means students can follow the learning activities
carried out by the teacher using learning devices by using the advanced organizer model.
c. Learning Device Practical Result
The learning device practical result is reviewed from the result of the trial of the learning device by using an
advanced organizer learning model conducted with three meetings observed by 3 observers. The following are the
This design of LKS
andcoloid student’s
material make me more
enthusiasm in learning
chemistry
100 - Very Good
By using the design of
LKS andcoloid
student’s material make
learning chemistry fun
83,33 16,67 Very Good
The explanation of
student material relates
with the daily life
95,8 4,16 Very Good
Material The material in the
student’s book can be
easily understood
95,8 4,16 Very Good
The material in the
student’s book make
student doing
discussion with their
friends
66,67 33,33 Good
The steps of practice in
the student’s
book(LKS) are easily
understood
79,16 20,83 Good
Language Sentences and
paragraphs that have
used in the student’s
book are easily to
understood
83,33 16,67 Very Good
The language that has
used in the student’s
book is simple and
easily to understood
79,16 20,83 Good

International Journal of Scientific and Research Publications, Volume 10, Issue 1, January 2020 94
ISSN 2250-3153
http://dx.doi.org/10.29322/IJSRP.10.01.2020.p9714 www.ijsrp.org
practicalities of the learning tools obtained based on trials in 1 class for 3 meetings. The results of observing the
implementation of learning observed by 3 observers while conducting the trial are presented in Table 10.
Table 10 The Observation Result of Lesson Plan Implementation
Steps First Meeting Second Meeting Third Meeting
Average Categor
y
R
(%)
Average Category R
(%)
Average Category R (%)
First Activity
Teacher gives
greeting
3,33
G
86
3,67
VG
86
3,67
VG
86
Teacher asks one
of the student to
lead the pray
4
VG
100
3,33
G
86
3,67
VG
86
Teacher explains
the advance
organizerlearning
model
3,33
VG
86
4
VG
100
4
VG
100
Main Activity
Phase 1 : the
presentation of
advance organizer
a. Explain the
goal of
learning
Teacher
explains the
goal of the
learning and
indicator
3,33
G
86
3,33
G
86
3,67
VG
86
b. The
presentation
ofadvance
organizer
1. Teacher
gives
student’s
worksheet
3,67
VG
86
2. Teacher 3,33 G 86 3,33 G 86 4 VG 100

International Journal of Scientific and Research Publications, Volume 10, Issue 1, January 2020 95
ISSN 2250-3153
http://dx.doi.org/10.29322/IJSRP.10.01.2020.p9714 www.ijsrp.org
Steps First Meeting Second Meeting Third Meeting
Average Categor
y
R
(%)
Average Category R
(%)
Average Category R (%)
gives an
example to
the student
3. Teacher asks
the student to
give
question(stat
ing the
problem)
(asking)
3,33
G
86
3,67
VG
86
3,67
VG
86
4. Teacher asks
one of the
student to
answer
(giving
argument)
3,33
G
86
3,67
VG
86
3,67
VG
86
5. Teacher
explains
3,67
VG
86
4
VG
100
3,67
VG
86
6. Teacher
explains the
technical
term (giving
attention)
4
VG
100
3,67
VG
86
3,33
G
86
c. Reminding the
knowledge or
relevant
experience
Teacher asks
to the student
the material
that they have
learnt before
3
G
100
3,67
VG
86
3,33
G
86
Phase 2 :
Learning
material

International Journal of Scientific and Research Publications, Volume 10, Issue 1, January 2020 96
ISSN 2250-3153
http://dx.doi.org/10.29322/IJSRP.10.01.2020.p9714 www.ijsrp.org
Steps First Meeting Second Meeting Third Meeting
Average Categor
y
R
(%)
Average Category R
(%)
Average Category R (%)
presentation
a. Give material
1. Teacher asks
the students
to make a
group
3,33
G
86
4
VG
100
3,67
VG
100
2. Teacher gives
LKS
3
G
100
3,33
G
86
3
G
100
3. Teacher gives
instruction to
the student to
do LKS
4
VG
100
3,33
G
86
4
VG
100
4. Students do
the question
from the
teacher
(stating
problem),
(giving
argument),
(analyzing),
(inducting or
concluding),
(applying)
(observing,
asking, trying,
thinking,
communicatin
g)
3,33
G
86
3,67
VG
86
3,67
VG
86
5. Teacher
supervises the
discussion
3,67 SB 86 3,67 B 86 3,67 SB 86
6. Teacher asks
one group to
do
3
G
100
3,67
VG
86
3,33
G
86
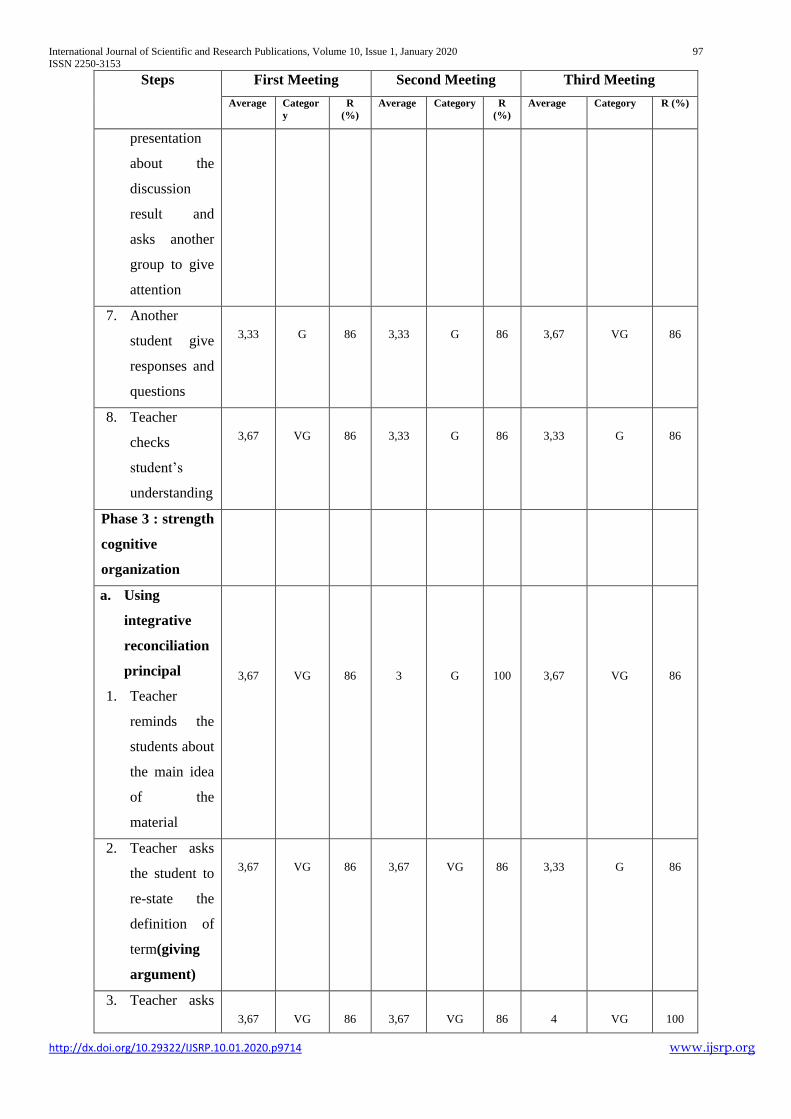
International Journal of Scientific and Research Publications, Volume 10, Issue 1, January 2020 97
ISSN 2250-3153
http://dx.doi.org/10.29322/IJSRP.10.01.2020.p9714 www.ijsrp.org
Steps First Meeting Second Meeting Third Meeting
Average Categor
y
R
(%)
Average Category R
(%)
Average Category R (%)
presentation
about the
discussion
result and
asks another
group to give
attention
7. Another
student give
responses and
questions
3,33
G
86
3,33
G
86
3,67
VG
86
8. Teacher
checks
student’s
understanding
3,67
VG
86
3,33
G
86
3,33
G
86
Phase 3 : strength
cognitive
organization
a. Using
integrative
reconciliation
principal
1. Teacher
reminds the
students about
the main idea
of the
material
3,67
VG
86
3
G
100
3,67
VG
86
2. Teacher asks
the student to
re-state the
definition of
term(giving
argument)
3,67
VG
86
3,67
VG
86
3,33
G
86
3. Teacher asks
3,67
VG
86
3,67
VG
86
4
VG
100

International Journal of Scientific and Research Publications, Volume 10, Issue 1, January 2020 98
ISSN 2250-3153
http://dx.doi.org/10.29322/IJSRP.10.01.2020.p9714 www.ijsrp.org
Steps First Meeting Second Meeting Third Meeting
Average Categor
y
R
(%)
Average Category R
(%)
Average Category R (%)
the students
to summary
what they
have learned
4. Teacher gives
student the
assignment
for writing
the
differenceof
each concept
that has
served
(thinking)
3,33
G
86
3,67
VG
86
3,33
G
86
b. Suggest active
reception
learning
Teacher asks
the student to
write another
examples
(thinking)
3,67
VG
86
3,67
VG
86
3,33
G
86
c. Build the
critical
approach to
the learning
material
Teacher asks
the student to
explain again
the main idea
of the material
(giving
argument)
3,33
G
86
3,33
G
86
3,67
VG
86

International Journal of Scientific and Research Publications, Volume 10, Issue 1, January 2020 99
ISSN 2250-3153
http://dx.doi.org/10.29322/IJSRP.10.01.2020.p9714 www.ijsrp.org
Steps First Meeting Second Meeting Third Meeting
Average Categor
y
R
(%)
Average Category R
(%)
Average Category R (%)
d. Clarification
Teacher asks
the student in
every group to
ask
question(statin
g problem)
(asking)
4
VG
100
3,33
G
86
3,67
VG
86
Closing
1. Teacher gives
homework
3,33
G
86
3
G
100
3,67
VG
86
2. Teacher closes
the lesson by
praying and
greeting
3
G
100
3,67
VG
86
3,67
VG
86
Class Condition
1. Teacher’s
enthusiasm
3,33
G
86
3,67
VG
86
4
VG
100
2. Student’s
enthusiasm
4
VG
100
3,67
VG
86
3,33
G
86
3. Time
management
3,67
VG
100
3
G
100
3,67
VG
86
Explanation: G: Good; VG: Very Good
Based on Table 10, it is known that the implementation of each aspect in the lesson plan of meetings I, II, III
gets an average score of 3.33 to 4. These results indicate that overall the stages of learning, namely the initial, main,
and closing activities have been carried out with both good and very good categories. In addition, each stage has
reliability ranging from 86 to 100%, it means that all stages in the three meetings are appropriately carried out in
accordance with the stages in the lesson plan.
D. Conclusion
Based on the results of the development and the data collection that is heldat 7th Senior High School of
Surabaya towards 24 students, it can be concluded that the learning device by using the advanced organizer model has
fulfilled the validity, practicality, and effectiveness requirements so that it is appropriate to be used in the learning
process to improve student’s critical thinking skills, especially at indicators of formulating the problems, analyzing,
providing arguments, inducting or concluding, and applying.

International Journal of Scientific and Research Publications, Volume 10, Issue 1, January 2020 100
ISSN 2250-3153
http://dx.doi.org/10.29322/IJSRP.10.01.2020.p9714 www.ijsrp.org
E. References
Abiansyah, T. (2007). “Advance Organizer untuk Meningkatkan Pemahaman Konsep dan Keterampilan Berpikir
Kritis Siswa pada Topik Hidrokarbon”. Tesis PPs UPI. Diakses 3 Februari 2019 dari
http://repository.upi.edu/operator/upload/s_mat_053893_chapter2.pdf.
Agustina, D. (2011). “Penerapan Pengorganisasian Awal (Advance Organizer) dalam Memfasilitasi Kemampuan
Berpikir Kritis”. PPs Unesa: Surabaya
Borich, Gary. D. (1994). Observation Skill for Effective Teaching. New York: Mac Millan Publishing Company.
Ennis, R. H. (1996). Critical Thinking. USA: Prentice Hall. Inc
Ivie, S. D. (1998). “Ausubel’s Learning Theory: An Approaching To Teaching Higher Order Thingking Skills.
Educational Phyhologist David Paul Ausubel”. High School Journal. Vol. 82 (1): 1-40
Joyce, B. & Weil, M (1992). Model of Theaching. Prentice Hall. Inc
Kardi, S. (2003). Advance Organizer. PPs Unesa: Surabaya
Purwanto. (2008). Evaluasi Hasil Belajar. Yogyakarta: Pustaka Pelajar
Ratumanan, T. G. & Laurens, T. (2011). Penilaian Hasil Belajar Siswa pada Tingkat Satuan Pendidikan Edisi 2.
Surabaya: Unesa University Press
Setyowati, Subali, & Mosik. (2011). “Implementasi Pendekatan Konflik Kognitif dalam Pembelajaran Fisika untuk
Menumbuhkan Kemampuan Kritis Siswa”. Jurnal Pendidikan Fisika Indonesia. 7(-): 89-96

International Journal of Scientific and Research Publications, Volume 10, Issue 1, January 2020 101
ISSN 2250-3153
http://dx.doi.org/10.29322/IJSRP.10.01.2020.p9715 www.ijsrp.org
Factors Affecting for E-Waste Recycling in Sri Lanka
K. S. H. Sarathchandra*, H. A. H. Hettiarachchib **
* Lecturer (Probationary), Departemnt of Commerce & Financial Management,University of Kelaniya
** Senior Lecturer, Departemnt of Commerce & Fincnail Management, University of Kelaniya,
DOI: 10.29322/IJSRP.10.01.2020.p9715
http://dx.doi.org/10.29322/IJSRP.10.01.2020.p9715
Abstract- Owing to the recent technological advancements and
growing tendency to embrace technology has tremendously
increased the use of Electrical and Electronic Equipment (EEE)
both in developed and developing countries. Consequently, this
led to accumulation of large quantities of e-waste around the
world. Importantly, management and proper disposal of household
e-waste in almost every country including Sri Lanka has become
a prevailing challenge. Evidently, Sri Lanka has given a minimum
priority for systematic e-waste management compared to the
developed countries. The main aim of this research is to examine
the factors influencing the e-waste recycling of households in Sri
Lanka. Hence, this research was conducted as a quantitative study
involving cross-sectional survey, gathering valid responses from
245 households. Multiple Regression Analysis was employed to
analyze the data and tested the constructed hypotheses. The
findings exhibited that attitude and perceived convenience are the
factors that influence willingness of e-waste recycling of Sri
Lankan households. A succinct overview of Sri Lanka’s
household perception of current e-waste recycling is emphasized
in this research. Ultimately, findings would support the relevant
waste management authorities in Sri Lanka to plan and execute
effective strategies to manage household e-waste.
Index Terms- Electrical and Electronic Equipment, E-Waste,
Recycling, Willingness,
I. INTRODUCTION
resently, exponential growth in manufacturing and subsequent
use of sophisticated EEE is commonly witnessed all around
the world. In fact, there is an incessant production of EEE with
rapid cutting-edge technical enhancements striving to feed the
respective growing consumer demand. Moreover, duration of
expected use of some EEE such as communication devices has
drastically reduced with frequent arrival of upgraded versions
embedded with enhanced user friendly smart features and high-
performance capabilities. Consequently, rising demand with
increasing tendency of replacing/upgrading EEE and acceleration
of production with minimum attention to Waste Electrical and
Electronic (WEEE) recycling has created a major threat for both
the humanity and natural environment (Nixon, Saphores,
Ogunseitan, & Shapiro, 2009). Regretfully, it is evident that most
of the consumers tend to discard WEEE without practicing a
proper environmental friendly disposal mechanism (Borthakur,
Anwesha, Sinha, & Kunal, 2013). Mainly, these disposed WEEE
contain numerous toxic chemicals and other harmful substances.
Thus, WEEE cannot be treated as normal junk. Many countries,
including both the developed and developing countries have taken
several counter measures to manage WEEE disposal with the aim
of minimizing the harm. Major protective step acknowledged is
the proper recycling of WEEE (Ray, 2008). Therefore, managing
WEEE by proper recycling would minimize the negative results
affected for human livelihood and natural environmental.
Presently, Sri Lanka is similarly encountering the problem of
managing WEEE. However, insufficient countermeasures have
been taken to address the issue of managing e-waste
(Mallawarachchi & Karunasena, 2012). The researchers argue that
there exists a gap in examining the extent of Sri Lankan consumer
readiness on e-waste management and recycling. Thus,
researchers seek to address aforementioned issue via this empirical
research.
II. LITERATURE REVIEW
1.1. E-waste Increasing use and frequent replacement of EEE gave a rise
to the e-waste as an emerging phenomenon that happens be
challenging the existence of humanity and nature. Although the
concept of WEEE has been predominantly received interest
among many scholars, research studies are still progressing aimed
at exploring appropriate strategies to minimize the harmfulness.
Many reputed organizations and scholars embarked to
conceptually define e-waste or WEEE as an initially approach to
investigate this phenomenon. E-waste is all obsolete or outdated
electronic and electrical devices commonly used in offices, homes
and by people on the go (Electronic Recyclers of America, 2006).
Similarly, e-waste is referred as an end-of-life equipment, whose
working depends on electric current or electromagnetic field
(United Nations Environmental Programme, 2007). Organization
of Economic Cooperation and Development (2001) defined e-
waste as “any appliance using electric power supply that has
reached its end-of-life”. The Directive 2012/19/EC defined e-
waste as the electrical or electronic equipment which is waste
including all components, subassemblies and consumables which
are part of the product at the time of discarding. Above mentioned
directive lists ten categories of e-waste namely: large household
appliances; small household appliances; IT and
telecommunication equipment; consumer equipment; lighting
equipment; electrical and electronic tools (with the exception of
large scale stationary industrial tools); toys, leisure and sports
equipment; medical devices (with the exception of all implanted
and infected products); monitoring and control instruments; and
automatic dispensers.
P
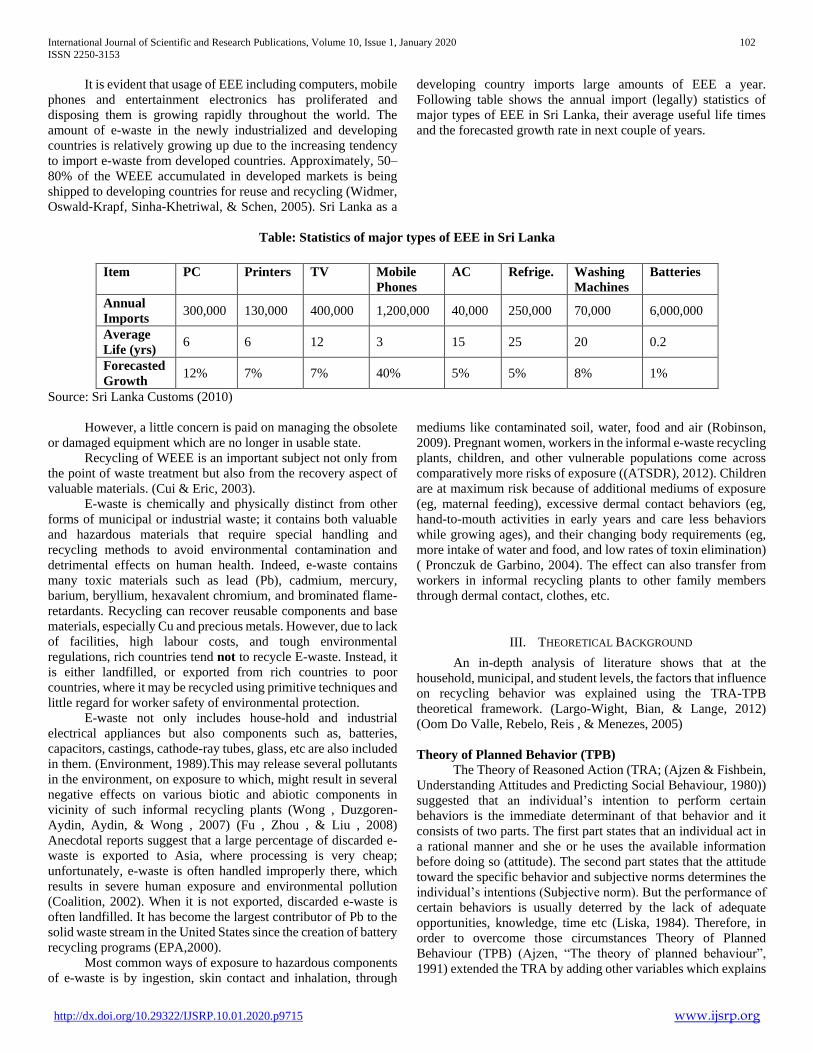
International Journal of Scientific and Research Publications, Volume 10, Issue 1, January 2020 102
ISSN 2250-3153
http://dx.doi.org/10.29322/IJSRP.10.01.2020.p9715 www.ijsrp.org
It is evident that usage of EEE including computers, mobile
phones and entertainment electronics has proliferated and
disposing them is growing rapidly throughout the world. The
amount of e-waste in the newly industrialized and developing
countries is relatively growing up due to the increasing tendency
to import e-waste from developed countries. Approximately, 50–
80% of the WEEE accumulated in developed markets is being
shipped to developing countries for reuse and recycling (Widmer,
Oswald-Krapf, Sinha-Khetriwal, & Schen, 2005). Sri Lanka as a
developing country imports large amounts of EEE a year.
Following table shows the annual import (legally) statistics of
major types of EEE in Sri Lanka, their average useful life times
and the forecasted growth rate in next couple of years.
Table: Statistics of major types of EEE in Sri Lanka
Source: Sri Lanka Customs (2010)
However, a little concern is paid on managing the obsolete
or damaged equipment which are no longer in usable state.
Recycling of WEEE is an important subject not only from
the point of waste treatment but also from the recovery aspect of
valuable materials. (Cui & Eric, 2003).
E-waste is chemically and physically distinct from other
forms of municipal or industrial waste; it contains both valuable
and hazardous materials that require special handling and
recycling methods to avoid environmental contamination and
detrimental effects on human health. Indeed, e-waste contains
many toxic materials such as lead (Pb), cadmium, mercury,
barium, beryllium, hexavalent chromium, and brominated flame-
retardants. Recycling can recover reusable components and base
materials, especially Cu and precious metals. However, due to lack
of facilities, high labour costs, and tough environmental
regulations, rich countries tend not to recycle E-waste. Instead, it
is either landfilled, or exported from rich countries to poor
countries, where it may be recycled using primitive techniques and
little regard for worker safety of environmental protection.
E-waste not only includes house-hold and industrial
electrical appliances but also components such as, batteries,
capacitors, castings, cathode-ray tubes, glass, etc are also included
in them. (Environment, 1989).This may release several pollutants
in the environment, on exposure to which, might result in several
negative effects on various biotic and abiotic components in
vicinity of such informal recycling plants (Wong , Duzgoren-
Aydin, Aydin, & Wong , 2007) (Fu , Zhou , & Liu , 2008)
Anecdotal reports suggest that a large percentage of discarded e-
waste is exported to Asia, where processing is very cheap;
unfortunately, e-waste is often handled improperly there, which
results in severe human exposure and environmental pollution
(Coalition, 2002). When it is not exported, discarded e-waste is
often landfilled. It has become the largest contributor of Pb to the
solid waste stream in the United States since the creation of battery
recycling programs (EPA,2000).
Most common ways of exposure to hazardous components
of e-waste is by ingestion, skin contact and inhalation, through
mediums like contaminated soil, water, food and air (Robinson,
2009). Pregnant women, workers in the informal e-waste recycling
plants, children, and other vulnerable populations come across
comparatively more risks of exposure ((ATSDR), 2012). Children
are at maximum risk because of additional mediums of exposure
(eg, maternal feeding), excessive dermal contact behaviors (eg,
hand-to-mouth activities in early years and care less behaviors
while growing ages), and their changing body requirements (eg,
more intake of water and food, and low rates of toxin elimination)
( Pronczuk de Garbino, 2004). The effect can also transfer from
workers in informal recycling plants to other family members
through dermal contact, clothes, etc.
III. THEORETICAL BACKGROUND
An in-depth analysis of literature shows that at the
household, municipal, and student levels, the factors that influence
on recycling behavior was explained using the TRA-TPB
theoretical framework. (Largo-Wight, Bian, & Lange, 2012)
(Oom Do Valle, Rebelo, Reis , & Menezes, 2005)
Theory of Planned Behavior (TPB)
The Theory of Reasoned Action (TRA; (Ajzen & Fishbein,
Understanding Attitudes and Predicting Social Behaviour, 1980))
suggested that an individual’s intention to perform certain
behaviors is the immediate determinant of that behavior and it
consists of two parts. The first part states that an individual act in
a rational manner and she or he uses the available information
before doing so (attitude). The second part states that the attitude
toward the specific behavior and subjective norms determines the
individual’s intentions (Subjective norm). But the performance of
certain behaviors is usually deterred by the lack of adequate
opportunities, knowledge, time etc (Liska, 1984). Therefore, in
order to overcome those circumstances Theory of Planned
Behaviour (TPB) (Ajzen, “The theory of planned behaviour”,
1991) extended the TRA by adding other variables which explains
Item PC Printers TV Mobile
Phones
AC Refrige. Washing
Machines
Batteries
Annual
Imports 300,000 130,000 400,000 1,200,000 40,000 250,000 70,000 6,000,000
Average
Life (yrs) 6 6 12 3 15 25 20 0.2
Forecasted
Growth 12% 7% 7% 40% 5% 5% 8% 1%
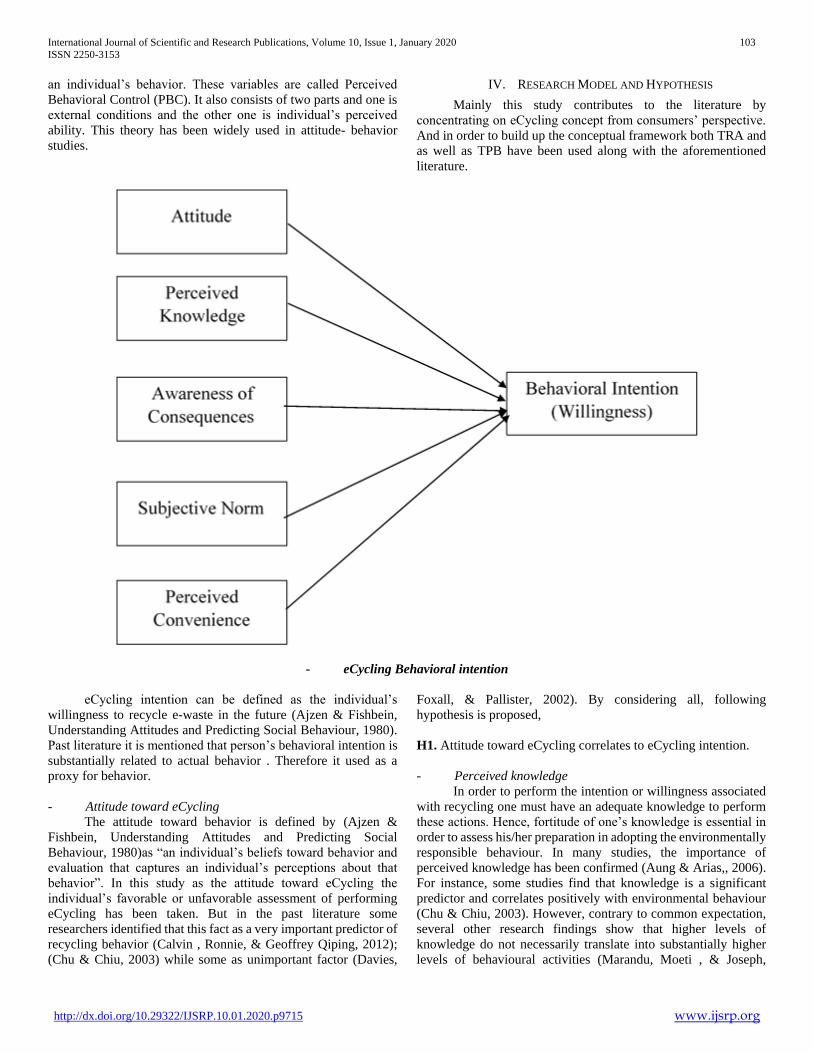
International Journal of Scientific and Research Publications, Volume 10, Issue 1, January 2020 103
ISSN 2250-3153
http://dx.doi.org/10.29322/IJSRP.10.01.2020.p9715 www.ijsrp.org
an individual’s behavior. These variables are called Perceived
Behavioral Control (PBC). It also consists of two parts and one is
external conditions and the other one is individual’s perceived
ability. This theory has been widely used in attitude- behavior
studies.
IV. RESEARCH MODEL AND HYPOTHESIS
Mainly this study contributes to the literature by
concentrating on eCycling concept from consumers’ perspective.
And in order to build up the conceptual framework both TRA and
as well as TPB have been used along with the aforementioned
literature.
- eCycling Behavioral intention
eCycling intention can be defined as the individual’s
willingness to recycle e-waste in the future (Ajzen & Fishbein,
Understanding Attitudes and Predicting Social Behaviour, 1980).
Past literature it is mentioned that person’s behavioral intention is
substantially related to actual behavior . Therefore it used as a
proxy for behavior.
- Attitude toward eCycling
The attitude toward behavior is defined by (Ajzen &
Fishbein, Understanding Attitudes and Predicting Social
Behaviour, 1980)as “an individual’s beliefs toward behavior and
evaluation that captures an individual’s perceptions about that
behavior”. In this study as the attitude toward eCycling the
individual’s favorable or unfavorable assessment of performing
eCycling has been taken. But in the past literature some
researchers identified that this fact as a very important predictor of
recycling behavior (Calvin , Ronnie, & Geoffrey Qiping, 2012);
(Chu & Chiu, 2003) while some as unimportant factor (Davies,
Foxall, & Pallister, 2002). By considering all, following
hypothesis is proposed,
H1. Attitude toward eCycling correlates to eCycling intention.
- Perceived knowledge
In order to perform the intention or willingness associated
with recycling one must have an adequate knowledge to perform
these actions. Hence, fortitude of one’s knowledge is essential in
order to assess his/her preparation in adopting the environmentally
responsible behaviour. In many studies, the importance of
perceived knowledge has been confirmed (Aung & Arias,, 2006).
For instance, some studies find that knowledge is a significant
predictor and correlates positively with environmental behaviour
(Chu & Chiu, 2003). However, contrary to common expectation,
several other research findings show that higher levels of
knowledge do not necessarily translate into substantially higher
levels of behavioural activities (Marandu, Moeti , & Joseph,

International Journal of Scientific and Research Publications, Volume 10, Issue 1, January 2020 104
ISSN 2250-3153
http://dx.doi.org/10.29322/IJSRP.10.01.2020.p9715 www.ijsrp.org
2010). Therefore, the following hypothesis is proposed regarding
Perceived knowledge:
H2. Perceived knowledge correlates to eCycling intention.
- Awareness of consequences
In many observed studies Anxieties for the environment is
perceived to be one of the important encouragers of recycling
behavior. In this study, awareness of consequences is defined as
the individual’s awareness of environmental consequences when
the individual behaves in a certain way. There are contradictions
in recycling literature about how awareness of consequences
influences behavioral intentions.
Although, numerous studies have confirmed that awareness
of consequences and the environmental concerns associated with
recycling positively predict recycling intentions (Calvin , Ronnie,
& Geoffrey Qiping, 2012) (Tonglet, Phillips, & Read, “Using the
theory of planned behaviour to investigate the determinants of
recycling behaviour: a case study from Brixworth, UK”,
2004)found a negative relationship between awareness and
intentions. However, the empirical studies focus on eCycling find
that awareness of environmental consequences is a positive
significant predictor of eCycling behavior such as paying for green
electronics. Hence, the following hypothesis is proposed regarding
the awareness of consequences:
H3. Awareness of consequences correlates to eCycling intention.
- Subjective norms
A subjective norm can be defined as social pressure and it
is a function of the perceived expectations by other individuals or
groups who are important or close to a person, and that person’s
motivation to comply with these expectations (Ajzen & Fishbein,
Understanding Attitudes and Predicting Social Behaviour, 1980).
That means the pressure from peers, family and neighbors has a
positive effect on behavior of recycling. Past literature also stated
that this is one of the vital factor in motivating recycling behavior.
(Oskamp, Harrington , Edwards, & Sherw, 1991) (Sidique, Lupi,
& Joshi, 2010)
H4. Subjective norms correlates to eCycling behavior.
- Perceived convenience
The number of expected recycling site visits increased
when recycling was considered a convenient activity (Sidique,
Lupi, & Joshi, 2010). Time, space and the perceived ease of an
individual in managing waste can be considered as the
convenience (Tonglet, Phillips, & Bates , “Determining the drivers
for householder pro-environmental behaviour: waste minimisation
compared to recycling”, (2004b)).
H5. Perceived convenience correlates to eCycling intention.
V. METHODOLOGY
4.1 population
In order to conduct the research university students have
been taken as the subject population because they potentially
respond differently from non-student consumers and they are an
important group of consumers (Peterson, 2001)
According to (Carlson, 1971)“students are ‘unfinished’
personalities”. Therefore, they differ from non-students based on
number of specific psychological dimensions and as well as
behavioral dimensions. Another fact is that today’s university
students are rapidly changing and they are very nontraditional.
And also “college students are likely to have less-crystallized
attitudes, less-formulated senses of self, stronger cognitive skills,
stronger tendencies to comply with authority, and more unstable
peer group relationships” (Sears, 1986)and they are more
homogeneous than non-students (Calder, et al., 1981). Therefore,
this research investigates the determinants of eCycling behavior
using university students as subjects. Regardless of the limitation,
this study executes students as an important group to sample
because they are the representatives of future generation that is
likely to use technology and better understanding them allows
better preparation for how to develop attitudes about eCycling.
Finally, university students can be taken as a representation of all
consumers because past literature also suggests that university
students’ behavior has an impact on the general public and broader
humanity (Calvin , Ronnie, & Geoffrey Qiping, 2012) (Kelly,
Mason, Leiss , & Ganesh, 2006).
Considering all, people need a better understanding of
consumer behavior with e-waste to reduce e-waste and its
potential threat to humanity and the environment. This paper
examines the determinants of eCycling intention using university
students as the subject population.
4.2 Questionnaire Design and Data Collection
The questionnaire used was designed with reference to the
recycling literature and the TPB theoretical framework (Tonglet,
Phillips, & Read, “Using the theory of planned behaviour to
investigate the determinants of recycling behaviour: a case study
from Brixworth, UK”, (2004a)) (Sidique, Lupi, & Joshi, 2010). In
order to test the theoretical model proposed, the questionnaire was
conducted among students at the University of Kelaniya, Sri
Lanka. The questionnaire included questions about the
respondents’ eCycling willingness (eCycling Behavioral
intention), Attitude toward eCycling, Subjective norms,
Awareness of consequences, Perceived convenience, Perceived
knowledge. The questionnaire also contained questions asking
demographic information of the respondents. The dependent
variable and all the independent variables are measured using a
seven-point Likert-type scale with endpoints “Strongly Disagree=
1” and “Strongly Agree=7”.
To enhance internal validity, pre-testing was conducted to
modify the questionnaire before launching formally. Thirty copies
of the questionnaire were randomly distributed in this pilot study.
The main data collection was conducted in January 2017, during
with 255 questionnaires were distributed in the university. 245
completed and valid questionnaires (response rate 96%) were
returned.

International Journal of Scientific and Research Publications, Volume 10, Issue 1, January 2020 105
ISSN 2250-3153
http://dx.doi.org/10.29322/IJSRP.10.01.2020.p9715 www.ijsrp.org
This research was a preliminary study to gather data and
test the constructs for recycling e-waste in light of previous
research findings. In this study, SPSS software was used to
evaluate data.
VI. RESULTS OF THE STUDY
The main purpose of this study was to analyze the factors
that influence eCycling intention. In order to analyze the data,
researcher has used the regression analysis. As it proves all the
assumptions of regression analysis (Multicollinearity,
Autocorrelation, Homoscedasticity, Normality) researcher has
continued with the analysis. According to Table 01 all the factors
i.e. Attitude toward eCycling, Subjective norms, Awareness of
consequences, Perceived convenience, Perceived knowledge are
significantly correlated to the dependent variable, eCycling
willingness (eCycling Behavioral intention).
Among them, Perceived Convenience has the highest
correlation with Behavioral Intention (Willingness) to eCycling
which the value is 0.414. Perceived knowledge has the next
highest correlation which is 0.302 and other 3 variables Attitude,
Awareness of consequences, Subjective norms have a positive
correlation of 0.268, 0.288 and 0.260 respectively. This indicates
that all the five factors have a moderate positive association with
Behavioral Intention (Willingness) to eCycling and association of
all the five factors are significant under the 5% significant level.
Table 1:
Correlation analysis
A B C D E F
A Pearson Correlation 1 .293** .569** -.080 .268** .132*
Sig. (2-tailed) .000 .000 .105 .000 .019
N 245 245 245 245 245 245
B Pearson Correlation .293** 1 .332** .543** .302** .462**
Sig. (2-tailed) .000 .000 .000 .000 .000
N 245 245 245 245 245 245
C Pearson Correlation .569** .332** 1 -.015 .288** .232**
Sig. (2-tailed) .000 .000 .407 .000 .000
N 245 245 245 245 245 245
D Pearson Correlation -.080 .543** -.015 1 .260** .493**
Sig. (2-tailed) .105 .000 .407 .000 .000
N 245 245 245 245 245 245
E Pearson Correlation .268** .302** .288** .260** 1 .414**
Sig. (2-tailed) .000 .000 .000 .000 .000
N 245 245 245 245 245 245
F Pearson Correlation .132* .462** .232** .493** .414** 1
Sig. (2-tailed) .019 .000 .000 .000 .000
N 245 245 245 245 245 245
. Correlation is significant at the 0.05 level (2-tailed).
A – Attitude
B – Perceived knowledge
C – Awareness of consequences
D – Subjective norms
F – Perceived convenience
E – Behavioral intention (Willingness)
Multiple Regression Analysis
Multiple regression allows to determine the overall fit which means the variance explained of the model and the relative
contribution of each of the factors to the total variance explained.
Tables 02 explains how well the regression model fits the data.
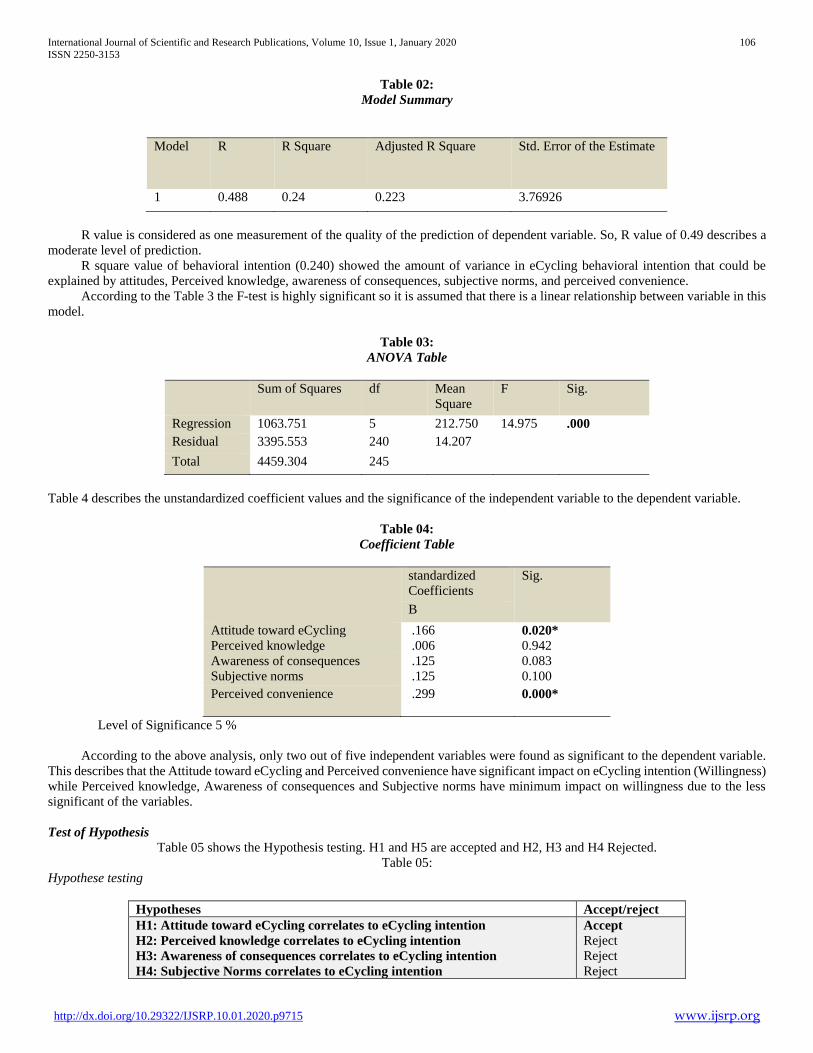
International Journal of Scientific and Research Publications, Volume 10, Issue 1, January 2020 106
ISSN 2250-3153
http://dx.doi.org/10.29322/IJSRP.10.01.2020.p9715 www.ijsrp.org
Table 02:
Model Summary
Model R R Square Adjusted R Square Std. Error of the Estimate
1 0.488 0.24 0.223 3.76926
R value is considered as one measurement of the quality of the prediction of dependent variable. So, R value of 0.49 describes a
moderate level of prediction.
R square value of behavioral intention (0.240) showed the amount of variance in eCycling behavioral intention that could be
explained by attitudes, Perceived knowledge, awareness of consequences, subjective norms, and perceived convenience.
According to the Table 3 the F-test is highly significant so it is assumed that there is a linear relationship between variable in this
model.
Table 03:
ANOVA Table
Sum of Squares df Mean
Square
F Sig.
Regression 1063.751 5 212.750 14.975 .000
Residual 3395.553 240 14.207
Total 4459.304 245
Table 4 describes the unstandardized coefficient values and the significance of the independent variable to the dependent variable.
Table 04:
Coefficient Table
standardized
Coefficients
Sig.
B
Attitude toward eCycling
Perceived knowledge
.166
.006
0.020*
0.942
Awareness of consequences
Subjective norms
.125
.125
0.083
0.100
Perceived convenience
.299 0.000*
Level of Significance 5 %
According to the above analysis, only two out of five independent variables were found as significant to the dependent variable.
This describes that the Attitude toward eCycling and Perceived convenience have significant impact on eCycling intention (Willingness)
while Perceived knowledge, Awareness of consequences and Subjective norms have minimum impact on willingness due to the less
significant of the variables.
Test of Hypothesis
Table 05 shows the Hypothesis testing. H1 and H5 are accepted and H2, H3 and H4 Rejected.
Table 05:
Hypothese testing
Hypotheses Accept/reject
H1: Attitude toward eCycling correlates to eCycling intention
H2: Perceived knowledge correlates to eCycling intention
H3: Awareness of consequences correlates to eCycling intention
H4: Subjective Norms correlates to eCycling intention
Accept
Reject
Reject
Reject
International Journal of Scientific and Research Publications, Volume 10, Issue 1, January 2020 107
ISSN 2250-3153
http://dx.doi.org/10.29322/IJSRP.10.01.2020.p9715 www.ijsrp.org
H5: Perceived Convenience correlates to eCycling intention
Accept
VII. DISCUSSIONS AND CONCLUSIONS
The TPB provided a useful foundation in explaining
recycling behaviour. Attitudes and subjective norms significantly
correlated with behavioral intention. This finding was consistent
with those empirical studies in related areas, including those of
Chen and Tung (2010), (Oom Do Valle, Rebelo, Reis , &
Menezes, 2005), and Cheung et al. (1999). The additional
measures of Perceived knowledge, awareness of consequences,
and Perceived convenience were included in the model; these
variables were also statistically significant in explaining the
behavioural intention of recycling behaviour. The current study’s
result regarding Perceived convenience was consistent with the
findings by (Tonglet, Phillips, & Read, “Using the theory of
planned behaviour to investigate the determinants of recycling
behaviour: a case study from Brixworth, UK”, (2004a)).
This study gives insightful information to facilities
management professionals as regards shaping a more user-friendly
and convenient recycling scheme to fulfil the social responsibility
for environmental protection. The results suggested that each of
the five predictors – Attitude, Perceived knowledge, Awareness of
consequences, Subjective Norms, Perceived Convenience –
contributed approximately 25 per cent of R2 in explaining
behavioral intention. However, the contributions of all the
variables were comparatively low. These findings implied that the
key challenges and considerations for practitioners about the
design and implementation of eCycling schemes.
This study developed a model to identify the determinants
of eCycling intention vis-a `-vis eCycling activities in university
in Sri Lanka. The results showed that out of five critical factors
including eCycling intention were less influenced by only attitude,
and Perceived convenience and that each of those five factors
correlated positively with recycling intentions. This sheds light for
facilities managers on the design and implementation of eCycling
schemes in university.
REFERENCES
[1] ATSDR, A. f. (2012). Toxicoloigcal profi le for chromium, Atlanta, GA: US . . Department of Health and Human Services, Public Health Service.
[2] Ajzen, I. (1991). “The theory of planned behaviour”. Organizational Behaviour and Human Decision Processes, 50, 170-211.
[3] Ajzen, I., & Fishbein, M. (1980). Understanding Attitudes and Predicting Social Behaviour. Englewood Cliffs, NJ.: Prentice Hall.
[4] Aung , M., & Arias,, M. (2006). "Examining waste management in San Pablo del Lago, Ecuador: a behavioral framework,". Management of Environmental Quality: An International Journal, 17(6), 740-752.
[5] Borthakur, Anwesha, Sinha, & Kunal. (2013). Electronic Waste Management in India: A Stakeholder’s Perspective. Electronic Green Journal, 1(36).
[6] Calder, B., Philips, L., & Tybout, A. (1981). “Designing research for application”. Journal of Consumer Research, 8(2), 197-207.
[7] Calvin , W., Ronnie, C., & Geoffrey Qiping, S. (2012). “Recycling attitude and behaviour in university campus: a case study in Hong Kong”. Facilities, 30(1), 630-646.
[8] Carlson, R. (1971). “Where is the person in personality research?”. Psychological Bulletin, 75(3), 203-219.
[9] Chu , P. Y., & Chiu, J. F. (2003). “Factors influencing household waste recycling behavior: test of an integrated model”. Journal of Applied Social Psychology, 33(3), 604-626.
[10] Chu, P.-Y., & Chiu, J.-F. (2003). “Factors Influencing Household Waste Recycling Behaviour: Test of and Integrated Model,”. Journal of Applied Social Psychology, 33(3), 604-626.
[11] Coalition, T. B. (2002). Exporting harm: The high-tech trashing of Asia. Seattle, WA: Basel Action Network.
[12] Cui, J., & Eric, F. (2003). Mechanical recycling of waste electric and electronic equipment:a review . Journal of Hazardous Materials, 243–263.
[13] Davies, J., Foxall, G. R., & Pallister, J. (2002). “Beyond the intention-behaviour mythology: an integrated model of recycling”. Market Theory, 2(1), 29-113.
[14] Environment, (. N. (1989). Basel convention on the control of transboundary movements of hazardous waste and their disposal. United Nations Environment Programme.
[15] E-waste: Inventory assessment manual United Nations Environmental Programme. (2007). In Division of Technology, Industry and Economics, International Environmental Technology Centre. Osaka, Japan: (UNEP), United Nations Environment Programme.
[16] Fu , J., Zhou , Q., & Liu , J. (2008). High levels of heavy metals in rice (Oryza sativa L.) from a typical E-waste recycling area in southeast China and its potential risk to human health, Chemosphere. 1269–1275.
[17] Kelly, T., Mason, I., Leiss , M., & Ganesh. (2006). “University community responses to on-campus resource recycling”. Resources, Conservation and Recycling, 47(1), 42-55.
[18] Largo-Wight, E., Bian, H., & Lange, L. (2012). “An empirical test of an expanded version of the theory of planned behavior in predicting recycling behavior on campus”. American Journal of Health Education, 43(2), 66-73.
[19] Mallawarachchi, H., & Karunasena, G. (2012). Electronic and electrical waste management in Sri Lanka : suggestions for national policy enhancements. Resources, Conservation and Recycling, 68, 44-53.
AUTHORS
First Author – K. S. H. Sarathchandra, Lecturer (Probationary),
Departemnt of Commerce & Financial Management,University
of Kelaniya
Second Author – H. A. H. Hettiarachchi, Senior Lecturer,
Departemnt of Commerce & Fincnail Management, University of
Kelaniya

International Journal of Scientific and Research Publications, Volume 10, Issue 1, January 2020 108
ISSN 2250-3153
http://dx.doi.org/10.29322/IJSRP.10.01.2020.p9716 www.ijsrp.org
Assessment of Heavy Metals Concentration in
Agriculture Soil of Kolfe Area, Addis Ababa, Ethiopia
Nega Fikru Alemu1,2, Yang Changming*, Yang Yang1
* Department, Institute Name
** Department, Institute Name, if any 1Tongji University, UN Environment-Tongji Institute of Environment for Sustainable Development (IESD): College of Environmental Science and
Engineering.Tongji University, Shanghai 200092, P.R. China. * Corresponding Author:Tongji University, Email: [email protected]; Tel +8618917692875
2Ministry of Inovvation and Technology, Addis Ababa 2790, F.D.R. Ethiopia
DOI: 10.29322/IJSRP.10.01.2020.p9716
http://dx.doi.org/10.29322/IJSRP.10.01.2020.p9716
Abstract- This research evaluated the concentration and
distribution of heavy metals (Chromium (Cr), Lead (Pb), &
Cadmium (Cd)) in the vegetable field in the Kolfe area, Addis
Ababa. Soil samples are tested for pH and heavy metals. Heavy
metals in the soil are higher than the earlier report [1]. However,
concentrations of heavy metal were observed (Cr > Pb >Cd), mean
concentrations of heavy metal Cr, Cd and Pb were 274.83 mg
kg−1, 3.09 mg kg−1, and 29.83 mg kg−1, respectively. Overall,
some concentrations of heavy metal (Cr & Cd) are higher than the
safe limit. Hence, the soils studied indicate that vegetable
cultivation in the area of study can lead to health and
environmental problems. In terms of health and safety, soil
pollution and toxicity, heavy metal sources are discussed.
Index Terms- Soil, Heavy metals, Soil Pollution
I. INTRODUCTION
ue to the availability of pollutants in the soil, soil
contamination is natural and inorganic [2]. Contaminants
from heavy metal soil cannot be biodegraded and would cause
harm to the human body through the food chain bioaccumulation
[2-8]. Arsenic (As), cadmium (Cd), lead (Pb), copper (Cu), nickel
(Ni), chromium (Cr) and zinc (Zn) are heavy metals. An element's
available concentration in the soil is an estimate of the fraction of
that element that is present either as free ions, soluble complexes
or in readily absorbable forms [9]. The maximum heavy metal
content in the soil is the estimate of the concentrations of mineral-
derived elements in the geological parent material on which the
soil has formed and contributions from a wide range of potential
sources of contamination. The causes of heavy metal
contamination are the airborne absorption of aerosol particles (<
30 mm in diameter), raindrops containing heavy metals or gaseous
types of elements, direct applications of agricultural fertilizers,
agrichemicals and various organic materials like sewage sludge’s,
animal manures, food waste and compost [2, 9].
The level of concentration of heavy metals in the soil has
an adverse effect on soil quality and biological functions. Heavy
metals such as Lead (Pb) are largely insoluble heavy metal soil
[10] , which can undergo a complex phosphate and carbonate
reaction. When Pb is present in the soil, growth inhibition can
affect the plant by inhibiting enzyme activity, changes in
membrane permeability, and impaired photosynthesis [11, 12].
Plants and plants eaten by animals and humans will absorb Pb,
which is a significant human health problem [13]. Cd occurs in
agricultural fields, of course. In addition, the use of phosphate
fertilizers and sewage sludge, dumping of mine spills or tailings,
and industrial discharge are major causes of soil cadmium
dispersion. Cd is a mobile component in soils that can be easily
absorbed by roots and transported to shoots of plants [14]. High
levels of Cd induce phytotoxicity by decreasing the absorption of
nutrients, inhibiting photosynthesis, inducing lipid peroxidation,
and altering the antioxidant process and membrane functioning
[15]. Cd can be adsorbed from soil and water by plants. Excess
consumption of Cd affects human health, can primarily cause
kidney damage, and can cause adverse health effects on
respiratory, cardiovascular, and musculoskeletal systems [10].
Global cancer research organizations have listed Chromium Cr
(VI) as one of the human carcinogens [16]. Chromium (Cr)
contamination is primarily caused by industry such as mining and
smelting industries [17]. Cr is usually found in the forms of Cr
(III) and Cr (VI) in the natural environment. Cr (III) can control
insulin and blood glucose levels as one of the important trace
elements of a mammal [18]. Cr (III) primarily exists in the form
of Cr (OH)3 or Cr2O, and a complex can be easily produced and
stable in the sediment. The toxicity of Cr (VI) is 100 times greater
than that of Cr (III). Long-term human skin exposure to Cr (VI)
wastewater is confirmed to be the cause of dermatitis and eczema.
And Cr (VI) inhalation can cause sneezing, running nose,
nosebleeds, ulcers, and even damage to the kidneys and liver.
Cr(VI) is detrimental to the human circulatory system or even
threatens human life in vital situations [19]. In water and soil, Cr
(VI) was highly mobile [20].
Contamination with heavy metals is a major problem
worldwide; the problem in a country like China is very serious.
One-sixth of China's cultivated land was estimated to have been
contaminated by heavy metals [21, 22]. According to the
Ethiopian Public Health Institute, over 2,000 factories are based in
the capital city of Ethiopia and about 90% of the industries spill
untreated effluent into the river network [23]. The two main rivers
are used for irrigation of urban farms and contribute about 60% [1,
24]. The present study showed that due to significantly rapid urban
D
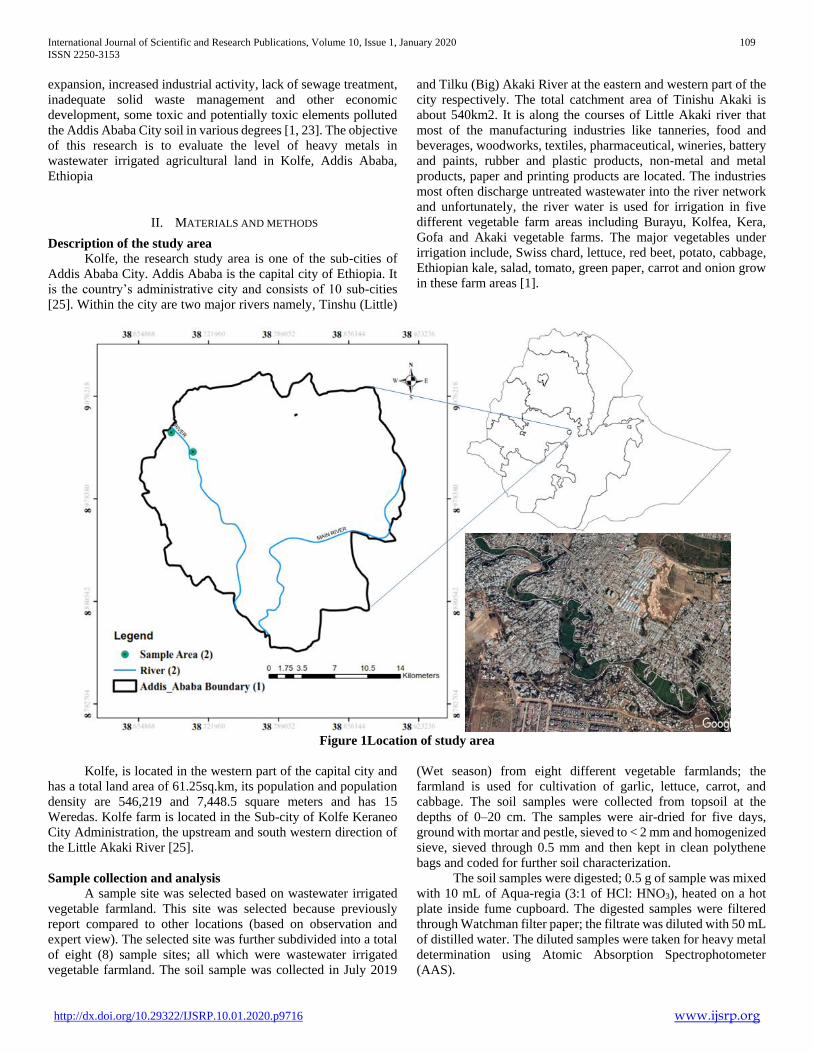
International Journal of Scientific and Research Publications, Volume 10, Issue 1, January 2020 109
ISSN 2250-3153
http://dx.doi.org/10.29322/IJSRP.10.01.2020.p9716 www.ijsrp.org
expansion, increased industrial activity, lack of sewage treatment,
inadequate solid waste management and other economic
development, some toxic and potentially toxic elements polluted
the Addis Ababa City soil in various degrees [1, 23]. The objective
of this research is to evaluate the level of heavy metals in
wastewater irrigated agricultural land in Kolfe, Addis Ababa,
Ethiopia
II. MATERIALS AND METHODS
Description of the study area
Kolfe, the research study area is one of the sub-cities of
Addis Ababa City. Addis Ababa is the capital city of Ethiopia. It
is the country’s administrative city and consists of 10 sub-cities
[25]. Within the city are two major rivers namely, Tinshu (Little)
and Tilku (Big) Akaki River at the eastern and western part of the
city respectively. The total catchment area of Tinishu Akaki is
about 540km2. It is along the courses of Little Akaki river that
most of the manufacturing industries like tanneries, food and
beverages, woodworks, textiles, pharmaceutical, wineries, battery
and paints, rubber and plastic products, non-metal and metal
products, paper and printing products are located. The industries
most often discharge untreated wastewater into the river network
and unfortunately, the river water is used for irrigation in five
different vegetable farm areas including Burayu, Kolfea, Kera,
Gofa and Akaki vegetable farms. The major vegetables under
irrigation include, Swiss chard, lettuce, red beet, potato, cabbage,
Ethiopian kale, salad, tomato, green paper, carrot and onion grow
in these farm areas [1].
Figure 1Location of study area
Kolfe, is located in the western part of the capital city and
has a total land area of 61.25sq.km, its population and population
density are 546,219 and 7,448.5 square meters and has 15
Weredas. Kolfe farm is located in the Sub-city of Kolfe Keraneo
City Administration, the upstream and south western direction of
the Little Akaki River [25].
Sample collection and analysis
A sample site was selected based on wastewater irrigated
vegetable farmland. This site was selected because previously
report compared to other locations (based on observation and
expert view). The selected site was further subdivided into a total
of eight (8) sample sites; all which were wastewater irrigated
vegetable farmland. The soil sample was collected in July 2019
(Wet season) from eight different vegetable farmlands; the
farmland is used for cultivation of garlic, lettuce, carrot, and
cabbage. The soil samples were collected from topsoil at the
depths of 0–20 cm. The samples were air-dried for five days,
ground with mortar and pestle, sieved to < 2 mm and homogenized
sieve, sieved through 0.5 mm and then kept in clean polythene
bags and coded for further soil characterization.
The soil samples were digested; 0.5 g of sample was mixed
with 10 mL of Aqua-regia (3:1 of HCl: HNO3), heated on a hot
plate inside fume cupboard. The digested samples were filtered
through Watchman filter paper; the filtrate was diluted with 50 mL
of distilled water. The diluted samples were taken for heavy metal
determination using Atomic Absorption Spectrophotometer
(AAS).

International Journal of Scientific and Research Publications, Volume 10, Issue 1, January 2020 110
ISSN 2250-3153
http://dx.doi.org/10.29322/IJSRP.10.01.2020.p9716 www.ijsrp.org
Soil pollution indices
The geo-accumulation index (I-geo) and Contamination
factor (CF) were employed to assess the pollution of metals in the
soil of Kolfe area.
Geo-accumulation index: The geo-accumulation index
(𝐼𝑔𝑒𝑜) introduced by Muller [26]. 𝐼𝑔𝑒𝑜 Index is used to assess
metal pollution in sediments or soil. 𝐼𝑔𝑒𝑜 Can be calculated by Eq.
(1)
𝐼𝑔𝑒𝑜 = log 2 (𝐶𝑛
1.5 × 𝐵𝑛) (1)
Where 𝐶𝑛 = the concentration of heavy metal (n) in the
soil, 𝐵𝑛 = is the background value for heavy metal (n) and Factor
1.5 indicates the variation of background values for heavy metal
in the environment [27, 28] The classes of soil pollution were
identified in terms of Igeo, Unpolluted (Igeo< 0), unpolluted to
moderately polluted (Igeo= 0~1), moderately polluted (Igeo=
1~2), moderately to strongly polluted (Igeo= 2~3), heavily
polluted (Igeo= 3~4), strongly to extremely polluted (Igeo>5) [28-
30].
Average contamination factor (CF): Contamination
Factor is the ratio obtained by dividing the concentration of a
specific heavy metal in the soil sample by the background value
of that metal. It can be calculated by Eq. (2)
𝐶𝐹 𝐶𝑚
𝐶𝑏 (2)
Where, Cm is the concentration of heavy metals in soils
sample, Cb is the reference of background value for heavy metals
(permissible limit), the value of Cb can be measured either in
precivilization soil or sediments of the study area or taken from
the literature and the value of Cb for Cr, Cd and Pb was considered
as 100, 0.8 and 80 mg kg−1, respectively [31, 32]. Table 1. Shows
different categories of soil contamination class in terms of CF.
Table 1.Classification based on contamination factor (CF) [31]
CFs Value Scale Classification
≤1 Uncontaminated soil
1-2.0 Suspected
2-3.5 Slight
3.5-8 Moderate
8-27.0 Severe
≥ 27 Extremely
III. STATISTICAL ANALYSIS
The levels of different heavy metals in the soil were
measured using a one-way analysis of ANOVA. Furthermore,
Pearson correlation was used to determine the heavy metals inter-
element relationship in the soil. The mean and standard deviations
of metal concentrations, CF and Igeo in the soil were calculated.
Data and Figure were analysed using OriginPro and SPSS
software.
IV. RESULTS AND DISCUSSION
Results
The soil heavy metal content in the soil samples is shown
in Table 1 and Figure 2. Figure 3 indicates the average heavy metal
concentration of the three heavy metals. Results are expressed as
a mean and standard sample deviation.
Table 2 Concentration of Heavy Metals at Different Sample Site
Sample
Name
Co-ordination Metal concentration mg 𝑘𝑔−1
Latitude Longitude Cr Cd Pb pH
1 09°02 ̍40̎ N 038°41̍26̎ E 329.32 1.11 27.21 7.18
2 09°02 ̍15̎ N 038°414̍7 ̎E 312.71 3.14 32.12 7.28
3 09°02 ̍37̎ N 038°41̍39̎ E 322.51 3.92 39.64 7.29
4 09°02̍ 08 ̎N 038°420̍1 ̎E 271.01 2.99 10.11 7.18
5 09°02 ̍22̎ N 038°414̍6 ̎E 312.23 1.18 21.34 7.15
6 09°02 ̍16̎ N 038°414̍6 ̎E 297.45 3.22 34.02 7.23
7 09°02 ̍11̎ N 038°414̍9 ̎E 189.12 4.18 41.01 6.91
8 09°02 ̍12̎ N 038°415̍6 ̎E 164.32 5.01 33.23 7.11
Mean ± SD 274.83-63.42 3.09-1.37 29.83-10.16 7.16-0.12
Range 164.32-329.32 1.11-5.01 10.11-41.01 6.91-7.29
Safe limit 100 0.8 80
The average amounts of the three heavy metals were Cr > Cd > Pb. Figure 2 indicates the distribution of heavy metal in the eight areas.
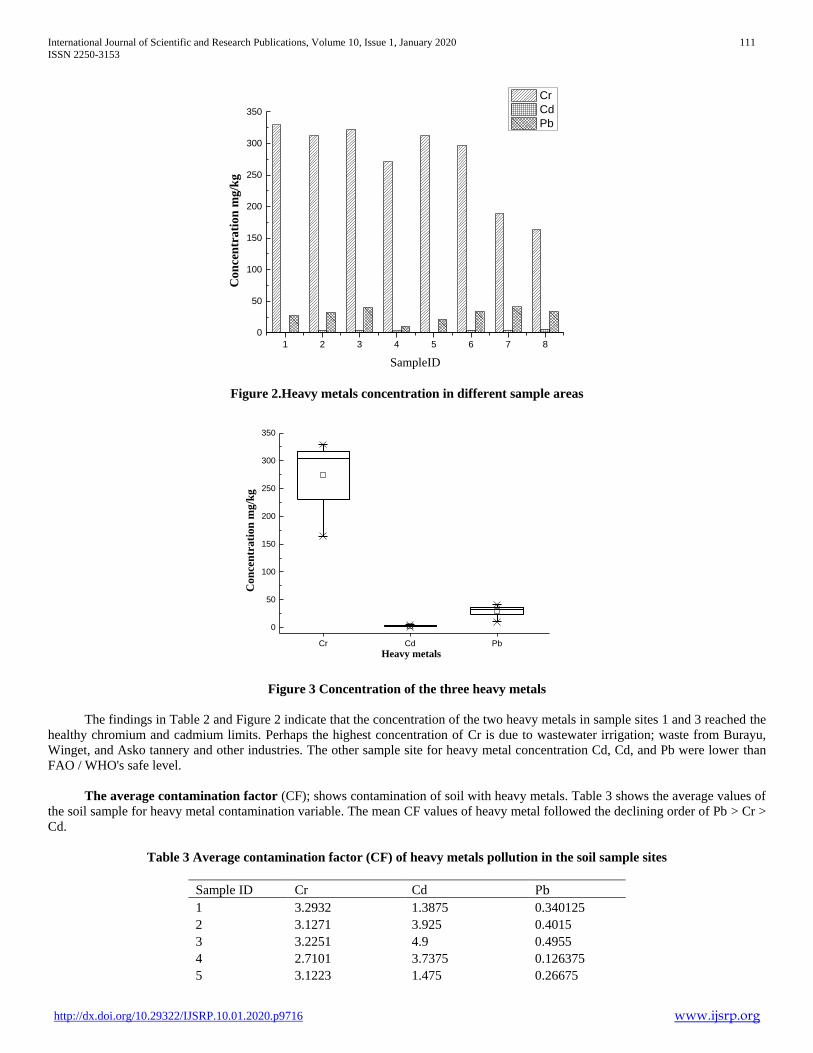
International Journal of Scientific and Research Publications, Volume 10, Issue 1, January 2020 111
ISSN 2250-3153
http://dx.doi.org/10.29322/IJSRP.10.01.2020.p9716 www.ijsrp.org
1 2 3 4 5 6 7 8
0
50
100
150
200
250
300
350
Con
cen
trati
on
mg/k
g
SampleID
Cr
Cd
Pb
Figure 2.Heavy metals concentration in different sample areas
Cr Cd Pb
0
50
100
150
200
250
300
350
Co
nce
ntr
ati
on
mg
/kg
Heavy metals
Figure 3 Concentration of the three heavy metals
The findings in Table 2 and Figure 2 indicate that the concentration of the two heavy metals in sample sites 1 and 3 reached the
healthy chromium and cadmium limits. Perhaps the highest concentration of Cr is due to wastewater irrigation; waste from Burayu,
Winget, and Asko tannery and other industries. The other sample site for heavy metal concentration Cd, Cd, and Pb were lower than
FAO / WHO's safe level.
The average contamination factor (CF); shows contamination of soil with heavy metals. Table 3 shows the average values of
the soil sample for heavy metal contamination variable. The mean CF values of heavy metal followed the declining order of Pb > Cr >
Cd.
Table 3 Average contamination factor (CF) of heavy metals pollution in the soil sample sites
Sample ID Cr Cd Pb
1 3.2932 1.3875 0.340125
2 3.1271 3.925 0.4015
3 3.2251 4.9 0.4955
4 2.7101 3.7375 0.126375
5 3.1223 1.475 0.26675
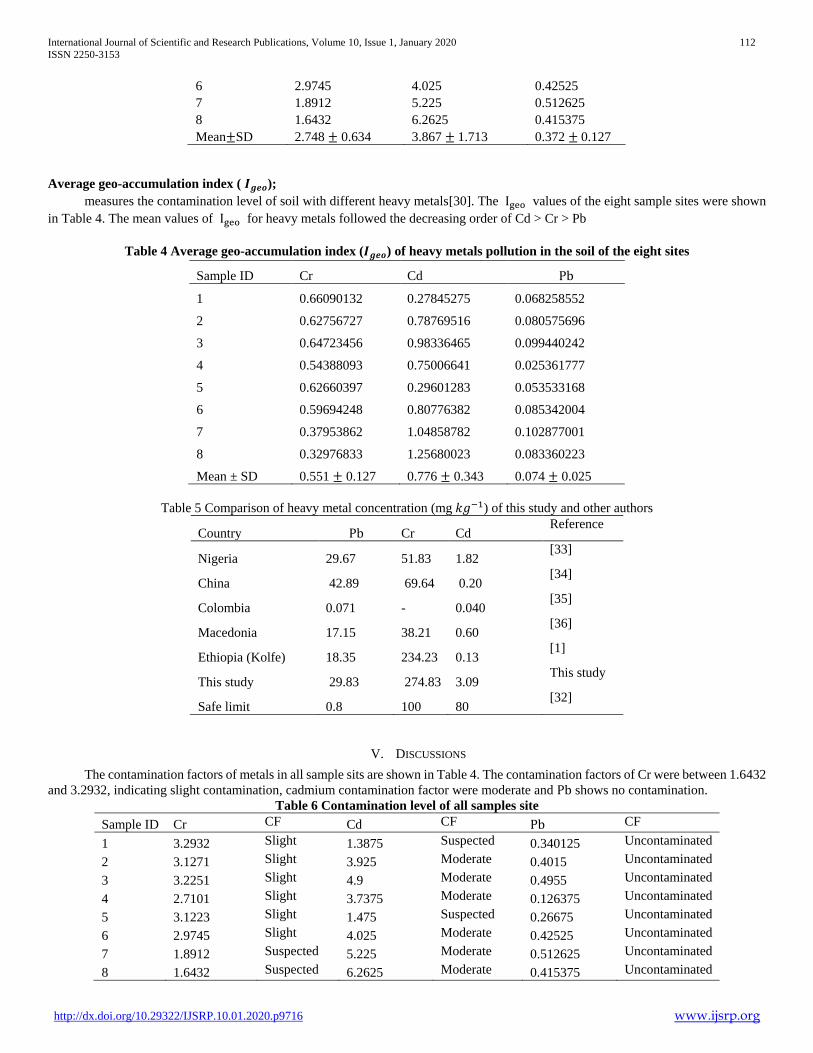
International Journal of Scientific and Research Publications, Volume 10, Issue 1, January 2020 112
ISSN 2250-3153
http://dx.doi.org/10.29322/IJSRP.10.01.2020.p9716 www.ijsrp.org
6 2.9745 4.025 0.42525
7 1.8912 5.225 0.512625
8 1.6432 6.2625 0.415375
Mean±SD 2.748 ± 0.634 3.867 ± 1.713 0.372 ± 0.127
Average geo-accumulation index ( 𝑰𝒈𝒆𝒐);
measures the contamination level of soil with different heavy metals[30]. The Igeo values of the eight sample sites were shown
in Table 4. The mean values of Igeo for heavy metals followed the decreasing order of Cd > Cr > Pb
Table 4 Average geo-accumulation index (𝑰𝒈𝒆𝒐) of heavy metals pollution in the soil of the eight sites
Sample ID Cr Cd Pb
1 0.66090132 0.27845275 0.068258552
2 0.62756727 0.78769516 0.080575696
3 0.64723456 0.98336465 0.099440242
4 0.54388093 0.75006641 0.025361777
5 0.62660397 0.29601283 0.053533168
6 0.59694248 0.80776382 0.085342004
7 0.37953862 1.04858782 0.102877001
8 0.32976833 1.25680023 0.083360223
Mean ± SD 0.551 ± 0.127 0.776 ± 0.343 0.074 ± 0.025
Table 5 Comparison of heavy metal concentration (mg 𝑘𝑔−1) of this study and other authors
Country Pb Cr Cd Reference
Nigeria 29.67 51.83 1.82 [33]
China 42.89 69.64 0.20 [34]
Colombia 0.071 - 0.040 [35]
Macedonia 17.15 38.21 0.60 [36]
Ethiopia (Kolfe) 18.35 234.23 0.13 [1]
This study 29.83 274.83 3.09 This study
Safe limit 0.8 100 80 [32]
V. DISCUSSIONS
The contamination factors of metals in all sample sits are shown in Table 4. The contamination factors of Cr were between 1.6432
and 3.2932, indicating slight contamination, cadmium contamination factor were moderate and Pb shows no contamination.
Table 6 Contamination level of all samples site
Sample ID Cr CF Cd CF Pb CF
1 3.2932 Slight 1.3875 Suspected 0.340125 Uncontaminated
2 3.1271 Slight 3.925 Moderate 0.4015 Uncontaminated
3 3.2251 Slight 4.9 Moderate 0.4955 Uncontaminated
4 2.7101 Slight 3.7375 Moderate 0.126375 Uncontaminated
5 3.1223 Slight 1.475 Suspected 0.26675 Uncontaminated
6 2.9745 Slight 4.025 Moderate 0.42525 Uncontaminated
7 1.8912 Suspected 5.225 Moderate 0.512625 Uncontaminated
8 1.6432 Suspected 6.2625 Moderate 0.415375 Uncontaminated

International Journal of Scientific and Research Publications, Volume 10, Issue 1, January 2020 113
ISSN 2250-3153
http://dx.doi.org/10.29322/IJSRP.10.01.2020.p9716 www.ijsrp.org
Mean±SD 2.748 ± 0.634 Slight 3.867 ± 1.713 Moderate 0.372 ± 0.127 Uncontaminated
CF-contamination factor
Geo-Accumulation Index in Kolfe farm area, the soil was polluted by Cd and Cr. The geo-accumulation index value of Cr was
less than 1; the value shows unpolluted to moderately pollution. Cadmium was also unpolluted to moderately polluted, but in sample
site 7 and 8 the pollution was moderate. No pollution by Lead. Igeo No pollution to slight pollution of all soil samples. The ANOVA
sample analysis presented in Table 7.
Table 7 Pearson correlation and ANOVA analysis of heavy metals in the soil samples
Pearson correlation Cr Cd 𝑃𝑏
Cr 1
Cd -0.72296 1
Pb -0.23699 0.521556 1
ANOVA
P value 0.1146 0.973 0.902
Heavy Metals
Chromium (Cr): The average chromium concentrations
found in the study area were higher than the recommended limit
[32]. The high concentration of chromium in the sample site
indicated the high availability of Cr in the vegetable farming area
for plant uptake.
Cadmium (Cd): The mean Cd concentration results in the
study area were between (1.11-5.01 mg kg−1). The concentration
of Cd contained in all test sites exceeded the permissible limits
(WHO 1996). The high cadmium level may be due to phosphate
fertilizers being used. Cadmium concentrations obtained in this
sample were higher than the appropriate soil limit of 0.8 mg kg−1
[32].
Lead (Pb): Pb levels ranged from 10.11 to 41.01 mg 𝑘𝑔−1.
In this study site, the average concentration of Pb was generally
lower than the safe limits set in soil by [32]. Accumulation of lead
may have been due to the use of some chemicals and
manufacturing activities.
One-way analysis of variance (ANOVA) was made at 95%
confidence level. The results showed that there were significant
differences (p < 0.05) in the concentrations of the heavy metals
Cr, Cd and Pb among the analysed soil samples while there was
no significant difference (p > 0.05) in the concentrations of Pb. In
general, the mean concentration of heavy metals in soils collected
from all sampling site decreased in the order of Cr > Pb > Cd.
VI. CONCLUSION
Following the collected sample analysis the concentrations
of heavy metals in soil samples used for cultivation of vegetable
including Swiss chard, lettuce, red beet, potato, cabbage,
Ethiopian kale, salad, tomato, green paper, carrot and onion
Cabbage, Onion, lettuce, Habsha Gomen & carrot area of Kolfe
farm were determined. The analysis indicated that the soils serve
as the potential source of the heavy metals in the environment and
the concentration of the heavy metals Pb in all sample site are far
below the maximum tolerable levels set by FAO/WHO however,
the values of Cr and Cd were higher than maximum tolerable
levels set by the country. In general, the results also show that the
level of contamination of the soils by the heavy metals is
moderately contaminated at present and the soil is polluted by
toxic heavy metals (Cd and Pb). On the other hand however, the
increase in concentration of some elemental may be due to long-
term wastewater irrigation, application of various types of
pesticides and fertilizer in the vegetable farming areas. Further
research is needed to analyse the contamination level of heavy
metals in the vegetables and recommend proper soil and
wastewater remediation method to solve the current situation.
REFERENCES
[1] M. Aschale, Y. Sileshi, M. Kelly-Quinn, and D. Hailu, "Pollution assessment of toxic and potentially toxic elements in agricultural soils of the city Addis Ababa, Ethiopia," Bulletin of environmental contamination and toxicology, vol. 98, no. 2, pp. 234-243, 2017. [Online]. Available: https://link.springer.com/content/pdf/10.1007%2Fs00128-016-1975-4.pdf.
[2] S. Chaoua, S. Boussaa, A. El Gharmali, and A. Boumezzough, "Impact of irrigation with wastewater on accumulation of heavy metals in soil and crops in the region of Marrakech in Morocco," Journal of the Saudi Society of Agricultural Sciences, vol. 18, no. 4, pp. 429-436, 2019.
[3] W. Addis and A. Abebaw, "Determination of heavy metal concentration in soils used for cultivation of Allium sativum L.(garlic) in East Gojjam Zone, Amhara Region, Ethiopia," Cogent Chemistry, vol. 3, no. 1, p. 1419422, 2017.
[4] X. Gong et al., "Stabilized nanoscale zerovalent iron mediated cadmium accumulation and oxidative damage of Boehmeria nivea (L.) Gaudich cultivated in cadmium contaminated sediments," Environmental science & technology, vol. 51, no. 19, pp. 11308-11316, 2017.
[5] W. Xue et al., "Nanoscale zero-valent iron coated with rhamnolipid as an effective stabilizer for immobilization of Cd and Pb in river sediments," Journal of hazardous materials, vol. 341, pp. 381-389, 2018. [Online]. Available: https://www.sciencedirect.com/science/article/abs/pii/S0304389417304491?via%3Dihub.
[6] S. Khan, S. Rehman, A. Z. Khan, M. A. Khan, and M. T. Shah, "Soil and vegetables enrichment with heavy metals from geological sources in Gilgit, northern Pakistan," Ecotoxicology and environmental safety, vol. 73, no. 7, pp. 1820-1827, 2010.
[7] S. Muhammad, M. T. Shah, and S. Khan, "Health risk assessment of heavy metals and their source apportionment in drinking water of Kohistan region, northern Pakistan," Microchemical journal, vol. 98, no. 2, pp. 334-343, 2011.
[8] J. Steffan, E. Brevik, L. Burgess, and A. Cerdà, "The effect of soil on human health: an overview," European journal of soil science, vol. 69, no. 1, pp. 159-171, 2018.

International Journal of Scientific and Research Publications, Volume 10, Issue 1, January 2020 114
ISSN 2250-3153
http://dx.doi.org/10.29322/IJSRP.10.01.2020.p9716 www.ijsrp.org
[9] B. J. Alloway, "Sources of heavy metals and metalloids in soils," in Heavy metals in soils: Springer, 2013, pp. 11-50.
[10] S. Satarug, "Dietary cadmium intake and its effects on kidneys," Toxics, vol. 6, no. 1, p. 15, 2018.
[11] B. Pourrut, M. Shahid, C. Dumat, P. Winterton, and E. Pinelli, "Lead uptake, toxicity, and detoxification in plants," in Reviews of Environmental Contamination and Toxicology Volume 213: Springer, 2011, pp. 113-136.
[12] J. Meng, M. Tao, L. Wang, X. Liu, and J. Xu, "Changes in heavy metal bioavailability and speciation from a Pb-Zn mining soil amended with biochars from co-pyrolysis of rice straw and swine manure," Science of the Total Environment, vol. 633, pp. 300-307, 2018.
[13] R. A. Wuana and F. E. Okieimen, "Heavy metals in contaminated soils: a review of sources, chemistry, risks and best available strategies for remediation," Isrn Ecology, vol. 2011, 2011.
[14] H. Yu et al., "Biochar amendment improves crop production in problem soils: a review," Journal of environmental management, vol. 232, pp. 8-21, 2019.
[15] M. Groppa, E. Rosales, M. Iannone, and M. Benavides, "Nitric oxide, polyamines and Cd-induced phytotoxicity in wheat roots," Phytochemistry, vol. 69, no. 14, pp. 2609-2615, 2008. [Online]. Available: Error! Hyperlink reference not valid..
[16] R. P. Farrell, R. J. Judd, P. A. Lay, N. E. Dixon, R. S. Baker, and A. M. Bonin, "Chromium (V)-induced cleavage of DNA: are chromium (V) complexes the active carcinogens in chromium (VI)-induced cancers?," Chemical research in toxicology, vol. 2, no. 4, pp. 227-229, 1989.
[17] M. Knott, "Toxic tannery sludge made as safe as houses," ed: NEW SCIENTIST PUBL EXPEDITING INC 200 MEACHAM AVE, ELMONT, NY 11003, 1996.
[18] Y. Xu and D. Zhao, "Reductive immobilization of chromate in water and soil using stabilized iron nanoparticles," Water research, vol. 41, no. 10, pp. 2101-2108, 2007. [Online]. Available: https://www.sciencedirect.com/science/article/abs/pii/S0043135407001315?via%3Dihub
AUTHORS
First Author – Nega Fikru Alemu, Tongji University, UN
Environment-Tongji Institute of Environment for Sustainable
Development (IESD): College of Environmental Science and
Engineering.Tongji University, Shanghai 200092, P.R. China.
Second Author – Yang Changming
Third Author – Yang Yang, Tongji University, UN
Environment-Tongji Institute of Environment for Sustainable
Development (IESD): College of Environmental Science and
Engineering.Tongji University, Shanghai 200092, P.R. China.
Correspondence Author – Tongji University, Email:
[email protected]; Tel +8618917692875

International Journal of Scientific and Research Publications, Volume 10, Issue 1, January 2020 115
ISSN 2250-3153
http://dx.doi.org/10.29322/IJSRP.10.01.2020.p9717 www.ijsrp.org
Comparing of job satisfaction due to coping of stress
in government and private sector
Shivani Singhvi1, Dr. Shikha Sharma2
1MSc. Clinical Psychology Student, Department of Psychiatry, Geetanjali Medical College & Hospital, Udaipur, Rajasthan, India.
2Assistant Professor, Clinical Psychology, Department of psychiatry, Geetanjali Medical College & Hospital , Udaipur, Rajasthan, India
DOI: 10.29322/IJSRP.10.01.2020.p9717
http://dx.doi.org/10.29322/IJSRP.10.01.2020.p9717
Abstract- The present study is an attempt to examine the stress
coping over job satisfaction in government and private sector.
Background: The rising prevalence of job dissatisfaction is due
to stress in satisfaction of job and here we are measuring how
much a person have stress coping in private and government sector
over job satisfaction. Sample: A purposive sample of 60 teachers
from Udaipur Rajasthan in which 30 are from government sector
and remaining 30 are from private sector. Research design : Two
group survey research design, Tools : Teachers job satisfaction
scale (TJSS) was used to assess the level of job satisfaction and
stress coping resource inventory: a self assessment was used to
assess the level of coping of stress. Result :The positive
correlation has been found between level of stress coping and level
of job satisfaction in both government and private sector teaching
professionals which is highly correlated , as the coping of stress
increases, the level of job satisfaction also increases. Another
finding is that Result shows not identifiable difference in
correlation of level of job satisfaction among government and
private sector working professionals. There is same job
satisfaction in both sectors (government and private sector) the
difference is not found significant. Conclusion: the study found
that level of coping of stress affect the level of job satisfaction in
both government and private sector. This study is not significant
in the second hypothesis that there is identifiable difference in job
satisfaction of government and private sector , this proves that
there is no difference in the job satisfaction in both the sectors
(government and private sector)
Index Terms- Private sector (PS), Government sector (GS),
Teachers job satisfaction scale (TJSS), Coping of stress (COS)
I. SIGNIFICANT OF THE STUDY
oping is defined as the thoughts and behaviors used to
manage the internal and external demands of situations that
are appraised as stressful (Folk man & Moskowitz, 2004; Taylor
& Stanton, 2007)
Stress is a negative emotional experience accompanied by
predictable biochemical, physiological, cognitive and behavioral
changes that are directed either toward altering the stressful event
or accommodating to its effects.
A job is a collection of tasks that can be performed by a
single employee to contribute to the production of some product
or service provided by the organization. By: Herbert G
Hereman
job satisfaction is favorableness towards job and the persons
satisfaction with their home and community life. But this
definition is not correct because there are so many people are not
happy with their work life but they are satisfied with their life. But
we can say that job satisfaction and life satisfaction are related
with each other. Job satisfaction is the attitude of an employee
which results from so many factors related with job such as timing
, work load , wages , supervision , opportunities , employee
interaction , Appreciation, Communication, Coworkers , Fringe
benefits, Job conditions, Nature of the work, Organization,
Personal growth, Policies , Procedures, Promotion opportunities,
Recognition, Security, Supervision etc. Job satisfaction is a
positive attitude a person carries and teachers have a control on
student’s education and students are the future, so that
understanding that in which sector coping of stress is high and as
I am connecting coping of stress with job satisfaction they are
directly proportional to each other[1]
II. STATEMENT OF THE PROBLEM
Comparing job satisfaction due to coping of stress in
government and private sector.
1. Job satisfaction
Job satisfaction is defined as feeling of contentment and
sense of accomplishment with environment which is self-
motivated ,positive and healthy in context of job stability ,career
growth , comfortable work life balance, pay , respect ,research
pursuit time , colleague behavior , library availability etc. which is
result of appraisal that meet one’s job value and basic needs. It
helps in determining at what extent a person likes or dislikes
his/her job
2. Stress coping
Stress is a feeling of emotional or physical tension. It can
come from any event or thought that makes you feel frustrated,
angry, or nervous. and Coping usually involves adjusting to or
tolerating negative events or realities while attempting to maintain
your positive self-image and emotional equilibrium. It occurs in
the context of life changes that is stressful. Psychological stress is
usually associated with negative life changes, such as losing a job
or loved one.
3. Private sector
The private sector is the part of the economy that is run by
individuals and companies for profit and is not state controlled.
Therefore, it encompasses all for-profit businesses that are not
owned or operated by the government.
C

International Journal of Scientific and Research Publications, Volume 10, Issue 1, January 2020 116
ISSN 2250-3153
http://dx.doi.org/10.29322/IJSRP.10.01.2020.p9717 www.ijsrp.org
4. Government sector
The government sector includes all institutional units
whose output is intended for individual and collective
consumption and mainly financed by compulsory payments made
by units belonging to other sectors, and/or all institutional units
principally engaged in the redistribution of national income and
wealth. The General government sector is subdivided into four
subsectors: central government, state government, local
government, and social security funds.
Objectives:
To assess the level of job satisfaction in private sector.
To assess the level of job satisfaction in government
sector.
To assess the level of coping of stress in private sector.
To assess the level of coping of stress in government
sector.
To find out the comparison in job satisfaction due to
coping of stress in private and government sector.
Hypothesis:
H1: There will be significant impact of level of stress
coping over job satisfaction.
H2: There will be identifiable difference in job
satisfaction among private and government sector
Review of literature:
Study of job satisfaction of private sector:
There has been found several earlier studies
by Sinha Deepti on studies of job satisfaction
of the employees of private sector banks in
which describes that Job satisfaction is a
subjective indicator that indicates how
contented an individual feels while
performing his/her duties. In shaping job
expectations, there are economic
considerations (e.g. compensation and
retirement benefits) and occupational and
family considerations (professional
satisfaction, job satisfaction, advancement
opportunities, relocation, etc.)in the private
sector of job area[1]
Another study conducted by Ayesha
Ajmal,Mohsin Bashir Muhammad Abrar,
Muhammad Mahroof Khan,
ShahnawazSaqibin The Effects of Intrinsic
and Extrinsic Rewards on Employee
Attitudes; Mediating Role of Perceived
Organizational Support employees shows
positive response about intrinsic and
extrinsic rewards. On the topic of the job
satisfaction in private sector[2]
Study of job satisfaction in government sector:
Some earlier studies done on job satisfaction
in government sector by the Staff of Sindh
Bureau of Statistics, Planning &
Development Department, Government of
Sindh. Methodology/Sample- measurement
of satisfaction of employee satisfaction
against various facets of their Job, facets like
job security, immediate supervisor’s
behavior, recognition, interpersonal
relations, workload, career growth and
pay/compensation were the factors that the
employees are satisfied with [4]
Another study conducted by Maheshwari
Uma by job satisfaction of municipal
government employees in which proved that
government job is good salary followed by
job security and it describes the satisfaction
and dissatisfaction of the employees and the
higher satisfaction the more effective the
performance[6]
Comparative study of job satisfaction in private and
government sector :
One of the study conducted by Akhtar Naeem
Shafqat in a comparative study of job
satisfaction in public and private school
teachers at secondary level which concluded
job satisfaction refers to the attitudes which
can be positive, favourable attitude and
feelings they have about their job, positive
teaching behavior and considerable
relationship between job satisfaction and
other areas of his/her life. and it shows there
is no significant difference between teachers
job satisfaction in public and private
schools[7]
Another study conducted by Sinha deepti on
Comparative Study of Job Satisfaction of the
Employees of Private & Public Sector Banks
which concluded the causes of satisfaction
and dissatisfaction in both public and private
sector banksin shaping job expectation,
economic consideration and occupation and
family consideration and novel changes
increases productivity [8]
Studies on impact of stress on work:
Study conducted by Usman Bashir &
Muhammad Ramay on impact of stress on
employees job performance in which
bankers are in a great stress such as
overload , role ambiguity ,role conflict
,responsibility of people and other and it
defines that job stress reduces job
performances and the stress is highly
effective in the area of job satisfaction
which includes so many factors[10]
Another study conducted by Sauter ,
Steven, Murphy & R. Lawrence on
organizational risk factors for job stress
which concluded the changing structure of
work in our society and presents empirical
research studies that examine

International Journal of Scientific and Research Publications, Volume 10, Issue 1, January 2020 117
ISSN 2250-3153
http://dx.doi.org/10.29322/IJSRP.10.01.2020.p9717 www.ijsrp.org
organizational factors that appear to
promote or decrease job stress[11]
Studies on stress coping affect on job satisfaction:
Study conducted by Griffith Jayne & Steptoe
Andrew in a study investigation of coping
strategies associated with job stress in
teachers which signed that behavioural
disengagement and suppression of competing
activities are maladaptive responses in a
teaching environment and contributes to job
stress. Coping and social support moderate
the impact of stressors on well‐being and
influence the appraisal of environmental
demands as stressful[12]
Another study conducted by Skaalvik M.
Einar & Skaalvik Sidsel on job satisfaction ,
stress and coping strategies in the teaching
profession which gives or confirmed that the
teachers of different stages in their careers
reported the same source of job satisfaction
and stress and coping strategies and
consequences were differed with age and
their ability of performance[13]
III. MATERIAL AND METHODS
Research design:
Research design provides overall plan for addressing
research question. Here Two Group Survey Research Design is
used to find out coping of stress over job satisfaction in
government and private sector.
Two group survey research design:
Variable Indications
O1 Level of coping of stress
O2 Level of job satisfaction
Variables
Independent variable : Coping of stress
Dependent variable : Level of job satisfaction
Sampling
Target population: Working teaching professionals.
Accessible population: In Udaipur.
Sample size: 60 consecutively selected samples.
Sampling technique: Convenience sampling.
Type of study : Observation type.
Type of data : Secondary data.
Sampling criteria:
Inclusion criteria:
Working professionals in teaching field.
Teachers from government and private sector working in
Udaipur.
Teachers who knows English language.
Teachers who gives the consent for data collection.
Exclusion criteria:
Teachers who don’t know English language.
Retired teaching professionals.
The data has been collected by using following psychological
tools:
Psychological test Developed by Year
Teachers job
satisfaction scale
Y. MUDGIL ,
I.S. MULHAR &
P. BHATIA
1998
Stress Coping
Resource
Inventory: A Self
Assessment
Kenneth B.
Matheny and
Christopher J.
McCarthy
2000
Statistical Analysis:
After finding mean and SD scores; correlation has been
found by using Karl Pearson’s product movement correlation and
significant by using t value.
IV. RESULT:
Table: A1 Mean and SD of stress coping level over job
satisfaction in government sector:
Coping of stress
level
N Mean SD
<1.5 (Below
average
stresscoper)
0 - -
1.5-2.4 (Average
stresscoper)
13 217.15 19.75
2.5-3.4 (Above
average
stresscoper)
16 278.62 16.57
>3.5 (Superior
stresscoper)
1 300 -
Table (A1) shows the mean values of coping of stress level,
and job satisfaction among teaching professionals working in
Udaipur (Rajasthan)
(Mean coping of stress level over job satisfaction in
government sector categorized in <1.5 = 0 ,1.5-2.4 = 217.5 , 2.5-
3.4=278.62 and >3.5 = 300 and SD values of stress level over job
satisfaction in government sector are categorized in <1.5=nil , 1.5-
2.4= 19.75 , 2.5-3.4= 16.57 , >3.5= nil respectively.)
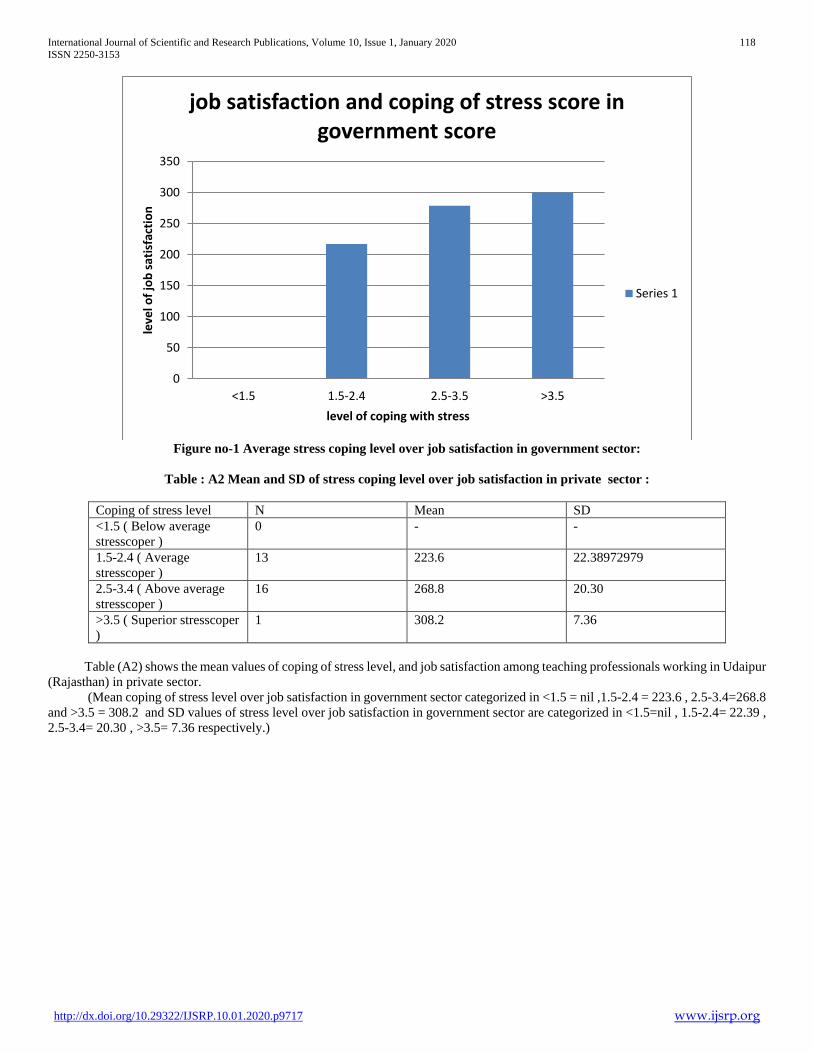
International Journal of Scientific and Research Publications, Volume 10, Issue 1, January 2020 118
ISSN 2250-3153
http://dx.doi.org/10.29322/IJSRP.10.01.2020.p9717 www.ijsrp.org
Figure no-1 Average stress coping level over job satisfaction in government sector:
Table : A2 Mean and SD of stress coping level over job satisfaction in private sector :
Coping of stress level N Mean SD
<1.5 ( Below average
stresscoper )
0 - -
1.5-2.4 ( Average
stresscoper )
13 223.6 22.38972979
2.5-3.4 ( Above average
stresscoper )
16 268.8 20.30
>3.5 ( Superior stresscoper
)
1 308.2 7.36
Table (A2) shows the mean values of coping of stress level, and job satisfaction among teaching professionals working in Udaipur
(Rajasthan) in private sector.
(Mean coping of stress level over job satisfaction in government sector categorized in <1.5 = nil ,1.5-2.4 = 223.6 , 2.5-3.4=268.8
and >3.5 = 308.2 and SD values of stress level over job satisfaction in government sector are categorized in <1.5=nil , 1.5-2.4= 22.39 ,
2.5-3.4= 20.30 , >3.5= 7.36 respectively.)
0
50
100
150
200
250
300
350
<1.5 1.5-2.4 2.5-3.5 >3.5
leve
l of
job
sat
isfa
ctio
n
level of coping with stress
job satisfaction and coping of stress score in government score
Series 1
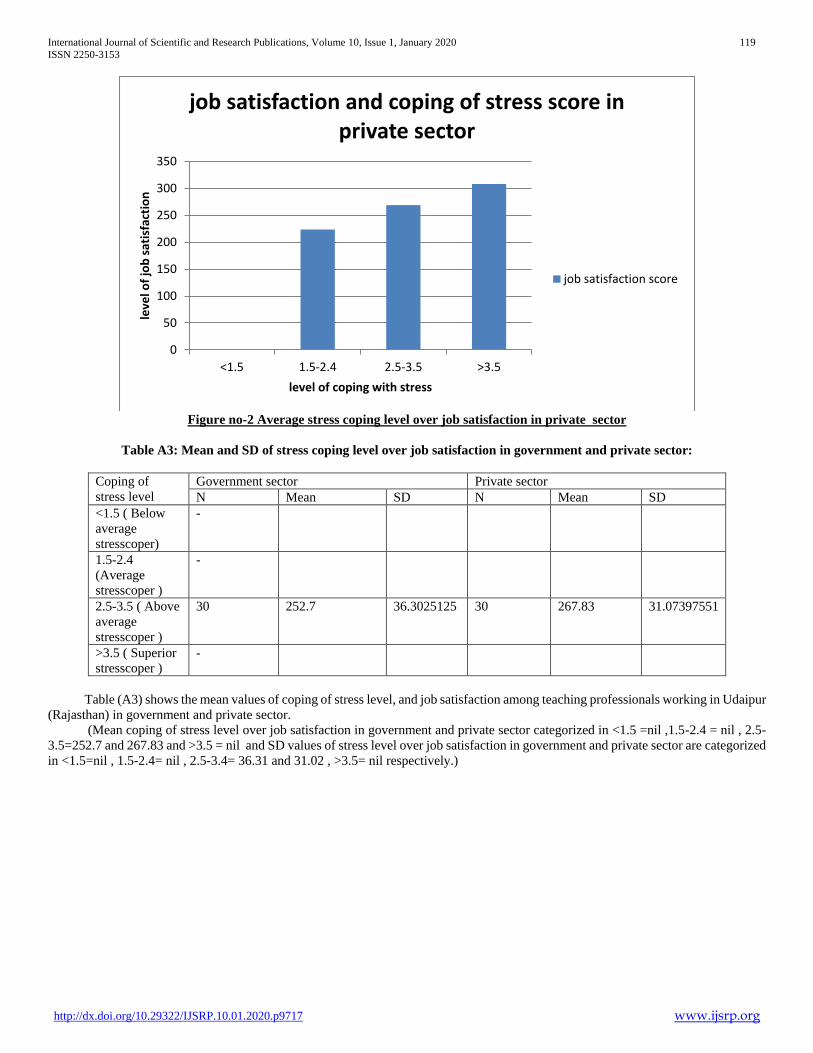
International Journal of Scientific and Research Publications, Volume 10, Issue 1, January 2020 119
ISSN 2250-3153
http://dx.doi.org/10.29322/IJSRP.10.01.2020.p9717 www.ijsrp.org
Figure no-2 Average stress coping level over job satisfaction in private sector
Table A3: Mean and SD of stress coping level over job satisfaction in government and private sector:
Coping of
stress level
Government sector Private sector
N Mean SD N Mean SD
<1.5 ( Below
average
stresscoper)
-
1.5-2.4
(Average
stresscoper )
-
2.5-3.5 ( Above
average
stresscoper )
30 252.7 36.3025125 30 267.83 31.07397551
>3.5 ( Superior
stresscoper )
-
Table (A3) shows the mean values of coping of stress level, and job satisfaction among teaching professionals working in Udaipur
(Rajasthan) in government and private sector.
(Mean coping of stress level over job satisfaction in government and private sector categorized in <1.5 =nil ,1.5-2.4 = nil , 2.5-
3.5=252.7 and 267.83 and >3.5 = nil and SD values of stress level over job satisfaction in government and private sector are categorized
in <1.5=nil , 1.5-2.4= nil , 2.5-3.4= 36.31 and 31.02 , >3.5= nil respectively.)
0
50
100
150
200
250
300
350
<1.5 1.5-2.4 2.5-3.5 >3.5
leve
l of
job
sat
isfa
ctio
n
level of coping with stress
job satisfaction and coping of stress score in private sector
job satisfaction score
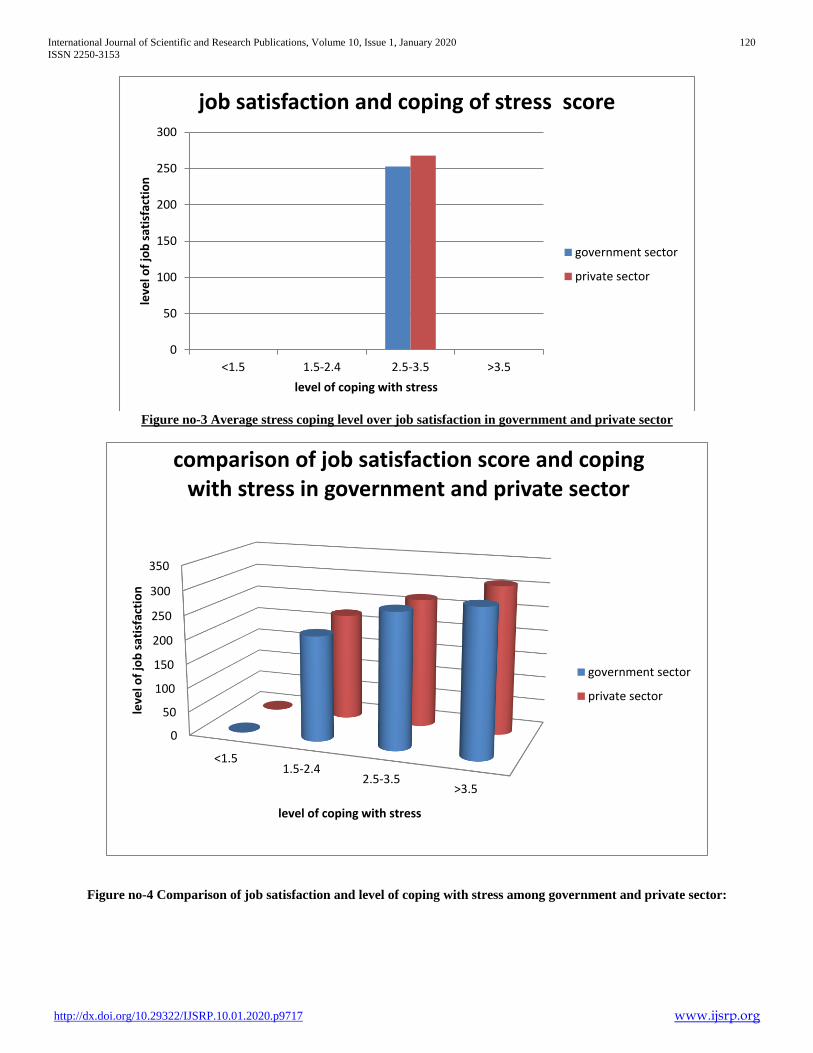
International Journal of Scientific and Research Publications, Volume 10, Issue 1, January 2020 120
ISSN 2250-3153
http://dx.doi.org/10.29322/IJSRP.10.01.2020.p9717 www.ijsrp.org
Figure no-3 Average stress coping level over job satisfaction in government and private sector
Figure no-4 Comparison of job satisfaction and level of coping with stress among government and private sector:
0
50
100
150
200
250
300
<1.5 1.5-2.4 2.5-3.5 >3.5
leve
l of
job
sat
isfa
ctio
n
level of coping with stress
job satisfaction and coping of stress score
government sector
private sector
0
50
100
150
200
250
300
350
<1.51.5-2.4
2.5-3.5>3.5
leve
l of
job
sat
isfa
ctio
n
level of coping with stress
comparison of job satisfaction score and coping with stress in government and private sector
government sector
private sector
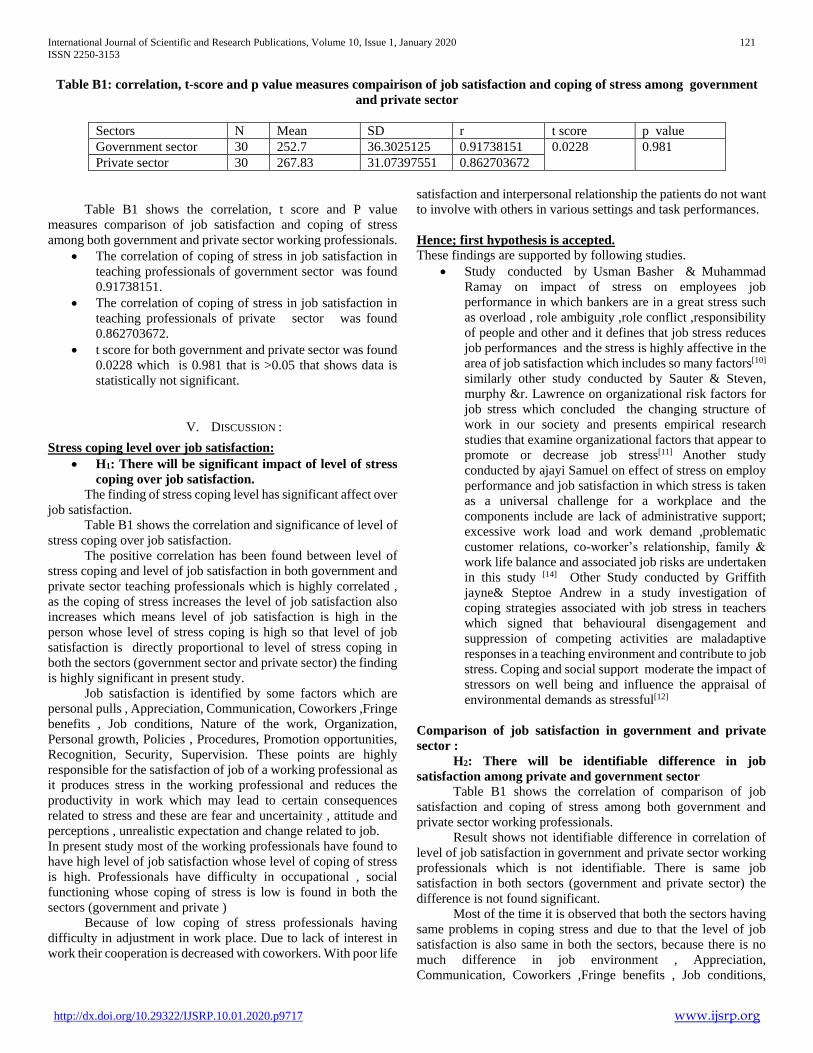
International Journal of Scientific and Research Publications, Volume 10, Issue 1, January 2020 121
ISSN 2250-3153
http://dx.doi.org/10.29322/IJSRP.10.01.2020.p9717 www.ijsrp.org
Table B1: correlation, t-score and p value measures compairison of job satisfaction and coping of stress among government
and private sector
Sectors N Mean SD r t score p value
Government sector 30 252.7 36.3025125 0.91738151 0.0228 0.981
Private sector 30 267.83 31.07397551 0.862703672
Table B1 shows the correlation, t score and P value
measures comparison of job satisfaction and coping of stress
among both government and private sector working professionals.
The correlation of coping of stress in job satisfaction in
teaching professionals of government sector was found
0.91738151.
The correlation of coping of stress in job satisfaction in
teaching professionals of private sector was found
0.862703672.
t score for both government and private sector was found
0.0228 which is 0.981 that is >0.05 that shows data is
statistically not significant.
V. DISCUSSION :
Stress coping level over job satisfaction:
H1: There will be significant impact of level of stress
coping over job satisfaction.
The finding of stress coping level has significant affect over
job satisfaction.
Table B1 shows the correlation and significance of level of
stress coping over job satisfaction.
The positive correlation has been found between level of
stress coping and level of job satisfaction in both government and
private sector teaching professionals which is highly correlated ,
as the coping of stress increases the level of job satisfaction also
increases which means level of job satisfaction is high in the
person whose level of stress coping is high so that level of job
satisfaction is directly proportional to level of stress coping in
both the sectors (government sector and private sector) the finding
is highly significant in present study.
Job satisfaction is identified by some factors which are
personal pulls , Appreciation, Communication, Coworkers ,Fringe
benefits , Job conditions, Nature of the work, Organization,
Personal growth, Policies , Procedures, Promotion opportunities,
Recognition, Security, Supervision. These points are highly
responsible for the satisfaction of job of a working professional as
it produces stress in the working professional and reduces the
productivity in work which may lead to certain consequences
related to stress and these are fear and uncertainity , attitude and
perceptions , unrealistic expectation and change related to job.
In present study most of the working professionals have found to
have high level of job satisfaction whose level of coping of stress
is high. Professionals have difficulty in occupational , social
functioning whose coping of stress is low is found in both the
sectors (government and private )
Because of low coping of stress professionals having
difficulty in adjustment in work place. Due to lack of interest in
work their cooperation is decreased with coworkers. With poor life
satisfaction and interpersonal relationship the patients do not want
to involve with others in various settings and task performances.
Hence; first hypothesis is accepted.
These findings are supported by following studies.
Study conducted by Usman Basher & Muhammad
Ramay on impact of stress on employees job
performance in which bankers are in a great stress such
as overload , role ambiguity ,role conflict ,responsibility
of people and other and it defines that job stress reduces
job performances and the stress is highly affective in the
area of job satisfaction which includes so many factors[10]
similarly other study conducted by Sauter & Steven,
murphy &r. Lawrence on organizational risk factors for
job stress which concluded the changing structure of
work in our society and presents empirical research
studies that examine organizational factors that appear to
promote or decrease job stress[11] Another study
conducted by ajayi Samuel on effect of stress on employ
performance and job satisfaction in which stress is taken
as a universal challenge for a workplace and the
components include are lack of administrative support;
excessive work load and work demand ,problematic
customer relations, co-worker’s relationship, family &
work life balance and associated job risks are undertaken
in this study [14] Other Study conducted by Griffith
jayne& Steptoe Andrew in a study investigation of
coping strategies associated with job stress in teachers
which signed that behavioural disengagement and
suppression of competing activities are maladaptive
responses in a teaching environment and contribute to job
stress. Coping and social support moderate the impact of
stressors on well being and influence the appraisal of
environmental demands as stressful[12]
Comparison of job satisfaction in government and private
sector :
H2: There will be identifiable difference in job
satisfaction among private and government sector
Table B1 shows the correlation of comparison of job
satisfaction and coping of stress among both government and
private sector working professionals.
Result shows not identifiable difference in correlation of
level of job satisfaction in government and private sector working
professionals which is not identifiable. There is same job
satisfaction in both sectors (government and private sector) the
difference is not found significant.
Most of the time it is observed that both the sectors having
same problems in coping stress and due to that the level of job
satisfaction is also same in both the sectors, because there is no
much difference in job environment , Appreciation,
Communication, Coworkers ,Fringe benefits , Job conditions,
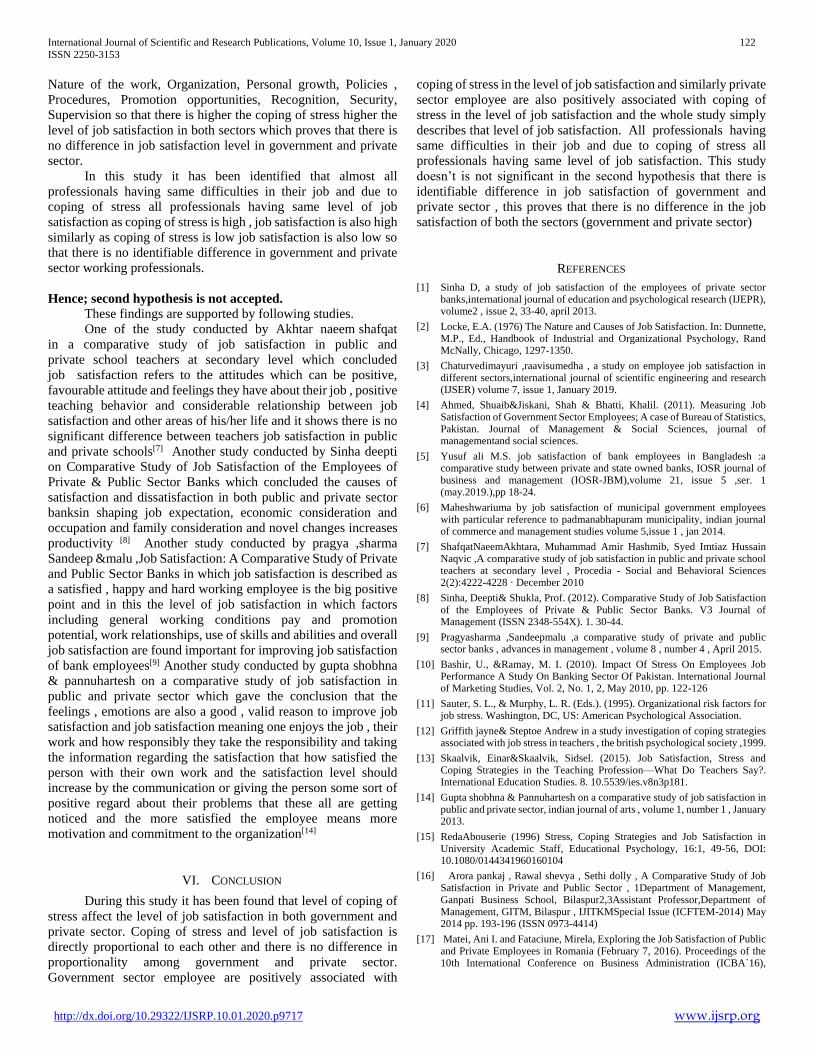
International Journal of Scientific and Research Publications, Volume 10, Issue 1, January 2020 122
ISSN 2250-3153
http://dx.doi.org/10.29322/IJSRP.10.01.2020.p9717 www.ijsrp.org
Nature of the work, Organization, Personal growth, Policies ,
Procedures, Promotion opportunities, Recognition, Security,
Supervision so that there is higher the coping of stress higher the
level of job satisfaction in both sectors which proves that there is
no difference in job satisfaction level in government and private
sector.
In this study it has been identified that almost all
professionals having same difficulties in their job and due to
coping of stress all professionals having same level of job
satisfaction as coping of stress is high , job satisfaction is also high
similarly as coping of stress is low job satisfaction is also low so
that there is no identifiable difference in government and private
sector working professionals.
Hence; second hypothesis is not accepted.
These findings are supported by following studies.
One of the study conducted by Akhtar naeem shafqat
in a comparative study of job satisfaction in public and
private school teachers at secondary level which concluded
job satisfaction refers to the attitudes which can be positive,
favourable attitude and feelings they have about their job , positive
teaching behavior and considerable relationship between job
satisfaction and other areas of his/her life and it shows there is no
significant difference between teachers job satisfaction in public
and private schools[7] Another study conducted by Sinha deepti
on Comparative Study of Job Satisfaction of the Employees of
Private & Public Sector Banks which concluded the causes of
satisfaction and dissatisfaction in both public and private sector
banksin shaping job expectation, economic consideration and
occupation and family consideration and novel changes increases
productivity [8] Another study conducted by pragya ,sharma
Sandeep &malu ,Job Satisfaction: A Comparative Study of Private
and Public Sector Banks in which job satisfaction is described as
a satisfied , happy and hard working employee is the big positive
point and in this the level of job satisfaction in which factors
including general working conditions pay and promotion
potential, work relationships, use of skills and abilities and overall
job satisfaction are found important for improving job satisfaction
of bank employees[9] Another study conducted by gupta shobhna
& pannuhartesh on a comparative study of job satisfaction in
public and private sector which gave the conclusion that the
feelings , emotions are also a good , valid reason to improve job
satisfaction and job satisfaction meaning one enjoys the job , their
work and how responsibly they take the responsibility and taking
the information regarding the satisfaction that how satisfied the
person with their own work and the satisfaction level should
increase by the communication or giving the person some sort of
positive regard about their problems that these all are getting
noticed and the more satisfied the employee means more
motivation and commitment to the organization[14]
VI. CONCLUSION
During this study it has been found that level of coping of
stress affect the level of job satisfaction in both government and
private sector. Coping of stress and level of job satisfaction is
directly proportional to each other and there is no difference in
proportionality among government and private sector.
Government sector employee are positively associated with
coping of stress in the level of job satisfaction and similarly private
sector employee are also positively associated with coping of
stress in the level of job satisfaction and the whole study simply
describes that level of job satisfaction. All professionals having
same difficulties in their job and due to coping of stress all
professionals having same level of job satisfaction. This study
doesn’t is not significant in the second hypothesis that there is
identifiable difference in job satisfaction of government and
private sector , this proves that there is no difference in the job
satisfaction of both the sectors (government and private sector)
REFERENCES
[1] Sinha D, a study of job satisfaction of the employees of private sector banks,international journal of education and psychological research (IJEPR), volume2 , issue 2, 33-40, april 2013.
[2] Locke, E.A. (1976) The Nature and Causes of Job Satisfaction. In: Dunnette, M.P., Ed., Handbook of Industrial and Organizational Psychology, Rand McNally, Chicago, 1297-1350.
[3] Chaturvedimayuri ,raavisumedha , a study on employee job satisfaction in different sectors,international journal of scientific engineering and research (IJSER) volume 7, issue 1, January 2019.
[4] Ahmed, Shuaib&Jiskani, Shah & Bhatti, Khalil. (2011). Measuring Job Satisfaction of Government Sector Employees; A case of Bureau of Statistics, Pakistan. Journal of Management & Social Sciences, journal of managementand social sciences.
[5] Yusuf ali M.S. job satisfaction of bank employees in Bangladesh :a comparative study between private and state owned banks, IOSR journal of business and management (IOSR-JBM),volume 21, issue 5 ,ser. 1 (may.2019.),pp 18-24.
[6] Maheshwariuma by job satisfaction of municipal government employees with particular reference to padmanabhapuram municipality, indian journal of commerce and management studies volume 5,issue 1 , jan 2014.
[7] ShafqatNaeemAkhtara, Muhammad Amir Hashmib, Syed Imtiaz Hussain Naqvic ,A comparative study of job satisfaction in public and private school teachers at secondary level , Procedia - Social and Behavioral Sciences 2(2):4222-4228 · December 2010
[8] Sinha, Deepti& Shukla, Prof. (2012). Comparative Study of Job Satisfaction of the Employees of Private & Public Sector Banks. V3 Journal of Management (ISSN 2348-554X). 1. 30-44.
[9] Pragyasharma ,Sandeepmalu ,a comparative study of private and public sector banks , advances in management , volume 8 , number 4 , April 2015.
[10] Bashir, U., &Ramay, M. I. (2010). Impact Of Stress On Employees Job Performance A Study On Banking Sector Of Pakistan. International Journal of Marketing Studies, Vol. 2, No. 1, 2, May 2010, pp. 122-126
[11] Sauter, S. L., & Murphy, L. R. (Eds.). (1995). Organizational risk factors for job stress. Washington, DC, US: American Psychological Association.
[12] Griffith jayne& Steptoe Andrew in a study investigation of coping strategies associated with job stress in teachers , the british psychological society ,1999.
[13] Skaalvik, Einar&Skaalvik, Sidsel. (2015). Job Satisfaction, Stress and Coping Strategies in the Teaching Profession—What Do Teachers Say?. International Education Studies. 8. 10.5539/ies.v8n3p181.
[14] Gupta shobhna & Pannuhartesh on a comparative study of job satisfaction in public and private sector, indian journal of arts , volume 1, number 1 , January 2013.
[15] RedaAbouserie (1996) Stress, Coping Strategies and Job Satisfaction in University Academic Staff, Educational Psychology, 16:1, 49-56, DOI: 10.1080/0144341960160104
[16] Arora pankaj , Rawal shevya , Sethi dolly , A Comparative Study of Job Satisfaction in Private and Public Sector , 1Department of Management, Ganpati Business School, Bilaspur2,3Assistant Professor,Department of Management, GITM, Bilaspur , IJITKMSpecial Issue (ICFTEM-2014) May 2014 pp. 193-196 (ISSN 0973-4414)
[17] Matei, Ani I. and Fataciune, Mirela, Exploring the Job Satisfaction of Public and Private Employees in Romania (February 7, 2016). Proceedings of the 10th International Conference on Business Administration (ICBA`16),

International Journal of Scientific and Research Publications, Volume 10, Issue 1, January 2020 123
ISSN 2250-3153
http://dx.doi.org/10.29322/IJSRP.10.01.2020.p9717 www.ijsrp.org
February,13-15, 2016, Barcelona, pp.138-145. Available at SSRN: https://ssrn.com/abstract=2763422
[18] Mehta Prachi and Juneja Richu M , A comparative study of employees job satisfaction in selected public and private sector banks , International Journal of Applied Research 2017; 3(1): 620-625
[19] Hameed, F., Ahmed-Baig, I., & Cacheiro-González. M.L. (2018). Job satisfaction of teachers from public and private sector universities in Lahore, Pakistan: A comparative study. Economics and Sociology, 11(4), 230-245. doi:10.14254/2071-789X.2018/11-4/15
[20] Bradely E Wright and Brian S. Davis, Job satisfaction in public sector , The American Review of Public Administration ,33(1):70-90 · March 2003
[21] Hossen Sayed Mohibul , Hossain Md. Takrib , Rana Md. Masud , Ismail Mohd Tahir , Employees’ Satisfaction of Government Organization in Tangail City, Bangladesh, International Business Research Vol. 12, No. 2 (2019)
[22] Dr.K Nigama ,Dr S Selvabaskar ,Dr S T Surulivel ,Dr R Alamelu ,Ms. D Uthaya Joice , Job satisfaction among school teachers , Faculty, School of Management, SASTRA Deemed University Student,School of Management, SASTRA Deemed University Thirumalaisamudram, Thanjavur, Tamil Nadu, India., International Journal of Pure and Applied Mathematics , Volume 119 No. 7 2018, 2645-2655
[23] Ajayi, Samuel, Effect of Stress on Employee Performance and Job Satisfaction: A Case Study of Nigerian Banking Industry (April 11, 2018). Available at SSRN: https://ssrn.com/abstract=3160620or http://dx.doi.org/10.2139/ssrn.3160620
[24] Spector, P.E. (1997). Job satisfaction: Application, assessment, causes and consequences. Thousand Oaks, CA: SAGE
[25] E. Taylor Shelley,HEALTH PSYCHOLOGY,STRESS AND COPING,tenth edition , McGraw Hill Education(India) Private Limited,Chennai,PP:115-116
[26] WebMD Medical Reference Reviewed by Joseph Goldberg, MD on March 11, 2018 / https://www.webmd.com/balance/guide/causes-of-stress#2
[27] Locke, E. A. “The Nature and Causes of Job Satisfaction” in Dunnette, M. D. Handbook of Industrial and Organizational Psychology (1st Ed.), Chicago, IL: Rand McNally. 1976. 1297-1349. 1976.
[28] ^ Spector, P.E. (1997). Job satisfaction: Application, assessment, causes and consequences. Thousand Oaks, CA: SAGE.
[29] E. Taylor Shelley,HEALTH PSYCHOLOGY,STRESS AND COPING,tenth edition , McGraw Hill Education(India) Private Limited,Chennai,PP:137-138
AUTHORS
First Author – Shivani Singhvi, MSc. Clinical Psychology
Student, Department of Psychiatry, Geetanjali Medical College
& Hospital, Udaipur, Rajasthan, India.
Second Author – Dr. Shikha Sharma, Assistant Professor,
Clinical Psychology, Department of psychiatry, Geetanjali
Medical College & Hospital , Udaipur, Rajasthan, India
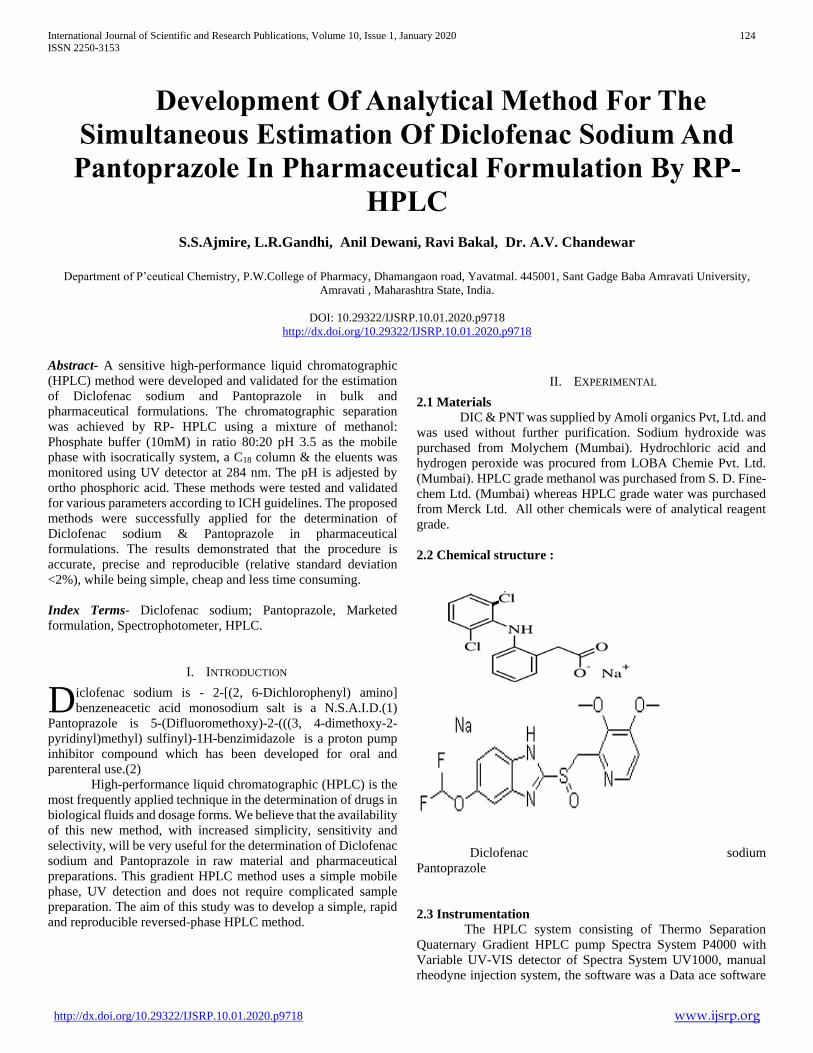
International Journal of Scientific and Research Publications, Volume 10, Issue 1, January 2020 124
ISSN 2250-3153
http://dx.doi.org/10.29322/IJSRP.10.01.2020.p9718 www.ijsrp.org
Development Of Analytical Method For The
Simultaneous Estimation Of Diclofenac Sodium And
Pantoprazole In Pharmaceutical Formulation By RP-
HPLC
S.S.Ajmire, L.R.Gandhi, Anil Dewani, Ravi Bakal, Dr. A.V. Chandewar
Department of P’ceutical Chemistry, P.W.College of Pharmacy, Dhamangaon road, Yavatmal. 445001, Sant Gadge Baba Amravati University,
Amravati , Maharashtra State, India.
DOI: 10.29322/IJSRP.10.01.2020.p9718
http://dx.doi.org/10.29322/IJSRP.10.01.2020.p9718
Abstract- A sensitive high-performance liquid chromatographic
(HPLC) method were developed and validated for the estimation
of Diclofenac sodium and Pantoprazole in bulk and
pharmaceutical formulations. The chromatographic separation
was achieved by RP- HPLC using a mixture of methanol:
Phosphate buffer (10mM) in ratio 80:20 pH 3.5 as the mobile
phase with isocratically system, a C18 column & the eluents was
monitored using UV detector at 284 nm. The pH is adjested by
ortho phosphoric acid. These methods were tested and validated
for various parameters according to ICH guidelines. The proposed
methods were successfully applied for the determination of
Diclofenac sodium & Pantoprazole in pharmaceutical
formulations. The results demonstrated that the procedure is
accurate, precise and reproducible (relative standard deviation
<2%), while being simple, cheap and less time consuming.
Index Terms- Diclofenac sodium; Pantoprazole, Marketed
formulation, Spectrophotometer, HPLC.
I. INTRODUCTION
iclofenac sodium is - 2-[(2, 6-Dichlorophenyl) amino]
benzeneacetic acid monosodium salt is a N.S.A.I.D.(1)
Pantoprazole is 5-(Difluoromethoxy)-2-(((3, 4-dimethoxy-2-
pyridinyl)methyl) sulfinyl)-1H-benzimidazole is a proton pump
inhibitor compound which has been developed for oral and
parenteral use.(2)
High-performance liquid chromatographic (HPLC) is the
most frequently applied technique in the determination of drugs in
biological fluids and dosage forms. We believe that the availability
of this new method, with increased simplicity, sensitivity and
selectivity, will be very useful for the determination of Diclofenac
sodium and Pantoprazole in raw material and pharmaceutical
preparations. This gradient HPLC method uses a simple mobile
phase, UV detection and does not require complicated sample
preparation. The aim of this study was to develop a simple, rapid
and reproducible reversed-phase HPLC method.
II. EXPERIMENTAL
2.1 Materials
DIC & PNT was supplied by Amoli organics Pvt, Ltd. and
was used without further purification. Sodium hydroxide was
purchased from Molychem (Mumbai). Hydrochloric acid and
hydrogen peroxide was procured from LOBA Chemie Pvt. Ltd.
(Mumbai). HPLC grade methanol was purchased from S. D. Fine-
chem Ltd. (Mumbai) whereas HPLC grade water was purchased
from Merck Ltd. All other chemicals were of analytical reagent
grade.
2.2 Chemical structure :
Diclofenac sodium
Pantoprazole
2.3 Instrumentation
The HPLC system consisting of Thermo Separation
Quaternary Gradient HPLC pump Spectra System P4000 with
Variable UV-VIS detector of Spectra System UV1000, manual
rheodyne injection system, the software was a Data ace software
D

International Journal of Scientific and Research Publications, Volume 10, Issue 1, January 2020 125
ISSN 2250-3153
http://dx.doi.org/10.29322/IJSRP.10.01.2020.p9718 www.ijsrp.org
version 6.1. The chromatographic separation was performed using
Grace C18 (250mm × 4.6 mm i.d., 5mm particle size) Separation
was achieved using a mobile phase consisting of buffer:methanol
in the ratio (80:20 pH 3.5 adjusted with ortho phosphoric acid) at
a flow rate of 1ml/min and UV detection at 284 nm. The column
was maintained at ambient temperature with injection volume of
20 µl. The mobile phase was filtered through 0.45 µm Chrom Tech
Nylon-66 filter and degassed in ultrasonic bath prior to use. A
blank chromatogram was recorded before the studies.
Quantization of result was performed using peak area counts.
2.4 Standard preparation
Stock solution of DIC & PNT was prepared. Accurately
weighed quantity 5 mg of both was dissolved in methanol and
volume was made up to 25 ml mark (200 g/ml). The stock
standard solution was diluted further with Methanol to get final
concentration of about 10 g/ml. then various trial are taken &
mobile phase finalized where proper resolution of both the drug
were seen. This was found that the sample preparation in mobile
phase gives sharp resolution hence all samples were prepared in
mobile phase. The stock solution was prepared in mobile phase of
100g/ml.
III. RESULT & DISCUSSION:
3.1 Preparation of calibration curve:-
The mobile phase was allowed to equilibrate with the stationary
phase until steady baseline was obtained. The series of
concentration from 2-20 g/ml of both drug solutions were
injected and peak area was recorded. The graph plotted as the
concentration of the drug Vs peak area depicted in Fig. No.2 and
3.
3.2 Method Validation
3.2.1 Specificity (Selectivity)
Specificity was measured as ability of the proposed
method to obtain well separated peak for DIC and PNT without
any interference from component of matrix. The values obtained
were very close to that in standard laboratory mixture in DIC no
interference from the component of matrix. Mean retention time
for –
DIC = 2.446
PNT = 6.678
3.2.2. Accuracy and precision
It was ascertained on the basis of recovery studies
performed by standard addition method. The results of recovery
studies and statistical data are recorded in Table No.1 Precision of
an analytical method is expressed as S.D or R.S.D of series of
measurements. It was ascertained by replicate estimation of the
drugs by proposed method.
3.2.3 Ruggedness:
The studies of ruggedness were carried out under two
different conditions-
a) Days
b) Analyst.
a) Interday (Different days):
Same procedure was performed as under marketed formulation
analysis on different days. The % label claim was calculated. Data
obtained for day 1, day 2, and day 3 is shown in Table No. 1
b) Different analyst: The sample solution was prepared by two different
analysts and same procedure was followed as described earlier.
The % label claim was calculated as done in marketed formulation
estimation.
3.3 Analysis of Pharmaceutical dosage form (eye drop):
The values of analysis of eye drop obtained by the
proposed method were between 99.6% and 101.6% (Table 2),
which showed that the estimation of dosage forms were accurate
within the acceptance level of 95% to 105%. (Refer Table 2).
Tables:
Table 1: Summary of validation parameters for the proposed method
Validation Parameters DIC PNT
Linearity μg mL-1 0.5-5.0 0.2-2.0
Accuracy mean
0.065 0.055
Precision (% RSD)
0.047 0.100
Intraday (% RSD)
0.0360 0.115
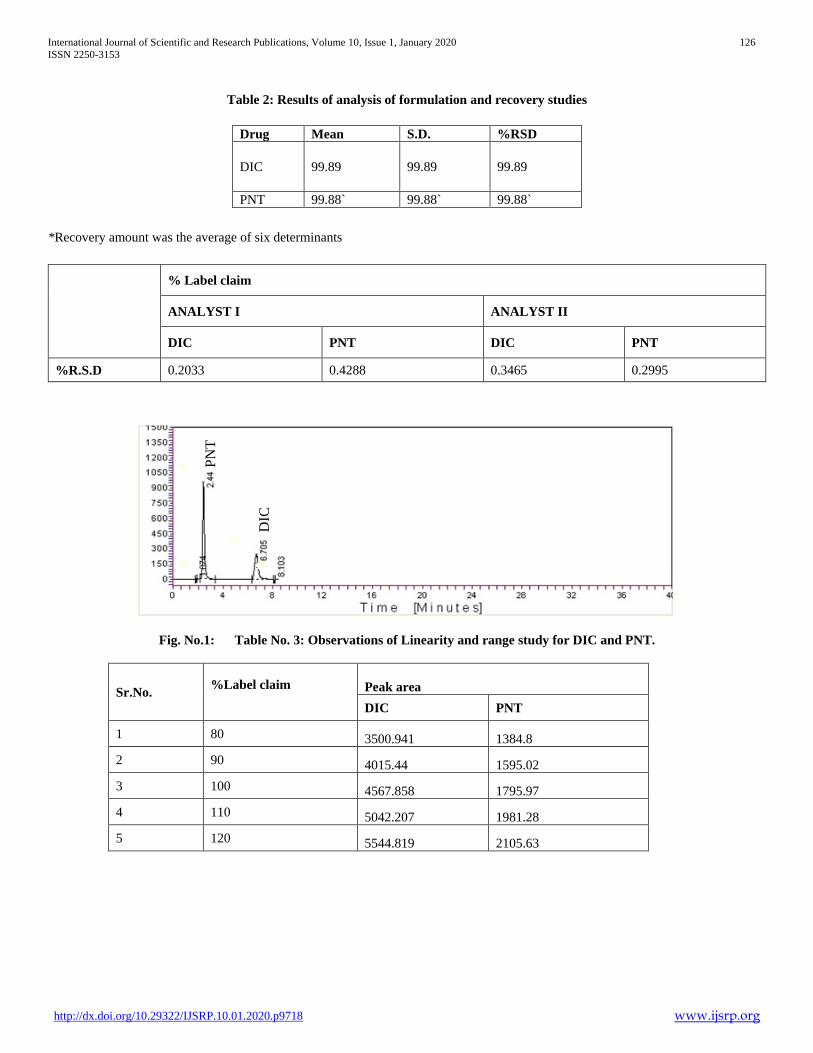
International Journal of Scientific and Research Publications, Volume 10, Issue 1, January 2020 126
ISSN 2250-3153
http://dx.doi.org/10.29322/IJSRP.10.01.2020.p9718 www.ijsrp.org
Table 2: Results of analysis of formulation and recovery studies
*Recovery amount was the average of six determinants
Fig. No.1: Table No. 3: Observations of Linearity and range study for DIC and PNT.
Drug Mean S.D. %RSD
DIC 99.89 99.89 99.89
PNT 99.88` 99.88` 99.88`
% Label claim
ANALYST I ANALYST II
DIC PNT DIC PNT
%R.S.D 0.2033 0.4288 0.3465 0.2995
Sr.No. %Label claim
Peak area
DIC PNT
1 80 3500.941 1384.8
2 90 4015.44 1595.02
3 100 4567.858 1795.97
4 110 5042.207 1981.28
5 120 5544.819 2105.63
PN
T
DIC
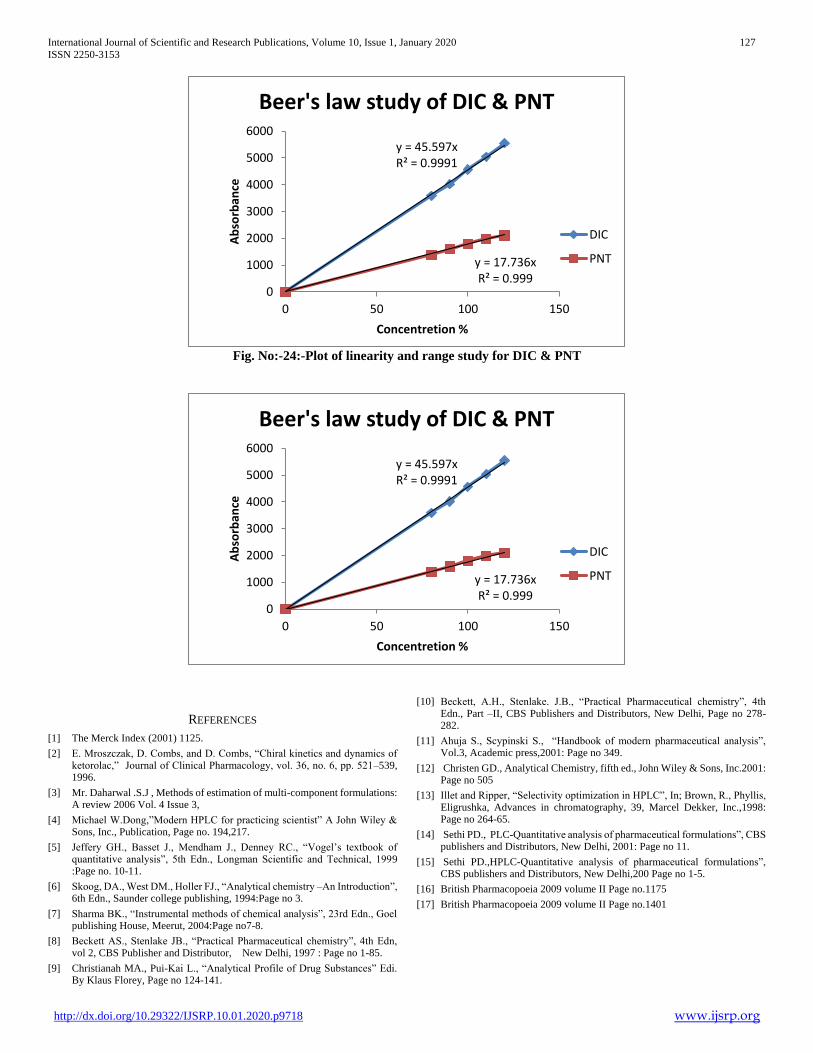
International Journal of Scientific and Research Publications, Volume 10, Issue 1, January 2020 127
ISSN 2250-3153
http://dx.doi.org/10.29322/IJSRP.10.01.2020.p9718 www.ijsrp.org
Fig. No:-24:-Plot of linearity and range study for DIC & PNT
REFERENCES
[1] The Merck Index (2001) 1125.
[2] E. Mroszczak, D. Combs, and D. Combs, “Chiral kinetics and dynamics of ketorolac,” Journal of Clinical Pharmacology, vol. 36, no. 6, pp. 521–539, 1996.
[3] Mr. Daharwal .S.J , Methods of estimation of multi-component formulations: A review 2006 Vol. 4 Issue 3,
[4] Michael W.Dong,”Modern HPLC for practicing scientist” A John Wiley & Sons, Inc., Publication, Page no. 194,217.
[5] Jeffery GH., Basset J., Mendham J., Denney RC., “Vogel’s textbook of quantitative analysis”, 5th Edn., Longman Scientific and Technical, 1999 :Page no. 10-11.
[6] Skoog, DA., West DM., Holler FJ., “Analytical chemistry –An Introduction”, 6th Edn., Saunder college publishing, 1994:Page no 3.
[7] Sharma BK., “Instrumental methods of chemical analysis”, 23rd Edn., Goel publishing House, Meerut, 2004:Page no7-8.
[8] Beckett AS., Stenlake JB., “Practical Pharmaceutical chemistry”, 4th Edn, vol 2, CBS Publisher and Distributor, New Delhi, 1997 : Page no 1-85.
[9] Christianah MA., Pui-Kai L., “Analytical Profile of Drug Substances” Edi. By Klaus Florey, Page no 124-141.
[10] Beckett, A.H., Stenlake. J.B., “Practical Pharmaceutical chemistry”, 4th Edn., Part –II, CBS Publishers and Distributors, New Delhi, Page no 278-282.
[11] Ahuja S., Scypinski S., “Handbook of modern pharmaceutical analysis”, Vol.3, Academic press,2001: Page no 349.
[12] Christen GD., Analytical Chemistry, fifth ed., John Wiley & Sons, Inc.2001: Page no 505
[13] Illet and Ripper, “Selectivity optimization in HPLC”, In; Brown, R., Phyllis, Eligrushka, Advances in chromatography, 39, Marcel Dekker, Inc.,1998: Page no 264-65.
[14] Sethi PD., PLC-Quantitative analysis of pharmaceutical formulations”, CBS publishers and Distributors, New Delhi, 2001: Page no 11.
[15] Sethi PD.,HPLC-Quantitative analysis of pharmaceutical formulations”, CBS publishers and Distributors, New Delhi,200 Page no 1-5.
[16] British Pharmacopoeia 2009 volume II Page no.1175
[17] British Pharmacopoeia 2009 volume II Page no.1401
y = 45.597xR² = 0.9991
y = 17.736xR² = 0.999
0
1000
2000
3000
4000
5000
6000
0 50 100 150
Ab
sorb
ance
Concentretion %
Beer's law study of DIC & PNT
DIC
PNT
y = 45.597xR² = 0.9991
y = 17.736xR² = 0.999
0
1000
2000
3000
4000
5000
6000
0 50 100 150
Ab
sorb
ance
Concentretion %
Beer's law study of DIC & PNT
DIC
PNT

International Journal of Scientific and Research Publications, Volume 10, Issue 1, January 2020 128
ISSN 2250-3153
http://dx.doi.org/10.29322/IJSRP.10.01.2020.p9718 www.ijsrp.org
AUTHORS
First Author – S.S.Ajmire, Department of P’ceutical Chemistry,
P.W.College of Pharmacy, Dhamangaon road, Yavatmal. 445001
Sant Gadge Baba Amravati University, Amravati ,Maharashtra
State, India.
Second Author – L.R.Gandhi, Department of P’ceutical
Chemistry, P.W.College of Pharmacy, Dhamangaon road,
Yavatmal. 445001, Sant Gadge Baba Amravati University,
Amravati ,Maharashtra State, India.
Third Author – Anil Dewani, Department of P’ceutical
Chemistry, P.W.College of Pharmacy, Dhamangaon road,
Yavatmal. 445001, Sant Gadge Baba Amravati University,
Amravati ,Maharashtra State, India.
Fourth Author – Ravi Bakal, Department of P’ceutical
Chemistry, P.W.College of Pharmacy, Dhamangaon road,
Yavatmal. 445001, Sant Gadge Baba Amravati University,
Amravati ,Maharashtra State, India.
Fifth Author – Dr. A.V. Chandewar, Department of P’ceutical
Chemistry, P.W.College of Pharmacy, Dhamangaon road,
Yavatmal. 445001, Sant Gadge Baba Amravati University,
Amravati ,Maharashtra State, India.
Correspondence Author – S.S.Ajamire, Department of
P’ceutical Chemistry , Email: [email protected]
P.W. College of Pharmacy, Dhamangaon Road, Yavatmal.
445001 (M.S), Sant Gadge Baba Amravati University, Amravati
India, Mob No:- 9420372534.

International Journal of Scientific and Research Publications, Volume 10, Issue 1, January 2020 129
ISSN 2250-3153
http://dx.doi.org/10.29322/IJSRP.10.01.2020.p9719 www.ijsrp.org
Modelling the Universe of Data (DataVerse)
Ashutosh Gupta
GM, Gujarat Telecom Circle, BSNL, Ahmedabad.
DOI: 10.29322/IJSRP.10.01.2020.p9719
http://dx.doi.org/10.29322/IJSRP.10.01.2020.p9719
Abstract- The paper presents an axiomatic model of Abstract
Universe or the Universe of Information. It suggests the minimum
elements required to create the information of Abstract Universe
and this model forms the necessary and sufficient condition for an
Abstract Universe to exist. This Universe of Information is viewed
for outside to see its impact on real Universe. The process of
creation of Information Universe from its Axiomatic model is
proposed. Some interpretation based on the model is proposed.
This model will form the basis for the axiomatic model of the Real
Universe which is beyond the scope of the paper.
Index Terms- DataVerse, Data, Process, Algorithm, Datafication,
Instantiation, Actor, Agent, Axiomatic Model, RootCause
I. INTRODUCTION
n today’s information age, information is multiplying
exponentially and the devices using these data are exploding.
Various data sources as Internet of Things (IoT), sensors, user
devices as mobiles etc. are creating enormous data. Analysis of
this data as Big Data, Artificial Intelligence (AI) and Deep
Learning are the attempts to map the reality and to emulate it. This
growing is creating an increasing Virtual Universe and Abstract
Universe. The advent of communication and Information
Technology also has exploded the Data Universe. With such an
impact of Data in our lives, it has become important to understand
tha nature of the Data Universe in a holistic way.
II. WHAT IS DATA
Data comes from the Latin term meaning literally
‘something given,’. It is a set of codes that represent information,
processes, measurements, any phenomenon, any physical or non-
physical aspect, etc. As such, data as a general concept refers to
the fact that some existing information or knowledge is
represented or coded in some form suitable for better usage or
processing. Data is always a slice of reality, we are chopping the
Universe up into little bits, codifying into symbols and storing
them to be utilised in converting it back to Reality. Such data can
be brought back to reality.
This makes the data portable. It can be taken from one
context and brought into another. No matter how extensive our
gathering of data it will only ever be able to capture a partial
representation of the system and in so doing separate it from its
overall context. Data is always incomplete but the discrete nature
of data makes it quantifiable and thus accessible to formal
quantitative methods of analysis (Colchester, Datafication -
Complexity Labs, 2018). The Universal Set of all such data can
be termed as DataVerse.
III. WHAT CONSTITUTES THE DATAVERSE
Any information which is captured, recorded and stored
will constitute the DataVerse. This data can be information
(meaningful) or noise (meaningless). These information can be
any one of the following.
1. Literature, Language, Books, Documents, etc. which
are presented in the form of documents or books etc.
2. Sound or audio stored in Cassettes, Memory devices,
tapes etc, which can be played back.
3. All types of pictures, photographs
4. Movies, Videos, etc.
5. Data on the internet, Social Media, etc.
6. Memory in the mind of living being which can be
recollected.
7. Any operator or Process or Algorithm which has
been designed for the processing, modification,
manipulation or replication or the data.
8. All the data and operator for its processing
constitutes knowledge also forms the part of
DataVerse.
IV. CREATION OF DATA
The data can be created in multiple ways. Some of them are
1. Act of Measurement or Datafication: It is process of
taking snapshot of Reality, codifying it and storing it. The
snapshot can be of physical objects, process,
phenomenon, ideas, thoughts, feelings, etc. Any aspects
of reality can be converted to Data by the process of
Datafication. (Colchester, 2018). E.g. Recording a movie
is an act of datafication of the event.
2. Manipulation of existing Data/Applying Operator on the
Data: The existing data can undergo various operations
(as arithmetic, logical, process, algorithm, etc. ) to create
more data. The processing device can be human mind or
a computer. Generally such processing creates the data of
higher order. Eg Graph from raw data, words from
alphabets, etc. A language is a recursive process of data
manipulation on alphabets. E.g. Giving the VFX to the
movie is the manipulation of movie.
3. Replication of Data: A data can be increased by
replicating or copying. A broadcast is one of the example
of replicating in large quantity. In today’s world, data on
I

International Journal of Scientific and Research Publications, Volume 10, Issue 1, January 2020 130
ISSN 2250-3153
http://dx.doi.org/10.29322/IJSRP.10.01.2020.p9719 www.ijsrp.org
internet, Youtube, Facebook, Newspaper etc. are big
replicators. Because of such replications, we are
overwhelmed with data in our day to day life. E.g.
Broadcasting or Downloading the movie is the process
of replication.
Destruction of Data
The data which is created can be destroyed. It can be
destroyed in the following ways
1. Destruction of storage device where data is stored: If the
storage device is destroyed, then the data stored in it is
destroyed.
2. Destruction of the Interpreter or Instantiator (Cohchester,
2016): Since the data are set of symbols, it needs
interpreter to make sense. If the interpreter of data is
absent or destroyed, the data cease to exist. For example,
the data in a cassette cease to exist if there is no player.
A language is destroyed if there is nobody to read or
understand it.
Axiomatic Model of DataVerse
Since the data is the Symbolic or the coded version of the real Universe, it is possible to reduce all type of data into its Elementary
Code by breaking the data into simpler form till the simplest indestructible Elementary Code is arrived. Following is some of the effort
to reduce the data to its Elementary Code.
1. Literature → Book → Chapters → Paragraphs → Sentences → Words → Alphabets
The Elementary code derived are the alphabets which cannot be subdivided.
2. Music → Notations → Note . The indivisible element is notes.
3. Movie → Pictures → Pallete. Here the element is the color palate which cannot be divided.
From the above examples it can be seen that for different type of information there were different indivisible elements. Hence there is
the need of a model which can represent all types of elements.
Picture Pallete Pixels
Alphabets
Words Paragraph Literature
Notations
Notes Music
Figure 1 Reduction of Literature into Elements
Figure 2 Reductio of Music into Elements
Figure 3 Reduction of Picture into Elements
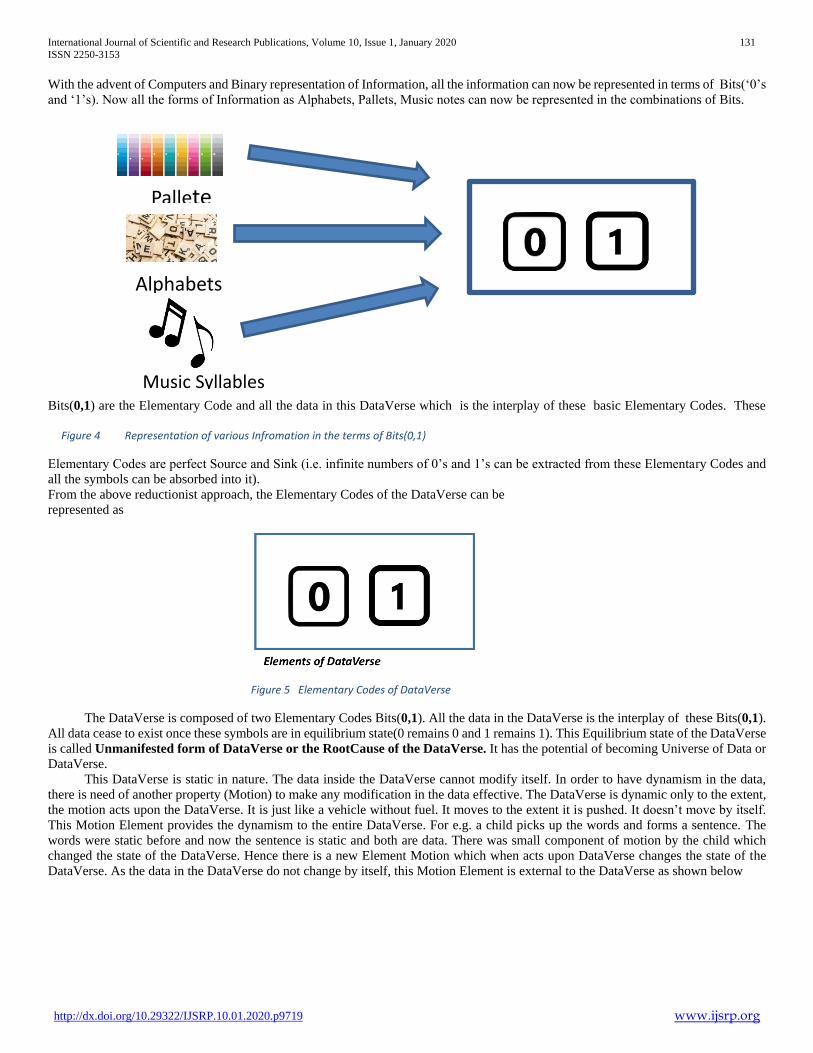
International Journal of Scientific and Research Publications, Volume 10, Issue 1, January 2020 131
ISSN 2250-3153
http://dx.doi.org/10.29322/IJSRP.10.01.2020.p9719 www.ijsrp.org
With the advent of Computers and Binary representation of Information, all the information can now be represented in terms of Bits(‘0’s
and ‘1’s). Now all the forms of Information as Alphabets, Pallets, Music notes can now be represented in the combinations of Bits.
Bits(0,1) are the Elementary Code and all the data in this DataVerse which is the interplay of these basic Elementary Codes. These
Elementary Codes are perfect Source and Sink (i.e. infinite numbers of 0’s and 1’s can be extracted from these Elementary Codes and
all the symbols can be absorbed into it).
From the above reductionist approach, the Elementary Codes of the DataVerse can be
represented as
The DataVerse is composed of two Elementary Codes Bits(0,1). All the data in the DataVerse is the interplay of these Bits(0,1).
All data cease to exist once these symbols are in equilibrium state(0 remains 0 and 1 remains 1). This Equilibrium state of the DataVerse
is called Unmanifested form of DataVerse or the RootCause of the DataVerse. It has the potential of becoming Universe of Data or
DataVerse.
This DataVerse is static in nature. The data inside the DataVerse cannot modify itself. In order to have dynamism in the data,
there is need of another property (Motion) to make any modification in the data effective. The DataVerse is dynamic only to the extent,
the motion acts upon the DataVerse. It is just like a vehicle without fuel. It moves to the extent it is pushed. It doesn’t move by itself.
This Motion Element provides the dynamism to the entire DataVerse. For e.g. a child picks up the words and forms a sentence. The
words were static before and now the sentence is static and both are data. There was small component of motion by the child which
changed the state of the DataVerse. Hence there is a new Element Motion which when acts upon DataVerse changes the state of the
DataVerse. As the data in the DataVerse do not change by itself, this Motion Element is external to the DataVerse as shown below
Alphabets
Pallete
Music Syllables
Figure 4 Representation of various Infromation in the terms of Bits(0,1)
Figure 5 Elementary Codes of DataVerse

International Journal of Scientific and Research Publications, Volume 10, Issue 1, January 2020 132
ISSN 2250-3153
http://dx.doi.org/10.29322/IJSRP.10.01.2020.p9719 www.ijsrp.org
The above scenario also does not make the sense unless there is an Actor / Agent supporting the motion to make sense to the
data.
Actor/Agent – An Actor is an entity responsible for all the action. The following are the properties of an Agent
a. It is the representative of I or Ego.
b. It can set Goals.
c. It can analyse the information, compare them, have options and make choices.
d. It is the THE FREE WILL.
e. It is responsible for the ACTION.
In the above example, the child’s action enables the formation of the sensible sentences from the words. Hence the new Model
of DataVerse becomes as below.
The above scenario makes the DataVerse to be meaningful. Whenever there is an Actor acting on the DataVerse, the DataVerse
changes State. Actor/Agent and Motion are external to the DataVerse.
Thus with reference to Figure 7, DataVerse is composed of the two Elementary Codes. The Motion element which is
external to the DataVerse provides the dynamism and changes the state of the DataVerse. The Agent which is also external to
the DataVerse is the Purpose of DataVerse. The entire DataVerse happens for the purpose of the Agent.
Thus the DataVerse can be defined as an Interplay of Two elementary Codes acted upon by Motion for the purpose of Agent.
Actor/Agent
Actor/Agent
Figure 6: DataVerse when Motion acts on it
Figure 7: Axiomatic Model of DataVerse
Agent/Acto
r
Agent/Acto
r
Figure 8 Model of DataVerse

International Journal of Scientific and Research Publications, Volume 10, Issue 1, January 2020 133
ISSN 2250-3153
http://dx.doi.org/10.29322/IJSRP.10.01.2020.p9719 www.ijsrp.org
Necessary and Sufficient Conditions for the existence of
DataVerse
The above Axiomatic model of the DataVerse is both
necessary and sufficient for the Creation of the DataVerse. The
DataVerse will cease to exist in the absence of any one of the
component
1. In the absence of any one the symbol, the data won’t exist.
There is no data with only 1’s on only 0’s.
2. In the absence of motion element, no new combination of
data will be formed. No change, no evolution, no creation,
no destruction of data will happen.
3. In the absence of Agent, the data created will be random
or noise without any meaning.
4. The above model can be understood from the following
example. The minimum items require to make a painting
are two colours (Two symbols), one brush(Motion
element) and a painter(Agent). The painting will cease to
exist in the absence of any one of the element.
Hence the four elements are necessary and sufficient for the
existence of the DataVerse.
Thus the model with its four elements is both necessary and
sufficient for the existence of the entire DataVerse.
Properties of DataVerse
1. Composition: The DataVerse is composed of two
Elementary Codes Bits(0,1). All the data in the
DataVerse is the interplay of these Bits(0,1). All data
cease to exist once these symbols are in equilibrium state.
Properties of Bits(0,1)
(a) The Bits(0,1) are omnipresent in the entire
DataVerse.
(b) The Elementary Codes are Perfect Source
and Perfect Sink.
2. Static in Nature: This DataVerse is static in nature. The
data inside the DataVerse cannot modify itself since the
Motion Element is not the component of DataVerse.
3. Deterministic: Since the DataVerse is Static in nature
and the data in the DataVerse changes only when external
motion acts upon it. The operation acting on the data
called Algorithm is also a static data. Any algorithm
acting on the data will give deterministic result. No
randomness can be created in DataVerse.
4. Discrete: Since there are only two Elementary Symbols
Bits(0,1) and no fractional symbols are created, the
DataVerse is discreet and countable in nature.
5. Finite and Countable: Any subset of the DataVerse is
finite and Countable.
6. Unintelligent: Since Agent/Actor is not the component
of the DataVerse, DataVerse do not make any sense to its
content.
7. Dependent on Unmanifested DataVerse for Creation or
Absorption of Data.
8. All knowledge (set of Data and the Operators Action on
Data) exist in the DataVerse.
Process of creation of DataVerse from the Axiomatic Model
The creation of the DataVerse happens by the process of
Evolution and Emergence. More and more complex data is created
by the successive evolution and emergence.
a) Creation of Language
The Elementary code inside the DataVerse in presence of
Agent and Motion Element moves to produce patterns. The Agent
chooses some of the patterns that make sense to form alphabets.
Making sense is the property of Agent. The alphabets becomes the
first level of Emergence for a language. The Agent in association
with Motion Element Continues its interplay to make Words i.e.
the combinations of alphabets that make sense, the Second level
of Emergence. Other combinations which are not relevant to the
Agent also exist in the DataVerse. This process of Emergence or
Evolution continues to make Sentences, Paragraphs, Chapters,
Books, Subject etc. The data in the DataVerse changes level of
Emergence both in terms of depth and Diversity. The complete
universe of data is formed from the above process of Emergence
and Evolution. The DataVerse formed from this Interplay of the
Elementary Code is called Manifested DataVerse.
b. Conway’s Game of Life (Agent based modelling)
The process of creation is also seen in the Conway’s Game of Life
(Gardner, 1970), an agent based model. The bits in the
Square of the Game is the Data. All the data in the game is all
combination of 0’s and 1’s. The bits in the game are created or
destroyed as per the need of the game. This data is static unless the
tick happens. This tick is the motion element that acts on the data
that changes the state of the data. Hence this motion is external to
the DataVerse of the Game. This motion can be single tick or
continuous ticks. The Data in the Square will change state so long
the tick happens. At every tick, the data gets modified as per the
rule defined by the Programmer. Here the agent does not take the
decision but follows the logic of the programmer. Any pattern
form in the data is based on the logic defined by the programmer.
Here the real agent is the programmer which decides the how the
data will change in the Game. It is again the programmer which
sees the pattern in the data. Making sense is the property of the
Agent. Different observers may identify different patterns. Based
on the patterns the programmer may decide to change the logic of
the game thus resulting into more patterns. This iterative process
gives both emergence and diversity resulting into complex
creative process.
V. CONCLUSION
This paper is an attempt to present the Information
Universe as an Entity in the holistic perspective and named as
DataVerse. It gives the crisp definition its nature and properties.
The process of creation through emergence and evolution into a
complex Information Universe. This model is also the seed to
model the Real Universe. DataVerse together with the Real
Universe can define the complete Reality (real and Virtual).
REFERENCES
[1] Cohchester, J. (2016, 07 30). Instantiation. Retrieved from Complexity Labs: http://complexitylabs.io/instantiation/

International Journal of Scientific and Research Publications, Volume 10, Issue 1, January 2020 134
ISSN 2250-3153
http://dx.doi.org/10.29322/IJSRP.10.01.2020.p9719 www.ijsrp.org
[2] Colchester, J. (2018, 02 08). Datafication - Complexity Labs. Retrieved from Complexity Labs: http://complexitylabs.io/datafication
[3] Gardner, M. (1970, October). MATHEMATICAL GAMES:The fantastic combinations of John Conway's new solitaire game "life". Scientific American, pp. 120-123. Retrieved 11 30, 2018, from https://web.archive.org/web/20090603015231/http://ddi.cs.uni-potsdam.de/HyFISCH/Produzieren/lis_projekt/proj_gamelife/ConwayScientificAmerican.htm
AUTHORS
First Author – Ashutosh
Gupta was born in Badaun UP
India, in 1969. He received the
B.Tech. degree in Electronics &
Communications engineering
from the Banaras Hindu
University, Varanasi in
1991and the M.E (EcE) degrees
in Electrical Communications Engineering from the Indian
Institute of Science(IISc) Bangalore, India in 1993.
In 1993, he joined the Department of Telecom, Govt. of India as
India Telecommunications Services. From 1996 to 2000, he was
instructor in Advanced Level Telecom Training Center,
Ghaziabad. From 2000 to 2009 he was head of IT in Gujarat
Circle, BSNL Ahmedabad. He was in-charge of pricing of
Mobile Services for 4 years at BSNL Corporate Office New
Delhi since 2009. Presently he is head of Wireline Business and
IT in Gujarat Telecom Circle BSNL Ahmedabad.
Apart from his profession life, his interests are in
studying recent development in Science and Technology,
Complex Systems. In contrast, his interests are in studying
ancient Indian Philosophy of Samkhya Yoga, Patanjali Yoga,
Bhagwat Gita etc.
Email: [email protected]
Mobile: 9426001919
International Journal of Scientific and Research Publications, Volume 10, Issue 1, January 2020 135
ISSN 2250-3153
http://dx.doi.org/10.29322/IJSRP.10.01.2020.p9720 www.ijsrp.org
Diversity V Multiculturalism Advantages And
Disadvantages Of Workplace Diversity
Ositadima Emeka Alozie
Business Management And Administration, Osichukwu Services Consultancy; American Public University System - American Military University
DOI: 10.29322/IJSRP.10.01.2020.p9720
http://dx.doi.org/10.29322/IJSRP.10.01.2020.p9720
Abstract- The concept of multiculturalism and diversity in
organizations continues to draw management and public attentions
due to the constantly changing global business atmosphere
especially for multinational corporations (MNCs). Diversity and
multiculturalism are most times interwoven terms that calls for an
organizational culture that allows all members to pursue their
objectives’ without being hindered by factors such as age, gender,
race, religion, nationality or other potentials that do not contribute
to performance. Obviously, diversity and multiculturalism are two
terms that are most times used interchangeably, thus, making it
difficult for some scholars, managers, and corporate officers etc.
to differentiate between the two terms. However, this research
paper focuses on the basic differences between diversity and
multiculturalism as well as the pros and cons of diversity in an
organization.
Index Terms- administration, business, management, diversity,
multiculturalism, workplace, culture.
I. INTRODUCTION
iversity and multiculturalism do not exist without
organizational culture which is the fundamental beliefs,
expectations, norms and values, and ways of interrelationship that
contribute to the distinctive social and psychological
organizational environment, however, culture is based on
collective attitudes, beliefs, customs, and rules existing within the
organization which are considered to be valid. Moreover, culture
is considered primary values that direct people’s behavior
(Eriksen, 2018) within an organization. Globalization a
phenomenon that allows the interaction and integration of people,
firms and governments from various countries with one another
are facilitated by diversity and multiculturalism, which enables
them to take advantage of business opportunities enhanced via
information technology.
A study of diversity and multiculturalism in multicultural
corporations in Singapore shows that employees’ perceptions of
multiculturalism and a diverse workforce are directly proportional
to individual and organizational productivity (DeLancey, 2013).
The challenges faced by organizations especially of being in
business and gaining competitive edge, have compelled them to
search for new strategies of developing solutions to mitigate such
challenges in order to boost their performances. Therefore,
organizations currently concentrate on the inclusion of workforce
against monolithic structures that have customarily been in place,
with the view of exploring the range of opportunities put in place
by a mix of capabilities leading to a broad diversity (Ayega &
Muathe, 2018).
Diversity and multiculturalism remains an important issue
for the management of organizations, but unfortunately some of
them still run on issues due to the fact that they still find it difficult
to differentiate between diversity and multiculturalism.
Obviously, for managers and supervisors to effectively recognize
the dynamic changes and evolution in the workplace, they must
first comprehend the basic difference between diversity and
multiculturalism to successfully ensure a multicultural and diverse
workforce. Managing diversity remains an important
organizational challenge, therefore, managerial skills must adjust
to accommodate a multicultural work environment (Clark et al,
2016).
Certainly, for organizations to realize the needed potentials
vital for productivity and profitability, they must strive to meet the
standard of the modern workforce diversity, thus, for firms to reap
the benefits of cultural diversity in the workplace they must
communicate their obligations to dealing with the challenges of
divers workforce (Eriksen, 2018). However, employers must be
able to differentiate between workplace diversity and
multiculturalism, understand why a diverse workforce is important
by knowing the advantages and disadvantages of diversity in the
workplace. Besides, organizations must be appeased with their
employees’ diversity to prevent unwholesome workplace issues
such as entrenchment, awkwardness, and hostility (Eriksen, 2018).
This research paper is designed to assist managers, supervisors and
organizational team leaders etc. to have more elaborate knowledge
of the difference between workplace diversity and
multiculturalism, understand the merits of diversity in the
workplace to effectively manage diverse workforces.
Diversity
Diversity in the workplace refers to the difference between
employees such as race, gender, religion, sexual orientation,
ethnicity, socioeconomic background, etc. (Nedha, 2016). Esty et
al. 1995 defined diversity as acknowledging, comprehending,
accepting and valuing variations among individuals with regard to
age, gender, ethnicity, class, race, and disability, etc (Clark et al.
2016). More so, workplace diversity is the differences in race,
language, nationality, religion, age, and sexual orientation
(Martin, 2014) among individuals.
D
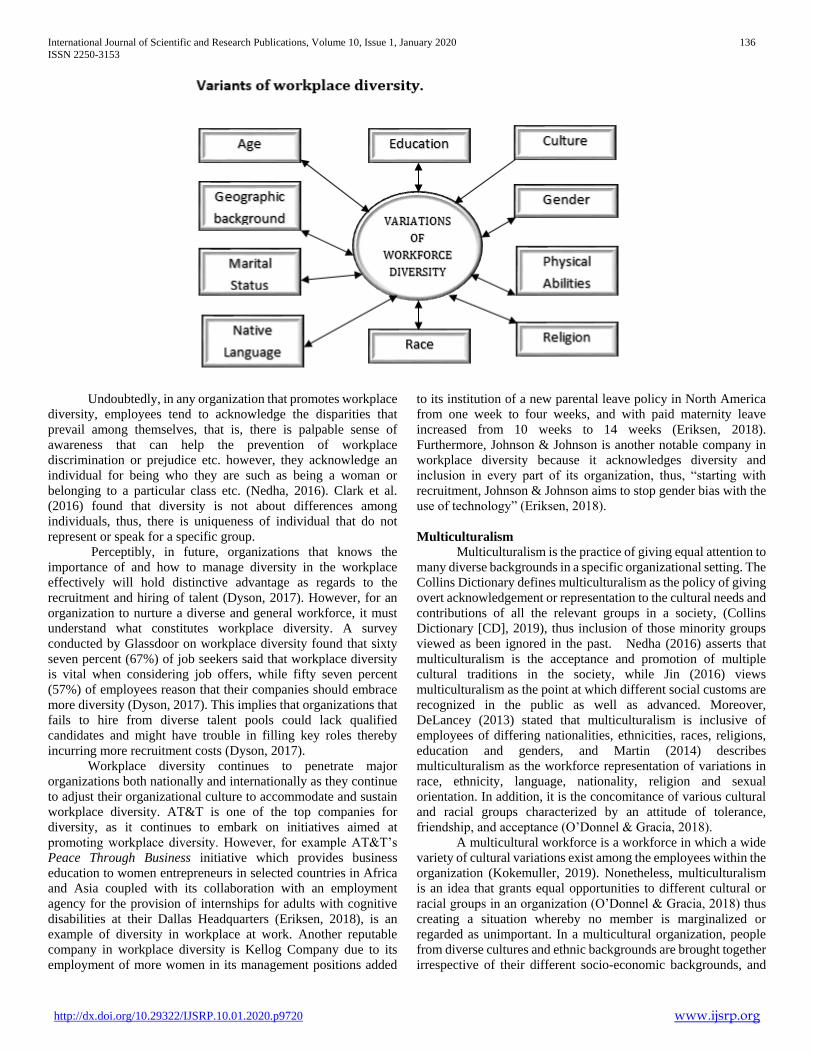
International Journal of Scientific and Research Publications, Volume 10, Issue 1, January 2020 136
ISSN 2250-3153
http://dx.doi.org/10.29322/IJSRP.10.01.2020.p9720 www.ijsrp.org
Undoubtedly, in any organization that promotes workplace
diversity, employees tend to acknowledge the disparities that
prevail among themselves, that is, there is palpable sense of
awareness that can help the prevention of workplace
discrimination or prejudice etc. however, they acknowledge an
individual for being who they are such as being a woman or
belonging to a particular class etc. (Nedha, 2016). Clark et al.
(2016) found that diversity is not about differences among
individuals, thus, there is uniqueness of individual that do not
represent or speak for a specific group.
Perceptibly, in future, organizations that knows the
importance of and how to manage diversity in the workplace
effectively will hold distinctive advantage as regards to the
recruitment and hiring of talent (Dyson, 2017). However, for an
organization to nurture a diverse and general workforce, it must
understand what constitutes workplace diversity. A survey
conducted by Glassdoor on workplace diversity found that sixty
seven percent (67%) of job seekers said that workplace diversity
is vital when considering job offers, while fifty seven percent
(57%) of employees reason that their companies should embrace
more diversity (Dyson, 2017). This implies that organizations that
fails to hire from diverse talent pools could lack qualified
candidates and might have trouble in filling key roles thereby
incurring more recruitment costs (Dyson, 2017).
Workplace diversity continues to penetrate major
organizations both nationally and internationally as they continue
to adjust their organizational culture to accommodate and sustain
workplace diversity. AT&T is one of the top companies for
diversity, as it continues to embark on initiatives aimed at
promoting workplace diversity. However, for example AT&T’s
Peace Through Business initiative which provides business
education to women entrepreneurs in selected countries in Africa
and Asia coupled with its collaboration with an employment
agency for the provision of internships for adults with cognitive
disabilities at their Dallas Headquarters (Eriksen, 2018), is an
example of diversity in workplace at work. Another reputable
company in workplace diversity is Kellog Company due to its
employment of more women in its management positions added
to its institution of a new parental leave policy in North America
from one week to four weeks, and with paid maternity leave
increased from 10 weeks to 14 weeks (Eriksen, 2018).
Furthermore, Johnson & Johnson is another notable company in
workplace diversity because it acknowledges diversity and
inclusion in every part of its organization, thus, “starting with
recruitment, Johnson & Johnson aims to stop gender bias with the
use of technology” (Eriksen, 2018).
Multiculturalism
Multiculturalism is the practice of giving equal attention to
many diverse backgrounds in a specific organizational setting. The
Collins Dictionary defines multiculturalism as the policy of giving
overt acknowledgement or representation to the cultural needs and
contributions of all the relevant groups in a society, (Collins
Dictionary [CD], 2019), thus inclusion of those minority groups
viewed as been ignored in the past. Nedha (2016) asserts that
multiculturalism is the acceptance and promotion of multiple
cultural traditions in the society, while Jin (2016) views
multiculturalism as the point at which different social customs are
recognized in the public as well as advanced. Moreover,
DeLancey (2013) stated that multiculturalism is inclusive of
employees of differing nationalities, ethnicities, races, religions,
education and genders, and Martin (2014) describes
multiculturalism as the workforce representation of variations in
race, ethnicity, language, nationality, religion and sexual
orientation. In addition, it is the concomitance of various cultural
and racial groups characterized by an attitude of tolerance,
friendship, and acceptance (O’Donnel & Gracia, 2018).
A multicultural workforce is a workforce in which a wide
variety of cultural variations exist among the employees within the
organization (Kokemuller, 2019). Nonetheless, multiculturalism
is an idea that grants equal opportunities to different cultural or
racial groups in an organization (O’Donnel & Gracia, 2018) thus
creating a situation whereby no member is marginalized or
regarded as unimportant. In a multicultural organization, people
from diverse cultures and ethnic backgrounds are brought together
irrespective of their different socio-economic backgrounds, and
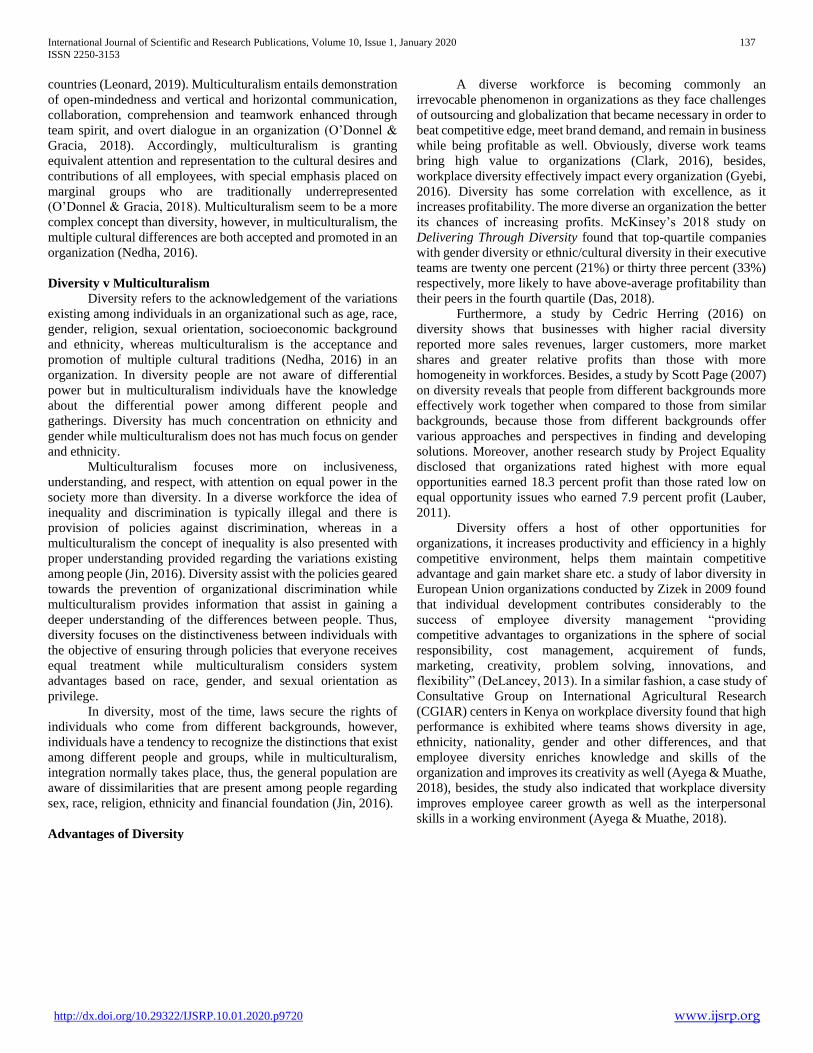
International Journal of Scientific and Research Publications, Volume 10, Issue 1, January 2020 137
ISSN 2250-3153
http://dx.doi.org/10.29322/IJSRP.10.01.2020.p9720 www.ijsrp.org
countries (Leonard, 2019). Multiculturalism entails demonstration
of open-mindedness and vertical and horizontal communication,
collaboration, comprehension and teamwork enhanced through
team spirit, and overt dialogue in an organization (O’Donnel &
Gracia, 2018). Accordingly, multiculturalism is granting
equivalent attention and representation to the cultural desires and
contributions of all employees, with special emphasis placed on
marginal groups who are traditionally underrepresented
(O’Donnel & Gracia, 2018). Multiculturalism seem to be a more
complex concept than diversity, however, in multiculturalism, the
multiple cultural differences are both accepted and promoted in an
organization (Nedha, 2016).
Diversity v Multiculturalism
Diversity refers to the acknowledgement of the variations
existing among individuals in an organizational such as age, race,
gender, religion, sexual orientation, socioeconomic background
and ethnicity, whereas multiculturalism is the acceptance and
promotion of multiple cultural traditions (Nedha, 2016) in an
organization. In diversity people are not aware of differential
power but in multiculturalism individuals have the knowledge
about the differential power among different people and
gatherings. Diversity has much concentration on ethnicity and
gender while multiculturalism does not has much focus on gender
and ethnicity.
Multiculturalism focuses more on inclusiveness,
understanding, and respect, with attention on equal power in the
society more than diversity. In a diverse workforce the idea of
inequality and discrimination is typically illegal and there is
provision of policies against discrimination, whereas in a
multiculturalism the concept of inequality is also presented with
proper understanding provided regarding the variations existing
among people (Jin, 2016). Diversity assist with the policies geared
towards the prevention of organizational discrimination while
multiculturalism provides information that assist in gaining a
deeper understanding of the differences between people. Thus,
diversity focuses on the distinctiveness between individuals with
the objective of ensuring through policies that everyone receives
equal treatment while multiculturalism considers system
advantages based on race, gender, and sexual orientation as
privilege.
In diversity, most of the time, laws secure the rights of
individuals who come from different backgrounds, however,
individuals have a tendency to recognize the distinctions that exist
among different people and groups, while in multiculturalism,
integration normally takes place, thus, the general population are
aware of dissimilarities that are present among people regarding
sex, race, religion, ethnicity and financial foundation (Jin, 2016).
Advantages of Diversity
A diverse workforce is becoming commonly an
irrevocable phenomenon in organizations as they face challenges
of outsourcing and globalization that became necessary in order to
beat competitive edge, meet brand demand, and remain in business
while being profitable as well. Obviously, diverse work teams
bring high value to organizations (Clark, 2016), besides,
workplace diversity effectively impact every organization (Gyebi,
2016). Diversity has some correlation with excellence, as it
increases profitability. The more diverse an organization the better
its chances of increasing profits. McKinsey’s 2018 study on
Delivering Through Diversity found that top-quartile companies
with gender diversity or ethnic/cultural diversity in their executive
teams are twenty one percent (21%) or thirty three percent (33%)
respectively, more likely to have above-average profitability than
their peers in the fourth quartile (Das, 2018).
Furthermore, a study by Cedric Herring (2016) on
diversity shows that businesses with higher racial diversity
reported more sales revenues, larger customers, more market
shares and greater relative profits than those with more
homogeneity in workforces. Besides, a study by Scott Page (2007)
on diversity reveals that people from different backgrounds more
effectively work together when compared to those from similar
backgrounds, because those from different backgrounds offer
various approaches and perspectives in finding and developing
solutions. Moreover, another research study by Project Equality
disclosed that organizations rated highest with more equal
opportunities earned 18.3 percent profit than those rated low on
equal opportunity issues who earned 7.9 percent profit (Lauber,
2011).
Diversity offers a host of other opportunities for
organizations, it increases productivity and efficiency in a highly
competitive environment, helps them maintain competitive
advantage and gain market share etc. a study of labor diversity in
European Union organizations conducted by Zizek in 2009 found
that individual development contributes considerably to the
success of employee diversity management “providing
competitive advantages to organizations in the sphere of social
responsibility, cost management, acquirement of funds,
marketing, creativity, problem solving, innovations, and
flexibility” (DeLancey, 2013). In a similar fashion, a case study of
Consultative Group on International Agricultural Research
(CGIAR) centers in Kenya on workplace diversity found that high
performance is exhibited where teams shows diversity in age,
ethnicity, nationality, gender and other differences, and that
employee diversity enriches knowledge and skills of the
organization and improves its creativity as well (Ayega & Muathe,
2018), besides, the study also indicated that workplace diversity
improves employee career growth as well as the interpersonal
skills in a working environment (Ayega & Muathe, 2018).
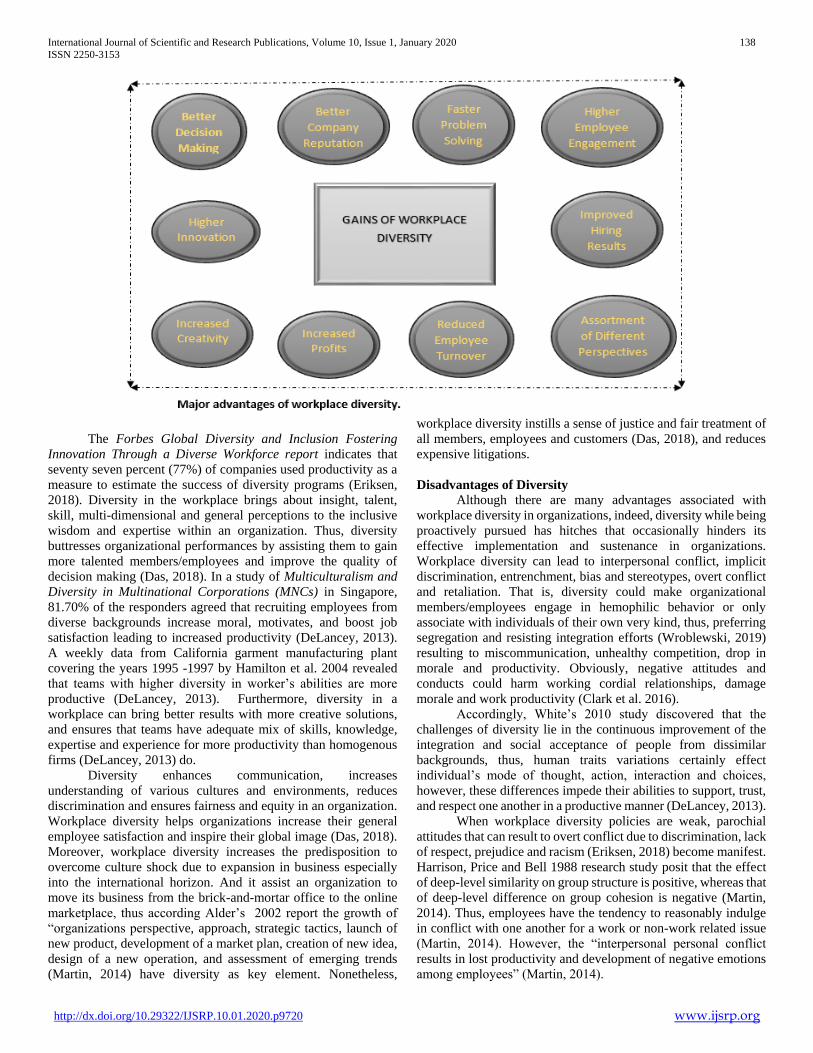
International Journal of Scientific and Research Publications, Volume 10, Issue 1, January 2020 138
ISSN 2250-3153
http://dx.doi.org/10.29322/IJSRP.10.01.2020.p9720 www.ijsrp.org
The Forbes Global Diversity and Inclusion Fostering
Innovation Through a Diverse Workforce report indicates that
seventy seven percent (77%) of companies used productivity as a
measure to estimate the success of diversity programs (Eriksen,
2018). Diversity in the workplace brings about insight, talent,
skill, multi-dimensional and general perceptions to the inclusive
wisdom and expertise within an organization. Thus, diversity
buttresses organizational performances by assisting them to gain
more talented members/employees and improve the quality of
decision making (Das, 2018). In a study of Multiculturalism and
Diversity in Multinational Corporations (MNCs) in Singapore,
81.70% of the responders agreed that recruiting employees from
diverse backgrounds increase moral, motivates, and boost job
satisfaction leading to increased productivity (DeLancey, 2013).
A weekly data from California garment manufacturing plant
covering the years 1995 -1997 by Hamilton et al. 2004 revealed
that teams with higher diversity in worker’s abilities are more
productive (DeLancey, 2013). Furthermore, diversity in a
workplace can bring better results with more creative solutions,
and ensures that teams have adequate mix of skills, knowledge,
expertise and experience for more productivity than homogenous
firms (DeLancey, 2013) do.
Diversity enhances communication, increases
understanding of various cultures and environments, reduces
discrimination and ensures fairness and equity in an organization.
Workplace diversity helps organizations increase their general
employee satisfaction and inspire their global image (Das, 2018).
Moreover, workplace diversity increases the predisposition to
overcome culture shock due to expansion in business especially
into the international horizon. And it assist an organization to
move its business from the brick-and-mortar office to the online
marketplace, thus according Alder’s 2002 report the growth of
“organizations perspective, approach, strategic tactics, launch of
new product, development of a market plan, creation of new idea,
design of a new operation, and assessment of emerging trends
(Martin, 2014) have diversity as key element. Nonetheless,
workplace diversity instills a sense of justice and fair treatment of
all members, employees and customers (Das, 2018), and reduces
expensive litigations.
Disadvantages of Diversity
Although there are many advantages associated with
workplace diversity in organizations, indeed, diversity while being
proactively pursued has hitches that occasionally hinders its
effective implementation and sustenance in organizations.
Workplace diversity can lead to interpersonal conflict, implicit
discrimination, entrenchment, bias and stereotypes, overt conflict
and retaliation. That is, diversity could make organizational
members/employees engage in hemophilic behavior or only
associate with individuals of their own very kind, thus, preferring
segregation and resisting integration efforts (Wroblewski, 2019)
resulting to miscommunication, unhealthy competition, drop in
morale and productivity. Obviously, negative attitudes and
conducts could harm working cordial relationships, damage
morale and work productivity (Clark et al. 2016).
Accordingly, White’s 2010 study discovered that the
challenges of diversity lie in the continuous improvement of the
integration and social acceptance of people from dissimilar
backgrounds, thus, human traits variations certainly effect
individual’s mode of thought, action, interaction and choices,
however, these differences impede their abilities to support, trust,
and respect one another in a productive manner (DeLancey, 2013).
When workplace diversity policies are weak, parochial
attitudes that can result to overt conflict due to discrimination, lack
of respect, prejudice and racism (Eriksen, 2018) become manifest.
Harrison, Price and Bell 1988 research study posit that the effect
of deep-level similarity on group structure is positive, whereas that
of deep-level difference on group cohesion is negative (Martin,
2014). Thus, employees have the tendency to reasonably indulge
in conflict with one another for a work or non-work related issue
(Martin, 2014). However, the “interpersonal personal conflict
results in lost productivity and development of negative emotions
among employees” (Martin, 2014).
International Journal of Scientific and Research Publications, Volume 10, Issue 1, January 2020 139
ISSN 2250-3153
http://dx.doi.org/10.29322/IJSRP.10.01.2020.p9720 www.ijsrp.org
Diversity increases the chances of ligation against the
organization. Wroblewski (2019) asserts that many employees feel
uneasy working with managers from different backgrounds, and
that discriminating against a worker has direct impact on the
worker’s productivity.
Conclusion
Obviously, there is marked difference between workplace
diversity and multiculturalism, but most times the former does not
occur without the later. DeLancey (2013) study on
Multiculturalism and Diversity in Multinational Corporations in
Singapore found that 77.44% of the respondents agreed that a
multicultural and diverse workforce enriches them personally to
work harder, and that multiculturalism and diversity in
organizations are assets for planned survival and competitiveness
in a universal economy. In addition, 78.63% agreed that
multiculturalism and diversity are good and result to workforce
coherence (DeLancey, 2013).
A diverse workforce has become imperative in today’s
market place, therefore, for organizations to achieve its desired
aims of increasing stakeholders and shareholders wealth, they
must embrace diversity and multiculturalism to be well positioned
to proffer adequate solution to its business problems. Diversity
management in organizations benefits associates through the
creation of a fair and safe environment where all and sundry have
access to opportunities and challenges (DeLancey, 2013).
Workplace diversity has a positive correlation with
organizational culture, thus, organizational culture determines its
level of diversity. DeLnacey (2013) study found that 89.63% of
the responders agreed that organizational culture that inspires
diversity, employee involvement, and creates a sense of ownership
and responsibility is essential for the management of a successful,
diverse, and happy workforce. Certainly, Brief’s 2008 report
shows that diversity has important effect for the promotion of
positive organizational change by enhancing both personal and
organizational performance (DeLancey, 2013). More so, a diverse
workforce ensures the safety of employees and encourage them to
interact effectively.
Although workplace diversity has some demerits,
certainly, its advantages far outweigh its disadvantages. Indeed, a
diverse workforce reflects changing business world and
marketplace. A study by Cameron and Caza in 2004 indicates that
the benefits of diversity can translate in employees’ satisfaction,
higher levels of physical and psychological well-being, and
financial strength (DeLancey, 2013). Moreover, Koonce’s 2001
study asserts that to reap the benefits of diverse and multicultural
workforce organizations should put in place and sustain ongoing
training (DeLancey, 2013) in order to impact people’s behavior.
Besides, managers should understand the meaning, significance
and implications of diversity, and there should be promotion of a
safe place for associate communication through the
implementation of policies that provides and allows associates
access to information (DeLancey, 2013). Furthermore, there
should be established rules and regulations promoting workplace
diversity while prohibiting discrimination at all levels.
REFERENCES
[1] Ayega, E. N & Muathe, S. (2018). Critical Review of Literature on Cultural Diversity in the Work Place and Organizational Performance: A Research Agenda. Journal of Human Resources Management, 6(1), 1 -15. Retrieved from http://www.sciencepublishinggroup.com/j/jhrm
[2] Clark, L. J., Farnsworth, D., Green, K., Kepner, K., Lopez, M & Wysocki, A. (2016). Diversity in the Workplace: Benefits, Challenges and the Required Managerial Tools. University of Florida, 1 – 3. Retrieved from https://edis.ifas.ufl.edu/pdffiles/HR/HR02200.pdf
[3] Collins Dictionary (2019). Multiculturalism. Collins. Retrieved from https://www.collinsdictionary.com/dictionary/english/multiculturalism.
[4] Das, S. (2018). Impact of Ethnic Diversity and Multiculturalism in Corporate Culture. Entrepreneur. Retrieved from https://www.entrepreneur.com/article/316482
[5] DeLancey, M.R (2013). Employees’ Perceptions of Multiculturalism and Diversity in Multinational Corporation. academicJournals, 7(35), 3560 – 3566. Retrieved from https://academicjournals.org/article/article1380705787_DeLancey.pdf Dyson, E. (2017). The Shifting Definition of Diversity in the Workplace. Peoplescout. Retrieved from ABI/Inform Global database
[6] Collins Dictionary (2009). Multiculturalism. Collins. Retrieved from https://collinsdictionary.com/dictionary/english/multiculturalism
[7] Eriksen, K. (2018). The Importance of Cultural Diversity in the Workplace. Retrieved from https://www.deputy.com/blog/the-importance-of-cultural-diversity-in-the-workplace
[8] Gyebi, O. K. (2016). The Impact of Multicultural Working Environment on Employees at Workplace. Business Economics, 13 – 16. Retrieved from https://www.theseus.fi/bitstream/handle/10024/143420/Gyebi_Kerlyn.pdf?sequence=1
[9] Herring, C., “Does Diversity Pay? Racial Composition of Firms and the Business Case for Diversity” (paper presented at the annual meeting of the American Sociological Association, Montreal, Canada, August 11, 2006). Retrieved from http://citation.allacademic.com/meta/p_mla_apa_research_citation/1/0/1/7/9/pages101792/p101792-1.php
[10] Jin (2016). Difference between Diversity and Multiculturalism. Academic Heaven. Retrieved from https://researchpedia.info/difference-between-diversity-and-multiculturalism/
[11] Kokemuller, N. (2019). Definitions of Multiculturalism in the Workplace. Chron. Retrieved from https://www.smallbusiness.chron.com/definition-multiculturalism-workplace-15469.html
[12] Lauber, M., “Studies Show That Diversity in Workplace Is Profitable,” Project Equality. Retrieved from http://www.villagelife.org/news/archives/diversity.html
[13] Leonard, K. (2019). The Advantages of Multiculturalism in the Workplace. Chron. Retrieved from ABI/Inform Global databse
[14] Martin, C. G. (2014). The Effects of Cultural Diversity in the Workplace. Journal of Diversity Management, 9(2), 89 – 90. Retrieved from
[15] https://clutejournals.com/index.php/JDM/article/download/8974/8934
[16] Nedha (2016). Difference between Diversity and Multiculturalism. Retrieved from https://www.differencebetween.com/difference-between-diversity-and-multiculturalism/
[17] O’Donnel, E & Gracia. M. (2018). The Benefits of Multiculturalism in the Workplace. Wolfstone. Retrieved from https://www.wolfestone.co.uk/blog/benefits-multiculturalism-workplace/
[18] Page, S. E., The Difference: How the Power of Diversity Creates Better Groups, Firms, Schools, and Societies (Princeton, NJ: Princeton University Press, 2007).
[19] Wroblewski, M. T. (2019). Negative Effects of Diversity in the Workplace. Chron. Retrieved from https://smallbusiness.chron.com/negative-effects-diversity-workplace-18443.html
AUTHORS
First Author – Ositadima Emeka Alozie
August 2019, Business Management And Administration,

International Journal of Scientific and Research Publications, Volume 10, Issue 1, January 2020 140
ISSN 2250-3153
http://dx.doi.org/10.29322/IJSRP.10.01.2020.p9720 www.ijsrp.org
Osichukwu Services Consultancy; American Public University
System - American Military University
International Journal of Scientific and Research Publications, Volume 10, Issue 1, January 2020 142
ISSN 2250-3153
http://dx.doi.org/10.29322/IJSRP.10.01.2020.p9721 www.ijsrp.org
Real Time Eye Gaze Detection Using Machine
Learning Techniques
Achudan TS
Department of Electrical and Electronics Engineering
Mepco Schlenk Engineering College, Sivakasi, Virudhunagar- 626005, India. Phone number: +91 9994301185
Gobinath N
Department of Electrical and Electronics Engineering
Mepco Schlenk Engineering College, Sivakasi, Virudhunagar- 626005, India. Phone Number: +916383227981
DOI: 10.29322/IJSRP.10.01.2020.p9721
http://dx.doi.org/10.29322/IJSRP.10.01.2020.p9721
Abstract:
Drowsiness and exhaustion of vehicle drivers reduce the
driver's abilities to control the vehicle, his natural reflex,
and perception. Such diminished vigilance level of
drivers is observed at night driving or prolonged
driving, causing an accident and pose a severe threat to
commuters. Therefore, it is an absolute requisite in the
automobile industry to assimilate the driver assistance
system that can detect drowsiness and fatigue of the
drivers. This paper proposes a prototype for monitoring
the driver's vigilance using a computer vision system in
real-time. Eye-tracking is one of the critical parts in
future driver assistance systems since human eyes
contain much-needed information about the driver's
condition, such as attention level, gaze, and fatigue
level. One common problem faced by many eye-
tracking methods proposed so far is their sensitivity to
change in lighting conditions. This tends to limit their
scope for automotive applications significantly. This
paper illustrates an eye-gaze detection and tracking
method that works under realistic and variable lighting
conditions in real-time. Keywords: OpenCV, eye gaze,
image processing, Machine Learning, drowsiness
detection.
Keywords: OpenCV, eye gaze, image processing,
Machine Learning, drowsiness detection
INTRODUCTION
The increasing number of traffic accidents due to a
driver's diminished vigilance level is a severe problem
for society. Driver's abilities to control the vehicle, his
natural reflex, and perception decline drastically due to
fatigue and drowsiness, reducing the driver's vigilance
level. These ultimately results in a threat, not only to
other lives but also to their own. According to the U.S.
National Highway Traffic Safety Administration
(NHTSA), in 2017, drowsiness and falling asleep while
driving is responsible for at least 91,000 automobile
crashes annually. The annual average of nonfatal
injuries is 40,000, and 1,306 fatalities are from these
crashes. More than a hundred billion dollars in damage
occurs annually due to drowsiness related crashes.
These figures only present the casualties happening
from midnight to early morning, and underestimates the
involvement of sleepiness because the above data does
not include crashes during daytime hours. Vehicles
having systems that are intelligent can detect drowsiness
and alert the driver.
I. THE BASE IDEA
The central concept of Driver Drowsiness Detection is
to capture a driver's face from a camera and accurately
be able to calculate their drowsiness level, processing it
in real-time. To achieve the requirements as mentioned
earlier, Open CV library can be used, for its
convenience and compatibility. Various tools used for
our prototype are discussed below.
A. OPENCV
Open-source computer vision is a popular computer
vision library that has the class for face recognition
using the latest computer vision algorithms. Face
recognition build on the geometric features of a face is
probably the most intuitive approach to face
recognition.
B. SCIPY
SCIPY is a library that uses NumPy for various
mathematical functions. SciPy uses NumPy arrays as
the underlying data structure and comes with modules
for various commonly used tasks in scientific
programming, including linear algebra, ordinary
differential equation solving, integration calculus, and
signal processing. SciPy is used in this scenario to
calculate the Euclidian distance between the vector
points plotted on the eyes.
C. DLib
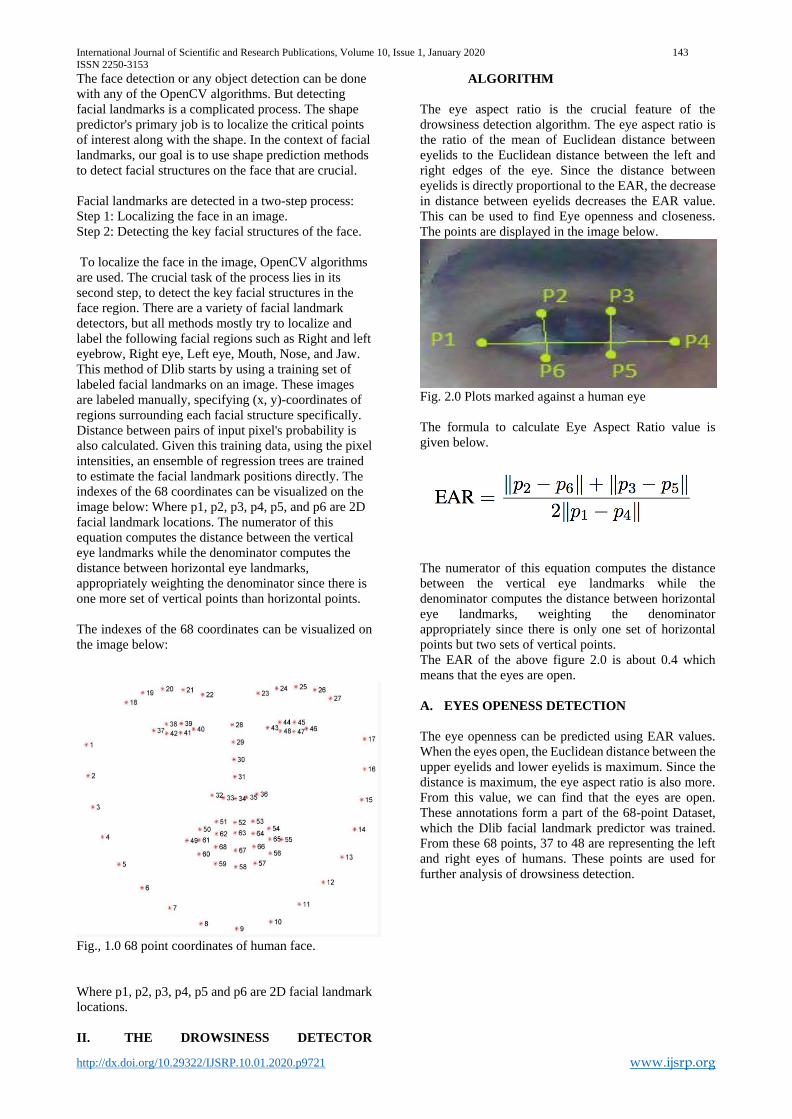
International Journal of Scientific and Research Publications, Volume 10, Issue 1, January 2020 143
ISSN 2250-3153
http://dx.doi.org/10.29322/IJSRP.10.01.2020.p9721 www.ijsrp.org
The face detection or any object detection can be done
with any of the OpenCV algorithms. But detecting
facial landmarks is a complicated process. The shape
predictor's primary job is to localize the critical points
of interest along with the shape. In the context of facial
landmarks, our goal is to use shape prediction methods
to detect facial structures on the face that are crucial.
Facial landmarks are detected in a two-step process:
Step 1: Localizing the face in an image.
Step 2: Detecting the key facial structures of the face.
To localize the face in the image, OpenCV algorithms
are used. The crucial task of the process lies in its
second step, to detect the key facial structures in the
face region. There are a variety of facial landmark
detectors, but all methods mostly try to localize and
label the following facial regions such as Right and left
eyebrow, Right eye, Left eye, Mouth, Nose, and Jaw.
This method of Dlib starts by using a training set of
labeled facial landmarks on an image. These images
are labeled manually, specifying (x, y)-coordinates of
regions surrounding each facial structure specifically.
Distance between pairs of input pixel's probability is
also calculated. Given this training data, using the pixel
intensities, an ensemble of regression trees are trained
to estimate the facial landmark positions directly. The
indexes of the 68 coordinates can be visualized on the
image below: Where p1, p2, p3, p4, p5, and p6 are 2D
facial landmark locations. The numerator of this
equation computes the distance between the vertical
eye landmarks while the denominator computes the
distance between horizontal eye landmarks,
appropriately weighting the denominator since there is
one more set of vertical points than horizontal points.
The indexes of the 68 coordinates can be visualized on
the image below:
Fig., 1.0 68 point coordinates of human face.
Where p1, p2, p3, p4, p5 and p6 are 2D facial landmark
locations.
II. THE DROWSINESS DETECTOR
ALGORITHM
The eye aspect ratio is the crucial feature of the
drowsiness detection algorithm. The eye aspect ratio is
the ratio of the mean of Euclidean distance between
eyelids to the Euclidean distance between the left and
right edges of the eye. Since the distance between
eyelids is directly proportional to the EAR, the decrease
in distance between eyelids decreases the EAR value.
This can be used to find Eye openness and closeness.
The points are displayed in the image below.
Fig. 2.0 Plots marked against a human eye
The formula to calculate Eye Aspect Ratio value is
given below.
The numerator of this equation computes the distance
between the vertical eye landmarks while the
denominator computes the distance between horizontal
eye landmarks, weighting the denominator
appropriately since there is only one set of horizontal
points but two sets of vertical points.
The EAR of the above figure 2.0 is about 0.4 which
means that the eyes are open.
A. EYES OPENESS DETECTION
The eye openness can be predicted using EAR values.
When the eyes open, the Euclidean distance between the
upper eyelids and lower eyelids is maximum. Since the
distance is maximum, the eye aspect ratio is also more.
From this value, we can find that the eyes are open.
These annotations form a part of the 68-point Dataset,
which the Dlib facial landmark predictor was trained.
From these 68 points, 37 to 48 are representing the left
and right eyes of humans. These points are used for
further analysis of drowsiness detection.
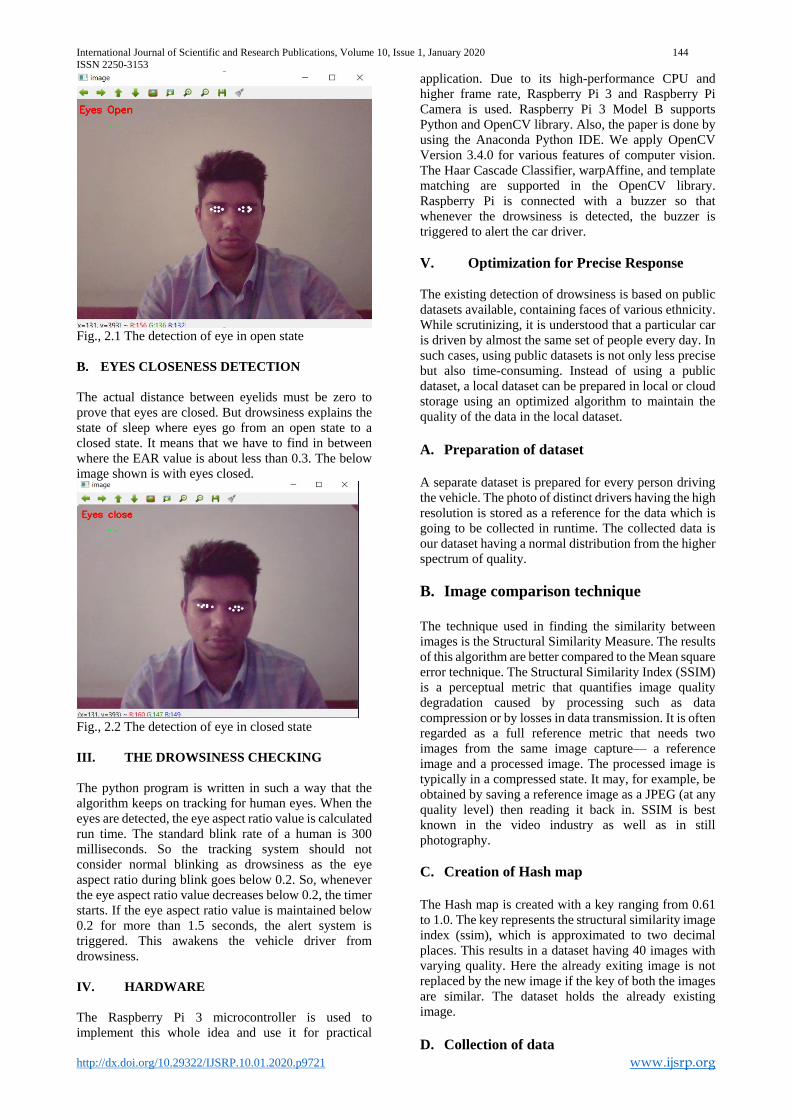
International Journal of Scientific and Research Publications, Volume 10, Issue 1, January 2020 144
ISSN 2250-3153
http://dx.doi.org/10.29322/IJSRP.10.01.2020.p9721 www.ijsrp.org
Fig., 2.1 The detection of eye in open state
B. EYES CLOSENESS DETECTION
The actual distance between eyelids must be zero to
prove that eyes are closed. But drowsiness explains the
state of sleep where eyes go from an open state to a
closed state. It means that we have to find in between
where the EAR value is about less than 0.3. The below
image shown is with eyes closed.
Fig., 2.2 The detection of eye in closed state
III. THE DROWSINESS CHECKING
The python program is written in such a way that the
algorithm keeps on tracking for human eyes. When the
eyes are detected, the eye aspect ratio value is calculated
run time. The standard blink rate of a human is 300
milliseconds. So the tracking system should not
consider normal blinking as drowsiness as the eye
aspect ratio during blink goes below 0.2. So, whenever
the eye aspect ratio value decreases below 0.2, the timer
starts. If the eye aspect ratio value is maintained below
0.2 for more than 1.5 seconds, the alert system is
triggered. This awakens the vehicle driver from
drowsiness.
IV. HARDWARE
The Raspberry Pi 3 microcontroller is used to
implement this whole idea and use it for practical
application. Due to its high-performance CPU and
higher frame rate, Raspberry Pi 3 and Raspberry Pi
Camera is used. Raspberry Pi 3 Model B supports
Python and OpenCV library. Also, the paper is done by
using the Anaconda Python IDE. We apply OpenCV
Version 3.4.0 for various features of computer vision.
The Haar Cascade Classifier, warpAffine, and template
matching are supported in the OpenCV library.
Raspberry Pi is connected with a buzzer so that
whenever the drowsiness is detected, the buzzer is
triggered to alert the car driver.
V. Optimization for Precise Response
The existing detection of drowsiness is based on public
datasets available, containing faces of various ethnicity.
While scrutinizing, it is understood that a particular car
is driven by almost the same set of people every day. In
such cases, using public datasets is not only less precise
but also time-consuming. Instead of using a public
dataset, a local dataset can be prepared in local or cloud
storage using an optimized algorithm to maintain the
quality of the data in the local dataset.
A. Preparation of dataset
A separate dataset is prepared for every person driving
the vehicle. The photo of distinct drivers having the high
resolution is stored as a reference for the data which is
going to be collected in runtime. The collected data is
our dataset having a normal distribution from the higher
spectrum of quality.
B. Image comparison technique
The technique used in finding the similarity between
images is the Structural Similarity Measure. The results
of this algorithm are better compared to the Mean square
error technique. The Structural Similarity Index (SSIM)
is a perceptual metric that quantifies image quality
degradation caused by processing such as data
compression or by losses in data transmission. It is often
regarded as a full reference metric that needs two
images from the same image capture— a reference
image and a processed image. The processed image is
typically in a compressed state. It may, for example, be
obtained by saving a reference image as a JPEG (at any
quality level) then reading it back in. SSIM is best
known in the video industry as well as in still
photography.
C. Creation of Hash map
The Hash map is created with a key ranging from 0.61
to 1.0. The key represents the structural similarity image
index (ssim), which is approximated to two decimal
places. This results in a dataset having 40 images with
varying quality. Here the already exiting image is not
replaced by the new image if the key of both the images
are similar. The dataset holds the already existing
image.
D. Collection of data
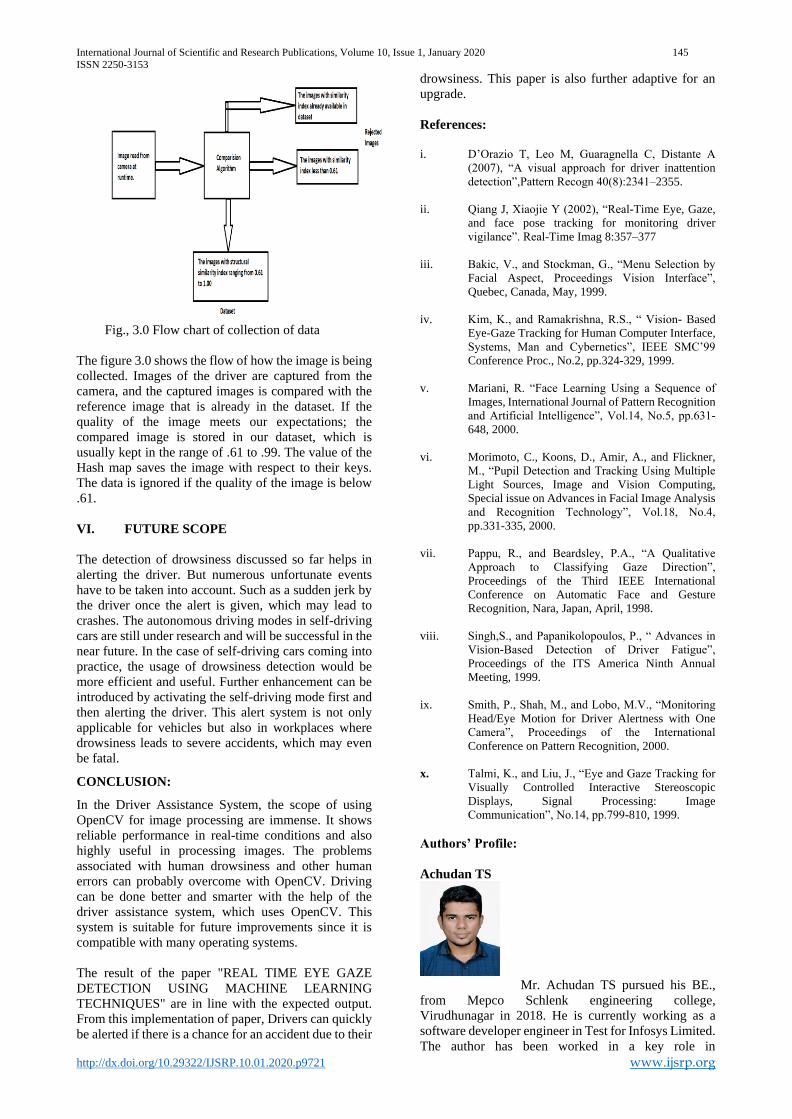
International Journal of Scientific and Research Publications, Volume 10, Issue 1, January 2020 145
ISSN 2250-3153
http://dx.doi.org/10.29322/IJSRP.10.01.2020.p9721 www.ijsrp.org
Fig., 3.0 Flow chart of collection of data
The figure 3.0 shows the flow of how the image is being
collected. Images of the driver are captured from the
camera, and the captured images is compared with the
reference image that is already in the dataset. If the
quality of the image meets our expectations; the
compared image is stored in our dataset, which is
usually kept in the range of .61 to .99. The value of the
Hash map saves the image with respect to their keys.
The data is ignored if the quality of the image is below
.61.
VI. FUTURE SCOPE
The detection of drowsiness discussed so far helps in
alerting the driver. But numerous unfortunate events
have to be taken into account. Such as a sudden jerk by
the driver once the alert is given, which may lead to
crashes. The autonomous driving modes in self-driving
cars are still under research and will be successful in the
near future. In the case of self-driving cars coming into
practice, the usage of drowsiness detection would be
more efficient and useful. Further enhancement can be
introduced by activating the self-driving mode first and
then alerting the driver. This alert system is not only
applicable for vehicles but also in workplaces where
drowsiness leads to severe accidents, which may even
be fatal.
CONCLUSION:
In the Driver Assistance System, the scope of using
OpenCV for image processing are immense. It shows
reliable performance in real-time conditions and also
highly useful in processing images. The problems
associated with human drowsiness and other human
errors can probably overcome with OpenCV. Driving
can be done better and smarter with the help of the
driver assistance system, which uses OpenCV. This
system is suitable for future improvements since it is
compatible with many operating systems.
The result of the paper "REAL TIME EYE GAZE
DETECTION USING MACHINE LEARNING
TECHNIQUES" are in line with the expected output.
From this implementation of paper, Drivers can quickly
be alerted if there is a chance for an accident due to their
drowsiness. This paper is also further adaptive for an
upgrade.
References:
i. D’Orazio T, Leo M, Guaragnella C, Distante A
(2007), “A visual approach for driver inattention
detection”,Pattern Recogn 40(8):2341–2355.
ii. Qiang J, Xiaojie Y (2002), “Real-Time Eye, Gaze,
and face pose tracking for monitoring driver
vigilance”. Real-Time Imag 8:357–377
iii. Bakic, V., and Stockman, G., “Menu Selection by
Facial Aspect, Proceedings Vision Interface”,
Quebec, Canada, May, 1999.
iv. Kim, K., and Ramakrishna, R.S., “ Vision- Based
Eye-Gaze Tracking for Human Computer Interface,
Systems, Man and Cybernetics”, IEEE SMC’99
Conference Proc., No.2, pp.324-329, 1999.
v. Mariani, R. “Face Learning Using a Sequence of
Images, International Journal of Pattern Recognition
and Artificial Intelligence”, Vol.14, No.5, pp.631-
648, 2000.
vi. Morimoto, C., Koons, D., Amir, A., and Flickner,
M., “Pupil Detection and Tracking Using Multiple
Light Sources, Image and Vision Computing,
Special issue on Advances in Facial Image Analysis
and Recognition Technology”, Vol.18, No.4,
pp.331-335, 2000.
vii. Pappu, R., and Beardsley, P.A., “A Qualitative
Approach to Classifying Gaze Direction”,
Proceedings of the Third IEEE International
Conference on Automatic Face and Gesture
Recognition, Nara, Japan, April, 1998.
viii. Singh,S., and Papanikolopoulos, P., “ Advances in
Vision-Based Detection of Driver Fatigue”,
Proceedings of the ITS America Ninth Annual
Meeting, 1999.
ix. Smith, P., Shah, M., and Lobo, M.V., “Monitoring
Head/Eye Motion for Driver Alertness with One
Camera”, Proceedings of the International
Conference on Pattern Recognition, 2000.
x. Talmi, K., and Liu, J., “Eye and Gaze Tracking for
Visually Controlled Interactive Stereoscopic
Displays, Signal Processing: Image
Communication”, No.14, pp.799-810, 1999.
Authors’ Profile:
Achudan TS
Mr. Achudan TS pursued his BE.,
from Mepco Schlenk engineering college,
Virudhunagar in 2018. He is currently working as a
software developer engineer in Test for Infosys Limited.
The author has been worked in a key role in

International Journal of Scientific and Research Publications, Volume 10, Issue 1, January 2020 146
ISSN 2250-3153
http://dx.doi.org/10.29322/IJSRP.10.01.2020.p9721 www.ijsrp.org
manufacturing of an Electric vehicle for Electric Solar
Vehicle Championship(ESVC). He had intern at Nokia
networks and solutions. His core domain is not only
electrical and electronics, but also has made a wide
range of applications in computer domain. He has two
years of experience in software industry. He is an expert
in process automation and implements devops with
CICD and AWS cloud.
Gobinath N
Mr. Gobinath N pursued his BE.,
from Mepco Schlenk engineering college,
Virudhunagar in 2018. He is currently working as a
software developer engineer in SAP Hana technology
for Infosys Limited. The author has worked in numerous
automation and image processing projects. He had
intern at Nokia networks and solutions. His core domain
is not only electrical and electronics, but also has made
a wide range of applications in computer domain. He
has two years of experience in software industry. He is
an expert in SAP ABAP development and core data
services in SAP Hana platform.

International Journal of Scientific and Research Publications, Volume 10, Issue 1, January 2020 147
ISSN 2250-3153
International Journal of Scientific and Research Publications, Volume 10, Issue 1, January 2020 148
ISSN 2250-3153
http://dx.doi.org/10.29322/IJSRP.10.01.2020.p9722 www.ijsrp.org
Translation and Tribal Areas and the Valley: Meitei
language in the Socio-Cultural Context
Thokchom Premlata Devi
DOI: 10.29322/IJSRP.10.01.2020.p9722
http://dx.doi.org/10.29322/IJSRP.10.01.2020.p9722
Abstract- Despite the fact that Manipur has various communities
living together for centuries with long history of culture and
tradition it would be imperative to notice that the oral narratives
and cultural identity of Meiteis and other tribes of Manipur are
relatively of homogeneous nature in the ancient period and this
tread is found still persistent. In digging out the truth, the
translation versions help depict the relative impacts amongst each
other. It is imperative to know that intra- and inter-cultural
enrichment can be made possible through translation.
Index Terms- Translation, Oral narratives, Homogeneity
I. INTRODUCTION
anipur is inhabited by a number of ethnic groups.
Geographically, Manipur is divided into the hill and valley
areas. The valley is surrounded by hill from all directions. Meitei
ancestors have described this land as the one being surrounded by
nine hill ranges. The valley is inhabited mainly by the Meiteis, the
largest community in the state, while the hills are inhabited by
various tribes. All these communities have been living togerther
for centuries with a long history of culture and tradition.
When Manipur became a part of India in 1949, 29
communities were reconginezed as Scheduled Tribes under the
Indian Constitution. They are:
Aimol, Anal, Angami, Chiru, Chothe, Gangte, Hmar, Kabui,
Kacha Naga, Koirao, Koireng, Kom, Lamkang, Mao, Maram,
Maring, Mizo, Monsang, Moyon, Paite, Purul, Ralte, Sema, Simte,
Tangkhul, Thadou, Vaiphei and Zou.
Besides these 29 communities, five more communities were
added in 2012 under the Constitution of India (Schedule Tribes)
order (Amendment) Act 2011 (No.2 of 2012) dated 8th January,
2012 to the Scheduled Tribe list taking the number to 34. They are
namely:
Kharam, Poumai, Tarao, Mate and any Kuki Tribes
In a harmonious manner, these communities are grouped on
the basis of closer linguistic and cultural affinity. In this chapter,
the researcher will make attempt to explore the hidden treasure of
oral literature as found in Manipur tribal areas in terms of its
origin, culture and religion and revealation of close relationship
among the tribals and Meitei. The Oral narrative is said to include
different varieties of Oral history, folklore, folktale, Oral tradition
etc. In one way, it is cultural information passed on from one
generation to the next by story tellers.
The forms of Oral tradition mean to include poetry, folktale,
ballads, ritualistic hymns and chants, riddles, myths, legends,
epics, proverbs and some magical Spells, etc. The mode of
expression in the Oral literary style is in its musical and rhymic
ways, which further serve as both entertainment and aids to
memory Epic poems mainly concerning the real destiny of the
society in concern. When a myth in particular is asked for
summarizing, it naturally begins with as Oral tradition followed
by the written-down system. In section 2, I shall focus on other
tribes’ areas and Meitei language in oral narratives where I shall
present the Oral History of Thangal Origin Myth, the Oral History
of Anal and the Sacred Fire of Andro showing the very
significance of how they are relatively of homogeneous nature in
the ancient period and this tread is still persistent. This gets
reflected in the translation of the oral narratives from such various
tribes. Section 3 is about Cultural knowledge effects in translation
prompting that through the translation only all the socio-political
informations for past or present within or across the language can
be easily grasped.
II. OTHER TRIBES’ AREAS AND MEITEI LANGUAGE IN ORAL
NARRATIVE
In Manipur there still continues to have Oral tradition among
old people and some minority groups as well as among children
and such an Oral narrative survives in their daily games, counting
rhymes and songs being transmitted orally from generation to
generation.
There is a tide connection amonst the tribal communities and
Meitei clans (Salai). Meiteis believe that holy souls of their
ancestors used to hunt the stars and planets, i.e., Sajik and Thaba.
This sort of belief system could be connected to the Oral story of
Khongchomnupi Nongkarol, indicating the lovely relation
between the stars and mankind. On the other hand, the practice of
buring the dead body of a Meitei was there in the then Meitei social
milieu. After the incident of Puya Meithaba (the Burning of Sacred
Puya books), the cremation of dead body was introduced among
the Meitei society. To the fullest point of surprise, children below
3 years old were exempted from cremation on the basis of which
they were not baptized into Hindu religion. The same practice still
persists in the present scheduled caste of Meitei-Sekmai or Meitei-
Khurkhul society. They used to bury the body within one earthen
pottery or vessel instead of cremating the same at “LU-PUNG”
near Sekmai Keithel (market). In the present scheduled tribal
areas, such an aged burial ceremony is still followed. One can find
such a sytem in the Oral history of “Henjunaha and Lairoulembi”
that clearly reveals that Meiteis used to bury their dead bodies.
Even in Meitei Laiharaoba festival, which is embellished
with songs and dances, the performance of Tangkhul Nurabi
Dance confirms the apparent relation between Tangkhul
M

International Journal of Scientific and Research Publications, Volume 10, Issue 1, January 2020 149
ISSN 2250-3153
http://dx.doi.org/10.29322/IJSRP.10.01.2020.p9722 www.ijsrp.org
community and Meitei. The folktale of Achon Meiraba, a goddess
of Tangkhul made introduction of “Lui Cloth” or “Leiroom”,
which is a common religious cloth of both Meitei and Tangkhul.
Such an attachement amongst the various communities and Meitei
is strongly prevalent till now. In its reality, the cultural identity of
Meiteis and that any tribes of Manipur are homogeneous. They
also belong to pro-mongoloid stock of people.
In terms of translation work for Oral narratives reflecting the
origin myth, the researcher is paying focus on some communities
for the ease of exposition. We will see some amples cases of tribal
languages in the next sub-section touching some logical
interpretation of their origins through myth.
2.1 The Oral History of Thangal Origin Myth
The Thangal was formerly identified as Koirao, a small
indigenous Scheduled Tribe of Manipur. The etymological
meaning of the term “Thangal”is still obscure. It is believed that
the name “Thangal” be derived from the saying that other tribes
refer to Naga tribes found on the southernmost part of Manipur,
which is called “Thangkaimi” that stands for “the southernmost
people”. Physically, they are indistinguishable from the
neighbouring indigenous tribes belonging to the same Mongoloid
stock.
Following is a translation version of oral songs of Thangal
origin myth:
“Kajong antou mini sombs
puiba sanao amdei
anrum lairing katak
lungkari tangnou, lungkanao tangni
paonni ta nge”
Free translation
The stone drag by the monkey was erected for
men
Ties of the collateral mothers broken
The junior one (men) devourded up the senior
line
(monkeys).
Thangmi,
C.A. (2006)
From the above translation, it can be traced back that
Thanagals lived together with the monkeys as cognate brothers
born by two collateral sisters. It was believed that Thangal
originated from a place called “Angkaipang” and stayed there for
a short period and further moved down towards the south to a place
called “Angkaipang” and settled there for a long time. There was
a large flat magical stone with supreme divine power that can
produce the huge quantity of paddy. As a consequence, they
become quite prosperous. As a tradition the Thangals erect large
memorial stones to show their glory and prosperity. Thangals used
to collect a large boulder from the foothills which had to be lifted
to the hilltops. The common habitat sharing monkeys assisted
them in pulling up the stone to the hilltop. On certain accasions
occurred crushing many monkeys to death. As a norm of
compensation, the Thangals promised that they would bury the
dead monkeys with honour. Instead, they cooked and ate the meat
of the dead monkeys. The monkeys didn’t notice the happening.
The incident occurred so frequently that monkeys somehow
started suspecting the treachery and caught them red handed. The
monkeys left the village for jungle with anger and prepared for an
appropriate revenge. The above song was sung by the monkeys at
the time of departure. The monkeys marred the Thangal in all their
life sectors and asked finally to work out a peace treaty with them
that Thangals should never kill and slaught the monkeys. Since
then the flesh of monkeys has become a taboo of food for
Thangals.
What can be interpreted from the above myth is that
following the evolutionary theory of man in which man is
considered to have evolved from monkyes (or apes), such type of
close association of the people with monkeys in this myth is
nothing but the real indicator of link between human and monkeys
(or apes).
2.2 The Oral History of Anal
The origin of the name ‘Anal’is obscure till now. However,
most of the writers commonly agreed that the word ‘Anal’is given
by Meiteis (Rd. Kanthung, 1995).
In the sacred book of Ningthourol Lambuba, it is stated that
King Poireiton, the first century ruler of Manipur, happened to slip
over a mossy ground while passing an area inhabited by the tribe.
He called the place ‘Nanba’ which means ‘Slippery’. In this way,
the Meitei word nanba was corrupted to the Anal (Lh. Ngamhring,
2007). There is also other belief that because of their cleanliness
in comparison with other tribes, the Meiteis called them Anan,
which gave way to Anal. This again goes somewhat against the
argument countered by the fact that in Burma (Myanmar) they
were known as ‘Khon’ meaning ‘unclean’ or ‘dirty’.
With respect to the legend of Anal origin, there is a belief
among the Anals that they came out of the ‘khol’, a word with two
meanings. The first means a deep ‘hole’ in the earth while the other
means a ‘foreign country’. As the legend spells out, the Anal
people came out from a big cave covered with a stone. There was
a savage tiger which kept watching over the hole and ate up
anyone who came out from the cave. There were two brave Anal
heroes called Hanshu and hanta who engaged a bird group, Pari
birds (in Anal) with the promise that if it helped them, it could eat
freely in their fields for all time to come. Now the Pari birds flew
in front of the tiger’s face in a swarm thereby blinding him
intelligently. In the mean time, the two brave men came out from
along with their party and fought anfd killed the tiger. In this way,
the Anal people came out of the hole spreading all over.
The following song depicts the victory over the tiger Anal
people won:
Rāi Kasung, rāi kasung zā
Chim pho le rāi lu kasung na
Chim pho le rai lu kasung na
Karal sungna kakng korera
Free English translation
Fought and fought the enemy,
With shield and sword enemy’s
Sharpeneth was my sword use for war
Kāonvā kāonvā yā
Rāi oh sa danite nii oh kāon vā (2)
Zu oh sa oh danite kappa kekolro

International Journal of Scientific and Research Publications, Volume 10, Issue 1, January 2020 150
ISSN 2250-3153
http://dx.doi.org/10.29322/IJSRP.10.01.2020.p9722 www.ijsrp.org
Free English translation
Called me called me!
Called me thence be enemy
Called me thence be enemy
Invite my father thence be a feast
From Daryal Juli
Anal (2009)
The pari birds still try to feed themselves in the tribe’s fields of
paddy and millet. Their emergence from the ‘Khoi’is concretised
from the following Anal song:
Khol – o hahang sānpe
Hnakhāl o lāngdāl pathusinnu – o
Hedum patel sinnu – o
Khehluwng – o limsor pathusinnu – o
Hethun patel sinnu –
Hari –o … Hari ae
Free English Translation:
Ah, the days of old,
When we first emerged from the khol
The broad teak leaves were our make-
believe gongs
Which we playfully tolled, the whole
day long
And the grasshoppers would be our
cattle, you know
As we prodded and poked them, a long
time ago1.
There is a cultural practice in Anal society that whenever
there is any journey to take amongst the whole family, the women
and children are made to go in the front while the men walk
behind. This insues from an earlier reflection that when the people
were about to leave the cave, the priest chanted prayer to invoke
blessing and gave farewell and after the event of chanting, they
performed divination by breaking an egg and started journey
forward in response to the divination. The women and children
walked in the front while the heroes, Hansu and Hantha followed
them behind with shields in their hand. So, the practice of letting
the women and children go before the men emerged henceforth.
Even in our Meitei society the same culture is visible. The above
translation version is the only proof showing the idea of how Anal
community originated and how they got spreading all over.
Anals have many festivals similar to that of Meiteis’. Daryal
(2009: 76) mentions that Khamtungro/Phamka (Coronation) is of
a recent origin after the Anals came in contact with the Meiteis
and their subjugation by the Meitei rulers. This coronation
happens to be performed only by a member of the village
authority. A person nominated or elected as a member of the
village has to perform this function. This coronation function
usually takes place during the night and all the villages invited are
served with Zu-ṭuwng (rice beer) and Sa- ṭuwng (meat). The song
leaders (Kamṭāng) lead the singing with musical instruments and
Jakadām (a kind of dance) is performed. In this function, the host
first dances with his wife and other males and females make pairs
and followed the session. Every pair, after the dance, offers some
money to the host team for buying a pig to be eaten by those who
will help in the closing ceremony of the coronation.
Anal songs are of various types composed by great heroes of
the past, poets and singers. One of the traditional love songs called
‘Tuna’ is ‘Akam Hla’is sung only during the Akam festivals.
‘Luhla’is sung on the occasion of Sape ceremony while the songs
sung during the death ceremony are called ‘Athọ Hla’.
The following song is one of the many songs sung on the
occasion of ‘Akam’:
In hmun su – oh sewa kenu sewa – tha
Akanare amma atuwng nare amma
Akanare amma atuwng nare amma
Atha puwnt rang chunrawng, oh
Thinsel
Free English Translation:
Looking for the construction of a house
Quite lonely, when no men are there
Though Thinsel built a house and
called the people.
The following song is sung on the occasion of Phamkha:
“Jakase, jakase, jakatinkase
Jakamumda, changluse jakatinkase
Ningthou majumda changluse
jakatintare”
Free English Translation:
Merry, merry, be joyful
Enter the house of a man merrily
Enter the house of a man merrily2.
In the above song, the last line contains a phrase Ningthou
majumda, which are Meitei words meaning ‘to the house of the
King’. Daryal (2009) opines that “it is in Meitei language and
shows the influence of Meiteism on the Anals. Besides, the
Phamka ceremony origin goes back to the time after the Anals
were subjugated by the Meitei Kings in the 16th and 17th century”.
From the above translation work, it clearly reveals that Anal
literature is highly enfluenced by Meitei literature, and even
Meitei words are found inserted in their songs. We can see the
linguistic synthesis out of the source language, Anal and the target
language, Meiteilon within the state itself.
From the political point of view, the Anal heroes protected
the Anal land from dangers and were adventurous and they wen
out on an expedition to the Kabow valley by establishing their
hegemony over a large tract of territory. Thumkhel (the Anal hero)
extended hi hold over the Loktak Lake region of Moirang and
there he caught a wild bull for his ailing wife. The following song
depicts the underlying connection:
Kathe palung eni- o, Thebong palung
eni – o
Morang so ki sal- o jungke kadobe
A sha the thal pinam- o, ka ruwng ngan
teh dim ma
Free English Translation
Oh! Thebong, my kind hearted wife,
She has asked me to catch the wild bull from the green pastures of
moirang region.

International Journal of Scientific and Research Publications, Volume 10, Issue 1, January 2020 151
ISSN 2250-3153
http://dx.doi.org/10.29322/IJSRP.10.01.2020.p9722 www.ijsrp.org
Though caught and killed, the beef thus obtained seemed not
enough3.
The following is the song of Thumkhel’s Expedition to the Kabaw
Valley:
Thumkhel lāngcham sina, Tamu zol, huzā eh vathal ting hmi deso.
Oh, volhlung lāngcham sina pinsa zol, husa eh vathal tehmi
lingsā,
Thumkhel ral duh tensinbe, simzong lu oh marende,
Huzā- aluwng som hmin tungka.
Oh, Volhlung rāl duh tensinbe, kikiing lu oh marende,
Huzā- aluwng kheh hmin tungmi.
Free English Translation:
The battle fields of Thumkhel lies at the southern part of
Tamu, covering vast area. As a mightier fighter, he killed and
destroyed everything. Nothing remained behind to be seen at far.
Southern part of ‘Pinsa’ (now called pandah in Myanmar) is the
battle field of Volhlung. As a less superior fighter, he could not
clear and conquered a large area. Many lives and things remained
visible when looked at. The number of heads of his victims is as
amny as the number of monkey heads being raised by a good
hunter in front of his house. The heads which filled ten rows are
Thumkhel’s. The score of heads claimed by Volhlung are of
weaker and smaller beings like ‘Kikiing’ (sea snails) and is even
short of one row4.
From the above songs and brief traditional accounts, we
could spell out that the Anals belonging to the Tibeto-Burman
family of Mongolian race are one of the various types of Manipur.
They believe that they came out of the ‘Khol’, still preserving their
cultural way of life by tradition. Christianity and modernization
cannot wipe away their tradition and culture. The Anal’s cultural
literature is found enfluenced by the interaction with the various
tribes such as Kuki chin tribes and the Naga tribes. The Anal tribe
has also tendency of strong feeling that there is impact of the
Meiteis in belief, culture and language. Daryal (2009: 145) spells
out that “Today’s Anal dialect has many Manipuri words. Old
words have given way to these new borrowed words. The Anals
have linguistic affinity to the Kuki Chin tribes”. This is how we
can observe how the above translated version provides a clue
depicting the richness of the culture of a language like Anal. The
Oral narratives and cultural identity of Meiteis and other tribes of
Manipur are relatively of homogeneous nature in the ancient
period and this tread is still persistent. This gets reflected in the
translation shown above.
2.3 The Sacred Fire of Andro
Andro is one of the Scheduled Caste Communities, who
spoke Chakpa which has died out and they now speak Meiteilon.
Only a few elders know their old language which is used only in
rituals. It can be noted that some Puyas (old Manipuri sacred
manuscripts) have information about the history, civilization as
well as culture of the Chakpas in the name of Chakparol,
Chakparol Khunda, Chakpa Khoira, and Chakpa Lai Khunda.
There are eleven hakpa localities in the state of Manipur and most
of them still practice the aged-old traditions, calling themselves
the Meitei Ariba (true Meiteis) in the sense that they are what the
whole Meitei community was befor the Hinduism that came into
existence in 18th century was adopted by most of the Meiteis. Still
Andro community preserves and guards their cultural practices
forming a council to function as a local self-government. There is
a building where the council has its office and they call it
‘Loishang’. Inide this Loishang is the Sacred Fire, which is
believed to been started at the time when the Chakpas started
living at Andro more than two thousand years ago. This Sacred
Fire has never been extinguished from that time by following a
particular system called ‘Singhul Leng Meihul Leng’ according to
which two persons for everyday from two different families have
to attend to the sacred fire by bringing firewood to the temple of
the Loishang. A hym is sung to glorify the sacred fire. The
following is a part of the hym with translated version.
Ubi uyel mei
Hemba pamchak mei
Lamchao Khambi mei
Amam singkum mei
Chapok kadang mei
Tara chakthong mei
Shenglou Yenphut mei
Chakpa phuyik mei
Charu tangsam mei
Poireiton khunthok mei
Poinaotana khunphao mei
Poirei khulling mei
English Translation
Fire in the ashes
Fire that can burn everything
Fire to cremate
Fire also in childbirth
Fire to cook rice
Fire to cook dishes
Fire to bake pots of the Chakpas
Fire to burn hay in the field
Fire brought by Poireiton
Fire brought by Poinaota
Fire, the foundation of Meitei
civilization.
Rajketan Chirom
(2013: 113)
Rajketan remarks that “the hym gives the various uses and
qualities of fire. It describes the role that fire plays in all the
aspects of man’s life. One notable in the hym is that it talks about
Poireiton, and his wife Poinaota, as having brought fire (the know-
how to make and use fire) to Manipur during their migration and
its importance in the civilization of this land. Thus, the people of
Andro believe that if the sacred fire is extinguished, the Manipuri
civilization will come to an end and all its people, culture and
tradition will become extinct. Therefore, this sacred fire is always
to be kept alive”. This small translation tells a lot about the ancient
days when many clan principalities were ruling their own small
kingdoms. Pakhangba, the Ningthouja king defeated Poireiton,
who came to Manipur to help Khaba clan in war. Poireiton married
his younger sister Laisna to Pakhangba and she was made queen.
It is said that the fire used in the coronation of Pakhangba was said
to have been brought by Poireiton. It is still believed that it is the
same fire which is still kept burning at Andro.

International Journal of Scientific and Research Publications, Volume 10, Issue 1, January 2020 152
ISSN 2250-3153
http://dx.doi.org/10.29322/IJSRP.10.01.2020.p9722 www.ijsrp.org
III. CULTURAL KNOWLEDGE EFFECTS IN TRANSLATION
Now let us see a recent view of the semiotician Lotman &
Upensky (1978) describe literature who declares the following
statement:
No language can exist unless it is steeped in the context of
culture; and no culture can exist which does not have at its centre,
the structure of natural language.
Viewd so, language behaves as the heart within the body of
culture. The interaction between the two brings forth the
continuation of life-energy.
Thriveni (2002, p.46.) describes such interactive
phenomenon as an item covering all aspects of life expanding from
history to traditional customs. At this crucial juncture, the
translator has to to take good decision about the importance given
to certain cultural aspects and to what extent it is necessary or
desirable to translate such elements into the target language.
Again, one can also have the handsome idea of which Hatim
and Mason's theory (1990) on translation is focused on the
decisive relevance of cultural context: Translating is
communicative process which takes place within a social context.
According to them, translators are considered as mediators:
Translators medíate between cultures (including ideologies,
moral systems and socio-political structures), seeking to overcome
those incompatibilities which stand in the way of transfer of
meaning. What has value as a sign in one cultural community may
be devoid of significance in another [...].
Hatim and Mason consider translation as a communication
process going through linguistic and cultural barriers. According
to them, the translator may face problems within or outside the
language concept.
The existing fact is that when a language exists in a particular
culture it is very hard to realize the meaning of linguistic text to be
comprehended as per the particular culture. However, even though
cultural words create problems as the impact of them gets lost in
the process of translation, what is good here is that through the
translation only all such socio-political informations for past or
present within or across the language can be easily grasped.
IV. CONCLUSION
In this paper, we have explored that Manipur has various
communities living together for centuries with long history of
culture and tradition. The Oral narratives and cultural identity of
Meiteis and other tribes of Manipur are relatively of homogeneous
nature in the ancient period and this tread is still persistent. The
translation versions depict the relative impacts amongst each
other. It is imperative to know that intra- and inter-cultural
enrichment can be made possible through translation.
ACKNOWLEDGEMENT
I am deeply grateful to Mr. Amom Nandaraj Meetei who
helped me a lot in developing this paper extending his academic
insight. I am also grateful to Mr. Athokpam Jeet Prabhat Meitei
for his moral support and encouragemnt.
REFERENCES
[1] Dorson, Richard M. “Introduction: Concepts of Folklore and Folklife
[2] Studies” In Folklore and Folklife: An Introduction. Ed. Richard M. Dorson. Chicago: University of Chicago Press, 1972.
[3] Dorson, Richard M. Folklore and Folklife: An Introduction. Chicago:
University of Chicago Press, 1972.
[4] Dorson, Richard M. Folklore and Fakelore: Towards a Discipline of
Folk Studies. Cambridge: Cambridge University Press, 1976.
[5] Dorson, Richard M. “Stitch Thompson (1885-1976),”. In Journal of
American Folklore. 1977. Vol.90:35. p.6-24.
[6] Dorson, Richard M. (Ed). Folklore in the Modern World. The Hague,
Paris: Mouton, 1978.
[7] Dundes, Alan. (Ed). The Study of Folklore. New Jersy: University of
California, 1965.
[8] Dundes, Alan. “Who are The Folk.” In Interpreting Folklore.
Bloomington: Indiana University Press, 1980.
[9] Ellyn, S. Folk customs. Beijing: Foreign Language Press, 2006.
[10] Goodenough, W.H. Cultural Anthropology and Linguistics. In: D.
[11] Hymes (Ed.), Language in Culture and Society. New York: Harper & Row. 1954, pp. 36-39.
[12] Philip, Neil. Mythology of the World. London: Kingfisher Pub., 2004.
[13] Rajketan, Chirom. (Ed). Oral Narratives of Manipur. Cultural Research
Centre Manipur, Imphal, 2016.
[14] Snell-Hornby, Mary. Translation studies: An integrated approach.
Amsterdam/Philadelphia: John Benjamins, 1988.
[15] Spivak, Gayatri. “Translation as Culture”. In Paul St-Pierre and Prafull
[16] C. Kar (edited) In Translation: Reflections, Refractions, Transformations. Delhi: Pencraft, 2005. pp.238-250.
AUTHORS
First Author – Thokchom Premlata Devi

International Journal of Scientific and Research Publications, Volume 10, Issue 1, January 2020 153
ISSN 2250-3153
http://dx.doi.org/10.29322/IJSRP.10.01.2020.p9723 www.ijsrp.org
A Study about the cognomens that were adopted by
the kings during Anuradhapura Era
Professor Anurin Indika Diwakara
Department of Sinhala, University of Kelaniya, Sri Lanka
DOI: 10.29322/IJSRP.10.01.2020.p9723
http://dx.doi.org/10.29322/IJSRP.10.01.2020.p9723
Abstract: During the Anuradhapura Era the King was the head of the state. When studying inscription stones enlisted in this
regard, what is clearly visible is the fact that, a reign based on heritance has been functioning. The kingship was deserved by those
who hail from the Kshathriya dynasty. The amateur prince becomes a proper king after the coronation ceremony. In the absence of
such coronation, the prince is not considered as the king of the state. In Mahavamsa Teeka, this is discussed at length. The one who
commanded the entire governance system was the King, thus since the inception, a governance based on dynastic line was existed in
ancient Sri Lanka. (Journal of the Royal Artistic Society of the Royal Asiatic Society of Great Britain and Ireland (1936, p.443.)
Corpus
Sri Lanka was so closely and intimately connected with India that every great change that took place in the main continent
whether political, social, economic or religious influenced considerably the life of the people of Sri Lanka (Amaratunga G &
Gunawardana N, 2019, Volume-3-issue6, 203-206). The king needs to be a secular, orderly person in his governance due to certain
factors; those were to receive rain at apt time in favor of successful cultivation, to obtain prosperity and blessing for both citizens and
the state, and for the smooth function of his governance with the help of citizens. Thus, given the stability of the reign and as a
custom, the kings were given various honorary names/cognomens when enthroned. This was a custom which prevailed since the
inception of the Anuradhapura Era. The fifth chapter of Mahavamsa has been dedicated to the emperor Asoka (Gunawardana N, 2019,
IJSRP Volume 9, Issue 7, 230-235). “Devanapiya” is one such forefront cognomen. This has been first adopted by the King Asoka.
Simply as the manner in which governance was established in Sri Lanka along with the introduction of Buddhism, these honorary
Indian terms were also adopted by Sri Lankan Kings as well. The holy city of Anuradhapura was originally planned and laid out by
Mahinda son of king Asoka. (Gunawardana N, 2019, IJSRP Volume 9, Issue 6, 634-638).
One of the influential kings in Ceylon named “Tissa” (B.C 250-210) was later known as “Devanampiyatissa”. King
Devanampiyatissa, became the king after his father’s death (Gunwardana N, 2019, IJSRP Volume 9, Issue 7, 236-240). The
inscription stones testified that these honorary terms was used by the kings for a period about three years during the Anurdhapura Era.
(see. Amaravansha Himi, Kothmale., (1969). Lakdiwa Sellipi, (LS), Epigraphia Zeylanica., (EZ.) Volume (Vol:1 )., p.144., EZ.,
vol:III., p.154 EZ., vol: V. p.209).
Though it was used as an honorary term alluded to King Devanampiyathissa, later on the other kings were also used it as a
cognomen. Even though, the usage of these honorary terms seceded during the first century, they have emerged again during the reign

International Journal of Scientific and Research Publications, Volume 10, Issue 1, January 2020 154
ISSN 2250-3153
http://dx.doi.org/10.29322/IJSRP.10.01.2020.p9723 www.ijsrp.org
of King Upathissa (A.D 517-518). Many scholars have taken into discourse about the usage of the honorary terms. (see
Wimalakeerthi, Madayangoda., (1958) Part 2, Epigraphs Compilation.,Moratuwa., D.G Dodangoda and Company. Page 45, EZ. Vol:
1, p.63). However, the study about the epigraphs listed during A.D centuries shows the gradual secession of the term devanapiya.
During the anno domini (A.D) era, one of the pivotal honorary terms in use was ‘Maha Raja’, and the term Raja which had a
lesser importance than the former was also in use. During the B.C era the term Raja-Maha Raja was in use overwhelmingly yet
during anno domini (A.D) era the term Maharaja was hardly used. (Ez. vol: V., p-209). The term raja was particularly used by the
minor rulers who ruled the other parts of the island. Dathuvamsa mentions about two such minor rulers who governed Rohanaya.
(Ven Sri Kakusanda via Sri Sumedankara. (1930) Dathuwanshaya. (ed): 52). However, it is not evident that they maintained any
relationship with the Anuradhapura royal family. Further, an epigraph enlisted in a cave in Mihinthalaya speaks about a king called
DipaRaja (EZ. vol: V. p.209). Though the name connotes the meaning as the king of the state, it also holds the allusion to the
honorary term used by the prince who governed Nagadeepaya region in the Jaffna peninsula. (Pali text society. p.443) However, the
study of epigraphs enlisted during the Anurdhapura era reveals that the honorary term MahaRaja existed in usage for a longer period
while the term raja diminished quickly from colloquial.
The honorary term Gamani is also a term adopted by majority of kings. However, there is a hullaballoo regarding this since it
has been adopted by both kings and other heads at managerial level in governance. However, as testified by the epigraphs, the kings
have adopted this term to connote a sense of honorary while other minor heads of state have adopted it as an official term associated
with their duties. The study of the evolution and the expansion of this term gamini reveal many facts in this regard. (Gunawardana., R.
Liyanagamage A., (1961)., Anuradhapura Era (A.E)., Kelaniya., Vidyalankara Press. p.53., Ven Vimalawansa, Baddegama., (1961)
Epigraphic Society., Colombo.,Anula Press., p.99-100). At first it has been used in association with powers vested in administration
yet later on it has been used to connote a sense of honorary, a sense of belongingness to a high strata of society and finally as a term of
identification. The cave epigraphs reveal that many such cognomens have been used in association with gamini. (EZ., vol: v. p.209).
As evident from the epigraphs, this title of honor has seceded from usage after the B.C era.
Mapurumu is another cognomen used by kings during the Anurdhapura reign, in Sanskirit Mapurumu connotes the meaning
the greatest while it gives the same meaning in Pali language as well. This is an ancient term which has been gradually evolved over
the time. (See. Diwakara., Anurin Indika., (2008) Compilation of Scholarly Articles.(CSA), Colombo., Godage and Brothers. The term
also has been in use as Mapurmuka & Mapurumuka. As the cognomen Gamini, the title of honor Mapurmuka has also been adopted
by both kings in power and other heads in governance. Since this cognomen has been cited as chula parumuka in the Tissamaharama
epigraph, it can be assumed that a clan associated with the cognomen Maha Parumaka had also been in existence. (p.202). the study
of epigraphs reveals the different platforms in which this cognomen had been in use. (EZ., vol: IV, pp. 144-249). Some epigraphs
testify that this has been used as a personal identification term/name of the kings concerned. (EZ., vol: iii. P. 122). Thus, Mapurmuka
can be defined as a popular cognomen which had been in use during the Anuradhapura era.
Buddhadasa is another contemporary cognomen that can be noted during this era. Budhadasa (Buddhadasa in Pali) denotes
the accomplice of Buddha. The kings such as Sena, Mahasen, has adopted this title as a cognomen. As per the Culavamsa one
particular kings has adopted this as the personal name. (Giger, Wilhelm., (1952) Chuulavansha., (edited) Part I., London, Pali Books
Company., p.37)

International Journal of Scientific and Research Publications, Volume 10, Issue 1, January 2020 155
ISSN 2250-3153
http://dx.doi.org/10.29322/IJSRP.10.01.2020.p9723 www.ijsrp.org
Toward the latter part of the Anurdhapura era, the cognomen Sirisangabo has been in use. As exemplified from the
epigraphs, this title of honor has been used by coupling it along with the cognomen Budhadasa (E Z., Vol: I. p.43). Even this
cognomen Sirisanabo has also been adopted as a personal name by some of the kings. Subsequently, it has been used as a title of
honor. The (Aba, Apaya) is another cognomen visible in the respective epigraph. The Thonigala epigraphs reveal how the
aforementioned cognomen has been used in front of the term Maharaja & Raja. (EZ. vol: III. p.172). This cognomen has been in use
as an integral part of the name itself linked with the titles Maharaja and Raja (EZ. vol: ii. p.177). Abha Salamewan I is another such
name which has adopted the respective cognomen. (EZ., vol: I. p. 182). Toward the latter part of the Anurdhapura period, many kings
have enlisted the epigraphs only mentioning their cognomens in lieu of their personal names. Thus, this has resulted in creating a
complex scenario in the exploration of the political nuances in the respective era (EZ. vol: 1.p. 24).
The term pa in Rajapa is another such cognomen. In Sanskrit, it denotes the meaning Arya Pada. In Pali, it is used in lieu of
Abhaya. (EZ., Vol: iii., p. 132). The term Thiripali, has been used as an adjective for the Mahanamayan, while the terms such as Siri
Niwasa, Siri Kudda that can be found in Samanthapasadikawa and Dammhapadatta Katha are also considered as honorary titles.
(Sikawalnda Winisa., Introduction. p.ii)
As the time goes by the notion about the governance/state became more overwhelming. The cognomens that were used
during the initial years were left out and instead of that honorary titles such as Maharad, Maharadthuma, Maharadunwahanse,
Wathhimi, Wathhimiyanwahanse were adopted. While the concept of state was getting wider in its scope, the terms such as parapura,
wanshaya, were adopted instead of the honorary adjectives. Further, the titles were also coined based on the duties that were assigned
to the respective persons. These titles have further evolved into terms such as chathra wanshaya, surya wanshaya. As per the
epigraphs, the aforementioned titles stem from Okkaka dynasty. These titles are used in isolation or at times as siri Bara kath kula
koth (EZ. vol: 1. p.31, 182, 241)
Conclusion
Thus, the study of cognomens used during the Anuradhapura era exemplifies several factors. It reflects that the kings have
mainly enlisted these epigraphs stressing the fact that he (the kings) as the leader of the country, highlighting his eligibility to hold the
thrown with the particular emphasis on his dynasty, bond with the citizens, inherent positive qualities, his secular and orderly
administration of the nation, his fame, generous nature, kindness & combatting skills. Thus, the epigraphs have been enlisted
highlighting the aforementioned characteristics and the stability of his reign and his aptness for the kingship.
Bibliography
Archaeological Survey of Ceylon Inscriptions.
Archaeological Survey of Ceylon Inscriptions Register
Amaratunga G & Gunawardana N (2019) “The Pre Buddhist Religious Beliefs in Ancient Sri Lanka” International Journal of
Research and Innovation in Social Science (IJRISS) vol.3 issue 6, pp.203-206 June,
URL:https://www.rsisinternational.org/journals/ijriss/Digital-Library/volume-3-issue-6/203-206, www.rsisinternational.org
Amaravansa Himi, Kotmale, Lakdiwa Sellipi, M. D. Gunasena saha Samagama, Colombo, 1969.

International Journal of Scientific and Research Publications, Volume 10, Issue 1, January 2020 156
ISSN 2250-3153
http://dx.doi.org/10.29322/IJSRP.10.01.2020.p9723 www.ijsrp.org
Codrington. H.W. Ceylon Coins and Currency. 1924.
Codrington. H.W., Short history Ceylon. (Revised Edition) Reprinted 1947.
Coomaraswamy., A. K., Bronzes from Ceylon., 1914.
Culavamsa. (translated by) Wilhelm Geiger. The Pali text Society. Oxford University Press. Vol; 1. 1929. 1952., Vol II. 1930. 1973.
Ceylon Journal of Science Section. G. Archaeology. Ethnology
Davy., John. An Account of the Interior of Ceylon and of its Inhabitants. 1821.
Diwakara, Anurin Indika, Compilation of Scholarly Articles, Godage and brother. Colombo. 2008.
Doyly. Sir John. A Sketch of the Constitution of the Kandyan Kingdom., (and other Relevant papers)., 1835. 1929.
Epigraphia Zeylanica, Vol; III, D.M.D.Z. Wickemasingha., H.W. Codrington., New Delhi. Madras. 1994., Vol; IV. H.W.
Codrington., S. Paranavitana., 1934., Vol; V., Part I - II., Jayantha Uduwara., 1991., Voll., Saddhamangala Karunaratne., 1984.
Imperial Gazetteor of India Epigraphia Zeylanica., Vols I, II, Edited and translated by D. M. D.Z. Wickemasingha.,
Journal of the Royal Asiatic Society of the Royal Asiatic Society of Great Britain Ireland (1936).
Malalasekara., G. P.., The Pali Literature of Ceylon., Landon., 1928.
Wansaththappakasinee., (Mahavansa teeka)., Ed., Malalasekara., G. P.., Landon., Vol; I., 1935., Vol; II., 1936.
Gunawardana, R, Liyanagamage, A., Anuradhapura yugaya., Viddiyalankara Vishvaviddiyalaya., 1961.
Guanwardana Nadeesha, 2019, Emperor Aśoka as depicted from vamsa tradition in Sri Lanka, International Journal of Scientific
and Research Publications, IJSRP Volume 9, Issue 7, June 2019 edition, 230-235pp. ISSN 2250-3153, DOI:
10.29322/IJSRP.9.07.2019.p9133, http://dx.doi.org/10.29322/IJSRP.9.07.2019.p9133
Gunawardana Nadeesha, Third Buddhist Council of Emperor Aśoka, International Journal of Scientific and Research Publications,
IJSRP Volume 9, Issue 7, June 2019 edition, 236-240pp. ISSN 2250-3153, DOI: 10.29322/IJSRP.9.07.2019.p9134 ,
http://dx.doi.org/10.29322/IJSRP.9.07.2019.p913
Gunawardana Nadeesha, The Role of Mahinda thēra as Dīpaprasādaka in Sri Lanka, International Journal of Scientific and
Research Publications, IJSRP Volume 9, Issue 6, June 2019 edition, 634-638pp. ISSN 2250-3153, DOI:
10.29322/IJSRP.9.06.2019.p9092 , http://dx.doi.org/10.29322/IJSRP.9.06.2019.p9092
Gunawardana Nadeesha, 2019, “The Role of the theri Sanhgamittā introducing order of nuns to Sri Lanka in 3rd century B.C.E”,
International Journal of Scientific and Research Publications, Volume 9, Issue 9, September ISSN 2250-3153, 399-403 pp, DOI:
10.29322/IJSRP.9.09.2019.p9349, http://dx.doi.org/10.29322/IJSRP.9.09.2019.p9349
Indicopleustes Cosmas., the Christian Topography., 1992.
Knox, Robert. An Historical Relation of Ceylon. 1681., ed., James Ryan., 1911.

International Journal of Scientific and Research Publications, Volume 10, Issue 1, January 2020 157
ISSN 2250-3153
http://dx.doi.org/10.29322/IJSRP.10.01.2020.p9723 www.ijsrp.org
Mahavansa., Translated by W. Geiger., The Pli Text Society, Oxford university Press., London., 1908.
Muller., E. Ancient Inscriptions in Ceylon., London., 1883
Mudiyanse, Nandasena. Sinhala shila Lekana Sangrahaya., Godage and brother. Colombo. 2001.
Wimalakeerthi Himi, Madauyangoda. Shilalekana Sangrahaya, I, II, III, D. P., Dodangoda saha Samagama., Moratuwa. 1951, 1953,
1954.
Wimalavansa Himi., Baddegama., Sellipi Samajaya., Anula mudranalaya., Colombo., 1959.
International Journal of Scientific and Research Publications, Volume 10, Issue 1, January 2020 158 ISSN 2250-3153
http://dx.doi.org/10.29322/IJSRP.10.01.2020.p97XX www.ijsrp.org
Quality of Life of Seborrheic Keratosis Patients Imam Budi Putra1, Nelva Karmila Jusuf1, Evita Lourdes Pinem2*
1Department of Dermatology and Venereology, Faculty of Medicine,
Universitas Sumatera Utara, Indonesia 2Postgraduate Study of Dermatology and Venereology, Faculty of Medicine,
Universitas Sumatera Utara, Indonesia
DOI: 10.29322/IJSRP.10.01.2020.p9724 http://dx.doi.org/10.29322/IJSRP.10.01.2020.p9724
Abstract- Background: Seborrheic keratosis is a benign epidermal tumor that has various clinical appearances. Seborrheic keratosis are found on all area of the body except on the palm and sole, located mostly on the face and upper trunk. Lesions are often unattractive and serve as negative psychological connotations—daily reminders of aging. Objective: To determine the quality of life in subjects with seborrheic keratosis. Methods: This research was a descriptive study with cross-sectional design involving 100 subjects with seborrheic keratosis. Each subject answered Skindex-29 questionnaires and the the answers were assessed. Results: Quality of life in most subjects with seborrheic keratosis was very high quality of life with value of Skindex-29 in the amount of ≤ 5 ( 71 %), followed by high quality of life with value of Skindex-29 in the amount of 6-17 (27%), and at least having moderate quality of life with value of Skindex-29 in the amount of 18-36 (2%). Conclusion: Quality of life in most subjects with seborrheic keratosis was very high quality of life. Index Terms- seborrheic keratosis, skindex-29, quality of life.
I. INTRODUCTION eborrheic keratosis is a benign epidermal tumor that has various clinical appearances.1-3 Seborrheic keratosis are
found on all area of the body except on the palm and sole, located mostly on the face and upper trunk. The most clinical appearance is superficial verrucose plaque that looks stuck on the epidermis with various colours from tan to black colour.4 Lesions are often unattractive and serve as negative psychological connotations—daily reminders of aging. Many patients want to remove the seborrheic keratosis for cosmetic reason, especially with multiple lesions.5-11 In the last decade, there is an increasing interest to asses quality of life of patients with skin diseases and increasing development of quality of life method.12,13 Skin diseases are the the most cause for morbidity because of clinical sign appearances.12 Patients may complain itch, uncomfortable, and the other severe symptom. Skin disease can cause worry, depression, angry, shame that can cause social isolation, and interference in the work.12,14
WHO defines quality of life as individuals perception of their position in life in the context of the culture and value systems in which they live and in relation to their goals, expectations, standards and concerns. It is a broad ranging
concept affected in a complex way by the person's physical health, psychological state, level of independence, social relationships, personal beliefs and their relationship to salient features of their environment.15,16 Quality of life correlates with health-related quality of life reflect patient evaluation to disease and treatment for physic function, psychologic, social and health. Skindex-29 is HRQL instrument that designed to measure the impact of skin disease in patient’s life.16,17
No study was done before about seborrheic keratosis impact to quality of life of the patient by used skindex-29, so researcher wanted to know and asses quality of life seborrheic keratosis’ patient. This study aimed to find quality of life’s spectrum of the seborrheic keratosis patients. Special purpose was to asses quality of life to subjects that suffered from seborrheic keratosis based on age, sex, and periode suffered from disease.
II. MATERIAL AND METHODS This research is descriptive study with cross sectional design. Research had done in December 2015 until February 2016 in Medan involving 100 subjects with seborrheic keratosis that fulfilled inclusion and exclusion criteria and collected samples with consecutive sampling method. Each subject answered Skindex-29 questionnaires and the answers were assessed. Ethical Approval The protocol of this study was approved by The Health Research Ethical Committee, University of Sumatra Utara/H. Adam Malik General Hospital, Medan, Indonesia.
III. RESULT In this research subject charateristics were based on age, sex, ethnic group, education, occupation, marital status and periode suffered from the disease. The most subjects that had seborrheic keratosis were at age group 41-50 years old (33%), followed by age group 51-60 years old (31%), seen in table 1.
S
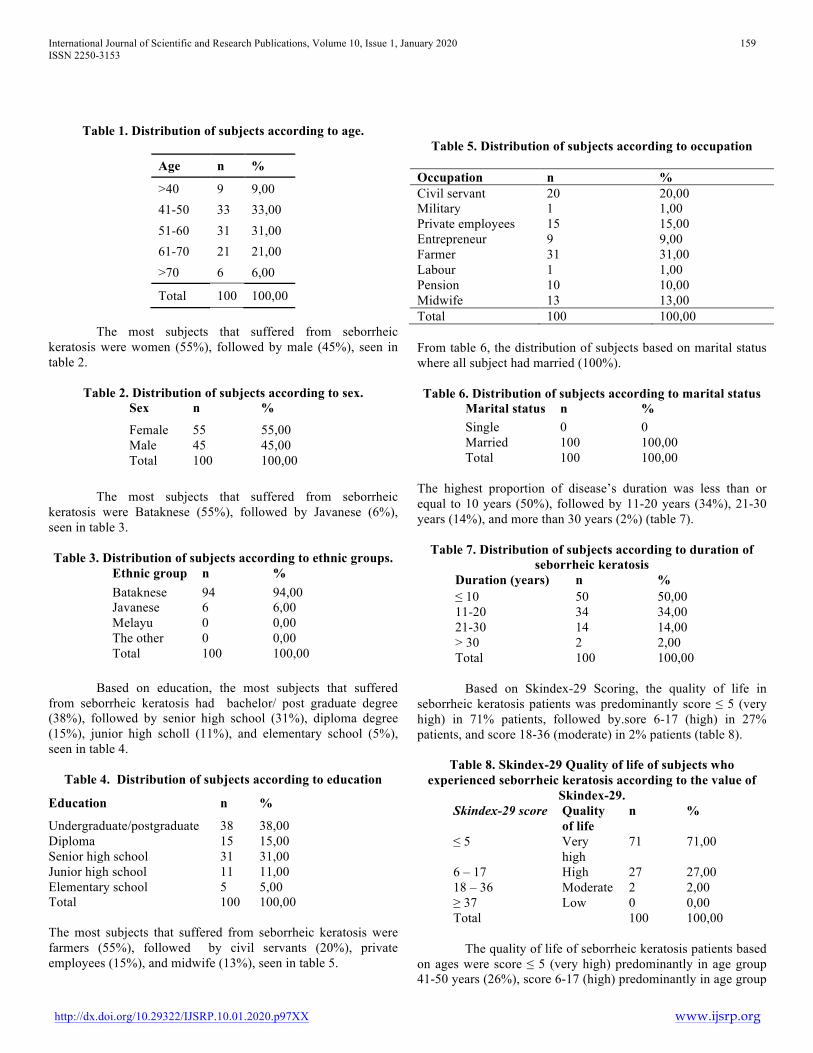
International Journal of Scientific and Research Publications, Volume 10, Issue 1, January 2020 159 ISSN 2250-3153
http://dx.doi.org/10.29322/IJSRP.10.01.2020.p97XX www.ijsrp.org
Table 1. Distribution of subjects according to age.
Age n %
>40 9 9,00 41-50 33 33,00 51-60 31 31,00 61-70 21 21,00 >70 6 6,00
Total 100 100,00 The most subjects that suffered from seborrheic keratosis were women (55%), followed by male (45%), seen in table 2.
Table 2. Distribution of subjects according to sex.
Sex n %
Female 55 55,00 Male 45 45,00 Total 100 100,00
The most subjects that suffered from seborrheic keratosis were Bataknese (55%), followed by Javanese (6%), seen in table 3. Table 3. Distribution of subjects according to ethnic groups.
Ethnic group n % Bataknese 94 94,00 Javanese 6 6,00 Melayu 0 0,00 The other 0 0,00 Total 100 100,00
Based on education, the most subjects that suffered from seborrheic keratosis had bachelor/ post graduate degree (38%), followed by senior high school (31%), diploma degree (15%), junior high scholl (11%), and elementary school (5%), seen in table 4.
Table 4. Distribution of subjects according to education
The most subjects that suffered from seborrheic keratosis were farmers (55%), followed by civil servants (20%), private employees (15%), and midwife (13%), seen in table 5.
Table 5. Distribution of subjects according to occupation Occupation n % Civil servant Military
20 1
20,00 1,00
Private employees 15 15,00 Entrepreneur 9 9,00 Farmer 31 31,00 Labour 1 1,00 Pension Midwife
10 13
10,00 13,00
Total 100 100,00 From table 6, the distribution of subjects based on marital status where all subject had married (100%). Table 6. Distribution of subjects according to marital status
Marital status n % Single 0 0 Married 100 100,00 Total 100 100,00
The highest proportion of disease’s duration was less than or equal to 10 years (50%), followed by 11-20 years (34%), 21-30 years (14%), and more than 30 years (2%) (table 7).
Table 7. Distribution of subjects according to duration of seborrheic keratosis
Duration (years) n % ≤ 10 50 50,00 11-20 21-30
34 14
34,00 14,00
> 30 2 2,00 Total 100 100,00
Based on Skindex-29 Scoring, the quality of life in seborrheic keratosis patients was predominantly score ≤ 5 (very high) in 71% patients, followed by.sore 6-17 (high) in 27% patients, and score 18-36 (moderate) in 2% patients (table 8).
Table 8. Skindex-29 Quality of life of subjects who experienced seborrheic keratosis according to the value of
Skindex-29.
The quality of life of seborrheic keratosis patients based on ages were score ≤ 5 (very high) predominantly in age group 41-50 years (26%), score 6-17 (high) predominantly in age group
Education n %
Undergraduate/postgraduate Diploma
38 15
38,00 15,00
Senior high school 31 31,00 Junior high school Elementary school
11 5
11,00 5,00
Total 100 100,00
Skindex-29 score Quality of life
n %
≤ 5 Very high
71 71,00
6 – 17 High 27 27,00 18 – 36 Moderate 2 2,00 ≥ 37 Low 0 0,00 Total 100 100,00
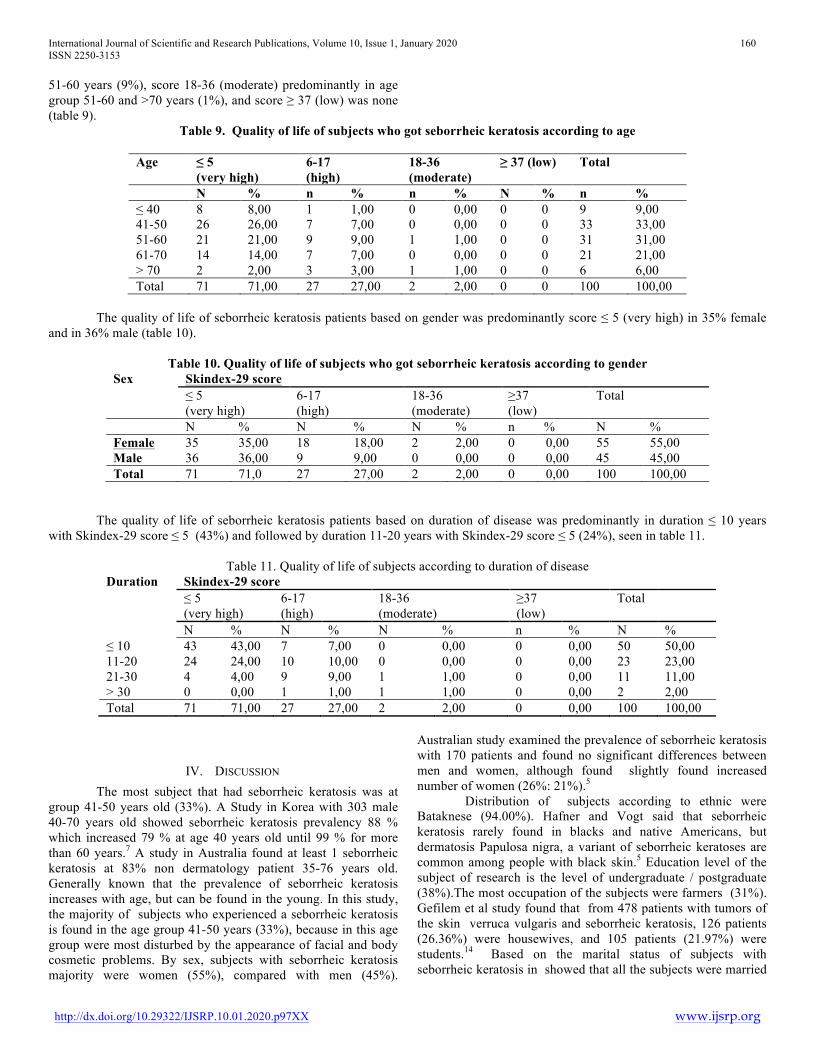
International Journal of Scientific and Research Publications, Volume 10, Issue 1, January 2020 160 ISSN 2250-3153
http://dx.doi.org/10.29322/IJSRP.10.01.2020.p97XX www.ijsrp.org
51-60 years (9%), score 18-36 (moderate) predominantly in age group 51-60 and >70 years (1%), and score ≥ 37 (low) was none (table 9).
Table 9. Quality of life of subjects who got seborrheic keratosis according to age
Age ≤ 5 (very high)
6-17 (high)
18-36 (moderate)
≥ 37 (low) Total
N % n % n % N % n % ≤ 40 8 8,00 1 1,00 0 0,00 0 0 9 9,00 41-50 26 26,00 7 7,00 0 0,00 0 0 33 33,00 51-60 21 21,00 9 9,00 1 1,00 0 0 31 31,00 61-70 14 14,00 7 7,00 0 0,00 0 0 21 21,00 > 70 2 2,00 3 3,00 1 1,00 0 0 6 6,00 Total 71 71,00 27 27,00 2 2,00 0 0 100 100,00
The quality of life of seborrheic keratosis patients based on gender was predominantly score ≤ 5 (very high) in 35% female and in 36% male (table 10).
Table 10. Quality of life of subjects who got seborrheic keratosis according to gender Sex Skindex-29 score
≤ 5 (very high)
6-17 (high)
18-36 (moderate)
≥37 (low)
Total
N % N % N % n % N % Female 35 35,00 18 18,00 2 2,00 0 0,00 55 55,00 Male 36 36,00 9 9,00 0 0,00 0 0,00 45 45,00 Total 71 71,0 27 27,00 2 2,00 0 0,00 100 100,00
The quality of life of seborrheic keratosis patients based on duration of disease was predominantly in duration ≤ 10 years with Skindex-29 score ≤ 5 (43%) and followed by duration 11-20 years with Skindex-29 score ≤ 5 (24%), seen in table 11.
Table 11. Quality of life of subjects according to duration of disease Duration Skindex-29 score
≤ 5 (very high)
6-17 (high)
18-36 (moderate)
≥37 (low)
Total
N % N % N % n % N % ≤ 10 43 43,00 7 7,00 0 0,00 0 0,00 50 50,00 11-20 24 24,00 10 10,00 0 0,00 0 0,00 23 23,00 21-30 4 4,00 9 9,00 1 1,00 0 0,00 11 11,00 > 30 0 0,00 1 1,00 1 1,00 0 0,00 2 2,00 Total 71 71,00 27 27,00 2 2,00 0 0,00 100 100,00
IV. DISCUSSION The most subject that had seborrheic keratosis was at group 41-50 years old (33%). A Study in Korea with 303 male 40-70 years old showed seborrheic keratosis prevalency 88 % which increased 79 % at age 40 years old until 99 % for more than 60 years.7 A study in Australia found at least 1 seborrheic keratosis at 83% non dermatology patient 35-76 years old. Generally known that the prevalence of seborrheic keratosis increases with age, but can be found in the young. In this study, the majority of subjects who experienced a seborrheic keratosis is found in the age group 41-50 years (33%), because in this age group were most disturbed by the appearance of facial and body cosmetic problems. By sex, subjects with seborrheic keratosis majority were women (55%), compared with men (45%).
Australian study examined the prevalence of seborrheic keratosis with 170 patients and found no significant differences between men and women, although found slightly found increased number of women (26%: 21%).5 Distribution of subjects according to ethnic were Bataknese (94.00%). Hafner and Vogt said that seborrheic keratosis rarely found in blacks and native Americans, but dermatosis Papulosa nigra, a variant of seborrheic keratoses are common among people with black skin.5 Education level of the subject of research is the level of undergraduate / postgraduate (38%).The most occupation of the subjects were farmers (31%). Gefilem et al study found that from 478 patients with tumors of the skin verruca vulgaris and seborrheic keratosis, 126 patients (26.36%) were housewives, and 105 patients (21.97%) were students.14 Based on the marital status of subjects with seborrheic keratosis in showed that all the subjects were married

International Journal of Scientific and Research Publications, Volume 10, Issue 1, January 2020 161 ISSN 2250-3153
http://dx.doi.org/10.29322/IJSRP.10.01.2020.p97XX www.ijsrp.org
100 (100%). Based on the period that suffered from seborrheic keratosis majority of subjects had experienced seborrheic keratosis ≤ 10 years as many as 50 (50%). Baykal and Yazganoglu stated that seborrheic keratosis patients usually do not remember exactly when it started having seborrheic keratosis, except for the rapid development and a lot of the cases on the basis of internal malignancy.2
The quality of life of subjects who had keratosis seborrheic based on the Skindex-29 value obtained the majority of the subjects had a quality of life is very high (71%) with a value Skindex-29 at ≤ 5, followed by a high quality of life (27%) with the value Skindex-29 at 18-36, then the quality of life medium (2%) with a value Skindex 6-17.
V. CONCLUSION This study demonstrated that the most quality of life of the seborrheic keratosis patients had very high quality of life.
REFERENCES [1] Thomas VD, Snavely NR, Lee K, Swanson NA. Benigna epithelial tumors,
hamartomas, and hyperplasia. In: Goldsmith LA, Katz SI, Gilchrest BA, Paller AS, Leffell DJ, Wolff K, editor. Fitzpatrick’s Dermatology in General Medicine. 8th Edition. New York: McGraw-Hill; 2012: p. 2166-70
[2] Baykal C, Yazganoglu. Benign epidermal tumors. In: Clinical Atlas of Skin Tumors. New York: Springer, 2014: p. 3-22
[3] Rapini RP. Epithelial neoplasms. Dalam: Rapini RP, editor. Practical Dermatopathology. Elsevier; 2012: 264-8
[4] Weedon D, Marks R, Kao GF, Harwood CA. Keratinocytic tumours: Introduction. In: LeBoit PE, editor. World health organization of tumours: Pathology and genetics of skin tumours. IARC Press: Lyon 2006: p. 41-3
[5] Hafner C, Vogt T. Seborrheic keratosis. JDDG. 2008; 8: 664-77 [6] Tejada CS, et al. Impact on the quality of life of dermatological patients in
southern Brazil. An Bras Dermatol. 2011;86(6):1113-21. [7] Chren MM. The Skindex Instruments to Measure the Effects of Skin
Disease on Quality of Life. Dermatol Clin. 2012; 30(2): 231-6
[8] Verhoeven EWM, Kraaimat FW, Kerkhof PCM, Weel CV, Duller P, Valk PGM, et al. Prevalence of physical symptoms of itch, pain and fatigue in patients with skin disease in general practice. BJD 2007: 157: 1346-9
[9] Farshi MG, Sharifi HP, Rad MA. The Relationship between Self-Esteem, Mental Health and Quality of Life in Patients with Skin Diseases. Asian J Med Pharm. 2013; 3(2): 50-4.
[10] Both H, et al. Critical Review of Generic and Dermatology-Specific Health-Related Quality of Life Instruments. Journal of Investigative Dermatology. 2007; 127: 2726–39.
[11] Prinsen CAC, et al. Interpretation of Skindex-29 Scores: Response to Sampogna and Abeni. Journal of Investigative Dermatology. 2012; 132: 1500-1.
[12] Kwon OS, Hwang EJ, Bae JH, Park HE, Lee JC. Seborrheic keratosis in the Korean males: causative role of sunlight. Photodermatol. Photoimmunol. Photomed. 2003; 19: 73 – 80
[13] Gefilem GA, Suling PL, Kapantouw MG. Profil tumor jinak kulit di poliklinik kulit dan kelamin RSUP Prof. Dr. R. D Kandou Manado periode 2009 – 2011. Dermatovenereology Faculty of Medicine University of Sam Ratulangi Manado.
AUTHORS First Author – Imam Budi Putra, Department of Dermatology and Venereology, Faculty of Medicine, Universitas Sumatera Utara, Indonesia Second Author – Nelva Karmila Jusuf, Department of Dermatology and Venereology, Faculty of Medicine, Universitas Sumatera Utara, Indonesia Third Author – Evita Lourdes Pinem, Postgraduate Study of Dermatology and Venereology, Faculty of Medicine, Universitas Sumatera Utara, Indonesia Correspondence Author – IB Putra, Department of Dermatology and Venereology, Faculty of Medicine Universitas Sumatera Utara, Indonesia, e-mail: [email protected]
International Journal of Scientific and Research Publications, Volume 10, Issue 1, January 2020 162
ISSN 2250-3153
http://dx.doi.org/10.29322/IJSRP.10.01.2020.p9725 www.ijsrp.org
Comparison The Events Of Postoperative Sore
Throat In Patients Undergoing Surgery With General
Anesthesia Endotracheal Tube After The Administration
Of Dexamethason And NACL 0.9% At Haji Adam Malik
Hospital Medan
Wicak Kunto Wibowo*, Achsanuddin Hanafie**, Muhammad Arshad**, Akhyar Hamonangan Nasution**
*Resident of Anaesthesiology and Intensive Therapy, Faculty of Medicine, Universitas Sumatera Utara, Medan, Indonesia
**Departement of Anaesthesiology and Intensive Therapy, Faculty of Medicine, Universitas Sumatera Utara, Medan, Indonesia
DOI: 10.29322/IJSRP.10.01.2020.p9725
http://dx.doi.org/10.29322/IJSRP.10.01.2020.p9725
Abstract- Introduction: Most surgeries require general
anesthesia, where one of its complication is sore throat. Sore throat
can reduce patient’s satisfaction and increase postoperative
discomfort ranging from 17% to 76%. Some way to reduce this
complication are to restrict physical trauma arising from
instrumentation and airway manipulation.
Objective: To determine the difference in throat pain by
administering intravenous dexamethasone versus intravenous
NaCl 0,9% in postoperative patients with general anesthesia
endotracheal tube at Haji Adam Malik General Hospital, Medan.
Method: This research is an experimental research with a
double-blind randomized research design. After obtaining
approval from the Ethics Committee, Medical Faculty, University
of North Sumatra, Medan, 62 samples were collected, ages 21-60
years, PS-ASA I-II, agree to participate, informed consent
approval, and operating time < 3 hours. After being calculated
statistically, all samples were randomly divided into 2 groups.
Group A received 10 mg dexamethasone and group B received
NaCl 0,9%. Data were tested with the Mann Whitney Test with a
significance of p<0.05.
Results: The mean VAS value in patients who was given by
dexamethasone were VAS 2 for T1 and T2, and VAS 1 for T3 and
T4. The mean VAS value in patients who was given by NaCl 0.9%
were VAS 3 for T1, VAS 2 for T2 and T3, and VAS 1 for T4.
Conclusion: There was a statistically significant difference
after administering dexamethasone compared with NaCl 0,9%.
Index Terms- general anesthesia, sore throat, VAS,
dexamethasone, NaCl 0.9%
I. INTRODUCTION
ostoperative Sore Throat (POST) is one of many
complications that can occur in patients undergoing general
anesthesia techniques with intubation using the endotracheal tube.
These complaints usually improve after the first 24 hours. POST
is the 8th biggest complaint for patients undergoing general
anesthesia, where the most cause is the use of an endotracheal tube
using a balloon during surgery.1 POST is a complication that
decreases patient satisfaction and increases discomfort in the
postoperative period.2 The incidence of POST after general
anesthesia with endotracheal tube (ETT) ranges from 17% to 76%.
This occurs because of irritation and inflammation of the airway
and damage to the tracheal mucosa due to pressure of the
endotracheal tube.3 Several studies had been carried out in an
effort to reduce POST including limiting physical trauma that
might result from instrumentation and airway manipulation, such
as pharmacological interventions.4
Dexamethasone is a steroid drug whose mechanism of
action is related to prevent the formation of prostaglandins and
stimulate the release of endorphins, which affect mood and
calmness. This drug have anti-inflammatory and
immunosuppressant effect.5 As we all know that the reduction and
inhibition of lymphocytes and peripheral macrophages play a role
in this effect. Also indirect inhibition of phospholipase A2 which
inhibits the release of arachidonic acid, prostaglandin and
leukotriene precursors, from membrane-bound phospholipids.6
II. METHODS
This study is a double blind randomized experimental study
to determine the comparison of postoperative sore throat pain with
general anesthesia using endothracheal tube anesthesia in
intravenous dexamethasone administration and intravenous NaCl
0.9%. This research was conducted at the Haji Adam Malik
General Hospital, Medan, Juli 2019. The population was all
patients who underwent elective surgery at the Haji Adam Malik
General Hospital, Medan. Samples obtained in this study were 62
samples that fit the inclusion and exclusion criteria. All samples
were divided into 2 groups. Group A received 2ml dexamethasone
5mg and group B received 2ml NaCl 0.9%. Data were tested by
Chi Square with significance of p<0.05.
P

International Journal of Scientific and Research Publications, Volume 10, Issue 1, January 2020 163
ISSN 2250-3153
http://dx.doi.org/10.29322/IJSRP.10.01.2020.p9725 www.ijsrp.org
III. RESULTS
The study was followed by 62 subjects who were divided
into two groups with the same amount, each as many as 31 people
where group A received 2ml dexamethasone 5mg and group B
received 2ml NaCl 0.9%.
3.1 Demographic Data Table
Characteristic Dexamethasone NaCl 0,9% p-value
Gender, n (%)
Male 15 (48,3%) 13 (41,9%) 0,613
Female 16 (51,7%) 18 (58,1%)
Age, mean ± SD 48,58 ± 13,55 46,58 ± 10,95 0,266
Body Weight ± SD 59,94 ± 5,78 58,35 ± 5,25 0,339
Body Height ± SD 1,56 ± 0,06 1,58 ± 0,09 0,297
BMI, mean ± SD 24,69 ± 2,86 24,72 ± 2,85 0,972
Duration of Intubation ± SD 148,87 ± 28,80 149,35 ± 39,40 0,920
ASA
ASA 1 3 (9,6%) 7 (22,5%) 0,171
ASA 2 28 (90,3%) 24 (77,4%)
Total 31 31
In this study, gender found in samples at the most were
female with 54.8%, and with an average age of sample was 47.58
years. For the mean body mass index (BMI) at sample was 24.71
kg / m2 which shows normoweight. Patients in this study were
mostly in ASA 2 of 83.8%. In addition to this study, it was found
that the characteristic data in this study were gender, age, weight,
height, body mass index, duration of intubation, and ASA had
some data that were not normally distributed with p values <0.05.
After further testing was carried out to assess homogeneity, it is
concluded that the data obtained are homogeneous with p-value >
0.05. Therefore, to carry out further tests to assess the relationship,
the Mann Withney Test was conducted with a 95% confidence
level.
3.2 Average of VAS Value on POST Patients with General
Anesthesia Endotracheal Tube After the Administration of
Dexamethasone and NaCl 0.9% at T1 (1 Hour Post-
Extubation), T2 (6 Hours Post-Extubation), T3 (12 Hours
Post-Extubation), T4 (24 Hours Post-Extubation).
Mean (± SD) p-value
Dexamethasone NaCl 0,9%
VAS T1 2,00 (0,577) 2,74 (0,729) 0,001
VAS T2 1,74 (0,445) 2,48 (0,677) 0,001
VAS T3 1,10 (0,301) 1,84 (0,735) 0,001
VAS T4 1,06 (0,250) 1,52 (0,626) 0,001
Mann Whitney Test, <005
Based on Table 3.2, it was found that the mean VAS of
POST patients in the group that had previously been given
dexamethasone was at VAS 2 at T1, and VAS 1 at T2, T3, and T4.
Whereas in groups that had previously been given 0.9% NaCl
injections were in VAS 2 at T1, T2 and VAS 1 at T3, and T4.
Statistically there were significant differences in the VAS POST
patients after administration of dexamethasone and NaCl 0.9% on
T1, T2, T3, and T4 observations with p values of 0.001 (<0.05),
respectively.
3.3 Comparison of VAS Value on POST Patients with General Anesthesia Endotracheal Tube after Administration of
Dexamethasone and NaCl 0.9% at T1
VAS 1
n (%)
VAS 2
n (%)
VAS 3
n (%)
VAS 4
n (%)
Total P-value
Dexamethasone 5 (16,1) 21(67,7) 5 (16,1) 0 (0) 31 (100) 0,001
NaCl 0,9% 1 (3,2) 10 (32,3,7) 16 (51,6) 4 (12,9) 31 (100)
Total 6 (9,6) 31 (50,0) 21 (33,8) 4 (6,4) 62 (100)
Mann Whitney Test, <005
Based on table 3.3 it was found that the VAS value of POST
patients in the group that had previously been given
dexamethasone injection was seen more at VAS 2 (21 patients =
67.7%) while in the group that had previously been given NaCl
0.9% injection had VAS 3 values were 16 patients (51.6%). In
addition, in the dexamethasone group there were no patients with
a VAS 4 value, while in the NaCl 0.9% group there were still
patients with a VAS 4 value (4 patients = 12.9%). Based on this it
can be concluded that patients given dexamethasone have lower
VAS values compared with 0.9% NaCl. Statistically there were
significant differences in the VAS value of sore throat patients
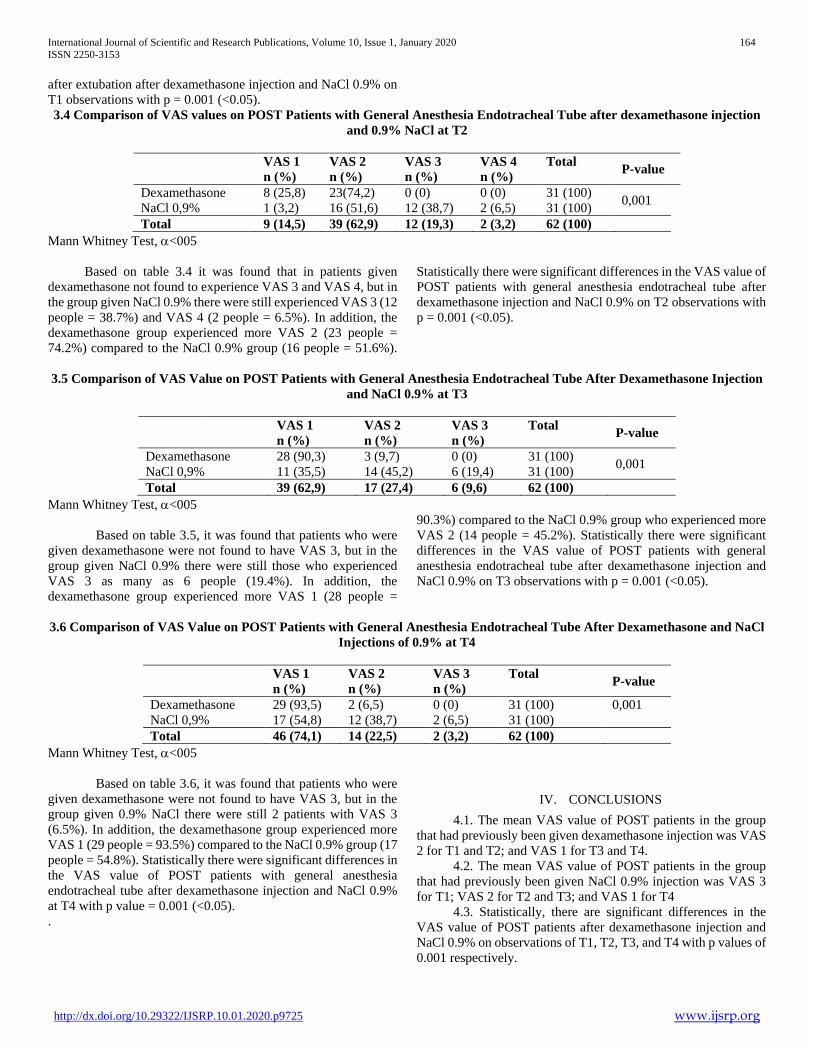
International Journal of Scientific and Research Publications, Volume 10, Issue 1, January 2020 164
ISSN 2250-3153
http://dx.doi.org/10.29322/IJSRP.10.01.2020.p9725 www.ijsrp.org
after extubation after dexamethasone injection and NaCl 0.9% on
T1 observations with p = 0.001 (<0.05).
3.4 Comparison of VAS values on POST Patients with General Anesthesia Endotracheal Tube after dexamethasone injection
and 0.9% NaCl at T2
VAS 1
n (%)
VAS 2
n (%)
VAS 3
n (%)
VAS 4
n (%)
Total P-value
Dexamethasone 8 (25,8) 23(74,2) 0 (0) 0 (0) 31 (100) 0,001
NaCl 0,9% 1 (3,2) 16 (51,6) 12 (38,7) 2 (6,5) 31 (100)
Total 9 (14,5) 39 (62,9) 12 (19,3) 2 (3,2) 62 (100)
Mann Whitney Test, <005
Based on table 3.4 it was found that in patients given
dexamethasone not found to experience VAS 3 and VAS 4, but in
the group given NaCl 0.9% there were still experienced VAS 3 (12
people = 38.7%) and VAS 4 (2 people = 6.5%). In addition, the
dexamethasone group experienced more VAS 2 (23 people =
74.2%) compared to the NaCl 0.9% group (16 people = 51.6%).
Statistically there were significant differences in the VAS value of
POST patients with general anesthesia endotracheal tube after
dexamethasone injection and NaCl 0.9% on T2 observations with
p = 0.001 (<0.05).
3.5 Comparison of VAS Value on POST Patients with General Anesthesia Endotracheal Tube After Dexamethasone Injection
and NaCl 0.9% at T3
VAS 1
n (%)
VAS 2
n (%)
VAS 3
n (%)
Total P-value
Dexamethasone 28 (90,3) 3 (9,7) 0 (0) 31 (100) 0,001
NaCl 0,9% 11 (35,5) 14 (45,2) 6 (19,4) 31 (100)
Total 39 (62,9) 17 (27,4) 6 (9,6) 62 (100)
Mann Whitney Test, <005
Based on table 3.5, it was found that patients who were
given dexamethasone were not found to have VAS 3, but in the
group given NaCl 0.9% there were still those who experienced
VAS 3 as many as 6 people (19.4%). In addition, the
dexamethasone group experienced more VAS 1 (28 people =
90.3%) compared to the NaCl 0.9% group who experienced more
VAS 2 (14 people = 45.2%). Statistically there were significant
differences in the VAS value of POST patients with general
anesthesia endotracheal tube after dexamethasone injection and
NaCl 0.9% on T3 observations with p = 0.001 (<0.05).
3.6 Comparison of VAS Value on POST Patients with General Anesthesia Endotracheal Tube After Dexamethasone and NaCl
Injections of 0.9% at T4
VAS 1
n (%)
VAS 2
n (%)
VAS 3
n (%)
Total P-value
Dexamethasone 29 (93,5) 2 (6,5) 0 (0) 31 (100) 0,001
NaCl 0,9% 17 (54,8) 12 (38,7) 2 (6,5) 31 (100)
Total 46 (74,1) 14 (22,5) 2 (3,2) 62 (100)
Mann Whitney Test, <005
Based on table 3.6, it was found that patients who were
given dexamethasone were not found to have VAS 3, but in the
group given 0.9% NaCl there were still 2 patients with VAS 3
(6.5%). In addition, the dexamethasone group experienced more
VAS 1 (29 people = 93.5%) compared to the NaCl 0.9% group (17
people = 54.8%). Statistically there were significant differences in
the VAS value of POST patients with general anesthesia
endotracheal tube after dexamethasone injection and NaCl 0.9%
at T4 with p value = 0.001 (<0.05).
.
IV. CONCLUSIONS
4.1. The mean VAS value of POST patients in the group
that had previously been given dexamethasone injection was VAS
2 for T1 and T2; and VAS 1 for T3 and T4.
4.2. The mean VAS value of POST patients in the group
that had previously been given NaCl 0.9% injection was VAS 3
for T1; VAS 2 for T2 and T3; and VAS 1 for T4
4.3. Statistically, there are significant differences in the
VAS value of POST patients after dexamethasone injection and
NaCl 0.9% on observations of T1, T2, T3, and T4 with p values of
0.001 respectively.

International Journal of Scientific and Research Publications, Volume 10, Issue 1, January 2020 165
ISSN 2250-3153
http://dx.doi.org/10.29322/IJSRP.10.01.2020.p9725 www.ijsrp.org
REFERENCES
[1] Sugathan, Reshma., Raj, Sumesh. Efficacy of intracuff dexamethasone in reducing the incidence of post-operative sore throat: an original article. International Journal of Research in Medical Sciences, 2019 May;7(5):1665-1669.
[2] Lee, S. H., et al. The Prophylactic Effect of Dexamethasone on Postoperative Sore Throat in Prone Position Surgery. Korean Journal of Anethesiology vol 69(3). 2016:255-261.
[3] Muhammad, M., Fuadi, I., Nawawi, A., M. Perbandingan Penggunaan Topikal Spray Benzidamin HCl 0,15% dan Gel Lidokain 2% pada Pipa Endotrakeal terhadap Kejadian Nyeri Tenggorok Pasca Intubasi Endotrakeal. Jurnal Anestesi Perioperatif vol 3(2). 2015:123-30.
[4] Suherman, SK, Ascobat P. Farmakologi dan Terapi. Edisi 5. Jakarta: Gaya Baru. 2007.
[5] Thomas, S., & Beevi, S. Dexamethasone reduces the severity of postoperative sore throat. Canadian Journal of anesthesia, 54(11). 2007:897-901.
[6] Mycek, M. J., Harvey, R. A., Champe, P. C., Farmakologi Ulasan Bergambar. Jakarta: Widya Medika; 2001: 407-415.
AUTHORS
First Author – Wicak Kunto Wibowo, Post graduate of
Anaesthesiology and Intensive Therapy, Faculty of Medicine,
Universitas Sumatera Utara, Medan, Indonesia,
Second Author – Achsanuddin Hanafie, Anaesthesiology and
Intensive Therapy, Faculty of Medicine, Universitas Sumatera
Utara,Medan, Indonesia, [email protected]
Third Author – Muhammad Arshad, Anaesthesiology and
Intensive Therapy, Faculty of Medicine, Universitas Sumatera
Utara,Medan, Indonesia, [email protected]
Fourth Author – Akhyar Hamonangan Nasution,
Anaesthesiology and Intensive Therapy, Faculty of Medicine,
Universitas Sumatera Utara,Medan, Indonesia,

International Journal of Scientific and Research Publications, Volume 10, Issue 1, January 2020 166
ISSN 2250-3153
http://dx.doi.org/10.29322/IJSRP.10.01.2020.p9726 www.ijsrp.org
A Study of Attitude of Geography Teachers towards
Geographic Education in Arunachal Pradesh
Tangkheso Tamai, Prof. T. Lhungdim
Research Scholar, Dept. of Education, Rajiv Gandhi University, Arunachal Pradesh
Professor, Dept. of Education, Rajiv Gandhi University, Arunachal Pradesh
DOI: 10.29322/IJSRP.9.11.2019.p9526
http://dx.doi.org/10.29322/IJSRP.9.11.2019.p9526
Abstract- The study compares the Attitude of Geography Teachers towards Geography Education in the selected three districts of
Arunachal Pradesh. The total of 111 samples were taken from three selected districts. The three districts were randomly selected
through simple random sampling techniques and they are Lohit, Lower Subansiri and West Siang Districts of Arunachal Pradesh.
The researcher followed Normative Survey Method for the present piece of work. The analysis was done with mean, standard
Deviation and ‘t’ test as statistical techniques. The findings reveals significant difference in relation to Sex, and not significant in
relation to Settlement and social groups. The study also reveals that the overall attitude of Teachers is positive.
Index Terms- Geographic Education, Attitudes, Geography Teachers, Elementary Education, Arunachal Pradesh
1. Introduction
Geography as a subject enables us to understand the earth we are living in from a spatial viewpoint. It provides a link
between the social sciences and the physical sciences, through the provision of an understanding of the dynamics of our cultures,
societies and economics on the one hand, and that of physical landscapes and environmental processes on the other. Geography is
an inclusive subject, but in India it is taught as a social science discipline. Geography is both a powerful medium for promoting
the education of individuals and major contributor to international, environmental and development Education (Commission on
Geographical Education of the International Geographical Union, 2004). Indeed, a recurring theme in geography is the way
people organize and use the environment (Fien, Gerber, & Wilson, 1989) and this provides the basis for the argument that a
school geography is responsive to the developments in geography and as a discipline will equip the students with the knowledge,
skills and values as useful citizens of the world.
An effective geography instruction requires teacher to improve students’ individual and group characteristics according
to the knowledge, skills, and values embedded within acquisitions. In addition, they bring a lot of components by drawing various
shapes over students’ skill and personalities. Then teachers can adapt their students to the unique environmental conditions in the
classroom ecosystem (Zabel and Zabel, 1996).In this sense, geography teachers provide the conditions that prepare their students
for life (Levin & Nolan, 2000).
Today there is a rising need for geography in both students and teachers, which is known to mould and enhance their
skills. The researcher in geography education has yet to flourish which requires investment in the continued training and
development of geography education professionals so this is an attempt made to know the attitudes or thinking of Geography
Teachers towards Geography Education in the selected three districts of Arunachal Pradesh.
II. STATEMENT OF THE PROBLEM
“A Study of Attitude of Geography Teachers towards Geographic Education in Arunachal Pradesh”
Objective of the study: The study has been designed to test the following objectives;
1. To study the difference between the attitude of Male and Female Geography Teachers towards Geographic Education in
Arunachal Pradesh.

International Journal of Scientific and Research Publications, Volume 10, Issue 1, January 2020 167
ISSN 2250-3153
http://dx.doi.org/10.29322/IJSRP.10.01.2020.p9726 www.ijsrp.org
2. To study the difference between the attitude of Tribal and Non-Tribal Geography Teachers towards Geographic
Education in Arunachal Pradesh.
3. To study the difference between the attitude of Rural and Urban Geography Teachers towards Geographic Education in
Arunachal Pradesh.
Hypotheses of the Study:
H01 There is no significant difference between the attitude of Male and Female Geography Teachers towards Geographic
Education in Arunachal Pradesh.
H02 There is no significant difference between the attitude of Tribal and Non-Tribal Geography Teachers towards
Geographic Education in Arunachal Pradesh.
H03 There is no significant difference between the attitude of Rural and Urban Geography Teachers towards Geographic
Education in Arunachal Pradesh.
Methodology:
The Descriptive Survey Method was employed by the researcher to collect data from Teachers of various schools for the
present piece of research work. The researcher used this method for collection of Teachers Attitude towards Geography Education
and this involves Measurement, Analysis, Comparison and interpretation.
Population and Sample:
The researcher randomly selected three districts of Arunachal Pradesh namely; Lohit District, Lower Subansiri District
and West Siang District. The sample comprised of 111 Teachers (Male-55, Female-56) from 45 Government Schools from the
selected districts.
Table No.1: Showing the Distribution of Sex, Gender and Location of Geography Teachers in the Three Selected Districts
of Arunachal Pradesh.
Districts Total Students Race Gender Location
T NT M F R U
Lohit 53 28 25 40 13 29 24
West Siang 26 10 16 26 0 17 9
Lower Subansiri 32 17 15 32 0 16 16
Total 111 55 56 98 13 62 49
Note: T-Tribal, NT-Non-Tribal, M-Male, F-Female, R-Rural and U-Urban.
Delimitations of the Study:
The sample size of study was delimited to;
1. Lower Subansiri, Lohit and West Siang Districts of Arunachal Pradesh.
2. Only Geography Teachers.
3. The independent variables- Gender, Settlement and Social Group.
Tools Used in the study:
The investigator used a self-developed Attitude scale to measure the Attitude of Geography Teachers towards
Geographic Education in the Elementary Schools in Arunachal Pradesh and followed the procedure in order to make the
questionnaire reliable and valid, The procedures of construction and Standardization of an attitude scale was adopted as suggested
by Likert (1932). This attitude scale is popularly known as Liker’s five point scale because the each statement of the scale
possesses five options for a respondent. The respondent was to put the tick/Correct mark on any one option as per his/her
willingness. The items with‘t’ ratio less than 1.96 at 0.05 level of significance were rejected on the basis that they had no

International Journal of Scientific and Research Publications, Volume 10, Issue 1, January 2020 168
ISSN 2250-3153
http://dx.doi.org/10.29322/IJSRP.10.01.2020.p9726 www.ijsrp.org
discriminating power. In this way, some items were rejected from the preliminary draft. This Scale consisted of 23 statements
related to various dimensions on Geographic Education.
Statistical Technique Used:
The following statistical techniques were used by the investigator; Mean, Standard Deviation and t-test was carried out
to analyse the collected data and verify the hypothesis.
III. RESULTS AND INTERPREATION
The major findings of the study as per variables wise of geography teachers towards their attitude on Geographic
Education in the selected three districts of Arunachal Pradesh.
Objective 1: To study the difference between the attitude of Male and Female Geography Teachers towards Geographic
Education in Arunachal Pradesh.
Hypothesis 1: There is no significant difference between the attitude of Male and Female Geography Teachers towards
Geographic Education in Arunachal Pradesh.
Table.2: Summary of computed Attitude Mean Scores, SD, SED and t-value of the scores of male and female Geography
Teachers at Elementary School Stage in the Three Selected Districts of Arunachal Pradesh.
Groups of Teachers N Mean SD 𝑆𝐸𝐷 df t-value Criterion Value of ‘t’ at
0.01 level
Male Teachers 55 90.62 3.20 0.68 109 11.15 2.62
Female Teachers 56 82.92 4.06
* Significant at 0.01 level.
Interpretation of the result
The Table- 2 indicates that the attitude mean scores of Male Teachers is 90.62 which is marginally higher than the
Female Teachers with 82.92 and computed t-value came out to be 11.15 which is greater than the table t-value(2.62) at .01 level
of significant for 109 df. Therefore, the computed t-values (11.15) have been considered significant and the formulated
hypothesis: “There is no significant difference between the attitude of Male and Female Geography Teachers towards Geographic
Education in Arunachal Pradesh” got rejected. This means that there exists difference in attitude of male and female teachers
towards geography subjects.
Objective 2: To study the difference between the attitude of Tribal and Non-Tribal Geography Teachers towards Geographic
Education in Arunachal Pradesh.
Hypothesis 2: There is no significant difference between the attitude of Tribal and Non-Tribal Geography Teachers towards
Geographic Education in Arunachal Pradesh.
Table.3: Summary of computed Attitude Mean Scores, SD, SED and t-value of the Tribal and Non-Tribal Geography
Teachers at Elementary School Stage in the Three Selected Districts of Arunachal Pradesh.
Groups of Teachers N Mean SD 𝑆𝐸𝐷 df t-value Criterion Value of ‘t’ at
0.01 level
Tribal Teachers 98 82.80 4.04 1.04 109 2.51* 2.62
Non-Tribal Teachers 13 83.50 3.50
* Not significant at 0.01 level.
Interpretation of the result
The Table- 3 reveals that the attitude mean scores of Tribal teachers (82.80) is slightly lower than the Non-Tribal
(83.50) teachers towards geography subjects and the computed t-value came out to be 2.51 which is lesser than the criterion table
t-value (2.62) at .01 level of significant for 109 df. Therefore, the computed t-values (2.51) has not been considered significant
and the formulated hypothesis: “There is no significant difference between the attitude of Tribal and Non-Tribal Geography

International Journal of Scientific and Research Publications, Volume 10, Issue 1, January 2020 169
ISSN 2250-3153
http://dx.doi.org/10.29322/IJSRP.10.01.2020.p9726 www.ijsrp.org
Teachers towards Geographic Education in Arunachal Pradesh” got accepted. It means that the Tribal and Non-Tribal do not
differ in their attitude and they are equally positive towards geography subject in the selected districts of Arunachal Pradesh.
Objective 3: To study the difference between the attitude of Rural and Urban Geography Teachers towards Geographic Education
in Arunachal Pradesh.
Hypothesis 3: There is no significant difference between the attitude of Rural and Urban Geography Teachers towards
Geographic Education in Arunachal Pradesh.
Table. 4: Summary of computed Attitude Mean Scores, SD, SED and t-value of the Rural and Urban Geography Teachers
at Elementary School Stage in the Three Selected Districts of Arunachal Pradesh.
Groups of Teachers N Mean SD 𝑆𝐸𝐷 df t-value Criterion Value of ‘t’ at
0.05 level
Rural Teachers 62 82.53 4.16 0.73 109 1.09* 1.98
Urban Teachers 49 83.33 3.69
* Not significant at 0.05 level.
Interpretation of the result
The Table - 4 indicates that the attitude score of rural teachers (82.53) is slightly lesser than the urban teachers (83.33)
and computed t-value came out to be 1.09 which is lesser than the table t-value (1.98) at .05 level of significant for 109 df.
Therefore, the computed t-values (1.09) have been considered not significant and the formulated hypothesis: “There is no
significant difference between the attitude of Rural and Urban Geography Teachers towards Geographic Education in Arunachal
Pradesh” got accepted. It reveals that there is no difference in the attitude of rural and urban teachers towards geography subject.
Finding of the Study:
There is a variation between the attitude of Male and Female Geography Teachers towards Geography Education. The
study reveals that Male Teachers are having better attitude than Female Teachers.
The attitude mean scores of Tribal teachers is slightly lower than the Non-Tribal teachers towards geography subjects but
the calculated value reveals that the Tribal and Non-Tribal do not differ in their attitude towards geography subject in the
selected districts of Arunachal Pradesh.
The Attitude mean scores of rural teachers are slightly lesser than the urban teachers but it reveals that there is no
difference in their attitude towards geography subject.
IV SUGGESTION AND CONCLUSION
Suggestion for Further Research:
1. A comparative study of different states of northeast India towards Geography Education may be conducted.
2. Attitudes of Geography teachers and Non-Geography teachers towards teaching Geography may be conducted.
3. A Comparative study between Teachers and Students Attitudes towards Geography Education may be conducted.
4. A Comparative study between Teachers of Secondary Level and Senior Secondary Level towards geography
Education may be conducted.
5. The Attitude of Government and Private School Students towards geography Education in to the different variables
may be conducted.
6. A Comparative study between Students of Secondary Schools and Senior Secondary Schools towards geography
Education may be conducted.
Conclusion:
On the basis of the present study on the attitude it reveals that the teachers are having positive attitude towards
geography subjects in the selected three districts in Arunachal Pradesh. Whereas the study indicates that proper attention needs to
be provided by the Government and Parents for improvement of geographic education at elementary school stages in Arunachal
Pradesh. Lastly the findings of the research will helpful in the field of geography education especially for the teachers, subject
experts, researchers, teacher educators and curriculum framers of elementary schools of Arunachal Pradesh.
International Journal of Scientific and Research Publications, Volume 10, Issue 1, January 2020 170
ISSN 2250-3153
http://dx.doi.org/10.29322/IJSRP.10.01.2020.p9726 www.ijsrp.org
REFERENCES
[1] Dar, M. A & Khan, M. A., (2018). Teachers with Favourable and Unfavourable Professional Attitude-A study on Teaching
Competence and Spiritual Intelligence. Periodic Research, Volume 7, Issue-2, November-2018.ISSNNo-
22319435.Retrievedfrom http://www.socialresearchfoundation.com/ upoadreserchpapers /2 / 240 /
1908121250091st % 20mohd%20amin % 20dar.pdf
[2] Edwards, A. L., (1969). Technique of Attitude Scale Construction. Vakils, Feffer and Simons Private Limited, Bombay.
[3] Garret, H. E. and Woodworth, R. S., (1981). Statistics in Psychology and Education, Vakils, Feffer and Simons, Bombay.
[4] Koul, Lokesh., (1996). Methodology of Educational Research. 3rd edtion. Vikash Publishing House Pvt. Ltd. New Delhi.
[5] Lamani, G. L., Naik, R. H., (2017). An Interaction Effect of Urban Students Mental Health, Emotional Intelligence and
Attitude on Academic Achievement in Science Among Secondary School Students, International Journal of Advanced
Research in Education & Technology , ISSN: 23942975 (Online) Vol.4, Issue 3. Retrieved from http://ijaret.com/wp-
content/themes/felicity/issues/vol4issue3/giija.pdf.
[6] M, P. Sumesh & K, P. A. Gafoor (2013). Attitude of Government and Private School Students towards Geography Education
in Calicut District of Kerala-A Comparative Study, Journal of Education and Human Development, Volume.2 No.2,
December.2013. Retrieved from http://jehdnet.com/vol-2-no-2-december-2013-abstract-7-jehd.
[7] Rana Deepa (2017). A study of Attitude of Upper Primary School Teachers Towards Discipline and Participatory
Management, Periodic Research, Volume 6, Issue-1, August-2017. ISSN No-22319435
[8] Sharma, R. S. (2006). Measurement and Evaluation Techniques. ABD Publisher, B-46, Natarai Nagar. Imliwala Phatak.
Jaipur-302005 (Rajasthan) India. Retrieved from
http://www.socialresearchfoundation.com/upoadreserchpapers/2/174/1710141119031st%20deepa%20rana.p
df.
[9] Thurstone, L.L. and E, J. Chave (1929). “The Measurement of Attitude’. Chicago The University of Chicago Press.
AUTHORS
First Author - Tangkheso Tamai, Ph.D Research Scholar, Dept. of Education, Rajiv Gandhi University, Arunachal Pradesh
Second Author - Prof. T. Lhungdim, Professor, Dept. of Education, Rajiv Gandhi University, Arunachal Pradesh
Correspondence Author – Tangkheso Tamai, [email protected], 8974545991 / 9383327271

International Journal of Scientific and Research Publications, Volume 10, Issue 1, January 2020 171
ISSN 2250-3153
http://dx.doi.org/10.29322/IJSRP.10.01.2020.p9727 www.ijsrp.org
Determinants of Undergraduate Students’ Academic
Performance: The Case of University of Sri
Jayewardenepura, Sri Lanka
A.J.M. Priyadarshana*, H.G.M.D. Kumari**
University of Sri Jayewardenepura, Sri Lanka
** Email: [email protected]*, [email protected]**
DOI: 10.29322/IJSRP.10.01.2020.p9727
http://dx.doi.org/10.29322/IJSRP.10.01.2020.p9727
Abstract- The primary objective of this study was to examine the factors affecting students’ academic performance at undergraduate
level. The research is conducted based on students of the Faculty of Management Studies and Commerce at the University of Sri
Jayewardenepura which is one of the state universities in Sri Lanka. The Faculty of Management Studies and Commerce is one of the
largest faculties in the university system and enrolls about 5,000 internal undergraduate students. The faculty offers 12 special degree
programs, more than 250 course units covering the range of Management and Accounting related disciplines (Prospectus USJP, 2017).
The sample consisted 191 graduate students who were completed their degree program in the year 2016 and 2015 (Academic year
2011/12 and 2010/11). Correlation analysis and multiple regression analysis were conducted as main analytical methods. The result of
the correlation analysis showed that there was a positive correlation of past academic performance, proficiency in English, lecture
attendance and time spent outside the university on academic performance and negative correlation between internship period and
academic performance. The multiple regression analysis concluded that past academic performance, English proficiency, lecture
attendance and time spent outside the university are significant factors when evaluating the academic performance. The study
analyzed hypothesis test in order to determine whether there is a significant difference exist between intern students’ and non-intern
students’ academic performance. The independent sample T-test was used to test the hypothesis and result found that there is no
significant difference exists between interns’ and no-interns’ academic performance. Study concluded that better understanding of
factors affects the performance of students in any given course is must in the process of improving students’ academic performance.
Index Terms- Academic Performance, Career Achievement, Internship, Undergraduate Students
I. INTRODUCTION
Education plays a pivotal role in the progress and development of a country. Hence, government invest significant amount on higher
education. And most of the developing countries are increasing their university students’ enrollment year by year. Sri Lanka as a
developing country also increasing the university student enrollment compared with previous years. In the year 1990 new admission
on university education was 1,752 and in 2016 it has been increased to 29,083 students and Sri Lanka expenditure on university
education as a percentage of government expenditure, which during the 1990s remained 1.16 had been increased to 2.09 by 2016 (Sri
Lanka University Statistics,2016)
But there is a doubt whether government investment on higher education and its output in terms of student’s achievement are equal.
When there is a huge gap between government expenditure and academic performance signals fallen standard of education. Despite
the increasing trend of student enrollment, the number of students graduating by completing their degree shows decreasing trend. It
means that there is a failure to achieve good performance compared with government investment which is negatively impact on
student’s future and to the progress of the country. Therefore, it is important to identify the factors affecting students’ academic
performance in order to get anticipated outcome.
There are many researches have been conducted to identify the factors affecting student’s academic performance like gender, family
background, student previous academic achievement, teacher student ratio, language proficiency, internship in local as well as
international context but studies which were empirically examined the impact of above factors including student internship on
academic performance in Sri Lankan context are not much adequate. The internship has become an integral part of the degree
programs in universities over the past decades. With the internship experience, students are able to gain new perspectives about their
academic activities because internship assists to demonstrate the relevance of what they learn in the classroom and applicability in the
real world. Hence the impact of internship on academic performance also needs to address when evaluating graduate students’
academic performance.

International Journal of Scientific and Research Publications, Volume 10, Issue 1, January 2020 172
ISSN 2250-3153
http://dx.doi.org/10.29322/IJSRP.10.01.2020.p9727 www.ijsrp.org
Therefore, the study primarily conducted to examine factors affecting student’s academic performance at undergraduate level and try
to give insight about the effect of those factors on student academic achievement. And study further extended to assess whether there
is a significant difference exist between internship and non-internship students’ academic performance in order to evaluate the
productivity of undergraduate internship program in university academic curriculum.
II. LITERATURE REVIEW
The study conducted by Cheung and Kan (2002) based on 168 students of business communications course in Hong Kong identified
that females perform better than males and positive relationship of academic background and previous academic achievement with
academic performance. The tutorial attendance and academic performance also showed a positive relationship and further, there is no
relationship between semester course loads and academic performance. The study conducted at University of Technology Sydney by
Hutcheson and Tse (2006) found there is a significant relationship between tutorial attendance and academic performance. The
students who involved with more academic works within university have obtained higher average marks than others. Nonis and
Hudson (2006) found that prior academic result of university students is significant variable when evaluating current academic
performance.
Warren (2002) explained students who were not employed intensively spend more time on academic related activities and extra-
curricular activities. Mushtaq and Khan (2012) have examined factors affect to students’ academic performance based on 175
students, and they found that communication skills, learning facilities and proper guidance positively affect to students’ academic
performance and family stress negatively affects to academic performance. They further explained the students’ effective
communication and competence in English language contributes to higher academic achievement.
Noble (2006) mentioned that students’ academic accomplishment is affected by background characteristics of the family such as
family income, parents’ education level and guidance from parents. The academic environment is significant to student academic
performance and there is a positive relationship between father’s education level and child’s academic level. Gang Li at el. (2010)
conducted a quantitative research based on questionnaire survey among 435 students in School of Management at the University of
Surrey. They found English proficiency, social communication and perceived impact of learning success of family are significant
factors when determining academic performance. The family income, parents’ education, lecture attendance, sex and teacher-student
ratio were acted as main characters when assessing student performance according to the Raychauduri et al. (2010) findings.
Tessema at el. (2014) examined the effect of student employment on GPA using 5223 respondents in Midwestern public university
between 2001 and 2009. Research concluded there is a significant negative but very small impact between working hours and
academic performance. When students work more hours, their academic performance come lower. Non-working students and students
who work fewer hours per week devote more time on their studies. Research further stated that student employment has both short
term and long term benefits and to be competitive in today’s labor market, the internship is critical. Threshold Model explained by
Cheng (1995) suggested that positive outcomes increase when students work below the threshold number of and above that limit,
increase the negative outcomes. The threshold hours of work do not precisely define, and this model predicts nonlinear effect of work
hours on outcome.
Koehler’s (1974) study looked at the overall GPA of students prior the internship and compared it to their overall GPA at the
graduation. He determined that Pennsylvania State University students, that both accounting and general grades enhanced with
following an internship. English and Koeppen at el. (1993) concluded on their research that students who undertook internship
perform better than non-interns in the semesters following an internship in both their accounting and non-accounting courses. Reddy
& Moores (2006) explained that interns have improved their final year marks by 3.2% compared with non-interns and out of total,
14% have improved their degree class with the internship experience based on the students of human psychology degree over a six
year period.
Rawlings, White, & Stephens (2005) concluded in their study conducted based on students of information system degree that there is a
high probability to achieve first and second upper degree for students who undertook internship than non-interns. Thilakerathne and
Madurapperuma, (2014) conducted a study to determine whether internship experience impact to improve GPA for students in
accounting degree of the University of Kelaniya. They found statistically significant academic performance of internship students.
Better result may in turn result in a higher degree class and better employment prospects. They further found in their research that Z-
score of students is not a significant variable when analyzing the current academic performance of graduate students in Sri Lankan
context.
Knouse et al. (1999) conducted a research to identify the relationship between college internship, college performance and subsequent
career opportunity. The data were collected from 1,117 students and study revealed that those who had internships attained a
significantly higher GPA upon graduation than those who did not have an internship even both parties entered into the college with
same potential. Students who undertook internship showed somewhat younger than non-interns and there was no significant difference
in sex when considering the academic performance of interns.
Zoysa and Rudkin (2007) found positive relationship between hours worked and academic performance of overall sample based on
their study of accounting students in Australia. There is a positive relationship between paid employment and academic performance
of local students and negative relationship between these two variables for international students. They further explained that students
did not give optimal engagement for university education because of the work pressure.
Andrew Lee Hock Cheong et al. (2014) conducted a research with the use of four purposively selected Malaysian private university
students who had undergone three months internship program in the Klang Valley. The study concluded internship provides thorough

International Journal of Scientific and Research Publications, Volume 10, Issue 1, January 2020 173
ISSN 2250-3153
http://dx.doi.org/10.29322/IJSRP.10.01.2020.p9727 www.ijsrp.org
understanding about the academic activities than they learned under the academic curriculum. They further explained university and
host companies should have a well-structured internship program to enhance the learning experience.
Barke et al. (2000) concluded that non-working students show 1.7 percent higher GPA than working students. Humphrey’s (2006)
also evidenced that working students show a significantly lower end-year average GPA. Lindsay and Paton-Saltzberg (1994)
explained working students showed a failure rate of average three times than non-working students and working students obtained
poor results and poor degree class. The study conducted by Curtis and Shani (2002) to find the impact of working students on their
academic performance, found that employment while studying reduces the lecture attendance, poor grades on exams and higher
negative consequences on their health.
Warinda (2013) concluded that most of the internship students do not meet their internship expectations. All interns did not get same
level of skills and it varied according to the location they get internship experience. They have recommended that university should
identify the areas which need to lead their students to get more exposure of learning and career expectations.
Giacomino (1990) evaluated the internship experience of students based on three-semester post internship period. He found no
significant impact of internship on academic performance. He hypothesized the reason for this as, since most of the interns receive
permanent employment from internship providers at the end, students have less motivation on academic performance enhancement.
Knechel and Snowball (1987) studied academic performance, measured by GPA, to assess the impacts of accounting internships using
pairs of non-interns and interns based on GPA and number of credit hours of course work finished prior to the internships of
University of Florida. They found no significant difference between interns and non-interns in GPA after completing an internship.
They further noted that students who got an auditing internship significantly outperform than those who had not participated in
internships. Light (2001) interviewed undergraduate students and found no relationship between grade point and work explaining that
students who work more time period show little or no effect on final GPA.
Mendis and Arachchige (2015) performed a research to identify the impact of internship programs on the academic performance of
state university students of Sri Lanka through structured questionnaire. According to their findings most of the students show less
deviation in GPA compared with prior and after the internship. They found that internship offers greater help to develop skills and
competencies of graduates and lead to give better academic performance. Students’ time management skills also help to achieve high
performance. They further stated that internship assists to develop communication skills, coordination skills and time management
skills and undergraduates were able to form an upright personality and better insight about themselves. Lalanie and Withanawasam
conducted a research to identify the impact of internship on academic performance and future employability. According to findings
internship is not a significant variable in determining academic performance. Lecture attendance and family index are identified as
significant factors when explaining the academic performance. They have further stated that internship is highly correlated with future
employability of undergraduates and those who have internship spend less time to reach a higher level job position. Ehrenberg and
Sherman (1987) found in their research that there is no strong evidence to prove that work hours during the academic year reduce
GPA.
The factors which were taken as independent and dependent variables to conduct the study mainly decided based on above literatures.
III. METHODOLOGY
The study collected data from students who were in the degree program in academic year 2011/2012 and 2010/2011 in the Faculty of
Management Studies and Commerce of University of Sri Jayewardenepura in Sri Lanka. The structured questionnaire was used to
gather primary data. Study used two groups as control group and experimental group and data were collected from both groups: those
who did undertake an internship and those who did not undertake an internship. The total population is about 2000 students and data
were collected from 191 respondents using purposive sampling technique. The sample consist 111 male students and 80 female
students and 159 students who have engaged with an internship program and 32 students who have not engaged with an internship
program.
Based on the variables used in the study the conceptual framework developed in the following manner.
Gender
Past Academic Performance
English Proficiency
School
University
Lecture Attendance
Time Spend outside the university
on academic activities
Parents Education
Mother’s education
Father’s education
Internship period
Academic Performance
GPA
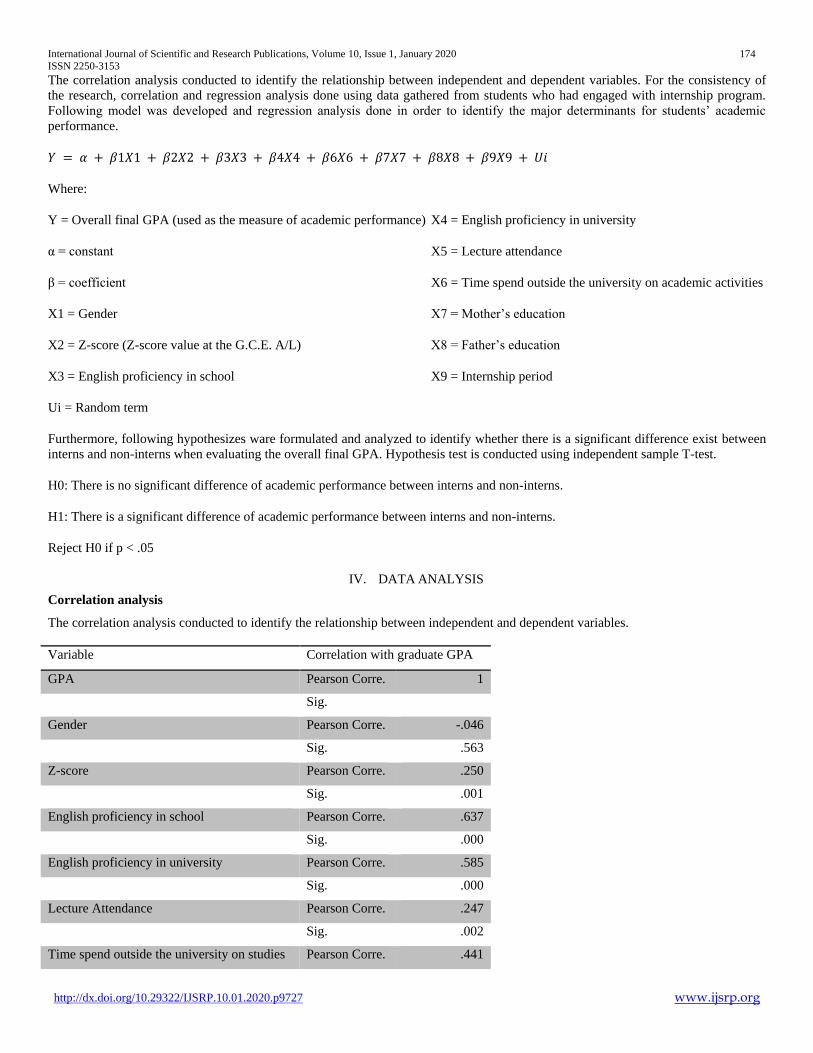
International Journal of Scientific and Research Publications, Volume 10, Issue 1, January 2020 174
ISSN 2250-3153
http://dx.doi.org/10.29322/IJSRP.10.01.2020.p9727 www.ijsrp.org
The correlation analysis conducted to identify the relationship between independent and dependent variables. For the consistency of
the research, correlation and regression analysis done using data gathered from students who had engaged with internship program.
Following model was developed and regression analysis done in order to identify the major determinants for students’ academic
performance.
𝑌 = 𝛼 + 𝛽1𝑋1 + 𝛽2𝑋2 + 𝛽3𝑋3 + 𝛽4𝑋4 + 𝛽6𝑋6 + 𝛽7𝑋7 + 𝛽8𝑋8 + 𝛽9𝑋9 + 𝑈𝑖
Where:
Y = Overall final GPA (used as the measure of academic performance) X4 = English proficiency in university
α = constant X5 = Lecture attendance
β = coefficient X6 = Time spend outside the university on academic activities
X1 = Gender X7 = Mother’s education
X2 = Z-score (Z-score value at the G.C.E. A/L) X8 = Father’s education
X3 = English proficiency in school X9 = Internship period
Ui = Random term
Furthermore, following hypothesizes ware formulated and analyzed to identify whether there is a significant difference exist between
interns and non-interns when evaluating the overall final GPA. Hypothesis test is conducted using independent sample T-test.
H0: There is no significant difference of academic performance between interns and non-interns.
H1: There is a significant difference of academic performance between interns and non-interns.
Reject H0 if p < .05
IV. DATA ANALYSIS
Correlation analysis
The correlation analysis conducted to identify the relationship between independent and dependent variables.
Variable Correlation with graduate GPA
GPA Pearson Corre. 1
Sig.
Gender Pearson Corre. -.046
Sig. .563
Z-score Pearson Corre. .250
Sig. .001
English proficiency in school Pearson Corre. .637
Sig. .000
English proficiency in university Pearson Corre. .585
Sig. .000
Lecture Attendance Pearson Corre. .247
Sig. .002
Time spend outside the university on studies Pearson Corre. .441
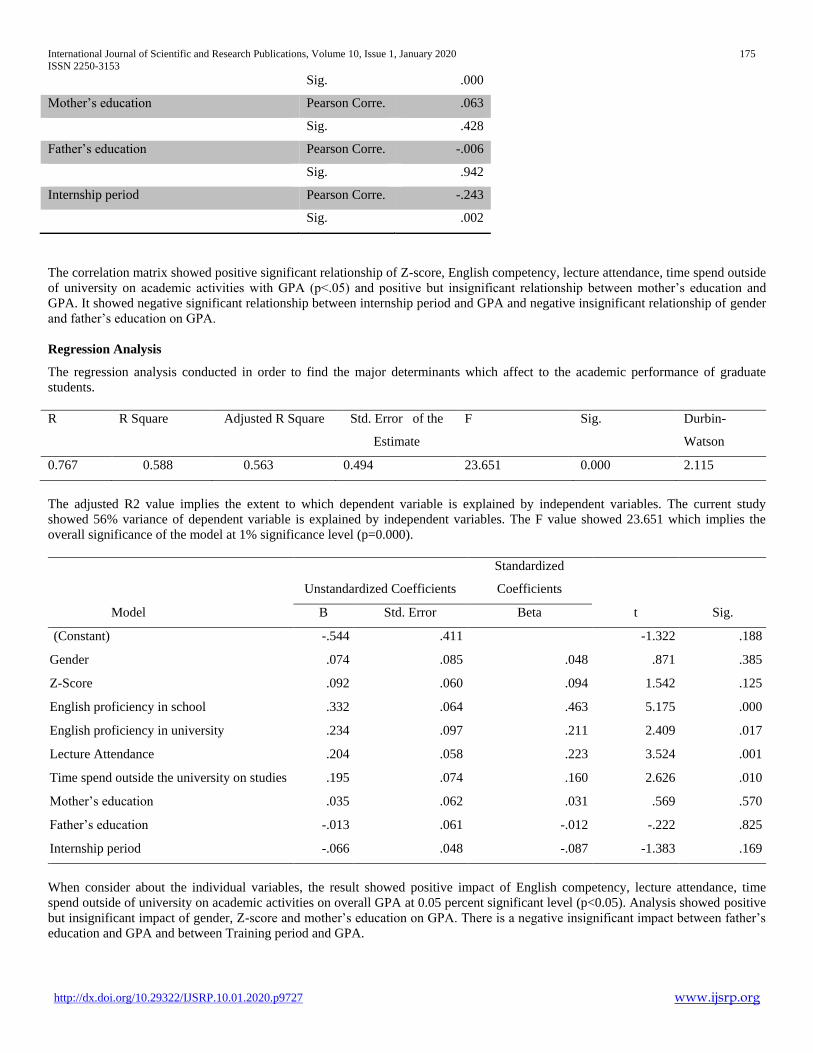
International Journal of Scientific and Research Publications, Volume 10, Issue 1, January 2020 175
ISSN 2250-3153
http://dx.doi.org/10.29322/IJSRP.10.01.2020.p9727 www.ijsrp.org
Sig. .000
Mother’s education Pearson Corre. .063
Sig. .428
Father’s education Pearson Corre. -.006
Sig. .942
Internship period Pearson Corre. -.243
Sig. .002
The correlation matrix showed positive significant relationship of Z-score, English competency, lecture attendance, time spend outside
of university on academic activities with GPA (p<.05) and positive but insignificant relationship between mother’s education and
GPA. It showed negative significant relationship between internship period and GPA and negative insignificant relationship of gender
and father’s education on GPA.
Regression Analysis
The regression analysis conducted in order to find the major determinants which affect to the academic performance of graduate
students.
R R Square Adjusted R Square Std. Error of the
Estimate
F Sig. Durbin-
Watson
0.767 0.588 0.563 0.494 23.651 0.000 2.115
The adjusted R2 value implies the extent to which dependent variable is explained by independent variables. The current study
showed 56% variance of dependent variable is explained by independent variables. The F value showed 23.651 which implies the
overall significance of the model at 1% significance level (p=0.000).
Model
Unstandardized Coefficients
Standardized
Coefficients
t Sig. B Std. Error Beta
(Constant) -.544 .411 -1.322 .188
Gender .074 .085 .048 .871 .385
Z-Score .092 .060 .094 1.542 .125
English proficiency in school .332 .064 .463 5.175 .000
English proficiency in university .234 .097 .211 2.409 .017
Lecture Attendance .204 .058 .223 3.524 .001
Time spend outside the university on studies .195 .074 .160 2.626 .010
Mother’s education .035 .062 .031 .569 .570
Father’s education -.013 .061 -.012 -.222 .825
Internship period -.066 .048 -.087 -1.383 .169
When consider about the individual variables, the result showed positive impact of English competency, lecture attendance, time
spend outside of university on academic activities on overall GPA at 0.05 percent significant level (p<0.05). Analysis showed positive
but insignificant impact of gender, Z-score and mother’s education on GPA. There is a negative insignificant impact between father’s
education and GPA and between Training period and GPA.
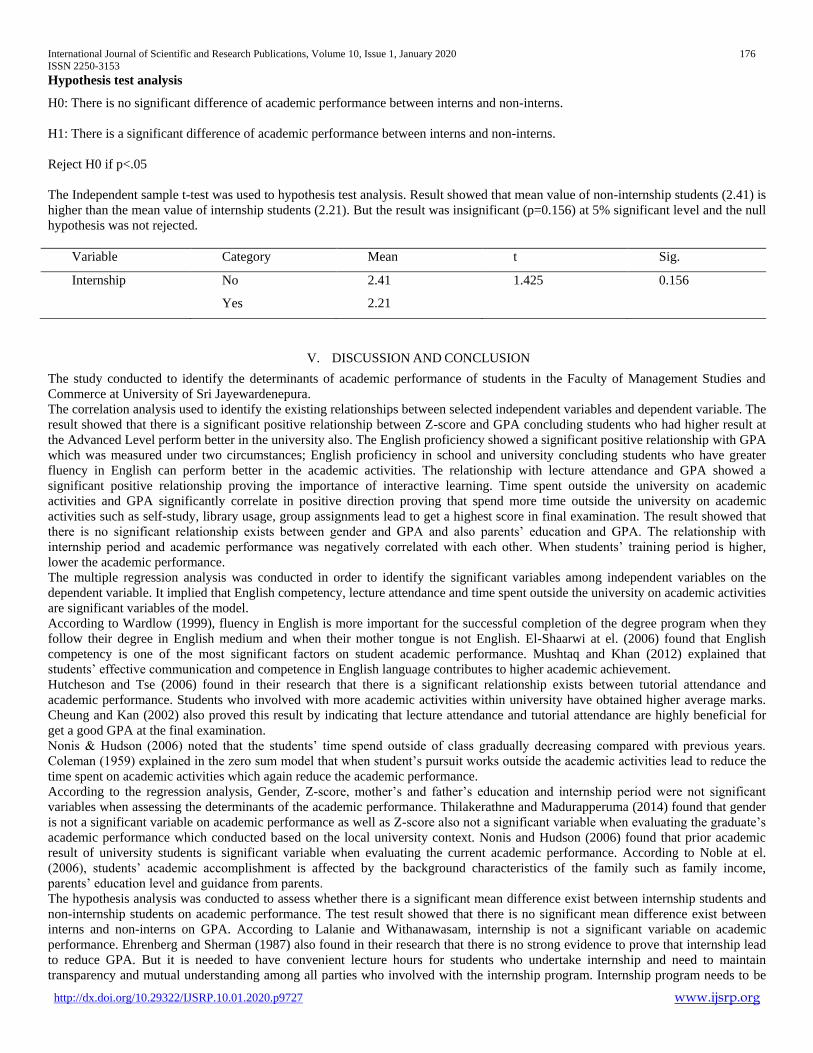
International Journal of Scientific and Research Publications, Volume 10, Issue 1, January 2020 176
ISSN 2250-3153
http://dx.doi.org/10.29322/IJSRP.10.01.2020.p9727 www.ijsrp.org
Hypothesis test analysis
H0: There is no significant difference of academic performance between interns and non-interns.
H1: There is a significant difference of academic performance between interns and non-interns.
Reject H0 if p<.05
The Independent sample t-test was used to hypothesis test analysis. Result showed that mean value of non-internship students (2.41) is
higher than the mean value of internship students (2.21). But the result was insignificant (p=0.156) at 5% significant level and the null
hypothesis was not rejected.
Variable Category Mean t Sig.
Internship No
Yes
2.41
2.21
1.425 0.156
V. DISCUSSION AND CONCLUSION
The study conducted to identify the determinants of academic performance of students in the Faculty of Management Studies and
Commerce at University of Sri Jayewardenepura.
The correlation analysis used to identify the existing relationships between selected independent variables and dependent variable. The
result showed that there is a significant positive relationship between Z-score and GPA concluding students who had higher result at
the Advanced Level perform better in the university also. The English proficiency showed a significant positive relationship with GPA
which was measured under two circumstances; English proficiency in school and university concluding students who have greater
fluency in English can perform better in the academic activities. The relationship with lecture attendance and GPA showed a
significant positive relationship proving the importance of interactive learning. Time spent outside the university on academic
activities and GPA significantly correlate in positive direction proving that spend more time outside the university on academic
activities such as self-study, library usage, group assignments lead to get a highest score in final examination. The result showed that
there is no significant relationship exists between gender and GPA and also parents’ education and GPA. The relationship with
internship period and academic performance was negatively correlated with each other. When students’ training period is higher,
lower the academic performance.
The multiple regression analysis was conducted in order to identify the significant variables among independent variables on the
dependent variable. It implied that English competency, lecture attendance and time spent outside the university on academic activities
are significant variables of the model.
According to Wardlow (1999), fluency in English is more important for the successful completion of the degree program when they
follow their degree in English medium and when their mother tongue is not English. El-Shaarwi at el. (2006) found that English
competency is one of the most significant factors on student academic performance. Mushtaq and Khan (2012) explained that
students’ effective communication and competence in English language contributes to higher academic achievement.
Hutcheson and Tse (2006) found in their research that there is a significant relationship exists between tutorial attendance and
academic performance. Students who involved with more academic activities within university have obtained higher average marks.
Cheung and Kan (2002) also proved this result by indicating that lecture attendance and tutorial attendance are highly beneficial for
get a good GPA at the final examination.
Nonis & Hudson (2006) noted that the students’ time spend outside of class gradually decreasing compared with previous years.
Coleman (1959) explained in the zero sum model that when student’s pursuit works outside the academic activities lead to reduce the
time spent on academic activities which again reduce the academic performance.
According to the regression analysis, Gender, Z-score, mother’s and father’s education and internship period were not significant
variables when assessing the determinants of the academic performance. Thilakerathne and Madurapperuma (2014) found that gender
is not a significant variable on academic performance as well as Z-score also not a significant variable when evaluating the graduate’s
academic performance which conducted based on the local university context. Nonis and Hudson (2006) found that prior academic
result of university students is significant variable when evaluating the current academic performance. According to Noble at el.
(2006), students’ academic accomplishment is affected by the background characteristics of the family such as family income,
parents’ education level and guidance from parents.
The hypothesis analysis was conducted to assess whether there is a significant mean difference exist between internship students and
non-internship students on academic performance. The test result showed that there is no significant mean difference exist between
interns and non-interns on GPA. According to Lalanie and Withanawasam, internship is not a significant variable on academic
performance. Ehrenberg and Sherman (1987) also found in their research that there is no strong evidence to prove that internship lead
to reduce GPA. But it is needed to have convenient lecture hours for students who undertake internship and need to maintain
transparency and mutual understanding among all parties who involved with the internship program. Internship program needs to be

International Journal of Scientific and Research Publications, Volume 10, Issue 1, January 2020 177
ISSN 2250-3153
http://dx.doi.org/10.29322/IJSRP.10.01.2020.p9727 www.ijsrp.org
more practical and up-to-date according to the market requirement. By having good understanding about factors affecting academic
performance, society will be able to get anticipated outcomes at the end of the higher education.
REFERENCES
[1] Barke, M. et al. 2000, ‘Students in the labor market: nature, extent and implications of term-time employment among University of Northumbria undergraduates’, (Research Report No. 215).
[2] Cheng, M 1995, ‘Issues related to student part-time work: What did research find in the Toronto situation and other context’, Toronto Board of Education.
[3] Cheung, L and Kan, A 2002, “Evaluation of Factors Related to Student Performance in a Distance-Learning Business Communication Course”, Journal of Education for Business, vol. 77, no. 5, pp.257-263.
[4] Coleman, JS 1959, ‘Academic achievement and the structure of competition’, Harvard Educational Review, vol.29, pp.330–351.
[5] Curtis, S & Shani, N 2002, ‘The effect of taking paid employment during term-time on students’ academic studies’, Journal of Further & Higher Education, 26(2), 129–138.
[6] Ehrenberg, RG and Sherman, DR 1987, ‘Employment While in College, Academic Achievement, and Postcollege Outcomes: A Summary of Results’, The Journal of Human Resources, 22(1), 123.
[7] English, DM & Koeppen, DR 1993, ‘The relationship of accounting internship and subsequent academic performance’, Issues in Accounting Education, 292 - 299.
[8] Faculty prospectus 2010/11, University of Sri Jayewardenepura.
[9] Giacomino, DE 1990, ‘An Empirical Study of Post-Internship Academic Performance of Public Accounting Interns’, Advances in Accounting, vol.8, pp. 179-188.
[10] Harb, Nasri and El-Shaarwi, Ahmed 2006, ‘Factors Affecting Students' Performance’. MPRA Paper No. 1362.
[11] Humphrey, R 2006, ‘Pulling structured inequality into higher education: The impact of part time working on English university students’, Higher Education Quarterly 60(3): 270–86.
[12] Hutcheson, T and Tse, H 2006, ‘Tutorial attendance and Grade Achievement’, Working Paper No. 145, University of Technology, Sydney.
[13] Knechel, WR & Snowball, D 1987, ‘Accounting internship and subsequent academic performance: An empirical study’, The Accounting Review, 799-807.
[14] Knouse, SB, Tanner, J & Harris, EW 1999, ‘The relation of college internships, college performance, and subsequent job opportunity’, Journal of Employment Counseling, vol. 36, pp. 35-43.
[15] Koehler, RW 1974, ‘The effect of internship programs on subsequent college performance’, Accounting Review, 49(2) 382-384.
[16] Lalanie, PP, Withanawasam, MPK, ‘Internship of Undergraduates, their Academic Performance and Future Employability’.
[17] Li G, Chen W, Duanmu J 2010, ‘'Determinants of International Students' Academic Performance: A Comparison between Chinese and Other International Students', Journal of Studies in International Education, 14 (4), pp. 389-405.
[18] Light, RJ 2001, ‘Making the most of college’, Cambridge, MA: Harvard University Press.
[19] Lindsay, R., and Paton-Saltzberg R 1994, ‘The effects of paid employment on the academic performance of full-time students in a British ‘new’ university consultancy report’, Oxford:Oxford Brookes University.
[20] Mendis, BHS and Arachchige, BJH, 2015, ‘Impact of Internship Programmes on the Academic Performance of State University Undergraduates of Sri Lanka: A Qualitative Inquiry’, 2nd International HRM Conference, vol.2, no.1.
[21] Mushtaq, I, Khan, SN 2012, ‘Factors affecting students’ academic performance’, Global journal of management and business research, vol.XII.
[22] Noble, Julie P, Roberts, William L and Sawyer, RL 2006, ‘Student Achievement, Behavior, Perceptions, and Other Factors Affecting ACT Scores’, ACT Research Report Series.
[23] Nonis, S and Hudson, G 2006, ‘Academic performance of college students; influence of time spent studying and working’, Journal of Education for Business, vol. 81, no. 3, pp. 151-160.
[24] Rawlings, P, White, P, & Stephens, R 2005, ‘Practice-based learning in information systems: the advantages for students’, Journal of Information Systems Education, 16(4), 455-464.
[25] Raychaudhuri, Amitava, Debnath, Manojit, Sen, Seswata & Majundra, Gopal B 2010, ‘Factors affecting Student’s academic performance: A case study in agartala municipal concial area’, Bangladesh e-journal of sociology, vol.7, no.2.
[26] Reddy, P & Moores, E 2006, ‘Measuring the benefits of a psychology Internship year, Assessment & Evaluation in Higher Education’, 31(5), 551-567.
[27] Sri Lanka University statistics, 2016, Chapter 01, pp2-3.
[28] Tessema, MT, Ready, KJ & Astani M, 2014, ‘Does Part-Time Job Affect College Students’ Satisfaction and Academic Performance (GPA)? The Case of a Mid-Sized Public University’, International Journal of Business Administration, vol.5.
[29] Thilakarathne, PM & Madurapperuma, WM 2014, ‘An examination of accounting internship on subsequent academic performance’, International Journal of Economics, Finance and Management Sciences, 8 - 15.
[30] Wardlow, G 1999, ‘International students of Agriculture in U.S. institutions precursors to academic success, Journal of Agricultural Education, 30: 17-22
[31] Warinda,T 2013, ‘Accounting students’ evaluation of internship experiences from a skills perspective’, International Journal of Asian Social Science, vol.3(3):783-799.
[32] Warren, JR 2002, ‘Reconsidering the relationship between student employment and academic outcomes: A new theory and better data’, Youth and Society, vol.33, pp.366–393.
[33] Zoyza, AD, Rudkin, KM 2007, ‘The effects of employment on academic performance of Australian accounting students’, Global Conference on Business & Economics, pp.1-2
AUTHORS
First Author – Abeykon Jalath Madushan Priyadarshana, B.Sc. Accounting (Special) USJ, [email protected].
Second Author – Hendeniye Gedara Madushani Dulanjalee Kumari, B.Sc. Business Administration (Business Economics) (Special)
USJ, [email protected].
International Journal of Scientific and Research Publications, Volume 10, Issue 1, January 2020 178
ISSN 2250-3153
http://dx.doi.org/10.29322/IJSRP.10.01.2020.p9728 www.ijsrp.org
Knowledge, Attitude and Practice Towards Malnutrition
among Mothers of Sunsari, Nepal
Srijat Dahal1, Mausam Shrestha2, Sanjeeb Shah3, Babita Sharma3, Mandip Pokharel4, Prakritee Guragai5, Bibek Shah6
1 Kirat Yakthung Chumlung Purnarjiwan Kendra, Dharan Nepal
2 Karuna Foundation Nepal, Illam, Nepal 3 School of Public Health and Community Medicine, B. P. Koirala Institute of Health Sciences, Dharan, Nepal
4 Vennue Foundation, Nepal 5 Health Office, Udayapur, Nepal
6 Chitwan Medical College, Bharatpur, Nepal
DOI: 10.29322/IJSRP.10.01.2020.p9728
http://dx.doi.org/10.29322/IJSRP.10.01.2020.p9728
Abstract- Malnutrition, a global health problem, is a state of
lacking proper nutrition. It contributes to childhood morbidity,
mortality, impaired intellectual development, and increased risk
of diseases in adulthood, with lack of knowledge and proper
feeding practice being the leading cause. Therefore, the study
aims to assess the knowledge, attitude and practice towards
malnutrition among the mothers with under five children of
Inaruwa, Sunsari, Nepal. A descriptive cross-sectional study was
conducted among 389 mothers of under five children in Inaruwa.
Systematic random sampling was used to reach the sample. Data
was collected using structured questionnaire through face to face
interview. Descriptive and bivariate analysis was done. About
38% of respondents were of age group 24-26 years. Mothers with
adequate knowledge on malnutrition were 45.2%. Majority of the
mothers (87.4%) had good attitude towards the malnutrition.
Most of the mothers (78.7%) knew how to prepare the sarbottam
pitho. Among the mothers, 76.6% of them started feeding
complimentary food after 6 months’ age of baby. The association
between educational level and knowledge was found to be
statistically significant. Although less than half of mothers had
adequate knowledge on malnutrition, they had good attitude. It
was also observed that the education of respondent has effect on
the knowledge of malnutrition. Hence, it shifts the focus on the
health education program related to malnutrition targeting the
mothers having under five children.
Index Terms- Knowledge, Attitude, Malnutrition, Practice,
Under five
I. INTRODUCTION
Malnutrition can be defined as a lack of proper nutrition. The
nutritional status of a child, as with any individual, is assessed
through dietary, anthropometric, biochemical and physical
observation for signs of malnutrition. These methods of
measurement are usually done in combination for more accurate
results. When there is a deficiency in the amount and nutritional
value of the food consumed, the growth pattern of a child
becomes disrupted owing to nutrient deficiencies. [1]
The nutritional status of a child is usually described in terms of
anthropometry, i.e. body measurement, such as weight, in
relation to age or height, which is reflective of the degree of
underweight or wasting of that child. Food is the prime necessity
of life; life cannot be sustained without an adequate nourishment
child needs adequate food for growth and development.
According to the World Health Organization (WHO), breast milk
has the complete nutritional requirements that a baby needs for
healthy growth and development in the first six months of life.
According to the United Nations Child Emergency Fund
(UNICEF), children who are breastfed in the first six months of
life have a six times greater chance of survival as opposed to
non-breastfed children. Children are malnourished if their diet
does not provide adequate nutrients for growth and maintenance
or they are unable to fully utilize the food they eat due to illness/
under nutrition. [2]
Malnutrition is one of the major and basic health concerns
especially in developing countries. Malnutrition is the major
factor which is related to the economic, educational status of the
people. Although malnutrition is prevalent in developing
countries, it is rarely cited as being among the leading causes of
death. This is due in part to the conventional way that cause of
death data are reported and analyzed. In many countries,
mortality statistics are compiled from records in which a single
proximate cause of death has been reported. Childhood under
nutrition is a major global health problem, contributing to
childhood morbidity, mortality, impaired intellectual
development, suboptimal adult work capacity, and increased risk
of diseases in adulthood. [3]
Malnutrition can lead to childhood mortality due to diarrhea,
pneumonia, severe infections, malaria and measles. According
to the WHO (2013), more than 33% of childhood deaths
worldwide resulted from malnutrition. Acute malnutrition in
childhood is as much a medical problem as it is a social problem
because it directly affects a broad range of issues: a country’s
mortality rates, educational prospects, productive employment
and economic capacity. Malnutrition also happens to be one of
the principal mechanisms behind the transmission of poverty and
inequality from one generation to the next. [3][7]
According to the United Nations Children’s Fund (UNICEF), the
prevalence of stunting in children under five in Guatemala rivals
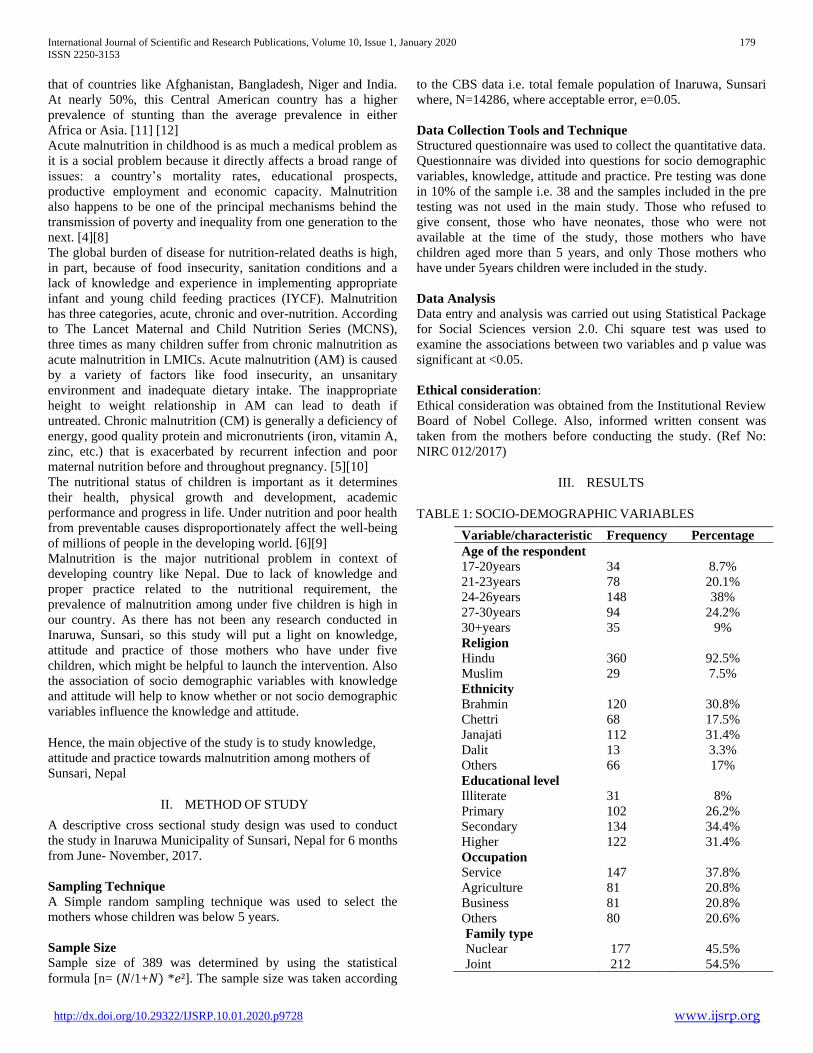
International Journal of Scientific and Research Publications, Volume 10, Issue 1, January 2020 179
ISSN 2250-3153
http://dx.doi.org/10.29322/IJSRP.10.01.2020.p9728 www.ijsrp.org
that of countries like Afghanistan, Bangladesh, Niger and India.
At nearly 50%, this Central American country has a higher
prevalence of stunting than the average prevalence in either
Africa or Asia. [11] [12]
Acute malnutrition in childhood is as much a medical problem as
it is a social problem because it directly affects a broad range of
issues: a country’s mortality rates, educational prospects,
productive employment and economic capacity. Malnutrition
also happens to be one of the principal mechanisms behind the
transmission of poverty and inequality from one generation to the
next. [4][8]
The global burden of disease for nutrition-related deaths is high,
in part, because of food insecurity, sanitation conditions and a
lack of knowledge and experience in implementing appropriate
infant and young child feeding practices (IYCF). Malnutrition
has three categories, acute, chronic and over-nutrition. According
to The Lancet Maternal and Child Nutrition Series (MCNS),
three times as many children suffer from chronic malnutrition as
acute malnutrition in LMICs. Acute malnutrition (AM) is caused
by a variety of factors like food insecurity, an unsanitary
environment and inadequate dietary intake. The inappropriate
height to weight relationship in AM can lead to death if
untreated. Chronic malnutrition (CM) is generally a deficiency of
energy, good quality protein and micronutrients (iron, vitamin A,
zinc, etc.) that is exacerbated by recurrent infection and poor
maternal nutrition before and throughout pregnancy. [5][10]
The nutritional status of children is important as it determines
their health, physical growth and development, academic
performance and progress in life. Under nutrition and poor health
from preventable causes disproportionately affect the well-being
of millions of people in the developing world. [6][9]
Malnutrition is the major nutritional problem in context of
developing country like Nepal. Due to lack of knowledge and
proper practice related to the nutritional requirement, the
prevalence of malnutrition among under five children is high in
our country. As there has not been any research conducted in
Inaruwa, Sunsari, so this study will put a light on knowledge,
attitude and practice of those mothers who have under five
children, which might be helpful to launch the intervention. Also
the association of socio demographic variables with knowledge
and attitude will help to know whether or not socio demographic
variables influence the knowledge and attitude.
Hence, the main objective of the study is to study knowledge,
attitude and practice towards malnutrition among mothers of
Sunsari, Nepal
II. METHOD OF STUDY
A descriptive cross sectional study design was used to conduct
the study in Inaruwa Municipality of Sunsari, Nepal for 6 months
from June- November, 2017.
Sampling Technique
A Simple random sampling technique was used to select the
mothers whose children was below 5 years.
Sample Size
Sample size of 389 was determined by using the statistical
formula [n= (𝑁/1+𝑁) *𝑒²]. The sample size was taken according
to the CBS data i.e. total female population of Inaruwa, Sunsari
where, N=14286, where acceptable error, e=0.05.
Data Collection Tools and Technique
Structured questionnaire was used to collect the quantitative data.
Questionnaire was divided into questions for socio demographic
variables, knowledge, attitude and practice. Pre testing was done
in 10% of the sample i.e. 38 and the samples included in the pre
testing was not used in the main study. Those who refused to
give consent, those who have neonates, those who were not
available at the time of the study, those mothers who have
children aged more than 5 years, and only Those mothers who
have under 5years children were included in the study.
Data Analysis
Data entry and analysis was carried out using Statistical Package
for Social Sciences version 2.0. Chi square test was used to
examine the associations between two variables and p value was
significant at <0.05.
Ethical consideration:
Ethical consideration was obtained from the Institutional Review
Board of Nobel College. Also, informed written consent was
taken from the mothers before conducting the study. (Ref No:
NIRC 012/2017)
III. RESULTS
TABLE 1: SOCIO-DEMOGRAPHIC VARIABLES
Variable/characteristic Frequency Percentage
Age of the respondent
17-20years
21-23years
24-26years
27-30years
30+years
34
78
148
94
35
8.7%
20.1%
38%
24.2%
9%
Religion
Hindu
Muslim
360
29
92.5%
7.5%
Ethnicity
Brahmin
Chettri
Janajati
Dalit
Others
120
68
112
13
66
30.8%
17.5%
31.4%
3.3%
17%
Educational level
Illiterate
Primary
Secondary
Higher
31
102
134
122
8%
26.2%
34.4%
31.4%
Occupation
Service
Agriculture
Business
Others
147
81
81
80
37.8%
20.8%
20.8%
20.6%
Family type
Nuclear
177
45.5%
Joint 212 54.5%
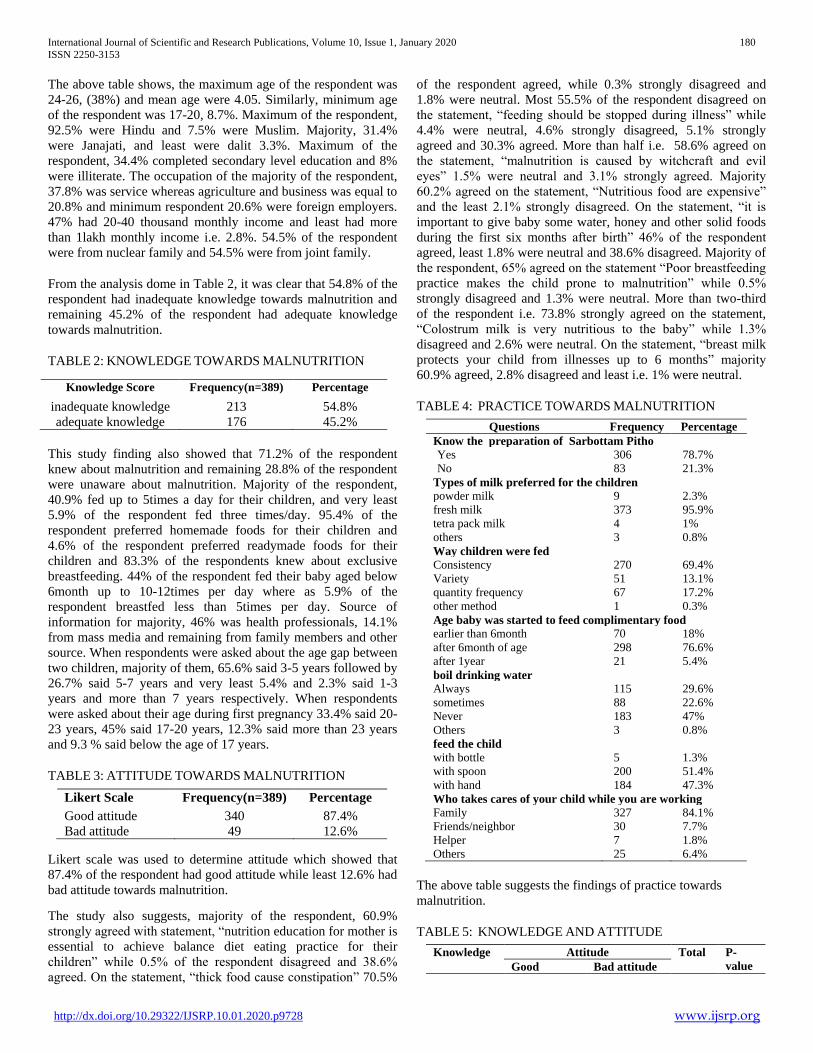
International Journal of Scientific and Research Publications, Volume 10, Issue 1, January 2020 180
ISSN 2250-3153
http://dx.doi.org/10.29322/IJSRP.10.01.2020.p9728 www.ijsrp.org
The above table shows, the maximum age of the respondent was
24-26, (38%) and mean age were 4.05. Similarly, minimum age
of the respondent was 17-20, 8.7%. Maximum of the respondent,
92.5% were Hindu and 7.5% were Muslim. Majority, 31.4%
were Janajati, and least were dalit 3.3%. Maximum of the
respondent, 34.4% completed secondary level education and 8%
were illiterate. The occupation of the majority of the respondent,
37.8% was service whereas agriculture and business was equal to
20.8% and minimum respondent 20.6% were foreign employers.
47% had 20-40 thousand monthly income and least had more
than 1lakh monthly income i.e. 2.8%. 54.5% of the respondent
were from nuclear family and 54.5% were from joint family.
From the analysis dome in Table 2, it was clear that 54.8% of the
respondent had inadequate knowledge towards malnutrition and
remaining 45.2% of the respondent had adequate knowledge
towards malnutrition.
TABLE 2: KNOWLEDGE TOWARDS MALNUTRITION
This study finding also showed that 71.2% of the respondent
knew about malnutrition and remaining 28.8% of the respondent
were unaware about malnutrition. Majority of the respondent,
40.9% fed up to 5times a day for their children, and very least
5.9% of the respondent fed three times/day. 95.4% of the
respondent preferred homemade foods for their children and
4.6% of the respondent preferred readymade foods for their
children and 83.3% of the respondents knew about exclusive
breastfeeding. 44% of the respondent fed their baby aged below
6month up to 10-12times per day where as 5.9% of the
respondent breastfed less than 5times per day. Source of
information for majority, 46% was health professionals, 14.1%
from mass media and remaining from family members and other
source. When respondents were asked about the age gap between
two children, majority of them, 65.6% said 3-5 years followed by
26.7% said 5-7 years and very least 5.4% and 2.3% said 1-3
years and more than 7 years respectively. When respondents
were asked about their age during first pregnancy 33.4% said 20-
23 years, 45% said 17-20 years, 12.3% said more than 23 years
and 9.3 % said below the age of 17 years.
TABLE 3: ATTITUDE TOWARDS MALNUTRITION
Likert scale was used to determine attitude which showed that
87.4% of the respondent had good attitude while least 12.6% had
bad attitude towards malnutrition.
The study also suggests, majority of the respondent, 60.9%
strongly agreed with statement, “nutrition education for mother is
essential to achieve balance diet eating practice for their
children” while 0.5% of the respondent disagreed and 38.6%
agreed. On the statement, “thick food cause constipation” 70.5%
of the respondent agreed, while 0.3% strongly disagreed and
1.8% were neutral. Most 55.5% of the respondent disagreed on
the statement, “feeding should be stopped during illness” while
4.4% were neutral, 4.6% strongly disagreed, 5.1% strongly
agreed and 30.3% agreed. More than half i.e. 58.6% agreed on
the statement, “malnutrition is caused by witchcraft and evil
eyes” 1.5% were neutral and 3.1% strongly agreed. Majority
60.2% agreed on the statement, “Nutritious food are expensive”
and the least 2.1% strongly disagreed. On the statement, “it is
important to give baby some water, honey and other solid foods
during the first six months after birth” 46% of the respondent
agreed, least 1.8% were neutral and 38.6% disagreed. Majority of
the respondent, 65% agreed on the statement “Poor breastfeeding
practice makes the child prone to malnutrition” while 0.5%
strongly disagreed and 1.3% were neutral. More than two-third
of the respondent i.e. 73.8% strongly agreed on the statement,
“Colostrum milk is very nutritious to the baby” while 1.3%
disagreed and 2.6% were neutral. On the statement, “breast milk
protects your child from illnesses up to 6 months” majority
60.9% agreed, 2.8% disagreed and least i.e. 1% were neutral.
TABLE 4: PRACTICE TOWARDS MALNUTRITION
Questions Frequency Percentage
Know the preparation of Sarbottam Pitho Yes 306 78.7%
No 83 21.3%
Types of milk preferred for the children powder milk 9 2.3%
fresh milk 373 95.9%
tetra pack milk 4 1%
others 3 0.8%
Way children were fed
Consistency 270 69.4%
Variety 51 13.1%
quantity frequency 67 17.2%
other method 1 0.3%
Age baby was started to feed complimentary food earlier than 6month 70 18%
after 6month of age 298 76.6%
after 1year 21 5.4%
boil drinking water
Always 115 29.6%
sometimes 88 22.6%
Never 183 47%
Others 3 0.8%
feed the child
with bottle 5 1.3%
with spoon 200 51.4%
with hand 184 47.3%
Who takes cares of your child while you are working Family 327 84.1%
Friends/neighbor 30 7.7%
Helper 7 1.8%
Others 25 6.4%
The above table suggests the findings of practice towards
malnutrition.
TABLE 5: KNOWLEDGE AND ATTITUDE
Knowledge Attitude Total P-
value Good Bad attitude
Knowledge Score Frequency(n=389) Percentage
inadequate knowledge 213 54.8%
adequate knowledge 176 45.2%
Likert Scale Frequency(n=389) Percentage
Good attitude 340 87.4%
Bad attitude 49 12.6%
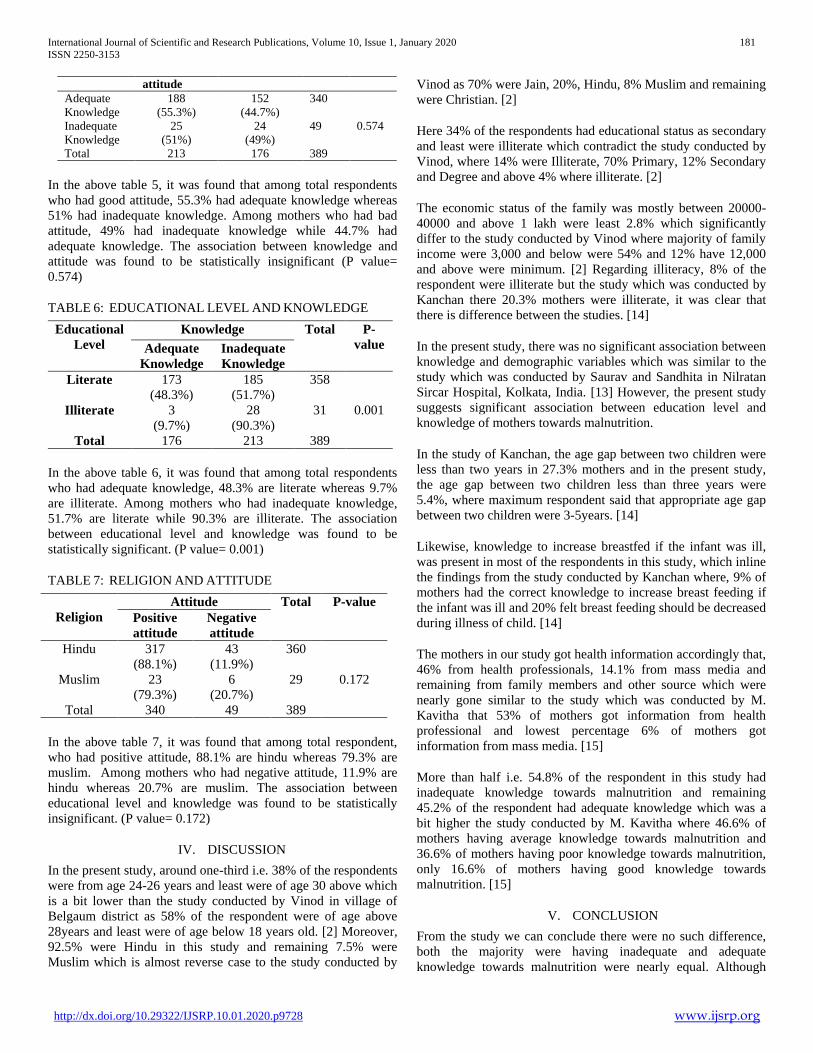
International Journal of Scientific and Research Publications, Volume 10, Issue 1, January 2020 181
ISSN 2250-3153
http://dx.doi.org/10.29322/IJSRP.10.01.2020.p9728 www.ijsrp.org
attitude
Adequate
Knowledge
188
(55.3%)
152
(44.7%)
340
0.574 Inadequate
Knowledge
25
(51%)
24
(49%)
49
Total 213 176 389
In the above table 5, it was found that among total respondents
who had good attitude, 55.3% had adequate knowledge whereas
51% had inadequate knowledge. Among mothers who had bad
attitude, 49% had inadequate knowledge while 44.7% had
adequate knowledge. The association between knowledge and
attitude was found to be statistically insignificant (P value=
0.574)
TABLE 6: EDUCATIONAL LEVEL AND KNOWLEDGE
Educational
Level
Knowledge Total P-
value Adequate
Knowledge
Inadequate
Knowledge
Literate 173
(48.3%)
185
(51.7%)
358
0.001 Illiterate 3
(9.7%)
28
(90.3%)
31
Total 176 213 389
In the above table 6, it was found that among total respondents
who had adequate knowledge, 48.3% are literate whereas 9.7%
are illiterate. Among mothers who had inadequate knowledge,
51.7% are literate while 90.3% are illiterate. The association
between educational level and knowledge was found to be
statistically significant. (P value= 0.001)
TABLE 7: RELIGION AND ATTITUDE
Religion
Attitude Total P-value
Positive
attitude
Negative
attitude
Hindu 317
(88.1%)
43
(11.9%)
360
0.172 Muslim 23
(79.3%)
6
(20.7%)
29
Total 340 49 389
In the above table 7, it was found that among total respondent,
who had positive attitude, 88.1% are hindu whereas 79.3% are
muslim. Among mothers who had negative attitude, 11.9% are
hindu whereas 20.7% are muslim. The association between
educational level and knowledge was found to be statistically
insignificant. (P value= 0.172)
IV. DISCUSSION
In the present study, around one-third i.e. 38% of the respondents
were from age 24-26 years and least were of age 30 above which
is a bit lower than the study conducted by Vinod in village of
Belgaum district as 58% of the respondent were of age above
28years and least were of age below 18 years old. [2] Moreover,
92.5% were Hindu in this study and remaining 7.5% were
Muslim which is almost reverse case to the study conducted by
Vinod as 70% were Jain, 20%, Hindu, 8% Muslim and remaining
were Christian. [2]
Here 34% of the respondents had educational status as secondary
and least were illiterate which contradict the study conducted by
Vinod, where 14% were Illiterate, 70% Primary, 12% Secondary
and Degree and above 4% where illiterate. [2]
The economic status of the family was mostly between 20000-
40000 and above 1 lakh were least 2.8% which significantly
differ to the study conducted by Vinod where majority of family
income were 3,000 and below were 54% and 12% have 12,000
and above were minimum. [2] Regarding illiteracy, 8% of the
respondent were illiterate but the study which was conducted by
Kanchan there 20.3% mothers were illiterate, it was clear that
there is difference between the studies. [14]
In the present study, there was no significant association between
knowledge and demographic variables which was similar to the
study which was conducted by Saurav and Sandhita in Nilratan
Sircar Hospital, Kolkata, India. [13] However, the present study
suggests significant association between education level and
knowledge of mothers towards malnutrition.
In the study of Kanchan, the age gap between two children were
less than two years in 27.3% mothers and in the present study,
the age gap between two children less than three years were
5.4%, where maximum respondent said that appropriate age gap
between two children were 3-5years. [14]
Likewise, knowledge to increase breastfed if the infant was ill,
was present in most of the respondents in this study, which inline
the findings from the study conducted by Kanchan where, 9% of
mothers had the correct knowledge to increase breast feeding if
the infant was ill and 20% felt breast feeding should be decreased
during illness of child. [14]
The mothers in our study got health information accordingly that,
46% from health professionals, 14.1% from mass media and
remaining from family members and other source which were
nearly gone similar to the study which was conducted by M.
Kavitha that 53% of mothers got information from health
professional and lowest percentage 6% of mothers got
information from mass media. [15]
More than half i.e. 54.8% of the respondent in this study had
inadequate knowledge towards malnutrition and remaining
45.2% of the respondent had adequate knowledge which was a
bit higher the study conducted by M. Kavitha where 46.6% of
mothers having average knowledge towards malnutrition and
36.6% of mothers having poor knowledge towards malnutrition,
only 16.6% of mothers having good knowledge towards
malnutrition. [15]
V. CONCLUSION
From the study we can conclude there were no such difference,
both the majority were having inadequate and adequate
knowledge towards malnutrition were nearly equal. Although

International Journal of Scientific and Research Publications, Volume 10, Issue 1, January 2020 182
ISSN 2250-3153
http://dx.doi.org/10.29322/IJSRP.10.01.2020.p9728 www.ijsrp.org
most of the respondent were having inadequate knowledge but
majority had good attitude towards malnutrition by mothers.
From the study it was found that majority of the respondent were
good in practice of complementary food to their baby after the
age of 6month. The association between knowledge and attitude
towards malnutrition were statistically insignificant.
VI. REFERENCES
[1] D. OOSTHUIZEN, "Impact of a nutrition education programme on
nutrition knowledge and," digiresearch, boipatong, 2016.
[2] V. V. Bagilkar and B. V. Savadatti, "a discriptive study on malnutrition,"
researchgate, pp. 72-80, 2015.
[3] Z. T. a. A. Shele, "Knowledge, attitude and practice towards malnutrition
among health care workers in Hawassa City, Southern Ethiopia," Global
Academic Research Journals, pp. 1(1):1-8, 2015 .
[4] W. w. UNICEF, "Monitoring the Situation of Children and Women," joint
child malnutrition, may 2017.
[5] y. t. hammond, "Evaluating the Knowledge, Attitude and Practice of Rural
Guatemalan Healthcare Providers Regarding," emory, pp. 1-15, 2014.
[6] g. p. dhungana, "NUTRITIONAL STATUS OF UNDER 5 CHILDREN
AND ASSOCIATED FACTORS OF KUNCHHA VILLAGE
DEVELOPMENT COMMITTEE," Journal of Chitwan Medical College,
pp. 38-39, 2013.
[7] ghimire, jeeban, "Malnutrition: Still Challenging In Nepal," Journal of
Nutritional Health & Food Engineering, p. volume 4 issue 5, 2016.
[8] C. B. o. S. a. U. Nepal, Nepal Multiple Indicator Cluster Survey,
kathmandu, 2014.
[9] M. o. Health, "Nepal Demographic and Health Survey," key indicator
report, 2016.
[10] m.-s. n. plan, "National Planning Commission," For Accelerating the
Reduction of Maternal and Child, 2012.
[11] M. L. Ramagoma, "KNOWLEDGE REGARDING SEVERE ACUTE
MALNUTRITION AND ITS," Pietermaritzburg, 2016.
[12] j. acharya, e. v. teijlingen, j. murphy and m. hind, "Study on Nutritional
Problems in Preschool Aged Children of Kaski District of Nepal,"
Malnutrition; Knowledge, attitudes and beliefs about nutritious food, 04
march 2015.
[13] s. chatterjee and s. saha, "A Study On Knowledge And Practice Of Mothers
Regarding Infant Feeding And Nutritional Status Of Under-Five Children
Attending Immunisation Clinic Of A Medical College," the internet journal
of nutrtion and wellness, p. 10, 2011.
[14] K. Mukherjee, "MALNUTRITION IN UNDER FIVE CHILDREN IN
TURBHE STORES URBAN SLUMS IN NAVI MUMBAI," pp. 1128-
1129, 2014.
[15] M.Kavitha, "Assess the Knowledge on Malnutrition among Mothers in
Vinayaka Mission Hospital, Salem," IOSR, pp. 29-31, 2015.
ACKNOWLEDGMENT
We all the authors would like to express our sincere gratitude
towards all the mothers included in the study and all the helping
hands from Nobel College.
AUTHORS
First Author – Srijat Dahal, Bachelor in Public Health (BPH),
Kirat Yakthung Chumlung Purnarjiwan Kendra, Dharan Nepal,
Second Author – Mausam Shrestha, Bachelor in Public Health
(BPH), Karuna Foundation Nepal, Illam, Nepal,
Third Author – Sanjeeb Shah, Master in Public Health (MPH),
B. P. Koirala Institute of Health Sciences,
Fourth Author – Babita Sharma, Master in Public Health
(MPH), B. P. Koirala Institute of Health Sciences,
Fifth Author – Mandip Pokharel, Bachelor in Pharmacy,
Vennue Foundation, Nepal, [email protected]
Sixth Author – Prakritee Guragai, Master of Business Studies
(MBS), Health Office, Udayapur, Nepal,
Seventh Author- Bibek Shah, Bachelor of Medicine and
Bachelor of Surgery (MBBS), Chitwan Medical College,
Bharatpur, Nepal, [email protected]
Correspondence Author – Srijat Dahal, Bachelor in Public
Health (BPH), Kirat Yakthung Chumlung Purnarjiwan Kendra,
Dharan Nepal, [email protected], +977- 9852073755
International Journal of Scientific and Research Publications, Volume 10, Issue 1, January 2020 183
ISSN 2250-3153
http://dx.doi.org/10.29322/IJSRP.10.01.2020.p9729 www.ijsrp.org
The Ability to Know the Concept of Numbering at
Children Group A through Dakon’s Game Modification
Nia Aminatus Sholihah*, Mustaji**, Miftakhul Jannah**
*Master Program of Basic Education, Post-graduate Program, Surabaya State University
**Promotor and Co-Promotor of Thesis, Post-graduate Program, Surabaya State University
Surabaya, Indonesia
DOI: 10.29322/IJSRP.10.01.2020.p9729
http://dx.doi.org/10.29322/IJSRP.10.01.2020.p9729
Abstract- Research has been conducted to describe the
ability to know the concept of numbering at children group
A through the Dakon’s Game modification. The research
method is to use quasi experimental research with non-
equivalent pre-test post-test control group design.
Population and samples are group A kindergartens in
Sidoarjo. Data collection techniques using observation
sheets. The results showed that there was an influence on
the Dakon’s game modification to the ability to know the
concept of numbering at group A.
Keywords- know the number concept, modification Dakon
game, group A
I. INTRODUCTION
The ability to know of numbering concepts is a
cognitive ability that is one of the 6 aspects of child
development [1]. Cognitive ability is a thought process,
which is an individual's ability to connect an event or event
[2]. Cognitive development is part of the development of
mind. Thoughts are part of the brain's thought process. The
mind can be used to solve or solve a problem quickly and
appropriately. The mind can also be used to recognize,
know, and understand [3].
Regulation of the Minister of Education and Culture of
the Republic of Indonesia Number 137 Year 2014 on
national standards for early childhood education on
cognitive development aspects reveals that children aged
4-5 years should have been able to cross the number one to
ten and understand the concepts and emblems of the
number ten and understand the concepts and emblems of
numbers [4]. Gessel and Amtruda in Susanto suggested
that at the age of 4-5 years is a period of mathematics
study. At this stage, the child begins to learn simple
mathematics for example mentioning numbers and
counting number sequences.
Early Childhood mathematics learning can be taught
through playing media, as the age of 4-5 is a game age for
children [5]. Play also opens up opportunities for the child
to create, shape, discover, and build using existing media,
such as playing clay or plasticine and playing beams [6].
The results of observation in TK showed that the ability
of children in recognizing the concept of number less,
allegedly because of the limitation of educational AIDS
(APE) owned by the school so that the counting ability has
not developed to the fullest.
One method of learning is thought to introduce the
ability to count children is through a method of Congklak
play [7]. Counting ability is an ability to use logical
reasoning and numbers. According to Yulianty, it turns out
that playing Congklak can also train good kids in counting.
In addition, children who play Congkak must be clever in
making a strategy to win the game. The game, called
Dakon in Javanese, is usually played by two daughters [8].
The concept of playing in children should be in accordance
with the development phase [9].
The method of play is a teaching method where the
teacher gives the child the opportunity to play a particular
game, such as the one in everyday life [10]. Play has
several meanings, other elements of play are repetition
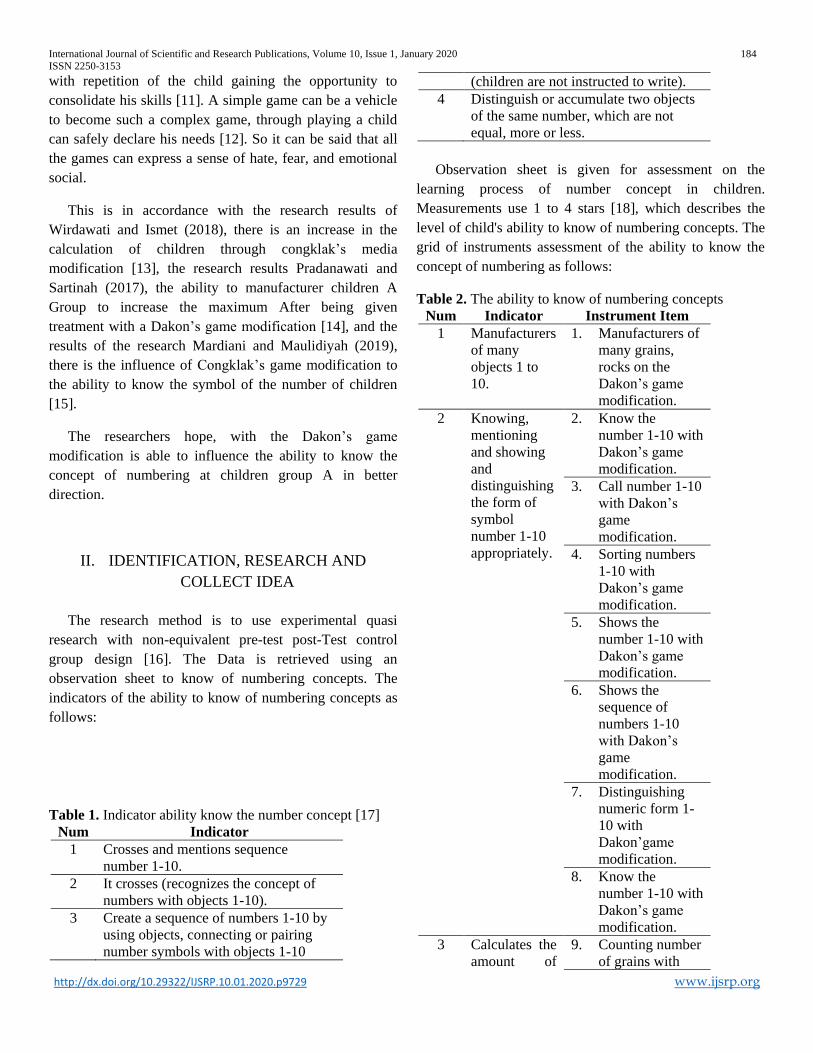
International Journal of Scientific and Research Publications, Volume 10, Issue 1, January 2020 184
ISSN 2250-3153
http://dx.doi.org/10.29322/IJSRP.10.01.2020.p9729 www.ijsrp.org
with repetition of the child gaining the opportunity to
consolidate his skills [11]. A simple game can be a vehicle
to become such a complex game, through playing a child
can safely declare his needs [12]. So it can be said that all
the games can express a sense of hate, fear, and emotional
social.
This is in accordance with the research results of
Wirdawati and Ismet (2018), there is an increase in the
calculation of children through congklak’s media
modification [13], the research results Pradanawati and
Sartinah (2017), the ability to manufacturer children A
Group to increase the maximum After being given
treatment with a Dakon’s game modification [14], and the
results of the research Mardiani and Maulidiyah (2019),
there is the influence of Congklak’s game modification to
the ability to know the symbol of the number of children
[15].
The researchers hope, with the Dakon’s game
modification is able to influence the ability to know the
concept of numbering at children group A in better
direction.
II. IDENTIFICATION, RESEARCH AND
COLLECT IDEA
The research method is to use experimental quasi
research with non-equivalent pre-test post-Test control
group design [16]. The Data is retrieved using an
observation sheet to know of numbering concepts. The
indicators of the ability to know of numbering concepts as
follows:
Table 1. Indicator ability know the number concept [17]
Num Indicator
1 Crosses and mentions sequence
number 1-10.
2 It crosses (recognizes the concept of
numbers with objects 1-10).
3 Create a sequence of numbers 1-10 by
using objects, connecting or pairing
number symbols with objects 1-10
(children are not instructed to write).
4 Distinguish or accumulate two objects
of the same number, which are not
equal, more or less.
Observation sheet is given for assessment on the
learning process of number concept in children.
Measurements use 1 to 4 stars [18], which describes the
level of child's ability to know of numbering concepts. The
grid of instruments assessment of the ability to know the
concept of numbering as follows:
Table 2. The ability to know of numbering concepts
Num Indicator Instrument Item
1 Manufacturers
of many
objects 1 to
10.
1. Manufacturers of
many grains,
rocks on the
Dakon’s game
modification.
2 Knowing,
mentioning
and showing
and
distinguishing
the form of
symbol
number 1-10
appropriately.
2. Know the
number 1-10 with
Dakon’s game
modification.
3. Call number 1-10
with Dakon’s
game
modification.
4. Sorting numbers
1-10 with
Dakon’s game
modification.
5. Shows the
number 1-10 with
Dakon’s game
modification.
6. Shows the
sequence of
numbers 1-10
with Dakon’s
game
modification.
7. Distinguishing
numeric form 1-
10 with
Dakon’game
modification.
8. Know the
number 1-10 with
Dakon’s game
modification.
3 Calculates the
amount of
9. Counting number
of grains with
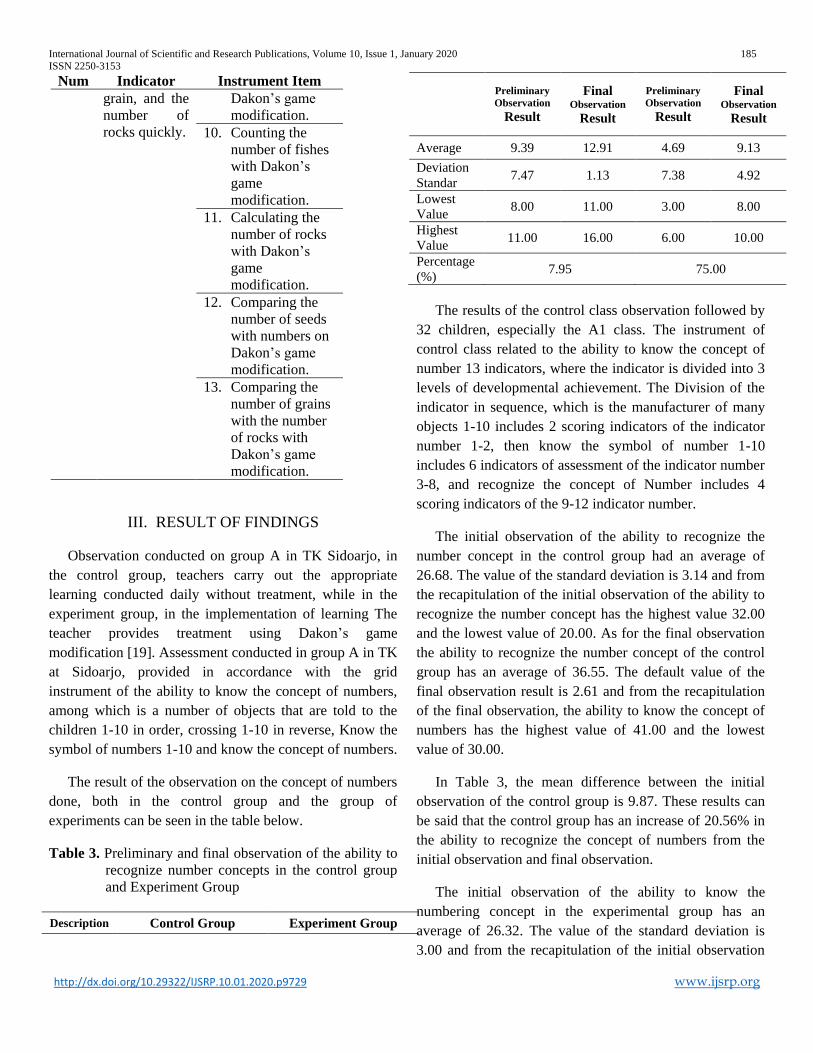
International Journal of Scientific and Research Publications, Volume 10, Issue 1, January 2020 185
ISSN 2250-3153
http://dx.doi.org/10.29322/IJSRP.10.01.2020.p9729 www.ijsrp.org
Num Indicator Instrument Item
grain, and the
number of
rocks quickly.
Dakon’s game
modification.
10. Counting the
number of fishes
with Dakon’s
game
modification.
11. Calculating the
number of rocks
with Dakon’s
game
modification.
12. Comparing the
number of seeds
with numbers on
Dakon’s game
modification.
13. Comparing the
number of grains
with the number
of rocks with
Dakon’s game
modification.
III. RESULT OF FINDINGS
Observation conducted on group A in TK Sidoarjo, in
the control group, teachers carry out the appropriate
learning conducted daily without treatment, while in the
experiment group, in the implementation of learning The
teacher provides treatment using Dakon’s game
modification [19]. Assessment conducted in group A in TK
at Sidoarjo, provided in accordance with the grid
instrument of the ability to know the concept of numbers,
among which is a number of objects that are told to the
children 1-10 in order, crossing 1-10 in reverse, Know the
symbol of numbers 1-10 and know the concept of numbers.
The result of the observation on the concept of numbers
done, both in the control group and the group of
experiments can be seen in the table below.
Table 3. Preliminary and final observation of the ability to
recognize number concepts in the control group
and Experiment Group
Description Control Group Experiment Group
Preliminary Observation
Result
Final Observation
Result
Preliminary Observation
Result
Final Observation
Result
Average 9.39 12.91 4.69 9.13
Deviation
Standar 7.47 1.13 7.38 4.92
Lowest
Value 8.00 11.00 3.00 8.00
Highest
Value 11.00 16.00 6.00 10.00
Percentage
(%) 7.95 75.00
The results of the control class observation followed by
32 children, especially the A1 class. The instrument of
control class related to the ability to know the concept of
number 13 indicators, where the indicator is divided into 3
levels of developmental achievement. The Division of the
indicator in sequence, which is the manufacturer of many
objects 1-10 includes 2 scoring indicators of the indicator
number 1-2, then know the symbol of number 1-10
includes 6 indicators of assessment of the indicator number
3-8, and recognize the concept of Number includes 4
scoring indicators of the 9-12 indicator number.
The initial observation of the ability to recognize the
number concept in the control group had an average of
26.68. The value of the standard deviation is 3.14 and from
the recapitulation of the initial observation of the ability to
recognize the number concept has the highest value 32.00
and the lowest value of 20.00. As for the final observation
the ability to recognize the number concept of the control
group has an average of 36.55. The default value of the
final observation result is 2.61 and from the recapitulation
of the final observation, the ability to know the concept of
numbers has the highest value of 41.00 and the lowest
value of 30.00.
In Table 3, the mean difference between the initial
observation of the control group is 9.87. These results can
be said that the control group has an increase of 20.56% in
the ability to recognize the concept of numbers from the
initial observation and final observation.
The initial observation of the ability to know the
numbering concept in the experimental group has an
average of 26.32. The value of the standard deviation is
3.00 and from the recapitulation of the initial observation

International Journal of Scientific and Research Publications, Volume 10, Issue 1, January 2020 186
ISSN 2250-3153
http://dx.doi.org/10.29322/IJSRP.10.01.2020.p9729 www.ijsrp.org
of the ability to recognize the number concept has the
highest value 31.00 and the lowest value of 20.00. While
the final observation of the ability to know the number
concept in the experiment group has an average of 39.55.
The default value of the final observation result is 2.74 and
from the final observation data the ability to know the
concept of numbers has the highest value of 42.00 and the
lowest value is 33.00.
In Table 3, the mean value of the average difference
between the initial observation and the final observation of
the ability to know the numbering concept in the control
group is 13.23. These results can be said that in the
experimental group there was an increase of 27.56% in the
ability to know the concept of numbers from the initial
observation and final observation.
From the description above it can be shown that both
groups, both the control and experiment groups
experienced an increase in the final outcome, but the
experimental group experienced a treatment improvement
using Dakon’s game modification. Have a higher
percentage (27.56%) than the control group (20.56%) who
do not get the treatment using Dakon’s game modification.
This means that the media is modified in the experimental
group to influence the ability to know the number concepts
in children.
Test the difference of acceptance to know the concept
of numbers between before and after the use of Dakon’s
game modification in the research is done using paired
sample 1 test. Decision making of the different test is as
follows:
a. If the value of the calculated t more bear than the value
of t-table or significance value of < 0.05 then H0
rejected, so there is a difference in the ability to know
the concept of numbers before and after using a
Dakon’s game modification.
b. If the value of the t-calculated is smaller than the table
or significance value > 0.05 then H0 is accepted, so not
be able to.
Based on the results of the Independent sample t-test is
known that the T-count value is 9.569 whereas the t-table
value obtained from 22 respondents is 2.074. From these
results can be known that the value t-count > of the t-table,
in addition to the significance value is 0.00 < 0.05 so that it
can be deduced H0 rejected, so there are significant
differences in the ability to know the concept of numbers
between before and after the use of Dakon’s game
modification.
This is in accordance with the National Education
Department's developmental achievement level, where
learning mathematics for children requires stages from
concrete in the abstract direction, where such stages
include: concrete (giving To the child the real material to
be touched, seen and expressed through the child's verbal),
visually (show the child on the number representing the
concept), and the symbol (introduce the symbols that can
represent the concept) then abstract (the child can
Understand the concept of numbers) [20].
From the above exposure presented that the test results
have also proved that with the use of Dakon’s game
modification of children can manufacturer many objects,
mentioning from 1 to 10 (including know, appoint and
mention) and use the number emblem to calculate (pinch
or take the number of beads and count the number of
beads, put the number of beads) the child can make a
sequence of numbers 1-10 with objects, connect or pair the
coat of arms numbers with objects 1-10 (children are not
told to write). Thus, it can be stated that the modified game
media is affecting the child's ability to know of numbering
concepts.
IV. CONCLUSIONS
Based on the results of the research and discussion, it
can be concluded that there is an influence on the game
Dakon’s game modification to the ability to know of
numbering concept at children group A.
ACKNOWLEDGEMENTS
The author thanked:
1. Prof. Dr. Mustaji, M.Pd, as the promoter who has
guided to complete this article.
2. Dr. Miftakhul Jannah, M.Pd. as the co-promoter who
has guided to complete this article.
3. All friends in Master of Basic Education post-graduate
Program, Surabaya State University that always provide
support and passion.
International Journal of Scientific and Research Publications, Volume 10, Issue 1, January 2020 187
ISSN 2250-3153
http://dx.doi.org/10.29322/IJSRP.10.01.2020.p9729 www.ijsrp.org
REFERENCES
[1] Suryana, D. (2016). Pendidikan Anak Usia Dini:
Stimulasi & Aspek Perkembangan Anak. Prenada Media.
[2] Ahmad Susanto, M. P. (2011). Perkembangan Anak Usia
Dini: pengantar dalam berbagai aspeknya. Kencana.
[3] Sujiono, Y. N., Zainal, O. R., Rosmala, R., &
Tampiomas, E. L. (2014). Metode pengembangan
kognitif.
[4] Pendidikan, M. (2014). Peraturan Menteri Pendidikan dan
Kebudayaan Republik Indonesia Nomor 137 Tahun 2014
Tentang Standar Nasional Pendidikan Anak Usia
Dini. Menteri Pendidikan dan Kebudayaan Republik
Indonesia: Jakarta..
[5] Amir, A. (2014). Pembelajaran matematika SD dengan
menggunakan media manipulatif. In Forum Pedagogik
Jurnal Pendidikan Agama Islam (Vol. 6, No. 01).
[6] Jawati, R. (2013). Peningkatan kemampuan kognitif anak
melalui permainan ludo geometri di paud habibul ummi
ii. Spektrum: Jurnal Pendidikan Luar Sekolah
(PLS), 1(1), 250-263.
[7] Triyuda, D., & Ali, M. (2013). Mengenalkan kemampuan
berhitung melalui permainan tradisional congklak pada
anak usia 5-6 tahun. Jurnal Pendidikan dan
Pembelajaran, 2(7).
[8] Yulianty, R. (2011). Permainan yang meningkatkan
kecerdasan anak. Laskar Aksara.
[9] Fadlillah, M. (2019). Buku ajar bermain & permainan
anak usia dini. Prenada Media. [10] Nasional, D. P. (2007). Pedoman pembelajaran permainan
berhitung permulaan di taman kanak-kanak.
[11] Wijayanti, R. (2016). Permainan Tradisional Sebagai
Media Pengembangan Kemampuan Sosial Anak. Jurnal
CARE (Children Advisory Research and Education), 4(1),
69-79.
[12] Na’im, N. B. (2015). Peningkatan Keterampilan Sosial
Anak Usia 4-5 Tahun Melalui Permainan Tradisional
Cublak-Cublak Suweng Di TK Aisyiah Bustanul Athfal
44 Kecamatan Banyumanik–Kota Semarang. Bella: Early
Childhood Education Papers, 4(2).
[13] Wirdawati, W., & Ismet, S. (2018). Peningkatan
kemampuan berhitung melalui permainan congklak
modifikasi. JPGI (Jurnal Penelitian Guru
Indonesia), 3(2), 110-113.
[14] Suta Pradanawati, H. (2017). Pengaruh Penggunaan
Permainan Dakon Modifikasi Terhadap Kemampuan
Membilang Anak Kelompok A. PAUD Teratai, 6(1). [15] Mardiani, R., & Cahya Maulidiyah, E. K. A. (2019).
Pengaruh Permainan Congklak Modifikasi Terhadap
Kemampuan Mengenal Lambang Bilangan Anak. PAUD
Teratai, 8(1).
[16] Fraenkel, W., & Wallen, N. Hyun,(2012). How to design
and evaluate research in education.
[17] Nugraha, P., Kusnaeni, R., & Fitriani, H. Buku Petunjuk
Guru: Mari Bermain. Grasindo.
[18] Munawaroh, Z. A. (2018). Pengaruh pemberian reward
stiker bintang terhadap percaya diri anak kelompok B di
TK Thoriqussalam Sidoarjo (Doctoral dissertation, UIN
Sunan Ampel Surabaya).
[19] Sugiyono, 2008. Metode Penelitian kuantitatif, kualitatif, dan R & D. Bandung : Alfabeta.
[20] Depdiknas. 2007. Pedoman Pembelajaran Bidang
Pengembangan Bahasa. Jakarta: Depdiknas.
V. AUTHORS
Nia Aminatus Sholihah-Master Program of Basic
Education, Post-graduate Program, Surabaya State
University,
Mustaji-Promotor of Thesis, Post-graduate Program,
Surabaya State University, [email protected]
Miftakhul Jannah-co-Promotor of Thesis, Post-graduate
Program, Surabaya State University,

International Journal of Scientific and Research Publications, Volume 10, Issue 1, January 2020 188
ISSN 2250-3153
http://dx.doi.org/10.29322/IJSRP.10.01.2020.p9730 www.ijsrp.org
Development and implementation of virtual academy for
enhancement of distance learning
N.R.Meddage , V.G.S. Pradeepika
Sri Lanka Institute of Advanced technological Education
Department of Information Technology
DOI: 10.29322/IJSRP.10.01.2020.p9730
http://dx.doi.org/10.29322/IJSRP.10.01.2020.p9730
1. Abstract
Who are the peoples in barriers of time and distance issues, those
kinds of peoples can’t achieve their expectation in education.
Therefore, we have developed a system for addressing to give a
great chance to learn online with more facilities with the use of
server configuration. The remainder of this document describes
the functional requirements of the Virtual Academy in detail,
including descriptions of the individual modules, integration
points between existing modules and high-level scope of new
modules to be developed specifically for the Virtual Academy.
Index terms – E learning, device, classroom, Virtual, Distance,
configuration, mobile, geographical
2. Introduction
Today most of the people in the world have so busy lives.
Unfortunately, they cannot avoid their busy lives. Every person
is really needed to get more qualifications. So, people need to get
more education though they have not time to do it.
So, I am introducing an eLearning system with more facilities
here. With that system the students can get the education by
staying at home. The special thing is this system is fully support
from the beginning to the end of the course.
That means from providing a classroom to get the certificate.
Here I would like to build a system to gather all students who
wants to do the same course. And then the system gathers the
students who want to do the same subject. And get their free
times to join to the classes and make a group with same wishes
students. Then the system can assign a teacher for that
classroom. From now let’s say it’s a virtual classroom.
The teacher as well as all students can log to the virtual
classroom at the class begins,
So, class goes as a normal class with teaching, questioning,
discussing, assignments and all. And there can teacher-student
communication, student-student communication both.
Meanwhile there the students can log to the classroom with their
mobile phones too.
So, I have implemented the system for some mobile devices too.
Actually we decided to provide complete solution for the above
problem from my project.
3. Problem Statement
Well, it is the catalyst that is changing the whole model of
learning in this century – for school pupils, university students,
for employees, for the on-going training and development of
professionals like doctors, nurses and teachers - in fact for just
about anyone who wants to find out something on either a formal
or casual basis. Here are eight ways why I think e learning is
revolutionizing learning, and to illustrate them, I ́ve included
some examples of e learning freely available on the Internet.
E-Learning means that you no longer need to spend long periods
travelling to a location to attend a course; you can now have
access to learning when you want it, at the time you want it - day
or night, wherever you want it - at home, at work, in your local
library. For many students this has opened up a new, much more
flexible and accessible world of learning that was previously
closed to them due to disability or family circumstances, or
perhaps due to the fact that the course they wanted was on the
other side of the world. In Other words, there are now no longer
any geographical constraints to learning; e-learning Brings
learning to people, not people to learning.
E-Learning means that learning no longer needs to be a passive
experience, with the learners all sitting in front of the teacher and
"learning by telling", e-learning makes learning an active
experience. The emphasis is on interactivity or "learning by
doing". And makes learning exciting, engaging and compelling.
Hard and boring Subjects can be made easier, more interesting
and appealing with e learning, and is also helping to embed
learning within work processes, as Organizations begin to
recognize that learning is not something that only takes Place in
a classroom. In fact, 70% of all learning occurs whilst a person is
on the job, that is not in formal training or education but in
everyday working Life as employees carry out their jobs -
finding out information, reading Documents, talking to other
colleagues etc. Learning has moved from the classroom onto the
desktop and now into the pocket. It ś a fact that we are all
becoming more mobile; about 50% of all employees now spend
up to 50% of their time outside the office. We all do a lot more
traveling (on buses, trains and planes), as we visit other offices
or campuses and there is quite a bit of evidence to show that

International Journal of Scientific and Research Publications, Volume 10, Issue 1, January 2020 189
ISSN 2250-3153
http://dx.doi.org/10.29322/IJSRP.10.01.2020.p9730 www.ijsrp.org
people would like to make more use of this "dead time" for
learning purposes. The term m learning is used to describe the
use of PDAs and mobile phones for learning.
The major problem is currently there is no e-learning system that
integrates system to mobile device that has same functionalities
included in desktop system.
4. Requirement Analysis
Basic requirement is implemented new e-learning chat client. For
this client we are supposed to use free and open source chat
server ejabberd.
Basic Requirements are Described below.
• Low Cost – Most important thing is system should be low cost,
there for supposed to use free and open source chat server. Chat
server is the application that transfers data to one user to another
user also called as chat engine.
• User Management – Should be create user accounts, edit users
manage permissions. This system use to facilitate e-learning
therefore it should be possible to create user account for students
and as well as for teachers and also this system should be able to
manage and maintained by administrator account, and also able
to remove user from system this is impartment when one course
is finished he is no longer active user.
• Classroom Management – Should be create classrooms, edit
classrooms and manage classrooms, other task is should be able
to add users as student to classroom as well as should be able to
assign teacher/teachers to classroom. Classroom is like actual
classroom one subject may have one classroom, administrator
can add users to a specific classroom or many classrooms then
user can subscribe to lessons via chat.
• Teacher-Student Communication– Should be able to transfer
chat between teacher to all users as well as teacher to specific
student. Basically, all the learning happens through online chat,
so one teacher has to teach to many students so this is a basic
feature of the system,
• Student-Student Communication – Should be able to transfer
chat between student-students, this is important when one
student wants to discuss something with his friend.
5. Development Methodology
First of all, install ejabberd server, this can be installed on a
Windows, Linux and Mac OSX as you wish. After installing
server should be configured to use to developed client
application. Editing manifest file, which is placed inside installed
directory of the ejabberd server, can do this. The manifest file is
in inside conf directory inside installation of the ejabberd server
the file name is ejabberd.conf. After configuring the server,
server can be accessed via given url and using username and
password provided in the installation wizard.
The client application developed using HTML, javascript and
some other web technologies, after configuring the server client
application should be placed inside server when user access chat
server via browser automatically then automatically loads
developed chat system inside browser.
The mobile application developed using j2me that is a java
version specially design for mobile devices and mobile
application is highly optimized for mobile platforms this
application can be run most mobile devices which support midp.
The system provides the following features:
a. Registration
b. Course Definition and Scheduling
c. Payments and Billing
d. Virtual Classroom
e. Learning Content Creation
f. Online Learning
g. Management Tools
6. Results and Discussion
Developed application can use to text chatting, but it is
impossible to use Audio and Video chat, but complete e learning
system needs proper audio and video chat with group video and
audio chatting. But as basic e-learning system developed system
can be use within small-scale organization with low cost and
with minimum requirements.
Mobile application is very useful for many users they can study
while traveling or in the home and clarify their problems with
friends or with teacher.
Finally, this project needs some future development such as
adding video and audio chatting support and file sharing which
make the application fully complete e-learning system.
The modules which together form the complete Virtual Academy
solution, highlighting the integration points between systems
existing at a given tenant, be it a corporate entity or academic
institution and also with the hosting service provider.
The possible integration and points with external systems are:
iRegistration – Will require information regarding
marketing campaigns, which resulted in the registration
of a given student. In return the registration process will
capture information about how a given student learned
about the programs and why he or she chose to follow
the same, and this information needs to be returned to
the marketing system, which will typically be a CRM
from a known vendor or a custom developed solution.
In addition, if the institute has a legacy Student
Information System which for some reason they would
wish to retain, synchronization of student profiles with
this system will be required.

International Journal of Scientific and Research Publications, Volume 10, Issue 1, January 2020 190
ISSN 2250-3153
http://dx.doi.org/10.29322/IJSRP.10.01.2020.p9730 www.ijsrp.org
iCalatog – For the course price and purchasing options
to be in line with the financial strategy of an institute it
will require integration with the institute’s financial
systems, as the ultimate price of a course will need to
take into account the complete cost incurred in
delivering the same.
Virtual Academy Functions
The functional modules that will be developed specifically
for the Virtual Academy are described at a high level below.
will describe the functional requirements for these modules
in further detail.
iRegistration
The Student self-registration module allows students to enter
personal and contact information and other details typically
provided via non-electronic means. In addition, the module
allows a student to maintain a single consolidated record of all
academic achievements over a period of time, plan their future
progress academically or professionally and provide a single
point of reference for educators regarding student learning plans
and history.
In additions all academic progress made at a given institution is
also captured and displayed within this module, once the course
or assessment is successfully completed. The registration profile
is common across institutions and displays information relevant
to all institutions regardless of which institution’s portal the
profile is currently being accessed from, giving the user a
complete portfolio, which can be exported as an academic
transcript or e-portfolio.
iCatalog
An on-line catalog of courses and scheduled events using which
learners can purchase or subscribe to offerings. The module
combines features of a product catalog, price list and course and
event schedule, allowing users to browse through offerings
available, make their selections and chose their payment method
for chargeable offerings.
iReach Alerts
This module will allow any institution to select a set of events
for which SMS based alerts should be sent out to their
student/learner base, define the message to be sent for a given
event and the dynamic values that should be retrieved from data
available in the system to be incorporated into the message body.
The message will be sent via an SMS gateway that will be
globally configured.
iVClass
The iVClass‘Virtual Classroom’ will deliver live training
sessions to a distributed group of participants over the internet.
The use of video and audio interactions, together with sharing of
the presenter’s applications and desktop, a shared whiteboard
and one-on-one or group chat sessions will allow trainers and
trainees to interact in real time. It will facilitate mentor assisted
training, enabling learners to supplement face-to-face and
eLearning courses with pre-scheduled live lectures.
iReach Classroom
The iReach client will be developed to provide anytime,
anywhere access to e-Learning for users on the Virtual Academy.
This module will allow users to learn online via e-Learning
courses, or to ‘stay in touch’ with their lecturers and colleagues
from within a ‘Mobile Learning Environment’ to supplement
classroom learning, even if they’re always on the road or don’t
have access to a PC or laptop.
The iReach™ Classroom will also acts as a place where users
and can view what new supplementary learning content is
available and what questions are being asked by any learners in
the classroom, virtual or physical. The offline access features
download and cache new learning content and store progress
statistics, which are synchronized with the hosted system when
the user is online.
iCatalog
The iCatalog module will be accessible as an independent web
portal, which can be integrated with any product listing exposed
as a web service. It will provide the following features.
Course Information Maintenance
This feature will allow the definition and maintenance
of all information pertaining to a course. A listing of
courses will be displayed, with the option to add new
courses, edit existing courses and delete unscheduled
courses. The add/edit page will capture or display the
following information:
1) Course ID – Identifier for course; auto generated.
2) Course Code – Unique within institution.
3) Course Name – Plain Text.
4) Course Description – Plain Text
5) Course Details – Detailed course description,
created as an XML document and displayed after
processing by an XSLT, for formatted display.
6) Base Cost
a. Cost to be associated with modes,
including live, online and eLearning. In
system base currency.
7) Course Version – To allow the course to be updated
from time to time.
a. Course Version Cost – if present will
override base cost.
b. Active date and expiry date.
8) Course Prerequisites – ID’s of pre-requisite courses
a. Prerequisite Entity ID – ID of prerequisite
course or program

International Journal of Scientific and Research Publications, Volume 10, Issue 1, January 2020 191
ISSN 2250-3153
http://dx.doi.org/10.29322/IJSRP.10.01.2020.p9730 www.ijsrp.org
b. Prerequisite Type – Type of entity (course
or program)
c. Prerequisite Criteria –
i. Mandatory – One prerequisite, and is
mandatory
ii. Option – One of many defined pre-requisites,
having followed at-least one is mandatory.
9) Course Audience – Level of student allowed to
follow course (e.g. undergrad, postgrad). The
selection will be validated against student profile,
so when a signed in user views the catalog, the
default behavior would be to list only courses that
include the current student as the audience.
10) Course Content ID – Identifier of content item, for
an eLearning course.
11) Base Credits – Default credits carried by the
course, regardless of scheduling.
12) Total Duration – In hours
Lesson Information Maintenance
This feature will allow lecturers to maintain the details of
the course. Listing of lessons for a course will be displayed.
It will provide option to add new lessons, update existing
lessons, and delete lessons. Lesson add, edit page will
provide the following options.
1) Lesson ID – Identifier of the lesson; auto generated
2) Course ID – Reference to the course; foreign key
3) Lesson Name – plain text
4) Lesson Description – Plain text
5) Lesson duration – plain text to integer hours
6) Location typeID – location type suitable for the
lesson.
Lecturer Information Maintenance
This feature will allow the definition and maintenance of all
information pertaining to a lecturer. A listing of lecturers
will be displayed, with the option to add new lecturers, edit
existing lecturers and delete unallocated lecturers. The
add/edit page will capture or display the following
information:
1) Lecturer Name
2) Lecturer Profile
a. Textual Description
b. Profile Picture
c. Contact Details - including e-mail, phone
number
d. Profile Page – Detailed page describing
expertise, areas of interest and qualifications.
Maintained as XML document, formatted
using XSLT.
3) Lecturers available time slots will be enter here using a
suitable control or a UI.
Location Information
This page will allow the maintenance of Locations for the
tenant, a location being any physical are which can be
reserved for courses. A listing of locations will be displayed
on entry to the feature, with the option to add a new
location, edit existing locations and delete unallocated
locations. The add/edit page will capture or display the
following information
1) Location ID
2) Location Type – Location type whether lecture room,
laboratory for practices.
3) Name
4) Description
5) Capacity
6) Location available time slot. Available time slots will
be entered by a suitable time entering control.
7) Active
Program Information
A program will be a bundling of courses into a single program,
which a student can register for. The program definition will
display/collect the following information:
1) Program Code
2) Program Name
3) Program Courses – Selected from a list of all courses,
both e-mode and lecturer delivered
a. Course ID – Filled upon selection
b. Mandatory – To be checked, if the course is
mandatory
Schedule Information
This feature will allow courses to be scheduled and will contain
information pertaining to the schedule. A course will be the
template or object while the schedule will be the actual course
instance. Schedules will only be maintained for instructor led
courses – eLearning courses can be followed at any time,
provided the defined pre-requisites are met. The following
information will be captured when defining a schedule:
1) Schedule ID – Unique identifier for scheduled item,
globally unique.
2) Course ID (subjectid) – Course identifier
3) Course Lecturer – Associated with lecturer information
4) Location - Room identification for physical class
5) Schedule Batch Title – Will default to course title, but
may be updated to indicate instance specific
information
6) Dates – Added using a calendar or a recurrence control,
which will allow selection of the following:
a. Start Date
b. End Date

International Journal of Scientific and Research Publications, Volume 10, Issue 1, January 2020 192
ISSN 2250-3153
http://dx.doi.org/10.29322/IJSRP.10.01.2020.p9730 www.ijsrp.org
c. Class Duration (validated to be less than or
equal to course duration)
d. Recurrence
i. Daily – Will display from/to time
entry fields
ii. Weekly – Will display Day-of-Week
selection checkboxes, in addition to
from/to time
7) Audience - Course registered Students will be the
audience of the schedule. Students add to the schedule ,
removing the schedule will be done from the separate
UI with datagridview.
Scheduling Helper
The scheduling helper will be invoked by a user wishing to
automate the scheduling process. The helper will contain the
following controls:
1) Courses – List from which the courses to be scheduled
are selected
2) Lecturers – Once the list of courses is selected, the
lecturer for each course will be specified
3) Locations – All class rooms or lecture halls to be
considered by the scheduling algorithm will be selected
from a list displayed
4) Period – A date range within which the courses should
be scheduled.
5) Preview – This button will invoke the scheduling
algorithm and create a draft schedule which can be
published.
6) Publish – to publish the schedule to the tenant institute’s
calendar.
The scheduling algorithm functionality will ensure that all
courses are scheduled within the period allocated and that no
two courses scheduled concurrently have the same lecturer
or are allocated to the same location. It will also ensure that
no mandatory courses of a given program are schedule
concurrently.
Scheduled Programs List
This page will list the currently scheduled programs, and
will allow a user to subscribe to a given program. Therefore,
the details row of a given scheduled program will also
display a button which can take one of the following forms:
a) Add to Cart – Will be displayed for programs that the
current user has not yet subscribed for but is eligible for
the user’s subscription. Will allow the user to subscribe
to the program, but directing him or her to the first step
of the subscription process.
b) Make Payment – Will be displayed for programs that
the current user has subscribed to, but has only made a
partial payment for. Will allow the user to complete any
pending ‘installment’ payments (using some payment
gateway)
c) Not Eligible – Will be displayed for programs where the
current user’s profile does not reflect that he or she
possesses the necessary pre-requisites specified for the
program. Clicking on this button will take the user to
the program details page which will contain defined
pre-requisites for the program.
Course Schedule
This feature will allow showing the courses which are scheduled
to particular learner, lecturer or the institute as a whole. This
module basically acts as a time table for individual learners,
lectures and institute administrators. The time table for a given
user at a particular institute will display here.
This page will be represented as a calendar control and
scheduled events will be marked in the relevant date and time
columns for easy reference. This module should present a user
interface that will feel intuitive to users familiar with the
calendar control of MS-Outlook.
Individual User Schedule
Lecturer Schedule
Institute Schedule.
iVClass
Lecture Scheduling
Live lectures are scheduled by Lecturers or Tutors and will be
visible to learners on the standard lecture schedule. When
scheduling such a session, the schedule information entered at
the VA user interface will be populated to the third party iVClass
server infrastructure software. The information to be populated
into the iVClass server will include the following attributes:
Session Name
Session Start Time
Session End Time
Lecturer/Tutor Name and ID – Presenter Name and
ID
Subscribed Learner Names and ID’s – Attendee
Names and ID’s
The scheduling may be for a single session or for multiple
sessions. A notification message with a link to the scheduled
session will be sent out to the lecturer and all subscribed learners
automatically once the session is successfully created in the
iVClass Server.
Lecture Subscription
All users subscribed to the subject for whom the live lecture is
scheduled will automatically be registered as attendees at the
time of lecture scheduling. Additional subscriptions can be
accommodated via a one-time subscription, for which a payment
may or may not be required. Such subscriber names and ID’s
will also be appended to the attendee list on the iVClass server.

International Journal of Scientific and Research Publications, Volume 10, Issue 1, January 2020 193
ISSN 2250-3153
http://dx.doi.org/10.29322/IJSRP.10.01.2020.p9730 www.ijsrp.org
Lecture Attendance
A user can join a scheduled lecture at the indicated start time, by
simply clicking on the schedule entry in the class schedule page.
A subscribed user is also sent a notification of the session with a
link at the point of scheduling or subscribing to a class; this links
can also be clicked on at the scheduled start time to attend the
lecture.
Lecture Delivery Features
During the lecture, the lecturer will be able to initiate the
following activities using the iVClass Client UI:
a) Share Audio – Lecturer can initiate audio sharing using
a button click.
b) Share Video - Lecturer can initiate audio sharing using
a button click.
c) Upload presentation – Lecturer can upload a
presentation to be accessible to all participants using a
button.
d) Share Desktop – Lecturer can share the active
application on the desktop using a button.
e) Share virtual whiteboard – Lecturer can share a virtual
whiteboard using a button. Once shared the lecturer can
enter text, mark or annotate and draw basic diagrams
using a mouse or other pointing device.
f) View Question & Answer List – A separate Q&A
screen will be accessible using a button click. This list
will display questions asked by the learners, which can
be responded to by selecting a given question and
typing in the answer.
g) Chat - An on-line chat session can be initiated, with the
chat window displaying the current messages, and
providing the control to select whether a response is to a
single learner or all attendees
h) Survey – The lecturer can initiate and publish a survey,
open polling and close polling, while being able to see a
summary of all responses received on-line.
i) Transfer control – Lecturer can transfer control to a
learner, passing on all above lecturer features to the
learner temporarily.
Lecture Recording
The entire lecture session will be recorded and can be published
in the using some management DB system as a content item, or
distributed to the iReach mobile client.
Additional Module Integration with iVClass
The following integration points will be enabled in the learning
management system and social learning portal:
a) Initiate iVClass Session with Content Publisher
b) Initiate interactive session with lecturer.
iReach Alerts
The iReach Alerts module will consist of an integration API
which invokes methods of a given SMSC, and the message
trigger and content definition wizard which will be accessed by
an authorized user at the tenant site.
User Management
User Management will provide the following major features:
a) Add new user
b) Edit existing user information
c) Delete users
d) List users with search and sort
Group Management Group Management will provide the following major
features:
Adding new group
Editing existing group information
Deleting group
Listing group
Adding users to group
Exact search/search and filter group
Sorting
Functionality Management
Functionality management will be the granting of feature
access to roles. Authorized personnel will be able to select a
role for a given unit and assign the system features granted
to that unit. To perform any operation, a given role should be
granted “Read” permission for that feature.
iReach Classroom
The iReach module will provide the mobile and offline access
features with learning content security. The iReach client will be
an application or ‘app’ which can be downloaded on to an
android powered smart phone or a personal computer and used to
obtain learning anytime, anywhere. It will be supported by a set
of services hosted on the server, to which the client has to
connect to occasionally to obtain new content and synchronize
updates.
User Interface Features
The core feature set to be provided to an iReach user is:
SCORM Viewer – The viewer will allow a user to follow a
SCORM compliant e-Learning course on a smart phone or
offline on a PC, and track all events, which will be updated to the
server immediately if the user is online, or stored for later
synchronization if the user is offline.
Any SCORM compliant course should ideally be accessible via
this viewer, but this would be subject to limitations imposed by
the host device.
The user will see a list of assigned courses from which he can
select a given course to start following the same. If he or she
chooses to stop at some point, the application will record current
progress and allow the user to resume following the course at a
later date or time.
The user will be able to interact with the course controls using
the touch screen, in the case of a smart phone, and a mouse and
keyboard in the case of off-line access via PC.

International Journal of Scientific and Research Publications, Volume 10, Issue 1, January 2020 194
ISSN 2250-3153
http://dx.doi.org/10.29322/IJSRP.10.01.2020.p9730 www.ijsrp.org
Interactive Assessment Viewer – This viewer will allow a user
to attempt an assessment on iReach, using the touch screen to
navigate through the question paper and answer questions if a
smart phone is being used, and using the mouse and keyboard
when on a PC.
The user will be presented with a list of assessments assigned,
from which he or she can chose to start a given assessment.
Once started, the user will not be allowed tostop or pause an
assessment without submitting the answers, and resume will not
be possible.
The assessment results will be immediately updated to the server
if the user is online and will be stored for subsequent
synchronization if the user is offline.
Chat client – a user will be able to chat with his or her tutor or
‘batch’, which for a user on the academic portal will be the set of
students following the same course. A user on the public portal
will be allowed to chat with a designated ‘mentor’, if such an
individual is nominated.
The chat client will indicate the online presence of a given user,
and selecting this user will initiate a chat session. Group chat
will also be possible for academic portal users, who will be able
to see all online users in the batch in a ‘chat room’.
Offline users will not be allowed to use the chat feature.
Video viewer – The viewer will allow a user to watch video
based courses within iReach; streamed video when online and
cached videos when offline. The resolution supported and the
size of the video that can be cached will be restricted by the
capabilities of the mobile handset.
Document Viewer – The document viewer will be used to
display tutorials, lecture notes and other text based content
which will be provided as a part of an on-line course, or as
supplementary material for a classroom based course. The
viewer will ensure that delivered material can be viewed, but not
copied or printed.
Settings and Sync – The user will be allowed to configure the
learner profile on the iReach client using this interface. The user
ID and password will be requested upon initial registration and
will be stored within the client and used for authentication
subsequently.
The ‘Sync Now’ button will activate the synchronization
process, which will upload any progress statistics to the server
and download any content queued for the user to the client.
Security Features and Resource Requirement
Security features will be transparent to the user, who will
configure the initial iReach profile by entering the user ID and
password which has been registered on the virtual academy. This
profile information will be stored securely on the smart phone or
PC, along with any other settings specific to the application.
The online authentication module will use profile information
configured on the iReach client to authenticate with the virtual
academy server, prior to initiating any data transfer for content
downloading or progress synchronization. The user will not be
expected to authenticate himself when starting the application as
it is assumed the owner of the smart phone will be the only
person using it for learning.
On a PC the iReach client will again assume that the owner of
the current operating system login is the user to whom the
application profile is configures and will not request
authentication.
7. Conclusion
This e-learning chat application is suitable for small scale
organization and possible to use as basic e-learning tool. but,
currently this tool does not have much features compared to
commercial tools like Microsoft lync. But this tool is free so this
does not need to pay anyone and fulfill basic e-learning
functions.
8. References
i. Best Practices in the Training of Faculty to Teach
Online. (2004). Maryland: Doctorial Dissertation,
University of Maryland.
ii. Japanangka, H. P. (1998). MIxed Model Delivery
of Health and Education service in the Tanami
Desert Region of the Northen Territory in Barker.
Perth, Australia: J.M., Learning Together:
Collobaration in Open :earning preceeding.
iii. Moore, M. a. (2005). Distance Education System
View. Thomson Wadsworth.
iv. Smith, T. (2005). Fifty- One Competencies for
online instruction. Journal Education Online, 3(2).
v. Tam, M. (2000). Constructivism, Instructional
Design, and Technology: Implications for
Transforming Distance Learning, Educational
Technology and Society . The Changing the Role
of the Teacher, The Journal, 25(3).
vi. Taylor, J. (1996). Perspective on the Education
Uses of TEchnology. Queensland: Toowoomba :
University of Southern Queensland.
vii. (2005). Virtual School Initiatives Increase as Study
Details Distance Learning. Electronic Education
Report, March .
Authors N.R. Meddage, Assistant Lecturer (Head of Department - IT ) , Sri Lanka Institute of Advanced Technological Education

International Journal of Scientific and Research Publications, Volume 10, Issue 1, January 2020 195
ISSN 2250-3153
http://dx.doi.org/10.29322/IJSRP.10.01.2020.p9730 www.ijsrp.org
Colombo 10, [email protected] V.G.S. Pradeepika, Senior Lecturer, Sri Lanka Institute of Advanced Technological Education Colombo 10, [email protected]
International Journal of Scientific and Research Publications, Volume 10, Issue 1, January 2020 196
ISSN 2250-3153
http://dx.doi.org/10.29322/IJSRP.10.01.2020.p9731 www.ijsrp.org
To Evaluate the Functional Outcome of Close
Reduction and Percutaneous Fixation of Fracture
Proximal Humerus By K Wires
Dr.Satish Agarwal *, Dr.Amit Sehgal **
* Assistant Proffesor M.L.B.Medical College Jhansi.)Dept Of Orthopaedics
** Associate Proffesor,M.L.B. Medical College Jhansi
DOI: 10.29322/IJSRP.10.01.2020.p9731
http://dx.doi.org/10.29322/IJSRP.10.01.2020.p9731
Abstract- Proximal humerus fractures are one of the common
fractures occurring in the skeleton. They account for
approximately 4-5% of all the fractures.1,2 85% are minimally
displaced or undisplaced and can be treated with
immobilization3,4,5 alone. The remaining 15% of these are
displaced and provide a therapeutic challenge6.This study was
conducted to analyze displaced fractures of proximal humerus that
was treated with close reduction and pinning and to document their
clinical and functional outcomes as well as complications .This
study was conducted in Department of Orthopedics, Santokba
Durlabhji, Hospital, Jaipur.A minimum of 25 patients with
fracture proximal humerus managed with percutaneous k-wires
fixation were evaluated.Percutaneous k- wires fixation is
recommended in young motivated patients with two and three part
fracture.Complication associated with k-wires fixation were few
and functional outcomes were comparable with other studies.
Complication associated with open reduction can be avoided.In
four part fractures had high complication rate of malunion and
stiffness, so it is not recommended for percutaneous fixation.It is
type of biological fixation, in the sense that it does not compromise
circulation of humeral head.It decreases duration of hospital stay
I. INTRODUCTION
roximal humerus fractures are one of the common fractures
occurring in the skeleton. They account for approximately 4-
5% of all the fractures.1,2 85% are minimally displaced or
undisplaced and can be treated with immobilization3,4,5 alone. The
remaining 15% of these are displaced and provide a therapeutic
challenge6.
Conservative management of displaced fractures
predisposes to non union, mal union, and painful shoulder
dysfunction10,11. Surgical treatment of displaced fracture requires
realignment and fixation. Open reduction and internal fixation is
challenging because it requires extensive exposure, which causes
substantial blood loss and predisposes to wound complications and
delay in fracture healing and risk to neurovascular structures.
As Proximal humerus fractures are metaphyseal fracture,
and they heal quickly and provide a unique opportunity for
temporary fixation till fracture union occurs. This can be easily
done by insertion of percutaneous pins, which can left in situ for
4-6 weeks to hold reduction. Normally smooth k-wires or 2.5mm
threated wires are used for this purpose. The usual site of insertion
of wires are, two wires retrograde from proximal to deltoid
insertion into the humeral head, one wire from greater tuberosity
to the medial humeral shaft and an optional fourth wire from
anterior humeral shaft into the humeral head.
This study was conducted to analyze displaced fractures of
proximal humerus that was treated with close reduction and
pinning and to document their clinical and functional outcomes as
well as complications.
Aims and Objectives
• The goal of study was to evaluate functional outcomes of
close reduction and percutaneous pinning of displaced proximal
humerus fractures by k- wires.
• To Study the complications that may occur with closed
reduction and percutaneous pinning of fracture proximal humerus.
Materials and methods
Study Centre - This study was conducted in Department of
Orthopedics, Santokba Durlabhji, Hospital, Jaipur.
Study Design - This was hospital based prospective study.
Source of Data - All patients fulfilling the inclusion criteria
were admitted during the study period.
Sample Size - A minimum of 25 patients with fracture
proximal humerus managed with percutaneous k-wires fixation
were evaluated.
Inclusion Criteria - Two part, three part, four part
displaced proximal humerus fracture:
• Acute fractures < 7 days
• Age above 18
• Patient fit for surgery and anesthesia
Exclusion criteria
• Associated humerus shaft fracture
• Associated neurovascular injury
• Pathological fractures
• Old fractures> 7 days
• Open fracture
• Stable fractures
Pre-operative assessment and planning:
The patients were examined according to protocol, which
included:
P

International Journal of Scientific and Research Publications, Volume 10, Issue 1, January 2020 197
ISSN 2250-3153
http://dx.doi.org/10.29322/IJSRP.10.01.2020.p9731 www.ijsrp.org
Clinical evaluation
• Detailed history, regarding name, age, sex
• Systemic examination
• Local examination of shoulder
• Examination to check for any neurovascular or
associated injury
Radiological evaluation
• Done by conventional radiograph consisting of anterior -
posterior and lateral view.
• A CL scan was indicated, If the amount of displacement
of the humeral head or tuberosity fragments was unclear on
radiographs and for complex fracture patterns.
Routine preoperative investigation
• Hb, BT, CT, Urine Blood Urea, blood sugar, Serum
electrolyte, ECG, X-ray chest.
• Antibiotic prophylaxis regime were given as per
treatment protocol of closed fractures.
II. OPERATIVE PROCEDURE
Surgery was done under general anaesthesia, Patient was
kept in a beach position. After adequate preparation fractured limb
was grasped and fracture were manipulated under fluoroscopic
control to achieve a closed reduction of the fragments. Reduction
checked under image intensifier system. After obtaining adequate
reduction, in both AP and lateral projections, 2-3, 2-2.5mm
terminally threaded k-wires were passed in a retrograde fashion
from proximal shaft of humerus across the fracture into humeral
head in a divergent fashion. 1-2 wires passed prograde from
greater tuberosity into the medial proximal humerus across the
fracture site, preventing damage to neurovascular structures.
Fixation checked under image intensifier for stability
Postoperative management
Post operatively patient was immobilized in shoulder
immobilizer. Appropriate antibiotics and analgesics were used.
Post-op X-rays were taken.
III. FOLLOW UP AND REHABILITATION
• Patient was asked to come for follow up in OPD after
seven to ten days post surgery for X-rays to check for secondary
displacement of fracture and pin migration.
• Patients were started on gentle shoulder movements at
three weeks from surgery as permitted by pain.
• Flexion/Abduction was permitted and rotation was
restricted till fracture union.
• X-ray evaluation was done at six weeks post surgery to
assess fracture union and k wires were removed in the clinic after
conformation.
• Physiotherapy was continued to regain shoulder
movements. Clinical checks was carried out at monthly interval
till complete fracture union was achieved.
• Once radiological evidence of fracture healing was
achieved, follow up exam was at three month intervals till
complete shoulder range of motion was achieved. Patients were
followed up for six month post surgery or till when full ROM at
shoulder was achieved if this was earlier than six months.
Methods of evaluation
Functional results were evaluated according to constant
score26
Observations and results
The minimum age of the patients in our series was 32 years
and the maximum was 78 years with mean age of 56.60 years. Of
all the 25 cases, 12 of them were in fifth and sixth decade of life
comprising 48% of the total patients.
Males predominates with incidence of 68% of the total
number of patients while females constituted 32% of the total
number of cases.
The involvement of left and right extremity was almost
equal. 16 patients had injury on right side and 9 had on left side.
Road side accidents were the mode of injury in 10 out of 25
cases. In 15 patient the mode of injury was fall.
Nineteen out of twenty five patients had no associated
injury. Six patients had other injuries along with proximal
humerus fracture. Out of these six patients two patients had BTC
and one had BTA. One patient had HI and two patient had pelvic
fracture which were managed conservatively.
In our study, six patients had hypertension, four patients had
diabetes mellitus, two patients had both hypertension and diabetes
mellitus. One patient had bronchial asthma.
One of total 25 patients, 9 patients had two part fracture 15
patient had 3 part fracture and 1 patient had 4 part fracture.
Out of twenty five patients, twenty patients were operated
within 1-4 days of injury and five patients were operated within 5-
7 days of injury due to medical problems or associated injuries.
Average union time for fracture to unite was found to be 9.5
weeks which was not very different from other modalities of
treatment. The minimum time for union was six weeks and
maximum time was twelve weeks.
Out of twenty five patients, three patients had superficial pin
infection. Two patients had malunion. Four patients had both
malunion and stiffness. Two patients had pin loosening. One
patient had proximal pin migration. No patients were found to
have non union or avascular necrosis of the humeral head.
2(8%) of the patients had flexion between 150 degree to 180
degree. 14 (56%) of the patients had flexion between 120 degree
to 150 degree. 8 (32%) of the patients had flexion between 90
degree to 120 degree. 1 (4%) of the patient had flexion less than
90 degree.
9(36%) patients had abduction between 120 and 150 degree.
13 (52%) patients had abduction between 90 and 120 degree. 3
(12%) patients had abduction less than 90 degree.
4(16%) patients had an external rotation between 60-90
degree that is hand above head and elbow forward. 13 (52%)
patients had an external rotation between 30-60 degree that is hand
behind head and elbow back. 8 (32%) patients had an external
rotation less than 30 degree that is hand behind head and elbow
forward.
4 (16%) patients had internal rotation (dorsum of hand) up
to the buttocks. 3(12%) patients had internal rotation (dorsum of
hand) up to the SI Joint. 11 (44%) patients had internal rotation
International Journal of Scientific and Research Publications, Volume 10, Issue 1, January 2020 198
ISSN 2250-3153
http://dx.doi.org/10.29322/IJSRP.10.01.2020.p9731 www.ijsrp.org
(dorsum of hand) up to the waist. 7(28%) patients had internal
rotation (dorsum of hand) up to the T12 level.
17 patients had no pain while 8 patients had mild pain.
Functional results were evaluated by Constant score. The
Constant score was graded as poor (0% - 55%), moderate (56% -
70%), good (71% - 85%) or excellent (86% - 100%). In our study
average Constant score was 73.65%. Minimum Constant score
was 44% and maximum constant was 89%. Patient with Constant
score 89% had two part proximal humerus fracture. K-wire
fixation was done and mobilisation was started after four weeks.
Patient was well educated 40 years male with great motivation. He
attained range of motion up to 150° in front and lateral elevation.
The only problem was mild pain while sleeping on the affected
side. The union time was 1.5 months and there was no
complication. Patient having minimum Constant score (44%) was
a 73 years male with four part proximal humerus fracture. Front
and lateral elevation was less than 90 degree. The union time in
this case was eleven weeks.
In our study out of 25 patients, 9 had two part fracture with
mean age of 45.55 years and average union time of 7.66 wks, with
the mean constant score of 80. Out of 9 patients with 2 part
fracture, 7 had union time between 6-8 wks in remaining, 2
patients union time of 9-10 wks.
In our study, 15 patients had 3 part fracture with man age of
60.73, union time of 8.6 wks, and mean constant score of 65.86.
out of these, three patients had poor results with restriction of
movements and persistent mild pain and varus malunion. Two
patient had malunion with satisfactory range of movements.
Correlation time of scores of age, union time and results for
four part fracture
Age Union
time
Complication Constant
score
Result
73 11 Mal & ST 44 Poor
This patient had severe restriction of movements and malunion,
decresing neck shaft angle less than 120 degree, probably due to
communition of bone which got impacted after reduction, leading
to varus malunion.
Results
Results No. of cases Percentage (%)
Excellent 4 16
Good 11 44
Moderate 6 24
Poor 4 16
Out of twenty five patients of two or three and four part
fracture proximal humerus, managed with percutaneous k-wires in
our study, 16% had excellent, 44% had good, 24% had moderate
and 16% had poor results.
Summary
• A total of 25 patients with two, three or four part fracture
proximal humerus managed with percutaneous k-wires fixation
were evaluated.
• The minimum age of the patients in our series was 32
years and the maximum was 78 years with mean age of 56.60
years.
• Males predominated with incidence of 68% of the total
number of patients while females constituted only 32% of the total
number of cases.
• 64% patients had injury on right side and 36% had injury
on left side.
• Road side accidents were the mode of injury in 10 out of
25 cases. In 15 patient the mode of injury was fall.
• The average time from injury to surgery was 3.08 days.
While most of cases operated within four days, one patient (4%)
took six days to operate, as he had associated head injury and was
managed for the same.
• Of the total 25 patients, 9 patients had two part fracture
15 patients had 3 part fracture and 1 patient had 4 part fracture.
• Nineteen out of twenty five patients had no associated
injury. Six patients had other injuries along with proximal
humerus fracture. Out of these six patients two patients had BTC
and one had BTA. One patient had HI and two patients had pelvic
fracture which were managed conservatively.
• In our study hypertension was the most common medical
history. Hypertension present in 6 patients (24%). In two patients
hypertension associated with diabetes mellitus. Diabetes mellitus
was present in total 4 patients (16%). Bronchial asthma is present
in 1 patient (4%).
• Average union time for fractures to unite was found to be
9.5 weeks which was not very different from other modalities of
treatment. The minimum time for union was six weeks and
maximum time was twelve weeks.
• Two patients had malunion. Four patients had both
malunion and stiffness (forward and lateral elevation less than 120
degree, external rotation with hand behind head and elbow
forward and back, and internal rotation with dorsum of hand up to
buttock or S.I. joint). Three patients had superficial infection. Two
patients had proximal pin migration. No patients found to have
nonunion or avascular necrosis of the humeral head.
• In our study average Constant score was 70.04%.
Minimum Constant score was 44% and maximum Constant was
89%.
• Out of twenty five patients 16% had excellent, 44% had
good, 24% had moderate and 16 % had poor results.
Our results are similar to or better than the results reported in
literature when k-wire fixation was done in two, three or four part
fracture proximal humerus.
In conclusion, fixation of two, three part fracture proximal
humerus with percutaneous k-wire after stabilization of the patient
gives good functional results in terms of final range of movement
achieved and acceptable rate of complications, but four part
fracture has high complication rate of malunion and stiffness.
IV. CONCLUSION
• The advantage of close reduction and percutaneous
pinning include avoidance of devascularization of fracture
fragment, decreasing risk of injury to soft tissue and blood vessels.
• As Proximal humerus fractures are metaphyseal fracture
so heals quickly and

International Journal of Scientific and Research Publications, Volume 10, Issue 1, January 2020 199
ISSN 2250-3153
http://dx.doi.org/10.29322/IJSRP.10.01.2020.p9731 www.ijsrp.org
• provide a unique opportunity for temporary fixation till
fracture union occurs. This can be easily done by temporary
insertion of percutaneous pins for two and three part fractures.
• Comparable results with fair to good functional outcomes
can be obtained with close reduction percutaneous pinning of
proximal humerus fracture.
• Isolated greater tuberosity fractures and displaced four
part fractures are less amiable to treatment with this modality and
are more likely to heal in some amount of malunion.
• Despite some degree of malunion and stiffness patients
are not significantly compromised in their activities of daily living.
• Complications though present are not with lasting sequel
and can be managed easily.
• This is an easy technique and particularly attractive
because of the minimally invasive approach and predictably
favourable outcomes in majority of patients.
• The fixation method is more biologic and reduces cost
and hospital stay, and allows for early fracture healing.
V. RECOMMENDATIONS
• Percutaneous k- wires fixation is recommended in young
motivated patients with two and three part fracture.
• Complication associated with k-wires fixation were few
and functional outcomes were comparable with other studies.
Complication associated with open reduction can be avoided.
• Four part fractures had high complication rate of
malunion and stiffness, so it is not recommended for percutaneous
fixation.
• It is type of biological fixation, in the sense that it does
not compromise circulation of humeral head.
• It decreases duration of hospital stay.
REFERENCES
[1] Horak J, Nilsson BE. Epidemiology of fracture of the upper end of the humerus. Clin Orthop 112: 250-253
[2] Rose SH, Melton U, Morey BF et al: Epidemiologic features of humeral fractures. Clin Orthop 168; 24, 1982
[3] Jacob RP, Kristiansen T, Mayo K, Ganz R, Muller ME: Classification and Aspects of Treatment of Fractures of the Proximal Humerus. In Bateman JE, Welsh RP (eds). Surgery of the shoulder. Philadelphia, Decker.1984:330-343.
[4] Koval KJ, Callagher MA, Marsicno JG et a!. Functional outcome after minimally displaced fractures of proximal part of humerus. J Bone Joint Surg. Am 1997;79: 203
[5] Neer CS. Displaced proximal humeral fractures. Part 1. Classification and evaluation. I Bone Joint Surg. Am. 1970;52: 1077-1089
[6] Cofield RH. Comminuted fractures of the proximal humerus. Clin Orthop 1988;230:49-57
[7] Neer CS II, Rockwood CA: Fractures and dislocations of the shoulder, in Rockwood CA, Green DP (eds): Fracture in adults, Philadelphia, PA, Lippincott, 1984:675-721.
[8] Neer CS II. Displaced proximal humeral fractures. Part II Treatment of three- part and four-part displacement. J Bone Joint Surg. Am. 1970; 52: 1090-103
[9] Campbell’s operative orthopaedics. Fracture of the proximal humerus in adults. 10th Ed.,Vol-3:2990-2994.
[10] Scott E. Powell, Robert W. Chandler. Fractures of the proximal humerus Chapter-11, In: Text book of Operative techniques in upper extremity sports injuries. Ed. Frank W. Jobe, Mosby, 1995: p.313-340.
[11] Zyto K. Non-operative treatment of comminuted fractures of the proximal humerus in elderly patients. Injury. i998;29:349-52
[12] Szyszkowitz R, Seggi W, Schleifer P, Cundy PJ. Proximal humeral fractures management techniques and expected results. Clin Orthop, 1993; 293: 13-25
[13] Hagg O, Lundberg BJ. Aspects of prognostic factors in comminuted and dislocated proximal humerus fractures. In: Bateman JE, Welsh RP. Surgery of shoulders. Philadelphia, Decker, 1984:51-59.
[14] Munst P, Kuner EH. Osteosynthesis in dislocated fractures of the humerus head. Orthopaed. 1992: 21:121-30
[15] Ebrain N, Wong F Y, Biyani A. Percutaneous pinning of the proximal humerus, J Orthop. Am. 1996; 25:500-1,506.
[16] Jaberg H, Warner JJ, Jakob RP. Percutaneous stabilization of unstable fractures of humerus. J Bone Joint Surg. Am. 1992; 74: 508-15.
[17] Lous U, Bigiliani, Chapter The shoulder, Vol-i ed. Charles Rockwood, Frederick A. Fractures of proximal humerus. In Rockwood CA, Matsen. Philadelphia: W.B. Saunders, 1990: p278-334.
[18] Sehr J, Szabo RM. Semitubular blade plate for fixation in the proximal humerus. J Orthop Trauma. 1989;2:327-332.
[19] Moda SK, Chadha NS, Sanqwan SS, Khurana DK, Dahiya AS, Siwach RC. Open reduction and internal fixation of proximal humeral fractures and fracture dislocations. J Bone Joint Surg. Br. 1990 Nov;72 (6): 1050-2.
[20] Sebler G, Walz H, Kuner E. [Minimal osteosynthesis of fractures of the head of the humerus. Indications, technic, results]. Unfallchirung, 1989: 92-169-74. German
[21] Maurer F. Sequestered bone infection after Kirschner wire osteosynthesis of humeral head fracture. Aktuelle Traumatol. 1993: 23: 380-1 German
[22] Povacz P, Resch H. Osteosynthesis of proximal humerus fractures. Ther Umsch. 1998; 55:192-6. German.
[23] Chen CY, Chao EK, Tu YK, Ueng SW, Shih CH. Closed management and percutaneous fixation of unstable proximal humerus fractures. J Trauma. 1998 Dec;45(6):1039-45.
[24] Resch H, Povacz, Frohlich R, Wambacher M. Percutaneous fixation of three- and four-part fractures of the proximal humerus. J Bone Joint Surg Br. 1997 Mar;79(2);295-300
[25] Darder A, Darder A Jr. Sanchis V, Fastaldi E, Gomar F. Four-part displaced proximal humeral fractures: Operative treatment using Kirschner wires and a tension band. J Orthop Trauma 1993 ;7(6):497-505.
[26] Zyto K, Ahrengart L, Sperberg A, Tornkvist H: Treatment of displaced proximal humeral fractures in elderly patients. J Bone Joint Surg. Br. 1997;79(3): 412-417.
[27] Constant CR, Murley AH. A clinical method of functional assessment of the shoulder. Clin Orthop 1 987;2 14:160-4.
[28] Jakob RP, Ganz R. Proximal humerus fracturen. Helv. Chir Acta 1981; 48:595-610.
[29] Habermeyer P, Schweieberer L. Fracture of the proximal humerus. Orthopaedic. 1989; 18:200-7.
[30] Hawkins RJ, Bell RH, Gurr K. The three part fracture of the proximal part of the humerus. Operative treatment. J Bone Joint Surg. Am. 1986 Dec;68(9): 14 10-4.
[31] Goldman RT, Koval KJ, Cuomo F, Gallagher MA, Zuckerman 3D. Functional outcome after humeral head replacement for acute three and four-part proximal humeral fractures. J Shoulder Elbow surg. 1995 Mar-Apr;4(2);81-6
AUTHORS
First Author – Dr.Satish Agarwal. Assistant Proffesor
M.L.B.Medical College Jhansi, Dept Of Orthopaedics
Second Author – Dr.Amit Sehgal. Associate Proffesor,M.L.B.
Medical College Jhansi.(Corresponding Author)

International Journal of Scientific and Research Publications, Volume 7, Issue 8, August 2017 200
ISSN 2250-3153
www.ijsrp.org
International Journal of Scientific and Research Publications, Volume 10, Issue 1, January 2020 201
ISSN 2250-3153
http://dx.doi.org/10.29322/IJSRP.10.01.2020.p97XX www.ijsrp.org
How Quality of Life Affects Emotional Intelligence
and Marital Adjustment in Menopausal Women
Gayatri Sahu1, Dr. Shikha Sharma2
1MSc. Clinical Psychology Student, Department of Psychiatry, Geetanjali Medical College & Hospital, Udaipur, Rajasthan, India
2Assistant Professor, Clinical Psychology, Department of psychiatry, Geetanjali Medical College & Hospital , Udaipur, Rajasthan, India
DOI: 10.29322/IJSRP.10.01.2020.p9732
http://dx.doi.org/10.29322/IJSRP.10.01.2020.p9732
Abstract- Background: Due to menopause, body makes less of
the hormones estrogens and progesterone so that very low level of
estrogens after menopause can affect health. And menopause leads
to Marital Adjustment (MA) and Emotional Intelligence (EQ) in
women. Aim: the main aim of the study is to how quality of life
affects emotional intelligence and marital adjustment in
menopausal women. Sample: 60 sample were selected
purposively from the Geetanjali Medical College & Hospital,
Udaipur (Raj).Method: Factorial research design was used and
data has been collected by using Quality of life scale, Emotional
Intelligence Scale, and Locke Wallace Marital Adjustment Test.
Result: The result shows significant association of quality of life
over marital adjustment and emotional intelligence and there is
significant correlation find in quality of life and marital adjustment
means low quality of life leads to increase marital difficulties and
it is similar in emotional intelligence that there is an impact of
quality of life on emotional intelligence. And another finding is
that there is a significant correlation between marital adjustment
and emotional intelligence. Emotional intelligence and marital
adjustment has significant correlation in menopausal women.
Conclusion: The study indicates that Quality of life has
significant effect on emotional intelligence or marital adjustment
in menopausal women.
Index Terms- Quality of life (QOL), Emotional intelligence (EQ),
Marital adjustment (MA), Menopausal women
I. MENOPAUSE
enopause is the transitional period in a woman's life when
her ovaries start producing less of
the sex hormones estrogen and progesterone. A woman who has
her ovaries surgically removed immediately enters menopause.
Meaning of menopause
Menopause is literally the very last period of a women
reproductive life and it is said that it occur when a women has not
menstruated naturally for 12 consecutive months.
Robert A Wilson, another of feminine forever and the
popular messiah of hormone replacement therapy (HRT) writing
in menopause- “the loss of womanhood and the loss of good
health” claims that menopause is the serious medical condition
endangering the health and happiness of any women.
Historical Aspect:
Three major milestones presence in the history of menopause:
1. The first event was the achievement of Butenandt; he was
a noble prizewinner in chemistry. He succeeded in 1929
in obtaining in pure form a hormone from the wine of
pregnant woman, which was eventually called Estrogen.
2. The second development was the publication of book in
1966 which was published by Robert, A Wilson M.D.
Ebtutked “Feminine forever” which become an instant
best seller. The popularized theory of this book called
“Estrogen Replacement Treatment’’ or “Hormone
Replacement Therapy”
3. The third major landmark was the publication of an
editorial and two original articles in the New England
Journal of medicine of December 4, 1975.Claiming an
association between exogenous estrogen and endometrial
cancer.
The hypothalamus, anterior pituitary gland and gonads
(ovaries) work together to regulate the menstrual cycle.
Gonadotropin releasing hormone from the hypothalamus
stimulates luteinizing hormone (LH) and follicular stimulating
hormone (FSH) release from anterior pituitary gland. LH and FSH
are gonadotrpins which act primarily on the ovaries in the female
reproductive tract
II. SIGNIFICANT OF THE STUDY
The study on the topic “How quality of life affects
emotional intelligence and marital adjustment in menopausal
women” is very relevant in present society. Health is an important
factor that contributes to human well- being and economic growth.
Currently in India women has to face various health issues, which
directly affect the aggregate economy output. Every year we
celebrate mother’s day and women’s day or we show love and
respect to women that how important she has in our lives but this
is a only one side story. India tops the list of countries that are said
to have highest mortality rates during delivery or even highest
number of non school going girl. In various health issues of
women currently menopause is a major problem.
Menopause signs the end of a women’s period. In the months
to year before menopause a time called “perimenopause” means
the production of hormones that regulate the menstrual cycle
changes.
Average age of menopause is 45 to 50 but there is a wide
range some women have their last period in their 40s.
M

International Journal of Scientific and Research Publications, Volume 10, Issue 1, January 2020 202
ISSN 2250-3153
http://dx.doi.org/10.29322/IJSRP.10.01.2020.p97XX www.ijsrp.org
Anything that damages the ovaries or stops estrogen
production can cause menopause to occur earlier. These include:
Smoking
Surgery to remove ovaries
Radiation therapy
Apart from this almost every women who suffer from
menopausal problem also have difficulties with Quality of life,
Emotional Intelligence and Marital Adjustment.
International Scenario
Menopause defined as a cessation of menstrual period it’s
occur naturally in most women with the aging of worldwide
population in the coming decades, it is estimated that 1.2 billion
women worldwide will be menopausal or premenopausal by the
year of 2030. It is estimated that 85% of postmenopausal women
have experienced a menopause related symptoms in their lifetime
and vasomotor symptoms is estimated 40 to 50 million women in
United States (29)
Apart from quality of life, marital adjustment and emotional
intelligence (EQ) also have important aspect in menopausal
women. Menopausal symptoms affect individual’s quality of life.
As well as may cause of difficulty in marital adjustment and
emotional intelligence.
National Scenario
India has a large population. A project frame in 2026 have
estimated that the population in India will be 1.4 billion, people
over 60 years 173 million, and the menopausal population 103
million. Average age of menopause is 47.5 years in Indian women
with an average life expectancy of 71 years. 35–40% of women
between 40 and 65 years have been detected to suffer from
osteopenia whereas 8–30% suffers from osteoporosis. Premature
menopause in India has been noticed anecdotally to have an
increasing incidence and greater prevalence in India.
There is an wide burden of surgical menopause in India. A
significant number of hysterectomies are performed with bilateral
oophorectomies (28)
III. STATEMENT OF THE PROBLEM
How quality of life affects marital adjustment and emotional
intelligence in menopausal women.
Menopause: Menopause happens when fertility and
menstruation end. And It is a normal process, not a disease, but it
can cause drastic changes in women life.(5) more than 80% of the
women experience physical or psychological symptoms in the
years when they come near to menopause, with various distresses
and disturbances in their lives, leading to a decrease in the quality
of life. Women in dissatisfying marriages or marital adjustment,
characterized by less social support, less depth, and higher
conflict, reported increased stress.(4)
Quality of life: quality of life means general well being of
individual and societies. Quality of life includes not only wealth
and employment but also the built environment, physical and
mental health, education and recreation and social belonging.
Marital Adjustment: marital adjustment describes the
experience of a married couple acclimating to a marital
relationship. New marriages begin with a period of marital
adjustment as both spouses learn to adapt to the marriage.
Women’s quality of life affected by family function and marital
adjustment in family.
Emotional Intelligence: emotional intelligence quotient is
the ability to recognize their own emotion and those of others use
emotional information to guide thinking and behavior, and
manage and or adjust emotions to adapt environment and achieve
goal.
Objectives:
To analyze how quality of life affects marital adjustment
in menopausal women
To analyze how quality of life affects emotional
intelligence in menopausal women
To find out the correlation between emotional
intelligence and marital adjustment in menopausal
women.
Hypothesis:
H1 There will be significant impact of quality of life on
emotional intelligence.
H2 There will be significant impact of quality of life on
marital adjustment.
H3 There will be correlation between emotional
intelligence and marital adjustment in menopausal
women.
Review of literature
There has been a study conducted on Four hundred and
eighty-one women aged 40-59 years attending the Southern
Metropolitan health service in Santiago de Chile were studied
using the Quality of Life Questionnaire for Menopause from
Toronto University. The analysis showed that menopausal
women have worse Quality of life scores than women conserving
cycles in the four areas of the questionnaire: They show a 10.6-
fold higher risk for suffering vasomotor disorders affecting QoL,
a 3.5-fold higher risk for psychosocial impairment, a 5.7-fold
higher risk for physical disorders, and a 3.2-fold higher risk for
sexual disorder (20)
Another study found in the health care centers in Kashan
City and 700 menopause women were selected using cluster
sampling method findings showed that menopausal women had
worse QOL in sexual and vasomotor domains. Several studies
indicated that QOL was impaired in menopausal women, because
menopausal phase is related with several physical and mental
changes that may impact women’s health outcomes (21)
This Study were done by Zolinda Stone man and Susana
Gavidia-Payne (2006) Marital Adjustment in Families of Young
Children With Disabilities and in this study 67 families were
included. And the result of this study is that Most of the couples
were experiencing average to above average marital adjustment.
Husbands and wives viewed their marriages more negatively.(23)
Another study was conducted in Social Security hospital in
Zahedan and the sample size was 103. Aim of study is to determine
the relationship between quality of life and marital satisfaction in
nurses in Social Security hospital in Zahedan. Results of study
demonstrated the importance of pay attention to family issues and

International Journal of Scientific and Research Publications, Volume 10, Issue 1, January 2020 203
ISSN 2250-3153
http://dx.doi.org/10.29322/IJSRP.10.01.2020.p97XX www.ijsrp.org
marital satisfaction and in this regard, the promotion of all aspects
of quality of life is essential. (24)
This study was conducted by Rakesh Pandey and Tulika
Anand and suggests that emotional intelligence (EI) is a factor of
chief importance in adjustment to life. And this study believed that
couples with high EQ are good at understanding each other’s
emotions and feelings which, in turn, enhances marital adjustment
and happiness in their life. The sample size was 32 and thirty two
married couples completed a set of self-report questionnaires
consisting measures of emotional intelligence, marital adjustment,
health and well-being. (26)
Material and Methods
Research design: Factorial Research Design
Quality
of life
Emotional
intelligence(EQ)
Marital
adjustment(MA)
Quality of life.
Emotional intelligence
Quality of life.
Marital adjustment
Variables
Independent variable: Quality of life
Dependent variable: marital adjustment and emotional
intelligence
Sampling
Sample size : 60 Consecutively selected samples
Sampling technique : purposive sampling
Type of study: Observation type.
Type of data: Secondary data.
Sampling criteria:
Inclusion criteria
1. Subject whose age is between 45 to 55 year and who are
attending to Geetanjali medical college and hospital
2. Subject who understand English and Hindi language
3. Subject who are willing to participate in research study
4. Both rural and urban patients were taken for the study
Exclusion criteria:
1. Subject who don't understand Hindi and English
language
2. Subject who are under 13 to 45 year
3. Subject who are suffer from gynecological disorder,
serious illness, physical stress
4. medications that affect menstruation include
antipsychotics
cancer chemotherapy
antidepressant
The data has been collected by using following psychological
tools:
Psychological test Developed by year
Quality of life scale John Flanagan 1981
Emotional quotient
test
Dr. Dalip Singh and
Dr. NK Chadha
2006
Locke Wallace test Locke, H. J.,&
Wallace , K.M.
1959
IV. STATISTICAL ANALYSIS :
After finding mean and SD scores; correlation has been
found by using Karl Pearson’s product movement correlation and
significant by using t value.
V. OBSERVATION AND RESULT
The present study conducted in the Department of psychiatry
of Geetanjali Medical College & Hospital, Udaipur Rajasthan.
Sixty menopausal women were taken for this study whose age is
between 40-45.
Marital
adjustment
N Mean SD
60 23.15 3.76345
Table A1 shows the mean and SD value of marital adjustment in
menopausal women. Mean value is 23.15 and SD value of marital
adjustment is 3.76345 respectively.
Table A2: Mean and SD of Emotional intelligence in
menopausal women
Emotional
intelligence
N Mean SD
60 255.25 43.99947
Table A2 shows the mean and SD value of emotional
intelligence in menopausal women. Mean value of emotional
intelligence is 255.25 and SD value is 43.99947 respectively.
Table A3: Mean and SD of Quality of life in menopausal
women
Quality of
life
N Mean SD
60 63.01667 16.45074
Table A3 shows the mean and SD value of quality of life in
menopausal women. Mean value of quality of life is 63.01667 and
SD value of quality of life is 16.45074 respectively.
Table –A 4: Mean and SD of emotional intelligence quotient
over level of marital adjustment
Level of Marital
adjustment
Emotional intelligence quotient
N Mean SD
Difficulties in
relationship(<14)
0 - -
Neutral(14-27) 53 252.6415 42.56899
Happy (>27) 7 275 53.07228
Table A4 shows the level of marital adjustment level over
emotional intelligence quotient in menopausal women. And
categorized are level of marital adjustment of difficulties in
relationship (<14) and EQ value are (N=0, mean =nil, SD = nil)
and Neutral (14-27) level of MA AND EQ are (N = 53, Mean =
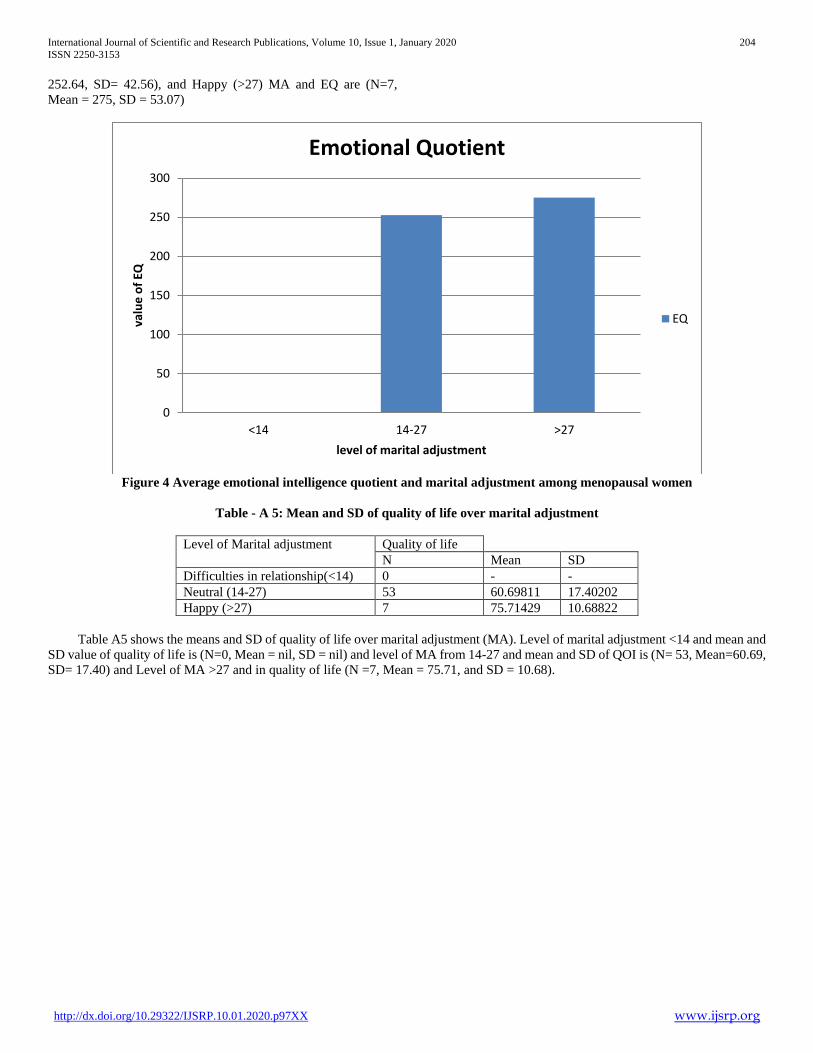
International Journal of Scientific and Research Publications, Volume 10, Issue 1, January 2020 204
ISSN 2250-3153
http://dx.doi.org/10.29322/IJSRP.10.01.2020.p97XX www.ijsrp.org
252.64, SD= 42.56), and Happy (>27) MA and EQ are (N=7,
Mean = 275, SD = 53.07)
Figure 4 Average emotional intelligence quotient and marital adjustment among menopausal women
Table - A 5: Mean and SD of quality of life over marital adjustment
Level of Marital adjustment Quality of life
N Mean SD
Difficulties in relationship(<14) 0 - -
Neutral (14-27) 53 60.69811 17.40202
Happy (>27) 7 75.71429 10.68822
Table A5 shows the means and SD of quality of life over marital adjustment (MA). Level of marital adjustment <14 and mean and
SD value of quality of life is (N=0, Mean = nil, SD = nil) and level of MA from 14-27 and mean and SD of QOI is (N= 53, Mean=60.69,
SD= 17.40) and Level of MA >27 and in quality of life (N =7, Mean = 75.71, and SD = 10.68).
0
50
100
150
200
250
300
<14 14-27 >27
valu
e o
f EQ
level of marital adjustment
Emotional Quotient
EQ
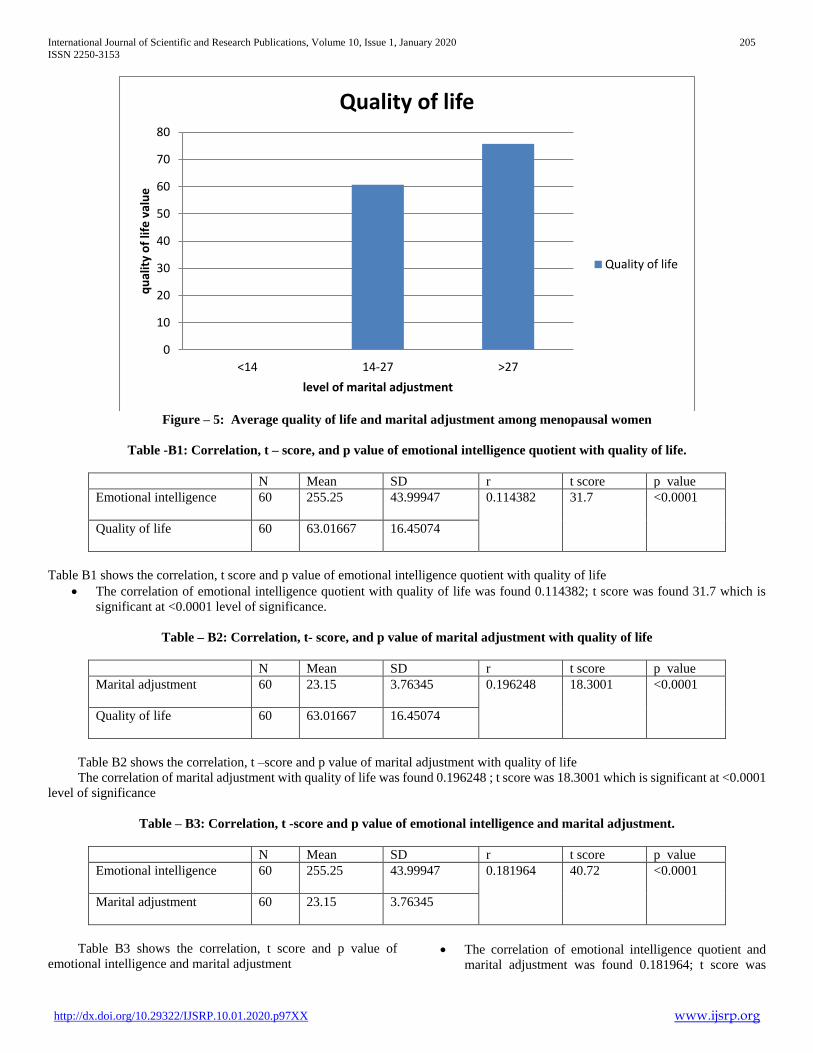
International Journal of Scientific and Research Publications, Volume 10, Issue 1, January 2020 205
ISSN 2250-3153
http://dx.doi.org/10.29322/IJSRP.10.01.2020.p97XX www.ijsrp.org
Figure – 5: Average quality of life and marital adjustment among menopausal women
Table -B1: Correlation, t – score, and p value of emotional intelligence quotient with quality of life.
N Mean SD r t score p value
Emotional intelligence 60 255.25
43.99947
0.114382
31.7
<0.0001
Quality of life 60 63.01667
16.45074
Table B1 shows the correlation, t score and p value of emotional intelligence quotient with quality of life
The correlation of emotional intelligence quotient with quality of life was found 0.114382; t score was found 31.7 which is
significant at <0.0001 level of significance.
Table – B2: Correlation, t- score, and p value of marital adjustment with quality of life
N Mean SD r t score p value
Marital adjustment 60 23.15
3.76345
0.196248
18.3001
<0.0001
Quality of life 60 63.01667
16.45074
Table B2 shows the correlation, t –score and p value of marital adjustment with quality of life
The correlation of marital adjustment with quality of life was found 0.196248 ; t score was 18.3001 which is significant at <0.0001
level of significance
Table – B3: Correlation, t -score and p value of emotional intelligence and marital adjustment.
N Mean SD r t score p value
Emotional intelligence 60 255.25
43.99947
0.181964
40.72
<0.0001
Marital adjustment 60 23.15
3.76345
Table B3 shows the correlation, t score and p value of
emotional intelligence and marital adjustment The correlation of emotional intelligence quotient and
marital adjustment was found 0.181964; t score was
0
10
20
30
40
50
60
70
80
<14 14-27 >27
qu
alit
y o
f lif
e v
alu
e
level of marital adjustment
Quality of life
Quality of life
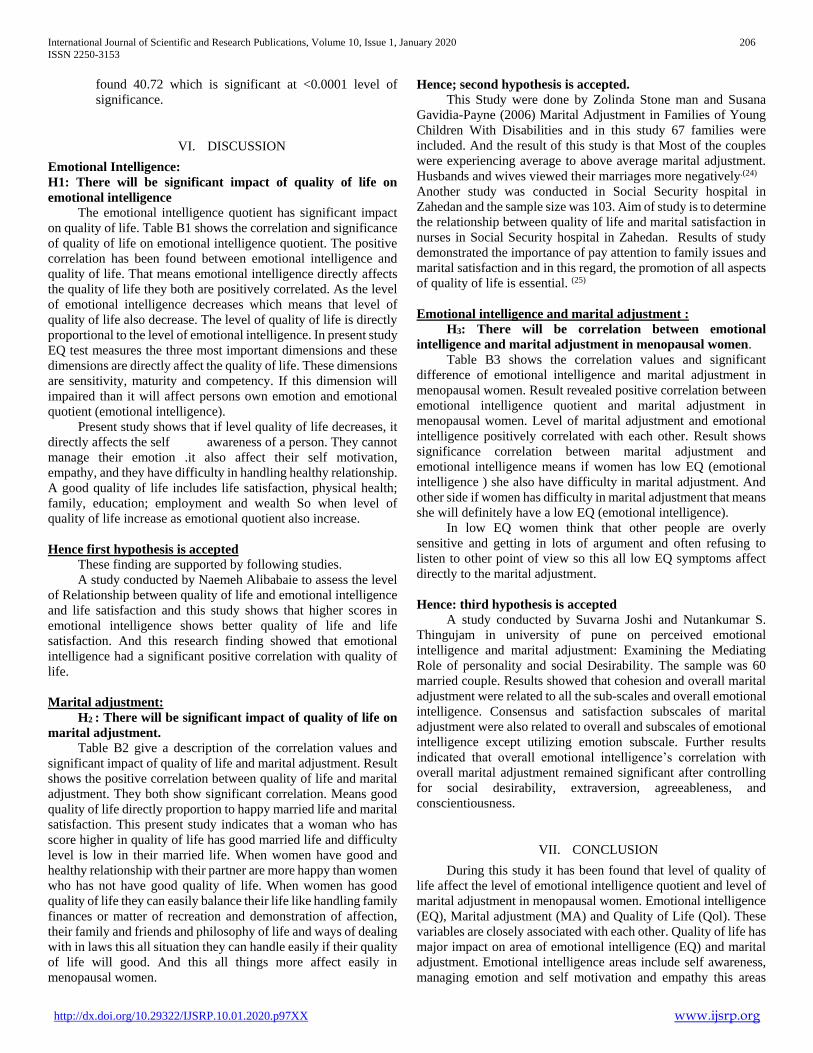
International Journal of Scientific and Research Publications, Volume 10, Issue 1, January 2020 206
ISSN 2250-3153
http://dx.doi.org/10.29322/IJSRP.10.01.2020.p97XX www.ijsrp.org
found 40.72 which is significant at <0.0001 level of
significance.
VI. DISCUSSION
Emotional Intelligence:
H1: There will be significant impact of quality of life on
emotional intelligence
The emotional intelligence quotient has significant impact
on quality of life. Table B1 shows the correlation and significance
of quality of life on emotional intelligence quotient. The positive
correlation has been found between emotional intelligence and
quality of life. That means emotional intelligence directly affects
the quality of life they both are positively correlated. As the level
of emotional intelligence decreases which means that level of
quality of life also decrease. The level of quality of life is directly
proportional to the level of emotional intelligence. In present study
EQ test measures the three most important dimensions and these
dimensions are directly affect the quality of life. These dimensions
are sensitivity, maturity and competency. If this dimension will
impaired than it will affect persons own emotion and emotional
quotient (emotional intelligence).
Present study shows that if level quality of life decreases, it
directly affects the self awareness of a person. They cannot
manage their emotion .it also affect their self motivation,
empathy, and they have difficulty in handling healthy relationship.
A good quality of life includes life satisfaction, physical health;
family, education; employment and wealth So when level of
quality of life increase as emotional quotient also increase.
Hence first hypothesis is accepted These finding are supported by following studies.
A study conducted by Naemeh Alibabaie to assess the level
of Relationship between quality of life and emotional intelligence
and life satisfaction and this study shows that higher scores in
emotional intelligence shows better quality of life and life
satisfaction. And this research finding showed that emotional
intelligence had a significant positive correlation with quality of
life.
Marital adjustment:
H2 : There will be significant impact of quality of life on
marital adjustment.
Table B2 give a description of the correlation values and
significant impact of quality of life and marital adjustment. Result
shows the positive correlation between quality of life and marital
adjustment. They both show significant correlation. Means good
quality of life directly proportion to happy married life and marital
satisfaction. This present study indicates that a woman who has
score higher in quality of life has good married life and difficulty
level is low in their married life. When women have good and
healthy relationship with their partner are more happy than women
who has not have good quality of life. When women has good
quality of life they can easily balance their life like handling family
finances or matter of recreation and demonstration of affection,
their family and friends and philosophy of life and ways of dealing
with in laws this all situation they can handle easily if their quality
of life will good. And this all things more affect easily in
menopausal women.
Hence; second hypothesis is accepted.
This Study were done by Zolinda Stone man and Susana
Gavidia-Payne (2006) Marital Adjustment in Families of Young
Children With Disabilities and in this study 67 families were
included. And the result of this study is that Most of the couples
were experiencing average to above average marital adjustment.
Husbands and wives viewed their marriages more negatively.(24)
Another study was conducted in Social Security hospital in
Zahedan and the sample size was 103. Aim of study is to determine
the relationship between quality of life and marital satisfaction in
nurses in Social Security hospital in Zahedan. Results of study
demonstrated the importance of pay attention to family issues and
marital satisfaction and in this regard, the promotion of all aspects
of quality of life is essential. (25)
Emotional intelligence and marital adjustment :
H3: There will be correlation between emotional
intelligence and marital adjustment in menopausal women.
Table B3 shows the correlation values and significant
difference of emotional intelligence and marital adjustment in
menopausal women. Result revealed positive correlation between
emotional intelligence quotient and marital adjustment in
menopausal women. Level of marital adjustment and emotional
intelligence positively correlated with each other. Result shows
significance correlation between marital adjustment and
emotional intelligence means if women has low EQ (emotional
intelligence ) she also have difficulty in marital adjustment. And
other side if women has difficulty in marital adjustment that means
she will definitely have a low EQ (emotional intelligence).
In low EQ women think that other people are overly
sensitive and getting in lots of argument and often refusing to
listen to other point of view so this all low EQ symptoms affect
directly to the marital adjustment.
Hence: third hypothesis is accepted
A study conducted by Suvarna Joshi and Nutankumar S.
Thingujam in university of pune on perceived emotional
intelligence and marital adjustment: Examining the Mediating
Role of personality and social Desirability. The sample was 60
married couple. Results showed that cohesion and overall marital
adjustment were related to all the sub-scales and overall emotional
intelligence. Consensus and satisfaction subscales of marital
adjustment were also related to overall and subscales of emotional
intelligence except utilizing emotion subscale. Further results
indicated that overall emotional intelligence’s correlation with
overall marital adjustment remained significant after controlling
for social desirability, extraversion, agreeableness, and
conscientiousness.
VII. CONCLUSION
During this study it has been found that level of quality of
life affect the level of emotional intelligence quotient and level of
marital adjustment in menopausal women. Emotional intelligence
(EQ), Marital adjustment (MA) and Quality of Life (Qol). These
variables are closely associated with each other. Quality of life has
major impact on area of emotional intelligence (EQ) and marital
adjustment. Emotional intelligence areas include self awareness,
managing emotion and self motivation and empathy this areas
International Journal of Scientific and Research Publications, Volume 10, Issue 1, January 2020 207
ISSN 2250-3153
http://dx.doi.org/10.29322/IJSRP.10.01.2020.p97XX www.ijsrp.org
affected in emotional intelligence. The marital adjustment
includes difficulty in dealing with in laws and conflict with partner
occurs when level of quality of life low in menopausal women.
REFERENCES
[1] J. Legg, Timothy, Holland Kimberly, Psychological and Social Aspects of Menopause PMHNP-BC, GNP-BC, CARN-AP, MCHES on March 15, 2016
[2] Pallikadavath S, Ogollah R, Singh A, Dean T, Dewey A, Stones W, et al. Natural menopause among women below 50 years in India: A population-based study. Indian J Med Res 2016;144:366-77.
[3] Mayer, John D (2008). "Human Abilities: Emotional Intelligence’’. Annual Review of Psychology. 59: 507–536. doi:10.1146/annurev.psych.59.103006.093646. PMID 17937602. Archived from the original on 2015-12-22.
[4] Peeyananjarassri K, Cheewadhanaraks S, Hubbard M, Manga RZ, Eden J. Menopausal symptoms in a hospital-based sample of women in southern Thailand. Climacteric. 2006;9:23–29.
[5] Waidysakera H, Wijewardena K, Lindmark G, Naessen T. Menopausal symptoms and quality of life during the menopausal transition in Sri Lankan women. Menopause. 2009;16(1):164–170.
[6] William R, Levine K, Kalini L, Lewis J, Clark R. Menopause – specific questionnaire assessment in US population–based study shows negative impact on health related quality of life. Maturitas. 2009;62(2):153–159.
[7] Satob T, Ohashi K. Quality of life assessment in community-dwelling, middle aged, healthy women in Jaban. Climacteric. 2005;8:146–153.
[8] Sussman Matthew, Trocio Jeffrey and Louie Michael , Prevalence of menopausal symptoms among mid life women ; finding from electronic medical records, BMC Womens’s Health , Aug 13, 2015.
[9] Unni Jyothi , Third consensus meeting of Indian Menopause Society (2008): A summary , J Midlife Health. 2010 Jan-Jun; 1(1): 43–47.
[10] Blumel J.E.; Castelo Branco C.;Binfa L; Gramegna G.; X Tacla ; Aracena B.;Cumsille M.A.; Sanjuan A., Quality of life after the menopause: a population study ; Maturitas ; Volume 34 , Issue 1, 15 January 2000, PP 17-23
[11] Kalarhoudi, Abedzadeh ; Taebi ,M ; Sadat, Z ; and Sadat,F ; Assessment of quality of life in menopausal women; A population study in Kashan, Iran ; Iranian Red Crescent Medical Journal; Published online 2011 Nov. 1.
[12] Nisar Nusrat ; Ahmed Sohoo Nisar ; Severity of Menopausal symptoms and the quality of life at different status of Menopause: a community based survey from rural Sindh, Pakistan ; international journal of collaborative Research on internal Medicine & public health
[13] E Norozie, F Mostafavi, A Hasanzadeh ,M Moodi, G Sharifirad , Factors affecting quality of life in postmenopausal women, Isfahan, 2011.; J Educ Health Promot. 2013 Oct 30;2:58. doi: 10.4103/2277-9531.120857. eCollection 2013.
[14] Karmakar Nabarun,, Majumdar Somak , Dasgupta Aparajita , and Das Sulagna , Quality of life among menopausal women: A community-based study in a rural area of West Bengal, J Midlife Health. 2017 Jan-Mar; 8(1): 21–27. doi: 10.4103/jmh.JMH_78_16
[15] Ganapathy Thilagavathy , Saud Al Furaikh Samia , Health-related quality of life among menopausal women, Department of MCH, King Saud Bin Abdul Aziz University of Health Sciences, Al- Ahsa, CON-A, KSA,Department of MCH, King Saud Bin Abdul Aziz University of Health Sciences; Department of Pediatrics, King Abdul Aziz Hospital, Al- Ahsa, CON-A, KSA, ORIGINAL Article, year: 2018, volume:6, Issue:1, page: 16-23
[16] A. E. Mohamed Hoda, M. Lamadah Sahar, Gh. Al. Zamil Luma, Quality of life among menopausal women, International journal of reproduction contraception, obstetrics and gynecology Vol 3, No 3 (2014)
[17] G K Poomalar , Arounassalame Bupathy, The Quality of Life During and After Menopause Among Rural Women, Department of Obstetrics and Gynaecology, Sri Manakula Vinayakar Medical College & Hospital, Madagadipet, Pondicherry 605107, India. Journal of clinical and diagnostic research, Original Article DOI 10.7860/JCDR/2012/4910.2688 Year : 2013 | Month : Jan | Volume : 7 | Issue : 1 Page : 135 - 139
[18] BAIRY Laxminarayana , ADIGA Shalini , BHAT Parvathi , BHAT Rajeshwari , Prevalence of menopausal symptoms and quality of life after menopause in women from South India, Australian and New Zealand Journal
of Obstetrics and Gynaecology 2009; 49:106–109 DOI: 10.1111/j.1479-828X.2009.00955.x
[19] Senthilvel sumathi, Vasudevan senthivel, , P. S. Anju , Anjana Sukumaran, Anjana Sukumaran , jayanthi sureshbabu , Assessment of Symptoms and Quality of Life among Postmenopausal Women in a Tertiary Care Hospital in Kochi, South India: A Hospital-based Descriptive Study, journal of mid life health, 2018 Oct-Dec; 9(4): 185–190. doi: 10.4103/jmh.JMH_98_18
[20] Pallikadavath Saseendran, Ogollah Reuben, Singh Abhishek , Dean Tara, Dewey Ann, Stones William, Natural menopause among women below 50 years in India: A population-based study, Indian journal of medical Research, Year : 2016 | Volume : 144 | Issue : 3 | Page : 366-377
[21] A AlDughaither , H AlMutairy , M AlAteeq, Menopausal symptoms and quality of life among Saudi women visiting primary care clinics in Riyadh, Saudi Arabia, International Journal of Women's Health , Published 29 June 2015 Volume 2015:7 Pages 645—653.
[22] Shirvani Mina, Heidari Mohammad, Quality of Life in Postmenopausal Female Members and Non-members of the Elderly Support Association, (J Menopausal Med 2016;22:154-160), December 2016, DOI: 10.6118/jmm.2016.22.3.154
[23] Panichkul Suthee, Wongwananuruk Thanyarat ,Boonyanurak pongrak, Menopause-related symptoms and quality of life in peri- and postmenopausal women in Thailand: a multicenter study, Sciendo, Volume/Issue: Volume 11: Issue 3 published online: 31 Aug 2017 Pages: 207–216 DOI: https://doi.org/10.5372/1905-7415.1103.551
[24] Stoneman Zolinda ; Gavidia Payne Susana ; Marital Adjustment in Families of Young ChildrenWith Disabilities: Associations With Daily Hasslesand Problem-Focused Coping ; American journal of mental retardation: AJMR ;February 2006
[25] Gharibi Maliheh ; Sanagouymoharer GholamreZ and Yaghoubinia Fariba ; The Relationship Between Quality of Life With Marital Satisfaction in Nurses in Social Security Hospital in Zahedan; Global journal of health science ;june 2015
[26] Gutierrez-Vega Marisela; Del villar- Oscar Armando Esparza; Saucedo -Irene Concepción Carrillo and Alvarado Priscila Montañez; The Possible Protective Effect of Marital Status in Quality of Life Among Elders in a U.S.-Mexico Border City ; Community Mental Health Journal 2018 ; Published online 2017 sep 8.
[27] Jafarbegloo Esmat , Bakouei Sareh , Dadkhahtehrani Tahmineh, Marital Satisfaction in Menopausal Women with and without Sexual Dysfunction, Journal of midwifery and reproductive health, doi 10.22038/jmrh.2017.8898
[28] Basharpoor Sajjad , Sheykholeslami Ali , The Relation of Marital Adjustment and Family Functions With Quality of Life in Women, Eur J Psychol. 2015 Aug; 11(3): 432–441. Published online 2015 Aug 20. doi: 10.5964/ejop.v11i3.859
[29] Bankowski Brandon J., Gallicchio Lisa M. , Whiteman Maura K., Lewis Lynn M.,. Zacur Howard A., Flaws Jodi A., The association between menopausal symptoms and quality of life in midlife women, asrm American society for reproductive medicine, October 2006 Volume 86, Issue 4, Pages 1006–1008.
[30] Sis Aslı , PASİNLİOĞLU Türkan , Determining the association between Turkish women’s menopausal symptoms and their marital adjustment, Turkish Journal of Medical Sciences, Faculty of Health Sciences, Atatürk University, Erzurum, Turkey, Received:02.08.2012, Accepted:01.01.2013, Published Online:02.10.2013, Printed:01.11.2013
[31] Whiteley Jennifer, daCosta DiBonaventura Marco, Wagner Jan-Samuel, Alvir Jose ,shah Sonali , Journal of Women's Health, J Womens Health (Larchmt). 2013 Nov; 22(11): 983–990.doi: 10.1089/jwh.2012.3719
[32] Pandey Rakesh and Anand Tulika ; Emotional Intelligence and its Relationship with Marital Adjustment and Health of Spouse ; Indian journal of science and research; October 2018
[33] Extremera Natalio , Berrocal Pablo Fernandez , Relation to perceive emotional intelligence and health-related quality of life of middle-aged women, Psychological Reports 91(1):47-59 · September 2002 with 2,390 Reads DOI: 10.2466/PR0.91.5.47-59
[34] Bauld Rosie , F. Brown Rhonda, Stress, psychological distress, psychosocial factors, menopause symptoms and physical health in women, science direct, Maturitas
[35] Volume 62, Issue 2, 20 February 2009, Page DOI: 10.13140/RG.2.1.3693.6802
[36] Jain rahul divya , Emotional Intelligence & its relationship with Life Satisfaction, DOI: 10.13140/RG.2.1.3693.6802 Conference: Emergence of

International Journal of Scientific and Research Publications, Volume 10, Issue 1, January 2020 208
ISSN 2250-3153
http://dx.doi.org/10.29322/IJSRP.10.01.2020.p97XX www.ijsrp.org
India as a Global Economy: Challenges and Opportunities, At CENTUM Journal of Management, Volume: ,vol. 8 (1) 61-63
[37] Rosie Bauld, Rhonda Brown, Stress, psychological distress, psychosocial factors, menopause symptoms and physical health in women, Australian national university 2015-12-13T22:45:27Z
[38] Dr. Lavalekar Anagha , Kulkarni Pradnya , jagtap Pranita, the relationship between Marital Satisfaction and Emotional Intelligence, January 2010, Research gate.
[39] Ozyer Kubilay and Azizoglu Oznur and Fahreeva Gulnaz, A Study About Relationship Between Emotional Intelligence and Life Satisfaction, AKADEMİK BAKIŞDERGİSİSayı: 25 Temmuz – Ağustos 2011 UluslararasıHakemli Sosyal Bilimler E-Dergisi ISSN:1694-528X İktisat ve
Girişimcilik Üniversitesi, Türk DünyasıKırgız – Türk Sosyal Bilimler Enstitüsü, Celalabat – KIRGIZİSTAN
AUTHORS
First Author – Gayatri Sahu, MSc. Clinical Psychology Student,
Department of Psychiatry, Geetanjali Medical College &
Hospital, Udaipur, Rajasthan, India
Second Author – Dr. Shikha Sharma, Assistant Professor,
Clinical Psychology, Department of psychiatry, Geetanjali
Medical College & Hospital , Udaipur, Rajasthan, India

International Journal of Scientific and Research Publications, Volume 10, Issue 1, January 2020 209
ISSN 2250-3153
http://dx.doi.org/10.29322/IJSRP.10.01.2020.p9733 www.ijsrp.org
The Process of Representation of Junior High School
Students’ in Solving Integers Word Problems
Annisah1, Masriyah2, Rooselyna Ekawati3
1,2,3 Faculty of Mathematics and Science, State University of Surabaya, Indonesia
DOI: 10.29322/IJSRP.10.01.2020.p9733
http://dx.doi.org/10.29322/IJSRP.10.01.2020.p9733
Abstract- Research has an intention to describe the process of a student’s representation who has a high, medium, and low ability in
solving integer word problems. The method used is qualitative. From 35 participants, three subjects are selected with each of them has
either high ability, medium ability, and low ability. The data is retrieved by using ‘ think aloud ' method. After that, the data will be
analyzed after the interview with the three selected students. The process of representation problem consists of problem translation
and problem integration. After going through the problem of representation, the problem-solution will take the role of external
representation of the students. The research result shows that the low-ability student described in a pictorial way with the incorrect
answer. Medium-ability students used schematic in problem-solving with the incorrect answer. And the high-ability student used both
pictorial and schematic in problem-solving with the correct answer. The students' answers are affected by the process of representation
so it’s possible to get either the correct answer and incorrect answer.
Index Terms- representation, integers, process
I. INTRODUCTION
Many students are afraid of math. Paradigm will be difficult to learn mathematics and will shadow creepy
math teacher who is always in the minds of students. Thus making the students rigid in following math.
Prediction will have difficulty in understanding mathematics students is the focus of teachers in mathematics
[1]. Many students who take lessons and solving mathematical problems in a way that has been presented by the
teacher without the use of a representation according to their own thoughts. Teachers should assign learning
strategies for the success of learning [2]. Set of learning objectives NCTM [3] students to understand
mathematical concepts and make the problem becomes easy to solve using the representation [4,5].
The representation consists of internal and external [6,7,8]. The internal representation is an image of the
student's image stored in the mind [7,9]. As with the external representation of something written that students
in the form of pictures, words or symbols [5,7,10].
Previous knowledge is required to build an internal representation of the students [7,10] and the
information he had received [10]. The internal representation is unique because of the formation are not
viewable by anyone else directly [7]. The representation shown is not the same students [11] and the students
can show multiple representations [8,11,12].
In resolving the issue is the process through which the students. The first problem of representation and
the second problem solution [13]. Translation problems consist of two phases: translation and integration [13].
Translational stages depend on the linguistic abilities of students, to understand the problem. [13] Stages of
integration depends on the interpretation of the students in the form of visual representation. [1,13]. A visual
representation of an advanced student is very important because it can determine the next step in solving the
problem of students [1]. In problem solution, students can use some representation [8,11,12] as a visual
representation [1,14,15,16,17] who have used students in the integration phase [13], verbal representations
(written words) symbolic representation ( mathematics expression) [8,11,12].

International Journal of Scientific and Research Publications, Volume 10, Issue 1, January 2020 210
ISSN 2250-3153
http://dx.doi.org/10.29322/IJSRP.10.01.2020.p9733 www.ijsrp.org
Researchers are particularly interested in the process of student representation. Because rarely examined
regarding student representation. Starting from the representation of problems and problem-solving.
Researchers chose the problem of word problems in the material integers. The integer is the basis used to
further understand the material such as algebra, arithmetic, etc. [18]. So if essentially not strong then to proceed
further material will also be difficult [18,19]. Students have difficulty in operating problems [14,15,16,19],
word problems [13,19] and producing a model of integers with [14,15,16,18,19].
This study reveals the process of representation of students in problem-solving word integers. How
students representation process of translation problems and the problems of integration. what are the
representations used by students in problem-solving? This study is aimed at students who have math skills
category is, low and high. So that raises the question of research, (1) how the representation of students with
problems of mathematical ability is low, medium, and high? (2) what kind of representation that students use
mathematics capable of the low, medium, and high in problem-solving?
II. THEORETICAL BACKGROUND
This study was motivated by previous research and current authors will further investigate the process of
representation for word problems on integers.
a. Representation of internal and external
The author describes the representation shown by the students to understand the problem and resolve the
issue so that it shows the students' answers. Comprising representation internal representation and external
representation [4,6,7,8] appearing in parallel without any replacement between the two. Internal representation
expresses the ideas in the minds of students [4.7], a part of mental activity [12], the image you have in mind. It's
hard to express the internal representation of students because other people can not catch someone with direct
internal representation.
External representation includes a visual representation that is used to solve the problem [1,14,15,16,17]
can be either (1) images (2) table or graph [1,7], (3) verbally expressed in writing using the phrase student or
orally [ 4,7,12]. Houses are represented by everyone in different ways. Internal representation works with the
knowledge of the house through the shadow of the real house. Some people imagine the house is not like a
house building, but imagine the room in the house. Internal representation may also appear as an imagined
harmonious relationship with residents who are in the house. External representation may appear with the words
'home', or to describe the representation of the object of building a home, or can also describing the building
complete with the garden. Or also can draw a plan of the room. It may be different for each individual. The
internal representation can only be understood by the subjects who experience the event itself unless he tells the
internal representation to others. However, the external representation can be felt or seen the senses themselves
or others.
The internal representation can only be accessed by the five senses themselves and can be understood by
others using external representation [4]. Others can understand the internal representation of a person if it is
delivered orally internal representation that he had. Teachers transfer knowledge using external representation
on the board, powerpoint slide, or other means. Students capture this information can then perform an internal
representation, then students using external representation to write in their book. It was revealed that the internal
representation can not be separated from the external representation. And the interaction between them in
understanding a problem [4,20].
b. The process of representation
Troubleshooting conducted to find the correct answer [21]. The problem is understood to find what the
problems were solved with the knowledge [1]. Math speaking, the operation can be done if it had been through

International Journal of Scientific and Research Publications, Volume 10, Issue 1, January 2020 211
ISSN 2250-3153
http://dx.doi.org/10.29322/IJSRP.10.01.2020.p9733 www.ijsrp.org
the mental process with the aim of solving the problem [1]. To resolve the issue is the process through which
(1) the problem of representation (2) problem solution [13,22]. Problem representation describes how students
understand the problem correctly to make a solution plan. When understanding the problem, visualizing a
reliable strategy to solve the problem correctly [22]. Problem representation is divided into two stages: (1) the
problem of translation, determine how to understand the problem by paraphrasing the problem using own words
that are easy to understand, (2)problem integration, making visuals to make it easier to understand the problem
correctly and make plans.
The picture presented by the students is categorized into two types (1) pictorial, produces images without
regard to the relationship between the components of the problem (2) schematics, producing images with
attention to relations with the components of the problem [22]. Students who only see the quantity of a problem
without considering the relationship that plays a role in solving the problem will produce pictorial images and
more not generate schematic
III. . METHODE
a. Research design
This study uses qualitative research types. The aim is to describe how the representation process occurs in middle
school students. A process referred to by the author are (1) the problem of representation (2) problem solution. Seeing the
resulting images include pictures of students whether pictorial or schematic.
b. Participant
This study involved junior high school students in Surabaya who volunteered to play a role. 35 junior high school
students participated in this study. Of the 35 students, the authors take each of the students with the ability level of high,
medium, and low was made as a research subject. So there are three subjects in this study.
In determining the student's ability level is high, medium or low, the author first gives a mathematical ability test
(TKM) to be able to classify in this category. Tests solving (TPM) are given after the students classified.
Students completing the TPM and solve problems according to their respective strategies. Researchers took the
data using the think aloud. By using think-aloud researchers can tell what he was thinking by students. So that researchers
know the internal representation of the external representation of the students then students write on paper. To obtain
more information, researchers conducted interviews.
Once the data is obtained, the researchers analyzed the data with three-phase (1) condensing the data, select the
data that is needed to be the focus and classify types of data obtained (2) data, (3) drawing conclusions, making
inferences from the data analyzed [23]
IV. RESULT
35 students who participate to do TKM, researchers took three subjects to see the process of
representation. The process of representation is described by the authors, as follows.
1.1. Subject SD with pictorial
Subject SD solving the problem by using pictorial and get the answer wrong. SD Subject belonging to the
mathematical ability of students is low.

International Journal of Scientific and Research Publications, Volume 10, Issue 1, January 2020 212
ISSN 2250-3153
http://dx.doi.org/10.29322/IJSRP.10.01.2020.p9733 www.ijsrp.org
Picture 1
SD Subject depicting trees and flower pots overall. At the stage of problem translation, the subject reads
the problem by looking at quantity and find the relationship that the 60-meter street trees will be installed with
the same distance. Researchers concluded the subject focused on the 60 m long road and would be planted with
trees and flower pots, but did not understands what to do for the next step.
P : after reading the questions, what do you think?
SD : road 60 m
P : is that all?
SD : there are trees and flower pots on the road
P : did you think of something else?
SD : no
SD wrote down what he understood the problem and rewrite the paper about what is known on the matter.
After understanding the matter, SD writes down the questions asked by the use of words.
P : what did you do after reading the question
SD : write down what is known and asked
To solve the problem, SD directly visualizes the tree that will be installed along the road and describe the
trees into paper. SD drew 10trees and some of them contained flower pots. As follows the conversation.
P : do you imagine anything?
SD : yes
P : what have you imagined?
SD : trees
P : is there anything else that you imagine?
SD : flower pots
P : is there anything else?
SD : No
P : do you describe what you imagine?
SD : yes, like this
With the quantity of 60 meters and the distance between the trees of 6 meters, SD directly divides 60 by 6
to get the answer 10 trees. Then SD illustrates pictorially without recalculating whether the answers he did by
drawing pictorial computationally are appropriate. To answer the distance between flowerpots installed between
two trees, SD answered correctly that is 2 meters. Two pots of flowers drawn SD represents the distance that
should be between two trees is 6 meters.
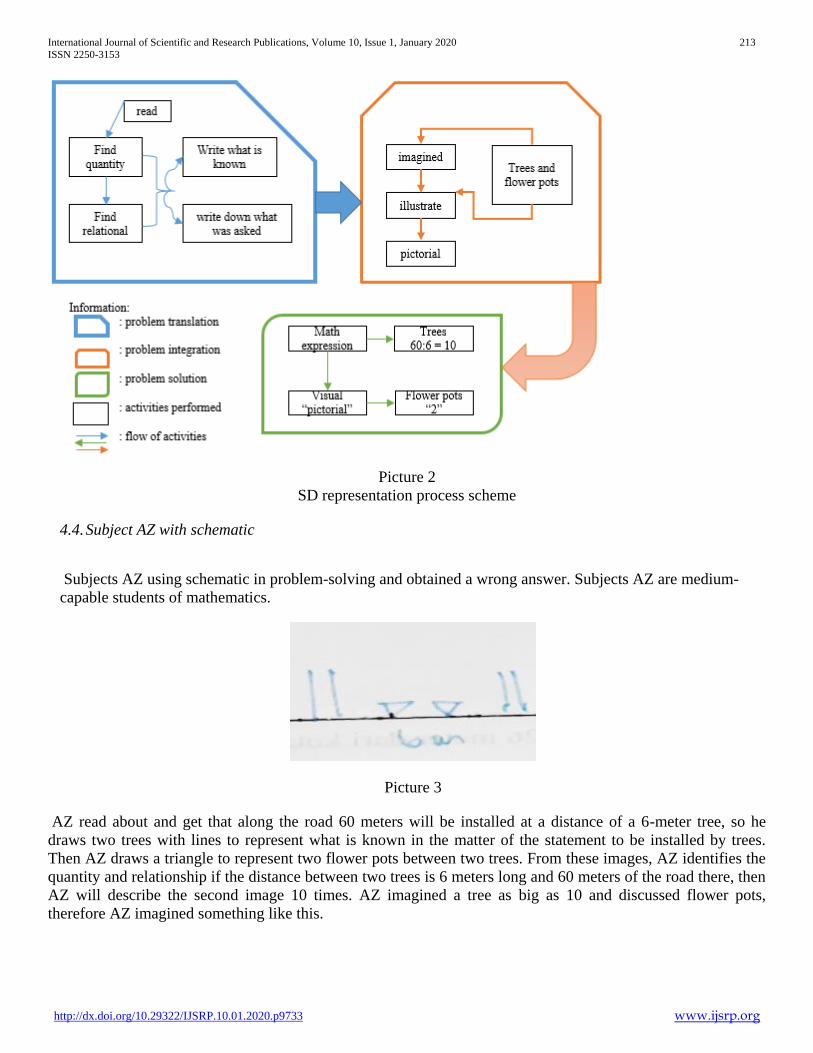
International Journal of Scientific and Research Publications, Volume 10, Issue 1, January 2020 213
ISSN 2250-3153
http://dx.doi.org/10.29322/IJSRP.10.01.2020.p9733 www.ijsrp.org
Picture 2
SD representation process scheme
4.4. Subject AZ with schematic
Subjects AZ using schematic in problem-solving and obtained a wrong answer. Subjects AZ are medium-
capable students of mathematics.
Picture 3
AZ read about and get that along the road 60 meters will be installed at a distance of a 6-meter tree, so he
draws two trees with lines to represent what is known in the matter of the statement to be installed by trees.
Then AZ draws a triangle to represent two flower pots between two trees. From these images, AZ identifies the
quantity and relationship if the distance between two trees is 6 meters long and 60 meters of the road there, then
AZ will describe the second image 10 times. AZ imagined a tree as big as 10 and discussed flower pots,
therefore AZ imagined something like this.

International Journal of Scientific and Research Publications, Volume 10, Issue 1, January 2020 214
ISSN 2250-3153
http://dx.doi.org/10.29322/IJSRP.10.01.2020.p9733 www.ijsrp.org
Picture 4
It is a pity it turns out that do AZ after knowing that there is 10 times the figure 2, AZ computing 60: 6 to
obtain answers to 10. AZ did not realize that that figure 2 only he repeated 9 times. AZ did not double-check
what he imagined about the image 2 will be 10 by the external representation of the image which he described
only 9 times, and computing which he did.
Picture 5
After AZ found that there were 10 trees, AZ calculates the distance between the trees as much as 9 and
multiplying it by 2 to get the flower pots installed is 18. To determine the distance between the flowerpot, AZ
calculates the distance between the flower pot by describing two trees as representative and describe triangle as
a representative of the flowerpot, shines the pictorial perform calculations using to get the distance between the
flower pot is 2 meters. He counted if the distance between the two pots of flowers are 2 meters he gets the
correct answer to the other components, namely the relationship between tree 6 meters distance. The following
is an illustration of the AZ representation process.
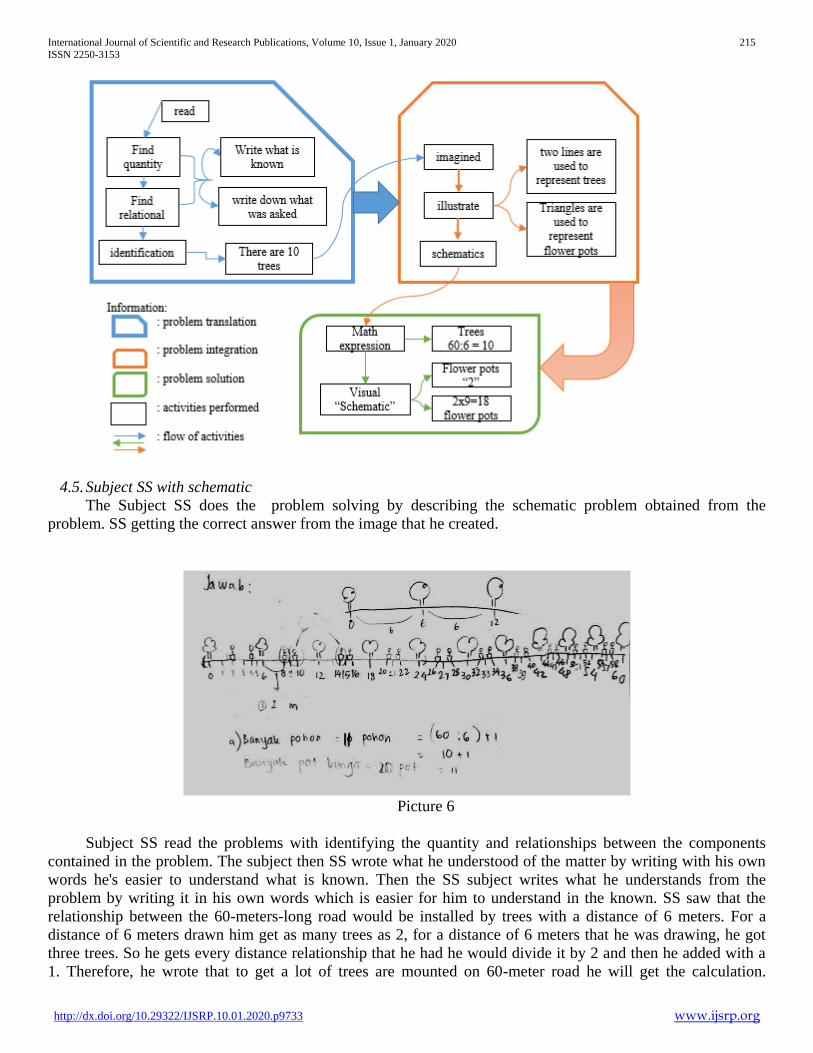
International Journal of Scientific and Research Publications, Volume 10, Issue 1, January 2020 215
ISSN 2250-3153
http://dx.doi.org/10.29322/IJSRP.10.01.2020.p9733 www.ijsrp.org
4.5. Subject SS with schematic
The Subject SS does the problem solving by describing the schematic problem obtained from the
problem. SS getting the correct answer from the image that he created.
Picture 6
Subject SS read the problems with identifying the quantity and relationships between the components
contained in the problem. The subject then SS wrote what he understood of the matter by writing with his own
words he's easier to understand what is known. Then the SS subject writes what he understands from the
problem by writing it in his own words which is easier for him to understand in the known. SS saw that the
relationship between the 60-meters-long road would be installed by trees with a distance of 6 meters. For a
distance of 6 meters drawn him get as many trees as 2, for a distance of 6 meters that he was drawing, he got
three trees. So he gets every distance relationship that he had he would divide it by 2 and then he added with a
1. Therefore, he wrote that to get a lot of trees are mounted on 60-meter road he will get the calculation.
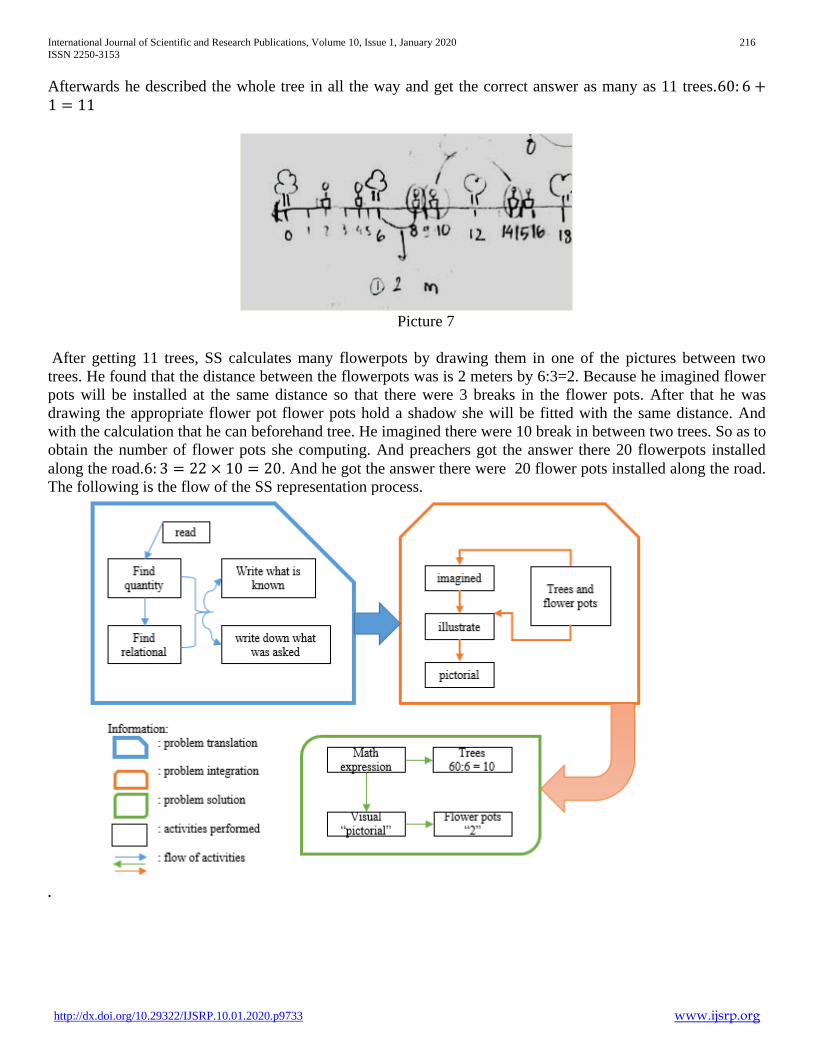
International Journal of Scientific and Research Publications, Volume 10, Issue 1, January 2020 216
ISSN 2250-3153
http://dx.doi.org/10.29322/IJSRP.10.01.2020.p9733 www.ijsrp.org
Afterwards he described the whole tree in all the way and get the correct answer as many as 11 trees.60: 6 +1 = 11
Picture 7
After getting 11 trees, SS calculates many flowerpots by drawing them in one of the pictures between two
trees. He found that the distance between the flowerpots was is 2 meters by 6:3=2. Because he imagined flower
pots will be installed at the same distance so that there were 3 breaks in the flower pots. After that he was
drawing the appropriate flower pot flower pots hold a shadow she will be fitted with the same distance. And
with the calculation that he can beforehand tree. He imagined there were 10 break in between two trees. So as to
obtain the number of flower pots she computing. And preachers got the answer there 20 flowerpots installed
along the road.6: 3 = 22 × 10 = 20. And he got the answer there were 20 flower pots installed along the road.
The following is the flow of the SS representation process.
.

International Journal of Scientific and Research Publications, Volume 10, Issue 1, January 2020 217
ISSN 2250-3153
http://dx.doi.org/10.29322/IJSRP.10.01.2020.p9733 www.ijsrp.org
V. CONCLUSION
From the representation process that students go through, students get external representation by the
internal representation he imagined. The resulting representation depends on the problem representation that it
goes through. Students will get the answers correctly if students not only see a problem form the quantity alone
but from the relationship of the components contained in the problem. These relationships are correctly
identified to produce the right schematic external representation and produce the right computation in getting
answers.
The resulting representation of students can be pictorial, schematic or a combination of pictorial and
schematic. Students check the answers of the results of the representation he has then compute the results of his
representation.
Low-ability students produce a rich pictorial and still not be able to use the schematic in problem-solving.
The resulting answer is still not quite right. Students are capable of being able to produce schematic but still
there is a misunderstanding between the representation that he produces in the shadows and external
representation, and computing in solving the problem. So there are still errors in getting the answers. High-
ability students can combine a pictorial and schematic to get the correct answer. High-ability students using the
internal representation and link the components and identify, prioritize what should he use to get the results of
the correct answer.
REFERENCES
Guler Gursel and Ciltas Alper 2011 The Visual Representation Usage Levels of Mathematics Teachers and
students in Solving Verbal Problems (Turkey: International Journal of Humanities and Social
Science) p 145-154
[2] Akyus Didem, Stephan, Michelle, and Dixon K Juli 2012 The Role of the Teacher in Supporting in
Understanding Integers (United States of America: Education and Science 2012 vol 37 no 163) p
268-269
[3] National Council of The Teachers of Mathematics (NCTM) 2000 Executive Summary: Principles and
Standards for School Mathematic
[4] Goldin Gerald A 2003 Representation in School Mathematics: A Unifying Research Perspective
(Newark: Research Gate)
[5] Goldin Gerald A and Kaput James 1996 A Joint Perspective on The Idea of Representation in Learning
and Doing Mathematics (Newark: Research Gate)
[6] Neria Dorit and Amit Miriam 2004 Student Preference of Non-Algebraic Representations in
Mathematical Communication (Proceeding of the 28th Conference of the International Group for the
Psychology of Mathematics Education 2004 vol 2 pp 409-416)
[7] Pape SJ and Thcoshanov Mourat 2001 The Role of Representations in Developing Mathematical
Understanding. (Research Gate)
[8] Hwang et al 2007 Multiple Representation Skill and Creativity Effects on Mathematical Problem Solving
using a Multimedia Whiteboard System (Educational Technology and Society) p 121-212
[9] Cuoco Albert A 2001 The Roles of Representation in School Mathematics (National Council of The
Teachers of Mathematics: 2001 Yearbook)
[10] Ott Natalie et al 2018 Multiple Symbolic Representations: The Combination of Formula and Text
Supports Problem Solving in The Mathematical Field of Propositional Logic (Germany: Elsevier)
Learning and Instruction
[11] Dreher Annika 2015 Dealing With Multiple Representation In The Mathematics Classroom: Teachers’
Views, Knowledge, and Their Noticing (Ludwigsburg: Dissertation)
[12] Adu and Gyamfi Kwaku 2003 External Multiple Representations in Mathematics Teaching (USA:
Thesis North Carolina State University)

International Journal of Scientific and Research Publications, Volume 10, Issue 1, January 2020 218
ISSN 2250-3153
http://dx.doi.org/10.29322/IJSRP.10.01.2020.p9733 www.ijsrp.org
[13] Krawec Jennifer Lee 2010 Problem Representation and Mathematical Problem Solving of Student of
Varying Math Ability (Miami: Open Access Dissertation)
[14] Wessman-Enzinger N M 2018 Grade 5 Children’s Drawings for Integer Addition and Subtraction Open
Number (United States: Elsevier)
[15] Hertel Joshua T and Wessman-Enzinger N M 2017 Examining Pinterest as a Curriculum Resource for
Negative Integers: An Initial Investigation (United States: Research Gate)
AUTHORS
First Author – Annisah, Faculty of Mathematics and Science, State University of Surabaya, Indonesia
Second Author – Masriyah, Faculty of Mathematics and Science, State University of Surabaya, Indonesia
Third Author – Rooselyna Ekawati, , Faculty of Mathematics and Science, State University of Surabaya, Indonesia
Correspondence Author – Annisah, [email protected], 082231146929.
International Journal of Scientific and Research Publications, Volume 10, Issue 1, January 2020 219
ISSN 2250-3153
http://dx.doi.org/10.29322/IJSRP.10.01.2020.p9734 www.ijsrp.org
Differences of Superoxide Dismutase (SOD) Enzyme
Levels Based on the Severity of Androgenetic Alopecia in
Men
Erty W.L Toruan*, Rointan Simanungkalit**, Ariyati Yosi**
*Post graduate of Dermatology and Venereology, Faculty of Medicine, Universitas Sumatera Utara, Medan, Indonesia
**Departement of Dermatology and Venereology, Faculty of Medicine, Universitas Sumatera Utara, Medan, Indonesia
DOI: 10.29322/IJSRP.10.01.2020.p9734 http://dx.doi.org/10.29322/IJSRP.10.01.2020.p9734
Abstract
Introduction: Androgenetic alopecia or male pattern hair loss is
a progressive hair loss caused by genetic and androgenic factors
in hair follicles with characteristic shortening of the anagen
phase, telogen phase elongation, and miniaturization of hair
follicles which causes the hair shaft to grow thinner in each
cycle. Enzyme Superoxide Dismutase (SOD) is one of the body's
antioxidant defense systems. Superoxide Dismutase is important
in almost all cells that are exposed to oxygen, decreased levels or
their activity can cause oxidative stress status of body cells
including hair keratinocytes. The severity of androgenetic
alopecia in men is classified on a Hamilton-Norwood scale
consisting of types I to VII.
Objective: To analyze differences of SOD enzyme levels based
on the severity of androgenetic alopecia in men.
Methods: This study was an observational analytic study with a
cross-sectional design involving 30 men with androgenetic
alopecia who was treated at Departement of Dermatology and
Venereology H. Adam Malik General Hospital Medan. The
severity of androgenetic alopecia of each participant was
classified into mild, moderate and severe based on Hamilton-
Norwood scale and we also performed examination of SOD
level.
Results: There was no significant difference in SOD enzyme
levels based on the severity of androgenetic alopecia in men.
Conclusion: Androgenetic alopecia is baldness which is
influenced by internal factors such as genetic and androgen, and
external factors such as microinflammation. SOD levels are
strongly related to the characteristics of each individual such as
aging and lifestyle.
index term: Alopecia androgenetica, severity, SOD, Hamilton-
Norwood scale
I.INTRODUCTION
Androgenetic alopecia or male pattern hair loss is a
common progressive hair loss caused by genetic and androgenic
factors in hair follicles. Its characteristics are similar in both
sexes characterized by shortening of the anagen phase,
elongation of the telogen phase, and miniaturization of hair
follicles which causes the hair shaft grow thinner in each cycle.1-
3
The severity of androgenetic alopecia in men is
classified with the Hamilton-Norwood scale consist of types I to
VII.1-3According to Colgecen E et al and Abbasi J et al, the
severity can be categorized into mild (I and II), moderate (IIA,
III, IIIA and IV), and severe (IVA, V, VA, VI and VII).4,5
The pathogenesis of androgenetic alopecia in men
influenced by androgen hormon and genetic factors.1,3
Microinflammation also plays a role in the pathogenesis of
androgenetic alopecia in which DHT will increase secretion of
interleukin (IL) -6 and also TGF-β1. Later it will influence
oxidative stress on dermal papilla cells and inhibits proliferation
of hair matrix epithelial. In addition, environmental factors such
as nutrition, metabolic syndrome, smoking and ultraviolet (UV)
radiation also play a role in the pathogenesis of androgenetic
alopecia.6 These environmental factors influence the occurrence
of oxidative stress which in turn causes an increase in free
radicals and reactive oxygen compounds in androgenetic
alopecia.6-8 Oxidative stress is a state of imbalance between the
production of free radicals or reactive oxygen compounds with
antioxidant defense systems in the body.7
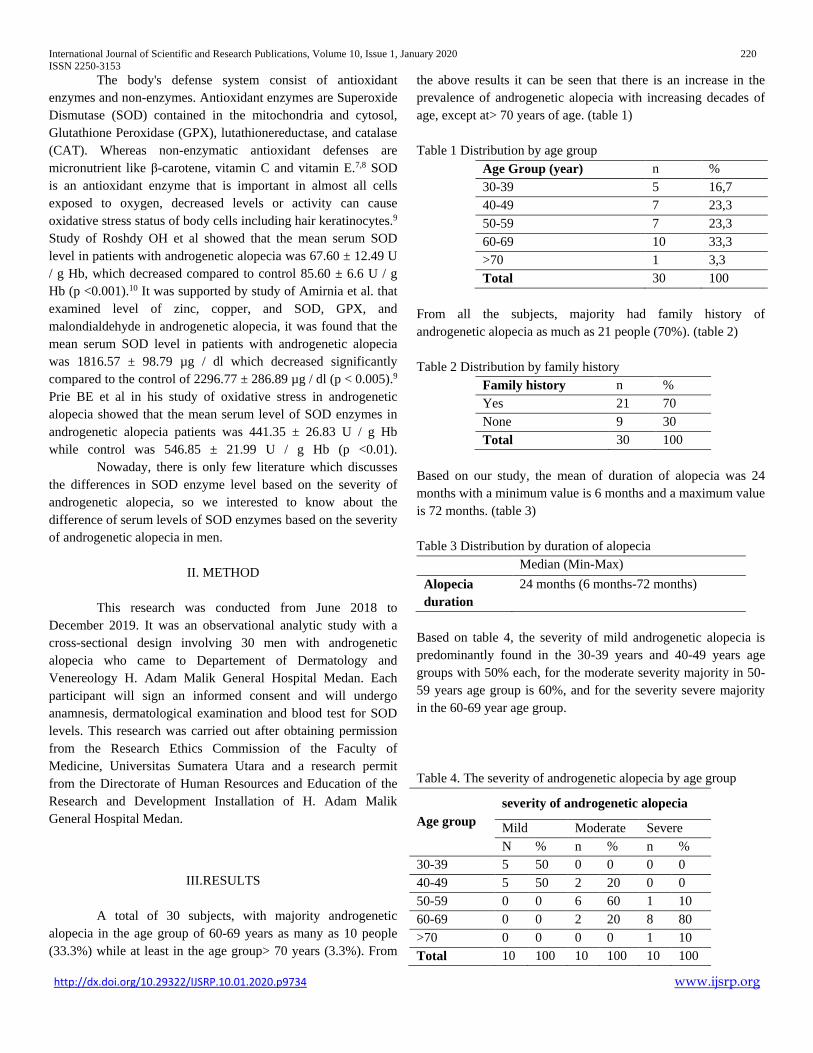
International Journal of Scientific and Research Publications, Volume 10, Issue 1, January 2020 220
ISSN 2250-3153
http://dx.doi.org/10.29322/IJSRP.10.01.2020.p9734 www.ijsrp.org
The body's defense system consist of antioxidant
enzymes and non-enzymes. Antioxidant enzymes are Superoxide
Dismutase (SOD) contained in the mitochondria and cytosol,
Glutathione Peroxidase (GPX), lutathionereductase, and catalase
(CAT). Whereas non-enzymatic antioxidant defenses are
micronutrient like β-carotene, vitamin C and vitamin E.7,8 SOD
is an antioxidant enzyme that is important in almost all cells
exposed to oxygen, decreased levels or activity can cause
oxidative stress status of body cells including hair keratinocytes.9
Study of Roshdy OH et al showed that the mean serum SOD
level in patients with androgenetic alopecia was 67.60 ± 12.49 U
/ g Hb, which decreased compared to control 85.60 ± 6.6 U / g
Hb (p <0.001).10 It was supported by study of Amirnia et al. that
examined level of zinc, copper, and SOD, GPX, and
malondialdehyde in androgenetic alopecia, it was found that the
mean serum SOD level in patients with androgenetic alopecia
was 1816.57 ± 98.79 µg / dl which decreased significantly
compared to the control of 2296.77 ± 286.89 µg / dl (p < 0.005).9
Prie BE et al in his study of oxidative stress in androgenetic
alopecia showed that the mean serum level of SOD enzymes in
androgenetic alopecia patients was 441.35 ± 26.83 U / g Hb
while control was 546.85 ± 21.99 U / g Hb (p <0.01).
Nowaday, there is only few literature which discusses
the differences in SOD enzyme level based on the severity of
androgenetic alopecia, so we interested to know about the
difference of serum levels of SOD enzymes based on the severity
of androgenetic alopecia in men.
II. METHOD
This research was conducted from June 2018 to
December 2019. It was an observational analytic study with a
cross-sectional design involving 30 men with androgenetic
alopecia who came to Departement of Dermatology and
Venereology H. Adam Malik General Hospital Medan. Each
participant will sign an informed consent and will undergo
anamnesis, dermatological examination and blood test for SOD
levels. This research was carried out after obtaining permission
from the Research Ethics Commission of the Faculty of
Medicine, Universitas Sumatera Utara and a research permit
from the Directorate of Human Resources and Education of the
Research and Development Installation of H. Adam Malik
General Hospital Medan.
III.RESULTS
A total of 30 subjects, with majority androgenetic
alopecia in the age group of 60-69 years as many as 10 people
(33.3%) while at least in the age group> 70 years (3.3%). From
the above results it can be seen that there is an increase in the
prevalence of androgenetic alopecia with increasing decades of
age, except at> 70 years of age. (table 1)
Table 1 Distribution by age group
Age Group (year) n %
30-39 5 16,7
40-49 7 23,3
50-59 7 23,3
60-69 10 33,3
>70 1 3,3
Total 30 100
From all the subjects, majority had family history of
androgenetic alopecia as much as 21 people (70%). (table 2)
Table 2 Distribution by family history
Family history n %
Yes 21 70
None 9 30
Total 30 100
Based on our study, the mean of duration of alopecia was 24
months with a minimum value is 6 months and a maximum value
is 72 months. (table 3)
Table 3 Distribution by duration of alopecia
Median (Min-Max)
Alopecia
duration
24 months (6 months-72 months)
Based on table 4, the severity of mild androgenetic alopecia is
predominantly found in the 30-39 years and 40-49 years age
groups with 50% each, for the moderate severity majority in 50-
59 years age group is 60%, and for the severity severe majority
in the 60-69 year age group.
Table 4. The severity of androgenetic alopecia by age group
Age group
severity of androgenetic alopecia
Mild Moderate Severe
N % n % n %
30-39 5 50 0 0 0 0
40-49 5 50 2 20 0 0
50-59 0 0 6 60 1 10
60-69 0 0 2 20 8 80
>70 0 0 0 0 1 10
Total 10 100 10 100 10 100

International Journal of Scientific and Research Publications, Volume 10, Issue 1, January 2020 221
ISSN 2250-3153
http://dx.doi.org/10.29322/IJSRP.10.01.2020.p9734 www.ijsrp.org
Based on table 5, participant with family history of alopecia,
90% had a moderate severity androgenetic alopecia, while study
subjects who had no family history, 60% had mild androgenetic
alopecia.
Table 5. The severity of androgenetic alopecia by family history
Family
history
Severity of androgenetic alopecia
Mild Moderate Severe
N % n % n %
Yes 4 40 9 90 8 80
None 6 60 1 10 2 20
Total 10 100 10 100 10 100
Based on table 6 it can be seen that the highest SOD enzyme
levels are at moderate androgenetic alopecia which is 106.51
(0.01-1054.80) U / L and the lowest level at severe androgenetic
alopecia is 24.61 (0.04-595.37) U / L. The results of the kruskal-
wallis test showed the value of p> 0.05 so, there was no
significant difference in SOD levels based on the severity of
androgenetic alopecia in men.
Table 6. The difference of SOD enzyme levels based on the
severity of androgenetic alopecia
Severity of
androgenetic
alopecia
Median (Min-
Max)
U/L
p*
Mild 35,89 (0,03-
401.92)
0,679
Moderate 106,51 (0,01-
1054.80)
Severe 24,61 (0,04-
595,37)
Based on table 7 it can be seen that the highest SOD enzyme
levels are in the 50-59 years age group which is 94.06 (0.01-
492.07) U / L while the lowest levels in the 40-49 years age
group are 9.22 (0 , 05-1054.80) U / L. The results of the kruskal-
wallis test p value> 0.05 so there was no significant difference in
SOD levels based on the age group of androgenetic alopecia in
men.
Table 7. Differences of SOD enzyme levels by age group
Age group
(years)
Median (Min-Max)
U/L p*
30-39 62,09 (0,03-113,52) 0,783
40-49 9,22 (0,05-1054,80)
50-59 94,06 (0,01-492,07)
60-69 49,82 (0,04-595,37)
>70 62,09
Based on table 8 it can be seen that SOD enzyme levels are
higher in men with a family history of alopecia that is 73.75
(0.02-1054.80) U / L. The results of the kruskal-wallis test
showed p values> 0.05, so there was no significant difference in
SOD levels based on a family history of androgenetic alopecia.
Table 8. Differences of SOD enzyme levels based on family
history
Family
history
Median (Min-Max)
U/L
p*
Yes 73,75 (0,02-1054,80) 0,402
None 9,22 (0,01-595,37)
IV.DISCUSSION
The increasing of androgenetic alopecia prevalence by
decades of age shows a connection between the aging and
microinflammatory processes in androgenetic alopecia. The
accumulation of oxidative stress in aging activates the
inflammatory pathway mediated by IL-1α, IL-6, IL-8, which
causes cellular damage to the hair's peripherals.11
Family history of alopecia has an important role in the onset of
androgenetic alopecia which genetic factors are considered has
role that greatly influences the occurrence of androgenetic
alopecia.The duration of androgenetic alopecia varies depending
on the onset. The onset of androgenetic alopecia usually begins
after puberty and before the age of 40.3 Study of Lee WS showed
there is a link between the history of alopecia in families with
early onset other than that the early onset of androgenetic
alopecia otherwise the early onset will increases the risk more
severe androgenetic alopecia.12
Family history of alopecia has an important role in the
onset of androgenetic alopecia. Genetic factors are considered as
a very influential role in the occurrence of androgenetic
alopecia.12 Polygenic inheritance patterns are considered
important in clinical phenotypes and an increased risk of the
number of family members affected by alopecia.13
According to this study there was no significant
difference in SOD levels based on the severity of androgenetic
alopecia in men. Roshdy et al's study showed there were
differences in SOD levels in androgenetic alopecia patients
compared to controls (67.60 ± 12.49 U / L and 85 ± 6.60 U / L (p
<0.05)).10 Armirnia et al also revealed the same, with a value of
1861.57 ± 98.79 U / L for patients with androgenetic alopecia
and 2290.77 ± 286.89 U / L for control (p <0.005).9 However,
many studies have revealed differences in SOD levels in each
degree of severity of alopecia androgenetics are very limited.
Theoritical, there is no significant differences in SOD
levels were found in each of the severity of androgenetic

International Journal of Scientific and Research Publications, Volume 10, Issue 1, January 2020 222
ISSN 2250-3153
http://dx.doi.org/10.29322/IJSRP.10.01.2020.p9734 www.ijsrp.org
alopecia, could be influenced by several things, like the presence
of oxidative stress factors that can originate from irritants,
pollution, and ultraviolet radiation. In addition, individual
lifestyles can also affect oxidative stress status such as exercise
habits, antioxidant supplementation, and smoking.14-16 The
results of this study can be influenced by several things,
especially the presence of oxidative stress factors that came from
irritants, pollution, and ultraviolet radiation. However, individual
lifestyles can also affect oxidative stress status such as exercise
habits, antioxidant supplementation, and smoking.15-16
V.CONCLUSIONS
Androgenetic alopecia is baldness which is influenced
by internal factors such as genetics and androgens, as well as
external factors such as microinflammation. Genetics play an
important role in the family's history of androgenetic alopecia.
Whereas the SOD level is highly related to the characteristics of
each individual such as aging and lifestyle.
VI. SUGGESTION
This research can be done with a larger sample size and
age distribution in each group that is similar and has no family
history, other than that by minimizing the presence of bias
factors such as smoking and the use of antioxidants.
REFERENCES
1. Otberg N, Shapiro J. Hair growth disorders. Dalam:
Goldsmith LA, Katz SI, Gilchrest BA, Paller AS, Leffell
DJ, Wolff K, editor. Fitzpatrick’s dermatology in general
medicine. Volume 1. Edisi kedelapan. New York: The
McGraw Hill Companies; 2012: 979-1008.
2. Messenger AG. Androgenetic alopecia. Dalam: McMichael
AJ, Hordinsky MK, editor. Hair and scalp diseases:
medical, surgical, and cosmetic treatments. New York:
Informa Healthcare; 2008: 107-18.
3. Arias-Santiago S, Buendía-Eisman A, Gutiérrez-Salmerón
MT, Serrano-Ortega S. Male androgenetic alopecia. Dalam:
Preedy VR, editor. Handbook of hair in health and disease.
Wageningen: Wageningen Academic Publishers; 2012: 99-
116.
4. Colgecen E, Ede H, Erkoc FM, Akyuz Y, Erbay A. The
relation of androgenetic alopecia severity with epicardial fat
thickness. Ann Dermatol. [Internet]. 2016 [Diakses pada
2018 Juni 22]; 28 (2): 205-10. Tersedia di:
http://dx.doi.org/10/5021/ad.2016.28.2.205
DOI:10/5021/ad.2016.28.2.205
5. Abbasi J, Abbasi M, Lee KC, Tan KC, Tan SE, et al. Cap
wearing and quality of life in patients with androgenetic
alopecia amongst Indian population. J Comm Pub Health
Nursing. 2017; 3 (2): 1-10
6. Rajput JR. Role of non androgenic factors in hair loss and
hair regrowth. J Cosmo Trichol. [Internet]. 2017 [Diakses
pada 2018 Juni 21]; 3(2): 118-22. Tersedia di:
https://www.omicsonline.org/open-access/role-of-non-
androgenic-factors-in-hair-loss-and-hair-regrowth-2471-
9323-1000118.pdf
7. Erdogan HK, Bulur I, Kocaturk E, Yildiz B, Saracoglu ZN,
Alatas O. The role of oxidative stress in early-onset
androgenetic alopecia. Journal of Cosmetic Dermatology.
2016; 0: 1-4.
8. Liguori I, Russo G, Curcio F, Bulli G, Aran L, et al.
Oxidative stress, aging, and disease. Dove Press Journal.
[Internet]. 2018 [Diakses pada 2018 Juni 21]; 13: 757-72.
Tersedia di: http://dx.doi.org/10.2147/CIA.S158513
DOI: 10.2147/CIA.S158513
9. Amirnia M, Sinafar S, Sinafar H, Nuri M. Assessment of
zinc and copper contents in scalp hair and serum and
superoxide dismutase, glutathione peroxidase and
malondialdehyde in serum of androgenetic alopecia and
alopecia areata patients. Life Science Journal. [Internet].
2013 [Diakses pada 2018 Juni 21]; 10(1): 204-9. Tersedia
di:
http://www.lifesciencesite.com/lsj/life1001/030_11559life10
01_204_209.pdf
10. Roshdy OH, Mohammad NS, Kamha ES, Omar M. Genetic
analysis of 5 α reductase type II enzyme in relation to
oxidative stress in cases of androgenetic alopecia in a
sample of egyptian population. Our Dermatol Online.
[Internet] 2013 [Diakses pada 2018 Juni 21]; 4(4): 468-74.
Tersedia di:
http://www.odermatol.com/odermatology/42013/5.Genetic-
RoshdyOH.pdf
11. Liguori I, Russo G, Curcio F, Bulli G, Aran L, et al.
Oxidative stress, aging, and disease. Dove Press Journal.
[Internet]. 2018 [Diakses pada 2018 Juni 21]; 13: 757-72.
Tersedia di: http://dx.doi.org/10.2147/CIA.S158513
DOI: 10.2147/CIA.S158513
12. Lee WS, Lee HJ. Characteristics of androgenetic alopecia in
Asian. Ann Dermatol. [Internet]. 2012 [Diakses pada 2018
Juni 19]; 24 (3): 243-52. Tersedia di:
http://dx.doi.org/10.5021/ad/2012.24.3.2443
DOI: 10.5021/ad/2012.24.3.2443
13. Rathnayake D, Sinclair R. Male androgenetic alopecia.
Informa J. [Internet] 2010 [Diakses pada 2019 Desember
11]; 11(8):1295-304. Tersedia di:
https://doi.org/10.1517/14656561003752730
14. Tang PH, Chia HP, Cheong LL, Koh D. A community
study of male androgenetic alopecia in Bishan, Singapore.

International Journal of Scientific and Research Publications, Volume 10, Issue 1, January 2020 223
ISSN 2250-3153
http://dx.doi.org/10.29322/IJSRP.10.01.2020.p9734 www.ijsrp.org
Singapore Med J. [Internet]. 2000 [Diakses pada 2018 Juni
19]; 41: 202-5.Tersedia di:
http://citeseerx.ist.psu.edu/viewdoc/download?doi=10.1.1.5
71.8614&rep=rep1&type=pdf
DOI: 10.1.1.571.8614
15. Legiawati L. Jenis kerontokan rambut dan kebotakan pasien
poliklinik kulit dan kelamin RSUPN DR. Cipto
Mangunkusumo tahun 2009-2011, Jakarta. MDVI.
[Internet]. 2013.[Diakses pada 2018 Juni 20]; 40(4): 159-
63. Tersedia di:
http://www.perdoski.or.id/doc/mdvi/fulltext/34/222/Artikel
_Asli_(2).pdf
16. Osborn, D. Inheritance of baldness. J Heredity. [Internet].
1916 [Diakses pada 2018 Juni 20]; 7, 347-355. Tersedia di:
https://doi.org/10.1093/oxfordjournals.jhered.a110746
DOI: 10.1093/oxfordjournals.jhered.a110746
International Journal of Scientific and Research Publications, Volume 10, Issue 1, January 2020 224
ISSN 2250-3153
http://dx.doi.org/10.29322/IJSRP.10.01.2020.p9735 www.ijsrp.org
Assessment of public awareness on e-waste
management: A case study of Kigali.
Nkusi REVOCATTE, Haochen ZHU, Uwabimfura JACKSON, Shyaka CHRISTOTHE,.
Tongji University
College of Environmental Science and Engineering.
DOI: 10.29322/IJSRP.10.01.2020.p9735
http://dx.doi.org/10.29322/IJSRP.10.01.2020.p9735
Abstract. E-waste generation in Kigali has significant increases as economic change, which means a lot of uses of ICT
equipment in different domains with high population willingness to use technological materials, the change of technology makes
loose of existing equipment value and increased waste electrical and electrical equipment. This study was carried out to determine
and comprehend the e-waste awareness and disposal practices among residents of Kigali city. The findings revealed that
consumer awareness in Kigali is generally fairly good but low. However, with regard to disposal methods, residents are not
informed about e-waste collection facilities, appropriate disposal methods, and electronic waste regulations. As a result, residents
most of them store their e-waste in homes and mix some e-waste generated with municipal solid waste, which ends up in
dumpsite which is not constructed in an environment protection manner. Respondents had a variety of environmental concerns,
but they did not know the consequences, as well as the disposal of electronic waste with municipal waste or stored in homes.
Keywords: environment consciousness; awareness; waste electrical and electronic equipment (WEEE); disposal ; dismantling.
1. INTRODUCTION
E-waste or waste electronic equipment (EEE), is defined as equipment dependent on electric currents or electromagnetic
fields to work properly, but also any for the generation, transfer, and measurement of such currents and fields, which is discarded
or have reached its end-of-life[1], but there is no standard definition, countries define e-waste with their definitions,
interpretations, and usage of the term “e-waste/WEEE[2]. These includes the following categories, temperature exchange
equipment, screens and monitors, lamps, large household appliances, small household appliances, IT and telecommunications
equipment discarded, missed some part, or reach their end-of-life[3].
Waste generated by EEEs is growing rapidly around the world[4], especially in developing countries, people are ready to
be transferred to the current trend and those who use more developed and improved technologies of electrical and electronic
equipment, make the large portion in degrading EEEs before its end-of-life and generate waste electrical and electronic equipment
and some transferred in low-class and middle-class income with no knowledge and facilities of e-waste management, example of
phones which is upgrade day to day and reduce end of life of phone, and resulting in rising of waste of phones[5].
The irresponsible management of waste electrical and electronic equipment has adverse environmental consequences,
in particular, because of the harmful content of devices, including high concentrations of hazardous substances such as
mercury (Hg), lead (Pb), cadmium (Cd ), hexavalent chromium (Cr), PVC and brominated flame retardants etc.. [6] and
contains several parts with different values in feature use that can second resources to manufacture the other needed materials,
the EEE's fractions; It contains more than 1,000 different substances in the "dangerous" and "non-dangerous" categories.
These include metal, metal, plastic, glass, wood and plate, print circuits, concrete and ceramics, rubber and other elements. e-
waste consists of 50% steel, followed by plastics (21%), non-metallic ferrous metals (13%) and other constituents. Ferrous
metals consist of copper and aluminium as well as precious metals such as silver, gold, platinum, and palladium[7,8].
The proper treatment of e-waste is vital; ecologically, socially and economically sustainable development for the future. Today,
electronic waste management includes formal and informal recycling sectors that attempt to deal with electronic waste, but on the
other hand, the informal sector has become part of an adequate economy and is involved in activities illegal. The activity
destroyed the environment. There is no national control[9].The formal process of e-waste recycling facilities it’s ethical and
reliable for environment sustainability, it is regal work with recycling standards begins with sorting, testing, refurbishment and
repair of received e-waste, component which can be reprocessed are disassembled and sometimes shredded and sorted by
automatic machines or manually[10].
This paper aims to investigate the awareness of the general public in Kigali/Rwanda, forces that leverage and downplay
the adoption of e-waste practices. We emphasize that the commitment to responsible waste management, such as recycling, is not
just about environmental awareness, positive environmental goals, or a global attitude towards technologies. Instead, it takes a
sense of personal effectiveness and social legality to take these steps to effectively involve people. A well understanding of the
impact of setting up professional recycling practices can provide valuable information for policy development and help identify
key points of contact that governments, businesses, and local initiatives can explore for a fight more effectively against
environmental pressures.

International Journal of Scientific and Research Publications, Volume 10, Issue 1, January 2020 225
ISSN 2250-3153
http://dx.doi.org/10.29322/IJSRP.10.01.2020.p9735 www.ijsrp.org
As far as the author knows, this is the first study on the public awareness of recycling electronic waste in Kigali /
Rwanda. Therefore, we first describe the background of e-waste in Kigali, illustrating the general numbers and public opinion on
solid waste issues to characterize this society. Then we review the literature to assess the potential forces that lead to facilitate
recycling and recognize the limitations and alternative readings of cumulative evidence. Given the lack of research in developing
societies like Kigali, we use as many lessons learned from research based on similar emerging contexts as possible.
2. BACKGROUND
2.1. e-waste in Rwanda
Rwanda is a country in Central Africa, the capital Kigali. Geographically, Kigali is located at 1°57′S 30°4′E. In 2012
[11], Kigali was 10.7% of the country's population, and Kigali is the largest city with 745,261 residents or more million persons
living in the well urban area. The garbage portion is about 70% of organic waste, about 13% of non-recycled / imported waste,
about 5% of plastics (plastic bottles), about 5% of packaging, 1% of metal and 1% of the waste of electrical and electronic
equipment and 1% of the hazardous waste. The average waste production is from 1800 to 2000 tons per day[12].
Rwanda faces major challenges in solid waste management[12]. The quantity of waste produced increases and most is
disposed of in inappropriate landfills, with negative consequences for the environment and health. Country waste management
legislation is implemented and existing efforts to recover and dispose of the waste are properly coordinated and promoted, but the
lack of suitable infrastructure rests a major challenge.
Kigali's demand for EEE has increased significantly due to overall economic development and transformation due to the
strong demand for various ICT tools as end-user equipment, the increases of EEEs for the side of human health and environment
protection needs further treatment strategies of waste from EEEs after end of life of the equipment, and this is very complicated
and due to the high price of e-waste collection, facilities are still needed, which can handle e-waste from different sources.
According to a survey conducted between November 2014 and January 2015, Rwanda’s imports of EEE increased fivefold. The
annual growth rate of EEE imports during 2010-2014 is estimated to be approximately 5.95% and had annual generation of 9 417
tons of e-waste; 7 677 tons (81.52%) were from individuals, 1,143 tons (12.14%) were from public institutions, and 597 tons
(6.34%) were from private institutions[13], the estimation per capita was 0.9kg/inh[14].
The political and legitimate framework for e-waste management in Rwanda was widely discussed and implemented in
2018, with specific descriptions; (1) National Health Policy - a framework policy for specific policies for the management of e-
waste; and (2) National electronic waste policy; The policy guidance and guidance for legal and regulatory tools apply to the
management of electronic waste, and (3) The Environmental Law approved by Parliament following the Producer Responsibility
Principles (Article 16 - Electronic waste management) provides a legal program of e-waste management. Legal obligations of
producers and other institutions, and (4) The Regulation on e-waste accepted by the governing board of the governing body
establishes the functions of the various actors, including producers and recyclers, with emphasis on maintenance and renewal and
minimum license requirements, as good as sanctions and penalties for violations[14]. However, these legal agreements are largely
unknown to consumers (households) and implementation between manufacturers and the informal sector is weak.
E-waste management still presents major challenges. 1) Low consumer awareness: the general public is less aware of the
environment, mostly about the challenges and management of e-waste. 2) Legislative and Regulatory Framework: no law obliges
consumers and producers to treat and properly recycle electronic waste or compensate the engaged parties. 3) Limited national
capacity: currently, the country's capacity to process e-waste is in its infancy and e-waste in developing countries is exacerbated
by dumping in the form of donations, second-hand goods or poor quality.
Therefore, it is vital to study the WEEE production model of households considered as an important source of WEEE
production. The author claims to be the first to study this questionnaire with topics such as awareness level, WEEE knowledge,
reasons for rejection, preferences and WEEE treatment methods. The purpose of this study is to assess the general public
awareness, disposal practices and the willingness to contribute to the management of WEEE at the domestic level, and then to
imply the results of international regulations and trends in the production of WEEE. This document also provides an opportunity
for the accumulation of scientific knowledge from a scientific perspective of developed countries then called for the promotion of
the political agenda in the WEEE management system, taking into account international development.
2.2. RWANDA ELECTRONIC WASTE MANAGEMENT INFRASTRUCTURE The government of Rwanda has set up a dismantling and recycling facility for e-waste which is in provision of helping
all e-waste generated in EAC, the dismantling facility has attracted private investment and are currently working in partnership
with Enviroserve Rwanda, a subsidiary of Recycling Powerhouse in the United Arab Emirates, in line with the PPP model, and
now enviroserve is working forward to sets up collection points/centers across the country[14].
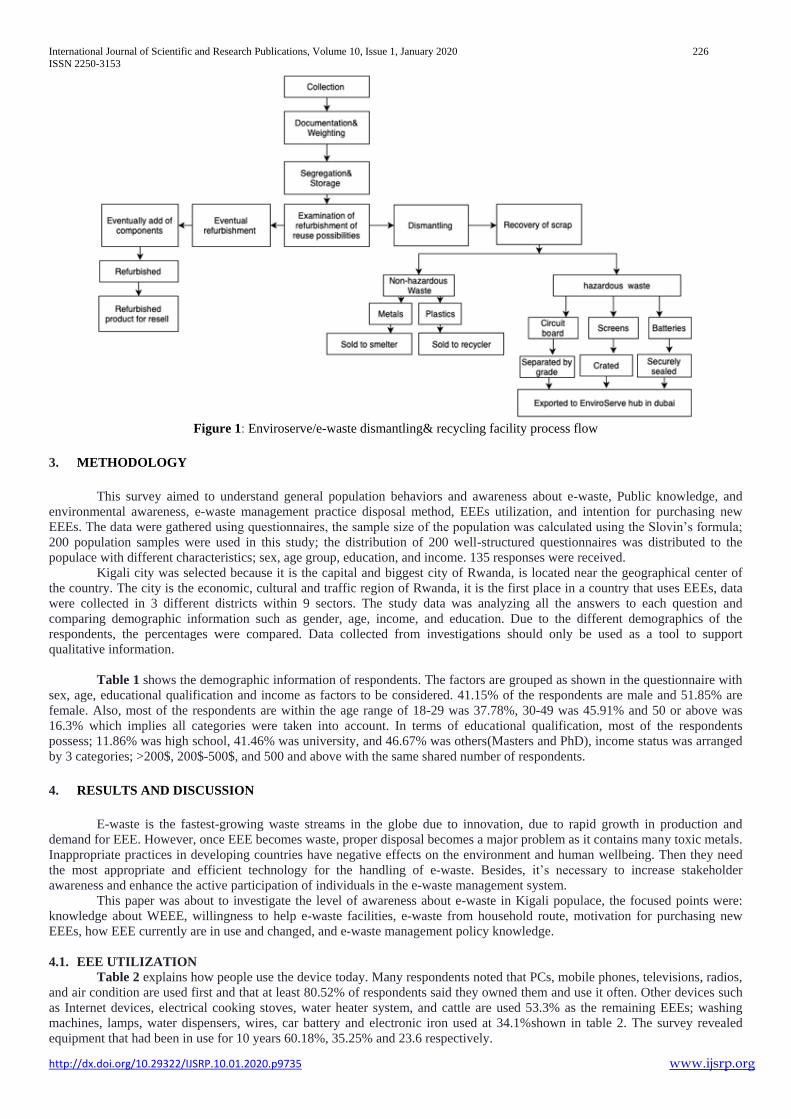
International Journal of Scientific and Research Publications, Volume 10, Issue 1, January 2020 226
ISSN 2250-3153
http://dx.doi.org/10.29322/IJSRP.10.01.2020.p9735 www.ijsrp.org
Figure 1: Enviroserve/e-waste dismantling& recycling facility process flow
3. METHODOLOGY
This survey aimed to understand general population behaviors and awareness about e-waste, Public knowledge, and
environmental awareness, e-waste management practice disposal method, EEEs utilization, and intention for purchasing new
EEEs. The data were gathered using questionnaires, the sample size of the population was calculated using the Slovin’s formula;
200 population samples were used in this study; the distribution of 200 well-structured questionnaires was distributed to the
populace with different characteristics; sex, age group, education, and income. 135 responses were received.
Kigali city was selected because it is the capital and biggest city of Rwanda, is located near the geographical center of
the country. The city is the economic, cultural and traffic region of Rwanda, it is the first place in a country that uses EEEs, data
were collected in 3 different districts within 9 sectors. The study data was analyzing all the answers to each question and
comparing demographic information such as gender, age, income, and education. Due to the different demographics of the
respondents, the percentages were compared. Data collected from investigations should only be used as a tool to support
qualitative information.
Table 1 shows the demographic information of respondents. The factors are grouped as shown in the questionnaire with
sex, age, educational qualification and income as factors to be considered. 41.15% of the respondents are male and 51.85% are
female. Also, most of the respondents are within the age range of 18-29 was 37.78%, 30-49 was 45.91% and 50 or above was
16.3% which implies all categories were taken into account. In terms of educational qualification, most of the respondents
possess; 11.86% was high school, 41.46% was university, and 46.67% was others(Masters and PhD), income status was arranged
by 3 categories; >200$, 200$-500$, and 500 and above with the same shared number of respondents.
4. RESULTS AND DISCUSSION
E-waste is the fastest-growing waste streams in the globe due to innovation, due to rapid growth in production and
demand for EEE. However, once EEE becomes waste, proper disposal becomes a major problem as it contains many toxic metals.
Inappropriate practices in developing countries have negative effects on the environment and human wellbeing. Then they need
the most appropriate and efficient technology for the handling of e-waste. Besides, it’s necessary to increase stakeholder
awareness and enhance the active participation of individuals in the e-waste management system.
This paper was about to investigate the level of awareness about e-waste in Kigali populace, the focused points were:
knowledge about WEEE, willingness to help e-waste facilities, e-waste from household route, motivation for purchasing new
EEEs, how EEE currently are in use and changed, and e-waste management policy knowledge.
4.1. EEE UTILIZATION Table 2 explains how people use the device today. Many respondents noted that PCs, mobile phones, televisions, radios,
and air condition are used first and that at least 80.52% of respondents said they owned them and use it often. Other devices such
as Internet devices, electrical cooking stoves, water heater system, and cattle are used 53.3% as the remaining EEEs; washing
machines, lamps, water dispensers, wires, car battery and electronic iron used at 34.1%shown in table 2. The survey revealed
equipment that had been in use for 10 years 60.18%, 35.25% and 23.6 respectively.
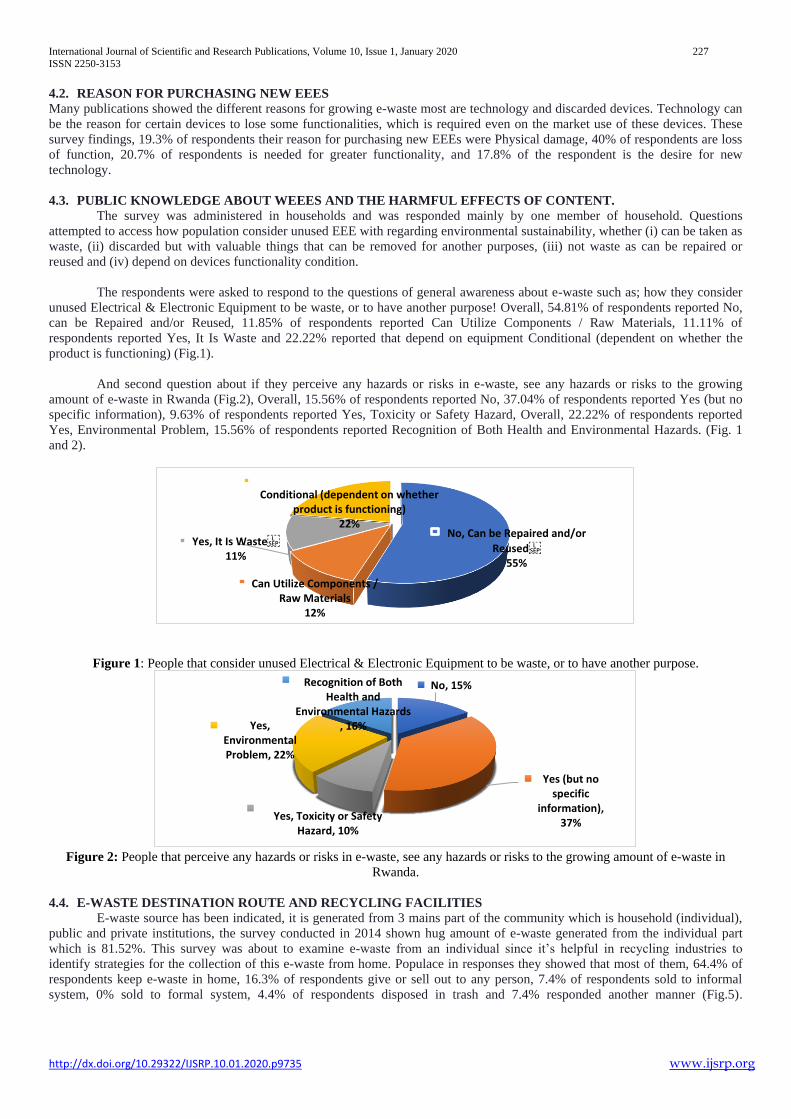
International Journal of Scientific and Research Publications, Volume 10, Issue 1, January 2020 227
ISSN 2250-3153
http://dx.doi.org/10.29322/IJSRP.10.01.2020.p9735 www.ijsrp.org
4.2. REASON FOR PURCHASING NEW EEES Many publications showed the different reasons for growing e-waste most are technology and discarded devices. Technology can
be the reason for certain devices to lose some functionalities, which is required even on the market use of these devices. These
survey findings, 19.3% of respondents their reason for purchasing new EEEs were Physical damage, 40% of respondents are loss
of function, 20.7% of respondents is needed for greater functionality, and 17.8% of the respondent is the desire for new
technology.
4.3. PUBLIC KNOWLEDGE ABOUT WEEES AND THE HARMFUL EFFECTS OF CONTENT.
The survey was administered in households and was responded mainly by one member of household. Questions
attempted to access how population consider unused EEE with regarding environmental sustainability, whether (i) can be taken as
waste, (ii) discarded but with valuable things that can be removed for another purposes, (iii) not waste as can be repaired or
reused and (iv) depend on devices functionality condition.
The respondents were asked to respond to the questions of general awareness about e-waste such as; how they consider
unused Electrical & Electronic Equipment to be waste, or to have another purpose! Overall, 54.81% of respondents reported No,
can be Repaired and/or Reused, 11.85% of respondents reported Can Utilize Components / Raw Materials, 11.11% of
respondents reported Yes, It Is Waste and 22.22% reported that depend on equipment Conditional (dependent on whether the
product is functioning) (Fig.1).
And second question about if they perceive any hazards or risks in e-waste, see any hazards or risks to the growing
amount of e-waste in Rwanda (Fig.2), Overall, 15.56% of respondents reported No, 37.04% of respondents reported Yes (but no
specific information), 9.63% of respondents reported Yes, Toxicity or Safety Hazard, Overall, 22.22% of respondents reported
Yes, Environmental Problem, 15.56% of respondents reported Recognition of Both Health and Environmental Hazards. (Fig. 1
and 2).
Figure 1: People that consider unused Electrical & Electronic Equipment to be waste, or to have another purpose.
Figure 2: People that perceive any hazards or risks in e-waste, see any hazards or risks to the growing amount of e-waste in
Rwanda.
4.4. E-WASTE DESTINATION ROUTE AND RECYCLING FACILITIES E-waste source has been indicated, it is generated from 3 mains part of the community which is household (individual),
public and private institutions, the survey conducted in 2014 shown hug amount of e-waste generated from the individual part
which is 81.52%. This survey was about to examine e-waste from an individual since it’s helpful in recycling industries to
identify strategies for the collection of this e-waste from home. Populace in responses they showed that most of them, 64.4% of
respondents keep e-waste in home, 16.3% of respondents give or sell out to any person, 7.4% of respondents sold to informal
system, 0% sold to formal system, 4.4% of respondents disposed in trash and 7.4% responded another manner (Fig.5).
No, Can be Repaired and/or
Reused55%
Can Utilize Components / Raw Materials
12%
Yes, It Is Waste11%
Conditional (dependent on whether product is functioning)
22%
No, 15%
Yes (but no specific
information), 37%
Yes, Toxicity or Safety Hazard, 10%
Yes, Environmental Problem, 22%
Recognition of Both Health and
Environmental Hazards , 16%
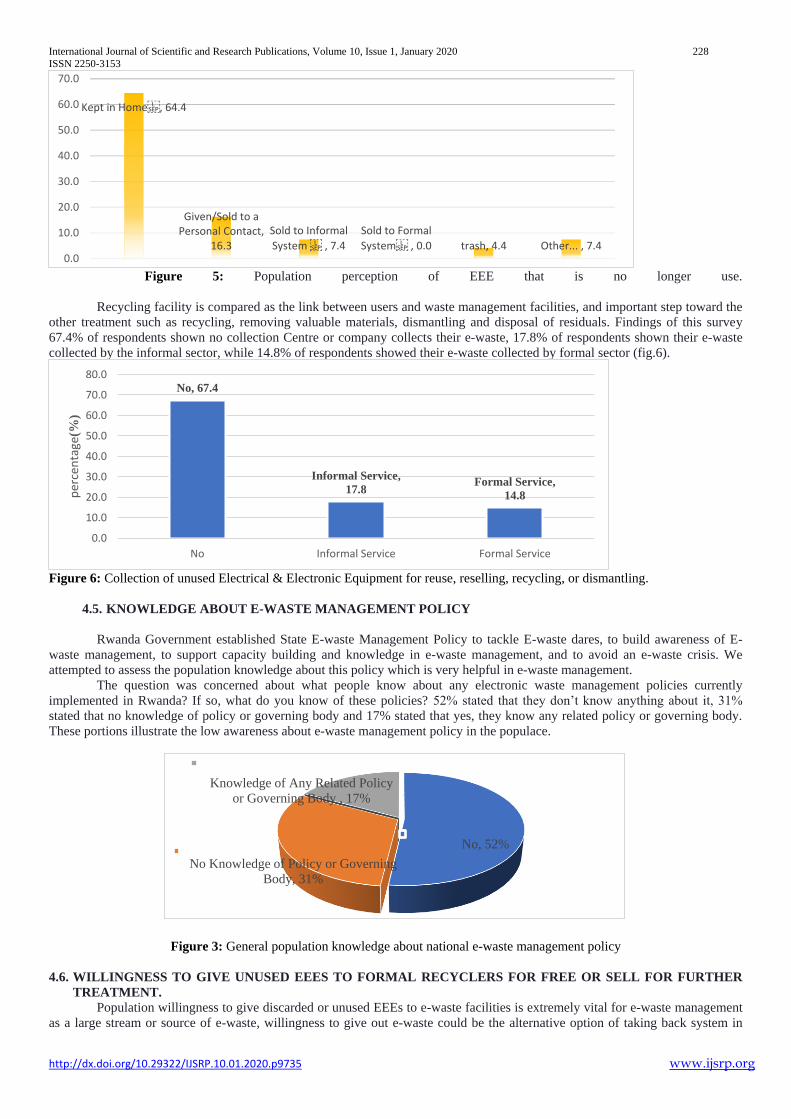
International Journal of Scientific and Research Publications, Volume 10, Issue 1, January 2020 228
ISSN 2250-3153
http://dx.doi.org/10.29322/IJSRP.10.01.2020.p9735 www.ijsrp.org
Figure 5: Population perception of EEE that is no longer use.
Recycling facility is compared as the link between users and waste management facilities, and important step toward the
other treatment such as recycling, removing valuable materials, dismantling and disposal of residuals. Findings of this survey
67.4% of respondents shown no collection Centre or company collects their e-waste, 17.8% of respondents shown their e-waste
collected by the informal sector, while 14.8% of respondents showed their e-waste collected by formal sector (fig.6).
Figure 6: Collection of unused Electrical & Electronic Equipment for reuse, reselling, recycling, or dismantling.
4.5. KNOWLEDGE ABOUT E-WASTE MANAGEMENT POLICY
Rwanda Government established State E-waste Management Policy to tackle E-waste dares, to build awareness of E-
waste management, to support capacity building and knowledge in e-waste management, and to avoid an e-waste crisis. We
attempted to assess the population knowledge about this policy which is very helpful in e-waste management.
The question was concerned about what people know about any electronic waste management policies currently
implemented in Rwanda? If so, what do you know of these policies? 52% stated that they don’t know anything about it, 31%
stated that no knowledge of policy or governing body and 17% stated that yes, they know any related policy or governing body.
These portions illustrate the low awareness about e-waste management policy in the populace.
Figure 3: General population knowledge about national e-waste management policy
4.6. WILLINGNESS TO GIVE UNUSED EEES TO FORMAL RECYCLERS FOR FREE OR SELL FOR FURTHER
TREATMENT.
Population willingness to give discarded or unused EEEs to e-waste facilities is extremely vital for e-waste management
as a large stream or source of e-waste, willingness to give out e-waste could be the alternative option of taking back system in
Kept in Home, 64.4
Given/Sold to a Personal Contact,
16.3
Sold to Informal
System , 7.4
Sold to Formal
System , 0.0 trash, 4.4 Other... , 7.40.0
10.0
20.0
30.0
40.0
50.0
60.0
70.0
No, 67.4
Informal Service,
17.8Formal Service,
14.8
0.0
10.0
20.0
30.0
40.0
50.0
60.0
70.0
80.0
No Informal Service Formal Service
per
cen
tage
(%)
No, 52%
No Knowledge of Policy or Governing
Body, 31%
Knowledge of Any Related Policy
or Governing Body , 17%
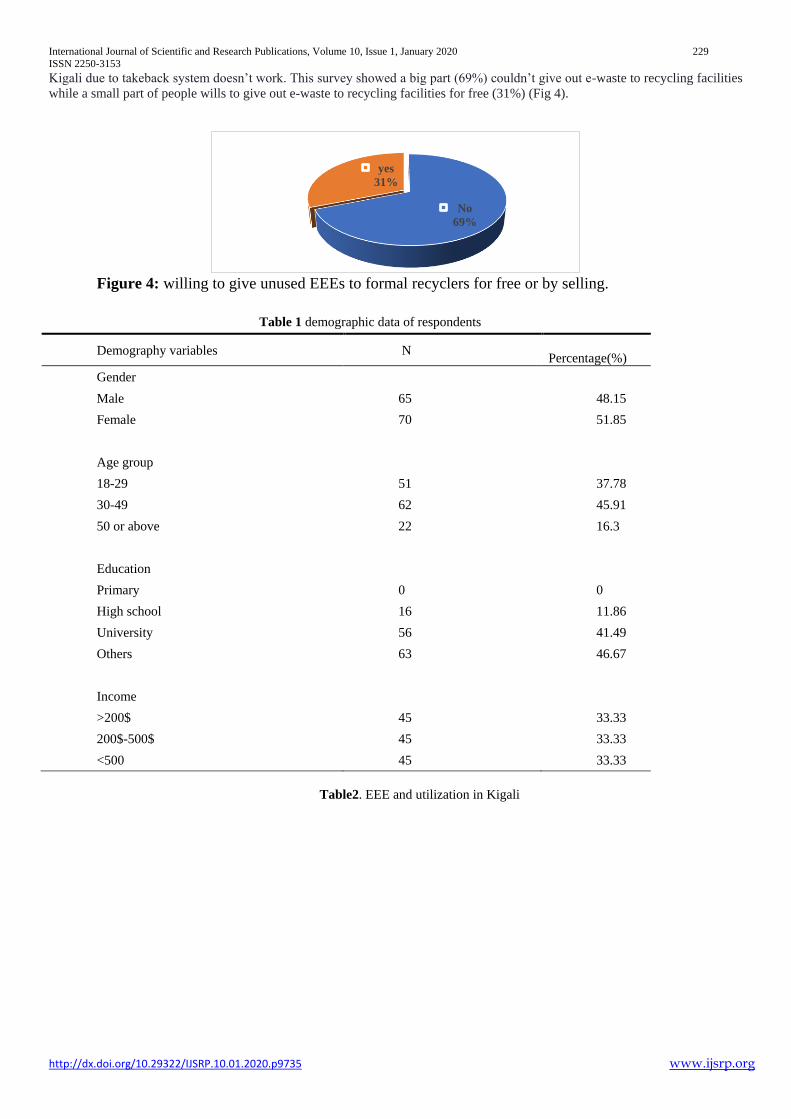
International Journal of Scientific and Research Publications, Volume 10, Issue 1, January 2020 229
ISSN 2250-3153
http://dx.doi.org/10.29322/IJSRP.10.01.2020.p9735 www.ijsrp.org
Kigali due to takeback system doesn’t work. This survey showed a big part (69%) couldn’t give out e-waste to recycling facilities
while a small part of people wills to give out e-waste to recycling facilities for free (31%) (Fig 4).
Figure 4: willing to give unused EEEs to formal recyclers for free or by selling.
Table 1 demographic data of respondents
Demography variables N
Percentage(%)
Gender
Male 65 48.15
Female 70 51.85
Age group
18-29 51 37.78
30-49 62 45.91
50 or above 22 16.3
Education
Primary 0 0
High school 16 11.86
University 56 41.49
Others 63 46.67
Income
>200$ 45 33.33
200$-500$ 45 33.33
<500 45 33.33
Table2. EEE and utilization in Kigali
No
69%
yes
31%
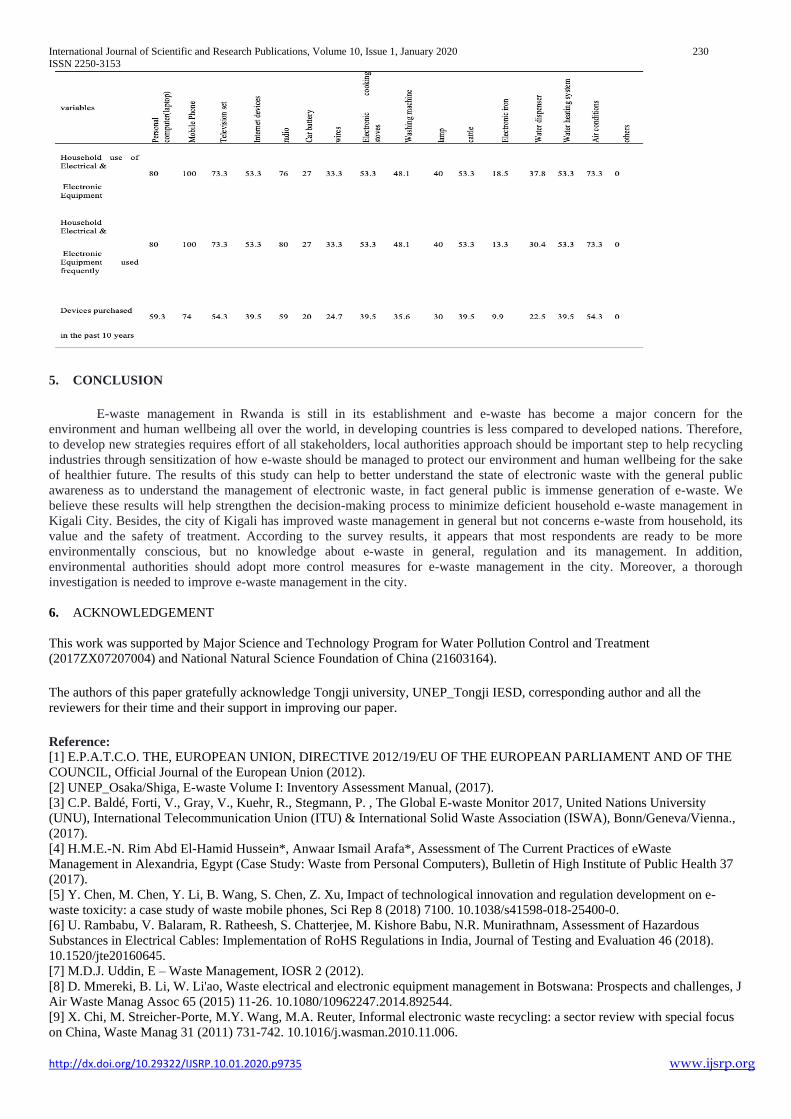
International Journal of Scientific and Research Publications, Volume 10, Issue 1, January 2020 230
ISSN 2250-3153
http://dx.doi.org/10.29322/IJSRP.10.01.2020.p9735 www.ijsrp.org
5. CONCLUSION
E-waste management in Rwanda is still in its establishment and e-waste has become a major concern for the
environment and human wellbeing all over the world, in developing countries is less compared to developed nations. Therefore,
to develop new strategies requires effort of all stakeholders, local authorities approach should be important step to help recycling
industries through sensitization of how e-waste should be managed to protect our environment and human wellbeing for the sake
of healthier future. The results of this study can help to better understand the state of electronic waste with the general public
awareness as to understand the management of electronic waste, in fact general public is immense generation of e-waste. We
believe these results will help strengthen the decision-making process to minimize deficient household e-waste management in
Kigali City. Besides, the city of Kigali has improved waste management in general but not concerns e-waste from household, its
value and the safety of treatment. According to the survey results, it appears that most respondents are ready to be more
environmentally conscious, but no knowledge about e-waste in general, regulation and its management. In addition,
environmental authorities should adopt more control measures for e-waste management in the city. Moreover, a thorough
investigation is needed to improve e-waste management in the city.
6. ACKNOWLEDGEMENT
This work was supported by Major Science and Technology Program for Water Pollution Control and Treatment
(2017ZX07207004) and National Natural Science Foundation of China (21603164).
The authors of this paper gratefully acknowledge Tongji university, UNEP_Tongji IESD, corresponding author and all the
reviewers for their time and their support in improving our paper.
Reference:
[1] E.P.A.T.C.O. THE, EUROPEAN UNION, DIRECTIVE 2012/19/EU OF THE EUROPEAN PARLIAMENT AND OF THE
COUNCIL, Official Journal of the European Union (2012).
[2] UNEP_Osaka/Shiga, E-waste Volume I: Inventory Assessment Manual, (2017).
[3] C.P. Baldé, Forti, V., Gray, V., Kuehr, R., Stegmann, P. , The Global E-waste Monitor 2017, United Nations University
(UNU), International Telecommunication Union (ITU) & International Solid Waste Association (ISWA), Bonn/Geneva/Vienna.,
(2017).
[4] H.M.E.-N. Rim Abd El-Hamid Hussein*, Anwaar Ismail Arafa*, Assessment of The Current Practices of eWaste
Management in Alexandria, Egypt (Case Study: Waste from Personal Computers), Bulletin of High Institute of Public Health 37
(2017).
[5] Y. Chen, M. Chen, Y. Li, B. Wang, S. Chen, Z. Xu, Impact of technological innovation and regulation development on e-
waste toxicity: a case study of waste mobile phones, Sci Rep 8 (2018) 7100. 10.1038/s41598-018-25400-0.
[6] U. Rambabu, V. Balaram, R. Ratheesh, S. Chatterjee, M. Kishore Babu, N.R. Munirathnam, Assessment of Hazardous
Substances in Electrical Cables: Implementation of RoHS Regulations in India, Journal of Testing and Evaluation 46 (2018).
10.1520/jte20160645.
[7] M.D.J. Uddin, E – Waste Management, IOSR 2 (2012).
[8] D. Mmereki, B. Li, W. Li'ao, Waste electrical and electronic equipment management in Botswana: Prospects and challenges, J
Air Waste Manag Assoc 65 (2015) 11-26. 10.1080/10962247.2014.892544.
[9] X. Chi, M. Streicher-Porte, M.Y. Wang, M.A. Reuter, Informal electronic waste recycling: a sector review with special focus
on China, Waste Manag 31 (2011) 731-742. 10.1016/j.wasman.2010.11.006.

International Journal of Scientific and Research Publications, Volume 10, Issue 1, January 2020 231
ISSN 2250-3153
http://dx.doi.org/10.29322/IJSRP.10.01.2020.p9735 www.ijsrp.org
[10] D.M. Ceballos, Z. Dong, The formal electronic recycling industry: Challenges and opportunities in occupational and
environmental health research, Environ Int 95 (2016) 157-166. 10.1016/j.envint.2016.07.010.
[11] R.E.M. Authority, State of Environment and Outlook Report 2017, (2017).
[12] D.N. Josephine Isugi, Research on Landfill and Composting Guidelines in Kigali City, Rwanda Based on China’s
Experience, International Proceedings of Chemical, Biological and Environmental Engineering (2016). 10.7763/ipcbee.
[13] R.O. RWANDA, National E-Waste Management Policy for Rwanda, (August 2016).
[14] O. MBERA, C.E. Rwanda, Opportunities in the Circular Economy of E-waste management Case of Rwanda, (2019).
AUTHORS
First Author – NKUSI Revocatte, Master candidate , Tongji University, UN Environment-Tongji Institute of Environment for
Sustainable Development (IESD): College of Environmental Science and Engineering; Email [email protected]; Phone No
+86 13817486124/+250 788249619; Address: 1239 Siping Road, Shanghai 200092, China
Second Author – Haochen ZHU, Mentor and Supervisor , Tongji University, UN Environment-Tongji Institute of Environment
for Sustainable Development (IESD): College of Environmental Science and Engineering: Email [email protected];
Phone No +86 13621945080; Address: 1239 Siping Road, Shanghai 200092, China
Third Author – Uwabimfura JACKSON, Master candidate , Tongji University, UN Environment-Tongji Institute of
Environment for Sustainable Development (IESD): College of Environmental Science and Engineering; Email: [email protected]; Phone No +86 15816798949: Address: 1239 Siping Road, Shanghai 200092, China
Fourth Author – Shyaka CHRISTOPHE, Master’s degree in accounting, Jiangsu University; Email
[email protected]; Phone No: +86 15605292083; Address: Zhenjiang/ Jiangsu, China.
Corresponding Author – Haochen ZHU, Mentor and Supervisor, Tongji University, UN Environment-Tongji Institute of
Environment for Sustainable Development (IESD): College of Environmental Science and Engineering: Email
[email protected]; Phone No +86 13621945080; Address: 1239 Siping Road, Shanghai 200092, China

International Journal of Scientific and Research Publications, Volume 10, Issue 1, January 2020 232
ISSN 2250-3153
http://dx.doi.org/10.29322/IJSRP.10.01.2020.p9736 www.ijsrp.org
Phytogeographic Distribution of Sorghum in Nigeria
Arinze JP. Chukwu and Ikechukwu O. Agbagwa
Department of Plant Science and Biotechnology, Faculty of Science, University of Port Harcourt
DOI: 10.29322/IJSRP.10.01.2020.p9736
http://dx.doi.org/10.29322/IJSRP.10.01.2020.p9736
Abstract- Sorghum cultivation and distribution in Nigeria spans
the entire North and Southern Region (Savannah and Rain Forest
Regions). Sorghum is generally not cultivated in the Southern
region hence its attribute of not thriving in the Southern regions of
Nigeria. Also, relegation of Sorghum to the S. bicolor is also
responsible for this assertion since wild species such as S.
arundinaceum, S. vogellianum, S. aethiopicum and S. vociflorum
are grow as weeds and abound in most localities in the South
except for the saline environment. Herbarium specimen review
and field data collection were adapted as tools to determine the
distribution of Sorghum in Nigeria. Results suggests that S.
arundinaceum is the most abundant species of Sorghum (in terms
of distribution) in Nigeria closely followed by S. vogelleianum
before S. bicolor. Field studies also accounted for localities where
Sorghum species exists but not recorded in the flora or herbarium
archives.
Index Terms- Sorghum, Forestry Herbarium Ibadan (FHI),
Morphology,
I. INTRODUCTION
orghum is a cereal crop that has over the years adapted to
Nigeria ecosystem whilst expressing varying forms of
characteristics both at morphological and molecular level.
Sorghum has capacity to withstand adverse environment which
confers it with a dynamic survival strategy that enables the plant
thrive in the diverse ecosystems (especially the dry regions) of the
world (Habindavyi, 2009). Sorghum is distribution spans the
entire tropic and arid regions of the world (Wang et al., 2015).
Some research works have also reported the occurrence of
Sorghum in the temperate regions as well as tropics with altitudes
of about 2.3 km (ICRISAT, 2012). Sorghum, grows in almost all
the ecological zones of Nigeria, however, it is predominantly
cultivated in the Northern part of Nigeria (House, 1985).
The top ten sorghum producing country in the world
account for about 71% of global Sorghum production (FAOSTAT,
2013) cultivated on 22.25 m ha (Reddy et al. 2011).
In Africa (particularly in Nigeria, Niger, Mali, Senegal,
Ghana and Burkina Faso), sorghum is cultivated in a large belt that
spreads from the Atlantic coast to Ethiopia and Somalia, bordering
the Sahara in the north and the equatorial forest to the south. West
Africa produces about 25% of the world’s sorghum. This figure
has continuously increased over the past 25 years (Wang et al.,
2015) at the rate of about 7%, due to release of improved varieties
and resistant species as well as improved agricultural practices
(CRP 3.6, 2012).
Nigeria ranks among the top seven major sorghum producer
with others as; India, USA, Mexico, Sudan, China and Argentina
(Wang et al., 2015). Similarly, in Africa countries like Burkina
Faso, Chad, Ethiopia, Gambia, Ghana, Mali, Mauritania,
Mozambique, Niger, Senegal, Somalia, Tanzania and Yemen also
contribute their own quota to global Sorghum production.
Literature Review
Sorghum is a C4 (uses an alternative method of CO2 uptake
leading to a C4 carbon cycle and reduction of losses due to photo-
respiration) plant having common ancestor with maize dating back
to about 15 million years ago (Thurber et al., 2013).
Sorghum is the fifth most important cereal crop grown
globally (Doggett, 2008) after wheat, maize, rice and barley.
Nigeria is the largest sorghum producer in West Africa and
accounts for over 71% of output from the region and over 35% of
the entire Africa as at 2007. Nigeria ranks third in terms of
sorghum production globally after USA and India (Mohammed et.
al., 2011). However, most (90%) of the sorghum produced by
USA and India are used for animal feed hence, making Nigeria the
highest producer of sorghum consumed by humans globally
(FAO, 2012).
Sorghum genus is made up of twenty (25) species (USDA
ARS, 2007), tough different researchers have reported varying
species numbers. Some authors classified the genus on the basis
of wild and cultivated forms while others based on morphology
(House et. al., 1995). The conflicting and diverse classification
from different researchers has resulted to dynamic taxonomic
characteristics of Sorghum which includes Garber who classified
the Sorghum genus into five taxonomic groups namely Eu-
Sorghum, Chaetosorghum, Heterosorghum , Para-Sorghum,
Stiposorghum (Garber, 1950).
Sorghum has the characteristics of a typical Poaceae and a
striking resemblance with Zea mays and Sacharrum sp. (Sally et
al., 2007) but the stem is thin relative to those of Zea mays.
Soghum height generally ranges from 0.5-6 m (Habindavyi, 2009)
with tillers and branching roots which are visible on its main axis.
Most taxonomy of Sorghum has been centered around the panicle
and grain colour (Harlan and de Wet, 1972). Doggett in his work
reported that domestication of sorghum started over 10,000 years
ago (Doggett, 1970). Similarly, Smith and Frederiksen reported
that anthropological evidence exists which suggests that as far
back as 800bc hunters gathered sorghum for use (Smith and
Frederiksen, 2000). Kimber reported that sorghum was first
domesticated in North Africa (Nile and Ethiopian regions) as
recently as 1000 BC (Kimber, 2000). Sorghum cultivation was
pivotal in the migration of Bantu (black) group of people across
sub-Saharan Africa (Diamond, 1998). Similarly, Ayana and
S
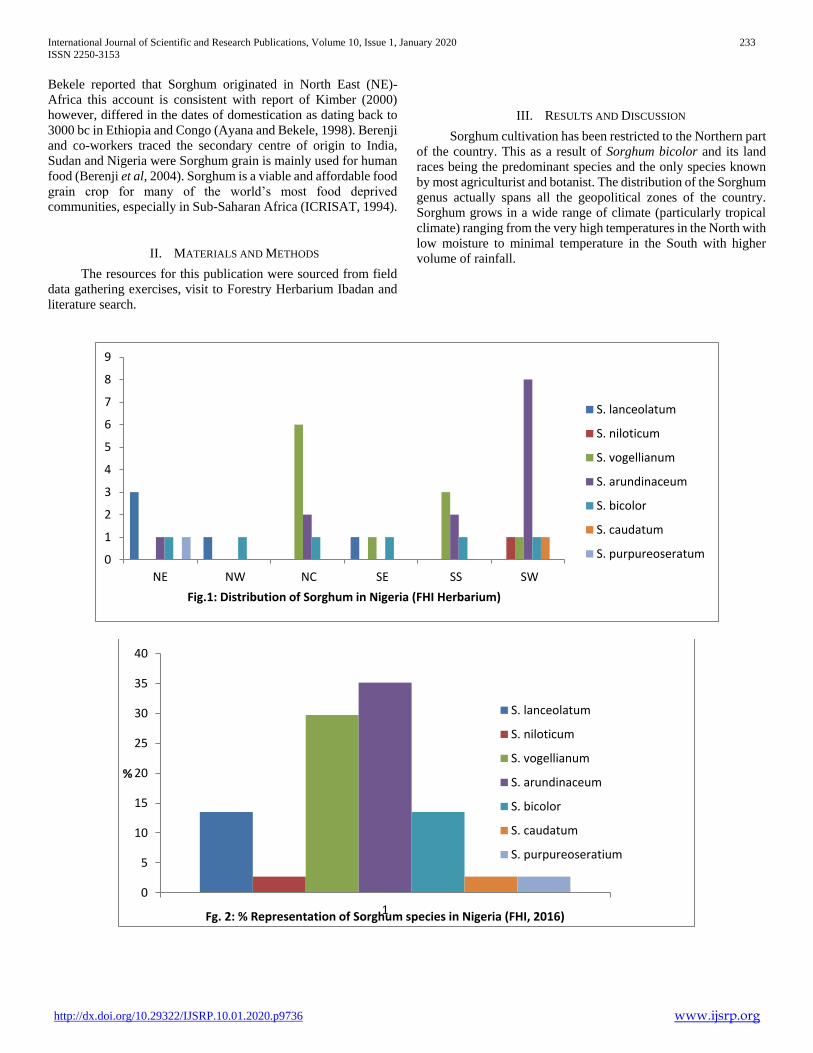
International Journal of Scientific and Research Publications, Volume 10, Issue 1, January 2020 233
ISSN 2250-3153
http://dx.doi.org/10.29322/IJSRP.10.01.2020.p9736 www.ijsrp.org
Bekele reported that Sorghum originated in North East (NE)-
Africa this account is consistent with report of Kimber (2000)
however, differed in the dates of domestication as dating back to
3000 bc in Ethiopia and Congo (Ayana and Bekele, 1998). Berenji
and co-workers traced the secondary centre of origin to India,
Sudan and Nigeria were Sorghum grain is mainly used for human
food (Berenji et al, 2004). Sorghum is a viable and affordable food
grain crop for many of the world’s most food deprived
communities, especially in Sub-Saharan Africa (ICRISAT, 1994).
II. MATERIALS AND METHODS
The resources for this publication were sourced from field
data gathering exercises, visit to Forestry Herbarium Ibadan and
literature search.
III. RESULTS AND DISCUSSION
Sorghum cultivation has been restricted to the Northern part
of the country. This as a result of Sorghum bicolor and its land
races being the predominant species and the only species known
by most agriculturist and botanist. The distribution of the Sorghum
genus actually spans all the geopolitical zones of the country.
Sorghum grows in a wide range of climate (particularly tropical
climate) ranging from the very high temperatures in the North with
low moisture to minimal temperature in the South with higher
volume of rainfall.
0
1
2
3
4
5
6
7
8
9
NE NW NC SE SS SW
Fig.1: Distribution of Sorghum in Nigeria (FHI Herbarium)
S. lanceolatum
S. niloticum
S. vogellianum
S. arundinaceum
S. bicolor
S. caudatum
S. purpureoseratum
0
5
10
15
20
25
30
35
40
1
%
Fg. 2: % Representation of Sorghum species in Nigeria (FHI, 2016)
S. lanceolatum
S. niloticum
S. vogellianum
S. arundinaceum
S. bicolor
S. caudatum
S. purpureoseratium
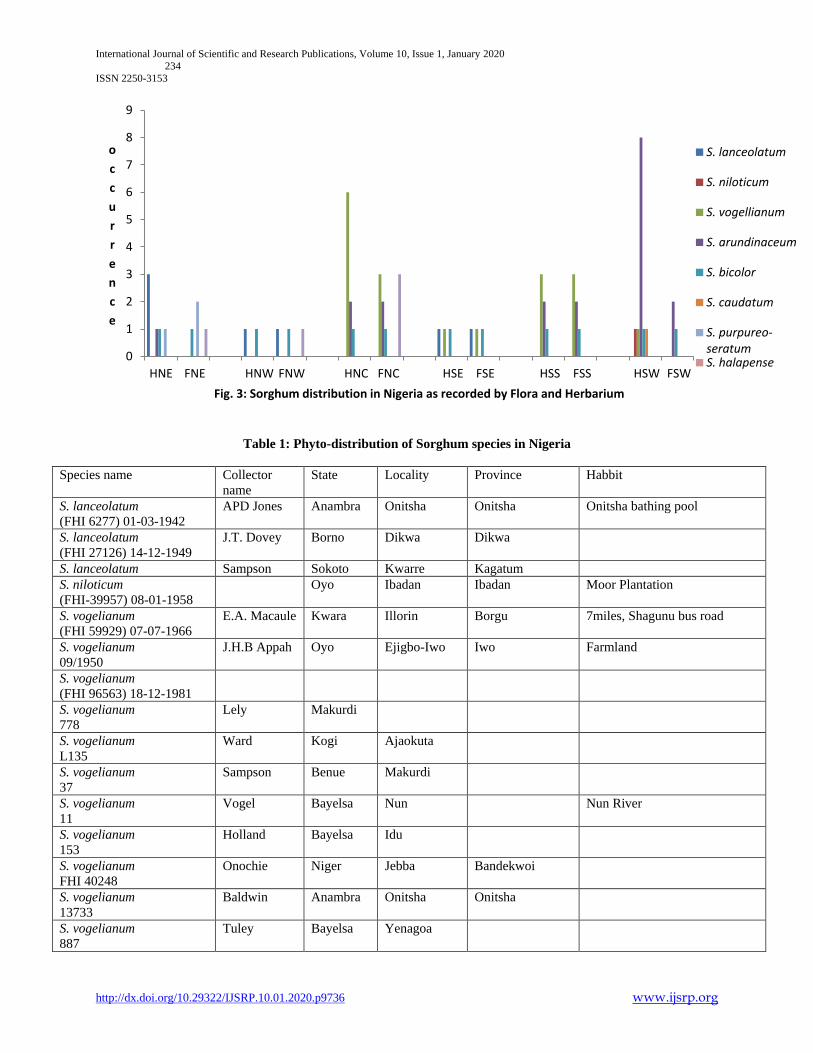
International Journal of Scientific and Research Publications, Volume 10, Issue 1, January 2020
234
ISSN 2250-3153
http://dx.doi.org/10.29322/IJSRP.10.01.2020.p9736 www.ijsrp.org
Table 1: Phyto-distribution of Sorghum species in Nigeria
Species name Collector
name
State Locality Province Habbit
S. lanceolatum
(FHI 6277) 01-03-1942
APD Jones Anambra Onitsha Onitsha Onitsha bathing pool
S. lanceolatum
(FHI 27126) 14-12-1949
J.T. Dovey Borno Dikwa Dikwa
S. lanceolatum Sampson Sokoto Kwarre Kagatum
S. niloticum
(FHI-39957) 08-01-1958
Oyo Ibadan Ibadan Moor Plantation
S. vogelianum
(FHI 59929) 07-07-1966
E.A. Macaule Kwara Illorin Borgu 7miles, Shagunu bus road
S. vogelianum
09/1950
J.H.B Appah Oyo Ejigbo-Iwo Iwo Farmland
S. vogelianum
(FHI 96563) 18-12-1981
S. vogelianum
778
Lely Makurdi
S. vogelianum
L135
Ward Kogi Ajaokuta
S. vogelianum
37
Sampson Benue Makurdi
S. vogelianum
11
Vogel Bayelsa Nun Nun River
S. vogelianum
153
Holland Bayelsa Idu
S. vogelianum
FHI 40248
Onochie Niger Jebba Bandekwoi
S. vogelianum
13733
Baldwin Anambra Onitsha Onitsha
S. vogelianum
887
Tuley Bayelsa Yenagoa
0
1
2
3
4
5
6
7
8
9
HNE FNE HNW FNW HNC FNC HSE FSE HSS FSS HSW FSW
o
c
c
u
r
r
e
n
c
e
Fig. 3: Sorghum distribution in Nigeria as recorded by Flora and Herbarium
S. lanceolatum
S. niloticum
S. vogellianum
S. arundinaceum
S. bicolor
S. caudatum
S. purpureo-seratumS. halapense

International Journal of Scientific and Research Publications, Volume 10, Issue 1, January 2020 235
ISSN 2250-3153
http://dx.doi.org/10.29322/IJSRP.10.01.2020.p9736 www.ijsrp.org
S. lanceolatum
(FHI 27157) 05-1956
W.D. Clayton Borno Wulge Ngala Riverine vegetation
S. arundinaceum
(FHI 69) 15-07-1974
Onyeachusim Ondo FUTA Akure
S. arundinaceum
Onyeachusim
Onijanowo
Ibhanesebhor
Ondo Idanre Akure
S. arundinaceum
(FHI 70652) 27-02-1975
Olorunfemi
and Pagbemi
Ekiti Ido, Igo Ekiti
S. arundinaceum
(FHI 38705)
Oyo Oyo Ibadan Forestry Hill
S. arundinaceum
1379
Barter Niger Nupe
S. arundinaceum
1713
De Leeuw Benue Katina Ala
S. arundinaceum
1322
Dalz. Lagos Lagos
S. arundinaceum
(FHI 7940)
Onochie Oyo Oke Ado Ibadan
S. arundinaceum
(FHI 8143)
Onochie Oyo Eruwa
S. arundinaceum
21
Maggs Edo Benin
S. arundinaceum
50
T. Vogel Bayelsa Nun Nun River
S. arundinaceum
(FHI 64974) 24-02-1972
P. Wit and
Fagbemi
Ogun Ogun River, 6
miles South
of Abeokuta
near Oba
Village
Abeokuta
Species name Collector name State Locality Province Habbit
S. arundinaceum
(FHI 93843)
Ekwuno and
Fagbemi
Borno Baga Baga Riverine area
S. arundinaceum
(FHI 53683)
S. arundinaceum Ohichi
S. bicolor
(FHI 10965)
Kwara Omuaran Omuaran Farmland
S. bicolor
(FHI 63819) 25-01-
1971
P.O. Ekwuno Lagos, Western State,
Midwest State, Rivers
State, East Central,
Southern State, Kwara
State, Northern State,
Delta State, North West
States
Bukana Bukana Streamside
S. bicolor
S. caudatum
(FHI 47514)
Oyo Ibadan Ibadan Roadside
S. lanceolatum
(FHI 27)
Borno Gumare Dikwa Fadama cotton soil
S. purpureo-sericeum Bauchi Magaji Magaji Clay soil
S. halapense
S. aethiopicum
N72
Johnston

International Journal of Scientific and Research Publications, Volume 10, Issue 1, January 2020 236
ISSN 2250-3153
http://dx.doi.org/10.29322/IJSRP.10.01.2020.p9736 www.ijsrp.org
S. aethiopicum
FHI 27155
Davey Tilum Rann
S. aethiopicum
FHI 27157
Davey Wulgo
IV. DISCUSSIONS
Contrary to the assertions that Sorghum thrives only in the
Northern part of Nigeria, current study suggests that the unpopular
nature of Sorghum in Southern Nigeria is associated with lack of
interest for the crop. Also, most research work are centred around
S. bicolor (cultivated Sorghum) which is not cultivated in
Southern Nigeria due to its unpopular nature, has fueled the
speculation that Sorghum does not thrive in the Southern part of
Nigeria. Also, another unempirical/unscientific assertion is that
rainfall duration is higher in the South. However, this is not true
as the plant has been adjudged to thrive in moisture levels of
between 100-600mm (Wang et al., 2015).
REFERENCES
[1] Aruna C (2014) High yielding sorghum cultivars for kharif. In: Chapke RR, Vinayagam SS, Patil JV (eds) Improved sorghum cultivation and value-addition perspectives. Directorate of Sorghum Research, Hyderabad, pp 89–93. ISBN 81-89335-50
[2] Aruna C, Audilakshmi S (2008) Reproductive biology and breeding behaviour of sorghum. In: Reddy Belum VS, Ramesh S, Ashok Kumar A, Gowda CLL (eds) Sorghum improvement in the new millennium. International Crops Research Institute for the Semi-Arid Tropics, Patancheru, pp 7–12
[3] Ayyangar GNR, Ponnaiya BWX (1937) The occurrence and inheritance of earheads with empty anther sacs in sorghum. Curr Sci 5:309
[4] Carter PR, Hicks DR, Oplinger ES, Doll JD, Bundy LG, Schuler RT, Holmes BJ (1989) Grain Sorghum (Milo). Alternative field crops manual. University of Wisconsin & University of Minnesota.
[5] Clayton WD (1961) Proposal to conserve the generic name Sorghum Moench (Gramineae) versus Sorghum Adans (Gramineae). Taxon 10:242
[6] Damania AB (2002) The Hindustan centre of origin of important plants. Asian Agri-Hist 6(4):333–341
[7] de Wet JMJ, Harlan JR, Price EG (1970) Origin of variability in the Spontanea complex of Sorghum bicolor. Am J Bot 57(6):704–707
[8] Doggett H (1970) Sorghum, Tropical agriculture series. Longman Scientific & Technical, London, 403 p
[9] Doggett H (1988) Utilization of grain sorghum. In: Sorghum (ed) Longman Scientific & Technical. Wiley/CBRS, New York
[10] FAO (2014) Statistical database, Food and Agriculture Organization of the United Nations, Rome. Accessed 1 Aug 2014
[11] Harlan JR (1972) Genetic resources in sorghum. In: Rao NGP, House LR (eds) Sorghum in seventies. Oxford & IBH, New Delhi, pp 1–13
[12] Harlan JR, de Wet JMJ (1972) A simplified classification of cultivated sorghum. Crop Sci 12(2):172–176
[13] House LR (1985) A guide to sorghum breeding, 2nd edn. ICRISAT, Patancheru, 206
AUTHORS
First Author – Arinze JP. Chukwu, Department of Plant Science
and Biotechnology, Faculty of Science, University of Port
Harcourt
Second Author – Ikechukwu O. Agbagwa, Department of Plant
Science and Biotechnology, Faculty of Science, University of
Port Harcourt

International Journal of Scientific and Research Publications, Volume 10, Issue 1, January 2020 237
ISSN 2250-3153
http://dx.doi.org/10.29322/IJSRP.10.01.2020.p9737 www.ijsrp.org
Strategic and tactical level decision making styles
and their impact on the company performance: A study
in private sector apparel manufacturing firms in Sri
Lanka
Nadeeja Dodamgoda, Furkan Ziyard
Imperial Institute of Higher Education, Colombo, Sri Lanka, Validated Center of University of Wales
DOI: 10.29322/IJSRP.10.01.2020.p9737
http://dx.doi.org/10.29322/IJSRP.10.01.2020.p9737
Abstract- The apparel industry in Sri Lanka is reputed worldwide for producing top quality fashion apparel and
trusted by the most reputed, iconic global fashion brands. While being a key contributor towards the Gross Domestic Product of the
country it is also the largest foreign income generator to the Sri Lankan economy. Effective organizational decision making process
plays a pivotal role in determining the successful performance of organizations in the competitive market today.
The objective of this study is to determine the impact of decision making styles adopted at the strategic and tactical
levels of private sector apparel manufacturing companies in Sri Lanka on the performance of the organization.
As the study explores a behavioural aspect of decision makers, an Inductive approach was followed and the research
was conducted as an Exploratory Study. The study was conducted with a sample of ten large companies operating in the private sector
apparel manufacturing industry in Sri Lanka with a workforce over two thousand employees. One individual in strategic or tactical
level of decision making was selected from each company to conduct an interview on decision making styles adopted and their impact
on the performance of the company. A structured questionnaire was administered to ten individuals selected across the value chain of
each company. The data collected through the questionnaire has been quantitatively analysed and the interview findings are
qualitatively analysed through thematic analysis. Hence the researcher has adopted mixed methods in data collection and analysis.
Findings revealed that, companies do not restrict themselves to one decision making approach for their business
decisions. Depending on the nature of the decision, its importance, the time constrains involved and the impact that is being exerted
on the company performance, companies use a combination of decision making approaches including data driven decision making,
intuition based and spontaneous decisions. Research findings strongly suggest that in all the above decision making circumstances
group decision making plays a strong moderating role.
Index Terms- Decision making styles, Group think, Company performance, Triple bottom line, Apparel
manufacturing companies
1. INTRODUCTION
Effective organizational decision making process plays a pivotal role in determining the successful performance of an
organization. In view of the dynamic business environment, and competitive challenges faced by modern business entities it is
important for organizations to adopt an effective decision making approach in order to be competitive and to capitalize on the market
potentials.
In view of the above changes in business context, decision makers could adopt a conventional approach for decisions
where the decisions are largely based on experience and intuition or rather the gut feel of the decision maker. On the other hand,
decision makers also could use a fact based approach to support their decision where data, information and analytics would come in to
play. Organizations would choose to base their decisions largely on data and analytics driven approach or in certain cases depend on
intuition. While these two approaches have different degrees of success rates, both are widely accepted to be practical means of
decision making for enhanced performance in organizations.
However it is a stressing question for such organizations to find out whether the effort that the company has put in to develop a data
driven decision making culture has in turn supported towards the performance of the company and gear the company to face
dynamism of the business effectively. Alternatively, whether intuition based decisions that are driven by gut feel and personal
experiences have brought in better performance to the company and made organizations sufficiently equipped to face business
dynamism. This would be one key stressing factor organizational stakeholders and strategic decision makers will be interested in
knowing in order to support the specific form of decision making or to identify an ideal blend factual based and intuition driven
approaches when faced with a corporate decision.

International Journal of Scientific and Research Publications, Volume 10, Issue 1, January 2020 238
ISSN 2250-3153
http://dx.doi.org/10.29322/IJSRP.10.01.2020.p9737 www.ijsrp.org
The Apparel Industry in Sri Lanka has enjoyed epic growth levels over the past four decades and is today Sri Lanka’s primary
foreign exchange earner accounting to 40% of the total exports and 52% of industrial products exports [1]. This industry, entirely
privately owned has successfully exploited the opportunities in the international market.
The decision making approaches adopted by private sector apparel companies in Sri Lanka for their strategic and tactical decisions
will be a key aspect in determining the retention of the competitive position in the industry. The Impact on the performance of these
companies as a direct result of the decision making approach will provide a significant insight in the subject of decision making.
Further, this could be used to extrapolate the findings for other corporates and provide an avenue for further research in the subject of
decision science.
In view of the above evidence it is notable that corporates use different degrees of data and intuition for decision making
process at different management levels. Hence the companies have experienced various levels of outcomes as a result of the practice
adopted. It is also apparent that organizations are working towards establishing a data driven culture and use information and
communication technologies to support its decisions. However, the intuition aspect of the decision is also a significant driver when
confronted with a decision requirement.
The aim of this research is to find the decision making styles adopted at the strategic and tactical levels of private sector
apparel manufacturing companies in Sri Lanka and the impact made by the decision making styles on the performance of such
companies.
2. REVIEW OF LITERATURE
2.1 Theories and Models on Decision-Making
2.1.1 General Decision-Making Styles (GDMS)
A large body of knowledge has been developed over the years on individual decision making styles. Scott and Bruce (1995) [2], being
pioneers in the area of research on individual decision making styles identified, five decision making styles categorized based on
individual behaviours. The five styles identified by extensive data analysis and validation across multiple samples were rational style,
intuitive style, avoidant style, spontaneous style and dependent style. Rational style was found to be adopted by individuals with
orientations on internal controls while dependent style was preferred by those with an external orientation. Avoidance decision-
making style would portray individuals with lack of confidence in the decision-making ability. The intuitive decision-makers rely on
gut feeling and proficiency on the decision being correct. Amount of time devoted in decision making was a key concern of
spontaneous decision makers.
2.1.2 Decision Style Theory
Model for decision making styles introduced by Rowe and Boulgarides (1992) [3] focus on the cognitive and behavioural aspects of
decision-makers. This theory yields four decision-making styles: directive, analytical, conceptual, and behavioural. Directive style
(Low ambiguity tolerance Task focus) is associated with individuals who inherit an autocratic leadership personality and seeks more
power in a situation. Individuals with such personality characteristics rely mostly on their intuition and gut feel. Analytical style (High
ambiguity tolerance, Task focus) is preferred by individuals who are analytical minded and seek additional information to consider
possible alternatives when making a decision. Such decision makers present thorough, detailed and comprehensive information and
tend to produce novel reasoning. Individuals who follow Conceptual style (High ambiguity tolerance, Social focus) are creative and
exploratory and possess novel habits. They are also comfortable in taking risks. They believe in their own opinions and intuition and
also revolve upon opinions of others to have a broader vision and analyse different possibilities associated in a given decision
situation. Behavioral decision makers(Low ambiguity tolerance, Social focus) rely on explicit information developed based on
opinions of others and implicit information gathered during social interactions. They focus on social aspects, welfare and feelings and
make decisions based on their emotions and intuitions.
2.1.3 The Rational Decision-Making Model
Robbins and Coulter’s (2002) [4]rational decision-making model defines six-steps when approaching rational decision. The steps are:
1. Defining the problem clearly and accurately
2. Identifying the criterion by which to make the decision
3. Prioritize and allocating weights to the decision criteria accordingly
4. Develop alternative solutions that resolve the issue to on the table
5. Analyze and evaluate each alternative critically using the weighted decision criteria
6. Select the optimal alternative with the highest score using the weightages
Russ, McNeilly & Comer (1996) [5] assumed that rational decision making leads to higher quality decisions, whereas intuitive and
spontaneous decision-making would lead to lower quality decisions, dependent decision making being participative would make
positive contributions and avoidant decision making would have a negative impact on performance. They obtained that intuitive,
dependent and spontaneous decision-making styles have no effect, rational style has positive and avoidant style has a negative impact

International Journal of Scientific and Research Publications, Volume 10, Issue 1, January 2020 239
ISSN 2250-3153
http://dx.doi.org/10.29322/IJSRP.10.01.2020.p9737 www.ijsrp.org
on performance. Moreover, they found that the high performing managers show more of transactional and transformational leadership
while low performers are more avoidant and less rational in their decision-making approaches.
2.1.4 Data Driven Decision Making (DDDM) Model
A considerable amount of information is required for an organization to frame their way to achieve its organizational goals. Decisions
based on limited information are not an effective mechanism, and such decisions will consequently be reflected negatively on their
performance [6]. It is under such circumstances that a Data Driven Decision-making Model (DDDM) is most suited. DDDM is a
continuous process where data is collected and transferred into information and ultimately knowledge; this knowledge is then used to
make decisions, while providing feedback for each process [7].
The relationship between information and decisions were broadly studied by Davenport (2009) [8]. Devenport’s study has resulted in
a framework that identifies three distinctive forms of information contexts namely; loosely coupled environments, structured human
decision based environments and automated decision environments.
Loosely coupled information environments – In this scenario, information has a loosely coupled relationship between information and
decision. Consequently, information is made accessible to decision makers along with the necessary tools to analyse it. This approach
is the most commonly used by organisations to aid their business intelligence systems.
Structured human decision environments – In this circumstance, decisions are continued to be made by professionals. However,
specific elements are put in place to improve the decision-making process by determining particular information required to make
better decisions [8]. Such environments have a narrow focus on precise decisions. This approach is identified as one that is not
suitable for all types decision-making and should focus only on those that are critical to the organisational success due to its
complexity involved.
An automated decision environment incorporates decision rules and algorithms embedded into the key business processes. Decision-
making is made by the rule-engines while the manpower takes care of the exception handling. The main objective behind such an
environment is to achieve an improved efficiency as the process is now fully automated. Moreover, this set-up only works where
decisions are well structured and conducive to a set of rules. Implying that all information necessities could be determined prior, and
each decision can be effortlessly operationalized via a blend of automated workflows and rule engines.
Davenport (2009) [8] argues that the above three types of environments, should be used as a guide for organisational implementation
of business intelligence applications. In order to choose the most appropriate tools for a specific type of decision environment, it is
essential to prioritize on critical decisions that have to be made in urgency, and also wholly comprehend the relationship between
these decisions and necessary information.
2.2 Linking Decisions and Cognition
The power of information based logical decision making is strongly supported and widely accepted [9]. Current literature on
decision making stresses the importance of using non-logical portions of the brain in decision making. Chester Barnard (1968) [10]
states that the non-logical decision making capabilities are important especially when it is obvious that logical decisions may fail.
These non-logical capabilities are now named as “intuition” in management theory. Evidence can be found of successful leaders who
have relied on gutfeel. The former chairman and CEO of General Electric (GE), Jack Welch in his book “Straight from the Gut”
defines intuition is believed as one of the ultimate skills of a corporate leader. According to Welch, gut decisions or intuition based
decisions testify the confidence of a decision maker [11]. Welch states that gut decisions at GE, were mainly made at times of crisis
when there was no time to weigh and calculate probability of each outcome in a decision making process. Agor (1989) [12] elaborated
that intuition based decisions are mostly arrived at when there is a very high level of uncertainty and when there is very little previous
precedence to problem in concern. In such situations, information is limited and there is pressure to make a correct decision. Thus,
executives tend to use “intuition” over rationality for decision making. According to Bonabeau (2003) [13], intuition based decisions
can be dangerously unreliable in complex situations in corporates. The research states that the human brain fuses information from the
past and uses it to understand the present and the future. Bonabeau [13] states that the human mind’s unconscious desire to search for
patterns is very strong. Therefore, when a new situation is faced, the brain attempts to categorize the new situation to one of the
situations experienced in the past and fit it into a pattern already known.
If decision makers cannot rely on intuition and do not have the time or the analytical capability to analyze all facets of a
complex problem, how can corporates make smart choices? According to literature technology has stepped in to answer this question
to a greater extent. Complex software applications have been developed to supplement and reinforce human decision making in
organizations.
2.3 Influence of Technology on Decision Making
Corporates also experiment new business ideas and attempt to base their decisions on scientifically valid data [8]. A
preliminary study conducted on this area by Brynjolfsson et al (2011) [14] at Massachusetts Institute of Technology in USA on firms
in United States of America, concluds that, a 5-6% increase in productivity improvement can be observed in organizations where data
based decision making is practiced. Linking back to the problem statement of this research, the availability of information technology
and information systems is not sufficient to make decisions. Davis (1986) [15] stated that the use of technology in corporates is
influenced by employee behaviors. His research developed the Technology Acceptance Model (TAM) where, perceived usefulness

International Journal of Scientific and Research Publications, Volume 10, Issue 1, January 2020 240
ISSN 2250-3153
http://dx.doi.org/10.29322/IJSRP.10.01.2020.p9737 www.ijsrp.org
and perceived ease of use were considered as two key beliefs in using information systems by employees in the modern world today.
The TAM defines the general elements of individual technology acceptance and has been widely used to predict technology based
behaviours in a broad range of user groups in the corporate world.
2.4 The influence of Groups in Decision Making
Group decision making refers to a scenario where a group of people faced with a problem involve themselves in identification of
alternatives, evaluation and selection of the most appropriate alternative for the purpose of achieving their objective. While research
done by Scott and Bruce (1995) [2], Rehman(2012) [16] and Pacini & Epstein (1999) [17] highlight individual decision making
styles, another school of thought on decision making is governed by decisions made by groups. Gunnarsson (2010) [18], state that a
considerable amount of decisions in organizations are made by groups or teams. According to Robbins and Judge (2011) [19], groups
generate more complete information that results in decisions with higher quality. This is mainly due to the diversity of views and
opinions involved along with the sum of knowledge gathered. Many scholars indicate that group decision making has great
advantages. While combining individual capabilities and knowledge it is also perceived that group decision making also results in the
group’s commitment to the result of the decision making process [20]. However, group decisions have not been considered as the best
method of decision making at all management decisions. Gudykunst (1997) [21] found that groups with more decision-relevant
information made better decisions than groups with less information in a context where all information was shared.
2.4.1 Lunenburg Model
Lunenburg (2010) [22]presents three models used in decision making which helps to understand the extent to which group decision
making is required in different situations. They included the Vroom-Yetton-Jago decision tree model, Tannenbaum and Schmidt's
decision-making pattern choice model, and The Nash's synergistic decision making model. However Lunenburg continue to state that
group decision making also has adverse impact on the decisions and thus the organizations. Working within groups develops “in
group” pressure. When “in-group” pressure leads to reduction in efficiency in individuals, reduction in motivation and rationality, the
quality of the decisions made is significantly reduced impacting performance of organizations. This commonly witnessed phenomena
is called “ groupthink” in management theory and occurs due to giving prominence to cohesiveness within the group as opposed to
rationality or cognitive capability involved in the decision making process.
2.5 Group Think
Management theorist Janis (1991) [23]coined the term “groupthink”, and indicated that it is commonly observed in highly cohesive
groups. Interestingly, research by Janis, identified that extensively qualified and experienced people sometimes make very poor
decisions in organizations. Janis quotes some poor decision making examples influenced by group think such as : NASA’s decision to
launch the Challenger space shuttle in 1986, (which exploded with its crew after takeoff), President John F. Kennedy and his teams
decision to launch the Bay of Pigs invasion of Cuba(1960) and NASA’s decision to launch the space shuttle Columbia which also
resulted in an explosion when entering the earth’s atmosphere. With the above literature it is evident that group decision making has
both advantages and disadvantages towards the process of making quality decisions.
2.6 Relating literature to the study
The theories and empirical findings discussed above lay resilient substance for the study. This section is intended to provide a critical
review of each theory and model presented above.
Decision style theory is a perception driven theory, which looks into four distinctive types of decision-making styles: Directive,
Analytical, Conceptual and Behavioural. This theory mainly focuses on the traits of leaders, and their decision-making behaviours in
the context of strategic planning. The rational decision-making model is a sequential and structured approach to decision-making,
aimed at seeking a precise solution to well-defined problems. Present day companies use ‘big data’ to make effective decisions on
every aspect of their business, commencing from product development, to financing to marketing etc. Opinions are essential and are
much in need in an organization, however, without numbers or data to support the opinions, they become suppositions. Data driven
decision-making is a cycle where the investment in data gathering is guaranteed with returns. GDMS identifies five decision-making
styles, which includes, rational style, intuitive style, dependent style, avoidant style and spontaneous style
Considering the decision making styles adopted by managers at strategic and tactical levels in apparel manufacturing companies in Sri
Lanka, the styles described under GDMS appear to be most appropriate as it explaines five different decision making styles of
decision making. Further, Decision style theory is considered to be less appropriate as the main focus of this theory is on leadership
traits. The rational decision making model only provides a structured approach to decision making but does not focus on different
decision making styles. The Data driven decision making model supports the rational style of decisions under GDMS. Further, the
data driven decisions are also supported by the findings of Brynjolfsson et. al (2011) [14]and Davenport (2009) [8]. The data driven
decisions are supported with technological advancements as pointed out by Davis (1986) [15]. As per Lia, Song & Hall (2015) [24]
capability in data driven decision making is most supported by capabilities in data governance, data analytics, insight exploitation,
performance management and integration. According to Pacini & Epstein (1999) [17], most of the research on individual decision
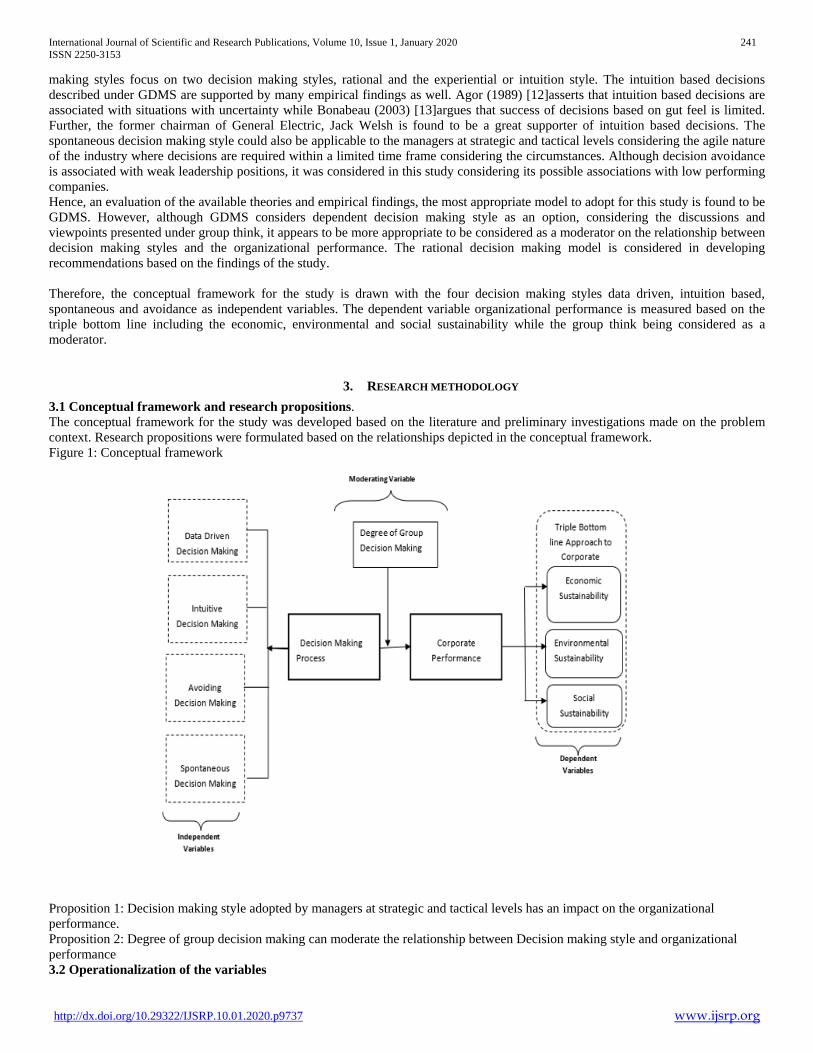
International Journal of Scientific and Research Publications, Volume 10, Issue 1, January 2020 241
ISSN 2250-3153
http://dx.doi.org/10.29322/IJSRP.10.01.2020.p9737 www.ijsrp.org
making styles focus on two decision making styles, rational and the experiential or intuition style. The intuition based decisions
described under GDMS are supported by many empirical findings as well. Agor (1989) [12]asserts that intuition based decisions are
associated with situations with uncertainty while Bonabeau (2003) [13]argues that success of decisions based on gut feel is limited.
Further, the former chairman of General Electric, Jack Welsh is found to be a great supporter of intuition based decisions. The
spontaneous decision making style could also be applicable to the managers at strategic and tactical levels considering the agile nature
of the industry where decisions are required within a limited time frame considering the circumstances. Although decision avoidance
is associated with weak leadership positions, it was considered in this study considering its possible associations with low performing
companies.
Hence, an evaluation of the available theories and empirical findings, the most appropriate model to adopt for this study is found to be
GDMS. However, although GDMS considers dependent decision making style as an option, considering the discussions and
viewpoints presented under group think, it appears to be more appropriate to be considered as a moderator on the relationship between
decision making styles and the organizational performance. The rational decision making model is considered in developing
recommendations based on the findings of the study.
Therefore, the conceptual framework for the study is drawn with the four decision making styles data driven, intuition based,
spontaneous and avoidance as independent variables. The dependent variable organizational performance is measured based on the
triple bottom line including the economic, environmental and social sustainability while the group think being considered as a
moderator.
3. RESEARCH METHODOLOGY
3.1 Conceptual framework and research propositions.
The conceptual framework for the study was developed based on the literature and preliminary investigations made on the problem
context. Research propositions were formulated based on the relationships depicted in the conceptual framework.
Figure 1: Conceptual framework
Proposition 1: Decision making style adopted by managers at strategic and tactical levels has an impact on the organizational
performance.
Proposition 2: Degree of group decision making can moderate the relationship between Decision making style and organizational
performance
3.2 Operationalization of the variables
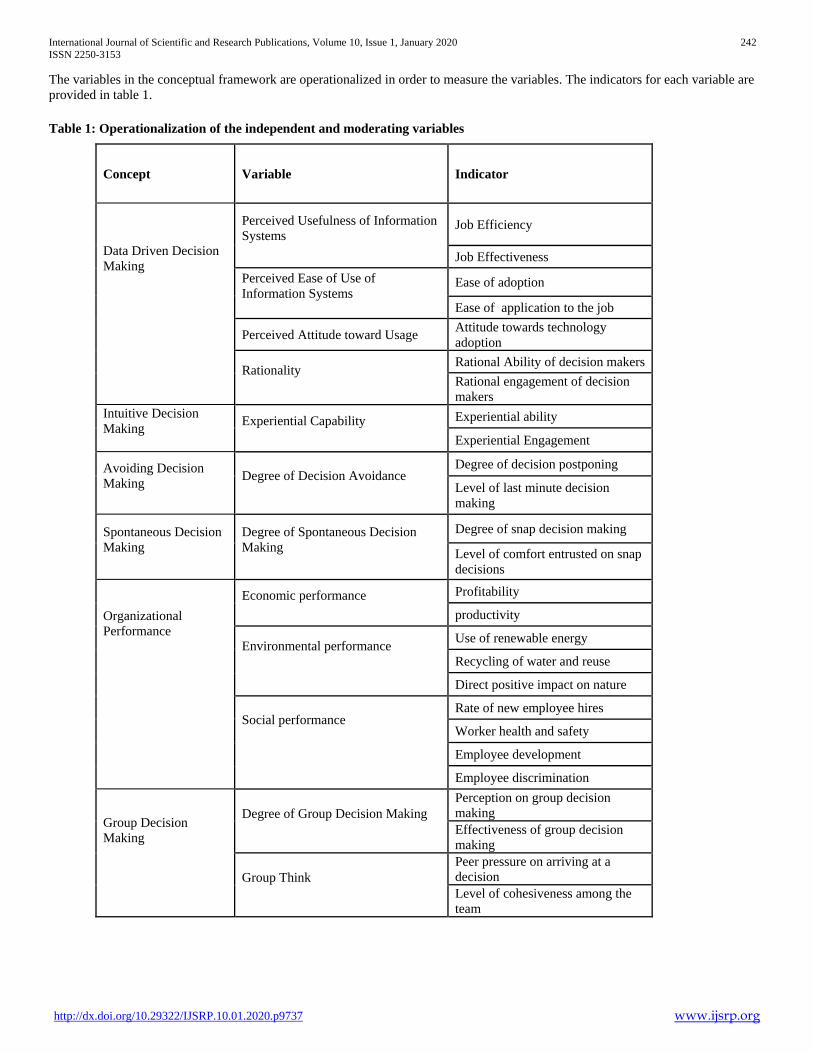
International Journal of Scientific and Research Publications, Volume 10, Issue 1, January 2020 242
ISSN 2250-3153
http://dx.doi.org/10.29322/IJSRP.10.01.2020.p9737 www.ijsrp.org
The variables in the conceptual framework are operationalized in order to measure the variables. The indicators for each variable are
provided in table 1.
Table 1: Operationalization of the independent and moderating variables
Concept Variable Indicator
Data Driven Decision
Making
Perceived Usefulness of Information
Systems
Job Efficiency
Job Effectiveness
Perceived Ease of Use of
Information Systems
Ease of adoption
Ease of application to the job
Perceived Attitude toward Usage Attitude towards technology
adoption
Rationality
Rational Ability of decision makers
Rational engagement of decision
makers
Intuitive Decision
Making
Experiential Capability
Experiential ability
Experiential Engagement
Avoiding Decision
Making
Degree of Decision Avoidance
Degree of decision postponing
Level of last minute decision
making
Spontaneous Decision
Making
Degree of Spontaneous Decision
Making
Degree of snap decision making
Level of comfort entrusted on snap
decisions
Organizational
Performance
Economic performance
Profitability
productivity
Environmental performance
Use of renewable energy
Recycling of water and reuse
Direct positive impact on nature
Social performance
Rate of new employee hires
Worker health and safety
Employee development
Employee discrimination
Group Decision
Making
Degree of Group Decision Making
Perception on group decision
making
Effectiveness of group decision
making
Group Think
Peer pressure on arriving at a
decision
Level of cohesiveness among the
team

International Journal of Scientific and Research Publications, Volume 10, Issue 1, January 2020 243
ISSN 2250-3153
http://dx.doi.org/10.29322/IJSRP.10.01.2020.p9737 www.ijsrp.org
The organizational performance was measured through the Triple Bottom Line (TBL) model where organizational performance can
be measured through three dimensions; Economic, Environmental and Social sustainability. The indicators for each sustainability
dimension considered in the study are shown in figure 2.
Figure 2. Indicators of triple bottom line.
3.3 Research Design
The research onion developed by Saunders et. al (2007) [25] elaborates the stages that needs to be covered when developing
a research. While the research onion attempts to define the stages, the researcher should follow them in defining the research
methodology. The layers of this model attempts to define the research philosophy, research approach, research strategies, choices,
time horizon, and techniques and procedures used.
3.3.1 The Research Philosophy and Approach
A researcher’s philosophy towards a study depends on his/her personal view of what establishes as acceptable knowledge
and the process by which this knowledge is developed.
A researcher with a concern for a laboratory like setting with identification of cause and effect relationships involving testing
hypothesis reflects the philosophy of positivism. This philosophy requires the researcher to follow a scientific method to propose and
test hypothesis with large amounts of highly structured and measurable data. Realism philosophical position is required when the
study involves underlying complexities of the problem with varied data collection techniques using both quantitative and qualitative
data. When the researcher is more concerned about gathering rich understandings and subjective insights into a problem with an
intention of generalizing the meanings, the philosophy of interpretivism is followed. This philosophy is mostly adopted at times where
a social phenomenon is studied in a natural environment. Therefore, data collection for such philosophies involves qualitative data
from in depth investigations using a small sample. Pragmatism emphasizes the practicality of research findings at all times thus
emphasizing on reliable, credible and relevant data being collected that supports subsequent actions of the research.
The next layer of the research onion defines the research approach where a decision is made to use either deductive or
inductive approach. Deductive research relates to scientific research leading to testing theory whereas inductive approach leads to
building theory.
In view of the first two layers of the research onion, the research methodology should follows a Pragmatism philosophy
combined with an inductive approach. However, an element of deduction is also visible as the GDMS model is followed initially to
identify the decision making styles to test. Findings made through interviews were used to understand patterns and formulate theories
at the end of the research. The research involves understanding, how and under what conditions different decision making styles are
adopted and attempts to search for patterns based on observations leading to development of explanations on the impact each decision
making style has on the organizational performance.
3.3.2 The Research Strategy
Subsequent to peeling away the research approach layer, the research onion exposes the strategy layer. The strategy adopted
could vary from experiments, action research, survey, case study, ethnography, grounded theory etc. According to Saunders and
Tosey (2014) [26], the boundary between research strategies and the research philosophy adopted is often considered as permeable.
Bringing in an example, ethnography is associated with realism and interpretivism whereas experiment and survey research strategy is
considered to be closely associated with positivism. A case study strategy was followed based on a selected sample of companies to
understand the decision making styles adopted by the Sri Lankan Apparel Industry in order to predict and explain certain behavioral
traits to be used in the decision process. Further, case study research often involves combination of quantitative and qualitative
Economic Sustainability
•Cost per Minute
•Air Freight Cost
•Production Line
Efficiency
•First Past Yield
Environment Sustainability
• % of Waste water purified
• % of renewable energy
used
• % of Diesel Fuel and
Furnaces Oil used
Social Sustainability
• % of workers recruited from within 10 Km radius
• Expenditure spent on rural educational institutions
•Expenditure spent on mobile health campaigns
•No. of safety Audits conducted
•No. of work place accidents

International Journal of Scientific and Research Publications, Volume 10, Issue 1, January 2020 244
ISSN 2250-3153
http://dx.doi.org/10.29322/IJSRP.10.01.2020.p9737 www.ijsrp.org
methods. In this study, the findings based on qualitative data analysis is followed up based on quantitative data collected through a
survey. Hence, the survey research strategy is also adopted within the case study.
3.3.3 The Research Choice and Time Horizon
A researcher can adopt qualitative, quantitative or a mixture of both during a research study. According to the nature of this
research it is evident that this explores a behavioral aspect of decision makers in the apparel industry in Sri Lanka. Hence this has an
inductive approach for the findings where it concerns with the generation of new theory and findings emerging from the data. A
research questionnaire is also used to help develop and build theories along with structured interviews to strengthen the findings.
Therefore, the researcher has applied a mixed method for the purpose of this research. A research could either be a snapshot taken at a
particular time or be a series of snapshots taken over a period of time. A single snapshot is called a cross-sectional study whereas a
series of snapshots taken over a period of time is considered to follow a longitudinal study. This research follows a cross sectional
study where data is collected at a particular time as this research is conducted for the purpose of academic studies and thus, time
constrained.
3.4 Sampling, Methods of data Collection and analysis
Ten medium to large scale apparel manufacturing companies were purposively chosen for the study. The differences based
on the triple bottom line and different preferences given to different decision making styles identified through a preliminary
investigation were considered as criteria for selection of the companies. The data gathered were primarily qualitative consisting semi
structured interviews and a survey was administered to follow up on the interview findings. The interview respondents were selected
based on judgmental sampling where one respondent representing the strategic or tactical levels in each organization were chosen.
Managers representing functions of finance, human resource management, merchandising and marketing were chosen considering
their experience in industry. The interviews consisted of two sections where semi structures questions on the conditions under which
each decision making style was considered most appropriate and business cases simulating industry dynamics were presented to
justify most appropriate decision making style and how it could affect the triple bottom line. Quantitative data was collected through a
structured survey where the questions were developed based on the indicators of the decision making styles operationalized and
presented in a 1-5 likert scale. The questionnaire was administered on ten strategic and tactical level managers in each of the chosen
companies totaling to 100 respondents. The organizational performance was measured through secondary data on the indicators of
triple bottom line.
Qualitative data were thematically analysed to identify the patterns and themes emerging from the data while survey findings
were initially analysed to identify the primary components, tested for reliability and validity and each decision making style was
statistically analysed using SPSS.
3.5 Methods for testing reliability and validity of data
A confirmatory factor analysis helps to identify the measures of a latent variable share their variance and how they are
different from others. The quantitative data collected through questionnaire were initially tested for unidimentiality based on factor
analysis and the constructs identified were tested for reliability and validity.
Cronbach’s alpha is a measure of internal consistency or reliability. According to Kline (2011) [27] acceptable value of
alpha in reliability analysis is 0.70 in the case of reliability tests. The validity of data can be tested through face validity, content
validity, criterion validity and congruent validity. The aspects of validity except the construct validity were ensured by developing
appropriate indicators during the operationalization of the variables. Construct validity consists of two types; convergent validity and
the discriminant validity (Campbell & Fiske, 1959) [28]. The convergent validity is the degree of confidence that can be placed on the
indicators to measure a trait correctly. Discriminant validity is the degree to which the measures of different traits are unrelated.
Fornell & Larker (1981) [29]have suggested the Average Variance Extracted (AVE), which measures the level of variance captured
by the construct against the measurement error and Composite reliability (CR), a less biased estimator of reliability than Chronbach’s
alpha as measures of convergent validity. Fornell and Larker suggest AVE to be above 0.5 and CR to be above 0.7 for convergent
validity to be satisfactory. In addition, Kaiser-Meyer-Olkin Measure of Sampling Adequacy (KMO), is also suggested to be a
measure of convergent validity. KMO values above 0.5 are considered satisfactory (Sekeran & Bougie, 2010) [30]. Further, the
Bartlett’s test pf sphericity can be used to test the strength of relationships among the indicators of a measure (Bartlett, 1937) [31].
This test can be conducted at a predetermined level of significance where, the p-value of the results can be compared with the level of
significance to arrive at a conclusion. Commonly used level of significance is .05.
As explained by Lincoln and Guba (1985) [32], reliability and validity of qualitative findings were ensured by selecting
trustworthy and knowledgeable individuals in the field. In addition, constant data comparison, comprehensive data use reputational
analysis suggested by Silverman (2013) [33] were considered.

International Journal of Scientific and Research Publications, Volume 10, Issue 1, January 2020 245
ISSN 2250-3153
http://dx.doi.org/10.29322/IJSRP.10.01.2020.p9737 www.ijsrp.org
4. FINDINGS
4.1 Summary of findings from Semi Structured Interview Process
Table 2: Summary of findings from Semi Structured Interview Process
Data Driven Decision Making
Key Findings Potential Impact on Performance
1. Decision making process is largely supported by data and analytics which
are considered to be an important aspect of overall decision making process
of Companies.
2. Extensive dependability on decision support system in overall ERP of the
Company, budgeting process, demand planning and KPI monitoring.
3. Data and decision support systems are significantly applied to identify
problem root causes and develop solutions.
4. Key factors drive data driven decisions in the companies were identified as
understandability of data, Attitudes towards use of data for decision
support, extent of data being updated in the system, applicability and
relevance of data in the system, real time availability of data, The extent
that the data is forward looking, Reliability and Accuracy of data
1. Better budgetary control process and thereby
achieve cost efficiencies in terms of Cost per
minute of the Company.
2. Setting up of key performance indicators which
help to achieve productivity and quality targets
such as improved production line efficiencies
and increase in First Past Yield.
3. Better overall performance monitoring in terms
of Budgets vs. Actual and help to take corrective
action timely.
4. Prevention of problems arising repeating as the
problem root cause is addressed. Hence better
overall cost savings such as reduction in Air
Freight, reduction in overheads which in turn
constitute towards competitive cost per minute.
Intuitive Decision Making
Key Findings Potential Impact on Performance
1. Experiential ability and experiential engagement is an important aspect of
Intuitive decision making.
2. Time factor plays a key role in selecting intuitive approach for decision
making
3. Highly individualistic decision approach. Hence potential risk factor
could be significant.
4. Even if the data is available intuition aspect of the decision is important
as it would bring about certain important vantage point for the business
decision.
5. Key factors that drive data driven intuition in the companies were
identified as extent of proactiveness of data, human aspect involved in the
decision, business circumstances, individual preferences, industry
changes & trends and pressure for time.
1. Experiential ability based intuitive decisions are
important to reduce wastages especially in the
fabric cutting process. This would reduce overall
cost and make the cost per minute of the
company more competitive.
2. Better timely decision could exploit emerging
opportunities in the market and would keep the
company abreast in market dynamisms. This
would allow the Companies to exploit and
capitalize on business opportunities to increase
shareholder wealth.
3. Certain business circumstances such as
commencing to work with new customers,
adopting new fashion designs and introduction
of new products to the market requires a high
degree of intuition based decision approach.
4. Intuition is necessary when there are human
aspects involved in the decision. This is mainly
important in performance related human
resources development such as performance
related payments, career progression plans,
succession plans where a person’s attitude,
perception, ability to embrace change, adaptation
aspects are being considered. However,
decisions may carry a high degree of risk when
compared to data driven decisions as it is largely
individual experience based.

International Journal of Scientific and Research Publications, Volume 10, Issue 1, January 2020 246
ISSN 2250-3153
http://dx.doi.org/10.29322/IJSRP.10.01.2020.p9737 www.ijsrp.org
Avoiding Decision Making
Key Findings Potential Impact on Performance
1. General understanding was that business decisions should not be avoided.
Decision makers have to act on a timely manner and make effective
decisions and implement within the organization.
2. There is no ideology of “time will find a solution” when it come to a
corporate decision although the idea may work in relation to personal
decisions in certain cases.
3. Avoidance of decision is not a healthy alternative for existence of any
business organization.
1. The practice of avoiding decisions in an
organization will lead to;
Loss of business opportunities
Loss of Confidence
Being Left Behind
Difficulty to Change
Loss of Organizational Value / Repute
Spontaneous Decision Making
Key Findings Potential Impact on Performance
1. Highly situation dependent decisions where decision makers would arrive
at a spontaneous decision even if data is available.
2. Higher element of intuition is also involved where experiential ability and
experiential engagement is high.
3. Spontaneous decisions are not applicable for certain decisions such as
Finance related decisions where decisions should be made after careful
evaluation and scrutiny.
4. Decision maker has to be an expert in the field the decision is made upon.
Otherwise the decision itself will be irrational and would be a failure.
1. Potential savings of time is noted as a key
advantage for this type of decisions.
2. Decisions related to quality, waste emission,
workplace safety are some key performance
areas where spontaneous decisions are
practiced.
Group Decision Making
Key Findings Potential Impact on Performance
1. This approach has an impact on all decision making approaches in the
Organization. All the respondents participated in the interview indicated
that they would involve functional departments in corporate decision
making process.
2. Group decision making has a definite time advantage in the decision
process. Multiple points of view are put forward and evaluation, think
through is done at a faster phase and potential synergies are leveraged in
order to make a quick effective well thought through decision.
3. Group decisions play an intermediary moderating role in the overall
decision making process in the organization. In the case of the apparel
industry where interlinked processes are involved in the overall value chain
the importance of group influence over the decision is vital irrespective of
the decision making approach being adopted by the organization.
1. Better timely decisions in relation to key
performance aspects of the industry such as
first past yield, productivity, and cost
management, environmental and social aspects.
2. Evokes participatory style of management
where decisions are accepted among all
stakeholders involved in the process. Hence
better implementation and results are achieved.
3. Potential synergies available among decision
makers are leveraged in order to make a quick
effective well thought through decision.
4.2 Analysis of Responses to Business Case Scenarios
In order to establish the relationship between the decision making approaches adopted by apparel manufacturing firms and
resulting impact on the triple bottom line performance of the Companies a set of business cases were developed which specifically
addresses the performance related aspect of the Triple bottom line model. Each of the business cases related to an aspect of Triple
bottom line for which measurements for the dependent variable is introduced. The dependent variable measurement and the aspect of
the Triple bottom line it related to is presented hereunder in following tables
Each of the business cases were linked to measurement criteria in the dependent variables. Hence the respondent’s response
to the business case is measured by the measurement criteria established for the dependent variable. Following table indicated the link
of the business cases to measurement criteria in dependent variables.
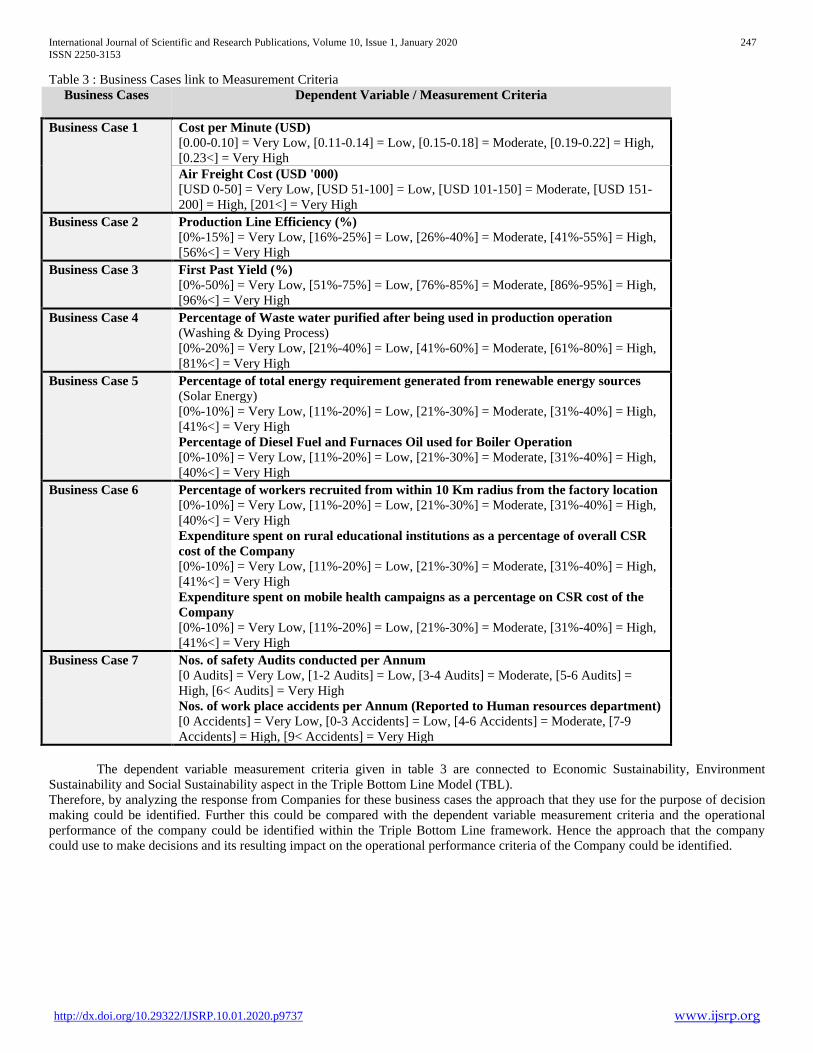
International Journal of Scientific and Research Publications, Volume 10, Issue 1, January 2020 247
ISSN 2250-3153
http://dx.doi.org/10.29322/IJSRP.10.01.2020.p9737 www.ijsrp.org
Table 3 : Business Cases link to Measurement Criteria
Business Cases
Dependent Variable / Measurement Criteria
Business Case 1
Cost per Minute (USD)
[0.00-0.10] = Very Low, [0.11-0.14] = Low, [0.15-0.18] = Moderate, [0.19-0.22] = High,
[0.23<] = Very High
Air Freight Cost (USD '000)
[USD 0-50] = Very Low, [USD 51-100] = Low, [USD 101-150] = Moderate, [USD 151-
200] = High, [201<] = Very High
Business Case 2 Production Line Efficiency (%)
[0%-15%] = Very Low, [16%-25%] = Low, [26%-40%] = Moderate, [41%-55%] = High,
[56%<] = Very High
Business Case 3 First Past Yield (%)
[0%-50%] = Very Low, [51%-75%] = Low, [76%-85%] = Moderate, [86%-95%] = High,
[96%<] = Very High
Business Case 4 Percentage of Waste water purified after being used in production operation
(Washing & Dying Process)
[0%-20%] = Very Low, [21%-40%] = Low, [41%-60%] = Moderate, [61%-80%] = High,
[81%<] = Very High
Business Case 5 Percentage of total energy requirement generated from renewable energy sources
(Solar Energy)
[0%-10%] = Very Low, [11%-20%] = Low, [21%-30%] = Moderate, [31%-40%] = High,
[41%<] = Very High
Percentage of Diesel Fuel and Furnaces Oil used for Boiler Operation
[0%-10%] = Very Low, [11%-20%] = Low, [21%-30%] = Moderate, [31%-40%] = High,
[40%<] = Very High
Business Case 6 Percentage of workers recruited from within 10 Km radius from the factory location
[0%-10%] = Very Low, [11%-20%] = Low, [21%-30%] = Moderate, [31%-40%] = High,
[40%<] = Very High
Expenditure spent on rural educational institutions as a percentage of overall CSR
cost of the Company
[0%-10%] = Very Low, [11%-20%] = Low, [21%-30%] = Moderate, [31%-40%] = High,
[41%<] = Very High
Expenditure spent on mobile health campaigns as a percentage on CSR cost of the
Company
[0%-10%] = Very Low, [11%-20%] = Low, [21%-30%] = Moderate, [31%-40%] = High,
[41%<] = Very High
Business Case 7 Nos. of safety Audits conducted per Annum
[0 Audits] = Very Low, [1-2 Audits] = Low, [3-4 Audits] = Moderate, [5-6 Audits] =
High, [6< Audits] = Very High
Nos. of work place accidents per Annum (Reported to Human resources department)
[0 Accidents] = Very Low, [0-3 Accidents] = Low, [4-6 Accidents] = Moderate, [7-9
Accidents] = High, [9< Accidents] = Very High
The dependent variable measurement criteria given in table 3 are connected to Economic Sustainability, Environment
Sustainability and Social Sustainability aspect in the Triple Bottom Line Model (TBL).
Therefore, by analyzing the response from Companies for these business cases the approach that they use for the purpose of decision
making could be identified. Further this could be compared with the dependent variable measurement criteria and the operational
performance of the company could be identified within the Triple Bottom Line framework. Hence the approach that the company
could use to make decisions and its resulting impact on the operational performance criteria of the Company could be identified.

International Journal of Scientific and Research Publications, Volume 10, Issue 1, January 2020 248
ISSN 2250-3153
http://dx.doi.org/10.29322/IJSRP.10.01.2020.p9737 www.ijsrp.org
Figure 3: Business case categorization
Table 4: Analysis of Business Cases 1, 2 & 3
Business Case Decision
making
approach
Percentage
adopted
Operational Performance
Criteria Level %
Case 1
Production cost has surged during the last few years. The
management wants to identify cost management strategies to
control key cost drivers and make the CPM more competitive.
The key cost drivers identified for this exercise are as follows.
Production Process Cost (Key processes: Cutting,
Sewing, Finishing & Packing)
Air Freight Cost
Data Driven 100% Cost Per
Minute
(USD)
Very High 10%
Intuition 70% High 20%
Avoidance 0% Moderate 50%
Spontaneous 10% Low 20%
Group 100% Air
Freight
Cost
(USD
000)
High 20%
Moderate 50%
Low 30%
Case 2
The work study department of the company is in the process of
developing best practices in order to enhance sewing line
efficiency and to reduce initial learning curve effect when new
styles are being introduced in production lines.
Data Driven 90% Production
Line
Efficiency
(%)
Very High 10%
Intuition 80% High 20%
Avoidance 0% Moderate 50%
Spontaneous 20% Low 20%
Group 100%
Case 3
The Company has experienced some quality rejects during the
final Quality Control checkpoint. The QC department is in the
process of developing quality control guidelines and best
practices in order to minimize quality issues.
Data Driven 100% First Past
Yield (%)
Very High 20%
Intuition 80% High 30%
Avoidance 0% Moderate 30%
Spontaneous 30% Low 20%
Group 100%
4.2.1 Discussion on the Analysis of Business Cases 1, 2 & 3
According to the analysis of business cases 1, 2 & 3 for the ten Companies in the sample it is evident that the Companies
which use a combination of data, intuition and group influence in decision making has shown better operational performance.
In the case of Business Case 1, it is clearly evident that 70% of the companies have the cost per minute at either low or a
moderate level. This is considered to be a very competitive cost per minute value as it makes the company cost competitive in
devising pricing strategies. These Companies use a cognitive approach in decision making by the use of data, intuition and being
moderated by group involvement.
Further the Air Freight cost incurred by these Companies is also either moderate or low (with the exception of 20% of
Companies) which indicates a reasonable value in the Industry context. This indicates that the supply chain process and the
production process are well monitored and managed within these Companies. However, in 20% of Companies where Air Freight
values are at a higher end which could be due to last minute order from the buyers and in certain cases buyer incurred air freight costs.
In relation to Business Case 2 it is evident that most of the Companies which have achieved High or Very High efficiencies
are using data driven decision making approach combined with intuition and group think. Accordingly, 50% of Companies are using
this combined approach in implementing decisions in relation to enhancement of Production Line Efficiencies.
This behavior is also evident in Business Case 3 where 50% of Companies have recorded High and Very High first past yield
values which in turn uses a combination of data, intuition and group in their quality control decision making. In these cases 20% of
Companies also indicated that they use a spontaneous approach to the decision depending on the urgency, nature and potential down
the line impact of the quality issue. As such certain quality issues in the production process needs to be sorted out in a matter of
minutes.
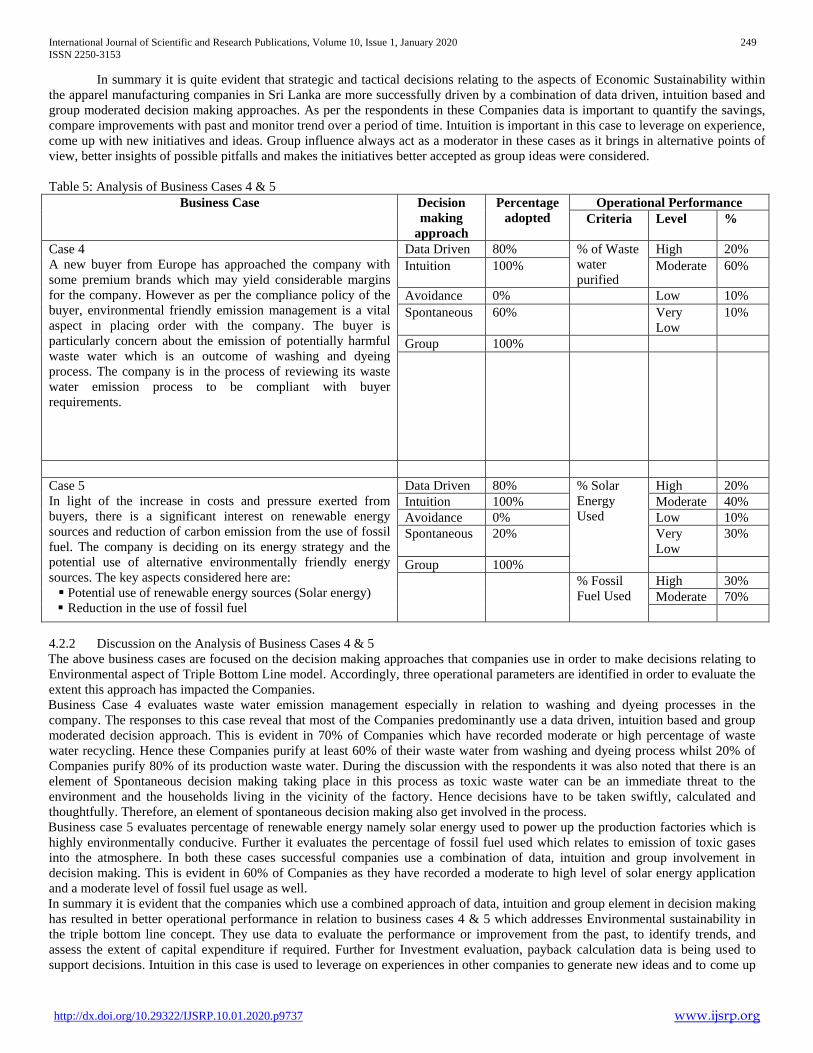
International Journal of Scientific and Research Publications, Volume 10, Issue 1, January 2020 249
ISSN 2250-3153
http://dx.doi.org/10.29322/IJSRP.10.01.2020.p9737 www.ijsrp.org
In summary it is quite evident that strategic and tactical decisions relating to the aspects of Economic Sustainability within
the apparel manufacturing companies in Sri Lanka are more successfully driven by a combination of data driven, intuition based and
group moderated decision making approaches. As per the respondents in these Companies data is important to quantify the savings,
compare improvements with past and monitor trend over a period of time. Intuition is important in this case to leverage on experience,
come up with new initiatives and ideas. Group influence always act as a moderator in these cases as it brings in alternative points of
view, better insights of possible pitfalls and makes the initiatives better accepted as group ideas were considered.
Table 5: Analysis of Business Cases 4 & 5
Business Case Decision
making
approach
Percentage
adopted
Operational Performance
Criteria Level %
Case 4
A new buyer from Europe has approached the company with
some premium brands which may yield considerable margins
for the company. However as per the compliance policy of the
buyer, environmental friendly emission management is a vital
aspect in placing order with the company. The buyer is
particularly concern about the emission of potentially harmful
waste water which is an outcome of washing and dyeing
process. The company is in the process of reviewing its waste
water emission process to be compliant with buyer
requirements.
Data Driven 80% % of Waste
water
purified
High 20%
Intuition 100% Moderate 60%
Avoidance 0% Low 10%
Spontaneous 60% Very
Low
10%
Group 100%
Case 5
In light of the increase in costs and pressure exerted from
buyers, there is a significant interest on renewable energy
sources and reduction of carbon emission from the use of fossil
fuel. The company is deciding on its energy strategy and the
potential use of alternative environmentally friendly energy
sources. The key aspects considered here are:
Potential use of renewable energy sources (Solar energy)
Reduction in the use of fossil fuel
Data Driven 80% % Solar
Energy
Used
High 20%
Intuition 100% Moderate 40%
Avoidance 0% Low 10%
Spontaneous 20% Very
Low
30%
Group 100%
% Fossil
Fuel Used
High 30%
Moderate 70%
4.2.2 Discussion on the Analysis of Business Cases 4 & 5
The above business cases are focused on the decision making approaches that companies use in order to make decisions relating to
Environmental aspect of Triple Bottom Line model. Accordingly, three operational parameters are identified in order to evaluate the
extent this approach has impacted the Companies.
Business Case 4 evaluates waste water emission management especially in relation to washing and dyeing processes in the
company. The responses to this case reveal that most of the Companies predominantly use a data driven, intuition based and group
moderated decision approach. This is evident in 70% of Companies which have recorded moderate or high percentage of waste
water recycling. Hence these Companies purify at least 60% of their waste water from washing and dyeing process whilst 20% of
Companies purify 80% of its production waste water. During the discussion with the respondents it was also noted that there is an
element of Spontaneous decision making taking place in this process as toxic waste water can be an immediate threat to the
environment and the households living in the vicinity of the factory. Hence decisions have to be taken swiftly, calculated and
thoughtfully. Therefore, an element of spontaneous decision making also get involved in the process.
Business case 5 evaluates percentage of renewable energy namely solar energy used to power up the production factories which is
highly environmentally conducive. Further it evaluates the percentage of fossil fuel used which relates to emission of toxic gases
into the atmosphere. In both these cases successful companies use a combination of data, intuition and group involvement in
decision making. This is evident in 60% of Companies as they have recorded a moderate to high level of solar energy application
and a moderate level of fossil fuel usage as well.
In summary it is evident that the companies which use a combined approach of data, intuition and group element in decision making
has resulted in better operational performance in relation to business cases 4 & 5 which addresses Environmental sustainability in
the triple bottom line concept. They use data to evaluate the performance or improvement from the past, to identify trends, and
assess the extent of capital expenditure if required. Further for Investment evaluation, payback calculation data is being used to
support decisions. Intuition in this case is used to leverage on experiences in other companies to generate new ideas and to come up
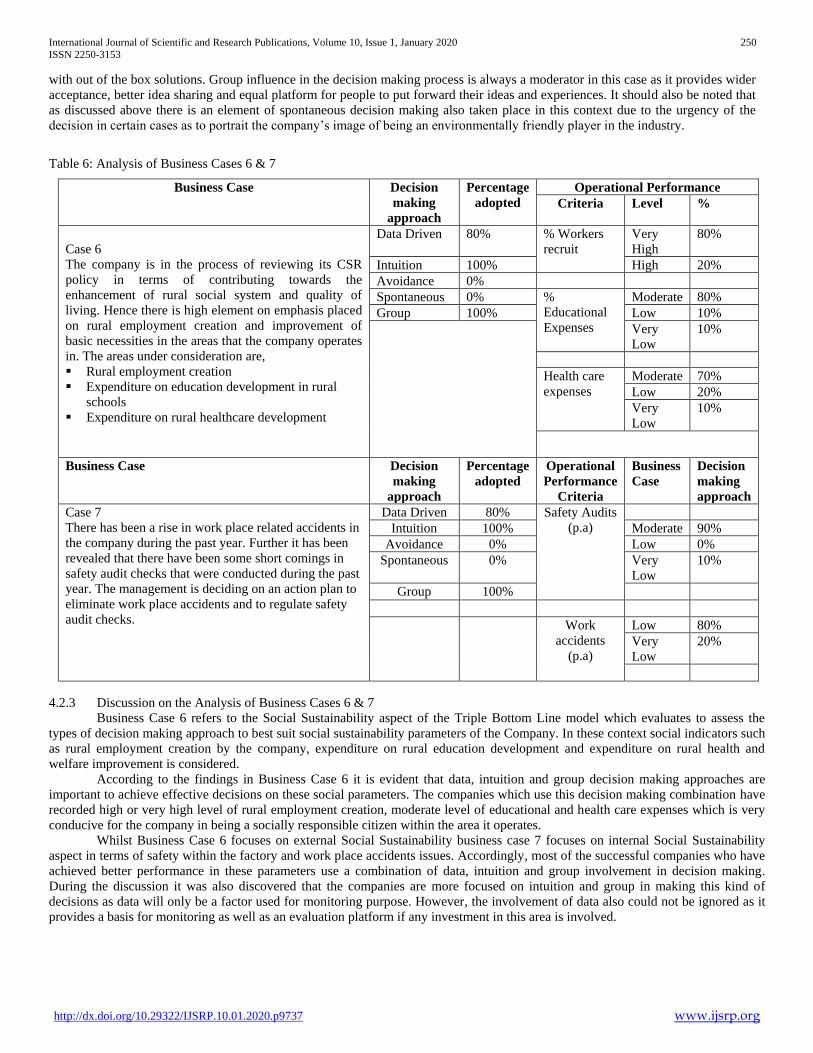
International Journal of Scientific and Research Publications, Volume 10, Issue 1, January 2020 250
ISSN 2250-3153
http://dx.doi.org/10.29322/IJSRP.10.01.2020.p9737 www.ijsrp.org
with out of the box solutions. Group influence in the decision making process is always a moderator in this case as it provides wider
acceptance, better idea sharing and equal platform for people to put forward their ideas and experiences. It should also be noted that
as discussed above there is an element of spontaneous decision making also taken place in this context due to the urgency of the
decision in certain cases as to portrait the company’s image of being an environmentally friendly player in the industry.
Table 6: Analysis of Business Cases 6 & 7
Business Case Decision
making
approach
Percentage
adopted
Operational Performance
Criteria Level %
Case 6
The company is in the process of reviewing its CSR
policy in terms of contributing towards the
enhancement of rural social system and quality of
living. Hence there is high element on emphasis placed
on rural employment creation and improvement of
basic necessities in the areas that the company operates
in. The areas under consideration are,
Rural employment creation
Expenditure on education development in rural
schools
Expenditure on rural healthcare development
Data Driven 80% % Workers
recruit
Very
High
80%
Intuition 100% High 20%
Avoidance 0%
Spontaneous 0% %
Educational
Expenses
Moderate 80%
Group 100% Low 10%
Very
Low
10%
Health care
expenses
Moderate 70%
Low 20%
Very
Low
10%
Business Case Decision
making
approach
Percentage
adopted Operational
Performance
Criteria
Business
Case Decision
making
approach Case 7
There has been a rise in work place related accidents in
the company during the past year. Further it has been
revealed that there have been some short comings in
safety audit checks that were conducted during the past
year. The management is deciding on an action plan to
eliminate work place accidents and to regulate safety
audit checks.
Data Driven 80% Safety Audits
(p.a)
Intuition 100% Moderate 90%
Avoidance 0% Low 0%
Spontaneous 0% Very
Low
10%
Group 100%
Work
accidents
(p.a)
Low 80%
Very
Low 20%
4.2.3 Discussion on the Analysis of Business Cases 6 & 7
Business Case 6 refers to the Social Sustainability aspect of the Triple Bottom Line model which evaluates to assess the
types of decision making approach to best suit social sustainability parameters of the Company. In these context social indicators such
as rural employment creation by the company, expenditure on rural education development and expenditure on rural health and
welfare improvement is considered.
According to the findings in Business Case 6 it is evident that data, intuition and group decision making approaches are
important to achieve effective decisions on these social parameters. The companies which use this decision making combination have
recorded high or very high level of rural employment creation, moderate level of educational and health care expenses which is very
conducive for the company in being a socially responsible citizen within the area it operates.
Whilst Business Case 6 focuses on external Social Sustainability business case 7 focuses on internal Social Sustainability
aspect in terms of safety within the factory and work place accidents issues. Accordingly, most of the successful companies who have
achieved better performance in these parameters use a combination of data, intuition and group involvement in decision making.
During the discussion it was also discovered that the companies are more focused on intuition and group in making this kind of
decisions as data will only be a factor used for monitoring purpose. However, the involvement of data also could not be ignored as it
provides a basis for monitoring as well as an evaluation platform if any investment in this area is involved.

International Journal of Scientific and Research Publications, Volume 10, Issue 1, January 2020 251
ISSN 2250-3153
http://dx.doi.org/10.29322/IJSRP.10.01.2020.p9737 www.ijsrp.org
4.3 Analysis of Quantitative data
The quantitative data collected through survey questionnaire based on Likert scale were analysed using SPSS software package. The
data were initially subjected to a factor analysis to identify the groupings developed. Each identified group were analysed for
reliability and validity and descriptively analysed based on statistical measures.
4.3.1 Factor Analysis of Data Collected
The data collected from the questionnaire for the Independent variable was subjected to factor analysis. The factor loading
from SPSS is presented below. The codes representing each variable are: DD- Data driven decision making, IN- Intuitive decision
making, SP- spontaneous decision making and AV-avoiding decision making.
Table 6: Factor Analysis
According to the above factor loading output it is evident that responses for questions in relation to data driven decision
making has two aspects. Questions DD1, DD2, DD3, DD4 and DD6 have one aspect whereas questions DD7, DD8, DD9 and DD10
have another aspect. Hence considering the indicators represented by the questions, the questions were grouped as: Data Driven Decision Making - Interaction with Decision Support Systems
Data Driven Decision Making - Personal Traits adopted in Data Driven Decisions
During the reliability and validity testing process one question (DD5) was dropped from the data gathered as there was a
misinterpretation of the question by the respondents.
4.3.2 Reliability Testing
Cronbach's alpha is a measure of internal consistency of the data collected in relation to one variable. This refers as to how
closely relate a set of responses for a particular item within the variables. The table 7 indicates Cronbach's alpha calculated for
dependent, moderating and independent variables relating to this research.
1 2 3 4 5
AV2 .811
AV4 .759
AV5 .755
AV3 .721
AV1 .640
IN4 .798
IN1 .767
IN2 .742
IN5 .740
IN3 .728
DD3 .829
DD2 .808
DD1 .753
DD4 .707
DD6 .582
SP1 .842
SP4 .703
SP2 .670
SP3 .659
DD10 .764
DD8 .719
DD9 .686
DD7 .626
Spontaneous Decision
Making
Data Driven Decision
Making- Personal Traits adopted in
Data Driven Decisions
Component
Avoiding Decision Making
Intuitive Decision Making
Data Driven Decision
Making- Interaction with Decision
Support Systems

International Journal of Scientific and Research Publications, Volume 10, Issue 1, January 2020 252
ISSN 2250-3153
http://dx.doi.org/10.29322/IJSRP.10.01.2020.p9737 www.ijsrp.org
Table 7 : Reliability Test Results
Variable Description Chronbach’s Alpha
Data Driven Decision Making 0.8449
Interaction with Decision Support Systems
Data Driven Decision Making 0.80703
Personal Traits adopted in Data Driven Decisions
Intuitive Decision Making 0.82828
Avoiding Decision Making 0.83641
Spontaneous Decision Making 0.83952
Group Decision Making 0.7727
The Cronbach's alpha calculated for all the variables are above 0.70 which indicates relatively high internal consistency.
Hence it could be determined that all variables taken in consideration are acceptable and are valid for the purpose of this research
study.
4.3.3 Validity Testing
This tests the degree of validity of the research instrument for the purpose of the research. In this context the validity test carried out
in order to ascertain the validity of the questionnaire for the purpose of the research. In this context four validity testing measures are
calculated namely, Kaiser-Meyer-Olkin Measure of Sampling Adequacy, P value of Bartlett's Test of Sphericity, Average Variance
Extracted (AVE) and Composite Reliability. The descriptions of this measures and acceptable parameters are discussed under chapter
three of this research paper.
Table 8: Convergent Validity test Results
KMO
P value of
Bartlett's
Test of
Sphericity
AVE Composite
Reliability Variable Description
Data Driven Decision Making 0.82709 0.0000 0.62885
0.89260
Interaction with Decision Support Systems
Data Driven Decision Making 0.75674 0.0000 0.60757 0.86053
Personal Traits adopted in Data Driven Decisions
Intuitive Decision Making 0.80703 0.0000 0.59621 0.88053
Avoiding Decision Making 0.84348 0.0000 0.64295 0.89958
Spontaneous Decision Making 0.78386 0.0000 0.68349 0.89601
Group Decision Making 0.68212 0.0000 0.69186 0.87059
According to the table 8 validity testing parameters it is evident that Kaiser-Meyer-Olkin Measure of Sampling Adequacy
calculated for all variables are above 0.50 and P-value of Bartlett's Test of Sphericity is always less than 0.05 for all variables. Further
Average Variance Extracted for all the variables indicate a value above 0.50 and Composite Reliability for the variables are greater
than 0.70. Hence it could be concluded that the research instrument is valid and satisfies the purpose of the research.
4.3.4 Discriminant Validity Test Results
This is a test of validity of a variable if the variable is discriminated from the others. If the variable is to stand by its own how
the variable can be measured as an independent entity. Discriminant validity occurs where constructs that are expected not to relate do
not, such that it is possible to discriminate between these constructs.
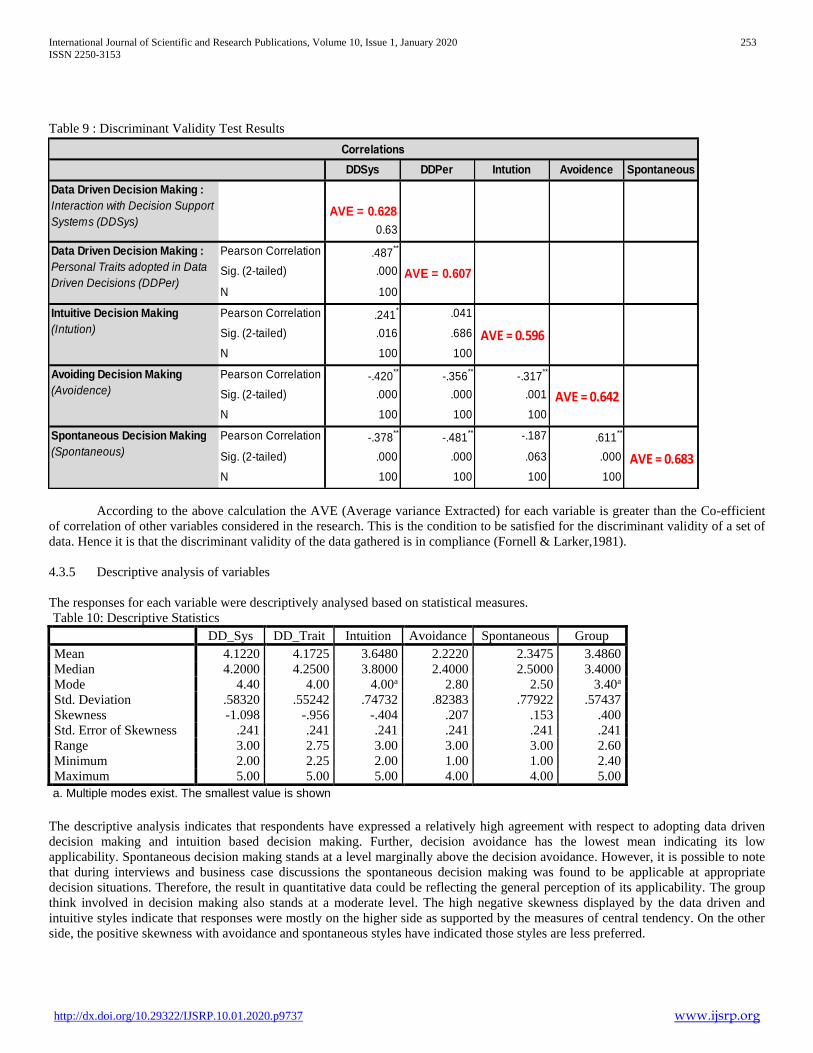
International Journal of Scientific and Research Publications, Volume 10, Issue 1, January 2020 253
ISSN 2250-3153
http://dx.doi.org/10.29322/IJSRP.10.01.2020.p9737 www.ijsrp.org
Table 9 : Discriminant Validity Test Results
According to the above calculation the AVE (Average variance Extracted) for each variable is greater than the Co-efficient
of correlation of other variables considered in the research. This is the condition to be satisfied for the discriminant validity of a set of
data. Hence it is that the discriminant validity of the data gathered is in compliance (Fornell & Larker,1981).
4.3.5 Descriptive analysis of variables
The responses for each variable were descriptively analysed based on statistical measures.
Table 10: Descriptive Statistics
DD_Sys DD_Trait Intuition Avoidance Spontaneous Group
Mean 4.1220 4.1725 3.6480 2.2220 2.3475 3.4860
Median 4.2000 4.2500 3.8000 2.4000 2.5000 3.4000
Mode 4.40 4.00 4.00a 2.80 2.50 3.40a
Std. Deviation .58320 .55242 .74732 .82383 .77922 .57437
Skewness -1.098 -.956 -.404 .207 .153 .400
Std. Error of Skewness .241 .241 .241 .241 .241 .241
Range 3.00 2.75 3.00 3.00 3.00 2.60
Minimum 2.00 2.25 2.00 1.00 1.00 2.40
Maximum 5.00 5.00 5.00 4.00 4.00 5.00
a. Multiple modes exist. The smallest value is shown
The descriptive analysis indicates that respondents have expressed a relatively high agreement with respect to adopting data driven
decision making and intuition based decision making. Further, decision avoidance has the lowest mean indicating its low
applicability. Spontaneous decision making stands at a level marginally above the decision avoidance. However, it is possible to note
that during interviews and business case discussions the spontaneous decision making was found to be applicable at appropriate
decision situations. Therefore, the result in quantitative data could be reflecting the general perception of its applicability. The group
think involved in decision making also stands at a moderate level. The high negative skewness displayed by the data driven and
intuitive styles indicate that responses were mostly on the higher side as supported by the measures of central tendency. On the other
side, the positive skewness with avoidance and spontaneous styles have indicated those styles are less preferred.
DDSys DDPer Intution Avoidence Spontaneous
Pearson Correlation
Sig. (2-tailed) AVE = 0.628
N 0.63
Pearson Correlation .487**
Sig. (2-tailed) .000 AVE = 0.607
N 100
Pearson Correlation .241* .041
Sig. (2-tailed) .016 .686 AVE = 0.596N 100 100
Pearson Correlation -.420**
-.356**
-.317**
Sig. (2-tailed) .000 .000 .001 AVE = 0.642N 100 100 100
Pearson Correlation -.378**
-.481** -.187 .611
**
Sig. (2-tailed) .000 .000 .063 .000 AVE = 0.683N 100 100 100 100
Correlations
Data Driven Decision Making :
Interaction with Decision Support
Systems (DDSys)
Data Driven Decision Making :
Personal Traits adopted in Data
Driven Decisions (DDPer)
Intuitive Decision Making
(Intution)
Avoiding Decision Making
(Avoidence)
Spontaneous Decision Making
(Spontaneous)

International Journal of Scientific and Research Publications, Volume 10, Issue 1, January 2020 254
ISSN 2250-3153
http://dx.doi.org/10.29322/IJSRP.10.01.2020.p9737 www.ijsrp.org
4.4 Summary of Findings
In summary it was discovered that these companies do not restrict to one decision making approach for their business
decisions. Based on the nature of the decision, its importance, the time constrains involved as well as the impact that is being exerted
to the bottom line, companies use a combination of decision making approaches. Decisions related to economic aspects are largely
driven by data as well as intuition in these companies. They consider data as an important aspect as it gives quantification to the
problem, identify the extent of implementation as well as provide a quantified review of the degree of success in the decision.
This is similar to decisions involving the environmentally sustainable aspect as well. In this context the decision maker used
a combination of data and intuitive decision making approaches to arrive at an effective business decisions. According to the research
findings there is an element of spontaneous decision making also taking place in this area of decision making. It was highlighted that
most of the environmental related decisions have to be spontaneous without excessive deliberations.
Social sustainability related decisions are also dominated by data driven and intuition based decision making styles. The
research findings suggest that social sustainability decisions need to be carefully evaluated in terms of costs benefits as well as an
element of intuition is important when making the most suitable decisions which provides maximum benefit to the community.
The research findings strongly suggest that in all the above decision making circumstances there is a high degree of group
influence. This is due to none of these decisions can be made by one person as they require multitude of expertise in respective fields.
Further it also requires experiential ability and experiential engagement of such disciplined resource personnel. Most importantly if
the decisions need to be accepted across the company there should be a cross functional involvement in its making. Hence group
decision making influences relationship between all aspects of the decision making styles and the performance of private sector
apparel manufacturing companies in Sri Lanka. Therefore, group decision making is considered to be a strong moderator in the
decision making process.
5. RECOMMENDATIONS
The aim of this research study was to identify strategic and tactical level decision making styles of private sector apparel
manufacturing companies in Sri Lanka and their resulting impact on company performance. In order to achieve this aim, a
comprehensive research was conducted within a selected sample of companies. Based on these findings and knowledge gained from
the literature review the following recommendation is formulated by applying the decision making style of these companies to the
established process of Rational Decision Making Model.
5.1 Application of Rational Decision Making Model
Rational decision making is a multi-step process, of decision making starting from problem identification, analysis, and
generation of alternatives, evaluation, and selection of alternatives, implementation and monitoring. There are three fundamental
aspects of the rational decision making model. These could be identified as follows.
1. Problem Identification
2. Alternative Generation
3. Implementation & Monitoring
Within these fundamental aspects, various steps of rational decision making model would be applied. According to this
research study it was identified that there is no one unique style where private sector apparel companies in Sri Lanka adopt for
strategic and tactical management decisions. It was evident that companies adopt a mix approach of data driven style, intuition style
and spontaneous style in their business decisions which is again moderated by the influence of group decision making. However,
these companies do identify the problem in hand, generate alternative decisions or solutions and implement, monitor the decisions to
resolve the problem or to achieve the objective.
Therefore, various decision making styles are applied in each of these above stages of rational decision making model. Thus,
the rational decision model being the core framework of decision making. various decision making styles will be applied in each
stages of the framework. Figure 4 below identifies various steps involved in rational decision making model and how each decision
making styles identified in this research impact the steps in the rational model.
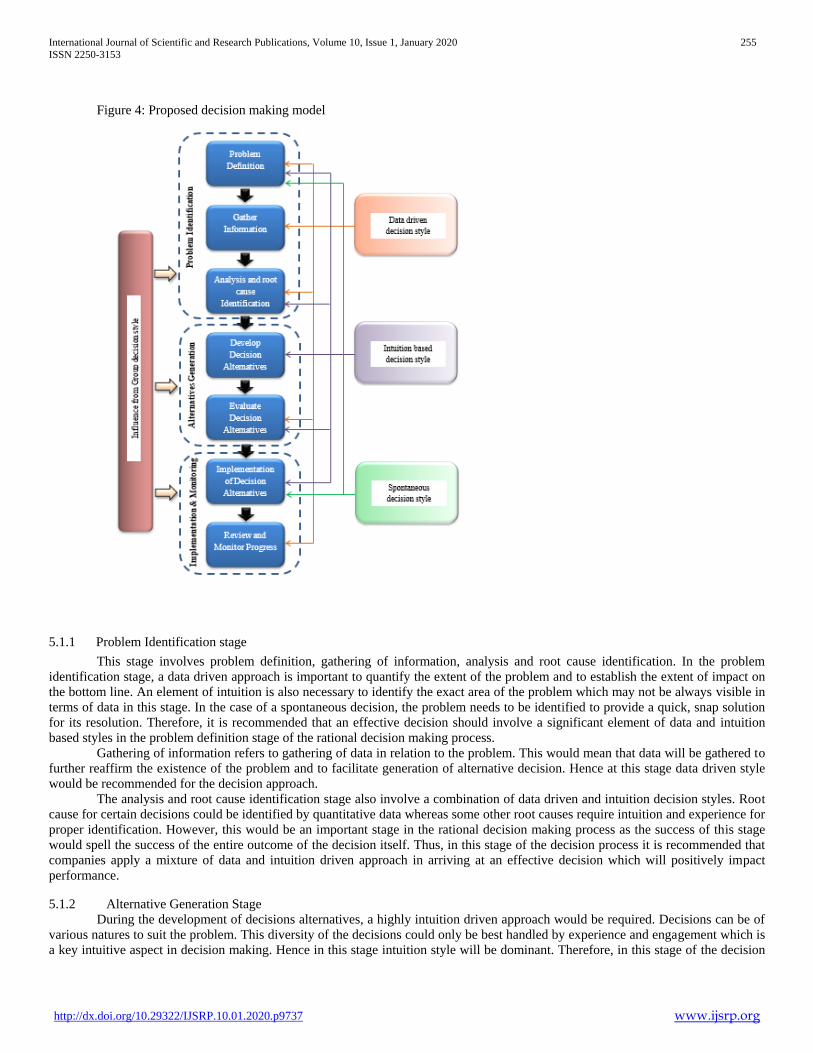
International Journal of Scientific and Research Publications, Volume 10, Issue 1, January 2020 255
ISSN 2250-3153
http://dx.doi.org/10.29322/IJSRP.10.01.2020.p9737 www.ijsrp.org
Figure 4: Proposed decision making model
5.1.1 Problem Identification stage
This stage involves problem definition, gathering of information, analysis and root cause identification. In the problem
identification stage, a data driven approach is important to quantify the extent of the problem and to establish the extent of impact on
the bottom line. An element of intuition is also necessary to identify the exact area of the problem which may not be always visible in
terms of data in this stage. In the case of a spontaneous decision, the problem needs to be identified to provide a quick, snap solution
for its resolution. Therefore, it is recommended that an effective decision should involve a significant element of data and intuition
based styles in the problem definition stage of the rational decision making process.
Gathering of information refers to gathering of data in relation to the problem. This would mean that data will be gathered to
further reaffirm the existence of the problem and to facilitate generation of alternative decision. Hence at this stage data driven style
would be recommended for the decision approach.
The analysis and root cause identification stage also involve a combination of data driven and intuition decision styles. Root
cause for certain decisions could be identified by quantitative data whereas some other root causes require intuition and experience for
proper identification. However, this would be an important stage in the rational decision making process as the success of this stage
would spell the success of the entire outcome of the decision itself. Thus, in this stage of the decision process it is recommended that
companies apply a mixture of data and intuition driven approach in arriving at an effective decision which will positively impact
performance.
5.1.2 Alternative Generation Stage
During the development of decisions alternatives, a highly intuition driven approach would be required. Decisions can be of
various natures to suit the problem. This diversity of the decisions could only be best handled by experience and engagement which is
a key intuitive aspect in decision making. Hence in this stage intuition style will be dominant. Therefore, in this stage of the decision

International Journal of Scientific and Research Publications, Volume 10, Issue 1, January 2020 256
ISSN 2250-3153
http://dx.doi.org/10.29322/IJSRP.10.01.2020.p9737 www.ijsrp.org
making process it is recommended for the company to weigh more on the intuitive decision making style as it would generate more
thought through result specific decision which will be favorable for company performance.
Once decision alternatives are developed, they need to be evaluated in order to access its suitability for the solution intended.
Hence in the evaluation of decision alternatives stage a data driven approach is necessary in order to assess the cost of implementing
the decision, potential benefit and a quantification of possible risk areas. Further in this stage intuition approach is also necessary for
the selection of best decision alternative and to understand which decision alternative would be best embraced by all the stakeholders
involved in the process and to gauge on any non-quantifiable repercussions of the decision. Therefore, at this stage a data driven style
coupled with intuition would be recommended for an effective decision.
5.1.3 Implementation & Monitoring Stage
This stage involves implementation of the selected decision alternative and review and monitoring of the progress.
Implementation of the selected decision alternative is a solely based on intuition as it involves significant human interactions. This is
similar when it comes to spontaneous decisions as well. Implementation involves experiential ability in relation to “getting things
done” and experiential engagement in “being a part of the solution”. Therefore, at this stage of the decision making process it is
recommended that the decision makers use an intuition based approach towards the decision.
Post implementation review and monitoring is also a key part in rational decision making process. This involves gathering
data of the progress, review with original objectives and targets; identify variances taking further corrective measures. In this stage
data driven approach plays a key role in gathering data, analyzing progress and identifying variances. Thus, a data driven approach is
recommended for this stage of the decision process.
In all the above stages of the rational decision making model there is a significant level of influence exerted by group
decision making styles and group think. This is due to better idea generation from knowledge synergies with the group, brainstorming,
decision acceptance within the cross functional departments and to promote successful decision implementation. Hence according to
the research findings it is recommended that the group moderation towards the decision making is recommended at all levels of the
rational decision making model.
6. LIMITATIONS OF THE STUDY
The above research study was conducted to identify strategic and tactical level decision making styles for private sector
apparel manufacturing companies operating in Sri Lanka and how it has impacted the performance of such organizations. The
research is within a framework that identifies decision making styles as data driven, intuition based, spontaneous and being moderated
or influenced by group decision aspect. Although the study is conducted within the above framework the following limitations could
be identified which will be a contingency for the outcome of the study.
Organizational Culture – This is one of the key aspects in organizational decision making. The concept of culture is
generally used in the corporate world to represent an established set of beliefs, values of society, behaviors that attribute to the
performance of an organization [34]. Hence organizational culture would have a significant impact in the type of decision making
style adopted within the organization. If the organization is used to a Hierarchy based cultures an element of power and authority
would come in to play in decision making. Hence the decision style could be more prone to the beliefs at the top layer of the
management structure. If the organization is driven by market oriented or result based culture there would be more independence in
making decisions at lower level. Hence the style of decision making would vary significantly in this context. Therefore, organizational
culture would have an impact on the decision making style which is not considered in this research study. To this extent the
applicability of this research will be limited.
Emotional Intelligence – The level of emotional intelligence possessed by the decision maker will also have a significant
impact on the decision styles which is not considered in this research. The level of emotional intelligence possessed by the decision
makers can make a significant impact on using an appropriate decision making approach and thus superior performance in the
organization [35]. Therefore, the emotional intelligence aspect is considered as a limitation for this research study.
Leadership Styles – The leadership styles adopted by the management is also a key factor contributing to the decision
making approaches in the organization. Various styles invoke different level of employee engagement, independence. This could
affect the decision styles. This research does not factor in leadership styles influencing decision making in companies operating in the
apparel sector of Sri Lanka.
Industry – This research study is limited to apparel sector decision making styles. However similar decisions are made in
various other sectors such as financial services, FMCG manufacturing, conglomerates, etc. The scope of the research being limited to
apparel sector also is considered as a limitation to the research study.
Sample Size & Respondents Profiles – The sample size of the research is ten companies operating in apparel sector in Sri
Lanka. However according to apparel exporters association statistics there are approximately 70 medium to large scale apparel
companies in Sri Lanka producing for the export market. Therefore the sample size would restrict the findings of this research which
is a limitation. Further the respondents in this research were strategic and tactical level decision makers. However in the apparel
industry many ground level decisions are made by operational level decision makers as well. This is also not considered in the
research which limits the scope of this paper.

International Journal of Scientific and Research Publications, Volume 10, Issue 1, January 2020 257
ISSN 2250-3153
http://dx.doi.org/10.29322/IJSRP.10.01.2020.p9737 www.ijsrp.org
7. CONTRIBUTION TO THEORY AND PRACTICE
This study dealt with styles of decision making adopted by apparel manufacturing companies in Sri Lanka and its resulting
impact on performance. The Study identified how the theory of decision making can be applied in a practical context especially in the
domain of apparel industry. Thereby this study assessed the impact of such decision approaches exerted on organizational
performance. The key theoretical contribution of this research was how each of the decision making approaches namely data driven,
intuition and spontaneous approach would be applied to the established rational decision making model. This means the rational
decision making model could be effectively applied to decision making in the apparel industry. In a practical context this study gives
an insight to a decision maker on how to use the data driven decision approaches, intuition and spontaneous approaches for effective
corporate decisions. This Paper also highlights the areas within the rational decision making model these styles could be adopted.
These would be the key contribution from this research study towards theoretical framework and practical application.
8. DIRECTION FOR FURTHER RESEARCH
The direction for further research spinning off from this research study comes mainly from its limitations. Further research
could be conducted to evaluate the impact of company culture influencing decision making styles of organizations. Further the level
of emotional intelligence possessed by the decision makers influencing decision making styles. It would also be worthy to research on
leadership styles and decision making in organizations and its impact on organizational performance. This research dealt with apparel
industry in Sri Lanka. However further research could be conducted in other industries mainly financial services industry where the
researcher assumes that data driven decision approach would play a more vital role. This research also was focused on companies
producing for the export market. Therefore the decision making styles for companies operating in local market context and the
resulting impact on their performance also could be an interesting area for further research study.
9. CONCLUSION
In the modern dynamic business environment organizational decision making is a vital element in determining the success or
failure of competitive organizations. Businesses face challenging decisions which are extremely important and thus impact the core
existence of organizations. However decision making is not always a scientific or a modular approach. It includes a behavioral aspect
of the individuals involved in the process as well. Hence whilst the style of decision making would differ from person to person it
would also differ from the type of the decision, the circumstance on which the decision is arrived on as well as the practices and
established methodologies beliefs in the industry.
This research paper attempted to identify the decision making styles at strategic and tactical in private sector apparel
manufacturing companies in Sri Lanka and its resulting impact on its performance. Further it also identified the key moderator in such
decisions which was group think aspect. Thereby various decision making styles and approaches were identified during the progress
of this research and the circumstances of such styles likely being used in the industry was also identified.
The insights gathered herein was them applied to the established rational decision making model and the transformation of
the rational decision making model by the application of various decision making styles were also discussed. In conclusion the
research has identified various decision making styles adopted in the apparel industry in Sri Lanka for its strategic and tactical
decisions and had conferred the findings in to the rational decision making model to provide a holistic view of decision making in
private sector apparel manufacturing companies in Sri Lanka. Thereby the researcher identified and recommended the best suited
decision making styles that could be adapted at different stages of the rational decision making model for strategic and tactical
decision making in private sector apparel manufacturing companies in Sri Lanka.

International Journal of Scientific and Research Publications, Volume 10, Issue 1, January 2020 258
ISSN 2250-3153
http://dx.doi.org/10.29322/IJSRP.10.01.2020.p9737 www.ijsrp.org
References
[1] Central Bank of Sri lanka, "Central Bank of Si Lanka Annual Report 2015," 2015. [Online]. Available: from http://www.cbsl.gov.lk/pics_n_docs/ 10_pub/_docs
/efr/annual_report/AR2015/English/content.htm. [Accessed 23 September 2017].
[2] Scott and Bruce, "Decision making styles: The development and assessment of new measure," Educational and Psychological Measurement, pp. 818-831, 1995.
[3] A. J. Rowe and J. D. Boulgarides, Managerial Decision Making, New York, 1992.
[4] S. P. Robbins and M. Coulter, Management, Prentice Hall, 2002.
[5] F. A. Russ, K. M. McNeilli and J. M. Comer, "Leadership, decision making and performance of sales managers: a multi - level approach," Journal of Personal
Selling & Sales, vol. XIV, no. 3, pp. 1-15, 1996.
[6] S. Muneer and S. U. Rehman, "Materialization of Behavioural Fanance and Behavioural Portfolio Theory : A brief Review," Journal of Economics and
Behavioural Studies, pp. 431-435, 2012.
[7] E. B. Mandinach, M. Honey and D. Light, "A Theoretical Framework for Data-Driven Decision Making," in Annual meeting of AERA, San Francisco, San
Francisco, 2006.
[8] T. H. Davenport, "How to Design Smart Business Experiments," Harvard Busioness Review, 2009.
[9] R. Rowan, The Intuitive Manager, Boston: Little, Brown and Company., 1986.
[10] C. Barnard, The Functions of Executive, Harvard University Press, 1968.
[11] J. Welch and J. A. Bryne, Jack: Straight From the Gut, New York: Warner Books, 2001.
[12] W. H. Agor, Intuition in organizations: Leading and managing productively, Sage Publications, 1989.
[13] Bonabeau, "Don't Trust Your Gut," Harvard Business Review, 2003.
[14] Brynjolsson, E. Lorin and H. Heekyung, "'Strength in Numbers: How Does Data-Driven Decisionmaking Affect Firm Performance?'," SSRN, pp. 1-33, 2011.
[15] F. D. Davis, "'Technology Acceptance Model for Empirically Testing New End- User Information Systems: Theory and Results'," Doctoral Dissertation Thesis,
Massachusetts Institute of Technology, USA, 1986.
[16] R. R. Rehman, A. Khalid and M. Khan, "Impact of Employee Decision Making Styles on Organizational Performance: In the Moderating Role of Emotional
Intelligence," World Applied Sciences Journal, no. 17(10), pp. 1308-1315, 2012.
[17] R. Pacini and S. Epstein, "The relation of rational and experiential information processing styles to personality, basic," Journal of Personality and Social
Psychology, no. 76, pp. 972 - 987, 1999.
[18] M. Gunnarsson, Group Decisipn Making, Verlag, 2010.
[19] S. P. Robbins and T. A. Judge, Organisational Behaviour, 14th, Ed., Upper Saddle River: Prentice Hall, 2011.
[20] R. Elena, K. Konstantinos and V. Dimitra, "Web Based Group Decision Making In Human Resources Management.," International Symposium on the Analytic
Hierarchy Process, 2011.
[21] W. B. Gudykunst, "Cultural variability in communication," Communication Research, no. 24(4), pp. 327 - 348, 1997.
[22] F. Lunenburg, "Group Decision Making: The Potential for Groupthink," International Journal of Management, Business and Administration, pp. 1-6, 2010.
[23] I. L. Janis, "Victims of Groupthink," Political Psychology, vol. 12, no. 2, pp. 247-278, 1991.
[24] L. Jia, D. J. Hall and J. Song, "The Conceptualization of Data-driven Decision Making Capability," in America Conference on Information Systems, 2015.
[25] M. Saunders, P. Lewis and A. Thornhill, Research Methods for Business Students, 5th ed., 2007, p. 106.
[26] M. Saunders and P. Torsey, The layers of research design, Rapport, 2014, pp. 58-59.
[27] R. B. Kline, Principles and practice of structural equation modeling, USA: The Guilford Press, 2011.
[28] D. T. Campbell and D. W. Fisk, "Convergent and discriminant validation by the multitrait- multimethod matrix," Psychological Bulletin, p. 56, 1959.
[29] C. Fornell and D. Larker, "Evaluating Structural Equation Models with Unobservable Variables and Measurement Error," Journal of Marketing Research, pp. 39-
50, 1981.
[30] U. Sekeran and R. Bougie, Research Methods for Business. A skill building approach., 5th ed., Haddington: John Wiley and Sons, 2010.
[31] M. S. Bartlette, "Properties of sufficiency and statistical tests," Proceedings of Royal Statistical Society, pp. 268-282, 1937.
[32] Y. S. Lincon and E. G. Guba, Naturalistic Enquiry, Newbury Park: CA: SAGE publications, 1985.
[33] D. Silverman, Doing Qualitative Research: A practical Handbook, SAGE Publications, 2013.
[34] G. Hofsted, CultCulture’s Consequences: Comparing Values, Behaviors, Institutions, and Organizations Across Nations, Sage, 2001.
[35] D. Goleman, "An EI-Based Theory of Performance," The Emotionally Intelligent Workplace, pp. 27-44, 2001.
[36] T. D. Campbell and D. W. Fiske, "Convergent and Discriminant Validation by the multitrait- multi method matrix.," Psychological bulletin, pp. 56-81, 1959.
[37] "Group Decision Making: The Potential for Groupthink," International Journal of Management, Business and Administration, pp. 1-6, 2010.
AUTHORS
First Author – Nadeeja Dodamgoda, BSc (Engineering), MBA, MSc in Applied Statistics, Senior Lecturer. [email protected]
Second Author – Furkan Ziyard, MBA, [email protected]
International Journal of Scientific and Research Publications, Volume 10, Issue 1, January 2020 259
ISSN 2250-3153
http://dx.doi.org/10.29322/IJSRP.10.01.2020.p9738 www.ijsrp.org
Profile of Condyloma Acuminatum Patients with
Syphilis and HIV/AIDS in Haji Adam Malik General
Hospital January 2013 - December 2018
Benjamin Ricardo R. Lbn Tobing*, Richard Hutapea**, Kristina Nadeak**
*Post graduate of Dermatology and and Venereology, Faculty of Medicine, Universitas Sumatera Utara, Medan, Indonesia
**Departement of Dermatology and Venereology, Faculty of Medicine, Universitas Sumatera Utara, Medan, Indonesia
DOI: 10.29322/IJSRP.10.01.2020.p9738
http://dx.doi.org/10.29322/IJSRP.10.01.2020.p9738
Abstract- Introduction : Condyloma acuminatum (CA) is a
sexually transmitted disease that is currently a worldwide
epidemic. Data collected in the United States found about 20
million new cases of sexually transmitted infections (STIs), and
about 14 million cases were Human Papilloma Virus (HPV)
infections. Worldwide data collected by WHO, recorded about 1
million cases occur every day around the world. This phenomenon
shows that CA is an STI that is quite common in the population.
Objective : To understand the profile of CA patients with
syphilis and HIV/AIDS in the Department of Dermatology and
Venereology Divison of Sexually Transmitted Diseases Haji
Adam Malik General Hospital Medan during the period of 1st
January 2013 - 31st December 2018
Subjects and methods : Subjects were the patient's medical
record data in Department of Dermatology and Venereology Haji
Adam Malik General Hospital Medan from 1st January 2013 - 31st
December 2018 using descriptive retrospective method.
Results : Patients CA with syphilis and HIV/AIDS was 10
people, with the majority of male sex was 6 (60%), in the age
group 17-25 years was 5 (50%), in the homosexual group was 4
(40 %), with the number of sexual partners more than 1 was 6
(60%), at the perianal location was 6 (60%) , acuminatum form
was 5 (50%), with a CD4+ 500-200 cell/ mm3 was 5 (50%), and
TCA application was 10 (100%).
Conclusion : The number of CA patients with syphilis and
HIV/AIDS in Haji Adam Malik General Hospital from 1st January
2013 to 31st December 2018 was 10 people, with the majority of
male sex, in the age group 17-25 years, homosexual group,
number of sexual partners more than 1, perianal location,
acuminatum form, homosexual group, CD4+ 500-200 count, and
TCA application.
Index Terms- condyloma acuminatum, syphilis, HIV/AIDS,
profile
I. INTRODUCTION
ondyloma acuminatum (CA) is a sexually transmitted disease
that is currently a worldwide epidemic. The prevalence of CA
is estimated at 1% in the sexually active population and has
increased to 25% in 2008 - 2010 in the United States. Clinical
features may be papillomatous papules or nodules such as
cauliflower found on mucous membranes or skin of external
genitalia. In addition to CA, one of the other sexually transmitted
diseases that are often found is syphilis. In some cases syphilis
often seroconversion in patients with HIV/AIDS. Syphilis is a
contagious infectious disease that is chronic and in its course can
attack other systems in the body to several organs at different
clinical levels, and Treponema sp. is the main causative agent.
Syphilis has become an epidemic infectious disease throughout the
world and is increasing in patients with HIV/AIDS. All HIV/AIDS
patients must be tested for syphilis.1
Syphilis and CA also often occur together or coinfection
in HIV/AIDS. Several studies, both research and case studies have
found many cases of syphilis with CA. Both of these pathogens
are very closely related to the integrity of the epithelium as the
main barrier to infection infection.2
The HIV/AIDS will interfere with the integrity of the
mucosal epithelial barrier which allows the translocation of
viruses and bacteria. The presence of HIV and HPV viruses can
be a risk factor for syphilis infection, conversely syphilis, which is
generally in the form of chancre/ulcer durum at the primary stage,
is also a risk factor for the entry of HIV and HPV viruses.
HIV/AIDS is currently a sexually transmitted disease that has
become an epidemic throughout world. Sexually transmitted
infections that occur can be single to multiple due to the low
resistance system against pathogens that enter the body.3
Genital warts are a sexually transmitted disease that is
also often found in patients with HIV/AIDS. Data collected in the
United States found about 20 million new cases of STIs, and about
14 million cases were HPV infections. Worldwide data collected
by WHO, recorded about 1 million cases occur every day around
the world. This phenomenon shows that CA is a sexually
transmitted infection which is quite commonly found in the
population of sexually transmitted infections.4,5
Immunologically this infection will directly deal with the
cellular immune system. In patients with HIV/AIDS that are
infected with CA will be difficult to experience healing and tend
to develop with larger lesions. The prevalence of HPV infection
will increase in patients with immunosuppression such as infection
with the HIV, immunosuppressive therapy and pregnancy with
longer manifestations and difficult virus clearance so that it
becomes a persistent infection. The condition of the immune
system decline will cause CA infection to become giant
C

International Journal of Scientific and Research Publications, Volume 10, Issue 1, January 2020 260
ISSN 2250-3153
http://dx.doi.org/10.29322/IJSRP.10.01.2020.p9738 www.ijsrp.org
condyloma. Cellular immunity is very strong role to be a defense
and clearance against CA infection.6,7,8,9
II. METHODS
This study was descriptive retrospective. This study was
conducted by looking at and re-recording medical record data
from patients at the Department of Dermatology and Venereology,
Divison of Sexually Transmitted Diseases Haji Adam Malik
General Hospital Medan from 1st January 2013 to 31st December
2018.
III. RESULTS
The number of CA patients with syphilis and HIV/AIDS who
came for treatment at the Dermatology and Venereology Policlinic
Haji Adam Malik General Hospital Medan from 2013 to 2014
based on medical record data in the Haji Adam Malik General
Hospital in Medan which qualified for the study was 10 people.
TABLE 1. FREQUENCY DISTRIBUTION BASED ON
GENDER
Gender n Percentage (%)
Male 6 60
Female 4 40
Total 10 100
Based on the table above, the most gender was male as many
as 6 patients (60%).
In a retrospective description study by Aswar at the Haji
Adam Malik General Hospital recorded in the medical record
section for the period of January 1st, 2008 - December 31st, 2011
there were 76 CA patients, the majority of which were women
(53.9%) . Research conducted by Nelwan et al at Prof. dr. R. D.
Kandou General Hospital Manado in the January - December 2012
period reported that most of the new patients were 14 women
(51.85%). While the retrospective study conducted by Lang et al
in Canada from 2006-2016 reported the most syphilis cases in
HIV/AIDS were found in 183 men (94.3%) . The difference in the
results of this study with other studies can be influenced by the
small number of samples and the tendency to increase the number
of cases of MSM each year.5,6,10
TABLE 2. FREQUENCY DISTRIBUTION BASED ON
AGE
Age Group n Percentage (%)
17-25 5 50
26-35 4 40
36-45 1 10
Total 10 100
Based on the table above, the most age distribution was 17-
25 years old as many as 5 patients (50%).
CA infection usually occurs during the active sexual period
of 1% and there is a possibility of a tendency towards changes in
sexual lifestyle habits and changing attitudes or adding partners in
this age group which has a role in increasing the prevalence of
HPV infection, especially CA.According to the AIDS
Commission in 2007 an important age distribution to note, because
the younger a person is, the more susceptible to contracting
sexually transmitted diseases. In the age group of men 20-34 years
and women 16-24 years old are classified as high risk for sexually
transmitted diseases.11,12
TABEL 3. FREQUENCY DISTRIBUTION BASED ON
SEXUAL ORIENTATION
Sexual Orientation n Percentage (%)
Homosexual 4 40
Heterosexual 3 30
Bisexual 3 30
Total 10 100
Based on the table above, the most sexual orientation was
homosexual as many as 4 patients (40%).
This is consistent with the literature that CA with anorectal
lesions usually affects homosexual men infected with HIV/AIDS.
The prevalence and recurrence rates of perianal condyloma are
much higher in individuals with impaired immunity compared to
healthy individuals. The incidence of HPV infection in
homosexual men has doubled compared to heterosexuals.11,12
TABEL 4 FREQUENCY DISTRIBUTION BASED ON
SEXUAL PARTNER
Sexual Partner n Percentage (%)
1 person 4 40
>1 person 6 60
Total 10 100
Based on the table above, the most patient with sexual
partners was >1 person as many as 6 patients (60%)
The results of this study are in line with studies conducted
by Assi et al in Lebanon regarding the prevalence of HIV/AIDS
and other STDs and their relationship with sexual practices in
2.238 MSM reporting that 78% of patients had more than one
sexual partner in the last 3 months. The large number of sexual
partners accompanied by inconsistent use of condoms will
increase a person's risk factors for getting sexually transmitted
infections.13
TABEL 5. FREQUENCY DISTRIBUTION BASED ON
LOCATION
Location n Percentage (%)
Genital 4 40
Perianal 6 60
Total 10 100
Based on the table above, the most location was
perianal/anal as many as 6 people (60%).
According to research in Hong Kong, the highest incidence
of CA patients in MSM or homosexual populations so that the
most lesions are usually perianal and genital. While Nelwan et al
reported the distribution of CA patients according to the location
of lesions most often found in women is in the vulva (35.71 %)
and in men is most often on the penis as many as 4 people
(30.77%).4,5
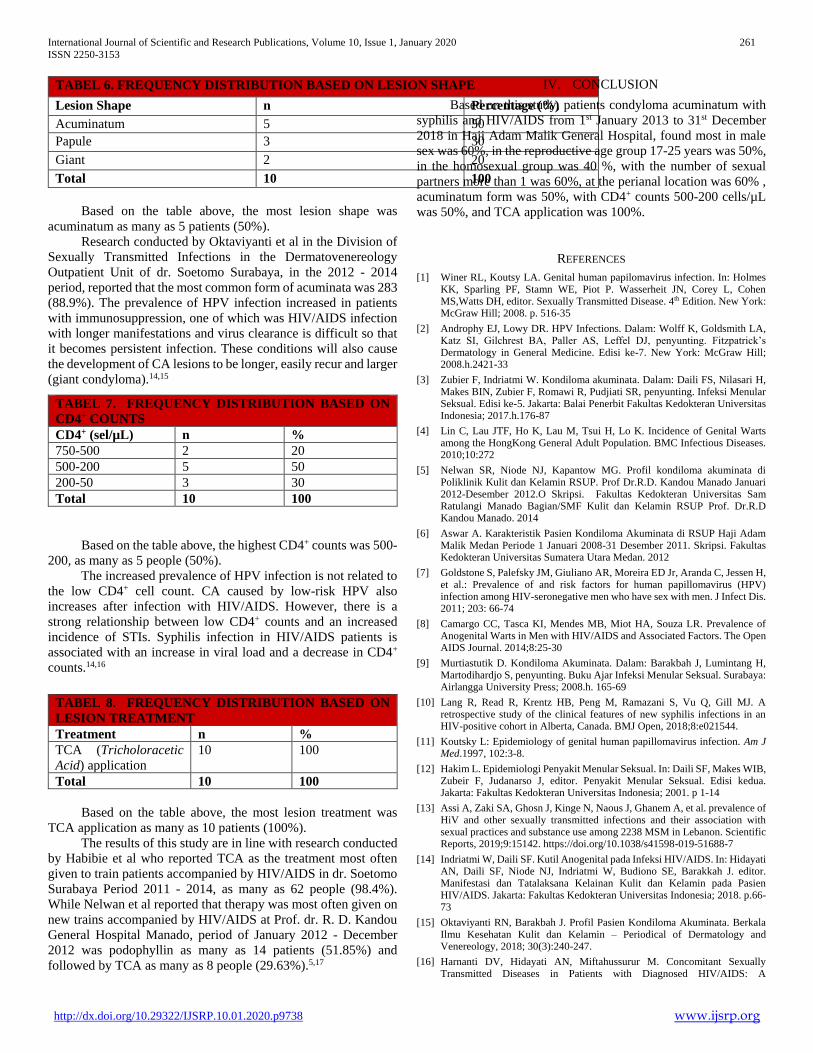
International Journal of Scientific and Research Publications, Volume 10, Issue 1, January 2020 261
ISSN 2250-3153
http://dx.doi.org/10.29322/IJSRP.10.01.2020.p9738 www.ijsrp.org
TABEL 6. FREQUENCY DISTRIBUTION BASED ON LESION SHAPE
Lesion Shape n Percentage (%)
Acuminatum 5 50
Papule 3 30
Giant 2 20
Total 10 100
Based on the table above, the most lesion shape was
acuminatum as many as 5 patients (50%).
Research conducted by Oktaviyanti et al in the Division of
Sexually Transmitted Infections in the Dermatovenereology
Outpatient Unit of dr. Soetomo Surabaya, in the 2012 - 2014
period, reported that the most common form of acuminata was 283
(88.9%). The prevalence of HPV infection increased in patients
with immunosuppression, one of which was HIV/AIDS infection
with longer manifestations and virus clearance is difficult so that
it becomes persistent infection. These conditions will also cause
the development of CA lesions to be longer, easily recur and larger
(giant condyloma).14,15
Based on the table above, the highest CD4+ counts was 500-
200, as many as 5 people (50%).
The increased prevalence of HPV infection is not related to
the low CD4+ cell count. CA caused by low-risk HPV also
increases after infection with HIV/AIDS. However, there is a
strong relationship between low CD4+ counts and an increased
incidence of STIs. Syphilis infection in HIV/AIDS patients is
associated with an increase in viral load and a decrease in CD4+
counts.14,16
Based on the table above, the most lesion treatment was
TCA application as many as 10 patients (100%).
The results of this study are in line with research conducted
by Habibie et al who reported TCA as the treatment most often
given to train patients accompanied by HIV/AIDS in dr. Soetomo
Surabaya Period 2011 - 2014, as many as 62 people (98.4%).
While Nelwan et al reported that therapy was most often given on
new trains accompanied by HIV/AIDS at Prof. dr. R. D. Kandou
General Hospital Manado, period of January 2012 - December
2012 was podophyllin as many as 14 patients (51.85%) and
followed by TCA as many as 8 people (29.63%).5,17
IV. CONCLUSION
Based on this study, patients condyloma acuminatum with
syphilis and HIV/AIDS from 1st January 2013 to 31st December
2018 in Haji Adam Malik General Hospital, found most in male
sex was 60%, in the reproductive age group 17-25 years was 50%,
in the homosexual group was 40 %, with the number of sexual
partners more than 1 was 60%, at the perianal location was 60% ,
acuminatum form was 50%, with CD4+ counts 500-200 cells/µL
was 50%, and TCA application was 100%.
REFERENCES
[1] Winer RL, Koutsy LA. Genital human papilomavirus infection. In: Holmes KK, Sparling PF, Stamn WE, Piot P. Wasserheit JN, Corey L, Cohen MS,Watts DH, editor. Sexually Transmitted Disease. 4th Edition. New York: McGraw Hill; 2008. p. 516-35
[2] Androphy EJ, Lowy DR. HPV Infections. Dalam: Wolff K, Goldsmith LA, Katz SI, Gilchrest BA, Paller AS, Leffel DJ, penyunting. Fitzpatrick’s Dermatology in General Medicine. Edisi ke-7. New York: McGraw Hill; 2008.h.2421-33
[3] Zubier F, Indriatmi W. Kondiloma akuminata. Dalam: Daili FS, Nilasari H, Makes BIN, Zubier F, Romawi R, Pudjiati SR, penyunting. Infeksi Menular Seksual. Edisi ke-5. Jakarta: Balai Penerbit Fakultas Kedokteran Universitas Indonesia; 2017.h.176-87
[4] Lin C, Lau JTF, Ho K, Lau M, Tsui H, Lo K. Incidence of Genital Warts among the HongKong General Adult Population. BMC Infectious Diseases. 2010;10:272
[5] Nelwan SR, Niode NJ, Kapantow MG. Profil kondiloma akuminata di Poliklinik Kulit dan Kelamin RSUP. Prof Dr.R.D. Kandou Manado Januari 2012-Desember 2012.O Skripsi. Fakultas Kedokteran Universitas Sam Ratulangi Manado Bagian/SMF Kulit dan Kelamin RSUP Prof. Dr.R.D Kandou Manado. 2014
[6] Aswar A. Karakteristik Pasien Kondiloma Akuminata di RSUP Haji Adam Malik Medan Periode 1 Januari 2008-31 Desember 2011. Skripsi. Fakultas Kedokteran Universitas Sumatera Utara Medan. 2012
[7] Goldstone S, Palefsky JM, Giuliano AR, Moreira ED Jr, Aranda C, Jessen H, et al.: Prevalence of and risk factors for human papillomavirus (HPV) infection among HIV-seronegative men who have sex with men. J Infect Dis. 2011; 203: 66-74
[8] Camargo CC, Tasca KI, Mendes MB, Miot HA, Souza LR. Prevalence of Anogenital Warts in Men with HIV/AIDS and Associated Factors. The Open AIDS Journal. 2014;8:25-30
[9] Murtiastutik D. Kondiloma Akuminata. Dalam: Barakbah J, Lumintang H, Martodihardjo S, penyunting. Buku Ajar Infeksi Menular Seksual. Surabaya: Airlangga University Press; 2008.h. 165-69
[10] Lang R, Read R, Krentz HB, Peng M, Ramazani S, Vu Q, Gill MJ. A retrospective study of the clinical features of new syphilis infections in an HIV-positive cohort in Alberta, Canada. BMJ Open, 2018;8:e021544.
[11] Koutsky L: Epidemiology of genital human papillomavirus infection. Am J Med.1997, 102:3-8.
[12] Hakim L. Epidemiologi Penyakit Menular Seksual. In: Daili SF, Makes WIB, Zubeir F, Judanarso J, editor. Penyakit Menular Seksual. Edisi kedua. Jakarta: Fakultas Kedokteran Universitas Indonesia; 2001. p 1-14
[13] Assi A, Zaki SA, Ghosn J, Kinge N, Naous J, Ghanem A, et al. prevalence of HiV and other sexually transmitted infections and their association with sexual practices and substance use among 2238 MSM in Lebanon. Scientific Reports, 2019;9:15142. https://doi.org/10.1038/s41598-019-51688-7
[14] Indriatmi W, Daili SF. Kutil Anogenital pada Infeksi HIV/AIDS. In: Hidayati AN, Daili SF, Niode NJ, Indriatmi W, Budiono SE, Barakkah J. editor. Manifestasi dan Tatalaksana Kelainan Kulit dan Kelamin pada Pasien HIV/AIDS. Jakarta: Fakultas Kedokteran Universitas Indonesia; 2018. p.66-73
[15] Oktaviyanti RN, Barakbah J. Profil Pasien Kondiloma Akuminata. Berkala Ilmu Kesehatan Kulit dan Kelamin – Periodical of Dermatology and Venereology, 2018; 30(3):240-247.
[16] Harnanti DV, Hidayati AN, Miftahussurur M. Concomitant Sexually Transmitted Diseases in Patients with Diagnosed HIV/AIDS: A
TABEL 7. FREQUENCY DISTRIBUTION BASED ON
CD4+ COUNTS
CD4+ (sel/µL) n %
750-500 2 20
500-200 5 50
200-50 3 30
Total 10 100
TABEL 8. FREQUENCY DISTRIBUTION BASED ON
LESION TREATMENT
Treatment n %
TCA (Tricholoracetic
Acid) application
10 100
Total 10 100

International Journal of Scientific and Research Publications, Volume 10, Issue 1, January 2020 262
ISSN 2250-3153
http://dx.doi.org/10.29322/IJSRP.10.01.2020.p9738 www.ijsrp.org
Retrospective Study. J. Infect. Dis, 2018;12(S): 83-89. https://doi.org/10.2101/Ajid.v12i1S.12
[17] Habibie DP, Barakbah J. Studi Retrospektif : Profil Pasien Kondiloma Akuminata pada HIV/AIDS. Departemen/Staf Medik Fungsional Ilmu Kesehatan Kulit dan Kelamin Fakultas Kedokteran Airlangga. RSUD Dr. Soetomo. Berkala Ilmu Kesehatan Kulit dan Kelamin. 2016;28(3)
AUTHORS
First Author – Benjamin Ricardo R. Lbn Tobing, Post graduate
of Dermatology and Venereology, Faculty of Medicine,
Universitas Sumatera Utara, [email protected]
Second Author – Richard Hutapea, Departement of
Dermatology and Venereology, Faculty of Medicine, Universitas
Sumatera Utara, [email protected]
Third Author – Kristina Nadeak, Departement of Dermatology
and Venereology, Faculty of Medicine, Universitas Sumatera
Utara, [email protected]
International Journal of Scientific and Research Publications, Volume 10, Issue 1, January 2020 263
ISSN 2250-3153
http://dx.doi.org/10.29322/IJSRP.10.01.2020.p9739 www.ijsrp.org
The Socialization Effect Of The Clean River By The
West Jakarta Sanitary Office On Healthy Life
Consciousness In Kedaung, Kali Angke Communities
Period (2015-2016)
A Rahman HI
Fakultas Ilmu Komunikasi Universitas Mercu Buana
DOI: 10.29322/IJSRP.10.01.2020.p9739
http://dx.doi.org/10.29322/IJSRP.10.01.2020.p9739
Abstract- This study is entitled the Socialization Effect of the
Clean River by the West Jakarta Sanitary Office on Healthy Life
Consciousness In Kedaung, Kali Angke Communities Period
(2015-2016). The theory used in this research was firstly, the
concept of socialization includes: the form of programs, content,
methods, media, participation and participatory socialization.
Secondly, the concept of consciousness includes: 1) Feeling
obligatory or a must, 2) Rational, 3) Freedom, and 4) Individual
responsibility. Then the method used in this study was the survey
method. The findings of this study indicate that the clean river
socialization by the West Jakarta Sanitary Office influences the
healthy life consciousness in the Kedaung, Kali Angke Urban
Community. Then finding of the study also found that the Angke
River filled with assorted domestic waste distribution of
household activity pose a problem, it was because the rapid growth
and development was not be balanced by adequate arrangements .
Index Terms- socialization, clean river, healthy life
consciousness, & society.
I. INTRODUCTION
akarta has a land area of 661.52 square km and sea of 6,977.5
square km. Based on the 2010 Population Census, it has a
population of 9.6 million. The official residents who live in
Jakarta, are not including commuters from Greater Jakarta and
other regions. In Jakarta, several rivers flow, such as Angke River,
Pesangrahan River, Grogol River, Krukut River, Cedeng River,
Sunter River, Ciliwung River, Cipinang River, Buaran River,
Cakung River, and so on.
Kali Angke or Cikeumeuh is the name of a river in Jakarta,
Indonesia. The name Kali Angke was given after the Chinese
ethnic massacre for three days by the VOC in Batavia on October
9, 1740. Angke himself actually came from the Hokkien dialect,
meaning Kali Merah. It is said that due to the incident the color of
the river turned red by the ethnic Chinese blood. Since then the
name has changed to Kali Angke.
The river is tipped in East Cilendek sub-district, West
Bogor, West Java. Then it passes through South Tangerang,
Tangerang City and empties into West Jakarta in the Muara Angke
area. This river never dries up during the dry season, because it
originates directly in the mountainous region of Bogor, as is the
Pesanggrahan River and Ciliwung River. But the change in the
function of the River into a giant rubbish bin, not only makes
people nervous, but also children. Many parents are worried that
unhealthy river conditions can cause children to get ill.
Along the river bank 2 km and width of 2 meters is almost
full with piles of trash, residential trash heaps around the river
worsen. Various types of rubbish ranging from plastic, organic
garbage to mount along the river, no wonder if the capacity of the
river becomes not optimal. Many impacts that arise when the river
turns into a giant trash can include: firstly, the shallow of the river,
the impact on the capacity of the river when the rain decreases, not
only does the earth’s capacity of rainwater cause flooding, silting
is the main trigger in Jakarta and big cities the other flood occurs
when the rainy season comes. Secondly, the spread of disease due
to spoilage of garbage close to residential areas. Thirdly, it caused
flooding waste disposal and industrial waste into rivers and
ditches. Supposedly in dealing with this problem, it takes
consciousness of all parties especially the community. So that
negative activities will not continue, such as holding socialization,
making artificial lakes, water catchments and many more. Certain
agencies must also be responsible for determining that the river is
always clean and not used as a garbage dump.
For the realization of an environmentally conscious
community, efforts must be made, ranging from promoting
consciousness of environmental law, to imposing sanctions and
strict laws against violators. This is important, because the rivers
in Jakarta must be saved, and it is the responsibility of all parties,
whoever without exception has the right to secure it. Data about
the early 1990s showed that Ciliwung get waste supply no less
than 1,654 kg per day, from 10 factories not including household
waste. Likewise, the Cipinang River was flowed with 10,658 kg
of waste every day, originating from 32 factories.
It is proper for every industrialist in Jakarta to comply with
the Jakarta Governor’s Decree regarding wastewater quality
standards. To be fully operational in the field, Bapedal (the
Environmental Impact Management Agency) must carry out its
functions optimally. With the presence of Bapedal, the Jakarta
Regional Government is expected to be more responsive and more
able to act decisively against river pollutants.
To minimize these problems, massive handling is needed
and involves all levels of society and related stakeholders. The
J
International Journal of Scientific and Research Publications, Volume 10, Issue 1, January 2020 264
ISSN 2250-3153
http://dx.doi.org/10.29322/IJSRP.10.01.2020.p9739 www.ijsrp.org
Jakarta’s socialization will only be truly successful if it has the
support of all members of the community. However all these rivers
are guarantees for survival, especially concerning the fulfillment
of water needs. Especially considering that underground water
reserves (ground water) are increasingly depleted, even in several
districts in North and West Jakarta, groundwater is brackish,
turbid, acidic and salty due to seepage of sea water.
The socialization is not only a program owned by the Jakarta
Regional Government, Bapedal, KLH or factory owner, but also a
program for all Jakarta residents. It is only right that a relationship
as a clear river province can be achieved. At one time, in addition
to clear water, rivers in Jakarta can be used for transportation and
tourism, as in Amsterdam.
The socialization conducted by the village of Kedaung, Kali
Angke is carried out by the Sanitary Office to give direction to the
residents of Kali Angke. This socialization program is not only
owned by the Jakarta provincial government, but this socialization
program is owned by all citizens of Jakarta, so it is very important
for residents of the river to be self-conscious in order to better
respect protecting an environment, especially in watersheds. This
socialization program will continue to be implemented so that
environmental cleanliness in the watershed areas is maintained,
especially in the area of the Angke riverbank.
Based on the research problem, the researcher formulated
the problem of this research i.e. “to what extent is the Effect of
Clean River Socialization by the West Jakarta Sanitary Office on
Healthy Life Consciousness in Kedaung, Kali Angke Community
2015-2016 Period?” Then the purpose of this study is to determine
the Effect of Clean River Socialization by the West Jakarta
Sanitary Office on Healthy Life Consciousness in Kedaung Kali
Angke Community Period 2015-2016.
II. THEORITICAL REVIEW
2.1 Environmental Communication
Communication is an important component in all activities
of human life. Communicating is a human obstacle to be able to
interact with one another, as is the case for an institution or
organization. According to Katz and Robert Khan, two social
psychologists from the University of Michigan Survey Research
Center, Communication is the exchange of information and the
delivery of meaning which is the main thing of a social system or
organization. So communication is a “process of delivering
information and understanding from one person to another person
and the only way to manage activities in an organization is through
a communication process (Erlita, 2018: 19). In this description, it
can be concluded that the communication process is a common
meaning that must be mutually agreed upon by the public so that
a good feedback/ response appears so that the flow of information/
messages is not interrupted and makes two-way communication
achieved between communication actors.
Environmental communication can be realized with
campaign activities aimed at educating the public by expanding
public knowledge often depending on asymmetric tactics of public
relations. Tactics that can be used through the use of controlled
media (in the form of advertisements, web sites, direct mail,
bulletins, and public service announcements) and uncontrolled
media (such as media releases, opinion pieces, and publicity of
events) (Henderson, 2005: 122 ). Robert further in Herutomo
(2013) argues that environmental communication is a pragmatic
and constructive media to provide understanding to the
community about the environment. Therefore we need a message
packaging strategy in certain communication media, this is
intended so that public consciousness and participation grows in
environmental management. The main communicators in
environmental communication are government and non-
government organizations that are committed to environmental
management (Yuliawati & Irawan, 2018: 29).
2.2 Socialization According to Elly M. Setiadi & Usman Kolip (2011: 156)
Socialization is closely related to enculturation or the process of
culture which is the process of learning from an individual to learn
to recognize, appreciate, and adjust his mind and attitude towards
customary systems, norms, language, art, religion, as well as all
regulations and establishments that live in the cultural
environment of society.
Another important thing that is also very necessary in
developing a communication strategy is to determine the
communicant’s situation and also pay attention to the specific
things related to the culture or the variety of languages used by the
communicant so that by paying attention to this important matter
later strategies can be arranged diverse but right on target (Tarone,
E 1977: 197) because it is right on target in the socialization
process how an organization can transfer the purpose of the
message from the socialization to many people of different
cultures.
According to Fajar the process of socialization in the
community has two functions, among others: a) Viewed from the
interests of individuals. Socialization aims to make individuals
recognize, acknowledge and adapt themselves to the values,
norms, and social structures that exist in society, b) Viewed from
the interests of the community. The socialization functions as a
means of preservation, dissemination and inheritance of values
and norms that exist in society, so that they remain and are
maintained by the whole community. In other words socialization
functions to: 1). Forming individual behavior patterns, 2).
Maintaining the regularity of life in society, 3). Maintaining group
integration in society (Haryati, 2018: 174).
The dimension of socialization consists of the form of
programs, content, methods, media, participation and
participatory socialization (Firdaus, 2017: 64 - 66). By
understanding this dimension, the researcher easily determined the
indicators on the operationalization of the concept, so that this
dimension of socialization could be used as a reference in the
preparation of the research questionnaire.
2.3 Consciousness
The term consciousness comes from the Latin word
“concetia” which means “to understand” (Bambang. 2013: 16). In
English there is the word “consciousness”. This consciousness
comes from the word “conscious” which means feel, know, and
understand. Consciousness is defined as understanding or a state
of understanding and is something that is felt or experienced by
someone.
The consciousness that God has given to humans is unique
because with human consciousness can place themselves in
accordance with the true and false beliefs. Human consciousness
International Journal of Scientific and Research Publications, Volume 10, Issue 1, January 2020 265
ISSN 2250-3153
http://dx.doi.org/10.29322/IJSRP.10.01.2020.p9739 www.ijsrp.org
is an important element in understanding reality and how to act
and respond to that reality. The consciousness that humans have is
consciousness of themselves, others, the past and the possibility of
their future. The consciousness arises when the moral man must
decide anything concerning the rights and happiness of others
(Suseno, 198 7: 22). This moral consciousness explicitly requires
a person in accordance with his inner voice to do according to what
is a true norm.
Furthermore Suseno (198 7: 25) explains three elements of
moral consciousness i.e. 1) The feeling of obligation or obligation
to carry out moral actions is present and occurs in every human
heart, anyone, anywhere, and at any time. 2) Rational, human
consciousness can be said to be rational because it is generally
accepted, and open to justification or denial. It is also stated as an
objective thing that can be universalized, meaning that it can be
approved, applies at all times, and places for everyone in a similar
situation. 3) Freedom, or moral consciousness, a person is free to
obey him. 4) The responsibility of the individual in dealing with
his obligations.
III. RESEARCH METHOD
The research method used was a Quantitative Research
Method of the type of survey method that is a research method that
collects data using a questionnaire (questionnaire method) that is
a list of written questions asked to a group of people called a
sample (Bambang, 2013: 39). The reason the writers use this
method is because this method is limited to the collection of data
collected from a sample of the population to represent the entire
population. And this survey method also helps in quantitative data
collection on the Effects of Clean River Socialization by the West
Jakarta Sanitary Office on the Consciousness of Healthy Life in
Kedaung, Kali Angke Community for the period of 2015-2016.
In this study the author chose the residents of West Jakarta
Kali Angke as the study population, by taking the level of Rt 01 to
Rt 05. The reason the writers chose this population was because
the writers can make measurements evenly starting from the level
of Rt 01 to Rt 05. The population in the study was 150 people.
Then the number of samples in this study was 110 people using
the calculation of the proportional stratified random sampling
formula.
Data collection techniques in this study were primary data
collection through surveys, and secondary data collection through
systematic and standard procedures to obtain the data needed in
research. In this study, the writers used primary data and
secondary data from the literature study of reference books
relating to the research object, intranet, and thesis examples that
have to do with things that would be discussed in accordance with
the title of this study.
To determine the sample size, the writers performed
statistical calculations using the Slovin formula. Slovin’s formula
is to determine the sample size of a population whose number is
known (Kriyantono, 2007: 160). The formula is:
n=N
1 + Ne2
Note
n = sample size
N = sample size
E = allowance of inaccuracy due to
sampling errors that can be tolerated, which
is 5%
The data validity technique used in this research was the use Logic
Validity/ sampling validity, because the instrument was
reasonable and only questions items related to the attribute to be
measured, while the attribute to be measured was related to the
object research on sample attributes, so it is often called sampling
validity. Then because the method used is a causal explanatory
research method with a quantitative approach that aimed to assess
the success of a program implemented, the writers use a Likert
scale to analyze the data. To simplify the calculation of survey
findings, the researcher uses SPSS 16 (Static Product and
Solutions Service), where the data collected was first made in the
questionnaire answer table list, then given a number or number
code (because SPSS can only read numbers) after that, then
inputted into the SPSS calculation system to get the findings in the
form of a table.
IV. DISCUSSION
In the research on the effect of clean river socialization by
the West Jakarta Sanitary Office on healthy life consciousness in
Kedaung, Kali Angke community period 2015-2016, the writers
feels interested in knowing whether or not there was a healthy life
consciousness in the angke river community that has been taken
after the socialization process. Then this research was conducted
in Kedaung, Kali Angke which is one of the river basins located
in West Jakarta. So the author could find out how much influence
the socialization carried out by the Sanitary Office in Kedaung,
Kali Angke.
The general description of the respondents was the people
of the Angke River from RT 1 to RT 5, whether male or female.
The findings of the answers from respondents on the dimensions
of the two variables were not yet relevant. For the variables of the
influence of clean river socialization, it was a mean or method
used to convey information or messages from the socialization
itself. Whereas the variable of healthy life consciousness in the
Angke River community is something that was expected after the
program was implemented.
In general the findings of answers to questions that have
been submitted had a positive response with the percentage of the
number of answers agreeing and strongly agreeing to more than
50%, but there were still answers above 50% who disagree so that
the question points were be concerned by the residents of the river
and also the village of Kedaung, Kali Angke.
For the variable of healthy life consciousness is a picture of
the findings received from the clean socialization program. In
general, the findings of respondents’ answers had a positive
response to the questions asked by the percentage of the number
of answers agreeing and strongly agreeing to 60% and quite a few
answers hesitating/ disagreeing. This showed that the
consciousness of healthy life in the Angke River community can
be felt by the Angke River community. To prove empirically that
the clean river socialization program influences the consciousness
of healthy life in the people of the village of Kedaung, Kali Angke.
Then the hypothesis test was done through statistical calculations
with the help of the SPSS 23. The hypothesis testing method was
found in the simple linear regression analysis, the T test method.
International Journal of Scientific and Research Publications, Volume 10, Issue 1, January 2020 266
ISSN 2250-3153
http://dx.doi.org/10.29322/IJSRP.10.01.2020.p9739 www.ijsrp.org
From the findings of the research that the writers got about
the socialization effect of the clean river by the West Jakarta
sanitary office on healthy life consciousness in Kedaung, Kali
Angke communities period (2015-2016), it was stated positively
or the socialization program implemented could affect the
residents of the Kedaung, Kali angke.
Starting from the calculation of the first dimension, which
was about Data and Information about Clean River Socialization,
the findings of the analysis were from the information data
obtained by the writers from respondents, which agree 80 people
(53.3%), and strongly agree 70 people (46.7%). So it can be
concluded from the data and information regarding the clean water
the average of 4.19 of 150 respondents. Then from these findings
it can be said the first dimension regarding data and information
was valid.
The second dimension is about the contents of the Clean
River program, Analysis of the second dimension is about the
content and method of socializing the clean river of the numbers
that strongly agree there are 65 people (43.4%), agree 75 people
(50%), doubt 10 people (6.6%). From this analysis get an average
of 4.19 of 150 respondents. Then from these findings it can be said
the second dimension regarding the content and method of
socialization was valid.
The third dimension is about How to Clean River
Socialization, Analysis on this third dimension which was about
how to clean river socialization was the respondent who answers
doubtfully 50 people (33.3%), agrees 50 people (33.3%), disagrees
23 people (15.4%), and strongly disagree 27 people (18%), with
an average of 4.19 out of 150 respondents. Then from these
findings it can be said the third dimension regarding the way of
socialization was valid.
The analysis on the fourth dimension regarding media
socialization of clean river was that respondents answered strongly
disagree there were 35 people (23.3%), disagree 15 people (10%),
doubtful 50 people (33.4%), agree 35 people (23.3%) and strongly
agree15 (10%) with an average of 4.19 out of 150 respondents.
Then from the findings it can be said that the fourth dimension was
valid.
The fifth dimension analysis finding of Clean River
Socialization Participation was that respondents answered from
strongly disagree 40 (27%), disagree 60 (40%), doubt 20 (13%),
agree 15 (10%), strongly agree 15 (10%) with an average of 4.19
out of 150 respondents. Then from the findings of the fifth
dimension regarding the Socialization Participation, clean river
could be said to be valid.
The analysis on the sixth dimension concerning
participatory socialization was that respondents answered strongly
disagree 70 people (44%), disagree 15 people (10%), doubtful 25
people (16.7%), agree 20 people (13, 3%) and strongly disagree
20 people (13.3%) ith an average of 4.19 out of 150 respondents.
Then the findings could be said to be valid.
The seventh dimension regarding the consciousness of
healthy living at Angke River society with analysis that answers
strongly disagrees 70 (44%), disagrees 15 people (10%), doubts
25 people (16.7%), agrees 20 people (13.3%), and strongly agree
20 people (13.3%) with an average of 99.8. So from these findings
it could be said that the dimension regarding the existence of a
healthy life in the Angke River community was valid.
The findings of the analysis on the eighth dimension i.e.
freedom in responding to the socialization of clean river was
answered strongly disagree 70 (44%), disagree 15 people (10%),
doubt 25 people (16.7%), agree 20 people (13.3%), and strongly
agree 20 people (13.3%) with an average of 99.8. So from these
findings it can be said the dimension of freedom in addressing the
socialization of clean river was valid.
The findings of the analysis on this dimension regarding
healthy life consciousness were answered strongly disagree 70
(44%), disagree 15 people (10%), doubt 25 people (16.7%), agree
20 people (13.3% ), and strongly agree 20 people (13.3%) with an
average of 99.8. So from these findings it could be said that the
dimensions of community responsibility in maintaining healthy
living were said to be valid.
To use the parametric analysis tool, another condition is
needed, which is a normality test. According to Sudarmanto
Gunawan, that a study which proposes a hypothesis by using t-test
and f-test, according to an assumption that must be tested, the
population must be normally distributed. Because if you use the
parametric method, then the normal requirements must be met,
this is derived from the normal distribution. In this study the
Kolmogorov-Smimov sample oen method was used with a
significance level of 5% (0.05). Data is stated as normal
distribution if the significance is greater than 0.05 or 5%. In table
4.14 the findings of the Kolmogorov-Smirnov Z calculation show
that the significance values of the two variables are 0,000 so that
the significance value is lower than 0.05, so it can be concluded
that the two variables are normally distributed.
The variable questions for the Clean River Socialization
Program (X) totaled 13 questions, as shown in table 4.1 below, the
value of the product moment items ranged from 0.545 to 0.716
where the value was greater than the value of R table (0.361) then
all items of variable X were declared valid. Variable question
items Increased Consciousness of Healthy Life in Society (Y)
amounted to 7 questions, where, the value of product moment (r-
count) item questions ranged from 0.393 to 0.771 where the value
was greater than the value of r table (0.361) then all the variable Y
question was declared valid. The T test aims to test the
significance of the regression coefficient values. The testing
criterion as a requirement of the accepted hypothesis is that the
calculated t-value must be greater than the t-table. Based on the
findings of calculations, it was found that the t-value of 71.5 was
greater than t-table (316).
V. CONCLUSION
From the findings of the research that the writers got about
the effect of clean river socialization by the West Jakarta Sanitary
Office on healthy life consciousness in Kedaung, Kali Angke
community period 2015-2016, it was stated positively or the
socialization program implemented could affect the residents of
Kedaung, Kali Angke. The findings of the study found that the
Angke River was filled with various kinds of distribution of
domestic waste from household activities, causing a problem, it
was due to the rapid development and development that was not
matched by adequate arrangements. Pollution in the Angke River
is due to the habit of people throwing garbage directly into rivers,
houses that do not have septic tanks, industries that dispose of
waste directly to the river without being processed first, showing
International Journal of Scientific and Research Publications, Volume 10, Issue 1, January 2020 267
ISSN 2250-3153
http://dx.doi.org/10.29322/IJSRP.10.01.2020.p9739 www.ijsrp.org
several parameters that exceed the quality standard threshold. The
parameters were: 1) Detergent, 2) BOD, 3) COD, 4) Oil and Fat,
5) Lead, 6) Fecal Coli, 7) Total Coli
Various kinds of activities that occur around the Angke
River certainly cause pollution impacts for the local residents, the
environment, and the biota contained in the river. The impact of
household waste pollution in Angke River in this case has a
negative impact on the biota in Angke River water. Besides that,
the impacts on the residents around Angke River are: firstly, the
water became no longer useful. The water in Angke River was no
longer suitable to use. Residents who were in direct contact with
polluted water usually suffer from itching. Secondly, water is the
cause of disease. Diseases caused by pollution in Kali Angke
were: Hepatitis A, Polliomyelitis, Cholera, Typhus Abdominalis,
Dysentery Trachoma, Scabies, Cadmium Poisoning, Cobalt
Poisoning, and Malaria.
The participation of the government of Kali Angke and local
residents were needed in handling household waste pollution. The
Sanitary Office have made various efforts, one of which is river
water neutralization, which is by conducting the consciousness
raising of domestic waste to the people who live around Angke
River, taking Angke River water samples and implementing the
Clean River Socialization Program. In addition to the role of the
West Jakarta Sanitary Office, residents around the Kali Angke also
participated in river walks and the socialization activities carried
out by the West Jakarta Sanitary Office.
REFERENCES
[1] Bambang Yuniarto. Membangun kesadaran Warga Negara dalam Pelestarian Lingkungan, Yogyakarta, 2013
[2] Erlita, Novi. The Website Management of www.ppid.dpr.go.id in Public Information Services 2014. American Journal of Humanities and Social Sciences Research (AJHSSR). Volume-02, Issue-11, pp-17-26, 2018
[3] Firdaus, Arini. Pengaruh Sosialisasi Kali Bersih Oleh Suku Dinas Kebersihan Jakarta Barat Terhadap Kesadaran Hidup Sehat Pada Masyarakat Kel. Kedaung Kali Angke Priode (2015-2016). Fakultas Ilmu Komunikasi, Universitas Mercu Buana, Jakarta. 2017.
[4] Haryati Syerli, The Socialization Process Analysis of the Importance of Clean Water Pipe by the Tangerang City Government Inovercoming Clean Water Crissis. International Journal of Science and Research (IJSR), Vol 7, Issue 8, ISSN (Online) 2319-7064 pp. 174 – 180, 2018.
[5] Henderson, Alison. Activism in “Paradise”: Identity Management in a Public Relations Campaign Against Genetic Engineering. Journal of Public Relations Research, 17(2), 117–137. 2005
[6] Kriyantono, Rachmat. 2007. Teknik Praktis Riset Komunikasi, edisi pertama, cetakan kedua, Jakarta : Prenada Media Group.
[7] Setiadi, Elly M dan Kolip, Usman. Pemahaman Fakta dan Gejala Permasalahan Sosial:Teori,Aplikasi dan Pemecahannya. Jakarta: Kencana Prenadamedia Grup. 2011
[8] Sudarmanto Gunawan, 2005, Analisis Regresi Linear Ganda dengan SPSS, Graha Ilmu Yogyakarta
[9] Suseno Franz Margin. Etika Dasar Masalah-masalah Pokok Filsafat Moral, Kanisius, Yogyakarta, 1987.
[10] Tarone, E. Conscious communication strategies in interlanguage: A progress report. In H. D. Brown, C.A. Yorio & R.C. Crymes (Eds.) TESOL pp. 194-203.
[11] Yuliawati and Irawan Enjang Pera. The Analysis of Green Environment Movement Campaign in Supporting National Food Security of Indonesia. Global Journal of HUMAN-SOCIAL SCIENCE. Volume 18 Issue 2 Version 1.0 Year 2018
[12] http://www.yipd.or.id/files/Best_Practice/PROKASIH2.pdf, diakses pada 11 september 2017 : 09.07
AUTHORS
First Author – A Rahman HI, Fakultas Ilmu Komunikasi
Universitas Mercu Buana

International Journal of Scientific and Research Publications, Volume 10, Issue 1, January 2020 268
ISSN 2250-3153
http://dx.doi.org/10.29322/IJSRP.10.01.2020.p9740 www.ijsrp.org
Prevalence of Cholelithiasis in Sickle Cell
Hemoglobinopathy, Central Indian Scenario
J R Tijare, R K Pohekar, A A Dani, A V Shrikhande
Department of Pathology, Indira Gandhi Government Medical College, Nagpur.
DOI: 10.29322/IJSRP.10.01.2020.p9740
http://dx.doi.org/10.29322/IJSRP.10.01.2020.p9740
Abstract- Cholelithiasis is a well-known complication of
sustained heme catabolism as in Sickle cell anemia, which has
frequency distribution between 22.5 – 44.4 % in central India.
This study was carried at Regional Hemoglobinopathy Detection
And Management center, Indira Gandhi Government Medical
College Nagpur. This study includes 120 patients with sickle cell
disease and 30 cases with sickle cell trait. The prevalence of
cholelithiasis in 120 sickle cell disease cases was found to be
28.33% as compared to 10% in each of the sickle cell trait and
normal population. The cases were clinically evaluated for
frequency of Vasoocclusive crisis (VOC), abdominal pain,
jaundice, and biliary colic along with Cholecystosonography,
hemoglobin Estimation, reticulocyte counts, peripheral smear,
AST, ALT and AlkalinePhosphatase
Age of the youngest patient with gallstone, in the present series
was 5 years and that of the oldest patient was 70 years. The
reduced hemoglobin percentage, increased reticulocyte count,
increased bilirubin concentration (indirect, direct and total) and
raised AST were found to be significant factors related with
cholelithiasis in homozygous sickle cell disease.
Sickle cell disease cases with repeated abdominal pain, voc
coupled with low mean hemoglobin, high reticulocyte count, and
bilirubin should be subjected to ultra-sonographic screening as
early as at 2 yrs.
Index Terms – Sickle cell anemia, cholelithiasis, Central India
Abbreviations
1. VOC – Vasoocclusive crisis
2. AST – aspartate aminotranferase
3. ALT – alanine aminotranferase
I. INTRODUCTION
holelithiasis is a well-known complication of chronic
hemolysis. Sickle cell anemia, a hereditary hemolytic
anemia with sustained heme catabolism, leads to very high
frequency of pigment gallstones. The prevalence of gallstones
varies from 6.8% to 58.4%1-8. This variability can be accounted
to the variability in geographic location, dietary habits,
environmental factors, genetic factors and the technique
employed for detection. Ultrasonography has been considered as
fairly sensitive technique for the radio opaque as well as
radiolucent stones. In patients with sickle cell anemia, the
presence of gallstones poses a medical and surgical dilemma, due
to similarities of clinical and laboratory features between acute
cholecystitis and acute abdominal crisis. The gallstones can be
radiolucent or radio opaque and can be picked up by
ultrasonography. Even though 10 to 15% of the patients have
symptoms that can be attributed to the biliary tract9,10 elective
cholecystectomy may lead to dramatic decrease in the frequency
of abdominal crisis9,11. Sickle cell disease especially the Asian –
Indian haplotype has relatively benign course (have mild course)
and hence the patients tend to live longer12. The incidence of
cholelithiasis increases with age13,14 and hence screening for
gallstones is necessary to reduce gallstone related morbidity and
mortality. The present study was carried out to find out
prevalence of cholelithiasis in patients of sickle cell anemia from
central India.
II. IDENTIFY, RESEARCH AND COLLECT IDEA
Material & Methods
This study was carried out for two years.150 patients that were
positive by solubility test along with 30 control cases (solubility
negative) were included. These cases were classified into
homozygous (SS) and heterozygous (AS) and normal
homozygous (AA), using hemoglobin electrophoresis at alkaline
PH with agar gel as support media. The cases were clinically
evaluated for frequency of Vasoocclusive crisis (VOC),
abdominal pain, jaundice, and biliary colic. The cases were
subjected for laboratory investigations like Hemoglobin
Estimation, Reticulocyte counts, Peripheral smear,
AlkalinePhosphatase AST and ALT and Cholecystosonography.
Cholecytosonography was carried out using machine GE Logic 3
PRO with a curvilinear probe of frequency 3.5 MHz. The
sonographic images and records were obtained. Examination of
gallbladder was performed after a minimum of 4 hours of fasting,
because ingestion of food, particularly of a fatty nature stimulates
the gallbladder to contract. The contracted gallbladder may
appear thick walled and may obscure luminal or wall
abnormalities. Evaluation of the gallbladder was performed with
routine agital and transverse sonograms. Small stones less than 5
mm did not cast shadow but were echogenic. Mobility was the
key feature of stone, allowing differentiation from polyps or
other entities. Scanning with the patient in the right or left lateral
decubitus or upright standing positions allowed stone to roll
within the gallbladder.
C
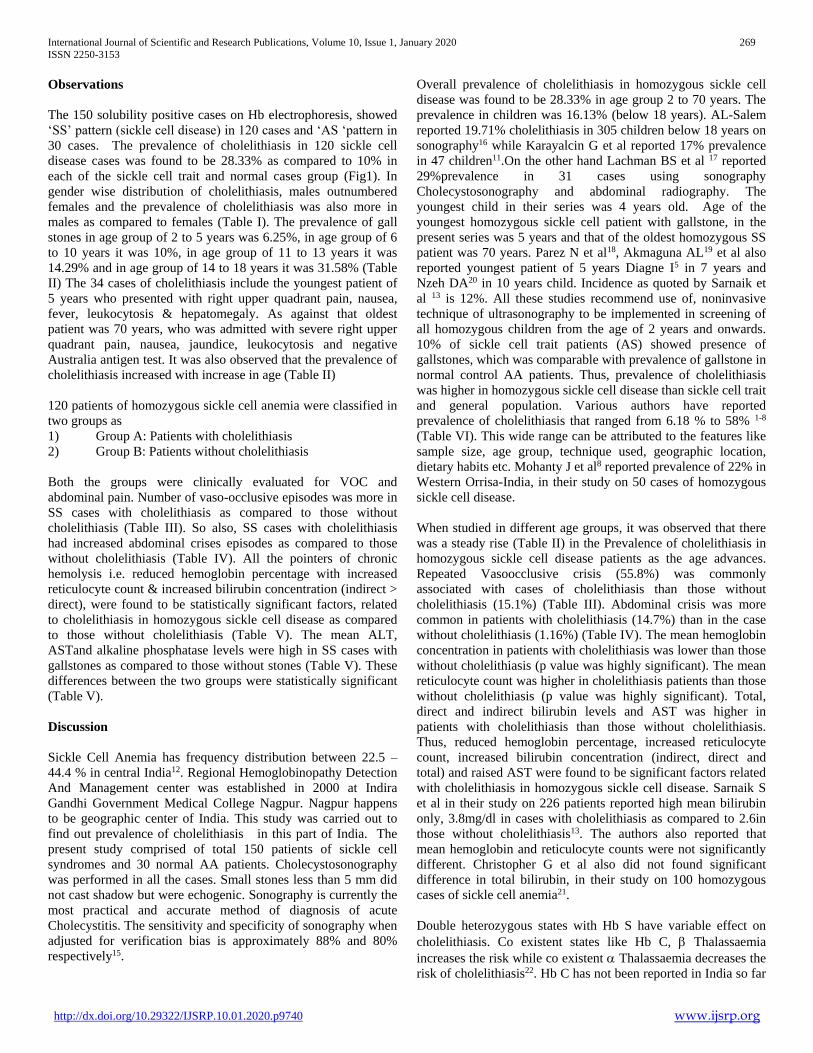
International Journal of Scientific and Research Publications, Volume 10, Issue 1, January 2020 269
ISSN 2250-3153
http://dx.doi.org/10.29322/IJSRP.10.01.2020.p9740 www.ijsrp.org
Observations
The 150 solubility positive cases on Hb electrophoresis, showed
‘SS’ pattern (sickle cell disease) in 120 cases and ‘AS ‘pattern in
30 cases. The prevalence of cholelithiasis in 120 sickle cell
disease cases was found to be 28.33% as compared to 10% in
each of the sickle cell trait and normal cases group (Fig1). In
gender wise distribution of cholelithiasis, males outnumbered
females and the prevalence of cholelithiasis was also more in
males as compared to females (Table I). The prevalence of gall
stones in age group of 2 to 5 years was 6.25%, in age group of 6
to 10 years it was 10%, in age group of 11 to 13 years it was
14.29% and in age group of 14 to 18 years it was 31.58% (Table
II) The 34 cases of cholelithiasis include the youngest patient of
5 years who presented with right upper quadrant pain, nausea,
fever, leukocytosis & hepatomegaly. As against that oldest
patient was 70 years, who was admitted with severe right upper
quadrant pain, nausea, jaundice, leukocytosis and negative
Australia antigen test. It was also observed that the prevalence of
cholelithiasis increased with increase in age (Table II)
120 patients of homozygous sickle cell anemia were classified in
two groups as
1) Group A: Patients with cholelithiasis
2) Group B: Patients without cholelithiasis
Both the groups were clinically evaluated for VOC and
abdominal pain. Number of vaso-occlusive episodes was more in
SS cases with cholelithiasis as compared to those without
cholelithiasis (Table III). So also, SS cases with cholelithiasis
had increased abdominal crises episodes as compared to those
without cholelithiasis (Table IV). All the pointers of chronic
hemolysis i.e. reduced hemoglobin percentage with increased
reticulocyte count & increased bilirubin concentration (indirect >
direct), were found to be statistically significant factors, related
to cholelithiasis in homozygous sickle cell disease as compared
to those without cholelithiasis (Table V). The mean ALT,
ASTand alkaline phosphatase levels were high in SS cases with
gallstones as compared to those without stones (Table V). These
differences between the two groups were statistically significant
(Table V).
Discussion
Sickle Cell Anemia has frequency distribution between 22.5 –
44.4 % in central India12. Regional Hemoglobinopathy Detection
And Management center was established in 2000 at Indira
Gandhi Government Medical College Nagpur. Nagpur happens
to be geographic center of India. This study was carried out to
find out prevalence of cholelithiasis in this part of India. The
present study comprised of total 150 patients of sickle cell
syndromes and 30 normal AA patients. Cholecystosonography
was performed in all the cases. Small stones less than 5 mm did
not cast shadow but were echogenic. Sonography is currently the
most practical and accurate method of diagnosis of acute
Cholecystitis. The sensitivity and specificity of sonography when
adjusted for verification bias is approximately 88% and 80%
respectively15.
Overall prevalence of cholelithiasis in homozygous sickle cell
disease was found to be 28.33% in age group 2 to 70 years. The
prevalence in children was 16.13% (below 18 years). AL-Salem
reported 19.71% cholelithiasis in 305 children below 18 years on
sonography16 while Karayalcin G et al reported 17% prevalence
in 47 children11.On the other hand Lachman BS et al 17 reported
29%prevalence in 31 cases using sonography
Cholecystosonography and abdominal radiography. The
youngest child in their series was 4 years old. Age of the
youngest homozygous sickle cell patient with gallstone, in the
present series was 5 years and that of the oldest homozygous SS
patient was 70 years. Parez N et al18, Akmaguna AL19 et al also
reported youngest patient of 5 years Diagne I5 in 7 years and
Nzeh DA20 in 10 years child. Incidence as quoted by Sarnaik et
al 13 is 12%. All these studies recommend use of, noninvasive
technique of ultrasonography to be implemented in screening of
all homozygous children from the age of 2 years and onwards.
10% of sickle cell trait patients (AS) showed presence of
gallstones, which was comparable with prevalence of gallstone in
normal control AA patients. Thus, prevalence of cholelithiasis
was higher in homozygous sickle cell disease than sickle cell trait
and general population. Various authors have reported
prevalence of cholelithiasis that ranged from 6.18 % to 58% 1-8
(Table VI). This wide range can be attributed to the features like
sample size, age group, technique used, geographic location,
dietary habits etc. Mohanty J et al8 reported prevalence of 22% in
Western Orrisa-India, in their study on 50 cases of homozygous
sickle cell disease.
When studied in different age groups, it was observed that there
was a steady rise (Table II) in the Prevalence of cholelithiasis in
homozygous sickle cell disease patients as the age advances.
Repeated Vasoocclusive crisis (55.8%) was commonly
associated with cases of cholelithiasis than those without
cholelithiasis (15.1%) (Table III). Abdominal crisis was more
common in patients with cholelithiasis (14.7%) than in the case
without cholelithiasis (1.16%) (Table IV). The mean hemoglobin
concentration in patients with cholelithiasis was lower than those
without cholelithiasis (p value was highly significant). The mean
reticulocyte count was higher in cholelithiasis patients than those
without cholelithiasis (p value was highly significant). Total,
direct and indirect bilirubin levels and AST was higher in
patients with cholelithiasis than those without cholelithiasis.
Thus, reduced hemoglobin percentage, increased reticulocyte
count, increased bilirubin concentration (indirect, direct and
total) and raised AST were found to be significant factors related
with cholelithiasis in homozygous sickle cell disease. Sarnaik S
et al in their study on 226 patients reported high mean bilirubin
only, 3.8mg/dl in cases with cholelithiasis as compared to 2.6in
those without cholelithiasis13. The authors also reported that
mean hemoglobin and reticulocyte counts were not significantly
different. Christopher G et al also did not found significant
difference in total bilirubin, in their study on 100 homozygous
cases of sickle cell anemia21.
Double heterozygous states with Hb S have variable effect on
cholelithiasis. Co existent states like Hb C, Thalassaemia
increases the risk while co existent Thalassaemia decreases the
risk of cholelithiasis22. Hb C has not been reported in India so far
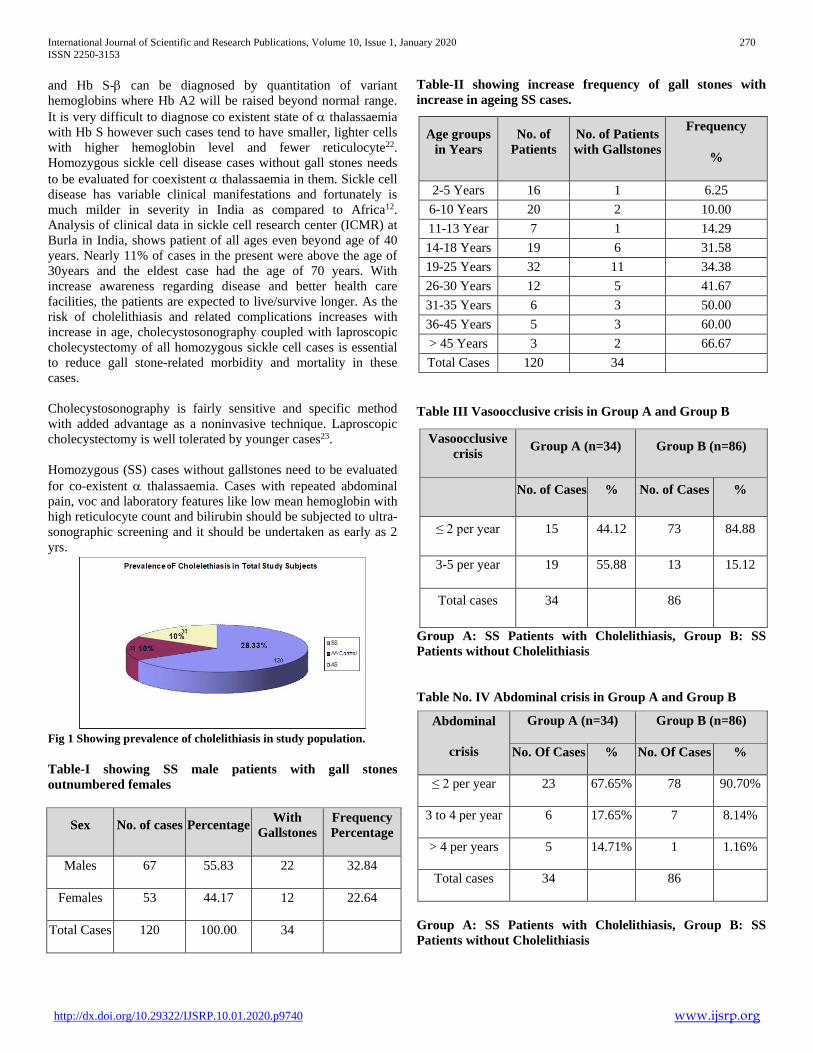
International Journal of Scientific and Research Publications, Volume 10, Issue 1, January 2020 270
ISSN 2250-3153
http://dx.doi.org/10.29322/IJSRP.10.01.2020.p9740 www.ijsrp.org
and Hb S- can be diagnosed by quantitation of variant
hemoglobins where Hb A2 will be raised beyond normal range.
It is very difficult to diagnose co existent state of thalassaemia
with Hb S however such cases tend to have smaller, lighter cells
with higher hemoglobin level and fewer reticulocyte22.
Homozygous sickle cell disease cases without gall stones needs
to be evaluated for coexistent thalassaemia in them. Sickle cell
disease has variable clinical manifestations and fortunately is
much milder in severity in India as compared to Africa12.
Analysis of clinical data in sickle cell research center (ICMR) at
Burla in India, shows patient of all ages even beyond age of 40
years. Nearly 11% of cases in the present were above the age of
30years and the eldest case had the age of 70 years. With
increase awareness regarding disease and better health care
facilities, the patients are expected to live/survive longer. As the
risk of cholelithiasis and related complications increases with
increase in age, cholecystosonography coupled with laproscopic
cholecystectomy of all homozygous sickle cell cases is essential
to reduce gall stone-related morbidity and mortality in these
cases.
Cholecystosonography is fairly sensitive and specific method
with added advantage as a noninvasive technique. Laproscopic
cholecystectomy is well tolerated by younger cases23.
Homozygous (SS) cases without gallstones need to be evaluated
for co-existent thalassaemia. Cases with repeated abdominal
pain, voc and laboratory features like low mean hemoglobin with
high reticulocyte count and bilirubin should be subjected to ultra-
sonographic screening and it should be undertaken as early as 2
yrs.
Fig 1 Showing prevalence of cholelithiasis in study population.
Table-I showing SS male patients with gall stones
outnumbered females
Sex No. of cases Percentage With
Gallstones
Frequency
Percentage
Males 67 55.83 22 32.84
Females 53 44.17 12 22.64
Total Cases 120 100.00 34
Table-II showing increase frequency of gall stones with
increase in ageing SS cases.
Table III Vasoocclusive crisis in Group A and Group B
Group A: SS Patients with Cholelithiasis, Group B: SS
Patients without Cholelithiasis
Table No. IV Abdominal crisis in Group A and Group B
Group A: SS Patients with Cholelithiasis, Group B: SS
Patients without Cholelithiasis
Age groups
in Years
No. of
Patients
No. of Patients
with Gallstones
Frequency
%
2-5 Years 16 1 6.25
6-10 Years 20 2 10.00
11-13 Year 7 1 14.29
14-18 Years 19 6 31.58
19-25 Years 32 11 34.38
26-30 Years 12 5 41.67
31-35 Years 6 3 50.00
36-45 Years 5 3 60.00
> 45 Years 3 2 66.67
Total Cases 120 34
Vasoocclusive
crisis Group A (n=34) Group B (n=86)
No. of Cases % No. of Cases %
≤ 2 per year 15 44.12 73 84.88
3-5 per year 19 55.88 13 15.12
Total cases 34 86
Abdominal
crisis
Group A (n=34) Group B (n=86)
No. Of Cases % No. Of Cases %
≤ 2 per year 23 67.65% 78 90.70%
3 to 4 per year 6 17.65% 7 8.14%
> 4 per years 5 14.71% 1 1.16%
Total cases 34 86
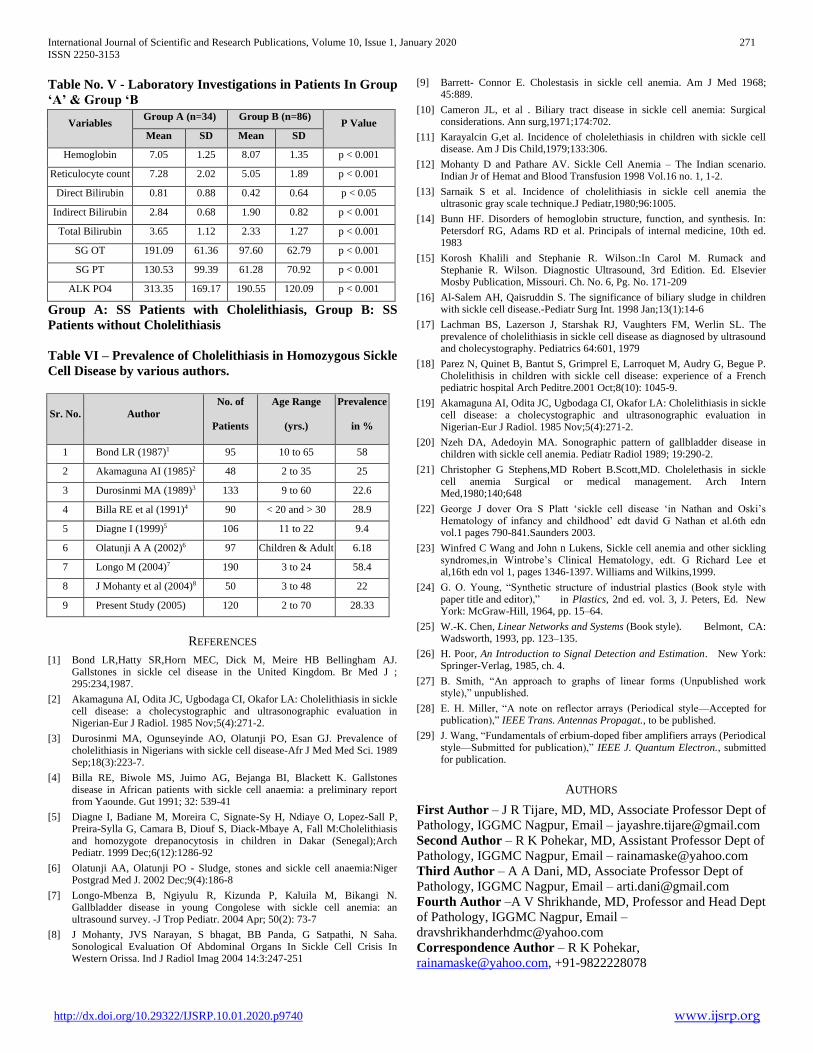
International Journal of Scientific and Research Publications, Volume 10, Issue 1, January 2020 271
ISSN 2250-3153
http://dx.doi.org/10.29322/IJSRP.10.01.2020.p9740 www.ijsrp.org
Table No. V - Laboratory Investigations in Patients In Group
‘A’ & Group ‘B
Group A: SS Patients with Cholelithiasis, Group B: SS
Patients without Cholelithiasis
Table VI – Prevalence of Cholelithiasis in Homozygous Sickle
Cell Disease by various authors.
REFERENCES
[1] Bond LR,Hatty SR,Horn MEC, Dick M, Meire HB Bellingham AJ. Gallstones in sickle cel disease in the United Kingdom. Br Med J ; 295:234,1987.
[2] Akamaguna AI, Odita JC, Ugbodaga CI, Okafor LA: Cholelithiasis in sickle cell disease: a cholecystographic and ultrasonographic evaluation in Nigerian-Eur J Radiol. 1985 Nov;5(4):271-2.
[3] Durosinmi MA, Ogunseyinde AO, Olatunji PO, Esan GJ. Prevalence of cholelithiasis in Nigerians with sickle cell disease-Afr J Med Med Sci. 1989 Sep;18(3):223-7.
[4] Billa RE, Biwole MS, Juimo AG, Bejanga BI, Blackett K. Gallstones disease in African patients with sickle cell anaemia: a preliminary report from Yaounde. Gut 1991; 32: 539-41
[5] Diagne I, Badiane M, Moreira C, Signate-Sy H, Ndiaye O, Lopez-Sall P, Preira-Sylla G, Camara B, Diouf S, Diack-Mbaye A, Fall M:Cholelithiasis and homozygote drepanocytosis in children in Dakar (Senegal);Arch Pediatr. 1999 Dec;6(12):1286-92
[6] Olatunji AA, Olatunji PO - Sludge, stones and sickle cell anaemia:Niger Postgrad Med J. 2002 Dec;9(4):186-8
[7] Longo-Mbenza B, Ngiyulu R, Kizunda P, Kaluila M, Bikangi N. Gallbladder disease in young Congolese with sickle cell anemia: an ultrasound survey. -J Trop Pediatr. 2004 Apr; 50(2): 73-7
[8] J Mohanty, JVS Narayan, S bhagat, BB Panda, G Satpathi, N Saha. Sonological Evaluation Of Abdominal Organs In Sickle Cell Crisis In Western Orissa. Ind J Radiol Imag 2004 14:3:247-251
[9] Barrett- Connor E. Cholestasis in sickle cell anemia. Am J Med 1968; 45:889.
[10] Cameron JL, et al . Biliary tract disease in sickle cell anemia: Surgical considerations. Ann surg,1971;174:702.
[11] Karayalcin G,et al. Incidence of cholelethiasis in children with sickle cell disease. Am J Dis Child,1979;133:306.
[12] Mohanty D and Pathare AV. Sickle Cell Anemia – The Indian scenario. Indian Jr of Hemat and Blood Transfusion 1998 Vol.16 no. 1, 1-2.
[13] Sarnaik S et al. Incidence of cholelithiasis in sickle cell anemia the ultrasonic gray scale technique.J Pediatr,1980;96:1005.
[14] Bunn HF. Disorders of hemoglobin structure, function, and synthesis. In: Petersdorf RG, Adams RD et al. Principals of internal medicine, 10th ed. 1983
[15] Korosh Khalili and Stephanie R. Wilson.:In Carol M. Rumack and Stephanie R. Wilson. Diagnostic Ultrasound, 3rd Edition. Ed. Elsevier Mosby Publication, Missouri. Ch. No. 6, Pg. No. 171-209
[16] Al-Salem AH, Qaisruddin S. The significance of biliary sludge in children with sickle cell disease.-Pediatr Surg Int. 1998 Jan;13(1):14-6
[17] Lachman BS, Lazerson J, Starshak RJ, Vaughters FM, Werlin SL. The prevalence of cholelithiasis in sickle cell disease as diagnosed by ultrasound and cholecystography. Pediatrics 64:601, 1979
[18] Parez N, Quinet B, Bantut S, Grimprel E, Larroquet M, Audry G, Begue P. Cholelithisis in children with sickle cell disease: experience of a French pediatric hospital Arch Peditre.2001 Oct;8(10): 1045-9.
[19] Akamaguna AI, Odita JC, Ugbodaga CI, Okafor LA: Cholelithiasis in sickle cell disease: a cholecystographic and ultrasonographic evaluation in Nigerian-Eur J Radiol. 1985 Nov;5(4):271-2.
[20] Nzeh DA, Adedoyin MA. Sonographic pattern of gallbladder disease in children with sickle cell anemia. Pediatr Radiol 1989; 19:290-2.
[21] Christopher G Stephens,MD Robert B.Scott,MD. Cholelethasis in sickle cell anemia Surgical or medical management. Arch Intern Med,1980;140;648
[22] George J dover Ora S Platt ‘sickle cell disease ‘in Nathan and Oski’s Hematology of infancy and childhood’ edt david G Nathan et al.6th edn vol.1 pages 790-841.Saunders 2003.
[23] Winfred C Wang and John n Lukens, Sickle cell anemia and other sickling syndromes,in Wintrobe’s Clinical Hematology, edt. G Richard Lee et al,16th edn vol 1, pages 1346-1397. Williams and Wilkins,1999.
[24] G. O. Young, “Synthetic structure of industrial plastics (Book style with paper title and editor),” in Plastics, 2nd ed. vol. 3, J. Peters, Ed. New York: McGraw-Hill, 1964, pp. 15–64.
[25] W.-K. Chen, Linear Networks and Systems (Book style). Belmont, CA: Wadsworth, 1993, pp. 123–135.
[26] H. Poor, An Introduction to Signal Detection and Estimation. New York: Springer-Verlag, 1985, ch. 4.
[27] B. Smith, “An approach to graphs of linear forms (Unpublished work style),” unpublished.
[28] E. H. Miller, “A note on reflector arrays (Periodical style—Accepted for publication),” IEEE Trans. Antennas Propagat., to be published.
[29] J. Wang, “Fundamentals of erbium-doped fiber amplifiers arrays (Periodical style—Submitted for publication),” IEEE J. Quantum Electron., submitted for publication.
AUTHORS
First Author – J R Tijare, MD, MD, Associate Professor Dept of
Pathology, IGGMC Nagpur, Email – [email protected]
Second Author – R K Pohekar, MD, Assistant Professor Dept of
Pathology, IGGMC Nagpur, Email – [email protected]
Third Author – A A Dani, MD, Associate Professor Dept of
Pathology, IGGMC Nagpur, Email – [email protected]
Fourth Author –A V Shrikhande, MD, Professor and Head Dept
of Pathology, IGGMC Nagpur, Email –
Correspondence Author – R K Pohekar,
[email protected], +91-9822228078
Variables Group A (n=34) Group B (n=86)
P Value
Mean SD Mean SD
Hemoglobin 7.05 1.25 8.07 1.35 p < 0.001
Reticulocyte count 7.28 2.02 5.05 1.89 p < 0.001
Direct Bilirubin 0.81 0.88 0.42 0.64 p < 0.05
Indirect Bilirubin 2.84 0.68 1.90 0.82 p < 0.001
Total Bilirubin 3.65 1.12 2.33 1.27 p < 0.001
SG OT 191.09 61.36 97.60 62.79 p < 0.001
SG PT 130.53 99.39 61.28 70.92 p < 0.001
ALK PO4 313.35 169.17 190.55 120.09 p < 0.001
Sr. No. Author
No. of
Patients
Age Range
(yrs.)
Prevalence
in %
1 Bond LR (1987)1 95 10 to 65 58
2 Akamaguna AI (1985)2 48 2 to 35 25
3 Durosinmi MA (1989)3 133 9 to 60 22.6
4 Billa RE et al (1991)4 90 < 20 and > 30 28.9
5 Diagne I (1999)5 106 11 to 22 9.4
6 Olatunji A A (2002)6 97 Children & Adult 6.18
7 Longo M (2004)7 190 3 to 24 58.4
8 J Mohanty et al (2004)8 50 3 to 48 22
9 Present Study (2005) 120 2 to 70 28.33

International Journal of Scientific and Research Publications, Volume 10, Issue 1, January 2020 272
ISSN 2250-3153
http://dx.doi.org/10.29322/IJSRP.10.01.2020.p9740 www.ijsrp.org

International Journal of Scientific and Research Publications, Volume 10, Issue 1, January 2020 273
ISSN 2250-3153
http://dx.doi.org/10.29322/IJSRP.10.01.2020.p9741 www.ijsrp.org
Role of Project Managers in the Stakeholder
Management
Dr. Cross Ogohi Daniel*, Victor Inim**
*Departments of Public Administration/Banking and Finance,
Nile University of Nigeria,
Abuja, Nigeria
** Department Of Accounting,
Nile University of Nigeria,
Abuja, Nigeria
DOI: 10.29322/IJSRP.10.01.2020.p9741
http://dx.doi.org/10.29322/IJSRP.10.01.2020.p9741
Abstract – Stakeholders and project managers are key players in projects success. Therefore, the relationship among different
stakeholders needs to be established and the project manager plays a key role in achieving stakeholder management. Current
research shows that there is a need for stakeholder management and the responsibility lies on the project manager. Therefore,
this study shows the factors that affect stakeholder management and role in which the project manager has on a successful
stakeholder management. This study obtained data through questionnaire. The analysis shows a significant relationship between
some variables.
Keywords: Project Manager, Stakeholder, Management.
I. INTRODUCTION Project management is the application of acquired, skills, techniques, and tactics in overseeing a project process from its inception
to its end. Stakeholder management is a monumental constituent of the project management process. It is therefore imperative for
a project manager to facilitate active communication between, the project team and the stakeholders.
Project managers are individuals in charge of supervising, facilitating, monitoring and executing a project. Project managers deal
with all the stages of a project life cycle which include; initiating, planning, executing, monitoring and controlling, closing. They
also work with all the nine project management knowledge areas, which include; Cost management, Communication
management, Human resource management, Procurement management, Scope management, Quality management, Time
management, Risk management and integration management.
Every project has stakeholders; stakeholders are people, individuals, organizations that are impacted one way or another by the
outcome of a project. Stakeholders can be both internal and external. Internal stakeholders are people in the organization that are
executing that project while External are the outside beneficiaries.
Stakeholder management provides knowledge about the prospects, functions and requirements of external and internal players
who have the likely to either influence, or be influenced by a certain project/activity. This knowledge is an early step in the
analysis of stakeholders' impact on the products or outcomes of an organization, project, or activity. The direction of influence
stakeholders' power and interest or location in the communications network (Bourne, 2008).
The management of the project stakeholders is considered the responsibility of the project manager. This task constitutes one of
the largest components of their role. To mitigate the risk to the project that the stakeholders pose and to obtain the multitude of
project – related benefits that follow the achievement of successful stakeholder relationship. It is critical that the project manager
develops relationship with the stakeholders that are effective and of high quality (Mazur & Pisarski, 2015).
Stakeholder management also pays particular attention to the communication with stakeholders in other to understand their needs
and expectation, to address issues as they arise, to manage conflicting interest, to promote a commitment of the stakeholders in
the decision and activities of the project (Riahi, 2017).
In project management, it is regularly agreed that when a project is completely done according to the required specifications,
within the given scope, time and budget as a successful project. Stakeholders are important input in any project therefore, the
project manager should build communal relationship among different group of people to complete project. Since, project success
doesn’t just depend on the performance on the project team, success or failure often depends on the involvement of top
management, functional managers, customers, suppliers, contractors and others. (Dekkar & Qing, 2014)
II. STATEMENT OF THE PROBLEM
Projects are organizational strategic instruments that lead to innovation and create value however; their failures and challenges
cause global businesses, governments and organizations fortune each year (Raiablu, 2014). Scholars have cited the ignorance of
stakeholder management as one of the key reasons responsible for project failure (Raiablu, 2014).The issues with stakeholders
having different interest on projects makes it quite difficult to manage all of them, therefore finding a balance and an environment
where each stakeholders interest is represented and the success of the project is achieved. The difficulty in communication among

International Journal of Scientific and Research Publications, Volume 10, Issue 1, January 2020 274
ISSN 2250-3153
http://dx.doi.org/10.29322/IJSRP.10.01.2020.p9741 www.ijsrp.org
stakeholders needs to be resolved and also how ineffective stakeholder management can impact project success. Therefore, this
research aims that identifying causes of ineffective stakeholder management, role of the project manager and provide a panacea.
III. OBJECTIVES OF THE STUDY
The objectives of this research are as follows
i. To examine the role of project manager on stakeholders
ii. To investigate the reasons of unsuccessful stakeholder management
IV. RESEARCH HYPOTHESIS The following null hypotheses were formulated for this study is;
H01: There is no project manager role on stakeholder
H02: The reasons of unsuccessful stakeholder management is negative
V. LITERATURE REVIEW A. Concept of Project Manager
A project manager is an individual that oversees the entire process of a project. These processes include, initiation, planning,
executing and closing the project.
The Project Manager is responsible for scoping, planning, and delivering a project supported and funded by the three key
stakeholders. They will be working closely with representatives from each of the key stakeholders to scope, design, plan, and
execute an initiative. They will also be involved in recruiting your team, as well as managing aspects of the project such as your
team, budget, and schedule. (EWB-Robogals, 2012).
Project managers have different roles and responsibilities based on the job description therefore the following are a few;
Negotiate the performance of activities with team members and their managers if operating in an environment.
Prepare to clarify assignments and deliverables, mentor others in project management practices, analyze quality of work and
manages integration of team members’ work.
Project Support Manager, strategize to optimize professional development for each team member.
Co-create a project charter with the team, together with the definition of completion criteria.
Manage and communicate a transparent vision of the project’s objectives, and motivate the project team to achieve them; create a
project environment that enables peak performance by team members. Organize the work into manageable activity clusters
(phases) and determines an efficient approach to finishing the work.
Organize estimation and compile a complete and accurate estimate of a project; using reserves appropriately. Organize the project
plan and prepare project plan and obtain management approval. Analyze risks, create a contingency plan and identify trigger
events and responsibility for initiating mitigating action. Supervise the activities of Risk Administrator. Gather neutral input; rank
the highest project risks in terms of total impact.
Organize the work plan schedule and monitor and control the tracking and report on plan to proceed, cost, change control and
schedule reporting. Analyze the actual performance against the plan and adjust consistent with plan objectives. Manage
relationships with project stakeholders, including internal and external clients and vendors, keeping them stakeholders informed
of progress and issues in order to manage expectations on all project requirements and deliverables.
B. Project Stakeholder
Every project has stakeholders; therefore, a stakeholder is person that is directly or indirectly affected by the result or output of a
project.
According to (Riahi, 2017) Stakeholders are both internal and external actors, social and economic partners of a company. The
activity of the company has a direct or indirect impact on these actors, and these partners have a more or less important influence
on the company. The research also says that the company is accountable to all parties and must consider their opinions. The study
concluded that it is therefore important to identify stakeholders but there is also a need to plan stakeholder management.
Depending on the nature of the project, there may be several types of stakeholders; some stakeholders can play several roles at a
time. Stakeholders may have a positive or negative influence on a project. Managing stakeholders in a proactive way is an
important factor in their relationship.
A good project manager recognizes the key impact that stakeholders can have both to help and to hinder the progress of the
project. Meticulous stakeholder analysis and a careful communication plan will maximize the project's chances of delivering
deliverables on time and in budget. The management and communication strategies to be adopted for each type of stakeholder
will be detailed in future works (Riahi, 2017).
Project stakeholders have been divided by type: organizational stakeholders (executives, line leaders, employees and unions),
product stakeholders (customers, suppliers, governments and the general public) and capital market stakeholders (shareholders,
creditors and banks). They have also been differentiated in terms of whether they are considered primary or secondary
stakeholders (Mazur & Pisarski, 2015).
Project stakeholders may also be distinguished by where the project stakeholder is situated within a project manager's
organization or outside of it. The position of the stakeholder may influence the project manager's management of that stakeholder.
However, the position of the project stakeholders should have little practical impact as all stakeholders have to be identified, and
have their needs and potential to impact the project assessed (Mazur & Pisarski, 2015). According to the study, stakeholder
relationship quality as major project managers' overall assessment of the capacity of their stakeholder relationships to withstand
project-related stressors from within and outside of the relationship (Mazur & Pisarski, 2015).
Communication is itself a human endeavor, and the complex communication that may be necessary for managing stakeholder
relationships within an organization or around its activities requires planning, monitoring and also leadership. Furthermore, from
International Journal of Scientific and Research Publications, Volume 10, Issue 1, January 2020 275
ISSN 2250-3153
http://dx.doi.org/10.29322/IJSRP.10.01.2020.p9741 www.ijsrp.org
the study, for stakeholder relationship management it is better to take a little extra time to understand better the stakeholder
community and how well to involve the important stakeholders, than to actually deal with the aftermath of disinterest or lack of
support of neglected stakeholders (Bourne, 2008). The important thing in managing stakeholder relationships is in understanding
that the stakeholder community is a network of people. Managing stakeholder relationships is difficult and takes more time than
expected, but the costs of not engaging stakeholders, particularly senior management stakeholders are significantly higher
(Bourne, 2008).
The influence stakeholders can have on organizational policy, strategy, and project is dependent on their relationship to either the
organization itself or the issues of concern, or both. Project managers ought to acknowledge the reciprocity of efforts and rewards
among stakeholders, and should attempt to achieve a fair distribution of the benefits and burdens of corporate activity among
them, considering their respective risks and vulnerabilities (Hunt & Markwell, 2016).
According to the study, the project managers should listen to and openly communicate with stakeholders about their respective
concerns and contributions, and about the risks that they assume because of their involvement with the corporation. Furthermore,
managers should recognize and actively oversee the concerns of all legitimate stakeholders, and should take their interests
appropriately into account in decision-making and operations (Hunt & Markwell, 2016).
Project managers ought to avoid altogether activities which may jeopardize inalienable human rights or bring about to risks that,
if clearly understood, would be patently unacceptable to relevant stakeholders (Hunt & Markwell, 2016).
Therefore, managers ought to acknowledge the potential conflicts between their own role as company stakeholders, and their
legal and ethical responsibilities for the interests of stakeholders, and will address such conflicts through open communication,
appropriate reporting and incentive systems and, where necessary, third party review (Hunt & Markwell, 2016).
C. Stakeholder Management Stakeholders largely accounts for the success of projects, especially complex projects. The strong cooperation of stakeholders is
necessary for project success, since a project can be regarded as a temporary organization of stakeholders pursuing an aim together.
From the study, the purpose of stakeholder management is to achieve project success through the persistent development of their
interrelationships. Therefore, identifying how stakeholders influence project success.
According to the study, Understanding the influence of stakeholders on project is essential in project management, particularly in
projects with complex stakeholder relationships.
Stakeholder management is those processes that are necessary in order to identify the people, groups, or organizations that could be
directly or indirectly affected by the project endeavor. These stakeholders are actors outside the authority of the project manager.
The number of stakeholders interested in the project can dramatically increase the complexity. These stakeholders usually have
individual interests, which may vary priorities (Karlsen, 2002).
Stakeholder management is often characterized by causal actions, which in some situations are not coordinated and discussed
within the project team. The result of this practice is often an unpredictable outcome. To meet this challenge, several stakeholder
management methods and guidelines have been introduced. These pointers embody the execution of the management functions of
designing, organizing, motivating, directing, and dominant the resources accustomed with neutral methods (Karlsen, 2002).
Stakeholder management is about the management of the relationships with all stakeholders serving their benefits competently and
thus profitably in order to sustain and improve the contributions, resources they provide for the organization’s value conception.
It’s all about relationship and experience management and, business excellence. Effective management of relationships with
stakeholders is critical to resolving issues facing organizations. By using their influence, stakeholders hold the key to the
environment in which an organization functions and the consequent financial and effective performance of the organization.
Therefore, a proper management of stakeholder relations is an emergent focus of public relations and organizational activities
(Itanyi & Ukpere, 2014).
Stakeholder and communication management literature to suggest that enlightened organizational strategy-making is best informed
by a process of continuous dialogue with stakeholders and that “the social performance of any business should be judged not only
by what it does, but by the extent to which it facilitates interested parties in negotiating what it does (Itanyi & Ukpere, 2014).
Thus, management of communication with the various project stakeholders is very vital
It is imperative to manage key stakeholders attentively and keep them fully occupied. More than that there is a need to keep
important stakeholders satisfied. Do not burden them with too much detail. Try and keep affected stakeholders informed.
Communicate regularly to check that no major issues are appearing. Make efforts to monitor other stakeholders. It is good to
communicate, but do not bother them with too much information (Itanyi & Ukpere, 2014).
Therefore, this study aims at relating the importance of a project manager on stakeholder management and also outlines few factors
that affect stakeholder management.
VI. METHODOLOGY
The paper adopted a singular source of data collection. The secondary source of data generation, which include the use of
textbooks written by different authors on the subject matter, journals, magazines, information from the internet and other
published and unpublished materials relevant to work. The data was analyzed using the content analysis approach. This is because
of its major dependence on the secondary source data.
This chapter grants the findings got from the research, by set out the results of the questionnaires. The research instrument used
was a questionnaire. The information was examined with Excel to bring out a regression analysis. A total number of 70
stakeholders answered to the questionnaire.
VII. TEST OF HYPOTHESES

International Journal of Scientific and Research Publications, Volume 10, Issue 1, January 2020 276
ISSN 2250-3153
http://dx.doi.org/10.29322/IJSRP.10.01.2020.p9741 www.ijsrp.org
Hypotheses One
H1: There is a project manager role on stakeholder
H0 There is no project manager role on stakeholder
Table I: Table of correlation between project manager role and stakeholder Correlations
Project manager role stakeholder
Project manager role
Pearson Correlation
Sig. (2-tailed)
N
1
110
.536 **
.000
110
stakeholder Pearson Correlation
Sig. (2-tailed)
N
.536 **
.000
110
1
110
**Correlation is significant at the 0.01 level (2-tailed).
According to above calculations it is observed that amount of correlation coefficient between levels of project manager role is
equal to 53.6 per cent and considering that a significant level is less than 5%. Then we can say that there is a positive relationship
between project manager roles on stakeholder. This implies that one per cent increase in project manager role will lead to 53.6%
increase in level of stakeholder.
Regression analysis test of level of stakeholder and project and project manager role
Model Summary
Model R R Square Adjusted
R Square
Std. Error of
the Estimate
1 .965a .716 .586 3.79952
a. Predictors: (Constant), project manager role
Regression coefficient of R = .965 or 96.5% indicate that relationship exist between independent variables and dependent
variable. The coefficient of determination R2 = 0.716 which show that 71.6% of variation in level of employee’s explained by
project manager role. The adjusted R-square in the table shows that the dependent variable, (level stakeholder) is affected by
58.6% by independent variable (effective project manager role). It shows that effective project manager role is responsible for
stakeholder.
Coefficientsa
Model Unstandardized
Coefficients
Standardized
Coefficients
t Sig.
B Std.
Error
Beta
1 (Constant)
stakeholder
12.310
1.056
.901
.085
.536
13.656
12.426
.002
.000
a. Dependent Variable: level of stakeholder
The coefficient of determination for effective project manager role is positive (1.056) and is highly significant (0.001) in ensuring
level of stakeholder. The p-value of 0.000 is less than the t-statistic value of 12.426 and the standard error value of 0.085. This
implies that a unit increase in effective project manager role will lead to 1.056 increases in level of stakeholder. Therefore, the
null hypothesis is rejected and alternative hypothesis accepted that there is a project manager role on stakeholder.
Hypothesis two
H2 The reason of unsuccessful stakeholder management is positive.
H0: The reason of unsuccessful stakeholder management is negative.
Table II: Table of correlation between stakeholder and management
Correlations
stakeholder management
stakeholder Pearson Correlation
Sig. (2-tailed)
N
1
110
.473**
.000
110
management Pearson Correlation
Sig. (2-tailed)
N
.473 **
.000
110
1
110
**. Correlation is significant at the 0.01 level (2-tailed).
According to above calculations is observed that amount of correlation coefficient between stakeholder and improving in the
management is equal to 47.3 per cent and considering that a significant level is less than 5%. Then we can say that there is a

International Journal of Scientific and Research Publications, Volume 10, Issue 1, January 2020 277
ISSN 2250-3153
http://dx.doi.org/10.29322/IJSRP.10.01.2020.p9741 www.ijsrp.org
positive relationship between stakeholder and improving in the management. This implies that one per cent increase in
stakeholder will lead to 47.3% increase in improving in the management.
Regression analysis test of unsuccessful stakeholder and management
Model Summary
Model R R Square Adjusted
R Square
Std. Error of
the Estimate
1 .773 a .624 .722 3.96426
a. Predictors: (Constant), stakeholder
Regression coefficient of R = .773 or 77.3% indicate that relationship exist between independent variables and dependent
variable. The coefficient of determination R2 = 0.624 which show that 62.4% of variation in improving the management is
explained by stakeholder. The adjusted R-square in the table shows that the dependent variable, (improving the management) is
affected by 72.2% by independent variable stakeholder). It shows that there are positive of stakeholder on improving the
management.
Coefficientsa
Model Unstandardized
Coefficients
Standardized
Coefficients
t Sig.
B Std. Error Beta
1(Constant)
management
15.036
1.319
.806
.125
.473
18.644
10.520
.000
.000
a. Dependent Variable: improving the management.
The coefficient of determination for stakeholder is positive (1.319) and is highly significant (0.000) in improving in the
management. The p-value of 0.000 is less than the t-statistic value of 10.520 and the standard error value of 0.125. This implies
that a unit increase in stakeholder will lead to 1.319 increases in improving in the management. Therefore, the null hypothesis is
rejected and alternative hypothesis that the reason of unsuccessful stakeholder management is positive.
VIII. CONCLUSION According to this study, the factors affecting stakeholder management was examined and also the role of a project manager was
identified. Further in-depth research needs to be conducted to establish the success of stakeholder management. Therefore, from
the findings, the importance of communication, interest level and power amongst stakeholders affect stakeholder management.
Therefore, recommendations are as follows;
i. Project managers should establish strong communication skills amongst stakeholders.
ii. Project managers should identify key stakeholders. iii. Project managers should identify influential stakeholders. iv. key stakeholders should be involved in decision making v. Transparency amongst stakeholders is adopted.
vi. Project managers should avoid corruption and bureaucracy among stakeholders.
IX. RECOMMENDATIONS It is necessary to offer the following recommendations.
i. It is recommended that more attention be placed on organizing project management processes according to their impact
and influence.
ii. To preserve the construction projects after its completion, the quality of materials used in construction projects must not
be compromised.
iii. More project management metrics recently developed in other research works like benefit to end users, benefit to
national infrastructure should be included for performance Measurement.
iv. With this, the projects should not necessarily be organization based and will be more useful to all stakeholders.
Embracing a tactical approach to engaging in project management practices is recommended through implementing
customer satisfaction surveys, meetings and communication effectiveness evaluation forms and analysing the turnaround
time for outstanding issues and informally through listening observing and conversing with relevant parties.
v. The function of identifying projects through systematic procedures should be encouraged on every individual project.
This should not be left in the hands of only the end users of a project.
REFERENCES
D. K. Bird (2009). The use of questionnaires for acquiring information on public perception of natural hazards and risk
mitigation – a review of current knowledge and practice. Nat. Hazards Earth Syst. Sci.
Bourne, L. (2008). Stakeholder Relationship Management Maturity. International journal of project management .

International Journal of Scientific and Research Publications, Volume 10, Issue 1, January 2020 278
ISSN 2250-3153
http://dx.doi.org/10.29322/IJSRP.10.01.2020.p9741 www.ijsrp.org
J. K. Crawford, Cabanis-Brewin, J., Crawford, D. B., & Pennypacker, J. (2008). Project Management Roles & Responsibilities
Second Edition.
Dekkar, & Qing. (2014). Stakeholder Relationship . journal of management science .
E.W Robogals. (2012). Role Description – Project Manager. International Journal of project management .
L. N. Hunt, & Markwell, S. (2016). Identifying and Managing Internal and External Stakeholder Interest. International journal of
project management.
O. Itanyi, & W Ukpere, (2014). Stakeholder Relations Management as a Public Relations Tool for Socio-Economic Development
in Nigeria. Mediterranean Journal of Social Sciences.
J Karlsen, (2002). Project Stakeholder Management. Engineering Management Journal.
A. K. Mazur, & A. Pisarski. (2015). Major Project Managers internal and external stakeholders relationship: The development
and validation of measurement scales. International journal of Management.
Raiablu. (2014). Project Management stakeholder . Interantional jourmal of Project management .
Riahi, Y. (2017). Project Stakeholders: Analysis and Management Processes. International Journal of Project Management.
M. L. Saunders (2009). • Research Methods for Business Students (5th ed.).
A Wan,. (2010). Basic Concepts of Regression Analysis. Journal of Mathematics .
X, L., Yu, T., & Guo, L. (2017). Understanding Stakeholders’ Influence on Project Success with a New SNA Method: A Case
Study of the Green Retrofit in China. Journal of Management Sciences.
AUTHORS
Author 1- Dr. Cross Ogohi Daniel
Departments of Public Administration/Banking and Finance,
Nile University Of Nigeria, Abuja, Nigeria
Author 2- Inim Victor E.
Department Of Accounting,
Nile University of Nigeria,
Abuja, Nigeria

International Journal of Scientific and Research Publications, Volume 10, Issue 1, January 2020 279
ISSN 2250-3153
http://dx.doi.org/10.29322/IJSRP.10.01.2020.p9742 www.ijsrp.org
Comparative performance analysis of machine
learning models for breast cancer diagnosis
Ghufran Ullah1, HaiYan2
1School of information management (computer science), north China University of water resources and electric power, Henan, China
2School of information engineering, North China University of water resources and electric power, Henan, China
DOI: 10.29322/IJSRP.10.01.2020.p9742
http://dx.doi.org/10.29322/IJSRP.10.01.2020.p9742
Abstract- Breast cancer tumor is one the tumor discussed,
researched and thought over by many recent time philosopher for
it malignant and benign nature through manual and natural
language methods. Due to the severity of tumor and increasing rate
medical science has accepted this challenge and tried to diagnose
it on early stage. Manual methods are not giving the results for
mammographic images and statistical reviews for treatment. This
study tends to evaluate the performance of seven machine learning
classification models such as: Artificial Neural Network (NN),
Bayes Network (BN), k-Nearest Neighbors Algorithm (KNN),
Decision Tree (DT), Random Forest (RF), Logistic Regression
(LR) and Support Vector Machine (SVM) are used to diagnose
breast cancer symptoms. The accuracy for the prediction of breast
cancer has remained the disputed research area. Many authors
previously have worked and found the flaws in natural language,
and learning models of classification for breast cancer. Study
debates on the accuracy and efficiency of machine learning
models by comparing all seven methods using AUC values, K-
Fold Cross Validation and F-measure metric. Study used F
measure values, cross validation values and AUC (ROC) values
for interpreting the results of performance measurement of all
seven classification methods, results acquired suggested that all
seven methods are better and efficient as compare to the manual
methods of diagnosing the breast cancer and Random Forest as the
highly recommended and most appropriate methods to yield the
perfect results in AUC and Cross validation values for the
diagnosing the Datasets of BCCD and WBCD acquired from the
papers and used in many modules for analysis.
Index Terms- Breast Cancer, Classification Methods, Accuracy
and Efficiency, Performance measurement
I. INTRODUCTION
reast cancer in women is one of the deadly types of diseases
worldwide/globally. For the prediction of survival indicators
various researches have been showed that most of the evaluations
were mainly performed using basic statistical techniques.
According to world health organization in 2018, it is assessed that
627,000 women died from breast cancer that is approximately
15% of all cancer deaths among women [1]. Therefore it requires
more scientific methods for diagnosing. Machine learning method;
recently have taken part in medical treatment and predictions for
the symptoms of cancers and other maleficent diseases. Breast
cancer can be categorized Malignant and Benign. This study tends
to calculate the performance of seven machine learning
classification models such as: Artificial Neural Network, Bayes
Network, k-Nearest Neighbors Algorithm, Decision Tree,
Random Forest, Logistic Regression and Support Vector Machine
are used to diagnose breast cancer symptoms. The accuracy for the
prediction of breast cancer has remained the disputed research
area. Many authors previously have worked and found the flaws
in natural language and learning models of classification for breast
cancer. Study debates on the accuracy and efficiency of machine
learning models by comparing all seven methods using AUC
values, K-Fold Cross Validation and F-measure metric.
In this study we used two datasets related to breast cancer;
Wisconsin Breast Cancer Database (WBCD) and Breast Cancer
Coimbra Dataset (BCCD) and WEKA is used for all the
simulation and experiments to illustrate the results. This study
compares the result and interprets that performance evaluation of
seven methods which resulted in Random Forest as the highest
ranked method for diagnosing the breast cancer patient as compare
to other six methods.
The rest of the content of this paper is organized in
following order. In section 2, we discussed related work about
machine learning and breast cancer. We discussed research
methodology in section 3 and in section 4 we discussed about data
analysis and interpretation. In the last section we conclude this
paper and present possible future work.
II. LITERATURE REVIEW
Globally, the second most cause of deaths is Breast cancer.
In 2018, the most usual occurring distortions were in women’s
(almost 22.9% of female cancers). Within them, more than 2
million cases were diagnosed newly. In Western Europe and North
America, this disease is common but it’s also increasing in
developing countries. The main causes are life expectancy,
urbanization, and the implementation of western lifestyles. (Paola
De Cicco, 2019) [2] Said five-year survival rate has improved
from 63% in 1960 to 90% at present according to the American
Cancer Society. Classification plays an important role in data
mining and machine learning. Numerous researches have been
conducted on the datasets related to breast cancer using data
mining techniques and machine learning methods. For nearly 20
years, artificial neural networks and decision trees have been used
in cancer discovery and diagnosis. (Cicchetti, 1992)[3]. Machine
learning techniques have been used in many applications ranging
from identifying and categorizing tumors through CRT images
B

International Journal of Scientific and Research Publications, Volume 10, Issue 1, January 2020 280
ISSN 2250-3153
http://dx.doi.org/10.29322/IJSRP.10.01.2020.p9742 www.ijsrp.org
and X-ray (Liotta, 2007) [4]. More than 1500 papers are published
on the subject of machine learning and cancer as stated by latest
PubMed statistics. But, many of these papers are related with
machine learning methods to classify, to categorize, to detect and
to distinguish tumors and other distortions. We can conclude that
machine learning is primarily used as assistance for cancer
diagnosis and detection (McCarthy, 2004) [5].
The growth of a cancer tumor is linked with its temperature.
Many masses are benign that implies the irregular development
restricts to a limited, single and growing mass of cells (Gokhale,
2009)[6]. Early stages breast cancer is commonly detect by
Mammography. Mammograms are for the most part examined by
radiologists to differentiate the early stage of cancer (Domínguez,
2009) [7]. In literature, for breast tumor conclusion in tissue level,
multiple commitments were made concerning about the use of
example pattern recognition techniques. A model is proposed by
tumor (al-shamlan, 2010)[8] and his group for the extraction of
feature values to examine the breast cancer mammogram images
for the classification of breast. (Yixuan Li, 2018)[9] applied 5
methods to evaluate the performance of SVM, DT, ANN, RF and
LR and resulted in identifying that Random Forest provides
befitting results in predicting the cased of tumor patients in breast
cancer. This study tends to evaluate the performance of seven
Machine-learning classification models and diagnose breast
cancer symptoms with the comparison of accuracy values of all
methods with RF. (kiyan, 2004) [10] Explain that breast cancer
diagnosis can be performed effectively by using statistical neural
networks. (Lertworaprachaya, 2014) [11] A new model is
proposed for composing decision trees by the use of interval-
valued fuzzy membership values.
III. RESEARCH METHODOLOGY
The chapter presents the research design and Datasets used
in statistical treatment and performance evaluation of breast
cancer patient. It also depicts the data analysis techniques, the data
analysis procedure and statistical treatment of data to achieve the
objective of the study.
1.1 Description of datasets:
This study uses 2 datasets relevant to Breast Cancer; Breast
Cancer Coimbra Dataset (BCCD) and Wisconsin Breast Cancer
Database (WBCD). Attributes of both the datasets are different but
relevant to the breast cancer patient. First dataset is comprises of
117 entries identity is given as the age of the patient ranging from
34 to 89, frequency distribution is used to understand the classes
as per the age group of the subject used in the dataset. Second
dataset is comprised of 570 entries given a separate ID for each
subject in the dataset. Both datasets are coded according to get the
utmost result at similar frequency distribution classes.
Table.1 Characteristics of dataset1
Table.2 characteristics of dataset2
S/No. Characteristics Code Remarks
1 Age A
2 BMI B
3 Glucose G
4 Insulin I
5 Homa H
6 Leptin L
7 Adiponectin AD
8 MCP M
S/No. Characteristics Code Remarks
1 radius mean R
2 texture mean T
3 area mean AR
4 parameter mean PM
5 smoothness mean SM
6 compactness means CM
7 concave mean C
8 concavity mean CN
9 Symmetry means SM
10 Fractal dimension mean FD

International Journal of Scientific and Research Publications, Volume 10, Issue 1, January 2020 281
ISSN 2250-3153
http://dx.doi.org/10.29322/IJSRP.10.01.2020.p9742 www.ijsrp.org
1.2 Modeling method
Study intends to imply seven machine learning methods
which respectively are NN, BN, KNN, DT, RF, LR and SVM. The
aim of the study is to select a suitable primary model with
maximum prediction accuracy.
For the selection of primary model we combined both the
index of F measure metric and accuracy. We used random forest
as a classification model for the prediction of breast cancer either
benign or malignant. Ratio of both the datasets are distributed in
subsets such 70% to 30%. Study implies 70 percentages as training
set and 30 percentages as testing data. Firstly we trained
classification model by applying training data and secondly we
applied test data on a trained model. Later on we compared the
results of prediction accuracy of RF with other models.
Figure.1 proposed model
2. EXPERIMENTS AND INTERPRETATIONS
In this section we will elaborate the comparative analysis on
experimental results of seven machine learning models. Dataset
BCCD classification has malignant weight of 64 counts and
benign weight of 52 counts in total they are 116 count distributed
in different classes and sets. It is intended to apply all seven
machine learning methods to examine the database.
For the selection of primary model we combined both the
index of F-measure metric and accuracy. Accuracy depends on the
measurements of classifier and it’s calculated by average of true
positive items and false positive items and F-measure matric is
measured by harmonic average of recall and precision.
Accuracy can be calculated by percentage of correctly classified
occurrences (TP + TN) / (TP + TN + FP + FN), Whereas TN , FN,
TP and FP represents true negatives, false negatives, true positives
and false positives respectively. F-measure metric can be
calculated by harmonic mean of the precision and recall.
A model consider to be more efficient if the value of F-
measure will be high, where 0 represents as worst while 1
represent as high efficiency of model. Table3 and table4 shows the
accuracy values and F-measure metric values of seven machine
learning methods on BCCD, WBCD data. Figure 2 and figure 3
shows the comparison of all seven classification methods by
accuracy and F-measure metric on WCCD and WBCD datasets.
Machine Learning Models
Artificial Neural Network,
Bayes Network,
k-Nearest Neighbors
Algorithm,
Decision Tree,
Random Forest,
Logistic Regression
Support Vector Machine
DATA SETS
Breast Cancer Coimbra Dataset
(BCCD)
Wisconsin Breast Cancer
Database
(WBCD)
INPUT Assessment of the
methods used in
Machine Learning
Models
Data inputs
WEKA
K-Fold Cross
Validation,
F-measure metric, and
AUC Values
Application of Statistical
tools
PROCESS
Comparative analysis of
Machine Learning Models
for Diagnosing Breast
Cancer
OUTPUT
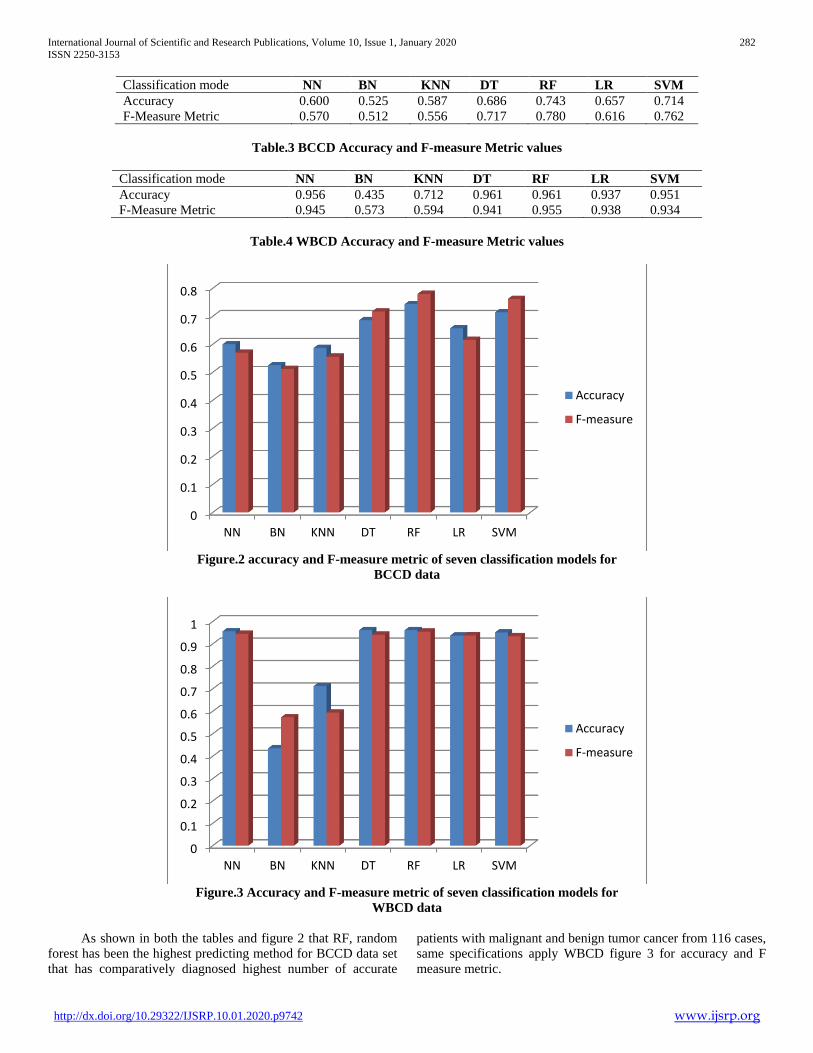
International Journal of Scientific and Research Publications, Volume 10, Issue 1, January 2020 282
ISSN 2250-3153
http://dx.doi.org/10.29322/IJSRP.10.01.2020.p9742 www.ijsrp.org
Classification mode NN BN KNN DT RF LR SVM
Accuracy 0.600 0.525 0.587 0.686 0.743 0.657 0.714
F-Measure Metric 0.570 0.512 0.556 0.717 0.780 0.616 0.762
Table.3 BCCD Accuracy and F-measure Metric values
Classification mode NN BN KNN DT RF LR SVM
Accuracy 0.956 0.435 0.712 0.961 0.961 0.937 0.951
F-Measure Metric 0.945 0.573 0.594 0.941 0.955 0.938 0.934
Table.4 WBCD Accuracy and F-measure Metric values
Figure.2 accuracy and F-measure metric of seven classification models for
BCCD data
Figure.3 Accuracy and F-measure metric of seven classification models for
WBCD data
As shown in both the tables and figure 2 that RF, random
forest has been the highest predicting method for BCCD data set
that has comparatively diagnosed highest number of accurate
patients with malignant and benign tumor cancer from 116 cases,
same specifications apply WBCD figure 3 for accuracy and F
measure metric.
0
0.1
0.2
0.3
0.4
0.5
0.6
0.7
0.8
NN BN KNN DT RF LR SVM
Accuracy
F-measure
0
0.1
0.2
0.3
0.4
0.5
0.6
0.7
0.8
0.9
1
NN BN KNN DT RF LR SVM
Accuracy
F-measure
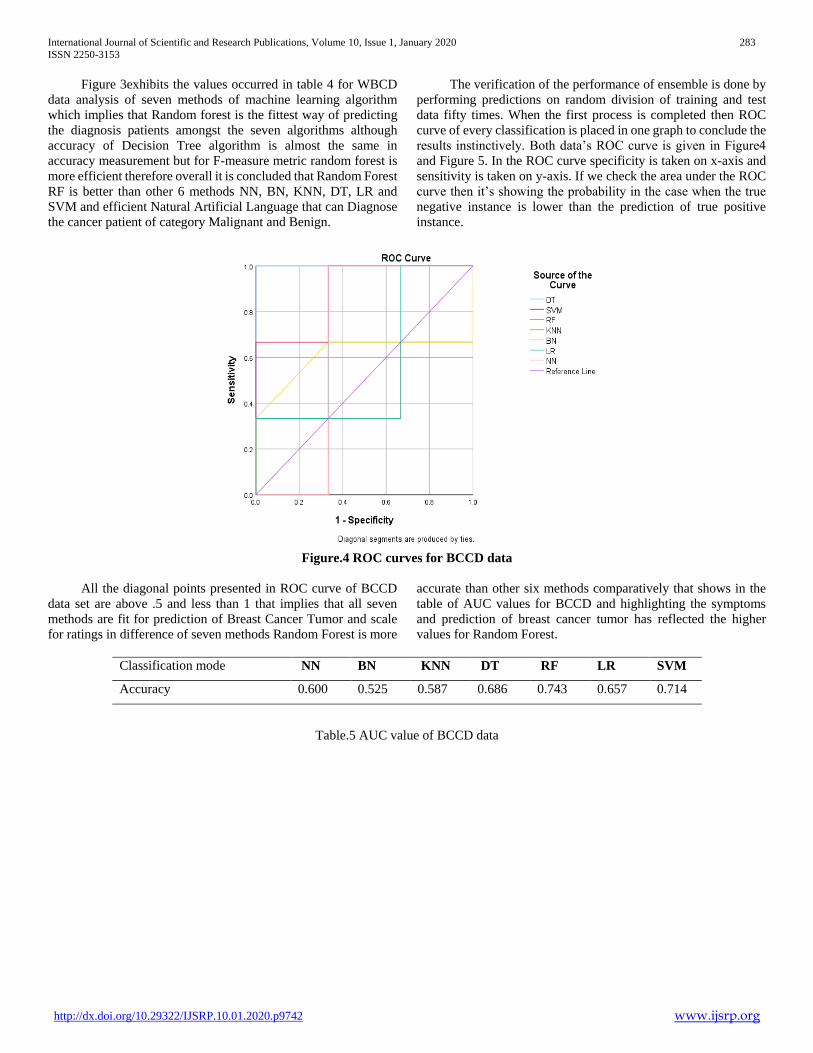
International Journal of Scientific and Research Publications, Volume 10, Issue 1, January 2020 283
ISSN 2250-3153
http://dx.doi.org/10.29322/IJSRP.10.01.2020.p9742 www.ijsrp.org
Figure 3exhibits the values occurred in table 4 for WBCD
data analysis of seven methods of machine learning algorithm
which implies that Random forest is the fittest way of predicting
the diagnosis patients amongst the seven algorithms although
accuracy of Decision Tree algorithm is almost the same in
accuracy measurement but for F-measure metric random forest is
more efficient therefore overall it is concluded that Random Forest
RF is better than other 6 methods NN, BN, KNN, DT, LR and
SVM and efficient Natural Artificial Language that can Diagnose
the cancer patient of category Malignant and Benign.
The verification of the performance of ensemble is done by
performing predictions on random division of training and test
data fifty times. When the first process is completed then ROC
curve of every classification is placed in one graph to conclude the
results instinctively. Both data’s ROC curve is given in Figure4
and Figure 5. In the ROC curve specificity is taken on x-axis and
sensitivity is taken on y-axis. If we check the area under the ROC
curve then it’s showing the probability in the case when the true
negative instance is lower than the prediction of true positive
instance.
Figure.4 ROC curves for BCCD data
All the diagonal points presented in ROC curve of BCCD
data set are above .5 and less than 1 that implies that all seven
methods are fit for prediction of Breast Cancer Tumor and scale
for ratings in difference of seven methods Random Forest is more
accurate than other six methods comparatively that shows in the
table of AUC values for BCCD and highlighting the symptoms
and prediction of breast cancer tumor has reflected the higher
values for Random Forest.
Classification mode NN BN KNN DT RF LR SVM
Accuracy 0.600 0.525 0.587 0.686 0.743 0.657 0.714
Table.5 AUC value of BCCD data
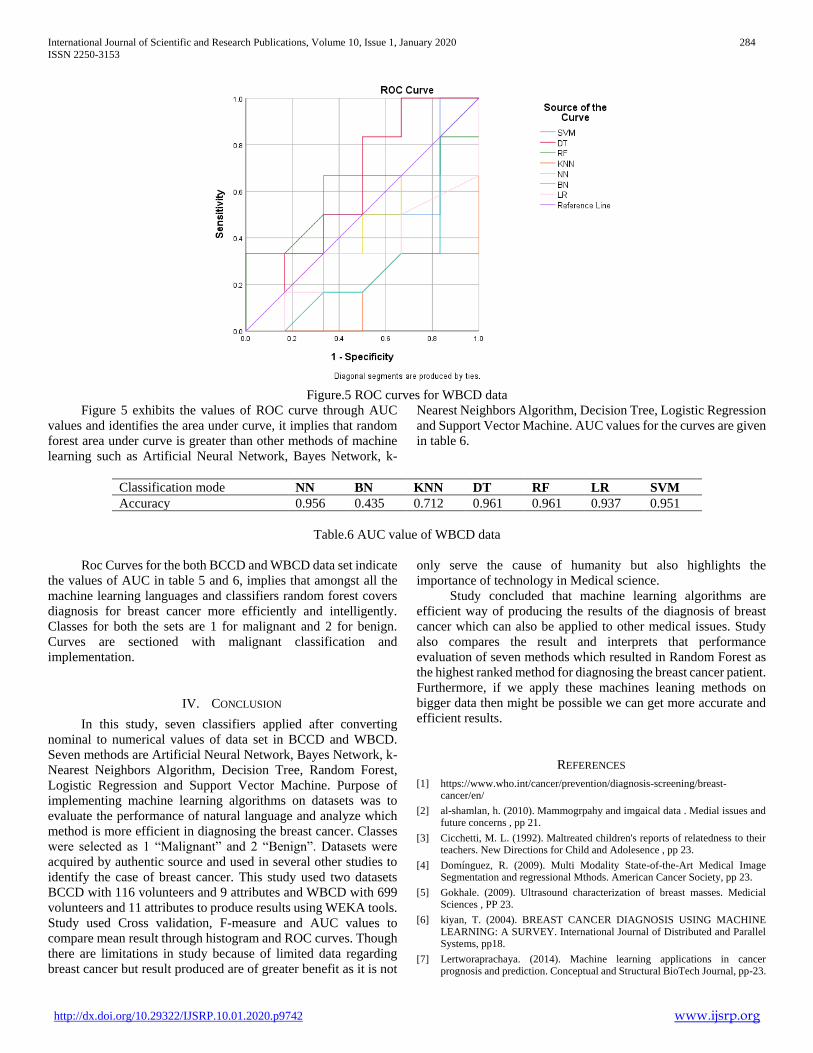
International Journal of Scientific and Research Publications, Volume 10, Issue 1, January 2020 284
ISSN 2250-3153
http://dx.doi.org/10.29322/IJSRP.10.01.2020.p9742 www.ijsrp.org
Figure.5 ROC curves for WBCD data
Figure 5 exhibits the values of ROC curve through AUC
values and identifies the area under curve, it implies that random
forest area under curve is greater than other methods of machine
learning such as Artificial Neural Network, Bayes Network, k-
Nearest Neighbors Algorithm, Decision Tree, Logistic Regression
and Support Vector Machine. AUC values for the curves are given
in table 6.
Classification mode NN BN KNN DT RF LR SVM
Accuracy 0.956 0.435 0.712 0.961 0.961 0.937 0.951
Table.6 AUC value of WBCD data
Roc Curves for the both BCCD and WBCD data set indicate
the values of AUC in table 5 and 6, implies that amongst all the
machine learning languages and classifiers random forest covers
diagnosis for breast cancer more efficiently and intelligently.
Classes for both the sets are 1 for malignant and 2 for benign.
Curves are sectioned with malignant classification and
implementation.
IV. CONCLUSION
In this study, seven classifiers applied after converting
nominal to numerical values of data set in BCCD and WBCD.
Seven methods are Artificial Neural Network, Bayes Network, k-
Nearest Neighbors Algorithm, Decision Tree, Random Forest,
Logistic Regression and Support Vector Machine. Purpose of
implementing machine learning algorithms on datasets was to
evaluate the performance of natural language and analyze which
method is more efficient in diagnosing the breast cancer. Classes
were selected as 1 “Malignant” and 2 “Benign”. Datasets were
acquired by authentic source and used in several other studies to
identify the case of breast cancer. This study used two datasets
BCCD with 116 volunteers and 9 attributes and WBCD with 699
volunteers and 11 attributes to produce results using WEKA tools.
Study used Cross validation, F-measure and AUC values to
compare mean result through histogram and ROC curves. Though
there are limitations in study because of limited data regarding
breast cancer but result produced are of greater benefit as it is not
only serve the cause of humanity but also highlights the
importance of technology in Medical science.
Study concluded that machine learning algorithms are
efficient way of producing the results of the diagnosis of breast
cancer which can also be applied to other medical issues. Study
also compares the result and interprets that performance
evaluation of seven methods which resulted in Random Forest as
the highest ranked method for diagnosing the breast cancer patient.
Furthermore, if we apply these machines leaning methods on
bigger data then might be possible we can get more accurate and
efficient results.
REFERENCES
[1] https://www.who.int/cancer/prevention/diagnosis-screening/breast-cancer/en/
[2] al-shamlan, h. (2010). Mammogrpahy and imgaical data . Medial issues and future concerns , pp 21.
[3] Cicchetti, M. L. (1992). Maltreated children's reports of relatedness to their teachers. New Directions for Child and Adolesence , pp 23.
[4] Domínguez, R. (2009). Multi Modality State-of-the-Art Medical Image Segmentation and regressional Mthods. American Cancer Society, pp 23.
[5] Gokhale. (2009). Ultrasound characterization of breast masses. Medicial Sciences , PP 23.
[6] kiyan, T. (2004). BREAST CANCER DIAGNOSIS USING MACHINE LEARNING: A SURVEY. International Journal of Distributed and Parallel Systems, pp18.
[7] Lertworaprachaya. (2014). Machine learning applications in cancer prognosis and prediction. Conceptual and Structural BioTech Journal, pp-23.

International Journal of Scientific and Research Publications, Volume 10, Issue 1, January 2020 285
ISSN 2250-3153
http://dx.doi.org/10.29322/IJSRP.10.01.2020.p9742 www.ijsrp.org
[8] Liotta, P. a. (2007). Application of Machinec Learning in cancer diagnoiss . Cancer Informatics, pp 7.
[9] McCarthy. (2004). Cancer Stage at Diagnosis and Survival among Persons with Social Security Disability Insurance on Medicare. Heatth Services and Researchs , pp 8.
[10] Paola De Cicco, M. V. (2019). Nutrition and Breast Cancer: A Literature Review on Prevention, Treatment and Recurrence. Nutrients, 15-20.
[11] Yixuan Li, Z. C. (2018). Performance Evaluation of Machine Learning Methods for breast cancer prediction. Applied and Computational, 212-216.
AUTHORS
First Author – Ghufran Ullah, School of information
management (computer science), north China University of water
resources and electric power, Henan, China,
Second Author – HaiYan, School of information engineering,
North China University of water resources and electric power,
Henan, China, [email protected]
International Journal of Scientific and Research Publications, Volume 10, Issue 1, January 2020 286
ISSN 2250-3153
http://dx.doi.org/10.29322/IJSRP.10.01.2020.p9743 www.ijsrp.org
Green synthesis and characterization of Ceria
nanoparticles using Ricinus communis leaf
extract
J.Suvetha Rani*
* Department of Physics, Thiagarajar College, Madurai-625009, Tamilnadu, India
DOI: 10.29322/IJSRP.10.01.2020.p9743
http://dx.doi.org/10.29322/IJSRP.10.01.2020.p9743
Abstract- Nowadays, green synthesis of nanoparticles has great interest and achievement due to its eco-benign and
low time consuming properties. In this work, Ceria nanoparticles is Synthesized using Ricinus communis (Castor
oil) leaf extract. The Synthesized nanoparticles are characterized by UV-Vis spectroscopy, dispersive X- ray
analysis (EDAX), which is attachment of scanning electron microscope (SEM). Crystalline nature and purity are
revealed by X-ray diffraction (XRD) and their FTIR spectra are examined to identify the effective functional groups
present in the synthesized nanoparticles. Raman studies show a characteristic peak at 461 cm−1.
Index Terms- Ceria nanoparticles, Green synthesis, Ricinus communis,Raman spectroscopy
I. INTRODUCTION
Semiconductor oxide Nanoparticles play an
important role in the recent research due to their
interesting physical and chemical properties. Ceria is
a semiconductor oxide with wide bandgap of 3.19eV
at room temperature and high excitation binding
energy. It is widely used in many applications like
sensor, fuel cell, catalyst, cosmetic, antioxidant and
bioimaging [1-6]. Ceria nanoparticles are less toxic
compare to other semiconductor oxide nanoparticles.
Generally Ceria nanoparticles were synthesized by
physical and chemical methods. Phytosynthesis of
ceria nanoparticles is more cost effective and
ecofriendly. Cerium oxide has two different oxide
forms, CeO2 and Ce2 O3. On the nanoscale, the
cerium oxide has cubic fluorite structure with the
coexistence of Ce3+ and Ce4+ ions on its surface. The
surface Ce3+ : Ce4+ ratio is influenced by the
microenvironment [7]. Recently, phytosynthesis of
ceria NPs was reported using different plants. The
plant extract acted as capping as well as stabilizing
agent in ceria nanoparticles synthesis process[1,8,9].
Ricinus communis or the castor oil plant is a
species of perennial flowering plant in the spurge
family, Euphorbiaceae. Although it is indigenous to
the southeastern and India today it is widespread
throughout tropical region. Castor seed is the source
of castor oil which has a wide variety of uses. Its leaf
extract has many medicinal uses. Its seed contains a
water-soluble toxin, ricin, which is also present in
lower concentrations throughout the plant. In this
paper, the synthesis of ceria nanoparticles using
Ricinus communis leaf extract and its
characterization studies have been reported for the
first time.
II. EXPERIMENTAL DETAILS
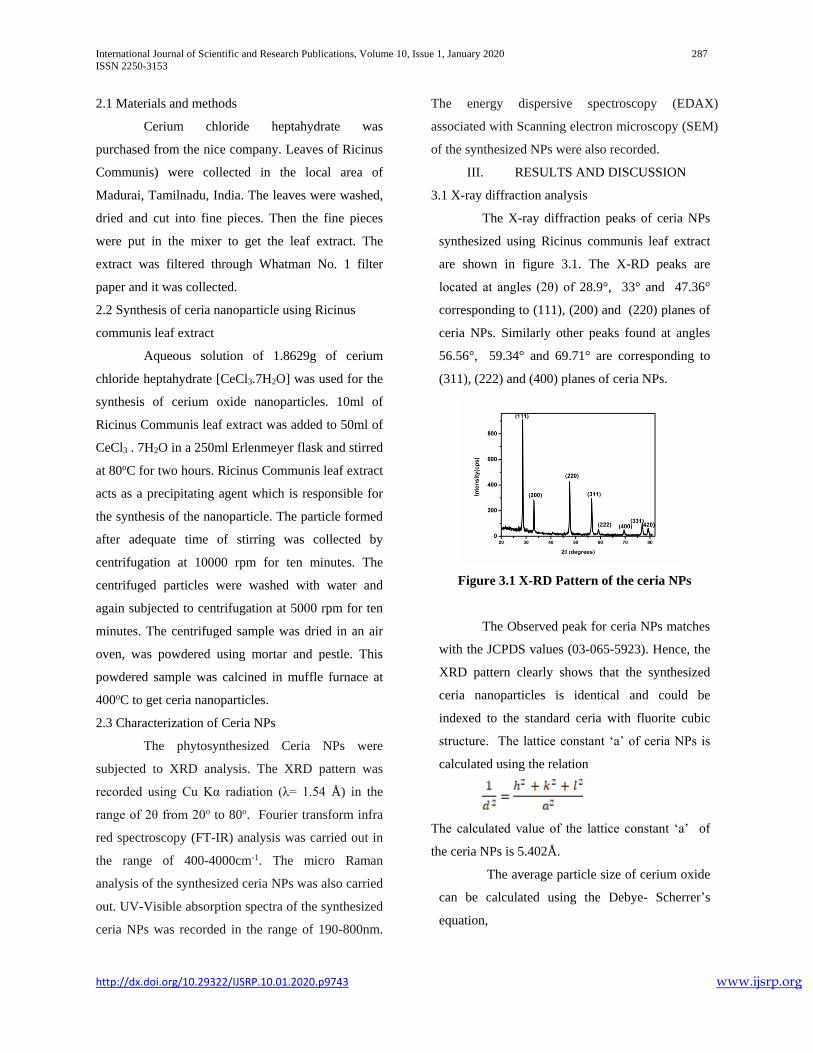
International Journal of Scientific and Research Publications, Volume 10, Issue 1, January 2020 287
ISSN 2250-3153
http://dx.doi.org/10.29322/IJSRP.10.01.2020.p9743 www.ijsrp.org
2.1 Materials and methods
Cerium chloride heptahydrate was
purchased from the nice company. Leaves of Ricinus
Communis) were collected in the local area of
Madurai, Tamilnadu, India. The leaves were washed,
dried and cut into fine pieces. Then the fine pieces
were put in the mixer to get the leaf extract. The
extract was filtered through Whatman No. 1 filter
paper and it was collected.
2.2 Synthesis of ceria nanoparticle using Ricinus
communis leaf extract
Aqueous solution of 1.8629g of cerium
chloride heptahydrate [CeCl3.7H2O] was used for the
synthesis of cerium oxide nanoparticles. 10ml of
Ricinus Communis leaf extract was added to 50ml of
CeCl3 . 7H2O in a 250ml Erlenmeyer flask and stirred
at 80oC for two hours. Ricinus Communis leaf extract
acts as a precipitating agent which is responsible for
the synthesis of the nanoparticle. The particle formed
after adequate time of stirring was collected by
centrifugation at 10000 rpm for ten minutes. The
centrifuged particles were washed with water and
again subjected to centrifugation at 5000 rpm for ten
minutes. The centrifuged sample was dried in an air
oven, was powdered using mortar and pestle. This
powdered sample was calcined in muffle furnace at
400oC to get ceria nanoparticles.
2.3 Characterization of Ceria NPs
The phytosynthesized Ceria NPs were
subjected to XRD analysis. The XRD pattern was
recorded using Cu Kα radiation (λ= 1.54 Å) in the
range of 2θ from 20o to 80o. Fourier transform infra
red spectroscopy (FT-IR) analysis was carried out in
the range of 400-4000cm-1. The micro Raman
analysis of the synthesized ceria NPs was also carried
out. UV-Visible absorption spectra of the synthesized
ceria NPs was recorded in the range of 190-800nm.
The energy dispersive spectroscopy (EDAX)
associated with Scanning electron microscopy (SEM)
of the synthesized NPs were also recorded.
III. RESULTS AND DISCUSSION
3.1 X-ray diffraction analysis
The X-ray diffraction peaks of ceria NPs
synthesized using Ricinus communis leaf extract
are shown in figure 3.1. The X-RD peaks are
located at angles (2θ) of 28.9°, 33° and 47.36°
corresponding to (111), (200) and (220) planes of
ceria NPs. Similarly other peaks found at angles
56.56°, 59.34° and 69.71° are corresponding to
(311), (222) and (400) planes of ceria NPs.
Figure 3.1 X-RD Pattern of the ceria NPs
The Observed peak for ceria NPs matches
with the JCPDS values (03-065-5923). Hence, the
XRD pattern clearly shows that the synthesized
ceria nanoparticles is identical and could be
indexed to the standard ceria with fluorite cubic
structure. The lattice constant ‘a’ of ceria NPs is
calculated using the relation
The calculated value of the lattice constant ‘a’ of
the ceria NPs is 5.402Å.
The average particle size of cerium oxide
can be calculated using the Debye- Scherrer’s
equation,
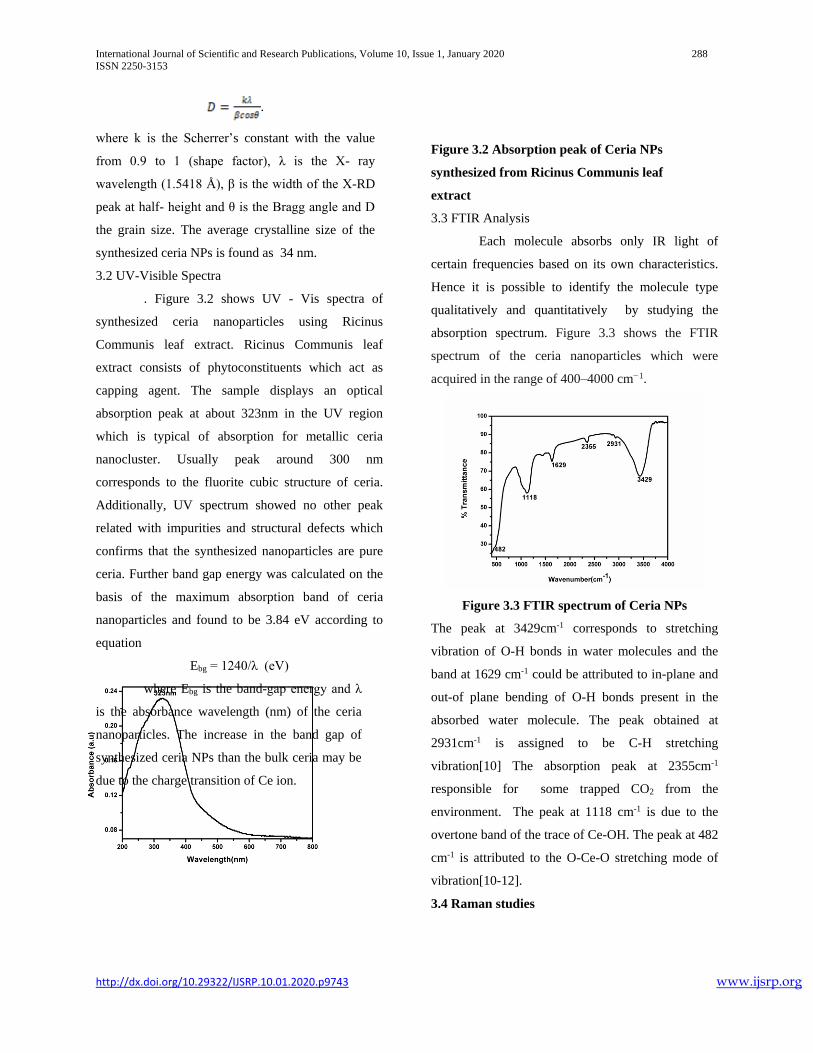
International Journal of Scientific and Research Publications, Volume 10, Issue 1, January 2020 288
ISSN 2250-3153
http://dx.doi.org/10.29322/IJSRP.10.01.2020.p9743 www.ijsrp.org
.
where k is the Scherrer’s constant with the value
from 0.9 to 1 (shape factor), λ is the X- ray
wavelength (1.5418 Å), β is the width of the X-RD
peak at half- height and θ is the Bragg angle and D
the grain size. The average crystalline size of the
synthesized ceria NPs is found as 34 nm.
3.2 UV-Visible Spectra
. Figure 3.2 shows UV - Vis spectra of
synthesized ceria nanoparticles using Ricinus
Communis leaf extract. Ricinus Communis leaf
extract consists of phytoconstituents which act as
capping agent. The sample displays an optical
absorption peak at about 323nm in the UV region
which is typical of absorption for metallic ceria
nanocluster. Usually peak around 300 nm
corresponds to the fluorite cubic structure of ceria.
Additionally, UV spectrum showed no other peak
related with impurities and structural defects which
confirms that the synthesized nanoparticles are pure
ceria. Further band gap energy was calculated on the
basis of the maximum absorption band of ceria
nanoparticles and found to be 3.84 eV according to
equation
Ebg = 1240/λ (eV)
where Ebg is the band-gap energy and λ
is the absorbance wavelength (nm) of the ceria
nanoparticles. The increase in the band gap of
synthesized ceria NPs than the bulk ceria may be
due to the charge transition of Ce ion.
Figure 3.2 Absorption peak of Ceria NPs
synthesized from Ricinus Communis leaf
extract
3.3 FTIR Analysis
Each molecule absorbs only IR light of
certain frequencies based on its own characteristics.
Hence it is possible to identify the molecule type
qualitatively and quantitatively by studying the
absorption spectrum. Figure 3.3 shows the FTIR
spectrum of the ceria nanoparticles which were
acquired in the range of 400–4000 cm−1.
Figure 3.3 FTIR spectrum of Ceria NPs
The peak at 3429cm-1 corresponds to stretching
vibration of O-H bonds in water molecules and the
band at 1629 cm-1 could be attributed to in-plane and
out-of plane bending of O-H bonds present in the
absorbed water molecule. The peak obtained at
2931cm-1 is assigned to be C-H stretching
vibration[10] The absorption peak at 2355cm-1
responsible for some trapped CO2 from the
environment. The peak at 1118 cm-1 is due to the
overtone band of the trace of Ce-OH. The peak at 482
cm-1 is attributed to the O-Ce-O stretching mode of
vibration[10-12].
3.4 Raman studies

International Journal of Scientific and Research Publications, Volume 10, Issue 1, January 2020 289
ISSN 2250-3153
http://dx.doi.org/10.29322/IJSRP.10.01.2020.p9743 www.ijsrp.org
The structure of the ceria nanoparticles is
further explained by using Micro Raman
spectroscopy which is shown in figure 3.4..
Figure 3.4 Raman spectrum of synthesized ceria
nanoparticles
Ceria nanoparticles exhibited a strong
intense band at 461cm−1 which generally corresponds
to the F2g Raman active-mode due to symmetrical
breathing mode of the O atoms around each cerium
ions. Thus Raman spectrum confirms that the
synthesized products have well crystalline fluorite
cubic structure [13]. The particle size of the ceria
NPs can also be calculated using Raman line
broadening using the formula
where is the full width half maximum of the Raman
active mode peak and DR is the particle size[ 14]. On
substituting, as 461cm-1, the calculated particle size
is obtained around 3nm which is found to be lower
than that of obtained from X-RD spectrum.
3.5 EDAX Analysis
Analysis through energy dispersive X-ray
(EDX) spectrometer has verified the presence of
elemental cerium and the oxygen in the synthesized
ceria nanoparticles (Fig. 3.5). The vertical axis
displays the number of X-ray counts and the
horizontal axis displays energy in KeV. The peaks in
the spectrum marks the major emission energies of
cerium and oxygen. It is found that the atomic
percentage of Oxygen is more than that of cerium.
Figure 4.4 EDAX spectrum of synthesized ceria
nanoparticles
3.6 SEM ANALYSIS
The surface morphology of the Ceria
nanoparticles is examined by scanning electron
microscopy (SEM) and is shown in figure 4.5.
Figure 3.6 SEM image of ceria nanoparticles
SEM images reveal that there are various
sizes of particles in the as-prepared sample. It can be
clearly observed that many agglomerates with an
irregular morphologies. The particles are connected
to each other to make long complex systems with
irregular porous size and shapes. There are numerous
micro pores are present on the surface of the
particles. The pores are formed due to the liberation
of large amount of CO2 and H2O gases during

International Journal of Scientific and Research Publications, Volume 10, Issue 1, January 2020 290
ISSN 2250-3153
http://dx.doi.org/10.29322/IJSRP.10.01.2020.p9743 www.ijsrp.org
calcination process. These escaping gases are swelled
the materials and resulted in the formation of pores in
the materials.
IV. CONCLUSION
In summary, Ceria NPs have been
successfully synthesized using Ricinus Communis
leaf extract. UV studies indicated that the obtained
absorption peak is of metallic ceria nanocluster. The
XRD patterns, EDAX pattern and Micro Raman
spectra suggest the formation ceria NPs with cubic
fluorite structure. The functional groups in the ceria
nanoparticles observed in FTIR spectrum confirms
the presence of ceria. The SEM image clearly showed
many agglomerates with an irregular morphologies. It
is expected that the green synthesized ceria NPs can
find many potential applications as bulk metal ceria
in many fields.
REFERENCES
1. Ayyakannu Arumugam, chandrasekaran kathikeyan,
Abdulrahman syedahamed Haja Hameed, Kasi
Gopinath, Shanmugam Gowri, Viswanathan Karthika,
“Synthesis of cerium oxide nanoparticles using
Gloriosa superba L. leaf extract and their structural,
optical and antibacterial properties”, Materials Science
and Engineering: C, 49, (2015), Pages 408-415.
2. Gagnon J, Fromm KM, “Toxicity and protective effects
of cerium oxide nanoparticles depending on their
preparation method, particle size, cell type, and
exposure route”, European Journal of Inorganic
chemistry, 27, (2015), 4510-4517.
3. Tian Z, Li J, Zhang Z, Gao W, Zhou X, Qu Y, “ Highly
sensitive and robust peroxidase like acitivity of porous
nanorods of ceria and their application for breast cancer
detection”, Biomaterials, 59, (2015), 116-124.
4. Arya A, Gangwar A, Singh SK etal, “ Cerium oxide
nanoparticles promote neurogenesis and abrogate
hypoxia induced memory impairment through AMPK-
PKC-CBP signaling cascade, International journal of
nanomedicine, 11, (2016), 1159-1173.
5. Beaudoux X, Virot M, Chave T, Durand G, Leturcq G,
Nikitenko SI, “Vitamic C boosts ceria based catalyst
recycling”, Green chemistry, 18, (2016), 3656-3668.
6. Gawande M, Bonifacio VDB, Varma Rs etal, “
Magnetically recyclable magnetite Ceria nanocatalyst-
applications in multicomponent reactions under benign
conditions”, Green chemistry, 15(5), (2013), 1226-
1231.
7. Fahimeh Charbgoo, Mansor Bin Ahmad, Majid
Darroudi, “ Cerium oxide nanoparticles: green
synthesis and biological applications” , International
journal of nanomedicine, 12, (2017), 1401-1413.
8. Kannan SK, Sundrarajan M, “A Green approach for the
synthesis of a cerium oxide nanoparticle:
characterization and antibacterial activity”,
International Journal of nanoscience, 13(03), (2014),
1450018.
9. Priya GS, Kannegnati A, Kumar KA, Rao KV, Bykkam
S, “Bio synthesis of cerium oxide nanoparticles using
Aloe arbadensis Miller Gel”, International Journal of
Science Research publications, 4(6), (2014), 1-4.
10. Sumalin Phoka, Paveena Laokul, Ekaphan Swatsitang,
Vinich Promarak, Supapan Seraphin, Santi Maensiri,,
“Synthesis, structural and optical properties of CeO2
nanoparticles synthesized by a simple polyvinyl
pyrrolidone (PVP) solution route” Materials Chemistry
and Physics 115 (2009) 423–428.
11. Devadoss Mangalam, Durai Manoharadoss,
Prabaharana, Karuppasamy Sadaiyandi, Manickam
Mahendran, Suresh Sagadevan “ Structural, Optical,
Morphological and Dielectric Properties of Cerium
Oxide Nanoparticles”, Materials Research, (2016),
19(2): 478-482.
12. Tommy Mokkelbost, Ingeborg Kaus, Tor Grande, and
Mari-Ann Einarsrud, “Combustion Synthesis and
Characterization of Nanocrystalline CeO2-Based
Powders Chemical Materials, 16, (2004), 5489-5494.
13. Santi Maensiri, Sarawuth Labuayai, Paveena Laokul,
Jutharatana Klinkaewnarong and
Ekaphan Swatsitang, “Structure and optical properties
of CeO2 nanoparticles prepared by using lemongrass
plant extract solution” Japanese Journal of Applied
Physics 53, (2014), 06JG14.

International Journal of Scientific and Research Publications, Volume 10, Issue 1, January 2020 291
ISSN 2250-3153
http://dx.doi.org/10.29322/IJSRP.10.01.2020.p9743 www.ijsrp.org
14. Sumeet Kumar, Manish Srivastava, Jay Singh, Samar
Layek, Madhu Yashpal, Arnulf Materny and Animesh
K. Ojha, “ Controlled synthesis and magnetic properties
of monodispersed ceria nanoparticles”, AIP Advances
5, (2015), 027109.
AUTHORS
First Author – J.Suvetha Rani, M.Sc, M.Phil, M.E,
Ph.D, PG and Research Department of Physics,
Thiagarajar College, Madurai-625009. Tamilnadu,
India, [email protected].
International Journal of Scientific and Research Publications, Volume 10, Issue 1, January 2020 292
ISSN 2250-3153
http://dx.doi.org/10.29322/IJSRP.10.01.2020.p9744 www.ijsrp.org
Influence Of Entrepreneurial Development Training
Programme On Psycho-Social And Economic Stability Of
Widows In South Senatorial District Of Ondo State,
Nigeria
Erinsakin, Martins Ojo (Ph.D) *, Agun, Paulinah Olusola**, Mr. Akinbebije John ***
* Department of Continuing Education/Adult and Non-Formal Education, Adeyemi College of Education, Ondo, Ondo State, Nigeria.
** Department of Continuing Education/Adult and Non-Formal Education, Adeyemi College of Education, Ondo, Ondo State, Nigeria. *** Department of Continuing Education/Adult and Non-Formal Education, Adeyemi College of Education, Ondo, Ondo State, Nigeria.
DOI: 10.29322/IJSRP.10.01.2020.p9744
http://dx.doi.org/10.29322/IJSRP.10.01.2020.p9744
Abstract- This study was carried out to ascertain the influence of
Entrepreneurial Development Training Programme (EDTP) on
Psycho-social and economic stability of widows in the south
senatorial district of Ondo State, Nigeria. Descriptive survey
research design was adopted for the study. The study population
comprised, widows who were clientele of the programme. The
sample size of the study was Ninety (90) respondents, selected
through a multi-stage sampling technique. Two research
instruments were used to collect data for the study. A well-
developed questionnaire by the researchers, entitled
“Questionnaire on the Influence of Entrepreneurial Development
Training Programme on Psycho-Social and District of Ondo State,
Nigeria” was used as quantitative research instruments. Focus
Group Discussion (FGDs) was used as an instrument to collect
data quantitatively. The research instruments were validated by an
expert in test and test measurement at Adeyemi College of
Education, Ondo, Ondo State, Nigeria. The reliability of the
instruments used to collect quantitative data was determined
through test retest method of two weeks interval and 0.72
coefficient reliability obtained. The research questions raised for
the study were analysed using descriptive statistics (frequency
counts, simple percentages and means), while the qualitative data
was done qualitatively, through transcription. Based on the results
of the study, it was concluded that EDTP could address the
psycho-social and economic challenges of widows
(unemployment, financial challenges) in Ondo State Senatorial
District. Recommendations were made that more awareness
should be created to widows on the relevance of the programme to
their financial wellbeing and wellness by Ondo State Government.
Also, the state should endeavour to embrace that more widows
enroll for the programme and so on.
Index Terms- Entrepreneurial development, Training Psycho-
Social, Economic Stability, Unemployment.
I. BACKGROUND TO THE STUDY
omen are often experiencing the challenges of widowhood,
especially in Africa, Nigeria, inclusive. Widowhood is a
situation where one of the others in marriage either man or woman
loses his or her spouse. A widow is a woman whose husband has
died and still remains unmarried. Widows are in most cases
subjected to disharmonizing situations which poses a severe threat
to socio-economic and psychological wellness or wellbeing of
women.
The challenges of widowhood are enormously
experience by women (Mathias, 2015). Ethiel (2016) noted that
African women remain victims of harmful traditional risks that are
associated with the passing away of their husbands. Ugweeze
(1997) opined that, widows are targets of accusations of be
witchment or soccery and they are often made to be responsible
for the death of their husbands. The breament of widow in Africa
is very traumatic and evoke sympathy (Onyenuchie, 1999).
Widowhood envokes both physical and psychological challenges
to women. Widowhood period to women in most Nigerian
communities are characterized by financial challenge, emotional
and psychological deprivation, social alienation and other harmful
practices.
After the death of men in most African communities their
wives’ become victims of several challenges ranging from
financial difficulty, health challenges inability to support or cope
with the needs of the family materially and so on. It is on this
sound that widows, especially become the participants targets of
entrepreneurship development training programme (EDTP) of
Ondo State, Nigeria, among others.
Poverty, unemployment and other socio-economic and
psychological challenges remain topical and perennial issues in
Ondo State and the country, Nigeria at large. These situations have
unleased serious problems to the people such as, destitution pains,
hunger, joblessness, health challenges, social problems etc. This
resulted into Implementation Entrepreneurship Development
Training Programme (EDTP) as one of the remedies taken to
address their situations. Olorunmolu and Agbede (2012), states
that the programme would enhance job creation, reduce high rate
of joblessness alleviate poverty and so on. It is believed that if
people are gainfully employed or self-employed, most challenges
associating with unemployment will be reduced it not completely
eradicated. Hence, in 1999, soon after the nation returned from
political sabbatical and state government implemented EDTP. W
International Journal of Scientific and Research Publications, Volume 10, Issue 1, January 2020 293
ISSN 2250-3153
http://dx.doi.org/10.29322/IJSRP.10.01.2020.p9744 www.ijsrp.org
Each of the Eighteen (18) Local Government Areas of the state
has at least a centre for the programme. The target participants are;
the jobless graduates, civil servants, retirees, widows, artisans and
so on (Erinsakin, 2014).
The main aim of the programme is to curtail an illusory
life of people without job. Several studies had been carried on
Entrepreneurial Development Training Programme (EDTP).
Observable, little or nothing has been done on influence of EDTP
on psycho-social and economic stability of widows in south
senatorial district of Ondo State, Nigeria. Thus, necessitated this
study.
II. STATEMENT OF THE PROBLEM
In African communities, Nigeria inclusive widows all
over the country are experiencing myriads of challenges ranging
from socio-economic to psychological problems. Thus, informed
involving widows as clientele of Entrepreneurial Development
Training Programme (EDTP) of Ondo State, Nigeria. EDTP centre
spreads across the length and breadth of Ondo State. A Local
Government has a least a centre.
It is a belief of Ondo State Government based on the
implementation guidelines of the programme that a programme
should be able to address poverty, unemployment, thus curb
several negative consequential challenges associated with these
problems (poverty and unemployment). It is against this backdrop
this research was carried out on influence of (EDTP) on psycho-
social and economic stability of widows in south senatorial district
of Ondo State, Nigeria.
III. THEORETICAL FRAMEWORK
This study is anchored on Becker’s Human Capital
Theory
The human capital theory was propounded by Becker in
1993. However, the origin of the theory has been traced to Adam
Smith (Wikipedia Free Encyclopedia) who defined, Human
Capital Theory as the acquired and useful abilities of all the
inhabitants or members of a society. The acquisition of such
talents and their maintenance by the acquirers. According to Adam
Smith, it is through education, study or apprenticeship. Smith
emphasizes that costs as real expenses, which are capital fixed and
realized as they were in the person. Adam Smith opines, that these
talents make persons to be fortune and that of the society, they live
or belong to (Becker, 1993 & 1996).
The human capital theory is defined as the activity that
promotes or increases future consumption possibilities by
increasing the resources in people, through training, which has
been identified as one of such activities (Becker, 1993 and 1996).
Human capital theory suggests that, education or training raises
the productivity of workers by imparting useful knowledge and
skill thus, raising workers’ future incomes by increasing their life-
time earnings.
Human capital theory therefore observes that, education
or training raises workers’ future incomes by raising or increasing
their life-time earning (Becker, 1964). It is worth noting, that the
use of the terms in the modern neo-classical economic literature is
credited to Mincer (1958) in the Journal of Political Economy
titled “Investment in Human Capital and Personal Incomes
Distribution”. Becker’s Human capital theory states that, workers’
productivity is determined, through training acquired. Becker
(1964), observes, that education or training raises the productivity
of workers by imparting useful knowledge and skill, and provides
different explanations on how education is related to workers’
productivity.
The human capital theory tends to attribute workers’
knowledge level to their level of knowledge acquired in formal
schooling. This is the basis of Livingstone (1997) assumption that,
more schooling could lead to productivity and micro-economic
growth. However, it should be emphatically stressed, that formal
schooling cannot sustain individuals in terms of giving skills,
knowledge and developing one’s capacity to be effectively
productive to himself or herself and to his or her employer.
It is interesting to note, that formal schooling has its own
attendant problems in form of unemployed school graduates,
despite its rapid expansion, throughout the world in recent times.
However, as noted by Belanger and Tuijuman (1997) that adult
education development in developed countries in recent years is
focused on strengthening vocational skill acquisition, so as to meet
the needs of skills development, across all occupational strata in
the global, economy. There must be a mixture of education and
training availability to actually give vocational skill acquisition
opportunities to workers (Middleton, Zinderman and Adam, 1993;
Zinderman and Horn, 1995). The position of critique of Human
Capital Theory, rest on the fact that, workers’ productivity in their
occupation may not be only through formal education or schooling
rather, through the life-long learning. Effective employee must be
life-long learners in an increasing globally competitive enterprise
environment. The informal working related learning of workers
and their cumulative bodies of tacit knowledge as symbolic
relevance to their efficiency on the job (Livingstone, 1991).
The relevance of human capital theory to skill acquisition
and entrepreneurial development training programmes therefore
rests on the fact that the programmes fall within the scope of non-
formal education and which skills and training acquisition is one
of its objective. Also, that formal education to some extent may
not be adequate to offer adequate trainings and skills needed for
the optimal productivity of the workers, whether self-employed or
employed
Review of Related Literature
Entrepreneurial Development Training Programme of Ondo
State,Nigeria.
The location of Ondo State in Nigeria is at south-western part of
Nigeria. The state lies within the latitudes of 50, 451 and 80, 151
with and longitude 40, 451 and 61 Eat. It is bordered in the north-
west by Ekiti and Kogi States, West Central by Osun State; North-
East and East Central by Edo State; South-West by Ogun State and
South-East by Delta State.
The state is naturally endowed with natural mineral
resources, abundantly. The climatic condition of the state is good
for cash and food crops growing. The rainfall varies from
2,540mm in a year in the South-Eastern strip to 2,032mm along
the remaining coastline, 1.524mm in the middle part and 1,270mm
along the Northern part of the state (Ondo State Government,
2005).

International Journal of Scientific and Research Publications, Volume 10, Issue 1, January 2020 294
ISSN 2250-3153
http://dx.doi.org/10.29322/IJSRP.10.01.2020.p9744 www.ijsrp.org
Considering the climatic condition and natural mineral
resources which the state is endowed with the state is expected to
be very buoyant and economically developed. However, majority
of people in the state are living in an extreme poverty and without
gainful job. Agagu (2007), noted that there is a high rate of
unemployment in Ondo State. One of the measures adopted to
tackle this situation is implementation of (EDTP).
Obser (2006), stated that EDTP is principally arrived at
capacity building in entrepreneurship. It is meant to train clientele
of the programme in the following areas: identification of business
opportunities and gaps in the markets that can be tapped for
economic advantages; mobilization of finance and other resources
for doing business; organization, implementation and
management of business; coping with uncertainties and risks of
business; inculcating the spirit of enterprise management in the
target groups and encouragement of self-employment as a
conscious and deliberate choice for self-reliance.
Ogundele, Akingbade and Akinlabi (2012) stressed that
(EDTP) could boost productivity, motivation, create employment
and prosperity and revitalizing economy of the nation. Further,
that it could facilitate wealth creation, income generation for self-
reliance. Awogbade and Iwuamadi (2010), asserted that (EDTP)
could address the problem of searching for non-existing job and
an urgent way to oriented people to imbibe entrepreneurship
culture.
The United Nations Educational Scientific and Cultural
Organization (UNESCO) (2012), stated the following as
contributions of (EDTP) to a nations and individuals’ economic
development; increase in productivity, enhancement of market
competition, employment generation, promotion of effective
domestic resource utilization, wealth creation and income
generation, economic growth and development and so on. Garrett
(2012); Elumilade and Asaolu (2006), contended that (EDTP)
could increased sense of insecurity and achievement. Akpomi
(2009), stressed that the programme would make job seekers to
become job creators and to a large extent reduce poverty. Further,
it was stressed that EDTP is very imperative to tackled poverty.
Aina (2008), opined that EDTP would make individuals
to seek investment opportunity, profitably. In a nutshell, the
implementation of EDTP by Ondo State Government is to revamp
and resuscitate the economic status of both individual and Ondo
State.
IV. PURPOSE OF THE STUDY
The purpose of the study is to ascertain the influence of
Entrepreneurship Development Training Programme on psycho-
social and economic stability of widows in south senatorial district
of Ondo State, Nigeria.
V. SIGNIFICANCE OF THE STUDY
The following are the significance of the study to the
stakeholders in the provision of EDTP in Ondo State, Nigeria.
1. The findings of the study will enable Ondo State
Government to determine the effectiveness of EDTP on
addressing the psycho-social and economic challenges of
widows in Ondo State, Nigeria.
2. The findings of the study will enable other stakeholders
in EDTP provision in Ondo State, Nigeria to know that
through non-formal system of education widows’ socio-
economic challenges could also be tackled.
3. The findings of the research will also enable EDTP
programme to determine the extent at which the
programme objectives have been achieved on the target
participants, particularly the widows and so on.
VI. METHODOLOGY
Descriptive survey research design was adopted for the
study. The study population comprised the clientele of
Entrepreneurial Development Training Programme of Ondo State
splitful into three senatorial district (North, Central and South).
From each of the senatorial district, a centre that has a highest
number of participants for the programme was selected. Then a
simple random sampling technique was used to select thirty (30)
respondent from the three selected centres. Thus, moving the
respondents to be ninety (90).
Entrepreneurial Development Training Programme of
Ondo State Government, Nigeria. The sample size was Ninety
(90) respondents selected through a multi-stage sampling
technique. Data was collected using both the quantitative and
qualitative sampling techniques. For the qualitative technique, a
self-developed questionnaire by the research entitled
“Questionnaire on Influence of Entrepreneurial Development
Training Programme on Psycho-Social and Economic Stability of
Widows in South Senatorial District of Ondo State, Nigeria” was
used, while Focus Groups Discussion (FGD) used as a qualitative
research instrument to collect data for the study.
Both quantitative and qualitative instruments were
validated by an expert in test and measurement at Adeyemi
College of Education, Ondo, Ondo State, Nigeria and reliability of
the quantitative instrument was determined through test retest
method at two weeks interval. 0.72 coefficient reliability was
obtained, this made the instrument to be adjudged as having a high
reliability value that was good enough for the study, while that of
qualitative instrument was done, using another group of
respondents that were part of the first FGD. They were
interviewed and data collected were correlated with FGDs for the
study. The research questions for the study were analysed using
descriptive statistics (frequency counts, simple percentages and
means).
Research Questions
1.Can widows` joblessness be eradicated through EDTP in Ondo
State, Nigeria?
2.Will EDTP enhance widows` financial status?
Presentation of Results and Discussion of Findings
Research Question One: Can widows’ joblessness eradicated
through EDTP in Ondo State, Nigeria?
Table I: Showing frequency counts simple percentages and
means on can widows joblessness be eradicated through EDTP in
Ondo State, Nigeria.
S/
N
ITEMS SD D A SA Me
an
Rem
arks
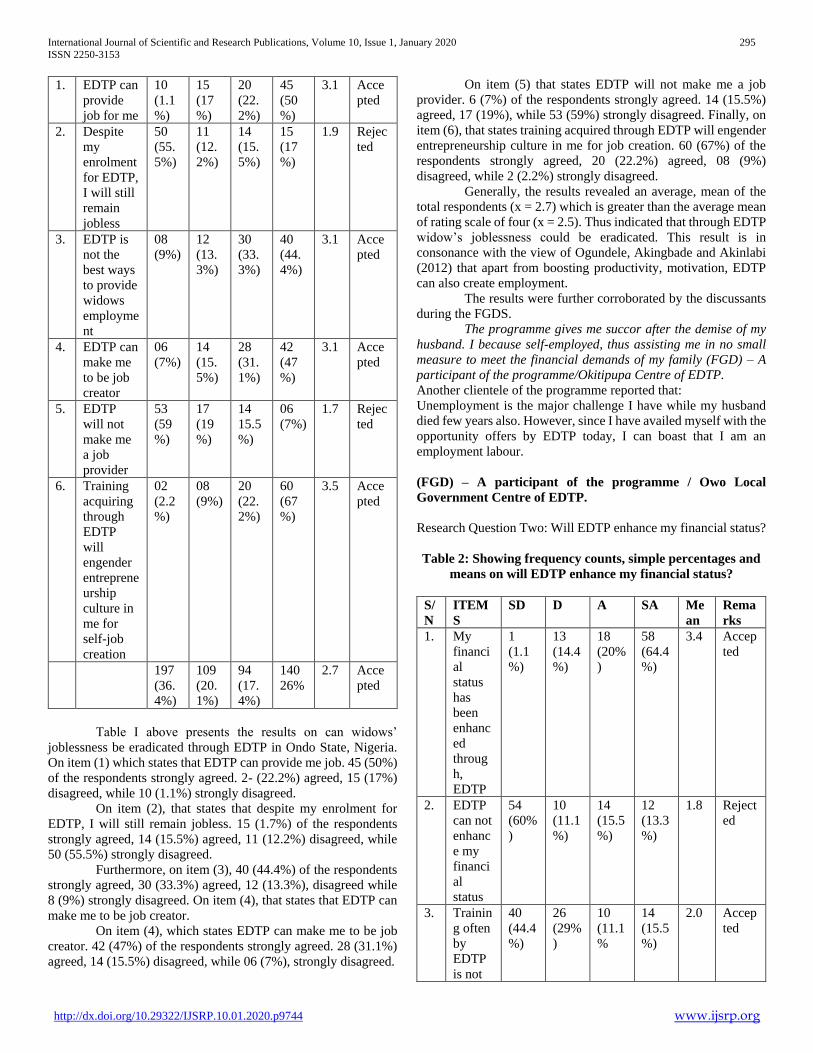
International Journal of Scientific and Research Publications, Volume 10, Issue 1, January 2020 295
ISSN 2250-3153
http://dx.doi.org/10.29322/IJSRP.10.01.2020.p9744 www.ijsrp.org
1. EDTP can
provide
job for me
10
(1.1
%)
15
(17
%)
20
(22.
2%)
45
(50
%)
3.1 Acce
pted
2. Despite
my
enrolment
for EDTP,
I will still
remain
jobless
50
(55.
5%)
11
(12.
2%)
14
(15.
5%)
15
(17
%)
1.9 Rejec
ted
3. EDTP is
not the
best ways
to provide
widows
employme
nt
08
(9%)
12
(13.
3%)
30
(33.
3%)
40
(44.
4%)
3.1 Acce
pted
4. EDTP can
make me
to be job
creator
06
(7%)
14
(15.
5%)
28
(31.
1%)
42
(47
%)
3.1 Acce
pted
5. EDTP
will not
make me
a job
provider
53
(59
%)
17
(19
%)
14
15.5
%)
06
(7%)
1.7 Rejec
ted
6. Training
acquiring
through
EDTP
will
engender
entreprene
urship
culture in
me for
self-job
creation
02
(2.2
%)
08
(9%)
20
(22.
2%)
60
(67
%)
3.5 Acce
pted
197
(36.
4%)
109
(20.
1%)
94
(17.
4%)
140
26%
2.7 Acce
pted
Table I above presents the results on can widows’
joblessness be eradicated through EDTP in Ondo State, Nigeria.
On item (1) which states that EDTP can provide me job. 45 (50%)
of the respondents strongly agreed. 2- (22.2%) agreed, 15 (17%)
disagreed, while 10 (1.1%) strongly disagreed.
On item (2), that states that despite my enrolment for
EDTP, I will still remain jobless. 15 (1.7%) of the respondents
strongly agreed, 14 (15.5%) agreed, 11 (12.2%) disagreed, while
50 (55.5%) strongly disagreed.
Furthermore, on item (3), 40 (44.4%) of the respondents
strongly agreed, 30 (33.3%) agreed, 12 (13.3%), disagreed while
8 (9%) strongly disagreed. On item (4), that states that EDTP can
make me to be job creator.
On item (4), which states EDTP can make me to be job
creator. 42 (47%) of the respondents strongly agreed. 28 (31.1%)
agreed, 14 (15.5%) disagreed, while 06 (7%), strongly disagreed.
On item (5) that states EDTP will not make me a job
provider. 6 (7%) of the respondents strongly agreed. 14 (15.5%)
agreed, 17 (19%), while 53 (59%) strongly disagreed. Finally, on
item (6), that states training acquired through EDTP will engender
entrepreneurship culture in me for job creation. 60 (67%) of the
respondents strongly agreed, 20 (22.2%) agreed, 08 (9%)
disagreed, while 2 (2.2%) strongly disagreed.
Generally, the results revealed an average, mean of the
total respondents (x = 2.7) which is greater than the average mean
of rating scale of four (x = 2.5). Thus indicated that through EDTP
widow’s joblessness could be eradicated. This result is in
consonance with the view of Ogundele, Akingbade and Akinlabi
(2012) that apart from boosting productivity, motivation, EDTP
can also create employment.
The results were further corroborated by the discussants
during the FGDS.
The programme gives me succor after the demise of my
husband. I because self-employed, thus assisting me in no small
measure to meet the financial demands of my family (FGD) – A
participant of the programme/Okitipupa Centre of EDTP.
Another clientele of the programme reported that:
Unemployment is the major challenge I have while my husband
died few years also. However, since I have availed myself with the
opportunity offers by EDTP today, I can boast that I am an
employment labour.
(FGD) – A participant of the programme / Owo Local
Government Centre of EDTP.
Research Question Two: Will EDTP enhance my financial status?
Table 2: Showing frequency counts, simple percentages and
means on will EDTP enhance my financial status?
S/
N
ITEM
S
SD D A SA Me
an
Rema
rks
1. My
financi
al
status
has
been
enhanc
ed
throug
h,
EDTP
1
(1.1
%)
13
(14.4
%)
18
(20%
)
58
(64.4
%)
3.4 Accep
ted
2. EDTP
can not
enhanc
e my
financi
al
status
54
(60%
)
10
(11.1
%)
14
(15.5
%)
12
(13.3
%)
1.8 Reject
ed
3. Trainin
g often
by
EDTP
is not
40
(44.4
%)
26
(29%
)
10
(11.1
%
14
(15.5
%)
2.0 Accep
ted
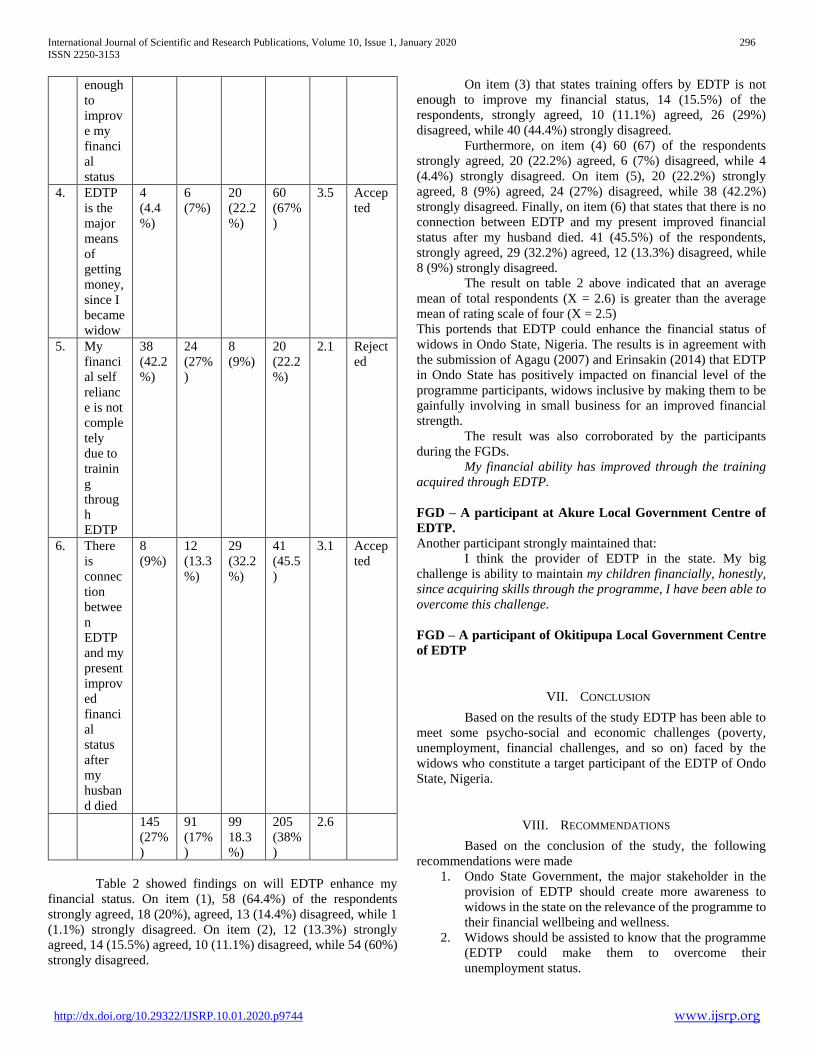
International Journal of Scientific and Research Publications, Volume 10, Issue 1, January 2020 296
ISSN 2250-3153
http://dx.doi.org/10.29322/IJSRP.10.01.2020.p9744 www.ijsrp.org
enough
to
improv
e my
financi
al
status
4. EDTP
is the
major
means
of
getting
money,
since I
became
widow
4
(4.4
%)
6
(7%)
20
(22.2
%)
60
(67%
)
3.5 Accep
ted
5. My
financi
al self
relianc
e is not
comple
tely
due to
trainin
g
throug
h
EDTP
38
(42.2
%)
24
(27%
)
8
(9%)
20
(22.2
%)
2.1 Reject
ed
6. There
is
connec
tion
betwee
n
EDTP
and my
present
improv
ed
financi
al
status
after
my
husban
d died
8
(9%)
12
(13.3
%)
29
(32.2
%)
41
(45.5
)
3.1 Accep
ted
145
(27%
)
91
(17%
)
99
18.3
%)
205
(38%
)
2.6
Table 2 showed findings on will EDTP enhance my
financial status. On item (1), 58 (64.4%) of the respondents
strongly agreed, 18 (20%), agreed, 13 (14.4%) disagreed, while 1
(1.1%) strongly disagreed. On item (2), 12 (13.3%) strongly
agreed, 14 (15.5%) agreed, 10 (11.1%) disagreed, while 54 (60%)
strongly disagreed.
On item (3) that states training offers by EDTP is not
enough to improve my financial status, 14 (15.5%) of the
respondents, strongly agreed, 10 (11.1%) agreed, 26 (29%)
disagreed, while 40 (44.4%) strongly disagreed.
Furthermore, on item (4) 60 (67) of the respondents
strongly agreed, 20 (22.2%) agreed, 6 (7%) disagreed, while 4
(4.4%) strongly disagreed. On item (5), 20 (22.2%) strongly
agreed, 8 (9%) agreed, 24 (27%) disagreed, while 38 (42.2%)
strongly disagreed. Finally, on item (6) that states that there is no
connection between EDTP and my present improved financial
status after my husband died. 41 (45.5%) of the respondents,
strongly agreed, 29 (32.2%) agreed, 12 (13.3%) disagreed, while
8 (9%) strongly disagreed.
The result on table 2 above indicated that an average
mean of total respondents (X = 2.6) is greater than the average
mean of rating scale of four (X = 2.5)
This portends that EDTP could enhance the financial status of
widows in Ondo State, Nigeria. The results is in agreement with
the submission of Agagu (2007) and Erinsakin (2014) that EDTP
in Ondo State has positively impacted on financial level of the
programme participants, widows inclusive by making them to be
gainfully involving in small business for an improved financial
strength.
The result was also corroborated by the participants
during the FGDs.
My financial ability has improved through the training
acquired through EDTP.
FGD – A participant at Akure Local Government Centre of
EDTP.
Another participant strongly maintained that:
I think the provider of EDTP in the state. My big
challenge is ability to maintain my children financially, honestly,
since acquiring skills through the programme, I have been able to
overcome this challenge.
FGD – A participant of Okitipupa Local Government Centre
of EDTP
VII. CONCLUSION
Based on the results of the study EDTP has been able to
meet some psycho-social and economic challenges (poverty,
unemployment, financial challenges, and so on) faced by the
widows who constitute a target participant of the EDTP of Ondo
State, Nigeria.
VIII. RECOMMENDATIONS
Based on the conclusion of the study, the following
recommendations were made
1. Ondo State Government, the major stakeholder in the
provision of EDTP should create more awareness to
widows in the state on the relevance of the programme to
their financial wellbeing and wellness.
2. Widows should be assisted to know that the programme
(EDTP could make them to overcome their
unemployment status.

International Journal of Scientific and Research Publications, Volume 10, Issue 1, January 2020 297
ISSN 2250-3153
http://dx.doi.org/10.29322/IJSRP.10.01.2020.p9744 www.ijsrp.org
3. Ondo State Government should embark on aggressive
more to ensure that more widows among other targets
groups for the programme enroll for it.
4. Widows should be encouraged also to put in practice
skills acquired through EDTP for their improve standard
of living and so on.
REFERENCES
[1] Agagu, O.K. (2007). A speech presented at graduation ceremony and presentation of certificates of proficiency and distribution of cheque to graduands of skills acquisition programme in Ondo State on the 26th February, 2007.
[2] Akponi, M.E. (2009). Entrepreneurship education for all students in higher education institutions in Nigeria: A means to sustainable development. Journal of sustainable development in Africa 11 (1).
[3] Awogbade, A.C. and Iwuamachi, K. (2010). Youths’ employment: Entrepreneurship development programme as an intervention mechanism. Enugu: Institute for development studies, university of Nigeria, Enugu Campus, Enugu State, Nigeria.
[4] Becker, G.S. (1964, 1992 & 1996). Human capital. New York: Columbia, University Press.
[5] Erinsakin, M.O. (2014). Impact evaluation of skill acquisition and entrepreneurial development training programme in Ondo State, Nigeria.
[6] Ethiel, E.I. (2016). The innman treatment of widows in African Communities. Journal of social sciences, 4 (1).
[7] Garret, N. (2012). How to encourage entrepreneurship development in developing countries.
[8] Mathia, B. (2015). Widowhood practice in Eastern Nigeria. A comparative study of Imo and Anambra State. Journal of sociology practice, 5(3).
[9] Olorunmolu, J.O. & Agbede, E.A (2012). Quality entrepreneurial education: A panacea to job creation in Nigeria. Journal of resourcefulness and distinction, 1 (1).
[10] Ondo State Government (2006). Modules for entrepreneurship development training programme, Akure.
[11] Onyenuche, A.N.T (1999). Widowhood and wife inheritance practices in Edo and Delta State of Nigeria. Report for IAC – Nigeria on widowhood/wife inheritance practices in Nigeria.
[12] Ugwueueze (1997). Cultural practices against women in Eastern Nigeria. Winners Int. Enterprises, Port Harcourt.
[13] UNESCO (2012). Economic growth in Africa Pans. UNESCO.
AUTHORS
First Author – Erinsakin, Martins Ojo (Ph.D), Department of
Continuing Education/Adult and Non-Formal Education,
Adeyemi College of Education, Ondo, Ondo State, Nigeria.,
Second Author – Agun, Paulinah Olusola , Department of
Continuing Education/Adult and Non-Formal Education,
Adeyemi College of Education, Ondo, Ondo State, Nigeria.
Third Author – Mr. Akinbebije John, Department of Continuing
Education/Adult and Non-Formal Education, Adeyemi College
of Education, Ondo, Ondo State, Nigeria.
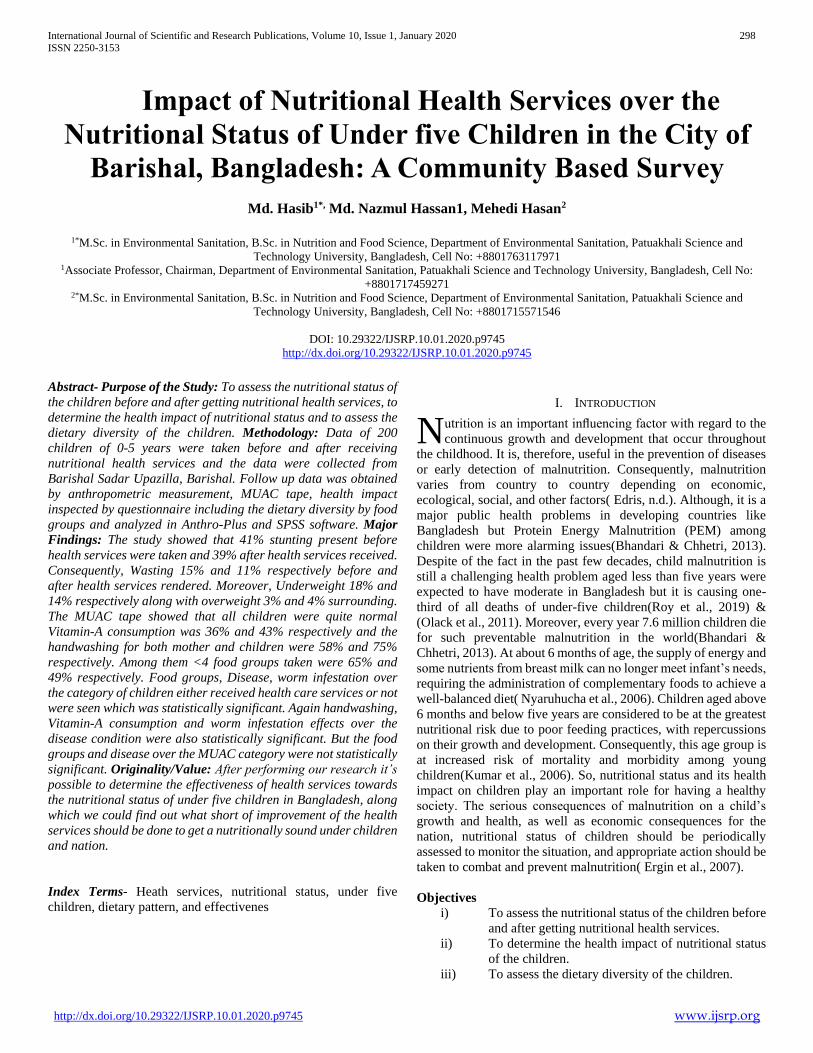
International Journal of Scientific and Research Publications, Volume 10, Issue 1, January 2020 298
ISSN 2250-3153
http://dx.doi.org/10.29322/IJSRP.10.01.2020.p9745 www.ijsrp.org
Impact of Nutritional Health Services over the
Nutritional Status of Under five Children in the City of
Barishal, Bangladesh: A Community Based Survey
Md. Hasib1*, Md. Nazmul Hassan1, Mehedi Hasan2
1*M.Sc. in Environmental Sanitation, B.Sc. in Nutrition and Food Science, Department of Environmental Sanitation, Patuakhali Science and
Technology University, Bangladesh, Cell No: +8801763117971 1Associate Professor, Chairman, Department of Environmental Sanitation, Patuakhali Science and Technology University, Bangladesh, Cell No:
+8801717459271 2*M.Sc. in Environmental Sanitation, B.Sc. in Nutrition and Food Science, Department of Environmental Sanitation, Patuakhali Science and
Technology University, Bangladesh, Cell No: +8801715571546
DOI: 10.29322/IJSRP.10.01.2020.p9745
http://dx.doi.org/10.29322/IJSRP.10.01.2020.p9745
Abstract- Purpose of the Study: To assess the nutritional status of
the children before and after getting nutritional health services, to
determine the health impact of nutritional status and to assess the
dietary diversity of the children. Methodology: Data of 200
children of 0-5 years were taken before and after receiving
nutritional health services and the data were collected from
Barishal Sadar Upazilla, Barishal. Follow up data was obtained
by anthropometric measurement, MUAC tape, health impact
inspected by questionnaire including the dietary diversity by food
groups and analyzed in Anthro-Plus and SPSS software. Major
Findings: The study showed that 41% stunting present before
health services were taken and 39% after health services received.
Consequently, Wasting 15% and 11% respectively before and
after health services rendered. Moreover, Underweight 18% and
14% respectively along with overweight 3% and 4% surrounding.
The MUAC tape showed that all children were quite normal
Vitamin-A consumption was 36% and 43% respectively and the
handwashing for both mother and children were 58% and 75%
respectively. Among them <4 food groups taken were 65% and
49% respectively. Food groups, Disease, worm infestation over
the category of children either received health care services or not
were seen which was statistically significant. Again handwashing,
Vitamin-A consumption and worm infestation effects over the
disease condition were also statistically significant. But the food
groups and disease over the MUAC category were not statistically
significant. Originality/Value: After performing our research it’s
possible to determine the effectiveness of health services towards
the nutritional status of under five children in Bangladesh, along
which we could find out what short of improvement of the health
services should be done to get a nutritionally sound under children
and nation.
Index Terms- Heath services, nutritional status, under five
children, dietary pattern, and effectivenes
I. INTRODUCTION
utrition is an important influencing factor with regard to the
continuous growth and development that occur throughout
the childhood. It is, therefore, useful in the prevention of diseases
or early detection of malnutrition. Consequently, malnutrition
varies from country to country depending on economic,
ecological, social, and other factors( Edris, n.d.). Although, it is a
major public health problems in developing countries like
Bangladesh but Protein Energy Malnutrition (PEM) among
children were more alarming issues(Bhandari & Chhetri, 2013).
Despite of the fact in the past few decades, child malnutrition is
still a challenging health problem aged less than five years were
expected to have moderate in Bangladesh but it is causing one-
third of all deaths of under-five children(Roy et al., 2019) &
(Olack et al., 2011). Moreover, every year 7.6 million children die
for such preventable malnutrition in the world(Bhandari &
Chhetri, 2013). At about 6 months of age, the supply of energy and
some nutrients from breast milk can no longer meet infant’s needs,
requiring the administration of complementary foods to achieve a
well-balanced diet( Nyaruhucha et al., 2006). Children aged above
6 months and below five years are considered to be at the greatest
nutritional risk due to poor feeding practices, with repercussions
on their growth and development. Consequently, this age group is
at increased risk of mortality and morbidity among young
children(Kumar et al., 2006). So, nutritional status and its health
impact on children play an important role for having a healthy
society. The serious consequences of malnutrition on a child’s
growth and health, as well as economic consequences for the
nation, nutritional status of children should be periodically
assessed to monitor the situation, and appropriate action should be
taken to combat and prevent malnutrition( Ergin et al., 2007).
Objectives
i) To assess the nutritional status of the children before
and after getting nutritional health services.
ii) To determine the health impact of nutritional status
of the children.
iii) To assess the dietary diversity of the children.
N
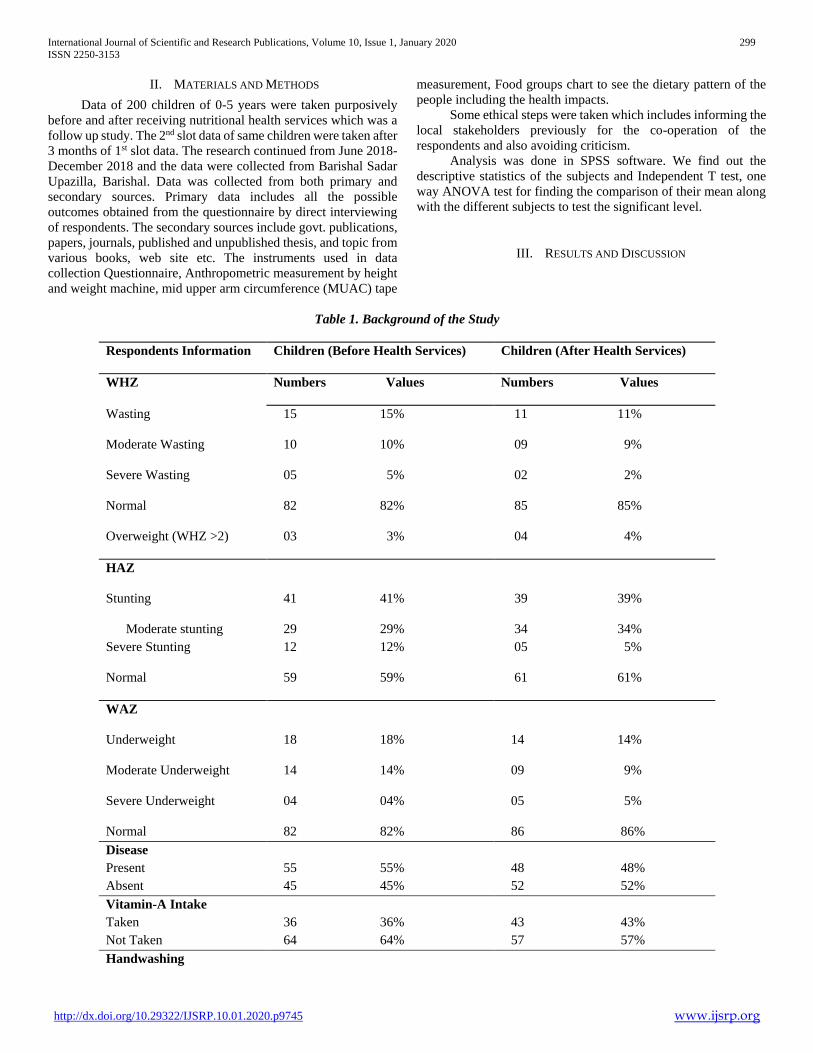
International Journal of Scientific and Research Publications, Volume 10, Issue 1, January 2020 299
ISSN 2250-3153
http://dx.doi.org/10.29322/IJSRP.10.01.2020.p9745 www.ijsrp.org
II. MATERIALS AND METHODS
Data of 200 children of 0-5 years were taken purposively
before and after receiving nutritional health services which was a
follow up study. The 2nd slot data of same children were taken after
3 months of 1st slot data. The research continued from June 2018-
December 2018 and the data were collected from Barishal Sadar
Upazilla, Barishal. Data was collected from both primary and
secondary sources. Primary data includes all the possible
outcomes obtained from the questionnaire by direct interviewing
of respondents. The secondary sources include govt. publications,
papers, journals, published and unpublished thesis, and topic from
various books, web site etc. The instruments used in data
collection Questionnaire, Anthropometric measurement by height
and weight machine, mid upper arm circumference (MUAC) tape
measurement, Food groups chart to see the dietary pattern of the
people including the health impacts.
Some ethical steps were taken which includes informing the
local stakeholders previously for the co-operation of the
respondents and also avoiding criticism.
Analysis was done in SPSS software. We find out the
descriptive statistics of the subjects and Independent T test, one
way ANOVA test for finding the comparison of their mean along
with the different subjects to test the significant level.
III. RESULTS AND DISCUSSION
Table 1. Background of the Study
Respondents Information Children (Before Health Services)
Children (After Health Services)
WHZ
Numbers Values Numbers Values
Wasting
15 15% 11 11%
Moderate Wasting
10 10% 09 9%
Severe Wasting
05 5% 02 2%
Normal
82 82% 85 85%
Overweight (WHZ >2)
03 3% 04 4%
HAZ
Stunting
41 41% 39 39%
Moderate stunting 29 29% 34 34%
Severe Stunting
12 12% 05 5%
Normal
59 59% 61 61%
WAZ
Underweight
18 18% 14 14%
Moderate Underweight
14 14% 09 9%
Severe Underweight
04 04% 05 5%
Normal 82 82% 86 86%
Disease
Present 55 55% 48 48%
Absent 45 45% 52 52%
Vitamin-A Intake
Taken 36 36% 43 43%
Not Taken 64 64% 57 57%
Handwashing
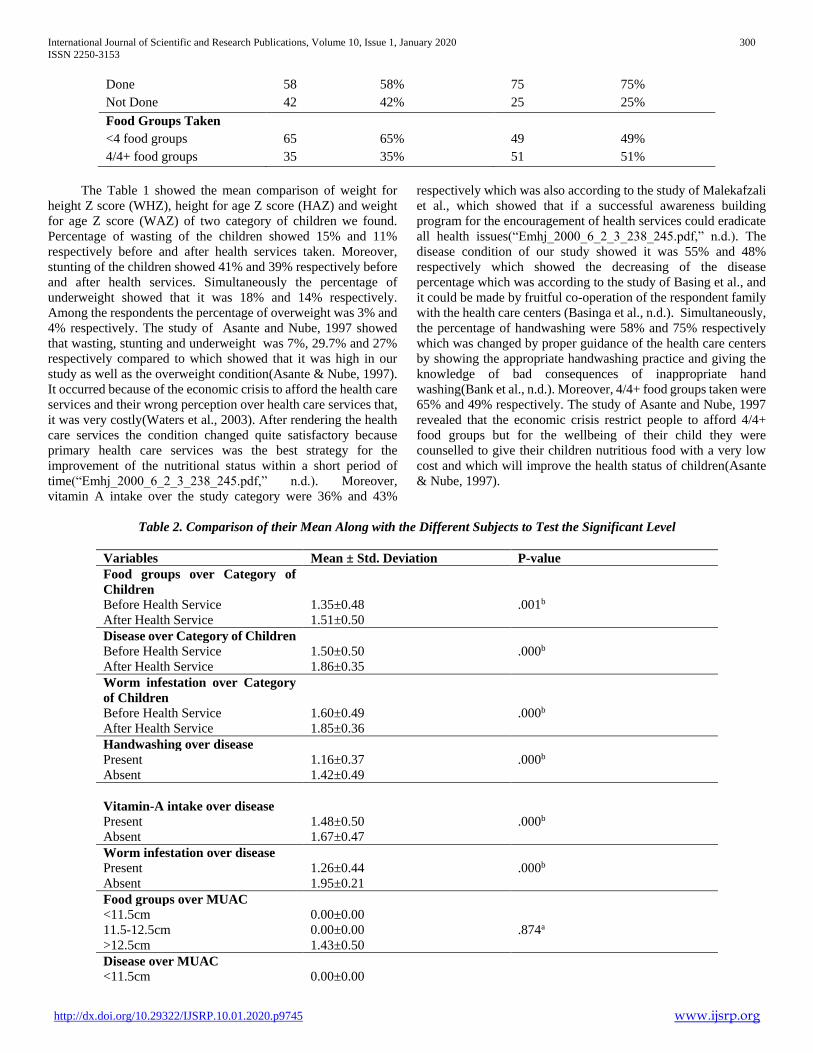
International Journal of Scientific and Research Publications, Volume 10, Issue 1, January 2020 300
ISSN 2250-3153
http://dx.doi.org/10.29322/IJSRP.10.01.2020.p9745 www.ijsrp.org
Done 58 58% 75 75%
Not Done 42 42% 25 25%
Food Groups Taken
<4 food groups 65 65% 49 49%
4/4+ food groups 35 35% 51 51%
The Table 1 showed the mean comparison of weight for
height Z score (WHZ), height for age Z score (HAZ) and weight
for age Z score (WAZ) of two category of children we found.
Percentage of wasting of the children showed 15% and 11%
respectively before and after health services taken. Moreover,
stunting of the children showed 41% and 39% respectively before
and after health services. Simultaneously the percentage of
underweight showed that it was 18% and 14% respectively.
Among the respondents the percentage of overweight was 3% and
4% respectively. The study of Asante and Nube, 1997 showed
that wasting, stunting and underweight was 7%, 29.7% and 27%
respectively compared to which showed that it was high in our
study as well as the overweight condition(Asante & Nube, 1997).
It occurred because of the economic crisis to afford the health care
services and their wrong perception over health care services that,
it was very costly(Waters et al., 2003). After rendering the health
care services the condition changed quite satisfactory because
primary health care services was the best strategy for the
improvement of the nutritional status within a short period of
time(“Emhj_2000_6_2_3_238_245.pdf,” n.d.). Moreover,
vitamin A intake over the study category were 36% and 43%
respectively which was also according to the study of Malekafzali
et al., which showed that if a successful awareness building
program for the encouragement of health services could eradicate
all health issues(“Emhj_2000_6_2_3_238_245.pdf,” n.d.). The
disease condition of our study showed it was 55% and 48%
respectively which showed the decreasing of the disease
percentage which was according to the study of Basing et al., and
it could be made by fruitful co-operation of the respondent family
with the health care centers (Basinga et al., n.d.). Simultaneously,
the percentage of handwashing were 58% and 75% respectively
which was changed by proper guidance of the health care centers
by showing the appropriate handwashing practice and giving the
knowledge of bad consequences of inappropriate hand
washing(Bank et al., n.d.). Moreover, 4/4+ food groups taken were
65% and 49% respectively. The study of Asante and Nube, 1997
revealed that the economic crisis restrict people to afford 4/4+
food groups but for the wellbeing of their child they were
counselled to give their children nutritious food with a very low
cost and which will improve the health status of children(Asante
& Nube, 1997).
Table 2. Comparison of their Mean Along with the Different Subjects to Test the Significant Level
Variables Mean ± Std. Deviation P-value
Food groups over Category of
Children
Before Health Service 1.35±0.48 .001b
After Health Service 1.51±0.50
Disease over Category of Children
Before Health Service 1.50±0.50 .000b
After Health Service 1.86±0.35
Worm infestation over Category
of Children
Before Health Service 1.60±0.49 .000b
After Health Service 1.85±0.36
Handwashing over disease
Present 1.16±0.37 .000b
Absent 1.42±0.49
Vitamin-A intake over disease
Present 1.48±0.50 .000b
Absent 1.67±0.47
Worm infestation over disease
Present 1.26±0.44 .000b
Absent 1.95±0.21
Food groups over MUAC
<11.5cm 0.00±0.00
11.5-12.5cm 0.00±0.00 .874a
>12.5cm 1.43±0.50
Disease over MUAC
<11.5cm 0.00±0.00

International Journal of Scientific and Research Publications, Volume 10, Issue 1, January 2020 301
ISSN 2250-3153
http://dx.doi.org/10.29322/IJSRP.10.01.2020.p9745 www.ijsrp.org
11.5-12.5cm 0.00±0.00 .192a
>12.5cm 1.68±0.47
Handwashing over Category of
Children
Before Health Service 1.16±0.42 .000b
After Health Service 1.42±0.50
Note: aP value for One way ANOVA Test
bP value for Independent T Test
The Table 2 showed the food groups, disease and worm
infestation, handwashing over the two category of children were
seen and the P value obtained P<.05 which showed that there were
significantly differences in the study area as expected but the study
of Basing et al., showed it was not statistically significant because
in our study the respondents were not aware of the health of
children but the study of Basing et al., the respondent were fully
aware because for more than 6 month intervention were carried
out there (Basinga et al., n.d.). In addition, food groups showed
significantly different in the category of children because after the
health services taken by the family they were fully aware of the
fact about their children health and they were well known about
the low cost nutritious foods which wouldn’t be costly(Asante &
Nube, 1997). Moreover, handwashing, vitamin A intake and worm
infestation over disease condition was seen and we obtained P
value that was P<.05 and it showed a significant differences in
disease condition. The study of Bank et al., revealed that an
inappropriate handwashing and lack of fresh water causes diseases
as well as if the worm infestation was not done then all the
nutrients in the body will be absorbed by the worms which will
make us malnourished and vulnerable to disease. Vitamin A intake
negligence would suffer the children with different kind of
diseases due to vitamin A deficiency like liver disorders, fat mal-
absorption, night blindness etc.(Bank et al., n.d.). On the contrary
food groups, disease over mid upper arm circumference (MUAC)
tape categories wasn’t P<.05 which were not significant but the
study of Bhandari & Chhetri, 2013 showed it was significant
because in our study exclusive breastfeeding and taking health
care was much more but in the study of Bhandari & Chhetri, 2013
it was unsatisfactory (Bhandari & Chhetri, 2013).
IV. CONCLUSION
The problems of low standard of living, hunger, starvation,
malnutrition, agricultural illiteracy, poor antenatal care, disease,
unsatisfactory sanitary and housing facilities etc. of the family has
to be developed totally by implementation of policy for the
improvement of nutritional status of 0-5 year’s old children to
have a positive health impact. Stunting in our study was much
more than our national stunting condition which was really
alarming. So, poor nutritional status should be halted or minimized
at an acceptable level overcome such condition.
REFERENCES
[1] Asante, F. A., & Nube, M. (1997). Understanding the health and nutritional status of children in Ghana, 17(233).
[2] Bank, U. W., Wardlaw, T., Newby, H., Brown, D., Cai, X., Onis, M. De, … Hiraga, M. (n.d.). Child Malnutrition.
[3] Basinga, P., Gertler, P. J., Binagwaho, A., Soucat, A. L. B., Sturdy, J., & Vermeersch, C. M. J. (n.d.). Eff ect on maternal and child health services in Rwanda of payment to primary health-care providers for performance : an impact evaluation. The Lancet, 377(9775), 1421–1428. https://doi.org/10.1016/S0140-6736(11)60177-3
[4] Bhandari, T. R., & Chhetri, M. (2013). Nutritional Status of Under Five Year Children and Factors Associated in Kapilvastu District , Nepal, 1–6.
[5] Edris, M. (n.d.). Assessment of nutritional status of preschool children of Gumbrit, North West Ethiopia.
[6] Emhj_2000_6_2_3_238_245.pdf. (n.d.).
[7] Ergin, F., Okyay, P., Atasoylu, G., & Beşer, E. (2007). Nutritional status and risk factors of chronic malnutrition in children under five years of age in Aydın , a western city of Turkey, 283–289.
[8] Kumar, D., Goel, N. K., Mittal, P. C., & Misra, P. (2006). Influence of Infant-feeding Practices on Nutritional Status of Under-five Children, 73, 417–422.
[9] Nyaruhucha, C. N. M., Msuya, J. M., Mamiro, P. S., & Kerengi, A. J. (2006). Nutritional status and feeding practices of under-five children in Simanjiro District , Tanzania, 8(3), 162–167.
[10] Olack, B., Burke, H., Cosmas, L., Bamrah, S., Dooling, K., Feikin, D. R., … Breiman, R. F. (2011). Nutritional Status of Under-five Children Living in an Informal Urban Settlement in Nairobi , Kenya, 29(4), 357–363.
[11] Roy, A. S. K., Fuchs, G. J., Mahmud, Z., Ara, G., Islam, S., Akter, S. S., … Islam, S. (2019). Intensive Nutrition Education with or without Supplementary Feeding Improves the Nutritional Status of Moderately-malnourished Children in Bangladesh Linked references are available on JSTOR for this article : Intensive Nutrition Education with or without Supplementary Feeding Improves the Nutritional Status of Moderately-malnourished Children in, 23(4).
[12] Waters, H., Saadah, F., & Pradhan, M. (2003). The impact of the 1997 – 98 East Asian economic crisis on health and health care in Indonesia, 18(2), 172–181. https://doi.org/10.1093/heapol/czg022
AUTHORS
First Author – Md. Hasib, M.Sc. in Environmental Sanitation,
B.Sc. in Nutrition and Food Science, Department of
Environmental Sanitation, Patuakhali Science and Technology
University, Bangladesh, Cell No: +8801763117971
Second Author – Md. Nazmul Hassan, Associate Professor,
Chairman, Department of Environmental Sanitation, Patuakhali
Science and Technology University, Bangladesh, Cell No:
+8801717459271
Third Author – Mehedi Hasan, M.Sc. in Environmental
Sanitation, B.Sc. in Nutrition and Food Science, Department of
Environmental Sanitation, Patuakhali Science and Technology
University, Bangladesh, Cell No: +8801715571546

International Journal of Scientific and Research Publications, Volume 7, Issue 8, August 2017 302
ISSN 2250-3153
www.ijsrp.org

International Journal of Scientific and Research Publications, Volume 10, Issue 1, January 2020 303
ISSN 2250-3153
http://dx.doi.org/10.29322/IJSRP.10.01.2020.p9746 www.ijsrp.org
“Learning Steps” An Innovative Teaching Technique
Implementing STEM-AI Protocols Preetam Kumar Panda*, Prateek Kumar Singh**, Capt. Shweta Singh***
* Department of Science & Technology ** Delhi World Public School, Raigarh
DOI: 10.29322/IJSRP.10.01.2020.p9746
http://dx.doi.org/10.29322/IJSRP.10.01.2020.p9746
Abstract- Learning is maximized when children are engaged in
the process of learning. If ‘fun factor’ is added to it, it becomes
all the more interesting. Basically, teaching must include two
major components viz. sending and receiving information.
Overall, a teacher tries his/her best to transmit knowledge in the
way he/she understands it. Hence, any method of
communication that serves this purpose, keeping the objective
intact, can be considered as innovative method of teaching, and
our project is based on this concept only. In the process of
continually enriching the quality of education we endeavor to
impart, we have set the objective of our project i.e to make
Learning highly efficacious. Our project was conceived for the
school to develop creative thinking and innovation in the next
generation. And what better way to do this then “Lead by
example”. On successful implementation of this project, it has
been found that the pupils in our school show a great deal of
interest and enthusiasm in conceptual learning.
Index Terms- Learning Steps, Education, Audeno, Learning is Fun.
I. INTRODUCTION
With the gradual ushering in of the digital era in every walk of our life,
it becomes a moral responsibility of the schools to implicate digital
and online tools into the learning process. This article guides a
stepwise walkthrough of our new innovative learning methodology
which enables the concept of Learning is Fun. Project “Learning
Steps” is a very helpful tool for children to easily understand and
memorize difficult topics in sports and fun. Through learning steps,
many other essential concepts/fundamentals can be taught to young
children easily and recreationally. Further, it becomes a medium of
skill development in children where we can make education more
viable and enjoyable as well. This project incorporates the basic
concepts of Artificial Intelligence and STEM (“science technology
Engineering and Mathematics”). The learning steps tool is made up of
ultrasonic sensors, Audino microprocessor and other electronic and
electrical parts, which in itself is a complete learning tool. The
learning steps have 12 Ultrasonic Sensors for 12 stair-steps. That have
been connected to the microcontroller, and when the children go to the
steps, the rays emanating from the feet reach back to the ECHO sensor
which carries a current of 5 volts to the microcontroller and the basis
of corresponding C++ program installed in the microcontroller enables
DF Player to play particular sensor’s music file. Thus, the tune plays
and the children learn to the tune of music.
II. RESEARCH & IDEA
The role of technology in education:- Learning with technology has become essential in today’s
schools. Worldwide, governments, education systems,
researchers, school leaders, teachers and parents consider
technology to be a critical part of a child’s education. In
Australia, it is acknowledged that advances in technology
have an influence on the way people create, share, use and
develop information in society, and that young people need to
be highly skilled in their use of information and
communications technologies (ICT). This educational
aspiration is a cornerstone of the Melbourne Declaration on
Goals for Young Australians (MCEETYA, 2008) and ICT
competence is realized as one of the general capabilities in the
Australian Curriculum (ACARA, 2011). Developing
students’ knowledge and skills related to ICT in the school
years provides an important grounding for later stages in life.
It also provides equity of opportunity, regardless of
background. General social commentary and the popular
press tend to generalize about young people, their access to
and use of technology. Recent literature have challenged
these assumptions and acknowledge that, although students
today may have been born into a technologically rich world,
they may not be avid and skillful users of technology
(Bennett, Maton & Kervin, 2008). Meaningful development
of technology based knowledge and skills is important for all
students, in order to avoid a phenomenon known as the
‘second-level digital divide’, whereby people have drastically
differentiated skills, which in turn influence how people
participate in society (OECD, 2010).
Learning with technological tools:- The contemporary curriculum guides teachers to facilitate the
development of adaptable and flexible learners who know
how to take on new tasks and situations, quickly and easily.
Students will need to be good communicators who can
competently discuss topics with others and effectively share
their ideas in many forms and for different purposes. Students
will need to possess excellent collaboration skills and be able

International Journal of Scientific and Research Publications, Volume 10, Issue 1, January 2020 304
ISSN 2250-3153
http://dx.doi.org/10.29322/IJSRP.10.01.2020.p9746 www.ijsrp.org
to work together with many different types of people, each of
whom has her or his own special disciplines and unique ways
of learning and working together. Furthermore, students will
need the ability to create in a variety of manners and bring
their visions and ideas alive through different types of media.
In this section, we discuss the ways in which students can
learn to understand, communicate, collaborate and create
using different modes of technology, and how teachers can
use technology to assist their students in transforming
knowledge and skills into products, solutions and new
information.
III. STUDIES AND FINDINGS
When we make any innovative learning tool it should justify
following principals:-
Learners have to be at the center of what we are
making with activities focused on their cognition and growth.
They have to actively engage in learning in order to become
self-regulated learners who are able to control their emotions
and motivations during the study process, set goals, and
monitor their own learning process.
Learning is a social practice and can’t happen alone. “By
our nature we are social beings and we learn by interacting,”
Groff said. “We learn by pushing and pulling on concepts
with one another.” Structured, collaborative group work can
be good for all learners; it pushes people in different ways.
Emotions are an integral part of learning. Students
understand ideas better when there’s interplay between
emotions, motivation and cognition, so positive beliefs about
oneself are a core part of reaching a more profound
understanding. The power of emotions and motivation in the
classroom are well documented, but often overlooked because
they are “soft.” Still most teachers know that if a student is
upset about something that happened at home or in school, he
won’t learn well. Similarly, keeping students motivated
should be the starting point of learning. If students understand
why it matters, learning becomes more important to them.
Learners are different and innovative learning environments
reflect the various experiences and prior knowledge that each
student brings to class. “You really want practices and
processes that help teachers engage each student where they
are,” said Groff. This principle is understood by every
frustrated educator teaching to a “middle” that doesn’t exist.
Students need to be stretched, but not too much. “It’s really
critical to find that student’s sweet spot,” Groff Said.
Educators should try to prevent both coasting and
overloading. Students need to experience both academic
success and the challenge of discovery. In a diverse
classroom group work can help achieve this as students at
different levels help one another.
Assessment should be for learning, not of learning.
Assessments are important, but only to gauge how to
structure the next lesson for maximum effectiveness. It
should be meaningful, substantial, and shape the learning
environment itself. “Good teachers do this informally most of
the time,” Groff said. “But when it’s done well and more
formally it’s a whole structure and methodology where you
collect feedback on the learning pathway and it drives the
next step that you take.”
Learning needs to be connected across disciplines and reach
out into the real world. Learning can’t be meaningful if
students don’t understand why the knowledge will be useful
to them, how it can be applied in life. Understanding the
connections between subjects and ideas is essential for the
ability to transfer skills.
IV. METHODOLOGY
Arduino mega 2560:- Arduino is an open source
programmable circuit board that can be integrated into a wide
variety of projects both simple and complex. This board contains a
microcontroller which is able to be programmed to sense and
control objects in the physical world. By responding to sensors
and inputs, the Arduino is able to interact with a large array of
outputs such as LEDs, motors and displays. Because of its
flexibility and low cost, Arduino has become a very popular
choice for makers and makerspaces looking to create interactive
hardware projects.
DF player mini:-The DFPlayer Mini is a small and low cost
MP3 module with an simplified output directly to the speaker. The
module can be used as a stand alone module with attached battery,
speaker and push buttons or used in combination with an Arduino
UNO or any other with RX/TX capabilities. The DFPlayer
perfectly integrates hard decoding module, which supports
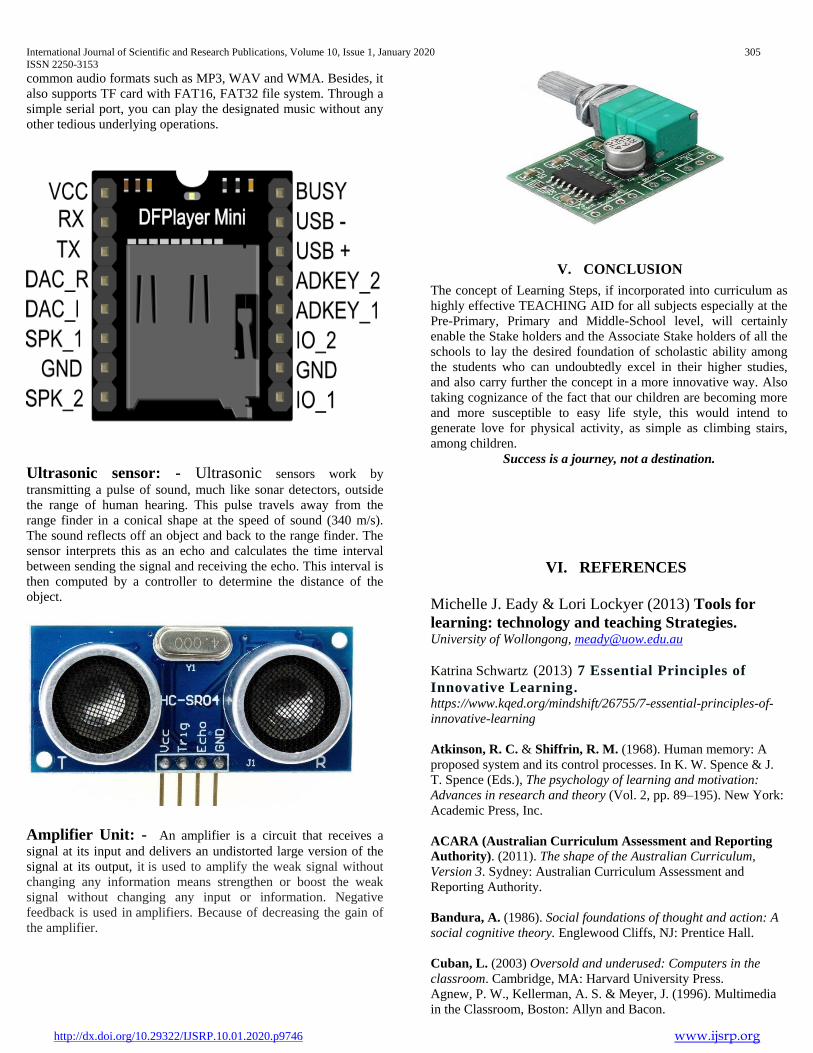
International Journal of Scientific and Research Publications, Volume 10, Issue 1, January 2020 305
ISSN 2250-3153
http://dx.doi.org/10.29322/IJSRP.10.01.2020.p9746 www.ijsrp.org
common audio formats such as MP3, WAV and WMA. Besides, it
also supports TF card with FAT16, FAT32 file system. Through a
simple serial port, you can play the designated music without any
other tedious underlying operations.
Ultrasonic sensor: - Ultrasonic sensors work by
transmitting a pulse of sound, much like sonar detectors, outside
the range of human hearing. This pulse travels away from the
range finder in a conical shape at the speed of sound (340 m/s).
The sound reflects off an object and back to the range finder. The
sensor interprets this as an echo and calculates the time interval
between sending the signal and receiving the echo. This interval is
then computed by a controller to determine the distance of the
object.
Amplifier Unit: - An amplifier is a circuit that receives a
signal at its input and delivers an undistorted large version of the
signal at its output, it is used to amplify the weak signal without
changing any information means strengthen or boost the weak
signal without changing any input or information. Negative
feedback is used in amplifiers. Because of decreasing the gain of
the amplifier.
V. CONCLUSION
The concept of Learning Steps, if incorporated into curriculum as
highly effective TEACHING AID for all subjects especially at the
Pre-Primary, Primary and Middle-School level, will certainly
enable the Stake holders and the Associate Stake holders of all the
schools to lay the desired foundation of scholastic ability among
the students who can undoubtedly excel in their higher studies,
and also carry further the concept in a more innovative way. Also
taking cognizance of the fact that our children are becoming more
and more susceptible to easy life style, this would intend to
generate love for physical activity, as simple as climbing stairs,
among children.
Success is a journey, not a destination.
VI. REFERENCES
Michelle J. Eady & Lori Lockyer (2013) Tools for
learning: technology and teaching Strategies. University of Wollongong, [email protected]
Katrina Schwartz (2013) 7 Essential Principles of
Innovative Learning. https://www.kqed.org/mindshift/26755/7-essential-principles-of-
innovative-learning
Atkinson, R. C. & Shiffrin, R. M. (1968). Human memory: A
proposed system and its control processes. In K. W. Spence & J.
T. Spence (Eds.), The psychology of learning and motivation:
Advances in research and theory (Vol. 2, pp. 89–195). New York:
Academic Press, Inc.
ACARA (Australian Curriculum Assessment and Reporting
Authority). (2011). The shape of the Australian Curriculum,
Version 3. Sydney: Australian Curriculum Assessment and
Reporting Authority.
Bandura, A. (1986). Social foundations of thought and action: A
social cognitive theory. Englewood Cliffs, NJ: Prentice Hall.
Cuban, L. (2003) Oversold and underused: Computers in the
classroom. Cambridge, MA: Harvard University Press.
Agnew, P. W., Kellerman, A. S. & Meyer, J. (1996). Multimedia
in the Classroom, Boston: Allyn and Bacon.

International Journal of Scientific and Research Publications, Volume 10, Issue 1, January 2020 306
ISSN 2250-3153
http://dx.doi.org/10.29322/IJSRP.10.01.2020.p9746 www.ijsrp.org
Boud, D. & Feletti, G. (1999). The Challenge of Problem-Based
Learning, (2nd Ed.), London: Kogan Page.
Hofstetter, F. T. (1995). Multimedia Literacy, New York:
McGraw-Hill.
Dunn, Philip (2001) Interpretation of Accounts. Uk, Student
Accountant January 2001
Preetam Kumar Panda received the M.Sc. (Chemistry)
defree from Guru Ghasidas University Bilaspur , B.Ed. from
Sarguja University, Ambikapur, CTET qualified and
Currently Working as TGT Science at Delhi world Public
School, Raigarh (C.G.)
Prateek kumar Singh received the M.Tech degree in
Comuter Science & Engineering from the LNCT, Jabalpur,
India, and Currently Working as TGT Computer Science at
Delhi world Public School, Raigarh (C.G.)
Capt. Shweta Singh received Masters Degree in History
and Bachelor degree in Education and guided the project as
Principal of Delhi world Public School, Raigarh (C.G.)
International Journal of Scientific and Research Publications, Volume 10, Issue 1, January 2020 307
ISSN 2250-3153
http://dx.doi.org/10.29322/IJSRP.10.01.2020.p9747 www.ijsrp.org
The Effect of Multisensory Methods of Early
Childhood’s Fine Motor Development
Kurnia Oktafianto*, Siti Masitoh**, Hendratno**
*Master Program of Primary Education, Post-graduate Program, Surabaya State University
**Promotor and Co-Promotorof Thesis, Post-graduate Program, Surabaya State University
Surabaya, Indonesia
DOI: 10.29322/IJSRP.10.01.2020.p9747
http://dx.doi.org/10.29322/IJSRP.10.01.2020.p9747
Abstract-This research aims to testing the effect of the
Multisensory methods on fine motor of early childhood’s. The
study used a quantitative approach with a quasi-experiment
design with a non-equivalent group design. Sampling was carried
out with a random sampling technique that selected 122 children
aged 5-6 years each divided into experimental groups and control
groups. Data analysis using non-parametric statistics with
Kruskal Wallis’s test. The results showed that a significant value
of 0.000 < sig 0.05 meant that there was an effect on the
multisensory methods of fine motor development in children
aged 5-6 years.
Keywords-multisensory methods, fine motor development,
childhood.
I. INTRODUCTION
Early childhood developments included six aspects of
religious and moral values, physical-motor, cognitive, language,
social-emotional, and artistic; It is listed in the Ministry of
National Education Regulation Number 137 year 2014 on
national standards for Early childhood education [1].
The developmental aspect that can be stimulated in early
childhood is the physical development of the motor. According
to Musfiroh, the physical development of the motor is an
important aspect of development in early childhood life [8].
Physical-motor is divided into 2 i.e. crude motor and fine motor.
According to Gallahue, in fine motor activities are more
dominant using limited movements in certain parts of the body
that require precision such as cutting, chopping, sewing, and
writing [9]. According to Sujiono, fine motor is a movement that
uses only parts of small muscles, such as using the hand fingers
and proper wrist movements [10]. Therefore, the movement in
fine motor does not require energy, but it requires careful
coordination of eyes and limbs.
In Permendikbud Number 137 year 2014 on National
Standard of Early childhood Education Stated the level of
development achievement of children aged 5-6 years on fine
motor ability is to mimic the form [1]. Activities that stimulate
the fine motor development at the time of kindergartens are
activities to mimic the form of letters using stationery. According
to Suyanto early writing activities include children try writing
techniques by mimicking curves and lines forming letters,
imitating writings or letters known, writing their own names,
writing a few short words [11]. According to Susanto, there are
five stages of writing at the kindergarten age, the stages of the
strike through, linear repetition stage, randomized writing stage,
writing stage name, and short sentence writing stage [12]. Thus,
the emergence of child's interest in writing begins with Scribble,
then the child attempts to write letters, and then mimics writing
his own name, and imitating words or writings. According to
Thaiss (in Dhieni, 2015) when in the delivery of information a
child is given the opportunity to be able to discuss, write it down,
then describe it, and then manipulate the information provided
will be understandable and well remembered [13]. Can be drawn
understanding that fine motor development at the age of
kindergartens is to mimic a typeface or write letters using
stationery.
The Multisensory method is a learning that has the basis of
the assumption that the subject matter presented involving
various modalities will help the child to be able to learn well and
optimally. The modalities involved include vision (visual),
hearing (auditory), kinesthetic, and feel (tactile), or often also
known as VAKT [14]. The Multisensory method was developed
by Fernald in 1943 whose activities use the various modalities of
sensory instruments namely visual, auditory, kinesthetic, and
tactile which is often also known as VAKT. This method uses
the selected reading material of the words spoken by the child,
and each word is taught in full. This method is believed when
applied to normal children, so the Multisensory method can help
to stimulate the development of the child's fine motor in
mimicking the typeface.
The implementation of multi-sensory method is as follows:

International Journal of Scientific and Research Publications, Volume 10, Issue 1, January 2020 308
ISSN 2250-3153
http://dx.doi.org/10.29322/IJSRP.10.01.2020.p9747 www.ijsrp.org
1. The teacher introduces the media board flannel. The board
contains letters made of flannel, then pasted onto the board.
The letters that are affixed contain the words that the child
often hear. (e.g. "baju"). Then the teacher read aloud and
clearly the word "baju", "Ba-ju", "B-A-J-U" then the child
imitating the spoken word teacher.
2. The teacher invites the child to follow the letter pattern
using the index finger. The teacher asks the child to see the
word and say its sound. The child will practice the sense of
the feel, and the movement because of the textured flannel
letters are made of flannel.
3. The teacher gave an example of writing letters with markers
on the board. The teacher mentions the letter name and
demonstrates, the teacher explains how to write it
4. The child is invited to make a letter using the index finger
with the help of sand media, then the child can analyze the
shape of the letter based on its memory.
5. The last activity is to write with the pencil to mimic the
letters that have been taught on a sheet of paper. The
teacher gave help to the child who is still unable to write,
giving the dots on the paper, so that the child follows the
pattern.
The results of the study conducted by Labat showed that the
results of a significant increase in the percentage of children who
use learning with visual approach, Visuo-haptic (touching letters
with fingers), and Visuo-graphomotor [15]. Later, Lisnawati's
research showed that the multisensory method gave rise to
positive atmospheres to appeal to children and encourage
parental involvement in literacy activities [16]. As well, the
research on Ade's shows the results that the multisensory method
enhances the ability of early literacy in kindergarten [17].
Based on the explanation above, it is necessary to study for
improvement of previous research related to fine motor
development for group B children in kindergarten using multi-
sensory method. While the principle in the Multisensory method
has several advantages in learning activities recognize literacy
and mimic the form of letters.
II. IDENTIFICATION, RESEARCH AND COLLECT IDEA
This research uses the quasi experiment with non-equivalent
control group design. There are 2 experimental groups and 2
control groups. The experimental group was given the learning
treatment of the multisensory method, while the control group
was given learning according to the teacher's method without
using the Multisensory method. Measurement of observations
conducted before and after learning using the rating scale
calculation 1-4. Scale Rating is a scale used to collect raw data in
the form of numbers that are then interpreted in a qualitative
sense [18]. The scale rating used refers to the following table 1:
Table1.Research Instrumen Assessment [19]
Score Description
1 Undeveloped
2 Start Growing
3 Evolving as Expected
4 Excellent Growth
The following observation grids are as follows:
Table 2.Fine Motor Capability Observation Grid
Child’s
Development
Assessment
Level
Indicator Instrument
Emulate the
shape
The ability
mimic letter
shape
1. Mimicking
letters with
index
fingers.
2. Emulate
letters with
stationery.
3. Can mimic
composing
a word with
stationery.
III. RESULT AND FINDINGS
Based on the test results normality with Kolmogorov-
Smirnov is smaller than the level of 0.05 significance. As such,
the data is declared non-distribution normal and cannot be
continued with parametric testing, in lieu of the use of the
Nonparametric test with Kruskal Wallis [19].
Tabel 3.Results of Fine Motor Capability with Kruskal Wallis’s
Test
Test Statisticsa,b
Post Test Fine Motor Capability
Chi-Square 27.879
df 1
Asymp. Sig. 0.000
a. Kruskal Wallis’s Test
b. Grouping Variable: Treatment
According to table 3, the results of Chi-Square were obtained
at 27.879 while the P-value value indicated by the asymp value.
International Journal of Scientific and Research Publications, Volume 10, Issue 1, January 2020 309
ISSN 2250-3153
http://dx.doi.org/10.29322/IJSRP.10.01.2020.p9747 www.ijsrp.org
A Significance of 0.000 is that it explains that the P-value is <
from the critical limit of 0.05, so H0 is rejected and H1 is
accepted. It can be concluded that there is influence of the
multisensory methods of fine motor ability of kindergarten
children aged 5-6 years.
This research is in accordance with Susanto's opinion [3],
there is a close relationship between the letters by impersonating
them, when the child shows his activity in impersonating a
pattern letter then recite it, then the ability in know it will
increase. It is also in line with the research conducted by the
British Audio-Visual Association (in the Age, 2011) suggests
that information obtained by one through Visual senses (visually)
as much as 75%, 13% through auditory, 6% through touch, , and
6% through the senses of smell and tongue [20]. So using
multisensory method can stimulate the function of the child's
senses to obtain information, so that language learning (literacy)
and fine motor (imitating the shape of the letters) will develop
well.
IV. CONCLUSIONS
Based on data analysis and discussion, it concluded that the
multisensory method affects the development of fine motor
children aged 5-6 years.
ACKNOLEDGEMENTS
The author thanked:
1. Prof. Dr. Siti Masitoh, M. Pd, as promotor of Thesis.
2. Dr. Hendratno, M. Hum.,as a as co-promotor of Thesis.
3. All friends at master program of primary education, post-
graduate, Surabaya State University.
REFERENCES
[1] Peraturan Menteri Pendidikan Nasional nomor 137 tahun
2014 tentang Standar Nasional Pendidikan Anak Usia
Dini.
[2] Suyanto, Slamet. (2005). Pembelajaran Untuk Anak TK.
Jakarta: Departemen Pendidikan Nasional.
[3] Susanto, A. (2011). Perkembangan Anak Usia Dini:
Pengantar Dalam Berbagai Aspeknya. Jakarta: Kencana
Prenada Media.
[4] Bjorklund, D. (2005). Children’s Thinking, Cognitive
Development and Individual deferences. Belmont:
Thomson Learning.
[5] Hasan, Maimunah. (2009). PAUD (Pendidikan Anak
Usia Dini). Yogyakarta: DIVA Press.
[6] Aulia. (2012). Revolusi Membuat Anak Candu
Membaca. Yogyakarta: Flash Books.
[7] Sintayani, Yulianti, (2011). Persiapan Membaca Bagi
Balita. Yogyakarta: Kriztea Publisher.
[8] Musfiroh, Tadkiroatun. (2009). Menumbuh Kembangkan
Baca Anak Usia Dini. Jakarta: Grasindo.
[9] Gallehue, David L. (1996). Development Physical
Education for Today’s Children. Chicago: Brown &
Benchmark.
[10] Sujiyono, Yuliani Nurani. (2009). Konsep Dasar
Pendidikan Anak Usia Dini. Jakarta: PT Indeks.
[11] Suyanto, S. (2005). Dasar – dasar Pendidikan Anak
Usia Dini. Yogyakarta: Hikayat.
[12] Susanto, A. (2011). Perkembangan Anak Usia Dini:
Pengantar Dalam Berbagai Aspeknya. Jakarta: Kencana
Prenada Media.
[13] Nurbiana, Dhieni dkk. (2015). Metode Pengembangan
Bahasa. Jakarta: Pusat Penerbitan Universitas Terbuka.
[14] Yusuf, M. (2003). Pendidikan Bagi Anak dengan
Problema Belajar. Solo: Tiga Serangkai Pustaka
Mandiri.
[15] Labat H, Ecalle Jean. (2014). “How can low-skilled 5-
year-old children benefit from multisensory trainingon
the acquisition of the alphabetic principle?”. Science
Direct, 106-113
[16] Ruhaena Lisnawati. (2017). Multisensory ModelFor
Home Early Literacy Stimulation: The
ImplementationProcess. Atlantis Press, AC-PCH2017.
[17] Sesianingsih Ade. (2007). PengaruhMultisensori Untuk
Meningkatkan Kemampuan Membaca PermulaanAnak
TK. Semarang: UniversitasDiponegoro.
[18] Sugiyono. 2012. MetodePenelitianPendidikan,
PendekatanKuantitatif, Kualitatifdan R&D. Alfabeta:
Bandung.
[19] Sugiyono. (2014). Metode Penelitian Pendidikan,
Pendekatan Kualitatif, Kuantitatif, dan R&D. Bandung:
Alfabeta.
[20] Zaman, Badru dkk. (2005). Media dan Sumber Belajar
TK. Jakarta: Universitas Terbuka.
AUTHORS
Kurnia Oktafianto-Master Program of Primary Education,
Post-graduate Program, Surabaya State University,
Siti Masitoh-Promotor of Thesis, Post-graduate Program,
Surabaya State University, [email protected]
Hendratno-co-Promotor of Thesis, Post-graduate Program,
Surabaya State University, [email protected]

International Journal of Scientific and Research Publications, Volume 10, Issue 1, January 2020 310
ISSN 2250-3153
http://dx.doi.org/10.29322/IJSRP.10.01.2020.p9748 www.ijsrp.org
Public Sector Collaboration Management In
Coremap Implementation In Kabupaten Buton,
Southeast Sulawesi
Asmiddin, Zainul Abidin and Abdul Madjid
Dayanu Ikhsanuddin University, State Administration Program
DOI: 10.29322/IJSRP.10.01.2020.p9748
http://dx.doi.org/10.29322/IJSRP.10.01.2020.p9748
Abstract- The management of public sector collaboration emerged
as an urgent approach adopted by the government at this time
because it relates to the demands of the community related to the
government's development performance which has not been able
to reach the optimal point. The purpose of this study was to
describe the implementation of collaborative management
between the Buton District Government, including the regions that
are now part of South Buton and other actors in coastal resource
management, especially in the Coral Reef Management Program.
This study uses a case study approach. The results show that the
implementation of public sector collaboration management in the
coremap program is a collaboration designed by the central
government which is then followed up by the Buton District
Government together with other parties from both formal and non-
formal institutions in implementing the program. The
implementation of public sector collaboration management that
took place in the framework of the implementation of the coremap
conducted from 2006 to 2012 in stages two and three from 2015
to now in the third stage both in terms of definitions,
characteristics and processes in general has fulfilled the elements
of public sector collaboration management.
Index Terms- Public Sector Collaboration Management, Coremap
Implementation
I. PRELIMINARY
ne model of collaboration in government efforts to improve
its development performance is call "The Collaborative
Management". Public sector collaboration management in a
governance perspective has several issues that are relevant in the
context of public sector management, including in coastal resource
management and fisheries. There are several conditions that
encourage the promotion of the collaboration principle. First,
awareness that development management that only relies on one
actor is a practice that is contrary to democratization of
development. Secondly, the logic is that by relying on resources
only from one party, on the one hand it is difficult to fulfill the
needs, on the other hand to waste resources on the other side.
Third, the demand that by promoting collaboration in development
management the realization of good governance. Therefore,
demands from the community so that the regional government
must be able to carry out innovations in the management of
government become a logical consequence, especially in the
context of collaborative management of coastal resource
management.
Departing from the background of the research that has been
described, that is how important the Buton District Government
carries out the management of public sector collaboration in
managing public issues, especially related to the management of
coastal resources. Collaboration management in the public sector
is principally seen as being able to overcome the scarcity of
resources owned by each collaborating party. Likewise, the effect
of collaborative management is seen as being able to have the
effect of strengthening the competencies of each party that
collaborates in order to overcome problems that are still difficult
to overcome independently. This study intends to focus on
describing the implementation of public sector collaboration
management in the implementation of the coral reef management
program in Buton District, including in the South Buton section
which has now become an autonomous region. Research on the
management of coastal resource collaboration with the
governance perspective in this study focuses more on the
implementation of the coremap program with the first reason,
since the establishment of South Buton Regency as a new
autonomous region does not have a collaboration program for
coastal resource management. There is only a program to
distribute fishing vessels for fishermen and other routine programs
carried out by the marine and fisheries services. This is quite
reasonable because of various limitations as new autonomous
regions both human resources and funds. On the other hand, there
is a program that was once very massive carried out in the district
of Buton as the parent region, the final stage of which is still
occurring even on a very small scale in South Buton district as a
new autonomous region. The program is called coremap.
Therefore the discussion of this research will occur with the locus
of Buton and South Buton District, which cannot be separated
from one another. Although the discussion of this research will
focus a lot on the shading or the southern part of Buton with the
focus there will also be more second phases, although as a whole
the first and third phases will also be discussed.
II. LITERATURE REVIEW
1. Public Sector Collaboration Management
O
International Journal of Scientific and Research Publications, Volume 10, Issue 1, January 2020 311
ISSN 2250-3153
http://dx.doi.org/10.29322/IJSRP.10.01.2020.p9748 www.ijsrp.org
Changing perspectives and orientations in running the
government from government to governance causes the attention
of experts and practitioners to be more focused on the form of
organizations that are capable of possessing capabilities and at the
same time being able to reach beyond their authority. As a result
of these changes, a government leader at all levels must also want
to change, especially in terms of management capabilities and the
desire to direct their attention to efforts to integrate and collaborate
with other organizations in completing their development
programs. This new perspective by O'Leary and Bingham (2009)
is called the collaboration management (The Collaborative
Management). Collaboration itself can be defined as the
involvement of various parties with different institutional origins
in an implementation of a development plan. The emphasis of
collaboration is the different origins of the parties involved. With
these different origins, an implementation of development will
involve resources.
The promotion of the principle of collaboration in
development management is accelerated by two epochs that define
current development, namely globalization and decentralization.
Globalization, although ideologically relying more on market
mechanisms and private actors to finalize capitalism, is also
pragmatically confronted with the urgency of finalizing state
facilitation. In addition, agents of capitalism are also very aware
of the threat of investment insecurity for capitalism if civil society
marginalized in the praxis of development, therefore globalization
also promotes the principle of collaboration in development
management. Decentralization, which has the consequence of
down-sizing development management, is also concerned with the
promotion of the principle of collaboration, because when the
development unit is more localized the resources of each party are
also increasingly limited, especially the state. Because of this, the
spirit of decentralization also finally trapped in the inevitability of
collaboration. Regional autonomy, management of local resources
to solve problems/local needs, are very much determined by
managerial abilities in collaborating between development actors
(Salman, 2004).
Associated with development management, the benefits of
collaboration are not only related to the technical benefits of
collaboration between actors in the implementation process, but
especially on the resources emerging (emerging resources)
produced by the collaboration. Based on experience in various
cases, the benefits of collaboration in development management
can be described as follows. First, collaboration presents new
contributors to development management. With limited
contributors, the burden is very large. At present, the resources
owned by the government do not allow it to become a single
contributor to development. The presence of private contributors
and civil society in an area reduces the burden. Second,
collaboration presents new resources, both physical and non-
physical. Third, collaboration creates social capital. Social capital
is the ability of development actors to organize and coordinate
actions towards achieving goals.
2. Understanding Coremap and Coremap Program
Implementation in Buton District
Coremap is a coral reef management program abbreviation.
The COREMAP program is an effort to manage coastal and
archipelago resources, especially coral reef ecosystems and fish
resources in a sustainable manner, in order to improve the welfare
of coastal and island communities. The importance of managing
these resources can be seen from the results of a study which
shows that in managed coral reef ecosystems 30 tons of fish can
be produced per km. This value can be sustained if this resource is
managed properly. Conversely, if the coral reef ecosystem is left
to be damaged the results can drop dramatically to 5 tons per km.
COREMAP itself emphasizes more on efforts to improve
institutional and community capacity and the development of
various alternative community activities in an effort to meet their
needs from the sustainable use of coral reef ecosystem resources.
Buton Regency before divided was one of the COREMAP
target areas in phase I to Phase III. Coremap in Buton district as in
other regions is divided into 3 phases, coremap I, II and III.
Coremap I is the initial stage of regulation from coremap.
Coremap I explained the purpose of the meeting through
socialization to regions and establishing a legal basis and
encouraging local governments to be active in managing coral
reefs. Coremap I has succeeded in Buton District. This starts from
the establishment of the basic regulation of the implementation of
the theme, which is the decree of the district head of Buton number
677 of 2006 concerning the management of coral reefs. The Buton
District Government through the Decree of the Regent of Buton
Number 1578 of 2006 has determined Liwutongkidi Island as a
Regional Marine Conservation Area (Buton COREMAP II
Report, 2007).
In phase II it was carried out since 2006. Previously the
COREMAP Phase 1 program for Buton District was carried out
since 2005, with the target area of one subdistrict namely the
District of Lakudo. The COREMAP II target area consists of 7
sub-districts, from each subdistrict, four COREMAP target
villages are determined. Determination of the target area is based
on the Regent's Decree, by prioritizing the lagging regions (Buton
COREMAP II Report, 2007). In the implementation of phase II,
various villages form marine protected areas (DPL) which will be
determined in various Village Regulations. The Coremap III
program itself ran four years ago and is still running with the
institutionalization stage. The final section of the COREMAP
(Institutionalization) program aims to establish a reliable and
operational coral reef management system, decentralized and
encourages strengthening.
Coremap is a comprehensive program approach, combining
approaches that bring together top down and bottom up. Coral
reefs are protected and conserved, through natural rehabilitation
efforts while the community is inspired to participate in
maintaining and utilizing resources wisely and wisely. In the
context of Buton Regency, the activities of community groups to
support Coremap II were also carried out in various ways such as
training in dodol processing from seaweed, conducting training in
processing fish into Abon. The training is always attended by
various members of the Pokmas (Community Group). The
existence of community groups in the fields of cultivation, fishing,
processing, marketing and supervision groups provides benefits
for group members (ButonCoremap II, 2012 Report).
III. RESEARCH METHODS
This research was conducted using a qualitative design with
the aim of describing objectively the public sector collaboration
International Journal of Scientific and Research Publications, Volume 10, Issue 1, January 2020 312
ISSN 2250-3153
http://dx.doi.org/10.29322/IJSRP.10.01.2020.p9748 www.ijsrp.org
management in coremap implementation in kabupaten buton,
southeast sulawesi. This study, previously determined key
informants where key informants were taken based on criteria
according to Bungin (2002) which states that in determining key
informants with consideration that the person concerned has
personal experience in accordance with the problem under study
and has extensive knowledge of the problem under study.
Data sources used in accordance with the opinion of Moleong
(2010) are primary data obtained from two sources, namely
observation and interviews and secondary data obtained from
searching documentation. The process of analyzing data by
analyzing all available data from various sources according to
Moleong (2010), namely interviews, observations, which have
been written in field notes, personal documents and so on. After
being studied, and then it has been arranged in units - units. The
units are then categorized at the last stage which is checking the
validity of the data.
IV. RESULTS AND DISCUSSION
Implementation of Public Sector Collaboration
Management Between Buton District (Including South of
Buton) Government and Parties in Coremap Implementation
In the context of collaborative management in coastal
management in the coremap program in Buton District, including
part of the area that is now part of South Buton, is a synergistic
policy and program and needs to be implemented properly.
Therefore, the Buton District Government is trying to make this
happen. Conceptually it can be understood that there is no single
organization/government that is able to meet its needs by using
resources that are owned independently.
The researcher tried to describe the implementation of public
sector collaboration management that took place between the
Buton District Government and other parties in supporting the
achievement of coral reef conservation, carried out through the
disclosure of various facts in the field by digging up information
about, among other things, how the idea emerged to collaborate.
who first took the initiative to collaborate, what is the basis for the
consideration of both parties to collaborate, do they understand the
context so that they want to collaborate and how the process is so
that the decision to collaborate.
In the context of coremap initiated by the central government,
the program design is designed in a participatory and collaborative
framework. Participation in COREMAP is active community
involvement, especially fishermen and coastal communities, at
every stage of COREMAP activities, starting from preparation,
pre-planning, planning, implementing, monitoring and evaluating
activities.
In the context of Buton district to follow up on the central
direction and as a basis for implementing the coremap, the local
government in this case the regent issued a Decree of the Regent
of Buton number 677 of 2006 concerning Management of Coral
Reefs which later followed up by the decision letter of the Buton
district marine and fisheries number 24/ Q / VI / 2007 which
regulates the organization, the main tasks of the party structures
involved in coremap implementation. As for the reference, among
others, Law No. 32 of 2004 concerning Regional Government,
Decree of the Minister of Maritime Affairs and Fisheries No. 38
Men/2004 on General Guidelines for the Management of Coral
Reefs and Decree of the Minister of Maritime Affairs and
Fisheries Number Kep. 13 Men/2006about the establishment of a
Steering Committee, the Technical Committee and the
Management of the Coral Reef Rehabilitation and Management
Project.
In the context of collaborative management for the
implementation of coremap in Buton district (including South
Buton) with related parties due to the decision of the Ministry of
Maritime Affairs and Fisheries which appointed several regions,
including Buton district to implement coral reef conservation
programs in the Coremap program. Therefore, the Buton District
Government through a regent's decree and followed by a decree
from the head of the maritime and fisheries service followed up on
the order by involving the level of the organization or government
under its authority. Where both theButon District Government and
the marine and fisheries services and related agencies, sub-
districts and villages, the community and related parties are
obliged to succeed the instruction.
Departing from the instruction, it was then followed up by the
maritime and fisheries service by holding a meeting and making a
joint agreement at the level of the government that carried out the
collaboration. At the village level, the initial idea so that the idea
to collaborate in the framework of the implementation of coremap
in South Buton as revealed by the informants included the head of
the Bahari village of Sampolawa sub-district during the coremap
program which stated that :
"Our involvement in a collaborative collaboration is a follow-
up to the Regent's decree and the head of the maritime and
fisheries service and mutual agreement between DKK and all
relevant parties. Subsequently the regent and the head of the DKP
office and the related SKPD collaborate with stakeholders to
succeed in this program (L, 8 June 2018)"
In addition to information about who initiated the
collaboration management of the public sector in the coremap
program, it is also important to know what is the basis for the
consideration of various parties so that they collaborate. Departing
from the information gathered from various informants and
documentation, it can be concluded that the basis for the
consideration of why many parties include the Buton District
Government, fisheries maritime service, transportation services,
environmental services, sub-district and village governments,
NGO members, private and community due to consideration other
than refers to the regent's decree instructions and the decree of the
head of the maritime and fisheries service that had been signed
were also due to the consideration that the Buton District
Government was given the mandate by the central government as
one of the proponents of coral reef conservation. Therefore, the
Buton District Government must continue to maintain coral reefs
as a permanent fishery center in Southeast Sulawesi and even
increase their production from existing ones. The role of Buton
Regency (in this case including South Buton), can be a mainstay
of how to maintain coral reefs without disturbing the lives and
welfare of coastal communities on the other hand, where coral
reefs that are maintained and even increase can be a guarantee for
the long term.
Related to how the process is so that the decision to
collaborate between various parties in the meeting in Buton
District can actually be understood through the explanation of who
International Journal of Scientific and Research Publications, Volume 10, Issue 1, January 2020 313
ISSN 2250-3153
http://dx.doi.org/10.29322/IJSRP.10.01.2020.p9748 www.ijsrp.org
initiated and the substance of the purpose of the collaboration. As
explained earlier that this collaboration occurs because of an order
or instruction from above or topdown from the minister of
maritime and fisheries decree that was followed up by the regent
and the maritime and fisheries service of Buton Regency. Then
followed up through mutual agreement and joint meetings
between stakeholders. However, the top down orders or
instructions are complemented by proposals from the parties from
below in some ways or bottom up. This was revealed by the head
of program and coastal affairs of the South Buton Marine and
Fisheries Department which stated that :
" Our collaboration process refers to the regent's decree and
the fisheries marine service decree and mutual understanding
between the parties at the district level and its coordination to the
center so that it adapts to the conditions and capabilities of the
parties and staff (N., June 2 2018)".
However, the interesting information from the head of the
satker coremap stated that there were still those who were not
ready to commit to collaborating at the service level directly
related to this program. This condition is certainly quite influential
because it is related to field readiness when the program is
implemented. This can be seen from the lack of effective
coordination mechanism. Many schedules that should be carried
out on time are finally delayed. Likewise at the village level there
are villages that actually entered in the initial draft refused to be
involved and some were involved but were less active in activities.
Resistance in the form of unwillingness or laziness at the service
level can be caused by the absence of benefits that can be obtained
or perhaps their interests are not accommodated. At the village
level there is resistance because it is considered to disturb their
livelihoods in the short term and is familiar with the existing habit
patterns.
In addition to how the process of collaboration occurs, also
information about what forms of collaboration are part of the
substance of the description of collaborative management. Based
on the information obtained from various informants, it can be
concluded that the form of collaboration that exists between
various parties is in the form of support from parties in the
structure to the Buton District government.
Further about how the forms of cooperation between the
Buton Patent Government and various parties can be traced
through the contents of the Decree of the Head of the Marine and
Fisheries Department Office and the Joint Statement of
Understanding between various parties regarding the support of
the achievement of the target program where all parties agreed to
succeed in achieving the goals and objectives wherein each party
expresses its commitment to its contribution, for example, that the
First Party in this case, the central party and the regional
government, develops targets, regulations and general guidelines,
infrastructure and costs for its implementation. Further explained
in the statement that the parties are willing to help and support this
program through supervision activities, carrying out mentoring,
counseling and awareness, socialization and arousing and
mobilizing community participation.
Related to how the process of formulating strategies,
objectives, and targets as the national program has actually been
compiled by the main person in charge in this case the marine and
fisheries department assisted by Indonesian science institutions. In
general COREMAP's goal is to ensure the availability of reef fish
resources and to conserve their habitat (coral reefs) on an ongoing
basis, as the main wealth and capital of coastal village
development, to accelerate poverty reduction through increasing
community and institutional capacity in the implementation of
village and / or inter-village development and increasing provision
socio-economic facilities and infrastructure in accordance with
community needs. areas that have long existed. The specific
objective or target is to first empower coastal communities and
their institutions in the COREMAP region to be able to conserve
coral reefs and other related ecosystems through joint management
with government institutions. Second, increasing income through
transparent business diversification, accountability and feasibility
to be financed and thirdly increasing the government's active role
in meeting the needs of coastal communities in the framework of
joint management of marine protection and marine protected areas
(DPL).
From the objectives, the COREMAP Strategy was mapped
where the strategy was through the involvement of various
stakeholders in the management of coral reef resources, the
implementation of activities supported by COREMAP that needed
to involve stakeholders, especially fishermen and communities
whose lives depend on coral reef resources and other resources.
The management of coral reef ecosystem resources is not only
related to the procedures for utilization, but also by other things
that affect the use procedures, all of which involve various
stakeholders at different levels (national, provincial, district and
village), including policy makers, universities, NGOs, fisheries
businesses, fishermen associations, law enforcement. That way,
the presence of stakeholders together by knowing their roles and
functions in the context of managing coral reef ecosystem
resources will facilitate the implementation of a responsive
management model, oriented towards sustainable use and
encourage the welfare process of fishing communities.
In order for a collaboration to have a clear direction and be a
guide for all parties and can be realized, in the context of
collaborative collaboration in Buton regency there is nothing
specifically in the form of vision, policies, strategies, goals and
common goals. The vision and mission in the coremap program in
all regions refers to the vision - mission set by the center or the
program as a whole. The vision of this program nationally is
ensuring the sustainability of coral reef resources and the welfare
of local communities through the application of the principles of
environmentally friendly sustainable management and the
development of economic enterprises for the local community.
This is actually strengthened carefully from the regent's decree and
the decree of the head of the maritime and fisheries service, so it
can be concluded that the collaboration has a vision as expressed
by the head of the coremap work unit "... realizing sustainable
coral reef management(H., 29 June 2018)”.
This vision is actually intersecting and is a description of the
vision in the field of fisheries in Buton Regency namely: as a pillar
of sustainable and competitive fisheries. In order for this vision to
have a clear direction then it will be accompanied by a mission
that includes: 1) increasing sustainable fisheries production; 2)
optimization of infrastructure by encouraging optimization of
fisheries resources and) improving the welfare of coastal
communities and fishermen. Departing from the vision and
mission, then it became a reference and director of collaboration
International Journal of Scientific and Research Publications, Volume 10, Issue 1, January 2020 314
ISSN 2250-3153
http://dx.doi.org/10.29322/IJSRP.10.01.2020.p9748 www.ijsrp.org
in realizing the achievement of coremap targets, especially in
sustainable management of coral reefs.
Related to what policies are issued from the collaboration to
support the effectiveness of the implementation of the
collaborations that have been agreed upon, the duties of the regent
and the fisheries marine service are clearly stated in the duties of
each party involved in the collaboration. Another policy is that
each government agency in the related districts, sub-districts and
villages is emphasized to collaborate with other relevant parties to
support the implementation of the coremap program and the
agreements that have been stated in the meetings and meetings.
The policy that becomes the technical reference above is
derived from the policies that have been issued by the central
government the marine and fisheries department, namely: 1)
integration and coordination between relevant agencies, including
universities in supporting sustainable coastal resource
management; 2) strengthening the policy network; 3) assistance
and escort program.
The composition of organizational personnel in
implementing collaboration between the two parties can be
illustrated through the contents of the regent's decree and the
maritime and fisheries department and the agreement signed in the
meeting which certainly refers to the technical guidelines and
written instructions of the program but also through a series of
information sourced from informants. The Regent acts as the party
who is committed in encouraging the policy of the leadership to
remain consistent to realize the agreed targets.
As the technical executor, the Head of the Marine and
Fisheries Service, the head of the coastal empowerment council
and the head of the work unit coordinate again with the province
and the main center. In addition, the inner city district government
consists of the marine and fisheries service, the Environment
Agency, Bappeda, Community Empowerment, Spatial Planning
assisted by Universities, NGOs, sub-district and village
governments and the community acts as the party implementing
the coremap program. In Buton Regency as the Regency that
implemented the program, the organization has an organizational
structure consisting of a coastal community empowerment board,
a national park, and a project management unit as the manager
whose determination is determined by the regent's decree. In the
implementation of the regent and regional legislative council will
provide support for the effectiveness of the role and institutional
functions of the coremap.
In full, the organizational structure is led by a coastal
community empowerment board where the coastal community
empowerment board is formed through the Decree of the District
Head and chaired by the Regent or Chair of the District Bappeda.
This board consists of 20 people with a balanced composition that
comes from government and non-government elements in this
case from the government element from the elements of DKP,
Bappeda, DinasPendidikan, KSDA, Police, Navy, Camat. In
addition, members can also be added from the Bapedalda office,
the Tourism Office, the empowerment and spatial planning
agencies. there is also the village head fishermen, women,
community leaders, traditional leaders, NGOs, and universities.
The second element is the project management unit which is
chaired by the Head of the DKP or other services that handle
maritime and fisheries functions. Third, the power of the user of
the unit's management program budget. In each sub-district, senior
extension facilitators will be placed extension and training officer
(SETO) which is assigned, among others, to assist PMU in the
implementation of the COREMAP program and coordinate
activities to be carried out by the Facilitator and Village Motivator.
Community Facilitators (CF) and Village Motivators Community
Facilitators (CF) and Village Motivators recruited and placed in
the village to assist in the implementation of the COREMAP
program in the village (General Guidelines for COREMAP
Community-based Management, 2006).
In the context of collaboration in the match program in Buton
District acting as the collaboration leader was the coastal
empowerment council chaired by the buton regent and the head of
the bappeda and assisted by the executive management unit
chaired by the head of the maritime and fisheries service and the
daily was run by the head of the work unit as the main actor of
collaboration. This can be traced through information from
informants and based on the decree of the regent and the maritime
and fisheries service and mutual understanding.
Related to the mechanism of responsibility of each party that
collaborates takes place as stipulated in a joint decree and
agreement that is strengthened by a meeting agreed upon and
signed by each party. Information is obtained that at the district
level the mechanism of responsibility can be seen in several
articles in the district head and marine and fisheries services as
well as the MoU. Head of the program and coastal area of South
Buton Regency stated that :
"The technical responsibility for activities and funding is
carried out by the central marine and fisheries department which
has been decentralized to the main implementers here, namely the
coastal empowerment council chaired by the regent and the head
of the bappeda and the management unit which is headed by the
head of the regency. This is in accordance with the rules and skills
that have been agreed upon (N., June 17, 2018 ".
In order for these responsibilities to be carried out according
to the agreed terms, coordination is always carried out according
to their respective functions. For example, between management
units and coastal empowerment councils and the central
government. Coordination took place at the sub-district level
between sub-district heads and sub-district level administrators as
well as at the village level facilitators and village motivators will
always coordinate with village heads and community leaders. The
form and mechanism of coordination are carried out through
meeting activities and follow-up in the field.
Based on the foregoing description, it can be concluded that
the implementation of public sector collaboration management in
the coremap program is a collaboration designed by the central
government which is then followed up by the Buton District
Government where South Buton is still a part. Together with other
parties both from formal institutions in the sense of service related
also to non-formal institutions such as members of non-
governmental organizations, community and adat leaders in the
sub-districts and villages that are the location of program
implementation. As is known that even though the order to
collaborate comes from the central government and the Buton
District Government as the parent of South Buton District since
the beginning of implementing collaboration by involving a
number of parties. Therefore, the Buton District Government and
in this case including the government in southern Buton can be
International Journal of Scientific and Research Publications, Volume 10, Issue 1, January 2020 315
ISSN 2250-3153
http://dx.doi.org/10.29322/IJSRP.10.01.2020.p9748 www.ijsrp.org
categorized as a government that has adopted a governance
governance approach. This is because governance is susceptible to
use because of the internal awareness of an organization in this
case the government that by relying on its internal resources it is
impossible for the organization the government is now able to
achieve its vision and mission.
Use of other organizational resources is important. Therefore
at the same time when the local government has invited other
resource owners that are needed by their government, it means that
they have implemented the substance of governance, namely the
importance of using networks and collaboration between actors.
This is in line with the views of O'Leary and Gazley (2009) which
states that governance that collaborates management is one of the
characteristics of government organizations that apply the concept
of governance. The desire of Buton District Government to utilize
the network, how to make decisions with networks, how to
determine tasks and targets with the network, and how to manage
the impact of the policies made shows that the efforts made
between the Buton District government followed by the southern
Buton district as a division with various parties are categorized as
a form of collaboration management.
The process that occurs in implementing the implementation
of this program is one part of the obligations of the Government
of Buton District and South Buton as a division in facilitating its
citizens to be able to manage coastal resources in a sustainable
manner and improve their standard of living which further aims to
solve problems that cannot be resolved or resolved. by relying on
himself. This process is in line with the definition of collaborative
management proposed by O'Leary and Gazley (2009) that
organizations in the context of governance must be oriented to
organizations that act to facilitate and be able to operate in
networks between organizations to solve problems that cannot be
solved by themselves, or are able to finish easily compared to the
organization itself.
An important aspect is analyzed in the context of
collaboration between the Buton District Government and the
terikait government, namely whether there is reciprocal interest.
Field findings indicate that there are interests of various parties
who want to be achieved with a sustainable coral reef management
program in a coremap. The main interests of the Buton District
Government as the parent and South Buton as pemekaran are
overcoming the destruction of coral reefs and maintaining and
even increasing the position as a fishery barn in Southeast
Sulawesi in sustainable management of resources. While the
objectives to be achieved from the parties so that they are willing
to provide their resources to succeed in the coremap program are
diverse, but overall there are parts of efforts to realize sustainable
management of coastal resources and fisheries. Based on these
interests, one meeting program activities achieved the
achievement of the coremap target. The interests that collaborate
in realizing sustainable management of coral reefs and coastal
resources are in line with what was stated by Hull in Hjern, (1987).
Thus it can be concluded that the description of the
implementation of public sector collaboration management that
took place in the framework of the implementation of the coremap
conducted from 2006 to 2012 in stages two and three from 2015
to the present in the third stage both in terms of definition,
characteristics and processes in general public sector collaboration
management. Except for some aspects that are still not optimal in
their implementation so that they have implications for outputs or
targets that have been predetermined as previously described, for
example coordination and communication.
V. CONCLUSION
The process that occurs in implementing the implementation
of this program is one part of the obligations of the Government
of Buton District and southern Buton as a division in facilitating
its citizens to be able to manage coastal resources in a sustainable
manner and solve problems that cannot be solved by relying on
themselves. This process is in line with the definition of
collaborative management proposed by O'Leary and Gazley
(2009) that organizations in the context of governance must be
oriented to organizations that act to facilitate and be able to operate
in networks between organizations to solve problems that cannot
be solved by themselves, or are able to finish easily compared to
the organization itself.
The main interests of the Buton District Government as the
parent and South Buton as pemekaran are overcoming the
destruction of coral reefs and maintaining and even increasing the
position as a fishery barn in Southeast Sulawesi in sustainable
management of resources. While the objectives to be achieved
from the parties so that they are willing to provide their resources
to succeed in the coremap program are diverse, but overall there
are parts of efforts to realize sustainable management of coastal
resources and fisheries. Based on these interests, one meeting
program activities achieved the achievement of the coremap
target. The interests that collaborate in realizing sustainable
management of coral reefs and coastal resources are in line with
what was stated by Hull in Hjern, (1987).
Thus it can be concluded that the description of the
implementation of public sector collaboration management that
occurs in the framework of the implementation of the coremap
conducted from 2006 to 2012 in stages two and three from 2015
to the present in the third stage both in terms of definition,
characteristics and processes in general have met the elements
public sector collaboration management. Except for some aspects
that are still not optimal in their implementation so that they have
implications for outputs or targets that have been predetermined
as previously described, for example coordination and
communication.
REFERENCES
[1] Bungin, Burhan.2002. Qualitative Research Methods, Methodological actualization in the direction of contemporary variations, Jakarta: Rajawali Press
[2] COREMAP II. 2012. Report of the Implementation of the 2012 COREMAP II Local Research Implementation Activity of Buton District.
[3] COREMAP II. 2007. Report of Buton District 2007 COREMAP II Local Research Implementation Implementation Report.
[4] COREMAP II. 2007. Report on the Preparation of KKLD Plan Management in Liwutongkidi.
[5] Ministry of Maritime Affairs and Fisheries of the Republic of Indonesia. Decree of the Minister of Maritime Affairs and Fisheries No. 38.Men/2004 on General Guidelines for the Management of Coral Reefs
[6] Ministry of Maritime Affairs and Fisheries of the Republic of Indonesia. Decree of the Minister of Maritime Affairs and Fisheries Number Kep. 13 /Men/2006 about the establishment of a Steering Committee, the Technical

International Journal of Scientific and Research Publications, Volume 10, Issue 1, January 2020 316
ISSN 2250-3153
http://dx.doi.org/10.29322/IJSRP.10.01.2020.p9748 www.ijsrp.org
Committee and the Management of the Coral Reef Rehabilitation and Management Project
[7] Department Of Marine And Fisheries, Buton Regency, 2007. Decree Of Marine And Fisheries Office Number 4/Q/VI/2007 About The Structure, Organizational Structure And Main Tasks Of The Implementation Of Coremap In The District Of Buton.
[8] Directorate General of Marine, Coastal and Small Islands Ministry of Maritime Affairs and Fisheries. 2006. General guidelines for COREMAP community-based management.
[9] Hull, Christopher J., with Benny Hjern. 1987. Helping Small Firms Grow: An Implementation Approach. London: Croom Helm.
[10] O’Leary, R., B.Gazley, B. Michael McGuire, and L.B.Bingham. 2009. Public Managers in Collaboration. In The Collaborative Publik Manager: New Ideas for the Twenty-firts Century. 1-12. Washington DC: Georgetown University Press.
[11] Kabupaten buton Government. Decree Of The Regent Of Buton Number 677 Of 2016 Concerning The Management Of Coral Reefs In Buton Regency.
[12] Salman, Darmawan.2004. Collaboration Between Actors in Regional Economic Development "Paper Presented In A Seminar On Population-Based Regional Economic Development Planning", Development And Population Education And Training Center For Education And Training Agency Of The Ministry of Home Affairs. Jakarta: 4 - 9 October 2004.
[13] Moleong, Lexy J. 2010. Qualitative Research Methodology PT.Remaja Rosda Karya, Bandung.
AUTHORS
First Author – Asmiddin, Zainul Abidin, Dayanu Ikhsanuddin
University, State Administration Program, Email :
Second Author – Abdul Madjid, Dayanu Ikhsanuddin
University, State Administration Program
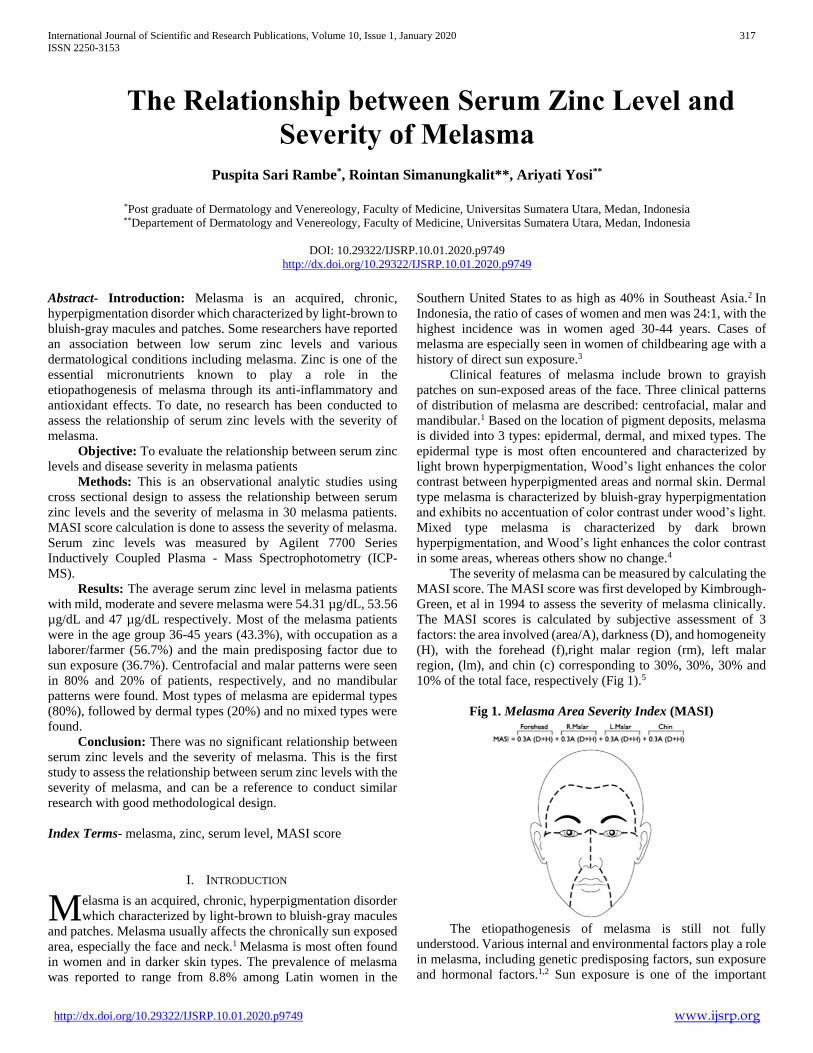
International Journal of Scientific and Research Publications, Volume 10, Issue 1, January 2020 317
ISSN 2250-3153
http://dx.doi.org/10.29322/IJSRP.10.01.2020.p9749 www.ijsrp.org
The Relationship between Serum Zinc Level and
Severity of Melasma
Puspita Sari Rambe*, Rointan Simanungkalit**, Ariyati Yosi**
*Post graduate of Dermatology and Venereology, Faculty of Medicine, Universitas Sumatera Utara, Medan, Indonesia **Departement of Dermatology and Venereology, Faculty of Medicine, Universitas Sumatera Utara, Medan, Indonesia
DOI: 10.29322/IJSRP.10.01.2020.p9749
http://dx.doi.org/10.29322/IJSRP.10.01.2020.p9749
Abstract- Introduction: Melasma is an acquired, chronic,
hyperpigmentation disorder which characterized by light-brown to
bluish-gray macules and patches. Some researchers have reported
an association between low serum zinc levels and various
dermatological conditions including melasma. Zinc is one of the
essential micronutrients known to play a role in the
etiopathogenesis of melasma through its anti-inflammatory and
antioxidant effects. To date, no research has been conducted to
assess the relationship of serum zinc levels with the severity of
melasma.
Objective: To evaluate the relationship between serum zinc
levels and disease severity in melasma patients
Methods: This is an observational analytic studies using
cross sectional design to assess the relationship between serum
zinc levels and the severity of melasma in 30 melasma patients.
MASI score calculation is done to assess the severity of melasma.
Serum zinc levels was measured by Agilent 7700 Series
Inductively Coupled Plasma - Mass Spectrophotometry (ICP-
MS).
Results: The average serum zinc level in melasma patients
with mild, moderate and severe melasma were 54.31 µg/dL, 53.56
µg/dL and 47 µg/dL respectively. Most of the melasma patients
were in the age group 36-45 years (43.3%), with occupation as a
laborer/farmer (56.7%) and the main predisposing factor due to
sun exposure (36.7%). Centrofacial and malar patterns were seen
in 80% and 20% of patients, respectively, and no mandibular
patterns were found. Most types of melasma are epidermal types
(80%), followed by dermal types (20%) and no mixed types were
found.
Conclusion: There was no significant relationship between
serum zinc levels and the severity of melasma. This is the first
study to assess the relationship between serum zinc levels with the
severity of melasma, and can be a reference to conduct similar
research with good methodological design.
Index Terms- melasma, zinc, serum level, MASI score
I. INTRODUCTION
elasma is an acquired, chronic, hyperpigmentation disorder
which characterized by light-brown to bluish-gray macules
and patches. Melasma usually affects the chronically sun exposed
area, especially the face and neck.1 Melasma is most often found
in women and in darker skin types. The prevalence of melasma
was reported to range from 8.8% among Latin women in the
Southern United States to as high as 40% in Southeast Asia.2 In
Indonesia, the ratio of cases of women and men was 24:1, with the
highest incidence was in women aged 30-44 years. Cases of
melasma are especially seen in women of childbearing age with a
history of direct sun exposure.3
Clinical features of melasma include brown to grayish
patches on sun-exposed areas of the face. Three clinical patterns
of distribution of melasma are described: centrofacial, malar and
mandibular.1 Based on the location of pigment deposits, melasma
is divided into 3 types: epidermal, dermal, and mixed types. The
epidermal type is most often encountered and characterized by
light brown hyperpigmentation, Wood’s light enhances the color
contrast between hyperpigmented areas and normal skin. Dermal
type melasma is characterized by bluish-gray hyperpigmentation
and exhibits no accentuation of color contrast under wood’s light.
Mixed type melasma is characterized by dark brown
hyperpigmentation, and Wood’s light enhances the color contrast
in some areas, whereas others show no change.4
The severity of melasma can be measured by calculating the
MASI score. The MASI score was first developed by Kimbrough-
Green, et al in 1994 to assess the severity of melasma clinically.
The MASI scores is calculated by subjective assessment of 3
factors: the area involved (area/A), darkness (D), and homogeneity
(H), with the forehead (f),right malar region (rm), left malar
region, (lm), and chin (c) corresponding to 30%, 30%, 30% and
10% of the total face, respectively (Fig 1).5
Fig 1. Melasma Area Severity Index (MASI)
The etiopathogenesis of melasma is still not fully
understood. Various internal and environmental factors play a role
in melasma, including genetic predisposing factors, sun exposure
and hormonal factors.1,2 Sun exposure is one of the important
M
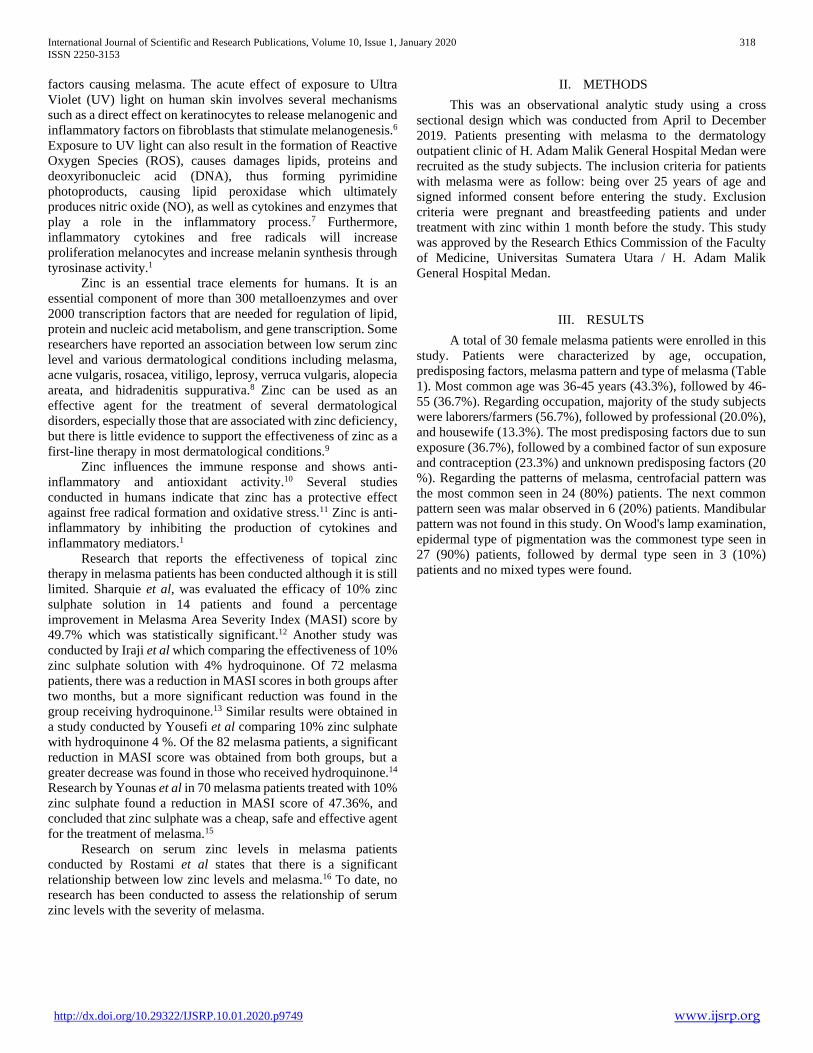
International Journal of Scientific and Research Publications, Volume 10, Issue 1, January 2020 318
ISSN 2250-3153
http://dx.doi.org/10.29322/IJSRP.10.01.2020.p9749 www.ijsrp.org
factors causing melasma. The acute effect of exposure to Ultra
Violet (UV) light on human skin involves several mechanisms
such as a direct effect on keratinocytes to release melanogenic and
inflammatory factors on fibroblasts that stimulate melanogenesis.6
Exposure to UV light can also result in the formation of Reactive
Oxygen Species (ROS), causes damages lipids, proteins and
deoxyribonucleic acid (DNA), thus forming pyrimidine
photoproducts, causing lipid peroxidase which ultimately
produces nitric oxide (NO), as well as cytokines and enzymes that
play a role in the inflammatory process.7 Furthermore,
inflammatory cytokines and free radicals will increase
proliferation melanocytes and increase melanin synthesis through
tyrosinase activity.1
Zinc is an essential trace elements for humans. It is an
essential component of more than 300 metalloenzymes and over
2000 transcription factors that are needed for regulation of lipid,
protein and nucleic acid metabolism, and gene transcription. Some
researchers have reported an association between low serum zinc
level and various dermatological conditions including melasma,
acne vulgaris, rosacea, vitiligo, leprosy, verruca vulgaris, alopecia
areata, and hidradenitis suppurativa.8 Zinc can be used as an
effective agent for the treatment of several dermatological
disorders, especially those that are associated with zinc deficiency,
but there is little evidence to support the effectiveness of zinc as a
first-line therapy in most dermatological conditions.9
Zinc influences the immune response and shows anti-
inflammatory and antioxidant activity.10 Several studies
conducted in humans indicate that zinc has a protective effect
against free radical formation and oxidative stress.11 Zinc is anti-
inflammatory by inhibiting the production of cytokines and
inflammatory mediators.1
Research that reports the effectiveness of topical zinc
therapy in melasma patients has been conducted although it is still
limited. Sharquie et al, was evaluated the efficacy of 10% zinc
sulphate solution in 14 patients and found a percentage
improvement in Melasma Area Severity Index (MASI) score by
49.7% which was statistically significant.12 Another study was
conducted by Iraji et al which comparing the effectiveness of 10%
zinc sulphate solution with 4% hydroquinone. Of 72 melasma
patients, there was a reduction in MASI scores in both groups after
two months, but a more significant reduction was found in the
group receiving hydroquinone.13 Similar results were obtained in
a study conducted by Yousefi et al comparing 10% zinc sulphate
with hydroquinone 4 %. Of the 82 melasma patients, a significant
reduction in MASI score was obtained from both groups, but a
greater decrease was found in those who received hydroquinone.14
Research by Younas et al in 70 melasma patients treated with 10%
zinc sulphate found a reduction in MASI score of 47.36%, and
concluded that zinc sulphate was a cheap, safe and effective agent
for the treatment of melasma.15
Research on serum zinc levels in melasma patients
conducted by Rostami et al states that there is a significant
relationship between low zinc levels and melasma.16 To date, no
research has been conducted to assess the relationship of serum
zinc levels with the severity of melasma.
II. METHODS
This was an observational analytic study using a cross
sectional design which was conducted from April to December
2019. Patients presenting with melasma to the dermatology
outpatient clinic of H. Adam Malik General Hospital Medan were
recruited as the study subjects. The inclusion criteria for patients
with melasma were as follow: being over 25 years of age and
signed informed consent before entering the study. Exclusion
criteria were pregnant and breastfeeding patients and under
treatment with zinc within 1 month before the study. This study
was approved by the Research Ethics Commission of the Faculty
of Medicine, Universitas Sumatera Utara / H. Adam Malik
General Hospital Medan.
III. RESULTS
A total of 30 female melasma patients were enrolled in this
study. Patients were characterized by age, occupation,
predisposing factors, melasma pattern and type of melasma (Table
1). Most common age was 36-45 years (43.3%), followed by 46-
55 (36.7%). Regarding occupation, majority of the study subjects
were laborers/farmers (56.7%), followed by professional (20.0%),
and housewife (13.3%). The most predisposing factors due to sun
exposure (36.7%), followed by a combined factor of sun exposure
and contraception (23.3%) and unknown predisposing factors (20
%). Regarding the patterns of melasma, centrofacial pattern was
the most common seen in 24 (80%) patients. The next common
pattern seen was malar observed in 6 (20%) patients. Mandibular
pattern was not found in this study. On Wood's lamp examination,
epidermal type of pigmentation was the commonest type seen in
27 (90%) patients, followed by dermal type seen in 3 (10%)
patients and no mixed types were found.
International Journal of Scientific and Research Publications, Volume 10, Issue 1, January 2020 319
ISSN 2250-3153
http://dx.doi.org/10.29322/IJSRP.10.01.2020.p9749 www.ijsrp.org
Based on our study, the mean duration of the melasma was
91.70±72.145months with a minimum value of 12 months and a
maximum value of 240 months. The relationship of serum zinc
levels with melasma duration were presented in Table 2. Based on
our study, the result of Spearman correlation test showed the value
of p > 0.05. There is no significant relationship between serum
zinc levels with duration of melasma (p-value = 0.680, r = 0.079).
Table 2 Relationship of serum zinc levels with duration of
melasma
min-max
(months)
Mean ±
SD
(months)
r p-
value
Duration
of
melasma
12-240 91.70 ±
72.145
0.079 0.680
From the MASI score, the severity of melasma was mild in
13 patients, moderate in 16 patients and severe in 1 patient. Serum
zinc levels in mild melasma patients ranged from 42-70 µg/dL
(mean 54.31 µg/dL), moderate 34-72 µg/dL (mean 53.56 µg/dL),
and severe 47 µg/dL (Table 3).
Table 3. Relationship of serum zinc levels with the severity of
melasma
Melasma
severity n
Min-
Max
(µg/dL)
Mean ±
SD
(µg/dL)
p-
value
Mild 13 42-70 54.31 ±
7.307
0.542 Moderate 16 34-72 53.56 ±
8.951
Severe 1 47-47 47
Based on our study, the results of the kruskal-wallis test
showed the value of p > 0.05. There is no significant relationship
between serum zinc levels with the severity of melasma (p> 0.05).
IV. DISCUSSIONS
In our study, the highest number of melasma subjects was
36-45 years (43.3%) and followed by 46-55 years (36.7%). A
similar study by Umborowati et al reported the majority of
melasma patients was 36-45 year (43%), followed by the 46-55
year.17 In our study, most subjects had working outdoors and often
exposed to sunlight, especially in the laborers/farmers groups.
Research conducted by Handel et al revealed a higher proportion
of individual melasma who reported work with higher sun
exposure. Chronic sun exposure is more important in developing
melasma.18
The most predisposing factors found in this study were due
to sun exposure as many as 11 cases (36.7%) and the second most
were combined factors of sun exposure and contraception as many
as 7 cases (23.3%). Sun exposure is one of the important factors
causing melasma with the formation of ROS which causes lipid
peroxidation and produces free radicals and the release of
inflammatory cytokines thereby increasing the process of
melanogenesis.1 Hormonal factors are also referred to as important
factors triggering the occurrence of melasma. Estrogen,
progesterone and MSH may induce hyperpigmentary responses
within melanocytes by increases tyrosinase and dopachrome
tautomerase resulting in the process of melanogenesis.19
Melasma involving sun exposed areas, such as face and less
commonly on neck and arms. During exposure and after sun
exposure, clinical manifestations are more clearly visible.
Centrofacial melasma are more common because the appropriate
area of focus is direct sun exposure. In our study, the most frequent
pattern of melasma was the centrofacial pattern of 24 patients
(80%), followed by the malar pattern of 6 patients (20%).
Mandibular pattern was not found in this study. This result is
similar with study by Kusumaningrum et al. Centrofacial pattern
was the most common pattern (87.5%), followed by malar pattern
(12.5%) and no subjects with mandibular type were found.20 The
type of melasma is determined based on clinical examination and
Wood's lamp. The epidermal type was found more frequently in
(90%), followed by dermal types (10%) and no mixed types were
found.
Based on table 2 it can be seen that there is no significant
relationship between serum zinc levels with melasma duration (p-
Characteristics
Subject
Frequency
(n)
Percentage
(%)
Age (years)
26-35 2 6.7
36-45 13 43.3
46-55 11 36.7
56-65 4 13.3
Occupation
Housewife 4 13.3
Laborer/farmer 17 56.7
Professional 6 20
Bussiness 3 10
Predisposing factor
None 6 20
Sun exposure 11 36.7
Contraception 3 10
Pregnancy 2 6.7
Sun exposure and
contraception
7 23.3
Sun exposure and
pregnancy
1 3.3
Melasma pattern
Centrofacial 24 80
Malar 6 20
Mandibular 0 0
Melasma type
Epidemal 27 90
Dermal 3 10
Mix 0 0
Table 1. Patient characteristics

International Journal of Scientific and Research Publications, Volume 10, Issue 1, January 2020 320
ISSN 2250-3153
http://dx.doi.org/10.29322/IJSRP.10.01.2020.p9749 www.ijsrp.org
value = 0.680, r = 0.079). This study is similar with research
conducted by Rostami et al who stated that there was no significant
relationship between serum zinc levels and duration of melasma
(p-value = 0.182).16
Based on table 3 it can be seen that there is no significant
relationship between serum zinc levels with the severity of
melasma (p > 0.05). The previous study conducted by Rostami et
al found that there was a relationship between low zinc levels in
melasma patients. Serum zinc levels in control subjects ranged
from 45.3 – 130.4 µg/dL with a mean value of 82.2 ± 23.9 µg/dL,
while serum zinc levels in melasma patients ranged from 39.1 –
126.5 µg/dL with a mean value of 77.4 ± 23.2 µg/dL. Paired t test
results showed that there were significant differences between
serum zinc levels in melasma patients compared with control
subjects (P-value 0.0001). Serum zinc deficiency was found in 54
(45.8%) in melasma patients and 28 (23.7%) in control subjects.16
Low zinc levels were also encountered in our study, where 24
subjects (80%) had serum zinc levels below normal (<60 µg/dL).
Etiopathogenesis of melasma is complex in which sun exposure is
one of the main causative factors. UV light can cause the
formation of ROS which in turn will cause lipid peroxidation and
stimulate the release of inflammatory cytokines and subsequently
stimulate the process of melanogenesis.1,7 Zinc in this case is a
SOD enzyme cofactor which is one of the main antioxidants in
fighting ROS.10,21
There is no significant relationship between serum zinc
levels and the severity of melasma in this study, indicating that
melasma is not only influenced by sun exposure, but is
multifactorial, such as genetic, hormonal, and other factors (drugs,
neural and psychological and lipid metabolism).
V. CONCLUSIONS
This study shows that there is no significant relationship
between serum zinc levels and the severity of melasma. This is the
first study to evaluate the relationship of serum zinc levels and the
severity of melasma so that it can be used as a reference to conduct
similar studies in the future with a better design methodology.
REFERENCES
[1] Bagherani N, Gianfaldoni S, Smoller B. An overview on melasma. Pigmentary disorders. [Internet]. 2015 [cited 2019 Juni 21]; 2(10): 1-8. Available from https://www.omicsonline.org/open-access/an-overview-on-melasma-2376-0427-1000216.php?aid=60663
doi:10.4172/2376-0427.1000216
[2] Park KC, Kang HY. Current Views on Melasma. In: Kumarasinghe P. (eds) Pigmentary Skin Disorders. Updates in Clinical Dermatology. Springer, Cham. [Internet]. 2018 [cited 2019 Juni 21]. Available from:
https://link.springer.com/chapter/10.1007/978-3-319-70419-7_12
[3] Soepardiman L. Kelainan pigmen. Dalam: Djuanda A, Hamzah, Aisah S, editor. Ilmu Penyakit Kulit dan Kelamin Edisi ke 7. Jakarta: Balai Penerbit FKUI. 2015; 342-345.
[4] Rigopoulos D, Gregoriou S, Katsambas A. Hyperpigmentation and melasma. Journal of Cosmetic Dermatology. [Internet]. 2007 [cited 2019 Juni 22]; 6(3): 195–202. Available from: https://onlinelibrary.wiley.com/doi/10.1111/j.1473-2165.2007.00321.x
doi:10.1111/j.1473-2165.2007.00321.x
[5] Pandya AG, Hynan LS, Bhore R. Reliability assessment and validation of the Melasma Area and Severity Index (MASI) and a new modified MASI scoring method. Journal of American Academy of Dermatology. [Internet]. 2009
[cited 2019 Juni 22]; 6(1):78-83.e2. Available from: https://www.ncbi.nlm.nih.gov/pubmed/20398960
doi10.1016/j.jaad.2009.10.051
[6] Lee AY. Recent progress in melasma pathogenesis. Pigment cell & melanoma research. [Internet]. 2015 [cited 2019 Juni 22]; 28(6): 648-60. Available from: https://onlinelibrary.wiley.com/doi/full/10.1111/pcmr.1240
[7] Nishisgori C. Current concept of photocarcinogenesis. Photochemical & Photobiological Sciences. [Internet]. 2015 [cited 2019 Juni 22]; 14(9): 1713-21. Available from: https://pubs.rsc.org/en/content/articlehtml/2015/pp/c5pp00185
[8] Mrinal Gupta, Vikram K. Mahajan. Zinc Therapy in Dermatology: A Review. Dermatology Research and Practice. [Internet]. 2014 [cited 2019 Juni 21], Article ID 709152, 11 pages. Available from: https://www.hindawi.com/journals/drp/2014/709152/cta/
doi 10.1155/2014/709152
[9] Bagherani N, Smoller B. An overview of zinc and its importance in dermatology-Part II: The association of zinc with some dermatologic disorders. Global dermatology. [Internet]. 2016 [cited 2019 Juni 21]; 3(5): 337-50. Available from: https://www.oatext.com/pdf/GOD-3-186.pdf
doi: 10.15761/GOD.1000186
[10] Jarosz M, Olbert M, Wyszogrodzka G. Antioxidant and anti-inflammatory effects of zinc. Zinc-dependent NF-κB signaling. Inflammopharmacology. [Internet]. 2017 [cited 2019 Juni 26]; 25(1): 11–24. Available from: https://www.ncbi.nlm.nih.gov/pmc/articles/PMC5306179/ doi:10.1007/s10787-017-0309-4
[11] Rostan EF, Debuy HV. Evidence supporting zinc as an important antioxidant for skin. International Journal of Dermatology. [Internet]. 2001[cited Juni 26]; 41: 606-611. Available from: https://www.ncbi.nlm.nih.gov/pubmed/12358835
doi:10.1046/j.1365-4362.2002.01567.x
[12] Sharquie KE, Al Mashhadani SA. Topical 10% zinc sulfate solution for treatment of melasma. Dermatology surgery. [Internet]. 2008 [cited 2019 Juni 22]; 34: 10. Available from:
https://www.ncbi.nlm.nih.gov/pubmed/18616534
DOI:10.1111/j.1524-4725.2008.34287.x
[13] Iraji F, Tagmirriahi N, Gavidnia K. Comparison between the efficacy of 10% zinc sulfate solution with 4% hydroquinone cream on improvement of melasma. Adv Biomed Res. [Internet]. 2012 [cited 2019 Juni 22]; 1(3): 39. Available from: https://www.ncbi.nlm.nih.gov/pmc/articles/PMC3544106/
doi:10.4103/2277-9175.10013
[14] Yousefi A, Khoozani Z. Is topical zinc effective in the treatment of melasma? A double-Blind randomized comparative study. Dermatol surgery. [Internet]. 2014 [cited 2019 Juni 21]; 40(1): 33-7. Available from: https://www.ncbi.nlm.nih.gov/pubmed/24237751
doi: 10.1111/dsu.122
[15] Younas S, Fasih S, Arshad A. Outcome of topical 10% zinc sulphate solution in the treatment of melasma. Pak J Physiol [Internet]. 2019 [cited 2019 November 22]; 15(1): 45-47. Available from: http://www.pps.org.pk/PJP/15-1/Sana.pdf
[16] Rostami M, Ardabili N. Evaluation of the serum zinc level in adult patients with melasma: Is there a relationship with serum zinc deficiency and melasma? J Cosmet Dermatol. [Internet]. 2018 [cited 2019 April]; 17(3): 417-422. Available from: https://www.ncbi.nlm.nih.gov/pubmed/29131489
doi: 10.1111/jocd.12392
[17] Umborowati MA, Rahmadewi. Studi Retrospektif: Diagnosis dan Terapi Pasien Melasma. BIKKK - Berkala Ilmu Kesehatan Kulit dan Kelamin - Periodical of Dermatology and Venereology. 2014; 26(1): 56-62.
[18] Handel AC, Lima PB, Tonolli V. Risk factors for facial melasma in women: a case-control study. British Journal of Dermatology. [Internet]. 2014 [cited 2019 October 5]; 171(3): 588–594. Available from: https://onlinelibrary.wiley.com/doi/pdf/10.1111/bjd.13059 doi:10.1111/bjd.13059
[19] Costin GE, Birlea SA. What is the mechanism for melasma that so commonly accompanies human pregnancy. Life. [Internet]. 2006 [cited 2019 Juli 16]; 58 (1): 55-7. Available from: https://www.ncbi.nlm.nih.gov/pubmed/16540433 doi10.1080/15216540500417020
[20] Kusumaningrum N, Febriana SA, Winarni DR. Fungsi Barier Kulit pada Pasien Melasma. Media Dermato Venereologica Indonesiana. [Internet].

International Journal of Scientific and Research Publications, Volume 10, Issue 1, January 2020 321
ISSN 2250-3153
http://dx.doi.org/10.29322/IJSRP.10.01.2020.p9749 www.ijsrp.org
2018 [cited 2019 October 16]; 45(3). Available from: http://www.ojs.perdoski.id/index.php/mdvi/article/view/3
doi 10.33820/mdvi.v45i3.3
[21] Seckin HY, Kalkan G, Bas Y. Oxidative stress status in patients with melasma, Cutan ocul toxicol. [Internet]. 2014 [cited 2019 October 16]; 33(3): 212-217. Available from:
https://www.ncbi.nlm.nih.gov/pubmed/24147944
doi:10.3109/15569527.2013.834496
AUTHORS
First Author – Puspita Sari Rambe, Post graduate of
Dermatology and Venereology, Faculty of Medicine, Universitas
Sumatera Utara, Medan, Indonesia, Email:
Second Author – Rointan Simanungkalit, Departement of
Dermatology and Venereology, Faculty of Medicine, Universitas
Sumatera Utara, Medan, Indonesia
Third Author – Ariyati Yosi, Departement of Dermatology and
Venereology, Faculty of Medicine, Universitas Sumatera Utara,
Medan, Indonesia
International Journal of Scientific and Research Publications, Volume 10, Issue 1, January 2020 322
ISSN 2250-3153
http://dx.doi.org/10.29322/IJSRP.10.01.2020.p9750 www.ijsrp.org
Correlation between Serum 25-Hydroxyvitamin D
Level with Acne Vulgaris Severity
Fitri Puspita*, Rointan Simanungkalit**, AriyatiYosi**
*Post Graduate of Dermatology and Venereology, Faculty of Medicine, Universitas Sumatera Utara, Medan, Indonesia **Departement of Dermatology and Venereology, Faculty of Medicine, Universitas Sumatera Utara, Medan, Indonesia
DOI: 10.29322/IJSRP.10.01.2020.p9750
http://dx.doi.org/10.29322/IJSRP.10.01.2020.p9750
Abstract- Introduction: Acne vulgaris (AV) is a chronic
inflammatory disease of the pilosebacceous unit characterized by
the formation of open and closed comedones, papules, pustules,
nodules and cysts. Vitamin D has an antiinflammation and
anticomedogenic effects. Correlation between vitamin D and AV
is presumed to exists only in patients with AV inflammatory
lesions.
Objective: To determine the correlation between serum 25-
hydroxyvitamin D (25(OH)D) level and AV severity.
Methods: This is is a cross-sectional analytic study,
involving 30 subject AV patients. The Saphiro Wilk test is used to
determine the normality of data distribution and the Spearman
correlation test is used to determine the correlation between serum
25(OH)D level and AV severity. The severity of AV of each
participant was classified into mild, moderate and severe based on
Indonesian Acne Expert Meeting 2015 (Lehmann, 2002
modification).
Results: The highest propotion was women (80%), age
group 17 – 25 years (83,33%), and AV with family history (80%).
The lowest serum 25(OH)D level was men 16,68 (13,01 – 70,3)
ng/mL, age group 17 -25 years 16,7 (3,61 – 98,3) ng/ mL, AV
with family history 12,74 (3,61 – 27,2) ng/mL, and severe AV
5,63(3,61 – 17,20) ng/mL, there was astrong negative correlation
between serum 25(OH)D level with AV severity (r= -0,792,
p<0,05).
Conclusion: Lower level of serum 25(OH), the severity of
acne vulgaris became an increasingly heavy.
Index Terms- acne vulgaris, 25-hydroxyvitamin D, severity,
Indonesian Acne Expert Meeting
I. INTRODUCTION
cne vulgaris (AV) is a disease of pilosebaceous unit
characterized by the formation of non-inflammation lesions
(open and closed comedones) and inflammation lesions (papules,
pustules, nodules and cysts).1-2 The term acne is derived from
Greek word “acme” which is used in the sense of skin eruption
and vulgaris indicate the meaning “common”.3 AV affects the skin
regions with the densest sebaceous follicles populations which
include face, nupper part of chst and the back.4,5
The grading of AV based on the type of lesions, affected
surface area and their severity that can help in deciding which
therapies are needed in each individual. However, no grading
system has been accepted universally.3,6 Indonesian Acne Expert
Meeting (2015), modification Lehmann (2002) is a quantitative
scoring system to assess the severity of AV. According to this
score AV was graded as mild, moderate, and severe.7
The pathogenesis of AV is multifactorial, but there is four
main pathogenesis: epidermal follicular hyperkeratinization,
increased sebum production, Propionibacterium acnes (P. acnes)
within the follicle, and inflammation.8,9
Vitamin D is a fat-soluble steroid hormone, which plays an
important role in calcium homeostasis, immune system
regulations, and cell growth and differentiation.10 Main source of
vitamin D is de novo synthesis in the skin by ultraviolet B rays of
sunlight (290-315 nm) and small proportion is obtained from
dietary source. A few in vitro studies have published data that
support the theory that vitamin D has a functional role in AV
development. Vitamin D regulates the proliferation and
differeniation of keratinocytes and sebocytes.11,12
Study in Korea (2016) reported 48,8% of patients with AV
had deficiency in serum 25(OH)D level, but only 22,5% of the
healthy control. In subsequent trial, improvement in inflammatory
lessions was notes after supplementation with vitamin D in 39 AV
patients with 25(OH) deficiency.13 Study in Egypt (2016) also
reported serum 25(OH) level in patients with AV lower than
healthy control. While study in Kuwait (2018) reported there is no
significant correlation between serum 25(OH) level with AV
severity.14
Nowaday, studies about correlation between serum
25(OH)D level and AV severity are still controversial, so we
interested to assess about the correlation between serum 25(OH)D
and AV severity.
II. METHOD
This research was conducted from September 2019 until
December 2019. It was an observational analytic study with a
cross-sectional design involving 30 patients with AV who came to
Departement of Dermatology and Venereology H. Adam Malik
General Hospital Medan. Each participant will sign an informed
consent and will undergo anamnesis, dermatological examination
and blood test for serum 25(OH)D levels. The patients were then
be categorized into 3 groups according AV severity by Indonesian
Acne Expert Meeting (2015), Lehmann (2002) modification.
Patients with polycystic ovaries, pregnant, thyroid,
parayhyroid, renal, cardiovascular, cancer, tuberculosis, diabetes
mellitus, psoriasis, sistemic lupus erythematous, scleroderma
disorders and also patients receiving drugs vitamin D supplement
A

International Journal of Scientific and Research Publications, Volume 10, Issue 1, January 2020 323
ISSN 2250-3153
http://dx.doi.org/10.29322/IJSRP.10.01.2020.p9750 www.ijsrp.org
and AV therapy (oral and topical) in last 1 months were exluded
from the study.
The Saphiro Wilk test is used to determine the normality
of data distribution and Spearman correlation test is used to
determine the correlation between serum 25(OH)D level and AV
severity
This research was carried out after obtaining permission
from the Research Ethics Commission of the Faculty of Medicine,
Universitas Sumatera Utara and a research permit from the
Directorate of Human Resources and Education of the Research
and Development Installation of H. Adam Malik General Hospital
Medan.
III. RESULTS
Patient’s characteristics
This study included 30 subjects of AV, 24 patients (80%)
were female and 6 patients (20%) were male. Most of patients
were predominantly age group 17-25 years (83,33%) and the
lowest was age group 36-45 years (6,67%). From all the subjects,
majority had family history of AV as much as 18 people (60%)
and among 30 AV patients, 10 patients (33,3%) with mild
severity, 10 patients (33,3%) with moderate severity, and 10
patients (33,33%) with severe severity. The characteristics of AV
in the study population are shown in Table 1.
Table 1. Patients characteristics
Variables Number of cases
(%)
Sex :
Male
Female
6 (20)
24 (80)
Age group (years) :
17-25
26-35
36-45
25 (83,33)
3 (10)
2 (6,67)
Family history :
Yes
None
18 (60)
12 (40)
AV severity :
mild
moderate
severe
10 (33,33)
10 (33,33)
10 (33,33)
Serum 25-Hydroxyvitamin D Level
Serum 25(OH)D levels in women 18,5 (3,61-98,3) ng/mL
was higher than men 16,68 (13,01-70,30) ng/mL. The highest
serum 25(OH)D level were age group 36-45 years 26,37 (25,84-
26,9) ng/mL, followed by age group 26-35 years 19,89 (12,48-
70,3) ng/mL, and age group 17-25 years 16,7 (3,61-98,3) ng/mL.
Based on family history, serum 25(OH)D levels was higher in AV
without family history 25,34 (14,02-98,3) ng/mL than AV with
family history 12,74 (3,61-27,2) ng/mL, the highest serum
25(OHD) levels are at mild AV which is 26,37 (14,02-98,3)
ng/mL and the lowest level at severe AV is 5,63 (3,61-17,2)
ng/mL, shown in Table 2.
Table 2. Serum 25(OH)D levels
Variables
25(OH)D levels
Median (Min-Max)
ng/mL
Sex :
Male
Female
16,68(13,01-70,30)
18,5 (3,61-98,3)
Age group (years) :
17-25
26-35
36-45
16,7 (3,61-98,3)3 (10)
19,89 (12,48-70,3)
26,37 (25,84-26,9)
Family history :
Yes
None
12,74 (3,61-27,2)
25,34 (14,02-98,3)
AV severity :
mild
moderate
severe
26,37 (14,02-98,3)
18,34 (12,48-27,2)
5,63 (3,61-17,2)
Correlation between Serum 25(OH)D Level with Acne Vulgaris
Severity
There was a significant strong negative correlation
between serum 25(OH)D serum with AV severity (p = <0.05, r =
–0.719), shown in Table 3.
Table 3. Correlation between Serum 25(OH)D levels with
acne vulgaris severity
Variable p r
25(OH)D with AV severity <0.05 –0.719
IV. DISCUSSION
AV is a chronic inflammatory disease of pilosebaceous
follicles, characterized mainly by comedones and inflammatory
lessions such as pustules, papules, nodules, cysts, andd scars.1-3
From a total of 30 patients AV in our study, the proportion of
female (80%) was higher than male (20%). It was consistent with
the study in Egypt (2017) reported that more proportion of female
(60%) than male (40%).15 Otherwise, study in South India reported
that the proportion of male (55,7%) was higher than female
(44,3%).16 This discrepancy between these studies may be due to
the difference in the number of samples. AV often heralds the
onset of puberty. In girls, the occurrence of AV may precede
menarche by more than a year.1
AV can occur at any age. The highest distribution was age
group 17-25 years (83,33%) and the lowest was age group 36-45
years (6,67%). This results were consistent with the Global
Burden Disease reported that the most psoriasis patients were age
group 12-25 years.1,17 Study in Malysia (2018) also reported that
that the most AV patients were age group 14-20 years (87,7%).18
AV prevalence hits its peak during the middle-to-late teenage
period, with more than 85% of adolescents affected, and then
steadily decreases. However, AV may persist through the third
International Journal of Scientific and Research Publications, Volume 10, Issue 1, January 2020 324
ISSN 2250-3153
http://dx.doi.org/10.29322/IJSRP.10.01.2020.p9750 www.ijsrp.org
decade or even later, particularly in women. It has been shown that
females with high DHEAS levels are predictors of severe or long-
standing AV.1,2
AV paients with family history (60%) was higher than AV
without family history (40%). It was consistent with the study in
China (2013) reported that 78% AV patients had father and
mother with AV.19 AV usually occurs early and more severe in
AV patients who had family history.1,20
According to the gender, serum 25(OH) level in female
18,5 (3,61 -98,3) ng/mL was higher than male 16,68 (13,01-70,30)
ng/mL. It was consistent with study in Denmark (2009) reported
that serum 25(OH)D level in female was higher than men. Vitamin
D Binding Protein (VDBP) in female was significant higher than
men, and it had positive correlation with total 25(OH)D.21
The highest serum 25 (OH)D level was age grup 36-45
years 26,37 (25,84-26,9) ng/mL and the lowest was ag group 17-
25 years 16,7 (3,61-98,3) ng/mL. It was consistent with study in
Denmark (2009), study of the global serum 25(OH)D status in the
general population, it was found that the lowest serum 25(OH)D
level was at an age group of ≤ 15, and the highest was at the
age group of 66-75 years, but there was no significant
relationship between the level 25(OH)D with age.21
In this study, serum 25(OH)D level in AV patients with
family history 12,74 (3,61-27,2) ng/mLwas lower that AV patients
without family history 25,34 (14,02-98,3) ng/mL. It was
inconsistent with study in Turkey (2018) reported that serum
25(OH)D level in AV patients with family history (14,21±0,5)
ng/mL was higher than AV patients without family history
(9,99±1,4) ng/mL.14
The lowest serum 25(OH)D levels was severe AV 5,63
(3,61-17,20) ng/mL and the highest serum 25(OH)D levels was
mild AV 26,37 (14,02-98,3) ng/mL. It was consistent with the
study in Egypt (2018) reported that the lowest serum 25(OH)
levels was severe AV (11,32 ± 6,45) ng/mL.15 Vitamin D has an
antiinflammation and anticomedogenic effects. The presence of P.
acnes in AV lesion leads to secretion of various inflammatory
cytokines, including Interleukin (IL)-8 and IL-12 in addition to the
recruiment of activated T helper 1 (Th1) and Th17 lymphocytes to
the site of early AV lesions.14,15,22 Vitamin D also inhibits T-cell
proliferation and suppresses the production of B- cell opsonizing
antibodies, and reduces Th17.22 The association between vitamin
D and AV is pesumed only in between vitamin D level and AV
severity in patients with inflammatory lesions.14
According to this study there was a significant strong
negative correlation between serum 25(OH)D serum with AV
severity (p = <0.05, r = –0.719). Study in Korea (2016) reported
there was a significant strong negative correlation between serum
25(OH)D serum with AV severity (p = <0.001, r = –0.512).13
Study in Iran (2015) showed there was no significant correlation
between serum 25(OH)D and AV severity (p = 0,45, r = 0.12)..23
The difference in the correlation between serum 25(OH)D levels
with severity of AV can be influenced by genetic factors, dietary
intake or vitamin D supplementation, and the length of exposure
to sunlight that varies in each individual.
V. CONCLUSIONS
The correlation between 25(OH)D serum level with AV
severity has significant negative correlation. Lower level of serum
25(OH)D, the severity of AV became an increasingly heavy.
These results may indicate that vitamin D play a potential role in
AV. Further studies are needed to determine the benefits of
vitamin D derivatives administration to AV patients, as a basis
for consideration of additional therapy in the management of AV
in health services.
VI. SUGGESTION
This research can be done with a larger sample size.
ACKNOWLEDGMENT
We thank to Putri C Elyanoer, MD.,MS., Epi., PhD. for her
guidance on research concept and statistical analyses. We are also
grateful to all staff members in Department of Dermatology and
Venereology, Medical Faculty of Universitas Sumatera Utara/H.
Adam Malik General Hospital, Medan, Indonesia for their help
and cooperation during this study.
REFERENCES
[1] Zaenglein AL, Graber EM, Thiboutot D. Acne vulgaris and acneiformis eruptions. In: Goldsmith LA, Katz Si, Gilchrest BA, Paller AS, Leffell DJ, Wolff K, editors. Fitzpatrick’s Dermatology in General Medicine. 8th ed. New York: McGraw Hill Companies; 2012. p.897-917.
[2] Layton AM, Eady EM, Zoubolis CC. Acne. In: Burns T, Breathnach S, Cox N, Griffiths C, editors. Rook’s textbook of dermatology. 9th ed. Massachusetts: Blackwell Science Ltd; 2016. p.90.1-50.
[3] Zohra FT, Sultana T, Islam S, Nasreen T. Evaluation of severity in patients of acne vulgaris by Global Acne Grading System in Bangladesh. Clinical Pathology & Research Journal. 2017; 1(1): 1-5.
[4] Suva MA, Patel AM, Sharma N, Bhattacharya C, Mangi RK. A brief review on Acne vulgaris: pathogenesis, diagnosis and treatment. Research & Reviews: Journal of Pharmacology. 2015;4(3):1-12. Avaible from: https://www.researchgate.net/publication/271072186.
[5] Raza K, Talwar V, Setia A, Katare OP. Acne: An understanding of the disease and its impact on life. International Journal of Drug Developement & Research. 2012; 4(2):14-20.
[6] Adityan B, Kumari R, Thappa DM. Scoring systems in acne vulgaris. Indian Journal of Dermatology, Venereology, and Leprology. 2009; 75(3): 323-6. DOI: 10.4103/0378-6323.51258.
[7] Wasitaatmadja SM, Arimuko A, Norawati L, Bernadette I, Legiawati L. editors. Pedoman tata laksana akne di Indonesia. 2nd ed. Jakarta: Centra communications. 2016. h.1-13
[8] Kataria U, Chillar D. Acne:Etiopathogenesis and its management. International archives of integrated medicine. 2015; 2(5): 225-31.
[9] Tan JKL, Gold LFS, Alexis AF, Harper JC. Current concepts in Acne pathogenesis: Pathways to inflamation. Seminars in Cutaneous Medicine and Surgery. 2018:37(3S):S60-2. DOI: 10.12788/j.sder.2018.024.
[10] Mostafa WZ, Hegazy RA. Vitamin D and the skin: Focus on a complex relationship: A review. Journal of Advanced Research. 2015; 6:793-804. DOI: 10.1016/j.jare.2014.01.011.
[11] Polat M, Uzun O. Vitamin D in dermatology. OA Dermatology. 2014;2(1): 1-4.
[12] Vanchinathan V, Lim HW. A Dermatologist’s Perspective on vitamin D. Mayo clin proc. 2012;87(4):372-80. DOI: 10.1016/j.mayocp.2011.12.010.
[13] Lim SK, Ha JM, Lee YH, Lee Y, Seo YJ, et al. Comparison of vitamin D levels in patients with and without acne: A case-control study combined with a randomized controlled trial . Plos One. 2016;11(8):1-11. DOI: 10.1371/journal.pone.0161162.
[14] Al-Taiar A, Al-Khabbaz M, Rahman A, Al-Sabah R, Shaban L, Akhtar S. Plasma 25-hydroxy vitamin D is not associated with acne vulgaris. Nutrients. 2018; 10:1-9. DOI: 10.3390/nu10101525.
[15] El-Hamd MA, Nada EEA, Moustafa MAK, Mahboob-Allah RA. Prevalence of acne vulgaris and its impact of the quality of life among secondary school-

International Journal of Scientific and Research Publications, Volume 10, Issue 1, January 2020 325
ISSN 2250-3153
http://dx.doi.org/10.29322/IJSRP.10.01.2020.p9750 www.ijsrp.org
aged adolescents in Sohag province, Upper Egypt. J Cosmetic Dermatology. 2017;1-4.
[16] Adityan B, Thappa DM. Profile of acne vulgaris – A hospital based study from South India. Indian J Dermatol Venereol Leprol. 2009;75:272-8.
[17] Lynn DD, Umari T, Dunnick CA, Cellavalle RP. The epidemiology of acne vulgaris in late adolescent. Adolescent Health, Medicine, and Therapeutica. 2016;7:13-25.
[18] Suppiah TSS, Sundram TKM, Tan ESS, Lee CK, Bustami NA, Tan CK. Acne vulgaris and its asociation with dietary intake: a Malaysian perspective. Asia Pac J Clin Nutr. 2018; 27(5): 1141-5.
[19] Bhate K,Williams HC. Epidemiology of acne vulgaris. British Journal of Dermatology. 2013;168: 474-85. DOI: 10.1111/bjd.12149
[20] Layton AM, Mawson RL. Adult acne. In World Clinics Dermatology, Acne. Khana N, Kuba R. Jaypee Brothers Medical Publisher LTD, New Delhi, 2013: 128-43.
[21] Hagenau T, Vest R, Gissel TN, Poulsen CS, Erlandsen M, Mosekilde L, et al. Global vitamin D levels in relation to age, gender, skin pigmentation and latitude: an ecologic meta-regression analysis. Osteoporos Int. 2009;20:133-40. DOI:10.1007/s00198-008-0626-y
[22] El-Hamd MA, El Taieb MA, Ibrahim HM, Aly SS. Vitamin D levels in acne vulgaris patients treated with oral isotretinoin. J Cosmet Dermatol. 2018: 1-5. DOI: 10.1111/jocd.12503.
[23] Tossi P, Azizian Z, Yavari H, Fakhim TH, Amini SH, Enamzade R. Serum 25-hydroxy vitamin D levels in patient with acne vulgaris and its association with disease severity. Clin Cases Miner Bone Metab. 2015; 12: 238-42. DOI: 10.11138/ccmbm/2015.12.3.238
AUTHORS
First Author – Fitri Puspita, Post graduate of Dermatology and
Venereology, Faculty of Medicine, Universitas Sumatera Utara,
Second Author – Rointan Simanungkalit, Departement of
Dermatology and Venereology, Faculty of Medicine, Universitas
Sumatera Utara.
Third Author – Ariyati Yosi, Departement of Dermatology and
Venereology, Faculty of Medicine, Universitas Sumatera Utara

International Journal of Scientific and Research Publications, Volume 10, Issue 1, January 2020 326
ISSN 2250-3153
http://dx.doi.org/10.29322/IJSRP.10.01.2020.p9751 www.ijsrp.org
Management of Recurrent Periapical Abscess with
Platelet Rich Fibrin
Maj (Dr) Deepak Sharma*, Surg Lt Cdr (Dr) Muneesh Joshi**, Lt Col (Dr) Manab Kosala**, Col (Dr) T Prasanth**
*Division of Periodontology
*Department of Dental Surgery and Oral Health sciences, *Armed Forces Medical College, Pune, Pin- 411040, India
DOI: 10.29322/IJSRP.10.01.2020.p9751
http://dx.doi.org/10.29322/IJSRP.10.01.2020.p9751
Abstract- In cases of recurrent periapical abscess occurring post
peri-apical surgery, platelet rich fibrin presents a viable alternative
to bone grafts for osseous defects. Bone grafts may act as a nidus
in cases where there is incomplete removal of granulation tissue.
It is a 2nd generation platelet concentrates, which is a natural
scaffold, derived from an autogenous preparation of concentrated
platelets from human blood. These case reports illustrate the use
of PRF in management for recurrent periapical abscess following
failed periapical surgeries with bone grafts.
Index Terms- Bone graft, Platelet derived growth factor, Platelet
rich fibrin, Recurrent periapical abscess, Periapical surgery,
Wound healing
I. INTRODUCTION
hronic periapical abscess with draining sinus develops due to
infection of necrotic pulp tissue which most of the time
heals satisfactorily after non-surgical endodontic intervention [1].
Persistent chronic periapical abscess after non-surgical endodontic
therapy requires surgical endodontics which frequently involves
apicoectomy with placement of bone grafts to fill the defect and
promote regeneration. Success of surgical endodontics with bone
grafts depends on the reduction and complete elimination of the
surrounding chronic inflammatory granulation tissue [2]. Placing
of bone grafts in recurrent chronic periapical abscess can further
act as nidus for infection and further bone loss may occur due to
persistent infection [3]. Platelet rich fibrin presents a viable
alternative in such cases. It is a 2nd generation platelet concentrate,
that serves as a natural scaffold, derived from an autogenous
preparation of concentrated platelets from human blood[4].
Leukocyte–platelet-rich fibrin (L-PRF) is a polymerized fibrin
clot that contains a high number of platelets and leukocytes[5].
Platelets perform many other important functions other than
simple homeostasis. Platelets contain important growth factors
which promote collagen production, recruitment of progenitor
cells at the injury site, initiate vascular ingrowth and induces cell
differentiation which are crucial steps in wound healing[6]. These
growth factors (GF) are released for at least 1 week [7] and up to
28 days, [8] thus serving as a bio-physiological scaffold in the
process of wound healing.
The following case report describes the management of the
chronic recurrent periapical abscess occurring post root canal
treatment and peri-apical surgery with using PRF which acts as a
source of GF at the healing site, thereby accelerating soft and hard
tissue healing[9,10].
II. CASE 1
A 17 year old female patient, reported to department of
Periodontology with chief complaint of pus release in respect to
upper left lateral incisor region since 1 year[Figure 1a] . Patient
gave a history of traumatic injury to the front teeth area three years
back and had undergone periapical surgery with bone grafts twice
in relation to 21 & 22 region followed by finally extraction of 22
six months back. On clinical examination there was pus draining
sinus with respect to missing 22. Radiographic examination
revealed ill-defined radiolucency at peri apex of 21 & 22 & sinus
tract was traced to peri apex of 21 using gutta percha [GP] cone
[Figure 1b]. Head and neck examination showed no palpable
lymph nodes. Patients vitals were normal.
Patient was diagnosed as Chronic periapical abscess with
respect to 21 & missing 22.
Management
The treatment plan consisted of removal of old gutta percha
[GP] cone and placement of calcium hydroxide dressing.
Periapical surgery was planned following remission of acute signs
and symptoms simultaneously with root canal obturation and
retrograde restoration in relation to 21.
Surgical phase - Local anaesthesia with 2% lignocaine was
administered and sulcular incision around 21 region extending to
the ridge of 22 with vertical incisions were placed. A Full-
thickness mucoperiosteal flap was raised[Figure 1c]. A large
defect was visible in the buccal cortical plate with 21 & 22, which
was widened to facilitate thorough curettage of the granulation
tissue[Figure 1d]. Root canal was obturated with gutta percha cone
and retrograde restoration using GIC in relation to 21was done.
The surgical site was irrigated with betadine and sterile saline
solution.
PRF was prepared [Figure 1e] in accordance to the
Choukroun et al (2001) protocol. Prior to the surgery, 10 ml
intravenous blood (by veni-puncture of the antecubital vein) was
drawn into a sterile tube without anticoagulant which was
centrifuged immediately in centrifugation machine at 2700
revolutions per minute for 12 minutes. PRF formed was detached
from red blood corpuscles base [keeping a small red blood cell
(RBC) layer] using a sterile tweezers & scissors. PRF clot
C
International Journal of Scientific and Research Publications, Volume 10, Issue 1, January 2020 327
ISSN 2250-3153
http://dx.doi.org/10.29322/IJSRP.10.01.2020.p9751 www.ijsrp.org
collected was left into sterile dapen dish for 10mins to release the
serum contained in it.
The degranulated bony defect was then packed with PRF
clot [Figure 1f] and wound closure was achieved using 4-0 prolene
sutures[Figure 1g] . Nonsteroidal anti-inflammatory analgesics
were prescribed. Post 72 hours of surgery the patient was
instructed to use .12% chlorhexidine mouth wash for 7days to
maintain the oral hygiene. The sutures were removed post 7 days,
and satisfactory healing was seen. On Recall visits at 3 and 6
months [Figure 1h]. follow-up radiographs showed adequate bone
regeneration in the defect [Figure1i] along with good clinical
healing.
III. CASE 2
A 44 year old male patient reported to department of
periodontology with chief complain of pus release in respect to
upper left central incisor region since nine months [Figure 2a] .
Patient gave a history of traumatic injury to the front teeth area
five years back and had undergone periapical surgery with bone
graft placement twice in relation to 21at one year and six months
back. On clinical examination there was a pus draining sinus with
respect to 21. Radiographic examination revealed ill-defined
radiolucency at peri apex of 11 [Figure 2b] & sinus tract was
traced to peri apex of 21 using gutta percha cone.
Head and neck examination showed no palpable lymph
nodes. Patients vitals were normal. Case was diagnosed as Chronic
periapical abscess with respect to 21.
IV. MANAGEMENT
The treatment plan consisted of removal of old gutta percha
[GP] cone and placement of calcium hydroxide dressing.
Periapical surgery was planned upon remission of clinical signs
simultaneously with root canal obturation and retrograde
restoration in relation to 21.
Surgical therapy- Local anaesthesia with 2% lignocaine was
administered. Sulcular incision around 21 and 22 with vertical
releasing incisions were placed and full thickness mucoperiosteal
flap [Figure 2c] was reflected. The defect [Figure 2d] in the
buccal cortical plate with respect to 21, was widened to facilitate
thorough curettage of the [Figure 2e] of the unhealthy granulation
tissue. Management of root canal-Root canal obturation with gutta
percha cone and retrograde restoration using GIC in relation to
21was done. The surgical site was irrigated with betadine and
sterile saline solution.
The PRF was prepared[Figure 2 f] as in case 1, following
the protocol developed by Choukroun et al [2001] .
The degranulated bony defect was then packed with PRF
clot [Figure 2h and wound closure was achieved using 4-0 prolene
sutures [Figure 2g] . Nonsteroidal anti-inflammatory analgesics
and chlorhexidine mouth wash was prescribed for a week. The
sutures were removed post 7 days, and satisfactory healing was
seen. On Recall visits at 3 and 6 months [Figure 2i] follow-up
radiographs showed adequate bone regeneration in the defect
[Figure 2j and k] and good clinical healing.
V. DISCUSSION
Periapical lesions are inflammatory reactions evoked due to
irritants from infected root canal into the peri-radicular tissue.
Depending upon the nature and quantity of irritants, duration of
exposure, the lesion varies from simple periodontitis to
granulomas, cysts or abscess. When nonsurgical root canal therapy
fails to remove the lesion then surgery is the last option by which
lesion is removed followed by placement of suitable bone graft
substitute.
However, in cases of recurrent periapical abscess, which
occur post peri apical surgery, bone graft may act as a nidus in
cases with incomplete/difficult removal of granulation tissue.
The present case reports evaluated the clinical effectiveness
of PRF in the management of recurrent periapical abscess post peri
apical surgery.
PRF is a biological matrix of autogenous fibrin, rich in
platelet and leukocyte cytokines. PRF provides the subsequent
four advantages: First, the fibrin clot plays a mechanical role, by
maintaining and protecting the site from epithelium invagination.
Second, this fibrin network accelerates cellular migration of
progenitor cells, particularly endothelial cells needed for the neo-
angiogenesis (11) and vascularization. Third, the platelet growth
factors (PDGF, TGF- α, IGF-1) which are slowly released as the
physiological fibrin matrix resorbs, thus creating a perpetual
healing process(12). Lastly cytokines and leukocytes in the fibrin
network may have a important role in the regulation of infectious
and inflammatory phenomenon(13).
VI. CONCLUSIONS
PRF is efficacious clinically and radiographically in the
treatment of recurrent periapical abscess following peri apical
surgery where bone graft substitute used may act as a nidus. PRF
is an autologous preparation which is clinically effective and
economical than any other available regenerative materials.
Although the role of growth factors, ideal ratio of the components
and the exact mechanisms, are still being investigated, and more
clinical research with long-term results are needed. PRF will
definitely revolutionize the surgical dentistry with its clinical
efficacy.
Appendices
Appendix 1: Case 1-Fig 1a,1b, 1c, 1d, 1e, 1f, 1g, 1h,1i
Appendix 2 : Case 2-Fig 2a, 2b, 2c, 2d, 2e, 2f, 2g, 2h, 2i
REFERENCES
[1] Abramovitz I, Better H, Shacham A, Shalomi B, Metzger Z. Case Selection for apical surgery: A retrospective evaluation of associated factors and rational. J endod 2002;28:527–30.
[2] Siqueira et al. Endodontic infections: concepts, paradigms, and perspectives. Oral sur oral med oral Pathol radiol Endod 2002;94:281-293.
[3] Stassen LF, Hilsop WS, Still DM, Moos KF. Use of anorganic bone in periapical defects following apical surgery-a prospective trial. Br J Oral Maxillofac Surg 1994;32:83-5.
[4] Anantula K, Annareddy A. Platelet-rich fibrin (PRF) as an autologous biomaterial after an endodontic surgery: Case reports. J NTR Univ Health Sci 2016;5:49-54.
[5] Choukroun J, Adda F, Schoeffler C, Vervelle A. Une opportunite en paro-implantologie: le PRF. Implantodontie 2000;42:55-62.

International Journal of Scientific and Research Publications, Volume 10, Issue 1, January 2020 328
ISSN 2250-3153
http://dx.doi.org/10.29322/IJSRP.10.01.2020.p9751 www.ijsrp.org
[6] Dohan DM, Choukroun J, Diss A, Dohan SL, Dohan AJ, Mouhyi J, et al. Platelet-rich fibrin (PRF): A second generation platelet concentrate-part I: Technological concept and evolution. Oral Surg Oral Med Oral Path Oral Radiol Endod 2006;101:E37-44.
[7] Dohan DM, Choukroun J, Diss A, Dohan SL, Dohan AJ, Mouhyi J, et al. Platelet-rich fibrin (PRF): A second-generation platelet concentrate- part II: Platelet-related biologic features. Oral Surg Oral Med Oral Pathol Oral RadiolEndod 2006;101:E45-50.
[8] He L, Lin Y, Hu X, Zhang Y, Wu H. A comparative study of platelet-rich fibrin (PRF) and platelet-rich plasma (PRP) on the effect of proliferation and differentiation of rat osteoblasts in vitro. Oral Surg Oral Med Oral Pathol Oral Radiol Endod 2009;108:707-13.
[9] Choukroun J, Diss A, Simonpieri A, Girard MO, Schoeffler C, Dohan SL, et al. Platelet-rich fibrin (PRF): A second generation platelet concentrate-part V: Histologic evaluations of PRF effects on bone allograft maturation in sinus lift. Oral Surg Oral Med Oral Pathol Oral Radiol Endod 2006;101:E299-303.
[10] Gaßling VL, Açil,Y, Springer IN, Hubert N, Wiltfang J. Platelet-rich Plasma and Platelet-rich fibrin in human cell culture. Oral Surg Oral Med Oral Pathol Oral Radiol Endod 2009;108:48-55.
[11] Lind M. Growth factor stimulation of bone healing. Effects on osteoblasts, osteomies, and implants fixation. Acta Orthop Scand Suppl 1998;283:2-37.
[12] Dohan Ehrenfest DM, Diss A, Odin G, Doglioli P, Hippolyte MP, Charrier JB. In vitro effects of Choukroun’s PRF (platelet-rich fibrin) on human gingival fibroblasts, dermal pre-keratinocytes, pre-adipocytes, and maxillofacial osteoblasts in primary cultures. Oral Surg Oral Med Oral Pathol Oral Radiol Endod 2009;108:341-52.
AUTHORS
First Author- Maj (Dr) Deepak Sharma, Resident
Periodontology , Armed Forces medical college, Pune.
Second author- Surg Lt Cdr (Dr) Muneesh Joshi, Resident
Periodontology, Armed Forces medical college, Pune.
Third Author- Lt Col Manab Kosala, Professor
[Periodontology], Armed Forces medical college, Pune.
Fourth Author- Col T Prasanth, Associate Professor
[Periodontology] , Armed forces medical college, Pune.
Correspondence Author- Maj (Dr) Deepak Sharma, Resident
Periodontology , Armed Forces medical college, Pune.
[email protected], Mobile no - 8192883596

International Journal of Scientific and Research Publications, Volume 7, Issue 8, August 2017 329
ISSN 2250-3153
www.ijsrp.org

International Journal of Scientific and Research Publications, Volume 7, Issue 8, August 2017 330
ISSN 2250-3153
www.ijsrp.org

International Journal of Scientific and Research Publications, Volume 7, Issue 8, August 2017 331
ISSN 2250-3153
www.ijsrp.org

International Journal of Scientific and Research Publications, Volume 7, Issue 8, August 2017 332
ISSN 2250-3153
www.ijsrp.org
International Journal of Scientific and Research Publications, Volume 10, Issue 1, January 2020 333
ISSN 2250-3153
http://dx.doi.org/10.29322/IJSRP.10.01.2020.p9752 www.ijsrp.org
Investigating Gender Disparity between Female and
Male Heads of Department (Infant) in Primary Schools
in Botswana: The Perspectives of Primary Deputy School
Heads
Grace T. Seetso *, Kefilwe J. P. Batsalelwang**, Philip Bulawa***, Shirley Kekana****
* Master of Education (Early Childhood Education), University of Botswana
** Master of Education (Gender), University of Botswana *** Doctor of Philosophy (PhD), University of Botswana
**** Master of Education (Music), University of Botswana
DOI: 10.29322/IJSRP.10.01.2020.p9752
http://dx.doi.org/10.29322/IJSRP.10.01.2020.p9752
Abstract- There are over seven hundred government primary
schools in Botswana. In these schools, one of the managerial posts
is Head of Department (Infant), for which the incumbents are
responsible for supervising lower classes, of young children
between five and eight years old. Despite the fact that these
promotional positions are advertised for all qualifying teachers in
the country, both female and male, the position is dominated by
females. This is despite the definition by International Labour
Office (2000) that gender equity means fairness of treatment for
women and men including treatment of opportunities. It is in this
regard that this research sought the views of both female and male
primary deputy school heads in their final year of an
undergraduate degree why the position of HOD (Infant) is
dominated by females. Data were collected through participants’
responses to a semi-structured questionnaire and analysed using a
thematic approach. Consistent with the literature, the findings
revealed a range of reasons including traditional perceptions about
the role of women in child upbringing, as to why the position is
dominated by women, with an insignificant number of men
holding the position.
Index Terms- Head of department Infant, Deputy School Head,
Early Childhood Education, Gender disparity.
I. BACKGROUND
nder representation of men in Early Childhood Education
(ECE) has become a topical issue for debate internationally
(Yang, 2013). The literature on ECE shows that it is traditionally
a profession mainly dominated by women. There is evidence of
such under representation in different countries such as Canada
with male teachers representing 3.4% of the ECE teachers, and 2%
each in both New Zealand and USA. For the rest of Europe the
representation is rated at 1.5%, except for Denmark and Norway
with 7.6% and 11% respectively (Besnard & Letarte, 2017).
Africa is not an exception as the percentage of the male
teachers in early childhood education is also very low in
comparison to female counterparts. For instance, a study on
gender divides in Early Childhood teacher education in South
Africa reveals low representation of men in ECE (Mashiya, Kok,
Luthuli, Xulu & Mtshali, 2016).
Different reasons have been advanced in the literature,
which include cultural factors and the role of women in
childrearing. One stereotype classification is that of “women as
more suited to raising children and thus teaching in the early
grades” (Petersen, 2014, p. 3). Others describe the role of ECE
teachers as that of ‘nannies’ and ‘caregivers,’ mainly associated
with society’s stereotypes of ECE as a woman’s role and not that
of a man (Petersen & Petker, 2011). In light of this over
representation of women in ECE, this study sought the views of
female and male deputy school heads regarding disparity between
women and man holding the position of Head of Department
(Infant) in primary schools in Botswana.
II. PURPOSE OF STUDY
To explore participants’ views about the disparity between
men and women in the position of Head of Department (Infant) in
primary schools in Botswana
III. RESEARCH QUESTIONS
What are participants’ views about disparity of men and
women in the position of Head of Department (Infant)?
What do the participants perceive as the duties of HOD
(Infant)?
IV. METHOD
Participants were thirty-nine deputy primary school heads
in their final year undergraduate degree of Bachelor of
Educational Leadership and Management (BELM). It was
important to seekt the views of this group because as heads of
academic they worked very closely with HODs (Infant) in a broad
range of curriculum matters, including school-based professional
development. Questionnaires were issued to all the thirty-nine
U
International Journal of Scientific and Research Publications, Volume 10, Issue 1, January 2020 334
ISSN 2250-3153
http://dx.doi.org/10.29322/IJSRP.10.01.2020.p9752 www.ijsrp.org
participants who comprised twenty-three female deputy school
heads and sixteen male deputies. Only six of the female deputies
were previously Heads of Department (Infant), while none of their
male deputy school heads held this position. Thirty-eight
participants completed and returned the questionnaire with only
one not returned.
V. THEORETICAL FRAMEWORK
This study is guided by the theory proposed by Acker called
Theory of Gendered Organizations (Acker, 1990, 1992). Basing
on the idea that gender is socially constructed, Acker (1990)
observed that organizations as part of the society are gendered
meaning that norms and practices defining men and women
stereotypical persist (Mastracci & Arreol, 2016). In addition,
Britton, (2000) advance that gendered organizations implies that
they are “ defined, conceptualized and structured in terms of a
distinction between masculinity and femininity and will thus
inevitably reproduce gendered differences,”( p.419). Thus, the
extent to which ‘gendered characteristics are valued and evaluated
in turn results in inequalities.The theory of gendered organization
first mentioned by Kanter (1977, 2007) was used to interpret
inequalities between women and men in the work places. These
inequalities that include women’s lack of advancement were
attributed to be resulting on the hierarchical situation of women in
society and organizations. According to Mastracci and Arreol,
(2016) Acker revolutionized Kanter’s thought, by observing that
“rules and rituals internal to the organization produce and
reproduce disparities between women and men” (p, 137). In
addition based on the gendered societal norms about traditional
divisions of labour, Acker (2006) argues that such norms continue
to be seen in occupational fields and organizations as dictating
who gets hired, promoted, and rewarded in the workplace.
The theory of gendered organizations is relevant in this
study as Early childhood Education is generally a gendered field.
Traditionally child care, care work and nurturing are associated
with women and therefore are a female’s domain. Studies describe
gendered occupational fields as those fields with a significant
skew to the gender distribution of the employees (Kanter, 1977;
Kessler & McKenna, 1978; Sargent, 2005). According to Sargent
(2005) the work in such fields is “typically imbued with gendered
meanings and defined in gendered terms” (p. 251).
Low representation of males in early childhood education
has generally been observed internationally (Peeters, 2007;
Sargent, 2005; Yang, 2013). Studies that have paid attention to
low representation of males in ECE argue that the field is
considered as an extension of baby care which traditionally a
woman’s role. This role is considered as work that women do
naturally and intrinsically better (Peeters, 2007). Peeters (2007)
examined what could be done to increase the employment of men
in ECE. The findings revealed that the role of males in ECE in
Europe is still undervalued by society hence the work is less
inspiring to men.
In another study by Peeters (2007) an observation made
about the low persisting gender disparity in ECE occupation is that
the work is lowly paid and is still highly associated with women.
For instance, when women consider taking up male dominated
jobs, it is mostly because the occupations have a high pay and have
opportunities for advancement. Peeters (2007) argues that men
who take up ECE jobs would therefore be sacrificing in terms of
pay and status. Furthermore, are the potential reservations about
their masculinity and suitability for the job. As noted by Sargent
(2005), in some instances, when men break the social taboo and
do child care work, they implicitly attract negative labels such as
feminine, homosexuals or pedophiles. In addition, Sargent,
(2005) indicate that Early childhood Education is therefore viewed
a feminine job, or ‘framed through the metaphor of motherhood,
as such men cannot fit this metaphor while simultaneously living
up to expectations of hegemonic masculinity and fatherhood’(p.
255).
VI. LITERATURE REVIEW
Nurturing children is viewed as naturally a women’s job
(Sargent, 2005). Female predominance in teaching is a global
phenomenon (OECDE, 2005), with percentage of women highest
at level of ECE (Drudy, 2008). Evidence of this is the 2010/2011
statistics on Kindergarten in Hong Kong that revealed that there
were only 126 male teachers and 10,328 females in ECE
(Education Bureau, 2012). Such gender imbalances in teaching are
a major concern for governments in many countries (OECDE,
2005).
A study by Ho and Lam (2014) in China reveal societal
divergent views whether kindergartens should also employ male
teachers, with others maintaining that taking care of young
children is only suitable for females, as it relates to a mother's role.
The same study shows that some in Chinese society believe that
naturally, men are breadwinners while women are homemakers.
This saying has been deeply rooted in societies where men play a
dominant role in many aspects of life. It would seem that culture
plays a major role in defining masculinity and femininity in a
social context.
Sumsion (2000) argues that where there has been lack of
male teachers as role models, boys tend to be weak and timid with
some of them showing the tendency of being feminine. The
implication is that male role models are important for the
personality of children. Mac Naughton and Newman (2001)
therefore make a case for the need for male participation in ECE.
They suggest males’ involvement in ECE not only to provide
children with role models but also to cultivate the modern concept
of gender roles. According to Yang (2013), with active
participation of male teachers, children not only get to fulfil the
need for physical exercise but also the need for psychological
development.
The literature on ECE provides possible perspectives
regarding potential initiatives to attract more males to early
childhood education. Some point out that lack of men is a result of
inappropriate career guidance and information, as well as societal
prejudice and narrow-minded perceptions that early childhood
education is a female profession and men are not able to care for
young children. This leads men to think that they are not
welcomed to ECE and that entry into the profession will be
difficult for them (Rentzou & Ziganitidou, 2009). Therefore, to
overcome male teachers’ low participation in ECE, changes are
required in deeply rooted institutional and management practices.
This would entail among other things, the provision of better
career prospects and some improvement in the professional status
of kindergarten teachers (Ho & Lam, 2014). Other suggestions
International Journal of Scientific and Research Publications, Volume 10, Issue 1, January 2020 335
ISSN 2250-3153
http://dx.doi.org/10.29322/IJSRP.10.01.2020.p9752 www.ijsrp.org
aimed at attracting men include incentive grants to ECE services,
provision of scholarships, and effective use of media campaigns
(Farquhar, 2012; Yang, 2013).
VII. RESEARCH FINDINGS AND DISCUSSION
The findings answered all the three research questions and
captured participants’ views which were in three categories. These
were the perspectives of female and male deputy school heads
without any previous experience as HoD (Infant), and female
deputy heads with previous experience as HoD (Infant).
Disparity between female and male Heads of
Department (Infant): The perceptions of female and male
primary deputy school heads
Divergent perspectives were given to justify why the
position of head of department attracted mainly women and few
men. All deputy school heads were aware that the position of head
of department (Infant) was mainly held by women, with all of
them indicating that they came from schools where no man held
this position. As noted by Yang (2013), under representation of
men in early childhood education has also become an issue of
concern in Botswana. They also unanimously agreed that
advertisements for the post were not gender biased as they were
open to all members of the teaching staff.
Participants indicated that, the overall role of HoD (Infant)
is to supervise early childhood education classes, and that as part
of their responsibility they organized “Breakthrough” workshops
for all infant teachers, including newly appointed one. They are
also expected to teach infant classes and help infant class teachers
whenever they encountered difficulties.
Female deputy school heads’ views about potential causes of
the disparity
Female primary deputy school heads advanced divergent
views regarding the dominance of women in the position of head
of department (Infant). Their perceptions were mainly on account
of the traditional role of women in respect of children upbringing
in comparison to men. For instance, one participant stated:
“Women are too close to young learners. They can easily handle
young ones as compared to men. Women are more patient with
children.” Another one maintained: “Mostly women are more
close to children than men. They are easily able to connect with
mothers. Children feel more comfortable with women than men.”
Participants’ comments are consistent with Peeters (2007) view of
the women’s role being traditionally perceived as an extension of
baby care
There were other comments which were raised with
specific reference to children learning such as: “Men believe that
they are the best in upper classes. So normally they believe that
women are better when dealing with young learners. “Similar
statements were made as follows: “Most women know how to
handle small children in comparison to men and that is why most
of them teach lower classes.” “Most of the women train for early
childhood methods of teaching. Lady teachers can stand the mess
of young learners.” The literature also reveals high percentages of
women teachers at infant level in different countries (Besnard &
Letarte, 2017). Women were also painted as people who are more
loving as compared to their male counterparts. One participant
pointed out that, “females have motherly love and know how to
handle infants,” while another one argued that, “women by nature
have the zeal and motherly love of dealing with children.”
Perspectives of female primary deputy school heads with
previous experience as HoD (Infant)
The views of female primary deputy school heads with
previous experience as HoD (Infant) were also sought, and they
also gave different possible reasons. However their views
regarding this trend did not differ much from those articulated by
deputies with no experience of heading department at infant level.
The traditional perceptions of linking child upbringing also
emerged strongly, with strong sentiments that suggested that the
tender age of children growth, is traditionally mainly a
responsibility of women. One participant argued that , “there is a
believe that ladies have an upper hand in handling children and
children have fear towards men,” while another indicated that
“women are the ones who raise kids from a tender age, so they are
very close to the hearts of infants.”
Further emphasising the sentimental relationship that
makes women want to work with children, some participants
described women as “motherly to young children” and that “they
have love and care for young ones.” They argued that it is against
this background “that women usually teach lower standards than
men, and men usually teach upper classes.” Men were described
as “not as patient as women when it comes to nurturing of
children” and that “the post is more entitled for taking care of
young ones and that is why men feel they cannot afford to do that.”
“The bottom line” according to one participant is that “women are
able to cope with situations at lower classes.” These stereotypes
by participants about the role of women are also revealed in the
literature (Petersen & Petker, 2011).
Male deputy school heads perspectives about women’s
dominance of the position of HoD (Infant)
Male deputies also expressed views about the dominance
of the position of HoD (Infant) by females. They expressed similar
sentiments to those of their female counterparts. This includes
strong perceptions about the traditional role of women in the
development of the child as represented by the comment that,
“females understand child development much better than males
because it’s an inborn skill.” Another commented that, “this may
be by virtue of females being child bearers by nature and have the
skills of child caring as compared to males.” They also credit
women for love towards children which makes them perfect
candidates for the position of HoD (Infant) in comparison to men.
One of the participants who held this view said; “They have the
patience and love to deal with young ones. They love to teach
lower classes which make it easier for them to be recommended
for the post.”
Qualities of women’s as more caring and loving compared
to men are implied in the following participant’s comments: “HoD
Infant posts attract more women because at primary school infant
classes that is, standard 1 to 3 are mostly taught by women.
Women can handle small children than men and the department
ends up being dominated by women, hence they are better
qualified for the post of HoD Infant.” There was one participant
whose comments seemed to undermine the intellectual capacity of
women to teach higher classes as reflected thus; “Females like
lower classes. The content is much easier to handle so women do
International Journal of Scientific and Research Publications, Volume 10, Issue 1, January 2020 336
ISSN 2250-3153
http://dx.doi.org/10.29322/IJSRP.10.01.2020.p9752 www.ijsrp.org
not always go for challenging material. They think children like
them because they equate them to their mothers.” The men express
mainly traditional perceptions about the role women in society
(Peeters, 2007; Petersen & Petker, 2011).
What can be done to attract more men to the post
Participants considered the role of men in early childhood
education as very significant. This is also strongly recommended
in the literature (Mac Naughton & Newman, 2001). When
participants’ views were sought regarding potential initiatives to
attract men to the position of head of department (Infant), they
gave divergent responses. Female deputies’ suggestions included,
training, introduction of an allowance and targeted advertisement.
Several comments were captured that represented views on
training. For instance, one participant commented: “Train them on
handling infant classes.” Another one stated: “Develop them
through seminars, showing they them that can do the job despite
their sex.”
Those who were for some incentives to attract men to apply
for the post made such comments as: “Attach an incentive for
teaching infant classes,” and “Attach allowances to the post.” The
literature also makes reference to high paying jobs that attract men
in comparison to low pay in early childhood education (Peeters,
2007). There was a participant who pointed out that, “once in a
while the advertisement of the post should be specifically for men
only.” It was also suggested that men should be assured that
teacher aides will be provided “to help with nursing of the
children.”
The views of male deputy school heads bore similarities to
those of their female counterparts. They emphasised the need for
training to help men appreciate that they can also handle infants
and that handling children at any level was a responsibility of all
regardless of gender. Comments such as “suitable training even at
social gatherings levels to expose men to dealing with infants,”
and “specific training for men is needed during teacher preparation
programme,” capture men’s views about training. There were
other male participants who also commented about the need for
the introduction of incentives. This category of participants
associated handling of infants with extra work that required them
to be for such extra burden, with one stating that, “incentives such
as allowance should be introduced to cater for extra work” while
another one called such responsibility “extra job that calls for
government to pay more.” It is expected that with such
interventions more men could be motivated to apply for the post
of HoD (Infant), and as emphasised in the literature, and become
role models for children (Sumsion, 2000)
VIII. CONCLUSION
The findings show that previous advertisements for the
position of head of department (Infant) was not gender biased and
that participants were aware that the position was mainly
dominated by women. Participants advanced different reasons
why women mainly held the position in comparison to man, and
most of such reasons were based on traditionally held perceptions
in society regarding women’s role in child development.
REFERENCES
[1] Acker, J. (1990). Hierachies, jobs, bodies: A theory of gendered organizations. Gender & Society,4,139-158
[2] Acker, J. (1992). Gendering organizational theory.In A.J. Mills & P.Tancred(Eds.) Gendering organizational analysis(pp.248-260). Newbury, CA:Sage
[3] Besnard T. & Letarte, M.J. 2017. Effects of male and female early childhood teacher’s educational practices on childrens social adaptation. Journal of Research in Early Childhood. 31(3), 453-464.
[4] Cole, K.., Plaisir, J., Reich-Shapiro, M. & Freitas, A. (2019) Building a Gender-Balanced Workforce: Supporting Male Teacher Young Children 74 (4)
[5] Drudy, S. 2008. Gender balance/ gender bias: the teaching profession and the impact of feminisation. Gender and Education. 20 (4), 309-323.
[6] Farqhar, S. ( 2012) Time for men to be invited into early childhood teaching: The finding of a national survey on early childhood education services and teacher educators: Retrieved ..childforum.com
[7] Ho, D. & Lam, H. (2014) A study of male participation in early childhood education: Perspectives of school stakeholders, International Journal of Educational Management, Vol. 28 No. 5, pp. 498-509 DOI: https://doi.org/10.1108/IJEM-02-2013-0024
[8] Kanter, R.M (1977) Men and Women of the corporation. New York: Basic Books
https://www.emerald.com/insight/content/doi/10.1108/IJEM-02-2013-0024/full/html
[9] Kelly (2016)The influence of male practitioners in childcare settings. Early Years Careers.
http://www.earlyyearscareers.com/eyc/wpcontent/uploads/2016/03/PTDC0585.jpg
[10] Mastracci, S. & Arreola, V. (2016) Gendered Organizations: How Human Resource management Practices Produce and Reproduce Administrative Man. Journal of Administrative Theory & Praxis 38:2, 2016 Pp 137-149. Taylor & Francis
[11] MacNaughton, G. and Newman, B. 2001. “Masculinities and men in early childhood: Reconceptualising our theory and our practice”. In The anti‐bias approach in early childhood, 2nd ed., Edited by: Dau, E. 145–157. Frenchs Forest, NSW: Pearson Education.
[12] Mashiya, Kok, Luthuli, Xulu & Mtshali, (2015). Foregrounding the Gender Divides in Early Childhood Teacher Education: A case of South Africa Journal of Social Sciences, 42(3): 259-265 Kamla-Raj
[13] Peeters, J. (2007). Including Men in Early Childhood Education: Insights from the European Experience. NZ Research in Early Childhood Education, Vol. 10.
[14] Petersen, N. & Petker, G. 2011. Foundation phase as a career choice: Building the nation where it is needed. Education as Change. 15 (1), S49-S61.
[15] Rentzou, K. & Ziganitidou, K. (2009). Greek Male Early Childhood Educators: Self And Societal Perceptions Towards Their Chosen Profession Early Years. An International Journal of Research, Taylor& Francis, 29 (3) 271–279
[16] Sargent, P. 2005. The Gendering of men in early childhood education. Sex Roles 52 (3/4), 251-259.
[17] Sumsion, J. 2000. Negotiating Otherness: A male early childhood educator’s gender positioning. International Journal of Early Years Education. 8 (2), 129-140.
[18] Wang, V. C. X., Bain, B., Hope, J. & Hansman, K. (2017) Addressing and Managing conflicts within Organisations Educational Leadership and Organisational Management: Linking Theories to Practice.
[19] Yang, J. 2013 Gender balance in early childhood education: Reasons for the lack of male involvement, encouraging men into early childhood teaching, and the impact on children, females, colleagues and the early childhood sector. He Kupu (Practitioner researcher pp.5-11)

International Journal of Scientific and Research Publications, Volume 10, Issue 1, January 2020 337
ISSN 2250-3153
http://dx.doi.org/10.29322/IJSRP.10.01.2020.p9752 www.ijsrp.org
AUTHORS
First Author – Grace T. Seetso; Master of Education (Early
Childhood Education) ([email protected]), University
of Botswana
Second Author – Kefilwe J. P. Batsalelwang; Master of
Education (Gender) ([email protected]),
University of Botswana
Third Author – Philip Bulawa; Doctor of Philosophy (PhD)
[email protected]), University of Botswana
Fourth Author – Shirley Kekana; Master of Education (Music)
([email protected]), University of Botswana
International Journal of Scientific and Research Publications, Volume 10, Issue 1, January 2020
ISSN 2250-3153
http://dx.doi.org/10.29322/IJSRP.10.01.2020.p9753 www.ijsrp.org
C.L.I. Fonseka*, L.S Erandika**, S.Sotheeswaran
Department of Information and System Engineering, UCSC, Sri Lanka **Department of Information and System Engineering, UCSC, Sri Lanka
** Department of Mathematics, at Eastern University, Sri Lanka
DOI: 10.29322/IJSRP.10.01.2020.p9753
http://dx.doi.org/10.29322/IJSRP.10.01.2020.p9753
Abstract - Facial expression analysis plays a considerable role
in under human emotions and behaviours. Analysing facial
expressions accurately has board application areas like human
behavior analysis, human-human interaction and
human-computer interaction. Automatic identifying of smile
or non-smile from images has been a challenging and actively
studied problem over the past few decades. Since it has many
uses like patient observation, camera photo capturing and
more. In this research work the smile and non-smile face
images classifies through the proposed system which involves
the following steps: First, extract the scale-invariant feature
transform (SIFT) or speeded-up robust features (SURF)
features, then construct the codebook which provides a way to
map the descriptors into a fixed-length vector in histogram
space. Second, extract the histograms of oriented gradient
(HOG) features and Local Binary Pattern (LBP). Third,
combine the extracted features and reduce the dimensionality.
Finally, the binary-class classify the feature histograms using
support vector machines (SVMs). The proposed system focus
on detecting smiles from face images that contain either a
smile or a non-smile efficiently with highest accuracy by
reducing computational needs such as computational time,
memory, and disk space.
Index Terms - Smile detection, feature fusion, Support
Vector Machine, Local Binary Patterns, classifier, Extract
Features,
I. INTRODUCTION
mile is the most common facial movement that appears on
the face. Smile detection can be used to measure the
person’s mental state. Smile detection has many applications
such as intensive care system, resistance training, and
interactive systems. Nowadays, research attention has started
to toward the more realistic problem of analysing of facial
expressions. It seems very difficult to capture the complex
decision boundary among facial expressions. When automatic
recognition of emotion became feasible, novel challenges has
evolved. One of them is the recognition whether a presented
emotion is genuine or not. Many face detection methods are
already developed and used in many applications. Most of
these works focused on object based techniques, in which the
facial expressions are identified using facial action coding
system (FACS).
In this research, a novel approach will be proposed to
identifying the simile and non-smile faces by considering eye
state. The novel approach focuses the feature fusion and
Bag-of-features (BoF) approach with dimensionality
reduction which is to be enhanced the classification accuracy
and reduce the time complexity and storage spaces.
The bag-of-features is the most popular approach in recent
visual object recognition which makes use of local
information extracted at several patches in an image. This
BoF approach has proved to yield state-of-the-art
performance in large evaluations such as the PASCAL Visual
Object Classes and ImageNet Challenges. The general
framework of a BoF approach can be summarised in the
following four steps: (i) feature extraction from images (ii)
cluster analysis on the extracted descriptors from training
images (iii) BoF representation of training and testing image
sets and (iv) classification of test feature vectors.
The rest of this paper is organised as follows. In Section 2,
summarise different techniques that are closely related to
smile detection. Section 3 provides the comparison of the
previous results. In Section 4, the proposed technique for
classifying smile faces is described in detail. Section 5
concludes the paper with a discussion of the findings towards
future extensions.
II. LITERATURE REVIEW
A. Smile Detection using Local Binary Patterns and
Support Vector Machines
In this paper [1], the authors have proposed an approach for
smile detection using Local Binary Pattern (LBP) and
Support Vector Machine (SVM). Different LBPs were used
as main image descriptors for smile detection. Simplified
LBP (SLBP) and Uniform LBP (ULBP) were used to reduce
the length of the feature vector.
Rotation invariance is achieved in the LBP based
representation considering the local binary pattern as circular.
The author has used PCA for reduce the dimension and also
k-nearest neighbor’s algorithm (k-NN) and SVM were used
for classification. The best results came from the following
approaches: LBP operator is applied to derive features.
Two different approaches (SLBP/ULBP) were used to
obtain PCA space as a result of the original grayscale
An Unconventional Framework for Smile
Detection using Eye States
S
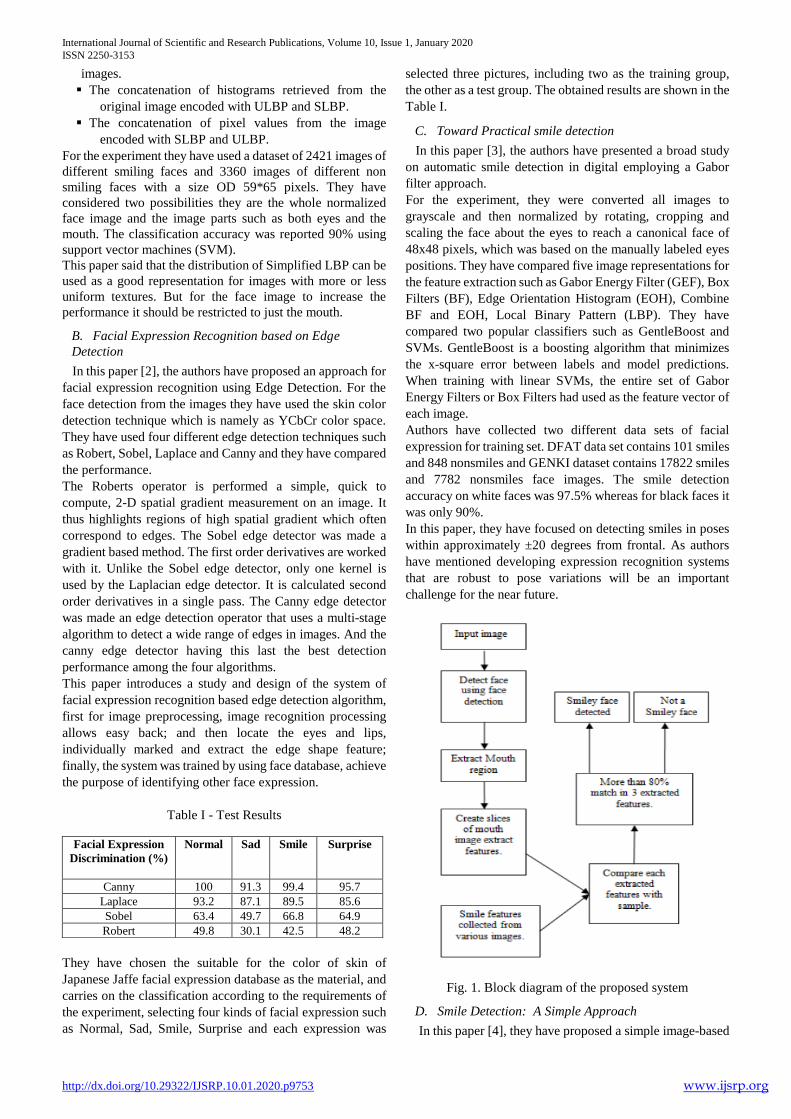
International Journal of Scientific and Research Publications, Volume 10, Issue 1, January 2020
ISSN 2250-3153
http://dx.doi.org/10.29322/IJSRP.10.01.2020.p9753 www.ijsrp.org
images.
The concatenation of histograms retrieved from the
original image encoded with ULBP and SLBP.
The concatenation of pixel values from the image
encoded with SLBP and ULBP.
For the experiment they have used a dataset of 2421 images of
different smiling faces and 3360 images of different non
smiling faces with a size OD 59*65 pixels. They have
considered two possibilities they are the whole normalized
face image and the image parts such as both eyes and the
mouth. The classification accuracy was reported 90% using
support vector machines (SVM).
This paper said that the distribution of Simplified LBP can be
used as a good representation for images with more or less
uniform textures. But for the face image to increase the
performance it should be restricted to just the mouth.
B. Facial Expression Recognition based on Edge
Detection
In this paper [2], the authors have proposed an approach for
facial expression recognition using Edge Detection. For the
face detection from the images they have used the skin color
detection technique which is namely as YCbCr color space.
They have used four different edge detection techniques such
as Robert, Sobel, Laplace and Canny and they have compared
the performance.
The Roberts operator is performed a simple, quick to
compute, 2-D spatial gradient measurement on an image. It
thus highlights regions of high spatial gradient which often
correspond to edges. The Sobel edge detector was made a
gradient based method. The first order derivatives are worked
with it. Unlike the Sobel edge detector, only one kernel is
used by the Laplacian edge detector. It is calculated second
order derivatives in a single pass. The Canny edge detector
was made an edge detection operator that uses a multi-stage
algorithm to detect a wide range of edges in images. And the
canny edge detector having this last the best detection
performance among the four algorithms.
This paper introduces a study and design of the system of
facial expression recognition based edge detection algorithm,
first for image preprocessing, image recognition processing
allows easy back; and then locate the eyes and lips,
individually marked and extract the edge shape feature;
finally, the system was trained by using face database, achieve
the purpose of identifying other face expression.
Table I - Test Results
They have chosen the suitable for the color of skin of
Japanese Jaffe facial expression database as the material, and
carries on the classification according to the requirements of
the experiment, selecting four kinds of facial expression such
as Normal, Sad, Smile, Surprise and each expression was
selected three pictures, including two as the training group,
the other as a test group. The obtained results are shown in the
Table I.
C. Toward Practical smile detection
In this paper [3], the authors have presented a broad study
on automatic smile detection in digital employing a Gabor
filter approach.
For the experiment, they were converted all images to
grayscale and then normalized by rotating, cropping and
scaling the face about the eyes to reach a canonical face of
48x48 pixels, which was based on the manually labeled eyes
positions. They have compared five image representations for
the feature extraction such as Gabor Energy Filter (GEF), Box
Filters (BF), Edge Orientation Histogram (EOH), Combine
BF and EOH, Local Binary Pattern (LBP). They have
compared two popular classifiers such as GentleBoost and
SVMs. GentleBoost is a boosting algorithm that minimizes
the x-square error between labels and model predictions.
When training with linear SVMs, the entire set of Gabor
Energy Filters or Box Filters had used as the feature vector of
each image.
Authors have collected two different data sets of facial
expression for training set. DFAT data set contains 101 smiles
and 848 nonsmiles and GENKI dataset contains 17822 smiles
and 7782 nonsmiles face images. The smile detection
accuracy on white faces was 97.5% whereas for black faces it
was only 90%.
In this paper, they have focused on detecting smiles in poses
within approximately ±20 degrees from frontal. As authors
have mentioned developing expression recognition systems
that are robust to pose variations will be an important
challenge for the near future.
Fig. 1. Block diagram of the proposed system
D. Smile Detection: A Simple Approach
In this paper [4], they have proposed a simple image-based
Facial Expression
Discrimination (%)
Normal Sad Smile Surprise
Canny 100 91.3 99.4 95.7
Laplace 93.2 87.1 89.5 85.6
Sobel 63.4 49.7 66.8 64.9
Robert 49.8 30.1 42.5 48.2
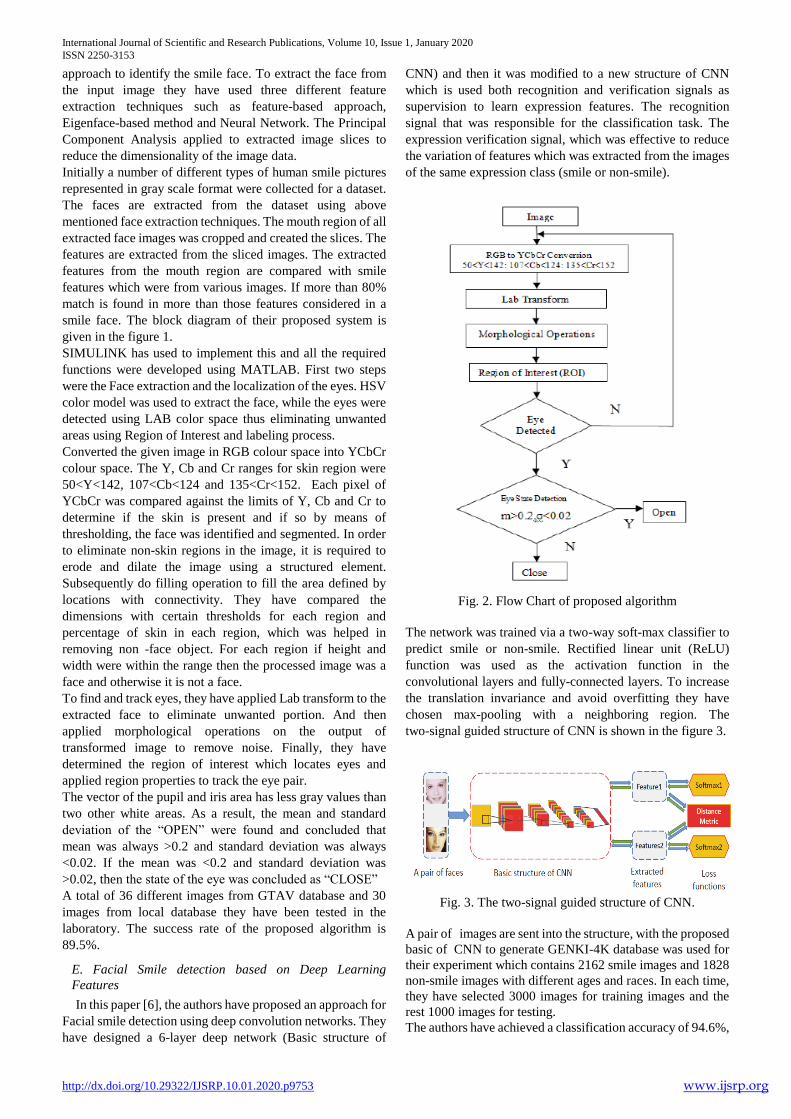
International Journal of Scientific and Research Publications, Volume 10, Issue 1, January 2020
ISSN 2250-3153
http://dx.doi.org/10.29322/IJSRP.10.01.2020.p9753 www.ijsrp.org
approach to identify the smile face. To extract the face from
the input image they have used three different feature
extraction techniques such as feature-based approach,
Eigenface-based method and Neural Network. The Principal
Component Analysis applied to extracted image slices to
reduce the dimensionality of the image data.
Initially a number of different types of human smile pictures
represented in gray scale format were collected for a dataset.
The faces are extracted from the dataset using above
mentioned face extraction techniques. The mouth region of all
extracted face images was cropped and created the slices. The
features are extracted from the sliced images. The extracted
features from the mouth region are compared with smile
features which were from various images. If more than 80%
match is found in more than those features considered in a
smile face. The block diagram of their proposed system is
given in the figure 1.
SIMULINK has used to implement this and all the required
functions were developed using MATLAB. First two steps
were the Face extraction and the localization of the eyes. HSV
color model was used to extract the face, while the eyes were
detected using LAB color space thus eliminating unwanted
areas using Region of Interest and labeling process.
Converted the given image in RGB colour space into YCbCr
colour space. The Y, Cb and Cr ranges for skin region were
50<Y<142, 107<Cb<124 and 135<Cr<152. Each pixel of
YCbCr was compared against the limits of Y, Cb and Cr to
determine if the skin is present and if so by means of
thresholding, the face was identified and segmented. In order
to eliminate non-skin regions in the image, it is required to
erode and dilate the image using a structured element.
Subsequently do filling operation to fill the area defined by
locations with connectivity. They have compared the
dimensions with certain thresholds for each region and
percentage of skin in each region, which was helped in
removing non -face object. For each region if height and
width were within the range then the processed image was a
face and otherwise it is not a face.
To find and track eyes, they have applied Lab transform to the
extracted face to eliminate unwanted portion. And then
applied morphological operations on the output of
transformed image to remove noise. Finally, they have
determined the region of interest which locates eyes and
applied region properties to track the eye pair.
The vector of the pupil and iris area has less gray values than
two other white areas. As a result, the mean and standard
deviation of the “OPEN” were found and concluded that
mean was always >0.2 and standard deviation was always
<0.02. If the mean was <0.2 and standard deviation was
>0.02, then the state of the eye was concluded as “CLOSE”
A total of 36 different images from GTAV database and 30
images from local database they have been tested in the
laboratory. The success rate of the proposed algorithm is
89.5%.
E. Facial Smile detection based on Deep Learning
Features
In this paper [6], the authors have proposed an approach for
Facial smile detection using deep convolution networks. They
have designed a 6-layer deep network (Basic structure of
CNN) and then it was modified to a new structure of CNN
which is used both recognition and verification signals as
supervision to learn expression features. The recognition
signal that was responsible for the classification task. The
expression verification signal, which was effective to reduce
the variation of features which was extracted from the images
of the same expression class (smile or non-smile).
Fig. 2. Flow Chart of proposed algorithm
The network was trained via a two-way soft-max classifier to
predict smile or non-smile. Rectified linear unit (ReLU)
function was used as the activation function in the
convolutional layers and fully-connected layers. To increase
the translation invariance and avoid overfitting they have
chosen max-pooling with a neighboring region. The
two-signal guided structure of CNN is shown in the figure 3.
Fig. 3. The two-signal guided structure of CNN.
A pair of images are sent into the structure, with the proposed
basic of CNN to generate GENKI-4K database was used for
their experiment which contains 2162 smile images and 1828
non-smile images with different ages and races. In each time,
they have selected 3000 images for training images and the
rest 1000 images for testing.
The authors have achieved a classification accuracy of 94.6%,
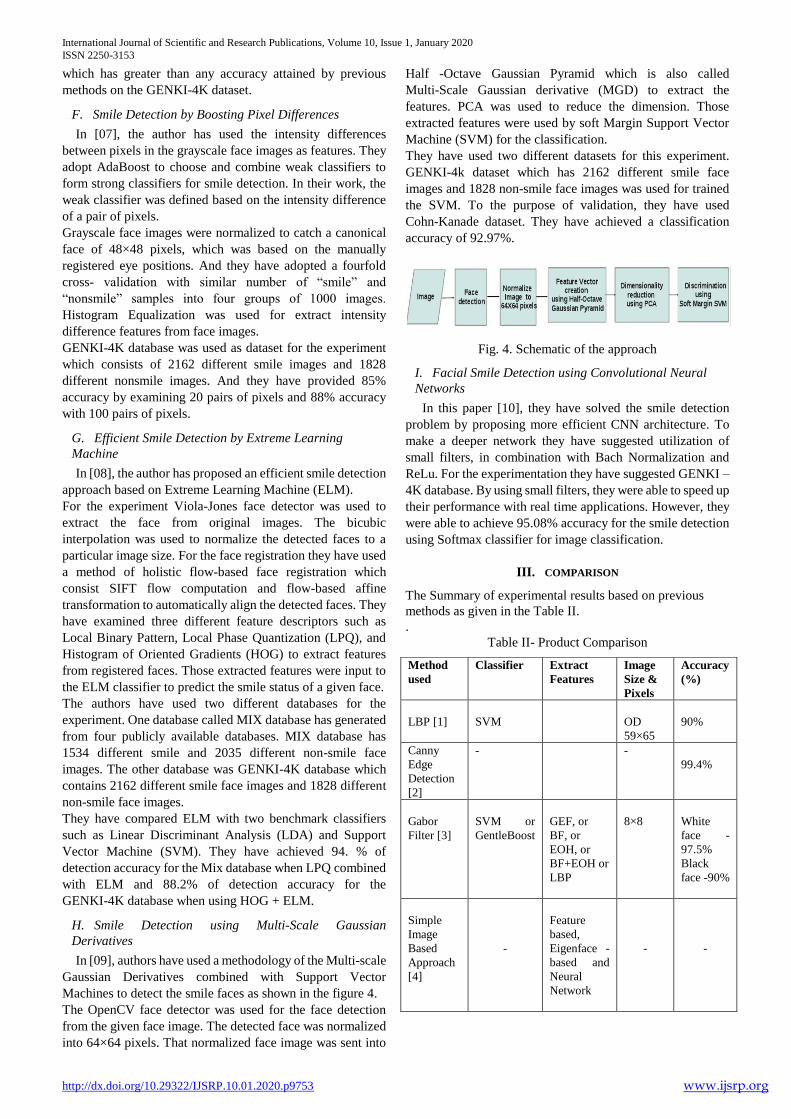
International Journal of Scientific and Research Publications, Volume 10, Issue 1, January 2020
ISSN 2250-3153
http://dx.doi.org/10.29322/IJSRP.10.01.2020.p9753 www.ijsrp.org
which has greater than any accuracy attained by previous
methods on the GENKI-4K dataset.
F. Smile Detection by Boosting Pixel Differences
In [07], the author has used the intensity differences
between pixels in the grayscale face images as features. They
adopt AdaBoost to choose and combine weak classifiers to
form strong classifiers for smile detection. In their work, the
weak classifier was defined based on the intensity difference
of a pair of pixels.
Grayscale face images were normalized to catch a canonical
face of 48×48 pixels, which was based on the manually
registered eye positions. And they have adopted a fourfold
cross- validation with similar number of “smile” and
“nonsmile” samples into four groups of 1000 images.
Histogram Equalization was used for extract intensity
difference features from face images.
GENKI-4K database was used as dataset for the experiment
which consists of 2162 different smile images and 1828
different nonsmile images. And they have provided 85%
accuracy by examining 20 pairs of pixels and 88% accuracy
with 100 pairs of pixels.
G. Efficient Smile Detection by Extreme Learning
Machine
In [08], the author has proposed an efficient smile detection
approach based on Extreme Learning Machine (ELM).
For the experiment Viola-Jones face detector was used to
extract the face from original images. The bicubic
interpolation was used to normalize the detected faces to a
particular image size. For the face registration they have used
a method of holistic flow-based face registration which
consist SIFT flow computation and flow-based affine
transformation to automatically align the detected faces. They
have examined three different feature descriptors such as
Local Binary Pattern, Local Phase Quantization (LPQ), and
Histogram of Oriented Gradients (HOG) to extract features
from registered faces. Those extracted features were input to
the ELM classifier to predict the smile status of a given face.
The authors have used two different databases for the
experiment. One database called MIX database has generated
from four publicly available databases. MIX database has
1534 different smile and 2035 different non-smile face
images. The other database was GENKI-4K database which
contains 2162 different smile face images and 1828 different
non-smile face images.
They have compared ELM with two benchmark classifiers
such as Linear Discriminant Analysis (LDA) and Support
Vector Machine (SVM). They have achieved 94. % of
detection accuracy for the Mix database when LPQ combined
with ELM and 88.2% of detection accuracy for the
GENKI-4K database when using HOG + ELM.
H. Smile Detection using Multi-Scale Gaussian
Derivatives
In [09], authors have used a methodology of the Multi-scale
Gaussian Derivatives combined with Support Vector
Machines to detect the smile faces as shown in the figure 4.
The OpenCV face detector was used for the face detection
from the given face image. The detected face was normalized
into 64×64 pixels. That normalized face image was sent into
Half -Octave Gaussian Pyramid which is also called
Multi-Scale Gaussian derivative (MGD) to extract the
features. PCA was used to reduce the dimension. Those
extracted features were used by soft Margin Support Vector
Machine (SVM) for the classification.
They have used two different datasets for this experiment.
GENKI-4k dataset which has 2162 different smile face
images and 1828 non-smile face images was used for trained
the SVM. To the purpose of validation, they have used
Cohn-Kanade dataset. They have achieved a classification
accuracy of 92.97%.
Fig. 4. Schematic of the approach
I. Facial Smile Detection using Convolutional Neural
Networks
In this paper [10], they have solved the smile detection
problem by proposing more efficient CNN architecture. To
make a deeper network they have suggested utilization of
small filters, in combination with Bach Normalization and
ReLu. For the experimentation they have suggested GENKI –
4K database. By using small filters, they were able to speed up
their performance with real time applications. However, they
were able to achieve 95.08% accuracy for the smile detection
using Softmax classifier for image classification.
III. COMPARISON
The Summary of experimental results based on previous
methods as given in the Table II.
.
Table II- Product Comparison
Method
used
Classifier Extract
Features
Image
Size &
Pixels
Accuracy
(%)
LBP [1]
SVM
OD
59×65
90%
Canny
Edge
Detection
[2]
- -
99.4%
Gabor
Filter [3]
SVM or
GentleBoost
GEF, or
BF, or
EOH, or
BF+EOH or
LBP
8×8
White
face -
97.5%
Black
face -90%
Simple
Image
Based
Approach
[4]
-
Feature
based,
Eigenface -
based and
Neural
Network
-
-
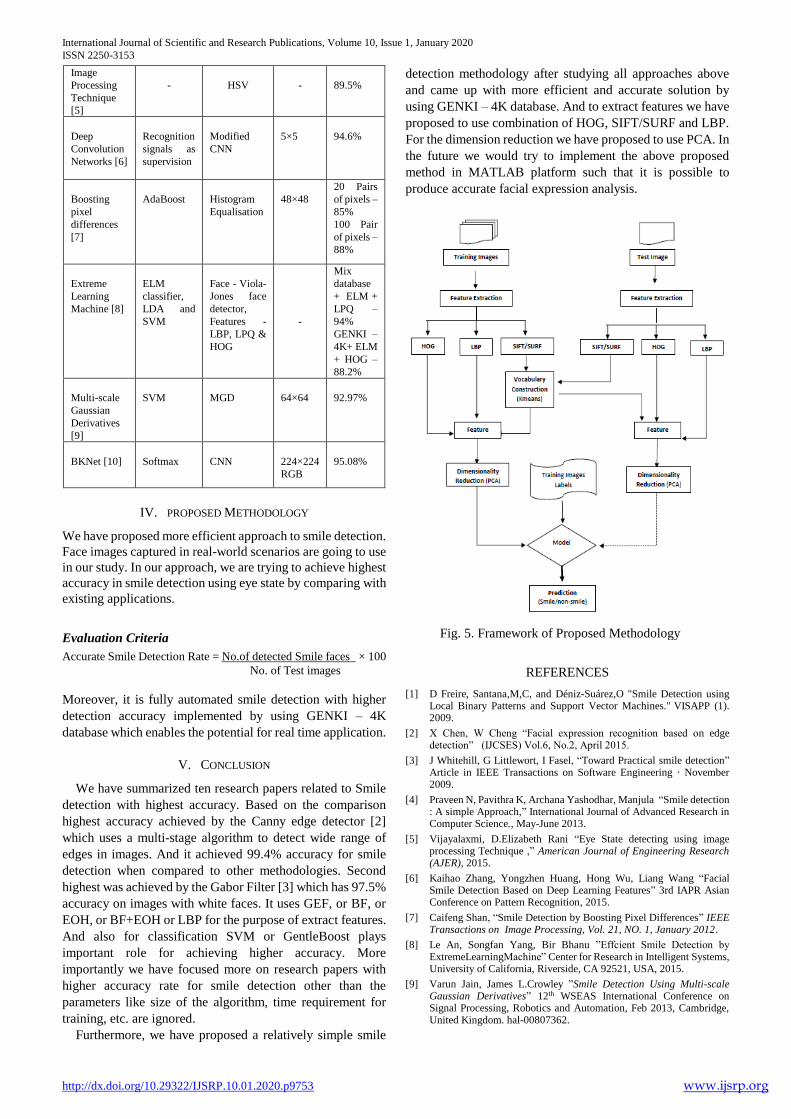
International Journal of Scientific and Research Publications, Volume 10, Issue 1, January 2020
ISSN 2250-3153
http://dx.doi.org/10.29322/IJSRP.10.01.2020.p9753 www.ijsrp.org
Image
Processing
Technique
[5]
-
HSV
-
89.5%
Deep
Convolution
Networks [6]
Recognition
signals as
supervision
Modified
CNN
5×5
94.6%
Boosting
pixel
differences
[7]
AdaBoost
Histogram
Equalisation
48×48
20 Pairs
of pixels –
85%
100 Pair
of pixels –
88%
Extreme
Learning
Machine [8]
ELM
classifier,
LDA and
SVM
Face - Viola-
Jones face
detector,
Features -
LBP, LPQ &
HOG
-
Mix
database
+ ELM +
LPQ –
94%
GENKI –
4K+ ELM
+ HOG –
88.2%
Multi-scale
Gaussian
Derivatives
[9]
SVM
MGD
64×64
92.97%
BKNet [10]
Softmax
CNN
224×224
RGB
95.08%
IV. PROPOSED METHODOLOGY
We have proposed more efficient approach to smile detection.
Face images captured in real-world scenarios are going to use
in our study. In our approach, we are trying to achieve highest
accuracy in smile detection using eye state by comparing with
existing applications.
Evaluation Criteria
Accurate Smile Detection Rate = No.of detected Smile faces × 100
No. of Test images
Moreover, it is fully automated smile detection with higher
detection accuracy implemented by using GENKI – 4K
database which enables the potential for real time application.
V. CONCLUSION
We have summarized ten research papers related to Smile
detection with highest accuracy. Based on the comparison
highest accuracy achieved by the Canny edge detector [2]
which uses a multi-stage algorithm to detect wide range of
edges in images. And it achieved 99.4% accuracy for smile
detection when compared to other methodologies. Second
highest was achieved by the Gabor Filter [3] which has 97.5%
accuracy on images with white faces. It uses GEF, or BF, or
EOH, or BF+EOH or LBP for the purpose of extract features.
And also for classification SVM or GentleBoost plays
important role for achieving higher accuracy. More
importantly we have focused more on research papers with
higher accuracy rate for smile detection other than the
parameters like size of the algorithm, time requirement for
training, etc. are ignored.
Furthermore, we have proposed a relatively simple smile
detection methodology after studying all approaches above
and came up with more efficient and accurate solution by
using GENKI – 4K database. And to extract features we have
proposed to use combination of HOG, SIFT/SURF and LBP.
For the dimension reduction we have proposed to use PCA. In
the future we would try to implement the above proposed
method in MATLAB platform such that it is possible to
produce accurate facial expression analysis.
REFERENCES
[1] D Freire, Santana,M,C, and Déniz-Suárez,O "Smile Detection using Local Binary Patterns and Support Vector Machines." VISAPP (1). 2009.
[2] X Chen, W Cheng “Facial expression recognition based on edge detection” (IJCSES) Vol.6, No.2, April 2015.
[3] J Whitehill, G Littlewort, I Fasel, “Toward Practical smile detection” Article in IEEE Transactions on Software Engineering · November 2009.
[4] Praveen N, Pavithra K, Archana Yashodhar, Manjula “Smile detection : A simple Approach,” International Journal of Advanced Research in Computer Science., May-June 2013.
[5] Vijayalaxmi, D.Elizabeth Rani “Eye State detecting using image processing Technique ,” American Journal of Engineering Research (AJER), 2015.
[6] Kaihao Zhang, Yongzhen Huang, Hong Wu, Liang Wang “Facial Smile Detection Based on Deep Learning Features” 3rd IAPR Asian Conference on Pattern Recognition, 2015.
[7] Caifeng Shan, “Smile Detection by Boosting Pixel Differences” IEEE Transactions on Image Processing, Vol. 21, NO. 1, January 2012.
[8] Le An, Songfan Yang, Bir Bhanu ”Effcient Smile Detection by ExtremeLearningMachine” Center for Research in Intelligent Systems, University of California, Riverside, CA 92521, USA, 2015.
[9] Varun Jain, James L.Crowley ”Smile Detection Using Multi-scale Gaussian Derivatives” 12th WSEAS International Conference on Signal Processing, Robotics and Automation, Feb 2013, Cambridge, United Kingdom. hal-00807362.
Fig. 5. Framework of Proposed Methodology

International Journal of Scientific and Research Publications, Volume 10, Issue 1, January 2020
ISSN 2250-3153
http://dx.doi.org/10.29322/IJSRP.10.01.2020.p9753 www.ijsrp.org
[10] Dinh Viet Sang, Le Tran Bao Cuong, Do Phan Thuan, “Facial smile detection using convolutional neural networks” October 2017.
[11] Vijayalaxmi, D.Elizabeth Rani, “Eye State Detection Using Image Processing Technique ” American Journal of Engineering Research(AJER) 2015.
AUTHORS
First Author C.L.I.S. Fonseka is a Lecturer in Computer
Science at University of Colombo School of Computing, Sri
Lanka. She received her B.Sc. Honors in Computer Science
(2017) from the Eastern University, Sri Lanka. Her research
interests are in the field of Image Processing, Data Analytics,
HCI and Machine Learning.
Second Author L.S Erandika, received her BSc. In
Management and Information Technology degree from South
Eastern University of Sri Lanka in 2016. Associate Member
of Computer Society of Sri Lanka. Her area of interests are
Image Processing, Machine Learning, E-Commerce,
Business Intelligence and Big Data.
Third Author Sittampalam Sotheeswaran is a Senior
Lecturer in Computer Science at the Department of
Mathematics at Eastern University, Sri Lanka. He received
his B.Sc. Honors in Computer Science (2008) and MPhil in
Computer Science (2016) from the University of Jaffna, Sri
Lanka. His research interests are in the field of Image
Processing, Pattern Recognition, Computer Vision and
Machine Learning.
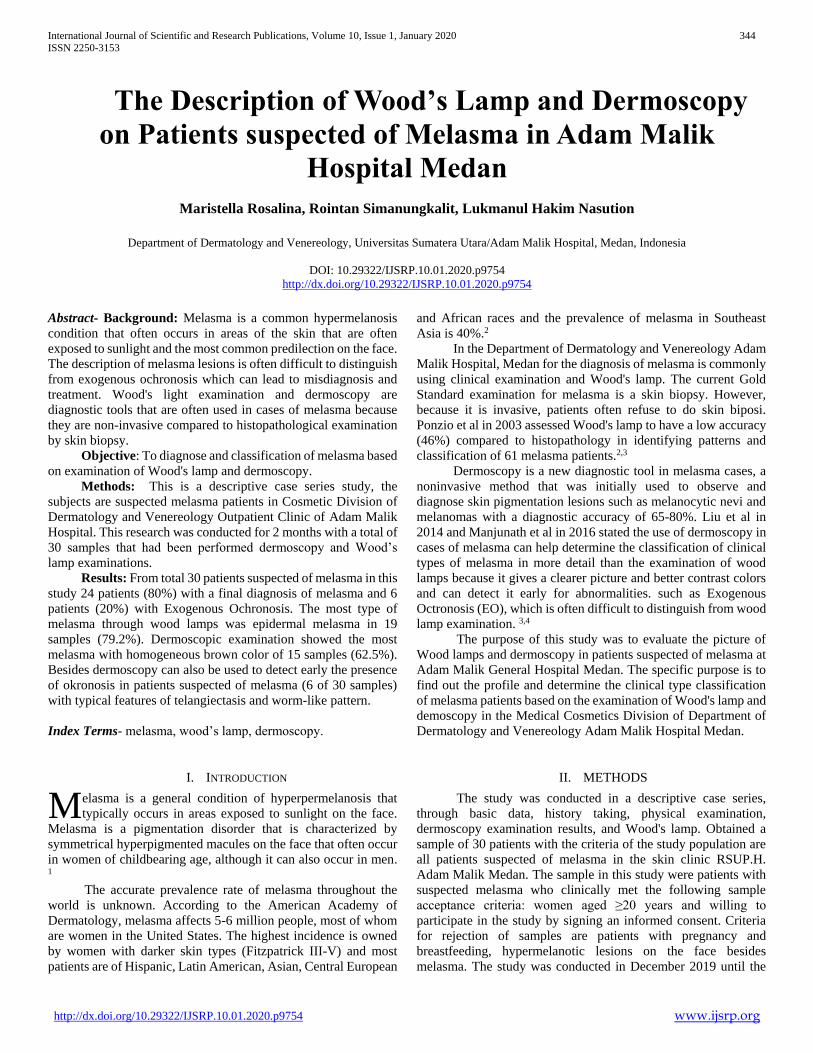
International Journal of Scientific and Research Publications, Volume 10, Issue 1, January 2020 344
ISSN 2250-3153
http://dx.doi.org/10.29322/IJSRP.10.01.2020.p9754 www.ijsrp.org
The Description of Wood’s Lamp and Dermoscopy
on Patients suspected of Melasma in Adam Malik
Hospital Medan
Maristella Rosalina, Rointan Simanungkalit, Lukmanul Hakim Nasution
Department of Dermatology and Venereology, Universitas Sumatera Utara/Adam Malik Hospital, Medan, Indonesia
DOI: 10.29322/IJSRP.10.01.2020.p9754
http://dx.doi.org/10.29322/IJSRP.10.01.2020.p9754
Abstract- Background: Melasma is a common hypermelanosis
condition that often occurs in areas of the skin that are often
exposed to sunlight and the most common predilection on the face.
The description of melasma lesions is often difficult to distinguish
from exogenous ochronosis which can lead to misdiagnosis and
treatment. Wood's light examination and dermoscopy are
diagnostic tools that are often used in cases of melasma because
they are non-invasive compared to histopathological examination
by skin biopsy.
Objective: To diagnose and classification of melasma based
on examination of Wood's lamp and dermoscopy.
Methods: This is a descriptive case series study, the
subjects are suspected melasma patients in Cosmetic Division of
Dermatology and Venereology Outpatient Clinic of Adam Malik
Hospital. This research was conducted for 2 months with a total of
30 samples that had been performed dermoscopy and Wood’s
lamp examinations.
Results: From total 30 patients suspected of melasma in this
study 24 patients (80%) with a final diagnosis of melasma and 6
patients (20%) with Exogenous Ochronosis. The most type of
melasma through wood lamps was epidermal melasma in 19
samples (79.2%). Dermoscopic examination showed the most
melasma with homogeneous brown color of 15 samples (62.5%).
Besides dermoscopy can also be used to detect early the presence
of okronosis in patients suspected of melasma (6 of 30 samples)
with typical features of telangiectasis and worm-like pattern.
Index Terms- melasma, wood’s lamp, dermoscopy.
I. INTRODUCTION
elasma is a general condition of hyperpermelanosis that
typically occurs in areas exposed to sunlight on the face.
Melasma is a pigmentation disorder that is characterized by
symmetrical hyperpigmented macules on the face that often occur
in women of childbearing age, although it can also occur in men. 1
The accurate prevalence rate of melasma throughout the
world is unknown. According to the American Academy of
Dermatology, melasma affects 5-6 million people, most of whom
are women in the United States. The highest incidence is owned
by women with darker skin types (Fitzpatrick III-V) and most
patients are of Hispanic, Latin American, Asian, Central European
and African races and the prevalence of melasma in Southeast
Asia is 40%.2
In the Department of Dermatology and Venereology Adam
Malik Hospital, Medan for the diagnosis of melasma is commonly
using clinical examination and Wood's lamp. The current Gold
Standard examination for melasma is a skin biopsy. However,
because it is invasive, patients often refuse to do skin biposi.
Ponzio et al in 2003 assessed Wood's lamp to have a low accuracy
(46%) compared to histopathology in identifying patterns and
classification of 61 melasma patients.2,3
Dermoscopy is a new diagnostic tool in melasma cases, a
noninvasive method that was initially used to observe and
diagnose skin pigmentation lesions such as melanocytic nevi and
melanomas with a diagnostic accuracy of 65-80%. Liu et al in
2014 and Manjunath et al in 2016 stated the use of dermoscopy in
cases of melasma can help determine the classification of clinical
types of melasma in more detail than the examination of wood
lamps because it gives a clearer picture and better contrast colors
and can detect it early for abnormalities. such as Exogenous
Octronosis (EO), which is often difficult to distinguish from wood
lamp examination. 3,4
The purpose of this study was to evaluate the picture of
Wood lamps and dermoscopy in patients suspected of melasma at
Adam Malik General Hospital Medan. The specific purpose is to
find out the profile and determine the clinical type classification
of melasma patients based on the examination of Wood's lamp and
demoscopy in the Medical Cosmetics Division of Department of
Dermatology and Venereology Adam Malik Hospital Medan.
II. METHODS
The study was conducted in a descriptive case series,
through basic data, history taking, physical examination,
dermoscopy examination results, and Wood's lamp. Obtained a
sample of 30 patients with the criteria of the study population are
all patients suspected of melasma in the skin clinic RSUP.H.
Adam Malik Medan. The sample in this study were patients with
suspected melasma who clinically met the following sample
acceptance criteria: women aged ≥20 years and willing to
participate in the study by signing an informed consent. Criteria
for rejection of samples are patients with pregnancy and
breastfeeding, hypermelanotic lesions on the face besides
melasma. The study was conducted in December 2019 until the
M
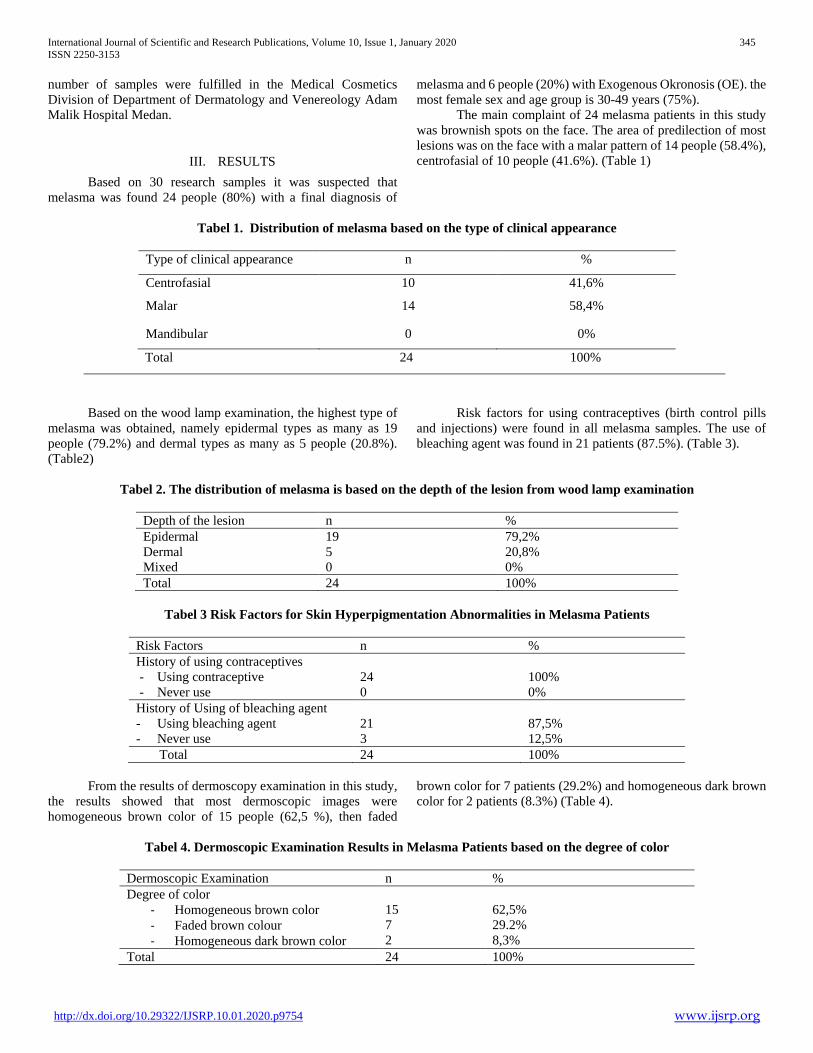
International Journal of Scientific and Research Publications, Volume 10, Issue 1, January 2020 345
ISSN 2250-3153
http://dx.doi.org/10.29322/IJSRP.10.01.2020.p9754 www.ijsrp.org
number of samples were fulfilled in the Medical Cosmetics
Division of Department of Dermatology and Venereology Adam
Malik Hospital Medan.
III. RESULTS
Based on 30 research samples it was suspected that
melasma was found 24 people (80%) with a final diagnosis of
melasma and 6 people (20%) with Exogenous Okronosis (OE). the
most female sex and age group is 30-49 years (75%).
The main complaint of 24 melasma patients in this study
was brownish spots on the face. The area of predilection of most
lesions was on the face with a malar pattern of 14 people (58.4%),
centrofasial of 10 people (41.6%). (Table 1)
Tabel 1. Distribution of melasma based on the type of clinical appearance
Type of clinical appearance n %
Centrofasial 10 41,6%
Malar 14 58,4%
Mandibular 0 0%
Total 24 100%
Based on the wood lamp examination, the highest type of
melasma was obtained, namely epidermal types as many as 19
people (79.2%) and dermal types as many as 5 people (20.8%).
(Table2)
Risk factors for using contraceptives (birth control pills
and injections) were found in all melasma samples. The use of
bleaching agent was found in 21 patients (87.5%). (Table 3).
Tabel 2. The distribution of melasma is based on the depth of the lesion from wood lamp examination
Depth of the lesion n %
Epidermal 19 79,2%
Dermal
Mixed
5
0
20,8%
0%
Total 24 100%
Tabel 3 Risk Factors for Skin Hyperpigmentation Abnormalities in Melasma Patients
Risk Factors n %
History of using contraceptives
- Using contraceptive
- Never use
24
0
100%
0%
History of Using of bleaching agent
- Using bleaching agent
- Never use
21
3
87,5%
12,5%
Total 24 100%
From the results of dermoscopy examination in this study,
the results showed that most dermoscopic images were
homogeneous brown color of 15 people (62,5 %), then faded
brown color for 7 patients (29.2%) and homogeneous dark brown
color for 2 patients (8.3%) (Table 4).
Tabel 4. Dermoscopic Examination Results in Melasma Patients based on the degree of color
Dermoscopic Examination n %
Degree of color
- Homogeneous brown color
- Faded brown colour
- Homogeneous dark brown color
15
7
2
62,5%
29.2%
8,3%
Total 24 100%
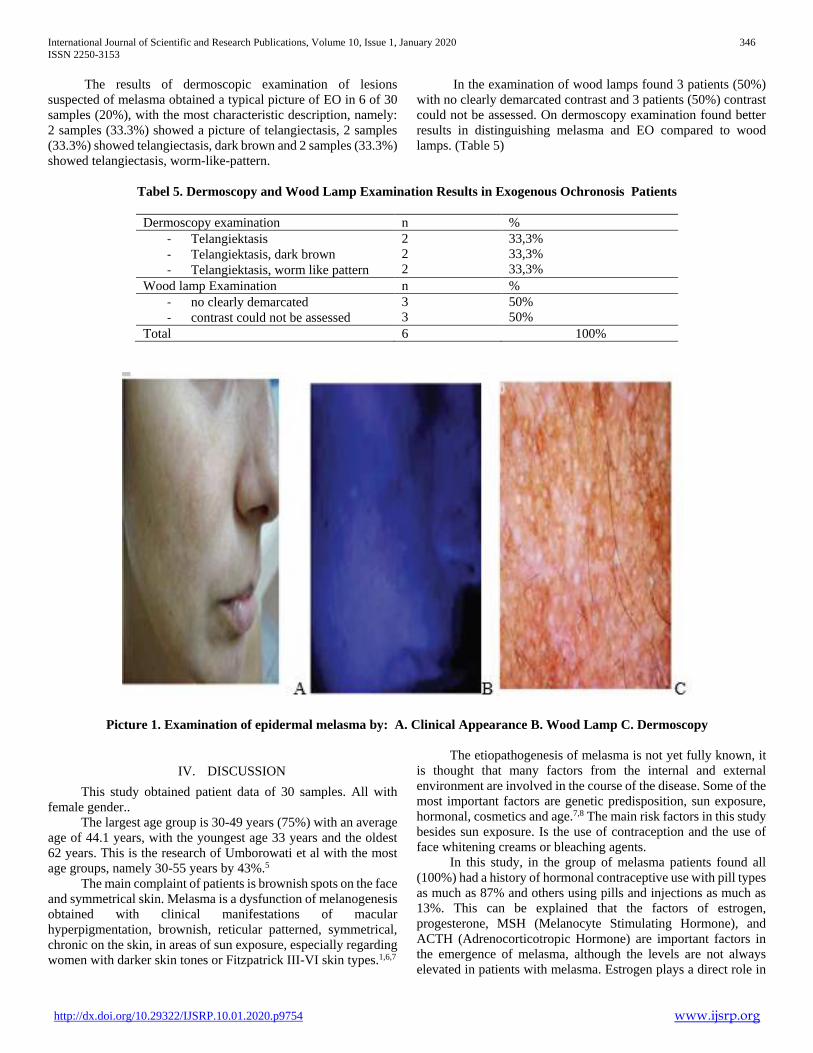
International Journal of Scientific and Research Publications, Volume 10, Issue 1, January 2020 346
ISSN 2250-3153
http://dx.doi.org/10.29322/IJSRP.10.01.2020.p9754 www.ijsrp.org
The results of dermoscopic examination of lesions
suspected of melasma obtained a typical picture of EO in 6 of 30
samples (20%), with the most characteristic description, namely:
2 samples (33.3%) showed a picture of telangiectasis, 2 samples
(33.3%) showed telangiectasis, dark brown and 2 samples (33.3%)
showed telangiectasis, worm-like-pattern.
In the examination of wood lamps found 3 patients (50%)
with no clearly demarcated contrast and 3 patients (50%) contrast
could not be assessed. On dermoscopy examination found better
results in distinguishing melasma and EO compared to wood
lamps. (Table 5)
Tabel 5. Dermoscopy and Wood Lamp Examination Results in Exogenous Ochronosis Patients
Dermoscopy examination n %
- Telangiektasis
- Telangiektasis, dark brown
- Telangiektasis, worm like pattern
2
2
2
33,3%
33,3%
33,3%
Wood lamp Examination n %
- no clearly demarcated
- contrast could not be assessed
3
3
50%
50%
Total 6 100%
Picture 1. Examination of epidermal melasma by: A. Clinical Appearance B. Wood Lamp C. Dermoscopy
IV. DISCUSSION
This study obtained patient data of 30 samples. All with
female gender..
The largest age group is 30-49 years (75%) with an average
age of 44.1 years, with the youngest age 33 years and the oldest
62 years. This is the research of Umborowati et al with the most
age groups, namely 30-55 years by 43%.5
The main complaint of patients is brownish spots on the face
and symmetrical skin. Melasma is a dysfunction of melanogenesis
obtained with clinical manifestations of macular
hyperpigmentation, brownish, reticular patterned, symmetrical,
chronic on the skin, in areas of sun exposure, especially regarding
women with darker skin tones or Fitzpatrick III-VI skin types.1,6,7
The etiopathogenesis of melasma is not yet fully known, it
is thought that many factors from the internal and external
environment are involved in the course of the disease. Some of the
most important factors are genetic predisposition, sun exposure,
hormonal, cosmetics and age.7,8 The main risk factors in this study
besides sun exposure. Is the use of contraception and the use of
face whitening creams or bleaching agents.
In this study, in the group of melasma patients found all
(100%) had a history of hormonal contraceptive use with pill types
as much as 87% and others using pills and injections as much as
13%. This can be explained that the factors of estrogen,
progesterone, MSH (Melanocyte Stimulating Hormone), and
ACTH (Adrenocorticotropic Hormone) are important factors in
the emergence of melasma, although the levels are not always
elevated in patients with melasma. Estrogen plays a direct role in
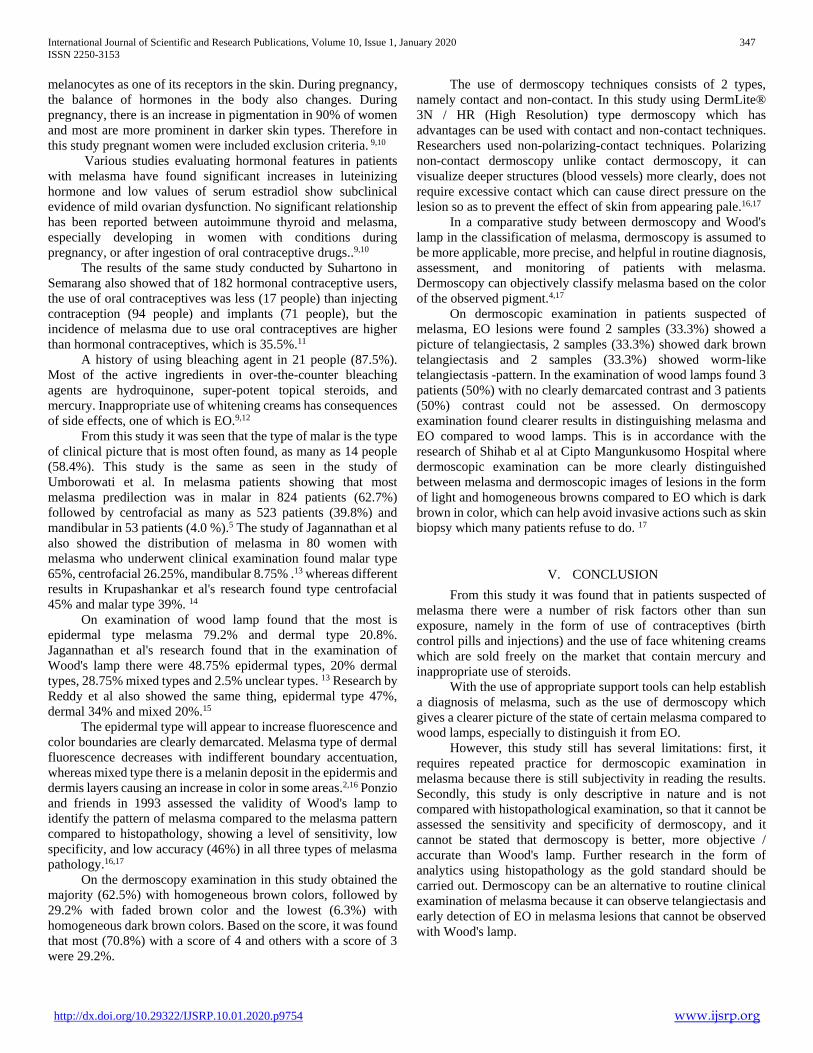
International Journal of Scientific and Research Publications, Volume 10, Issue 1, January 2020 347
ISSN 2250-3153
http://dx.doi.org/10.29322/IJSRP.10.01.2020.p9754 www.ijsrp.org
melanocytes as one of its receptors in the skin. During pregnancy,
the balance of hormones in the body also changes. During
pregnancy, there is an increase in pigmentation in 90% of women
and most are more prominent in darker skin types. Therefore in
this study pregnant women were included exclusion criteria. 9,10
Various studies evaluating hormonal features in patients
with melasma have found significant increases in luteinizing
hormone and low values of serum estradiol show subclinical
evidence of mild ovarian dysfunction. No significant relationship
has been reported between autoimmune thyroid and melasma,
especially developing in women with conditions during
pregnancy, or after ingestion of oral contraceptive drugs..9,10
The results of the same study conducted by Suhartono in
Semarang also showed that of 182 hormonal contraceptive users,
the use of oral contraceptives was less (17 people) than injecting
contraception (94 people) and implants (71 people), but the
incidence of melasma due to use oral contraceptives are higher
than hormonal contraceptives, which is 35.5%.11
A history of using bleaching agent in 21 people (87.5%).
Most of the active ingredients in over-the-counter bleaching
agents are hydroquinone, super-potent topical steroids, and
mercury. Inappropriate use of whitening creams has consequences
of side effects, one of which is EO.9,12
From this study it was seen that the type of malar is the type
of clinical picture that is most often found, as many as 14 people
(58.4%). This study is the same as seen in the study of
Umborowati et al. In melasma patients showing that most
melasma predilection was in malar in 824 patients (62.7%)
followed by centrofacial as many as 523 patients (39.8%) and
mandibular in 53 patients (4.0 %).5 The study of Jagannathan et al
also showed the distribution of melasma in 80 women with
melasma who underwent clinical examination found malar type
65%, centrofacial 26.25%, mandibular 8.75% .13 whereas different
results in Krupashankar et al's research found type centrofacial
45% and malar type 39%. 14
On examination of wood lamp found that the most is
epidermal type melasma 79.2% and dermal type 20.8%.
Jagannathan et al's research found that in the examination of
Wood's lamp there were 48.75% epidermal types, 20% dermal
types, 28.75% mixed types and 2.5% unclear types. 13 Research by
Reddy et al also showed the same thing, epidermal type 47%,
dermal 34% and mixed 20%.15
The epidermal type will appear to increase fluorescence and
color boundaries are clearly demarcated. Melasma type of dermal
fluorescence decreases with indifferent boundary accentuation,
whereas mixed type there is a melanin deposit in the epidermis and
dermis layers causing an increase in color in some areas.2,16 Ponzio
and friends in 1993 assessed the validity of Wood's lamp to
identify the pattern of melasma compared to the melasma pattern
compared to histopathology, showing a level of sensitivity, low
specificity, and low accuracy (46%) in all three types of melasma
pathology.16,17
On the dermoscopy examination in this study obtained the
majority (62.5%) with homogeneous brown colors, followed by
29.2% with faded brown color and the lowest (6.3%) with
homogeneous dark brown colors. Based on the score, it was found
that most (70.8%) with a score of 4 and others with a score of 3
were 29.2%.
The use of dermoscopy techniques consists of 2 types,
namely contact and non-contact. In this study using DermLite®
3N / HR (High Resolution) type dermoscopy which has
advantages can be used with contact and non-contact techniques.
Researchers used non-polarizing-contact techniques. Polarizing
non-contact dermoscopy unlike contact dermoscopy, it can
visualize deeper structures (blood vessels) more clearly, does not
require excessive contact which can cause direct pressure on the
lesion so as to prevent the effect of skin from appearing pale.16,17
In a comparative study between dermoscopy and Wood's
lamp in the classification of melasma, dermoscopy is assumed to
be more applicable, more precise, and helpful in routine diagnosis,
assessment, and monitoring of patients with melasma.
Dermoscopy can objectively classify melasma based on the color
of the observed pigment.4,17
On dermoscopic examination in patients suspected of
melasma, EO lesions were found 2 samples (33.3%) showed a
picture of telangiectasis, 2 samples (33.3%) showed dark brown
telangiectasis and 2 samples (33.3%) showed worm-like
telangiectasis -pattern. In the examination of wood lamps found 3
patients (50%) with no clearly demarcated contrast and 3 patients
(50%) contrast could not be assessed. On dermoscopy
examination found clearer results in distinguishing melasma and
EO compared to wood lamps. This is in accordance with the
research of Shihab et al at Cipto Mangunkusomo Hospital where
dermoscopic examination can be more clearly distinguished
between melasma and dermoscopic images of lesions in the form
of light and homogeneous browns compared to EO which is dark
brown in color, which can help avoid invasive actions such as skin
biopsy which many patients refuse to do. 17
V. CONCLUSION
From this study it was found that in patients suspected of
melasma there were a number of risk factors other than sun
exposure, namely in the form of use of contraceptives (birth
control pills and injections) and the use of face whitening creams
which are sold freely on the market that contain mercury and
inappropriate use of steroids.
With the use of appropriate support tools can help establish
a diagnosis of melasma, such as the use of dermoscopy which
gives a clearer picture of the state of certain melasma compared to
wood lamps, especially to distinguish it from EO.
However, this study still has several limitations: first, it
requires repeated practice for dermoscopic examination in
melasma because there is still subjectivity in reading the results.
Secondly, this study is only descriptive in nature and is not
compared with histopathological examination, so that it cannot be
assessed the sensitivity and specificity of dermoscopy, and it
cannot be stated that dermoscopy is better, more objective /
accurate than Wood's lamp. Further research in the form of
analytics using histopathology as the gold standard should be
carried out. Dermoscopy can be an alternative to routine clinical
examination of melasma because it can observe telangiectasis and
early detection of EO in melasma lesions that cannot be observed
with Wood's lamp.

International Journal of Scientific and Research Publications, Volume 10, Issue 1, January 2020 348
ISSN 2250-3153
http://dx.doi.org/10.29322/IJSRP.10.01.2020.p9754 www.ijsrp.org
REFERENCES
[1] Handel AC, Miot LDB, Miot HA. Melasma: a clinical and epidemiological review. An Bras Dermatol 2014;89(5):771-82.
[2] Mukhopadhyay AK. Historyand Evolution of Pigmentary Disorders in Human. Dalam : Lahiri K, Chatterjee M, Sarkar R, editors. Pigmentary Disorders A Comprehensive Compendium. 1st Edition. New Delhi : Jaypee Brothers Medical Publishers;2014. Hal.1-5.
[3] Liu WC, Tey HL, Lee JSS, et al. Exogenous ochronosis in a Chinese patient: use of dermoscopy aids early diagnosis and selection of biopsy site Singapore Med J 2014; 55(1): e1-e3. DOI: 10.11622/smedj.2014013
[4] Manjunath K. G., Kiran C., Sonakshi S, et al. Melasma: Through the eye of a dermoscope. Int J Res Dermatol. 2016 Dec;2(4):113-117.DOI: http://dx.doi.org/10.18203/issn.2455-4529.IntJResDermatol20164071
[5] Umborowati MA, Rahmadewi. Studi Retrospektif: Diagnosis dan Terapi Pasien Melasma.BIKKK - Berkala Ilmu Kesehatan Kulit dan Kelamin - Periodical of Dermatology and Venereology. 2014 April; 26(1) : 56-62.
[6] Achar A, Rathi SK. Melasma: A clinico- epidemiological study of 312 cases. Indian J Dermatol 2011;56:380-2.
[7] Hammerschmidt M, de Mattos SML, Suzuki HS, de Freitas CFNP, Mukai MM. Evaluation of melasma classification methods based on response to treatment. Surge Cosmet Dermatol 2012;4(2):155-8.
[8] Tzouveka E. Epidemiology and risk factors of melasma. Pigmentary disorders 2014; S1:1-3.
[9] Hee Young Kang. Etiological Factors and Triggering Factors. Dalam : Melasma a monograph, Rashmi sarkar, editors. Edisi ke 1. New Delhi: Jaypee; 2015. Hal 4-5
[10] Bagherani N, Gianfaldoni S, Smoller B. An overview of melasma. Pigmentary disorders 2015;2(10):1-18.
[11] Suhartono D. Prevalensi dan Beberapa Karakteristik Penderita Melasma Pada Pemakai Kontrasepsi Hormonal. Tesis Departemen Ilmu Kesehatan Kulit dan Kelamin Fakultas Kedokteran Universitas Diponegoro Semarang. 2001.
[12] Simmons BJ, Griffith RD, Bray FN, et al. Exogenous Ochronosis: A Comprehensive Reviewof the Diagnosis, Epidemiology, Causes, and Treatments. Am J Clin Dermatol (2015) 16:205–212. DOI: 10.1007/s40257-015-0126-8
[13] Jagannathan M, Sadagopan K, Ekkarakudy J, Anandan H. Clinico-epidemiological Study of Patients with Melasma in a Tertiary Care Hospital
- A Prospective Study. International Journal of Scientifi c Study. 2017; 4 : 117-20. doi : 10.17354/ijss/2017/61
[14] KrupaShankar DSR, Somani VK, Kohli M, Sharad J, Ganjoo A, Kandhari S, Mysore VR et al.. A Cross-Sectional, Multicentric Clinico-Epidemiological Study of Melasma in India. Dermatol Ther (Heidelb). 2014; 4:71–81. doi : 10.1007/s13555-014-0046-1
[15] Reddy AJ, Kumar P, Sawant SR, Jain SK. Endocrinological evaluation of melasma in females of western uttar Pradesh region. International Journal of Scientific Study. 2014; (2)6: 59-61.
[16] Benvenuto-Andrade C, Dusza SW, Agero AL, Scope A, Rajadhyaksha M, Halpern AC, et al. Differences between polarized light dermoscopy and immersion contact dermoscopy for the evaluation of skin lesions. Arch Dermatol 2007; 143:329.
[17] Shihab N, Suseno LS, Legiawati L, Simbolon Sitohang IB. Dermoscopy negates the need for biopsy in cases of confetti-like leukoderma and exogenous ochronosis. J Nat Sc Biol Med [serial online] 2018 [cited 2018 Dec16];9:297-9.DOI: 10.4103/jnsbm.JNSBM_205_17
AUTHORS
First Author – Maristella Rosalina, Department of Dermatology
and Venereology, Universitas Sumatera Utara/Adam Malik
Hospital, Medan, Indonesia
Second Author – Rointan Simanungkalit, Department of
Dermatology and Venereology, Universitas Sumatera
Utara/Adam Malik Hospital, Medan, Indonesia
Third Author – Lukmanul Hakim Nasution, Department of
Dermatology and Venereology, Universitas Sumatera
Utara/Adam Malik Hospital, Medan, Indonesia
Correspondence Author – Dr. Maristella Rosalina, Department
of Dermatology and Venereology, Universitas Sumatera
Utara/Adam Malik Hospital, Medan, Jl. Bunga Lau no 17,Medan
20136. Indonesia.. Email: [email protected]

International Journal of Scientific and Research Publications, Volume 10, Issue 1, January 2020 349
ISSN 2250-3153
http://dx.doi.org/10.29322/IJSRP.10.01.2020.p9755 www.ijsrp.org
Effectiveness of Using Discovery Learning Model
Assisted Tracker on Improvement of Physics Learning
Outcomes Observed From Students’ Initial Knowledge
Nurfadilah*, Dwi Sulisworo**, Guntur Maruto**, Suritno Fayanto**
* Department of Master in Physics Education, Universitas Ahmad Dahlan
** Department of Master in Physics Education, Universitas Ahmad Dahlan
DOI: 10.29322/IJSRP.10.01.2020.p9755
http://dx.doi.org/10.29322/IJSRP.10.01.2020.p9755
Abstract- The purpose of this study is to determine the effectiveness of the use of discovery-assisted discovery learning models to
improve physics learning outcomes in terms of students' initial knowledge. This research was conduct at Senior High School 1
Talibura in the academic year 2019/2010. This research is an experimental research that uses a quasi-experimental design consisting
of a nonequivalent (pretest-posttest) control group design. Sampling uses simple random sampling so that two sample classes
obtained, namely level XI MIA 1 as an experimental class and class XI MIA 2 as a control class. The first knowledge instrument and
learning outcomes are subjective tests (essays) that have been tested for validity and reliability. Hypothesis testing using ANCOVA
test. Based on data analysis, the results showed that there was an influence of the tracker assisted discovery hearing model on student
physics learning outcomes, where Fcount is higher than Ftable (4,484 > 3,20) with the significant value obtained is smaller than the
significance level (0,017 < 0,05). From this study, we can conclude that the discovery-assisted discovery learning model tracker is
handy to be used in physics learning to improve student physics learning outcomes.
Index Terms- Discovery learning model, tracker, physics learning outcomes, initial knowledge
I. INTRODUCTION
hysics is the study of natural phenomena or phenomena. Physics has become one of the most fundamental sciences of knowledg1.
Physics expected to be able to direct the educated generation to have good observation and reasoning abilities. However, in
learning physics, students tend to experience obstacles. Students consider physics as a complicated subject. Perspectives that physics
is involved is the reason for the decline in students' interest in physics2.
The students' initial knowledge determines the readiness of students in learning. Initial experience is the knowledge that students
have before participating in the lesson. Initial knowledge becomes essential for teachers to know before starting education. Through
fundamental knowledge, it can be known as the extent to which students already know the material to present. One study group indeed
consists of students with different school backgrounds, so they can ascertain that their initial knowledge is different too.
Although some of the concepts of physics formed through mathematical analysis, in the end, the theory developed must teste
through experiments. Experimental activities with a discovery learning approach result in students being able to improve and enhance
their skills and cognitive processes. If involved continuously in learning discovery, students will better understand and be able to
develop aspects3. On the other hand, discovery through experimentation becomes one of the methods often used to facilitate
understanding. Still, in reality, this method encounters obstacles such as limited time, inadequate tools, and a lack of students'
responses to problems encountered. In this case, it is necessary to use technology as a medium for learning physics.
In learning physics, supporting media needed that can facilitate the understanding of the material. The use of multimedia is
considered able to improve student learning outcomes4 — various advantages offered by technology to enhance the quality of physics
learning. The use of technology in learning physics is more productive than the lecture and demonstration methods5. Technology can
improve and develop the professional abilities of teachers, can be used as a source of learning, as a tool for learning interactions, as
well as a forum for learning. Technology can improve and develop the professional abilities of teachers, can be used as a source of
knowledge, as a tool for learning interactions, as well as a forum for learning6. However, in reality, both students and teachers have
not been able to utilize technology as a learning medium. Technology is still used only as a means of communication and social
interaction. Most students use technology only to update news on social media. As a result, much of their study time not used as it
should and wasted.
Problems are various in learning physics impact on the low learning outcomes of students. In Senior High School 1 Talibura, for
example, physics learning outcomes are relatively small compared to other natural science subjects. Various attempts were made by
P

International Journal of Scientific and Research Publications, Volume X, Issue X, Month 2018 350
ISSN 2250-3153
http://dx.doi.org/10.29322/IJSRP.10.01.2020.p9755 www.ijsrp.org
the teacher to improve student learning outcomes, but the results were not satisfactory. This condition spurred researchers to make
reforms by optimizing the use of technology as a medium for learning physics. With technology, the material will present in the form
of videos about physical phenomena. The video will be recorded by students who are then analyzed using a tracker to obtain accurate
data. The tracker allows students to analyze the motion of objects in the video by making a trail that follows the movement of objects
in video7. In groups of students who were taught using video and analyzed using a tracker experienced increased competence and
knowledge8. That way, it is expected that physics learning outcomes can increase.
Associated with the above view, the researcher is interested in researching "the effectiveness of the discovery-assisted discovery
learning model towards improving physics learning outcomes in terms of the students' initial knowledge."
II. THEORETICAL REVIEW
A. Discovery Learning Model
Discovery learning is a fundamental inquiry approach9. The teaching method is inquiry-based and is considered a constructivist
based approach to education. A literature review shows that discovery learning occurs whenever students are not provided with
conceptual understanding and must find it independently and only with the material provided10. Discovery Learning emphasizes
students to find the concept of knowledge6. In the process of finding, students guided to do a series of stages of learning from
observing to organizing their findings into a theory of knowledge. Discovery learning encourages students to be active agents in their
learning process11. Education helps students to find out various sources through observation and not just being told12. The aim is to
build concepts and gain knowledge from experience. The experience introduced to increase relevance and meaning. Students guided
by the teacher who directs questions to problems so as enable students to draw simple relationships, generalizations, or conclusions9.
B. Conventional Learning Model
Conventional learning is a teaching and learning process that commonly used in schools13. In traditional knowledge, students placed
as learning objects that act as passive recipients of information14. Conventional learning, in general, has certain peculiarities, for
example, prioritizing memorization rather than understanding, emphasizing numeracy skills, prioritizing results rather than process,
and teacher-centered teaching15.
From some understanding, it concluded that the conventional learning model is a teacher center learning model, prioritizing results
rather than processes. In this study, students placed as objects rather than subjects, so students are less confident in expressing their
opinions. A learning concept that is used by teachers in conveying material in the usual way. This learning still carried out without
utilizing technology as a medium education. This learning always carried out the assumption knowledge transferred in full from the
mind of the teacher to the students.
C. Tracker
A tracker is a software that can analyze, and model motion and optical phenomena are free and developed by Open Source Physics
(OSP) using the Java framework16. Through a tracker, educators and or students can quickly analyze real-world problems, especially
on the topic of motion and optics that are sometimes impossible to do without the help of technology.
D. Initial Knowledge
Fundamental knowledge is a collection of individual expertise and experience gained during their life journey and which they will
bring to new learning experience17. Student initial knowledge is a collection of information that can bridge the extent to which other
understandings can be used18.
The initial knowledge possessed by each student is different. Different individuals state different information according to their ways
and present information differently in their memory based on their initial experience and knowledge19. Student fundamental
knowledge plays a vital role in learning because it supports the ease of students in accepting and understanding a new material or
concept in education. Student's initial knowledge influences performance, academic results, and speed of completing studies20.
The initial knowledge possessed by students obtained through the teacher's ability to process the stored information21. The teacher
needs to know the extent of the students' initial knowledge so that if the initial experience is good enough, then there is no need to be
discussed in learning22. In this study, initial knowledge measured through an analysis of the results of the pretest test. The test
questions are in the form of multiple-choice questions given to students before the discovery learning model, and the conventional
learning model is applied. It intended that researchers know the extent of students' fundamental knowledge in the two sample classes
about the material to be taught.
C. Learning Outcomes
Changes in behavior mark learning outcomes. Although not all changes in behavior are learning outcomes, learning activities
generally accompanied by changes in behavior23. Learning outcomes must be observable and supported by a type of test called a
learning outcome test. Learning outcomes are the results obtained by students after learning activities24. Learning outcomes also said
as the success of the learning system. The success of learning determined by the product side and the process side. Learning success
that only seen from one side will not be perfect25.

International Journal of Scientific and Research Publications, Volume X, Issue X, Month 2018 351
ISSN 2250-3153
http://dx.doi.org/10.29322/IJSRP.10.01.2020.p9755 www.ijsrp.org
Based on the above understanding, it obtains a knowledge that learning outcomes are the actual abilities possessed by students after
learning, which manifests in the form of cognitive, affective, and psychomotor skills. In this research, learning outcomes are only
limited to the cognitive realm that refers to the Krathwol-Anderson taxonomy covering C1 through C6 (remembering, understanding,
applying, analyzing, evaluating, and making).
Learning outcomes measured through analysis of the results of the posttest. The test questions are in the form of multiple-choice
questions that are the same as the pretest questions and are given to students after the discovery learning model and the conventional
learning model applied. It intended that researchers know the effect of using the two learning models in improving student learning
outcomes.
D. Moment of Force (torque)
Torque is also called the moment of force and is a vector quantity. Torque is the result per cross between the position vector r and
the force F, which can be written.
Fr
(1)
The formula states the amount of torque:
sinrF (2)
Where θ is the angle between direction r
and direction F
.
Figure1. Torque
From Figure 1, it appears that the length of the torque arm expressed as
sinr (3)
So, equation (3) can be written as
F (4)
The torque arm is defined as the distance from the axis of rotation to the workforce line, as shown in Figure 1.
D. Moment of Force (torque)
The moment of inertia of a particle with mass m defined as the product of the mass of the particle (m) with the square of the
perpendicular distance of the particle from the pivot point (r2). 2mrI (5)
Because the moment of inertia I in rotational motion is analogous to mass m in translational motion, the function of the moment of
inertia is the same as the function of mass. If the mass in translational motion represents a measure of the ability of an object to
maintain its linear velocity, the moment of inertia of an object in rotational motion represents a measure of the strength of an object to
retain its rotational angular speed.
D. The Law of Conservation of Angular Momentum in Rotation Motion
In rotational motion, analogous to linear momentum is angular momentum. Mass is comparable to the moment of inertia; the linear
velocity is similar to angular velocity, then angular momentum L is equal to the result of the moment of inertia I with angular
velocity.
IL (6)
Thus, the law of conservation of angular momentum for rotating objects: "If the total torque acting on the object rotates to zero,
then the total angular momentum of the object remains/is constant."
E. Balance of Rigid Bodies
A rigid body is in static equilibrium if at first, the object is at rest, and the resultant force on the object is zero, and the torque to
any random point chosen as the axis is zero. Mathematically, it stated as follows:

International Journal of Scientific and Research Publications, Volume X, Issue X, Month 2018 352
ISSN 2250-3153
http://dx.doi.org/10.29322/IJSRP.10.01.2020.p9755 www.ijsrp.org
0F (7)
0 (8)
F. Center for Gravity
Every particle in a rigid body has weight. The overall weight of an object is the resultant of all downward directed gravity of all
particles. This resultant works through a single point called the center of gravity (center of gravity).
Figure 2. The concept of emphasis
The center of gravity can also express as a point where the resultant gravitational force of the particles concentrated at that point.
Therefore, the resultant torque of the gravitational force of particles at their center of gravity must be zero.
III. METHODOLOGY
A. Research Model
This study uses a quasi-experimental design consisting of nonequivalent (pretest-posttest) control group design, in which there are
control classes and innovative classes that given different treatments. The procedure of this research is the test of questions at a level
that has previously studied the material. In the sample class, a pretest conducted to determine the students' initial ability, treatment,
and, finally, the posttest to find out the learning outcomes of students after surgery.
Table 1. Research design
Group Pre-test Treatment Post-test
Experiment R1 X R2
Control R1 Y R2
B. Research Subjects
In this research conducted students of class XI odd semester of Senior High School 1 Talibura in the academic year 2019/2020. A
simple random sampling technique was used in the sampling to obtain class XI 1 MIA as an experimental class and class XI 2 MIA as
a control class. Is each course taken as many as 24 students.
C. Analysis Techniques
Before testing the hypothesis, the prerequisite test is in the form of a normality test using the Shapiro Wilk test and a homogeneity
test using the Fisher test. If the prerequisite tests have completed, then the next hypothesis test is performed using an ANCOVA test.
IV. RESULT
Based on the test results on the questions in class XII MIA Senior High School 1 Talibura, ten items obtained eight valid items with
high reliable status. In the calculation of different power, one problem is excellent, two is good, four is enough, and three is terrible. In
the calculation of the difficulty level, eight problems with medium difficulty level and two difficult questions obtained. From some
estimates on the test items collected, six items used in the research sample. The initial knowledge of the experimental class students
shown in Figure 3.
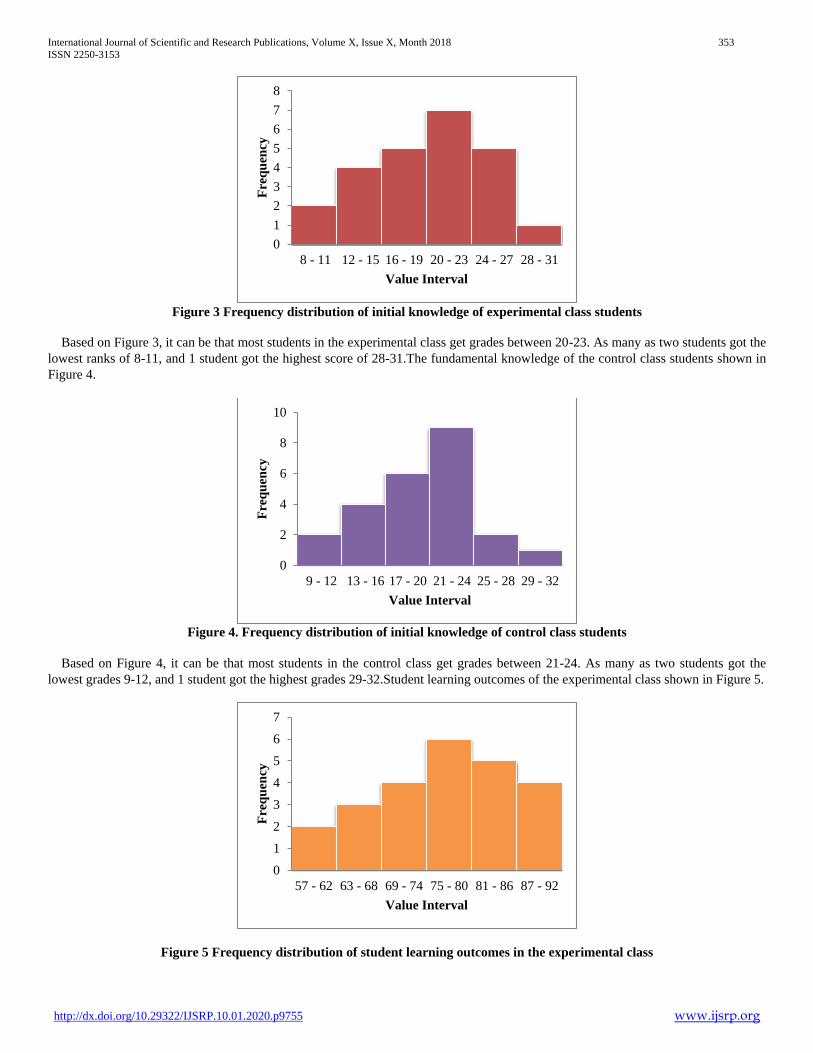
International Journal of Scientific and Research Publications, Volume X, Issue X, Month 2018 353
ISSN 2250-3153
http://dx.doi.org/10.29322/IJSRP.10.01.2020.p9755 www.ijsrp.org
Figure 3 Frequency distribution of initial knowledge of experimental class students
Based on Figure 3, it can be that most students in the experimental class get grades between 20-23. As many as two students got the
lowest ranks of 8-11, and 1 student got the highest score of 28-31.The fundamental knowledge of the control class students shown in
Figure 4.
Figure 4. Frequency distribution of initial knowledge of control class students
Based on Figure 4, it can be that most students in the control class get grades between 21-24. As many as two students got the
lowest grades 9-12, and 1 student got the highest grades 29-32.Student learning outcomes of the experimental class shown in Figure 5.
Figure 5 Frequency distribution of student learning outcomes in the experimental class
0
1
2
3
4
5
6
7
8
8 - 11 12 - 15 16 - 19 20 - 23 24 - 27 28 - 31F
req
uen
cy
Value Interval
0
2
4
6
8
10
9 - 12 13 - 16 17 - 20 21 - 24 25 - 28 29 - 32
Fre
qu
ency
Value Interval
0
1
2
3
4
5
6
7
57 - 62 63 - 68 69 - 74 75 - 80 81 - 86 87 - 92
Fre
qu
ency
Value Interval

International Journal of Scientific and Research Publications, Volume X, Issue X, Month 2018 354
ISSN 2250-3153
http://dx.doi.org/10.29322/IJSRP.10.01.2020.p9755 www.ijsrp.org
Used Figures 5 is seen that most students in the experimental class get grades between 75 - 80. A total of 2 students received the
lowest score of 57-62, and 4 students received the highest score of 87-92 — the control class student learning outcomes in Figure 6.
Figure 6 Frequency distribution of learning outcomes of control class students
Based on Figure 6, it can be that most students in the control class get grades between 48-56. A total of 4 students received the
lowest ranks of 30-38, and 1 student received the highest degree of 75-83. The results of the normality test in the experimental class
and the control class shown in Table 2.
Table 2. Normality Test Results in the Experiment Class and Control Class
Variable Experiment Control Conclusion
Early knowledge 0,272 0,514 Data normally distributed
Learning outcomes 0,186 0,443 Data normally distributed
Based on Table 2, the initial knowledge of the experimental class and control class students were 0,272 and 0,514, respectively.
Test the normality of the value of student learning outcomes in the innovative class and power class students, respectively 0,186 and
0,443. Both fundamental knowledge and learning outcomes data obtained in both types stated to generally distributed because the
significance collected is higher than the 0,05 significance level. Homogeneity test results in the experimental class and the control
class shown in Table 3.
Table 3. Homogeneity Test Results
Variable Sig. Significance level Conclusion
Early knowledge 0,875 0,05 Homogeneous variant
Learning outcomes 0,134 0,05 Homogeneous variant
Based on Table 3, fundamental knowledge and learning outcomes are 0,875 and 0,134, respectively. Because the significance
obtained is higher than 0,05, it stated that the initial knowledge data and learning outcomes have homogeneous variants. The results of
hypothesis testing using the ANCOVA test shown in Table 4.
Table 4. ANCOVA test
Source Type III Sum of Squares df Mean Square F Sig.
Corrected Model 1251,013a 2 625,506 4,484 ,017
Intercept 14911,884 1 14911,884 106,890 ,000
Early_Knowledge 60,992 1 60,992 ,437 ,512
Learning_Model 1204,084 1 1204,084 8,631 ,005
Error 6277,800 45 139,507
Total 249071,000 48
Corrected Total 7528,813 47
Based on Table 4, values of df1 = 2 and df2 = 47 are obtained so that the value of Ftable = 3,20 is obtained. In the ANCOVA test,
results obtained Fcount higher than Ftable (4,484> 3,20) with a significant value obtained is smaller than the significance level (0,017 <
0,05).From these results, concluded that the discovery-assisted used discovery learning model is effective in improving physics
learning outcomes in terms of students' initial knowledge
0
2
4
6
8
10
35 - 44 45 - 54 55 - 64 65 - 74 75 -84 85 - 94
Fre
qu
ency
Value Interval

International Journal of Scientific and Research Publications, Volume X, Issue X, Month 2018 355
ISSN 2250-3153
http://dx.doi.org/10.29322/IJSRP.10.01.2020.p9755 www.ijsrp.org
V. DISCUSSION
Based on the results of the study, note the influence of the use of discovery learning models on student physics learning outcomes
on the material balance and dynamics of rotation. The discovery learning model applied in the experimental class can influence
student learning outcomes much better than the use of conventional learning models in the control class. The increase in physics
learning outcomes in the innovative type using the discovery learning model is much higher compared to the control class using the
conventional learning model even though the knowledge possessed by students in both categories is almost the same. Therefore, it can
conclude that the discovery-assisted discovery learning model has more contribution to improving physics learning outcomes than
conventional models.
Based on the results of data analysis, the normality test of the pretest and posttest values in both classes obtained a significant
amount that is greater than the significance level 5%. Therefore, it can conclude that the data using discovery learning models and
conventional models come from normally distributed populations. In the homogeneity test conducted, it found that the data had
homogeneous variance because it was higher than the significance level of 5%.
Furthermore, in the hypothesis test using ana nova, it was found that the discovery learning model influence on the improvement of
physics learning outcomes of students of class XI MIA Senior High School 1 Talibura. The application of the discovery learning
model-assisted tracker can make students more active and independent in learning. Different from the classroom learning using
conventional models, where students tend to be passive and get bored quickly when studying physics. The test results prove that the
physics learning outcomes obtained by students greatly influenced by the application of learning models in the class. In this case, the
discovery-assisted discovery learning model tracker considered to be more effectively used in physics learning on material balance
and rotational dynamics.
VI. CONCLUSION
This study conducted to determine the effectiveness of the use of discovery-assisted discovery learning models on improving
physics learning outcomes. Based on the result of the hypothesis test, it can conclude that the discovery learning model assisted by
tracker considered more useful to be used in physics learning on the material balance and dynamic of rotation compared to using
conventional learning models.
ACKNOWLEDGMENT
The author, with all humility, expresses abundantly thanks to all those who have contributed to this research.
REFERENCES
[1] H. D. Young, R. A Freedman, and L. Ford, Sears, and Zemansky’s University Physics With Modern Physics. US: Eddison-Wesley, 2008. [2] S. Y. Erinosho, “How do Students Perceive the Difficulty of Physics in Secondary School? An Exploratory Study inNigeria,” International Journal for Cross-
Disciplinary Subjects in Education, vol. 3. 2013, pp. 1510-1515. [3] B. Suryobroto, Proses Belajar Mengajar di Sekolah. Jakarta: Rineka Cipta, 2009. [4] S. Fayanto, Misrawati, D. Sulisworo, H.F.N. Istiqomah, and L. Sukariasih, “The implementation of multimedia on physics learning based on direct instruction
model in the topic of light,” Indonesia Journal of Learning Education and Counseling, vol. 1, 2019, pp. 124-132. [5] N. Finkelstein, “HighTech Tools for Teaching Physics: The Physics Education Technology Project,” MERLOT Journal of Online Learning and Teaching, vol. 2,
2006, pp. 1-29. [6] E. Widiasworo, Strategi & metode mengajar siswa di luar kelas (outdoor learning) secara aktif, kreatif, inspiratif dan komunikatif. Yogyakarta: Ar-ruzz media,
2017. [7] I. Fitriyanto, and I. Sucahyo, “Penerapan Software Tracker Video Analyzer Pada Praktikum Kinematika Gerak,” Jurnal Inovasi Pendidikan Fisika, vol. 5, 2016,
pp. 92-97. [8] P. Hockicko, B. Trpisova, and J. Ondrus, “Correcting Students’ Misconceptions about Automobile Braking Distances and Video Analysis Using Interactive
Program Tracker,” Journal of science education and tecnology, vol. 23, 2014, pp. 763-776. [9] J. B. Gregorio, “Using Video Analysis, Microcomputer-Based Laboratories (MBL’s) and Educational Simulations as Pedagogical Tools in Revolutionizing
Inquiry Science Teaching and Learning,” K‐12 STEM Education, vol. 1, 2015, pp. 43‐64. [10] G. Singaravelu, “Discovery Learning Strategies in English,” Journal on English Language Teaching, vol. 2, 2012, pp. 57-62. [11] Gijlers, and T. D. Jong, “The Relation between Prior Knowledge and Students’ Collaborative Discovery Learning Processes,” Journal Of Research In Science
Teaching, vol. 42, 2005, pp. 264-282. [12] Daryanto, Pendekatan Pembelajaran Saintifik Kurikulum 2013. Yogyakarta: Gava Media, 2014. [13] M. Dimyati, Belajar dan Pembelajaran. Jakarta: Rineka Cipta, 2006. [14] W. Sanjaya, Perencanaan dan Desain Sistem Pembelajara. Jakarta: Kencana Prenada Media Group, 2008. [15] Ruseffendi, Dasar-dasar Penelitian Pendidikan & Bidang Non-Eksata Lainnya. Bandung: Tarsito, 2005. [16] L. K. Wee, andT. L. Lee, “Video Analysis and Modeling Tool for Physics Education: A workshop for Redesigning Pedagogy,” International Conference, 74,
2011. [17] Liliasari dan H. Rahmatan, “PengetahuanAwalCalon Guru Biologi Tentang Konsep Katabolisme Karbohidrat (Respirasi Seluler),” Jurnal Pendidikan IPA
Indonesia, vol. 1, 2012, pp. 91-99. [18] D. Fiser, andN. Frey, Background Knowledge: The Overlooked Factor in Reading Comprehension. New York: McGraw Hill, 2013. [19] D. Hu, “The Effect of Scaffolding on The Performance of Students in Computer – Based Concept Linking and Retention of Comprehension,” Dessertation,
Submitted for publication. [20] T. Hailikari, Assesing University Students’ Prior Knowledge, Implications for Theory and Practice. Helsinki: University of Helsinki Departement of Education
Research Report 227, 2009. [21] R. J. Marzano, Building Background Knowledge for Academic Achievement. USA: Association for Supervision and Curriculum Development (ASCD), 2004. [22] B. A. Pribadi, Model ASSURE untuk Mendesain Pembelajaran Sukses. Jakarta: PT Dian Rakyat, 2011.

International Journal of Scientific and Research Publications, Volume X, Issue X, Month 2018 356
ISSN 2250-3153
http://dx.doi.org/10.29322/IJSRP.10.01.2020.p9755 www.ijsrp.org
[23] Aunurrahman, Belajar dan Pembelajaran. Bandung: Alfabeta, 2014. [24] S.B. Djamarah, dan A. Zain, Strategi Belajar Mengajar. Jakarta: PT Asdi Mahastya, 2006. [25] W. Sanjaya, Perencanaan dan Desain Sistem Pembelajaran. Jakarta: Kencana Prenada Media Group, 2008.
AUTHORS
First Author – Nurfadila, Student, Universitas Ahmad Dahlan, Email. [email protected]
Second Author – Dwi Sulisworo, Lecture in Universitas Ahmad Dahlan, Email. [email protected]
Third Author – Guntur Maruto, Lecture in Universitas Ahmad Dahlan.
Fourth Author – Suritno Fayanto, Alumnus in Master of Physic Education, Universitas Ahmad Dahlan, Email.
Correspondence Author – [email protected]

International Journal of Scientific and Research Publications, Volume 10, Issue 1, January 2020 357
ISSN 2250-3153
http://dx.doi.org/10.29322/IJSRP.10.01.2020.p9756 www.ijsrp.org
Utilization of Health Facilities for Under-five
Children with Diarrhea in Indonesia: Data Analysis
of the IDHS 2017
Mussar Hadist*, Artha Prabawa**
*Department of Biostatistics and Population Studies Faculty of Public Health - Universitas Indonesia
**Department of Biostatistics and Population Studies Faculty of Public Health - Universitas Indonesia
DOI: 10.29322/IJSRP.10.01.2020.p9756
http://dx.doi.org/10.29322/IJSRP.10.01.2020.p9756
Abstract- According to the report issued by the Directorate General of Disease Control and Environmental Health, diarrhea is the
second leading cause of death among children under-five in Indonesia after pneumonia, with a proportion of 17.4 percent in post-
neonatal and 13.3 percent in infants. The proportion of children under-five with diarrhea those receiving treatment at a health facility
has increased from 65 percent in the 2012 IDHS report to 80 percent in the 2017 IDHS report. The health system in Indonesia i s a
combination of service providers by the government and private sector. This study aims to obtain the determinants of the use of health
facilities for children under-five with diarrhea in Indonesia. This study is a further data analysis from IDHS 2017. This study was an
observational analytic study with a cross-sectional design. The sample in this study were children with diarrhea aged under-five years
(0 - 59 months) who received treatment at the health facility within two weeks before the IDHS 2017 interview day, with a total sample
of 1314 children under five. The data in this study were analyzed using multiple logistic regression. The results of this study indicate
the use of previous health facilities (facilities where children are born) and the socioeconomic status of the mother is related to the
utilization of health care facilities in children-under five with diarrhea. Children under-five with diarrhea those born in private health,
the facility has a smaller chance (AOR: 0.39; 95% CI: 0.26-0.60) to receive treatment at a government health facility during diarrhea,
in other words, children under-five with diarrhea those born in private health care facilities have 2.5 times the chance to get treatment
at private health care facilities compared to children under-five those born at home. Children under-five with diarrhea from mothers
with the highest socioeconomic status have a smaller chance (AOR: 0.13; 95% CI: 0.07-0.25) to get treatment at the government health
facility, in other words, children under-five with diarrhea from mothers with the highest socioeconomic status has a 7.69 times chance
of getting treatment at a private health facility compared to children under-five who came from mothers with the lowest socioeconomic
status.
Keywords: Diare, balita 0 – 59 bulan, fasilitas kesehatan, IDHS
I. INTRODUCTION
Each year diarrhea causes of mortality in 525,000 children under-five and an estimated 1.7 billion cases of diarrheal disease are
experienced by children in the world [1]. Diarrhea is the second leading cause of mortality in children under five in Indonesia after
pneumonia, with the proportion of causes of death as large as 17.4 percent in postneonatal and as much as 13.3 percent in infants [2].
There has been a decrease in the Case Fatality Rate (CFR) of diarrhea in Indonesia between 2016 and 2017, which was 3.04 percent to
1.97 percent [3]. Over the past few decades, there has been a decrease in total global deaths from diarrhea, but morbidity due to diarrhea
has not shown the same result [1].
Although diarrhea is easily treated and managed, diarrhea is still one of the public health problems in Indonesia, especially in
infants and toddlers. According to a report from the Indonesian Demographic and Health Survey in 2017, there was 14 percent of children
aged 0-59 months suffered diarrhea in the two weeks before the survey. The percentage of children under five suffering from diarrhea
and receiving treatment at health facilities increased from 65 percent in the 2012 IDHS to 80 percent in 2017 IDHS [4].
The current health system in Indonesia is a combination of service providers by the government and the private sector [5]. The
concept of health and sickness in the community determines the utilization of health service facilities. The utilization of health services
is influenced by many factors. According to Anderson (1974) in Notoatmodjo (2003), there are three categories of individual determinants
in utilizing health service facilities, namely: predisposing, enabling, and need. Predisposing is the tendency to utilize health services
inherent in individuals. Individuals may use health services based on demographics, position in social structures, and belief in the benefits
of health services. Enabling, this category includes resources in the family and community. Family resources consist of economic status
and location of residence community resources combine with access to health care facilities and the availability of people to help. Need,
this category includes perceptions of health service needs, whether individual, social, or clinical that are evaluated by perceptions of needs
[6].

International Journal of Scientific and Research Publications, Volume 10, Issue 1, January 2020 358
ISSN 2250-3153
http://dx.doi.org/10.29322/IJSRP.10.01.2020.p9756 www.ijsrp.org
Based on the description above, this study aims to obtain determinants of the utilization of health care facilities for children under-five who had diarrhea in Indonesia from 2017 IDHS data, which is expected to produce important information in order to support

International Journal of Scientific and Research Publications, Volume 10, Issue 1, January 2020 359
ISSN 2250-3153
http://dx.doi.org/10.29322/IJSRP.10.01.2020.p9756 www.ijsrp.org
one of the government's strategies to achieve policy objectives to reduce morbidity and mortality rate due to diarrhea, through the management of standardized diarrhea sufferers in health care facilities.
II. MATERIAL AND METHOD
For this study, data were obtained from the 2017 Indonesian Demographic and Health Survey (IDHS). The Indonesian
Demographic and Health Survey (IDHS) was jointly conducted by the United States Agency for International Development (USAID),
Central Statistics Agency (BPS), the National Population and Family Planning Agency (BKKBN), and the Ministry of Health (Kemenkes)
the Republic of Indonesia which can be downloaded from the source www.measuredhs.com. The population in this study were all children
aged 0 - 59 months from female respondents who took part in the 2017 Indonesian Demographic and Health Survey [4].
The population in this study is households that had children aged less than 5 years with diarrhea were extracted from the 2017 Indonesian Demographic and Health Survey (IDHS). The sample in this study was children aged 0 - 59 months who issued diarrhea within a span of two weeks before the interview day for the 2017 Indonesian Health Demographic Survey. The number of samples in this study were 1314 children.
The dependent variable in this study is the utilization of health service facilities which are divided into two categories "0 =
private health facilities" and "1 = government health facilities". The independent variables in this study are predisposing factors and
enabling factors. Predisposing factors included in this study were maternal age (0 = 15-24 years; 1 = 25-29 years; 2 = 30-34 years; and 3
= 35 - 49 years), mother's education level (0 = none; 1 = primary; and 2 = secondary/higher), mother's occupation (0 = housewife/not
working; 1 = agriculture; 2 = semi-skille/unskilled labor; and 3 = professional / technician), marital status (0 = not married; and 1 =
married), age of child (0 = <1 year; 1 = 1-2 years; and 2 = ≥ 3 years), sex of child (0 = male; and 1 = female), family size (0 = <6 people;
and 1 = ≥ 6 people), previous use of health service facilities (0 = home; 1 = government facility; and 2 = private facility), and knowledge
of Oral Rehydration Solutions (0 = don't know; 1 = have heard; and 2 = have used). Enabling factors included in this study are
socioeconomic status (0 = lowest; 1 = lower; 2 = middle; 3 = higher; and 4 = thighest), health insurance ownership (0 = do not have; 1 =
social health insurance; 2 = government health insurance; and 3 = private health insurance), residential area (0 = Rural; and 1 = Urban),
access to media information (0 = no; and 1 = yes), and distance (0 = problem; and 1 = no problem).
The stages in data management carried out in this study are data filters, the data obtained are filtered and adjusted to the inclusion
and exclusion criteria of the study. If the respondent does not match the inclusion criteria and according to the exclusion criteria, they
will be excluded from the data set. Cleaning data, double-checking filtered data. Missing data in variables that contribute to the dependent
variable of the study will be adjusted to the provisions of handling missing data in the IDHS survey data. Recode data, the activity of
changing the encoding data following the classification specified in the study. Activities create new variables from variables that exist in
the data set. After the data management stage is carried out, the data obtained are analyzed including univariate, bivariate and multivariate
analyses with a significance of 5% and 95% confidence intervals. At the bivariate analysis stage, the output of the dependent and
independent variables is explained in the form of proportions. The bivariate analysis uses simple logistic regression while multivariate
analysis uses multiple logistic regression.
III. RESULTS
Need Factor
UNIVARIATE
Table 1. Health facilities utilization of children under-five with diarrhea in Indonesia 2017
Health Facilities n % Private Health Facilities 733 55,8 Government Health Facilities 581 44,2
Total 1314 100
In this study, the variables of health facilities visited for treatment when children under five suffer from diarrhea come from the 2017 IDHS questionnaire in the form of the question "Where did you first seek help/care when a child had diarrhea?". Based on respondents' answers to the questions on the questionnaire, the category of health facilities that were first visited when a child had diarrhea was divided into two groups of health facilities, private health facilities and government health facilities. According to the 2017 IDHS report, 80 percent of children under five suffer from diarrhea and receive treatment at a health facility. In this study, it was found that 55.7 percent of children under five suffering from diarrhea received treatment at private health facilities, while 44.3 percent received treatment at government health facilities.
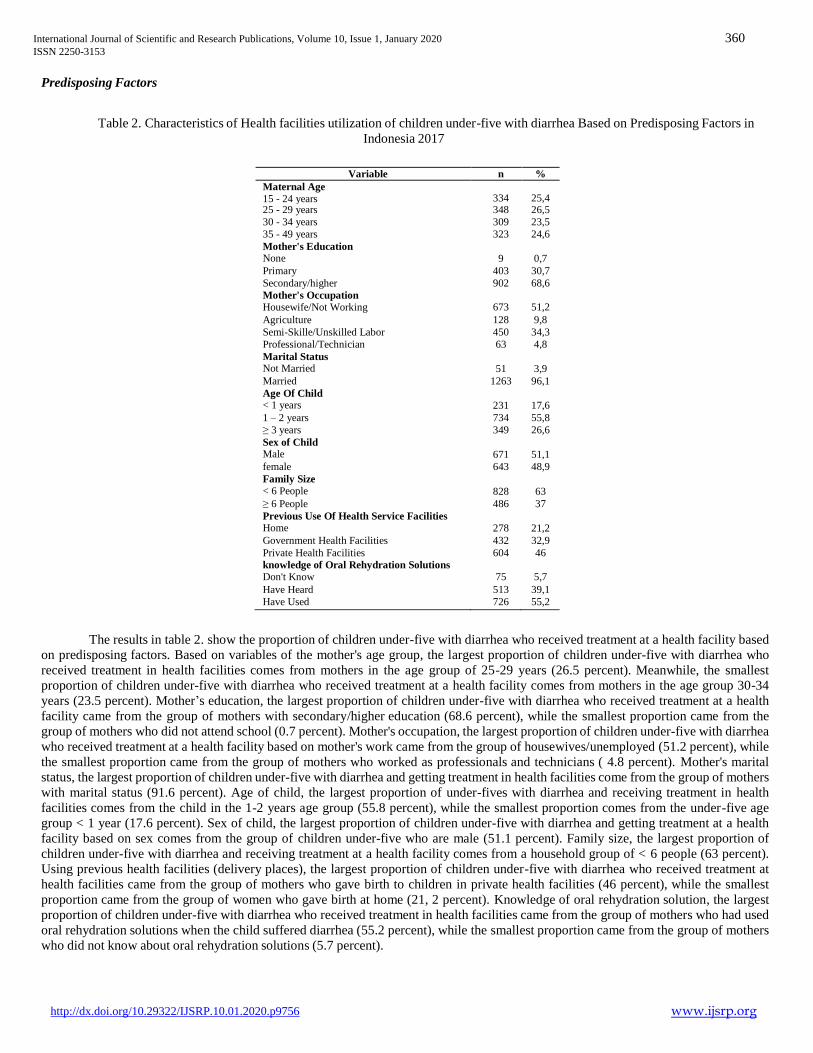
International Journal of Scientific and Research Publications, Volume 10, Issue 1, January 2020 360
ISSN 2250-3153
http://dx.doi.org/10.29322/IJSRP.10.01.2020.p9756 www.ijsrp.org
Predisposing Factors
Table 2. Characteristics of Health facilities utilization of children under-five with diarrhea Based on Predisposing Factors in
Indonesia 2017
Variable n %
Maternal Age 15 - 24 years
334
25,4
25 - 29 years 348 26,5
30 - 34 years 309 23,5
35 - 49 years 323 24,6
Mother's Education None
9
0,7
Primary 403 30,7
Secondary/higher
Mother's Occupation Housewife/Not Working
902
673
68,6
51,2
Agriculture 128 9,8
Semi-Skille/Unskilled Labor 450 34,3
Professional/Technician 63 4,8
Marital Status Not Married
51
3,9
Married 1263 96,1
Age Of Child < 1 years
231
17,6
1 – 2 years 734 55,8
≥ 3 years 349 26,6
Sex of Child Male
671
51,1
female 643 48,9
Family Size < 6 People
828
63
≥ 6 People 486 37
Previous Use Of Health Service Facilities Home
278
21,2
Government Health Facilities 432 32,9
Private Health Facilities knowledge of Oral Rehydration Solutions Don't Know
604
75
46
5,7
Have Heard 513 39,1
Have Used 726 55,2
The results in table 2. show the proportion of children under-five with diarrhea who received treatment at a health facility based
on predisposing factors. Based on variables of the mother's age group, the largest proportion of children under-five with diarrhea who
received treatment in health facilities comes from mothers in the age group of 25-29 years (26.5 percent). Meanwhile, the smallest
proportion of children under-five with diarrhea who received treatment at a health facility comes from mothers in the age group 30-34
years (23.5 percent). Mother’s education, the largest proportion of children under-five with diarrhea who received treatment at a health
facility came from the group of mothers with secondary/higher education (68.6 percent), while the smallest proportion came from the
group of mothers who did not attend school (0.7 percent). Mother's occupation, the largest proportion of children under-five with diarrhea
who received treatment at a health facility based on mother's work came from the group of housewives/unemployed (51.2 percent), while
the smallest proportion came from the group of mothers who worked as professionals and technicians ( 4.8 percent). Mother's marital
status, the largest proportion of children under-five with diarrhea and getting treatment in health facilities come from the group of mothers
with marital status (91.6 percent). Age of child, the largest proportion of under-fives with diarrhea and receiving treatment in health
facilities comes from the child in the 1-2 years age group (55.8 percent), while the smallest proportion comes from the under-five age
group < 1 year (17.6 percent). Sex of child, the largest proportion of children under-five with diarrhea and getting treatment at a health
facility based on sex comes from the group of children under-five who are male (51.1 percent). Family size, the largest proportion of
children under-five with diarrhea and receiving treatment at a health facility comes from a household group of < 6 people (63 percent).
Using previous health facilities (delivery places), the largest proportion of children under-five with diarrhea who received treatment at
health facilities came from the group of mothers who gave birth to children in private health facilities (46 percent), while the smallest
proportion came from the group of women who gave birth at home (21, 2 percent). Knowledge of oral rehydration solution, the largest
proportion of children under-five with diarrhea who received treatment in health facilities came from the group of mothers who had used
oral rehydration solutions when the child suffered diarrhea (55.2 percent), while the smallest proportion came from the group of mothers
who did not know about oral rehydration solutions (5.7 percent).
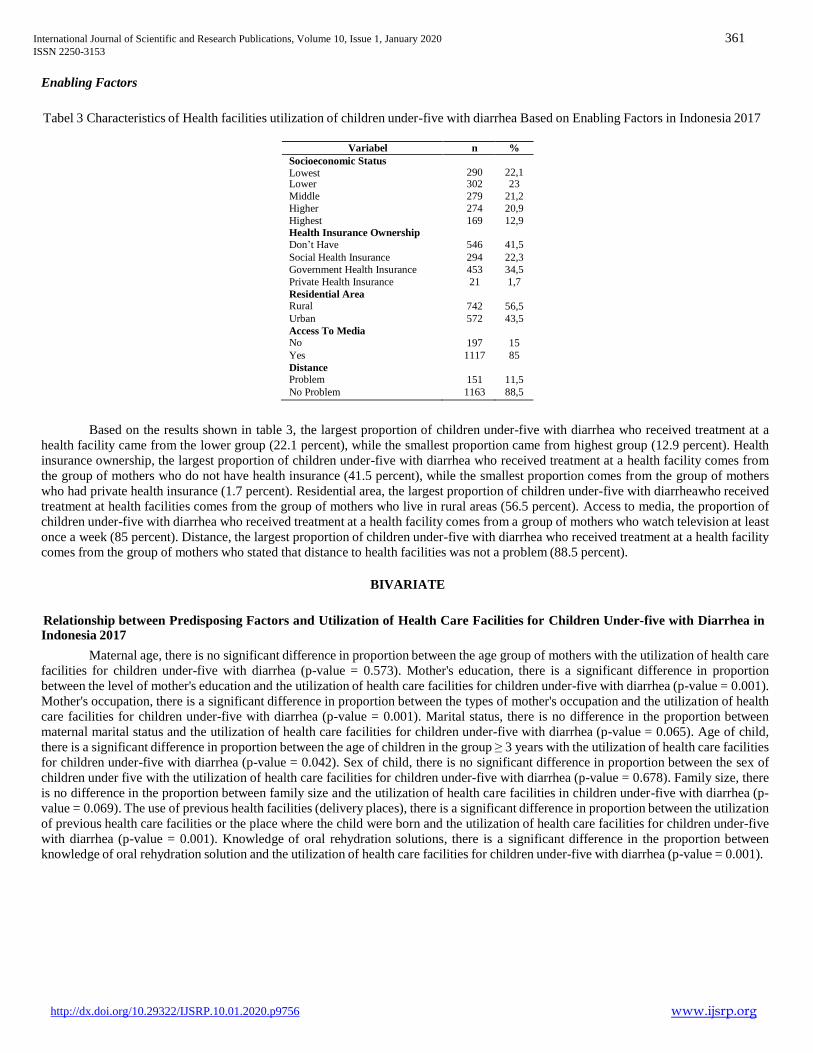
International Journal of Scientific and Research Publications, Volume 10, Issue 1, January 2020 361
ISSN 2250-3153
http://dx.doi.org/10.29322/IJSRP.10.01.2020.p9756 www.ijsrp.org
Enabling Factors
Tabel 3 Characteristics of Health facilities utilization of children under-five with diarrhea Based on Enabling Factors in Indonesia 2017
Variabel n %
Socioeconomic Status Lowest
290
22,1
Lower 302 23
Middle 279 21,2
Higher 274 20,9
Highest Health Insurance Ownership Don’t Have
169
546
12,9
41,5
Social Health Insurance 294 22,3
Government Health Insurance 453 34,5
Private Health Insurance 21 1,7
Residential Area Rural
742
56,5
Urban 572 43,5
Access To Media No
197
15
Yes 1117 85
Distance Problem
151
11,5
No Problem 1163 88,5
Based on the results shown in table 3, the largest proportion of children under-five with diarrhea who received treatment at a
health facility came from the lower group (22.1 percent), while the smallest proportion came from highest group (12.9 percent). Health
insurance ownership, the largest proportion of children under-five with diarrhea who received treatment at a health facility comes from
the group of mothers who do not have health insurance (41.5 percent), while the smallest proportion comes from the group of mothers
who had private health insurance (1.7 percent). Residential area, the largest proportion of children under-five with diarrheawho received
treatment at health facilities comes from the group of mothers who live in rural areas (56.5 percent). Access to media, the proportion of
children under-five with diarrhea who received treatment at a health facility comes from a group of mothers who watch television at least
once a week (85 percent). Distance, the largest proportion of children under-five with diarrhea who received treatment at a health facility
comes from the group of mothers who stated that distance to health facilities was not a problem (88.5 percent).
BIVARIATE
Relationship between Predisposing Factors and Utilization of Health Care Facilities for Children Under-five with Diarrhea in Indonesia 2017
Maternal age, there is no significant difference in proportion between the age group of mothers with the utilization of health care
facilities for children under-five with diarrhea (p-value = 0.573). Mother's education, there is a significant difference in proportion
between the level of mother's education and the utilization of health care facilities for children under-five with diarrhea (p-value = 0.001).
Mother's occupation, there is a significant difference in proportion between the types of mother's occupation and the utilization of health
care facilities for children under-five with diarrhea (p-value = 0.001). Marital status, there is no difference in the proportion between
maternal marital status and the utilization of health care facilities for children under-five with diarrhea (p-value = 0.065). Age of child,
there is a significant difference in proportion between the age of children in the group ≥ 3 years with the utilization of health care facilities
for children under-five with diarrhea (p-value = 0.042). Sex of child, there is no significant difference in proportion between the sex of
children under five with the utilization of health care facilities for children under-five with diarrhea (p-value = 0.678). Family size, there
is no difference in the proportion between family size and the utilization of health care facilities in children under-five with diarrhea (p-
value = 0.069). The use of previous health facilities (delivery places), there is a significant difference in proportion between the utilization
of previous health care facilities or the place where the child were born and the utilization of health care facilities for children under-five
with diarrhea (p-value = 0.001). Knowledge of oral rehydration solutions, there is a significant difference in the proportion between
knowledge of oral rehydration solution and the utilization of health care facilities for children under-five with diarrhea (p-value = 0.001).
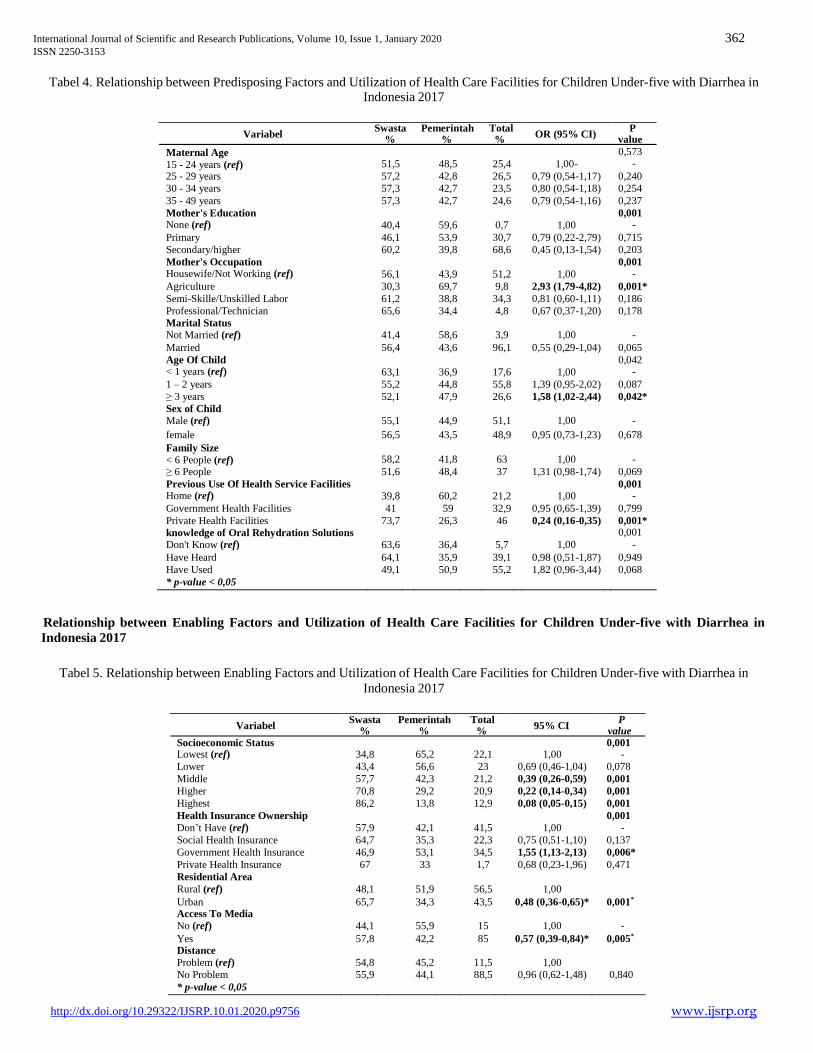
International Journal of Scientific and Research Publications, Volume 10, Issue 1, January 2020 362
ISSN 2250-3153
http://dx.doi.org/10.29322/IJSRP.10.01.2020.p9756 www.ijsrp.org
Tabel 4. Relationship between Predisposing Factors and Utilization of Health Care Facilities for Children Under-five with Diarrhea in Indonesia 2017
Variabel
Swasta Pemerintah Total OR (95% CI)
P % % % value
Maternal Age 15 - 24 years (ref)
51,5
48,5
25,4
1,00-
0,573 -
25 - 29 years 57,2 42,8 26,5 0,79 (0,54-1,17) 0,240
30 - 34 years 57,3 42,7 23,5 0,80 (0,54-1,18) 0,254
35 - 49 years 57,3 42,7 24,6 0,79 (0,54-1,16) 0,237
Mother's Education None (ref)
40,4
59,6
0,7
1,00
0,001 -
Primary 46,1 53,9 30,7 0,79 (0,22-2,79) 0,715
Secondary/higher 60,2 39,8 68,6 0,45 (0,13-1,54) 0,203
Mother's Occupation Housewife/Not Working (ref)
56,1
43,9
51,2
1,00
0,001 -
Agriculture 30,3 69,7 9,8 2,93 (1,79-4,82) 0,001*
Semi-Skille/Unskilled Labor 61,2 38,8 34,3 0,81 (0,60-1,11) 0,186
Professional/Technician
Marital Status Not Married (ref)
65,6
41,4
34,4
58,6
4,8
3,9
0,67 (0,37-1,20)
1,00
0,178
-
Married 56,4 43,6 96,1 0,55 (0,29-1,04) 0,065
Age Of Child < 1 years (ref)
63,1
36,9
17,6
1,00
0,042 -
1 – 2 years 55,2 44,8 55,8 1,39 (0,95-2,02) 0,087
≥ 3 years
Sex of Child Male (ref)
52,1
55,1
47,9
44,9
26,6
51,1
1,58 (1,02-2,44)
1,00
0,042*
-
female 56,5 43,5 48,9 0,95 (0,73-1,23) 0,678
Family Size < 6 People (ref)
58,2
41,8
63
1,00
-
≥ 6 People 51,6 48,4 37 1,31 (0,98-1,74) 0,069
Previous Use Of Health Service Facilities Home (ref)
39,8
60,2
21,2
1,00
0,001 -
Government Health Facilities 41 59 32,9 0,95 (0,65-1,39) 0,799
Private Health Facilities knowledge of Oral Rehydration Solutions Don't Know (ref)
73,7
63,6
26,3
36,4
46
5,7
0,24 (0,16-0,35)
1,00
0,001* 0,001
-
Have Heard 64,1 35,9 39,1 0,98 (0,51-1,87) 0,949
Have Used 49,1 50,9 55,2 1,82 (0,96-3,44) 0,068
* p-value < 0,05
Relationship between Enabling Factors and Utilization of Health Care Facilities for Children Under-five with Diarrhea in
Indonesia 2017
Tabel 5. Relationship between Enabling Factors and Utilization of Health Care Facilities for Children Under-five with Diarrhea in
Indonesia 2017
Variabel
Swasta Pemerintah Total 95% CI
P % % % value
Socioeconomic Status 0,001 Lowest (ref) 34,8 65,2 22,1 1,00 -
Lower 43,4 56,6 23 0,69 (0,46-1,04) 0,078
Middle 57,7 42,3 21,2 0,39 (0,26-0,59) 0,001
Higher 70,8 29,2 20,9 0,22 (0,14-0,34) 0,001
Highest 86,2 13,8 12,9 0,08 (0,05-0,15) 0,001
Health Insurance Ownership 0,001
Don’t Have (ref) 57,9 42,1 41,5 1,00 -
Social Health Insurance 64,7 35,3 22,3 0,75 (0,51-1,10) 0,137
Government Health Insurance 46,9 53,1 34,5 1,55 (1,13-2,13) 0,006*
Private Health Insurance 67 33 1,7 0,68 (0,23-1,96) 0,471
Residential Area Rural (ref) 48,1 51,9 56,5 1,00 Urban 65,7 34,3 43,5 0,48 (0,36-0,65)* 0,001*
Access To Media No (ref) 44,1 55,9 15 1,00 -
Yes 57,8 42,2 85 0,57 (0,39-0,84)* 0,005*
Distance Problem (ref) 54,8 45,2 11,5 1,00 No Problem 55,9 44,1 88,5 0,96 (0,62-1,48) 0,840
* p-value < 0,05
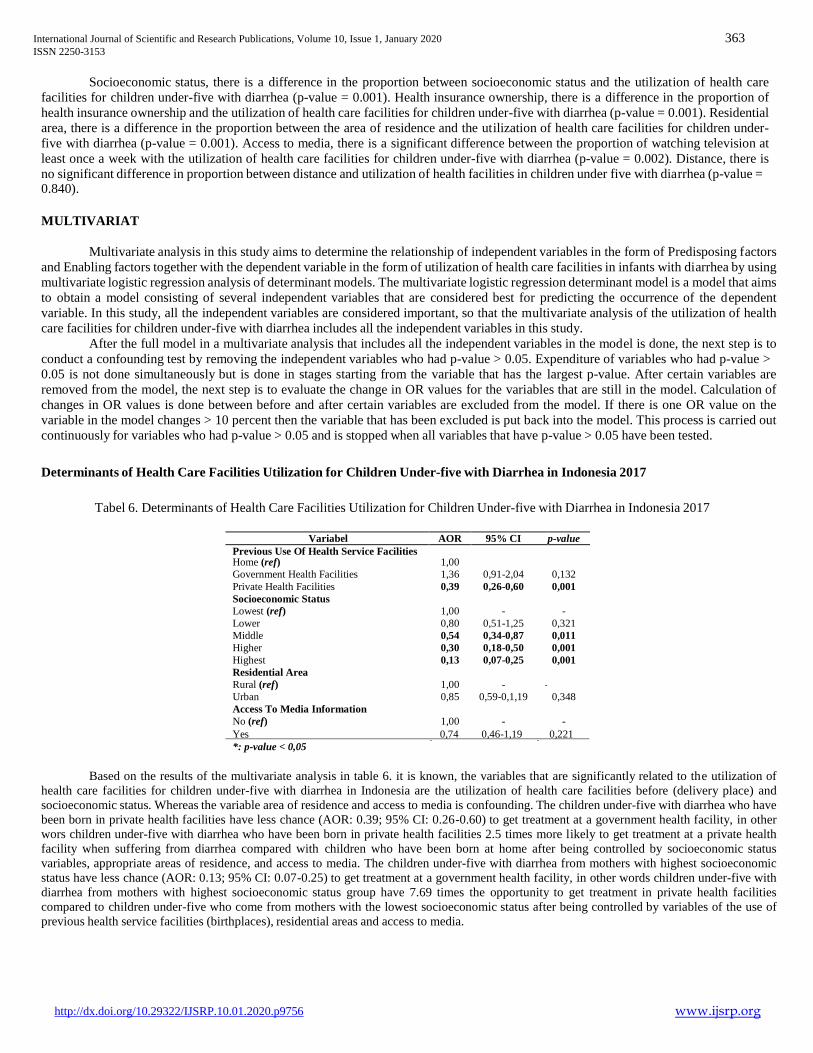
International Journal of Scientific and Research Publications, Volume 10, Issue 1, January 2020 363
ISSN 2250-3153
http://dx.doi.org/10.29322/IJSRP.10.01.2020.p9756 www.ijsrp.org
Socioeconomic status, there is a difference in the proportion between socioeconomic status and the utilization of health care
facilities for children under-five with diarrhea (p-value = 0.001). Health insurance ownership, there is a difference in the proportion of
health insurance ownership and the utilization of health care facilities for children under-five with diarrhea (p-value = 0.001). Residential
area, there is a difference in the proportion between the area of residence and the utilization of health care facilities for children under-
five with diarrhea (p-value = 0.001). Access to media, there is a significant difference between the proportion of watching television at
least once a week with the utilization of health care facilities for children under-five with diarrhea (p-value = 0.002). Distance, there is
no significant difference in proportion between distance and utilization of health facilities in children under five with diarrhea (p-value = 0.840).
MULTIVARIAT
Multivariate analysis in this study aims to determine the relationship of independent variables in the form of Predisposing factors
and Enabling factors together with the dependent variable in the form of utilization of health care facilities in infants with diarrhea by using
multivariate logistic regression analysis of determinant models. The multivariate logistic regression determinant model is a model that aims
to obtain a model consisting of several independent variables that are considered best for predicting the occurrence of the dependent
variable. In this study, all the independent variables are considered important, so that the multivariate analysis of the utilization of health
care facilities for children under-five with diarrhea includes all the independent variables in this study.
After the full model in a multivariate analysis that includes all the independent variables in the model is done, the next step is to
conduct a confounding test by removing the independent variables who had p-value > 0.05. Expenditure of variables who had p-value >
0.05 is not done simultaneously but is done in stages starting from the variable that has the largest p-value. After certain variables are
removed from the model, the next step is to evaluate the change in OR values for the variables that are still in the model. Calculation of
changes in OR values is done between before and after certain variables are excluded from the model. If there is one OR value on the
variable in the model changes > 10 percent then the variable that has been excluded is put back into the model. This process is carried out
continuously for variables who had p-value > 0.05 and is stopped when all variables that have p-value > 0.05 have been tested.
Determinants of Health Care Facilities Utilization for Children Under-five with Diarrhea in Indonesia 2017
Tabel 6. Determinants of Health Care Facilities Utilization for Children Under-five with Diarrhea in Indonesia 2017
Variabel AOR 95% CI p-value
Previous Use Of Health Service Facilities Home (ref) 1,00 Government Health Facilities 1,36 0,91-2,04 0,132
Private Health Facilities 0,39 0,26-0,60 0,001
Socioeconomic Status Lowest (ref) 1,00 - -
Lower 0,80 0,51-1,25 0,321
Middle 0,54 0,34-0,87 0,011
Higher 0,30 0,18-0,50 0,001
Highest 0,13 0,07-0,25 0,001
Residential Area Rural (ref) 1,00 - - Urban 0,85 0,59-0,1,19 0,348
Access To Media Information No (ref) 1,00 - -
Yes 0,74 0,46-1,19 0,221
*: p-value < 0,05
Based on the results of the multivariate analysis in table 6. it is known, the variables that are significantly related to the utilization of
health care facilities for children under-five with diarrhea in Indonesia are the utilization of health care facilities before (delivery place) and
socioeconomic status. Whereas the variable area of residence and access to media is confounding. The children under-five with diarrhea who have
been born in private health facilities have less chance (AOR: 0.39; 95% CI: 0.26-0.60) to get treatment at a government health facility, in other
wors children under-five with diarrhea who have been born in private health facilities 2.5 times more likely to get treatment at a private health
facility when suffering from diarrhea compared with children who have been born at home after being controlled by socioeconomic status
variables, appropriate areas of residence, and access to media. The children under-five with diarrhea from mothers with highest socioeconomic
status have less chance (AOR: 0.13; 95% CI: 0.07-0.25) to get treatment at a government health facility, in other words children under-five with
diarrhea from mothers with highest socioeconomic status group have 7.69 times the opportunity to get treatment in private health facilities
compared to children under-five who come from mothers with the lowest socioeconomic status after being controlled by variables of the use of
previous health service facilities (birthplaces), residential areas and access to media.

International Journal of Scientific and Research Publications, Volume 10, Issue 1, January 2020 364
ISSN 2250-3153
http://dx.doi.org/10.29322/IJSRP.10.01.2020.p9756 www.ijsrp.org
IV. DISCUSSION
Predisposing factors illustrate that each individual has a tendency to use different health services due to different individual
characteristics. These characteristics can be classified into three groups named in the form of demographic characteristics, such as gender,
age, marital status; social structure, which reflects a person's status in the environment such as education and employment levels; and
Health belief or belief, that selected health services can heal. [6].
Among these predisposing factors related to the utilization of health service facilities for diarrhea infants in Indonesia is the use
of previous health service facilities (delivery places). Previous experience in the use of health care facilities can be a reference for mothers
in seeking medical care when their children had diarrhea. With direct experience with health facilities or health workers, mothers will know
where medical help can be obtained when their child experiences pain. The results of this study indicate there is a relationship between the
utilization of health care facilities before (delivery place) with the utilization of health care facilities for children under-five with diarrhea.
In children who have been born in health facilities or private health workers are more likely to get treatment in health facilities or private
health workers compared to children who have been born at home. This is in line with research conducted in India that compares the use
of government health facilities with non-users as well as the utilization of private health care facilities with non-users found that compared
with children who have been born at home, the group of children who have been born in health facilities tended to bring their child to
health care facilities when children under-five suffer from diarrhea [7].
According to Anderson (1974) in Notoatmodjo (2003), enabling factors are a description of conditions or conditions that make a
person able to take action to meet the needs of health services. Enabling factors to consist of family resources in the form of family income,
the level of participation in health insurance, the ability to purchase health services and the knowledge of health care information needed.
Community resources, such as the number of health service facilities available, the number of health workers available in the area, the ratio
of population to health workers, and the location of residential areas. In this study, the variables used to describe the utilization of health
care facilities in infants with diarrhea based on these enabling factors in the form of socioeconomic status, ownership of health insurance,
residential areas, access to information media and distance to health care facilities [6]. Among these enabling factors, in this study, it was
found that associated with the utilization of health care facilities for children under-five with diarrhea in Indonesia is socioeconomic status.
Diarrhea patients with diarrhea originating from the top wealth index quintile tend to get treatment in private health facilities compared to
diarrhea sufferers from the lowest group.
This shows that government health facilities are the choice to get treatment for most of the children under five with diarrhea from
the group of mothers who come from the lower middle and lower socioeconomic status. This result is in line with research conducted by
Bunsoth et.al (2013) in Cambodia which showed that the group of mothers who were in the middle This shows that government health
facilities are the choice to get treatment for most of the children under five with diarrhea from the group of mothers who come from the
lower middle and lower socioeconomic status. This result is in line with research conducted by Bunsoth et.al (2013) in Cambodia which
showed that the group of mothers who were in the middle significantly tended to utilize private health care facilities when their children
were sick compared to mothers who were at the lowest level [8]. Similar results were also found in studies conducted by Thin (2005) in
Indonesia, compared with toddlers who came from families with the lowest asset index scores, while children who came from families
with the highest asset index scores tended to use private service facilities when their children have respiratory infections [9]. In line with
this, research conducted in India found that, in the group of mothers who came from the richest households, they had almost 3 times the
opportunity to bring their children to private health care facilities when experiencing diarrhea compared to mothers from the poorest
households [7].
V. CONCLUSION
This study found that 55.7 percent of children under five suffering from diarrhea in Indonesia 2017 received treatment at a private
health facility, while another 44.3 percent received treatment at a government health facility. Predisposing factors in the form of the use of
previous health service facilities (delivery places) and enabling factors in the form of socioeconomic status are related to the utilization of
health care facilities for children under-five with diarrhea in Indonesia.
VI. SUGGESTION
Factors related to the utilization of health service facilities for infants with diarrhea in Indonesia are in the form of mothers'
experience in the use of previous health service facilities (delivery places) and the mother's socioeconomic status. The Indonesian
government needs to make efforts to require every health worker who helps with the delivery process to provide sufficient information
about the health of children under five to post-partum mothers by health workers who assist in the delivery process in health care facilities.
The information conveyed includes symptoms of the disease to the actions that can be taken by the mother if a children has diarrhea. With
the discovery of dominant factors related to the utilization of health service facilities for children under-five with diarrhea in the form of
socioeconomic status, it is expected for the government to be able to provide maximum services for children under-five with diarrhea
especially children who come from the lowest socioeconomic status.

International Journal of Scientific and Research Publications, Volume 10, Issue 1, January 2020 365
ISSN 2250-3153
http://dx.doi.org/10.29322/IJSRP.10.01.2020.p9756 www.ijsrp.org
VII. REFERENCES
[1] WHO, “Diarrhoeal disease,” 2017. [Online]. Available: https://www.who.int/news-room/fact-sheets/detail/diarrhoeal-disease.
[2] Ditjen P2PL, Rencana Aksi Program Pengendalian Penyakit dan Penyehatan Lingkungan Tahun 2015-2019. Jakarta: Direktorat Jenderal Pengendalian Penyakit dan Penyehatan Lingkungan, 2015.
[3] Kemenkes RI, Profile Kesehatan Indonesia Tahun 2017. Jakarta: Kementerian Kesehatan Republik Indonesia, 2018. [4] BKKBN, BPS, Kemenkes RI, and USAID, Survei Demografi dan Kesehatan Indonesia 2017. Jakarta, 2018. [5] Y. Mahendradhata et al., Health Systems in Transition. The Republic of Indonesia Health System Review., vol. 7, no. 1. New Delhi, India: SEARO Library,
World Health Organization, Regional Office for South-East Asia., 2017.
[6] S. Notoatmodjo, Pendidikan dan Perilaku Kesehatan. Jakarta: Rineka Cipta, 2003.
[7] Sreeramareddy, C. T, Sathyanarayana, and H. N. H. T N Kumar, “Utilization of Health Care Services for Childhood Morbidity and Associated Factors in India: A National Cross-Sectional Household Survey,” PLoS One, vol. 7, no. 12, pp. e51904–e51904, Dec. 2012.
[8] M. Bunsoth, S. Lundy, and N. Sarun, “Factors Associated with Utilization of Health Services in Childhood Diarrhea and Fever in Cambodia: Further Analysis of the Cambodia Demographic and Health Survey.,” 2013.
[9] A. Thind, “Analysis of health services use for respiratory illness in Indonesian children: Implications for policy,” J. Biosoc. Sci., vol. 37, no. 2, pp. 129–142,
2005.
AUTHOR
First Author – Mussar Hadist, Department of Biostatistics and Population Studies Faculty of Public Health - Universitas
Indonesia
Second Author – Artha Prabawa, Department of Biostatistics and Population Studies Faculty of Public Health - Universitas Indonesia
Correspondence Author – Mussar Hadist
Email: [email protected] / [email protected]
Phone : +628812107862
International Journal of Scientific and Research Publications, Volume 10, Issue 1, January 2020 366
ISSN 2250-3153
http://dx.doi.org/10.29322/IJSRP.10.01.2020.p9757 www.ijsrp.org
Accuracy Between Dermoscopy Overview And
Moisture Checker In Assessing Skin Moisture Level On
Pediatric Nephrotic Syndrome Patients
Ramayanti boru Simandjuntak*, Sri Wahyuni Purnama**, Irma Damayanti Roesyanto-Mahadi**
* Post graduate of Dermatology and Venereology, Faculty of Medicine, Universitas Sumatera Utara, Medan, Indonesia **Departement of Dermatology and Venereology, Faculty of Medicine, Universitas Sumatera Utara, Medan, Indonesia
DOI: 10.29322/IJSRP.10.01.2020.p9757
http://dx.doi.org/10.29322/IJSRP.10.01.2020.p9757
Abstract- Background: Xerosis cutis (dry skin) is a common
condition experienced by millions of people, influenced by
exogenous and endogeneous factors. Excessive bathing as an
exogenous factor can cause dry skin. Endogenous factors such as
chronic diseases and the use of certain medications can also affect
skin moisture. Nephrotic syndrome (SN) is a common kidney
disease in children and is characterized by the presence of protein
that is released from the blood vessels and into the urine due to
glomerular damage. Manifestations of xerosis cutis in the form of
dull-looking have also been linked to the use of high dose diuretics
in SN. Skin moisture examination can be evalutaed with
dermoscopy and moisture checker. Methods: This is an
observational study with cross sectional design which involved 40
research subjects in which patients with pediatric nephrotic
syndrome who met the inclusion and exclusion criteria were
examined for skin moisture using a moisture checker and then
dermoscopy. The results of the study were then analyzed to
determine the Kappa value. Result: The most subjects in this study
were male, 27 people (67,5%) with the majority of the age group
10-15 years, as many as 17 people (42,5%) of a total of 40 research
subjects. The results of the examination with a moisture checker
showed as many as 24 people (60%) had normal skin moisture
checker and as many as 26 people (65%) in the dermoscopy
overview did not show any scale. The value of accuracy between
dermoscopy overview and moisture checker in assessing skin
moisture level on pediatric nephrotic syndrome shows a kappa
value of 0,622. Conclusion: The value of accuracy between
dermoscopy overview and moisture checker in assessing skin
moisture level on pediatric nephrotic syndrome is good (kappa
value = 0,622)
Index Terms- accuracy, dermoscopy, moisture checker, skin
moisture.
I. BACKGROUND
erosis cutis or dry skin is a common condition experienced
by millions of people. It could be an acute or chronic
condition as the consequences of environment, drug consumption,
aging or other diseases. Most people get dry skin in their life, with
a wide range of moisture.1 There are three important keys take part
in dry skin. They are: bounding substance called natural
moisturizing factor (NMF), fat skin and ceramide, and viable
network in epidermal layer mediated by aquaporin water
channel.2,3
There are two factors involved in dry skin. They are
endogenous and exogenous factor. Winter and summer are
exogenous factors contributing to dry skin. Excessive bath also
contributes to dry skin.4-7 There are many skin cleansers
containing surfactant that could extract and emulsify fat in skin
surface and intercellular fat between corneocyte and epidermis
resulting in disruption of skin barrier.8 Endogenous factors also
contribute to dry skin. The prevalence of dry skin increases with
aging. This is caused by disorder in keratinization and depletion
of lipid content in corneal layer. On the other hand, a chronic
disease and certain medications could evolve in dry skin.3,4,7
Nephrotic syndrome is a common kidney disease found
in children. It is marked with protein loss from blood to urin as the
impact of glomerular disruption. Nephrotic syndrome is defined
with proteinuria >40 mg/m2/hour or protein/creatinin ratio >200
mg/mL or protein +3 on urine dipstic test, hypoalbuminemia <25
g/L and edema.8
Nephrotic syndrome in paediatric group could occur
congenitally in the first 3 months of life.8,9 In such condition, a
genetic mutation is usually the culprit, affecting podocytes of
glomerular basal membrane. Even rare, the condition could also
be caused by cytomegalovirus infection congenitally. Nowadays,
it is yet unknown the most common etiology underlying it
(idiopathic). Glomerular disorder, vasculitis, infection, toxin,
malignancy, and genetic mutation might be the causative agent.
Some complications could occur as direct impact of the disease or
related to its medication. One of the complications on skin
integument system is dermatitis. Its effect on skin moisture is not
rare. The lack of NMF or aquaporin are the theory proposed by
some experts.8,10
Until this day, there are still limited publications
reporting the exact number of dry skin in nephrotic syndrome. The
predicted prevalence of dry skin is 50-58% in kidney failure
patient undergoing routine dialysis.11,12 It is stated that dry skin is
the most common skin disorder found on patients with chronically
ill kidney.13 One of the causes of dry skin is the decrease and
disrupt of functions of sebaceous gland resulting in epithelial cell
dehydration.13,14
It has been proved dermatologically and histologically
that uremia could reduce sweat volume.12,14 In such patients,
X

International Journal of Scientific and Research Publications, Volume 10, Issue 1, January 2020 367
ISSN 2250-3153
http://dx.doi.org/10.29322/IJSRP.10.01.2020.p9757 www.ijsrp.org
atrophy of sebaceous gland has also been revealed. Some patients
even suffered from ichtyosis and was linked to the tiers of kidney
damage. Dry skin has also been linked to the use of high dose
diuretic and excessive ultrafiltration.12,13 Dry skin are related to the
change of skin barrier where the dry skin will be more vulnerable
to irritation.7,11,14 A lesion on skin could be the source of infection
which will exaggerate the primary disease. Because of that,
patients suffering from dry skin need emolient to moisten their
skin.15 Patients also need to be informed not to bath using too
much soap because it will irritate the skin.8,16 Lotion application
containing urea 10% with dexpantenol supposed to reduce eritema
and scale on patients suffering dry skin.
Dry skin can be diagnosed clinically with additional
tools. Arid and dull skin are the cardinal sign on clinical
examination. Beside that, scale and fissure could be found also.17
The additional tools used in dry skin are dermoscopy and moisture
checker. Dermoscopy is a non-invasif technique which can
visualize the epidermal layer and structures underlying it with
more magnification.18 However, dermoscopy is relatively more
expensive and a long experience from the expertise is needed to
get a more objective value. Contrary, moisture checker is
relatively cheaper, more practical, and more objective.19
In this study, the moisture of the skin of children
suffering from nephrotic syndrome will be evaluated by moisture
checker. Thus, the accuracy with the feature of dermoscopy will
be analyzed.
II. OBJECTIVE
To asses the accuracy between moisture checker and
dermoscopy in evaluating skin moisture in children suffering from
nephrotic syndrome.
III. MATERIALS AND METHODS
This is an observational study with cross sectional
design. This study was done from April till December 2019 in
nephrology division pediatric outpatient clinic and dermato-
venereology outpatient clinic, Haji Adam Malik General Hospital
Medan, Indonesia. The subjects are children suffering from
nephrotic syndrome who came to the clinics fulfilling the
inclusion and exclusion criteria. The total of the subjects in this
study are 40 people. They are taken with concecutive sampling
method. All patients diagnosed with nephrotic syndrome in
nephrology division pediatric and dermato-venereology outpatient
clinic, Haji Adam Malik General Hospital are the inclusion
criteria. While the exclusion criteria are patients that have been
treated with emolient, have other keratinization disorders, and
refused to participate in this study.
This study was begun with explanation of the disease to
the patient and his/her family and the purpose, procedure, and
benefit of the test. After obtaining the consent from his/her parent,
the demographic features, history taking, clinical and
dermatological examination of the patient will be recorded. Lastly,
the moisture of the skin will be recorded by using dermoscopy and
moisture checker. Moisture checker Scalar type MY-808S and
dermoscopy with its brand firefly are the tools used in this study.
The procedure was begun by swabbing the tested skin area with
alcohol 70%, then the dermoscopy was put on the skin. Some
aspects which was evaluated are scale, fissure, erythema, and
wether the skin is arid or not. Moreover, a moisture checker was
put on the skin measured. The results would be displayed on the
form of percentage. The results would be classified into 3
interpretations which was adjusted with the part of skin test. The
skin area choosen to be tested in this study was inner upper arm.
The skin was classified as dry if the value of moisture checker was
<37%, normal if the value was 37–45%, and moist if the value was
>45%. The data obtained from this study will be analyzed
statistically to get kappa value.
IV. RESULTS
All the subjects in this study was first diagnosed with
nephrotic syndrome in the clinics stated above. All the subjects
experienced history taking, clinical examination, dermatological
examination using dermoscopy, and skin moisture measurement
using moisture checker.
The demographic characteristics of the subjects were
displayed based on gender and age.
Table 1. Subjects distribution based on gender
Gender Subjects
n %
Boy 27 67,5 %
Girl 13 32,5 %
Total 40 100%
The total number of the subjects was 40 people, with the proportion of boys are 27 people (67,5%) and the proportion of girls
are 13 people (32,5%). The results show that boys suffering from nephrotic syndrome is more than girls.
Table 2. Subjects distribution based on age
Age (year) Subjects
n %
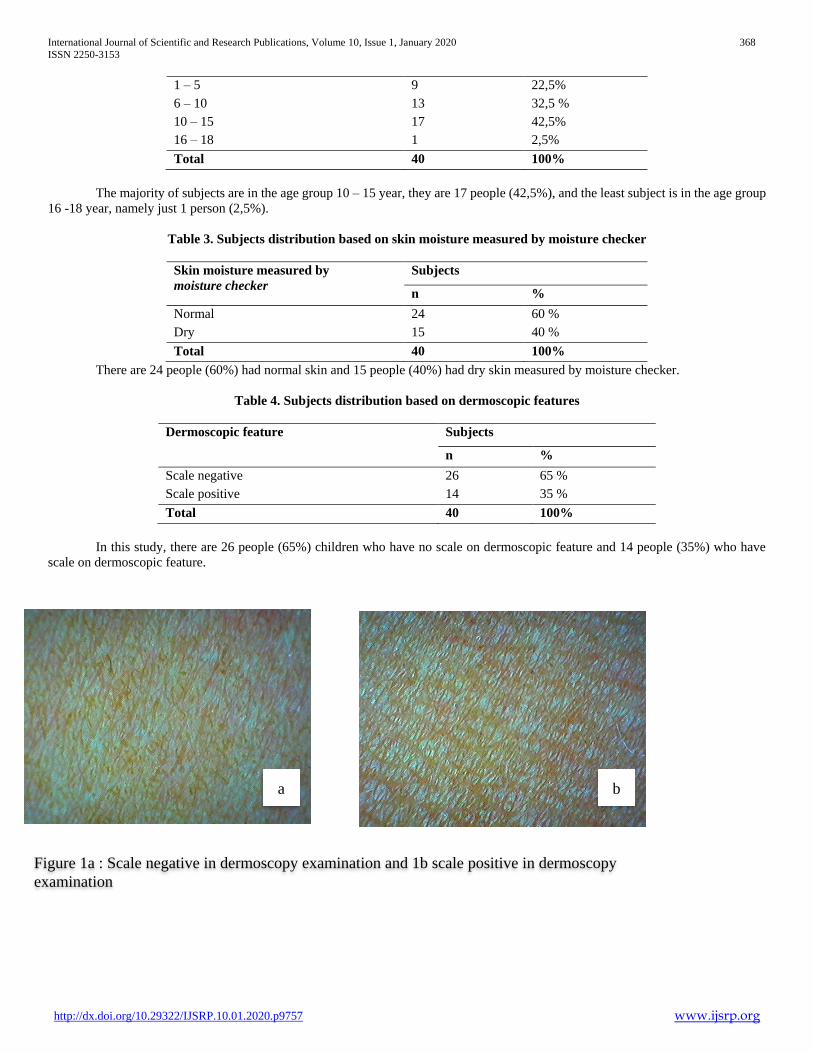
International Journal of Scientific and Research Publications, Volume 10, Issue 1, January 2020 368
ISSN 2250-3153
http://dx.doi.org/10.29322/IJSRP.10.01.2020.p9757 www.ijsrp.org
1 – 5 9 22,5%
6 – 10 13 32,5 %
10 – 15 17 42,5%
16 – 18 1 2,5%
Total 40 100%
The majority of subjects are in the age group 10 – 15 year, they are 17 people (42,5%), and the least subject is in the age group
16 -18 year, namely just 1 person (2,5%).
Table 3. Subjects distribution based on skin moisture measured by moisture checker
Skin moisture measured by
moisture checker
Subjects
n %
Normal 24 60 %
Dry 15 40 %
Total 40 100%
There are 24 people (60%) had normal skin and 15 people (40%) had dry skin measured by moisture checker.
Table 4. Subjects distribution based on dermoscopic features
Dermoscopic feature Subjects
n %
Scale negative 26 65 %
Scale positive 14 35 %
Total 40 100%
In this study, there are 26 people (65%) children who have no scale on dermoscopic feature and 14 people (35%) who have
scale on dermoscopic feature.
Figure 1a : Scale negative in dermoscopy examination and 1b scale positive in dermoscopy
examination
a b
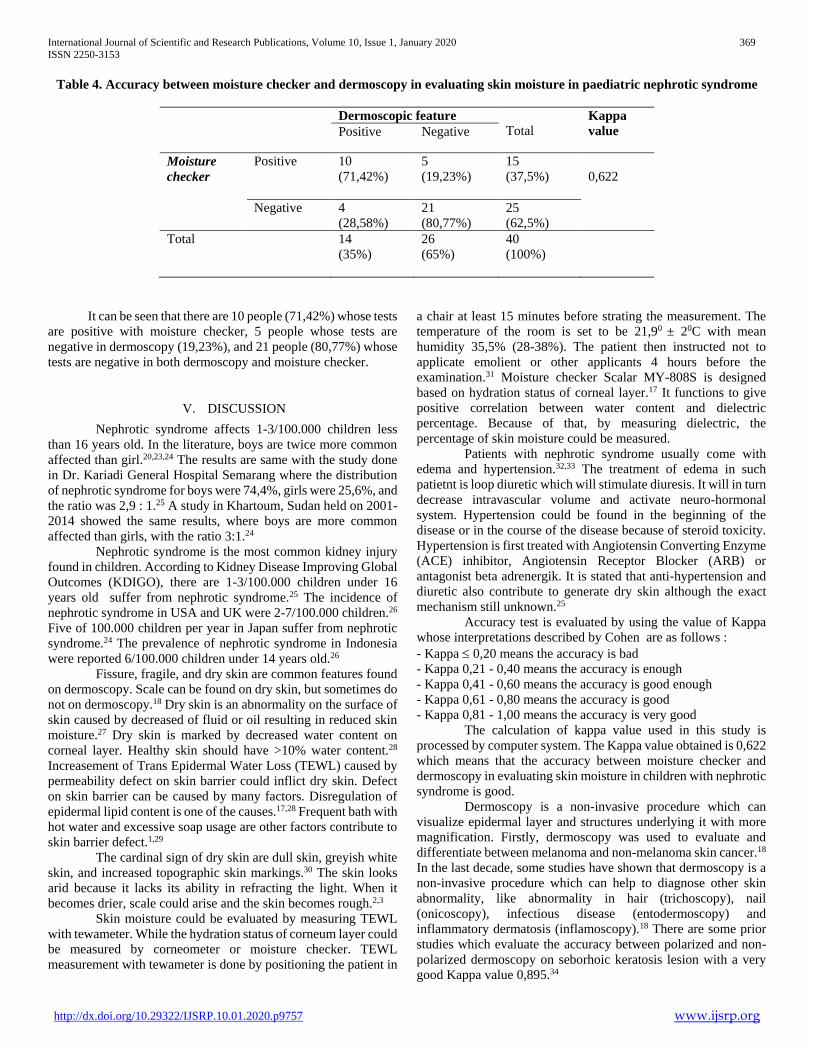
International Journal of Scientific and Research Publications, Volume 10, Issue 1, January 2020 369
ISSN 2250-3153
http://dx.doi.org/10.29322/IJSRP.10.01.2020.p9757 www.ijsrp.org
Table 4. Accuracy between moisture checker and dermoscopy in evaluating skin moisture in paediatric nephrotic syndrome
Dermoscopic feature
Total Kappa
value Positive Negative
Moisture
checker
Positive 10
(71,42%)
5
(19,23%)
15
(37,5%)
0,622
Negative 4
(28,58%)
21
(80,77%)
25
(62,5%)
Total 14
(35%)
26
(65%)
40
(100%)
It can be seen that there are 10 people (71,42%) whose tests
are positive with moisture checker, 5 people whose tests are
negative in dermoscopy (19,23%), and 21 people (80,77%) whose
tests are negative in both dermoscopy and moisture checker.
V. DISCUSSION
Nephrotic syndrome affects 1-3/100.000 children less
than 16 years old. In the literature, boys are twice more common
affected than girl.20,23,24 The results are same with the study done
in Dr. Kariadi General Hospital Semarang where the distribution
of nephrotic syndrome for boys were 74,4%, girls were 25,6%, and
the ratio was 2,9 : 1.25 A study in Khartoum, Sudan held on 2001-
2014 showed the same results, where boys are more common
affected than girls, with the ratio 3:1.24
Nephrotic syndrome is the most common kidney injury
found in children. According to Kidney Disease Improving Global
Outcomes (KDIGO), there are 1-3/100.000 children under 16
years old suffer from nephrotic syndrome.25 The incidence of
nephrotic syndrome in USA and UK were 2-7/100.000 children.26
Five of 100.000 children per year in Japan suffer from nephrotic
syndrome.24 The prevalence of nephrotic syndrome in Indonesia
were reported 6/100.000 children under 14 years old.26
Fissure, fragile, and dry skin are common features found
on dermoscopy. Scale can be found on dry skin, but sometimes do
not on dermoscopy.18 Dry skin is an abnormality on the surface of
skin caused by decreased of fluid or oil resulting in reduced skin
moisture.27 Dry skin is marked by decreased water content on
corneal layer. Healthy skin should have >10% water content.28
Increasement of Trans Epidermal Water Loss (TEWL) caused by
permeability defect on skin barrier could inflict dry skin. Defect
on skin barrier can be caused by many factors. Disregulation of
epidermal lipid content is one of the causes.17,28 Frequent bath with
hot water and excessive soap usage are other factors contribute to
skin barrier defect.1,29
The cardinal sign of dry skin are dull skin, greyish white
skin, and increased topographic skin markings.30 The skin looks
arid because it lacks its ability in refracting the light. When it
becomes drier, scale could arise and the skin becomes rough.2,3
Skin moisture could be evaluated by measuring TEWL
with tewameter. While the hydration status of corneum layer could
be measured by corneometer or moisture checker. TEWL
measurement with tewameter is done by positioning the patient in
a chair at least 15 minutes before strating the measurement. The
temperature of the room is set to be 21,90 ± 20C with mean
humidity 35,5% (28-38%). The patient then instructed not to
applicate emolient or other applicants 4 hours before the
examination.31 Moisture checker Scalar MY-808S is designed
based on hydration status of corneal layer.17 It functions to give
positive correlation between water content and dielectric
percentage. Because of that, by measuring dielectric, the
percentage of skin moisture could be measured.
Patients with nephrotic syndrome usually come with
edema and hypertension.32,33 The treatment of edema in such
patietnt is loop diuretic which will stimulate diuresis. It will in turn
decrease intravascular volume and activate neuro-hormonal
system. Hypertension could be found in the beginning of the
disease or in the course of the disease because of steroid toxicity.
Hypertension is first treated with Angiotensin Converting Enzyme
(ACE) inhibitor, Angiotensin Receptor Blocker (ARB) or
antagonist beta adrenergik. It is stated that anti-hypertension and
diuretic also contribute to generate dry skin although the exact
mechanism still unknown.25
Accuracy test is evaluated by using the value of Kappa
whose interpretations described by Cohen are as follows :
- Kappa 0,20 means the accuracy is bad
- Kappa 0,21 - 0,40 means the accuracy is enough
- Kappa 0,41 - 0,60 means the accuracy is good enough
- Kappa 0,61 - 0,80 means the accuracy is good
- Kappa 0,81 - 1,00 means the accuracy is very good
The calculation of kappa value used in this study is
processed by computer system. The Kappa value obtained is 0,622
which means that the accuracy between moisture checker and
dermoscopy in evaluating skin moisture in children with nephrotic
syndrome is good.
Dermoscopy is a non-invasive procedure which can
visualize epidermal layer and structures underlying it with more
magnification. Firstly, dermoscopy was used to evaluate and
differentiate between melanoma and non-melanoma skin cancer.18
In the last decade, some studies have shown that dermoscopy is a
non-invasive procedure which can help to diagnose other skin
abnormality, like abnormality in hair (trichoscopy), nail
(onicoscopy), infectious disease (entodermoscopy) and
inflammatory dermatosis (inflamoscopy).18 There are some prior
studies which evaluate the accuracy between polarized and non-
polarized dermoscopy on seborhoic keratosis lesion with a very
good Kappa value 0,895.34

International Journal of Scientific and Research Publications, Volume 10, Issue 1, January 2020 370
ISSN 2250-3153
http://dx.doi.org/10.29322/IJSRP.10.01.2020.p9757 www.ijsrp.org
Before this study was published, there was still no study
assessing the accuracy between dermoscopic feature and moisture
checker in evaluating skin moisture in children suffering from
nephrotic syndrome. This study is the pilot study trying to look for
their accuracy. In the end of this study, we found that moisture
checker is a reliable, reproducible, sensitive, cheap, and practical
tool for measuring skin moisture.
VI. CONCLUSION
The most subjects in this study are boys with 27 people
(67,5%), while girls are 13 people (32,5%). The majority of the
subjects are in the age group 10 – 15 year, with 17 out of 40 people
(42,5%). Subjects with normal skin measured by moisture checker
were 24 people (60%), while 15 people (40%) had dry skin.
Accuracy value of dermoscopy and moisture checker in evaluating
skin moisture in children suffering from nephrotic syndrome is
0,62 which means good accuracy. This result shows that moisture
checker can be used to substitute dermoscopy in evaluating people
suggestive of dry skin with lower cost.
VII. SUGGESTION
This study hopefully could be continued with diagnostic
study comparing moisture checker with corneometer or tewameter
to evaluate its sensitivity and specificity. The same thing can also
be done to dermoscopy. In the next study, it is mandatory to avoid
bias by performing the procedure sistematically, especially while
measuring TEWL or hydration status of corneal layer.
ETHICAL ISSUE
This study was done after obtaining the ethical clearance
letter from the ethical committee of Medical Faculty, North
Sumatera University, Medan, Indonesia.
CONFLICT OF INTEREST
The authors declare no conflict of interest, financial, or
otherwise.
ACKNOWLEDGEMENTS
We thank Putri C Elyanoer, MD.,MS., Epi., PhD. for her
guidance on research concept and statistical analyses. We are also
grateful to all staff members in Department of Dermatology and
Venereology, Medical Faculty of Universitas Sumatera Utara/H.
Adam Malik General Hospital, Medan, Indonesia for their help
and cooperation during this study.
REFERENCES
[1] White-Chu EF, Reddy M. Dry skin in the elderly: complexities of a common problem. Clin Dermatol. 2011;29(1):37–42.
[2] Pons-Guiraud A. Dry skin in dermatology: a complex physiopathology. J Eur Acad Dermatol Venereol. 2007;21(2 suppl):1–4.
[3] Draelos ZD. Clinical situations conducive to proactive skin health and anti-aging improvement. J Investig Dermatol Symp Proc. 2008;13(1):25–9.
[4] Rawlings AV, Harding CR. Moisturization and skin barrier function. Dermatol Ther. 2004;17(1 suppl):43–48.
[5] Jungersted JM, Hellgren LI, Jemec GB, Agner T. Lipids and skin barrier function—a clinical perspective. Contact Dermatitis. 2008;58(5):255–262.
[6] Bonté F. Skin moisturization mechanisms: new data. Ann Pharm Fr. 2011;69(3):135–141.
[7] Verdier-Sévrain S, Bonté F. Skin hydration: a review on its molecular mechanisms. J Cosmet Dermatol. 2007;6(2):75–82.
[8] Draelos ZD. New channels for old cosmeceuticals: aquaporin modulation. J Cosmet Dermatol. 2008:7(2):83-7.
[9] Kidney Disease : Improving Global Outcomes (KDIGO) Clinical Practice Guideline for Glomerulonephritis. Kidney Int. 2012;2:139-274.
[10] Davison AM, Cameron JS, Grunfeld JP, Ponticelli C, Ritz E, Winearls CG, et al. Oxford textbook of clinical nephrology. 3rd ed. New York: Oxford university Press, 2005;42-8.
[11] Markova A, Lester J, Wang J, Robinson-Bostom L. Diagnosis of common dermopathies in dialysis patients: a review and update. Semin Dial. 2012;25(4):408-18.
[12] Szepietowski JC, Balaskas E, Taube KM, Taberly A, Dupuy P. Quality of life in patients with uremic xerosis and pruritus. Acta Derm Venereol. 2011;91(3):313-7.
[13] Udayakumar P, Balasubramanian S, Ramalingan KS, Lakhsmi C, Srinivas CR, Mathew AC. Cutaneous manifestation in patients with chronic renal failure on hemodialysis. Indian J Dermatol VenereolLeprol. 2006;72:119-25.
[14] Khanna D, Singal A, Kalra OP. Comparison of cutaneous manifestations in chronic kidney disease with or without dialysis. Postgrad Med J. 2010;86:641-7.
[15] Castello M, Milani M. Efficacy of topical hydrating and emollient lotion containing 10% urea ISDIN(R) plus dexpanthenol (Ureadin Rx 10) in the treatment of skin xerosis and pruritus in hemodialyzed patients: an open prospective pilot trial. G Ital Dermatol Venereol. 2011;146(5):321-5.
[16] D. Barco, A. Giménez-Arnau. Xerosis: a Dysfunction of the Epidermal Barrier. Actas Dermosifiliograficas [internet]. 2008 [cited 2019 February 5]: 99(9): 671-682. Available from: ScienceDirect
[17] Baumann L. Skin and moisturizer. In: Cosmetic Dermatology. Principles and Practice. Mc Graw Hill: New York. 2002: 29-32
[18] Errichetti E, Stinco G. Dermoscopy in general dermoscopy: a practical overview. Dermatol Ther. 2016;6:471-507
[19] Fathan H, Indriatmi W, Rihatmaja R, Krisanti I. The Role of Dermoscopy in Non-pigmented Skin Disoreders. J Gen Pro DVI. 2016;1(2):44-53
[20] Udayakumar P, Balasubramanian S, Ramalingam KS, Lakshmi C, Srinivas CR, Mathew AC: Cutaneous manifestations in patients with chronic renal failure on hemodialysis. Indian J Dermatol Venerol Leprol 2006;72:119-25.
[21] Abdelbaqi-Salhab M, Shalhub S, Morgan MB: A current review of the cutaneous manifestations of renal disease. J Cutan Pathol 2003;30:527-38.
[22] Brewster UC: Dermatologic manifestations of end-stage renal disease. Hosp Phys 2006;42:31-5.
[23] Mettang T, Kremer AE: Uremic pruritus. Kid Int 2015;87:685-91.
[24] Schwartz GJ, Work DF. Measurement and estimation of GFR in children and adolescents. Clin J Am Soc Nephrol [Internet]. 2009 [cited 2019 Apr 12];4(11):1832-43. Available from:Pubmed.
[25] Lombel RM, Hodson EM, Gipson DS. Treatment of steroid-resistant nephrotic syndrome in children: new guidelines from KDIGO. Pediatr Nephrol. 2012:1-6
[26] Serup J. EEMCO Guidance for the Assesment of Dry Skin (Xerosis) and Ichtyosis: Clinical Skoring System. Skin Res Technol. 2014;20:87-91.
[27] Habif T. Principles of diagnosis and anatomy. Clinical dermatology: a color guide to diagnosis and therapy. 6th. Oxford:Elsevier;2016:1-5.
[28] Vogt BA, Avner ED. Conditions particularly associated with proteinuria. Dalam: Kliegman RM, Stanton BF, Schor NF, Geme JWS, Behrman RE, penyunting. Nelson textbook of pediatrics. Edisi ke – 19. Philadelphia: Elsevier Inc. 2011:1755-7.
[29] Kapoor S, Saraf S. Formulation and Evaluation of Moisturizer Containing Herbal Extracts for the Management of Dry Skin. Pharmacognosy [internet]. 2010 [cited 2019 March 19]: 2(11): 409-417. Available from: ScienceDirect
[30] Kasma K, Marlinah. Karakteristik penderita sindrom nefrotik pada anak. Journal of Pediatric Nursing. 2014:99-103.

International Journal of Scientific and Research Publications, Volume 10, Issue 1, January 2020 371
ISSN 2250-3153
http://dx.doi.org/10.29322/IJSRP.10.01.2020.p9757 www.ijsrp.org
[31] Ali E, Elhadi N, Abderlraheem M, Ellidir R. Childhood steroid-sensitive nephrotic syndrome: characteristics and predictors of relapses. Sudan Journal of Medical Sciences. 2018;13(3):133-43.
[32] Hee Jin Byun, et al. Lipid Ingredients in Moisturizers can Modulate Skin Response to UV in Barrier-Disrupted Human Skin In Vivo. Journal of Dermatological Science [internet]. 2011 [cited 2019 Apr 1]: 65(2): 110-17. Available from: ScienceDirect
[33] Draelos ZD. Therapeutic Moisturizers. In: Draelos ZD Dermatologic Clinic, vol. 18. No. 4 Philadelpia: WB Saunders co, Oktober 2000: 597-607
[34] Bauman L. Dry Skin. In: Cosmetic dermatology principles and practice. Mc Graw Hill: New York. 2009: 83-93.
AUTHORS
First Author – Ramayanti boru Simandjuntak, Post graduate of
Dermatology and Venereology, Faculty of Medicine, Universitas
Sumatera Utara, Medan, Indonesia, Phone: +62-81361764748;
Email: [email protected]
Second Author – Sri Wahyuni Purnama, Departement of
Dermatology and Venereology, Faculty of Medicine, Universitas
Sumatera Utara, Medan, Indonesia
Third Author – Irma Damayanti Roesyanto-Mahadi,
Departement of Dermatology and Venereology, Faculty of
Medicine, Universitas Sumatera Utara, Medan, Indonesia
International Journal of Scientific and Research Publications, Volume 10, Issue 1, January 2020 372
ISSN 2250-3153
http://dx.doi.org/10.29322/IJSRP.10.01.2020.p9758 www.ijsrp.org
Determine the Type of Diatoms in the Batangtoru
River and Parsariran River in Tapanuli Selatan Regency
by means of Acid Destruction
Amalan Surya Hutabarat, Asan Petrus, Nasib Mangoloi Situmorang
* Situmorang Departemen Forensik dan Medikolegal Fakultas Kedokteran Universitas Sumatera Utara
DOI: 10.29322/IJSRP.10.01.2020.p9758
http://dx.doi.org/10.29322/IJSRP.10.01.2020.p9758
Abstract- Victims of Drowning cases are still often found in the
World of Forensic medicine today. Drowning is a condition where
oxygenation occurs in the lungs due to the entry of water into the
airways through the nose and mouth. In Forensic medicine,
examination of diatoms in drowning victims is still very useful in
diagnosis .
Diatom examination on drowning victims is used to
determine whether the victim is still alive when entering the water
or has died. This examination can also determine the scene of the
incident or place of the victim's sinking.
This research uses a descriptive method. The sample
material used came from the Batangtoru river and Parsariran river
in South Tapanuli Regency. With the results of the study found 14
species of diatoms in the Batangtoru river and 14 species of
diatoms in the Parsariran river.
Index Terms- Diatoms, Drowning
I. INTRODUCTION
rowning is a condition in which oxygenation is disrupted in
the lungs due to the entry of fluid into the airways through
the nose and mouth.
WHO noted that in 2016 drowning cases there were
320,000 people lost their lives due to drowning. More than 90%
of these drowning deaths occur in low and middle income
countries. WHO also recorded the highest number of deaths in
drowning cases was in Africa, with a ratio of 15-20 times higher
than in Germany or the United Kingdom. In Indonesia, the death
toll drowned due to natural disasters according to the National
Disaster Management Agency (BNPB) of 180 people during 2017,
that number is relatively more than the death toll drowning at sea
according to the National Transportation Safety Committee
(KNKT) in 2013 totaling 65 fatalities , while the victims died as a
result of 2013 as many as 12 people. In the case of
drowning which often creates difficulties for investigators is to
determine where the victim first sank.
Definition of Diatoms
Diatoms are a type of algae that are only seen
microscopically and contain silicon particles. The shape is usually
round oval, triangle or rectangle. Along with water that enters the
lungs, diatoms then penetrate the lungs and then enter the
lymphatic channels. Through the circulation of these lymph
channels diatoms are delivered to the heart and then spread to
several body tissues.
According to Hendey, there are as many as 15,000 species
of diatoms, half of which live in fresh water and the other half live
in brackish water and sea water. Diatoms have a variety of sizes,
ranging from 2µ to 1 mm in length or diameter. Some species have
a length of 10-80µ, if long enough to have a width of 10µ.
Diatoms are included in the class Bacillariophyceae algae
with the main constituent cell wall of silica. It is called a diatom
because the cell consists of two valves (two atoms), where one
covers the other like a can of pastiles. Diatoms are generally
unicellular (solitary), but in some species there are those who live
in colonies and co-operate with one another. Diatoms are very
useful in environmental studies because their species distribution
is influenced by water quality and nutrient content and their
presence is very abundant in marine sediments such as at sea,
estuary, lake, pond, or river, as well as diatom fossils that can be
used as indicators of water quality better than water quality. with
saprobitas index because diatoms are more sensitive especially
those related to the conductivity parameters, organic content.
Diatom classification according to lifestyle is divided into
8 groups:
1. Epiphytic known as the diatom group attached to other
larger plants.
2. Epipsamic is known as a group of diatoms that live and
grow on sand.
3. Epipelic are known as diatom groups that live and grow
on the surface of clay (mud) or sediments.
4. Endopelic known as a group of diatoms that grow in
cavities of clay (mud) or sediments.
5. Epilithic known as diatom groups that grow and attach to
the surface of the fiber.
6. Endolitic, known as the diatom group that grows in
cavities at the bottom of ships.
7. Epizoic which is known as diatom group which is
attached to common animal invertebrate base coat.
8. Fouling, known as a diatom group attached to hard
objects that are mounted or placed on the base of the
mantle.
Definition of River
D

International Journal of Scientific and Research Publications, Volume 10, Issue 1, January 2020 373
ISSN 2250-3153
http://dx.doi.org/10.29322/IJSRP.10.01.2020.p9758 www.ijsrp.org
The river is the flow of air at the surface of the land that
flows into the sea. The river based on its physical condition is
divided into 3 namely:
1. Upstream: in the upstream condition of heavy water flow,
the rocks are also large and the erosion that occurs is
vertical downward erosion (waterfall).
2. Middle part: in this part the river water flow is rather calm,
the rocks are also not big anymore and the erosion that
occurs laterally / horizontally.
3. Downstream: in this part the flow of water is calm, the
rocks are gone turns into thick / sand and is rare.
The Drowning Definition
Drowning is death due to the entry of fluid into the
respiratory tract. Fluid that causes drowning is usually in the form
of water, although a number of other liquids can also cause
drowning. Sometimes a person who is unconscious will sink when
he drops his face into a pool of water, such as epilepsy during a
sudden attack but drowning generally appears as a result of total
body submergence. In this case drowning denotes death from the
entry of water into the respiratory tract, whether it is with a sinking
body or not.
Drowning of Mechanisme
Understanding of the mechanism of drowning according to
Brouardel quoted by Tedeschi et al (1977) found five stages as
follows:
1. The surprise stage which lasts for 5 to 10 seconds.
2. The first stage of respiratory arrest that lasts about
one minute.
3. The deep respiration phase which lasts for about one
minute.
4. The second stage of respiratory arrest that lasts about
one minute.
5. Gasps terminal stage (last breath) lasting 30 seconds.
Diatom's Relationship with Drowning
This diatom is used as a diagnostic tool for investigating
drowning cases, because of this the diatom examination is
intended :
a. Determine whether someone died by drowning or
not.
b. Knowing whether people are still alive when
drowning.
c. Knowing the location of the sinking body before
dying, by comparing the diatoms found in the body
of the victim with the water diatoms where the
bodies were found or suspected as a place to
drowning.
The pathophysiology of how people drown can be found
diatoms in their bodies is through the media of water, basically
when a living person sinks into water containing diatoms, some
diatoms will enter the lungs and stomach, diatoms contained in
water can enter the lungs the lungs and circulatory system and
other internal organs such as the brain, kidneys, liver and bone
marrow.
Procedure
Take water from the river at a depth of 1 meter to 2 meters
from the surface of the water with plankton net (plankton net), then
the netted plankton samples will be collected in a bucket which is
then poured into a 20 ml bottle and preserved using 3 drops of
lugol solution and labeled, then taken to the laboratory in each
ingredient mixed with concentrated sulfuric acid solution with the
same volume, then left for 24 hours, then heated with low heat
until boiling and then dripped with concentrated nitric acid until
the liquid is clear, then each is put into a centrifuge tube of the
same size and the number of even tubes at a speed of 3000 rpm for
15 minutes the sediment (sediment) is washed with aquadest then
in the centrifuge again for 15 minutes at a speed of 3000 rpm and
then the sediment (sediment ) viewed under a microscope with
magnification 100 times
II. RESEARCH METHODS
The type of research conducted descriptively is knowing
the type of diatoms in the Batangtoru river and Parsariran river in
South Tapanuli Regency in assisting the Case of the sinking
victims.
III. RESEARCH RESULT
Table 1. Distribution of diatom species in the Batangtoru
river in Tapanuli Selatan Regency
Location Diatom
Type
Stasiun
Upstr
eam
Cent
ral
Downs
tream
Batangtoru
River
Aulacoseir
a sp
+ + +
Coscinodis
cus sp
+ + +
Navicula
sp
+ - -
Synedra sp + - +
Caloneis
sp
+ - +
Nitzschia
sp
+ - +
Bacillaria
sp
+ - +
Fragillaria
sp
+ + +
Frustulia
sp
+ + +
Surirella sp + + +
Netrium sp + + +
Eunotia sp - + -
Amphora
sp
- + -
Achnanthe
s sp
- + -
Description:
+ : found
- : not found

International Journal of Scientific and Research Publications, Volume 10, Issue 1, January 2020 374
ISSN 2250-3153
http://dx.doi.org/10.29322/IJSRP.10.01.2020.p9758 www.ijsrp.org
From the table above it can be seen that there are various
different types of diatoms found at each station, but also found the
same type of diatoms at each station.
Table 2. Distribution of diatom species in the Parsariran
river in Tapanuli Selatan Regency
Location Diatom
Type
Stasiun
Upstre
am
Cent
ral
Downs
tream
Parsariran
River
Navicula
sp
+ - +
Synedra sp + - +
Bacillaria
sp
+ - +
Nitzshia sp + - +
Cymbella
sp
+ - +
Netrium sp + + +
Cyclotella
sp
+ + +
Asterionell
a sp
+ + -
Surirella sp + + -
Caloneis
sp
+ + -
Eunotia sp + - -
Pinnularia
sp
+ + -
Amphora
sp
+ + -
Frustulia
sp
+ + -
Description:
+ : found
- : not found
Table 3. Distribution of diatom species in the Batangtoru
river and Parsariran river in Tapanuli Selatan Regency.
No Diatom Type River
Batangtoru Parsariran
1 Navicula sp + +
2 Synedra sp + +
3 Bacillaria sp + +
4 Nitzshia sp + +
5 Cymbella sp - +
6 Netrium sp + +
7 Cyclotella sp - +
8 Asterionella sp - +
9 Surirella sp + +
10 Caloneis sp + +
11 Eunotia sp + +
12 Pinnularia sp - +
13 Amphora sp + +
14 Frustulia sp + +
From the above data it can be seen that in the two rivers the
same diatom species are found but there are also different diatom
species found.
IV. DISCUSSION
From the results of the above study it can be seen that
diatoms can be found in fresh and marine waters, in this case the
study used freshwater samples. The abundance of diatoms in a
waters varies greatly determined by environmental factors that
influence it. The distribution that affects the abundance of diatoms
include the following:
a. Temperature factor, where temperature can affect the
process of photo synthesis in waters both directly and
indirectly.
b. Waters currents, where currents largely determine the
distribution of abundance of diatoms living as
planktonics.
c. Turbidity, the more turbid the aquatic ecosystem, the
level of O2 levels is also reduced and sunlight is difficult
to penetrate a certain depth. Thus inhibiting the process
of photosynthesis and diatom growth itself.
In addition to the factors above that can affect the presence
and abundance of diatoms in a waters there are other factors
namely: environmental factors that can affect the growth and
spread of phytoplankton, both physical and chemical factors, such
as salinity, light, nutrients and PH.
V. CONCLUSION
1. Found 14 species of diatoms in the Batangtoru river
with the same diatom species distribution found at the
upstream, central and downstream stations, namely,
Aulacoseira sp, Coscinodiscus sp, Aulacoseira sp,
Fragillaria sp, Frustillia sp, Surirella sp, Netrium sp.
2. The type of diatom found at the upstream station but
not found at the central and downstream stations,
namely Navicula sp, this is very helpful in the
application of the Determination of the first place
where the victim sank, where if found diatoms in the
lungs of a drowned victim, the type of navicula sp is
confirmed to be the first victim the river was
submerged in the Batangtoru river upstream station.
3. The type of diatom found at the central station but not
found at the upstream and downstream stations
namely Eunotia sp, Amphora sp, Achnanthes sp. then
it is confirmed that the victim first sank, namely at the
central station.
4. In the Parsariran river there were 14 diatom species
found where the distribution of diatom species found
at the upstream, central and downstream stations,
namely Netrium sp and Cyclotella sp.
5. The type of diatom found at the upstream station but
not found at the central and downstream stations,
Eunotia sp. This is very helpful in the application to
determine the location of the case where the victim
first drowned. at the upstream station.

International Journal of Scientific and Research Publications, Volume 10, Issue 1, January 2020 375
ISSN 2250-3153
http://dx.doi.org/10.29322/IJSRP.10.01.2020.p9758 www.ijsrp.org
6. The type of diatom that is not found in the Batangtoru
river but found in the parsariran river, namely,
Cymbella sp, Cyclotella sp, Asterionella sp,
Pinnularia sp, this is due to the different turbidity
levels in the river where the turbidity river is higher
than the parsariran river which is very high affect
diatom photosynthesis itself.
7. The abundance of diatoms in each river varies greatly
because it is influenced by environmental, chemical
and physical factors.
VI. SUGGESTION
1. The results obtained in this study do not provide an
overall picture of the shape, type, and abundance of
diatoms in the Batangtoru and Parsariran rivers. This
causes the need for further research at different times,
circumstances and locations.
2. The results of diatom photographs obtained in this
study are less clear because it only uses a mobile
digital camera that is less compatible with a
microscope, so further research is expected to further
diatom images need to use a special camera that is
compatible with a microscope.
3. Such research is expected to be developed by other
researchers in different rivers in the South Tapanuli
Regency, especially in one stream.
REFERENCES
[1] Idris AM. Penerapan Ilmu Kedokteran Forensik dalam proses penyidikan. Edisi Revisi. Cetakan kedua. Jakarta: Sagung Seto; 2011.p.65-70.
[2] World Health Organization [Internet]. World Health Organization. [cited 30 July 2019]. Available from:
https://www.who.int/violence_injury_prevention/drowning/en/
[3] Data Bencana Indonesia 2017 [Internet]. Badan Nasional Penanggulangan Bencana; 2018 [cited 30 July 2019]. Available from:
https://bnpb.go.id/uploads/24/buku-data-bencana/buku-data-bencana-2017-compressed.pdf
[4] Knight, Bernard. Forensic Phatology. Oxford University press. 1996.
[5] Manuel dkk. Automatic screening and multifocus fusion methods for diatom identification. Republik Ceko. 2009.
[6] Campbell N dkk. Biologi. Penerbit Erlangga. Jakarta. 2003.
[7] Gani, Husni. Diagnosa Drowning, Penerbit Erlangga. Jakarta. 2002.
[8] Simanjuntak M. Pengaruh Suhu, Salinitas dan Silikat terhadap Kelimpahan Fitoplankton di Perairan Digul Laut Arafura, Jurnal ISSN Lingkungan hidup Jakarta. 2007.
[9] Amri A. Tenggelam (Drowning), in Amri A. Eds. Ilmu Kedokteran Forensik. Edisi 2. Medan. 2007.
[10] Reece J B , Mitchell L G. Biologi. Terjemahan Mahameru Jakarta. 2003.
[11] Teddesh C.G et.al. Forensic Medicine. W.B Saunder Company. 1997.
[12] M.G Forero et al. Analysis and screening of diatoms by Shape from Contour. Spanyol. 2009.
[13] Yeanny M S. Komunitas Fitoplankton sebagai Bioindikator kualitas air sungai Belawan. USU Medan. 2011.
[14] Knight, Bernard. Forensic Pathology. Oxford University Press. New York. 2000.
[15] Gonzales TA, Vance M, Helper M, Umberger CJ. Legal Medicine Phatology and Toxicology-Appleton-Century-Crofts, INC. New York. 1954.
[16] Camps, E. et al. Operational Death and Complications (Including Those Under Anasthesia). In: Gradwohl’s Legal Medicine Third Edition, Great Britain. 1976.
[17] Shamsudin L. Diatom air tawar morfologi dan taksonomi. Kuala Lumpur;1991: p.174-235.
[18] Charles bold H, James Wynne M. Introduction to the algae.2nd ed.United states of america: Library of cospen cataloging; 1985: p.465-473.
[19] Hii tan T, Pin leaw C.Marine micro-phytoplankton of singapore with a review of harmful microalgae in the region. National university of singapore. 2016;34(0217-2445):78-96
[20] Edmondson W. Fresh water.2nd ed. Washington: University of washington; 1959: p. 140-184.
[21] Arifiani purnomo A, Junitha I, Suartini N. Variasi spesies diatom pada tipe perairan berbeda untuk kepentingan forensik sebagai petunjuk kematian akibat tenggelam. Jurnal simbiosis III. 2015;I(2337-7244):247-257
[22] Al- Handal A.Y & Wulf A, Ephiphytic diatoms from King George island, Antartica; 2008: p. 421.
[23] Srivastava N, Suseela M, Toppo K, Lawrence R. Fresh water algal diversity of central india. International journal of research and development in pharmacy & life science [internet]. 2018 [cited 06 December 2019];4:3046. Available from: http://ijrdpl.com
[24] South. G. Robin & A. Whittick, Introduction to Phycology; 1987: p. 96..
[25] Sancetta. C. Processes Controling the Acumulation of Diatom in Sediments, Norwich: University of East Anglia, 1989.
[26] Aryawati R. Kelimpahan dan sebaran fitoplankton di Perairan Berau Kalimantan Timur[Tesis], Bogor; Institut Pertanian Bogor;2007.
AUTHORS
First Author – Amalan Surya Hutabarat, Departemen Forensik
dan Medikolegal Fakultas Kedokteran Universitas Sumatera
Utara, Email : [email protected]
Second Author – Asan Petrus, Departemen Forensik dan
Medikolegal Fakultas Kedokteran Universitas Sumatera Utara
Third Author – Nasib Mangoloi Situmoran, Departemen
Forensik dan Medikolegal Fakultas Kedokteran Universitas
Sumatera Utara
International Journal of Scientific and Research Publications, Volume 10, Issue 1, January 2020 376
ISSN 2250-3153
http://dx.doi.org/10.29322/IJSRP.10.01.2020.p9759 www.ijsrp.org
Determining The Types Of Diatoms Padang River
And Bahilang River In Tebing Tinggi City
Edwin Parlindungan Lubis, Asan Petrus, Abdul Gafar Parinduri
Department of Forensic and Medicolegal of Faculty of Medicine Universitas Sumatera Utara
DOI: 10.29322/IJSRP.10.01.2020.p9759
http://dx.doi.org/10.29322/IJSRP.10.01.2020.p9759
Abstract- Background : Drowning is a process that causes
respiratory disturbances due to the entry of fluid into the airways
or lungs. Until now, diatom examination is the gold standard
examination to diagnose deaths because of drowning. The
discovery of diatoms in tissue examination is one of the markers
that shows the victim died from drowning.
Aim: To find out whether the person died from drowning
or not, whether the person is still alive when drowning and to know
the location of the drowned body before death so that it helps
investigators determine where was the victim drowned for the first
time by comparing the diatoms in the victim's body with the
diatoms the water where the body was found or suspected to be a
drowning death place.
Method : This research was conducted descriptively. The
research sample was taken from rivers in Tebing Tinggi City,
namely Sungai Padang and Sungai Bahilang .
Results : 15 diatom species were found in the Sungai
Padang and 11 diatom species were found in the Sungai Bahilang.
From the results of research in the Sungai Padang and Sungai
Bahilang, there are similarities and differences in the types of
diatoms in each river
Index Terms- Drowning, Diatoms
I. PRELIMINARY
inking is a process that causes interference with the entry of
fluid into the respiratory tract or lungs. Drowning is not
limited to water, such as rivers, lakes or swimming pools, but may
also be in a puddle or ditch with only a face below the surface of
the air. 1,2
In 2016 WHO recorded drowning cases recorded as many
as 320,000 people lost their lives due to drowning, more than 90%
of deaths due to drowning occurred in low and middle-income
countries. Drowning is the third leading cause of death in the
world where the case most often affects children aged 5-14 years.
In connection with the use of diatoms in the diagnosis of
drowning, Revenstorf in 1904 was the first person to try to use
diatoms as a test for drowning, although he stated that Hofmann
was the first person to find it in pulmonary fluid in 1896. The basic
view put forward was if someone drowned in water containing
diatoms, the diatoms will penetrate the alveolar wall and bring it
to the main organs such as the brain, kidneys, liver, and bones.8
Diatoms are microscopic creatures that live in almost every
aquatic habitat. There is an enormous variety of living things.
Diatoms are a class of plants, which is a single-celled alga found
in water with sufficient lighting. With a size of 40-200 microns
but maybe also with a size <4-5 micron /> 1 micron, with the shape
that is owned varies. 9,10,11,12
In a corpse submerged in water and suspected of having
died due to drowning, it is necessary to determine whether the
victim is still alive when drowning which is marked by intravital
signs, whether there are other signs of violence, and the cause of
death.1 In uncovering criminal cases, crime scenes (TKP) is an
important source of information in revealing events that have
happened to victims. This is due to the fact that there is a lot of
evidence (corpus delict) found at the crime scene which experts
can speak to reveal about the events that occurred. However, the
problem now, is difficult to determine where the crime scene itself,
especially in the case of drowning because the victim was found
far from the place where the victim drowned.
Some previous researchers have discussed the
identification of diatoms, but there have been no studies or
research on the types of diatoms that exist in the Padang River and
Bahilang River in Tebing Tinggi City.
II. LITERATURE REVIEW
Diatom
Diatoms are a type of alga that are only seen
microscopically and contain silicon particles. The shape can be
round oval, triangle or rectangular.14
Diatoms have a structure that contains SiO2 silicic acid.
Silicate itself has resistance to decay. The peach alga enters the
body through blood circulation so that the location of the alga
shows whether the victim was drowned ante-mortal or post-
mortal. Diatoms can also be searched for in the heart which has
been diluted with water for hemolysis and then centrifuged and the
sediment examined. When the victim is so rotten that the victim
has sunk, both the skin and organs have been destroyed, the diatom
examination is taken from the long bone marrow and then the same
process is carried out.10
Diatom Identification
Diatoms are single-cell plants belonging to the
Bacillariophyceae class of the Bacillariophyta phylum. Diatoms
can consist of one single cell or a combination of several cells
forming a chain. They usually float freely in bodies of water and
also most of them attach to harder substrates. Diatom sticking is
usually because this plant has a kind of gelatin (Gelatinous
extrusion) which provides adhesion to objects or substrates. We
also sometimes find some diatoms that are very slow but have the
power to move.14,15,16
S

International Journal of Scientific and Research Publications, Volume 10, Issue 1, January 2020 377
ISSN 2250-3153
http://dx.doi.org/10.29322/IJSRP.10.01.2020.p9759 www.ijsrp.org
It is called a diatom because the cell consists of two valves
(two atoms), where one covers the other like a can of pastilles.
Diatoms are generally unicellular (solitary), but in some species
same live in colonies and co-operate with one another. From its
shape, diatoms are divided into two orders based on their shape,
namely circular diatom cells (Centrales diatoms) and elongated
diatom cells (Pennales diatoms). The Central Order when viewed
from above or below is symmetrical and circular in a radial shape.
The cells can be round, oval, cylindrical, with a round, triangular
or rectangular cross-section, while the Pennales Order is
longitudinal or sigmoid shaped like the letter "S". Along with the
median diatom cell fatigue there is a middle lane called rafe
(raphe) .17,18
Diatom classification according to their lifestyle is also
divided into 8 groups, namely: Epiphytic, Episamic, Epipelic,
Endopelic, Epilithic, Endolithic, Epizoic, Fouling. 14,16,18
Diatom Growth Factor
Diatom distribution varies which is determined by
environmental factors that influence. The distribution that affects
diatoms horizontally include the following: temperature, water
flow and turbidity factors.19
Drowning
Definisi
Drowning is usually defined as death from asphyxia
caused by the entry of fluid into the respiratory tract. In one case
the victim sank in the water so that his respiratory system was
disrupted by the result of loss of consciousness and threat to the
victim's soul.1
In general, drowning is a case of an accident, either directly
or because there are certain factors such as the victim being drunk
or under the influence of drugs, it could even be due to the result
of a murder event. Every year, around 150,000 deaths are reported
worldwide due to drowning, with annual occurrences perhaps
closer to 500,000. Some of the most populous countries in the
world fail to report near drowning incidents. This suggests that
many cases have never been brought to medical attention, events
around the world make an accurate approach almost
impossible.16,17
Drowning diagnosis
Until now, diatom examination is a gold standard
examination to diagnose deaths from drowning. However, this
examination is still controversial because diatoms cannot always
be found on the examination of the lung. This can occur in atypical
drowning cases such as dry drowning, disruptive climatic factors,
procedures and use of chemicals that are destructive and diatom
destruction and can also be caused by pollution of sea water or
fresh water. 23.24
A comparison between diatoms found in the victim's body
and those in the waters where the victim was found is useful to
strengthen the diagnosis and location of the victim's death. The
discovery of diatoms in tissue examination is one of the markers
that the victim died from drowning.1
Diatom's Relationship with Drowning
Diatom checks on suspected victims of drowning are
routine procedures that must be performed. Diatoms are used as
diagnostic tools to investigate drowning cases. Because of this, the
diatom examination aims: ascertain whether a person died due to
drowning or not, find out whether the person is still alive when
drowning and know the location of the sinking body before dying.
29
III. RESEARCH METHODS
Research Types and Design
The type of research conducted descriptively is to
determine the type of diatoms in rivers in the city of Tebing Tinggi
Location and Time of Research
The study was conducted in the Padang river and the
Bahilang river in the city of Tebing Tinggi,
When the study was conducted from August to November
2019. Sampling was carried out at 09.00-11.00 WIB, because
sunlight penetration for the process of photosynthesis of diatoms
was considered optimal at that hour.
Sample and How it Works Research
The material used in this study is river water taken at 2
rivers in Tebing Tinggi City in different locations, namely in the
upstream, middle and downstream areas at a depth of 1 meter to 2
meters from the surface of the river.
Take water from the river with a plankton net (plankton
net), then the netted plankton samples will be collected in a bucket
which is then poured into as many as 20 ml bottles, enter as much
as 20 ml concentrated H2SO4 and leave for 24 hours. Heat with
low heat until boiling, then pour into it a few drops of concentrated
HN03, until the color is clear yellow. The liquid is centrifuged for
15 minutes at 3000 rpm. The sediment (sediment) is washed with
distilled water and then again the sediment (sediment) is seen
under a microscope with a magnification of 100 times. Check the
shape of the diatoms found, then identify.
IV. RESEARCH RESULT
Table 1. Distribution of Types of Diatoms in the Padang
River at the Upstream, Middle and Downstream Stations in
Tebing Tinggi City.
N
O
Types of
Diatoms
Stations
Upstream Middle Downstream
1 Navicula sp.
+ + -
2 Synedra sp.
+ + +
3 Caloneis sp.
+ + +
4 Nitzschia sp.
+ + -
5 Cymbella sp.
+ + -
6 Fragillaria sp.
+ + +
7 Cyclotella sp. + - +

International Journal of Scientific and Research Publications, Volume 10, Issue 1, January 2020 378
ISSN 2250-3153
http://dx.doi.org/10.29322/IJSRP.10.01.2020.p9759 www.ijsrp.org
8
Asterionella
sp.
+ - +
9 Frustulia sp.
+ - +
10 Surirella sp.
+ - +
11 Netrium sp.
+ - +
12 Eunotia sp.
+ + +
13 Pinnularia sp.
- + +
14 Amphora sp.
- + +
15
Achnanthes
sp.
- + +
Description : + : Found
- : Not Found
Table 2. Distribution of Types of Diatoms in the Bahilang
River at the Upstream, Middle and Downstream Stations in
Tebing Tinggi City.
N
O
Types of
Diatoms
Stations
Upstream Middle Downstream
1 Navicula sp.
s + + +
2 Synedra sp.
+ + +
3 Rhopaldia sp.
+ + +
4 Nitzschia sp.
+ + +
5 Cymbella sp.
- + +
6 Stauroneis sp.
+ - -
7 Frustulia sp.
+ - +
8 Achnanthes sp. + - +
9 Gamphonema
sp. - + +
10 Terpsinoe sp.
- - +
11 Plagiotropis sp. + - +
Description : + : Found
- : Not Found
Table 3. Distribution of Types of Diatoms in the Padang
River and Bahilang River at the Upstream, Middle and
Downstream Stations in Tebing Tinggi City
N
O
Types of
Diatoms
River
Padang Bahilang
1 Navicula sp.
+ +
2 Synedra sp.
+ +
3 Caloneis sp.
+ -
4 Nitzschia sp.
+ +
5 Cymbella sp.
+ +
6 Fragillaria sp.
+ -
7 Cyclotella sp.
+ -
8 Asterionella sp.
+ -
9 Frustulia sp.
+ +
10 Surirella sp.
+ -
11 Netrium sp.
+ -
12 Eunotia sp.
+ -
13 Pinnularia sp.
+ -
14 Amphora sp.
+ -
15 Achnanthes sp.
+ +
16 Rhopaldia sp.
- +
17 Stauroneis sp.
- +
18
Gamphonema
sp.
- +
19 Terpsinoe sp.
- +
20 Plagiotropis sp. - +
Description : + : Found
- : Not Found
V. DISCUSSION
Based on the above research conducted on the Padang
River and Bahilang River in Tebing Tinggi City in different
locations, namely in the upstream, middle and downstream areas,
there are some different diatom species in both rivers, but several
diatom species are found in both rivers.
In a study conducted on the Padang river at the upstream
station, 12 diatom species were found, namely: Synedra sp.
Caloneis sp. Nitzschia sp. Cymbella sp. Fragillaria sp. Cyclotella
sp. Asterionella sp. Frustulia sp. Surirella sp. Netrium sp. Eunotia
sp., At the middle station found 10 species of diatoms, namely:
Navicula sp. Synedra sp. Caloneis sp. Nitzschia sp. Cymbella sp.
Fragillaria sp. Eunotia sp. Pinnularia sp. Amphora sp. Achnanthes

International Journal of Scientific and Research Publications, Volume 10, Issue 1, January 2020 379
ISSN 2250-3153
http://dx.doi.org/10.29322/IJSRP.10.01.2020.p9759 www.ijsrp.org
sp., and at the downstream station 12 diatom species were found,
namely: : Synedra sp. Caloneis sp. Fragillaria sp. Cyclotella sp.
Asterionella sp. Frustulia sp. Surirella sp. Netrium sp. Eunotia sp.
Pinnularia sp. Amphora sp. Achnanthes sp. Diatom species found
in the Bahilang river at the upstream station found 8 species,
namely: Navicula sp. Synedra sp. Rhopaldia sp. Nitzschia sp.
Stauroneis sp. Frustulia sp. Achnanthes sp. Plagiotropis sp., The
central station found 6 species of diatoms, namely: Navicula sp.
Synedra sp. Rhopaldia sp. Nitzschia sp. Cymbella sp.
Gamphonema sp., and at the downstream station 10 diatom
species were found, namely: Navicula sp. Synedra sp. Rhopaldia
sp. Nitzschia sp. Cymbella sp. Frustulia sp. Achnanthes sp.
Gamphonema sp. Terpsinoe sp. Plagiotropis sp.
Diatom distribution varies depending on the
environmental factors that influence it. The distribution that
affects diatoms horizontally include the following:
a. Temperature factor
Where the temperature can affect the photosynthesis process in the
waters both directly and indirectly. Diatoms are widespread in
subtropical climates.
b. Water flow
Waters currents, where currents largely determine the distribution
of diatoms that live as planktonic.
c. Turbidity
The more turbid aquatic ecosystem, the level of O2 is also reduced
and the sunlight is difficult to penetrate a certain. Thus inhibiting
the process of photosynthesis and growth of the diatoms
themselves.10
VI. CONCLUSION
Based on the results of the research conducted, it can be concluded
:
1. Found 15 species of diatoms in the Padang river, namely:
Navicula sp. Synedra sp. Caloneis sp. Nitzschia sp.
Cymbella sp. Fragillaria sp. Cyclotella sp. Asterionella
sp. Frustulia sp. Surirella sp. Netrium sp. Eunotia sp.
Pinnularia sp. Amphora sp. Achnanthes sp.
2. Found 11 species of diatoms in the Bahilang river,
namely: Navicula sp. Synedra sp. Rhopaldia sp.
Nitzschia sp. Cymbella sp. Stauroneis sp. Frustulia sp.
Achnanthes sp. Gamphonema sp. Terpsinoe sp.
Plagiotropis sp.
3. Diatom species in the Padang river that are not found in
the Bahilang river are Caloneis sp. Fragillaria sp.
Cyclotella sp. Asterionella sp. Surirella sp. Netrium sp.
Eunotia sp. Pinnularia sp. Amphora sp.
4. Diatom species in the Bahilang river that are not found in
the Padang river are Rhopaldia sp. Stauroneis sp.
Gamphonema sp. Terpsinoe sp. Plagiotropis sp.
5. In the Padang and Bahilang rivers, there are some
different types of diatoms found in the two rivers, but
there are several types of diatoms that are found in both
rivers. This can occur because some diatoms can adapt
quickly so that they can live in various environmental
conditions, while some are only able to live in certain
conditions.
6. There are differences in the types of diatoms found in the
Padang river and the Bahilang river so that it can help the
investigator in revealing the crime scene or where the
victim was first found, especially in the case of the victim
drowning,
VII. SUGGESTION
1. Diatom identification results in this study, have not
provided a comprehensive picture of the type of diatoms
and the abundance of diatoms in the Padang River and
the Bahilang river in Tebing Tinggi City which have only
been carried out in a limited time span. Therefore it is
necessary to do further research in a longer time span.
2. Diatom images in this study are less clear because it uses
a mobile camera, it is hoped that subsequent studies will
use a special camera that is compatible with a
microscope.
3. Doing the same next research on rivers in Tebing Tinggi
City.
REFERENCES
[1] Budiyanto A, Widiatmaka W, Sudiono S, Winardi T, Mun’iin A,Sidhi, dkk. Ilmu Kedokteran Forensik. Ed I. Jakarta : Bagian Kedokteran Forensik Fakultas Kedokteran Universitas Indonesia; 1997. Hal 197-202
[2] DiMaio DJ, DiMaio VJ. Forensik Pathology. Ed II. New York; CRC Press LLC; 2001.
[3] World Health Organization [Internet]. World Health Organization [cited 30 July 2019]. Available from: http://www.who.int/violence_injury_prevention/drowning/en/
[4] Centers for Disease Control and Prevention. Unintentional Drowning: Get the Facts. CDC; 2014 [cited 2014 Dec 11]. Available from : http://www.cdc.gov/homeandrectionalsafety/water-safety/waterinjuries tactsheet.html
[5] Cantwell GP. Drowning. Verive MJ, Shoff WH, Alcock J, editors. Medscape reference; 2014 [cited 2014 Dec 11]. Available from: http://emedicine.medscape.com/article/772753-overview
[6] Szpilman D, Bierens JJLM, Handley AJ, Orlowski JP. Review article: Drowning. New England Journal of Medicine. 2012: 366; 2102-10
[7] Muzakki L. Transportasi Perairan Indonesia. Dinas Perhubungan Jawa Barat (interna ). May 2014 [cited 2014 May 12]. Available from; http://dishub.jabarprov.go.id/content.php?.id=399
[8] Knight, Bernard. Forensik Pathology. Oxford University Press. 1996. p 395-408
[9] Gani, Husni. Diagnosa Drowning. Penerbit Erlangga. Jakarta. 2002.
[10] Teddesh CG, et al. Forensic Medicine. W.B Saunder Company. London. 1977.
[11] Amri A. Tenggelam. in Amri A. Eds. Ilmu Kedokteran Forensik. Edisi 2. Medan. 2007.
[12] M.G Forero, et al. Analysis and Screening of Diatoms by Shape from Contour. Spanyol. 2009.
[13] Reece JB, Mitchell LG. Biologi. Terjemahan Mahameru. Jakarta. 2003.
[14] Maneul dkk. Automatic Screening and Multifocus Fusion Methods for Diatom Identification. Republik Ceko. 2009.
[15] Yeanny MS. Komunitas Fitoplankton sebagai Bioindikator Kualitas Air Sungai Belawan. USU Medan. 2011.
[16] Simanjuntak M. Pengaruh Suhu, Salinitas dan Silikat Terhadap Kelimpahan Fitoplankton di Perairan Digul Laut Arafura, Jurnal ISSN Lingkungan Hidup Jakarta. 2007.
[17] Camps, E. et al. Operational Deaths and Complication (Including Those Under Anaesthesia). In : Gradwohl’s Legal Medicine Third Edition, Great Britain. 1976.
[18] Knight, Bernard. Forensic Pathology. Oxford University Press. New York. 2000.

International Journal of Scientific and Research Publications, Volume 10, Issue 1, January 2020 380
ISSN 2250-3153
http://dx.doi.org/10.29322/IJSRP.10.01.2020.p9759 www.ijsrp.org
[19] Sancetta C. Processes Controling The Accumulation of Diatoms in Sediment. Norwich. University of East Anglia. 1989.
[20] Dahlan S. Asfiksia. Ilmu Kedokteran Forensik Pedoman Bagi Dokter dan Penegak Hukum. Semarang: Badan Penerbit Universitas Diponegoro; 2007. Hal 47-65
[21] University of Michigan. The Water Resources of Earth. University of Michigan [internet]. April 2006 [cited 2014 May 11]. Available from http://www.globalchange.umich.edu/globalchange2/current/lectures/freshwater_supply/freshwater.html.
[22] Sheperd R. Drowning and Immersion. Simpson’s Forensic Medicine, 12th ed. USA: Oxford University Press Inc; 2003. p. 105-10.
[23] Piette MHA, De Letter EA. Drowning: Still a Diffucult Autopsy Diagnosis. Forensic Science International. 2006; 163: p. 1-9
[24] Law YY. Jayaprakash PT. Prevalence of diatom frustules in non-vegetarian foodstuffs and it’s implications in interpreting identification of diatom frustules in drowning case. Forensic Science International. 2007; 170: p. 1-7.
[25] Lunetta P, Penttla A, Sajantala A. Drowning in Finland “External Cause“ and “injury” Codes. 2009.
[26] Brinkmann B, Fechner G, Piischel K. On the Ultrastructural Pathology of the Alveolar System in Experimental Drowning. 1983. p. 47-60
[27] Masaharu A. Illustration of the Japanese Fresh-Water Algae Tokyo: Unhidarokakubo. 1977.
[28] Yunfang HMS. The Freshwater Biota in China Yantoi University Fishery College; 1995.
[29] Rohn EJ, Frade PD. The Role of Diatoms in Medico Legal Investigations I: The History Contemporary Science and Application of the Diatom Test for Drowning. Forensic Examiner; 2006: p. 10-15.
[30] Charles BH, James WM. Introduction to The Algae 2nd ed. United Stase of America: Library of Cospen Cataloging; 1985, p.465-473.
[31] Shamsudin L. Diatom Air Tawar Morfologi dan Taksonomi. Kualalumpur; 1991, p.174-235
[32] Srivastava N, Suseela M, Toppo K, Lawrence R. Fresh Water Algal Diversity of Central India. International Journal of Research and Development in Pharmacy & Life Science [internet] 2018 [cited 06 December 2019];4:3046. Available from: http//ijrdpl.com
[33] Edmondson W. Fresh Water 2nd ed Washington; University of Washington; 1959, p.140-184.
[34] Hii TT, Pin LC. Marine Micro-Phytoplankton of Phytoplankton of Singapore with a Review of Harmful Microalgae in the Region National University Singapore, 2016; 34(0217-2445): 78-96.
[35] South GR & A Whittick. Introduction to Phycology; 1987, P. 96
[36] Arifiani PA, Junitha I, Suartini N. Variasi Spesies Diatom Pada Tipe Perairan Berbeda Untuk Kepentingan Forensik Sebagai Petunjuk Kematian Akibat Tenggelam. Jurnal Simbiosis III 2015,I(2337-7244):247-257.
AUTHORS
First Author – Edwin Parlindungan Lubis, Department of
Forensic and Medicolegal of Faculty of Medicine Universitas
Sumatera Utara, Email :[email protected]
Second Author – Asan Petrus, Department of Forensic and
Medicolegal of Faculty of Medicine Universitas Sumatera Utara
Third Author – Abdul Gafar Parinduri, Department of Forensic
and Medicolegal of Faculty of Medicine Universitas Sumatera
Utara
International Journal of Scientific and Research Publications, Volume 10, Issue 1, January 2020 381
ISSN 2250-3153
http://dx.doi.org/10.29322/IJSRP.10.01.2020.p9760 www.ijsrp.org
Knowledge And Practice Regarding Oral Hygiene
Among Primary School Children Of Selected Schools,
Dhangadhi, Kailali
Chandani Malla*, Anita Mehta1
*Department of Pediatric Nursing, NMCNC, Birgunj, Parsa
1Department of Medical Surgical Nursing, NMCNC, Birgunj, Parsa
DOI: 10.29322/IJSRP.10.01.2020.p9760
http://dx.doi.org/10.29322/IJSRP.10.01.2020.p9760
Abstract- Background: Oral hygiene is the practice of keeping
the mouth and teeth clean to prevent dental problems, especially
dental caries, gingivitis and bad breath. The purpose of
maintaining oral hygiene is to prevent the build-up of plaque, the
sticky film of bacteria and food that forms on the teeth.1 This
research study was conducted to find out the Knowledge and
Practice regarding Oral Hygiene among Primary School Children
of selected school, Dhangadhi, Kailali.
Methods: A Descriptive co-relational research design was
used. A total of 112 primary school children of Hill World English
Boarding School, Dhangadhi, Kailali were included as samples
and total enumerative Sampling technique was used for sample
selection. Data was collected by using structured knowledge and
practice questionnaire.
Results: The study results shows that 12.5% respondents
had inadequate knowledge, 58% respondents had moderate
knowledge and 29.5% respondent had adequate knowledge
regarding oral hygiene. A least (1.8%) respondent had good
practice where as majority (67.9%) students had satisfactory
practice and 30.45% respondents had poor practice regarding oral
hygiene. There is no significant association found between level
of knowledge and selected socio-demographic variables as well as
level of practice and selected socio-demographic variables. there
is statistically significant positive correlation found between the
knowledge score and practice score of respondents’ regarding oral
hygiene (P<0.001).
Conclusion: Finding of current study showed that the
knowledge and practice about oral hygiene among primary school
children was not satisfactory and had to improved significantly.
School based health promotion for oral hygiene is a must for
improving oral health among school children.
Index Terms- Knowledge, Oral hygiene, Practice, Primary School
children
Acknowledgements: Yes
Funding: Nil
Conflict of Interest: None
Permission from IRC: Yes
I. INTRODUCTION
ental caries is a multifactorial oral disease developed by the
localized dissolution of the tooth hard tissues, caused by
bacteria.2,3
The dental caries burden has been increasing among
children due to the unlimited consumption of sugary substances,
poor oral care practices and inadequate health service utilization.
Dental caries is most prevalent and chronic oral disease of
childhood having multifactorial etiology. The etiological factors
are host factors, microorganisms, diet and time.4
Dental caries is a common disease with low mortality and
high morbidity and has great impact in the general health of a
population.5,6
Nepal has a high morbidity of dental caries in all age groups
of both genders. The disease is on different factors such as
lifestyle, diet and lack of dental health care.5,6,7
The National Pathfinder survey of Nepal 2004 shows that
57.5% of five to six years age group and 25.6% of 12 to 16 years
age group suffer from dental caries. Pain and discomfort due to
untreated dental caries was 18% in five to six year old.7
Many children fail to brush their teeth effectively and tend
to consume cariogenic foods and may underestimate health risks
despite having basic knowledge of dental health, such as
importance of proper brushing and diet in preventing dental
caries.8 Poor oral health can have negative impacts on children’s
quality of life and academic performance apart from causing
chronic pain and discomfort .If untreated it can impact daily
activities in terms of play, sleep, eating and school activity.9 As
dental caries is the most common dental disease with high
prevalence it is necessary to control the disease by assessing and
rendering the treatment required along with spreading awareness
regarding its prevention.10
Nepal is currently facing an oral healthcare crisis. Fifty-
eight percent of children and 69 percent of adults in the country
suffer from bacterial tooth decay. This can lead to infections, gum
disease, and chronic pain as well as heart disease and diabetes. A
national Oral Health Care Plan was drafted in 2004, but is being
implemented at a glacial speed. And thousands of Nepalese in
rural villages have no access to basic care such as fillings or even
fluorinated toothpaste and water. Meanwhile, intense superstition
D

International Journal of Scientific and Research Publications, Volume 10, Issue 1, January 2020 382
ISSN 2250-3153
http://dx.doi.org/10.29322/IJSRP.10.01.2020.p9760 www.ijsrp.org
surrounds dental care, including the belief that tooth extraction can
cause blindness.11
School is a place of learning for the children and is in fact
the ideal setting for integrating oral health instructions in the
curriculum. Children are receptive to guidance and familiar with
the learning environment and culture. School teachers can
effectively influence student’s knowledge and practices regarding
oral health and can bring change in behavior. It is very important
to target oral health education to the children since the lifestyle
and hygiene practices once established at an early age can go a
long way in spending rest of the life in a healthy way. They should
be empowered to take control of their own health early in their
lives and encouraged to develop positive attitude towards
preventive measures.12
The researcher felt that oral hygiene contributes a major
role in the prevention of dental diseases. Hence assessing the
knowledge and practice of primary school children regarding oral
hygiene is important to identify the dental problems in order to
manage and prevent the problems associated with oral health.
II. METHODS AND MATERIALS
A Descriptive co-relational research design was used for
the study to achieve the study objectives. The population included
both male and female primary school children of age group 6-11
years of selected primary school, Dhangadhi, Kailali. The total
sample size was 112 students, who met the sampling criteria. Total
enumerative Sampling technique was used for sample selection.
The study was conducted in Hill World English Boarding School,
Dhangadhi, Kailali. The researcher used structured knowledge and
practice questionnaire to collect the data. The content validity of
the research instrument was ascertained before the data collection.
The reliability of tool was determined by pre-testing it in 12
samples (10% of total sample) and was tested by using Split half
method and the reliability of the tool was found 0.97 for
knowledge and 0.89 for practice items. The researcher herself
collected the data from 15th July 2019 to 30th July 2019. The data
was collected and recorded systematically and was organized in a
way that facilitated computer entry.
III. RESULTS
The data were analyzed using descriptive and inferential
statistics. The results have been organized and presented as given
below:
Section A: Description of the demographic
characteristics of the respondents
Analyzed data reveals that, most 86.6% of students were in
age group 8-9 years. Majority (56.3%) of students were male
where as 43.8% were female. Maximum (92.9%) of students were
Hindu and least (0.9%) were Christians. Majority (73.2%) of
students were from nuclear family and only 5.4% from extended
family. Most of the students (57.1%) had one sibling and least
(1.8%) had no sibling. Majority 52.7% of students fathers had
achieved secondary level of education where as only 3.6% were
illiterate. Regarding mother’s education 33% had achieved
primary level of education where as least (7.1%) were literate but
no schooling. Among them, 42% of students fathers had their self
business and least (2.7%) were farmers and among mothers
majority (73.2%) were housewives and 1.8% were laborer.
Section B: Assessment of the level of knowledge regarding Oral hygiene
Table 1: Frequency and percentage of Respondent’s Level of Knowledge regarding oral hygiene
n=112
Level of knowledge Frequency Percentage (%)
Inadequate knowledge <50% 14 12.5
Moderate knowledge 50-75% 65 58
Adequate knowledge >75% 33 29.5
112 100
Section C: Assessment of the level of practice regarding Oral hygiene
Table 2: Frequency and percentage of respondent’s Level of practice regarding oral hygiene
n=112
Level of practice Frequency Percentage (%)
Good practice <50% 2 1.8
Satisfactory practice 50-75% 76 67.9
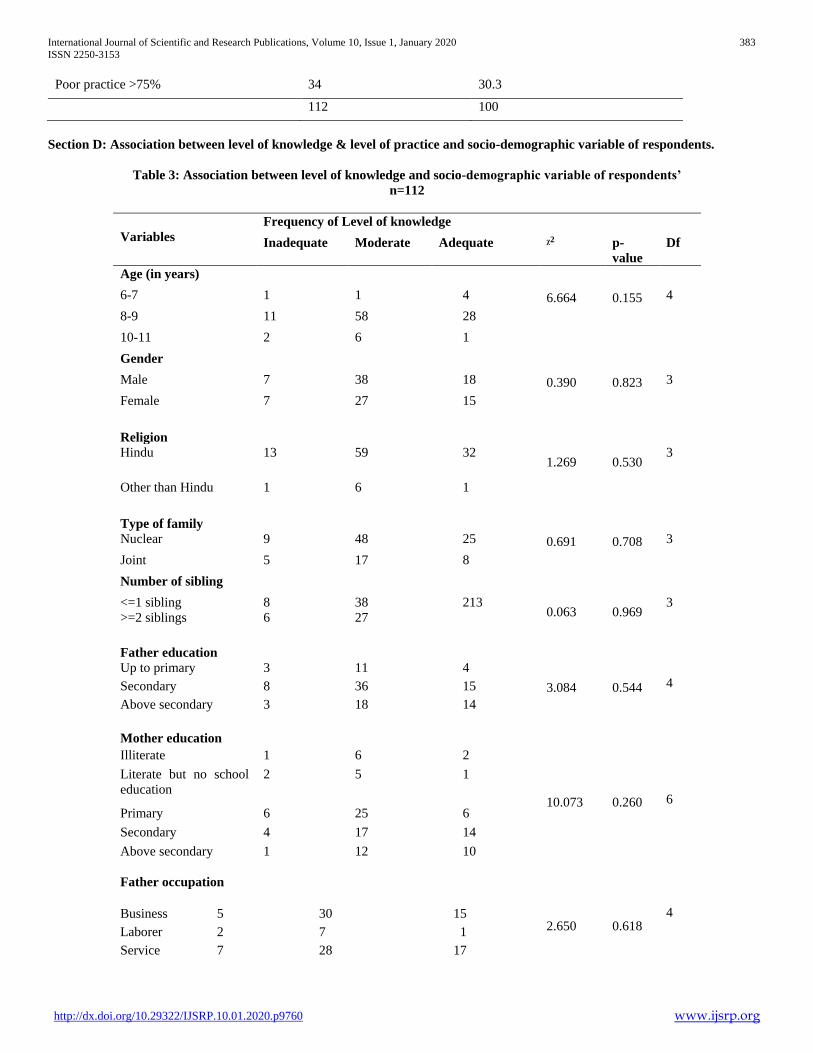
International Journal of Scientific and Research Publications, Volume 10, Issue 1, January 2020 383
ISSN 2250-3153
http://dx.doi.org/10.29322/IJSRP.10.01.2020.p9760 www.ijsrp.org
Poor practice >75% 34 30.3
112 100
Section D: Association between level of knowledge & level of practice and socio-demographic variable of respondents.
Table 3: Association between level of knowledge and socio-demographic variable of respondents’
n=112
Variables
Frequency of Level of knowledge
Inadequate Moderate Adequate ᵡ2 p-
value
Df
Age (in years)
6-7 1 1 4 6.664 0.155 4
8-9 11 58 28
10-11 2 6 1
Gender
Male 7 38 18 0.390 0.823 3
Female 7 27 15
Religion
Hindu 13 59 32 1.269 0.530
3
Other than Hindu 1 6 1
Type of family
Nuclear 9 48 25 0.691 0.708 3
Joint 5 17 8
Number of sibling
<=1 sibling
>=2 siblings
8
6
38
27
213 0.063 0.969
3
Father education
3.084
0.544
4
Up to primary 3 11 4
Secondary 8 36 15
Above secondary 3 18 14
Mother education
10.073
0.260
6
Illiterate 1 6 2
Literate but no school
education
2 5 1
Primary 6 25 6
Secondary 4 17 14
Above secondary 1 12 10
Father occupation
2.650
0.618
4 Business 5 30 15
Laborer 2 7 1
Service 7 28 17
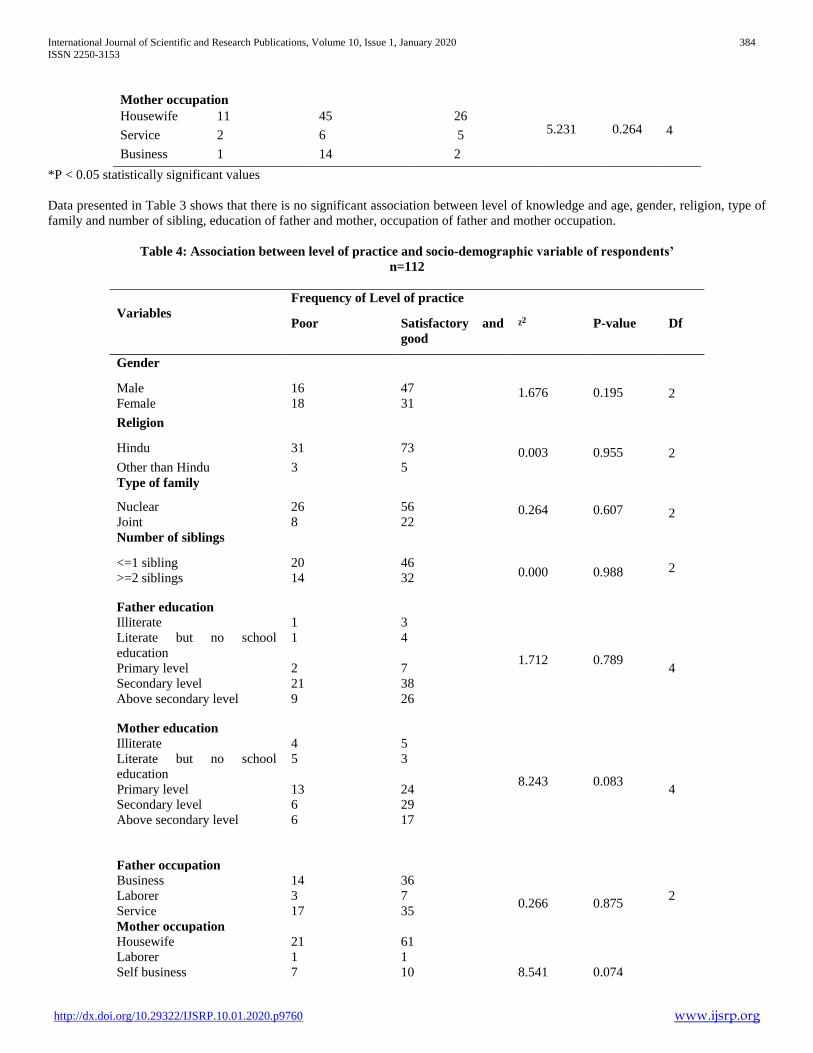
International Journal of Scientific and Research Publications, Volume 10, Issue 1, January 2020 384
ISSN 2250-3153
http://dx.doi.org/10.29322/IJSRP.10.01.2020.p9760 www.ijsrp.org
Mother occupation
5.231
0.264
4 Housewife 11 45 26
Service 2 6 5
Business 1 14 2
*P < 0.05 statistically significant values
Data presented in Table 3 shows that there is no significant association between level of knowledge and age, gender, religion, type of
family and number of sibling, education of father and mother, occupation of father and mother occupation.
Table 4: Association between level of practice and socio-demographic variable of respondents’
n=112
Variables
Frequency of Level of practice
Poor Satisfactory and
good
ᵡ2 P-value Df
Gender
1.676
0.195
2 Male 16 47
Female 18 31
Religion
0.003
0.955
2 Hindu 31 73
Other than Hindu 3 5
Type of family
0.264
0.607
2 Nuclear 26 56
Joint 8 22
Number of siblings
0.000
0.988
2 <=1 sibling
>=2 siblings
20
14
46
32
Father education
1.712 0.789
4
Illiterate 1 3
Literate but no school
education
1 4
Primary level 2 7
Secondary level 21 38
Above secondary level 9 26
Mother education
8.243 0.083
4
Illiterate 4 5
Literate but no school
education
5 3
Primary level 13 24
Secondary level 6 29
Above secondary level 6 17
Father occupation
0.266
0.875
2
Business 14 36
Laborer 3 7
Service 17 35
Mother occupation
8.541
0.074
Housewife 21 61
Laborer 1 1
Self business 7 10

International Journal of Scientific and Research Publications, Volume 10, Issue 1, January 2020 385
ISSN 2250-3153
http://dx.doi.org/10.29322/IJSRP.10.01.2020.p9760 www.ijsrp.org
Government employee 4 1
4 Private employee 1 5
*P < 0.05 statistically significant values ¥ Yates correction
Data presented on Table 4 reveals that, there is no association between level of practice and gender, religion, type of family and number
of sibling, education of father and mother, occupation of father and mother.
Section E: Correlation between knowledge score and practice score of respondents regarding oral hygiene.
Table 6: Correlation between Knowledge Scores and Practice Scores of Respondents Frequency regarding oral hygiene
n=112
Mean ± SD Karl Pearson’s correlation
coefficient
p-value
Knowledge Scores 11.81 ± 2.79 0.434 <0.001*
Practice Scores 6.08 ± 1.68
* Significant at the level of (p=0.05)
Table 6 shows that there is statistically significant positive correlation i.e. r= 0.434 between the knowledge score and practice score of
respondents’ regarding oral hygiene (P<0.001).
IV. DISCUSSION
Regarding socio-demographic characteristics findings,
majority (86.6%) of the students were in age group 10-11 years.
Majority (56.3%) of students were male. Most (92.9%) of students
belongs from Hindu religion. Majorities (73.2%) of the students
were from nuclear family and majority (57.1%) of the students had
one sibling. Majority (52.7%) of the students’ father had achieved
secondary level of education and 33% of student’s mother had
achieved primary level of education. Regarding occupation, 42%
of the students’ fathers had their self business and majorities
(73.2%) of mothers were housewife.
The study results showed that 12.5% respondents had
inadequate knowledge, 58% respondents had moderate knowledge
and 29.5% respondent had adequate knowledge regarding oral
hygiene. The present study findings is consistent with the cross
sectional study conducted in Jalandhar district, Punjab by
Manveer, (2013), which reported that (23.1%) of respondent had
adequate knowledge regarding oral hygiene.
A least (1.8%) respondent had good practice where as
majority (67.9%) students had satisfactory practice and 30.45%
respondents had poor practice regarding oral hygiene. These
findings is consistent with the cross sectional study conducted in
Iran by Aziz, (2014), which reported that 62% of responded had
good practice regarding oral hygiene.
The present study shows that there is no association
between knowledge and socio demographic data related age,
gender, religion, type of family, number of sibling, education of
father and occupation of father and mother. Also there is no
association between practice and socio demographic data related
age, gender, religion, type of family, number of sibling, education
of father and occupation of father and mother. This study
identified that there is a positive significant correlation (r=0.434,
p<0.001) between knowledge and practice of respondents
regarding oral hygiene which is supported by descriptive cross
sectional study conducted in Iran by Aziz, (2014) which reported
that there was positive correlation (r=0.695, p<0.001) between
knowledge and practice regarding oral hygiene among the
students.
V. CONCLUSION
One of the burning issues regarding practice of oral hygiene
is the seriousness of regular visits to the dentist, not only when
there is some dental problem but also for routine check-ups as a
preventive measure against disease such as caries. A poor dental
and oral health and untreated oral disease can have a significant
impact on quality of life according to WHO report.13 The
systematic school and community-oriented oral health promotion
programs are needed to target the needs of primary school
children. Also, information regarding oral health should be
included on wider basis in the school curriculum in an attempt to
prevent and control dental and oral diseases. The study concluded
that there is a great need for focusing on awareness programme
and good practices among primary school children since primary
school children lack adequate knowledge and practice regarding
oral hygiene for the prevention and management of oral and dental
problem and to prevent from further complications.
REFERENCES
[1] Kabir S, Gul R. Knowledge, attitude and practices regarding oral hygiene in school going children of both genders, aged 10–15 years. Journal of KCD.2013;3(2). Available from; file:///E:/oral%20hygiene%20thesis/knowledge%20and%20prcatice%20regarding%20oral%20hygiene.pdf
[2] Collins WZN, Walsh TF, Figures KH. A Handbook of dental hygienists. 4th ed. London: Wright An imprint of Elsevier Science Ltd; 2002. p. 1-256.
[3] Richardson RL, Barton RL, Brauer JC. The dental assistant. 4th ed. New York: McGraw-Hill Book Company; 1970. p. 213-25.
[4] Mulu W, Demilie T, Yimer M, Meshesha K, Abera B. Dental caries and associated factors among primary school children in Bahir Dar city: a cross-

International Journal of Scientific and Research Publications, Volume 10, Issue 1, January 2020 386
ISSN 2250-3153
http://dx.doi.org/10.29322/IJSRP.10.01.2020.p9760 www.ijsrp.org
sectional study. BMC Res Notes. 2014;7(1):1–7. https://doi.org/10.1186/17560500-7-949. PMID: 25540044
[5] Peterson PE. World oral health report. Continuous improvement of oral health in the 21st century – the approach of the WHO global oral health programme, Geneva, Switzerland: World Health Organization; 2003. p. 1-16.
[6] Moynihan PJ. The role of diet and nutrition in the etiology and prevention of oral diseases. Bull World Health Organ 2005;83(9):694-99.
[7] Yee R, Mishra P. Nepal oral national pathfinder survey 2004. International Dental Journal.2006; 56(4):196-202.
[8] Khanal S, Acharya J. Dental caries status and oral health practice among 12-15 year old children in Jorpati, Kathmandu. Nepal Medical College Journal.2014:16(1):84–7. Available from; https://www.researchgate.net/publication/274085786_Dental_caries_status_and_oral_health_practice_among_12-15_year_old_children_in_Jorpati_Kathmandu
[9] Mafuvadze BT, Mahachi L, Mafuvadze B. Dental caries and oral health practice among 12-year-old school children from low socio-economic status background in Zimbabwe. Pan Afr Med J. 2013; 14:164–9. https://doi.org/10.11604/ pamj.2013.14.164.2399. PMID: 23819006.
[10] Fotedar Shailee M, Sogi Girish R, Sharma Kapil PN. Oral health status and treatment needs among12 and 15-year-old government and private school
children in Shimla city, Himalchal Pradesh, India. J Int Soc Prev community Dent. 2013;3(1):44–50. https://doi.org/10.4103/22310762.115715. PMID: 24478980.
[11] Miller J. Nepal's Dental Health Crisis. Pulitzer Center.2013. Avalailabe from, https://pulitzercenter.org/reporting/nepals-dental-health-crisis
[12] Mathur P, Duggal R. Oral Health Module for prevention of Dental Caries in school children.2014.
[13] Khanal S, Bhattarai R, Rao NG, Shrestha S. Prevalence of Dental Caries among Primary School Children of Kathmandu District- A Pilot Study. Journal of College of Medical Sciences-Nepal. 2017;13(2):275-8. Available from; file:///E:/oral%20hygiene%20thesis/16335-Article%20Text-57925-1-10-20170716.pdf
AUTHORS
First Author – Chandani Malla, Department of Pediatric
Nursing, NMCNC, Birgunj, Parsa , Email:
Second Author – Anita Mehta, Department of Medical Surgical
Nursing, NMCNC, Birgunj, Parsa
International Journal of Scientific and Research Publications, Volume 10, Issue 1, January 2020 387
ISSN 2250-3153
http://dx.doi.org/10.29322/IJSRP.10.01.2020.p9761 www.ijsrp.org
The Impact of Online Consumer Reviews Dimension
on Online Purchase Intentions In Tokopedia
Andreanus Kevin*, Zakaria Wahab**, Muchsin Saggaff Shihab ***
* Student of Magsiter Management, Sriwijaya University
** Lecturer of Magister Management, Sriwijaya University *** Lecturer of Magister Management, Sriwijaya University
DOI: 10.29322/IJSRP.10.01.2020.p9761
http://dx.doi.org/10.29322/IJSRP.10.01.2020.p9761
Abstract- This study aims to determine whether the
dimensions of online consumer reviews consisting of
source credibility, review quality, review quantity,
review valence affect the online purchases intention in
Tokopedia. The population in this study were all
Tokopedia application users, while the sample in this
study were users who made purchases using the
Tokopedia application in the last 2 months with a total
sample of 190 respondents. This study uses multiple
linear regression analysis to determine the effect of
source credibility, review quality, review quantity,
review valence on purchase intentions. The results of
this study indicate that the source credibility, review
quality and review valence partially have a significant
effect on purchase intentions, while the review quantity
has no significant effect on purchase intentions.
Index Terms- online consumer review, source
credibility, review quality, review quantity, review
valence , purchase intentions
I. INTRODUCTION
Internet usage nowadays has increased very
fast. The We Are Social Survey as of January 2018
states that the number of global internet users now
touches 4.021 billion users with 53 percent penetration
of the total population in the world. The level of
internet usage is also claimed to have risen by 248
million users, which was previously 3.773 billion users
in January 2017 (kompas.com accessed October 21,
2018). Through the 2018 APJII survey, 64.8% of
Indonesia's population or 171.17 million people have
been connected to the internet. The number of internet
users shows an increase of 27.91 million, which was
143.26 million users in 2017.
The high level of internet usage is what caused
the offline store to start turning into an online store. The
results of research conducted by HaloMoney noted
several modern retail brands that closed their stores
throughout 2017 such as the Lotus Department Store,
Matahari Department Store, Debenhams and
Ramayana. (halomoney.co.id accessed on October 21,
2018). Companies that close their outlets generally
have their own websites and even online applications for
purchasing products.
The trend of online shopping is also increasingly in
demand in Indonesia. This can be proven from the
number of transactions of internet users who do online
shopping in Indonesia during 2018 which increased by
151% compared to the previous year (source:
cnbcindonesia.com accessed on November 11, 2019).
The number of e-commerce users in Indonesia has also
increased rapidly. The number of e-commerce users
reached 139 million users in 2017, then rose 10.8% to
154.1 million users in 2018. The number of e-commerce
users is predicted to reach 212.2 million users in 2023.
The same thing also occur at the level of e-commerce
penetration that is always increasing. Until 2023, the e-
commerce penetration rate is predicted to reach 75.3%
of the total population (katadata.co.id accessed on
Oktober 21, 2019).
Tokopedia is one of the most popular e-
commerce sites in Indonesia as a place for online
shopping. The proof is that Tokopedia was ranked first
with the highest number of visitors in Indonesia until
July 2019, beating Shopee and Bukalapak. In addition,
in 2018 Tokopedia has also become a favorite
application on Google Play with more than 10 million
downloads (source: tribunnews.com accessed 11
November 2019). From the transaction value,
Tokopedia also recorded the largest transaction value
compared to other e-commerce, which was US $ 5.9
billion in 2018. Even that number is predicted to reach
US $ 37.45 billion in 2023 (katadata.co.id accessed on
Oktober 21, 2019).
The high intention of online shopping in e-
commerce is directly proportional to the high level of
consumer confidence in shopping online. The
BrightLocal survey states that 93% of consumers read
online reviews to make decisions and 85% of consumers
trust reviews as much as they trust personal
recommendations. Meanwhile, APJII survey results
show that 62.8 percent of internet user respondents in
Indonesia believe that online transactions are safe.
Based on these facts, reading online reviews is one of
the factors that can increase consumer confidence so that
it can affect consumers' intention to shop online. While
the research conducted by the author, on Sriwijaya
International Journal of Scientific and Research Publications, Volume 10, Issue 1, January 2020 388
ISSN 2250-3153
http://dx.doi.org/10.29322/IJSRP.10.01.2020.p9761 www.ijsrp.org
University students in Palembang in 2019 showed that
most respondents intend to shop for products in
Tokopedia, but only a small proportion of respondents
stated that they read the reviews first before intending
to buy products in Tokopedia .
Part of the information created by website
users who have purchased products is also called
Online Consumer Reviews (OCRs). OCRs contain
information and recommendations regarding products
from a consumer perspective. Online Consumer
Reviews itself consists of 4 dimensions: source
credibility, review quality, review quantity, and review
valence (Park, Lee & Han, 2007). Source credibility
relates to the message recipient's perception of whether
or not the source of the message is reliable, does not
reflect anything about the message itself (Schepers,
2015). Review quality contains an objective and logical
review, the delivery of which is understandable and
relevant information on related products and services
(Park, Lee & Han, 2007). According to Bataineh
(2015) Review quantity is related to how many reviews
of a product seen by consumers to find out whether the
product is popular and has value or not. Review valence
regarding the way the online review is viewed, for
example viewed negatively or positively (Schepers,
2015).
Various phenomena indicate the factors that
influence purchase intention. Several previous studies
have also examined the effect of source credibility,
review quantity, review quality, review valence on
purchase intentions. Research from Atika et al (2012),
Arora and Sharma (2018), Hui (2017), Sutanto and
Aprianingsih (2016), Erkan and Evans (2016), and
Amandhari (2016) support that the source credibility
variable significantly influences intention purchase.
While Johansen's and Hovland's (2012) research
cannot reveal a significant effect of source credibility
on purchase intentions, which means that a reviewer's
credibility is not a significant indicator used by readers
to evaluate e-WOM messages and influence purchase
intentions.
Research by Atika et al (2012), Arora and
Sharma (2018), Sutanto and Aprianingsih (2016),
Johansen and Hovland (2012), Lin, et al (2011), Zhou
et al. (2013), Lee (2009), Erkan and Evans (2016)
support that review quality significantly influences
purchase intentions. While research Eun-Joo and Yu-
Jin (2013) states that review quality does not have a
significant effect on consumer confidence and
purchase intentions.
Research by Xiaorong et al (2011), Sutanto
and Aprianingsih (2016), Lin et al. (2011), Zhou et al.
(2013) and Lee (2009) support that review quantity has
a significant effect on purchase intentions. In contrast,
research from Arora and Sharma (2018) states that
there is no significant effect of the review quantity on
purchase intentions.
Research by Zarco (2015) states that the
review valence has a significant effect on purchase
intentions. Furthermore, Ketelaar et al (2015) and
Somohardjo (2017) stated that a positive review has a
significant positive effect on purchase intentions.
Whereas Ketelaar et al (2015) and Amandhari (2016)
state that negative reviews have a significant negative
effect on purchase intentions. In contrast, Togas, et al.
(2019) suggested that the review valence did not have a
significant effect on hotel booking intentions.
Based on the phenomena mentioned above, the
writer is interested in testing the influence of the Online
Consumer Reviews dimension consisting of source
credibility, review quality, review quantity, and review
valence on purchase intentions in Tokopedia. Therefore
the title of this research is "THE IMPACT OF ONLINE
CONSUMER REVIEWS DIMENSIONS ON ONLINE
PURCHASE INTENTIONS IN TOKOPEDIA"
Online Consumer Reviews
Online consumer reviews (OCRs) are one type
of e-WOM, including positive or negative statements
made by consumers about products sold
in online stores. OCRs contain information and
recommendations regarding products from a consumer
perspective. Online Consumer Reviews itself consists
of 4 dimensions: source credibility, review quality,
review quantity, and review valence (Park, Lee & Han,
2007) .
Source credibility
Source credibility relates to the message
recipient's perception of whether or not the source of the
message can be trusted (Schepers, 2015). Source
credibility is defined as the extent to which information
sources are seen as competent, reliable and can be
trusted by recipients of information. Consumers
generally trust credible opinions from other experienced
consumers (Arora & Sharma, 2018).
Review Quality
Review quality contain reviews that are
objective and logical, understandable and have relevant
information on related products and services (Park, Lee
& Han, 2007). Reviews that are objective and clear,
greatly affect consumers compared to opinions that are
emotional and subjective. Likewise, reviews with
transparent and useful arguments are more reliable than
reviews with emotional content (Arora & Sharma,
2018).
Review Quantity
According to Bataineh (2015) review quantity
is related to how many reviews of a product seen by
consumers to find out whether the product is popular
and of high quality or not. The large number of reviews
and information on online platforms supports them to be
more observable (Cheung & Thadani, 2012). The
number of reviews can meet consumer information
needs to strengthen certainty and can reduce doubts
about the risks of online shopping (Arora & Sharma,
2018).
Review Valence
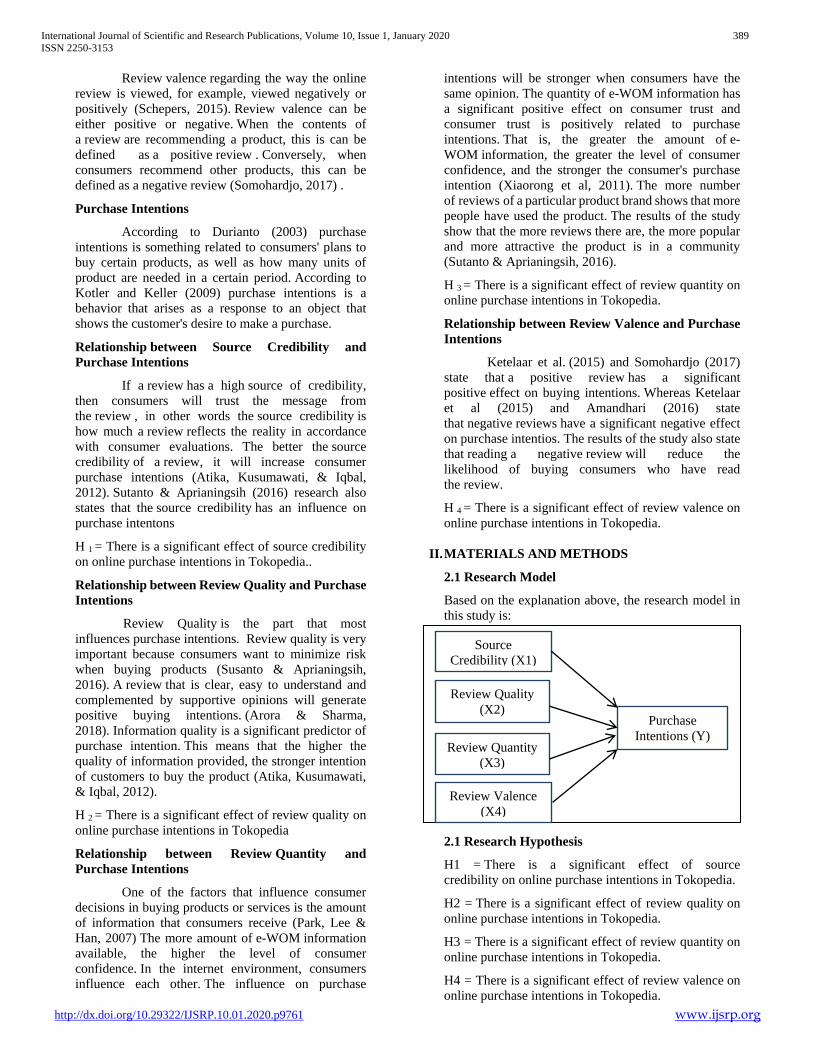
International Journal of Scientific and Research Publications, Volume 10, Issue 1, January 2020 389
ISSN 2250-3153
http://dx.doi.org/10.29322/IJSRP.10.01.2020.p9761 www.ijsrp.org
Review valence regarding the way the online
review is viewed, for example, viewed negatively or
positively (Schepers, 2015). Review valence can be
either positive or negative. When the contents of
a review are recommending a product, this is can be
defined as a positive review . Conversely, when
consumers recommend other products, this can be
defined as a negative review (Somohardjo, 2017) .
Purchase Intentions
According to Durianto (2003) purchase
intentions is something related to consumers' plans to
buy certain products, as well as how many units of
product are needed in a certain period. According to
Kotler and Keller (2009) purchase intentions is a
behavior that arises as a response to an object that
shows the customer's desire to make a purchase.
Relationship between Source Credibility and
Purchase Intentions
If a review has a high source of credibility,
then consumers will trust the message from
the review , in other words the source credibility is
how much a review reflects the reality in accordance
with consumer evaluations. The better the source
credibility of a review, it will increase consumer
purchase intentions (Atika, Kusumawati, & Iqbal,
2012). Sutanto & Aprianingsih (2016) research also
states that the source credibility has an influence on
purchase intentons
H 1 = There is a significant effect of source credibility
on online purchase intentions in Tokopedia..
Relationship between Review Quality and Purchase
Intentions
Review Quality is the part that most
influences purchase intentions. Review quality is very
important because consumers want to minimize risk
when buying products (Susanto & Aprianingsih,
2016). A review that is clear, easy to understand and
complemented by supportive opinions will generate
positive buying intentions. (Arora & Sharma,
2018). Information quality is a significant predictor of
purchase intention. This means that the higher the
quality of information provided, the stronger intention
of customers to buy the product (Atika, Kusumawati,
& Iqbal, 2012).
H 2 = There is a significant effect of review quality on
online purchase intentions in Tokopedia
Relationship between Review Quantity and
Purchase Intentions
One of the factors that influence consumer
decisions in buying products or services is the amount
of information that consumers receive (Park, Lee &
Han, 2007) The more amount of e-WOM information
available, the higher the level of consumer
confidence. In the internet environment, consumers
influence each other. The influence on purchase
intentions will be stronger when consumers have the
same opinion. The quantity of e-WOM information has
a significant positive effect on consumer trust and
consumer trust is positively related to purchase
intentions. That is, the greater the amount of e-
WOM information, the greater the level of consumer
confidence, and the stronger the consumer's purchase
intention (Xiaorong et al, 2011). The more number
of reviews of a particular product brand shows that more
people have used the product. The results of the study
show that the more reviews there are, the more popular
and more attractive the product is in a community
(Sutanto & Aprianingsih, 2016).
H 3 = There is a significant effect of review quantity on
online purchase intentions in Tokopedia.
Relationship between Review Valence and Purchase
Intentions
Ketelaar et al. (2015) and Somohardjo (2017)
state that a positive review has a significant
positive effect on buying intentions. Whereas Ketelaar
et al (2015) and Amandhari (2016) state
that negative reviews have a significant negative effect
on purchase intentios. The results of the study also state
that reading a negative review will reduce the
likelihood of buying consumers who have read
the review.
H 4 = There is a significant effect of review valence on
online purchase intentions in Tokopedia.
II. MATERIALS AND METHODS
2.1 Research Model
Based on the explanation above, the research model in
this study is:
2.1 Research Hypothesis
H1 = There is a significant effect of source
credibility on online purchase intentions in Tokopedia.
H2 = There is a significant effect of review quality on
online purchase intentions in Tokopedia.
H3 = There is a significant effect of review quantity on
online purchase intentions in Tokopedia.
H4 = There is a significant effect of review valence on
online purchase intentions in Tokopedia.
Source
Credibility (X1)
Review Quality
(X2)
Review Quantity
(X3)
Review Valence
(X4)
Purchase
Intentions (Y)
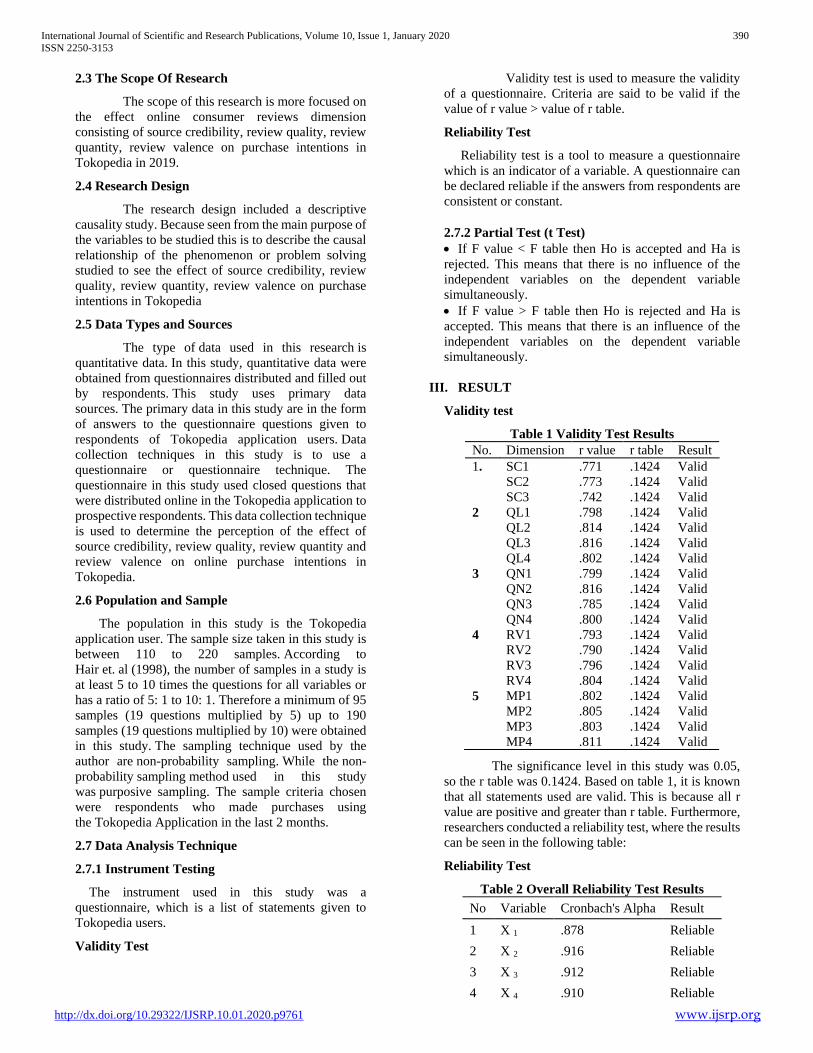
International Journal of Scientific and Research Publications, Volume 10, Issue 1, January 2020 390
ISSN 2250-3153
http://dx.doi.org/10.29322/IJSRP.10.01.2020.p9761 www.ijsrp.org
2.3 The Scope Of Research
The scope of this research is more focused on
the effect online consumer reviews dimension
consisting of source credibility, review quality, review
quantity, review valence on purchase intentions in
Tokopedia in 2019.
2.4 Research Design
The research design included a descriptive
causality study. Because seen from the main purpose of
the variables to be studied this is to describe the causal
relationship of the phenomenon or problem solving
studied to see the effect of source credibility, review
quality, review quantity, review valence on purchase
intentions in Tokopedia
2.5 Data Types and Sources
The type of data used in this research is
quantitative data. In this study, quantitative data were
obtained from questionnaires distributed and filled out
by respondents. This study uses primary data
sources. The primary data in this study are in the form
of answers to the questionnaire questions given to
respondents of Tokopedia application users. Data
collection techniques in this study is to use a
questionnaire or questionnaire technique. The
questionnaire in this study used closed questions that
were distributed online in the Tokopedia application to
prospective respondents. This data collection technique
is used to determine the perception of the effect of
source credibility, review quality, review quantity and
review valence on online purchase intentions in
Tokopedia.
2.6 Population and Sample
The population in this study is the Tokopedia
application user. The sample size taken in this study is
between 110 to 220 samples. According to
Hair et. al (1998), the number of samples in a study is
at least 5 to 10 times the questions for all variables or
has a ratio of 5: 1 to 10: 1. Therefore a minimum of 95
samples (19 questions multiplied by 5) up to 190
samples (19 questions multiplied by 10) were obtained
in this study. The sampling technique used by the
author are non-probability sampling. While the non-
probability sampling method used in this study
was purposive sampling. The sample criteria chosen
were respondents who made purchases using
the Tokopedia Application in the last 2 months.
2.7 Data Analysis Technique
2.7.1 Instrument Testing
The instrument used in this study was a
questionnaire, which is a list of statements given to
Tokopedia users.
Validity Test
Validity test is used to measure the validity
of a questionnaire. Criteria are said to be valid if the
value of r value > value of r table.
Reliability Test
Reliability test is a tool to measure a questionnaire
which is an indicator of a variable. A questionnaire can
be declared reliable if the answers from respondents are
consistent or constant.
2.7.2 Partial Test (t Test)
If F value < F table then Ho is accepted and Ha is
rejected. This means that there is no influence of the
independent variables on the dependent variable
simultaneously.
If F value > F table then Ho is rejected and Ha is
accepted. This means that there is an influence of the
independent variables on the dependent variable
simultaneously.
III. RESULT
Validity test
Table 1 Validity Test Results
No. Dimension r value r table Result
1. SC1 .771 .1424 Valid
SC2 .773 .1424 Valid
SC3 .742 .1424 Valid
2 QL1 .798 .1424 Valid
QL2 .814 .1424 Valid
QL3 .816 .1424 Valid
QL4 .802 .1424 Valid
3 QN1 .799 .1424 Valid
QN2 .816 .1424 Valid
QN3 .785 .1424 Valid
QN4 .800 .1424 Valid
4 RV1 .793 .1424 Valid
RV2 .790 .1424 Valid
RV3 .796 .1424 Valid
RV4 .804 .1424 Valid
5 MP1 .802 .1424 Valid
MP2 .805 .1424 Valid
MP3 .803 .1424 Valid
MP4 .811 .1424 Valid
The significance level in this study was 0.05,
so the r table was 0.1424. Based on table 1, it is known
that all statements used are valid. This is because all r
value are positive and greater than r table. Furthermore,
researchers conducted a reliability test, where the results
can be seen in the following table:
Reliability Test
Table 2 Overall Reliability Test Results
No Variable Cronbach's Alpha Result
1 X 1 .878 Reliable
2 X 2 .916 Reliable
3 X 3 .912 Reliable
4 X 4 .910 Reliable
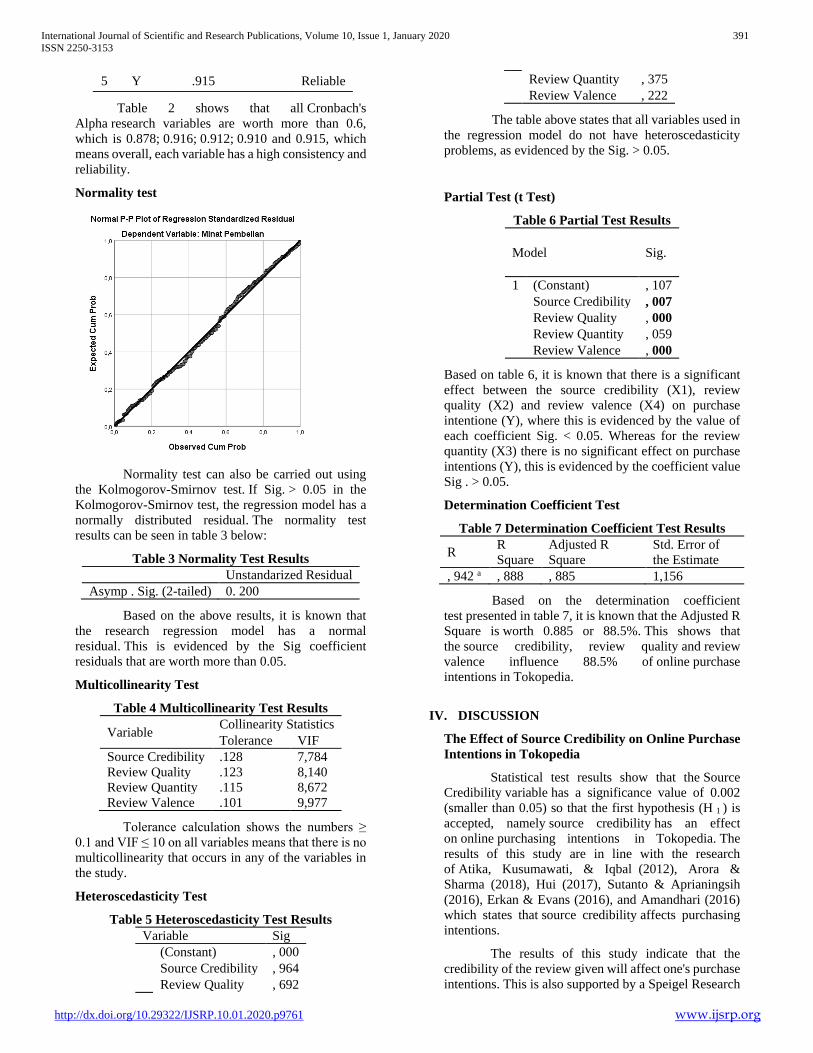
International Journal of Scientific and Research Publications, Volume 10, Issue 1, January 2020 391
ISSN 2250-3153
http://dx.doi.org/10.29322/IJSRP.10.01.2020.p9761 www.ijsrp.org
5 Y .915 Reliable
Table 2 shows that all Cronbach's
Alpha research variables are worth more than 0.6,
which is 0.878; 0.916; 0.912; 0.910 and 0.915, which
means overall, each variable has a high consistency and
reliability.
Normality test
Normality test can also be carried out using
the Kolmogorov-Smirnov test. If Sig. > 0.05 in the
Kolmogorov-Smirnov test, the regression model has a
normally distributed residual. The normality test
results can be seen in table 3 below:
Table 3 Normality Test Results
Unstandarized Residual
Asymp . Sig. (2-tailed) 0. 200
Based on the above results, it is known that
the research regression model has a normal
residual. This is evidenced by the Sig coefficient
residuals that are worth more than 0.05.
Multicollinearity Test
Table 4 Multicollinearity Test Results
Variable Collinearity Statistics
Tolerance VIF
Source Credibility .128 7,784
Review Quality .123 8,140
Review Quantity .115 8,672
Review Valence .101 9,977
Tolerance calculation shows the numbers ≥
0.1 and VIF ≤ 10 on all variables means that there is no
multicollinearity that occurs in any of the variables in
the study.
Heteroscedasticity Test
Table 5 Heteroscedasticity Test Results
Variable Sig
(Constant) , 000
Source Credibility , 964
Review Quality , 692
Review Quantity , 375
Review Valence , 222
The table above states that all variables used in
the regression model do not have heteroscedasticity
problems, as evidenced by the Sig. > 0.05.
Partial Test (t Test)
Table 6 Partial Test Results
Model Sig.
1 (Constant) , 107
Source Credibility , 007
Review Quality , 000
Review Quantity , 059
Review Valence , 000
Based on table 6, it is known that there is a significant
effect between the source credibility (X1), review
quality (X2) and review valence (X4) on purchase
intentione (Y), where this is evidenced by the value of
each coefficient Sig. < 0.05. Whereas for the review
quantity (X3) there is no significant effect on purchase
intentions (Y), this is evidenced by the coefficient value
Sig . > 0.05.
Determination Coefficient Test
Table 7 Determination Coefficient Test Results
R R
Square
Adjusted R
Square
Std. Error of
the Estimate
, 942 a , 888 , 885 1,156
Based on the determination coefficient
test presented in table 7, it is known that the Adjusted R
Square is worth 0.885 or 88.5%. This shows that
the source credibility, review quality and review
valence influence 88.5% of online purchase
intentions in Tokopedia.
IV. DISCUSSION
The Effect of Source Credibility on Online Purchase
Intentions in Tokopedia
Statistical test results show that the Source
Credibility variable has a significance value of 0.002
(smaller than 0.05) so that the first hypothesis (H 1 ) is
accepted, namely source credibility has an effect
on online purchasing intentions in Tokopedia. The
results of this study are in line with the research
of Atika, Kusumawati, & Iqbal (2012), Arora &
Sharma (2018), Hui (2017), Sutanto & Aprianingsih
(2016), Erkan & Evans (2016), and Amandhari (2016)
which states that source credibility affects purchasing
intentions.
The results of this study indicate that the
credibility of the review given will affect one's purchase
intentions. This is also supported by a Speigel Research

International Journal of Scientific and Research Publications, Volume 10, Issue 1, January 2020 392
ISSN 2250-3153
http://dx.doi.org/10.29322/IJSRP.10.01.2020.p9761 www.ijsrp.org
Center survey in 2017, which shows that reviews given
by verified reviewers increase the credibility of
the review and also increase consumer purchase
intentions. The survey suggests that intention to
purchase can be increased by 15% when consumers
read the reviews given by verified reviewer compared
to when reading the reviews given by the
anonymous reviewer .
The Effect of Review Quality on Online Purchase
Intentions in Tokopedia
Statistical analysis showed that the
variables Review Quality has a significance value of
0.009 (less than 0.05) so that the second hypothesis
(H 2 ) is received, the review quality affects the
purchase intentions in Tokopedia. The results of this
study are in line with research by Atika, Kusumawati,
& Iqbal (2012), Arora & Sharma (2018), Sutanto &
Aprianingsih (2016), Johansen & Hovland (2012), Lin,
Lee & Horng (2011), Zhou, Liu, & Tang (2013), Lee
(2009), Erkan & Evans (2016) which states that review
quality were significantly affect the purchase
intentions.
Based on the results of this study, it can be
concluded that the quality of the review will affect
purchase intentions. Reviews that are objective and
logical and their delivery can be understood and
relevant will increase purchase intentions.
The Effect of Review Quantity on Online Purchase
Intentions in Tokopedia
Statistical test results show that the Review
Quantity has a significance value of 0.059 (greater
than 0.05) so that the third hypothesis (H 3 ) is rejected,
meaning that the review quantity does not significantly
influence the online purchase intentions in
Tokopedia. The results of this study are in line with the
research of Arora & Sharma (2018) which also states
that there is no significant effect between review
quantity and purchase intentions.
Review quantity related to the number
of reviews that exist on a product. The results of this
study indicate that the large number of reviews does
not significantly affect a person's purchase
intentions. This is in line with the facts that the large
number of reviews is not the important thing for
consumers. Based on a survey conducted by
BrightLocal, consumers only read an average of
10 reviews and only 20% of consumers want to read
more than 11 reviews.
The Effect of Review Valence on Online Purchase
Intentions in Tokopedia
Statistical analysis showed that reviews valence has a
significance value of 0.006 (less than 0.05) so that the
fourth hypothesis (H 4 ) is received, the review
valence effect the online purchase intentions in
Tokopedia. The results of this study are in line with
research by Zarco (2015), Ketelaar et al. (2015),
Somohardjo (2017), and Amandhari (2016) which
show that review valence were significantly affect the
purchase intentions .
The results of this study indicate that the
valence review will affect person’s purchase
intention. In other words, the positive reviews will
increase a person's intention to purchase and the
negative reviews will reduce a person's intentions to
purchase. This is also supported by a survey conducted
by BrightLocal in 2018 which stated that 68% of
consumers would be more interested in what is being
offered by the business after reading the positive
reviews.
Conclusion
Based on the results of the research described
earlier, the following conclusions can be drawn:
1. Source Credibility has a significant effect
on online purchase intentions in Tokopedia.
2. Review Quality has a significant effect
on online purchase intentions in Tokopedia.
3. Review Quantity has no significant effect
on online purchase intentions in Tokopedia.
4. Review Valence has a significant effect
on online purchase intentions in Tokopedia.
Recommendations
The suggestions that the author can give in this
study are as follows:
1. Marketplace Tokopedia should pay attention to how
the reviews are there in Tokopedia really reliable
and actualy comes from consumers who purchase
the product. Marketplace Tokopedia must crack
down firmly shops online that do the fictitious
transaction with the purpose of giving a good
review for the products that they sell.
2. Marketplace Tokopedia should give appreciation t
o online store who sell products in Tokopedia
that have good quality of service. It it is
intended that the consumers are satisfied with
shopping in Tokopedia so they can provide positive
reviews for the product they purchased.
REFERENCES
[1] O. Yusuf, “Pengguna Internet Indonesia Nomor Enam Dunia,”
kompas.com, 2014. [Online]. Available:
https://tekno.kompas.com/read/2014/11/24/07430087/Pengguna.Inter
net.In donesia.Nomor.Enam.Dunia. [Accessed: 21-Oct-2018].
[2] APJII, “Penetrasi & Perilaku Pengguna Internet Indonesia,” 2018.
[Online]. Available: https://apjii.or.id/survei2018.
[3] U. Idris, “Lima GeraiRitel Modern yang Berguguran di 2017,”
HaloMoney, 2017. [Online]. Available:
https://www.halomoney.co.id/blog/ritel-modern-yang-tumbang-di-
2017. [Accessed: 21-Oct-2018].
[4] W. Daniel, “Wow! Transaksi e-Commerce RI 2018 Capai Rp 77
T, Lompat 151%,” CNBC Indonesia, 2019. [Online]. Available:
https://www.cnbcindonesia.com/tech/20190311101823-37-

International Journal of Scientific and Research Publications, Volume 10, Issue 1, January 2020 393
ISSN 2250-3153
http://dx.doi.org/10.29322/IJSRP.10.01.2020.p9761 www.ijsrp.org
59800/wow-transaksi-e-commerce-ri-2018-capai-rp-77-t-lompat-
151. [Accessed: 11-Nov-2019].
[5] D. H. Jayani, “Tren Pengguna E-Commerce Terus Tumbuh,”
katadata.co.id, 2019. [Online]. Available:
https://databoks.katadata.co.id/datapublish/2019/10/10/tren-
pengguna-e-commerce-2017-2023.
[6] A. Prayogo, “Ini Top 5 Toko Online Paling Diminati 2019,
Tokopedia Nomor 1,” Tribunnews, 2019. [Online]. Available:
https://wartakota.tribunnews.com/2019/07/22/ini-top-5-toko-online-
paling-diminati-2019-tokopedia-nomor-1. [Accessed: 11-Nov-
2019].
[7] D. H. Jayani, “Tokopedia, E-Commerce dengan Nilai Transaksi
Terbesar,” katadata.co.id, 2019. [Online]. Available:
https://databoks.katadata.co.id/datapublish/2019/10/15/2014-2023-
nilai-transaksi-tokopedia-terbesar-dibandingkan-e-commerce-
lainnya. [Accessed: 11-Nov-2019].
[8] BrightLocal, “Local Consumer Review Survey 2017,” 2017.
[Online]. Available: https://www.brightlocal.com/learn/local-
consumer-review-survey-2017/. [Accessed: 15-Aug-2018].
[9] D. Park, J. Lee, and I. Han, “The Effect of On-Line Consumer
Reviews on Consumer Purchasing Intention : The Moderating Role
of Involvement,” Int. J. Electron. Commer., vol. 11, no. 4, pp. 125–
148, 2007, doi: 10.2753/JEC1086-4415110405.
[10] M. Schepers, “The impact of online consumer
reviews factors on the Dutch consumer buying decision .,”
University of Twente Netherlands, 2015.
[11] A. Q. Bataineh, “The Impact of Perceived e-WOM
on Purchase Intention : The Mediating Role of Corporate Image,”
Int. J. Mark. Stud., vol. 7, no. 1, pp. 126–137, 2015, doi:
10.5539/ijms.v7n1p126.
[12] A. Atika, A. Kusumawati, and M. Iqbal, “the Effect
of Electronic Word of Mouth, Message Source Credibility,
Information Quality on Brand Image and Purchase Intention,”
EKUITAS (Jurnal Ekon. dan Keuangan), vol. 20, no. 1, p. 94, 2017,
doi: 10.24034/j25485024.y2016.v20.i1.1780.
[13] L. Arora and B. K. Sharma, “Influence of Review
Quality , Review Quantity and Review Credibility on Purchase
Intention in the Context of High Involvement Products Evaluated
by a Double-blind Review System,” Eur. J. Appl. Bus. Manag., vol.
4, no. 4, pp. 25–40, 2018.
[14] T. X. Hui, “The Effect of Source Credibility on
Consumers’ Purchase Intention in Malaysia Online Community,” J.
Arts Soc. Sci., vol. 1, no. 1, pp. 12–20, 2017.
[15] M. A. Sutanto and A. Aprianingsih, “The Effect of
Online Consumer Review Toward Purchase Intention : A Study in
Premium Cosmetic in Indonesia,” Int. Conf. Ethics Business, Econ.
Soc. Sci., pp. 218–230, 2016, doi: 10.1007/s10067-008-0838-8.
[16] I. Erkan and C. Evans, “Computers in Human
Behavior The influence of eWOM in social media on consumers ’
purchase intentions : An extended approach to information
adoption,” Comput. Human Behav., vol. 61, pp. 47–55, 2016, doi:
10.1016/j.chb.2016.03.003.
[17] P. Amandhari, “The role of intensity, credibility,
homophilous source and negative valence on ewom in the course of
intention to purchase cosmetic products on instagram putri
amandhari,” Universitas Gadjah Mada, 2016.
[18] K. V. Johansen and F. L. Hovland, “The Impact of
Online Consumer Reviews on Purchase Intention,” BI Norwegian
School of Management, 2012.
[19] C. Lin, S. Lee, and D. Horng, “The Effects of Online
Reviews on Purchasing Intention: The Moderating Role of Need for
Cognition,” Soc. Behav. Personal. An Int. J., vol. 39, no. 168, pp.
71–82, 2011, doi: 10.2224/sbp.2011.39.1.71.
[20] M. Zhou, M. Liu, and D. Tang, “Do the characteristics
of online consumer reviews bias buyers ’ purchase intention and
product perception ? A perspective of review quantity , review
quality and negative review sequence Ming Zhou * Mengwei Liu
Dingna Tang,” Int. J. Serv. Technol. Manag., vol. 19, pp. 166–186,
2013, doi: DOI: 10.1504/IJSTM.2013.055632.
[21] S. Lee, “How do online reviews affect purchasing
intention ?,” African J. Bus. Manag., vol. 3, pp. 576–581, 2009, doi:
10.5897/AJBM09.204.
[22] P. Eun-joo and J. Yu-jin, “Effects of E-reviews on
Purchase Intention for Cosmetics,” Korean J. Hum. Ecol., vol. 22,
no. 2, pp. 343–355, 2013, doi: DOI: 10.5934/kjhe.2013.22.2.343.
[23] F. Xiaorong, B. Zhang, Q. Xie, L. Xiao, and Y. Che,
“Impact of Quantity and Timeliness of EWOM Information on
Consumer’s Online Purchase Intention under C2C Environment,”
Asian J. Bus. Res., vol. 1, no. 2, 2011, doi: 10.14707/ajbr.110010.
[24] T. H. Zarco, “Effects of Online Review Valence on
Consumer Attitudes and Behavioral Intentions,” Philipp. Manag.
Rev., vol. 22, pp. 75–88, 2015.
[25] P. E. Ketelaar, L. M. Willemsen, L. Sleven, and P.
Kerkhof, “The Good, the Bad, and the Expert: How Consumer
Expertise Affects Review Valence Effects on Purchase Intentions in
Online Product Reviews,” J. Comput. Commun., vol. 20, no. 6, pp.
649–666, 2015, doi: 10.1111/jcc4.12139.
[26] N. Somohardjo, “The Effect of Online Reviews on the
Review Attitude and Purchase Intention,” Erasmus University
Rotterdam, 2017.
[27] C. M. K. Cheung and D. R. Thadani, “The impact of
electronic word-of-mouth communication : A literature analysis and
integrative model,” Decis. Support Syst., vol. 54, no. 1, pp. 461–470,
2012, doi: 10.1016/j.dss.2012.06.008.
[28] D. Durianto, Inovasi Pasar Dengan Iklan Efektif.
Jakarta: Gramedia Pustaka, 2003.
[29] P. Kotler and K. L. Keller, Manajemen Pemasaran,
13th ed. Jakarta: Erlangga, 2009.
[30] J. F. Hair, R. L. Tatham, R. E. Anderson, and W.
Black, Multivariate Data Analisys, Fifth Edit. New Jersey: Practice
Hall, 1998.
[31] T. Collinger, “How Online Reviews Influence Sales,”
Spiegel Research Center, 2017. [Online]. Available:
https://spiegel.medill.northwestern.edu/online-reviews/. [Accessed:
11-Nov-2019].

International Journal of Scientific and Research Publications, Volume 10, Issue 1, January 2020 394
ISSN 2250-3153
http://dx.doi.org/10.29322/IJSRP.10.01.2020.p9762 www.ijsrp.org
Sustainability in Nepalese Tourism Industry
Niranjan Ojha (Ph.D.)
DOI: 10.29322/IJSRP.10.01.2020.p9762
http://dx.doi.org/10.29322/IJSRP.10.01.2020.p9762
Abstract: Ecotourism, a burning issue and is a concern of Nepal. Nepal has attempted it in the industry for sustainability. UN
Sustainable Development Goals focuses on sustained, inclusive and sustainable economic growth. The goal 12 focuses on
sustainable consumption and production and specifically calls out a role for Travel & Tourism. In Nepalese perspective, increased
graph of tourist arrival indicates that it is the right time to implement the principles of sustainability in the industry.
Nepal Tourism Policy 2009, priorities tourism industry as an important tool for its socio-economic development. Direction of the
policy is quality improvement, foreign reserve collection and creating employment opportunities to improve the living standard of
Nepalese people. Vision 2020, tourism strategy, focuses on sustainable tourism, expecting two million tourists and creating
employment to one million on the year 2020.
Proper use of sustainable tourism principles in Nepalese tourism industry will be very beneficial for its sustainability. Sustainable
tourism has been priorities by Nepal government since long and tried to implement its three major aspects but the outcome is not
satisfactory. For its sustainability much more has to be done in coming days.
Keywords: Sustainable Tourism, Eco-Tourism, Tourism development.
Background
World Tourism Industry is in a flux. UNWTO estimated in 2018 that international tourist arrivals will increase 6% (1.4 billion)
and 3.7% growths in economy. It reached 64million with (+10%) in the Middle East, 67million with (+7%) in Africa. Asia and
the Pacific got 343 million and Europe 713 million (both at +6%) growth (UNWTO, 2019).
UNWTO focused 2019 on education, skills and job creation (UNWTO, 2019). UNWTO’s long-term forecast published in 2010
predicted that international tourist arrival will reach 1.4 billion by 2020 which was already achieved on 2018. Strong economic
growth after recession, affordable air fare and easy visa facilitation around the word has accelerated it (UNWTO, 2019).
Tourism isn’t a new phenomenon in the world history. If we study prehistory or protohistory or archeology we will come to know
that human beings have been moving from place to place for about 1 million years (Kunwar, 2012.P.17). After the First World
War people became anxious to see the effect of destruction which curiosities people to travel on those places (Kunwar,
2012.P.17). International tourism has geared up after the Second World War.
Tourism is not new for Hindus. In Sanskrit literature, there are different types of tourism known as paryatan (going out for
pleasure and a knowledge), deshatan (going to the places of religious importance) etc. derived from root atan (Negi, 1982.P. 22).
Till Rana regime Nepal was isolated from international contact because of closed door Rana policy which continued till 1950.
The democratic movement of 1951 marked a new era in Nepal. In `1950-51, a popular democratic movement was launched which
overthrew the Ranas. After this, changes were witnessed in the country. Nepali people were liberated and Nepal was opened for
the visitors (Ojha, 2018: 91). Before 1950’s only handful of tourist visited Nepal under strict permission of Rana regime. Now,
tourism has been recognized as a highly paying industry and very important source of earning.
Basically, sustainable tourism expects minimum impact on socio-culture and environmental issue. It is expected that principles of
sustainability must apply by the stakeholders while visiting. Sustainable tourism is also called a responsible tourism as each and
every participant has to take responsibility (Thapa, 2012.P.17).
Ecotourism is a most concerned and a burning issue. Many developing countries like Nepal are trying to achieve sustainability
through eco-tourism. Nepal has a lot of opportunities in the industry because of its diversity. Thus the concerned authorities must
be integrative, collaborative and comprehensive to achieve real outcome of ecotourism by realizing importance of environmental,
social and economic imperatives for its sustainability (Thapa, 2012.P.17).
Vision 2020, an ambitious plan of Nepal government to welcome two million tourist and creating job opportunities for one
million people for its sustainability, was already forecasted. Tourist arrival has crossed the estimated target of (1million) in 2019.
It seems vision 2020 meets its given target if the situation remained same as 2019 (NTB Press release).
Statement of the Problem
Nepal, a diversified Himalayan country, is a homeland for international visitors. The lowest point 59 meter above sea level in Terai
region and the highest point Everest, 8848 meter above the sea level; the two points are in a straight line only 200k.m. apart, can
only found in Nepal. Besides, homely environment, friendly people, natural beauty, national heritages, flora and fauna are the other
products of Nepalese tourism Industry. Because of such diversity –
1. Tourism is the backbone of Nepalese hospitality industry.
2. Sustainable tourism model has been efficiently practiced in Nepal.

International Journal of Scientific and Research Publications, Volume 10, Issue 1, January 2020 395
ISSN 2250-3153
http://dx.doi.org/10.29322/IJSRP.10.01.2020.p9762 www.ijsrp.org
Some national and international articles tried to address on sustainable tourism and its practice in Nepal but they don’t cover the
overall aspects of sustainability.
This article intends to identify some unidentified problems on sustainability in Nepalese tourism industry.
Research Question
So many such problems have been delt by so many researchers listed in review of literature. There are some areas which are not
addressed that are being focused by this research.
The research tries to answer following question,
1. Why tourism is the backbone of Nepalese industry
2. How sustainable tourism is practiced in Nepal
Objective of the study
In order to present the study two main objectives were selected:
1. To analyze the sustainable tourism practice in Nepalese tourism industry.
2. To explore tourism as the backbone of Nepalese industry.
Methodology
This article is based upon a qualitative analysis. Descriptive, analytical as well as informative method has been used in this
research. This research consists of present context data but some historical references are cited in the appropriate places. Basic
source of information for this research is secondary but primary information has not been avoided in this research. Relevant
books, journal articles and government publications have been used properly. Published government data has been used as
primary sources. All the information collected has been classified, summarized, analyzed and some reflection will be made for
this research.
Review of the Literature
Sustainable Development A report by World Commission on Environment and Development (WCED, 1987) entitled “Our Common Future” i s on
sustainable development. The commission has defined “Sustainable development is development that meets the needs of the
present without compromising the ability of future generations to meet their own needs”.
Eco-tourism as sustainable tourism
Ecotourism is defined as the science of the relationships between organism and environment. The definitions about ecotourism
reported in the Travel Industry Association of America’s study, Tourism and the Environment are as follows:
- Ecotourism is environmentally friendly travel.
- Ecotourism is a tool for conservation.
- Ecotourism is ecologically responsible tourism (Kunwar, 2012:125)
According to (Miller & Ward 2005), (WCED, 1987) suggested that sustainable development is largely a western invention in
a widespread perception and a product of the US conservation movement.
“Horochowski and Moisey(2008) defines sustainable tourism a s present benefit with the protection of future opportunities
to the people.
These literatures don’t support the raised research questions but it is partially helpful to fulfill theoretical aspects of sustainable
tourism. Hence, I have reviewed the available literature for this research.
Discussion
193 countries in September 2015 agreed the strategies of UN Sustainable Development Goals. The 17 goals and 169 targets will
guide the decisions that countries take over the years to 2030 in order to help them achieve strong economic foundations and a
better future. Regarding of revenue, employee count, or geographic reach and even whether they realize it or not, every
organization has a sustainability strategy (https://www.wttc.org, 2017).
Tourism is in flux. International tourist arrival reached 1.4 billion in 2018 in Europe which is an 6% growth than 2017. Arrivals
in South Asia grew 5%, South-East Asia 7% and Oceania 3%. Arrivals to North-East Asia increased by 3%. 217 million
international tourists visited The America in 2018 whereas 67 million tourists visited Africa in 2018. The Middle East increased
by 10% in 2018 (UNWTO, 2019). 134 million Chinese tourists visited all over the world in 2018 and they spent about $ 120

International Journal of Scientific and Research Publications, Volume 10, Issue 1, January 2020 396
ISSN 2250-3153
http://dx.doi.org/10.29322/IJSRP.10.01.2020.p9762 www.ijsrp.org
billion USD (http://www.globaltimes.cn, 2019). In 2017, 2.5 million Chinese tourist visited Tibet. An average expense of the
Chinese tourist is 100 thousand per person (Thapa, 2018.P.7) which is encouraging figure in tourism industry.
According to World Travel & Tourism Council (2017), the Travel & Tourism generated 10.4 percentage of global GDP and
supported 313 million jobs or 9.9% of total employment in 2017, equivalent to 1 in 11 jobs in the global economy (
WTTC,2017).
Tourist Trend in Nepal
Trend of tourist arrival was in increased order up to 2012 which declined thereafter. Year 2015 was most shocking in Nepalese
tourism industry having decrease by 32 percent compared to 2014(Nepal Tourism Statics, 2016:11). After 2015 it gradually
geared up. According to the Nepal Tourism Board (NTB) totally 969,287 tourists visited Nepal via air and 203,785
tourists came via land in 2017(NTB Press release, Jan08, 2019). International tourist arrivals geared up in 2018 after the
earthquake of 2015 and reached above the one million. A total of 1,173,072 visitors visited Nepal in 2018 which is of 24.77%
increment of the same period in 2017(NTB Press release,Jan.08,2019.
Tourist arrival from South Asian countries increased in 2018. Indian increased by 25.1%, Sri Lankan by 55%, Chinese by 46.8%,
in 2018. The overall arrival from SAARC countries grew up to 26.4 % in 2018. Similarly, the visitors from Thailand, South
Korea and Japan from Asia have also increased by 36%, 8.3% and 8.9% respectively in comparison to 2017(NTB Press Release,
Jan08, 2019). The European arrivals increased by 23.3%, American by 16% and Australian 15.1% in 2018 (NTB Press Release,
Jan08, 2019).
Tourist arrivals from India in February 2019 increased by 92.5% in comparison to the figures of February 2018 and reached
14,571. Likewise, 14,831 Sri Lankan visitors came to Nepal in February 2019. SAARC countries contribute a growth of 85 %
over the same month of 2018 (NTB Press Release, Feb.10, 2019). 16,205 Chinese tourists visited Nepal in February 2019, which
is 5.3% more than February 2018. Visitors from Thailand, Japan and South Korea have also increased significantly by 109 %, 20
% and 47.2% respectively in comparison to February 2018(NTB Press Release, March 11, 2019). Official data till February has
been published by NTB.
The European arrivals have also geared up in 2019. Arrival from the United Kingdom-5268(+8.7), Germany-3340(+27.9) and
France- 1978(+7.6) reached respectively. The total European arrivals in February 2019 reached 17,789 with aggregated growth of
11.6 % (NTB Press Release, March 11, 2019). US visitors to Nepal in February 2019 were 7,133(+5%) than the figures of
February 2018. Likewise, the number of Australians visitors to Nepal in February 2019 reached 2,978 which is 17.4% more than
in February 2018 (NTB Press Release, March11, 2019).
Though India is the number contributor in Nepalese tourism but interestingly, more visitors came from China and Sri Lanka in
February 2019 than from India, which is surprising incident for the industry( the arrivals from India included only those who
traveled by air to Nepal) ((NTB Press Release, March 11, 2019).
The above figure indicates that tourism is rapidly growing in Nepal.
Tourist Arrival in Nepal
Indicators 2015 2016 2017
Tourist Arrival by
Air 407412 572563 760577
Land 131558 180439 179641
Total 538970 753002 940218
Average Length
of Stay
13.16 13.4 12.6
Sex
Male 289158 399091 509598
Female 249813 353911 430620
(Source-Nepal Tourism Statistics 2018,.P.11 )
Year 2019 seems remarkable improvement in tourist arrivals. Early data published by NTB in February 2019 has remarks a
continuing growth trend. According to the Immigration Department (and its offices) a total of 124,421 (97,694 by air) and (26,727
overland) international visitors visited Nepal in February 2019 with increment of 39 % over the same period in 2018, is a good
sign for Nepalese Tourism.
Eco-tourism as Sustainable Tourism
Sustainable tourism development guidelines and management practices are applicable to all forms of tourism in all types of
destinations, including mass tourism. Sustainability principles refer to the environmental, economic, and socio-cultural aspects of
International Journal of Scientific and Research Publications, Volume 10, Issue 1, January 2020 397
ISSN 2250-3153
http://dx.doi.org/10.29322/IJSRP.10.01.2020.p9762 www.ijsrp.org
tourism development, and a suitable balance must be established between these three dimensions to guarantee its long-term
sustainability (Kunwar, 2012.P.17) which has been practicing in eco-tourism.
Sustainable Tourism Practice in Nepal
Tourism for Rural Poverty Alleviation Programme (TRPAP) is an initiative of the Nepal Government toward eco-tourism in
Nepal with technical and financial support from various international development agencies and non-government organizations
which is contributing to the poverty alleviation objective of the government through sustainable tourism development that is pro-
poor, pro-environment, pro-rural communities and pro-women, making the benefits of tourism reach grass-roots level in the
specific programme sites (Ojha,2018:175).
Eco-tourism is the only model that still shown constant improvement for its sustainability. Basic tourism infrastructure and
facilities such as clean drinking water, sanitation, transportation system and roadways are fundamentals to attract more tourists for
sustainable tourism development in Nepal. If basic infrastructures and facilities are provided into the country, the flow of tourists
also increases. If the number of tourist increases, the economy of the local stakeholder will be increased (Ojha, 2018:177).
Recent developments on the major trekking trails especially on the Annapurna and Everest region have been a serious concern to
both the environmentalists and locals and for the ecotourism. Because of the increased number of tourist and teahouses in the
trekking trails and unplanned road connectivity, indirectly increased the demand of wood and fuel which led deforestation as well
spoilt the nature. Another problem is the solid waste management. Waste matter such as plastic materials, oxygen cylinder and so
on, in the trekking trial has been increasing rapidly without the proper mechanism for disposal (Ojha,2018:177) is a big challenge.
Conclusion
Nepal, a small Himalayan country, sandwiched between China and India is a land locked country. Government data shows that
Nepal is importing a lot than its export. Thus, tourism is the backbone for national development which can also fulfill the sort of
foreign reserve. If we compare the data of tourist arrivals in last few years we can see Nepalese tourism is heading towards mass
tourism. Many tourists mean a big challenge to manage the balance between human and nature. In one hand tourism is creating
opportunities and the other hand there is a big challenge for its sustainability. So it is the right time to implement the principles of
ecotourism for its sustainability. Ecotourism is the only tool for sustainable tourism development providing maximum benefits for
local communities with environmental conservation through maximum involvement of all stakeholders.
Though many national and international agencies have also been continuously supporting the development of ecotourism in Nepal
but the outcome is not satisfactory.
Though ecotourism is the high priority of Nepal government and government is trying its best for sustainability but still there are
many laps in this industry. Nepal is going to celebrate tourism year 2020, in this very situation, balancing human beings and
nature, is a big challenge for its sustainability. Finally, Nepalese tourism has a lot of opportunities as well as a bundle of
challenge.
References
Kunwar, R.R.(2012) Tourists and Tourism science and Industry Interferance, Kathmandu:Ganga Sen Kunwar.
Negi, J.M.S, (1982) Tourism and Hotelering: A Worldwide Industry, New Delhi:Gitanjali Publications.
Nepal Tourism Statistics (2016). Government of Nepal: Kathmandu.
Nepal Tourism Board Press Release, -----------
Ojha, N.(2018) A Hand Book of Tourism, Kathamndu: Oxford Store.
Ojha, N.(2018) Brief history of Nepali Tourism , Journal of Development Review: Saraswati Multiple Campus: Kathamndu,
Vol.IV,No.1,2018.
R.Blaj,(2014) Ecotourism and nature tourism- components of a sustainable management of forests, Journal of Horticulture,
Forestry and Biotechnology : Luciana Blaga University,Volume 18(4).
Thapa, M.B.(2012) Tourism and Sustainable Community Development in Nepal, Central Ostrobothnia University of Applied
Sciences Degree Programme in Tourism.
Thapa, B.(2018) Annapurna Post Daily: Kathmandu: July 2.
UNWTO Press Release, 21 January 2019.
World Tourism Organization UNWTO (2005).Making Tourism More Sustainable - A Guide for Policy Makers, UNEP and
UNWTO.
World Travel and Tourism Council (2018) Travel and Tourism Economic Impact.
www.King Mahendra Trust for Nature Conservation Webpage Retrived on April 2018.
http://nationaleotourism.com Retrived on March 2018.

International Journal of Scientific and Research Publications, Volume 10, Issue 1, January 2020 398
ISSN 2250-3153
http://dx.doi.org/10.29322/IJSRP.10.01.2020.p9762 www.ijsrp.org
http://www.welcomenepal.com Retrived on April 2018.
https://uk.finance.yahoo.com Retrived on March 2018.
https://www.acrosshimalaya.com Retrived on April 2018.
https://www.travelchinaguide.com Retrived on 2018 April
https://www.wttc.org Retrived on 2018 March.

International Journal of Scientific and Research Publications, Volume 10, Issue 1, January 2020 399
ISSN 2250-3153
http://dx.doi.org/10.29322/IJSRP.10.01.2020.p9763 www.ijsrp.org
Correlational Study Of Mathematics And Physics
Students’ Performance For 2015-2017 Mock
Examinations: A Case Study Of Senior Secondary Two
(Ss2) Students In Ibesikpo Asutan Local Government
Area Of Akwa-Ibom State, Nigeria.
Ado, I. B.
+234 802 081 8817
Department of Science Education, University of Uyo, Uyo, Nigeria.
And
Edet, A. O. (Correspondence author)
https://orcid.org/0000-0003-3875-3385
+234 708 653 1117
Department of Science Education, University of Uyo, Uyo, Nigeria.
DOI: 10.29322/IJSRP.10.01.2020.p9763
http://dx.doi.org/10.29322/IJSRP.10.01.2020.p9763
Abstract
The study correlated the performance of students in Mathematics and Physics in Senior Secondary Two (SS2) mock examinations
for 2015, 2016, and 2017 in Ibesikpo Asutan Local Government Area of Akwa Ibom State. Four research questions and four
hypotheses were formulated to guide the study. The study adopted correlational design. The population comprises 2561 physics
students who partook in mock examinations for 2015, 2016, and 2017 sessions. Purposive sampling technique was used to select
four (4) from sixteen (16) secondary schools in the study area. 723 (28.2%) physics students were obtained as sample for the
study. Mathematics and Physics scores were extracted from the SS2 mock examination results for 2015-2017 obtained from the
Examinations Division, Ministry of Education, Akwa Ibom State for the study. The Data were analyzed using Pearson’s Product
Moment Correlation (r). The result revealed that students’ performance in mathematics and physics in (SS2) mock examinations
for 2015, 2016, 2017 and 2015-2017 correlated significantly. It was recommended among others that guidance should be
provided to the students on significance of mathematics as an instrument of communication in physics. This will lead to
appreciation of mathematical calculations involved in physics and thus raise the performance of students in physics.
Keywords: Mathematics, Physics, Students Performance.
Introduction
Education in Nigeria is oriented towards achieving a better future for its citizens. It is an avenue of training and learning
especially in schools or colleges, to improve knowledge and develop skills. According to FGN (2013), Education is a cornerstone
for development which forms the basis for literacy, skills acquisition, technological advancement and ability to harness human
and materials resources towards the achievement of societal goals.
Education could be termed as a process in which individuals’ physical abilities, emotional abilities, social abilities, and
intellectual abilities are developed. It is to actualize human potential so that the individual can become something more than what
he was before. Hence, Ugwanyin (2003) stated that education is the process were society establishes to assist the young to learn
and understand the heritage of the past, participate productively in the society and contribute meaningfully for the development of

International Journal of Scientific and Research Publications, Volume 10, Issue 1, January 2020 400
ISSN 2250-3153
http://dx.doi.org/10.29322/IJSRP.10.01.2020.p9763 www.ijsrp.org
the society. It is an element that stimulates social economic development and advances several government policies documents
and various scholars (Selina, 2012). Education prepares the individuals for the development of the right type of personality
required for living in the society; equipped the individuals with knowledge, skills and values that are cherished and valued by the
society.
The importance of education in the development of man cannot be overemphasized. Education is the mainstays through
which science and technology tools that form the bedrock for any meaningful development of a nation is achieved. Science and
technology is so dominant in the world to that almost everything is now scientific and technological in nature. Science is the basic
tool for which the present-day technological development is accomplished. Science is the rational and systematic study of the
environment through experimentation and observation with the view to understanding the environment in order to manipulate and
control it for betterment of human conditions (Njoku, 2007).
Physics is one of the most important science subjects taught in senior secondary schools and higher institutions
throughout the world due to its relevance to science and technological development. The importance of Physics as a subject in our
schools and everyday life cannot be overemphasized. As appended in FGN (2013), Physics is a core science subject being offered
in Nigerian schools and it forms the basis for the nation’s technological advancement and human resource development. In line
with this, physics is the rudiment of all scientific careers which include medicine, pharmacy, engineering, and technological
studies. It is the scientific study that deals with the relationship between energy and matter, and its knowledge has contributed
greatly to the production of instruments and devices of tremendous benefits to human race.
Awodun and Ojo (2013) opined that almost every life fields have relation with Physics such as organisms or inanimate
from engineering to mathematics, biology and chemistry. Mekonnan (2014) opined that without the knowledge of physics, human
will face difficulties in exploring the universe. Siddiqui and Khatoon (2013) stated that understanding of Physics helps to
understand the content of the universe and for students, it helps to develop observation skills, accuracy, analysis ability, creative
thinking. Siddiqui and Khatoon (2013) further stated the acquisition of the knowledge of physics is very important for science
students. Hence, no science student is admitted into the university, polytechnics, and colleges to pursue any science course among
which are science education, engineering, medical and biomedical sciences, technological studies, computer science and
pharmaceutical science without a credit level pass in Physics.
It is rather unfortunate that, in spite of the recognitions given to Physics as one of the compulsory science subjects at the
secondary school level as contained in National Policy of Education (NPE), the performance of students in physics have been
worrisome. This has become a great concern to many which include researchers, teachers, parents, administrators, physicists,
mathematicians, physics educators, mathematics educators and government. The search of ways to improve the poor performance
of students has resulted to attributing it to various factors which include inadequate resources, teacher’s professional commitment,
creativity, mechanical skills, initiative and resourcefulness, poor laboratory facilities, poor thinking and learning environment and
students’ attitude towards physics.

International Journal of Scientific and Research Publications, Volume 10, Issue 1, January 2020 401
ISSN 2250-3153
http://dx.doi.org/10.29322/IJSRP.10.01.2020.p9763 www.ijsrp.org
Physics is one of the science subjects that involve a lot of calculations. This is why Kaya and Boyuk, (2011)
opined that the choice of science subjects mostly Physics in Nigerian schools is much dependent on the learner’s ability on
mathematics because proficiency in mathematics is of basic importance to the study of Physics in particular and science in
general. Mathematics have some relations with physics such as volumes, pressure, temperature, are revealed through the use of
mathematical concepts and change of subject of formula in mathematics helps a great deal in understanding density in physics.
Mathematics is the study of quantity, structure, space and change. Oyedeji (2011) described mathematics as a creative
language, a tool and a process. It operates with its own language, with signs, vocabularies, symbols as well as its structures
(Effiong, 2015). The language of Mathematics can be looked at as the use of symbols, signs, rules, and formulas to represent
ideas, concepts and relationship existing between concepts. It plays the role of verbal symbols, which can represent concepts and
be used as stimuli for the internalized manipulation of concepts in science especially physics. However, Mathematics is a body of
knowledge, denoted and enacted in terms of a standardized language. Ezenwean (2006) opined that mathematics is a branch of
knowledge that seeks to improve on human perception and immediate environment by using clear, logical, precise and exact
thinking processes.
Mathematics as a body of knowledge assist in the understanding of other subjects such as the physics. Thorndike and
Woodworth (1901) in their theory of identical element stated that transfer of knowledge would take place from one situation to
another if the two situations shared identical or common elements. Thus, two tasks which share some set of stimulus features are
possible candidates for learning transfer. Looking at the numerous identical elements or features that exist between mathematics
and physics, it can be that when learners are properly guided in mathematics learning, there may be the possibility for such group
of learners to recall and transfer such concepts into physics learning. Harlow (1949) in his theory of learning to learn stated that
individuals usually improve on their ability to learn tasks when they practice on a series of similar or related tasks. Badru (2004)
suggested that the choice of science subjects mostly Physics in Nigerian schools is much dependent on the learner’s ability on
Mathematics because proficiency in mathematics may be of basic importance to the study of Physics in particular and science in
general. On this regard, the researchers examined the relationship between mathematics and physics on students’ performance.
Statement of the Problem
Nigerian science education system is plagued with lots of problems and one of the most serious problems is continuous
poor academic performance of students in Physics particularly and science in general. This result has resulted to the search for
various ways to improve the performance of students in physics by researchers, teachers, parents and government. It is on this
note that the researchers intended to find if performance of students in mathematics will correlate with their performance in
Physics in secondary school level.
Purpose of the Study

International Journal of Scientific and Research Publications, Volume 10, Issue 1, January 2020 402
ISSN 2250-3153
http://dx.doi.org/10.29322/IJSRP.10.01.2020.p9763 www.ijsrp.org
The purpose of this study was to investigate the correlation between the performance of students in mathematics and
physics in senior secondary two (SS2) mock examinations 2015-2017 in Ibesikpo Asutan Local Government Area, Akwa Ibom
State. The study specifically sought the following objectives:
(1) Ascertain the relationship between the academic performance of students in mathematics and physics in Senior
Secondary Two (SS2) 2015 mock examination.
(2) Determine the relationship between the academic performance of students in mathematics and physics in Senior
Secondary Two (SS2) 2016 mock examination.
(3) Investigate the relationship between the academic performance of students in mathematics and physics in Senior
Secondary Two (SS2) 2017 mock examination.
(4) Examine the relationship between the academic performances of students in mathematics and physics in Senior
Secondary Two (SS2) 2015-2017 mock examinations.
Research Questions
In considering the purpose of this work, the following research questions were formulated to guide the study.
(1) What is the relationship between students’ academic performance in mathematics and physics in Senior Secondary Two
(SS2) 2015 mock examination?
(2) What is the relationship between students’ academic performance in mathematics and physics in Senior Secondary Two
(SS2) 2016 mock examination?
(3) What is the relationship between students’ academic performance in mathematics and physics in Senior Secondary Two
(SS2) 2017 mock examination?
(4) What is the relationship between students’ academic performances in mathematics and physics in Senior Secondary Two
(SS2) 2015-2017 mock examinations?
Research Hypotheses
For this research work to have focus, the following hypotheses were therefore formulated.
(1) There is no significant relationship between students’ academic performance in mathematics and physics in Senior
Secondary Two (SS2) 2015 mock examination.
(2) There is no significant relationship between students’ academic performance in mathematics and physics in Senior
Secondary Two (SS2) 2016 mock examination.
(3) There is no significant relationship between students’ academic performance in mathematics and physics in Senior
Secondary Two (SS2) 2017 mock examination.
(4) There is no significant relationship between students’ academic performances in mathematics and physics in Senior
Secondary Two (SS2) 2015-2017 mock examinations.
Research Methods
Research Design
The study adopted correlational research design. Correlational research design has to do with the measurement of two or
more factors to determine the extent to which the values of the factors are related. The design was chosen because the study

International Journal of Scientific and Research Publications, Volume 10, Issue 1, January 2020 403
ISSN 2250-3153
http://dx.doi.org/10.29322/IJSRP.10.01.2020.p9763 www.ijsrp.org
intended to examine the relationship between students’ performance in mathematics and physics and if there is any relationship,
identify both the direction and magnitude of the relationship.
Population of the Study
The population of this study comprises of two thousand five hundred and sixty one (2561) physics students in sixteen
(16) secondary schools in Ibesikpo Asutan Local Government Area, who partook in SS2 mock examinations for 2015, 2016 and
2017 sessions. The number of students that took part in the mock examination were 751 physics students, 842 physics students
and 968 physics for 2015, 2016 and 2017 respectively making a total of 2561 physics students.
Sample and Sampling Technique
Purposive sampling technique was used by the researchers to select four (4) secondary schools in Ibesikpo Asutan Local
Government Area. Two (2) schools out of the four (4) were selected from each of the two clans of the research area. From the two
(2) schools selected from each clan, it was shared to be public and private. In summary, the criteria for selection was based on the
population of science students in the schools, the location of the school in term of the clans in the study area and the school must
be co-educational school. A total of 723 physics students were obtained for the three years making 28.2% of the population. 150
physics students for the years 2015, 269 physics students for 2016 and 304 physics students for 2017.
Instrumentation
Developing an instrument was not necessary because the research was to use secondary data, that is Senior Secondary
Two (SS2) mock examination results on mathematics and physics for 2015, 2016, and 2017 obtained from Examinations and
Certificates Division, Ministry of Education, Akwa Ibom State as all schools in the state takes a central mock examination
coordinated by the ministry.
Validity of the Instrument
The instrument need not be validated because they were secondary data, that is, Senior Secondary Two (SS2) mock
examination results on mathematics and physics for 2015, 2016 and 2017 collected from the Examinations and Certificates
Division, Ministry of Education, Akwa Ibom State.
Reliability of the Instrument
Reliability was not necessary because there was no developed instrument for the study. Secondary data were used
instead, that is, Senior Secondary Two (SS2) mock examination results on mathematics and physics for 2015, 2016 and 2017
collected from the Examination and Certificates Division, Ministry of Education, Akwa Ibom State.
Research Procedure
The research was carried out in four (4) purposive selected secondary schools in Ibesikpo Asutan Local Government
Area, Akwa Ibom State. The source of data for this investigation consisted of 2015, 2016 and 2017 Senior Secondary Two (SS2)
mock examination results of physics students for mathematics and physics collected from the Examination and Certificates

International Journal of Scientific and Research Publications, Volume 10, Issue 1, January 2020 404
ISSN 2250-3153
http://dx.doi.org/10.29322/IJSRP.10.01.2020.p9763 www.ijsrp.org
Division, Ministry of Education, Akwa Ibom State. Photocopies of these results were given to the researchers by the office of
Examination and Certificates Division, Ministry of Education, Akwa Ibom State. The Ministry of Education scored the scripts of
students as A1, A2 - A3, C4 – C6, P7, P8 and Fail while the researchers decided to use the five points scale to represents the
grades as shown below.
100% - 75% = A1 = 5 points
74% - 65% = A2-A3 = 4 points
64% - 50% = C4-C6 = 3 points
49% - 45% = P7 = 2 points
44% - 40% = P8 = 1 point
39% – 0 = fail = 0 point
The grades were presented using the points and the obtained points were used for analysis.
Method of Data Analysis
The data obtained for this study were analyzed using Pearson’s Product Moment Correlation statistics.
Results
The results were based on the research questions and hypotheses.
Research Questions
The research questions are answered using Pearson’s Product Moment Correlation.
Research Question One
What is the relationship between students’ academic performance in mathematics and physics in Senior Secondary Two
(SS2) 2015 mock examination?
Table 1: Pearson’s Product Moment Correlation between Students’ Performance in Mathematics and Physics in SS2 Mock
examination 2015.
Variables N ∑X∑Y ∑X2∑Y2 ∑XY r-cal
Mathematics (X) 150 423 1495
1321 .40
Physics(Y) 150 428 1486
Table 1 showed that the calculated r-value is .40. This indicates a positive average correlation between Mathematics and
Physics in mock examination 2015. It implies that as performance of students’ in mathematics increases, students’ performance in
physics averagely increases.
Research Question Two
What is the relationship between students’ academic performance in mathematics and physics in Senior Secondary Two
(SS2) 2016 mock examination?

International Journal of Scientific and Research Publications, Volume 10, Issue 1, January 2020 405
ISSN 2250-3153
http://dx.doi.org/10.29322/IJSRP.10.01.2020.p9763 www.ijsrp.org
Table 2: Pearson’s Product Moment Correlation between Students’ Performance in Mathematics and Physics in SS2 Mock
examination 2016.
Variables N ∑X∑Y ∑X2∑Y2 ∑XY r-cal
Mathematics (X) 269 1008 4232
2697 .20
Physics(Y) 269 694 2586
Table 2 showed that the calculated r-value is .20. This indicates a low positive correlation between Mathematics and
Physics in mock examination 2016. This implies that as performance of students’ in mathematics increases, students’
performance in physics will increase slowly.
Research Question Three
What is the relationship between students’ academic performance in mathematics and physics in Senior Secondary Two
(SS2) 2017 mock examination?
Table 3: Pearson’s Product Moment Correlation (r) between Students’ Performance in Mathematics and Physics in SS2 Mock
examination 2017.
Variables N ∑X∑Y ∑X2∑Y2 ∑XY r-cal
Mathematics (X) 304 1107 4401
2640 .33
Physics(Y) 304 677 2255
Table 3 showed that the calculated r-value is .33. This indicates an average positive correlation between students’
performance in Mathematics and Physics in mock examination 2017. This implies that as performance of students’ in
mathematics increases, students’ performance in physics will increase averagely.
Research Question Four
What is the relationship between students’ academic performances in mathematics and physics in Senior Secondary Two
(SS2) 2015-2017 mock examinations?
Table 4: Pearson’s Product Moment Correlation (r) between Students’ Performance in Mathematics and physics in SS2 Mock
examinations 2015-2017.
Variables N ∑X∑Y ∑X2∑Y2 ∑XY r-cal
Mathematics (X) 723 2538 10128
6658 .22
Physics(Y) 723 1799 6327
Table 4 showed that the calculated r-value is .22. This indicates a low positive correlation between students’
performance in Mathematics and Physics in mock examinations 2015-2017. This implies that as performance of students’ in
mathematics increases, students’ performance in physics will increase slowly.
Hypotheses Testing
The hypotheses were tested using Pearson’s Product Moment Correlation.
Hypothesis 1

International Journal of Scientific and Research Publications, Volume 10, Issue 1, January 2020 406
ISSN 2250-3153
http://dx.doi.org/10.29322/IJSRP.10.01.2020.p9763 www.ijsrp.org
There is no significant relationship between students’ academic performance in Mathematics and Physics in Senior
Secondary Two (SS2) 2015 mock examination.
Table 5: Pearson’s Product Moment Correlation (r) between Students’ Performance in Mathematics and Physics in SS2 Mock
examination 2015.
Variables N ∑X∑Y ∑X2∑Y2 ∑XY r-cal r-cri Decision
Mathematics (X) 269 1008 4232
1321 .40 .20 Rejected
Physics(Y) 150 428 1486
As shown in Table 5, the calculated r-value (,40) is greater than the critical value (.20). Therefore, the null hypothesis is
rejected. This means that there is significant relationship between students’ performance in Mathematics and Physics in SS2 mock
examination 2015.
Hypothesis 2
There is no significant relationship between students’ academic performance in Mathematics and Physics in Senior
Secondary Two (SS2) mock examination 2016.
Table 6: Pearson’s Product Moment Correlation (r) between Students’ Performance in Mathematics and Physics in SS2 Mock
examination 2016.
Variables N ∑X∑Y ∑X2∑Y2 ∑XY r-cal r-cri Decision
Mathematics (X) 269 1008 4232
2697 .20 .09 Rejected
Physics(Y) 269 694 2586
As shown in table 6, the calculated r-value (.20) is greater than the critical value (.09). Therefore, the null hypothesis is
rejected. This means that there is significant relationship between students’ performance in Mathematics and Physics in SS2 mock
examination 2016.
Hypothesis 3
There is no significant relationship between students’ academic performance in mathematics and physics in Senior
Secondary Two (SS2) mock examination 2017.
Table 7: Pearson’s Product Moment Correlation (r) between Students’ Performance in Mathematics and Physics in SS2 Mock
examination 2017.
Variables N ∑X∑Y ∑X2∑Y2 ∑XY r-cal r-cri Decision
Mathematics (X) 304 1107 4401
2640 .33 .09 Rejected
Physics(Y) 304 677 2255
As shown in Table 7 the calculated r-value (.33) is greater than the corresponding critical value (.09). Therefore, the null
hypothesis is rejected. This means that there is significant relationship between students’ performance in Mathematics and
Physics in SS2 mock examination 2017.
Hypothesis 4

International Journal of Scientific and Research Publications, Volume 10, Issue 1, January 2020 407
ISSN 2250-3153
http://dx.doi.org/10.29322/IJSRP.10.01.2020.p9763 www.ijsrp.org
There is no significant relationship between students’ academic performance in Mathematics and Physics in Senior
Secondary Two (SS2) 2015-2017 mock examinations.
Table 8: Pearson’s Product Moment Correlation (r) between Students’ Performance in Mathematics and physics in SS2 Mock
examinations 2015-2017.
Variables N ∑X∑Y ∑X2∑Y2 ∑XY r-cal r-cri Decision
Mathematics (X) 723 2538 10128
6658 .22 .09 Rejected
Physics(Y) 723 1799 6327
As shown in Table the calculated r-value is greater that the corresponding critical value. Therefore, the null hypothesis is
rejected. This means that there is significant relationship between students’ performance in Mathematics and Physics in SS2 mock
examinations 2015-2017.
Discussion of Findings
From the results, it was found that there was significant relationship between students’ performance in Mathematics and
their performance in physics in mock examinations for 2015, 2016, 2017 and 2015-2017. This is as a result of the identical
concepts in both mathematics and physics, such as vector, geometry, graphs, statistics and calculus. It is also as a result of the
mathematical symbols used in physics such as phi (φ), theta (θ), alpha (α), pi ( ), plus and minus (±), delta (∆), infinity (∞). The
findings could also be attributed to the calculation which is common in both mathematics and physics. Hence, Bassey (2003)
stated that calculations are very important in expressing physics contents and students with less ability in calculation will struggle
in physics because of the relationship between mathematical calculations and physics.
The findings of the study agreed with the findings of Awodun and Ojo (2013), who investigated the predictive influence
of mathematics skills (computation skills, geometry skills, algebra skills, probability, statistical skills, measuration skills,
interpretation of graphs and table skills) on physics students’ performance in senior secondary schools and found that
mathematics skills have strong positive influence and strong predictive value on physics students’ performance in senior
secondary schools. The study is also in agreement with that of Wenno (2014) who studied the relationship between physics and
knowledge of mathematics basic concepts with the ability to solve physics problems and found that there is positive relationship
between physics and knowledge of mathematics basic concepts with students’ ability to solve physics problems. However, the
findings of this study contradict the findings of Abdurrahman and Madugu (2014), who related the performance of students in
mathematics and physics in senior secondary school and found no significant correction between students’ performance in
mathematics and their performance in physics.
Conclusion

International Journal of Scientific and Research Publications, Volume 10, Issue 1, January 2020 408
ISSN 2250-3153
http://dx.doi.org/10.29322/IJSRP.10.01.2020.p9763 www.ijsrp.org
It can be concluded from the findings that mathematical knowledge has a relationship with physics. Thus, lack of
mathematical knowledge could block some students from venturing into physics as subject.
Recommendations
The result obtained from this study has creates an avenue for the researcher to make the following recommendations:
1. Guidance should be provided to students on significance of mathematics as an instrument of communication in physics.
This will lead to appreciation of mathematical calculations in physics and thus raise the performance of students in
physics.
2. Physics teachers should constantly consult and work closely with mathematics teachers. This will help to identify and
solve mathematics calculations involved in physics.
3. Science Teachers Association of Nigeria should organize seminars, conferences and workshops to enlighten physics
teachers on the important of collaborating with mathematics teachers.
References
Abdurrahman, M. S. and Madugu, A. (2014). Interrelationship between Students’ Performance in Mathematics and Physics in
Senior Secondary Schools of Birnin-Kebbi Local Government Area of Kebbi State. International Journal of Scientific &
Engineering Research. 5(11), 2 – 13.
Awodun, A. O. and Ojo, O. A. (2013). Mathematics Skills as Predictors of Physics Students’ Performance in Senior Secondary
Schools. International Journal of Science and Research (IJSR), 13 - 20.
Badru, A. K. (2004). Students Performance in Mathematics as Correlate of their Performance in Chemistry. 45th Annual
Conference Proceedings Science Teachers Association of Nigeria.
Bassey, M. (2003). School Science for Tomorrow’s Citizen. New York: Pergamon Press.
Effiong, S. (2015). The Relationship between Mathematical Language Skill and Students Academic Performance in Mathematics.
(Unpublished Undergraduate Project). University of Uyo, Uyo.
Ezenwean, U. L. (2006). Mathematics and Classroom Teaching. Abraka: University Press
Federal Republic of Nigeria (FGN) (2013). National Policy on Education Lagos: NERDC.
Harlow, F. H. (1949). Theory of Learning to learn. Retrieved from www.psywww.com/intropsych/cho8-animals/laws-of-
learning.html
Kaya, H. and Boyuk, U. (2011). Attitude towards Physical lesson and Physical Experiment of the High school students. European
Journal of physics Education, 2(1), 38-49.
Mekonnen, S. (2014). Problems Challenging the Academic Performance of Physics Students in Higher Governmental Institutions
in the Case of Arbaminch, Wolayita Sodo, Hawassa and Dilla Universities. Retrieve from
http://dx.doi.org/10.4236/ns.2014.65037.
Njoku, Z, C, (2007). Engendering learning equity in science and technology classrooms for sustainable development. In U.
Nzewi (Ed), Science, technology and mathematics education for sustainable development (50th proceedings of STAN).
Ibadan; HEBN publishers.
Oyedeji, S. O. (2011). Mathematics Skills as Predictors of Science Achievement in Junior Secondary Schools. World Young
Researchers. 4(60), 21 - 29.
Selina, (2012). Impact of IGAs on Students Retention rates in public secondary schools Vihiga District. Unpublished Project.

International Journal of Scientific and Research Publications, Volume 10, Issue 1, January 2020 409
ISSN 2250-3153
http://dx.doi.org/10.29322/IJSRP.10.01.2020.p9763 www.ijsrp.org
Siddiqui, U. and T. Khatoon, (2013). Teaching Physical Science: should We Implement Teacher-Centered CAI or Student-
Centered CAI at Secondary School level in India? European Scientific Journal, 9(10)136–149.
Ugwuanyi, J. C. (2003). Physical Education Teacher Preparation in Nigeria Projected and Challenges. Multidisciplinary Journal
of Research Development. (NARD), (2), 120-121.
Wenno, I. H. (2014). The Correlation Study of Interest at Physics and Knowledge of Mathematics Basic concepts towards the
Ability to Solve Physics Problems of 7th Grade Students at Junior High School in Ambon Maluku Province, Indonesia.
Hindawi Publishing Corporation Education Research International Volume 2015, Article ID 396750. Winneba, Ghana.
International Journal of Scientific and Research Publications, Volume 10, Issue 1, January 2020 410 ISSN 2250-3153
http://dx.doi.org/10.29322/IJSRP.10.01.2020.p9764 www.ijsrp.org
Performance Evaluation of Solar Bubble Dryer
Anand Mishra1*
, Sanjeet Kumar Jha2, Ganga Ram Bhandari
3, Shailendra Khatri
4, Shreemat Shrestha
5, and
Pravin Ojha6
*Corresponding author’s Email: [email protected] 1, 2, 3, 4, 5Agricultural Engineering Division, Khumaltar, Lalitpur, Nepal
6Food Research Division, Khumaltar, Lalitpur, Nepal
DOI: 10.29322/IJSRP.10.01.2020.p9764
http://dx.doi.org/10.29322/IJSRP.10.01.2020.p9764
Abstract: Rice is an important cereal crop and staple food for more than half of the world's population. Drying and
storage are two key post-harvest processes to improve yield in rice production. Farmers mostly perform drying of rice by
sun drying. Sun drying has many disadvantages such as: over-drying, animals feeding on the grains, spillage and non-
uniform drying. This experiment was conducted at Agricultural Engineering Division for performance evaluation of
Solar Bubble Dryer. During experiment paddy was spread on the floor of dryer and was mixed periodically with roller
bar. Sun drying was also carried out. The parameters such as moisture content and quality in terms of milling recovery
and head rice yield were tested for both methods of drying. Results showed that moisture content of paddy was reduced
from about 16% to 12% in six hours of operation. The rice quality was almost similar in both the drying methods.
Therefore, we concluded that Solar Bubble Dryer can be one of the options for drying of spring rice. However, the initial
cost of Solar Bubble Dryer is high.
Keywords: Paddy rice, Post-harvest handling, Solar Bubble Dryer, Grain moisture content
1. Introduction
Rice (Oryza sativa L.) is an important cereal crop and staple food for more than half of the world's population [1]. Rice
cultivation covers 42% of total cultivable area under food grains and 51.6% of the total food grain production of Nepal
[2]. Rice cultivation in Nepal contributes 7% and 20% of gross domestic product and agricultural gross domestic product,
respectively [3]. In Nepal, rice is cultivated under varying topography, climates and altitudes; from 60 to 3050 meters
above sea levels [3]. A total of 57 rice varieties have been released and 17 have been registered in the country [4]. About
20% of the total rice production in Nepal is contributed by spring rice. Due to the onset of rainy season during harvesting
of spring rice, drying is one of the challenging tasks for the farmers. They can loss from 10 to 30 percent of rice produced
due insufficient drying.
About 3-5% of paddy rice losses its quality due to improper drying of wet paddy [5, 6]. At the time of harvesting, the
paddy is generally harvested at the moisture content of 20-28% wet basis (MC) depending on wet and dry seasons. The
paddy should be dried within 24 hours of harvesting to the safe moisture content of about 14%. Storing paddy at 14% of
moisture content prevents losses which occur due to respiration, germination, etc., during storage [6, 7]. About 20% of
global rice production is contributed from Southeast Asia [8]. Commonly used mechanical dryers are the Solar Bubble
Dryer, the flatbed dryer, the recirculating batch columnar dryer, and the two-stage drying systems (two-stage) described
in RKB [9, 10].
Drying and storage are two key post-harvest processes to improve rice production. Farmers mostly perform drying of rice
by sun drying. Sun drying has many disadvantages such as: over-drying, animals feeding on the grains, spillage and non-
uniform drying. During the rainy season the possible problems in paddy cultivation are: delayed and incomplete drying,

International Journal of Scientific and Research Publications, Volume 10, Issue 1, January 2020 411 ISSN 2250-3153
http://dx.doi.org/10.29322/IJSRP.10.01.2020.p9764 www.ijsrp.org
yellowing of paddy, fungal propagation, and mycotoxin contamination [11, 12]. The fresh paddy market offers low farm
gate prices to the producers [13, 14]. Therefore, farmers are attracted toward drying of paddy and storing them. They sell
the paddy when the price becomes higher. The use of Solar Bubble Dryers (SBD) is one of option for drying of paddy.
They have low energy consumption and operational costs compared to commercial dryers that use fuels or electricity for
heating of the air [15]. The objective of this research was the performance evaluation of Solar Bubble Dryer. We also
tested the quality such as milling recovery and head rice yield of dried paddy.
2. Material and Methods
2.1. Introduction on Solar Bubble Dryer (SBD)
In collaboration with International Rice Research Institute (IRRI) and the University of Hohenheim (UOH), the Grain Pro
introduced SBD. It is designed in such a way that it can dry grain even during raining season. It is made of transparent
polyethylene (LDPE) cover which is UV and water resistant. The SBD safely dries agricultural commodities against
unexpected rain and also saves the commodities from contaminants. It acts like a bubble that traps solar radiation to heat
the commodities. Moisture is vaporized and pushed out by ventilators. The drying floor is made of a proprietary
watertight material to prevent water permeation from below. The top cover and the drying floor are joined together by
heavy-duty zippers. They can dry grains and seeds of paddy and corn. During sunny day, the drying rate is faster than
conventional sun-drying.
The commercially available SBD are found in market in two sizes. The model SBD25™ has a drying area of 25m2 which
is of half-ton capacity. The model SBD50™ has a drying area of 50m2 which is of one ton capacity. It has both solar and
electric models. Solar models use solar energy to run ventilator(s). However, in an electric-powered model, electricity is
needed to run the ventilator(s).
2.1.1. Working of Solar Bubble Dryer (SBD)
The SBD uses the solar energy from the sun in two ways. Firstly, the drying tunnel serves as a solar collector to convert
energy from the sun’s rays which enters through the transparent top of the drying tunnel to heat energy. This helps to
increase the temperature of the air and enables the faster drying process. Secondly, the SBD consists of a photovoltaic
system which has solar panels for generating electricity. In addition, it also has a rechargeable deep cycle battery for use
at night and one or two small blowers to inflate the drying tunnel and move air through it. The hot air helps to remove
water evaporating from the grains inside the tunnel. It also has roller with ropes attached on both ends which are
periodically moved underneath the tunnel to mix the grains inside the tunnel. For mixing of grain inside the tunnel rake is
used.
2.1.2. Benefits of use of Solar Bubble Dryer (SBD)
Solar Bubble Dryer (SBD) protects the agricultural commodities from unpredictable rainfall. It can dry the crops such as
paddy, corn, coffee, etc. As it is closed system therefore prevents the commodities from contaminants mixing during
drying process. It is portable and have collapsible and detachable components therefore it can easily carried from one
place to other and assemble on any flat surface. It can be operated either by solar or electric power. Fig. 1 shows the
photographic view of assembling of Solar Bubble dryer (SBD) before start of experiment. Fig. 2 shows photographic
view of Solar Bubble dryer (SBD) during experiment.
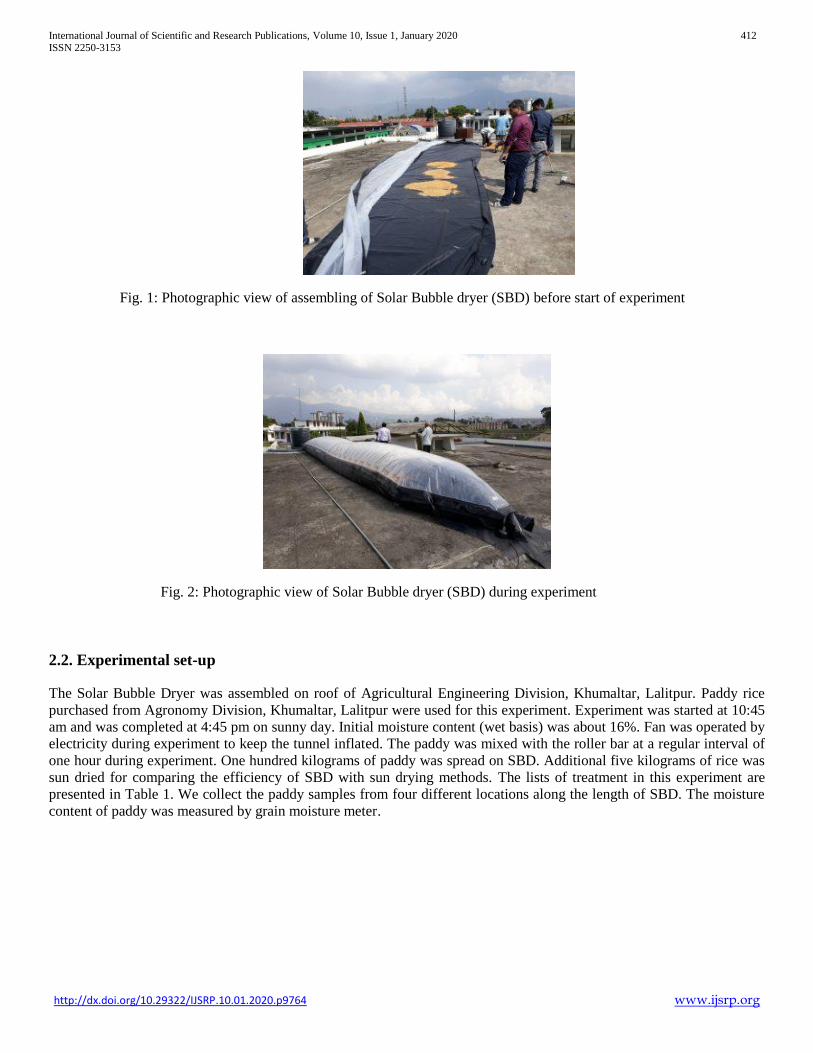
International Journal of Scientific and Research Publications, Volume 10, Issue 1, January 2020 412 ISSN 2250-3153
http://dx.doi.org/10.29322/IJSRP.10.01.2020.p9764 www.ijsrp.org
2.2. Experimental set-up
The Solar Bubble Dryer was assembled on roof of Agricultural Engineering Division, Khumaltar, Lalitpur. Paddy rice
purchased from Agronomy Division, Khumaltar, Lalitpur were used for this experiment. Experiment was started at 10:45
am and was completed at 4:45 pm on sunny day. Initial moisture content (wet basis) was about 16%. Fan was operated by
electricity during experiment to keep the tunnel inflated. The paddy was mixed with the roller bar at a regular interval of
one hour during experiment. One hundred kilograms of paddy was spread on SBD. Additional five kilograms of rice was
sun dried for comparing the efficiency of SBD with sun drying methods. The lists of treatment in this experiment are
presented in Table 1. We collect the paddy samples from four different locations along the length of SBD. The moisture
content of paddy was measured by grain moisture meter.
Fig. 1: Photographic view of assembling of Solar Bubble dryer (SBD) before start of experiment
Fig. 2: Photographic view of Solar Bubble dryer (SBD) during experiment

International Journal of Scientific and Research Publications, Volume 10, Issue 1, January 2020 413 ISSN 2250-3153
http://dx.doi.org/10.29322/IJSRP.10.01.2020.p9764 www.ijsrp.org
Table 1: List of treatments
T1 2.0 m away from fan of Solar Bubble Dryer
T2 4.5 m away from fan of Solar Bubble Dryer
T3 7.0 m away from fan of Solar Bubble Dryer
T4 9.5 m away from fan of Solar Bubble Dryer
T5 Sun drying method
2.3. Determination of milling quality of rice
Milling yield of paddy is the estimate of the quantity of the head rice and of the total yield of milled rice that can be
produced from a unit of paddy [16].
Milling recovery was calculated as follows:
Milling recovery (%) = (Weight of milled rice (kg)/Weight of paddy (kg)) x 100% ……. (1)
Milling capacity was calculated as follows:
Milling capacity (kg hr-1
) = Weight of rice (kg)/ time (hr)
3. Results and Discussion
3.1. Effects of drying methods on grain moisture content before and after drying
The effects of drying methods on grain moisture content before and after drying are shown in Table 2. The moisture
content before drying was about 16%. The moisture content after drying was about 12%. No significant difference was
found among the treatments for grain moisture content (%) after drying.
Table 2: Effects of drying methods on grain
moisture content before and after drying
Treatments
Before drying After drying
(%) (%)
T1 16.30 ± 0.28 12.45 ± 0.21
T2 16.10 ±0.42 12.20 ±0.49
T3 16.35 ± 0.49 12.40 ± 0.28
T4 16.25 ± 0.35 12.55 ± 0.42
T5 16.20 ± 0.42 12.70 ± 0.14
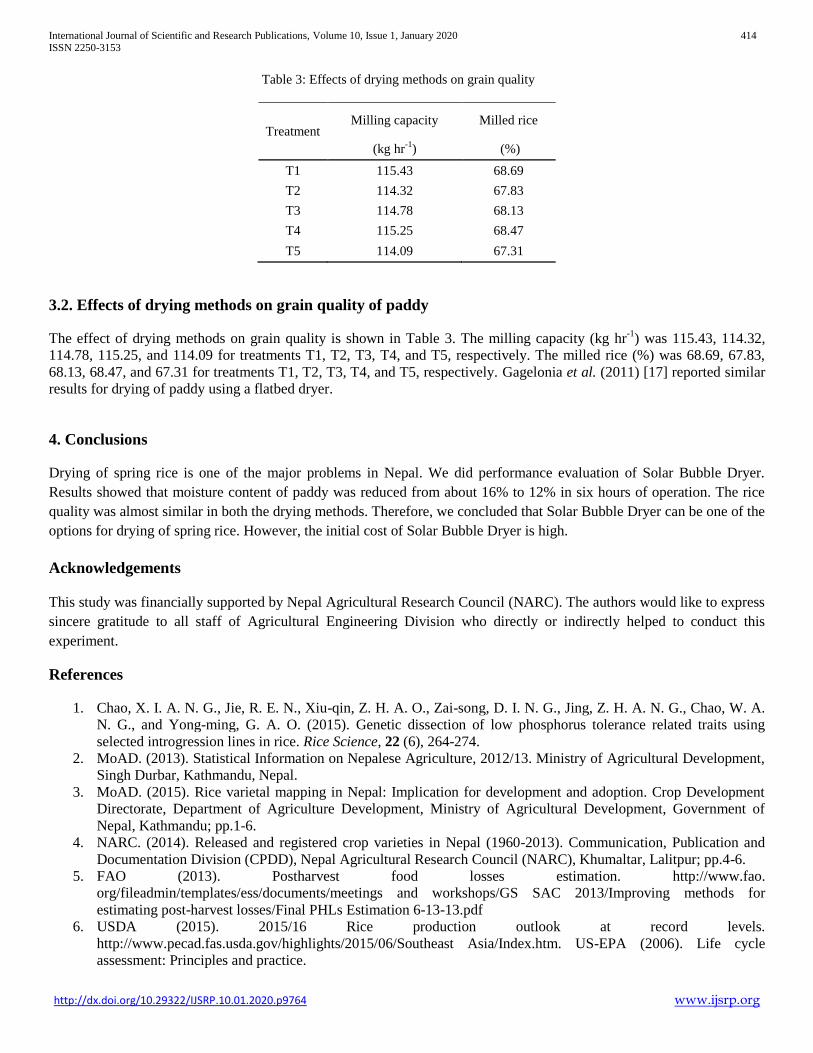
International Journal of Scientific and Research Publications, Volume 10, Issue 1, January 2020 414 ISSN 2250-3153
http://dx.doi.org/10.29322/IJSRP.10.01.2020.p9764 www.ijsrp.org
Table 3: Effects of drying methods on grain quality
Treatment Milling capacity Milled rice
(kg hr-1
) (%)
T1 115.43 68.69
T2 114.32 67.83
T3 114.78 68.13
T4 115.25 68.47
T5 114.09 67.31
3.2. Effects of drying methods on grain quality of paddy
The effect of drying methods on grain quality is shown in Table 3. The milling capacity (kg hr-1
) was 115.43, 114.32,
114.78, 115.25, and 114.09 for treatments T1, T2, T3, T4, and T5, respectively. The milled rice (%) was 68.69, 67.83,
68.13, 68.47, and 67.31 for treatments T1, T2, T3, T4, and T5, respectively. Gagelonia et al. (2011) [17] reported similar
results for drying of paddy using a flatbed dryer.
4. Conclusions
Drying of spring rice is one of the major problems in Nepal. We did performance evaluation of Solar Bubble Dryer.
Results showed that moisture content of paddy was reduced from about 16% to 12% in six hours of operation. The rice
quality was almost similar in both the drying methods. Therefore, we concluded that Solar Bubble Dryer can be one of the
options for drying of spring rice. However, the initial cost of Solar Bubble Dryer is high.
Acknowledgements
This study was financially supported by Nepal Agricultural Research Council (NARC). The authors would like to express
sincere gratitude to all staff of Agricultural Engineering Division who directly or indirectly helped to conduct this
experiment.
References
1. Chao, X. I. A. N. G., Jie, R. E. N., Xiu-qin, Z. H. A. O., Zai-song, D. I. N. G., Jing, Z. H. A. N. G., Chao, W. A.
N. G., and Yong-ming, G. A. O. (2015). Genetic dissection of low phosphorus tolerance related traits using
selected introgression lines in rice. Rice Science, 22 (6), 264-274.
2. MoAD. (2013). Statistical Information on Nepalese Agriculture, 2012/13. Ministry of Agricultural Development,
Singh Durbar, Kathmandu, Nepal.
3. MoAD. (2015). Rice varietal mapping in Nepal: Implication for development and adoption. Crop Development
Directorate, Department of Agriculture Development, Ministry of Agricultural Development, Government of
Nepal, Kathmandu; pp.1-6.
4. NARC. (2014). Released and registered crop varieties in Nepal (1960-2013). Communication, Publication and
Documentation Division (CPDD), Nepal Agricultural Research Council (NARC), Khumaltar, Lalitpur; pp.4-6.
5. FAO (2013). Postharvest food losses estimation. http://www.fao.
org/fileadmin/templates/ess/documents/meetings and workshops/GS SAC 2013/Improving methods for
estimating post-harvest losses/Final PHLs Estimation 6-13-13.pdf
6. USDA (2015). 2015/16 Rice production outlook at record levels.
http://www.pecad.fas.usda.gov/highlights/2015/06/Southeast Asia/Index.htm. US-EPA (2006). Life cycle
assessment: Principles and practice.

International Journal of Scientific and Research Publications, Volume 10, Issue 1, January 2020 415 ISSN 2250-3153
http://dx.doi.org/10.29322/IJSRP.10.01.2020.p9764 www.ijsrp.org
7. Xiao, H. W., and Gao, Z. J. (2008). Research progress in the effects of drying on feeding maize and processing
quality. Transactions of the Chinese Society of Agriculural Engineering, 24(7), 290–295.
8. RKB (2016a). Paddy drying. http://rkb.irri.org/step-by-stepproduction/postharvest/drying
9. RKB (2016b). The solar bubble dryer. http://www.knowledge
bank.irri.org/index.php?option=com_zoo&view=item&lay out=item&Itemid=1014.
10. GrainPro (2016). Solar bubble dryer. http://gel.grainpro.com/ solar-dryer-case-50.html
11. Phillips, S., Widjaja, S., Wallbridge, A., & Cooke, R. (1988). Rice yellowing during post-harvest drying by
aeration and during storage. Journal of Stored Products Research, 24 (3), 173-181.
12. Proctor, D. L. (Ed.). (1994). Grain storage techniques: Evolution and trends in developing countries (No. 109).
Food and Agriculture Org.
13. Hayami, Y., Kikuchi, M., and Marciano, E. B. (1999). Middlemen and peasants in rice marketing in the
Philippines. Agricultural Economics, 20 (2), 79-93.
14. GRAGASIN, M., MARUYAMA, A., and KIKUCHI, M. (2004). An economic evaluation of post-harvest
technology: the case of rice and corn drying in the Philippines. Japanese Journal of Tropical Agriculture, 48 (4),
253-264.
15. Janjai, S., Esper, A., and Mühlbauer, W. (1994). A procedure for determining the optimum collector area for a
solar paddy drying system. Renewable Energy, 4 (4), 409-416.
16. Bhattacharya KR. (2011). Rice quality: A guide to rice properties and analysis. 1st edition, Wood head Publishing
Limited. New Delhi, India.
17. Gagelonia, E. C., Regalado, M. J. C., Bautista, E. U., & Aldas, R. E. (2001). Flatbed dryer re-introduction in the
Philippines. AMA, Agricultural Mechanization in Asia, Africa and Latin America, 32 (3), 60-66.
International Journal of Scientific and Research Publications, Volume 10, Issue 1, January 2020 416 ISSN 2250-3153
http://dx.doi.org/10.29322/IJSRP.10.01.2020.p9765 www.ijsrp.org
Effects of Milking Methods on Milk Yield, Milk Flow
Rate, and Milk Composition in Cow
Anand Mishra1*
, Shailendra Khatri2, Sanjeet Kumar Jha
3 and Shamshad Ansari
4
*Corresponding author’s Email: [email protected] 1, 2, 3Agricultural Engineering Division, Khumaltar, Lalitpur, Nepal
4Agricultural Machinery Testing and Research Center
DOI: 10.29322/IJSRP.10.01.2020.p9765
http://dx.doi.org/10.29322/IJSRP.10.01.2020.p9765
Abstract: Cow milking is considered as laborious and time-consuming job at livestock farms. This experiment was
conducted with an objective to know the effects of milking methods on milk yield, milk flow rate, and milk composition
at National Cattle Research Program, Chitwan, Nepal. Four cows were selected randomly. All cows were maintained
under uniform feeding and management conditions. The selected cows were milked with milking machines on the first
day and the same cows were milked with hand on the second day. The results showed that there were no significant
differences between hand and machine milking for milk yield (p > 0.05). However, significant differences were found in
milking time and milk flow rate between hand and machine milking methods. We did not find any significant differences
in milk composition between hand and machine milking methods. The machine milking saves time compared to hand
milking. Therefore, we concluded that machine milking can be used in commercial farms of Nepal.
Keywords: Milking methods, Milk yield, Milk flow rate, Milk composition
1. Introduction
Nepal is located in South Asia and has economic dependency is on agriculture [1]. About eighty percent of its population
works in the agriculture sector which contributes about 40% of Gross Domestic Product (GDP) [1]. Livestock is an
integral part of Nepalese agriculture. The dairy sector contributes about 63% to the total Livestock Gross Domestic
Products (LGDP) which is more than 5% of total National GDP (MOAD, 2009) [2]. Farmers are attracted to dairy
farming recently. The productivity of the cattle is 519.56 Kg per lactation (MoAD, 2014) [3]. Milk demand in the country
is increasing day by day which necessitates the need to increase the milk yield of the country. Almost three-fourths of the
households in Nepal keep cattle and one-half keep buffalo for milk production [4]. Commercialization of livestock,
especially dairy farming is crucial for the economic development of the country. Almost 1.5 million of the population is
involved directly or indirectly in livestock production [5]
Cow milking is considered as laborious and time-consuming job at livestock farms [6]. Machine milking is gaining its
popularity as it improves labor efficiency and reduces the costs [7]. Aslam et al., (2014) [6] reported that machine
milking has the potential to increase milk production by up to 12%, reduce labor by up to 18%, and improve dairy cow
welfare. Hillerton and Winter (1992) [8] and Pappe and Capuco (1997) [9] reported that milk yield can be increased by
machine milking, and it is also beneficial for udder health. There is limited literature regarding the effects of machine
milking on milk yield, milk flow rate, and milk composition of Nepalese cattle. Therefore, this study was conducted to
know the effects of milking methods on milk yield, milking flow rate, and milk composition.

International Journal of Scientific and Research Publications, Volume 10, Issue 1, January 2020 417 ISSN 2250-3153
http://dx.doi.org/10.29322/IJSRP.10.01.2020.p9765 www.ijsrp.org
2. Material and Methods
2.1. Experimental site
The study was conducted at the National Cattle Research Program, Chitwan in July, 2019. It is situated in the central
region of Nepal (270 65′ N latitude; 84
0 35′ E longitude and 187 mean sea levels) at Rampur, Chitwan.
2.2. Selection of experimental animals
Four lactating cows with almost similar average bodyweight, conditions, and production performance were selected. Cow
milking was carried out by the hand and machine milking methods on alternate days. Animals were kept in separate pens
under identical conditions.
2.3. Feeding and data recording during experiment
Animals were given standard diet according to their body weight. Before milking, the udder of each cow was thoroughly
washed with moderately warm water and dried properly. The milking machine was thoroughly washed in lukewarm water
every day after milking operation was completed. Milking data were recorded for two methods of milking in the morning
time. Milk yields of all cows were recorded using an electric balance. The milking time in seconds was recorded with stop
watch. The milk flow rate was calculated as the ratio of milk yield per unit time. The following parameters such as milk
yield (kg), milking time (sec), milk protein (%), milk fat (%), milk lactose (%), milk total solids (%), and milk density
were studied to determine the responses of milking methods.
Milk composition analysis was carried out using a milk analyzer for the following milk constituents: milk fat, non-fat
solids, milk protein, lactose, and total solids.
2.4. Information about milking machine
The machine was made in India. It is operated by electric current with one horse power motor. It can milk two cows in
single operation and hence it saves time of milking.
2.5. Statistical analysis
The experiment was conducted in a completely randomized design with three replications. The data were analyzed using
one-way ANOVA followed by Tukey’s HSD test (p < 0.05). All analyses were done with STATISTIX 8 (Analytical
Software, Tallahassee, FL, US).
3. Results and Discussion
3.1. Effects of milking methods on milk yield of cow
The effects of milking methods on average milk yields are presented in Fig. 1. Milk yield between the machine and hand
milking treatment groups were not significantly different (p > 0.05). The average milk yield by machine and hand milking
were 6.05 and 5.85 kg, respectively. Aslam et al. (2014) [6] also reported that there was no significant difference in milk
yield of cow between machine and hand milking.

International Journal of Scientific and Research Publications, Volume 10, Issue 1, January 2020 418 ISSN 2250-3153
http://dx.doi.org/10.29322/IJSRP.10.01.2020.p9765 www.ijsrp.org
3.2. Effects of milking methods on milking time of cow
The effect of milking method on milking time is presented in Fig. 2. The machine milking significantly lower (p < 0.05)
the milking time compared to that of hand milking. On an average the milking time by machine milking was decreased by
52.17% compared to that of hand milking.
3.3. Effects of milking methods on milk flow rate of cow
The effect of milking methods on milk flow rate is presented in Fig 3. Milk flow rate was higher (p < 0.05) in cows
milked with machine compared to those milked with hand. The milk flow rate by machine milking was increased by
50.57% compared to that of hand milking.
a a
0.0
1.0
2.0
3.0
4.0
5.0
6.0
7.0
Machine
milking
Hand milking
Mil
k Y
ield
(kg)
Treatments
a
b
0.0
100.0
200.0
300.0
400.0
500.0
600.0
700.0
800.0
900.0
Hand milking Machine milking
Mil
kin
g t
ime
(sec
)
Treatments
Fig. 1: Effects of milking method on milk yield in cow. Error bars indicate the
standard deviations of means (S.D.) (n=3).
Fig. 2: Effects of milking method on milking time in cow. Error bars indicate the
standard deviations of means (S.D.) (n=3).

International Journal of Scientific and Research Publications, Volume 10, Issue 1, January 2020 419 ISSN 2250-3153
http://dx.doi.org/10.29322/IJSRP.10.01.2020.p9765 www.ijsrp.org
3.4. Effects of milking methods on milk composition of cow
The effects of milking methods on milk composition are shown in Table 1. Milking method did not influence fat
percentage in milk. Similarly, the percentage of total solids was also not significantly different among the treatment
groups. The percentages of protein and lactose in milk were not significantly different (p > 0.05) among cows in the
different treatment groups. The fat, protein, lactose, and SNF in hand milking were 3.98%, 2.97%, 4.48%, and 8.25%,
respectively. However, the fat, protein, lactose, and SNF in machine milking were 3.69%, 3.03%, 4.56%, and 8.29%,
respectively. Aslam et al. (2014) [6] also reported that there was no significant difference in milk composition of cow
between machine and hand milking.
Table 1: Effects of milking method on fat (%), protein (%), lactose (%), SNF (%), and density in cow
Treatments
Fat
(%)
Protein
(%)
Lactose
(%)
SNF
(%)
Density
Hand
Milking 3.98 ± 0.4 a 2.97 ± 0.05
a 4.48 ± 0.07
a 8.25 ± 0.09
a 27.41 ± 0.74
a
Machine
Milking 3.69 ± 0.37 a 3.03 ± 0.02
a 4.56 ± 0.03
a 8.29 ± 0.06
a 28.36 ± 0.61
a
Same letters are not significantly different at (p < 0.05) by Tukey’s HSD test.
4. Conclusions
This study was conducted to clarify the effects of milking methods on milk yield, milking flow rate, and milk
composition. From the results of our study, we concluded that the machine milking is profitable for milking of cows as it
saves time and also there were no significant differences in milk composition compared to hand milking.
Acknowledgements
This study was financially supported by Nepal Agricultural Research Council (NARC). The authors would like to express
sincere gratitude to all staff of Agricultural Engineering Division and National Cattle Research Program, Chitwan who
directly or indirectly helped to conduct this experiment.
b
a
0.0
0.5
1.0
1.5
2.0
2.5
Hand milking Machine milking
Mil
kin
g f
low
rat
e (k
g s
ec-1
) Treatments
Fig. 3: Effects of milk flow rate on milk flow rate in cow. Error bars indicate the
standard deviations of means (S.D.) (n=3).
International Journal of Scientific and Research Publications, Volume 10, Issue 1, January 2020 420 ISSN 2250-3153
http://dx.doi.org/10.29322/IJSRP.10.01.2020.p9765 www.ijsrp.org
References
1. Ojo, K., and VanSickle, J. (2018, January). Cost of Production and Competitiveness for Production of Milk in Nepal.
In 2018 Annual Meeting, February 2-6, 2018, Jacksonville, Florida (No. 266646). Southern Agricultural Economics
Association.
2. MoAD, 2009.Statistical Information of Nepalese Agriculture. Government of Nepal, Agri-Business promotion and
Statistical Division. Ministry of Agricultural Development, Singha Durbar, Kathmandu, Nepal.
3. MoAD, 2014.Statistical Information of Nepalese Agriculture.Government of Nepal, Agri-Business Promotion and
Statistical Division. Ministry of Agricultural Development, Singha Durbar, Kathmandu, Nepal.
4. Paneru, U., Sharma, M., Kolachhapati, M. R., and Shrestha, B. S. (2015). Evaluation of productive performance of
cattle in dairy pocket area of Chitwan and Nawalparasi Districts. Journal of the Institute of Agriculture and Animal
Science, 207-212.
5. Heymell, V. (1989). Evaluation of pasture conditions in Nichara Union Council in relation to construction of water
storage tanks. Studies, 9, 89.
6. Aslam, N., Abdullah, M., Fiaz, M., Bhatti, J. A., Iqbal, Z. M., Bangulzai, N., and Jo, I. H. (2014). Evaluation of
different milking practices for optimum production performance in Sahiwal cows. Journal of Animal Science and
Technology, 56 (1), 13.
7. Lind, O., Ipema, A. H., Koning, C. D., Mottram, T. T., & Hermann, H. J. (2000). Automatic milking. Bulletin of the
International Dairy Federation, (348), 3-14.
8. Hillerton, J. E., and Winter, A. (1992). The effects of frequent milking on udder physiology and health. Publication-
European Association for Animal Production, 65, 201-201.
9. Paape, M. J., and Capuco, A. V. (1997). Cellular defense mechanisms in the udder and lactation of goats. Journal of
Animal Science, 75 (2), 556-565.

International Journal of Scientific and Research Publications, Volume 10, Issue 1, January 2020 421 ISSN 2250-3153
http://dx.doi.org/10.29322/IJSRP.10.01.2020.p9766 www.ijsrp.org
Study on Zero Energy Cool Chamber (ZECC) for
Storage of Mango
Anand Mishra1*
, Sanjeet Kumar Jha2, Kriti Ghimire
3 and Ujjwol Subedi
4
*Corresponding author’s Email: [email protected] 1, 2, 3Agricultural Engineering Division, Khumaltar, Lalitpur, Nepal
4Food Research Division, Khumaltar, Lalitpur, Nepal
DOI: 10.29322/IJSRP.10.01.2020.p9766
http://dx.doi.org/10.29322/IJSRP.10.01.2020.p9766
Abstract: The zero energy cool chamber (ZECC) is used as storage for the extension of the shelf life of stored fruits and
vegetables. However, there are limited researches on the use of ZECC for storage of mangos in Nepal. Therefore, the
present study was conducted to qualify the quality and storability of mangos in different storage structures such as ZECC,
room, and freeze conditions. We measured the physiological loss of water (PLW), TSS, and vitamin C of mango under
different storage conditions. This study was conducted at Agricultural Engineering Division, Khumaltar, Lalitpur, Nepal.
Mangos were purchased from local market. They were stored in three different storages such as in ZECC, room condition,
and freeze conditions. The results showed that on eighth days of storage the highest PLW (%) was recorded for the room
storage and the lowest was recorded for ZECC condition. The TSS and vitamin C significantly increased on the eighth
day of storage compared to the first day for all types of storage. On the tenth day of storage, vitamin C was decreased
compared to the eighth day in both ZECC and freeze conditions. The PLW was higher in freeze storage condition
compared to that of ZECC condition. We concluded that mangos stored in ZECC can be stored until the eighth days of
storage after considering both quality and PLW. Our result suggested that ZECC can maintain mango’s quality and
extend its shelf life therefore it can be used as a temporary storage structure for fruits like mangos.
Keywords: ZECC, PLW, TSS, Vitamin C, Mango
1. Introduction
Mango (Mangifera indica L.) is originated from eastern India, Assam and Burma [1]. It is one of the important tropical
fruits of Nepal which is cultivated in 9% of the total fruit cultivated area [2]. Mango is cultivated in about 14 thousand
hectares with an average annual production of 100 thousand tons [3]. The local cultivars of mango are Sindhure, Kali,
Supare, and Lohare from the lower hills, and Chinia, Sipiya, Chausa, and Safeda from the Terai and hills region [4]. To
meet the consumers’ demand the production of mango is increasing day by day [5]. After harvesting, the storage of
mango is a major problem due to lack of purchase capacity of farmers of an expensive cooling system in a country like
Nepal. Besides, there is a lack of electricity in rural areas.
Zero Energy Cool Chamber (ZECC) can be a possible solution for storage as it does not requires electricity. Also, they
are eco-friendly and require low cost for its construction [6, 7, 8]. ZECC is a simple type of storage structure which is
used to store fruits and vegetables and consists of outer and inner brick walls with a gap between two walls which is
generally filled with sand. Water is sprinkled on the sand for the cooling purposes [7]. Ganesan et al., (2004) [9] reported
that the shelf life of eggplants was enhanced up to nine days by storing them in ZECC storage. Similarly, several other
researchers reported that storing fruits and vegetables in ZECC increases their shelf life. For example, Narayan et al.,
(2002) [10] conducted research on banana; Prabha et al., (2006) [11] conducted research on lemon; Singh et al., (2010)

International Journal of Scientific and Research Publications, Volume 10, Issue 1, January 2020 422 ISSN 2250-3153
http://dx.doi.org/10.29322/IJSRP.10.01.2020.p9766 www.ijsrp.org
[12] conducted research on aonla fruit; Islam et al., (2012, 2013) [6, 7] conducted research on tomato; Murugan et al.,
(2011) [13] conducted research on grapes; Sharma et al., (2010) [14] conducted research on apple in ZECC conditions.
All of them confirmed that the storage of fruits and vegetables in ZECC condition increases their shelf life. Dirpan et al.,
(2017) [15] reported that ZECC with watering 20 liters of water per day decreases temperature and increases relative
humidity inside ZECC which helps to maintain the quality and storability of fruits and vegetables inside the ZECC. There
is limited research on the quality and storability of mangos stored in the ZECC storage condition. Therefore, this study
was conducted to qualify the quality and storability of mango inside the ZECC.
2. Material and Methods
2.1. Experimental design
This research was conducted at Agricultural Engineering Division, Nepal Agricultural Research Council, Khumaltar from
June to July 2019. Zero Energy Cool Chamber (ZECC) was constructed by materials such as bricks, sand, bamboo, straw,
gunny bag, etc. The double wall was erected and leaving a gap of 7.5 cm between two walls. The gap between the two
walls was filled with river sand. House was constructed with bamboo and wheat straw to protect the ZECC from rainfall
and sunlight. Mango was collected from the local market. Mango was washed with tap water to remove field heat soon
after sorting for uniform size and undamaged product. About fifteen kilograms of mango with no fungal infection were
selected, labeled and weighed initially. Finally, mangoes were stored into three different storage conditions such as
ZECC, room, and freeze conditions.
2.2. Information about storage container
Three perforated crates made from high-density polyethylene were used to store mango. Mangos were placed inside the
perforated plastic crates and stored inside ZECC, freeze and room conditions for evaluation of its quality.
2.3. Effects of storage types on quality of mango
2.3.1. Effects of storage types on physiological loss in weight (PLW) of mango
The physiological loss in weight was measured using an electric balance with an accuracy of 0.01 g. The PLW was
measured by using the following formula:
Physiological loss in weight (PLW), % = (X1-X) x 100 ………. (1)
where, X1 = Initial weight (g) X = Weight (g) at the end of storage time.
2.3.2 Effects of storage types on total soluble solids (TSS) of mango
The TSS was measured by using Abbe refractometer with a measurement accuracy of ° Brix ±0.1%, and three replicates
of TSS samples.
2.3.3 Effects of storage types on vitamin C of mango
The vitamin-C content was determined by 2, 6-dichlorophenol-indophenol visual titration method [16]. Three replicates
of vitamin C were taken.

International Journal of Scientific and Research Publications, Volume 10, Issue 1, January 2020 423 ISSN 2250-3153
http://dx.doi.org/10.29322/IJSRP.10.01.2020.p9766 www.ijsrp.org
2.4. Statistical analysis
The experiment was conducted in a completely randomized design with three replications. The data were analyzed using
one-way ANOVA followed by Tukey’s HSD test (p < 0.05). All analyses were done with STATISTIX 8 (Analytical
Software, Tallahassee, FL, US).
3. Results and Discussion
3.1 Room and Zero Energy Cool Chamber (ZECC) temperature during experiment
Room and Zero Energy Cool Chamber (ZECC) temperature during experiment is shown in Table 1. The room
temperature ranges from 29.4 to 31.7 ° C. However, the ZECC temperature ranges from 23.3 to 25.2 ° C.
Table 1: Room and ZECC temperature during
experiment
Month Day
Room
temperature
(° C )
ZECC
temperature
(° C )
June 23 29.4 23.3
June 24 30.6 23.9
June 25 31.7 25.2
June 26 30.5 24.4
June 27 29.5 24.5
June 28 30.3 24.2
June 29 29.6 23.5
June 30 29.4 23.4
July 1 31.5 25.0
July 2 31.3 24.7
July 3 30.5 24.4
3.2. Effects of storages types on physiological loss in weight (PLW) of mango
The physiological loss in weight (PLW) of mangos stored inside ZECC, room, and freeze conditions are shown in Fig. 1.
We found significant differences in PLW (%) of mangos stored in the ZECC compared to mangos stored in room
condition. The PLW of mangos stored inside the ZECC were lower than those stored in room and freeze conditions. On
the eighth day of storage, the highest PLW was recorded for mangos stored in room conditions followed by freeze storage
condition. The lowest PLW was discovered for mangos stored in ZECC condition. On the tenth day of storage, the PLW
was 6.33% and 4.17% for mangos stored in freeze and ZECC conditions, respectively. On the tenth day of storage, the
mangos stored in room condition almost decay therefore we did not consider the PLW. Our results were in agreement
with Chien et al., (2007) [17] and Dirpan et al., (2018) [18] who reported that the mango with the higher moisture had
lower PLW and vice versa.
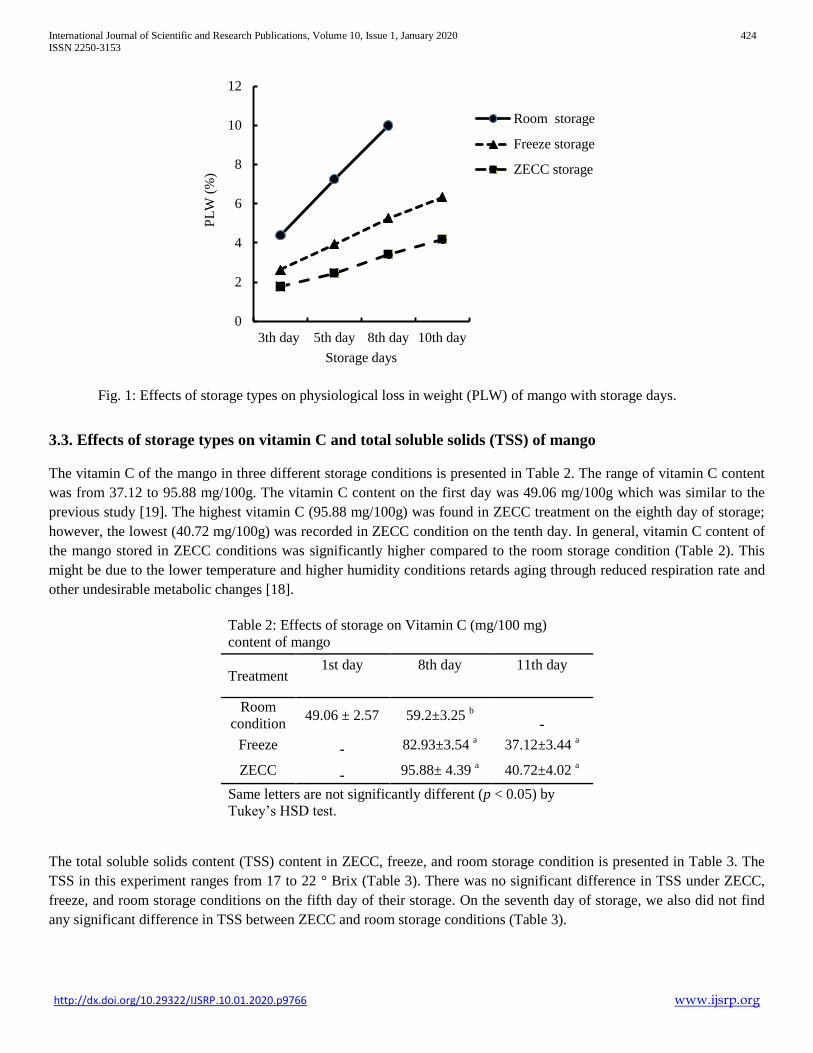
International Journal of Scientific and Research Publications, Volume 10, Issue 1, January 2020 424 ISSN 2250-3153
http://dx.doi.org/10.29322/IJSRP.10.01.2020.p9766 www.ijsrp.org
3.3. Effects of storage types on vitamin C and total soluble solids (TSS) of mango
The vitamin C of the mango in three different storage conditions is presented in Table 2. The range of vitamin C content
was from 37.12 to 95.88 mg/100g. The vitamin C content on the first day was 49.06 mg/100g which was similar to the
previous study [19]. The highest vitamin C (95.88 mg/100g) was found in ZECC treatment on the eighth day of storage;
however, the lowest (40.72 mg/100g) was recorded in ZECC condition on the tenth day. In general, vitamin C content of
the mango stored in ZECC conditions was significantly higher compared to the room storage condition (Table 2). This
might be due to the lower temperature and higher humidity conditions retards aging through reduced respiration rate and
other undesirable metabolic changes [18].
Table 2: Effects of storage on Vitamin C (mg/100 mg)
content of mango
Treatment 1st day 8th day 11th day
Room
condition 49.06 ± 2.57 59.2±3.25
b
-
Freeze - 82.93±3.54 a 37.12±3.44
a
ZECC - 95.88± 4.39 a 40.72±4.02
a
Same letters are not significantly different (p < 0.05) by
Tukey’s HSD test.
The total soluble solids content (TSS) content in ZECC, freeze, and room storage condition is presented in Table 3. The
TSS in this experiment ranges from 17 to 22 ° Brix (Table 3). There was no significant difference in TSS under ZECC,
freeze, and room storage conditions on the fifth day of their storage. On the seventh day of storage, we also did not find
any significant difference in TSS between ZECC and room storage conditions (Table 3).
0
2
4
6
8
10
12
3th day 5th day 8th day 10th day
PL
W (
%)
Storage days
Room storage
Freeze storage
ZECC storage
Fig. 1: Effects of storage types on physiological loss in weight (PLW) of mango with storage days.

International Journal of Scientific and Research Publications, Volume 10, Issue 1, January 2020 425 ISSN 2250-3153
http://dx.doi.org/10.29322/IJSRP.10.01.2020.p9766 www.ijsrp.org
Table 3: Effects of storage types on TSS (° Brix)
content of mango
Treatment 1st day 5th day 7th day
Room
condition 17.0±1.41 21±1.41
a
-
Freeze - 21.5±0.7 a 22.0±1.41
a
ZECC - 22.0± 2.83 a 20.0±2.83
a
Same letters are not significantly different (p < 0.05)
by Tukey’s HSD test.
4. Conclusions
In study we clarify the quality and storability of mango under ZECC, freeze, and room storage conditions. Results
revealed that the storage and quality (vitamin C and ° Brix) of mango were increased in ZECC storage
conditions until eighth day of storage. Therefore, we concluded that ZECC can be used as storage structure for storage
of mango.
Acknowledgements
This study was financially supported by Nepal Agricultural Research Council (NARC). The authors would like to express
sincere gratitude to all staff of Agricultural Engineering Division who directly or indirectly helped to conduct this
experiment.
References
1. Popenoe W. (1920). Manual of Tropical and Sub-Tropical Fruits. Hafner Press, Macmillan Publishing Co., New
York, USA.
2. Gautam D. M. and Dhakal D. D. (1994). [Fruit and industrial crops] [In Nepali]. Pabitra Tatha Rupa Publication,
Chitwan, Nepal. 324 p.
3. ASD [Agriculture Statistics Division] (2005). Statistical information on Nepalese agriculture. Agriculture
Statistics Division, Ministry of Agriculture, Kathmandu, Nepal.
4. NARC [Nepal Agricultural Research Council]. (2003). Final Report of the IPGRI-ADB-TFT Project on
Conservation and Use of Mango and Citrus Species Biodiversity in Nepal. Nepal Agricultural Research Council
(NARC), Kathmandu, Nepal.
5. Jahurul, M. H. A., Zaidul, I. S. M., Ghafoor, K., Al-Juhaimi, F. Y., Nyam, K. L., Norulaini, N. A. N., and Mohd
Omar, A. K. (2015). Mango (Mangifera indica L.) by products and their valuable components: A review. Journal
of Food Chemistry.
6. Islam, M. P., Morimoto, T., and Hatou, K. (2012). Storage behavior of tomato inside a zero energy cool chamber.
Agricultural Engineering International: CIGR Journal, 14 (4), 209–217.
7. Islam, M. P., Morimoto, T., and Hatou, K. (2013). Dynamic optimization of inside temperature of Zero Energy
Cool Chamber for storing fruits and vegetables using neural networks and genetic algorithms. Computers and
Electronics in Agriculture, 95, 98–107.
8. Vala, K. V, Saiyed, F., and Joshi, D. C. (2014). Evaporative Cooled Storage Structures : An Indian Scenario.
Trends in Post-Harvest Technology, 2 (3), 22–32.
International Journal of Scientific and Research Publications, Volume 10, Issue 1, January 2020 426 ISSN 2250-3153
http://dx.doi.org/10.29322/IJSRP.10.01.2020.p9766 www.ijsrp.org
9. Ganesan, M., Balasubramanian, K., and Bhavani, R. (2004). Studies on the application of different levels of
water on Zero energy cool chamber with reference to the shelf-life of brinjal. Journal of Indian Institute of
Sciences, 84, 107–111.
10. Narayana, C., Mustafa, M., and Sathiamoorthy, S. (2002). Effect of packaging and storage on shelf-life and
quality of banana cv. Karpuravalli. Journal of Dairying, Foods and Home Sciences, 59 (2), 113–117.
11. Prabha, A., H.R, S., A.K, G., and Ranjana, V. (2006). Changes in ascorbic acid content of lemon fruits stored in
zero energy cool chamber and under ambient atmosphere. Journal of Dairying, Foods and Home Sciences, 25 (1),
73–75.
12. Singh, S., Singh, a. K., Joshi, H. K., Bagle, B. G., and More, T. A. (2010). Effect of zero energy cool chamber
and post-harvest treatments on shelf-life of fruits under semi-arid environment of western India. Part 2. Indian
gooseberry fruits. Journal of Food Science and Technology, 47 (4), 450–453.
13. Murugan, A., Ranjith, S. A. J. A., and Vidhya, S. (2011). Evaluation of self-life and organoleptic aspects of fruits
stored in a modified traditional earthen pot cool chamber. Indian Journal of Traditional Knowledge, 10 (2), 375–
379.
14. Sharma, R. R., Pal, R. K., Singh, D., Samuel, D. V. K., Kar, A., and Asrey, R. (2010). Storage life and fruit
quality of individually shrink-wrapped apples in zero energy cool chamber. Indian Journal of Agricultural
Sciences, 80 (4), 338–341.
15. Dirpan, A., Sapsal, M. T., Muhammad, A. K., Tahir, M. M., and Rahimuddin. (2017). Evaluation of temperature
and relative humidity on two types of zero energy cool chamber (ZECC) in South Sulawesi, Indonesia. IOP
Conference Series: Earth and Environmental Science, 101, 012028.
16. Ranganna, S. 1997. Handbook of analysis and quality control for fruits and vegetable products. 2nd edn. New
Delhi: Tata McGrawhill Publishing Company Ltd.
17. Chien, P. J., Sheu, F., and Yang, F. H. (2007). Effects of edible chitosan coating on quality and shelf life of sliced
mango fruit. Journal of Food Engineering, 78 (1), 225–229.
18. Dirpan, A., Sapsal, M. T., Syarifuddin, A., Tahir, M. M., Ali, K. N. Y., and Muhammad, A. K. (2018). Quality
and Storability of Mango During Zero Energy Cool Chamber (ZECC). International Journal of Agriculture
System, 6 (2), 119-129.
19. Khader, S. E. S. A. (1990). Orchard application of paclobutrazol on ripening, quality and storage of mango fruits.
Scientia Horticulturae, 41(4), 329–335.
International Journal of Scientific and Research Publications, Volume 10, Issue 1, January 2020 427 ISSN 2250-3153
http://dx.doi.org/10.29322/IJSRP.10.01.2020.p9767 www.ijsrp.org
Study on Zero Energy Cool Chamber (ZECC) for
Storage of Vegetables
Anand Mishra1*
, Sanjeet Kumar Jha2, and Pravin Ojha
3
*Corresponding author’s Email: [email protected] 1, 2Agricultural Engineering Division, Khumaltar, Lalitpur, Nepal
3Food Research Division, Khumaltar, Lalitpur, Nepal
DOI: 10.29322/IJSRP.10.01.2020.p9767
http://dx.doi.org/10.29322/IJSRP.10.01.2020.p9767
Abstract: Two-third of the population of Nepal depends on agriculture which shares about 31% of gross domestic
product. Although there is huge potential of vegetable cultivation in Nepal, however post-harvest losses of vegetable
negatively affect the economy of Nepalese agriculture. The vegetables are vulnerable to high temperature. The adoption
of newer storage techniques is necessary to prevent waste of fresh vegetables. The zero energy cool chamber (ZECC) is
an ecofriendly system with low cost of construction. The present study was conducted to qualify the quality and
storability of vegetables (pointed gourd and okra) in different storage conditions such as in ZECC, room, and freeze
conditions. We measured the physiological loss of water (PLW) and vitamin C of vegetables under different storage
conditions. The study was conducted at Agricultural Engineering Division, Khumaltar, Lalitpur, Nepal. Pointed gourd and
okra were purchased from the local market. They were stored in three different storages conditions such as in ZECC,
room condition, and freeze conditions. The results showed that the highest PLW (%) was recorded on fifth days of storage
for the room storage and the lowest was recorded for ZECC condition. The vitamin C significantly increased on the fifth
day of storage compared to the first day for all types of storage. On the seventh day of storage, vitamin C was decreased
compared to the fifth day in both ZECC and freeze conditions. The PLW was higher in freeze storage condition compared
to that of ZECC condition. We concluded that pointed gourd and okra stored in ZECC can be stored until fifth day of
storage after considering both quality and PLW. Our result suggested that ZECC can be used as a storage structure for
vegetables such as pointed gourd and okra.
Keywords: ZECC, PLW, Vitamin C, Pointed gourd, Okra
1. Introduction
Nepal is the sixth leading producer of fresh vegetables after China, India, Vietnam, Philippines, and Myanmar in 2016
[1]. Farmers are attracted to vegetable farming in Nepal [2]. Two-third of the population in Nepal depends on agriculture
which shares about 31% of gross domestic product [3, 4]. Farmers can generate cash by cultivation vegetable crops even
in a small plot of land in a short period and can improve their livelihood [5]. Although there is huge potential of vegetable
cultivation in Nepal, however post-harvest losses of vegetable negatively affect the economy of Nepalese agriculture.
(Gautam and Bhattarai, 2006) [6] reported that the post-harvest loss of fruit and vegetable in Nepal is about 20-50
percent. After harvest of vegetable, it is stored and transported under various environmental conditions before it reaches
the retailer market. Post-harvest losses during handling, transportation, storage, and distribution are the major losses for
perishable vegetable marketing. Turan (2008) [7] reported that improper harvesting and post-harvest practices cause
the spoilage of vegetables which reduces the quality of vegetables such as deterioration in appearance, taste, and
nutritional value before reaching the market. The vegetables are vulnerable to high temperature. The adoption of newer
storage techniques is necessary to prevent waste of fresh vegetables.

International Journal of Scientific and Research Publications, Volume 10, Issue 1, January 2020 428 ISSN 2250-3153
http://dx.doi.org/10.29322/IJSRP.10.01.2020.p9767 www.ijsrp.org
The zero energy cool chamber (ZECC) is an ecofriendly system with low cost of construction. It also saves energy as it
does not need electricity for its operation. It is constructed with locally available materials therefore these structures can
be easily constructed in rural areas [8]. The evaporative cooling is suitable for storage of fruit and vegetables compared to
refrigerators [9, 10]. ZECC can be used as short-term on-farm storage of perishable agricultural commodities as well as
for pre-cooling of fruits and vegetables before transit and storage in cold storage [11]. Temperature and relative humidity
in the storage chamber are important environmental factors affecting the ripening process of fruits and the final quality
[12, 13]. Ganesan et al., (2004) [14] and Rajeswari et al., (2011) [15] reported that the storage of fruits and vegetables
inside ZECC could reduce the water loss. In a semi-arid region, it is viable to use ZECC storage to retain freshness longer
during storage. There are limited researches on the quality and storability of vegetables (pointed gourd and okra) stored in
the ZECC storage condition. Therefore, this study was conducted to qualify the quality and storability of vegetables
(pointed gourd and okra) inside the ZECC. We measured PLW and vitamin C for the fulfillment of our objectives.
2. Material and Methods
2.1. Construction of Zero energy cool chambers (ZECC)
ZECC was made from locally available raw materials such as bricks, sand, bamboo, dry grass, jute bags etc. The chamber
is an above-ground double-walled structure made up of bricks. The cavity of the double wall is filled with riverbed sand.
ZECC had a maximum efficiency during the summer season. The rise in relative humidity (90% or more) and fall in
temperature from the ambient condition could be achieved by watering the chamber twice a day. The photographic view
of ZECC constructed at Agricultural Engineering Division is shown in Fig. 1.
2.2. Experimental design
This research was conducted at Agricultural Engineering Division, Nepal Agricultural Research Council, Khumaltar from
June to July 2019. Pointed gourd and okra were collected from the local market. About five kilograms of pointed gourd
and okra each with no fungal infection were selected, labeled and weighed initially. Finally, they were stored in three
different storage conditions such as ZECC, room, and freeze conditions.
Fig. 1: Photographic view of Zero energy cool chamber (ZECC) constructed at Agricultural
Engineering Division, Khumaltar.

International Journal of Scientific and Research Publications, Volume 10, Issue 1, January 2020 429 ISSN 2250-3153
http://dx.doi.org/10.29322/IJSRP.10.01.2020.p9767 www.ijsrp.org
2.3. Information about storage container
Three perforated crates made from high-density polyethylene were used to store vegetables. Vegetables were placed
inside the perforated plastic crates and stored inside ZECC, freeze, and room conditions for evaluation of its quality.
2.4. Effects of storage types on quality of vegetables
2.4.1. Effects of storage types on physiological loss in weight (PLW) of vegetable
The physiological loss in weight was measured using an electric balance with an accuracy of 0.01 g. The PLW was
measured by using the following formula:
Physiological loss in weight (PLW), % = (X1-X) x 100 ………. (1)
where, X1 = Initial weight (g) X = Weight (g) at the end of storage time.
2.4.2. Effects of storage types on vitamin C of vegetable
The vitamin-C content was determined by 2, 6-dichlorophenol-indophenol visual titration method [16]. Three replicates
of vitamin C were taken.
2.5. Statistical analysis
The experiment was conducted in a completely randomized design with three replications. The data were analyzed using
one-way ANOVA followed by Tukey’s HSD test (p < 0.05). All analyses were done with STATISTIX 8 (Analytical
Software, Tallahassee, FL, US).
3. Results and Discussion
3.1 Room and Zero Energy Cool Chamber (ZECC) temperature during experiment
Room and Zero Energy Cool Chamber (ZECC) temperature during the experiment is shown in Table 1. The room
temperature ranges from 29.4 to 31.5 ° C. However the ZECC temperature ranges from 23.4 to 25.0 ° C.
Table 1: Room and ZECC temperature during
experiment
Month Day
Room
temperature
(° C )
ZECC
temperature
(° C )
June 26 30.5 24.4
June 27 29.5 24.5
June 28 30.3 24.2
June 29 29.6 23.5
June 30 29.4 23.4
July 1 31.5 25.0
July 2 31.3 24.7
July 3 30.5 24.4
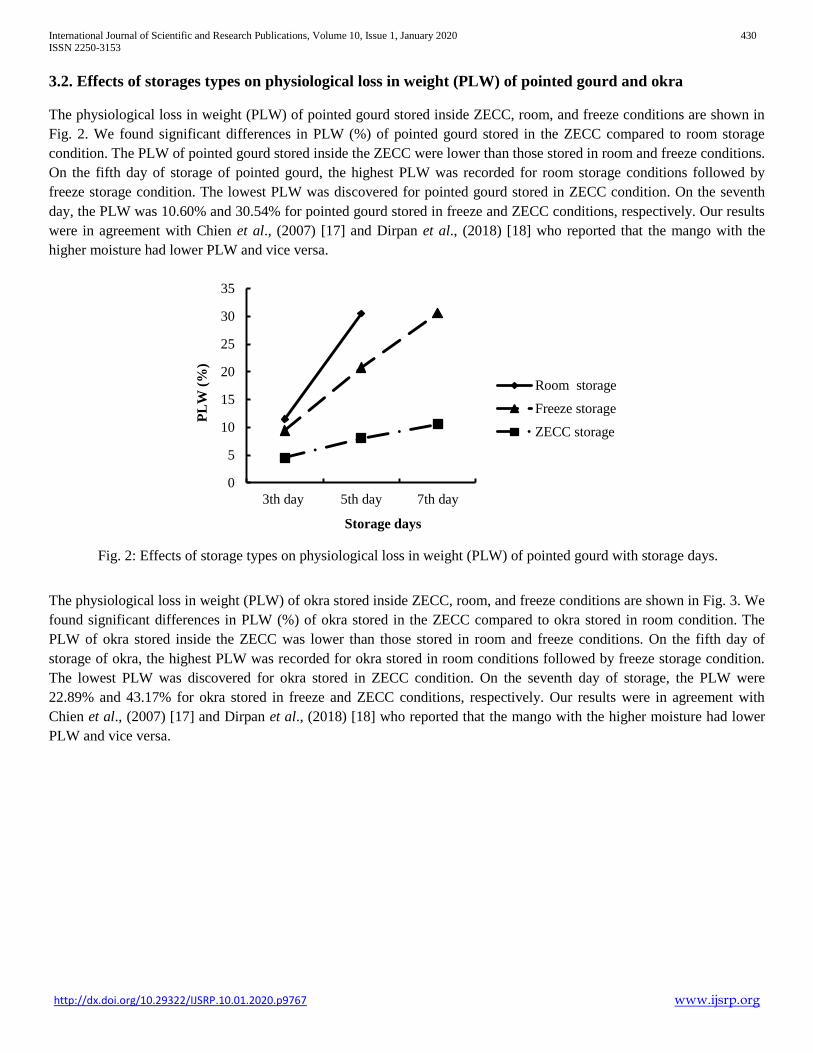
International Journal of Scientific and Research Publications, Volume 10, Issue 1, January 2020 430 ISSN 2250-3153
http://dx.doi.org/10.29322/IJSRP.10.01.2020.p9767 www.ijsrp.org
3.2. Effects of storages types on physiological loss in weight (PLW) of pointed gourd and okra
The physiological loss in weight (PLW) of pointed gourd stored inside ZECC, room, and freeze conditions are shown in
Fig. 2. We found significant differences in PLW (%) of pointed gourd stored in the ZECC compared to room storage
condition. The PLW of pointed gourd stored inside the ZECC were lower than those stored in room and freeze conditions.
On the fifth day of storage of pointed gourd, the highest PLW was recorded for room storage conditions followed by
freeze storage condition. The lowest PLW was discovered for pointed gourd stored in ZECC condition. On the seventh
day, the PLW was 10.60% and 30.54% for pointed gourd stored in freeze and ZECC conditions, respectively. Our results
were in agreement with Chien et al., (2007) [17] and Dirpan et al., (2018) [18] who reported that the mango with the
higher moisture had lower PLW and vice versa.
The physiological loss in weight (PLW) of okra stored inside ZECC, room, and freeze conditions are shown in Fig. 3. We
found significant differences in PLW (%) of okra stored in the ZECC compared to okra stored in room condition. The
PLW of okra stored inside the ZECC was lower than those stored in room and freeze conditions. On the fifth day of
storage of okra, the highest PLW was recorded for okra stored in room conditions followed by freeze storage condition.
The lowest PLW was discovered for okra stored in ZECC condition. On the seventh day of storage, the PLW were
22.89% and 43.17% for okra stored in freeze and ZECC conditions, respectively. Our results were in agreement with
Chien et al., (2007) [17] and Dirpan et al., (2018) [18] who reported that the mango with the higher moisture had lower
PLW and vice versa.
0
5
10
15
20
25
30
35
3th day 5th day 7th day
PL
W (
%)
Storage days
Room storage
Freeze storage
ZECC storage
Fig. 2: Effects of storage types on physiological loss in weight (PLW) of pointed gourd with storage days.

International Journal of Scientific and Research Publications, Volume 10, Issue 1, January 2020 431 ISSN 2250-3153
http://dx.doi.org/10.29322/IJSRP.10.01.2020.p9767 www.ijsrp.org
3.3. Effects of storage types on vitamin C of pointed gourd and okra
The vitamin C of the pointed gourd in three different storage conditions is presented in Table 2. The range of vitamin C
content was from 38.58 to 61.22 mg/100g. The vitamin C content on the first day was 45.15 mg/100g. The highest
vitamin C (61.22 mg/100g) was found in ZECC treatment on the fifth day of storage; however, the lowest (39.71
mg/100g) was recorded in ZECC condition on the seventh day. In general, vitamin C content of the pointed gourd stored
in ZECC conditions was significantly higher compared to the room storage condition (Table 2). This might be due to the
lower temperature and higher humidity conditions retards aging through reduced respiration rate and other undesirable
metabolic changes [18].
Table 2: Effects of storage on Vitamin C (mg/100 mg)
content of pointed groud
Treatment 1st day 5th day 7th day
Room
condition 45.15 ± 2.82 41.99±3.28
b
-
Freeze - 50.66±3.93 ab
38.58±4.28 a
ZECC - 61.22± 4.56 a 39.71±2.94
a
Same letters are not significantly different (p < 0.05) by Tukey’s
HSD test.
The vitamin C of the okra in three different storage conditions is presented in Table 3. The range of vitamin C content
was from 20.02 to 67.87 mg/100g. The vitamin C content on the first day was 33.58 mg/100g. The highest vitamin C
(67.87 mg/100g) was found in ZECC treatment on the fifth day of storage; however, the lowest (22.34 mg/100g) was
recorded in ZECC condition on the seventh day. In general, vitamin C content of the okra stored in ZECC conditions was
significantly higher compared to the room storage condition (Table 3). This might be due to the lower temperature and
higher humidity conditions retards aging through reduced respiration rate and other undesirable metabolic changes [18].
0
10
20
30
40
50
60
3th day 5th day 7th day
PL
W (
%)
Storage days
Room storage
Freeze storage
ZECC storage
Fig. 3: Effects of storage types on physiological loss in weight (PLW) of okra with storage days.
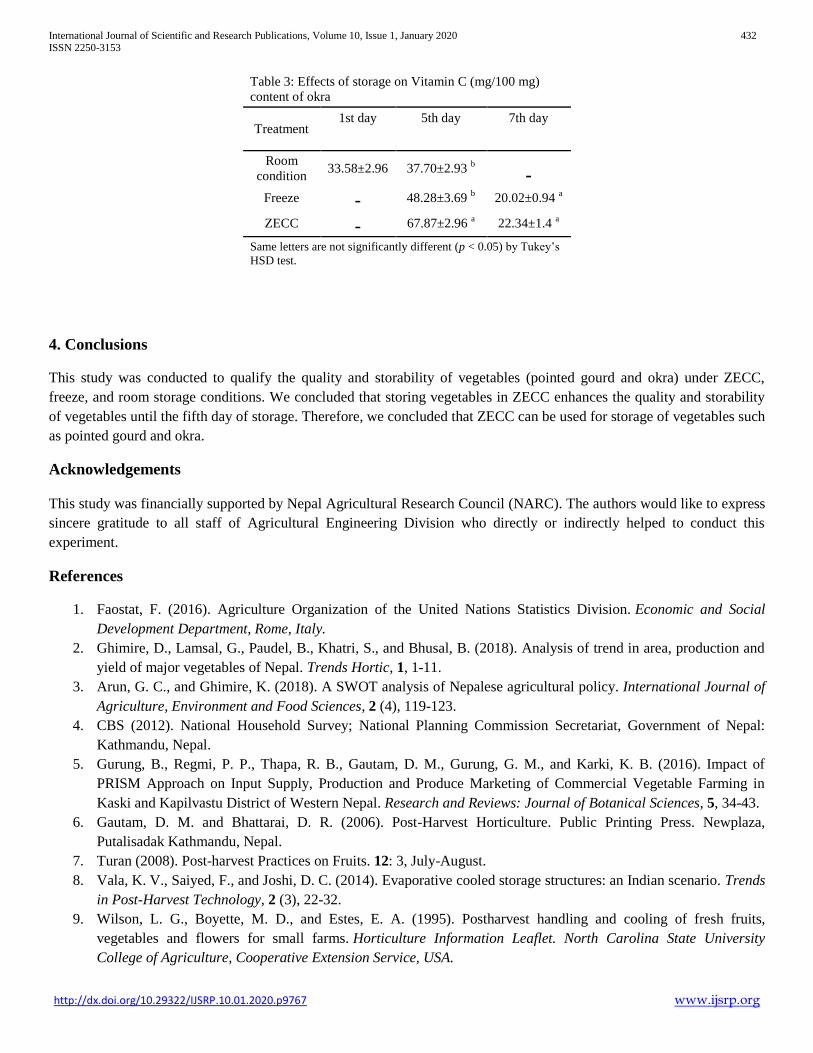
International Journal of Scientific and Research Publications, Volume 10, Issue 1, January 2020 432 ISSN 2250-3153
http://dx.doi.org/10.29322/IJSRP.10.01.2020.p9767 www.ijsrp.org
Table 3: Effects of storage on Vitamin C (mg/100 mg)
content of okra
Treatment 1st day 5th day 7th day
Room
condition 33.58±2.96 37.70±2.93
b
-
Freeze - 48.28±3.69 b 20.02±0.94
a
ZECC - 67.87±2.96 a 22.34±1.4
a
Same letters are not significantly different (p < 0.05) by Tukey’s
HSD test.
4. Conclusions
This study was conducted to qualify the quality and storability of vegetables (pointed gourd and okra) under ZECC,
freeze, and room storage conditions. We concluded that storing vegetables in ZECC enhances the quality and storability
of vegetables until the fifth day of storage. Therefore, we concluded that ZECC can be used for storage of vegetables such
as pointed gourd and okra.
Acknowledgements
This study was financially supported by Nepal Agricultural Research Council (NARC). The authors would like to express
sincere gratitude to all staff of Agricultural Engineering Division who directly or indirectly helped to conduct this
experiment.
References
1. Faostat, F. (2016). Agriculture Organization of the United Nations Statistics Division. Economic and Social
Development Department, Rome, Italy.
2. Ghimire, D., Lamsal, G., Paudel, B., Khatri, S., and Bhusal, B. (2018). Analysis of trend in area, production and
yield of major vegetables of Nepal. Trends Hortic, 1, 1-11.
3. Arun, G. C., and Ghimire, K. (2018). A SWOT analysis of Nepalese agricultural policy. International Journal of
Agriculture, Environment and Food Sciences, 2 (4), 119-123.
4. CBS (2012). National Household Survey; National Planning Commission Secretariat, Government of Nepal:
Kathmandu, Nepal.
5. Gurung, B., Regmi, P. P., Thapa, R. B., Gautam, D. M., Gurung, G. M., and Karki, K. B. (2016). Impact of
PRISM Approach on Input Supply, Production and Produce Marketing of Commercial Vegetable Farming in
Kaski and Kapilvastu District of Western Nepal. Research and Reviews: Journal of Botanical Sciences, 5, 34-43.
6. Gautam, D. M. and Bhattarai, D. R. (2006). Post-Harvest Horticulture. Public Printing Press. Newplaza,
Putalisadak Kathmandu, Nepal.
7. Turan (2008). Post-harvest Practices on Fruits. 12: 3, July-August.
8. Vala, K. V., Saiyed, F., and Joshi, D. C. (2014). Evaporative cooled storage structures: an Indian scenario. Trends
in Post-Harvest Technology, 2 (3), 22-32.
9. Wilson, L. G., Boyette, M. D., and Estes, E. A. (1995). Postharvest handling and cooling of fresh fruits,
vegetables and flowers for small farms. Horticulture Information Leaflet. North Carolina State University
College of Agriculture, Cooperative Extension Service, USA.

International Journal of Scientific and Research Publications, Volume 10, Issue 1, January 2020 433 ISSN 2250-3153
http://dx.doi.org/10.29322/IJSRP.10.01.2020.p9767 www.ijsrp.org
10. Soponpongpipat, N., and Kositchaimongkol, S. (2011). Recycled High-Density Polyethylene and rice husk as a
wetted pad in evaporative cooling system. American Journal of Applied Sciences, 8 (2), 186-191.
11. Jha, S. N., and Kudos, S. K. (2006). Determination of physical properties of pads for maximizing cooling in
evaporative cooled store. Journal of Agricultural Engineering, 43 (4), 92-97.
12. Islam, M. P., and Morimoto, T. (2012). Zero energy cool chamber for extending the shelf-life of tomato and
eggplant. Japan Agricultural Research Quarterly: JARQ, 46 (3), 257-267.
13. Islam, M. P., Morimoto, T., Hatou, K., Hassan, L., Awal, M. A., and Hossain, S. T. (2013). Case study about field
trial responses of the zero energy storage system. Agricultural Engineering International: CIGR Journal, 15 (4),
113-118.
14. Ganesan, M., Balasubramanian, K., and Bhavani, R. (2004). Studies on the application of different levels of
water on Zero energy cool chamber with reference to the shelf-life of brinjal. Journal of Indian Institute of
Sciences, 84, 107–111.
15. Dasmohapatra, R., Nautiyal, M. C., and Sharma, S. K. (2011). Effect of pedicel retention and zero energy cool
chamber on storage behaviour of malta fruits. International Journal of Agriculture Sciences, 3 (2), 78.
16. Ranganna, S. 1997. Handbook of analysis and quality control for fruits and vegetable products. 2nd edn. New
Delhi: Tata McGrawhill Publishing Company Ltd.
17. Chien, P. J., Sheu, F., and Yang, F. H. (2007). Effects of edible chitosan coating on quality and shelf life of sliced
mango fruit. Journal of Food Engineering, 78 (1), 225–229.
18. Dirpan, A., Sapsal, M. T., Syarifuddin, A., Tahir, M. M., Ali, K. N. Y., and Muhammad, A. K. (2018). Quality
and Storability of Mango During Zero Energy Cool Chamber (ZECC). International Journal of Agriculture
System, 6 (2), 119-129.
International Journal of Scientific and Research Publications, Volume 10, Issue 1, January 2020 434 ISSN 2250-3153
http://dx.doi.org/10.29322/IJSRP.10.01.2020.p9768 www.ijsrp.org
Performance Evaluation of Onion Grader Anand Mishra
1*, Sanjeet Kumar Jha
2, and Shreemat Shrestha
3
*Corresponding author’s Email: [email protected] 1, 2, 3Agricultural Engineering Division, Khumaltar, Lalitpur, Nepal
DOI: 10.29322/IJSRP.10.01.2020.p9768
http://dx.doi.org/10.29322/IJSRP.10.01.2020.p9768
Abstract: Onion is one of the important vegetable crops. A global review of area and production of major vegetable
crops shows that the onion ranks third in area and production. Onion is one of the important condiments which are widely
used all the year round in Nepal. Grading of onion is done on the basis of size and shape and is important for marketing of
uniform high quality products. Manual grading takes long time to do the grading process and hence labor charges is high.
This study was conducted with an objective of the performance evaluation of grader at Agricultural Engineering Division.
The onion was purchased from the local market. The grading machine is simple in design which is manually operated.
The size, weight, and percentage of onion received at individual size openings B varies from 3.39-3.68 cm, 25.71-27.95 g,
and 0.60-0.80%, respectively. The size, weight, and percentage of onion received at individual sieve opening C varies
from 4.43-4.72 cm, 36.87-42.93 g, and 6.20-7.80%, respectively. The size, weight, and percentage of onion received at
individual sieve openings D varies from 5.23-5.33 cm, 59.10-63.99 g, and 52.40-57.20%, respectively. The size, weight,
and percentage of onion received at outlet of grader which as denoted by E varies from 5.67-6.03 cm, 78.17-89.25 g, and
34.20-41.40%, respectively. The grading capacity varies from 0.20-0.22 kg sec-1
. The grader shows better results in terms
of size of onion. However, we saw few onions of size C and D was received from the outlet point of grader which is
denoted by E. Therefore, we concluded that there is still room for some modifications in the grader. We recommend
reducing the slope of the grader which will allow the product to travel for longer period of time inside the cylinder of
grader and better results can be expected. In addition, some modifications on sieve openings are necessary for the better
results in the future. Keywords: Postharvest handling, Onion, Grading capacity, Size of onion, Weight of onion
1. Introduction
Onion (Allium cepa L.) is one of the important vegetable crops worldwide. A global review of area and production of
major vegetable crops shows that the onion ranks third in area and production [1]. Onion is one of the important
condiments which are widely used all the year round in Nepal. It is rich source of phosphorus, calcium and carbohydrate
[2]. The area, production, and productivity of onion in Nepal was 20,070 ha, 2,38,590.7 t, and 11.9 t ha-1
, respectively [3].
This production fulfilled around 41.15% of national demand and remaining 58.85 % demand is fulfilled by importing
fresh or chilled and dry onion from other countries. In Nepal, based on the domestic production and import from other
countries, the per capita consumption of onion in fiscal year 2018/19 was 12.86 kg which was lower than the average
annual consumption 30.7 kg per person across the world [2]. The demand of onion is year round but it is grown
seasonally only [4].
Grading plays a vital role in the food processing industries. Grading of fruits and vegetables is one of the most important
operations which adds the value to the product and gives better income to the growers of fruits and vegetables. Manual
grading is time consuming process and it requires huge amount of labors. Manual grading is also affected by non-
availability of labors during peak seasons [5]. Manual grading is less efficient and inconsistent as human perception
varies from one another. It is also laborious job and causes muscle fatigue and stress to the farmers. In manual grading,
huge amount of energy is invested and the product is handled for number of times which results in increasing of wastage

International Journal of Scientific and Research Publications, Volume 10, Issue 1, January 2020 435 ISSN 2250-3153
http://dx.doi.org/10.29322/IJSRP.10.01.2020.p9768 www.ijsrp.org
and may decrease marketing value [6]. Mechanical grading saves time and money. It is gaining popularity in large scale
marketing to fetch higher prices. Good mechanical grading equipment can do grading of product based on various criteria
like size, shape, weight, colour etc. [7]. Gunathilake et al., (2016) [8] reported that there is an appreciable difference in
the market price of big onion according to the size of bulbs. Big size of graded onion bulbs fetches a higher price than the
un-graded onions [8].
Many researchers designed and fabricated grader such as Roy et al., (2005) [9] fabricated a potato grader with oscillating
sieve. The average capacity of the grader was 2030 kg hr-1
in the laboratory and 1500 kg hr-1
in the field. Similarly,
Ghanbarian et al., (2010) [10] reported a potato grader could grade products in three sizes: small (below 50 g), medium
(50 to 80 g), and large (above 80 g) with gradation accuracy of 74% and mechanical damages of 5.5%. Hossain et al.
(2013) [11] reported that capacity of the grader was 1.3 ton hr-1
with 95% grading efficiency.
The mechanical graders operated by electricity are expensive and sometimes beyond the purchase capacity of Nepalese
famers. The manually operated grader is usually less costly and can be purchase by Nepalese farmers. The quality of
processed product and cost of processing efficiency of machine depend on uniformity in size and shape of raw material.
This study was carried out with an objective of performance evaluation of grader for grading of onion.
2. Material and Methods
2.1. Experimental site
This research work was conducted at the Agricultural Engineering Division, Khumaltar, Lalitpur.
2.2. Information about grader and data collection
The machine consisted of main frame, feeding unit, grading unit, collection unit. The slope of the grader was about 8 per
cent. The grading of sample was done on the basis of size and was graded into three different sized grades. The grades are
classified into three different grades as, first grade (big size onions) which was denoted by D, second grade (medium size
onions) which was denoted by C, third grade (small size onions) which was denoted by B and finally oversized onions
were collected from the outlet point which was denoted by E. There were three outlets or collection units for collecting
the graded samples according to the grades. After completion of grading, the tubers were collected at each collection unit.
Ten kilograms of onion was purchased from the local market. Performance evaluation of grader was done at the three
speeds of grader, i.e. 17 revolutions per min., 20 revolutions per min., and 22 revolutions per min. The revolution per
minute was measured by digital techo-meter. The size (diameter) of graded onion was measured by vernier caliper. The
weight of grader onion was measured by weighing balance. Fig. 1 shows photographic view of grader.
Fig. 1: Photographic view of grader

International Journal of Scientific and Research Publications, Volume 10, Issue 1, January 2020 436 ISSN 2250-3153
http://dx.doi.org/10.29322/IJSRP.10.01.2020.p9768 www.ijsrp.org
2.3. Measurement of grading capacity
The grading capacity was determined by noting the time required to grade 10 kg of onion. The grading capacity of the
grader was determined by using the following formula as suggested by Cochran and Cox (1975) [12].
Grading capacity (kg sec-1
) = Total weight of grader sample (kg.) / time (sec)
Percentage of onion received at individual sieve openings (%) = mass of onion collected from individual sieve openings
(kg) / total mass of onion (kg)*100.
3. Results and Discussion
3.1. Size, weight, and percentage received at individual sieve openings and outlet point E of grader
Table 1 shows size, weight, and percentage received at individual sieve openings and outlet point denoted by E of grader
at 17 rpm. The size of onion at openings C and D were 4.57 ± 0.23 cm and 5.33 ± 0.36 cm, respectively. The weight of
onion at openings C and D were 42.93 ± 3.76 g and 59.72 ± 8.92 g, respectively. The percentage of onion received at
individual sieve openings C and D were 6.20% and 52.40%, respectively.
Table 1: Size, weight, and percentage of onion received at individual sieve
openings and outlet point of grader at 17 rpm
Parameters Sieve
openings C
Sieve
openings D
Outlet point of
grader denoted
by E
Size of onion (cm) 4.57 ± 0.23 5.33 ± 0.36 5.78 ± 0.41
Weight of onion (g) 42.93 ± 3.76 59.72 ± 8.92 78.17 ± 14.81
Percentage received at
individual sieves openings (%)
6.20 52.40 41.40
Table 2: Size, weight and percentage of onion received at individual sieve openings and outlet point
of grader at 20 rpm
Parameters
Sieve openings
B
Sieve openings
C Sieve openings D
Outlet point of
grader denoted
by E
Size of onion (cm) 3.68 ± 0.14 4.72 ± 0.19 5.27 ± 0.16 6.03 ± 0.37
Weight of onion (g) 27.95 ± 2.09 40.84 ± 4.23 59.10 ± 5.18 89.25± 13.30
Percentage received at
individual sieves
openings (%)
0.60 6.20 55.40 37.80
Table 2 shows size, weight, and percentage received at individual sieve openings and outlet point denoted by E of grader
at 20 rpm. The size of onion at openings B, C, and D were 3.68 ± 0.14 cm, 4.72 ± 0.19 cm, and 5.27 ± 0.16 cm,
respectively. The weight of onion at openings B, C, and D were 27.95 ± 2.09 g, 40.84 ± 4.23 g, and 59.10 ± 5.18 g,
respectively. The percentage of onion received at individual sieves openings B, C, and D were 0.6%, 6.20%, and 55.40%,
respectively.
Table 3 shows size, weight, and percentage received at individual sieve openings and outlet point denoted by E of grader
at 22 rpm. The size of onion at openings B, C, and D were 3.39 ± 0.21 cm, 4.43 ± 0.27 cm, and 5.23 ± 0.31 cm,
respectively. The weight of onion at openings B, C, and D were 25.71 ± 5.14 g, 36.87 ± 4.60 g, and 63.99 ± 8.02 g,
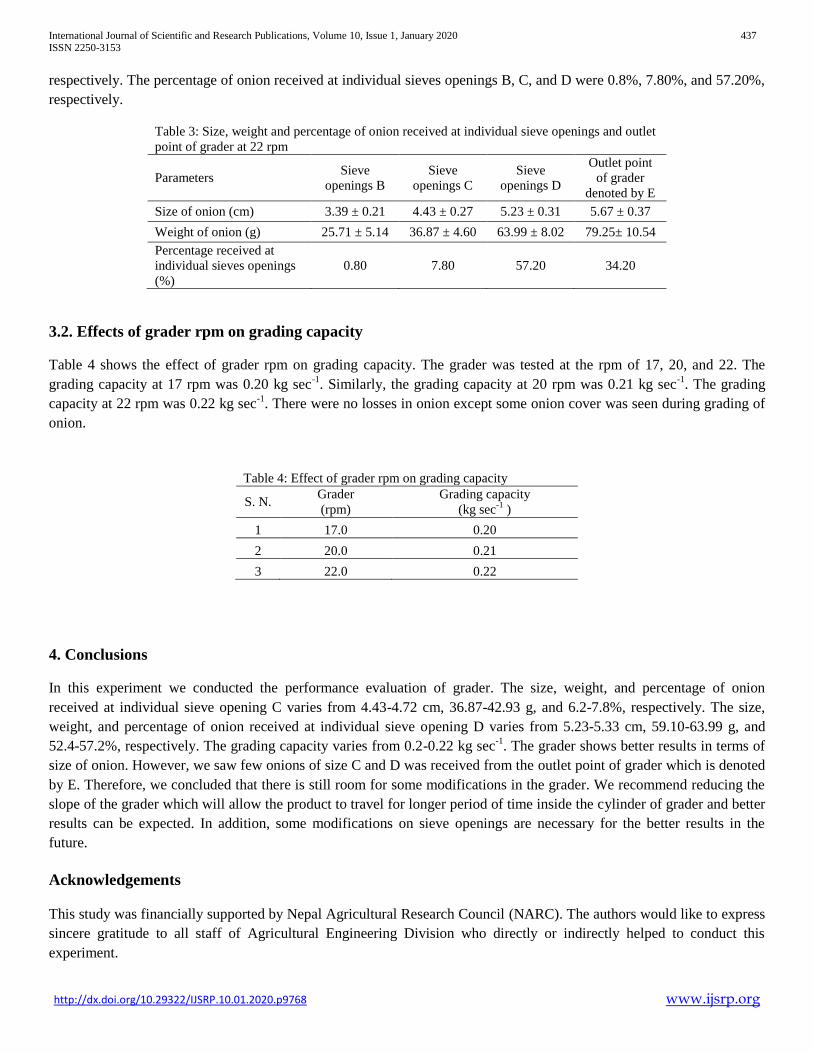
International Journal of Scientific and Research Publications, Volume 10, Issue 1, January 2020 437 ISSN 2250-3153
http://dx.doi.org/10.29322/IJSRP.10.01.2020.p9768 www.ijsrp.org
respectively. The percentage of onion received at individual sieves openings B, C, and D were 0.8%, 7.80%, and 57.20%,
respectively.
Table 3: Size, weight and percentage of onion received at individual sieve openings and outlet
point of grader at 22 rpm
Parameters Sieve
openings B
Sieve
openings C
Sieve
openings D
Outlet point
of grader
denoted by E
Size of onion (cm) 3.39 ± 0.21 4.43 ± 0.27 5.23 ± 0.31 5.67 ± 0.37
Weight of onion (g) 25.71 ± 5.14 36.87 ± 4.60 63.99 ± 8.02 79.25± 10.54
Percentage received at
individual sieves openings
(%)
0.80 7.80 57.20 34.20
3.2. Effects of grader rpm on grading capacity
Table 4 shows the effect of grader rpm on grading capacity. The grader was tested at the rpm of 17, 20, and 22. The
grading capacity at 17 rpm was 0.20 kg sec-1
. Similarly, the grading capacity at 20 rpm was 0.21 kg sec-1
. The grading
capacity at 22 rpm was 0.22 kg sec-1
. There were no losses in onion except some onion cover was seen during grading of
onion.
Table 4: Effect of grader rpm on grading capacity
S. N. Grader
(rpm)
Grading capacity
(kg sec-1
)
1 17.0 0.20
2 20.0 0.21
3 22.0 0.22
4. Conclusions
In this experiment we conducted the performance evaluation of grader. The size, weight, and percentage of onion
received at individual sieve opening C varies from 4.43-4.72 cm, 36.87-42.93 g, and 6.2-7.8%, respectively. The size,
weight, and percentage of onion received at individual sieve opening D varies from 5.23-5.33 cm, 59.10-63.99 g, and
52.4-57.2%, respectively. The grading capacity varies from 0.2-0.22 kg sec-1
. The grader shows better results in terms of
size of onion. However, we saw few onions of size C and D was received from the outlet point of grader which is denoted
by E. Therefore, we concluded that there is still room for some modifications in the grader. We recommend reducing the
slope of the grader which will allow the product to travel for longer period of time inside the cylinder of grader and better
results can be expected. In addition, some modifications on sieve openings are necessary for the better results in the
future.
Acknowledgements
This study was financially supported by Nepal Agricultural Research Council (NARC). The authors would like to express
sincere gratitude to all staff of Agricultural Engineering Division who directly or indirectly helped to conduct this
experiment.
International Journal of Scientific and Research Publications, Volume 10, Issue 1, January 2020 438 ISSN 2250-3153
http://dx.doi.org/10.29322/IJSRP.10.01.2020.p9768 www.ijsrp.org
References
1. IHD. 2014. Indian Horticulture Database, 2014. National Horticulture Board. Ministry of Agriculture,
Government of India. http://www.nhb.gov.in
2. Gautam, I. P., Pradhan, N. G., Luitel, B. P., and Subedi, S. (2019). Evaluation of Onion Genotypes for Growth
and Bulb Yield in Mid Hill of Nepal. Journal of Nepal Agricultural Research Council, 5, 53-61.
3. VDD. 2073/74. Annual Progress report of Potato, Vegetables and Spices Development Program Published by
Vegetable Development Directorate, Khumaltar, Nepal.
4. Karthik, S.K., Satishkumar, and Palanimuttu, V. (2016) Engineering Properties of Some Indian Onion
Cultivars.International Journal of Agricultural Science, 29 (8), 1613-1617.
5. Narvankar, D. S., Jha,S. K.and Singh, A. (2005), Development of rotating screen grader for selected orchard.
Journal of Agricultural Engineering, 42 (4): 60-64.
6. Gayathri, G., Harshanjali, K.V., Rupavathi, K., Vijay Kumar, D., Senthil Kumaran, G., Carolin Rathina Kumari,
A. and Ramana, M.V. (2016). Design, development and evaluation of a manually operated onion grader for Rose
onion, International Journal of Agricultural Engineering, 2 (9): 121-129.
7. Ukey, P. D. and Unde, P. (2010). Design, development and performance evaluation of sapota fruit grader.
International Journal of Agricultural Engineering, 3 (1): 35-39
8. Gunathilake, D. M. C. C., Wasala, W. M. C. B., and Palipane, K. B. (2016). Design, development and evaluation
of a size grading machine for onion. Procedia food science, 6, 103-107.
9. Roy, K. C., Wohab, M. A., and Mustafa, A. D. M. G. (2005). Design and Development of a Low-cost Potato
Grader. Agricultural Mechanization in Asia Africa and Latin America, 36(2), 28.
10. Ghanbarian, D., N. N. Kolchin, S. R. H. Beigi, and Ebrahim, R. (2010). Design and development of a small
potato grader machine using Capron net. Journal of Food Process Engineering, 33(6): 1148–1158.
11. Hossain, I., A. Hossain, N. Amin, K. K. Saha, N. Jahan, and Banna , T. N.. (2013). Introduction to BARI
Developed Agricultural Machinery. Joydebpur, Gazipur, Dhaka: Bangladesh Agricultural Research Institute
(BARI).
12. Cochran W. G. and Cox, G.M. (1975).Response surface design and analysis. 1st Edition, Marcel Dekker Quality
Press, NEW DELHI, INDIA.
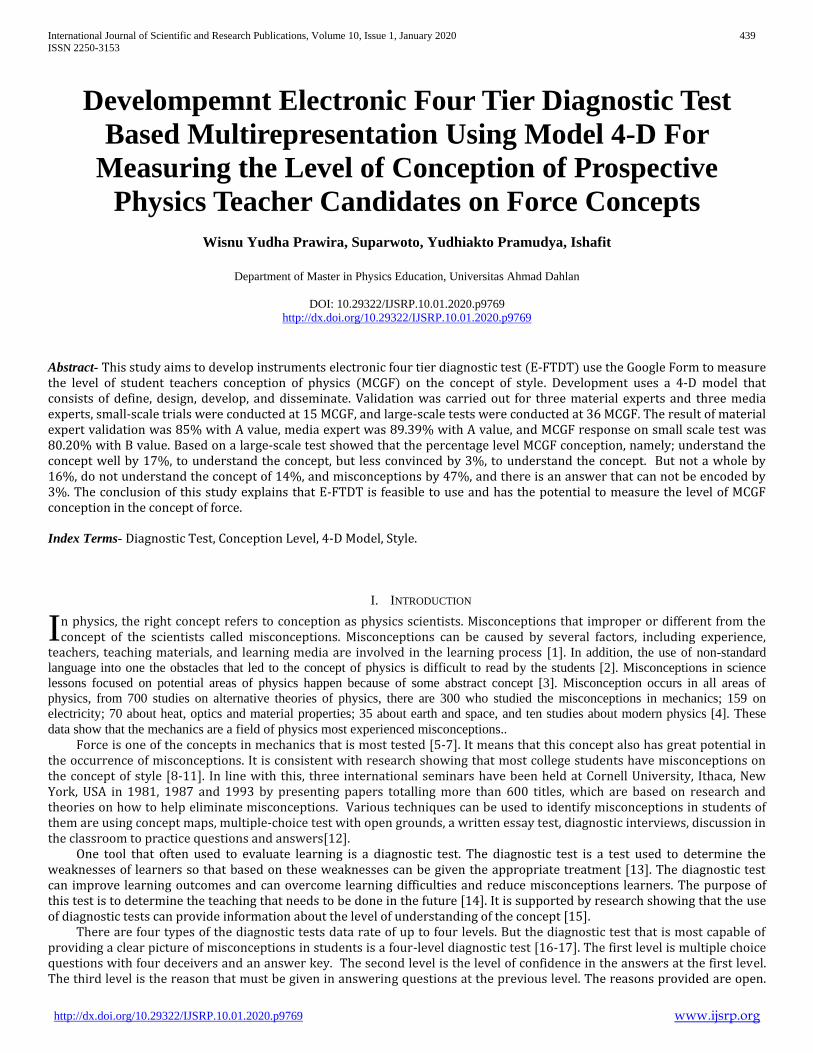
International Journal of Scientific and Research Publications, Volume 10, Issue 1, January 2020 439
ISSN 2250-3153
http://dx.doi.org/10.29322/IJSRP.10.01.2020.p9769 www.ijsrp.org
Develompemnt Electronic Four Tier Diagnostic Test
Based Multirepresentation Using Model 4-D For
Measuring the Level of Conception of Prospective
Physics Teacher Candidates on Force Concepts
Wisnu Yudha Prawira, Suparwoto, Yudhiakto Pramudya, Ishafit
Department of Master in Physics Education, Universitas Ahmad Dahlan
DOI: 10.29322/IJSRP.10.01.2020.p9769
http://dx.doi.org/10.29322/IJSRP.10.01.2020.p9769
Abstract- This study aims to develop instruments electronic four tier diagnostic test (E-FTDT) use the Google Form to measure the level of student teachers conception of physics (MCGF) on the concept of style. Development uses a 4-D model that consists of define, design, develop, and disseminate. Validation was carried out for three material experts and three media experts, small-scale trials were conducted at 15 MCGF, and large-scale tests were conducted at 36 MCGF. The result of material expert validation was 85% with A value, media expert was 89.39% with A value, and MCGF response on small scale test was 80.20% with B value. Based on a large-scale test showed that the percentage level MCGF conception, namely; understand the concept well by 17%, to understand the concept, but less convinced by 3%, to understand the concept. But not a whole by 16%, do not understand the concept of 14%, and misconceptions by 47%, and there is an answer that can not be encoded by 3%. The conclusion of this study explains that E-FTDT is feasible to use and has the potential to measure the level of MCGF conception in the concept of force.
Index Terms- Diagnostic Test, Conception Level, 4-D Model, Style.
I. INTRODUCTION
n physics, the right concept refers to conception as physics scientists. Misconceptions that improper or different from the concept of the scientists called misconceptions. Misconceptions can be caused by several factors, including experience,
teachers, teaching materials, and learning media are involved in the learning process [1]. In addition, the use of non-standard
language into one the obstacles that led to the concept of physics is difficult to read by the students [2]. Misconceptions in science
lessons focused on potential areas of physics happen because of some abstract concept [3]. Misconception occurs in all areas of
physics, from 700 studies on alternative theories of physics, there are 300 who studied the misconceptions in mechanics; 159 on
electricity; 70 about heat, optics and material properties; 35 about earth and space, and ten studies about modern physics [4]. These
data show that the mechanics are a field of physics most experienced misconceptions.. Force is one of the concepts in mechanics that is most tested [5-7]. It means that this concept also has great potential in
the occurrence of misconceptions. It is consistent with research showing that most college students have misconceptions on the concept of style [8-11]. In line with this, three international seminars have been held at Cornell University, Ithaca, New York, USA in 1981, 1987 and 1993 by presenting papers totalling more than 600 titles, which are based on research and theories on how to help eliminate misconceptions. Various techniques can be used to identify misconceptions in students of them are using concept maps, multiple-choice test with open grounds, a written essay test, diagnostic interviews, discussion in the classroom to practice questions and answers[12].
One tool that often used to evaluate learning is a diagnostic test. The diagnostic test is a test used to determine the weaknesses of learners so that based on these weaknesses can be given the appropriate treatment [13]. The diagnostic test can improve learning outcomes and can overcome learning difficulties and reduce misconceptions learners. The purpose of this test is to determine the teaching that needs to be done in the future [14]. It is supported by research showing that the use of diagnostic tests can provide information about the level of understanding of the concept [15].
There are four types of the diagnostic tests data rate of up to four levels. But the diagnostic test that is most capable of providing a clear picture of misconceptions in students is a four-level diagnostic test [16-17]. The first level is multiple choice questions with four deceivers and an answer key. The second level is the level of confidence in the answers at the first level. The third level is the reason that must be given in answering questions at the previous level. The reasons provided are open.
I

International Journal of Scientific and Research Publications, Volume 10, Issue 1, January 2020 440
ISSN 2250-3153
http://dx.doi.org/10.29322/IJSRP.10.01.2020.p9769 www.ijsrp.org
While the fourth level is the level of confidence in the reasons given at the third level. In some studies, the mostly four-tier diagnostic test still non-electronic form, which usually presented in the form of paper/sheet [11,17,18,19]. Some of the difficulties arising from a test like this are during the process of examination answers learners; proofreader sometimes experiences problems such as difficulty in writing illegible students perfect and human-error factor of the corrector itself. In addition, other obstacles that also arise are that much paper is needed, securing the confidentiality of questions is relatively tricky. It requires a large amount of money, processing the results requires a relatively long time, especially for the use of diagnostic tests. Therefore, these tests are then modified form of a electronic four tier diagnostic test .
In line with this, the development of information and communication technology (ICT) era of the industrial revolution 4.0 is now increasingly complex and evolving. We are required to be more competitive with the times so that in this case the implementation of the research will make it possible for learners to more easily work tests and make it easier for researchers or teachers too in examining the results of these tests. It is in line with the results of research suggest that the use of ICTs such as the Internet or a computer will make it easier in terms of both effectiveness research or efficient [20,21]. One feature that is often used and is familiar to the broader community are Google, Google Form. This feature is one of the highlights of Google that allows one to make a reliable evaluation test sheet, and also in its implementation will be more effective and efficient [22]. Some research indicates that the use of a Google Form as an electronic instrument in the study is very useful in helping and facilitate analysis or assessments performed in an agency for practical, free, and easy to use [23, 24].
Instruments developed in this research instruments adopted from the paper entitled Representational of the Force Concept Inventory (R-FCI) [25]. R-FCI is a development of the instrument Force Concept Inventory (FCI) [26]. R-FCI is an instrument that has been standardized and designed to assess the students understanding of the basic concepts of physics that deals with forces and motion. R-FCI is also a concept test standard for mechanics that have proven validation and reliability and have been used repeatedly in different countries. However, this instrument cannot be used to diagnose student conception levels because the format is in the form of multiple-choice questions so that it only tests student conceptions. Therefore, researchers developed it into a test instrument to diagnose potential student conception level. In the instrument, there are 27 items with multiple choice about the concept of force (Newtonian Mechanics) with nine themes, each theme consisting of 3 representations. The concept in the theme ninth consecutive test on; (1) gravitational force, (2) Newton's third law, (3) Newton's second law, (4) gravitational force, (5) Newton's first law, (6) Newton's second law, (7) Newton's first law, (8) Newton's third law, and (9) gravitational force [25].
The level of confidence that is presented on the second and fourth-tier in these diagnostics tests using methods Certainty of Response Index (CRICRI is a method used to measure the level of confidence/assurance respondent in answering each question/questions provided. Respondents asked to provide the level of certainty of their ability to associate a confidence level with the knowledge, concepts, or law [27]. It is possible to minimize the guesswork out of student answers due to the shape of the FCI only multiple-choice only. It is supported by the results of research which states that the CRI method can be used to identify students' misconceptions and who do not know the concept. In addition, its use in the teaching and learning process is possible because the process of identifying and analyzing the results does not take a long time [19,28].
However, the methods that have been prepare have weaknesses. Weakness contained in this method lies in the categorization, which has a low confidence level, and the amount of guess factor in answering the question because of the form of items used are multiple-choice tests. The presence of the actual respondents characterizes it was able to explain and understand the concepts contained in the matter. But because it has a low level of confidence led him to choose a small CRI scale, so it divided into categories does not understand the concept / deemed to guess the answer. By considering this condition, the category of the understanding level that has been compiled is then modified by adding a category that is understanding the concept but not sure [29]
II. METHOD
This research is a Research & Development study that aims to produce a product and test the feasibility of the product [30]. This study uses a model development procedure 4-D [31]: 1. Define
This stage includes field studies and literacy. The field study aims to obtain information about the implementation of physics learning in class and information about the characteristics of prospective physics teacher students — literacy studies conducted to assess the relevant concepts and related studies. The results are used as material to identify problems in learning activities.
2. Design After getting the problem and information from the definition phase, then performed the design stage. The purpose of this stage is
to produce an E-FTDT design that can be used to measure the level of conception of prospective physics teacher students on the
concept of force. This designs first made input from the supervisor. This feedback will be used to repair instruments developed
before entering the next stage
3. Develop a. Expert Validation

International Journal of Scientific and Research Publications, Volume 10, Issue 1, January 2020 441
ISSN 2250-3153
http://dx.doi.org/10.29322/IJSRP.10.01.2020.p9769 www.ijsrp.org
The purpose of this validation to get an assessment of experts are competent in the development of the instrument. In addition, to take input so that the instruments developed are better. The data analysis was done by tabulating data obtained from the results of expert validation for every aspect of the assessment items based research instruments. Data analysis was conducted referring to the calculation formula (1) and the following eligibility criteria.
n
xx
(1)
Where:
x : Average score
x : Score total
n : Number validator
The assessment of product development is carried out in the form of scores. Assessment by the quantitative data obtained from the scoring converted into qualitative data that consists of five categories. The conversion process is done with the formula contained in the following Table 1. [32].
Table 1. Conversion into a quantitative score qualitative score Score Scale Score Category
x > x +1,80SBi A Very good
x + 0,60SBi < x ≤ x +1,80SBi B Good
x - 0,60SBi < x ≤ x + 0,60SBi C Good enough
x - 1,80SBi < x ≤ x - 0,60SBi D Poorly
x ≤ x - 1,80SBi E Not good
Where: x : Average score = 1/2 (ideal maximum score + ideal minimum score)
SBi: ideal standard score = 1/6 (ideal maximum score - ideal minimum score) x : average score
The feasibility of the product is determined by the value of at least C with a category quite well. Thus, if the results of
the expert judgment give the final result C, then this development product is considered suitable for use [32].
b. Limited trial Tests carried out is limited to 15 student teachers of physics. Analysis of the results of diagnostic tests in a limited test is
also based on the calculation formula (1) and assessing the feasibility of the development of products in Table 1
4. Disseminate After validation by experts and a limited test and the instrument has revised, the next stage is the stage of dissemination. The
purpose of this stage is to disseminate the E-FTDT instrument that has been developing to be used as an evaluation instrument in
measuring the level of conception of prospective physics teacher students on the concept of force. This process was carried out at
the large-scale trial stage with 36 MCGF respondents. The analysis of the results of this stage is guided by the modification of the
conception level categories as in Table 2 below [29].
Table 2. Modification of the conception level category Answer Combination
Description Code Tier-1 Tier-2 Tier-3 Tier-4
Benar CRI > 2,5 Benar CRI > 2,5 Understand the concept well PK
Benar CRI > 2,5 Benar CRI < 2,5
Understanding the concept but not sure PKKY Benar CRI < 2,5 Benar CRI > 2,5
Benar CRI < 2,5 Benar CRI < 2,5
Benar CRI > 2,5 Salah CRI > 2,5
Understanding the concept but not intact PKTU
Benar CRI > 2,5 Salah CRI < 2,5
Benar CRI < 2,5 Salah CRI > 2,5
Benar CRI < 2,5 Salah CRI < 2,5
Salah CRI > 2,5 Benar CRI > 2,5
Salah CRI > 2,5 Benar CRI < 2,5
Salah CRI < 2,5 Benar CRI > 2,5
Salah CRI < 2,5 Benar CRI < 2,5
Salah CRI > 2,5 Salah CRI > 2,5 Misconception M
Salah CRI > 2,5 Salah CRI < 2,5
Don't understand the concept TPK Salah CRI < 2,5 Salah CRI > 2,5
Salah CRI < 2,5 Salah CRI < 2,5

International Journal of Scientific and Research Publications, Volume 10, Issue 1, January 2020 442
ISSN 2250-3153
http://dx.doi.org/10.29322/IJSRP.10.01.2020.p9769 www.ijsrp.org
Answer Combination Description Code
Tier-1 Tier-2 Tier-3 Tier-4
There is a combination of answers that
are not appropriate. Cannot be encoded TDK
CRI scale used is based on a scale according to Table 3 below [28].
Table 3. CRI Scale
Scale Category Code
0 Totally Guess Answer BBT
1 Almost Guess AT
2 Not Sure TY
3 Sure Y
4 Almost Sure AY
5 Certain SY
III. RESULT AND DISCUSSION
1. Define In this stage of the discussion with the supervisor obtain information about physics teaching. In the classroom as well
as the characteristics of physics student teachers who will serve as the respondent in a limited test. Based on these discussions shows that learning in the classroom generally been going well in which a student equipped with the physic sciences and science education. But they rarely do an evaluation of the level of conception owned the physics student teachers.
The results of the discussion also showed that student teachers of physics the most suitable as the respondents are students who will conduct teaching practice in schools that practice VI semester students. In addition to the knowledge of physics, especially on subconcepts particle kinematics have been obtained on the basic physics course, they also provided academic about education/teaching and have made micro-teaching practice as a first step before plunging into the field directly. so that if after the tests are limited and there is an indication that the student does not understand the concept or even occur misconceptions will be immediate remedial action.
2. Design Before development, the initial design of the instrument can be seen in Figure 1 below.
Instrumental Identity
Identity of Respondents
Work instructions
Question to – n
Multiple selected items in question to – n
A. (Answer choices 1)
B. (Answer choices 2)
C. (Answer choices 3)
D. (Answer choices 4)
E. (Answer choices 5)
Figure 1. Initial design of diagnostic tests before development
After operating through a defining phase, the draft produced by advice that has been given is like Figure 2 below.
Instrumental Identity
Identity of Respondents
Work instructions
(Petunjuk Umum dan Khusus)
Question to – n
n.1 Multiple choice items
A. (Answer choices 1)
B. (Answer choices 2)

International Journal of Scientific and Research Publications, Volume 10, Issue 1, January 2020 443
ISSN 2250-3153
http://dx.doi.org/10.29322/IJSRP.10.01.2020.p9769 www.ijsrp.org
C. (Answer choices 3)
D. (Answer choices 4)
E. (Answer choices 5)
n.2 Your confidence level associated answers in Question n.1:
A. Very sure
B. Some sure
C. Sure
D. Not sure
E. Less Know
F. Really Don't Know
n.3 Your reasons are related to the choice of answers to the questions number n.1:
..................................................................................................................................................................
n.4 Your level of confidence is related to the answer choices in the number n.3:
A. Very sure
B. Some sure
C. Sure
D. Not sure
E. Less Know
F. Really Don't Know
Figure 2. Design of four-tier diagnostic test development
One form of a question from a theme of the results of development carried out is as follows.
Figure3. The first-tier problem page is in the form of verbal representation
This page shows a way of delivering verbal shaped concept at the first tier.
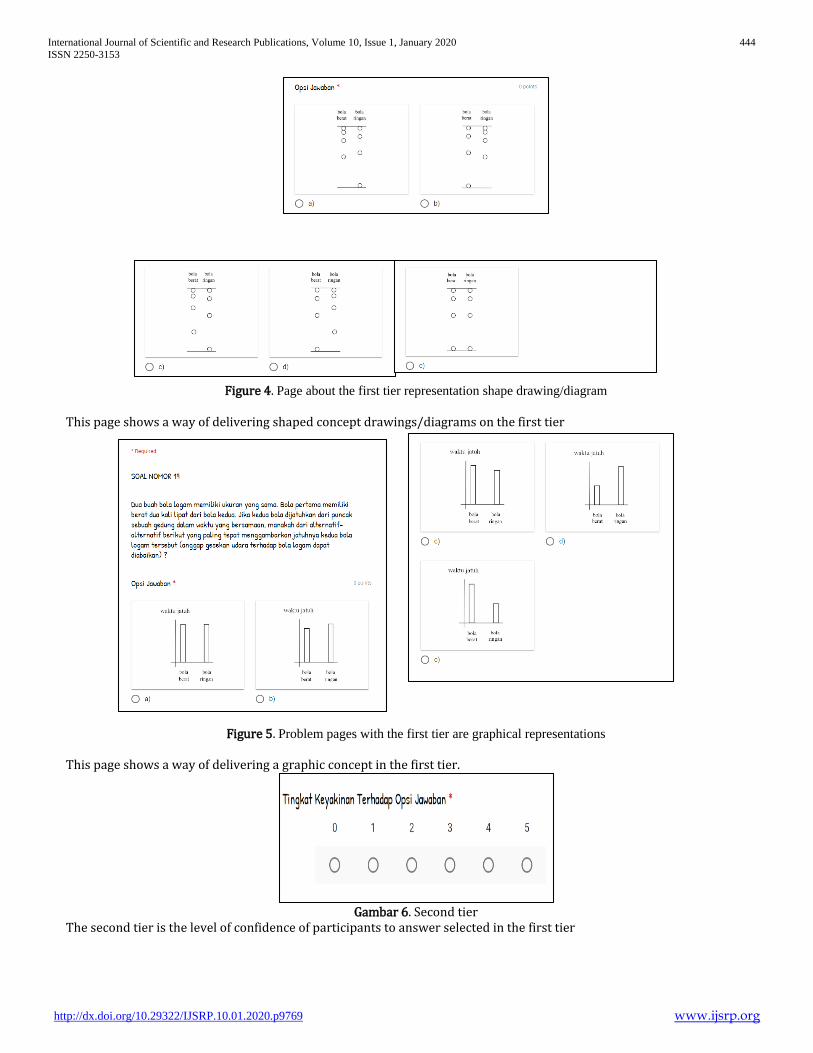
International Journal of Scientific and Research Publications, Volume 10, Issue 1, January 2020 444
ISSN 2250-3153
http://dx.doi.org/10.29322/IJSRP.10.01.2020.p9769 www.ijsrp.org
Figure 4. Page about the first tier representation shape drawing/diagram
This page shows a way of delivering shaped concept drawings/diagrams on the first tier
Figure 5. Problem pages with the first tier are graphical representations
This page shows a way of delivering a graphic concept in the first tier.
Gambar 6. Second tier
The second tier is the level of confidence of participants to answer selected in the first tier
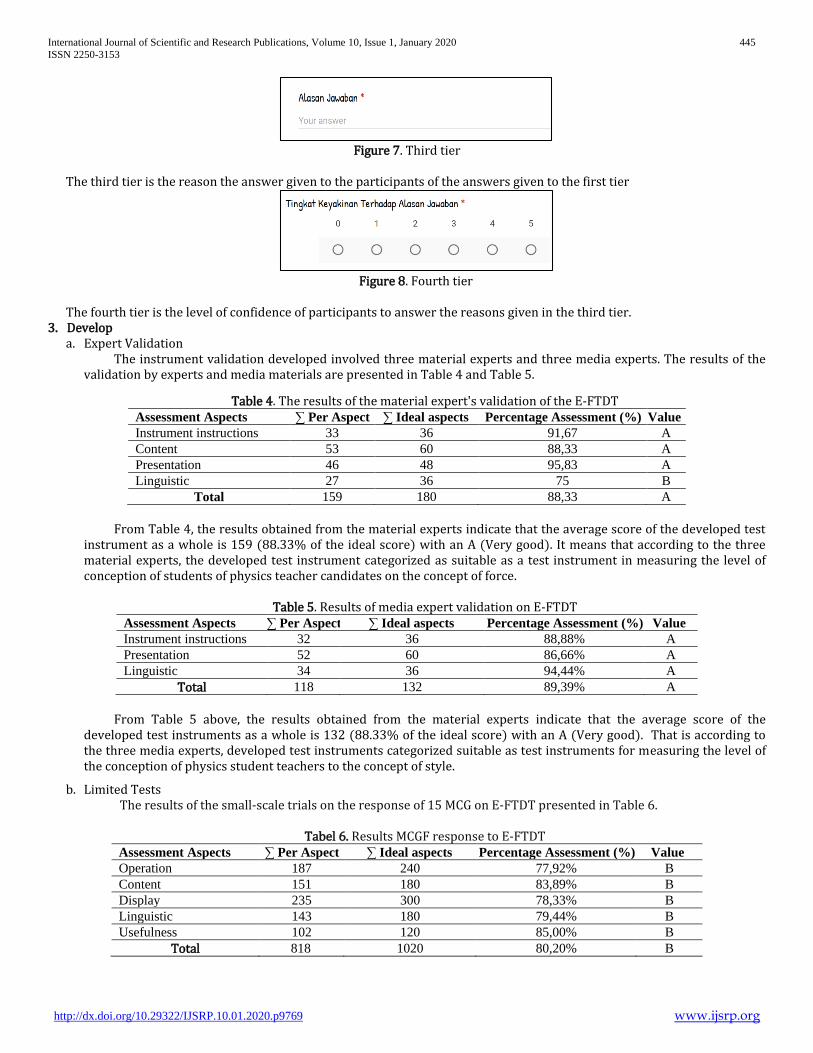
International Journal of Scientific and Research Publications, Volume 10, Issue 1, January 2020 445
ISSN 2250-3153
http://dx.doi.org/10.29322/IJSRP.10.01.2020.p9769 www.ijsrp.org
Figure 7. Third tier
The third tier is the reason the answer given to the participants of the answers given to the first tier
Figure 8. Fourth tier
The fourth tier is the level of confidence of participants to answer the reasons given in the third tier.
3. Develop a. Expert Validation
The instrument validation developed involved three material experts and three media experts. The results of the validation by experts and media materials are presented in Table 4 and Table 5.
Table 4. The results of the material expert's validation of the E-FTDT Assessment Aspects ∑ Per Aspect ∑ Ideal aspects Percentage Assessment (%) Value
Instrument instructions 33 36 91,67 A
Content 53 60 88,33 A
Presentation 46 48 95,83 A
Linguistic 27 36 75 B
Total 159 180 88,33 A
From Table 4, the results obtained from the material experts indicate that the average score of the developed test instrument as a whole is 159 (88.33% of the ideal score) with an A (Very good). It means that according to the three material experts, the developed test instrument categorized as suitable as a test instrument in measuring the level of conception of students of physics teacher candidates on the concept of force.
Table 5. Results of media expert validation on E-FTDT
Assessment Aspects ∑ Per Aspect ∑ Ideal aspects Percentage Assessment (%) Value
Instrument instructions 32 36 88,88% A
Presentation 52 60 86,66% A
Linguistic 34 36 94,44% A
Total 118 132 89,39% A
From Table 5 above, the results obtained from the material experts indicate that the average score of the developed test instruments as a whole is 132 (88.33% of the ideal score) with an A (Very good). That is according to the three media experts, developed test instruments categorized suitable as test instruments for measuring the level of the conception of physics student teachers to the concept of style.
b. Limited Tests The results of the small-scale trials on the response of 15 MCG on E-FTDT presented in Table 6.
Tabel 6. Results MCGF response to E-FTDT Assessment Aspects ∑ Per Aspect ∑ Ideal aspects Percentage Assessment (%) Value
Operation 187 240 77,92% B
Content 151 180 83,89% B
Display 235 300 78,33% B
Linguistic 143 180 79,44% B
Usefulness 102 120 85,00% B
Total 818 1020 80,20% B
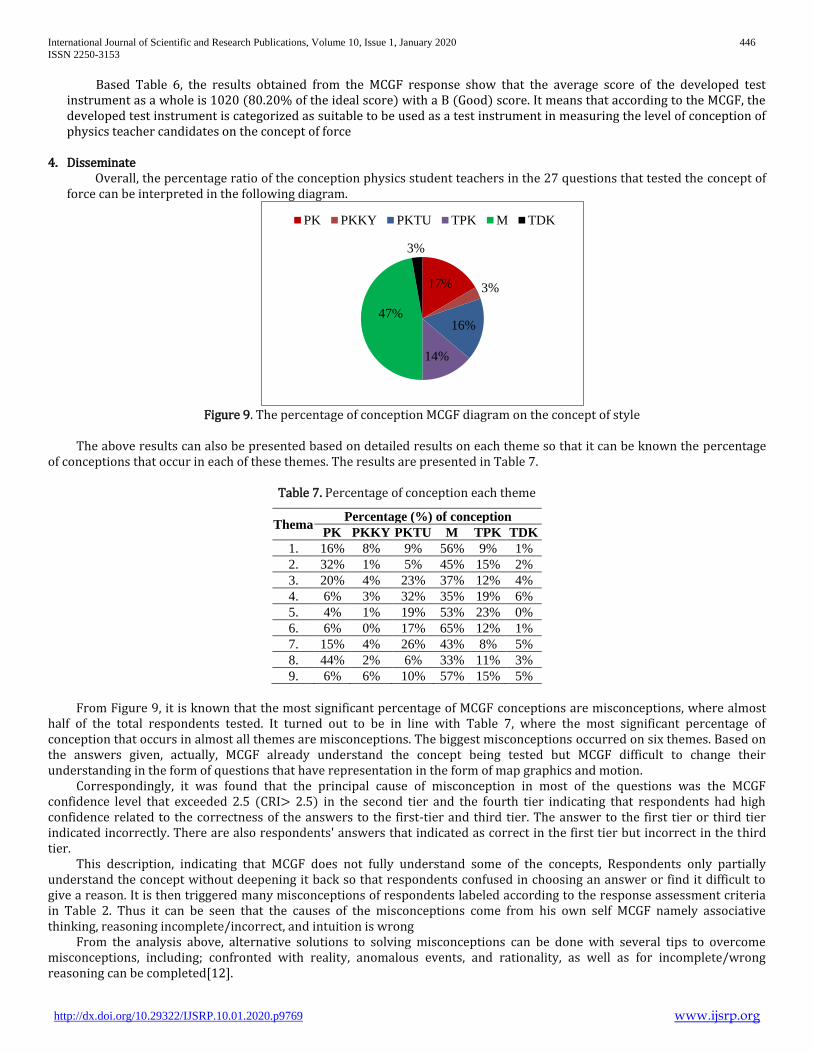
International Journal of Scientific and Research Publications, Volume 10, Issue 1, January 2020 446
ISSN 2250-3153
http://dx.doi.org/10.29322/IJSRP.10.01.2020.p9769 www.ijsrp.org
Based Table 6, the results obtained from the MCGF response show that the average score of the developed test instrument as a whole is 1020 (80.20% of the ideal score) with a B (Good) score. It means that according to the MCGF, the developed test instrument is categorized as suitable to be used as a test instrument in measuring the level of conception of physics teacher candidates on the concept of force
4. Disseminate
Overall, the percentage ratio of the conception physics student teachers in the 27 questions that tested the concept of force can be interpreted in the following diagram.
Figure 9. The percentage of conception MCGF diagram on the concept of style
The above results can also be presented based on detailed results on each theme so that it can be known the percentage
of conceptions that occur in each of these themes. The results are presented in Table 7.
Table 7. Percentage of conception each theme
Thema Percentage (%) of conception
PK PKKY PKTU M TPK TDK
1. 16% 8% 9% 56% 9% 1%
2. 32% 1% 5% 45% 15% 2%
3. 20% 4% 23% 37% 12% 4%
4. 6% 3% 32% 35% 19% 6%
5. 4% 1% 19% 53% 23% 0%
6. 6% 0% 17% 65% 12% 1%
7. 15% 4% 26% 43% 8% 5%
8. 44% 2% 6% 33% 11% 3%
9. 6% 6% 10% 57% 15% 5%
From Figure 9, it is known that the most significant percentage of MCGF conceptions are misconceptions, where almost
half of the total respondents tested. It turned out to be in line with Table 7, where the most significant percentage of conception that occurs in almost all themes are misconceptions. The biggest misconceptions occurred on six themes. Based on the answers given, actually, MCGF already understand the concept being tested but MCGF difficult to change their understanding in the form of questions that have representation in the form of map graphics and motion.
Correspondingly, it was found that the principal cause of misconception in most of the questions was the MCGF confidence level that exceeded 2.5 (CRI> 2.5) in the second tier and the fourth tier indicating that respondents had high confidence related to the correctness of the answers to the first-tier and third tier. The answer to the first tier or third tier indicated incorrectly. There are also respondents' answers that indicated as correct in the first tier but incorrect in the third tier.
This description, indicating that MCGF does not fully understand some of the concepts, Respondents only partially understand the concept without deepening it back so that respondents confused in choosing an answer or find it difficult to give a reason. It is then triggered many misconceptions of respondents labeled according to the response assessment criteria in Table 2. Thus it can be seen that the causes of the misconceptions come from his own self MCGF namely associative thinking, reasoning incomplete/incorrect, and intuition is wrong
From the analysis above, alternative solutions to solving misconceptions can be done with several tips to overcome misconceptions, including; confronted with reality, anomalous events, and rationality, as well as for incomplete/wrong reasoning can be completed[12].
17% 3%
16%
14%
47%
3%
PK PKKY PKTU TPK M TDK

International Journal of Scientific and Research Publications, Volume 10, Issue 1, January 2020 447
ISSN 2250-3153
http://dx.doi.org/10.29322/IJSRP.10.01.2020.p9769 www.ijsrp.org
IV. CONCLUSION
Based on the results of the study, it can be concluded that the developed test instrument answers both categories based on the
results of the assessment by material experts, media experts, and MCGF responses on limited trials so that it is fit to be used as a test
instrument and has the potential to measure the level of conception of prospective physics teacher candidates on the concept of force
ACKNOWLEDGMENT
The author would like thank to the Department of Master in Physics Education and Department of Physic Education Universitas
Ahmad Dahlan for all assist and support so that the study can be completed
REFERENCES
[1] Fiona & Sue. 2006. An Exploration of commont student Misconception in Science. International Education journal. 7 (4): 553-559.
[2] Kryjevskaia, M., Stetzer, M. R., & Heron, P. R. L. 2012. Student Understanding of Wave Behavior at a Boundary: The Relationships Among Wavelength,
Propagation Speed, and Frequency. American Journal of Physics. 80 (4), 339–347.
[3] Gurel, D. K., Eryilmaz, A., & cDermott, L. C. 2016. Identifying Pre-Service Physics Teachers’ Misconceptions and Conceptual Difficulties about
Geometrical Optics. European Journal of Physics. 37 (4). 1–30.
[4] Wandersee, J. H., Mintzes, J. J., & Novak, J. D. 1994. Research On Alternative Conceptions In Science. In D. L. Gabel (Eds.). Handbook of research on science
teaching and learning. 177-210.
[5] T.-W. Lin & H. Lin. 2014. Newton's Laws of Motion Based Substantial Aether Theory of the Universal Gravity Force. Journal of Mechanics. 30 (3): 315 – 325.
[6] Setyani, N.D., Cari, Suparmi, Handhika, J. 2017. Student’s concept ability of Newton’s law based on verbal and visual test. International Journal of Science and
Applied Science: Conference Series. 1 (2): 162-169.
[7] Blas, M.T., Seidel, L., Fernandes, A.S. 2010 Enhancing Force Concept Inventory Diagnostics to Identify Dominant Misconceptions in First-Year Engineering
Physics. European Journal of Engineering Education. 35 (6): 597-606.
[8] Demirci, N. 2005. A Study about Students’ Misconceptions in Force and Motion Concepts by Incorporating a Web-Assisted Physics Program. Turkish. Journal
of Educational Technology. 4 (3): 40-48.
[9] Bayraktar, S. 2006. Misconceptions of Turkish Pre-Service Teachers about Force and Motion. International Journal of Science and Mathematics Education. 7:
273-291.
[10] Liu, G., & Fang, N. 2016. Student Misconceptions about Force and Acceleration in Physics and Engineering Mechanics Education. International Journal of
Engineering Education. 32 (1A):19–29
[11] Kaniawati, I., Janeusse, N., Fratiwi, Danawan, A., Suyana, I., Samsudin, A.,, Suhendi, E. 2019. Analyzing Students’ Misconceptions about Newton’s Laws
through Four-Tier Newtonian Test (FTNT). Journal of Turkish Science Education. 16 (1): 111-122.
[12] Suparno, Paul. 2005. Miskonsepsi dan Perubahan Konsep dalam Pendidikan Fisika. Jakarta: PT Grasindo.
[13] Caleon, I., & Subramaniam, R. 2010. Development and Application of a Three-Tier Diagnostic Test to Assess Secondary Students’ Understanding of Waves.
International Journal of Science Education. 32 (7). 939–961.
[14] Suwarto. 2013. Pengembangan Tes Diagnostik dalam Pembelajaran. Yogyakarta: Pustaka Pelajar.
[15] Putra, I.O., Sujarwanto, E. & Pertiwi, N.A.S. 2018. Analisis Pemahaman Konseptual Mahasiswa pada Materi Kinematika Partikel melalui Tes Diagnostik.
Jurnal Riset dan Kajian Pendidikan Fisika UAD. 5 (1).
[16] Gurel, D. K., Eryilmaz, A., & McDermott, L. C. 2015. A Review and Comparison of Diagnostic Instruments to Identify Students’ Miscon ceptions in
Science. Eurasia Journal of Mathematics, Science and Technology Education. 11 (5): 989–1008.
[17] Yang, D. C., & Lin, Y. C. 2015. Assessing 10 to 11 Year-Old Children’s Performance and Misconceptions in Number Sense Using a Four-Tier Diagnostic Test.
Educational Research. 57 (4): 368 –388.
[18] Zulfikar, A., Samsudin, A. & Saepuzaman, D. 2017. Pengembangan Terbatas Tes Diagnostik Force Concept Inventory Berformat Four-Tier Test. Jurnal Wahana
Pendidikan Fisika. 2 (1). 43-49. ISSN: 2338-1027.
[19] Diani, R., Alfin, J., Anggraeni,Y.M., Mustari, M., Fujiani, D. Four-Tier Diagnostic Test With Certainty of Response Index on The Concepts of Fluid. Journal of
Physics: Conf. Series.
[20] Annisak, W., Astalini. & Pathoni H. 2017. Desain Pengemasan Tes Diagnostik Miskonsepsi Berbasis CBT (Computer Based Test). Jurnal EduFisika. 2 (1). [21] Himah, F., Sudarti. & Subiki. 2016. Pengembangan Instrumen Tes Computer Based Test Higher Order Thinking (CBT-HOT) pada Mata Pelajaran Fisika di
SMA. Jurnal Pembelajaran Fisika. 5 (1): 89-95.
[22] Mardiana, T., & Purnanto, A.W. 2017. Google Form Sebagai Alternatif Pembuatan Latihan Soal Evaluasi. The 6th University Research Colloquium. 183-188.
[23] Sianipar, Anton Zulkarnain. 2019. Penggunaan Google Form Sebagai Alat Penilaian Kepuasan Pelayanan Mahasiswa. Journal of Information System, Applied,
Management, Accounting, and Research. 3 (1): 16-22.
[24] Azmina, B., Solihah, M., Guritno, A. 2017. The University Students’ Perception of Online Examination Using Google Form. Jurnal Britania. 1 (1): 120-135.
[25] Nieminen, P., Savinainen, A., Viiri, J. 2010. Force Concept Inventory-Based Multiple-Choice Test For Investigating Students’ Representational Consistency.
Physical Review Special Topics - Physics Education Research. 6 (2)
[26] Hestenes, D., Wells, M., Swackhamer, G. 1992. Force Concept Inventory. The Physics Teacher. 30.
[27] Hasan, S., D. Bagayoko, D., Kelley, E. L., 1999. Misconseptions and the Certainty of Response Index (CRI). Physics Education. 34 (5): 294-299.
[28] Tayubi, Y.R. 2005. Identifikasi Miskonsepsi Pada Konsep-Konsep Fisika Menggunakan Certainty of Response Index (CRI). Jurnal Mimbar Pendidikan. 24 (3).
[29] Hakim, A., Liliasari. & Kadarohman, A. 2012. Student Concept Understanding of Natural Products Chemistry in Primary and Secondary Metabolites Using the
Data Collecting Technique of Modified CRI. International Online Journal of Educational Sciences. 4 (3). 544-553.
[30] Sugiyono. 2015. Metode Penelitian Pendidikan (Pendekatan Kuantitatif, Kualitatif, R&D). Bandung: Alfabeta.
[31] Thiagarajan, S., Semmel, D. S. & Semmel, M. I. 1974. Instructional Development for Training Teachers of Expectional Children. Minneapolis, Minnesota:
Leadership Training Institute/Secial Education, University of Minnesota.
[32] Zulham, M. & Sulisworo, D. 2016. Pengembangan Multimedia Interaktif Berbasis Mobile dengan Pendekatan Kontekstual pada Materi Gaya. Jurnal Penelitian
Pembelajaran Fisika. 7. 132-141.
AUTHORS
First Author – Wisnu Yudha Prawira, Student, Universitas Ahmad Dahlan, Email. [email protected]
Second Author – Suparwoto, Lecture, Universitas Ahmad Dahlan, [email protected]
Third Author – Yudhiakto Pramudya, Lecture, Universitas Ahmad Dahlan, Email. [email protected]

International Journal of Scientific and Research Publications, Volume 10, Issue 1, January 2020 448
ISSN 2250-3153
http://dx.doi.org/10.29322/IJSRP.10.01.2020.p9769 www.ijsrp.org
Fourth – Ishafit, Lecture, Universitas Ahmad Dahlan, Email. [email protected]
Correspondence Author – Wisnu Yudha Prawira, Email. [email protected]

International Journal of Scientific and Research Publications, Volume 10, Issue 1, January 2020 449 ISSN 2250-3153
http://dx.doi.org/10.29322/IJSRP.10.01.2020.p9770 www.ijsrp.org
Controlling Water Pollution In Batumerah Village Ambon City
FAUZIA RAHAWARIN
Lecturer in the Faculty of Sharia and Islamic Economics,
State Islamic Institute Ambon-Indonesia
DOI: 10.29322/IJSRP.10.01.2020.p9770 http://dx.doi.org/10.29322/IJSRP.10.01.2020.p9770
ABSTRACT: The main problem in this study is the management of water quality on the Batu Merah River Pollution Level. Declining water quality will reduce the usability,
usufruct, productivity, carrying capacity, and carrying capacity of water sources which in turn will reduce the wealth of natural resources. The research method used was a Field
Research study conducted at the Ambon City Environmental Agency and Ambon Batu village residents. Using primary and secondary data, the method of data collection is by
observing, documenting and interviewing. By using descriptive analysis and by using a qualitative method that is to find a concrete picture of water quality management of the
Batu Merah River Pollution Level.
The research method used was a Field Research study conducted at the Ambon City Environmental Agency and Ambon Batu village residents. Using primary and secondary data,
the method of data collection is by observing, documenting and interviewing. By using descriptive analysis and by using a qualitative method that is to find a concrete picture of
water quality management of the Batu Merah River Pollution Level.
Based on the results of the study, it can be concluded that the efforts to control the Ambon Batu Merah river water pollution carried out by the Ambon City Environmental and
Waste Management Office are to increase inventory and identification of water pollutant sources, improve waste management, determine the capacity of pollution loads, increase
knowledge and community participation in waste management, improve supervision of wastewater disposal, improve monitoring of river water quality.
Keywords: Control, Water Pollution, River
I. INTRODUCTION
Water is a natural resource that is very necessary for the survival of organisms.1 Humans use water to meet various needs such as household, agricultural, industrial and
others. The role of water for human life is very important, so that great attention is needed so that the quality of the water source is maintained. Water as a component of the
environment will affect and be influenced by other components. Poor quality water will result in bad environmental conditions that will affect the health and safety conditions of
humans and other living things. Declining water quality will reduce the usability, usufruct, productivity, carrying capacity, and carrying capacity of water sources which in turn
will reduce the wealth of natural resources. The river is the most important water provider for humans. With this being the most important water provider, it has a negative impact
on rivers. The negative impact that occurs in rivers is in the form of water pollution caused by human activities. Activities commonly carried out by humans include disposing of
trash and disposing of industrial waste directly into the river that can have an impact on aquatic organisms. Water pollution is indicated by a decrease in quality to a certain level
that causes water to not be able to function in accordance with its purpose. What is meant by a certain level above is the water quality standard that is set and serves as a
benchmark to determine the occurrence of water pollution, it is also a directive about the level of water quality that will be achieved or maintained by each water pollution control
work program.
various efforts to control environmental pollution in Indonesia, carried out by strengthening sanctions and expanding the range of regulations on environmental pollution
with the birth of Law Number 32 of 2009 concerning Environmental Protection and Management, Government Regulation Number 82 of 2001 concerning Management of Water
Quality and Water Pollution, Government Regulation Number 27 of 2012 concerning Environmental Permits, Government Regulation Number 101 of 2014 concerning
Management of Hazardous and Toxic Waste, as well as other regulations concerning the control of environmental pollution.
Efforts to control water pollution are regulated in PP RI No. 82 of 2001 concerning Management of water quality and control of water pollution, in Article 1 paragraph 9 PP
No. 82 of 2001 is a measure of the limit levels of living things, energy, or components that exist or must be present and / or pollutant elements that exist in water.2 Water quality
criteria for each class are listed in appendix PP RI No.81 of 2001.3 Article 1 point 11 PP RI No.82 of 2001 formulates the definition of water pollution, or the inclusion of living
things, substances, energy, and / or other components in water by human activities, so that the quality of water drops to a certain level that causes water to not function according
to its purpose. Article 1 point 12 PP RI No. 82 of 2001 formulates the definition of pollution load, namely: the amount of a pollutant element contained in water or wastewater.
Article 1 point 13 formulates the definition of the capacity of the pollution load, namely: The ability of water in a water source to receive input from the pollution load without
causing the water to become polluted4
According to Government Regulation of the Republic of Indonesia Number 82 Year 2001 regarding water quality management and water pollution control, it is stated in
Article 8 that the classification and criteria for water quality are applied into 4 (four) classes,5 namely: a) First Class: Water intended for use can be used for raw water drink and or
other purposes that require water quality that is the same as those uses, b) Class Two: Water intended can be used for water recreation facilities, freshwater fish farming, animal
husbandry, water for irrigating crops and or other purposes which are the same as the uses c) Class Three: Water intended for use can be used for culturing freshwater, water
husbandry to irrigate planting and or other purposes similar to these uses, d) Class Four: Water intended can be used to irrigate other crops and or other uses with these uses.
Water pollution and forms of activities carried out by humans such as disposing of waste that can mention environmental stress can have a harmful effect on individuals,
populations, communities and ecosystems. Over time the community will be dominated by species that can live superior, stable and independent in it. This whole process is called
succession, while communities that have achieved stability are called communities that have reached a peak or climax.6 There are six levels of water pollution effects in
accordance with the level of danger they cause:7 a) Class 1: aesthetic disturbances (smell, taste, scenery), b) Class 2: disruption or damage to property, c) Class 3: disruption of
animal life and plants, d) Class 4: disturbance to human health, e) Class 5: disturbance to the human reproductive system and gentica, f) Class 6: Major ecosystem damage. To
prevent diseases from arising from water pollution, the quality of water bodies must be maintained in accordance with water quality standards. The water quality of the Batu
Merah river can be determined by carrying out certain tests of the water. The usual tests are chemical and physical tests. Water quality can be expressed by several parameters
namely physical parameters (temperature, turbidity, dissolved solids and so on), chemical parameters (PH, BOD, COD, DO).
According to Effendi Waters that have BOD values of more than 10 mg / Liter have experienced pollution.8 The increase in BOD value in river water from upstream to
downstream shows that the Batu Merah River in Ambon has experienced pollution, especially in the downstream area. The level of water pollution in the Batu Merah river in
Ambon downstream is classified as high and is classified as a bad water category. This refers to Salmin's opinion that a water with a low level of pollution and can be categorized
as good water, the biochemical oxygen content (BOD) ranges from 0-10 ppm.9
Furthermore it is said that the presence of organic material in water can come from nature or household and industrial activities.10 COD values in uncontaminated waters are
usually less than 20 mg / Liter, and waters that have high COD are undesirable for fisheries and agriculture.11 Pollution does not only depend on the form of pollutants, but also
depends on the intended use of the water. The entry of pollutants into the river in Batu Merah can change the physical and chemical conditions of the environment, thereby
changing the diversity of river water communities. Because the species that exist in the environment are not all tolerant of the stresses of the environmental conditions, but rather
have their own tolerance limits and industrial waste discharged into the river without regard to the Environmental Impact Analysis (AMDAL).
Some industries that dispose of industrial waste in places that are still used by the community such as land surface and river flow. Though the river has a vital function in
relation to ecology, the river and its banks are usually a habitat that is very rich in flora and fauna as well as a barometer of the ecological conditions of the area. An unspoiled
river can function as a natural place that will increase or maintain the oxygen content of water in a river. The source of water pollution is mainly caused by human activities and is
triggered by population growth. Water pollution is increasing along with industrial growth. The government has determined that industrial waste cannot be released into the waters
if it does not meet a standard. That is, the industry must build and operate the WWTP. But in reality, it is often violated and ignored.
II. RESEARCH METHODS
1 Agoes Soegianto, Freshwater Ecology, (Surabaya: Publishing and Printing Center (AUP), 2010), p.44 2 RI Regulation No.82 of 2001 concerning Management of Water Quality and Water Pollution Control 3 Takdir Rahmadi, Environmental Law, (PT Raja Grafindo Persada: Jakarta), p.125 4 Ibid, 126 5 PP RI No. 82 of 2001 6 Ibid, p.49 7 Agoes Soegianto, Freshwater Ecology (Surabaya: Aup Publishing and Printing Center, 2010), p.48 8 Effendi H, Quality Study for Water Resources and Environmental Management, Fifth Printing (Yogyakarta: Kanisuis), h. 20 9 Salmin, Dissolved Oxygen (Do) and Biological Oxygen Demand (BOD) as one indicator to determine the quality of the waters. ISSN 01216-1877, Osema, Volume XXX, Number 3, 2005. h. 21 10 Effendi, H. Op.cit., H. 30 11 Ibid, h. 39

International Journal of Scientific and Research Publications, Volume 10, Issue 1, January 2020 450 ISSN 2250-3153
http://dx.doi.org/10.29322/IJSRP.10.01.2020.p9770 www.ijsrp.org
The method used in this study is empirical juridical research with the nature of descriptive research that uses primary and secondary data sources with library research
techniques using primary legal materials, secondary legal materials and tertiary legal materials. Primary legal materials are legal materials whose contents are related to
government regulations or other institutions that have authority. Secondary legal sources are materials in the form of books and other printed materials, as well as software, which
are the needs of this research.
III. RESULTS AND DISCUSSION
1. The Role of the Ambon City Environmental and Waste Management Office
The Office of Environment and Waste of Ambon City is an element of implementing regional autonomy in the environmental field. The Ambon City Environment and
Waste Management Agency was formed based on Ambon City Regulation Number 4 of 2016 concerning the Establishment and Composition of the Ambon City Regional
Apparatus, Ambon Mayor Regulation Number 38 of 2016 concerning the Organization and Work Procedure of the Ambon City Service. Regarding the role related to the main
tasks and functions that must be carried out by regional apparatus organizations as public organizations of the Ambon City waste and environmental agency that have the
following basic tasks and functions: a) The task of the Ambon city environmental office has the main task of carrying out the formulation and implementation of policies in the
field of environment and solid waste, b) Its function is to carry out the tasks as mentioned above, then the Ambon City environmental and waste service has functions: Formulation
of technical policies on government affairs in the field of environment and waste, implementation of policies in the field of environment and waste, implementation of evaluation
and reporting in the field of environment and solid waste, the implementation of Administrative Services; and the implementation of other functions provided by the Mayor in
relation to his duties and functions.
Based on Ambon Mayor Regulation No. 38 of 2016 concerning the Organization and Work Procedure of the Ambon City Office consisting of: 121) The Main Duties of the
Ambon City Environment and Solid Waste Office carry out the preparation and implementation of policies in the field of environment and waste. 2) Ambon City Environment and
Solid Waste Office Has the function: a) Formulation of technical policies on government affairs in the field of environment and waste b) Implementation of policies in the field of
environment and waste c) Implementation of evaluation and reporting in the field of environment and waste d) Implementation Service Administration; and e) Performing other
functions provided by the Mayor in relation to his duties and functions. 3) Organizational Structure of the Ambon City Environmental and Waste Service Office consists of:
Secretariat of the Environmental and Waste Service Office covering: a) Personnel and Public Subdivision, b) Financial and Asset Subdivision, c) Planning Subdivision.
The fields consist of: 1) Environmental Management, including: a) Inventory section, management plan, environmental monitoring (RPPLH) and strategic environmental
study (KLHS), b) Environmental Impact Assessment Section, and c) Maintenance Section environment and parks, 2) Waste Management, including: a) Waste reduction section, b)
Waste management section, c) Transportation and waste equipment section. 3.) The Field of Environmental Pollution and Damage Control includes; a) Environmental monitoring
section, b) Environmental planning and B3 waste section (Hazardous and toxic materials, c) Environmental damage section. 4) Environmental Management and Capacity Building
Sector includes: a) Section for complaints and settlement of environmental disputes, b) Section for environmental law enforcement, c) Section for enhancing the capacity of
environmental law. 4). The work tasks of the Office of the environment and solid waste include;
a) Secretariat, the Secretariat has the task of assisting the head of the environmental and waste department in the formulation of policies and administrative coordination of the
implementation of environmental and waste service tasks and administrative services.
b) Head of Personnel and General Subdivision, has the task of carrying out part of the secretariat of the environmental and waste service department in preparing staffing and
general policy materials in the environment and waste service department.
c) The Head of the Sub-Division of Finance and Assets has the task of carrying out part of the duties of the secretariat of the environmental and waste department in preparing
financial policy materials and regional assets in the environment and waste service department.
d) The Head of the Planning Subdivision carries out part of the duties of the secretariat of the environmental and waste department in preparing planning policy materials,
preparation of programs and activities as well as evaluation in the environment and waste service department.
The Head of the Environmental Management Division has the task of carrying out the preparation of policy materials and the coordination of sub-governmental government
planning in the area of environmental management. The Section Head for inventory, management plans, environmental monitoring (RPPLH) and strategic environmental studies
(KLHS) has the following tasks: 1) Inventory data and information on natural resources; 2) Preparing RPPLH documents; 3) Coordinate and synchronize the loading of RPPLH in
RPJP and RPJM; 4) Monitor and evaluate the implementation of the RPPLH; 5) Determine the carrying capacity and capacity of the environment; 6) Carry out coordination of
spatial planning based on carrying capacity and environmental capacity; 7) Arranging environmental economic instruments (gross domestic income (GDP) and green regional
gross domestic income (GRDP), disincentive incentives mechanism, environmental funding); 8) Carry out other tasks given by the head of the field of environmental governance
related to the tasks and functions.
The Head of the Environmental Impact Assessment Section has the following tasks: 1) Coordinating the preparation of environmental pollution and / or damage prevention
instruments (Amdal.UKL-UPL, environmental permit, environmental audit and environmental risk analysis), 2) Assessing environmental documents (AMDAL and UKL / UPL);
3) Arranging a transparent environmental document review team (appraisal commission, expert team and consultant); and 4) Carry out other tasks given by the Head of the
Division of Environmental Arrangements related to their duties and functions.
The Section Head of environmental maintenance and parks has the following tasks: 1) Implement protection of natural resources; 2) Carry out preservation of natural
resources; 3) Carry out sustainable use of natural resources; 4) Carry out the reserve of natural resources; 5) Implement mitigation and adaptation measures for climate change; 6)
Carry out an inventory of Greenhouse Gases (GHG) and compile profiles of GHG emissions; 7) Carry out biodiversity conservation; 8) Establish policies and implement
conservation, sustainable use and control of biodiversity damage; 9) Carry out monitoring and supervision of the implementation of biodiversity conservation; and 10) Carry out
other tasks given by the Head of Environmental Planning related to their duties and functions. The Head of the Waste Management Division has the task of carrying out the
preparation of policy materials and coordinating the planning of sub-government affairs in the field of waste management.
The head of the waste reduction section has the following tasks: Compile district / city level waste management information, Determine waste reduction targets and priority
types of waste for each specified period of time; Formulate waste reduction policies; Carry out fostering restrictions on landfill waste to producers / industries; Carry out fostering
the use of raw materials for production and packaging that can be broken down by natural processes; Carry out guidance on recycling of waste; Provide waste recycling facilities;
Carry out guidance on the reuse of waste from products and product packaging; and Carry out other tasks given by the Head of Waste Management in relation to their duties and
functions.
Section Head of solid waste handling has the tasks: Formulating waste management policies in the city; Coordinate waste sorting and collection; Provide waste handling
facilities; Carrying out levies on waste management services; Determine the location of TPS, TPST and TPA garbage; Supervise the final processing site with an open dumping
disposal system; and Carry out other tasks given by the Head of Waste Management in relation to their duties and functions.
Section Head of transportation and waste equipment has the following tasks: Coordinate the transportation and final processing; Arranging the transportation of waste
from TPS to TPA; To provide guidance to the transportation of municipal waste; Establish waste transportation routes / routes including public / public demand, the results of
community service as well as the transportation of rubbish and sediment deposits in channels and rholes; Carry out control of spatial use of urban areas and strategic areas, compile
zoning regulations as guidelines for controlling spatial use of cities and form institutions tasked with carrying out control of spatial use of cities; Carry out supervision, monitoring
and evaluation of the implementation of municipal waste transportation; and Carry out other tasks given by the Head of Waste Management in relation to their duties and
functions. Head of Environmental Pollution and Damage Control Division.
The Head of the Pollution and Environmental Damage Control Division has the task of carrying out the preparation of policy materials and coordinating the planning of
sub-government affairs in the field of pollution control and environmental damage. The Section Head of environmental monitoring has the following tasks: Carry out water quality
monitoring; Carry out air quality monitoring; Carry out soil quality monitoring; Carry out coastal and marine quality monitoring; Determine environmental quality standards;
Prepare an environmental monitoring workshop (environmental laboratory), and carry out other tasks given by the Head of Environmental Pollution and Damage Control Division
related to their duties and functions.
Section Head of environmental planning and B3 waste (Hazardous and toxic substances have the following tasks: Carry out the formulation of technical policies to control
environmental pollution and B3 waste; Carry out guidance on the control of environmental pollution and B3 waste; Carry out monitoring of sources of institutional and non-
institutional pollutants; Carry out recovery and control of pollution and pollution the environment and B3 waste; Carry out the formulation of a policy for the temporary storage of
B3 waste in a district of the city, and carry out other tasks given by the Head of Environmental Pollution and Damage Control Division related to their duties and functions.
Section Head of environmental damage has the task: Determine the criteria for environmental damage; Carry out environmental damage monitoring; Carry out mitigation
of environmental damage; Carry out environmental damage recovery; and Carry out other tasks given by the Head of Environmental Pollution and Damage Control Division
related to their duties and functions. The head of the area of structuring and enhancing environmental capacity has the task of carrying out the preparation of policy materials and
coordinating the planning of sub-government affairs in the field of structuring and enhancing environmental capacity.
The Section Head of complaints and settlement of environmental disputes has the following tasks: To formulate a policy on how to provide complaints and settle public
complaints; Facilitating the receipt of complaints on businesses or activities that are not in accordance with the environmental protection and management permit; Carry out a
review and verification of complaints; Make recommendations for the follow-up on the results of verification of complaints; Carry out technical guidance, monitoring and
reporting of the results of follow-up complaints; Settling environmental disputes both outside the court and through the court; Carry out socialization on complaints procedures;
Develop an information system for the reception of public complaints about businesses or activities that are not in accordance with the environmental protection and management
permit; and Carry out other tasks given by the Head of the Division of Environmental Management and Capacity Building related to their duties and functions.
The head of the environmental law section has the following tasks: To formulate a supervisory policy for businesses and / or activities that have environmental permits and
environmental protection and management permits; Carry out supervision of the recipient of environmental permits and environmental protection and management permits; Carry
out follow-up supervision of recommendations on the evaluation results of the recipient of environmental permits and environmental protection and management permits; Carry
out guidance and supervision of regional environmental supervisory officers; Form a coordination and monitoring team for the enforcement of civil rights; Carry out enforcement
12 Ambon Mayor Regulation Number 38 of 2016 concerning the Organization and Work Procedures of the Ambon City Service

International Journal of Scientific and Research Publications, Volume 10, Issue 1, January 2020 451 ISSN 2250-3153
http://dx.doi.org/10.29322/IJSRP.10.01.2020.p9770 www.ijsrp.org
of individuals for violations of environmental protection and management; Carry out investigations on cases of environmental violations; and Carry out other tasks given by the
Head of the Division of Environmental Management and Capacity Building related to their duties and functions.
The head of the environmental legal capacity building section has the following tasks: To formulate policies on the recognition of the existence of indigenous and tribal
peoples, local wisdom or traditional knowledge and rights of local wisdom or traditional knowledge and rights of the MHA related to environmental protection and management;
Carry out the identification, verification and validation and determination of recognition of the existence of indigenous peoples, local wisdom or traditional knowledge and the
right of local wisdom or traditional knowledge and rights of the MHA related to environmental protection and management; Establish customary land which is the existence of the
MHA, local wisdom or traditional knowledge and the right of local wisdom or traditional knowledge and rights of the MHA related to environmental protection and management;
Carry out dialogical communication with the MHA; Form a committee for the recognition of indigenous and tribal peoples; Compile data and information about the MHA profile,
local wisdom or traditional knowledge related to environmental protection and management; and Carry out other tasks given by the Head of the Division of Environmental
Management and Capacity Building related to their duties and functions.
Referring to the duties and principal of the Ambon City Environmental and Waste Department as explained above, as a part of the public organization it is expected to be
able to carry out its role by carrying out its main tasks and functions in the environmental field as stipulated in the legislation so that it can meet community expectations of the
role of the environmental service in preventing and overcoming environmental problems.
2. Efforts to Control Water Pollution in the Batu Merah river in Ambon
a) Water Pollution Control
Control of environmental pollution is an effort made to prevent, overcome and restore damage to the quality of the environment caused by pollution. The high density of
population housing on the banks of the Batu Merah river results in domestic and industrial waste being discharged directly into water bodies without treatment of WWTP / septic
tank, which needs to be a major concern in pollution control programs. Communities around the Batumerah river need to change their behavior regarding the use of the river so
that the river is no longer used as a landfill, awareness of compliance with applicable regulations, natural knowledge of waste management. Implementation of industrial waste
disposal regulations should be monitored for implementation and violators sentenced. Industrial waste should be processed first with sewage treatment techniques and after
meeting the quality standards for wastewater, it can be channeled into gutters or rivers. Thus a river will be created that is clean and has ecological functions.
According to local residents, DA provincial stated that ‘the government had actually issued a ban not to throw garbage into the river, but the ban was not accompanied by
strict sanctions, those who lived or boarding around the riverbanks were still determined to throw garbage in the river.13 The same thing was also conveyed by residents around the
Batumerah river with provincial R. There should be strict sanctions from the state and city governments, there must be a strict warning to boarders to prohibit their residents from
throwing garbage in the river, home industries around the village office. Mardika must be warned and given strict sanctions if he is still determined to dump garbage into the
river.14
As a result of the bad behavior of the Batumerah community which turned the Batu Merah river into a garbage bin. Garbage is dumped into the red rock river various types
of plastic waste from the community such as crackle, packaging items made of plastic and household and industrial waste. Interview with B3 Waste Pollution Control staff, Ir
Margaretha Tomasoa, said that river pollution occurs in the red stone because the community still uses the river as a landfill and there is direct disposal of industrial waste into the
river.15 Batumerah river is currently polluted by waste and industrial waste far above the quality standards determined by the government that are regulated in environmental
regulations.
A similar response from one of the residents of Provincial A from the interview results about their comfort to the environmental conditions around the Industrial factories in
the red stone that we feel disturbed by the smell of rotten and yellow waste and itching and lots of mosquitoes.16 Community activities that produce domestic wastewater
discharges as well as the presence of tofu and tempeh industries that dispose of their wastewater in the Batu Merah river will affect water quality. Water quality management is
carried out by efforts to control water pollution, namely by efforts to maintain the function of water so that the water quality meets quality standards (Azwir, 2006). A river is said
to be polluted if its water quality is not in accordance with its designation. This water quality is based on water quality standards according to river class based on Government
Regulation No. 82 of 2001 concerning Management of Water quality and Water Pollution Control.
Increasing community awareness and participation in maintaining the quality of water resources by preventing river water pollution.17 This is because the condition and
quality of the Batu Merah river water, is influenced by the input of wastewater discharges from the catchment area which is influenced by the behavior patterns of the surrounding
community. The people in this case are residents who live near the banks of the Batu Merah river. increased coordination between agencies related to water pollution control is
needed. River water pollution control strategies are prioritized on increasing the role of the community both the general public and industry in efforts to control water pollution
through community-based sanitation activities.
Based on the results of an interview with the Head of the Control and Pollution and Environmental Damage in Ambon City, various water pollution control efforts that have
been carried out by the Ambon City Environmental and Waste Management Office are to increase inventory and identification of water pollutant sources, improve waste
management, determine load capacity pollution, increase community knowledge and participation in waste management, improve supervision of waste water disposal, improve
monitoring of river water quality The same thing was also conveyed by J. Wattimena, SP Head of Regulations and Environmental Capacity Building in Ambon City that the
Pollution Control and Environmental Damage Program carried out by the Ambon City Environmental and Waste Management Office, namely: Monitoring Environmental Quality,
Supervising the Implementation of Environmental Policy, Clean Times Program, Increasing Community Participation in Control ian environment, Socialization of legislation,
Monitoring, Evaluation and Reporting.18 As well as the Role of the Department of Environment and Ambon City Solid Waste in efforts to control water pollution, namely the
provision of information, the stipulation of water pollution control policies, guidance and supervision, coordination among agencies with an interest in controlling water pollution,
applying the concept of community participation in the implementation of water pollution control activities.. Based on Article 20 of RI Regulation No. 82 of 2001 concerning
Management of water quality and water pollution control that the Government and Provincial Governments, Regency / City Governments in accordance with their respective
authorities in the context of controlling water pollution at water sources are authorized to:19 a) Determine the capacity of the pollution load ; b) Conduct an inventory and
identification of pollutant sources; c) Establish wastewater requirements for soil applications; d) Establish requirements for the disposal of wastewater to water or water sources; e)
Monitor water quality at water sources; and f) Monitor other factors that cause changes in water quality.
Tackling water pollution can be carried out starting from the introduction and good understanding by people's behavior. According to Prawirohartono (2000) changes in
people's behavior naturally, the water ecosystem can do rehabilitation "if there is pollution of water bodies. This capability has its limits, therefore efforts must be made to prevent
and overcome water pollution. To overcome water pollution, preventive efforts can be made, for example by not throwing garbage and industrial waste into rivers. The habit of
throwing garbage into the river and disembarang place should be eradicated by enforcing the rules that are applied in their respective environments consequently. Waste should be
disposed of at the designated place. Wastewater Disposal Permits to Water Sources or commonly known as Wastewater Disposal Permits (IPLC) to Water Sources are regulated in
Government Regulation No. 82 of 2001 concerning Management of Water Quality and Water Pollution Control. Obligation of Wastewater Discharge Permits to Water Sources is
a form of implementing obligations for activities / businesses to prevent and overcome water pollution, as regulated in Article 37 of Government Number 82 of 2001 concerning
Management of Water Quality and Water Pollution Control. Republic of Indonesia Government Regulation No. 82 of 2001 concerning water quality management and water
pollution control states that, water pollution is a change in the composition (composition) of water by human activities so that water quality becomes less or no longer able to
function in accordance with its designation. Water pollution occurs when there is a material or condition (for example heat) that can cause a decrease in the quality of the water
body to a certain level so that it does not meet the quality standards or cannot be used for certain purposes.
Water pollution can be caused by various things and have different characteristics such as disposal of factory waste into rivers and water pollution by garbage which can
damage river ecosystems and cause flooding. The impact of water pollution can affect changes in the structure and function of river ecosystems both animals and plants. Water
pollution and forms of activities carried out by humans such as disposing of waste that can cause environmental stress can have a harmful effect on individuals, populations,
communities and ecosystems. Over time the community will be dominated by species that can live superior, stable and independent in it. Such a process is entirely called
succession, while communities that have reached stability are called communities that have reached a peak or climax. Pollution in an ecosystem that is quite a lot will poison all
the organisms that are in it that are in it. A decrease in species diversity can also be considered a sign of pollution. Sources of water pollution can be classified in:
1. A permanent source or origin from an identifiable location (point source). Fixed sources are all waste originating from sources that can be identified and easily controlled.
Pollutants included in the fixed source include: a) originating from waste treatment areas, b) Runoff (runoff) from sanitation channels from urban areas, c) industry, d)
livestock slaughtering places.
2. Non-permanent sources (non-point sources), non-permanent sources include waste originating from land runoff, from the atmosphere and sources that are difficult to identify
and difficult to control. These pollution materials include: a) sediment runoff on land both naturally caused by human activity, b) runoff of chemicals such as fertilizers,
pesticides from agricultural areas, c) sedimentation due to mining, damd) oil spills and other hazardous materials.
Based on government regulation No. 82 of 2001 concerning water quality management and water pollution control, water quality management and water pollution control
activities are carried out in an integrated manner using an ecosystem approach. The integration is carried out through the stages of planning, implementation, observation and
evaluation. The scope of water pollution control According to the Regulation of the Minister of Environment No. 01 of 2010 includes the inventory and identification of water
13 nterview, resident of Batu Merah Village on 8 August 2019 14 Interview, Batu villagers on 9 August 2019 15 Interview, Ir Margaretha Tomasoa, 10 August 2019, B3 Waste Pollution Control staff 16 Interview, Batu Merah village residents on 8 August 2019 17 Interview, N. Ch. Risakota, S.Pt Head of Control and Pollution and Environmental Damage in Ambon City, August 6, 2019 18 Interview, N. Ch. Risakota, S.Pt Head of Control and Pollution and Environmental Damage in Ambon City, August 6, 2019. 19 RI Regulation No 82 of 2001 concerning Management of water quality and control of water pollution

International Journal of Scientific and Research Publications, Volume 10, Issue 1, January 2020 452 ISSN 2250-3153
http://dx.doi.org/10.29322/IJSRP.10.01.2020.p9770 www.ijsrp.org
pollutant sources, determination of the capacity of water pollution loads, determination of wastewater quality standards, stipulation of water pollution control policies, licensing,
monitoring of water quality, guidance and supervision and provision of information.
Strategy is a tool to achieve the goal, efforts to control water pollution require strategic planning which includes the process of analysis, formulation and evaluation of
strategies. One strategic planning model is the SWOT analysis (strengths, weaknesses, oppourtunities and threats). According to the strategy summary generated from the SWOT
analysis can be grouped into 4 (four) categories consi sting of ;20
1. SO Strategy: This strategy is carried out by using strengths (Strength) to take advantage of opportunities (Opportunity) which consists of: Increase the enforcement of
Environmental Law based on Law Number 32 of 2009, Increase leadership commitment and the availability of environmental information in order to increase the role of
Dinas Ambon City Environment in handling climate change issues and mainstreaming sustainable development.
2. ST Strategy: This strategy is carried out by using the existing strengths to face various threats, which consist of: Use the authority of the government in the field of
environment to control environmental pollution / destruction as well as forest and land fires, Expand public access to information the environment which is owned by the
Ambon City Environment Office to increase the role of the community in the protection / conservation of natural resources.
3. WO Strategy: This strategy is a step to minimize weaknesses to take advantage of existing opportunities; Increase the number of environmental quality monitoring tools and
infrastructure and the funds available to implement environmental MSS in the city of Ambon.
4. WT Strategy: This strategy is implemented with the intention of minimizing weaknesses to reduce threats. This strategy consists of: Increasing the ability of environmental
law enforcement so that it can handle the business world that violates environmental laws can be optimized, Increase infrastructure and funds available to control
environmental pollution / destruction of forest and land fires.
In this SWOT analysis of pollution control indicators are used as a basis for assessing the strengths, weaknesses, opportunities and threats in the current effort to control
water pollution. These indicators are determined based on the elements that influence the level of river pollution and the principles of pollution control. The elements used in
this analysis are: 1) The physical condition of the river, an element that explains the current environmental condition of the river with the problems faced and the potential that
exists physically, this element includes the level of water pollution. Peraian pollution, efforts to control water pollution, is an element that explains the efforts to control water
pollution that have been carried out by the government and the community, to reduce the level of water pollution; a) Monitoring water quality, b) Determination of the capacity
of water pollution load, c) Determination of wastewater quality standards, d) Preparation of WWTP, e) Inventory and identification of sources of water pollution. The attitude
and behavior of the community, is an element that explains the attitudes and behavior of the local community in efforts to control water pollution, both of which are both
supportive and hindering the success of water pollution control including; a) Disposal of industrial waste, b) Disposal of residential waste, c) Disposal of livestock waste, d)
Awareness of compliance with applicable regulations, e) Knowledge in waste treatment.
The role of the Government in efforts to control water pollution, is an element that explains the policies of the central government, provincial governments, district
governments and related agencies regarding water pollution control, both supporting and inhibiting, including: a) Licensing for disposal of wastewater from water sources, b)
Provision of information, c) Determination of water pollution control policies, d) Guidance and supervision, e) Coordination between agencies concerned in controlling water
pollution, d) Application of the concept of community participation in the implementation of water pollution control activities. Now the condition of the Batu Merah River
water is very alarming. This can be seen from the development of community activities along the Batu Merah river area and the large number of residents living along the Batu
Merah river. Pollution that occurs in the Batu Merah River Basin (DAS) due to the large number of factories dumping river waste is the main cause of the decline in the quality
of the Siak river water, not to mention household rubbish which more or less influences the destruction of the Batu Merah river ecosystem.
Management of water quality to the Batu Merah River Pollution Level that from the highest Batu Merah river water temperature was obtained in 2017 and the lowest in
2015; The highest pH was found in 2016 and the lowest in 2018; Highest TSS in 2015 and lowest in 2016; DO is highest in 2017 and lowest is 2018; Highest BOD in 2016 and
lowest in 2015; and the highest COD in 2016 and the lowest in 2018. The water quality of the Batu Merah Ambon River from 2015 to 2018 shows a significant difference.
Each measurement parameter has a difference from year to year. This is because natural activities and people experience significant changes every year.
Water quality reflects water status based on physical and chemical aspects through a periodic set of measurements. Batu Merah River is a type of periodic river that
flows through the middle of Ambon city. The high activity of the people who live around the river flow causes the river to become polluted and not suitable for the community
to function. In managing water quality and controlling water pollution, there are three possibilities for the intersection of authority, namely: (a) between agencies that have
different main tasks and functions (tupoksi); (b) between administrative regions; and (c) between Environmental Permit giver and PPLH Permit. An important point of these
three possibilities is the mechanism of coordination with agencies authorized to oversee other instruments. 21
(a) Interaction between agencies with different main functions
Although it is not directly related to monitoring activities, it is important to understand the duties of various agencies related to water pollution control. In addition to
environmental agencies under Law No. 32 of 2009, here are some agencies that have the task of influencing the control of water pollution.
Table 1
Agencies That Have Principal Tasks In Water Pollution Control
Mandate Relevant Principal Tasks Agencies
UU no. 11 of 1974 concerning
Irrigation ("Law 11/1974")
Management of water resources (water use rights)
• Drinking water supply system
• Waste water and environmental drainage management systems (including
sanitation)
• Solid Waste
• Construction of related infrastructure
with water; and
• Coordination of all arrangements for planning, technical planning,
supervision, business, maintenance, and protection and use of water and / or
water sources
Public Works
UU no. 41 of 1999 concerning
Forestry ("Law 41/1999")
• Land use management
• Management of conservation areas
• Watershed rehabilitation
Living environment*
(Now the Ministry of
Environment and Forestry)
UU no. 5 of 1990 concerning
Conservation of Biological Natural
Resources and their Ecosystems
("Law 5/1990")
Protection of species in territorial waters
• Protection of habitat in
Environmental and forestry*
(Now the Ministry of
Environment and Forestry)
UU no. 26 of 2007 concerning
Spatial Planning (Law 26/2007)
• Arrangement and supervision of spatial planning
• Implementation of spatial planning
• Coordination of spatial planning across sectors, across regions and across
stakeholders
Spatial
UU no. 25 of 2004 concerning
Development Planning Systems
(Law 25/2004)
• Coordination between development actors
• Guaranteed integration, synchronization, and policy synergy between regions,
between spaces and between times
• Consistency of planning, budgeting, implementation and supervision
• Monitoring and evaluation of the implementation of development plans
Development and Financial
Planning Agency
UU no. 18 of 2008 concerning
Waste Management ("Law
18/2008")
• Development and increase public awareness in waste management
• Technology research and development (including local specific technology),
waste reduction and handling
• Facilitating, developing and implementing waste reduction, handling and
utilization efforts
• Provision of waste management facilities and infrastructure
• Coordination between government agencies, communities and the business
world so that there is solid waste management
Environment and Public Works
Source: Guidebook for Supervision and Law Enforcement in Water Pollution
In addition to the above agencies, there are also several other relevant agencies in the field of natural resource management, but their authority still refers to the authority
above. Related sectors include: mineral and coal mining, plantations, agriculture, public infrastructure, and industry / manufacturing.
(b) Interaction between administrative regions
20 Rangkuti, F. SWOT Analysis (Jakarta: Gramedia Pustaka Utama, 2006), p.20 21 Henri Subagiyo, Handbook for Supervision and Law Enforcement in Water Pollution, (Jakarta: Indonesia Center for Environmental Law (ICEL), 2017), p.7

International Journal of Scientific and Research Publications, Volume 10, Issue 1, January 2020 453 ISSN 2250-3153
http://dx.doi.org/10.29322/IJSRP.10.01.2020.p9770 www.ijsrp.org
In principle, the supervisory authority is inherent in the authority of the permit. However, related to planning, recovery and mitigation, authority depends on the flow of
the river. The division of authority is as follows:
TABLE 2
Agencies That Have Principal Tasks In Water Pollution Control
Mandate
In the Regency / City
Inter-Regency / City
Cross-Province
Inventory and identification of water pollutant
sources (Article 20 PP No. 82 of 2001)
Regent / Mayor Governor Minister
Water quality monitoring
(Article 13 PP No. 82 of 2001)
Regent / Mayor Governor Minister
Determination of water class (Article 9 PP No. 82 of
2001)
Regent / Mayor Governor Minister
Determination of Water Quality Standards (Articles
10-12 PP No. 82 of 2001)
Regent / Mayor * Regent / Mayor * Regent / Mayor *
Establishment of DTBPA (Article 20 PP No. 82 of
2001)
Regent / Mayor Governor Minister
Determination of BMAL (Article 21 PP No. 82 of
2001)
Minister / Governor * Minister / Governor * Minister / Governor *
Determination of water pollution control policies Regent / Mayor Governor Minister
Determination of Environmental Permit (Article 47
paragraph (1) PP No. 27 of 2012)
Regent / Mayor Governor Minister
Licensing (IPLC, Waste Water Utilization Permit)
(Article 41 and article 36 PP No. 82 of 2001)
Regent / Mayor Regent / Mayor Regent / Mayor
Licensing (Injection Permit) (Permen LH No. 13 of
2007)
Minister Minister Minister
Guidance (for permit holders) (Article 43 PP No. 82
of 2001)
Giver of Permission Giver of Permission Giver of Permission
Guidance (for the community) (Article 43 paragraph
(3) PP No. 82 of 2001)
Regent / Mayor Governor Minister
Supervision (Article 71 paragraph (1) of Law No. 32
of 2009)
Giver of Permission Giver of Permission Giver of Permission
Law enforcement (Article 76 paragraph (1) of Law
No. 32 of 2009)
Giver of Permission Giver of Permission Giver of Permission
Provision of information (Article 33 PP No. 82 of
2001)
Regency / city government Provincial government Minister
Source: Guidebook for Supervision and Law Enforcement in Water Pollution
*) KET: The Minister establishes national water and wastewater quality standards; and the government can set stricter quality standards and / or add parameters.
**) KET: Authority to issue Environmental Permits based on the authority to issue Environmental Feasibility Decisions or UKL-UPL Recommendations.
For supervisory officials, the distribution of governmental authority in the context of controlling water pollution becomes important in terms of:22 1) The impact of
pollution is felt in a different administrative area (for example: in the downstream) with an administrative area that grants a waste water discharge permit and / or an
Environmental Permit (for example: in the upstream); and, 2)Government performance in the upstream administrative region will greatly influence pollution control in the
downstream (for example: related to the cumulation of pollutant sources or water discharge). In both cases, there is a possibility that complaints will be received by
environmental agencies that do not have the authority to monitor polluters / sources of impact. In the event that a complaint is received by an environmental agency that does not
have the authority to supervise pollutants / sources of impact, the agency submits follow-up recommendations to other work units or related agencies authorized to follow up on
the complaint (see Article 25 paragraph (2) Regulation of the Minister of the Environment No P22 / MenLHK / Setjen / Set.1 / 3/2017 concerning Procedures for Managing
Complaints over Suspected Pollution and / or Environmental Damage and / or Forest Damage).
(c) Interaction between the authority granting Environmental Permit and PPLH Permit
There is a difference regarding the basis for determining authority between Environmental Permits and the three types of PPLH Permits related to water pollution control
(Ivalerina, 2016) that affect their supervisory authority. What is meant by these three types of PPLH permits are IPLC, Wastewater Utilization Permit, and Injection Permit.
TABLE 3
Authority to grant Environmental Permit and PPLH Permit, Procedure, Period and Reporting
Environmental Permit
(PP No. 27 of 2012)
IPLC and Waste Water Utilization Permit
(PP No. 82 of 2001)
Injection permission
(LH Regulation No. 13 of 2007)
The authority to grant licenses is based on the
authority to evaluate AMDAL / UKL-UPL and
SKKLH, that is based on the type of business plan
or activity and its scale / magnitude.
The authority is determined based on legislation,
that is, by the Regent / Mayor.
The authority is determined based on legislation,
namely by the Minister.
Must be obtained before the business operates
(before there is a business license)
Obtained as part of the requirements for an
Environmental Permit (after the existence of an
Environmental Permit)
Obtained as part of the requirements for an
Environmental Permit (after the existence of an
Environmental Permit)
Valid as long as the Business License is valid Valid for 5 (five) years and can be extended
(unless otherwise specified in the Regional
Regulation)
Valid for 5 (five) years and can be extended
Report every 6 (six) months Report every 3 (three) months Report every 6 (six) months
Source: Guidebook for Supervision and Law Enforcement in Water Pollution
In accordance with Article 72 of RI Law No. 32 of 2009, supervision is carried out on the compliance of those responsible for the business and / or activity with respect to
Environmental Permits.23 This shows that the Environmental Permit is the object of supervision. The relationship between supervision and licensing is also regulated in RI Law
No. 30 of 2014 concerning Government Administration ("Law No. 30 of 2014"). Article 39 Paragraph (2) Letter b of Law no. 30 of 2014 states that the decision of a
Government Agency and / or Officer is in the form of a permit if the activities to be carried out are activities that require special attention and / or comply with statutory
provisions. The purpose of requiring special attention to the letter b is that every effort or activity carried out or carried out by the Citizens, in order to maintain public order, the
Government Agency and / or Officer needs to give attention and supervision.24 Based on these provisions it can be concluded that each decision in granting a permit requires
follow-up in the form of supervision
1. Enforcement of Environmental Law
Law enforcement is an effort to uphold the norms / rules and legal values that are behind the norm. The value of law is the achievement of the condition of preservation of
environmental capabilities. Enforcement of environmental law is an effort is an effort to achieve compliance with regulations and requirements in legal provisions that apply
generally and individually, through supervision and determination (or threat) of administrative, criminal and civil facilities. In general, environmental law enforcement officers
are categorized as: Police, prosecutors, judges, legal advisors, officials / agencies that have the authority to give permits (Ministry of Environment and Provincial, Regency and
22 Ibid, p.11 23 RI Law No. 32 of 2009 concerning Environmental Protection and Management 24 RI Law No. 30 of 2014 concerning Government Administration

International Journal of Scientific and Research Publications, Volume 10, Issue 1, January 2020 454 ISSN 2250-3153
http://dx.doi.org/10.29322/IJSRP.10.01.2020.p9770 www.ijsrp.org
City Government Agencies responsible for the environment). As well as parties related to environmental management such as Non-Governmental Organizations (NGOs),
communities, entrepreneurs and the journalism.25
Law enforcement as a concrete form of the application of law greatly affects the feeling of law, legal satisfaction, legal benefits, legal needs or justice individually and
socially. But because law enforcement cannot be separated from the rule of law, legal actors and the environment in which the law enforcement process occurs, it is not possible
to solve the problem of law enforcement if only glance at the law enforcement process, moreover it is more limited to the administration of justice.26
Regarding environmental law enforcement Ninik Suparni (a member of the Indonesian prosecutors association) emphasized that environmental law enforcement is an effort to
achieve compliance with regulations and requirements in general and individual legal provisions, through supervision and application in administrative, civil, criminal matters.
For this reason, law enforcement can be carried out preventively, namely law enforcement efforts to prevent environmental pollution. And can also be done in a repressive
manner, namely law enforcement efforts to take legal action to anyone who violates the applicable provisions.27
Enforcement of environmental law is closely related to the ability of the apparatus and the community's compliance with applicable regulations. In Indonesia the
regulations governing environmental protection are regulated in Law No. 32 of 2009 concerning Environmental Protection and Management. In the regulation, there are 3 ways
in which law enforcement can be done in an effort to protect the environment. include: Administrative law enforcement, criminal law enforcement, and civil law enforcement.
2. Law Enforcement on Environmental Administration
Administrative law enforcement through 2 ways, namely the way of supervision and administrative sanctions. Supervision if we see in Article 71 of Law No. 32 Year
2009, namely supervision is carried out by 2 parties, namely the government and the community. The role of government oversight in Article 71 of Law No. 32 Year 2009 is
stated to be carried out by the Governor, Mayor or Regent. In Article 71 number 2 of Law No. 32 of 2009 Stating that role can be delegated to the authorities. The role of the
authorized official is: a) Conducting monitoring, b) Requesting information, c) Making copies of documents, d) Making notes needed, e) Entering a certain place, f) Taking
photos, g) Making audio-visual recordings, h) Taking samples, i) Checking equipment, j) Checking installation, k) Stopping certain violations. While the role of the community
according to Article 70 of Law No. 32 of 2009 concerning the role of the community are: a) Social oversight, b) Providing suggestions, opinions, proposals, objections,
complaints, c) Submission of information and reports. The administrative sanctions according to Government Regulation No 27 of 2012 concerning Environmental Permits,
namely the Regional Head (Governor, Mayor and Regent) can impose administrative sanctions to those who commit violations. Sanctions given under Article 71 PP No. 27 of
2012 concerning environmental permits are: a) Written warning, b) Government coercion, c) Suspension of environmental permit, d) Revocation of environmental permit.
3. Environmental Criminal Law Enforcement
Criminal regulation which can be the basis of law enforcement for environmental law is Law No. 32 of 2009 concerning Environmental Protection and Management.
According to the provisions in the regulation, there are acts that can be criminalized by law enforcement officers. The intended legal acts are in the form of violations of the
provisions stipulated in the UUPPLH. There are at least 7 provisions that can be convicted if the provisions are violated by the parties concerned. The provisions in question are:
a) Provisions on quality standards, b) Provisions on genetic engineering, c) Provisions on Waste, d) Provisions on Land, e) Provisions on Environmental Permits, f) Provisions
on Environmental Information
4. Environmental Civil Law Enforcement
Enforcement of environmental law in the civil field can be done as an effort to prosecute losses experienced by the community due to pollution or environmental damage
and efforts to preserve environmental functions as well as effective supervision and law enforcement, so as to provide a deterrent effect on perpetrators of environmental
destruction. The enforcement effort is carried out in 3 ways, namely: a) Class Action or Community Lawsuit, Class Action or community lawsuit in regulated in Article 90 of
Law No. 32 Year 2009. The public has the right to file a group representative's lawsuit for its own interests or for the benefit of the community if it suffers a loss due to pollution
or environmental damage. A claim can be filed if there are similarities in facts or events, the legal basis, and the types of claims between group representatives and group
members. b) Organizational Rights, Organizational rights are themselves regulated in Article 92 of Law No. 32 of 2009, this right can be granted in the context of carrying out
environmental protection and management responsibilities, environmental organizations have the right to file a lawsuit in the interests of preservation of environmental
functions. The right to file a lawsuit is limited to demands for certain actions without any claim for compensation, except for real costs or expenses. An environmental
organization can file a lawsuit if it meets the following requirements: a) In the form of a legal entity, b) Affirms in its articles of association that the organization was established
for the purpose of preservation of environmental functions, c) Has carried out real activities in accordance with its articles of association for at least 2 (two) year. c) Government
Lawsuit both central and regional government, Government lawsuit rights based on Article 90 of the UUPPLH, Government agencies and regional governments responsible for
environmental matters have the authority to file compensation claims and certain actions against businesses or activities that cause pollution or damage the environment which
results in environmental losses.
Supervision and Law Enforcement are some of the tools that can be utilized in overcoming environmental problems, including water pollution. For water pollution,
especially rivers, which are not insignificant due to the contribution of businesses and/or activities, supervision and law enforcement are useful to ensure the level of compliance
of those responsible for the business and / or activity. With effective supervision and law enforcement, it is expected to have a deterrent or warning effect to those responsible for
the business and / or other activities so as not to repeat the same violation. In the framework of Law Number 32 Year 2009 concerning Management and Environmental
Protection ("Law No. 32 Year 2009"), supervision is part of the law enforcement mechanism. The main purpose of supervision is to monitor, evaluate and determine the status of
compliance with business and / or activities responsible for the laws and regulations in the field of environmental protection and management ("PPLH"), environmental
licensing, as well as environmental management and monitoring obligations in environmental documents. In relation to water quality, supervision has the following important
values: 1) ensuring the control of pollutants entering the water sources of certain pollutants (point sources) runs according to the permit, by complying with the required
conditions; and 2) verifying the accuracy of the monitoring, monitoring and monitoring information provided by the activity and / or business in the report. Water pollution
control itself is only one part of the overall water quality management framework, including efforts to prevent and control water pollution and restore water quality to ensure
water quality in accordance with water quality standards. As part of the law enforcement mechanism, supervision is downstream.
IV. CONCLUSION
From the discussion that has been presented, it is seen from the implementation of control activities carried out by the Ambon City Environment and Solid Waste Department on
liquid waste in the Batu Merah River watershed that is already good but not yet optimal. The community is also less aware of the awareness of preserving the environment,
especially in the Batu Merah River watershed. So the strategy undertaken by the Ambon City Environmental and Waste Management Office in dealing with water pollution and
water quality degradation so that river water can be utilized in accordance with its purpose and is sustainable as follows:
1. Increase inventory and identification of water pollutant sources
Inventory of sources of pollution is needed to determine the cause of the decline in water quality. This is because the source of water pollutants that will be identified will always
develop from time to time depending on the dynamics of development, economic, social and cultural growth of the local community. Inventory is carried out with the aim to
characterize pollutant streams in the environment, while identification is carried out to identify and classify types of pollutants, sources and locations and the effects of impacts
on the environment.
2. Improving waste management
Efforts to reduce pollution of liquid waste in rivers is by managing waste before being discharged into the river. Waste management can be done by making WWTPs.
3. Determine the capacity of the pollution load
Determination of pollution capacity can be used as a material for consideration and policy in determining spatial planning, giving business licenses / activities that affect water
quality both directly and indirectly. Give an environmental permit for wastewater from a water source and is used as a basis for allocating the burden obtained into water sources
from various pollutant sources so that appropriate control measures can be implemented so that the specified water quality standards can be met or the target water quality can be
achieved.
4. Increase community knowledge and participation in waste management
25 Aditia Saprillah, Textbook for Environmental Law, (Yogyakarta: CV. Budi Utama, 2016), First Printing, p. 110-111 26 Bagir Manan, Upholding the Law A Search, in the Enforcement of Justice with justice, (Jakarta: Indonesian Advocacy Association, 2009) p.52 27 Syahrul Mahmud, Indonesian Environmental Law Enforcement, p, 20

International Journal of Scientific and Research Publications, Volume 10, Issue 1, January 2020 455 ISSN 2250-3153
http://dx.doi.org/10.29322/IJSRP.10.01.2020.p9770 www.ijsrp.org
Increasing community knowledge in waste management is done by conducting socialization and training. Public awareness to maintain cleanliness and health also needs to be
improved. This is necessary to prevent the community from carrying out garbage disposal in the river or using river banks as a place for garbage disposal.
5. Improve supervision of waste water disposal
Water pollution can be minimized by monitoring the disposal of river wastewater. Supervision is carried out to ensure the implementation of the requirements stated in the
environmental permit for the disposal of river waste water and the technical requirements for water pollution control that are listed in the AMDAL or UKL / UPL documents.
The results of the implementation of supervision can be used as a reference in developing structuring or law enforcement.
6. Improve monitoring of river water quality
Efforts to monitor river water quality can be done routinely measuring river water quality parameters and checking waste generated from industrial activities that dispose of Batu
Merah river waste.
The things that can be done in conducting coaching can be in the form of: providing socialization or campaigns related to the application of legislation related to water pollution
control, providing information on technical guidelines and licensing procedures related to water pollution control; or provide information regarding the application of clean
technology to prevent water pollution.
REFERENCE
1) A. Chay. Hydrology and Management of Watersheds., Yogyakarta: Gaja Mada Press, 2004
2) Barus, T. A. Introduction to the Limnology Study on Inland Water Ecosystems, Medan: USU Press, 2004
3) Effendi H, Quality Study for Water Resources and Environmental Management, Fifth Printing, Yogyakarta: Kanisuis, 2005.
4) Eugene Odum P, Fundamentals of Ecology, Yogyakarta: Gajah Mada University Press, 1993.
5) Hanum Decomposition of Organic Material in Tofu Liquid Waste. Yogyakarta: Indonesian Islamic University. 2006
6) H. Ghufran, Water Quality Management in Aquaculture, Jakarta: Rineka Cipta, 2007
7) Irawan, Zoer'aini Djamal, Ecosystem Ecology Principles, Environment and Conservation, Jakarta: Bumi Aksara, 2012.
8) Kristanto Philip, Industrial Ecology, Yogyakarta: Andi Offset, 2004
9) Kaswinarni, F ... "Technical Study of Tofu Industry Solid and Liquid Waste Management". Thesis. Semarang: Diponegoro University's Environmental Sciences Study
Program. 2007
10) Mulia Ricki M., Environmental Health, Yogyakarta: Graha Science, 2005
11) N. H. T. Siahaan, Environmental Law and Development Ecology, Jakarta: Erlangga, 2004
12) Rahmadi Takdir, Environmental Law, Jakarta: PT RajaGrafindo Persada, 2000.
13) Soegianto Agoes, Freshwater Ecology, Surabaya: Publishing and Printing Center (AUP), 2010.
14) Salmin, Dissolved Oxygen (Do) and Biological Oxygen Demand (BOD) as one indicator to determine the quality of waters. ISSN 01216-1877, Osema, Volume XXX,
Number 3, 2005.
15) Sastrawidjaya A. Tresna, Environmental Pollution, Jakarta: Rineke Cipta, 2009.
16) Soegianto Agoes, Freshwater Ecology, Surabaya: Aup Publishing and Printing Center, 2010.
17) Wardana. Characteristics of Tofu BOD (Biochemical Oxygen Demand) Waste. Yogyakarta: Indonesian Islamic University, 2004
18) Zulkifli and Ami, BOD (Biochemical Oxygen Demand) Value, Yogyakarta: Indonesian Islamic University, 2007
19) Zulkifli, Arif. Fundamentals of Environmental Sciences, Jakarta: Salemba Teknika, 2014
20) Law No. 32 of 2009 concerning Environmental Protection and Management RI Regulation No. 82 of 2001 concerning Management of Water Quality and Water Pollution
Control.
21) Government Regulation No. 38 of 2011 concerning Rivers
22) Decree of the Minister of Environment No. 142 of 2003 regarding the Guidelines regarding the requirements and procedures for licensing and study of the disposal of
wastewater into water or water sources
23) Regulation of the Minister of Environment No. 1 of 2010 concerning the procedures for water pollution control
24) PP No. 82 of 2001 concerning Management of Water Quality and Water Pollution Control
Minister of Environment Regulation No. 19 of 2008 concerning Minimum Service Standards (SPM) for the Provincial and Regency / City Environmental Areas
25) Minister of Environment Regulation No. 20 of 2008 concerning Technical Guidelines for Implementing District / City SPM
26) Minister Regulation No. 38 of 2011 concerning Rivers
27) Decree of the State Minister for the Environment No. 115 of 2003 concerning Determination of Water Quality Status
28) Minister of Public Works Regulation No. 04 / PRT / M / 2015 concerning Criteria and Determination of River Basin Areas

International Journal of Scientific and Research Publications, Volume 10, Issue 1, January 2020 456
ISSN 2250-3153
http://dx.doi.org/10.29322/IJSRP.10.01.2020.p9771 www.ijsrp.org
Modern Reflection In Shakespeare’s Plays
Md. Abdul Qader
Lecturer, Department of English, Tarash Honours College, Tarash, Sirajgonj
DOI: 10.29322/IJSRP.10.01.2020.p9771
http://dx.doi.org/10.29322/IJSRP.10.01.2020.p9771
Abstract- William Shakespeare, the pioneer of English literary
world, is a universally famous dramatist whose creations and
literary contributions became more in the Elizabethan period than
in Jacobean age. This is why; he is identified as an Elizabethan
dramatist in English literature although he is a Renaissance and
modern thinker. Modernism is reflected in his plays to a great
extent. Shakespeare has written thirty-seven plays in his life time.
Out of them, only twenty-five plays were written in the
Elizabethan Age (1558-1603). He wrote his twelve important
plays in the Jacobean Age (1603-1625). Yet he is an Elizabethan
and not the Jacobean. However, whether he is Elizabethan or
Jacobean, he is above all modern writers. Besides, Dr. Johnson
says about the features of Shakespeare’s plays in his Preface to
Shakespeare, “Just representation in general nature” which
indicates evergreen prestige of his dramas in all literary ages
including modern age like today. So, from his life time up to the
present the atmosphere- language and theme, characters and
construction of every age is depicted in his plays and especially
the modern elements are merged with his plays. A touch of
feminism, realistic aspects, newness in plot-construction, horror
elements, treatment of depression and indecision, mental
turbulence, use of foil and vulgarism, display of domination all are
drawn like almost a modern piece of literature. In fact, the use of
above features has made Shakespeare universal and appealable for
all ages.
Index Terms- Modern, Reflection, Shakespeare, plays.
I. INTRODUCTION
o be or not to be?” That is the question that has passed over
the lips of countless actors playing Hamlet in the last four
centuries on stage and screen. It’s also a question that people in
almost every country and in any language know quite well. We
can thank playwright William Shakespeare whose reach is ever
extensive. So, Shakespeare’s works continue to resonate with each
generation. Bruce Smith in his The Cambridge Guide to the
Worlds of Shakespeare explained, “Shakespeare reveals a
different face to different cultures and different people at different
times.” When the First Folio of Shakespeare’s work was
published in 1623, seven years after his death, Ben Johnson, who
was a fellow writer, noted that “Shakespeare was ‘not of an age,
but for all time.’ That statement can be taken two ways: that the
meaning of Shakespeare’s work is always the same or that it is
always different. The second interpretation is the one that has been
borne out.” A prominent Russian critic says, “Shakespeare has
created more after God.” As a playwright, he is versatile and
contemporary and his plays have immortalized him.
Shakespeare’s dramas can be divided into three sections.
First Section: The dramas of this section were written in
1590-1600. They are 22 in number. They are Henry-VI (1st part),
Henry-VI (2nd part), Henry-VI (3rd part), Richard-III, The Comedy
of Errors, Titus Andronicus, The Taming of the Shrew, Love’s
Labour’s Lost, Romeo and Juliet, A Midsummer Night’s Dream,
The Two Gentlemen Of Verona, King John, Richard-II, The
Merchant of Venice, Henry-IV (1st Part), Henry-IV (2nd Part),
Much Ado About Nothing, Henry-V, Julius Caesar, The Merry
Wives of Windsor, As You Like It and Twelfth Night.
Second Section: The dramas of this section were written in
1601-1608. They are 11 in number. They are Hamlet (1601),
Troilus and Cressida (1602), All’s Well that Ends Well (1602),
Measure for Measure (1604), Othello (1604), Macbeth (1605),
King Lear (1605), Antony and Cleopatra (1606), Coriolanus
(1606), Timon of Athens (unfinished-1608), Pericles (in part-
1608).
Third Section: The dramas of this section were written in
1608-1613. They are Cymbeline (1609), The Winter’s Tale (1610),
The Tempest (1611) and Henry VIII (in part- 1613).
Among the above sections some plays have the issue of
recurrent elements. A deep study of Hamlet, Othello, King Lear,
As You Like, The Merchant of Venice, The Tempest, Twelfth Night,
A Midsummer Night’s Dream etc. possesses such aspects which
ensure modernity.
II. WHO WAS WILLIAM SHAKESPEARE?
William Shakespeare is widely regarded as one of the
greatest writers in the English language. He was born on or around
23 April 1564 in Stratford-upon-Avon, the eldest son of John
Shakespeare, a prosperous glover and local dignitary, and Mary
Arden, the daughter of a wealthy farmer. There are no records
of William’s education, but he probably went to King’s New
School – a reputable Stratford grammar school where he would
have learned Latin, Greek, theology and rhetoric– and may have
had a Catholic upbringing. He may also have seen plays by
the travelling theatre groups touring Stratford in the 1560s and
70s. At 18, William married Anne Hathaway, and the couple had
three children over the next few years.
What is Modernism: Modernism is a comprehensive but
vague term for a movement. It reveals a breaking away from
established rules, traditions and conventions, fresh ways of
looking at man’s position and function in the universe and many
experiments in form and style. The term, “Modern” is not
absolute. There is no suggestion in this word with which we
“T
International Journal of Scientific and Research Publications, Volume 10, Issue 1, January 2020 457
ISSN 2250-3153
http://dx.doi.org/10.29322/IJSRP.10.01.2020.p9771 www.ijsrp.org
evaluate a piece of literature. Even we cannot call writing modern
easily unless we point out its date of composition. So by the term
“modern”, we mean the contemporary writing of a writer or a
reader. For this reason, the meaning of the term is changeable.
While discussing the poetry and drama of ancient Athens,
Aristotle regards that literature as modern. Similarly, Ben Jonson
who is an English poet and dramatist wants to consider his age as
modern. In this way, contemporary literature has been regarded as
modern.
We know that Geoffrey Chaucer is a famous poet of the
Middle Age in the history of English literature. Matthew Arnold
in his The Study of Poetry says, “Chaucer is the father of modern
English poetry.” He considers his own age, the Victorian Period,
as a modern age. William Shakespeare is the Elizabethan poet and
dramatist. Dr. Samuel Johnson in his Preface to Shakespeare says,
“Shakespeare is, above all writers at least above all modern
writers….” So we can vigorously say what is modern today will
be old tomorrow.
However, Modernist literature is characterized chiefly by a
rejection of 19th-century traditions and of their consensus between
author and reader. Specifically, Modernists deliberately tried to
break away from the conventions of the Victorian era. This
separation from 19th century literary and artistic principles is a
major part of a broader goal. Modernists wished to distinguish
themselves from virtually the entire history of art and
literature. Ezra Pound captured the essence of Modernism with
his famous dictum, “Make it new!” It is believed that modernism
in English poetry has been started with the publication Profrock
and Other Observations by T.S. Eliot in 1917. Eliot was the
disciple of Ezra Pound who led many other imagists. W.B. Yeats,
W.H. Auden, Joseph Conrad, D.H. Lawrence and Virginia Woolf
led modern literature. Features of modernism are not yet set and
fixed but frustration, inner conflict, boredom, treatment of sex and
recent technology are generally common in a recent writing.
Use of Language: Shakespeare’s language runs deeply
extensive and modern. Although English language mostly came
from the Greek and the Roman, it was subsequently changed from
the anonymous up to the old, the middle and the modern literary
persons. But in his literary works, Shakespeare invented 1700
words and many phrases which are still in modern literature. For
instance, if we search the Oxford English Dictionary (OED) and
the definitive record of the English language, “Shakespeare is
often identified as the sole user or first user of a word or phrase,”
according to Charlotte Brewer who authored the guide’s chapter
on “Shakespeare and the OED.” Shakespeare is the most famous
of all Englishmen. One of the things he is famous for is the effect
he had on the development of the early modern English language.
For example, without even realizing it, our everyday speech is full
of words and phrases invented by Shakespeare. He was able to do
that because English was changing as people modernized it in their
normal work a day speech.
In Modern English we use the word “you” as both the
singular and the plural form. In Old English, thou was used for
addressing one person; ye for more than one. You was around
then, and while thou and ye were used as a subject of a clause, you
was used as the object. By the time of Early Modern English, the
distinction between subject and object uses of ye and you had
virtually disappeared, and you became the norm in all grammatical
functions and social situations. Ye had become old-fashioned and
so, when we see it in the Authorised Bible (‘Oh ye of little faith’)
we are seeing that, in spite of the fact that you may think you
understand the language in the Bible better than you do
Shakespeare, Shakespeare is more modern! Brewer also said, “The
more of Shakespeare’s words we look up, the more we discover
that, time after time, he turns out to have used language in wholly
individual ways or [more often] to have originated usages that
subsequently became established in the language,” Thus, William
Shakespeare is undoubtedly modern in using language in the
sixteenth century. He is modern in both theme and language in his
plays – tragedy, comedy and tragi-comedy.
Feminism: Feminism is a burning issue in the present world.
According to the Cambridge Advanced Learner’s Dictionary,
“Feminism is the belief that women should be allowed the same
rights, power and opportunities as men and be treated in the same
way, or the set of activities intended to achieve this state.” From
this definition, we can say that feminism is a modern term. It tells
about the belief that women should have the same rights and
chances as men. The feminist awareness emerged in the 19th
century. But it took the shape of a movement in the 20th century.
Virginia Woolf was one of the prominent writers who tried to say
in favour of women.
Shakespeare, an Elizabethan dramatist, picks out the most
powerful female characters across all of his plays. Social and
political power was entirely in the hands of the men in Elizabethan
England and particularly, well-born men. Both women and men in
the lower classes were powerless but women in the upper classes
were in a particularly unenviable position as their value was
generally reckoned to be a rich or powerful man’s path to more
riches or more power.
Cordelia in the play King Lear is the central character who
is banished by the king, her vain and foolish father for her original
love for father and truthfulness. Later, when the two older
daughters, Goneril and Regan have cruelly rejected Lear and he
lies defeated and imprisoned in a dungeon, Cordelia comforts him
and raises him up. She has helped him to learn what the bond
between a father and daughter is. She has shown great strength
throughout, and when her sisters have her hanged.
Portia in The Marchent of Venice, having no brother, had to
perform the role of a man and manage the very wealthy estate after
her father’s death. To save the life of Antonio, Portia comes
disguised as a famous young judge and shows extraordinary
qualities in delivering her judgment. Her power lies in her wisdom,
recognised by all those who do not know that she is a woman. In
a real sense she exercises power over everyone present.
Lady Macbeth in the play Macbeth is thought of as a very
strong woman. She certainly exercises power over her husband,
Macbeth, in the first half of the play, as she encourages him to
murder Duncan. She uses her sexuality; she taunts him and mocks
his lack of courage. She appeals to his sense of obligation towards
her.
Rosalind is the central character in the play, As You Like It.
She is disguised as a man throughout, until the end, and is able to
manage everyone to fit with her needs and desires. Her aim is to
turn the man she wants to marry into someone who can match her
qualities and be as strong as she is.
A touch of feminism in male dominance is peeked in his A
Midsummer Night’s Dream. In this play, we find Egeus
obstinately insisting on her daughter to marry Demetrius. He also
International Journal of Scientific and Research Publications, Volume 10, Issue 1, January 2020 458
ISSN 2250-3153
http://dx.doi.org/10.29322/IJSRP.10.01.2020.p9771 www.ijsrp.org
comes to Theseus to complain against Hermia. The duke also talks
in favour of Egeus. Thus Hermia has to face an adverse situation
to settle her own decision. Her love for Lysander does not go on
smoothly. As a woman, she feels helpless. She feels that she has
no power to decide as her own. But, like other strong female
characters in Shakespeare, Hermia stands up to her father. She
does this with logical argument and remains calm while doing it.
She then courageously runs away with her lover. Her strength lies
in her calm assertiveness and her determination to control her own
destiny rather than hand it to the men around her. In this sense, we
can say that feminism becomes one of the most important themes
in this play.
Besides, Viola in Twelfth Night, Beatrice in Much Ado
About Nothing, Juliet in Romeo and Juliet, Desdemona in Othello,
Margaret of Anjou in four history plays, all expect to practice
woman rights in their own world. They also surpass their male
counterparts with works and deeds
Realism: The plays of Shakespeare show the course of the
real world. Here in this world, the loss of a man is the gain of
another. The reveller is hurrying to his wine and the mourner to a
funeral. The malice of one is sometimes exceeded by the gaiety of
another. In this world, many good and bad actions are done and
prevented without design. The ancient poets had made a selection
among the serious and light human activities. Some of them chose
the crimes and absurdities of men. Some of them chose the lighter
incidents for composing dramas.
Parallelism and contrast is the very basis of As You Like It.
In order to compare and contrast, the playwright has dealt with
realistic elements in this play. At the outset of the play, we get a
taste of the atmosphere of the court and the city. The atmosphere
here is visited by jealousies, rivalries and antagonisms. Early in
the play, we see that Duke Frederick has usurped the dominions of
his elder brother, Duke Senior. He banishes him to the Forest of
Arden. Orlando has to come to the Forest of Arden along with old
Adam. Duke Frederick passes an order of banishment against
Rosalind, his niece. Though his daughter, Celia is deeply attached
to her, he does not hesitate to do so. Later on, he takes a stern step
against Oliver. As a result, Oliver has to flee from the city to save
him to the same forest. Such is the sordid and depressing
atmosphere of the court and the city. All those are found here are
artificial, pompous and eye-catching. No touch of nature and its
impact on man is found in the court life. We may find conspiracy,
corruption, jealousy, artificiality, villainy and pomposity in the
court life.
The Tempest is full of supernatural elements. But it is realistic
at the core. Prospero’s island is an enchanted island. And yet the
play is essentially realistic. The realistic quality of the play finds
expression in the manner in which the various characters have
been portrayed. In other words, Shakespeare’s portrayal of the
various persons in this play shows his realistic approach to his art
of drama-writing. Most of the events in the play are manipulated
by Prospero by the use of his supernatural powers. But human
nature in the play has been depicted in a perfectly realistic manner.
The mutual attraction of Ferdinand and Miranda, and their falling
in love with each other, are perfectly true to life. In real life also
we have the common situation of the young people falling in love
with each other at first sight. Then the villainy of Antonio and
Sebastian is also true to life.
Construction: Dr. Samuel Johnson says that Shakespeare has
borrowed the plots of his dramas from his contemporary popular
stories. His plots are also loose. In this respect, Johnson says:
“The plots are often so loosely formed that a very slight
consideration may improve them, and so carelessly pursued that
he seems not fully to comprehend his own design.”
Shakespeare violates chronology. He shows no regard to
distinction of time or place. He does not set the historical incidents
chronologically. He puts one character in the place of another. He
attributes a certain nation or a period of history to another. We find
that Hector quotes Aristotle in Troilus and Cressida. We also find
the love of Theseus and Hippolyta combined with the Gothic
mythology of fairies in A Midsummer Night’s Dream. This type of
chronological violation not only destroys likelihood but also
affects possibility. Loose plot-construction is found in As You Like
It. The play has a main plot, three major sub-plots and two minor
sub-plots. Sub-plots are the plots by which the main plot is
nourished. They are introduced to brighten the main plot of a play.
Violation of the unities of time and place is noticeable here. Many
critics opine that Shakespeare has no plot. Actually, Shakespeare
is the greatest borrower. He has borrowed his plots from different
sources. The main plot of As You Like It has been derived from
Thomas Lodge’s Rosalynde.
Horror Elements: Horror elements are annexed in the
revenge plays of Shakespeare. Revenge tragedy is a kind of
tragedy in which revenge, horror, murder, and other supernatural
horrors, quests for revenge urged on by ghosts, suicides, and
feigned or real insanity etc. are take place. The Elizabethan Age
saw the introduction of a kind of tragedy called revenge tragedies.
The features of the revenge tragedy are horror, revenge, blood-
shedding, supernatural elements and murders. Hamlet is a revenge
tragedy of William Shakespeare. It was Shakespeare who
introduced the elements of horror in the tragedy. In his tragedies
we find the piling up of crude, physical horror upon horror, which
assume sensational and melodramatic quality. In the tragedy
entitled Hamlet, horror is an integral part of the drama.
Sensationalism is another characteristic of a revenge tragedy,
which we find in Hamlet. In revenge tragedy, supernaturalism
plays an important role. The appearance of ghost is a common
phenomenon in the revenge tragedies of Shakespeare. Murder is
generally at the centre of a revenge tragedy. In a Shakespeare’s
revenge play it is the murder of somebody that puts the main action
of the play in motion. The language in the conventional Revenge
tragedy is highly rhetorical. But in Hamlet, the language is refined
and not so sensational as we find in The Spanish Tragedy.
Matthew Arnold calls the style of Shakespeare’s soliloquies as
grand-style but it is not melodramatic like Kyd. Melodramatic
elements like sensationalism violence, murder, horror and horrific
details, gruesome scenes, intrigue etc. abound in Hamlet,
Macbeth, Othello, King Lear and Julius Caesar. In these plays,
one can easily notice the abundant use of imagery of violence and
horror.
Suffering from Indecision: Lady Macbeth is able to
influence her husband to a great extent. Her instigation leads him
to kill the innocent King Duncan. She knows that Macbeth is not
devoid of ambition too. But she is conscious of the want of his
spirit. She takes the vital decision to murder Duncan without
waiting to consult her husband. This establishes her dominance
over her husband. Her domination helps the main action of the

International Journal of Scientific and Research Publications, Volume 10, Issue 1, January 2020 459
ISSN 2250-3153
http://dx.doi.org/10.29322/IJSRP.10.01.2020.p9771 www.ijsrp.org
play in a decisive way. Macbeth is almost determined not to
assassinate the King. But he is defeated by Lady Macbeth’s
strength of will and singleness of purpose. His determination is no
match for her dominating influence. Lady Macbeth scolds and
reproves him. So she brings him easily back to his original
decision. Thus her influence upon her husband plays a crucial role
in developing the main action of the play, Macbeth. It is true that
the thought of murdering Duncan initially comes to Macbeth’s
mind from his meeting with the Witches. But without Lady
Macbeth’s instigations, the thought might probably never have
been transformed into action.
Macbeth has primarily overcome intention to assassinate the
King. But the initial victory of conscience in his mind is only too
short-lived. Lady Macbeth accuses him of cowardice and
infirmity. She asks him to screw his courage to the sticking-place.
She then proceeds to underline the apparently fool-proof plan of
murder. Her forceful arguments revive his ambition to a great
extent. So Macbeth is now forced to ignore conscience and agree
to his wife’s plan. With the decision to assassinate Duncan, his
tragedy has begun to take shape. But his conscience has not yet
given up. It continues to fight against ambition. The situation thus
helps in making his self-damnation more intense. Even moments
before the murder, his conscience appears in full force. But his
imagination tries to dampen his ambition. He finds a visionary
dagger dripping with blood symbolizing the horror of the proposed
crime.
Macbeth feels heart-sickness and agony of restlessness. Yet
he continues to proceed steadily along the path to self-damnation.
Love of power and the will to live are so powerful in him. He now
possesses sickness of heart, weariness and ennui. On the one hand,
he is a mood of all-defying fury and ruthlessness. Both of these
contrary feelings are frustrated ambition and tortured conscience.
He has undiminished resolution. His impulse inspires him to go
for a second meeting with the Witches. It forces him to stride from
crime to crime. He diagnoses his chronic unrest as a thing caused
by fear of retaliation and considers Banquo to be the potential
source of this fear. But he takes the steps to dispose of this fear.
This proves futile and leads to his further undoing. He sees
Banquo’s ghost at the banquet. Fleance escapes and Macbeth’s
crime is exposed. Macbeth cannot rest and his agony is not abated.
He starts shedding blood through the assassination of Duncan.
Now his retreat from the path is impossible. So he plans the
purposeless slaughter of Macduff and his family. He degenerates
into a butcher. He has lost conscience and his capacity for feeling.
The tragedy of Macbeth lies precisely in this degeneration.
Procrastination is a striking feature in the character of
Hamlet. It makes him almost a coward. Hamlet always suffers
from indecision. He fails to decide whether he will take revenge
upon the killer of his father or not. He discloses it in his famous
soliloquy:
“To be or not to be, that is the question:
Whether ‘tis nobler in the mind to suffer
The slings and arrows of outrageous fortune,
Or to take arms against a sea of troubles
And by opposing end them.”
Hamlet raises the question whether it is good to submit to all
kinds of misfortunes of life and bear them cheerful, or to oppose
them and fight with them and finally to conquer them. If he could
conquer all his misfortunes, he would have never complained
against fate or against his own luck which is mostly bad and very
rarely good. Here Hamlet raises this question because he has been
fed up with his own life after having seen so much of wickedness,
immortality and treachery in this world, and particularly because
he has come to know that his own uncle has murdered his father
and afterwards married his mother. If this be the human character
or if this be human life, what is the good of living at all? This is
the significance of Hamlet’s question.
Indeed, among a large number of soliloquies, this is a famous
one. It is very significant too. Confusion and indecision of Hamlet
is clearly expressed through this famous soliloquy.
Mental Unrest: This conflict between his imagination and
his ambition results in heart-rending spiritual anguish. His soul
gradually falls to pieces. It is the real tragedy. Whenever his
imagination is stirring, we feel suspense and pity. But as soon
these feelings vanish, he becomes a brutal and pitiless murderer.
This is so because the will to live is mighty in him. He is not
prepared to lose the glittering prize and the worldly power and
pelf. He fails to understand his own true nature. He interprets his
sleepless torture as resulting from a sense of insecurity and the fear
of retaliations. Hence his ruthless career of crime and gradual
descent into hell is insured. It is an engrossing spectacle.
Psychologically, it is perhaps the most remarkable exhibition of
the development of a character to be found in Shakespeare’s
tragedies. We admire and pity the man while we condemn and
abhor the murderer. Macbeth is never completely dehumanized
despite his manifold crimes. Conscience unnerves a man turning
him into a moral coward unfit for action. Hamlet appears as a
typical melancholic personality. He wants to cover his cowardice
in the name of conscience. He says in Hamlet:
Thus conscience does make cowards of us all,
And thus the native hue of resolution
Is sicklied o’er with the pale cast of thought.
Hamlet is shocked between the thoughts of ‘miserable life’
and ‘evil death’ and concludes his soliloquy by saying that his
conscience is responsible for his cowardice and inaction. He says
that the fear of the would be life after death makes us cowards and
so the original colour of strong determination is made pale by the
sickness of unhealthy reflection. Thus the enormous task of great
importance which he has undertaken to accomplish has lost its
hold on him on account of this fear of conscience and thus he is
rendered incapable of prompt action.
Hamlet pretends to be mad. His insanity is a major turning point
in the field of taking revenge upon the killers of his father. Ophelia
regrets the madness of Hamlet in the following way:
O, what a noble mind is o’erthrown;
The courtier’s soldier’s scholar’s eye, tongue, sword,
The expectancy and rose of the fair state.
Placed in a hostile world, Hamlet intentionally takes a pose
of madness. He behaves and talks like a mad person. in his meeting
with Ophelia, Hamlet throws insult at her. He suggests that
Ophelia is a loose woman and should go to a convent to rectify
her. Ophelia interprets Hamlet’s speech the words of a madman.
Then she laments the loss of Hamlet’s reason. Hamlet’s character
embodies an ideal Renaissance prince. He is a polished and well-
mannered prince. Besides, he has the courage of a soldier. He is
also a scholar with an extraordinary gift of speech. Thus any
citizen would like to love him and expect him as the king.
According to Ophelia, all these virtues of Hamlet’s character have
International Journal of Scientific and Research Publications, Volume 10, Issue 1, January 2020 460
ISSN 2250-3153
http://dx.doi.org/10.29322/IJSRP.10.01.2020.p9771 www.ijsrp.org
been destroyed because of the attack of madness. On the one hand,
Ophelia’s speech is ironic in the sense that she does not know the
actual condition of Hamlet, that he is not mad. However, it is true
that Hamlet is really disturbed at the current state of affairs.
Characterization: Shakespeare is able to hold up to his
readers a faithful mirror of manners and of life. His characters
have got universal appeal. In Samuel Johnson’s preface to The
Plays of Shakespeare (1765), he wrote, “His characters … are the
genuine progeny of common humanity, such as the world will
always supply, and observation will always find.” For example,
Shylock of The Merchant of Venice is still present in the modern
society. Johnson appreciates Shakespeare’s dramas as a forest. But
he compares the dramas of other dramatists to a garden. Some
critics compare Addison’s Cato to Othello. But Johnson disagrees
with their view in this respect. He argues that Othello is the
progeny of Shakespeare’s vigorous genius accompanied with
subtle observation of human nature. Cato fails to familiarize us
with human sentiments.
His art of characterization is unsurpassable. It will also
remain incomparable even in future. His characters are life-like
and vivified. They have a universal appeal. The dialogue in the
plays of Shakespeare is the dialogue of common man. It is level
with life. His language is refined and praiseworthy. But we cannot
deny that Shakespeare has some faults and defects in his art of
characterization and use of language. He is different from other
dramatists in characterization. His characters express human
sentiments in human language derived from real life. He does not
disguise the natural passions and the natural incidents. His
dialogue is thoroughly realistic. It is pursued with much ease and
simplicity. It seems to have been taken from the common
conversation of human beings. Even where the agency is
supernatural, the dialogue accords with real life. Johnson says—
“Even where the agency is supernatural, the dialogue is level with
life.”
In fact, there is no blurring of characters. No character
shades off into another. The dialogue in his plays is based on the
actual conversation of people. Shakespeare’s characterization is
modern and realistic. He violates three unities, absent in modern
plays, in his plays except his last play, The Tempest.
Use of Foil: In modern literature, we find the use of foil. In
Julius Caesar, Brutus is recognized by everybody in Rome as a
noble-minded man. Casca says that Brutus stands high in all the
people’s hearts. Brutus’s participation in the conspiration against
Caesar would make the assassination of Caesar appear to be a
noble deed. In a soliloquy, Cassius himself says that Brutus is a
man of a noble character though he can be misled and lured into a
wrong path. At the end of the play, Antony pays a high tribute to
Brutus by saying that Brutus was the noblest of all the Romans
who joined the conspiracy against Caesar. No such praise is given
by any person in the play to Cassius.
In fact, it is only Caesar who makes an elaborate comment
upon Cassius’s character and this comment is most adverse.
Caesar speaks of him as a dangerous man whom he would like to
avoid. Now we will bring out the contrast between the characters
of Brutus and Cassius. The main difference between Brutus and
Cassius is that Cassius is a selfish man while Brutus is an unselfish
man. Brutus joins the conspiracy against Caesar because of his
profound and real love of freedom and republicanism. On the other
hand, Cassius initiates die conspiracy because of his personal
motives. Cassius conceives a plan to assassinate Caesar because
he has been feeling jealous of Caesar’s growing power.
Brutus is a very close to Caesar. He feels a deep affection for
Caesar. On the other hand, Cassius is not very close to Caesar. He
does not feel any affection for Caesar. He conspires to murder
Caesar. Caesar seems to Brutus to be well on the way to become a
dictator and a tyrant. Brutus’s motives in joining the conspiracy
are therefore totally unselfish. Cassius himself bears testimony to
this contrast between Brutus and himself. In a soliloquy early in
the play, Cassius says that, if he had been Brutus and if Brutus had
been Cassius, he (Cassius) would not have joined the conspiracy.
There is another point of contrast between Brutus and Cassius too
and this is a major contrast. Brutus is a philosopher and an
idealistic philosopher. On the contrary, Cassius is a man of action
and he is a man who possesses an exceptional practical sense.
Brutus lives in the world of ideas and ideals, while Cassius lives
in the world of realities and the world of hard facts. Brutus proves
a failure both as a conspirator and as a military leader, while
Cassius shows himself to be most competent to start the
conspiracy.
Modern Hero, Hamlet: Hamlet suffers from conflicts, both
external and internal. His conflict is obvious in the following
soliloquy-“To be or not to be”. The tragic hero is influenced by a
supernatural agent. Supernatural element plays a very vital role in
his life. He is influenced profusely by it. With the information of
the Ghost, Hamlet wants to kill his father’s murderer. The Ghost
of motivates the action of the play. Every tragic hero has some
tragic flaw. Similarly, Hamlet has some tragic flaws. People have
spoken about his inability to seek revenge, his irresolute nature,
his moral idealism, his mental suffering, and the conflict in his
mind. His most serious flaw is perhaps the genuinely loving and
exquisitely beautiful Ophelia. The tragic hero must arouse pity and
fear in the mind of the audience. He is able to arouse pity and fear
in our minds. Thus almost all the characteristics of a tragic hero
are present in Hamlet. He is a tragic hero. But he is not traditional
as Aristotle terms. He is a modern tragic hero.
Vulgarism: Measure for Measure is regarded as a dark
comedy which believes that morality and ethics, as well as
intellectual values are meaningless, and that life is a tragic farce.
A dark comedy is gloomy. It does have a happy ending. It also has
amusing scenes as well as wit and humour. It is an undercurrent of
gloom and despair which never leaves us. The comic elements in
such play are pushed into the background by the tone and
atmosphere of seriousness and gravity. The play is also called
‘problem play’ because it with a particular social or moral
problem. It displays the most detested of human emotions or of
sexual promiscuity. The gloom in the play is attributed to three
different and distinct reasons. There is no doubt that the world of
the play is a world of brothels and pimps, senseless copulation,
mindless pregnancies and a total reversal of Christian value of
marital sex. It has a weak Duke. It has a deputy Duke, Angelo. His
learning makes him harsh and cruel. It is a world where a brother
asks a sister to compromise her virginity to save his life.
Vulgarism is also responsible for making it a dark play.
Vulgar languages are used openly in Othello. Desdemona is
generally regarded as a simple foolish young girl. She falls in love
with a man older than herself. She is thought of as a weak-willed
creature deceived by the dazzling brilliance of Othello’s romantic
stories, almost as if she were like Bathsheba. She is extremely
International Journal of Scientific and Research Publications, Volume 10, Issue 1, January 2020 461
ISSN 2250-3153
http://dx.doi.org/10.29322/IJSRP.10.01.2020.p9771 www.ijsrp.org
modest. According to her father Brabantio, she is a maiden of spirit
so still and quiet that her motion and blushed at herself. Though
she not only modest, quiet and still, but also she is bold,
courageous, and firm. Her boldness is shown in her eloping with
the Moor and in openly refuting her father’s charges against her
husband before the senator.
Desdemona hardly guesses that some cunning and deceiving
rogue has poisoned Othello’s mind against her. There is no doubt
that Desdemona is perfectly chaste and faithful to her husband.
She really loves her husband. She is pure as an angel. She is pure
not only physically but also mentally. The idea of playing false to
her husband never crosses her mind. She cannot even utter the
word, “whore”. On the contrary, Iago and his accomplices tried to
prove her a prostitute. They complain against her to Brabantio by
using unutterable obscene languages and coinage. Innocent love-
affairs and marriage are described with vulgar words and phrases.
Display of Muscle Power: Caliban is the symbol of the
colonized and Prospero the colonizer. He hates heartily muscle
power of his master. He treats him as a usurper. He has expressed
his hatred for Prospero who teaches him the language of human
being. He hates him utterly as he considers him as a usurper and
the killer of his mother. He expresses in hatred in The Tempest:
“You taught me language; and my profit on’t
Is, I know how to curse. The red plague rid you
For learning me your language!”
Prospero is not altogether a likewise person. He is somewhat
crusty personage and self-opinionated sow. He dominates others.
He is a tyrant in his relation with Caliban and Ariel. He occupies
the land of Sycorax and kills her. He makes Caliban his servant.
By his magical power, he compels him to carry out his orders.
Caliban is the son of a witch named Sycorax. He is full of sensitive
response to all appeals to the sense. He shares such of his
characteristic with all primitive people living in the heart of nature.
Prospero always tries to rescue him from the savage condition. He
has given him shelter. He has taught him good manners. He also
teaches him human language. But Caliban is unable to talk with
the human language correctly. He is a rebel and seems to be
ungrateful to Prospero. That is why, he shows his disgust towards
Prospero. He does not take slavery of Prospero easy. Prospero is
vexed at his attitude. So he threatens him with more torture to
make him dutiful. Miranda threatens Caliban too. She calls him a
hateful slave. Caliban becomes angry. He says that Prospero has
taught him language and given him speaking power. So he uses
this power only to curse the usurper. He has learnt how to abuse
him. He curses that incurable plague should attack him and end his
life. According to him, this must happen as Prospero teaches him
how to express feelings.
Caliban preserves burning flame in his mind. His hatred for
the tyranny of Prospero remains silent in his heart like a volcano.
But he could not give it out without language. After learning it, he
starts abusing Prospero first. He curses and abuses him being
benefited by him. In a word, he who gives eyes is dishonoured.
This is the utmost reality in the world. Thus the theme of
usurpation and colonization is another significant theme of the
play.
Interest seeking: It is one of the most important
phenomenon in our modern world
III. CONCLUSION
Modern literature enjoys frustration, inner conflict,
boredom, feminism, display of muscle power, war, treatment of
sex and recent technology. Almost all these traits are found in the
plays of William Shakespeare. Moreover, we see some
exceptional features in them. Therefore, William Shakespeare can
be regarded as a modern dramatist, not historically but as a
displayer of recurrent elements in his dramas. In fact, he has
occupied a remarkable place in the world literature. He was
incomparable and matchless. He is still so and will remain in
future. The empire he has built will never meet its downfall. The
sun never goes down in the kingdom of Shakespeare. He is an
institution. His merits and contribution are never to be ended and
cannot reach the last point to express.
REFERENCES
[1] Dr. Johnson .. :A preface to Shakespeare
[2] M. H. Abrams : A Glossary of Literary Terms
[3] X. J. Kennedy: Literature : An Introduction to Drama (Sixth Edition)
[4] Emile Leguis : History of English Literature
[5] William J Long : History of English Literature
[6] Roy and Chokrovorty : Studies in English History
[7] J.N. Mundra and S. C. Mundra: A History of English Literature
[8] Sarad Rajimwale : A History of English Literature
[9] M. H. Abrams : A Glossary of English Literature
[10] Raghukul Tilak : A Short History of English Literature
[11] Raghukul Tilak : Literary Terms, Trends and Movements
[12] Raghukul Tilak : A History of English Literature
[13] Dr. Mofizar Rahman : An A. B. C. of English Literature
[14] A. S. Hornby : Oxford Advanced Learner’s Dictionary
AUTHORS
First Author – Md. Abdul Qader, B.A
(Hons.), M.A (English), Lecturer, Department of English, Tarash
Honours College, Tarash, Sirajgonj, 01761744737
International Journal of Scientific and Research Publications, Volume 10, Issue 1, January 2020 462
ISSN 2250-3153
http://dx.doi.org/10.29322/IJSRP.10.01.2020.p9772 www.ijsrp.org
Behavior of Mothers for Malaria in Children Under
Five Years of Age in Fobur, JOS East LGA, Plateau
State.
Oahimire, Oise Joan *, Pofung, Zachariah Freejob **
Department of Geography and Planning, University of Jos, Plateau State, Nigeria
DOI: 10.29322/IJSRP.10.01.2020.p9772
http://dx.doi.org/10.29322/IJSRP.10.01.2020.p9772 Abstract- Malaria fever appears to be one of the leading causes of
infant mortality in Nigeria. Improper health seeking behavior for
effective treatment is still a great concern for health practitioners
especially in rural areas. A sample of 200 mothers between ages
15-49 years with children ages 1-5 years in the community
participated. The study examined the treatment seeking behavior
of mothers for malaria in children under five years of age in Fobur,
Jos East LGA, Plateau state, Nigeria.
Index Terms- Malaria,Public health,Infant
mortality,Diagonsis,Morbidity,utilization,treatment,
I. INTRODUCTION
ackground to the study.
Malaria remains one of the greatest public health challenges
of our time. The disease is a major health issue in several tropical
and sub-tropical countries (Haque,et. al, 2012). World Health
Organization (WHO, 2013),reported that in 2012, there were an
estimated 207 million malaria cases and 627,000 malaria deaths,
of which, 77% of deaths were children under age five. However,
malaria mortality has decreased by more than 25% since 2000 due
to extensive prevention and control measures
(WHO,2012).Appropriate malaria treatment administered within
24 hours after the onset of fever can help lower it further
(WHO,2014).
Federal Ministry of Health (2010), reported that malaria is
the leading cause of mortality and morbidity in children aged less
than 5 years. It is estimated that over 300,000 people, mainly
pregnant women and children die of the disease each year in the
country. Childhood mortality due to malaria has been attributed to
poor health service delivery and ignorance associated with cultural
beliefs.
It has been suggested that social and cultural determinants
of behavior may account for the gap between awareness of modern
health measures and health seeking behavior (Okeke and
Okafor,2008). While some children are treated with malaria
medications from biomedical facilities as the World Health
Organization recommends, others receive treatment at home or
from traditional healers. Investigating social and cultural issues
regarding malaria treatment is integral in the development of
effective public health responses to the disease.
Although malaria is typically treated at health facilities, diagnosis
and treatment at community level is effective when access to such
facilities is not limited. The effectiveness of community-level
malaria control measures is influenced by early recognition of
symptoms and subsequent treatment-seeking behaviors (Das, et.al,
2010). It is therefore important to obtain region-specific
information on treatment seeking behavior for malaria.
Malaria treatment seeking behaviors are also associated
with socio-economic, demographic and personal factors. Other
important factors are proximity to health facilities, availability of
transportation, knowledge of malaria, a history of malaria, cultural
beliefs regarding traditional and herbal medicines, satisfaction
with health services, and attitude towards health care
providers(Haque, et. al,2012; Yadav, et. al, 2005).
Nigeria setting, being in the tropical region Most early
treatments for fever and uncomplicated malaria occur through
self-treatment at home with anti-malaria bought from patent
medicine sellers (Okeke, et. al, 2006). Treatments are rarely
sought at health facilities and are most often inappropriate or
delayed (Muller, et. al, 2003; Guyatt and snow, 2004; Kofoed, et.
al, 2004). Only less than 15 per cent of the malaria episodes treated
at home is treated correctly. Most fevers in children (>60%) are
treated with simple fever drugs, such as paracetamol and aspirin,
but not with anti-malaria. Even when anti-malaria are purchased,
they are commonly (<80% of cases) administered inappropriate
doses (WHO, 2004).
Various existing development assistance programmes have
funded nation-wide integrated malaria control projects in Nigeria,
with the aim of accelerating scale-up of intervention and assessing
the impact and sustainability of an integrated package of malaria
control interventions on malaria-related morbidity and mortality
among children under five and pregnant women. This included
distribution and use of Insecticide Treated Nets (ITNs), improved
management of sick children at the household level, improved
management of malaria and anemia in health facilities, and
prevention of malaria in pregnant women(WHO,2012).
Success in controlling malaria depends on understanding
the pattern of malaria in the communities including factors that
influence healthcare decision-making at household level, which
has implications for policy on the promotion of healthcare services
and utilization.
A number of studies highlighting behavior of mother’s
control of malaria have been carried out in Nigeria (Agu and
Nwojiji, 2005; Marcus, 2014). It has been observed that healthcare
B

International Journal of Scientific and Research Publications, Volume 10, Issue 1, January 2020 463
ISSN 2250-3153
http://dx.doi.org/10.29322/IJSRP.10.01.2020.p9772 www.ijsrp.org
decisions are determined by, among others, individual, household
and community factors. These include parental decisions,
socioeconomic status, both at individual and household level, and
availability of a health facility and drugs.
This study investigates mother’s behavior Towards malaria
in children less than five years in Fobur,a district in Jos East Local
Government Area of Plateau.
II. METHODOLOGY
Study Area Fobur is one of the districts in Jos East Local Government
Area of Plateau State. Fobur is a rural area comprised of eight
villages, which includes; laminga, Sabon gari , Biseki, Kerker,
Furaka, Wada, Fobur Central, Fada Fobur Border area and Hardo
Fulani. The major tribe is Afizere. However, the community has
different settlers such as the Ibos, Yorubas, fulanis and other
indigenous citizens and their major tribe is the Afizere. The
physical enviroment is a serene environment. The area has not
been affected by any crisis.
Population and Socio-Economic activities The 2006 census figure gave the population of Jos East local
government area as 85, 602 people. It has a Land mass of 2,540sq
km. The natives of the community are the AFizere even though it
is a heterogeneous community with other tribes.
Agriculture is the major occupation of the inhabitants with
only a few civil servants and many traders. The major crops
produced are millet, sweet potatoes, tomatoes, maize, soya beans,
cocoyam, cassava and carrots.
Social Amenities
Fobur has two private health facilities and a government
secondary healthcare centre facility which are being used by the
community. There are a few Nursery and primary schools. It also
has a government secondary school and a private secondary
school. It also has a police station.
Climate The climate characteristics of the study area reflects the
climate feature of Jos Plateau, which varies from North-South as
presented in the work of Tuley and Alfred (1975).The study area
is marked by alternating wet and dry seasons. Rainfall is both
orographic and convectional and last between April to October.
The mean rainfall is about 1400mm annually. Temperature is
reduced because of the altitude. Average monthly Temperature
range from 210c – 250c and daily temperatures range from 150c –
240c. The weather conditions are warmer during the rainy season
(April - October) which encourages the breeding of mosquitoes,
and much colder during the harmattan period (December –
February).
Geology and soils Geographically, the study area comprises of basement
complex rocks. The area has undergone serious weathering and
erosion. The landscape type is flat undulating plain with residual
hills. The soils are generally reddish brown in colour, and are
coarse in texture and are coarse in texture and shallow in depth.
Vegetation
The vegetation of the area is associated with the soil type.
The vegetation of the area is the northern guinea savannah which
consists mainly of short trees and grasses and there is presence of
gallery forest along the river valleys. The practice of irrigation
farming during the dry season which dampens some areas is also
a contributory factor to epidemics of malaria.
Sources and types of data required
Published data on social aspects of malaria in the state are
not readily available. Thus, the study relied mainly on primary
data gathered from mothers with at least a child less than five years
old. Data was also sourced from secondary sources which
included; Published books, internet materials and scientific
journals on malaria.
Sample selection and Sampling technique
The study population was contacted through a systematic
sampling procedure. The study was first, stratified into four
residential zones. Sampling in each zone proceeded with the
counting of all the buildings in the zone. The next stage was the
selection in each zone at specified intervals of either every
second or third building from a starting number (determined
randomly) depending on the length of the street or on the
total number of houses on zone. In each of the selected household,
an eligible respondent for selection was a mother, aged 15 - 49
years with at least a child less than five years within the period of
data collection. About 50 questionnaires were administered to all
the identified eligible respondents in each zone; totaling 200
mothers participated in the questionnaire aspect of the study. The
sample size is considered adequate because research statisticians
would generally recommend at the minimum having between 150-
200 participants per unit of analysis for a small scale study of this
nature (Palumbo, 1969). Thus, the sampling strategy captured this
sample size and provided adequate power and precision to
determine differences in the behaviors of interest.
Data Analysis
The data management and analysis was purely descriptive
analysis and Chi-square statistical was used to enter the data from
the study questionnaire and to construct a data base. The
quantitative data was summarized using tables and graphs for
quick comparisons of values.
All the data generated at the end of every FGD and IDI were
transcribed on return from the field.Verbatim transcriptions were
made for all tape-recorded FGDs and in-depth interviews. The
actual analysis was divided in to two stages: analysis of the
individual transcripts and all the group discussions. After that, all
the transcripts were coded. The edited reports of each of the
interviews were prepared by themes and the key findings were
noted and sorted. This enabled the pooling of similar ideas and
statements under a particular code across variables which was
used to support the quantitative findings and where appropriate,
quotes that best explained the knowledge and practices of the
mothers about malaria were identified and used in parallel with the
quantitative findings to elaborate more on the insights of the
perceptions and practices of the community.
Results and discussions
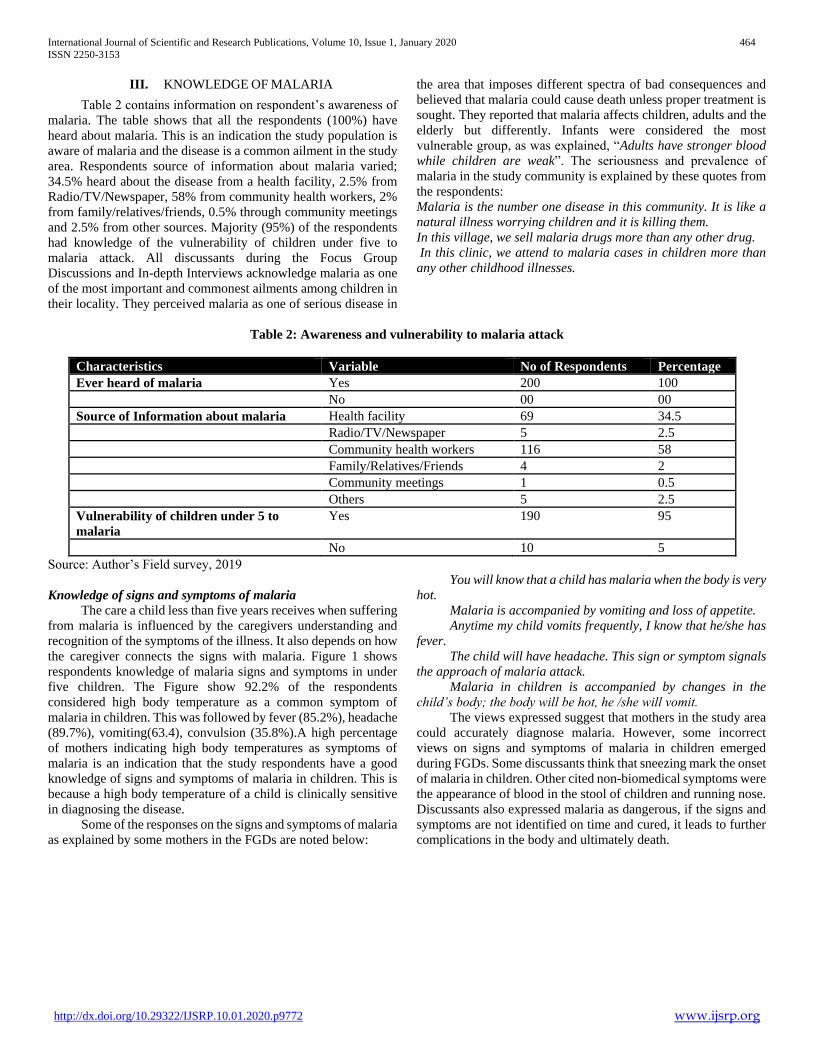
International Journal of Scientific and Research Publications, Volume 10, Issue 1, January 2020 464
ISSN 2250-3153
http://dx.doi.org/10.29322/IJSRP.10.01.2020.p9772 www.ijsrp.org
III. KNOWLEDGE OF MALARIA
Table 2 contains information on respondent’s awareness of
malaria. The table shows that all the respondents (100%) have
heard about malaria. This is an indication the study population is
aware of malaria and the disease is a common ailment in the study
area. Respondents source of information about malaria varied;
34.5% heard about the disease from a health facility, 2.5% from
Radio/TV/Newspaper, 58% from community health workers, 2%
from family/relatives/friends, 0.5% through community meetings
and 2.5% from other sources. Majority (95%) of the respondents
had knowledge of the vulnerability of children under five to
malaria attack. All discussants during the Focus Group
Discussions and In-depth Interviews acknowledge malaria as one
of the most important and commonest ailments among children in
their locality. They perceived malaria as one of serious disease in
the area that imposes different spectra of bad consequences and
believed that malaria could cause death unless proper treatment is
sought. They reported that malaria affects children, adults and the
elderly but differently. Infants were considered the most
vulnerable group, as was explained, “Adults have stronger blood
while children are weak”. The seriousness and prevalence of
malaria in the study community is explained by these quotes from
the respondents:
Malaria is the number one disease in this community. It is like a
natural illness worrying children and it is killing them.
In this village, we sell malaria drugs more than any other drug.
In this clinic, we attend to malaria cases in children more than
any other childhood illnesses.
Table 2: Awareness and vulnerability to malaria attack
Characteristics Variable No of Respondents Percentage
Ever heard of malaria Yes 200 100
No 00 00
Source of Information about malaria Health facility 69 34.5
Radio/TV/Newspaper 5 2.5
Community health workers 116 58
Family/Relatives/Friends 4 2
Community meetings 1 0.5
Others 5 2.5
Vulnerability of children under 5 to
malaria
Yes 190 95
No 10 5
Source: Author’s Field survey, 2019
Knowledge of signs and symptoms of malaria
The care a child less than five years receives when suffering
from malaria is influenced by the caregivers understanding and
recognition of the symptoms of the illness. It also depends on how
the caregiver connects the signs with malaria. Figure 1 shows
respondents knowledge of malaria signs and symptoms in under
five children. The Figure show 92.2% of the respondents
considered high body temperature as a common symptom of
malaria in children. This was followed by fever (85.2%), headache
(89.7%), vomiting(63.4), convulsion (35.8%).A high percentage
of mothers indicating high body temperatures as symptoms of
malaria is an indication that the study respondents have a good
knowledge of signs and symptoms of malaria in children. This is
because a high body temperature of a child is clinically sensitive
in diagnosing the disease.
Some of the responses on the signs and symptoms of malaria
as explained by some mothers in the FGDs are noted below:
You will know that a child has malaria when the body is very
hot.
Malaria is accompanied by vomiting and loss of appetite.
Anytime my child vomits frequently, I know that he/she has
fever.
The child will have headache. This sign or symptom signals
the approach of malaria attack.
Malaria in children is accompanied by changes in the
child’s body; the body will be hot, he /she will vomit.
The views expressed suggest that mothers in the study area
could accurately diagnose malaria. However, some incorrect
views on signs and symptoms of malaria in children emerged
during FGDs. Some discussants think that sneezing mark the onset
of malaria in children. Other cited non-biomedical symptoms were
the appearance of blood in the stool of children and running nose.
Discussants also expressed malaria as dangerous, if the signs and
symptoms are not identified on time and cured, it leads to further
complications in the body and ultimately death.
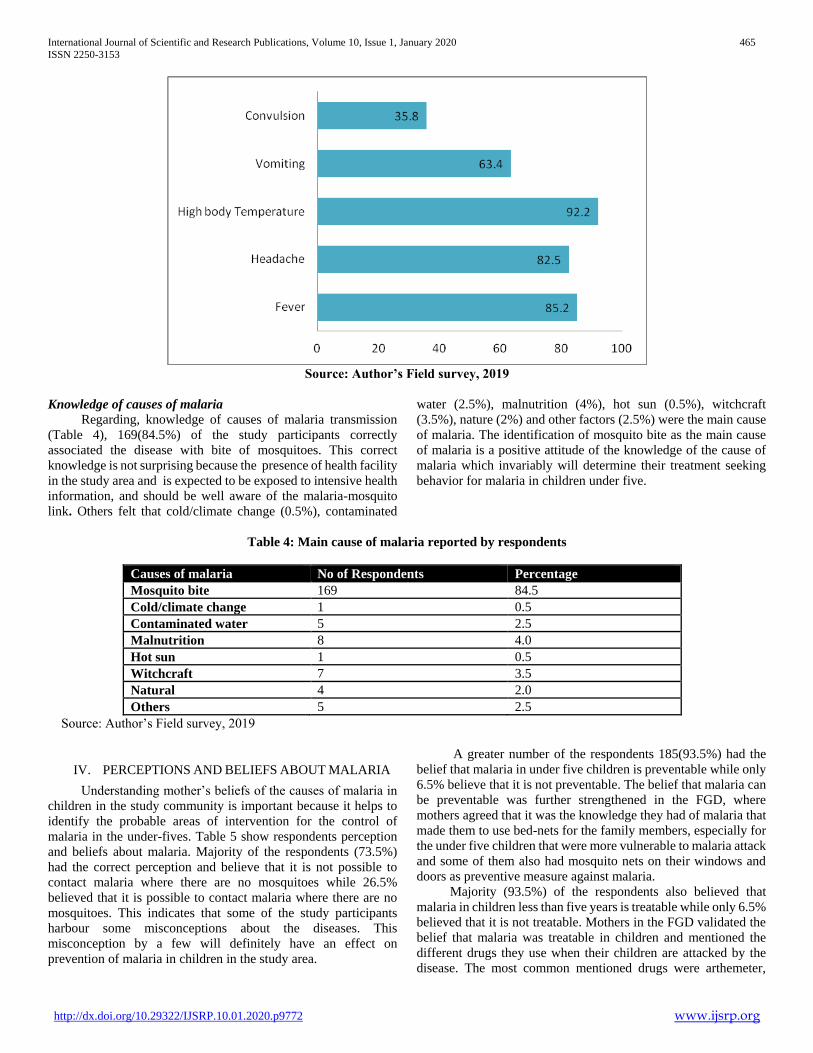
International Journal of Scientific and Research Publications, Volume 10, Issue 1, January 2020 465
ISSN 2250-3153
http://dx.doi.org/10.29322/IJSRP.10.01.2020.p9772 www.ijsrp.org
Source: Author’s Field survey, 2019
Knowledge of causes of malaria
Regarding, knowledge of causes of malaria transmission
(Table 4), 169(84.5%) of the study participants correctly
associated the disease with bite of mosquitoes. This correct
knowledge is not surprising because the presence of health facility
in the study area and is expected to be exposed to intensive health
information, and should be well aware of the malaria-mosquito
link. Others felt that cold/climate change (0.5%), contaminated
water (2.5%), malnutrition (4%), hot sun (0.5%), witchcraft
(3.5%), nature (2%) and other factors (2.5%) were the main cause
of malaria. The identification of mosquito bite as the main cause
of malaria is a positive attitude of the knowledge of the cause of
malaria which invariably will determine their treatment seeking
behavior for malaria in children under five.
Table 4: Main cause of malaria reported by respondents
Causes of malaria No of Respondents Percentage
Mosquito bite 169 84.5
Cold/climate change 1 0.5
Contaminated water 5 2.5
Malnutrition 8 4.0
Hot sun 1 0.5
Witchcraft 7 3.5
Natural 4 2.0
Others 5 2.5
Source: Author’s Field survey, 2019
IV. PERCEPTIONS AND BELIEFS ABOUT MALARIA
Understanding mother’s beliefs of the causes of malaria in
children in the study community is important because it helps to
identify the probable areas of intervention for the control of
malaria in the under-fives. Table 5 show respondents perception
and beliefs about malaria. Majority of the respondents (73.5%)
had the correct perception and believe that it is not possible to
contact malaria where there are no mosquitoes while 26.5%
believed that it is possible to contact malaria where there are no
mosquitoes. This indicates that some of the study participants
harbour some misconceptions about the diseases. This
misconception by a few will definitely have an effect on
prevention of malaria in children in the study area.
A greater number of the respondents 185(93.5%) had the
belief that malaria in under five children is preventable while only
6.5% believe that it is not preventable. The belief that malaria can
be preventable was further strengthened in the FGD, where
mothers agreed that it was the knowledge they had of malaria that
made them to use bed-nets for the family members, especially for
the under five children that were more vulnerable to malaria attack
and some of them also had mosquito nets on their windows and
doors as preventive measure against malaria.
Majority (93.5%) of the respondents also believed that
malaria in children less than five years is treatable while only 6.5%
believed that it is not treatable. Mothers in the FGD validated the
belief that malaria was treatable in children and mentioned the
different drugs they use when their children are attacked by the
disease. The most common mentioned drugs were arthemeter,
International Journal of Scientific and Research Publications, Volume 10, Issue 1, January 2020 466
ISSN 2250-3153
http://dx.doi.org/10.29322/IJSRP.10.01.2020.p9772 www.ijsrp.org
chloroquine, Lokmal, maldox. This was confirmed by a patent
medicine store owner who had high patronage by community
members. The in-depth interviews with health care practitioners
revealed similar patterns of treatment seeking behavior for
malaria.
Respondent’s belief about malaria was further assessed by
asking them whether a child suffering from malaria will die if the
disease is not treated (table 5). According to the table 95.5% of the
respondents believed that a child can die if malaria is not treated.
This suggests that some people in the study area (4.5%) still
believe that malaria does not kill children. It also indicates some
level of ignorance about the disease. This ignorance (even though
a small percentage) is not expected because people are suppose to
be more enlightened about the disease. This is also in spite of the
fact as reported earlier that malaria awareness was high and
children experience malaria attack severally in a year, yet some
believed it does not kill. Discussants during FGD and informal
conversation with community members reveal that they have some
contradictory views. Respondents that claim that malaria does not
kill indicated that it males one sad and unable to carry out ones
duties and attribute the distress to the fact that it may kill. Thus,
they attribute the main distress of malaria to mortality due to it. A
mother who perceived the disease to result in death of children
reported during FGD that:
Malaria is a big problem to us because many of our children
are dying due to the disease.
Table 5: Beliefs about malaria
Characteristics Variable No of Respondents Percentage
Contacting malaria where there are no mosquitoes Yes 53 26.5
No 147 73.5
Is malaria in children preventable Yes 187 93.5
No 13 6.5
Is malaria treatable Yes 187 93.5
No 13 6.5
Death of a child If malaria is not treated Yes 191 95.5
No 9 4.5
Source: Author’s Field survey, 2019
PREVENTIVE PRACTICES
Mothers perception of the cause of malaria determines their
protective behaviour and the type of protective measures adopted.
The major malaria preventive measures used at home and at
community level by respondents are shown Table 6. Majority
(78%) indicated using bed-nets which some of the respondents
said they got from the community health centre when they went
for immunization, 3.0% make use of environmental manipulation,
3.5% indicated indoor residual spraying as a means of reducing
mosquitoes. Respondents that use repellants and coils were 8.5%,
2.5% keep house clean. Others use traditional medicine (0.5%)
which was reported in the FGD as leaves called Kurga which they
believed repels mosquitoes. About 2% indicated that they cover
the Child body with cloth and 2% also believe in good nutrition as
a preventive measure. The finding reveals that the major form of
protection for children from mosquito bites was the use of bed-
nets
Table 6: Respondents Major Preventive Measures
Preventive measures No of Respondents Percentage
Use of Bed-nets 156 78.0
Environmental manipulation 6 3.0
Indoor residual spraying 7 3.5
Use of repellants and coils 17 8.5
Keep house clean 5 2.5
Traditional medicine 1 0.5
Cover body with clothes 4 2.0
Good nutrition 4 2.0
Source: Author’s Field survey, 2019
Respondents use of preventive measures were also assessed
(Table 7).Table 7 indicate the percentage of respondents who
made use of bed-nets as at the time of the study. Majority (89%)
of the respondents reported the making use of bed-nets to protect
children less than five years from mosquito bite. This is a positive
attitude in the use of preventive measures against malaria attack in
children while 11% did not use bed-nets. The use of bed-nets was
also confirmed by respondents in the discussion groups where
mothers attested to using bed-nets that were given to them at the
community health centre and some of the women made mention
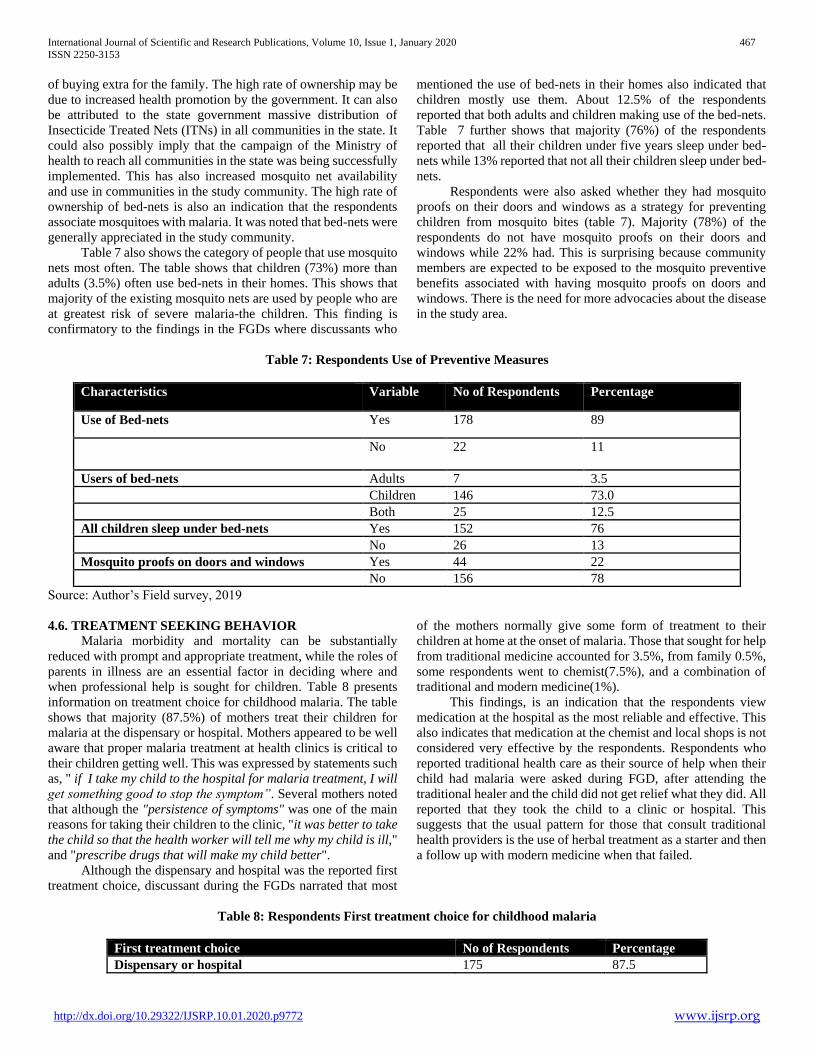
International Journal of Scientific and Research Publications, Volume 10, Issue 1, January 2020 467
ISSN 2250-3153
http://dx.doi.org/10.29322/IJSRP.10.01.2020.p9772 www.ijsrp.org
of buying extra for the family. The high rate of ownership may be
due to increased health promotion by the government. It can also
be attributed to the state government massive distribution of
Insecticide Treated Nets (ITNs) in all communities in the state. It
could also possibly imply that the campaign of the Ministry of
health to reach all communities in the state was being successfully
implemented. This has also increased mosquito net availability
and use in communities in the study community. The high rate of
ownership of bed-nets is also an indication that the respondents
associate mosquitoes with malaria. It was noted that bed-nets were
generally appreciated in the study community.
Table 7 also shows the category of people that use mosquito
nets most often. The table shows that children (73%) more than
adults (3.5%) often use bed-nets in their homes. This shows that
majority of the existing mosquito nets are used by people who are
at greatest risk of severe malaria-the children. This finding is
confirmatory to the findings in the FGDs where discussants who
mentioned the use of bed-nets in their homes also indicated that
children mostly use them. About 12.5% of the respondents
reported that both adults and children making use of the bed-nets.
Table 7 further shows that majority (76%) of the respondents
reported that all their children under five years sleep under bed-
nets while 13% reported that not all their children sleep under bed-
nets.
Respondents were also asked whether they had mosquito
proofs on their doors and windows as a strategy for preventing
children from mosquito bites (table 7). Majority (78%) of the
respondents do not have mosquito proofs on their doors and
windows while 22% had. This is surprising because community
members are expected to be exposed to the mosquito preventive
benefits associated with having mosquito proofs on doors and
windows. There is the need for more advocacies about the disease
in the study area.
Table 7: Respondents Use of Preventive Measures
Characteristics Variable No of Respondents Percentage
Use of Bed-nets Yes 178 89
No 22 11
Users of bed-nets Adults 7 3.5
Children 146 73.0
Both 25 12.5
All children sleep under bed-nets Yes 152 76
No 26 13
Mosquito proofs on doors and windows Yes 44 22
No 156 78
Source: Author’s Field survey, 2019
4.6. TREATMENT SEEKING BEHAVIOR
Malaria morbidity and mortality can be substantially
reduced with prompt and appropriate treatment, while the roles of
parents in illness are an essential factor in deciding where and
when professional help is sought for children. Table 8 presents
information on treatment choice for childhood malaria. The table
shows that majority (87.5%) of mothers treat their children for
malaria at the dispensary or hospital. Mothers appeared to be well
aware that proper malaria treatment at health clinics is critical to
their children getting well. This was expressed by statements such
as, " if I take my child to the hospital for malaria treatment, I will
get something good to stop the symptom”. Several mothers noted
that although the "persistence of symptoms" was one of the main
reasons for taking their children to the clinic, "it was better to take
the child so that the health worker will tell me why my child is ill,"
and "prescribe drugs that will make my child better".
Although the dispensary and hospital was the reported first
treatment choice, discussant during the FGDs narrated that most
of the mothers normally give some form of treatment to their
children at home at the onset of malaria. Those that sought for help
from traditional medicine accounted for 3.5%, from family 0.5%,
some respondents went to chemist(7.5%), and a combination of
traditional and modern medicine(1%).
This findings, is an indication that the respondents view
medication at the hospital as the most reliable and effective. This
also indicates that medication at the chemist and local shops is not
considered very effective by the respondents. Respondents who
reported traditional health care as their source of help when their
child had malaria were asked during FGD, after attending the
traditional healer and the child did not get relief what they did. All
reported that they took the child to a clinic or hospital. This
suggests that the usual pattern for those that consult traditional
health providers is the use of herbal treatment as a starter and then
a follow up with modern medicine when that failed.
Table 8: Respondents First treatment choice for childhood malaria
First treatment choice No of Respondents Percentage
Dispensary or hospital 175 87.5

International Journal of Scientific and Research Publications, Volume 10, Issue 1, January 2020 468
ISSN 2250-3153
http://dx.doi.org/10.29322/IJSRP.10.01.2020.p9772 www.ijsrp.org
Traditional medicine 7 3.5
Family 1 0.5
Private drug vendors/chemist 15 7.5
Combination of traditional and modern medicine 2 1
Source: Author’s Field survey, 2019
4.6.1. Treatment of children with malaria at home.
Table 9 contains information on whether respondents start
treatment of malaria in children at home. The table shows that
more than half(61.5%) of the respondents start treatment at home
when their children have malaria while 38.5% often do not start
treatment at home when their children have what they perceived
as malaria.
Some of the respondents perceived malaria not as a serious
disease but as an illness that has a simple and known treatment
regime that can be effectively applied at home. Since malaria is
often viewed as an "ordinary illness, they mostly believe that a
child has to be taken to a health centre only if it becomes severe.
Generally, mothers start treatment at home for their children with
malaria. This was expressed by the following statements by
participants in the FGDs :
I will take the child to the hospital only if it becomes severe.
I normally keep some drugs at home so that if my child is attacked
by malaria, I can easily just administer.
But anytime the drugs have finished and my children are attacked
by malaria, I can go to the market and purchase drugs from a
vendor and treat him at home.
Table 9: Treatment of malaria at home
Treatment of malaria at home No of Respondents Percentage
Yes 123 61.5
No 77 38.5
Source: Author’s Field survey, 2019
4.6.2. Sources of Drugs for the Treatment of Malaria
Table 10 shows that most respondents(43.5%) got their
drugs from government health centre,35% went to the chemist
to buy drugs, 0.5% bought it from drug vendors, 12.5% of the
respondents patronized private health facilities where they
obtained drugs, 4% were given by health workers and from family
members(4.5%) who had malaria drugs at home..
It was difficult to elicit information from respondents from
the study questionnaire on the type of anti-malarial drugs used at
home. The study respondents generally could not be categorical
about the anti-malarial drugs used at home. Most of them reported
during FGD that when children have malaria, they normally go to
the chemist and asked for any anti-malaria drug. They were not
too certain about the names of drugs used. However, the most
frequently mentioned drugs were chloroquine, fansidar,
paracetamol and some elderly mothers mentioned quinine.
Discussants in FGDs were asked whether they were aware of
Artemisinin-based combination therapies (ACTs).
Uninterestingly, not even a discussants reported that they have
heard about ACT-implying a very poor use of artemisinin
combination therapy. This is not encouraging because child ACTs
are the recommended first-line treatment for uncomplicated
malaria in most malaria-affected regions of Africa and are
extremely effective against malaria parasites and have few or no
side effects.
Table 10: Sources of Drugs for treatment of childhood malaria
Sources No of Respondents Percentage
Chemist 70 35
Government hospital/clinic 87 43.5
From vendor 1 0.5
Private health facility 25 12.5
Health workers 8 4
Family members 9 4.5
Source: Author’s Field survey, 2019
Duration between when symptoms of malaria are noticed in
children and consultation at the treatment centre.
The type of health care provider and time when treatment is
sought may depend on how the individual perceives the severity
of the disease and his or her faith in and experience of various
treatments. Delay in seeking help often results in complications,
increased cost of treatment and death. Table 11 presents
information on duration between noticing of symptoms of malaria
in children and consultation at treatment centre within and after 24
hours. Majority (69.5%) of the respondents take their children
suffering from malaria to a treatment centre within 24 hours,
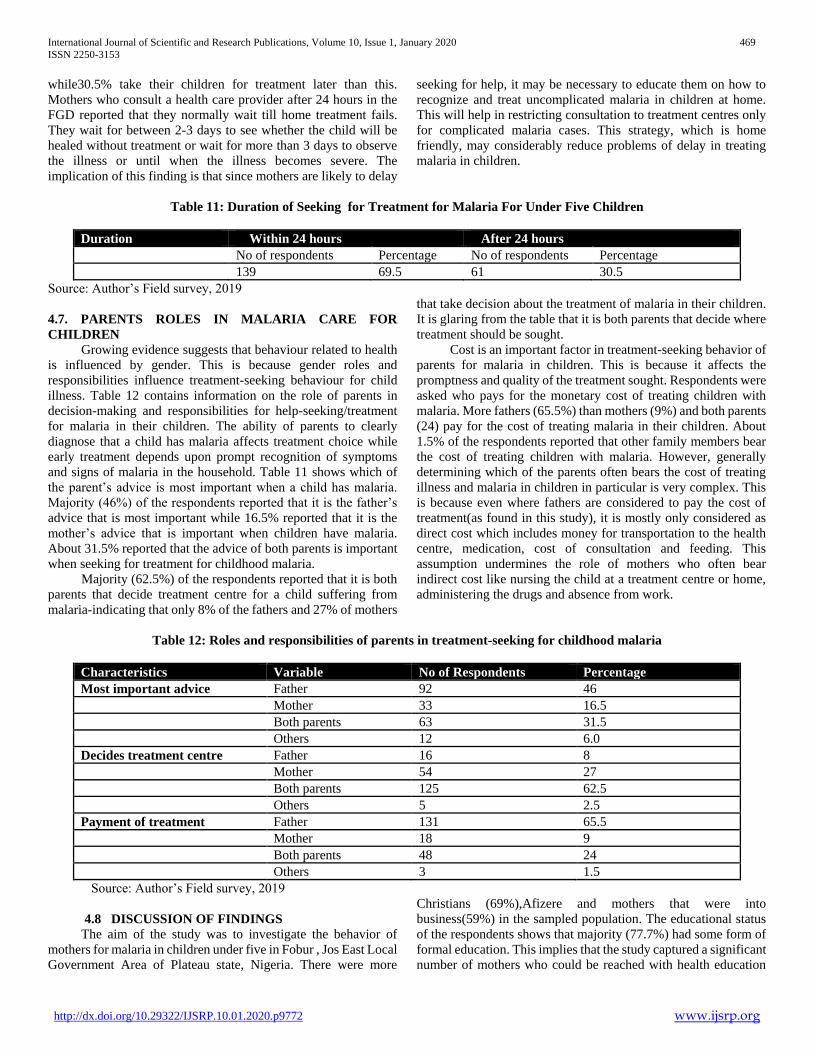
International Journal of Scientific and Research Publications, Volume 10, Issue 1, January 2020 469
ISSN 2250-3153
http://dx.doi.org/10.29322/IJSRP.10.01.2020.p9772 www.ijsrp.org
while30.5% take their children for treatment later than this.
Mothers who consult a health care provider after 24 hours in the
FGD reported that they normally wait till home treatment fails.
They wait for between 2-3 days to see whether the child will be
healed without treatment or wait for more than 3 days to observe
the illness or until when the illness becomes severe. The
implication of this finding is that since mothers are likely to delay
seeking for help, it may be necessary to educate them on how to
recognize and treat uncomplicated malaria in children at home.
This will help in restricting consultation to treatment centres only
for complicated malaria cases. This strategy, which is home
friendly, may considerably reduce problems of delay in treating
malaria in children.
Table 11: Duration of Seeking for Treatment for Malaria For Under Five Children
Duration Within 24 hours After 24 hours
No of respondents Percentage No of respondents Percentage
139 69.5 61 30.5
Source: Author’s Field survey, 2019
4.7. PARENTS ROLES IN MALARIA CARE FOR
CHILDREN
Growing evidence suggests that behaviour related to health
is influenced by gender. This is because gender roles and
responsibilities influence treatment-seeking behaviour for child
illness. Table 12 contains information on the role of parents in
decision-making and responsibilities for help-seeking/treatment
for malaria in their children. The ability of parents to clearly
diagnose that a child has malaria affects treatment choice while
early treatment depends upon prompt recognition of symptoms
and signs of malaria in the household. Table 11 shows which of
the parent’s advice is most important when a child has malaria.
Majority (46%) of the respondents reported that it is the father’s
advice that is most important while 16.5% reported that it is the
mother’s advice that is important when children have malaria.
About 31.5% reported that the advice of both parents is important
when seeking for treatment for childhood malaria.
Majority (62.5%) of the respondents reported that it is both
parents that decide treatment centre for a child suffering from
malaria-indicating that only 8% of the fathers and 27% of mothers
that take decision about the treatment of malaria in their children.
It is glaring from the table that it is both parents that decide where
treatment should be sought.
Cost is an important factor in treatment-seeking behavior of
parents for malaria in children. This is because it affects the
promptness and quality of the treatment sought. Respondents were
asked who pays for the monetary cost of treating children with
malaria. More fathers (65.5%) than mothers (9%) and both parents
(24) pay for the cost of treating malaria in their children. About
1.5% of the respondents reported that other family members bear
the cost of treating children with malaria. However, generally
determining which of the parents often bears the cost of treating
illness and malaria in children in particular is very complex. This
is because even where fathers are considered to pay the cost of
treatment(as found in this study), it is mostly only considered as
direct cost which includes money for transportation to the health
centre, medication, cost of consultation and feeding. This
assumption undermines the role of mothers who often bear
indirect cost like nursing the child at a treatment centre or home,
administering the drugs and absence from work.
Table 12: Roles and responsibilities of parents in treatment-seeking for childhood malaria
Characteristics Variable No of Respondents Percentage
Most important advice Father 92 46
Mother 33 16.5
Both parents 63 31.5
Others 12 6.0
Decides treatment centre Father 16 8
Mother 54 27
Both parents 125 62.5
Others 5 2.5
Payment of treatment Father 131 65.5
Mother 18 9
Both parents 48 24
Others 3 1.5
Source: Author’s Field survey, 2019
4.8 DISCUSSION OF FINDINGS
The aim of the study was to investigate the behavior of
mothers for malaria in children under five in Fobur , Jos East Local
Government Area of Plateau state, Nigeria. There were more
Christians (69%),Afizere and mothers that were into
business(59%) in the sampled population. The educational status
of the respondents shows that majority (77.7%) had some form of
formal education. This implies that the study captured a significant
number of mothers who could be reached with health education
International Journal of Scientific and Research Publications, Volume 10, Issue 1, January 2020 470
ISSN 2250-3153
http://dx.doi.org/10.29322/IJSRP.10.01.2020.p9772 www.ijsrp.org
about malaria. This supports a similar study reported by Okeke
and Oakfor(2008) findings where 73% of the care givers had at
least attained primary education. The findings was consistent with
the study done in Nasarawa state of Nigeria (Marcus,2014)
where majority of the respondents had formal education and were
significantly associated with high score of malaria knowledge
than those who had no formal education. It is however, higher
than findings reported by Chukwuocha, et.al(2009) where 58.3%
of the mothers interviewed were illiterates. The literacy level of
the mothers may affect their timely decision about treatment of
malaria in children as reported by Osagbemi(1998) that literate
mothers were significantly associated with early treatment of
malaria.
All the study participants have heard of malaria. This is an
indication of the prevalence of the diseases in the study
community. It is probably because the study area is not too far
from the urban centre(Jos-plateau state capital) where there have
been a lot of campaign on malaria. The major source of
information about malaria was community health workers.
Most of the respondent’s identified the correct clinical
symptoms of malaria. For example, the high percentage (992.2%)
of mothers indicating high body temperature (fever) as symptoms
of malaria is an indication that the study respondents had a good
knowledge of signs and symptoms of malaria and could accurately
diagnose malaria in children. Similar results were found in other
studies (Chukwuocha, et.al, 2009; Okeke and Okafor, 2008;
Marcus, 2014).
The study participants noted the role of mosquito bite in
malaria transmission. The participants elaborated their ideas of the
cause of malaria and most of them (84.5%) associated the disease
with mosquito bites. Although mosquitoes were recognized to be
the main agents in transmission of malaria in this study,
misconceptions such as cold/climate change, contaminated water,
malnutrition, hot sun, witchcraft, natural and others were also
perceived as a cause of malaria by some of the participants.
People’s perception and understanding about the perceived cause
and transmission of malaria have strong implications on the
preventive measures such as ITNS implementation (Ahorlu,1997,
Agyepong et al, 1999).
The second hypothesis stated that treatment seeking
behavior of mothers is a function of age . The hypothesis was
confirmed. This finding showed that the age of mothers
determined treatment seeking behavior of mothers in Fobur. In
other words, the treatment seeking behavior of mothers in this
community is a function of age to some extent, using the variable
‘In how many hours of the onset of malaria signs and symptoms
do you seek treatment? Cross tab with mothers age. (t =19.705;
df =6; p =0.003).The older women within the age of 45-49 years
had a higher percentage of those who sought for treatment after 24
hours.
Most participants in the study believed that malaria can only
be contacted through mosquito bite while 93.5% each believed
that malaria is preventable and treatable. Majority (95.5%) of the
respondents believe that a child will die if malaria is not treated.
This suggests that some people both in the study area still believe
that malaria does not kill children and it is not treatable and
preventable. This incorrect belief indicates the level of ignorance
about the disease. It could also be attributed to ignorance of
malaria prevention methods among community members and lack
of sensitization on the part of health workers to communities on
the appropriate malaria preventive measures. However, it is
surprising that despite the several years of contact with and
exposure to modern health education on the mosquito as the vector
that transmit malaria parasite to human beings, such information
is still not convincingly accepted by some mothers who have heard
it.
Greater awareness about malaria and undertaking a broader
range of preventive actions for malaria influence appropriate
treatment-seeking behavior.The commonest form of protection
used by respondents for children in the study area was a mosquito
net (78%) which is interestingly high. This is an indication of a
positive attitude towards malaria control. A similar finding was
reported by Chukwuocha, et.al, 2009; Okeke and Okafor, 2008
and Marcus, 2014. Respondents associated bed-nets with a control
programme of the government. Since identification of malaria as
a serious and potentially deadly disease is already high in the study
area, only little effort is needed in educating the respondents on
this.
Although environmental manipulation (draining of
mosquito breeding sites cleaning the environment), indoor
residual spraying were reported as some of the practices of some
households, the practice was said not to observed completely as
reported in the FGD, the quantitative report might have be
influenced by social desirability bias in which the respondents
replied to conform to the expectations of the field workers. The
practice of malaria prevention by households is related to
perception of the risk, their knowledge of the causes of malaria
and its preventive measures ( Agyepong, et al, 1999).
Mothers reported in this study that their major reason for
protecting their children against mosquitoes is that they cause
malaria. Since majority use bed-nets, it can be inferred that the
study respondents consider mosquito nets as an effective strategy
in reducing malaria in this group of children as reported by WHO
(2003). About 89% reported ownership and use of at least a bed-
net in their houses. The mosquito net ownership findings in this
study is higher than the results reported by Oyewole and Ibidapo
(2007) and Humprey,et.al (2010).The high rate of ownership may
be attributed to the state government’s massive distribution of
Insecticide Treated Nets (ITNs) in all communities in the state.
This has increased mosquito net availability and use in
communities.
The study shows that majority (73%) of existing mosquito
nets in the households were used by children. This demonstrates
that the existing mosquito nets were used by people who are at
greatest risk for severe malaria. This support James et.al.(2011)
findings in northern Uganda where children were more frequently
protected with mosquito nets than older children and adults. The
practice of putting mosquito proofs on doors and windows as a
form of protection against malaria was not too common in the
study community. More than half (78%) of the respondents had no
mosquito proofs on their doors and windows. This is even though
that, the study respondents believed the introduction of bed-nets
and mosquito nets on doors and windows had helped to reduce
malaria. (2011). Also, despite the fact that the study participants
had high knowledge of malaria, their low educational level implies
the need for intensifying the expansion of training programmes to
raise the level of women’s education. Evidences show that
educational attainment is associated with better malaria
International Journal of Scientific and Research Publications, Volume 10, Issue 1, January 2020 471
ISSN 2250-3153
http://dx.doi.org/10.29322/IJSRP.10.01.2020.p9772 www.ijsrp.org
knowledge. For example, in some parts of Nigeria, higher levels
of education were associated with improved knowledge and
practice about the appropriate malaria prevention and control
intervention (Dike, et al; 2006). Education also increases the
probability that household would purchase bed-nets(Dike, et
al;2006). This suggests that higher level of education may be
required to impact upon the intake of malaria prevention and
control interventions.
In this study, mothers seek for help from a variety of
sources. Mother’s first choice of treatment outside the home was
mainly from Dispensary or Hospital about (87.5%), within this
percentage most of them went to private health facilities. The
reason given in FGD was the availability of health personnel
anytime of the day and drugs unlike the government health centres
where they only operate during the day, long waiting and non
availability of some of the drugs. However, traditional remedies
were found to be very low in this study. The findings is an
indication that malaria illness is considered best treated by modern
health services by most respondents while a few considered it best
treated by traditional methods, and often a mixture of both is
sought .
The delay in seeking treatment within 24 hours of onset of
malaria is a great concern in the right attitude in treatment seeking
behavior as 30.5% of the respondents did not seek treatment
within 24hours at the onset of malaria signs, This leads to seeking
treatment at home. However, the findings in this study like in most
African countries are far below the Roll Back Malaria (RBM)
partnership target of ensuring that 80 percent of those suffering
from malaria have prompt access to, and are able to correctly use,
affordable and appropriate treatment within 24 hours from year
2010 .Perhaps the proportion of those that delay in consultation
with a health care provider should be educated on how to
recognize and treat uncomplicated malaria in children at home.
Treatment at home(61.5%%) to cure malaria among the
children less than 5 year of age was commonly practiced by
parents before going to the health facility. Similar findings were
reported by Jane,et.al.(2010). Mothers usually start treatment for
children at home with the belief and hope to cure malaria in
children. Mothers are more likely to begin with self-medication at
home to minimize expenditure at health facility, this was also
emphasized in the FGDs where the mothers reported delay in
seeking treatment outside the home, due to financial constraints
which was due to the absence of the husbands in some cases from
the house who were responsible for the payment of their children’s
treatment.
Gender roles and responsibilities influence treatment-
seeking behaviour for child illness. Majority (46%) of the
respondents reported that it is the father’s advice that is most
important. Dominating and decision making by fathers was also
reported by James, et.al.(2011) in their study of northern Ghana
.Patent medicine store owners in the community also confirmed
that the mother often come to purchase drugs with insufficient
money. This means husbands have important role in health of
children because financing care largely depends on them .While
some women can advice (16.5%), both parents advice is also
important (31.5%) seeking for treatment for childhood malaria.
Majority (62.5%) of the respondents reported that it is both parents
that decide treatment centre for a child suffering from malaria-
indicating that only 8% of the fathers and 27% of mothers that take
decision about the treatment of malaria in their children. This
suggests that in the study community, it is both parents. In this
study, more fathers (65.5%) than mothers (9%) and both parents
(24) pay for the cost of treating malaria in their children. This
finding means that husbands have important roles in health of
children because financing care largely depends on them
(D’Alessandro, et al, 2005).
V. CONCLUSION
This study has contributed to the existing knowledge about
malaria and the findings are also very informative in the area of
increasing peoples knowledge on the behaviors of mothers for
malaria in children under age five.. The study has revealed
reasonable knowledge of the symptoms of malaria, however there
is a need for community intervention programmes directed
towards correcting misconceptions about the cause of malaria, the
recognition of danger signs which will require prompt referral to
health facilities and improving treatment seeking practices.
Appropriate home management with effective drugs given in
correct dosages should also be promoted since majority resort to
self treatment before seeking treatment outside. Childhood malaria
is common in rural Nigeria. Mothers are at home more than are the
fathers, and so they are often the first to recognize when a child is
sick with malaria fever. In many instances, therefore, mothers take
the first step in finding treatment for the child, so mothers should
be enhanced financially
VI. RECOMMENDATIONS
The following recommendations are proffered in this study
to improve knowledge, belief and treatment seeking behavior for
childhood malaria.
1.Identify target groups, such as children and youth for
malaria prevention and control and bring down the observed
disease burden in this particular community.
2.There is a need to strengthen community education. Also
introduce integrated malaria vector control strategy, since most of
the respondents use only bed-nets as the most common preventive
measure.
3.The community should have access to any f a health
institution within less than one hours walking distance and get
health education because lack of education is associated with
delay to seek health.
4.There is a need for Subsequent health education regarding
malaria and promote general education of the community to suit
the economic circumstances of women in the study area.
5.Greater awareness and health education for mothers,
particularly on early treatment-seeking and appropriate use of
health care options for malaria. A regular workshop on malaria
prevention should be held regularly with the women, thereby
raising their awareness and understanding, and involving them in
malaria prevention.
6.A more concerted effort is needed for scaling –up the
distribution of bed-nets (ITNs), improving the knowledge of the
community about the link between malaria and mosquitoes,
causation of malaria and its preventive methods particularly on the
proper utilization of bed-nets.

International Journal of Scientific and Research Publications, Volume 10, Issue 1, January 2020 472
ISSN 2250-3153
http://dx.doi.org/10.29322/IJSRP.10.01.2020.p9772 www.ijsrp.org
7. Effective antimalaria drugs should also be available in the
community and malaria drugs should be free or affordable for
children under five to encourage mothers utilize the public health
facilities.
8. Women should be given opportunity for higher education
in order to develop more positive attitudes towards treatment
seeking for malaria.
9.There should be an intensive and extensive media
enlightment campaign on accessibility to treatment, dangers of
mosquitoes, prevention and control, both by the electronic and
print media in English and local languages.
REFERENCES
[1] Agyepong IA, Manderson L (1999): Mosquito avoidance and bed-net use in
Greater Accra Region, Ghana. J Bioso. Sci, 3: 79 -92
[2] Agyepong IA, Manderson L(1994): The diagnosis and management of fever at household level in the Greater Accra Region, Ghana. Acta Trop 58: 317 – 330.
[3] Agu,A.P. and Nwojiji,N.(2005).Childhood malaria: Mothers perception and treatment seeking behavior in a community in Ebonyi state, South East Nigeria. Journal of Community Medicine and Primary Heath Care.17 (1):45-50.
[4] Ahorlu CK, Dunyosk, Afari E, Koram KA, Nkrimah FK (1997): Malaria related beliefs and behavior in Southern Ghana: implications from treatment, prevention and centrol.Trop Med Int Health, 2: 488-499
[5] Aurelien,F.and Richard,L.(2008).Health-Seeking Behaviour for Childhood malaria:A Retrospective Study of two Districts in Ghana. Journal of Biosocial Science 41(1): 1-19.
[6] Audrey,P. Eboni,T. and David N.(2008).Bed net ownership, use and perceptions among women seeking antenatal care in Kinshasa, Democratic Republic of the Congo (DRC): Opportunities for improved maternal and child health BMC Public Health 8:331.
[7] Ayodele,S.J.(1997).African Culture and Health. Stirling-Horden publishers, Ibadan
[8] Bradley, D. (1996). Malaria - Whence and Whither? In: Targett, G.A.T.(editor). Malaria: waiting for the vaccine. Chichester: John Wiley & Sons.
[9] Chibwana A., Mathanga, D. P., Chinkhumba J.,Campbell C.(2009). Socio-cultural predictors of health-seeking behaviour for febrile under-five children in Mwanza-Neno district, Malawi. Malaria Journal, 8:219.
[10] Chukwuocha, U;,Nwankwo, B; Esomonu, O;Dozie, E.; Ikegwuoha, A;. Nwabueze, P and Mbagwu,S.(2009). Treatment Seeking Behaviour of Mothers for Febrile Children in Some Rural Parts of Imo State Nigeria: Implications for Home Management of Malaria in Endemic Areas; International Journal of Tropical Medicine, 4(3):132-135.
[11] David, M. M; Anisa, M; Edward, J. M; Jessie, M; Amir, A; and Kumanan, W.(2009)
[12] Barriers to the effective treatment and prevention of malaria in Africa: A Systematic Review of qualitative studies.BMC Int Health Hum Rights. 9: 26.Published online 2009 October 25. doi: 10.1186/1472-698X-9-26.
[13] Daboer, J.C, John C, Jamda, A.M, Chingle, M.P and Ogbonna C.(2010). Knowledge and treatment practices of malaria among mothers and caregivers of children in an urban slum in Jos, Nigeria. Nigerian Journal of Medicine. 19(2):184-7.
[14] Deressa W. Alli A Enquosellassie A. Knowledge, attitude and practice
about malaria.
[15] Dike N, Onwujekwe O, Ojukwu J, Ikeme A, Uzochukwu B, ShuE(2006): central Influence of education and knowledge on perceptions and practices to malaria in south east Nigeria; soc sci med, 63:103 -106.
[16] Dunyo, S.K (2000). Health centre versus home presumptive Diagnosis of
[17] Malaria in Southern Ghana: implication for Home Based Policy.
[18] Transaction of the Royal society of Tropical Medicine and Hygiene, 94:285-288.
[19] Federal Ministry of Health (2005). Roll Back Malaria. Training Manual on Community based promotion of the use of ITNs in Nigeria. FMOH, Abuja.
[20] Federal Ministry of Health (2005). National Malaria Control Programme in Nigeria. Annual Report. FMOH, Abuja.
[21] Federal Ministry of Health (2007). Ward Minimum Health Care Package 2007 to 2012. National Primary Health Care Development Agency, Abuja,
Nigeria.
[22] Federal Ministry of Health (2010). National Malaria Control Programme in Nigeria. Annual Report. FMOH, Abuja.
[23] Federal Ministry of Health (2012): Roll Back Malaria Partnership: Progress
and Impact Series. Country Reports, Number 4, April 2012.
[24] Federal Ministry of Health (2008) Federal Republic of Nigeria: Training Manual for management of malaria in Nigeria. Abuja: Federal Ministry
of Health, National Malaria and Vector Control Division.
[25] Goodman, C., Brieger,W. ,Unwin, A., Mills, A., Meek, S., Greer, G., (2007) Medicine sellers and malaria treatment in sub- Saharan Africa: what do they do and how can their practice be improved? American Journal of Tropical medicine and Hygiene, 77: 203 – 218.
[26] Goldman, N. and Heuveline, P. (2000) Health, Seeking Behaviour for Child
Illness in Guatemala. Tropical Medicine and International Health, 5: 145- 155.
[27] Guyatt HL and snow RW (2004) The management of Fevers in Kenyan Children and adults in an area of Seasonal malaria transmission. Transaction of the Royal society of Tropical Medicine and Hygiene 98:111-115.
[28] Hill, Z, Kendali, C and Auther, P. (2003) Recognizing Childhood illness and their Traditional seeking intervention in Rural Ghana. Tropical Medicine
international Health. 8: 879 – 889.
[29] Humprey,D.;Emmanuel,O.;Wilhellmus,M.;Paulina,M.;Maria,Z.;Eliningaya,K.;Lodslaus,M. and Jorg, H.(2010). Knowledge, Attitudes, and Practices about Malaria and Its Control in Rural Northwest Tanzania. Malaria Research and Treatment Volume 2010 Article ID 794261, doi:10.4061/2010/794261.Accessed 12/01/12
[30] Igun,U.A.(1982).Why we Seek Treatment Here: Retail Pharmacy and Clinical practice in Maiduguri, Nigeria; Social Science and Medicine 24:689-695.
[31] Iwelunmor,J.,Oladipo,I.,Adeniyi,A.,and Collins,O.(2010) Child malaria Treatment Decisions by mothers of children less than five years of age attending an outpatient clinic in South West Nigeria. An Application of PEN-3 Cultural Model. Malaria Journal 9:354
[32] James,O., Kitara,D.and Orah,C.G.(2011).Knowledge and Misconceptions about Malaria among Pregnant Women in a Post-Conflict Internally Displaced Persons' Camps in Gulu District, Northern Uganda. Malaria Research and Treatment, Article ID 107987, doi:10.4061/2011/107987.
[33] Jaston W.(2004).Medical Ecology. http://www.medicalecology.org/disease/malaria/print malaria.htm. Accessed 12/01/12.
[34] Kengeya – Kayendo JF, Seeley JA, Kajura – Bajenja E, Kabunga E, Mulder DW: Recognition, treatment seeking behavior and perception of cause of malaria among rural women in Uganda.
[35] Kofoed PE, Rodrigues A., COF Hedegaard K., Rombo L and Aaby P (2004) which children come to the health centre for treatment of malaria? Acta Tropica, 90CI): 17 -32
[36] Marcus,N.D.(2013).Treatment-Seeking Behaviour of Mothers for Childhood Malaria in Nasarawa State,North Central Nigeria. NSUK Journal of Science and Technology;3(1&2):117-128.
[37] Mike W (2000). Medical Entomology for students. Second edition; Liver pool School of Tropiocal Medicine, Liverpool, UK.
[38] Muller O., Trawre C and Becher H Kouyate B (2003) Malaria morbidity, treatment seeking behavior, and mortality in a cohort of young children in rural Burkina Faso. Tropical Medicine and International Health, 8:290 -296
[39] Mwenessi H, Harpham T, Snow RW (1995): Child Malaria treatment practices among mothers in Kenya. Soc Sci Med, 40: 1271 – 1277.
[40] Nigeria Demographic and Health Survey (2003). National Population Commission, Abuja: Nigerian Government.
[41] Nicholas J. White / Joel G. Breman . Harrison(2008), Principles of internal medicine, seventeenth edition, Nyamongo I.K (2002) Health care switching Behaviour of malaria Patient in a
[42] Kenya Rural Community. Social Science and Medicine,54:377- 386

International Journal of Scientific and Research Publications, Volume 10, Issue 1, January 2020 473
ISSN 2250-3153
http://dx.doi.org/10.29322/IJSRP.10.01.2020.p9772 www.ijsrp.org
[43] Okeke, T. A and Okafor, H.U. (2002) Perception and Treatment Seeking Behavior for malaria in Rural Nigeria, Enugu, Department of Community Medicine, University of Nigeria.
[44] Okeke TA., Uzochukwu BS and Okafor v (2006) An in-depth study of patent medicine sellers’ perspectives on malaria in Journal S:97.
[45] Okeke,T.A and Okafor,H.U(2008).Perception and Treatment Seeking Behavior for Malaria in Rural Nigeria: Implications for Control .J. Hum. Ecol., 24(3): 215-222
[46] Onwujekwe,O.,Ojukwu,B.,Dike,N.Ikeme,A.and Eshu,E.(2005).Where do people from different socio-economic groups receive diagnosis and treatment for presumptive malaria in south-eastern Nigeria?.Annals of Tropical Medicine and Parasitology; 99(5): 473-481.
[47] Osagbemi,M.O.(1998).Knowledge Concerning the control, transmission and treatment of malaria among the residents of the Riverine Area of Kogi state. Journal of Environmental Sciences,1(2):94-103.
[48] Oyewole and Ibidapo(2007). Attitudes to malaria, prevention, treatment and management strategies associated with the prevalence of malaria in a Nigerian urban center. African Journal of Biotechnology. 6 (21): 2424 -2427.
[49] Palumbo, D.J. (1969). Statistics in Political and Behavioural Science. New York: Appleton-Century-Crofts.
[50] Palafox B. Patouillard E. Tougher S. Goodman C and Kara Hanson (2009). ACT Watch; evidence for malaria medicine and Policy outlet Survey
Report (Baseline) Nigeria.
[51] Raccurt CP, Bouriame C, Lambert MT(1993). Malaria Indices, Larva ecology and tropic activity of Anophehes mosquitoes in Djohong (Adamaoua, Cameroon) in the Rainy season. Med Trop (Mars). 53 (3): 355 – 362.
[52] Sirima, S.B. (2003). Early Treatment of childhood fever with pre-packaged Reduces severe malaria morbidity in Burkina Faso. Tropical Medicine and International Health, 8:1-7.
[53] Sheikh BT and Hatcher J. (2005).Health seeking behavior and Health service utilization in Pakistan, Challenging the Policy makers; J. Public Health: 27: 49-54.
[54] Sheeran, P. and Abraham, C. (1995). The Health Belief Model, in Predicting Health
[55] Behaviour. In Conner, M. & Norman, P.( eds.). Buckingham: Open University Press
[56] Susanne,H.M.(2000),Community Understanding of malaria and treatment seeking behavior in a holoendemic area of Southeastern Tanzania. Inaugural Dissertation, Universitat Basel, Switzerland.
[57] Susanne,H.M,Joan,M.R. and Isaac,N.(2003).Health Seeking Behaviour and the Health System Response.DCC Working paper NO:4.
[58] Tinoula, F.(2009).Theoretical Considerations in Health Sociology; Sintex & Design, Makurdi
[59] Traore, F.N.(2005).Rolling Back Malaria: Opportunities and Challenges: Transactions of the Royal Society of Tropical Medicine and Hygiene 9(7):403-406
[60] The Carter center(2011). Available from http//wwwcartercenter.org/index. Html
[61] WHO(1992).Implementation of the global strategy for malaria control. Report of a WHO
[62] Study Group. Technical Report services, Geneva, World Health Organization.
[63] WHO (1993). Implementation of the Global Malaria Control Strategy. Report of a WHO study group on the implementation of the global plan for action for malaria control 1993-2000, WHO Technical Report Series 839, WHO, Geneva
[64] WHO (1997).Malaria: Know the facts. World Health Organization. Newsletter 13(1):6-7.
[65] WHO (1999) World Health Report 1999. Geneva: World Health Organization.
[66] WHO (2000) World Health Report 2000. Geneva: World Health Organization
[67] WHO (2003) World Health Report 2000. Geneva: World Health Organization.
[68] WHO (2004) World Health Report 2000. Geneva: World Health Organization.
[69] WHO(2008). Global malaria control and elimination: report of a technical review, Geneva. Available at MalariaControlEliminationMeeting.pdf.
[70] WHO (2009). World Health Report 2008. Geneva: World Health Organization.
[71] WHO/UNAIDS(2009.) Guidelines for core population based indicators.
[72] http://GuidelinesForCorePopulationFINAL9-20_Malaria.pdf. Accessed 21/8/10.
[73] WHO (2010). World Health Report 2009. Geneva: World Health Organization.
[74] WHO (2010). World Health Report 2009. Geneva: World Health Organization.
[75] WHO (2011). World Health Report 2008. Geneva: World Health Organization.
[76] WHO (2012). World Health Report 2008. Geneva: World Health Organization
AUTHORS
First Author – Oahimire, Oise Joan, [email protected]
Second Author – Pofung, Zachariah Freejob,
[email protected], Department of Geography and Planning,
University of Jos, Plateau State, Nigeria
International Journal of Scientific and Research Publications, Volume 10, Issue 1, January 2020 474
ISSN 2250-3153
http://dx.doi.org/10.29322/IJSRP.10.01.2020.p9773 www.ijsrp.org
Comparative Scrotal Ultrasound Findings in Fertile
and Infertile Males in Jos, North Central Nigeria
Igoh E.O∗, Ofoha C.G∗∗, Atsukwei D∗∗,Ekwere E.O∗∗, Salaam A.J∗∗, Gabkwet E.A∗∗, Taiwo Y.F∗∗, Danjem S.M∗∗,
Igoh C.S∗∗
First Author -Igoh Emmanuel Owoicho(MBBS,FWACS).Department of Radiology, Jos University Teaching Hospital, Plateau State, Nigeria.Email-
Second Author-Ofoha Chima G.(MBBS, FWACS).Division of Urology, Department of Surgery, Jos University Teaching Hospital, Plateau
Third Author-Atsukwei Denen.(MBBS,FWACS).Department of Radiology, Federal Medical Centre,Keffi Nasarawa State, Nigeria. Email-
Fourth Author-Ekwere O. Ekwere(BSc, MSc, PhD).Department of Human Anatomy, University of Jos, Plateau state, Nigeria .Email-
Fifth Author -Gabkwet E. Anthony.(MBBCh,FWACS).Department of Radiology, Jos University Teaching Hospital, Plateau State, Nigeria.Email-
Sixth Author -Salaam Abdul Jimoh.(MBBCh,FMCR).Department of Radiology, Jos University Teaching Hospital, Plateau State, Nigeria.Email-
seventh Author- Taiwo Yetunde F.(MBBS,FWACS).Department of Radiology, Jos University Teaching Hospital, Plateau State, Nigeria.Email-
Eighth Author -Danjem Samuel Moses.(MBBCh,FMCR).Department of Radiology, Jos University Teaching Hospital, Plateau State, Nigeria.Email-
Ninth Author -Igoh Catherine Sekyen(MBBCh,FMCR).Department of Community Medicine, Jos University Teaching Hospital, Plateau State,
DOI: 10.29322/IJSRP.10.01.2020.p9773
http://dx.doi.org/10.29322/IJSRP.10.01.2020.p9773
Abstract- Introduction: Infertility remains a threat to successful
reproduction by couples desirous of pregnancy. Since the
seminiferous tubules make up 70%–80% of the testicular mass,
the testicular volume reflects spermatogenesis. The testicular
volume demonstrates a relationship with the semen profiles in
infertile men, and its measurement has been used to estimate
spermatogenesis.
Materials and Methods: This was a cross-sectional
comparative study where 85 infertile and 85 fertile male subjects
were recruited and examined in Jos University Teaching Hospital.
All the subjects had their seminal fluids analyzed and their testes
examined using a high frequency(10 MHZ) linear transducer of an
ultrasound scanner. The results were expressed as percentages and
tests of significance were done using the chi-square and Student’s
t-test. A P-value of < 0.05 was considered statistically significant.
Results : The common abnormal scrotal ultrasound findings
were hydroceles (32.7%), bilateral small volume testes (24.7%)
and varicocele (22.9%).There were statistically significant
difference between fertile and infertile men (p<0.05).The average
testicular volume for fertile and infertile groups were 14.07 ± 3.08
ml and 9.37 ± 3.57 ml respectively (p<0.05).There was positive
strong linear association between testicular volume and sperm
count (coefficient of correlation 'r' =0.481, p<0.05).
Conclusion :This study found a strong positive correlation
between ultrasound measured testicular volume and total sperm
count. It was also observed that the critical mean testicular volume
of less than 10.3ml is associated with sub-fertility.
Index Terms- Male infertility, Seminal fluid analysis, mean
testicular volume, scrotal ultrasound
I. INTRODUCTION
arenthood is undeniably one of the most universally desired
goals in adulthood, and most people have life plans that
include children. However, not all couples who desire a pregnancy
will achieve one spontaneously and a proportion of couples will
need medical help to resolve underlying fertility problems.
Infertility is defined as inability of couples to achieve
conception despite regular unprotected sexual intercourse for one
year1.Infertility in the male refers to the inability of a man to
impregnate a woman after 12 months of regular and unprotected
sexual intercourse that is if the woman has no gynecological
problems1.
About 8–12% of couples worldwide experienced some
form of infertility during their reproductive lives, thus affecting
50–80 million couples with 20–35 million in Africa. It was
therefore extrapolated that 3–4 million Nigerian couples are
affected.2
The prevalence of infertility in Sub-Sahara Africa ranges
from 20% to 40%. Fertility problems are shared by both male and
females. Sub-fertile men are investigated to find a cause for their
infertility.3
The aetiology of male infertility is multifactorial. The
major causes of male factor infertility in Nigeria are infection and
hormonal abnormalities.4
P
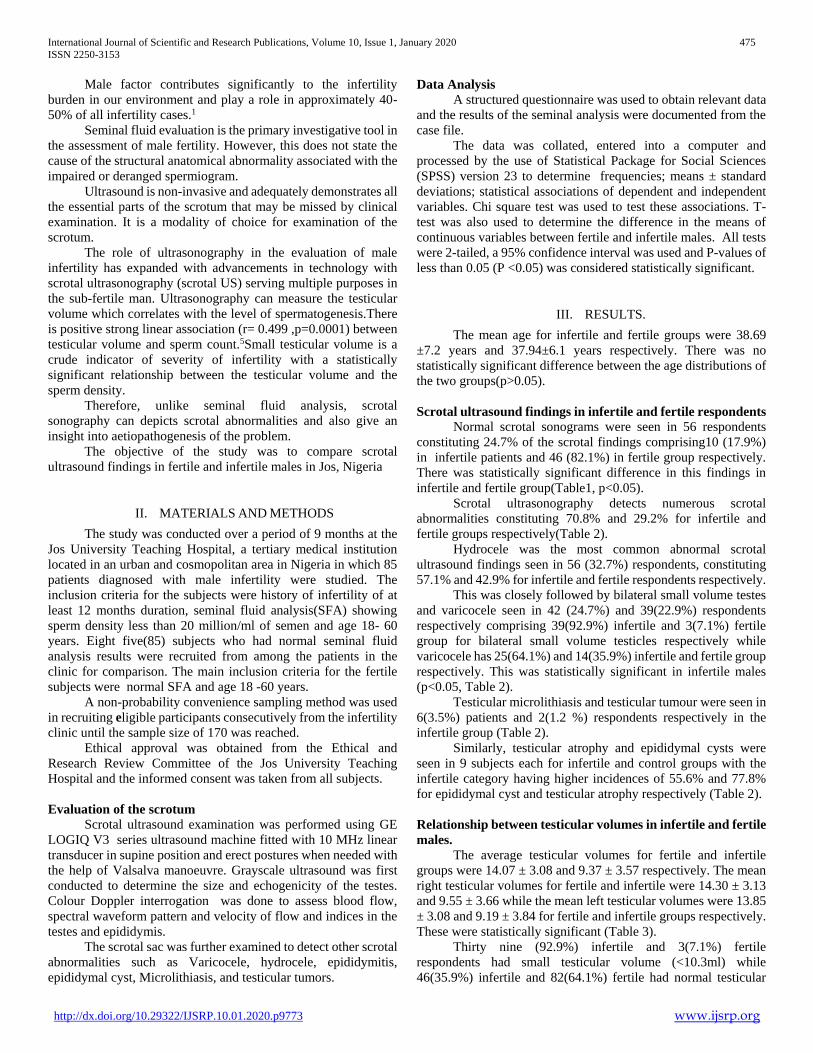
International Journal of Scientific and Research Publications, Volume 10, Issue 1, January 2020 475
ISSN 2250-3153
http://dx.doi.org/10.29322/IJSRP.10.01.2020.p9773 www.ijsrp.org
Male factor contributes significantly to the infertility
burden in our environment and play a role in approximately 40-
50% of all infertility cases.1
Seminal fluid evaluation is the primary investigative tool in
the assessment of male fertility. However, this does not state the
cause of the structural anatomical abnormality associated with the
impaired or deranged spermiogram.
Ultrasound is non-invasive and adequately demonstrates all
the essential parts of the scrotum that may be missed by clinical
examination. It is a modality of choice for examination of the
scrotum.
The role of ultrasonography in the evaluation of male
infertility has expanded with advancements in technology with
scrotal ultrasonography (scrotal US) serving multiple purposes in
the sub-fertile man. Ultrasonography can measure the testicular
volume which correlates with the level of spermatogenesis.There
is positive strong linear association (r= 0.499 ,p=0.0001) between
testicular volume and sperm count.5Small testicular volume is a
crude indicator of severity of infertility with a statistically
significant relationship between the testicular volume and the
sperm density.
Therefore, unlike seminal fluid analysis, scrotal
sonography can depicts scrotal abnormalities and also give an
insight into aetiopathogenesis of the problem.
The objective of the study was to compare scrotal
ultrasound findings in fertile and infertile males in Jos, Nigeria
II. MATERIALS AND METHODS
The study was conducted over a period of 9 months at the
Jos University Teaching Hospital, a tertiary medical institution
located in an urban and cosmopolitan area in Nigeria in which 85
patients diagnosed with male infertility were studied. The
inclusion criteria for the subjects were history of infertility of at
least 12 months duration, seminal fluid analysis(SFA) showing
sperm density less than 20 million/ml of semen and age 18- 60
years. Eight five(85) subjects who had normal seminal fluid
analysis results were recruited from among the patients in the
clinic for comparison. The main inclusion criteria for the fertile
subjects were normal SFA and age 18 -60 years.
A non-probability convenience sampling method was used
in recruiting eligible participants consecutively from the infertility
clinic until the sample size of 170 was reached.
Ethical approval was obtained from the Ethical and
Research Review Committee of the Jos University Teaching
Hospital and the informed consent was taken from all subjects.
Evaluation of the scrotum
Scrotal ultrasound examination was performed using GE
LOGIQ V3 series ultrasound machine fitted with 10 MHz linear
transducer in supine position and erect postures when needed with
the help of Valsalva manoeuvre. Grayscale ultrasound was first
conducted to determine the size and echogenicity of the testes.
Colour Doppler interrogation was done to assess blood flow,
spectral waveform pattern and velocity of flow and indices in the
testes and epididymis.
The scrotal sac was further examined to detect other scrotal
abnormalities such as Varicocele, hydrocele, epididymitis,
epididymal cyst, Microlithiasis, and testicular tumors.
Data Analysis
A structured questionnaire was used to obtain relevant data
and the results of the seminal analysis were documented from the
case file.
The data was collated, entered into a computer and
processed by the use of Statistical Package for Social Sciences
(SPSS) version 23 to determine frequencies; means ± standard
deviations; statistical associations of dependent and independent
variables. Chi square test was used to test these associations. T-
test was also used to determine the difference in the means of
continuous variables between fertile and infertile males. All tests
were 2-tailed, a 95% confidence interval was used and P-values of
less than 0.05 (P <0.05) was considered statistically significant.
III. RESULTS.
The mean age for infertile and fertile groups were 38.69
±7.2 years and 37.94±6.1 years respectively. There was no
statistically significant difference between the age distributions of
the two groups(p>0.05).
Scrotal ultrasound findings in infertile and fertile respondents
Normal scrotal sonograms were seen in 56 respondents
constituting 24.7% of the scrotal findings comprising10 (17.9%)
in infertile patients and 46 (82.1%) in fertile group respectively.
There was statistically significant difference in this findings in
infertile and fertile group(Table1, p<0.05).
Scrotal ultrasonography detects numerous scrotal
abnormalities constituting 70.8% and 29.2% for infertile and
fertile groups respectively(Table 2).
Hydrocele was the most common abnormal scrotal
ultrasound findings seen in 56 (32.7%) respondents, constituting
57.1% and 42.9% for infertile and fertile respondents respectively.
This was closely followed by bilateral small volume testes
and varicocele seen in 42 (24.7%) and 39(22.9%) respondents
respectively comprising 39(92.9%) infertile and 3(7.1%) fertile
group for bilateral small volume testicles respectively while
varicocele has 25(64.1%) and 14(35.9%) infertile and fertile group
respectively. This was statistically significant in infertile males
(p<0.05, Table 2).
Testicular microlithiasis and testicular tumour were seen in
6(3.5%) patients and 2(1.2 %) respondents respectively in the
infertile group (Table 2).
Similarly, testicular atrophy and epididymal cysts were
seen in 9 subjects each for infertile and control groups with the
infertile category having higher incidences of 55.6% and 77.8%
for epididymal cyst and testicular atrophy respectively (Table 2).
Relationship between testicular volumes in infertile and fertile
males.
The average testicular volumes for fertile and infertile
groups were 14.07 ± 3.08 and 9.37 ± 3.57 respectively. The mean
right testicular volumes for fertile and infertile were 14.30 ± 3.13
and 9.55 ± 3.66 while the mean left testicular volumes were 13.85
± 3.08 and 9.19 ± 3.84 for fertile and infertile groups respectively.
These were statistically significant (Table 3).
Thirty nine (92.9%) infertile and 3(7.1%) fertile
respondents had small testicular volume (<10.3ml) while
46(35.9%) infertile and 82(64.1%) fertile had normal testicular
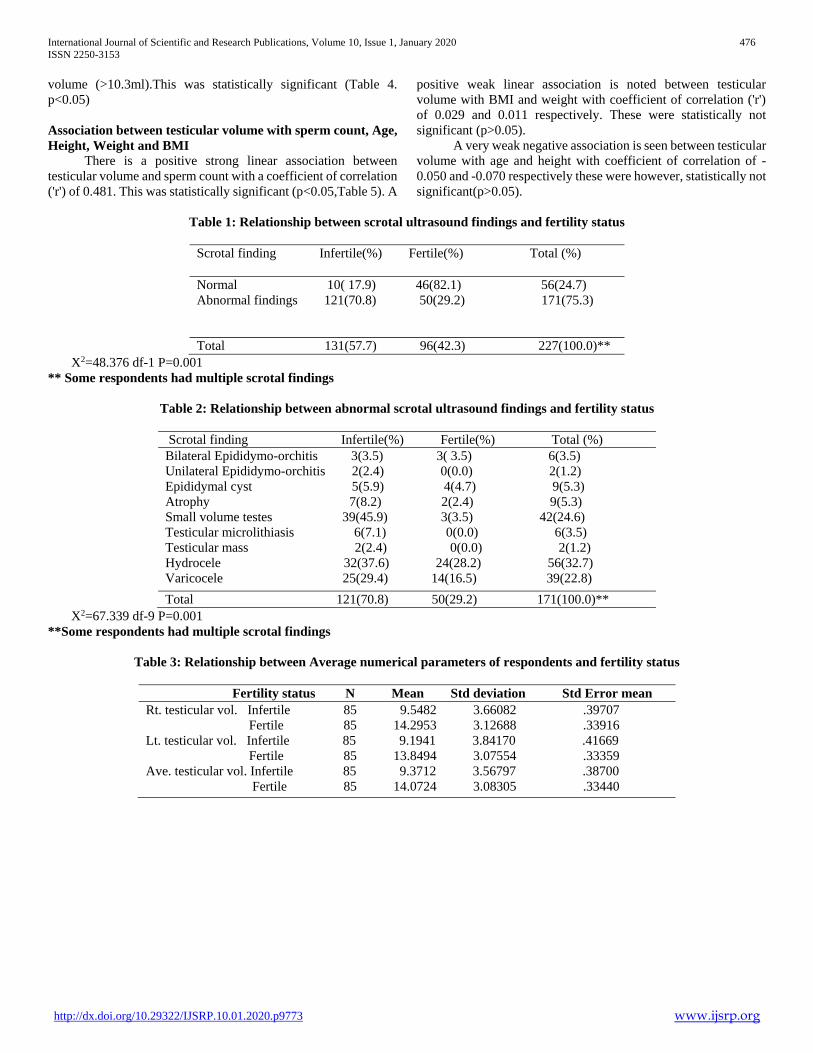
International Journal of Scientific and Research Publications, Volume 10, Issue 1, January 2020 476
ISSN 2250-3153
http://dx.doi.org/10.29322/IJSRP.10.01.2020.p9773 www.ijsrp.org
volume (>10.3ml).This was statistically significant (Table 4.
p<0.05)
Association between testicular volume with sperm count, Age,
Height, Weight and BMI
There is a positive strong linear association between
testicular volume and sperm count with a coefficient of correlation
('r') of 0.481. This was statistically significant (p<0.05,Table 5). A
positive weak linear association is noted between testicular
volume with BMI and weight with coefficient of correlation ('r')
of 0.029 and 0.011 respectively. These were statistically not
significant (p>0.05).
A very weak negative association is seen between testicular
volume with age and height with coefficient of correlation of -
0.050 and -0.070 respectively these were however, statistically not
significant(p>0.05).
Table 1: Relationship between scrotal ultrasound findings and fertility status
Scrotal finding Infertile(%) Fertile(%) Total (%)
Normal 10( 17.9) 46(82.1) 56(24.7)
Abnormal findings 121(70.8) 50(29.2) 171(75.3)
Total 131(57.7) 96(42.3) 227(100.0)**
X2=48.376 df-1 P=0.001
** Some respondents had multiple scrotal findings
Table 2: Relationship between abnormal scrotal ultrasound findings and fertility status
Scrotal finding Infertile(%) Fertile(%) Total (%)
Bilateral Epididymo-orchitis 3(3.5) 3( 3.5) 6(3.5)
Unilateral Epididymo-orchitis 2(2.4) 0(0.0) 2(1.2)
Epididymal cyst 5(5.9) 4(4.7) 9(5.3)
Atrophy 7(8.2) 2(2.4) 9(5.3)
Small volume testes 39(45.9) 3(3.5) 42(24.6)
Testicular microlithiasis 6(7.1) 0(0.0) 6(3.5)
Testicular mass 2(2.4) 0(0.0) 2(1.2)
Hydrocele 32(37.6) 24(28.2) 56(32.7)
Varicocele 25(29.4) 14(16.5) 39(22.8)
Total 121(70.8) 50(29.2) 171(100.0)**
X2=67.339 df-9 P=0.001
**Some respondents had multiple scrotal findings
Table 3: Relationship between Average numerical parameters of respondents and fertility status
Fertility status N Mean Std deviation Std Error mean
Rt. testicular vol. Infertile 85 9.5482 3.66082 .39707
Fertile 85 14.2953 3.12688 .33916
Lt. testicular vol. Infertile 85 9.1941 3.84170 .41669
Fertile 85 13.8494 3.07554 .33359
Ave. testicular vol. Infertile 85 9.3712 3.56797 .38700
Fertile 85 14.0724 3.08305 .33440
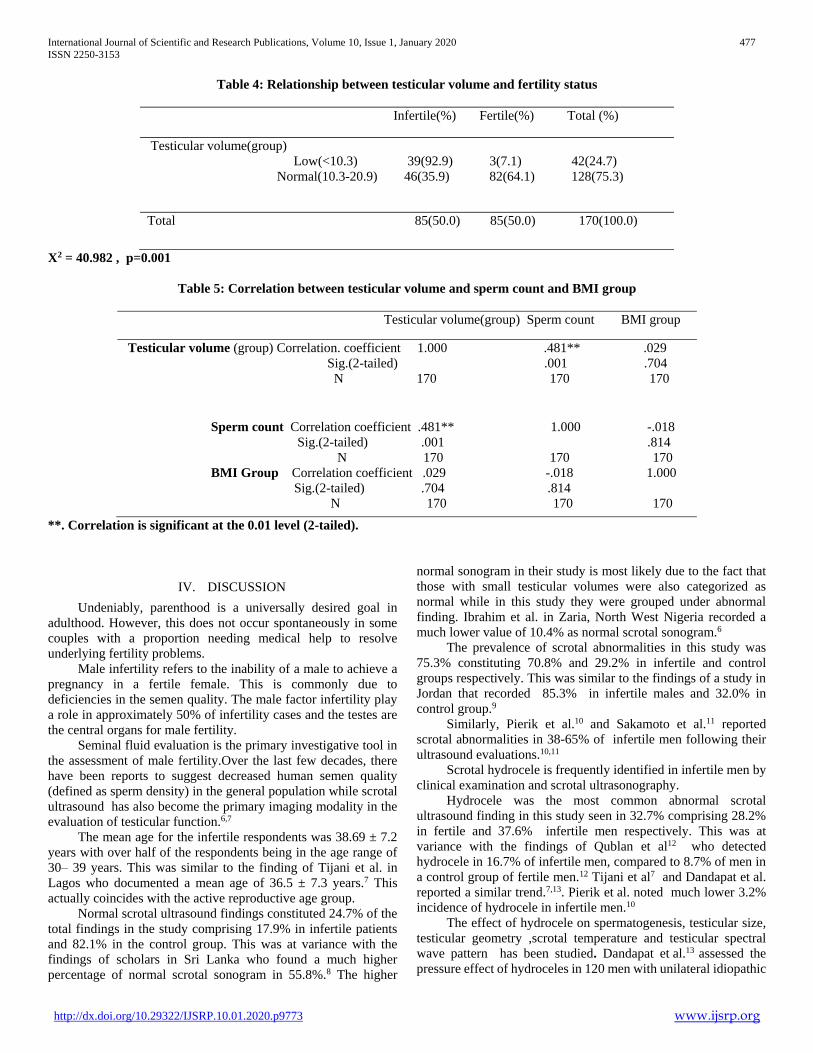
International Journal of Scientific and Research Publications, Volume 10, Issue 1, January 2020 477
ISSN 2250-3153
http://dx.doi.org/10.29322/IJSRP.10.01.2020.p9773 www.ijsrp.org
Table 4: Relationship between testicular volume and fertility status
Infertile(%) Fertile(%) Total (%)
Testicular volume(group)
Low(<10.3) 39(92.9) 3(7.1) 42(24.7)
Normal(10.3-20.9) 46(35.9) 82(64.1) 128(75.3)
Total 85(50.0) 85(50.0) 170(100.0)
X2 = 40.982 , p=0.001
Table 5: Correlation between testicular volume and sperm count and BMI group
Testicular volume(group) Sperm count BMI group
Testicular volume (group) Correlation. coefficient 1.000 .481** .029
Sig.(2-tailed) .001 .704
N 170 170 170
Sperm count Correlation coefficient .481** 1.000 -.018
Sig.(2-tailed) .001 .814
N 170 170 170
BMI Group Correlation coefficient .029 -.018 1.000
Sig.(2-tailed) .704 .814
N 170 170 170
**. Correlation is significant at the 0.01 level (2-tailed).
IV. DISCUSSION
Undeniably, parenthood is a universally desired goal in
adulthood. However, this does not occur spontaneously in some
couples with a proportion needing medical help to resolve
underlying fertility problems.
Male infertility refers to the inability of a male to achieve a
pregnancy in a fertile female. This is commonly due to
deficiencies in the semen quality. The male factor infertility play
a role in approximately 50% of infertility cases and the testes are
the central organs for male fertility.
Seminal fluid evaluation is the primary investigative tool in
the assessment of male fertility.Over the last few decades, there
have been reports to suggest decreased human semen quality
(defined as sperm density) in the general population while scrotal
ultrasound has also become the primary imaging modality in the
evaluation of testicular function.6,7
The mean age for the infertile respondents was 38.69 ± 7.2
years with over half of the respondents being in the age range of
30– 39 years. This was similar to the finding of Tijani et al. in
Lagos who documented a mean age of 36.5 ± 7.3 years.7 This
actually coincides with the active reproductive age group.
Normal scrotal ultrasound findings constituted 24.7% of the
total findings in the study comprising 17.9% in infertile patients
and 82.1% in the control group. This was at variance with the
findings of scholars in Sri Lanka who found a much higher
percentage of normal scrotal sonogram in 55.8%.8 The higher
normal sonogram in their study is most likely due to the fact that
those with small testicular volumes were also categorized as
normal while in this study they were grouped under abnormal
finding. Ibrahim et al. in Zaria, North West Nigeria recorded a
much lower value of 10.4% as normal scrotal sonogram.6
The prevalence of scrotal abnormalities in this study was
75.3% constituting 70.8% and 29.2% in infertile and control
groups respectively. This was similar to the findings of a study in
Jordan that recorded 85.3% in infertile males and 32.0% in
control group.9
Similarly, Pierik et al.10 and Sakamoto et al.11 reported
scrotal abnormalities in 38-65% of infertile men following their
ultrasound evaluations.10,11
Scrotal hydrocele is frequently identified in infertile men by
clinical examination and scrotal ultrasonography.
Hydrocele was the most common abnormal scrotal
ultrasound finding in this study seen in 32.7% comprising 28.2%
in fertile and 37.6% infertile men respectively. This was at
variance with the findings of Qublan et al12 who detected
hydrocele in 16.7% of infertile men, compared to 8.7% of men in
a control group of fertile men.12 Tijani et al7 and Dandapat et al.
reported a similar trend.7,13. Pierik et al. noted much lower 3.2%
incidence of hydrocele in infertile men.10
The effect of hydrocele on spermatogenesis, testicular size,
testicular geometry ,scrotal temperature and testicular spectral
wave pattern has been studied. Dandapat et al.13 assessed the
pressure effect of hydroceles in 120 men with unilateral idiopathic
International Journal of Scientific and Research Publications, Volume 10, Issue 1, January 2020 478
ISSN 2250-3153
http://dx.doi.org/10.29322/IJSRP.10.01.2020.p9773 www.ijsrp.org
hydrocele and found no pressure effect in 70% of men, testicular
flattening in 22% of the cohort and pressure-induced testicular
atrophy in 8% of patients. Turgut et al.14 noted time-related
testicular size declines in patients with hydrocele and described a
rounding rather than flattening effect of hydrocele on testicular
shape.14
Some investigators have shown that hydrocele can affect
spermatogenesis, which may be partially or totally absent.13The
possible mechanisms that underlie impaired spermatogenesis
include the pressure effect of the hydrocele on the testis,14 the
reaction of testicular cells to the highly proteinaceous fluid, and
raised intrascrotal temperature.15The hydrostatic pressure of a
hydrocele exceeds the pressure in blood vessels within the
scrotum,16 which interferes with arterial blood flow and might
have an ischemic effect on the testicle.
In this study bilateral small volume testes and varicocele
also showed similar trend of higher prevalence in infertile group
compared to the control with prevalence of 92.9% versus 7.1%
and 64.1% versus 35.9% for bilateral volume small testes and
varicocele respectively.
Epididymal cysts were found in 5.3% of the participant
evaluated sonographically. This is consistent with finding of
Sakamoto et al in Japan who found epididymal cysts in 3.9% of
the patients.11They may cause infertility by either partial or
complete obstruction of the vas deferens.
Testicular microlithiasis was identified in 3.5% of the
patients and it is thought to impair testicular function via
immunological mechanism6. Various studies have reported
incidence of between 0.6-9.0% in the healthy population, and an
incidence of 0.8-20% in sub-fertile population11.Testicular
microlithiasis is associated with pathological conditions such as
Klinefelter’s syndrome, infertility, epididymal cysts,
cryptorchidism, atrophy and torsion.17However, in this study there
was no associated abnormality seen in patients with microlithiasis.
In this study, the mean testicular volume (MTV) in the control
group was 14.30 ± 3.13 ml and 13.85 ± 3.08ml for right and left
respectively. This study agrees with previous study of scholars
who reported mean volume of 15.38 ± 3.29 ml and 15.29 ± 3.89
ml for right and left respectively.18This was however at variance
with the mean testicular volumes of 18.13± 3.85 ml and
18.37±3.62 ml for right and left respectively obtained by scholars
in Seoul, Korea.19This was most likely due to the fact that the
sample size was restricted to normal young men age range
19-27 years unlike this study where control group were
between18years to 60 years. Testicular volume rapidly increases
during puberty and peaks at age 30 years and thus an advancing
age is a risk factor for decrease testicular volume.
The mean testicular volume in this study for the control
group was significantly higher than the mean testicular volume of
9.55 ± 3.66 ml and 9.37 ± 3.56 ml for right and left respectively in
the infertile group. This was consistent with the findings of other
authors who documented the mean testicular volumes of 7.66 ml
and 7.43 ml the right testis respectively8 and low testicular
volumes in men with infertility and oligospermia7, as the
seminiferous tubules responsible for spermatogenesis constitutes
about 80% of testicular volume. This was, however at variance
with the finding of a higher mean testicular volume of 18.3ml and
16.9ml for right and left respectively by Schiff et al. in New Yolk,
USA using 159 sub fertile men.20This value for MTV in infertile
men was also at variance with that reported by a study carried out
by Kiridi et al. which was 13.3 ml.17
In this study, a testicular volume below 10.3ml had
statistically significant effect on the fertility status of the
individual (p<0.05).
Similarly, scholars in Tokyo, Japan documented a critical
total testicular volume of 20ml (MTV of 10ml) using
ultrasonography indicating normal or nearly normal testicular
function.11 However, a study in Tirana, Albania using 500 sub-
fertile males, found that testicular volume has a direct correlation
with semen parameters and the critical mean testicular volume
indicating normal testicular function is 13.3 ml. The study also
concluded that measurement of testicular volume can be helpful
for assessing fertility at the initial physical examination.5,20
There was a positive strong linear association between
testicular volume and sperm count(r= 0.481 , p<0.05) in this study.
The study by Kristo et al. in Albania also showed positive
correlation between testicular volume and sperm count (r=0.499,
p<0.0001).5
Another study carried out in India by Sharath et al.21 also
showed a significant positive correlation between mean testicular
volume and sperm count (r=0.501 p <0.0001) as well as a higher
mean testicular volume for the fertile men compared to the
infertile population.21
The mean testicular volume for the control population in the
study by Sharath et al. in India was 11.45±2.65 ml while that for
the infertile patients was 7.31±3.6 ml.21
Testicular volume is a measure of the level of
spermatogenesis as there is relationship between the testicular
volume and sperm count per ejaculate.22 Small testicular volume
is a crude indicator of severity of infertility with a statistically
significant relationship between the testicular volume and the
sperm density.
The minimum testicular volume necessary for adequate
spermatogenesis is also yet to be determined. However, using the
punched-out orchidometer, others have reported a critical mean
testicular volume of 14 ml as the minimum for adequate
spermatogenesis and a critical total testicular volume of 30 ml as
the minimum for normal testicular function. However,
orchidometers are known to overestimate testicular size especially
the smaller testes.7
Condorelli et al. also found reduced semen parameters in
patients with mean testicular volume of less than 12 ml.22
In this study, there is positive weak linear association
(‘r’=0.029, p>0.05) between testicular volume with BMI and
weight of the participants. This was in agreement with the findings
of Kiridi et al that demonstrated a positive correlation between
testicular volume and BMI.17
A very weak negative association is seen between testicular
volume with age and height.
This was at variance with the findings of Sobowale et al.23
who reported a weak positive linear relationship between testicular
volume and height.23
V. CONCLUSION
This study found a strong positive correlation between
ultrasound measured testicular volume and total sperm count. It

International Journal of Scientific and Research Publications, Volume 10, Issue 1, January 2020 479
ISSN 2250-3153
http://dx.doi.org/10.29322/IJSRP.10.01.2020.p9773 www.ijsrp.org
was also observed that the critical mean testicular volumes of less
than 10.3ml is associated with sub-fertility.
Ultrasound scan of the scrotum and its content is safe, reliable and
indispensable modality in the evaluation of the scrotum and its
contents especially in sub fertile subjects as this may aid early
diagnosis and prompt management of treatable causes of
infertility.
VI. RECOMMENDATION
Scrotal ultrasound should be done routinely in the evaluation
of male infertility as it has been shown to give an insight to the
possible outcome of the seminal fluid analysis and detect
abnormalities that may not be clinically visible following clinical
examination alone.
REFERENCES
[1] Uadia P, Emokpae A.Male infertility in Nigeria:A neglected reproductive health issue requiring attention.2015. Journal of Basic and Clinical Reproductive Science.4(2):45–53.
[2] Thomas K, Adeoye I, Olusanya O.Biochemical markers in seminal plasma of sub-fertile Nigerian men.1995. Tropical Journal of Obstetric Gynaecology. 1995;15:19–22.
[3] Cooper TG, Noonan E, Von-Eckardstein S, Auger J, Baker H, Behre H, et al. World health organization refernce values for human semen characteristics.Human Reproductive Update. 2010;16(3):231–45.
[4] Emokpae M.A, Uadia PO, Mohammed AZ, Omale-Itodo A.Hormonal abnormalities in azoospermic men in Kano, Northern Nigeria. Indian J Med Res.2006;124(3):299–304.
[5] Kristo A, Dani E. The Correlation between Ultrasound Testicular Volume and Conventional Semen Parameters in Albanian Subfertile Males. OA Maced J Med Sci. 2014; 2(3):464-466
[6] Ibrahim MZ ,Tabari AM, Igashi JB, Lawal S,Ahmed M. Scrotal Doppler Ultrasound Evaluation in Zaria, Nigeria. Niger J Basic Clin Sci.2016;13:89-93.
[7] Tijani KHH, Oyende BOO, Awosanya GOO, Ojewola RWW, Lawal AOO, Yusuf AOO Scrotal abnormalities and infertility in west African men: A comparison of fertile and sub-fertile men using scrotal ultrasonography.African J Urol.2014;20(4):180–183.
[8] Pethiyagoda AUB , Pethiyagoda K .Scrotal sonography in the assessment of subfertile males. International J Sci Res Pub. 2017; 7(5).873-876.
[9] Malkawi HY, Qublan HS, Kakish ME,Abu-khait SA.Frequency of Scrotal Abnormalities Detected By Ultrasound in Infertile Men At King Hussein.J Reproductive Med.2001;11(1):35–9.
[10] Pierik F, Dohle G, van Muiswinkel J, Vreeburg J, Weber R. Is routine scrotal ultrasound advantageous in infertile men? J Urol. 1999;162(5):1618–20.
[11] Sakamoto H, Yajima T, Nagata M, Okumura T, Suzuki K , OgawaY.Relationship between testicular size by ultrasonography and testicular function: Measurement of testicular length, width, and depth in patients with infertility. Int J Urol.2008; 15(6):529–33.
[12] Qublan HS, Al-Okoor K, Al-Ghoweri AS, Abu-Qamar A.Sonographic spectrum of scrotal abnormalities in infertile men. J Clin Ultrasound.2007;35(8):437–41.
[13] Dandapat MC, Padhi NC, Patra AP. Effect of hydrocele on testis and spermatogenesis. Br. J. Surg.1990; 77, 1293–1294 .
[14] Turgut A T et al. Unilateral idiopathic hydrocele has a substantial effect on the ipsilateral testicular geometry and resistivity indices. J. Ultrasound Med.2006; 25, 837–843
[15] Mihmanli, I. et al. Testicular size and vascular resistance before and after hydrocelectomy. AJR Am. J. Roentgenol.2004; 183, 1379–1385.
[16] Rados N, Trnski D, Keros P, Rados J. The biomechanical aspect of testis hydrocele. Acta Med. Croatica.1996; 50, 33–36.
[17] Kiridi E, Nwankwo N, Akinola R, Agi C, Ahmed A.Ultrasound measurement of testicular volume in healthy Nigerian adults. J Asian Sci Res.2011; 2(2):45–52.
[18] Innocent MC, Asomugha LA, Ukamaka MN, Aronu ME. Ultrasound measured testicular volume in Nigeria adults: Relationship of the three formulae with height, body weight, body -surface area, and body-mass index. Int J Adv Med Health Res.2016;3:86-90
[19] Bahk J, Jung J, Jin L,Min S .Cut-off value of testes volume in young adults and correlation among testes volume, body mass index, hormonal level, and seminal profiles. Urology. 2010;75:1318–23.
[20] Schiff J D, Li PS, Goldstein, M .Correlation of ultrasonographic and orchidometer measurements of testis volume in adults. Bri J Urol int. 2004;93(7):1015-7
[21] Sharath KC, Najafi M, Vineeth VS, Malini SS .Assessment of Testicular Volume in Correlation with Spermiogram of Infertile Males in South India. Advanced Studies in Biology.2013;5(7):327-335
[22] Condorelli R, Calogero AE, La Vignera S. Relationship between Testicular Volume andConventional or Nonconventional Sperm Parameters. International Journal of Endocrinology. 2013;2013:145792. doi:10.1155/2013/145792. Epub 2013 Sep 5. PMID: 24089610; PMCID:
PMC3780703..
[23] Sobowale O, Akiwumi, O .Testicular volume and seminal fluid profile in fertile and infertile males in Ilorin, Nigeria. Int J Gynecol Obs.1989;28(2):155–61.
AUTHORS
First Author -Igoh Emmanuel
Owoicho(MBBS,FWACS).Department of Radiology, Jos
University Teaching Hospital, Plateau State, Nigeria.Email-
Second Author-Ofoha Chima G.(MBBS, FWACS).Division of
Urology, Department of Surgery, Jos University Teaching
Hospital, Plateau [email protected]
Third Author-Atsukwei Denen.(MBBS,FWACS).Department
of Radiology, Federal Medical Centre,Keffi Nasarawa State,
Nigeria. Email- [email protected]
Fourth Author-Ekwere O. Ekwere(BSc, MSc, PhD).Department
of Human Anatomy, University of Jos, Plateau state, Nigeria
Fifth Author -Gabkwet E.
Anthony.(MBBCh,FWACS).Department of Radiology, Jos
University Teaching Hospital, Plateau State, Nigeria.Email-
Sixth Author -Salaam Abdul
Jimoh.(MBBCh,FMCR).Department of Radiology, Jos
University Teaching Hospital, Plateau State, Nigeria.Email-
seventh Author- Taiwo Yetunde
F.(MBBS,FWACS).Department of Radiology, Jos University
Teaching Hospital, Plateau State, Nigeria.Email-
Eighth Author -Danjem Samuel
Moses.(MBBCh,FMCR).Department of Radiology, Jos
University Teaching Hospital, Plateau State, Nigeria.Email-
Ninth Author -Igoh Catherine
Sekyen(MBBCh,FMCR).Department of Community Medicine,
Jos University Teaching Hospital, Plateau State, Nigeria.Email-

International Journal of Scientific and Research Publications, Volume 10, Issue 1, January 2020 480
ISSN 2250-3153
http://dx.doi.org/10.29322/IJSRP.10.01.2020.p9773 www.ijsrp.org
∗Corresponding author-Igoh Emmanuel Owoicho. Tel.: +234
8069540540.E-mail address: [email protected]

International Journal of Scientific and Research Publications, Volume 10, Issue 1, January 2020 481
ISSN 2250-3153
http://dx.doi.org/10.29322/IJSRP.10.01.2020.p9774 www.ijsrp.org
Efficacy of Audio-Visual Teaching Materials in EFL
Classes: The Case of Two Elementary Schools in Addis
Ababa, Ethiopia.
Fikremariam Yirgu Wondimtegegn
College of Social Science and Humanities, Department of English Language and Literature, Wolkite University, Ethiopia.
Email: [email protected]
DOI: 10.29322/IJSRP.10.01.2020.p9774
http://dx.doi.org/10.29322/IJSRP.10.01.2020.p9774
Abstract
The study was undertaken to explore the efficacy of audio-visual teaching materials in EFL Classes in two elementary
schools in Addis Ababa, Ethiopia. The target population comprised 55 boys and 59 girls in the elementary schools. Data was
collected from selected pupils, teachers and principals of the two elementary schools. The study sought to identify the common
materials, methodologies and expertise used in teaching EFL Classes as well as to establish their effectiveness in using and
promoting teaching aids. A survey research design was employed with a purposefully selected sample of one hundred fourteen
(114) respondents. Interview, questionnaires and observation were used to collect data from principals and teachers on one
hand, and pupils on the other hand. The data from the questionnaires was analyzed using frequency distribution tables and
percentages while first -hand information from the interviews was recorded according to emerging themes. The findings of the
study showed that materials and methodologies used to disseminate audio-visual teaching materials were not very effective.
The schools did not run of the mill with relevant literature on audio-visual teaching materials. They commonly used teaching
methodology in EFL Classes with limitations of language and audio- visual teaching materials. The findings further revealed
that the context for audio-visual teaching materials was limited in the schools. It was also revealed that audio-visual
teaching materials lacked the required expertise to conduct it as most of the officers involved had no pedagogical experience.
The study concluded that the audio visual teaching materials in EFL Classes were not effective. It was recommended that
stakeholders should use suitable media, resources, methodologies and personnel to advance audio-visual teaching materials in
EFL Classes.
Keywords: Efficacy, Audio-Visual Teaching Materials, Language, Methodologies, Textbook.
1. Introduction Visual aids have a great role in language teaching and learning. They make pupils involved, expand pedagogical
implementation, and create access to information and teaching resources. A visual aid facilitates a new method of teaching
language in the classroom. It also develops modern communicative teaching methods, especially, a new audiovisual serves as a
warning and a signal on pedagogical quality of teachers teaching strategies and their interaction with pupils. It is important to
get concrete wide information within a short time. In addition to this, the relevant visuals d e v e l o p individual learning styles,
teaching skills a n d c o m p r e h e n s i v e educational syllabus. They also enhance the competence and performance of
pupils, and finally strengthen the systematic application of scientific knowledge in finding practical solution to specific
problems of teaching language.
Audio-visual aids help teachers to bring a significant change in the class environment as well as in the teaching process. By
using audio-visual aids in the class, teachers can present a topic both verbally and visually which is very helpful for the
learners to pay more attention in the lesson. They can make a correlation between the verbal and non-verbal as well as abstract
and concrete issues. There are some abstract things in language which are difficult to explain verbally (Abdullah,
2014). However, teachers in elementary schools are not interested to use visual aids in language classes. The fact
beyond the curtain is lack of experience, exposure, interest, motivation and facilities. Consequently, the pupils do not

International Journal of Scientific and Research Publications, Volume 10, Issue 1, January 2020 482
ISSN 2250-3153
http://dx.doi.org/10.29322/IJSRP.10.01.2020.p9774 www.ijsrp.org
get much knowhow on visual aids. Krashen (1987) points out the importance of motivation and self-confidence. He holds that
these factors are more involved not only in supplying comprehensible input but also in creating a situation that encourages a
low filter. Thus, the effective language teacher is someone who can provide input and make it more comprehensible in low
anxiety situation. Therefore, motivated pupils will learn better than those who are not.
Teachers have their own role in communicative approach. According to Larsen Freeman (1986) teachers in communicative
classroom will find themselves talking less and listening more becoming active facilitator of their students learning. Similarly,
to encourage visuals in the classroom and to integrate visuals with their uses, it is necessary to create some interesting
situations in the classroom in which learners can use various visual items. If the verbal and visual things are presented together,
learners can get the information quickly. Mayer (2001) approved that, if the instruction is given in the class using both words
and visuals, learning becomes faster (cited in Dolati, 2011). Furthermore, a resourceful teacher can create different types of
situations in the classroom. Although a few types of situations are created by the teacher, a competent teacher can create
situations spontaneously depending on the level of students, the items and the topic s/he is teaching.
Teachers’ main target is to foster Learners’ interest toward the foreign language by taking advantage of the various resources
available for this purpose. The schools under investigation used audio visual aids as one of the strategies in conducting the
teaching and learning process. True audio visual aids are the significant resources utilized when it comes to having learners
exposed to the target language. There are pedagogical centers in both schools where audiovisual materials are prepared as
strategies to enhance the use of audio visual aids in EFL classes. However, the effectiveness of such strategies was not
known as there was no known study to measure their efficacy, the researcher of this study was interested to see the real challenges
while using audiovisual aids. Therefore, the study sought to explore the efficacy of audio-visual teaching materials in EFL
Classes: in the case of two elementary schools in Addis Ababa, Ethiopia.
1.2 Purpose of the Study The purpose of the study was to assess the efficacy of audio-visual teaching materials in EFL Classes: in the case of two
elementary schools in Addis Ababa, Ethiopia.
1.3 Major Objectives of the Study The major objective of the study was to assess the efficacy of audio-visual teaching materials in EFL Classes: the case of two
elementary schools in Addis Ababa, Ethiopia. Specific Objectives of the Study
The specific objectives of the study were to:
identify the factors that affect the use of audio-visual teaching materials in EFL Classes find out the effectiveness of
audio-visual teaching materials in EFL Classes
identify the common methodologies used in EFL classes; and find out to what extent
audio-visual aids use in EFL classes.
1.4 Research Questions
What are the factors that affect the use of audio-visual teaching materials in EFL Classes?
What are the audio-visual aids used in EFL Classes?
What are the common methodologies used in EFL classes?
How effective are the methodologies used in EFL classes?
1.5 Significance of the Study
The study was very important because it intended to benefit all stakeholders such as the Ministry of Education, education
officers, supervisors, school principals, teachers and pupils. The results would help school principals, teachers and pupils to

International Journal of Scientific and Research Publications, Volume 10, Issue 1, January 2020 483
ISSN 2250-3153
http://dx.doi.org/10.29322/IJSRP.10.01.2020.p9774 www.ijsrp.org
work together and produce relevant materials for preparing audio-visual teaching materials in EFL Classes to the pupils.
2. Review of Related Literature In Ethiopia, English is taught as a subject starting from grade one up to tertiary education. It is also a medium of instruction in
secondary and tertiary levels. Even though students are exposed to English language, their level of performance in using
the language is very low. Moreover, students cannot understand the target language as they understand their mother-tongue.
Therefore, learning of English becomes difficult for them. In the teaching of language, the main purpose of the use of audio-
visual aids is to enable the teacher to make his/her lessons effective and interesting. In the teaching of English the teacher uses
the lecture method. Therefore, it is for the teacher to give a clear idea to the students through audio-visual aids as such type of
teaching make the idea permanent in the pupils mind.
According to Adrian Doff (1990:81-82), the use of audiovisual aids is important to teachers as well as to pupils. It focuses
attention on meaning, helps to make the language used in the class more interesting. In addition, visuals can be used at any
level of the lesson, to help out in interpreting new language or introducing a topic, as part of language practice, and when
reviewing language that has been presented earlier. Good visual aids are not just used once, but again and again and can be
shared by different teachers. Mattew etal (2013) state that an effective integration of teaching aids methodology
elevates the learning environment. Koc (2005) cited in Mattew says that the integration of technology into curriculum means
using it as a tool to teach academic subject and to promote higher order thinking skills of the students. It is generally said that
students like the language class when teachers use different audio-visual materials because it motivates them to pay more
attention in the class and they can relate their learning with their real life (Çakir, 2006, pp.67). As a result, the use of audio-
visual aids seems to benefit both the teachers and the learners.
Use of audio-visual materials makes the learning more long-lasting than the use of traditional textbooks (Craig &
Amernic, 2006:152-153). A resourceful English language teacher create smart audiovisual aids as a motivational tool
in enhancing students attention in language teaching and learning. Thus, audiovisual aids are significant and the best
tool for making teaching effective and the best dissemination of knowledge. Moreover, it arouses the interest of pupils and
helps out the teachers to explain concepts easily. According to Burton cited in Shabiralyani (2015) “Visual aids are those
sensory objects or images which initiate or stimulate and support learning”. Kinder, S. James; describe visual aids as “Visual
aids are any devices which can be used to make the learning experience more real, more accurate and more active”. Hence,
Saricoban (1999) proposes the incorporation of a sort of visual backup to enhance comprehension as well as the importance of
awareness on environmental clues such as gestures, tones of voice, or expressions that may contribute in their comprehension.
Eliane etal (2007) state that visuals such as tables, charts and graphs provide clarity. Effective visuals are used for
specific purpose, not for decoration, and each type of visual illustrates some kind of materials better than others. Moreover,
effective visuals are simple and clear. If a chart is overloaded with information, separate it into charts instead. In fact, the
experience of elementary teachers in using visual aids is poor. Thus, the essence of using various visual aids in line with the
target lesson is mandatory, especially in EFL classes. Therefore, the study sought to explore the Efficacy of audio-visual
teaching materials in EFL Classes: the case of two elementary schools in Addis Ababa, Ethiopia. In short, the researcher
focuses on identifying the factors that hinder the use of effective audiovisuals in ELT classes.
Photographs, pictures, drawings, diagrams, and maps provide visual support to various subject matters like history, English
and other languages as well as to philosophy, music, theater, and other performing arts Elaine P. and etal (2007:235). Most
of the times students learn through visuals make the teaching learning process easier. It helps to integrate with various
language skills such as reading, listening, speaking and writing. According to Abdullah (2014), using different relevant visuals
in classrooms makes the class interesting and interactive. It helps the teachers to visualize the content of the classroom. Also, it
makes the learners more attentive and engaged in tasks. When visuals are used to introduce any topic to the learners, it
becomes more real and contextualized. Learners get an overview of the lesson and can generate ideas better. It improves the

International Journal of Scientific and Research Publications, Volume 10, Issue 1, January 2020 484
ISSN 2250-3153
http://dx.doi.org/10.29322/IJSRP.10.01.2020.p9774 www.ijsrp.org
learner comprehension ability.
About Visual Aids in Language teaching, B. M. Bowen (1991) states: They vary the pace of
the lesson:
They encourage the learners to lift their eyes from their books, which makes it easier and more natural for one to speak
to another;
They allow the teacher to talk less by diminishing the importance of the verbal stimuli provided by the teacher’s
voice, and allow the students to talk more;
They enrich the classroom by bringing in topics from the outside world which are made real and immediate by the
pictures;
They spotlight issues, providing a new dimension of dramatic realism and clarifying facts;
A student with a creative imagination will often learn a new language easily and enjoyably through the use of
pictures while he finds it difficult to learn just from a textbook and dictionary;
They make a communicative approach to language learning easier and more natural;
They help to teach listening, speaking, reading, and writing and allow the teacher to integrate these skills
constructively;
They inspire imaginativeness in both the teacher and students;
They provide variety at all levels of proficiency (Bowen, 1991) Wright A., Hallem S. also state that pictures have a major role to play in the development of students skills. There are two
reasons in particular for listening and reading: meanings we derive from words are affected by the context they are in: pictures
can represent or contribute much to the creation of contexts in the classroom; it is often helpful if the students can respond to a
text non – verbally: pictures provide an opportunity for non – verbal response (Wright & Hallem, 2001).
3. Methodology
3.1 Research Design
The researcher u s e d both quantitative and qualitative research designs. The researcher also investigated the efficacy of
audio-visual teaching materials in EFL Classes in two elementary schools in Addis Ababa, Ethiopia. Descriptive research
design was employed to conduct the study.
3.2 Population
The population of the study included 450 pupils, teachers, and principals in two elementary schools in Addis Ababa, Ethiopia.
3.3 Sample Population The sample size of the population comprised one hundred fourteen (114) pupils and four teachers from the two schools and two
(2) principals from the two elementary schools (Tsehay Chora and Dil Betigil) in Addis Ababa, Ethiopia.
3.4 Sampling Procedure Purposeful sampling for the two schools, principals, pupils and teachers was used with the purpose of including all key
elements in the sample. The two schools were purposely selected based on information from the Gulele sub-city education
office that these schools were among those where pupils have been exposed to various teaching methods. Random sampling
method was used for the selection of the 114 respondents.
3.5 Data Collection Techniques To get valid and reliable data, the researcher used questionnaire, interview and observation. Structured interviews were used
for all the three categories of respondents in order to get firsthand information on the effectiveness of audiovisual aids.
Structured interviews allowed direct interaction and also permitted assessment of non-verbal communication which could
have been missed if other techniques were employed. Structured interviews also encouraged mutual exchange of information

International Journal of Scientific and Research Publications, Volume 10, Issue 1, January 2020 485
ISSN 2250-3153
http://dx.doi.org/10.29322/IJSRP.10.01.2020.p9774 www.ijsrp.org
yet allowing data to be easily coded and analyzed.
3.6 Data Analysis The data was analyzed both quantitatively and qualitatively. Quantitative data was used to analyse the effectiveness of
methods and materials used. In this case tables and frequencies were used. Qualitative data was coded and analysed in the form
of explanations as given by the respondents.
4. Findings and Discussion of Findings The findings of the study revealed that there were several types of audio visual materials used in distributing information to
pupils namely brochures, textbooks and electronic media. Similarly, the government had developed a more effective medium
for educating the pupils through the publication of pictures, maps, diagrams, etc with various texts on the usefulness of audio
visual materials.
The interview, questionnaire and observation results describe the suggestions of teachers, students and principals
concerning the features of ELT audio-visual aids for elementary school students. The participants were asked about their
primacies while selecting audio visual materials. The participant teachers focused on the possible features of a model ELT
audio-visual aids designed for the elementary school students. In every stage of their suggestions, the participants focus on the
importance of reflecting both the written and spoken aspect of communication in the classroom. The importance of the choice
of a working methodology, the presentation of language skills with a focus on integration, importance of language functions,
the appropriateness of the audio-visual aids/materials in terms of students’ age, needs, levels, and interests are among teachers’
priorities while evaluating the audio-visual aids. Most of the participants of the study also focused on the necessity of
presenting authentic materials or the ones reflecting real-life situations and cultures in the audio-visual aids in terms of
transferring knowledge into students’ personal and social life endeavor. In addition, other participants of the study insist that
the audio-visual aids should include materials relevant with the objectives of the curriculum that is consistent with the students’
ages and needs.
As another component of the audio-visual aids, teachers also focused on the features of illustrations. A group of participants
made a distinction between the use of drawings and the photographs in regards to the students’ needs and suggested the use of
real photographs for the elementary school students. Another group of teachers recommended the presentation of different
kinds of illustrations as a mixture.
The majority of the participants considered that a communicative methodology following a content- based approach is ideal for
the elementary school students and such kind of a methodology should be based on four main language skills, namely reading,
listening, speaking and writing. Additionally, the organization of the audio-visual aids would manipulate students in order to
give prompt answers to the questions that they are likely experience in their daily lives. Moreover, the teachers evaluated a
successful audio-visual aids as long as it provides sufficient number of activities for enhancing interaction in the classroom.
Furthermore, an effective audio- visual aids should manipulate students to use the language for different purposes under
different circumstances and create as a basis in terms of providing discussions in the classroom.
According to the participants, the materials in audio-visual aids should evoke both the spoken and written communication
in the classroom in terms of students’ needs. An audio-visual aid can be regarded as successful, as long as it improves
students’ productivity in all skills and provides an assorted organization over a monotonous one.
Considering the presentation of cultural issues in the audio-visual aids and textbooks, it is essential to reflect the target
language culture overwhelmingly into the audio-visual aids/materials. The participants also suggested the presentation of
Ethiopian culture in terms of making c o m p a r i s o n s and the representations of multicultural aspects. Additionally, t h e y
indicated that it would be inappropriate to disregard the cultural aspects of first language and teaching the language via the
representations of the Ethiopian culture.

International Journal of Scientific and Research Publications, Volume 10, Issue 1, January 2020 486
ISSN 2250-3153
http://dx.doi.org/10.29322/IJSRP.10.01.2020.p9774 www.ijsrp.org
The participant teachers also indicated their thoughts concerning the four main language skills. The suitability of the skill
exercises in terms of the students’ needs and levels and the importance of a varied selection of the activities are indicated by
the teachers. Specifically for the speaking skill, the importance of guidance and authenticity is stated. According to the
teachers, the speaking activities should create a reason for students to talk and discuss and such activities should require pair or
group work discussions. While focusing on the writing exercises, the participants indicated a number of aspects such as the
guidance, integration of writing activities with other skills (speaking and reading) and activating students’ creative and
cognitive thinking skills. Moreover, the writing samples should be selected from the ones since students are able to write in
their daily lives. Visual aids are also necessary for the students to experience writing different kinds of essays and writing
samples such as short stories, poems, letters postcards, and e-mails. Regarding the reading skill, interesting, attractive and
motivating reading passages associated with various audio-visual aids are indicated to be effective in students’ language
learning process. Another aim should be to achieve appropriate audio-visual aids content consistent with students’ ages,
preferences and expectations.
The teachers suggested a number of aspects concerning the presentation of vocabulary in ELT audio- visual aids. The teachers
considered that the selection of vocabulary should be consistent with the students’ needs and levels. A great majority of the
teachers suggested the use of meaningful and contextual grammar exercises. The teachers also focused on the efficacy of
audio-visual aids and situation-based instruction with the aim of teaching different language skills. In addition, the
participants pointed out the superiority of the audio-visual aids instruction of language issues and the importance of presenting
situations and tasks in which students have to use the specific skills interactively. Shortly, audiovisual aids have positive
effects on pupils, teachers and schools.
Moreover, it is possible to observe that teachers share common opinions by indicating their disagreement considering several
features of the audio-visual aids in the text book. In other words the participant teachers do not consider that a number of
features or aspects are successfully presented in the textbook. According to the majority of the participants, the cover of the
audio-visual aids are unattractive (83.3 %), the audio-visual aids do not reflect representations of L 2 (80.3 %),
the topics are uninteresting for the students (88.3 %) and the exercises are not designed according to the students’ interest
(80 %).
Moreover, most of the participants (81.7 %) did not consider that the vocabulary items are controlled to ensure the systematic
gradation from simple to complex. One fourth of the participants (25 %) strongly disagree with the statement ‘The teacher’s
guide provides practical activities/ideas for the teacher to use visual aids in the classes’.
More than half of the teachers and principals (75 %) indicated that the audio visual aids help students to comprehend the
reading passages, on the other hand, the rest of the participants (25 %) considered that the audio visual aids are ineffective for
manipulating the students to understand the reading texts. In the open-ended questionnaire, a great majority of the teachers
reflected that the audio visual aids, especially, the drawings are poor in quality. For this reason, they are ineffective in terms of
reflecting the real scene of the reading passages.
While focusing on the language skills in the audio-visual aids, the majority of the participant teachers and principals
(86%) indicated that the reading exercises are appropriate for improving students’ reading abilities. In addition, listening
exercises presented in the audio-visual aids are found to be effective in terms of improving students’ listening skills (80%).
Furthermore, most of the participants agree on the efficacy of the listening materials or audio-visual aids (pictures, diagrams,
photographs, charts, videos, CDs) in terms of improving students listening in particular and language skills and
fluency in general.
However, considering the speaking skill, most of the teachers (76%) pointed out the inefficacy of speaking exercises in terms of
enhancing students’ speaking abilities. Especially for the writing skill, although a significant number (65 %) of the teachers
agree on the efficacy of the writing exercises, the rest of the participants (35%) did not evaluate the writing exercises as

International Journal of Scientific and Research Publications, Volume 10, Issue 1, January 2020 487
ISSN 2250-3153
http://dx.doi.org/10.29322/IJSRP.10.01.2020.p9774 www.ijsrp.org
successful.
The last section of the questionnaire was designed to find out the aspects that the teachers would like to see in the audio-visual
aids regarding the four-language skills. The results indicated that a great majority of the teachers would like to see more
speaking (95 %) and writing exercises (88.3 %). On the other hand, teachers’ responses show diversity whether or not they
would like see more reading, grammar, and listening exercises. At this point, it is possible to state that there is a significant
correspondence between the teachers’ assessments of the four-skills in the audio- visual aids and teachers’ following comments
regarding the language exercises that they would like see more in the textbook.
Furthermore, the analysis of interview and observation results revealed that half of the teachers indicated that the organization
of some of the main headings is problematic in terms of not presenting the actual sequence of the visual aids. Moreover,
focusing on the visual aspects, the subheadings are presented with small typeset in the textbook. This aspect is disparaged by a
number of the teachers and they suggested that these headings can be redesigned by using big typeset and various colors in
order not to present a rhythmic organization.
The participant teachers and principals tended to be negative concerning the efficacy of the instructions in explaining
the purpose of the relevant activities. However, the analysis conducted by the researcher did not match with the teachers’
statements since the language of the instructions is simple, consistent and addresses the purpose of the practices at different
levels. Focusing on the topics and exercises, the majority of the teachers (82 %) consider that the topics are not interesting for
the students and in the interviews teachers regarded the interestingness of the topics as a priority issue. Concerning certain
topics in the audio-visual aids, teachers indicated that their students were not eager to participate in the activities in a number
of topics because of finding the visuals uninteresting. Although creative activities and tasks are displayed, they are limited
and none of the activities are based on authentic situations. Thus, most of the teachers and principals considered that audio-
visual aids are not successful in terms of initiating communication.
5. Conclusion and Recommendations 5.1 Conclusion
From the findings, it was concluded that audiovisual aids are not as effective as they should be because of a number of
reasons. The inadequate availability of teaching materials and limited methodology hinders effective dissemination of the
lesson/ needed information. To achieve desired goals, all the stakeholders concerned must ensure availability of required
resources, employment of a variety of methodologies to arouse interest in the learners and also train all personnel involved to
disseminate information. It was understood that audiovisual aids have positive effects on pupils, teachers and schools. The
failure to recognize the importance of audiovisual aids will always lead pupils into misunderstanding the text/message.
Audiovisual aids, if accorded the importance they deserve, will help to avoid excessive, empty and meaningless verbalization
in teaching English. Moreover, using audiovisual aids make teaching and learning effective, provide interest and inspiration,
and help students to form clear and accurate concepts in English. Thus audio-visual aids help out our students in their language
articulation. However, most of the teachers do not use these aids which have great educative value. These are not the ordinary
materials, rather these are teaching materials. Audio- visual aids give direct sensory experience to the students.
In addition to the above points, the findings revealed facts regarding the evaluation of EFL audio-visual aids. First,
since the audio-visual aids were designed for the elementary school students, the topics can be rearranged or chosen by taking
into consideration their ages, expectations, and needs. Second, the illustrations may be restructured to meet the expectations of
elementary school students by providing high-quality standards similar to the ones in commercial publications. Third, from the
teachers’ perspectives, the teacher’s guide can be revised in order to provide practical ideas for the teachers to use in the
classroom. Fourth, the results are considered to be informative considering the audio-visual aids elements which do not require
revision regarding teachers’ audio- visual aids evaluation results such as the presentation of grammar and the relevant exercises,
the presentation of listening and the relevant exercises, and the activities.

International Journal of Scientific and Research Publications, Volume 10, Issue 1, January 2020 488
ISSN 2250-3153
http://dx.doi.org/10.29322/IJSRP.10.01.2020.p9774 www.ijsrp.org
5.2Recommendations The researcher made the following recommendations:
1. The audiovisual aids need to be transformed into policy so that it is included in the school curriculum and be
incorporated in the entire school subject both at primary and secondary school. Only then will it receive maximum
attention it deserves.
2. The audiovisual aids must be given adequate funding so that the school officials can provide quality training to those given
the mandate to disseminate information to the teachers. Adequate funds will allow all stakeholders to attend frequent
workshops in order to keep abreast and avoid misinforming the pupils mind.
3. The principals, department heads, supervisors must make it a mandate to visit all schools at least once a week by utilizing
supervisors in all schools, so that pupils and teachers in schools can perceive the importance of the audio visuals unlike the
situation where the officers visit the schools at the most once per year or not at all.
4. There must be involvement of stakeholders in decision making, planning, implementation and evaluating of programs
designed to make sure that the audiovisual aids education succeeds.
5. Addis Ababa and Gulele sub-city education office should give continuous training on the use of effective visual aids in ELT
classes in order to cultivate students’ cognitive as well as social bondage.
6. The principals, department heads, supervisors must consider the audio-visual aids elements which require adjustments such
as the presentation of grammar and the relevant exercises, the presentation of listening and relevant exercises, and the
activities.
Reference
Abdullah Al Mamun (2014). Effectiveness of Audiovisual aids in Language Teaching in Tertiary Level. BRAC University,
Dhaka.
Adrian Doff (1990) Teach English. A training course for teachers. Cambridge University Press Arab World English Journal,
2(1), 3-17.
Bowen M. B. (1991) Look here! Visual aids in Language Teaching. London: Modern English Publishers.
Çakir, D. I. (2006). The use of video as an audio-visual material in foreign language teaching classroom. The Turkish Online
Journal of Educational Technology, 5(4), 67-72. Retrieved from http://www.tojet.net/articles/v5i4/549.pdf
Craig, R. J., & Amernic, J. H. (2006). PowerPoint presentation technology and the dynamics of teaching. Innov High Educ, 31,
147-160. doi: 10.1007/s10755-006-9017-5
Dolati, R. (2011). Harnessing the use of visual learning aids in the English language classroom.
Eliane P.M., Janice H.P., Kathleen B.Y. (2007) A Writers Resource. A handbook for writing and research. McGraw-Hill
Companies Inc. New York.
Freeman, D. L. (2000).Techniques and principles in language teaching. New York: Oxford University Press.
Larsen Freeman, D. (1986) Techniques and Principles in Language Teaching. Oxford: Oxford University Press.
Mathew, N.G., & Alidmat, A.O.H. (2013). A study on the usefulness of audio-visual aids in EFL Classroom: Implications for
effective instruction. International Journal of Higher Education, 2(2), 86-91. doi:10.5430/ijhe.v2n2p86
Mayer, R. E. (2001). The Cambridge handout of multimedia learning. New York: Cambridge University Press
Saricoban, A. (1999). The teaching of listening. The internet TESL journal, 5 (12), p.1. Retrieved April 1st, 2008,
fromhttp://iteslj.org/Articles/Saricoban-Listening.html
Shabiralyani, G. etal (2015) Impact of Visual Aids in Enhancing the Learning Process Case Research: District Dera Ghazi
Khan. Journal of Education and Practice. ISSN 2222-1735 (Paper) ISSN 2222-288X (Online) Vol.6, No.19, 2015.
Stephen D. Krashen (1987) Principles and Practice in Second Language Acquisition, Prentice Hall International.
Wright A., Haleem S. (2001) Visuals for the Language Classroom. London and New York: Longman
International Journal of Scientific and Research Publications, Volume 10, Issue 1, January 2020 489
ISSN 2250-3153
http://dx.doi.org/10.29322/IJSRP.10.01.2020.p9775 www.ijsrp.org
Communal Riots and Plight of Women
Jyoti Tiwari
M.A Gender Studies, SNCWS
DOI: 10.29322/IJSRP.10.01.2020.p9775
http://dx.doi.org/10.29322/IJSRP.10.01.2020.p9775
Abstract- In this paper I am going to explore the topic of
communal violence in general and violence against women in
particular and the violation of women’s basic rights. The time
span, which I am going to look at, is phase of partition 1947 and
riots of 2002 Gujarat. Then I will also look upon the Communal
violence Bill 2011.
Index Terms- Communal, Gender, Gujarat, Hindu, Muslim,
Nation, Partition, Violence, Women, Riots.
I. INTRODUCTION
tarting with Communal violence, it is a form of violence that
is perpetrated across ethnic or communal lines, the violent
parties feel solidarity for their respective groups, and victims are
chosen based upon group membership. The term includes
conflicts, riots and other forms of violence between communities
of different religious faith or ethnic origins. The Indian law defines
communal violence as, "any act or series of acts, whether
spontaneous or planned, resulting in injury or harm to the person
and or property, knowingly directed against any person by virtue
of his or her membership of any religious or linguistic minority, in
any State in the Union of India, or Scheduled Castes and
Scheduled Tribes within the meaning of clauses (24) and (25) of
Article 366 of the Constitution of India". (Constitution of India)
Now coming to conflict’s gendered perspective, women
were the worst and most sufferers of these kinds of violence. Due
to the reason of the difference between gender and sex, the oldest
known difference embodied into language, is seen as basic,
unquestionable and unproblematic- a condition of life. Difference
“in itself” is historically determined as the hierarchy/ domination/
injustice/ social inequality that are “theoretically” based on
patriarchy/gender/sex. In conflict’s time women were not seen as
individual, rather they were seen as reproductive unit and property
or pride of “other” community which is meant to be distorted so
as to destroy the pride of community.
I am tracing communal violence and the experiences of
women, to re-write her history. It has been experienced by many
that the history we read is male biased i.e. written from men’s
perspective. I’m not denying the fact that there were considerable
women figures who worked on partition but that too were male
centered. Their contribution in freedom struggle was seen as the
supplement of male. When feminists began their study of partition
violence against women, they used first-hand accounts of social
workers and memoirs and the testimonies of women in
rehabilitation camps. And if we talk about government records,
women were considered as mere objects only shown in numbers.
No subjectification was provided as to what had happened? What
were the causes and consequences of violence against women?
What were the steps taken by government?
Talking about the partition of 1947 India, the practice of
nation building employed social constructions of masculinity and
femininity that supports a division of labor in which women
reproduce the nation physically and symbolically and men protect,
defend, and avenge the nation. National mythologies draw on
traditional gender roles and the nationalist narratives is filled with
images of the nation as mother, wife, and maiden. At that point of
time and till now women’s bodies become symbolic and spatial
boundaries of the nation. Women’s were seen as the property of
the nation and at times property of the community. Partition: a
metaphor for irreparable loss. (Menon & Bhasin, 2000)
II. PARTITION VIOLENCE 1947
The violence which immediately followed the partition of
British India into India and Pakistan resulted in the death of nearly
2.5 million people across both the regions. As the partition was
announced Minorities from both the sides tried to migrate to the
other country. Perhaps some of the historians peg the figure of
migration at about 15million. There were a large no of incidents
of mass violence. Sikh villages were burnt in West Punjab, male
members killed and female were subjected to physical violence
and mass rapes. Similarly in Eastern Punjab and other parts of
India the migrating minority community faced a similar fate. The
worst suffer of the violence were women. Both Hindus and
Muslims were affected on both sides of borders during the
partition riots. The main cause of partition was division of the
nation on religious grounds and the unbending attitude of the
political parties. The communal award announced by Ramsay
Mcdonald in 1932 was the beginning point of the conflict between
the different religious groups. The award provided for separate
electorates along religious lines. It resulted in
compartmentalization further the policy of divide and rule of the
Britishers and their sudden withdrawal lead to a bloody aftermath.
III. 2002 GUJARAT VIOLENCE
Since partition, there have been a number of incidents of
mass brutality against Muslims in Gujarat. In 2002, in an
occurrence depicted as a demonstration of “fascistic state terror",
Hindu radicals completed acts of extraordinary savagery against
the Muslim minority population. The beginning stage for the
episode was the burning of a train, which was blamed on Muslims.
Later in the riots, young ladies were sexually assaulted or hacked
to death. These assaults were virtually approved by the decision of
S
International Journal of Scientific and Research Publications, Volume 10, Issue 1, January 2020 490
ISSN 2250-3153
http://dx.doi.org/10.29322/IJSRP.10.01.2020.p9775 www.ijsrp.org
ruling BJP, whose refusal to intercede prompted the relocation of
200,000 Muslims. Loss of life figures extend from the official
gauge of 790 Muslims and 254 Hindus murdered, to 2,000
Muslims slaughtered. Then Gujarat CM Narendra Modi has too
been blamed for starting and overlooking the brutality, as have the
police and government authorities who remained silent and
virtually participated, as they literally coordinated the agitators
and gave addresses of Muslim-possessed properties to the radicals.
Women in both these cases faced the most brutality and the most
heinous crimes were committed on women of both the religious
communities.
As I had mentioned earlier women during the partition and
even before the partition also didn’t constitute a separate or
individual identity. Their identity was clubbed with the
community so as the honour. The nature of violence which
occurred was very ghastly ranging from:
1. Disfigurement,
2. Mutilation,
3. Disembowelment,
4. Castration,
5. Branding or tattooing the breasts and genitalia with
triumphal slogans,
6. Raping and killing the foetuses,
7. Abduction,
8. Honour killing,
9. Stripping and parading naked
These are the parts of its pathology and must be recognized
for their symbolic meaning. As Veena Das had noted “There is no
contradiction between the fact that, on the one hand mob violence
may be highly organized and crowds provided with such
instruments as voters list or combustible powders and on the other
hand that crowds draw upon repositories of unconscious images.”
This phenomenon of violence is described most aptly by the
language of feud. As in, feuds may be defined as “a pact of
violence” between social groups in such a way that definition of
self and other emerges through the exchange of violence i.e. the
exchange of violence is an integral part which is directed towards
the others. In such an exchange the “victims are simply the bearer
of status of their group”. The other group thinks by directing their
violence towards the victims they can crush the prestige of their
opponents. Similar was the case of women who faced the violence
in 1947 and 2002 Gujarat. The groups targeted the women
(victims) for the above mentioned reasons. The brutal violence
that women faced during the communal riots can also be seen in
the context of the place the women’s sexuality occupies in an all-
male, patriarchal arrangement of gender relations between and
within religious or ethnic communities. Most of the violence
experienced by women is when women are sexually assaulted by
men of other community in an assertion of their identity and in
order to humiliate the other by hurting their honour. The violence,
rape faced by Sikh, Hindu and Muslim women were a result of
similar action-reaction, retaliation and the fake honour concept.
There were a range of testimonies or case studies from 1947
violence riots and 2002 Gujarat riots, from the women who
personally experienced it or by the family members or by the fact
finding teams.
“Puttar, aurat da ki ai, aur tan varti jaandi ai
Hamesha, bhanve apne hon, bhanve paraye”
The incident of Sheikhupura is quite shaking. The
Sheikhupura district in Western Punjab was a Sikh minority
district. During the partition riots Sheikhupura became a byword
for murder, arson, loot and rape. A person named Dr. Virsa Singh
claimed that he had shot 50 women personally even his wife,
daughter and mother because he said that Muslims came to get
them. The most disturbing element is that the women themselves
came and said “Viran, pehle mannu maar”. Despite being highly
educated Dr. Virsa did not regret killing them. Rather he said that
this was necessary in order to protect the honour of the
community, because he considered the women as the honour of
the community.
The trauma of Partition violence was very difficult to tell for
both men and women. The gendered nature of experience of
violence has given rise the different narrations of the events of
violence. As Veena Das and Ashish Nandy have pointed out that
the difference in narrations of women and men was different
because the women have “retained the memory of loot, rape and
plunder” in their bodies as well. But the memories were more
formal and organized as in case of Iqbal or Dr. Virsa Singh.
An article from the Caravan: Journal of politics and culture,
titled “how Hindu mobs used rape as weapon against women like
Bilik Bano during Gujarat riots” by Prita Jha. “The struggles of
Gujarat’s rape survivors were not, and still are not, limited to the
courts of law,” Jha writes. “These women had to also fight for
their dignity in their own communities.”
The heavily pregnant Kauser Bano’s stomach had been
ripped open with a sword, her foetus removed and thrown into fire.
This clearly shows the patriarchal mentality of the mob.
Another case from Gujarat, was from the rehabilitation
camp were the Muslim survivors were kept for their safety and
security. Girl named Jamila stated that the Maulana there has
asked for sexual favor from her mother and sister, in return she
will get proper benefits of the camp. This shows the hypocrisy and
patriarchal nature of their community.
Kumkum Sangari's response to this viewpoint is very
important. For her there is no abstract disembodied patriarchy.
Rather, there is a multiplicity of patriarchies located in a variety of
institutions in the civil society, apart from the state.
State’s Role from recovering from the pain of partition and Gujarat
riots.
Apart from setting up rehabilitation camps for refugees in
1947, the governments of the two countries came to an agreement
that abducted persons should be recovered. India’s Abducted
Persons Act of 1949 stated that “Abducted person’ means a male
child of under the age of 16 years or a female of whatever age who
is, or immediately before the first day of March, 1947, was a
Muslim (Pakistan’s Law stated Hindu or Sikh) and who on or after
that day or before the first day of January, 1949, was separated
from his or her family and is found to be living with or in control
of any other individual or family, and in the latter case includes a
child born to any such female after the said date.” This law in itself
is very good, which allowed women and children from other side
to come to their respective countries. But the question here is of
honor of the family. Question was of acceptance of those women
who were coming from other side and after long time. The issues
of Abducted women were taken into account, resistance was
coming from within India, the question of children born from these
International Journal of Scientific and Research Publications, Volume 10, Issue 1, January 2020 491
ISSN 2250-3153
http://dx.doi.org/10.29322/IJSRP.10.01.2020.p9775 www.ijsrp.org
women, they were considered illegitimate in the eyes of law said
by one of member of Hindu society. Those children were needed
to send back to Pakistan. This also created trauma of separation
from the child to women. Homes for widows and children were
also setup.
Earlier known as ‘Prevention of Communal and Targeted
Violence (Access to Justice and Reparations) Bill, 2011′ is
brought to curb the riots taking place between majority and
minority communities. After the alleged post-godhra riots in
Gujarat, The former UPA government proposed for the need of the
bill. The controversial Communal Violence Bill (later name
changed from “Prevention of Communal and Targeted Violence
bill”) has raised the brows of one and all. While some believe it is
UPA's strategy to win minority vote banks, others believe that it is
a tool to strengthen the integrity and harmony of the country. At
first glance, it does seem to be a peacemaker, but on second
thoughts it brings out the darker side of democracy. When the
government should be emphasizing on equal rights for all, it is
promoting the minority community as the underprivileged and the
deprived. Recent amendments- drawing the wrath of various
parties, starting BJP, the two major points of contentions may be
amended. The words "majority" and "minority" have been
removed from the Bill. With this, communal violence law
becomes applicable against any particular community and not
against a minority or a majority. To emphasize its point, the UPA
further proposed to change the name of the Bill to "Communal
Violence Prevention Bill". However, another clause that allows
the Centre to send paramilitary force to a state, without its consent,
when a communal tension threatening the harmony of the society
arises.
From all this I only want to say that, women is not a
heterogeneous group. Each woman has her individual human
rights. In the time of riots women was the first whose human right
is violated. Her dignity was outraged. She was considered as the
mere reproductive machine for the community. Her honor was
honor of community but she is not part of community. Her
motherly nature was praised until she was under the set boundaries
of patriarchal society. She doesn’t have any control on her life and
death. When needed set on fire, and that too very proudly. The
concept of “Ghar Wapsi” is only applicable to men folk and many
more constraints in women’s emancipation.
REFERENCES
[1] BASIN. KAMLA & MENON. RITU; BORDERS & BOUNDARIES: WOMEN IN INADI’S PARTITION; 2011, KALI FOR WOMEN.
[2] KUMAR. MEGHA; COMMUNALISM AND SEXUAL VIOLENCE: AHMEDABAD SINCE 1969; 2017; TULIKA BOOKS
AUTHORS
First Author – Jyoti Tiwari, M.A Gender Studies, Sncws

International Journal of Scientific and Research Publications, Volume 10, Issue 1, January 2020 492
ISSN 2250-3153
http://dx.doi.org/10.29322/IJSRP.10.01.2020.p9776 www.ijsrp.org
Quality Management in Theory
Khalifa Isa
Phd.Candidate
DOI: 10.29322/IJSRP.10.01.2020.p9776
http://dx.doi.org/10.29322/IJSRP.10.01.2020.p9776
Abstract- The quality management in any organization
undoubtedly has a direct impact on the performance of that
organization. Thus, the quality of educational institutions has a
direct impact on the economy of a country, since higher quality
faculties emerge from higher quality students who have higher and
better knowledge that will be applied in practice, in a bank, an
enterprise, a public institution, or in a school. Increased
application of quality knowledge, acquired through education in
the enterprise, for example, leads to an increase in the economic
position of companies in the market, to a greater profit of the
company, which again affects the economy of the whole country.
Intellectual capital is considered one of the most important factors
in explaining economic growth and is considered one of its
sources. Any increase in the quality of education can have an
impact on economic growth by improving the productivity or
quality of workers.
Index Terms- quality.managment.school.company.institution
I. INTRODUCTION
n modern theory we distinguish a large number of different
definitions of the quality concepts. Within this paper, quality
will be explained in detail as a term, and its connections to quality
management concept.
Term quality has numerous and different definitions, which
can be accepted as precise. Different definitions of quality concept
are result of numerous changes in life style in the last hundred
years, as well as technological development.
As the organization's success always shows the profit and
market share achieved, users have an important role in the
functioning of the organization, and their assessment of the quality
of the output of the business system by looking at the level of
fulfillment of their requirements for these outputs is an important
factor of success. Therefore, the business systems that have been
implemented and the quality management system should have
greater likelihood of achieving good business results. Thus, the
quality of educational institutions has a direct impact on the
economy of a country, since higher quality faculties emerge from
higher quality students who have higher and better knowledge that
will be applied in practice, in a bank, an enterprise, a public
institution, or in a school. Increased application of quality
knowledge, acquired through education in the enterprise, for
example, leads to an increase in the economic position of
companies in the market, to a greater profit of the company, which
again affects the economy of the whole country.
II. QUALITY AS A TERM
In its broadest sense, this term means the quality
characteristics of certain products related to reliability during use,
the periods in which the product can be used, the characteristics of
the product, the level of customer satisfaction in consumption of a
product or usage of a service.
Quality can be viewed from several aspects, and some of
observation aspects are:
Requirements specified by regulations;
Meeting the relevance criteria;
Satisfaction of the criteria in terms of reliability;
Absence of defects;
Supremacy over competitors;
Satisfaction of the consumer's request.
Regarding prescribed requirements for a particular product
or service, they need to be met. This aspect of of observing a
product quality or service is a minimum in terms of conditions that
has to be met when it comes to quality. An example of prescribed
requirements, that a product must satisfy, is level of safety that a
particular device or machine must satisfy. Then, the next is safety
of children's and people's food products, and so on.
In relation to meeting the criteria in terms of relevance,
products and services that are marketed, must be in line with the
basic idea that the product or service was created. In other words,
the product or service is expected to provide for the satisfaction of
the purposes for which they were designed. Regarding this aspect,
it should be noted that the product or service must also be
functional, that is, for example, if the means of transport is
concerned, users expect from it, to provide transport from one
point to another, and if this function was performed without
difficulty, such a means of transport may be considered to be of
high quality.
Regarding satisfaction of reliability criteria, products or
services are expected to provide consumers with the assurance that
the product or service will be functional at any time, regardless of
when it is used, and then the product or service can be said to be
of high quality.
When it comes to the absence of defects, consumers
expect that the product does not contain anz anomalies and that
there is no need for additional product-related activities, such as
finishing or repairing.
When comes to question of superiority over competitor's
product, it means comparisement of quality of a particular product
or service with a product or service that is similar in functionality.
This aspect is based on the principle that higher quality products
I

International Journal of Scientific and Research Publications, Volume 10, Issue 1, January 2020 493
ISSN 2250-3153
http://dx.doi.org/10.29322/IJSRP.10.01.2020.p9776 www.ijsrp.org
or services meet more demands or provide more in relation to
products or services of the competition, according to consumers.
The Industrial Revolution has contributed to an increase
in the number of products used over a longer period of time. For
such products, the concept of suitability for use places a factor of
time in the first place. In order for the product to be effective, it is
necessary to achieve the role assigned to it and to be available for
use as long as the user wants it. This availability depends on
whether the product has reliability, that is, it is free of defects,
along with its sustainability, or the ability to easily service and
repair it.
The basic aspects of quality are:
A marketing aspect, which includes a technical aspect
that relates to the performance of a product or service,
a Business Aspect, which includes the economic and
organizational aspect of quality,
and the Social Aspect, which includes the moral and
ethical aspect of quality.
Marketing aspect of quality:
It refers to the quality of the product that must be such that:
It meets the requirements of users,
Ensures the convenience of the product for use
throughout its lifetime,
It enables the win of competition and achieves customer
loyalty,
and it is achieved by constant improvement and
innovation of products and / or services.
Business aspect of quality
It relates to the quality of business processes that are being
realized:
Increasing the effectiveness and efficiency of business
processes by fully defining and eliminating delays,
Increasing productivity,
Lower operating costs,
Increase in profit and long-term survival of the company
on the market.
III. SOCIAL ASPECT OF QUALITY
It relates to human quality or quality of life, and relates to
the future, and is based on a broad social understanding of quality,
the culture of the company's quality and the human aspect of
quality.
The creator of modern quality theory is Deming, an
American scientist who laid the foundations and helped
significantly to the development of quality practices throughout
the world, primarily in Japan. After the Second World War,
Deming was transferred to the Ministry of War as a consultant,
where he was tasked to, in addition to statistics, analyze the quality
of the work of the company's production that produced for the
army. During the war, while performing the basic work, he also
held a series of lectures from statistics across the US and Canada.
Thanks to these lectures and efforts of General McCarthy, Deming
came to Japan in 1947 for the first time.
Deming's contribution to the development of Japanese
philosophy of quality, the renewal of the Japanese economy after
the Second World War, and the formation of scientific methods of
control and quality improvement is enormous. The fact that the
biggest Japanese quality award is named after him: The Deming
Award for Quality speaks enough of the merit of creating Japanese
business success, and the American Quality Control Association
in 1980 established the Deming Medal for achievements in
statistical techniques and quality improvement.
Deming's fourteen points are its guidelines to
management when it comes to creating relationships and practical
measures to raise the quality system level in their own company.
The application of these principle does not depend on the size of
the company, type of production or services. They can also apply
to sectors within companies.
In the abbreviated version, the principles listed are:
1. Adopt continuous goals (create and publish an enterprise
mission and implement it),
2. Adopt a new philosophy,
3. Discontinue the practice of cheapest procurement,
4. Institutionalize leadership,
5. Eliminate empty slogans,
6. Eliminate numerical goals,
7. Introduce education at work,
8. Eliminate fear (and create trust),
9. Breaking barriers between organizational units (within
companies),
10. Conduct activities in accordance with changes
(transformations),
11. Improve continuous processes in production and service,
12. Reducing dependence on mass quality control,
13. Remove barriers that prevent people from being proud of
their work,
14. Conducts energetic curriculum.
Interpretation of quality, ie interpretation of the path for
achieving quality, the goal defined within each organization,
changed over time and depended on the achieved level of
development and the volume of production or services, as well as
the level of maturity of the social community.
Efforts to determine the concept of quality are characterized by the
presence of a subjective moment, which additionally influences an
objective approach in its expression. Some of the approaches are
based on assumptions that quality is a reflection of living standards
at a higher level.
There are also approaches according to which the quality
of the phenomena is reflected in the so-called petty attitudes that
are not common. According to some interpretations, quality can
be viewed through the level of convenience for use or compliance
with the needs of users.
“To determine meaning and essence of services quality,
is far more complex than defining the quality of goods. Without
going into more detail in the analysis of individual specificities, it
is shown that the basic difference between products and services
stems from the nature of service intolerance.
From this characteristics of service, there are also other
differences between products and services. Services can not be
seen, touched, possessed or displayed before purchase, and
International Journal of Scientific and Research Publications, Volume 10, Issue 1, January 2020 494
ISSN 2250-3153
http://dx.doi.org/10.29322/IJSRP.10.01.2020.p9776 www.ijsrp.org
customers can not test or evaluate quality before their use. Because
of this, service is very difficult to explain to potential buyers, and
the quality of the information provided depends on the ability of
those who sell those services.”
A sufficient number of comprehension of the concept of
quality is understandable, and the answers that have been obtained
lead to the conclusion that quality is not uniquely determined.
Quality is a set of different attributes and properties that the
product or service has and the impressions it leaves for each user
individually.
According to Kotler, quality can be defined as the degree
of ability of a particular brand to perform its functions. Quality is
a set of all properties of products, processes, services for the
consumer, from a range of market elements, business, quality of
life, protection of the environment, health correctness of
foodstuffs and others.
We distinguish different quality approaches according to
the lifetimes of a product or service that underlie key activities that
have an impact on the quality of products and services. In a given
context, in relation to the life-span of a product or service, the
following concepts can be stated:
Quality in the design phase of a product or service,
Quality in the stage of production of a product or service,
Quality in the phase of delivery of a product or service,
and Quality in a phase that involves relationships with
users of products or services.
A set of activities related to the realization of quality
objectives is necessary to be implemented in an organized and
systematic manner. The starting point for this is the attitude of the
organization, that is, the management of the organization in terms
of quality, which is an organization's quality policy. The quality
of the organization's quality within itself contains the general goals
and intentions of the organization in relation to the quality
prescribed by the management of the organization. Quality policy
is one of the most important segments of the overall policy of the
organization.
IV. QUALITY MANAGEMENT
Quality management represents all the activities of the
overall management function that determine the quality policy,
goals and responsibilities and is introduced as quality planning,
quality assurance, quality control and quality improvement within
the quality system. Quality management means that control over
the characteristics that make up the quality of a product or service
is established.
This practically implies the definition and
implementation of the procedures necessary for creating products
that will have the desired characteristics, or manage the activities
and their results. Quality management actually represents
methodical actions and procedures that are applied throughout the
duration of all processes in order to increase the level of their
efficiency. Procedures and methods of quality management can be
divided into three groups:
- Inclusion of quality as one of the parameters of the
management of creative activities,
- Application of general procedures and methods to quality
as a parameter,
- Introduction and application of special methods and
tools.
Quality management at the same time represents the
technique and methodology, that is, it is not a separate and separate
activity that is an upgrade to the activities of the company and its
products and services. It is implementation of these activities in a
way that they take place efficiently, in a way to master the
activities of creating products and services and the results of these
activities.
Quality management is responsible for all levels of
management, with the highest responsibility of top management,
which is also responsible for managing the quality management
system within the organization.
“Implementing and applying the concept of a quality
management system requires careful planning. It is also necessary
to create real technical and organizational conditions. Successful
examples show that the highest potential lies in the expertise of
employees and their motivation.” Since quality is embedded in a
product or service, it is defined and constructed together with it.
Quality management, as part of the overall management
of the company (management system), is aimed at realizing the
general goals of company, first of all, to quality, resource
allocation, growth and development of the company, market
position, profitability, environmental protection , safety of tourists
and employees, food safety, etc. It is a continuous process based
on compliance with established standards, which serve as a basis
for establishing a quality management system, their continuous
improvement and continuous improvement of products.
Organizational standards are used as a framework for organizing
the organization in order to improve the performance, ie,
successful conduct and successful business. For the purpose of
more efficient operation, ie satisfying the requirements of all
participants in the business process, the trend is to integrate
individual standardized management systems (quality,
environment, health and safety of employees, food safety, finance,
ethical standards, etc.). Such integrated systems as a whole are
oriented towards the continuous achievement of the goals of the
organization that meet the expectations of all stakeholders.
V. TOTAL QUALITY MANAGEMENT
Contemporary understanding of quality management
implies the so-called total quality management, which includes the
functions within the organization that contribute to the creation,
definition of products, its realization, maintenance and use, which
are realized through the quality system.
Creating a product consists of a particular process that
represents a sequence of activities and work, carried out in a way
to provide the previously determined desired result. The
management of these activities is carried out through procedures
that have a preventive character and whose goal is to do a good
job from the first time. In order to ensure a higher level of product
quality, the most important factor of the quality leverage system
lies in the development area (100: 1), then in the area of process
planning (10: 1) and, ultimately, in the production itself (1: 1).
Carrying out a particular job in an appropriate way is not a primary
goal that is placed before a manager. The goal should be defined
in the direction that the job must be done in an even better way the
International Journal of Scientific and Research Publications, Volume 10, Issue 1, January 2020 495
ISSN 2250-3153
http://dx.doi.org/10.29322/IJSRP.10.01.2020.p9776 www.ijsrp.org
next time. In this way, the set goal ensures that the job process can
be viewed as a process of continuous improvement.
Quality management services rely on identical
mechanisms of prevention and correction, as well as product
quality management. The design of the service involves the
conversion of complex information about the service into the
specification of services, its performance and congresses. The
service specification defines the service that is performed, while
the specification of the service performance defines the means and
methods used to perform the service.
The quality control specification defines the procedure for
assessing and controlling the service and characteristics of the
provision of the service. Designing service specifications, service
performance and quality control are independent, but with
interaction during the design process. The service specification
needs to have a complete and accurate display of the service. It
should be planned as an integral part of the service process. It
should be provided in such a way as to enable effective control of
each service process and ensure that the service fully meets the
specifications of the service and users.
Improving quality is becoming a priority task not only of
management, but also of state bodies, educational and scientific
institutions, business professional and professional associations.
Comprehensive introduction and improvement of quality should
contribute to achieving overall improvement of people's quality of
life, which implies improvement of living standards, protection of
the environment, health and safety. The quality management
system is by no means a formality that needs to be fulfilled to meet
the requirements of the international market, but a kind of social
technology that affects the way and organization of the business
of the company.
REFERENCES
[1] Barjaktarović D., „Upravljanje kvalitetom u hotelijerstvu“, Univerzitet Singidunum, (2013.), str. 7
[2] Lazić J, Cvijanović J, Zeremski A., „Infrastrukturna podrška QMS“, Projekat 149011 „Determinisanje dimenzija organizacione strukture u funkciji kvantifikacije uticaja najvaţnijih kontingentnih faktora preduzeće“, (2009.), str. 27-28
[3] M. Dahlgard, J. Kristensen, K.K. Kanji, G. K:“Foundametals of Total Quality Management – Process Analysis, and Improvement“, Chapman & Hall, London, (1998.), стр. 8-15
[4] Živković Ž., Đorđević P., „Upravljanje kvalitetom, IV izmenjeno i dopunjeno izdanje“, (2013.), str.
[5] Minić S., „Menadžment u praksi“, Univerzitet Privredna akademija u Novom Sadu Fakultet za primenjeni menadžment, ekonomiju i finansije u Beogradu, (2016.), str.6-7
[6] Heleta M, TQM – menadžment kocept za poslovnu izvrsnost. Zbornik radova: Izazovi menadžmenta i marketinga u globalnom okruženju. Beograd: Ekonomski fakultet, (1998.).
[7] Lidija B. Mihailović, Aleksandar M. Tanasković, Moderan pristup menadžmentu kvaliteta – principi menadžmenta totalnog kvaliteta, Fakultet organizacionih nauka, Beograd (2017).
[8] Dragan Mihajlović, Anđelija Plavšić, Biljana Ilić, Upravljanje znanjem u okviru menadžmenta ljudskih resursa, Zbornik radova VII skup privrednika i naučnika SPIN 09, FON, (2009).
[9] Winter, S.G., Knowledge and Competence as Strategic Assets. In: Klein D.A. (Ed.), The Strategic Management of Intellectual Capital, (1987).
[10] Mr Vitomir Miladinović, dipl. inž., Razvoj i principi teorije i prakse obezbeđenja kvaliteta i upravljanja kvalitetom, Naučnotehnički PREGLED,vol.L,,br.1,2000., (2000).
[11] https://www.biznis-akademija.com/upravljanje-kvalitetom-1,
AUTHORS
First Author – Khalifa Isa phd.Candidate
International Journal of Scientific and Research Publications, Volume 10, Issue 1, January 2020 496
ISSN 2250-3153
http://dx.doi.org/10.29322/IJSRP.10.01.2020.p9777 www.ijsrp.org
Rules Of Engagement: A Case Of Employees In Jubilee
Insurance
Dr. Medina Halako Twalib*
University of Nairobi
School of Business
*(Corresponding [email protected]), P. O. Box 30197-00100, Nairobi, Kenya
DOI: 10.29322/IJSRP.10.01.2020.p9777 http://dx.doi.org/10.29322/IJSRP.10.01.2020.p9777
ABSTRACT
Organizations are striving to find better ways of engaging their employees since many organizations have realised that workers
are the most imperative resource for achieving their goals. The objective of the study was to find out the factors affecting
employee engagement at jubilee insurance. Descriptive survey was used as a research design and questionnaires distributed to
the 175 respondents from a population of 580. Factor analysis was employed used for analysing data. Results indicated that four
major factors influence employee engagement. It is recommended that managers should ensure they have a good relationship
with employee and encourage teamwork in the organization.
Keywords
Employee Engagement, Disengagement
INTRODUCTION
Employee engagement is an inner state of being that gathers earlier models of work effort, organizational commitment, work
satisfaction and optimal experience (Armstrong, 2006). Engagement is a fulfilling, work related experience characterized by
dynamism, devotion and captivation (schaufeli et al 2002). According to Gallup (2010) engaged personnel are those that work
with dedication and who feel connected to their organization. Alfes et al (2010) posited that engaged workers are more
productive, more innovative and are likely to be retained with the employer, are healthier and enjoy their work more than others.
Employee engagement focus in bringing out an intrinsic desire to work for the company. Guest (2009) argues that employee
involvement is demonstrated in employees’ positive attitudes and behaviour and indication of trust, equity and commitment are
fulfilled.
Gallup (2005) noted that there are three types of employees; engaged employees. They consistently endeavour to give quality
within their roles. They are devoted toothier role, unlikely to quit, more industrious, hence brings in greater profits in
organization. The second category according to Gallup (2005) is the not engaged personnel. They emphasis on the tasks spelt
rather than the goals of the organization. They do what is in their job description are “checked out” and “sleepwalking” through
their day with less interest, or any personal investment. They are usually neither positive nor negative about their company. The
third types are the actively disengaged employees. Gallup (2005) noted that these are employees who not only don’t do well, but
demotivate others as well. They are always complaining and criticizing and undermining colleagues’ efforts to promote a
negative attitude and environment.
LITERATURE REVIEW
Several research studies have been published that on factors that drive employee engagement. A study done by Robinson (2007)
on what drives employee engagement, found that employee engagement is brought about by opportunities for upward feedback,
operative consultation and communication systems and a manager who is fair-minded and evidently committed to the
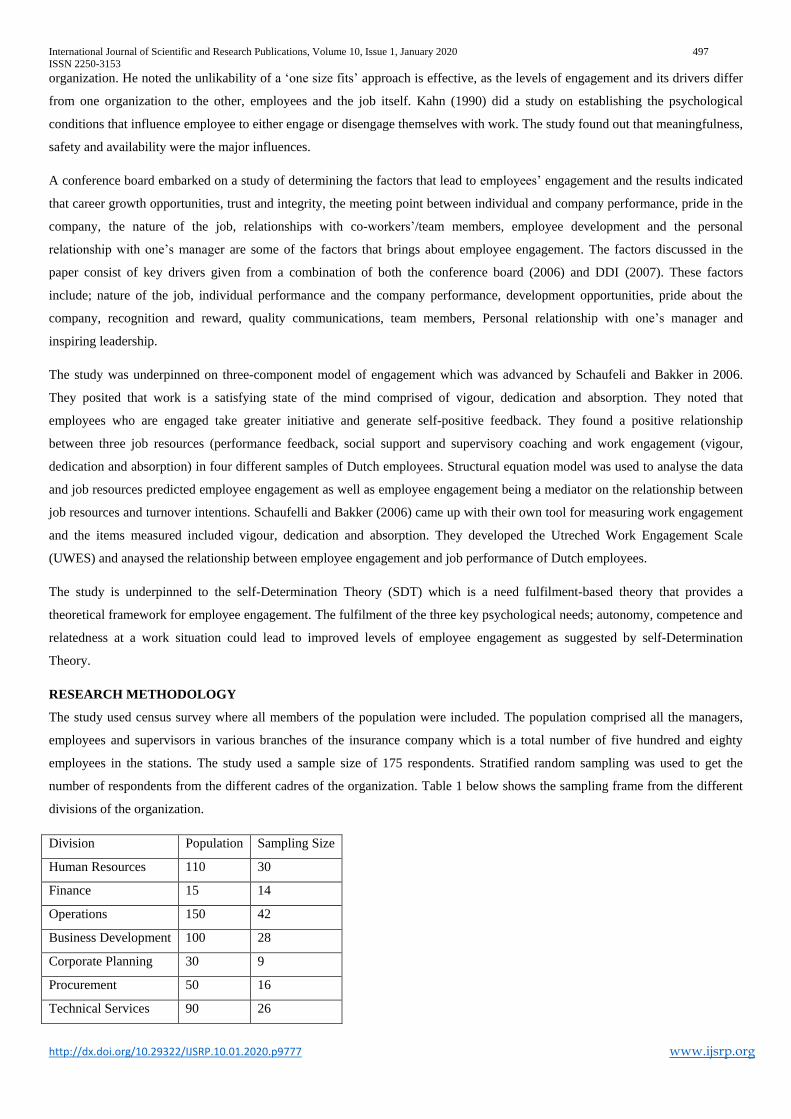
International Journal of Scientific and Research Publications, Volume 10, Issue 1, January 2020 497
ISSN 2250-3153
http://dx.doi.org/10.29322/IJSRP.10.01.2020.p9777 www.ijsrp.org
organization. He noted the unlikability of a ‘one size fits’ approach is effective, as the levels of engagement and its drivers differ
from one organization to the other, employees and the job itself. Kahn (1990) did a study on establishing the psychological
conditions that influence employee to either engage or disengage themselves with work. The study found out that meaningfulness,
safety and availability were the major influences.
A conference board embarked on a study of determining the factors that lead to employees’ engagement and the results indicated
that career growth opportunities, trust and integrity, the meeting point between individual and company performance, pride in the
company, the nature of the job, relationships with co-workers’/team members, employee development and the personal
relationship with one’s manager are some of the factors that brings about employee engagement. The factors discussed in the
paper consist of key drivers given from a combination of both the conference board (2006) and DDI (2007). These factors
include; nature of the job, individual performance and the company performance, development opportunities, pride about the
company, recognition and reward, quality communications, team members, Personal relationship with one’s manager and
inspiring leadership.
The study was underpinned on three-component model of engagement which was advanced by Schaufeli and Bakker in 2006.
They posited that work is a satisfying state of the mind comprised of vigour, dedication and absorption. They noted that
employees who are engaged take greater initiative and generate self-positive feedback. They found a positive relationship
between three job resources (performance feedback, social support and supervisory coaching and work engagement (vigour,
dedication and absorption) in four different samples of Dutch employees. Structural equation model was used to analyse the data
and job resources predicted employee engagement as well as employee engagement being a mediator on the relationship between
job resources and turnover intentions. Schaufelli and Bakker (2006) came up with their own tool for measuring work engagement
and the items measured included vigour, dedication and absorption. They developed the Utreched Work Engagement Scale
(UWES) and anaysed the relationship between employee engagement and job performance of Dutch employees.
The study is underpinned to the self-Determination Theory (SDT) which is a need fulfilment-based theory that provides a
theoretical framework for employee engagement. The fulfilment of the three key psychological needs; autonomy, competence and
relatedness at a work situation could lead to improved levels of employee engagement as suggested by self-Determination
Theory.
RESEARCH METHODOLOGY
The study used census survey where all members of the population were included. The population comprised all the managers,
employees and supervisors in various branches of the insurance company which is a total number of five hundred and eighty
employees in the stations. The study used a sample size of 175 respondents. Stratified random sampling was used to get the
number of respondents from the different cadres of the organization. Table 1 below shows the sampling frame from the different
divisions of the organization.
Division Population Sampling Size
Human Resources 110 30
Finance 15 14
Operations 150 42
Business Development 100 28
Corporate Planning 30 9
Procurement 50 16
Technical Services 90 26
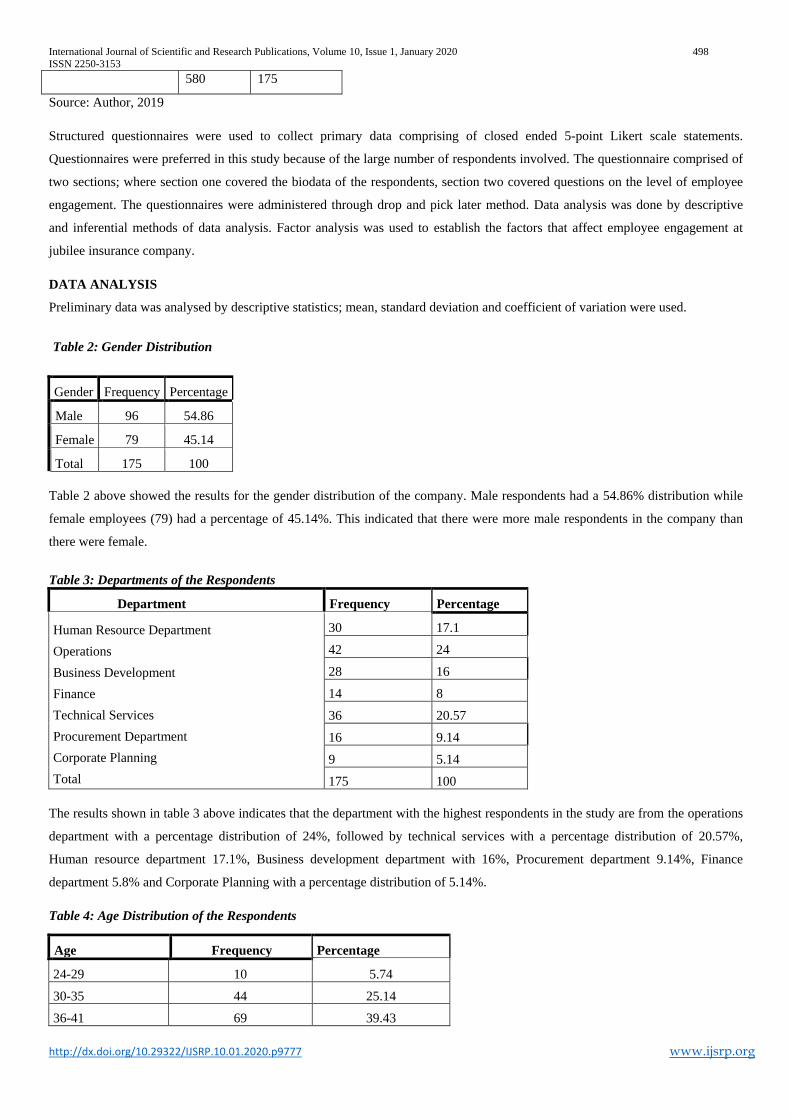
International Journal of Scientific and Research Publications, Volume 10, Issue 1, January 2020 498
ISSN 2250-3153
http://dx.doi.org/10.29322/IJSRP.10.01.2020.p9777 www.ijsrp.org
580 175
Source: Author, 2019
Structured questionnaires were used to collect primary data comprising of closed ended 5-point Likert scale statements.
Questionnaires were preferred in this study because of the large number of respondents involved. The questionnaire comprised of
two sections; where section one covered the biodata of the respondents, section two covered questions on the level of employee
engagement. The questionnaires were administered through drop and pick later method. Data analysis was done by descriptive
and inferential methods of data analysis. Factor analysis was used to establish the factors that affect employee engagement at
jubilee insurance company.
DATA ANALYSIS
Preliminary data was analysed by descriptive statistics; mean, standard deviation and coefficient of variation were used.
Table 2: Gender Distribution
Gender Frequency Percentage
Male 96 54.86
Female 79 45.14
Total 175 100
Table 2 above showed the results for the gender distribution of the company. Male respondents had a 54.86% distribution while
female employees (79) had a percentage of 45.14%. This indicated that there were more male respondents in the company than
there were female.
Table 3: Departments of the Respondents
Department Frequency Percentage
Human Resource Department
Operations
Business Development
Finance
Technical Services
Procurement Department
Corporate Planning
Total
30 17.1
42 24
28 16
14 8
36 20.57
16 9.14
9 5.14
175 100
The results shown in table 3 above indicates that the department with the highest respondents in the study are from the operations
department with a percentage distribution of 24%, followed by technical services with a percentage distribution of 20.57%,
Human resource department 17.1%, Business development department with 16%, Procurement department 9.14%, Finance
department 5.8% and Corporate Planning with a percentage distribution of 5.14%.
Table 4: Age Distribution of the Respondents
Age Frequency Percentage
24-29 10 5.74
30-35 44 25.14
36-41 69 39.43
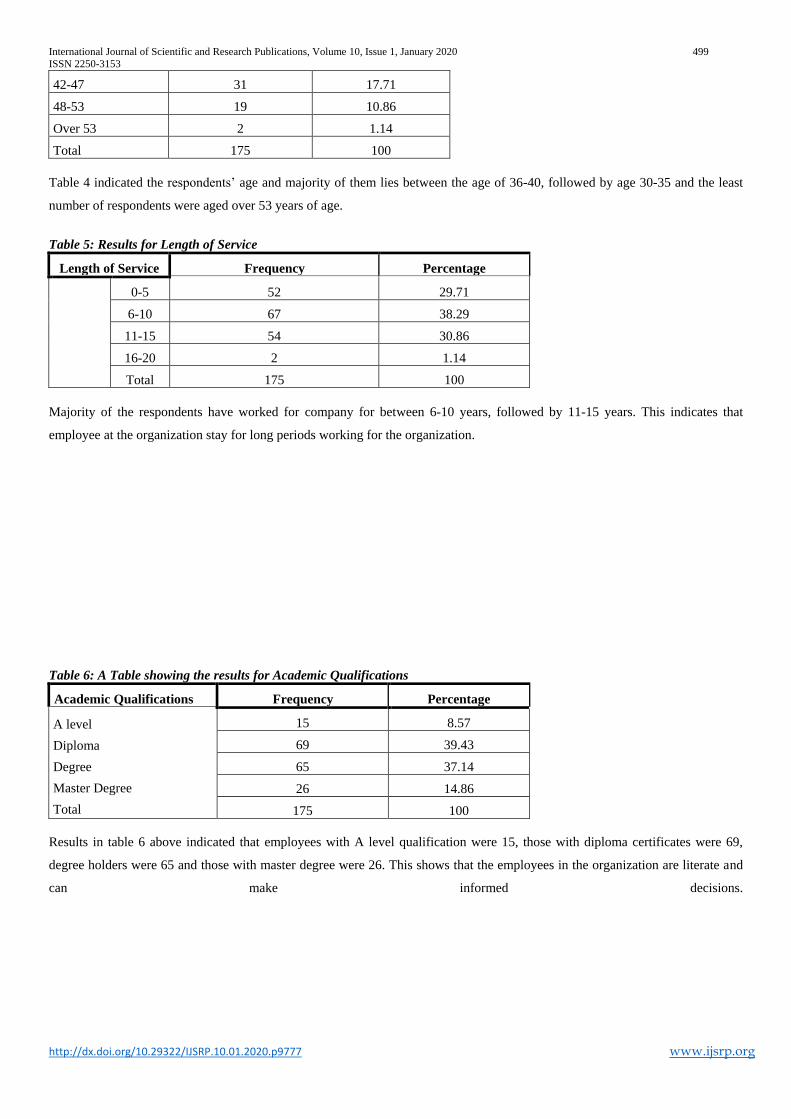
International Journal of Scientific and Research Publications, Volume 10, Issue 1, January 2020 499
ISSN 2250-3153
http://dx.doi.org/10.29322/IJSRP.10.01.2020.p9777 www.ijsrp.org
42-47 31 17.71
48-53 19 10.86
Over 53 2 1.14
Total 175 100
Table 4 indicated the respondents’ age and majority of them lies between the age of 36-40, followed by age 30-35 and the least
number of respondents were aged over 53 years of age.
Table 5: Results for Length of Service
Length of Service Frequency Percentage
0-5 52 29.71
6-10 67 38.29
11-15 54 30.86
16-20 2 1.14
Total 175 100
Majority of the respondents have worked for company for between 6-10 years, followed by 11-15 years. This indicates that
employee at the organization stay for long periods working for the organization.
Table 6: A Table showing the results for Academic Qualifications
Academic Qualifications Frequency Percentage
A level
Diploma
Degree
Master Degree
Total
15 8.57
69 39.43
65 37.14
26 14.86
175 100
Results in table 6 above indicated that employees with A level qualification were 15, those with diploma certificates were 69,
degree holders were 65 and those with master degree were 26. This shows that the employees in the organization are literate and
can make informed decisions.
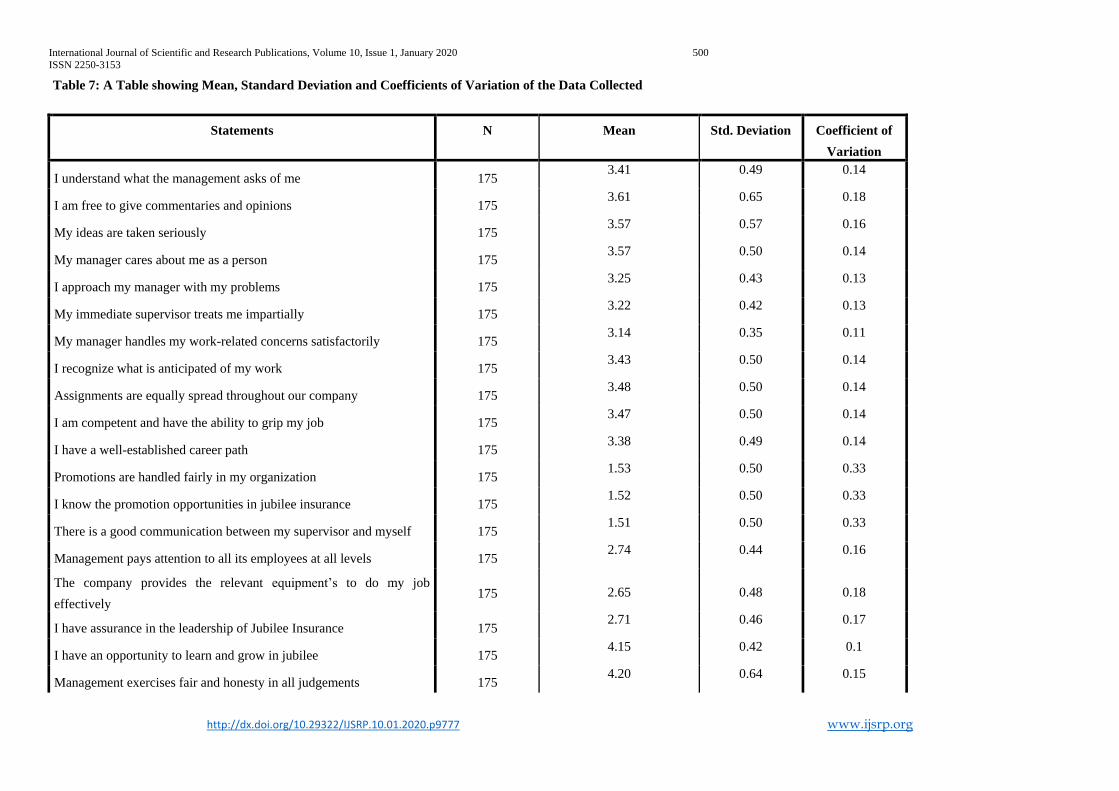
International Journal of Scientific and Research Publications, Volume 10, Issue 1, January 2020 500
ISSN 2250-3153
http://dx.doi.org/10.29322/IJSRP.10.01.2020.p9777 www.ijsrp.org
Table 7: A Table showing Mean, Standard Deviation and Coefficients of Variation of the Data Collected
Statements N Mean Std. Deviation Coefficient of
Variation
I understand what the management asks of me 175 3.41 0.49 0.14
I am free to give commentaries and opinions 175 3.61 0.65 0.18
My ideas are taken seriously 175 3.57 0.57 0.16
My manager cares about me as a person 175 3.57 0.50 0.14
I approach my manager with my problems 175 3.25 0.43 0.13
My immediate supervisor treats me impartially 175 3.22 0.42 0.13
My manager handles my work-related concerns satisfactorily 175 3.14 0.35 0.11
I recognize what is anticipated of my work 175 3.43 0.50 0.14
Assignments are equally spread throughout our company 175 3.48 0.50 0.14
I am competent and have the ability to grip my job 175 3.47 0.50 0.14
I have a well-established career path 175 3.38 0.49 0.14
Promotions are handled fairly in my organization 175 1.53 0.50 0.33
I know the promotion opportunities in jubilee insurance 175 1.52 0.50 0.33
There is a good communication between my supervisor and myself 175 1.51 0.50 0.33
Management pays attention to all its employees at all levels 175 2.74 0.44 0.16
The company provides the relevant equipment’s to do my job
effectively 175 2.65 0.48 0.18
I have assurance in the leadership of Jubilee Insurance 175 2.71 0.46 0.17
I have an opportunity to learn and grow in jubilee 175 4.15 0.42 0.1
Management exercises fair and honesty in all judgements 175 4.20 0.64 0.15
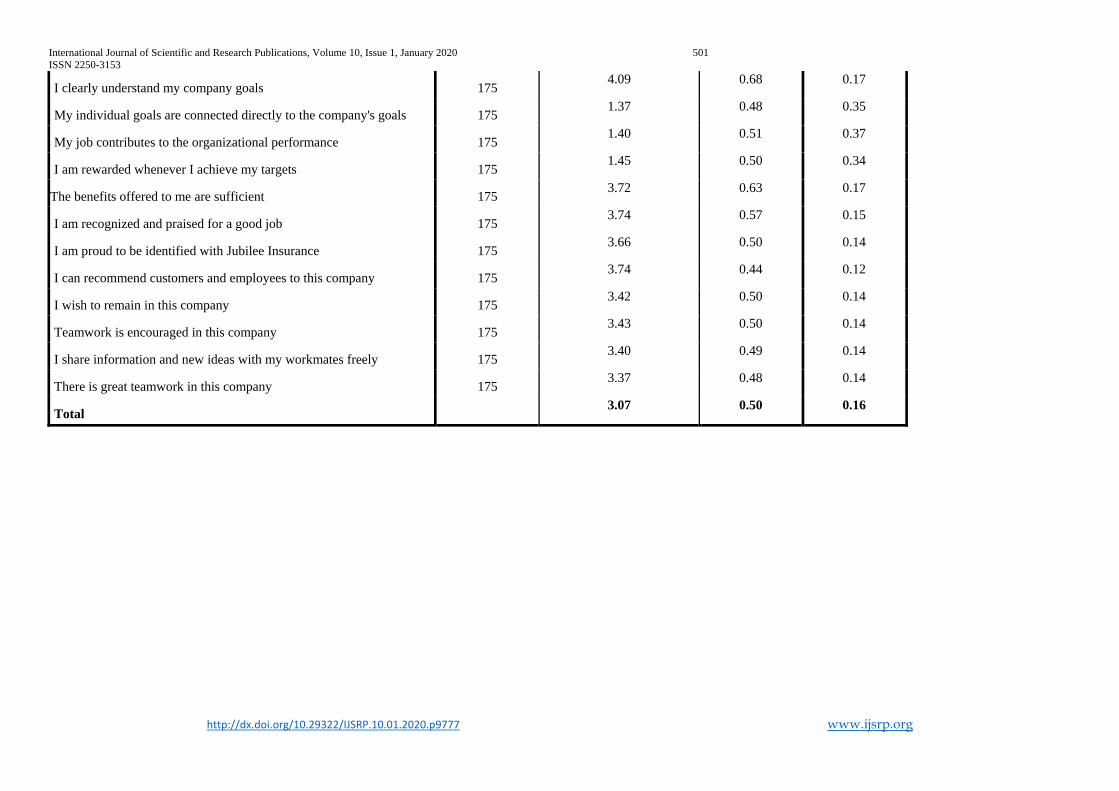
International Journal of Scientific and Research Publications, Volume 10, Issue 1, January 2020 501
ISSN 2250-3153
http://dx.doi.org/10.29322/IJSRP.10.01.2020.p9777 www.ijsrp.org
I clearly understand my company goals 175 4.09 0.68 0.17
My individual goals are connected directly to the company's goals 175 1.37 0.48 0.35
My job contributes to the organizational performance 175 1.40 0.51 0.37
I am rewarded whenever I achieve my targets 175 1.45 0.50 0.34
The benefits offered to me are sufficient 175 3.72 0.63 0.17
I am recognized and praised for a good job 175 3.74 0.57 0.15
I am proud to be identified with Jubilee Insurance 175 3.66 0.50 0.14
I can recommend customers and employees to this company 175 3.74 0.44 0.12
I wish to remain in this company 175 3.42 0.50 0.14
Teamwork is encouraged in this company 175 3.43 0.50 0.14
I share information and new ideas with my workmates freely 175 3.40 0.49 0.14
There is great teamwork in this company 175 3.37 0.48 0.14
Total 3.07 0.50 0.16
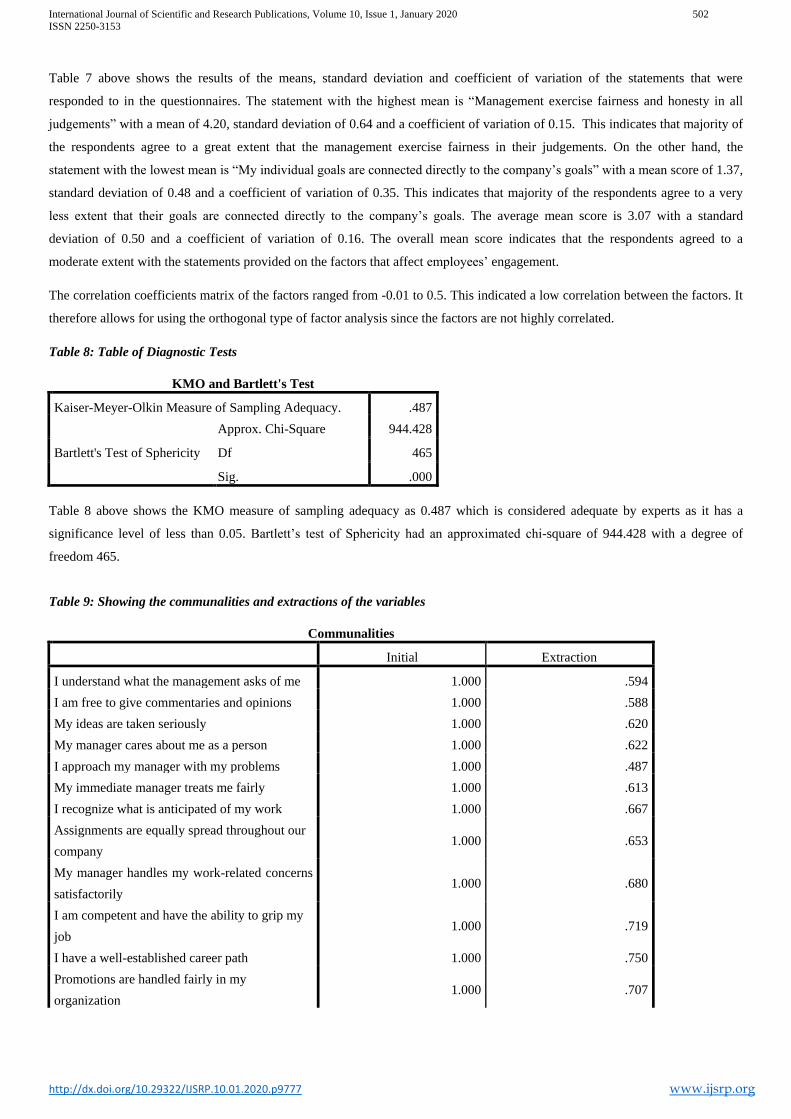
International Journal of Scientific and Research Publications, Volume 10, Issue 1, January 2020 502
ISSN 2250-3153
http://dx.doi.org/10.29322/IJSRP.10.01.2020.p9777 www.ijsrp.org
Table 7 above shows the results of the means, standard deviation and coefficient of variation of the statements that were
responded to in the questionnaires. The statement with the highest mean is “Management exercise fairness and honesty in all
judgements” with a mean of 4.20, standard deviation of 0.64 and a coefficient of variation of 0.15. This indicates that majority of
the respondents agree to a great extent that the management exercise fairness in their judgements. On the other hand, the
statement with the lowest mean is “My individual goals are connected directly to the company’s goals” with a mean score of 1.37,
standard deviation of 0.48 and a coefficient of variation of 0.35. This indicates that majority of the respondents agree to a very
less extent that their goals are connected directly to the company’s goals. The average mean score is 3.07 with a standard
deviation of 0.50 and a coefficient of variation of 0.16. The overall mean score indicates that the respondents agreed to a
moderate extent with the statements provided on the factors that affect employees’ engagement.
The correlation coefficients matrix of the factors ranged from -0.01 to 0.5. This indicated a low correlation between the factors. It
therefore allows for using the orthogonal type of factor analysis since the factors are not highly correlated.
Table 8: Table of Diagnostic Tests
KMO and Bartlett's Test
Kaiser-Meyer-Olkin Measure of Sampling Adequacy. .487
Bartlett's Test of Sphericity
Approx. Chi-Square 944.428
Df 465
Sig. .000
Table 8 above shows the KMO measure of sampling adequacy as 0.487 which is considered adequate by experts as it has a
significance level of less than 0.05. Bartlett’s test of Sphericity had an approximated chi-square of 944.428 with a degree of
freedom 465.
Table 9: Showing the communalities and extractions of the variables
Communalities
Initial Extraction
I understand what the management asks of me 1.000 .594
I am free to give commentaries and opinions 1.000 .588
My ideas are taken seriously 1.000 .620
My manager cares about me as a person 1.000 .622
I approach my manager with my problems 1.000 .487
My immediate manager treats me fairly 1.000 .613
I recognize what is anticipated of my work 1.000 .667
Assignments are equally spread throughout our
company 1.000 .653
My manager handles my work-related concerns
satisfactorily 1.000 .680
I am competent and have the ability to grip my
job 1.000 .719
I have a well-established career path 1.000 .750
Promotions are handled fairly in my
organization 1.000 .707
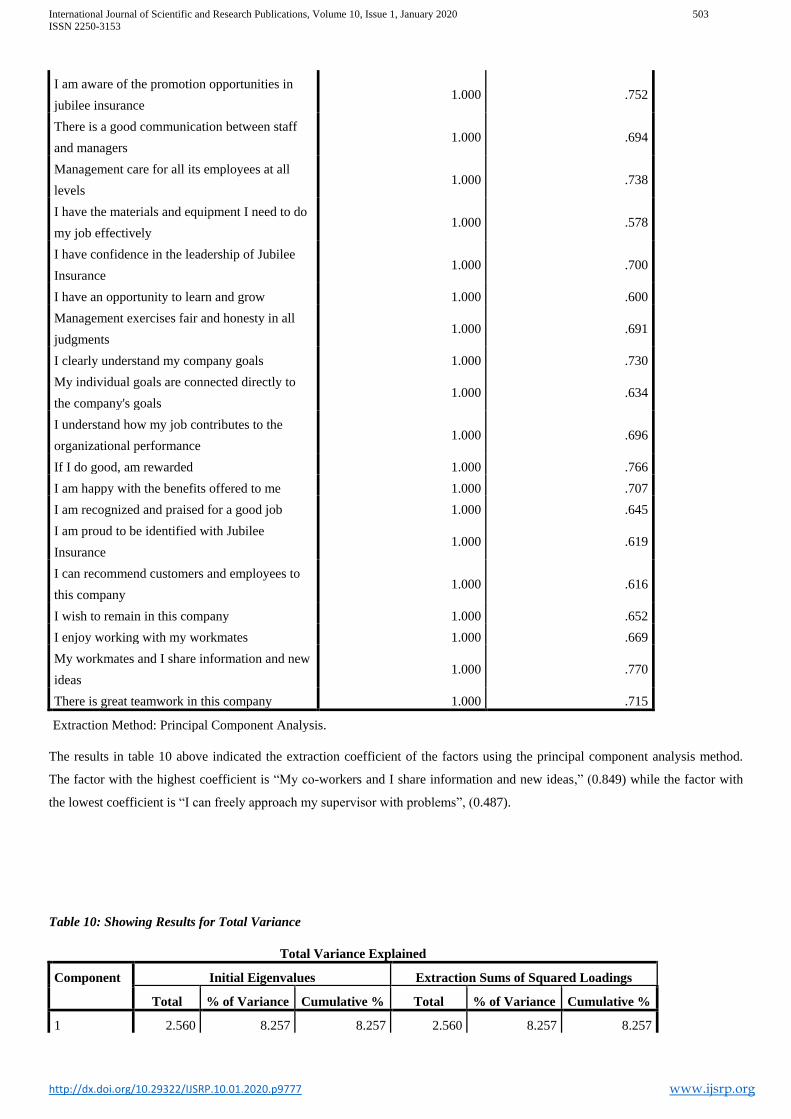
International Journal of Scientific and Research Publications, Volume 10, Issue 1, January 2020 503
ISSN 2250-3153
http://dx.doi.org/10.29322/IJSRP.10.01.2020.p9777 www.ijsrp.org
I am aware of the promotion opportunities in
jubilee insurance 1.000 .752
There is a good communication between staff
and managers 1.000 .694
Management care for all its employees at all
levels 1.000 .738
I have the materials and equipment I need to do
my job effectively 1.000 .578
I have confidence in the leadership of Jubilee
Insurance 1.000 .700
I have an opportunity to learn and grow 1.000 .600
Management exercises fair and honesty in all
judgments 1.000 .691
I clearly understand my company goals 1.000 .730
My individual goals are connected directly to
the company's goals 1.000 .634
I understand how my job contributes to the
organizational performance 1.000 .696
If I do good, am rewarded 1.000 .766
I am happy with the benefits offered to me 1.000 .707
I am recognized and praised for a good job 1.000 .645
I am proud to be identified with Jubilee
Insurance 1.000 .619
I can recommend customers and employees to
this company 1.000 .616
I wish to remain in this company 1.000 .652
I enjoy working with my workmates 1.000 .669
My workmates and I share information and new
ideas 1.000 .770
There is great teamwork in this company 1.000 .715
Extraction Method: Principal Component Analysis.
The results in table 10 above indicated the extraction coefficient of the factors using the principal component analysis method.
The factor with the highest coefficient is “My co-workers and I share information and new ideas,” (0.849) while the factor with
the lowest coefficient is “I can freely approach my supervisor with problems”, (0.487).
Table 10: Showing Results for Total Variance
Total Variance Explained
Component Initial Eigenvalues Extraction Sums of Squared Loadings
Total % of Variance Cumulative % Total % of Variance Cumulative %
1 2.560 8.257 8.257 2.560 8.257 8.257
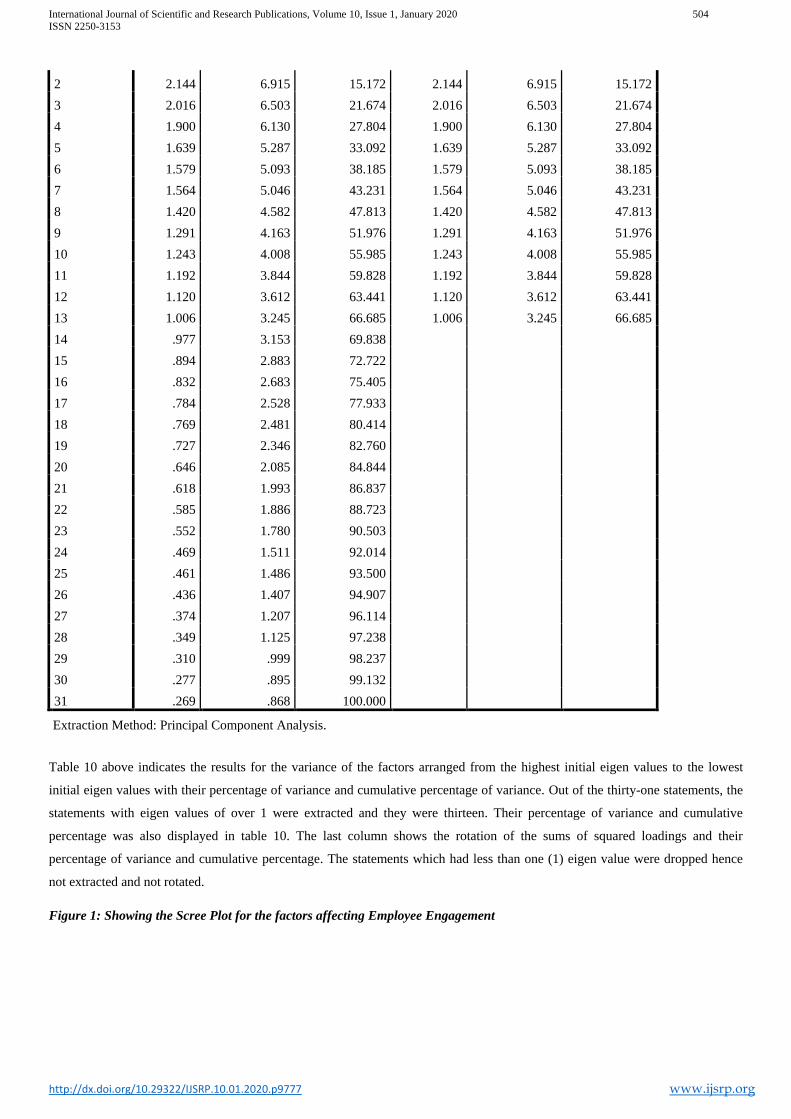
International Journal of Scientific and Research Publications, Volume 10, Issue 1, January 2020 504
ISSN 2250-3153
http://dx.doi.org/10.29322/IJSRP.10.01.2020.p9777 www.ijsrp.org
2 2.144 6.915 15.172 2.144 6.915 15.172
3 2.016 6.503 21.674 2.016 6.503 21.674
4 1.900 6.130 27.804 1.900 6.130 27.804
5 1.639 5.287 33.092 1.639 5.287 33.092
6 1.579 5.093 38.185 1.579 5.093 38.185
7 1.564 5.046 43.231 1.564 5.046 43.231
8 1.420 4.582 47.813 1.420 4.582 47.813
9 1.291 4.163 51.976 1.291 4.163 51.976
10 1.243 4.008 55.985 1.243 4.008 55.985
11 1.192 3.844 59.828 1.192 3.844 59.828
12 1.120 3.612 63.441 1.120 3.612 63.441
13 1.006 3.245 66.685 1.006 3.245 66.685
14 .977 3.153 69.838
15 .894 2.883 72.722
16 .832 2.683 75.405
17 .784 2.528 77.933
18 .769 2.481 80.414
19 .727 2.346 82.760
20 .646 2.085 84.844
21 .618 1.993 86.837
22 .585 1.886 88.723
23 .552 1.780 90.503
24 .469 1.511 92.014
25 .461 1.486 93.500
26 .436 1.407 94.907
27 .374 1.207 96.114
28 .349 1.125 97.238
29 .310 .999 98.237
30 .277 .895 99.132
31 .269 .868 100.000
Extraction Method: Principal Component Analysis.
Table 10 above indicates the results for the variance of the factors arranged from the highest initial eigen values to the lowest
initial eigen values with their percentage of variance and cumulative percentage of variance. Out of the thirty-one statements, the
statements with eigen values of over 1 were extracted and they were thirteen. Their percentage of variance and cumulative
percentage was also displayed in table 10. The last column shows the rotation of the sums of squared loadings and their
percentage of variance and cumulative percentage. The statements which had less than one (1) eigen value were dropped hence
not extracted and not rotated.
Figure 1: Showing the Scree Plot for the factors affecting Employee Engagement
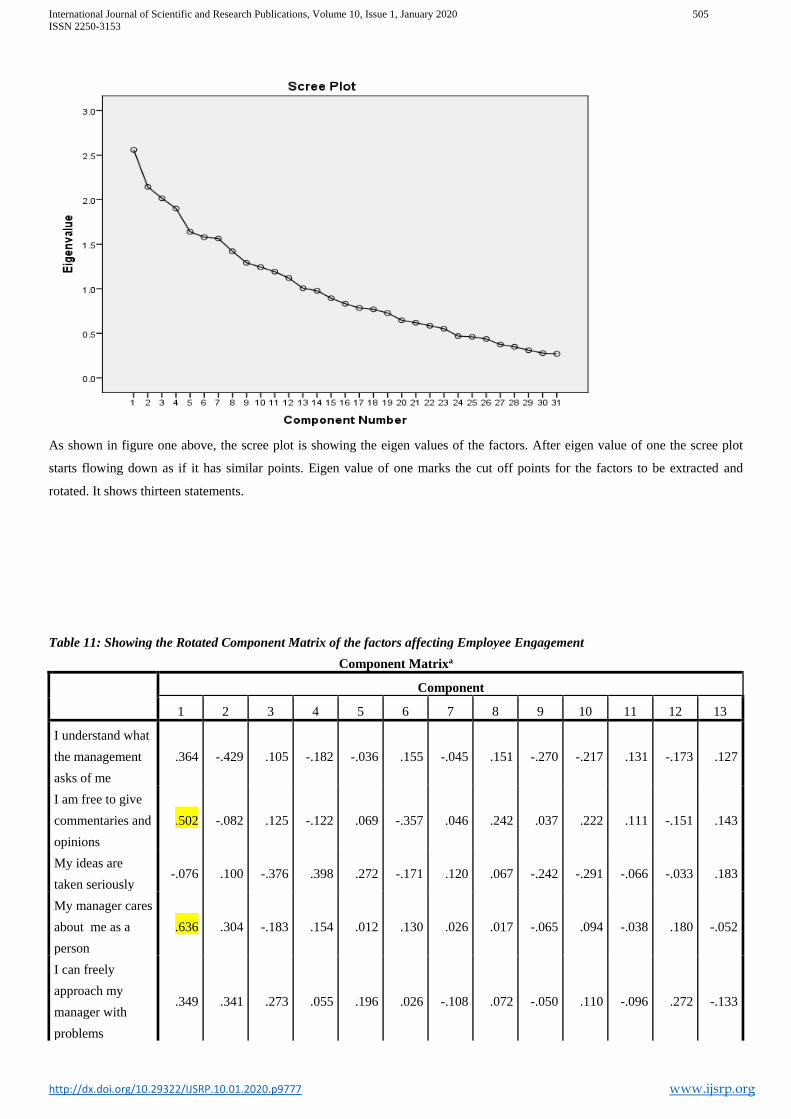
International Journal of Scientific and Research Publications, Volume 10, Issue 1, January 2020 505
ISSN 2250-3153
http://dx.doi.org/10.29322/IJSRP.10.01.2020.p9777 www.ijsrp.org
As shown in figure one above, the scree plot is showing the eigen values of the factors. After eigen value of one the scree plot
starts flowing down as if it has similar points. Eigen value of one marks the cut off points for the factors to be extracted and
rotated. It shows thirteen statements.
Table 11: Showing the Rotated Component Matrix of the factors affecting Employee Engagement
Component Matrixa
Component
1 2 3 4 5 6 7 8 9 10 11 12 13
I understand what
the management
asks of me
.364 -.429 .105 -.182 -.036 .155 -.045 .151 -.270 -.217 .131 -.173 .127
I am free to give
commentaries and
opinions
.502 -.082 .125 -.122 .069 -.357 .046 .242 .037 .222 .111 -.151 .143
My ideas are
taken seriously -.076 .100 -.376 .398 .272 -.171 .120 .067 -.242 -.291 -.066 -.033 .183
My manager cares
about me as a
person
.636 .304 -.183 .154 .012 .130 .026 .017 -.065 .094 -.038 .180 -.052
I can freely
approach my
manager with
problems
.349 .341 .273 .055 .196 .026 -.108 .072 -.050 .110 -.096 .272 -.133
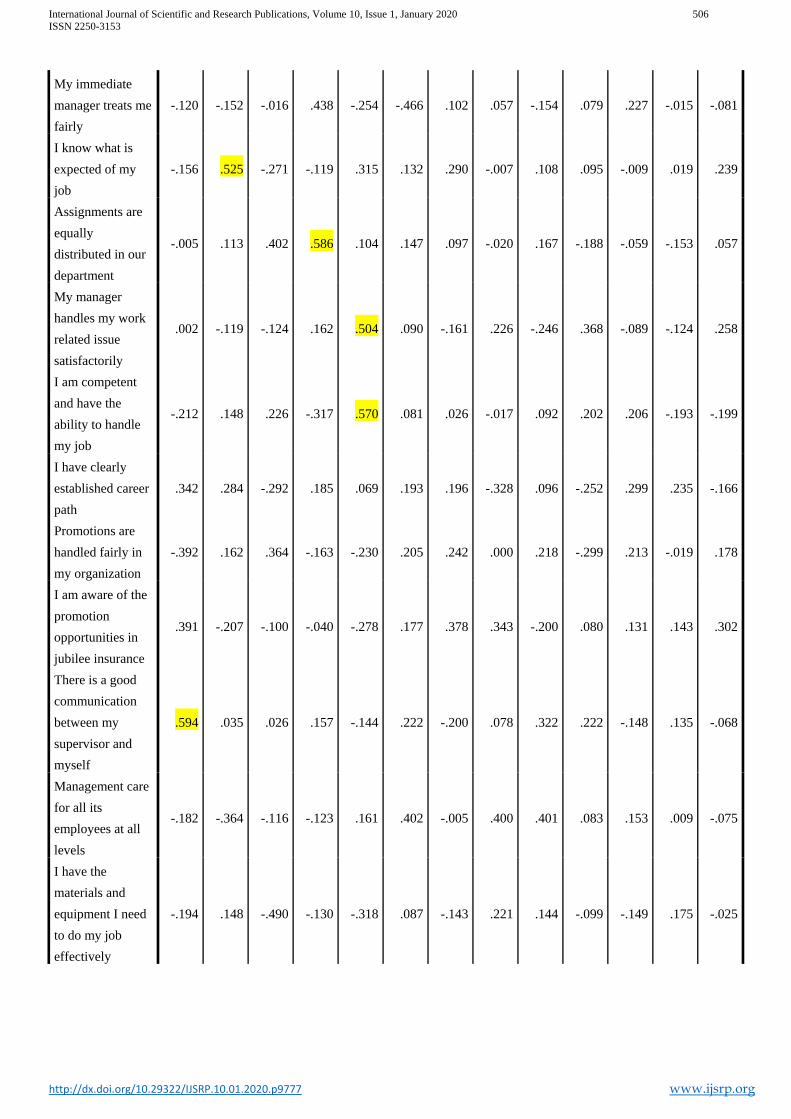
International Journal of Scientific and Research Publications, Volume 10, Issue 1, January 2020 506
ISSN 2250-3153
http://dx.doi.org/10.29322/IJSRP.10.01.2020.p9777 www.ijsrp.org
My immediate
manager treats me
fairly
-.120 -.152 -.016 .438 -.254 -.466 .102 .057 -.154 .079 .227 -.015 -.081
I know what is
expected of my
job
-.156 .525 -.271 -.119 .315 .132 .290 -.007 .108 .095 -.009 .019 .239
Assignments are
equally
distributed in our
department
-.005 .113 .402 .586 .104 .147 .097 -.020 .167 -.188 -.059 -.153 .057
My manager
handles my work
related issue
satisfactorily
.002 -.119 -.124 .162 .504 .090 -.161 .226 -.246 .368 -.089 -.124 .258
I am competent
and have the
ability to handle
my job
-.212 .148 .226 -.317 .570 .081 .026 -.017 .092 .202 .206 -.193 -.199
I have clearly
established career
path
.342 .284 -.292 .185 .069 .193 .196 -.328 .096 -.252 .299 .235 -.166
Promotions are
handled fairly in
my organization
-.392 .162 .364 -.163 -.230 .205 .242 .000 .218 -.299 .213 -.019 .178
I am aware of the
promotion
opportunities in
jubilee insurance
.391 -.207 -.100 -.040 -.278 .177 .378 .343 -.200 .080 .131 .143 .302
There is a good
communication
between my
supervisor and
myself
.594 .035 .026 .157 -.144 .222 -.200 .078 .322 .222 -.148 .135 -.068
Management care
for all its
employees at all
levels
-.182 -.364 -.116 -.123 .161 .402 -.005 .400 .401 .083 .153 .009 -.075
I have the
materials and
equipment I need
to do my job
effectively
-.194 .148 -.490 -.130 -.318 .087 -.143 .221 .144 -.099 -.149 .175 -.025
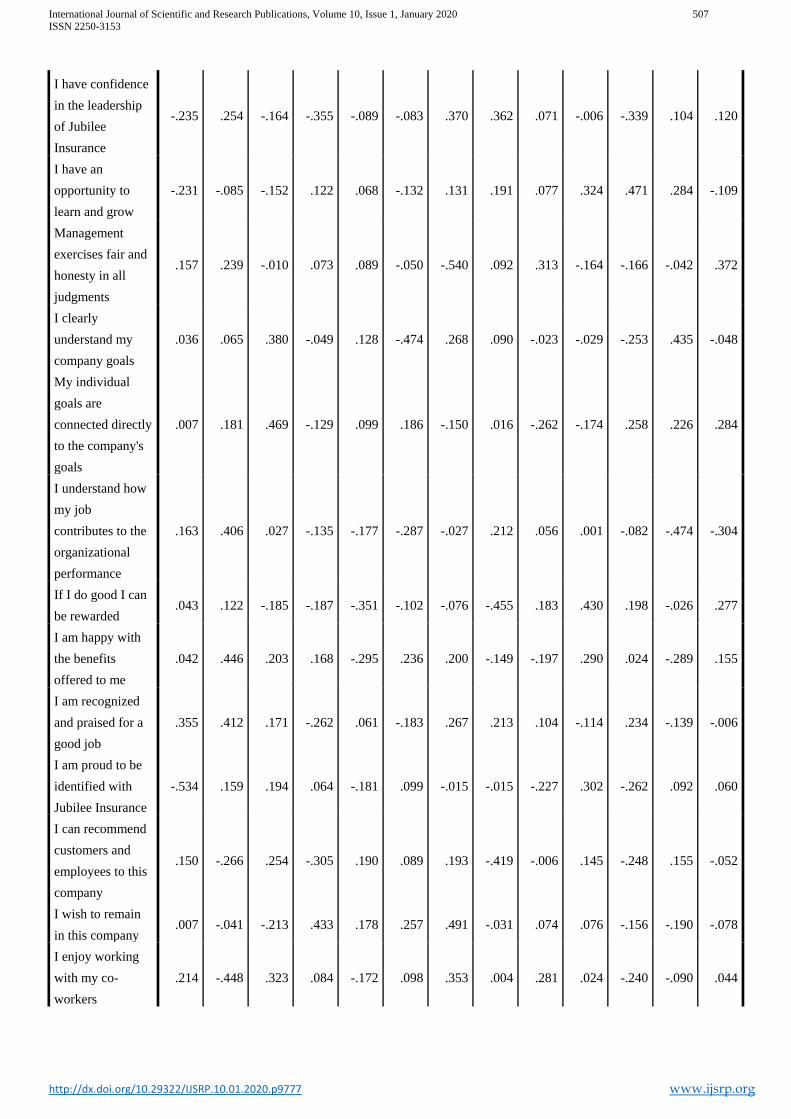
International Journal of Scientific and Research Publications, Volume 10, Issue 1, January 2020 507
ISSN 2250-3153
http://dx.doi.org/10.29322/IJSRP.10.01.2020.p9777 www.ijsrp.org
I have confidence
in the leadership
of Jubilee
Insurance
-.235 .254 -.164 -.355 -.089 -.083 .370 .362 .071 -.006 -.339 .104 .120
I have an
opportunity to
learn and grow
-.231 -.085 -.152 .122 .068 -.132 .131 .191 .077 .324 .471 .284 -.109
Management
exercises fair and
honesty in all
judgments
.157 .239 -.010 .073 .089 -.050 -.540 .092 .313 -.164 -.166 -.042 .372
I clearly
understand my
company goals
.036 .065 .380 -.049 .128 -.474 .268 .090 -.023 -.029 -.253 .435 -.048
My individual
goals are
connected directly
to the company's
goals
.007 .181 .469 -.129 .099 .186 -.150 .016 -.262 -.174 .258 .226 .284
I understand how
my job
contributes to the
organizational
performance
.163 .406 .027 -.135 -.177 -.287 -.027 .212 .056 .001 -.082 -.474 -.304
If I do good I can
be rewarded .043 .122 -.185 -.187 -.351 -.102 -.076 -.455 .183 .430 .198 -.026 .277
I am happy with
the benefits
offered to me
.042 .446 .203 .168 -.295 .236 .200 -.149 -.197 .290 .024 -.289 .155
I am recognized
and praised for a
good job
.355 .412 .171 -.262 .061 -.183 .267 .213 .104 -.114 .234 -.139 -.006
I am proud to be
identified with
Jubilee Insurance
-.534 .159 .194 .064 -.181 .099 -.015 -.015 -.227 .302 -.262 .092 .060
I can recommend
customers and
employees to this
company
.150 -.266 .254 -.305 .190 .089 .193 -.419 -.006 .145 -.248 .155 -.052
I wish to remain
in this company .007 -.041 -.213 .433 .178 .257 .491 -.031 .074 .076 -.156 -.190 -.078
I enjoy working
with my co-
workers
.214 -.448 .323 .084 -.172 .098 .353 .004 .281 .024 -.240 -.090 .044
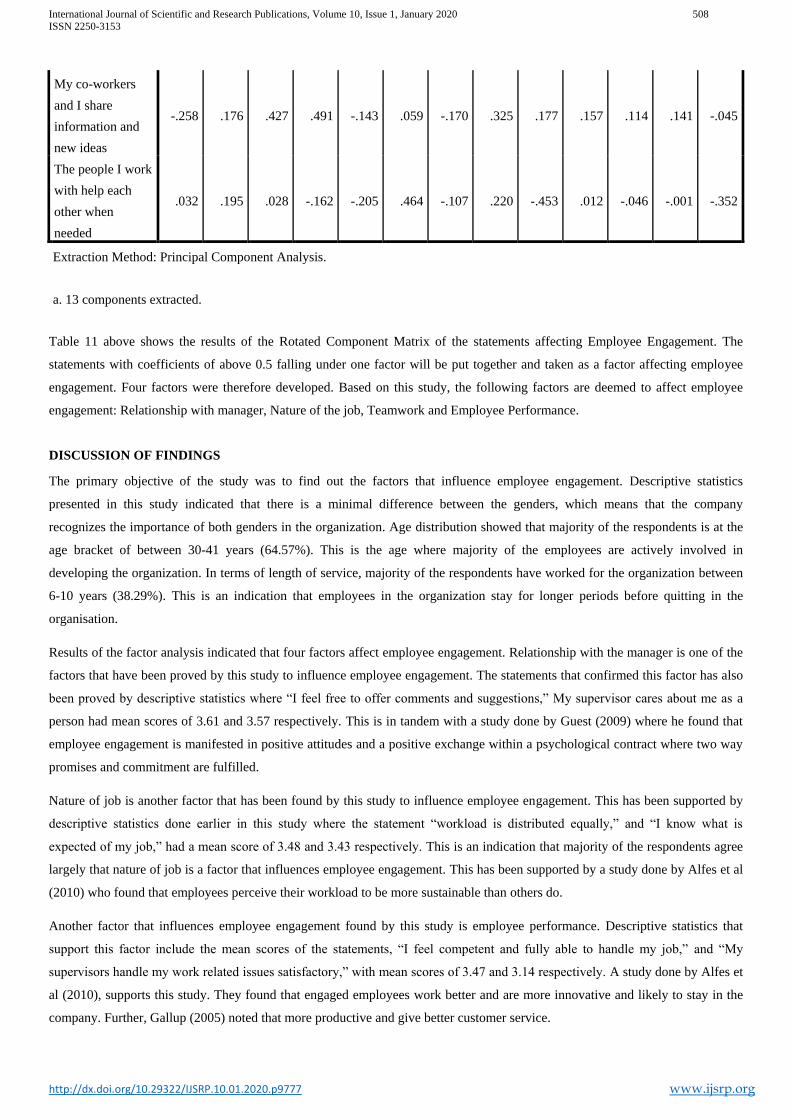
International Journal of Scientific and Research Publications, Volume 10, Issue 1, January 2020 508
ISSN 2250-3153
http://dx.doi.org/10.29322/IJSRP.10.01.2020.p9777 www.ijsrp.org
My co-workers
and I share
information and
new ideas
-.258 .176 .427 .491 -.143 .059 -.170 .325 .177 .157 .114 .141 -.045
The people I work
with help each
other when
needed
.032 .195 .028 -.162 -.205 .464 -.107 .220 -.453 .012 -.046 -.001 -.352
Extraction Method: Principal Component Analysis.
a. 13 components extracted.
Table 11 above shows the results of the Rotated Component Matrix of the statements affecting Employee Engagement. The
statements with coefficients of above 0.5 falling under one factor will be put together and taken as a factor affecting employee
engagement. Four factors were therefore developed. Based on this study, the following factors are deemed to affect employee
engagement: Relationship with manager, Nature of the job, Teamwork and Employee Performance.
DISCUSSION OF FINDINGS
The primary objective of the study was to find out the factors that influence employee engagement. Descriptive statistics
presented in this study indicated that there is a minimal difference between the genders, which means that the company
recognizes the importance of both genders in the organization. Age distribution showed that majority of the respondents is at the
age bracket of between 30-41 years (64.57%). This is the age where majority of the employees are actively involved in
developing the organization. In terms of length of service, majority of the respondents have worked for the organization between
6-10 years (38.29%). This is an indication that employees in the organization stay for longer periods before quitting in the
organisation.
Results of the factor analysis indicated that four factors affect employee engagement. Relationship with the manager is one of the
factors that have been proved by this study to influence employee engagement. The statements that confirmed this factor has also
been proved by descriptive statistics where “I feel free to offer comments and suggestions,” My supervisor cares about me as a
person had mean scores of 3.61 and 3.57 respectively. This is in tandem with a study done by Guest (2009) where he found that
employee engagement is manifested in positive attitudes and a positive exchange within a psychological contract where two way
promises and commitment are fulfilled.
Nature of job is another factor that has been found by this study to influence employee engagement. This has been supported by
descriptive statistics done earlier in this study where the statement “workload is distributed equally,” and “I know what is
expected of my job,” had a mean score of 3.48 and 3.43 respectively. This is an indication that majority of the respondents agree
largely that nature of job is a factor that influences employee engagement. This has been supported by a study done by Alfes et al
(2010) who found that employees perceive their workload to be more sustainable than others do.
Another factor that influences employee engagement found by this study is employee performance. Descriptive statistics that
support this factor include the mean scores of the statements, “I feel competent and fully able to handle my job,” and “My
supervisors handle my work related issues satisfactory,” with mean scores of 3.47 and 3.14 respectively. A study done by Alfes et
al (2010), supports this study. They found that engaged employees work better and are more innovative and likely to stay in the
company. Further, Gallup (2005) noted that more productive and give better customer service.
International Journal of Scientific and Research Publications, Volume 10, Issue 1, January 2020 509
ISSN 2250-3153
http://dx.doi.org/10.29322/IJSRP.10.01.2020.p9777 www.ijsrp.org
Teamwork is also one of the factors that influence employee engagement found by this study. This has also been proved by
descriptive statistics in that the statements “Workload is distributed equally throughout our department,” and “My co-workers and
I share information and ideas,” with mean scores of 3.48 and 3.40 respectively.
SUMMARY, CONCLUSION AND RECOMMENDATIONS
In summary, the study found sufficient data from the respondents with majority of the employees aged between 30-41 years,
majority of the employees have worked for the organization between 6-10 years and are of good academic qualifications. The
study found out that relationship with managers, nature of the job, teamwork and employee performance are the factors that
influence employee engagement in Jubilee insurance company.
In conclusion therefore, employers need to understand these four factors and make full use of them to ensure employees are
engaged hence achieve their objective. The study recommends that employers should encourage teamwork in their organizations;
they should ensure that the managers and lower employees have a good relationship. They should develop a policy that ensures
employees are given the necessary tools in order to improve their performance which will then ensure that employees feel
engaged in the organization. This way organization will benefit from the diverse ideas that will come from their employees for the
development of the organization.
REFERENCES
Alfes, K., Truss, C., Soanne, E. C., Rees, C. and Gatenby, M. (2010). Creating and Engaged Workforce. London:
Chartered Institute of Personnel and Development.
Armstrong, M. (2006). Evidence-Based Reward Management. London, Kogan Page.
Guest, D. (2009). Review of Employee Engagement. Notes for a Discussion (Unpublished). Prepared specifically for the
MacLeod and Clarke (2009). Review of Employee Engagement.
Kahn, W. (1990). Psychological Conditions of Personal Engagement and Disengagement at Work. Academy of
Management Journal, 33 pp692-724.
Robinson, D. (2007). Staff Engagement is Marriage of Various Factors at Work. Employee Benefits, 3, pp45-62.
Schaufeli, W.B., Martinez, I.S., Marques, P., Salanova, M., Baker, B.A. (2002). Burnout and Engagement in University
Students. Journal of Cross-Cultural Psychology, 3, pp 71-92.
Schaufeli, W.B. and Baker, A.B. (2006). “Same, Same” but Different? Can Work Engagement be Discriminated from
Job Involvement and Organization Commitment? European Psychologist. Vol.11 Issue 2 pp 119-127.
The Gallup Organization (2010). What your Dissatisfied Workers Cost. Gallup Management Journal. Retrieved from
Google Scholar http://gmj.gallup.com/content/default.aspx?ci=439.
Medina Halako Twalib is a lecturer
at the University of Nairobi,
School of Business
lecturing Human Resource Management Courses
International Journal of Scientific and Research Publications, Volume 10, Issue 1, January 2020 510
ISSN 2250-3153
http://dx.doi.org/10.29322/IJSRP.10.01.2020.p9778 www.ijsrp.org
Media Framing of Human Papillomavirus (HPV)
Health Issues and HPV Vaccine-Related
Sentiment in English Language News Media in
India (2015-2018)
Prabhjot Sohal*
* School of Communication Studies, Panjab University, India
DOI: 10.29322/IJSRP.10.01.2020.p9778
http://dx.doi.org/10.29322/IJSRP.10.01.2020.p9778
Abstract- India records a high incidence of Human
Papillomavirus (HPV)-related infections and cancers, with
cervical cancer being the second biggest cause of mortality
among women with cancer in the country. Immunization against
the high-risk HPV serotypes can efficiently prevent related
diseases. The HPV vaccine was recommended to be added in the
Universal Immunization Program (UIP) of India by the National
Technical Advisory Group on Immunization (NTAGI) in 2017.
However, following a controversial vaccine trial in 2009 and a
pending decision on a related legal case, the Government of India
has refrained from including the vaccine in the UIP. This study is
an analysis of the media coverage of HPV-related issues and
HPV vaccine-related sentiment in English language news media
in India from 2015 to 2018. The sampled news media for the
study include four national daily newspapers, The Hindu, The
Times of India, The Indian Express and Hindustan Times; and
two Indian news websites, The Wire and Scroll.in. Results based
on the sentiment analysis of the media coverage reveal a
predominantly positive sentiment towards the HPV vaccine with
a marginal presence of thematically framed negative and
contested opinion against the vaccine. The analysis of media
framing of the issue reveals a prevalence of authoritative frames
devoid of exemplification, and an extensive use of behavioral
determinants of health to establish responsibility in HPV-related
health status.
Index Terms- health behavior, health journalism, Human
Papillomavirus, HPV vaccine, vaccine uptake, Indian media,
media framing
I. INTRODUCTION
HPV incidence and HPV vaccine policy in India
Human Papillomavirus (HPV) is a common virus that is present
abundantly in the environment and is among the most common
sexually transmitted infections (STI). Scientific research has
established that certain types of high-risk HPV strains,
specifically the HPV serotypes 16 and 18, are responsible for
cancers of cervix uteri, penis, vulva, vagina, anus and
oropharynx in women as well as men. The incidence of HPV
related cancers, especially cervical cancer among women, is very
high in India. Approximately, 453.02 million women aged 15
and older are at the risk of developing cervical cancer in India.
Every year, 96922 women are diagnosed with cervical cancer,
while 60078 succumb to the disease (ICO/IARC HPV
Information Centre, 2018). Cervical cancer is the second most
common cause of cancer-related deaths among women in India.
As a result of long-term tobacco use and concurrent HPV
infections among the population, the rate of head and neck
cancers associated with HPV infections is also expected to rise in
India (Gupta, Johnson, & Kumar, 2016).
The probability of acquiring HPV infections and the severity of
HPV-related diseases are determined by several medical and
non-medical factors. The non-medical factors include
environmental factors, such as, polluted environment, poor
sanitation, and lack of clean water for cleaning and consumption;
behavioral factors, such as, having unprotected sex, having
multiple sex partners, tobacco use and poor maintenance of
health and hygiene. Socio-economic and political factors like
income, social status, gender, social rituals and norms, access to
healthcare and other amenities, political institutions, nature and
ideology of government and bureaucracy, corruption, and public
policy, among others are also significant determinants of HPV-
related health status. Several structural factors within the field of
medicine, such as, research, knowledge and training, health
infrastructure, administration, services, etc, and
biological/physiological factors, such as, gender, age, genetics,
prevailing diseases, among others, also determine an individual’s
HPV-related health status. An overall poor health, arising from a
combination of certain specific factors or several medical and
non-medical determinants of health puts an individual at a high
risk of contracting HPV infections and HPV-related diseases.
Timely immunization with the HPV prophylactic vaccine, along
with regular HPV screening, can help prevent HPV infections
and HPV-related cancers (Schiffman, Wentzensen, Wachold,
Kinney, Gage, & Castle, 2011; Ronco, et al., 2014; Petrosky, et
al., 2015; Zhai & Tumban, 2016). The safety and the efficacy of
the HPV vaccine have been confirmed by the results of large
International Journal of Scientific and Research Publications, Volume 10, Issue 1, January 2020 511
ISSN 2250-3153
http://dx.doi.org/10.29322/IJSRP.10.01.2020.p9778 www.ijsrp.org
trials across the different countries and health contexts.
Currently, there are three types of approved prophylactic HPV
vaccines available for use: the bivalent (against HPVs 16/18), the
quadrivalent (against HPVs 6/11/16/18) and the 9-valent
vaccines (against HPV 6/11/16/18/31/33/45/52/58).
In 2017, the National Technical Advisory Group on
Immunization (NTAGI) recommended introducing the HPV
vaccine in the Universal Immunization Programme (UIP) of
India (NTAGI, 2017). In 2009, a feasibility study of the HPV
vaccine conducted by an American non-profit organization,
Program for Appropriate Technology in Health (PATH), in
partnership with the provincial governments of the Indian states
of Andhra Pradesh and Gujarat, hit a roadblock following the
deaths of eight pre-adolescent girls, who were among the 24,000
girls who had been administered the vaccine during the study.
The Parliamentary Standing Committee of the Ministry of Health
and Family Welfare (MHFW), India, highlighted ethical
violations committed during the trial conducted jointly by PATH
and Indian Council of Medical Research (ICMR), which was one
of PATH’s technical partners for the study in India. The study
was abruptly stopped, even though it was found that the deaths of
the adolescent girls were not related to immunization with the
HPV vaccine (Larson, Brocard, & Garnett, 2010). In 2012, a writ
petition filed in the Supreme Court of India called for revoking
licenses of the two HPV vaccine manufacturers, Merck Sharp &
Dohme (MSD) and GlaxoSmithkline (GSK), citing that the then
Drug Controller General of India (DCGI) had allegedly approved
the vaccine by the manufacturers without conducting proper
clinical trials and without any evidence of the vaccine’s efficacy
and safety. What with the decision still pending with the apex
court of India, the Government of India has suspended its
decision on introducing the vaccine by the two manufacturers in
the UIP. However, the Indian states of Delhi and Punjab have
introduced the vaccine for adolescent girls in their immunization
program as an optional vaccine (Narayanan, 2018). An Indian
pharmaceutical company is currently in its final stage of clinical
testing of a quadrivalent HPV vaccine. It remains to be seen
whether the HPV vaccine made by the Indian manufacturer, after
completing trials and its market launch, will be adopted in the
UIP or not.
HPV and media coverage
Health behavior associated with the causes of HPV infections,
and vaccine uptake in a population are influenced by the public
perception of the risks of HPV infections and beliefs related to
the efficacy of HPV vaccine. The news media plays a crucial role
in forming a public perception of risks and health beliefs by
disseminating information about health issues and policies.
Finding its theoretical base in the concept of media influence and
the ecological model of health behavior (Sallis & Owen, 2015),
this study involves an analysis of news coverage related to HPV
and HPV vaccine in English language news media in India from
2015 to 2018. Since public perception of an issue is based on its
interpretation by the public using personal and social frames,
including those presented by the media (Goffman, 1974), the
prime focus of this study is to analyze the frames assigned to the
HPV and HPV vaccine issue by the media. The World Health
Organization (WHO) Commission on Social Determinants of
Health recommends including information about social
determinants of health in public policy and awareness messages
(Commission on Social Determinants of Health, 2008).The study
also screens the news items to identify and analyze the presence
of medical and non-medical determinants of HPV-related health
status.
In India, awareness about HPV- related diseases and HPV
vaccination is low (Hussain, et al., 2014; Rashid, Labani, & Das,
2016; Chawla, Chawla, & Chaudhary, 2016). Recent studies
have also shown resistance to the HPV vaccine, citing fears
about post-vaccination complications and the prohibitively high
cost of vaccine (Singh, et al., 2018). However, there’s evidence
that attitude towards the HPV vaccine, and associated risk-
benefit beliefs among parents of adolescents can be modified
through strategic messages which focus on highlighting the risks
of HPV infections and the efficacy of the vaccine against HPV-
related diseases (Degarege, et al., 2019).
While research on HPV and HPV vaccine-related messages in
Indian media is lacking, significant presence of negative
information regarding vaccines and immunization has been
found on Indian online and web-based media. The negative
information found is primarily coverage of adverse events
reporting – from minor allergic reactions to rare deaths – without
any proof of causality, or is about shortage of vaccine and social
resistance to immunization (Das & Singh, 2018). Research shows
that negative news coverage can generate a negative information
loop, beginning with a negative media report about a vaccine and
leading to a spike in adverse events reporting post-vaccination.
Consequently, there is a drop in vaccine uptake, inviting more
negative media coverage. A Denmark-based study (Suppli,
Hansen, Rasmussen, Valentiner-Branth, Krause, & Mølbak,
2018) found a significant negative correlation between negative
media coverage of vaccines and vaccine uptake, coinciding with
a spike in Google search activity related to the side effects of the
HPV vaccine, Gardasil, manufactured by MSD.
II. METHODS AND INSTRUMENTS
A sample of HPV and HPV vaccine -related news coverage was
drawn from four leading national daily English language
newspapers: The Hindu, The Times of India, Hindustan Times
and The Indian Express; and two independent news website: The
Wire and Scroll.in, for the period 2015-2018. The English
language press in India was purposively selected to study the
HPV-related media messages disseminated among the urban
upper/middle class and educated population, which constitutes
the main readership group of the English language media in India
(Parameswaran, 1997). The sample of new items was selected
through keyword search in the headline and/or the body text of
news items using four terms: HPV, Human Papillomavirus, HPV
vaccine and cervical cancer. A keyword search on the online and
print versions of the selected news media filtered a sample of 138
news items for the study. All news items were studied and
manually coded using content analysis as the prime method for
textual analysis. Qualitative and quantitative findings of the

International Journal of Scientific and Research Publications, Volume 10, Issue 1, January 2020 512
ISSN 2250-3153
http://dx.doi.org/10.29322/IJSRP.10.01.2020.p9778 www.ijsrp.org
textual enquiry measures listed below were used to find the
frames employed by the media in its coverage of HPV and
related issues.
(1) Health Issue: Each news item was categorized on the
basis of its prime focus on the HPV- related health issue
under the following categories: HPV; HPV
vaccine/immunization; HPV-related cancers, HPV/ HPV-
related cancers screening, and HPV/ HPV-related
cancer treatment.
(2) News type: Each news item was categorized as either
news; feature/article; editorial/opinion; or others.
(3) News source: The attributed source of each news item
was recorded and coded.
(4) Attribution: Attribution of quotes and other information
within each news item was recorded and coded. The two
broad categories of attribution were: authoritative
sources, such as, governments, health organizations and
institutes, research and publication, health professionals,
health care and other industry, and public figure; and
non-authoritative source, such as, patients or the public.
(5) Place: Each news item was categorized on the basis of
its framing of HPV-related issues using geographical
location as global; national; international; regional or
local.
(6) Sentiment towards HPV vaccine: sentiment towards the
HPV vaccine in each item was recorded and categorized
as follows:
1. Positive towards HPV vaccine: News items
containing information or references that support
immunization against HPV; cite efficacy and safety
of the vaccine.
2. Negative towards HPV vaccine: News items that
carry only negative HPV vaccine information,
including inefficacy, dangers, side-effects and high
cost.
3. Neutral or having no opinion: News items that do
not present a stance on the HPV vaccine, or only
mention the vaccine without recommending or
opposing it.
4. Contested position on the HPV vaccine: News
items that pit the positive and negative information
related to the vaccine against each other,
establishing a conflict, however, without a
resolution that favors any one side.
(7) Health approach: Each news item was categorized on
the basis of its prime public health approach, which
coded as prevention; awareness; screening/testing, or
control.
(8) Determinants of health: Using a directed content
analysis approach (Hsieh & Shannon, 2005), each new
items was categorized on the basis of medical and non-
medical determinants of health (DOH). The DOH
categories were constructed on the basis of the
determinants of health listed by the Commission on
Social Determinants of Health (CSDH) by World Health
Organization (WHO). The categories include structural
factors like the social and economic environment, the
physical environment, and individual characteristics and
behaviors, among the non-medical determinants of
behavior (WHO, 2019).
Each news items is categorized within a particular DOH
if it includes references to that DOH and carried
statements claiming the influence of the said DOH on the
HPV-related health status of an individual or group. The
sampled news items that were found to be containing
more than one DOH were assigned to every category that
was applicable in the analysis. The DOH categories
were:
1. Health behavior: defined as statements
claiming the impact of personal hygiene,
nutrition, sexual behavior and individual
attitude on HPV health status.
2. Economic: defined as statements claiming
impact of livelihood, low-income, cost of
vaccine and health services, the cost of
medical interventions, economic independence
and affordability of health and livelihood
amenities on HPV health status.
3. Social: defined as statements containing
reference to social factors, like gender, marital
status, social norms, social hierarchy, race,
ethnicity, social support, education, culture,
customs and beliefs, as influencers of HPV
health status.
4. Environmental: defined as statements claiming
influence of the physical environment, such
as, the natural environment, climate,
resources; living and work environment; and
infrastructure on HPV health status.
5. Political: defined as containing references to
government policies, political environment,
bureaucracy and ideology as an influence on
the HPV health status.
6. Biological/Physiological: defined as containing
references to age, sex, prevailing health status,
illness history or other bodily factors as a
factor in deciding HPV health status.
7. Medical: defined as containing references to
professional expertise, medical practice,
infrastructure, research, knowledge and other
aspects of medical field as a factor influencing
HPV health status.
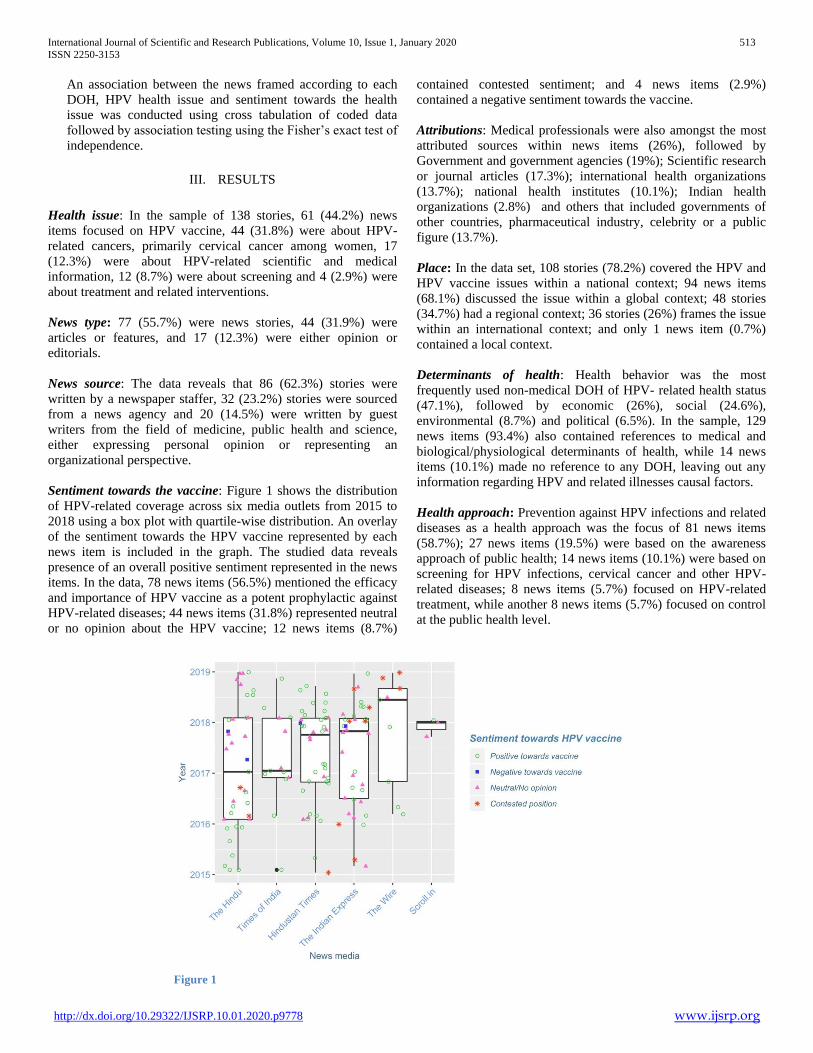
International Journal of Scientific and Research Publications, Volume 10, Issue 1, January 2020 513
ISSN 2250-3153
http://dx.doi.org/10.29322/IJSRP.10.01.2020.p9778 www.ijsrp.org
An association between the news framed according to each
DOH, HPV health issue and sentiment towards the health
issue was conducted using cross tabulation of coded data
followed by association testing using the Fisher’s exact test of
independence.
III. RESULTS
Health issue: In the sample of 138 stories, 61 (44.2%) news
items focused on HPV vaccine, 44 (31.8%) were about HPV-
related cancers, primarily cervical cancer among women, 17
(12.3%) were about HPV-related scientific and medical
information, 12 (8.7%) were about screening and 4 (2.9%) were
about treatment and related interventions.
News type: 77 (55.7%) were news stories, 44 (31.9%) were
articles or features, and 17 (12.3%) were either opinion or
editorials.
News source: The data reveals that 86 (62.3%) stories were
written by a newspaper staffer, 32 (23.2%) stories were sourced
from a news agency and 20 (14.5%) were written by guest
writers from the field of medicine, public health and science,
either expressing personal opinion or representing an
organizational perspective.
Sentiment towards the vaccine: Figure 1 shows the distribution
of HPV-related coverage across six media outlets from 2015 to
2018 using a box plot with quartile-wise distribution. An overlay
of the sentiment towards the HPV vaccine represented by each
news item is included in the graph. The studied data reveals
presence of an overall positive sentiment represented in the news
items. In the data, 78 news items (56.5%) mentioned the efficacy
and importance of HPV vaccine as a potent prophylactic against
HPV-related diseases; 44 news items (31.8%) represented neutral
or no opinion about the HPV vaccine; 12 news items (8.7%)
contained contested sentiment; and 4 news items (2.9%)
contained a negative sentiment towards the vaccine.
Attributions: Medical professionals were also amongst the most
attributed sources within news items (26%), followed by
Government and government agencies (19%); Scientific research
or journal articles (17.3%); international health organizations
(13.7%); national health institutes (10.1%); Indian health
organizations (2.8%) and others that included governments of
other countries, pharmaceutical industry, celebrity or a public
figure (13.7%).
Place: In the data set, 108 stories (78.2%) covered the HPV and
HPV vaccine issues within a national context; 94 news items
(68.1%) discussed the issue within a global context; 48 stories
(34.7%) had a regional context; 36 stories (26%) frames the issue
within an international context; and only 1 news item (0.7%)
contained a local context.
Determinants of health: Health behavior was the most
frequently used non-medical DOH of HPV- related health status
(47.1%), followed by economic (26%), social (24.6%),
environmental (8.7%) and political (6.5%). In the sample, 129
news items (93.4%) also contained references to medical and
biological/physiological determinants of health, while 14 news
items (10.1%) made no reference to any DOH, leaving out any
information regarding HPV and related illnesses causal factors.
Health approach: Prevention against HPV infections and related
diseases as a health approach was the focus of 81 news items
(58.7%); 27 news items (19.5%) were based on the awareness
approach of public health; 14 news items (10.1%) were based on
screening for HPV infections, cervical cancer and other HPV-
related diseases; 8 news items (5.7%) focused on HPV-related
treatment, while another 8 news items (5.7%) focused on control
at the public health level.
Figure 1
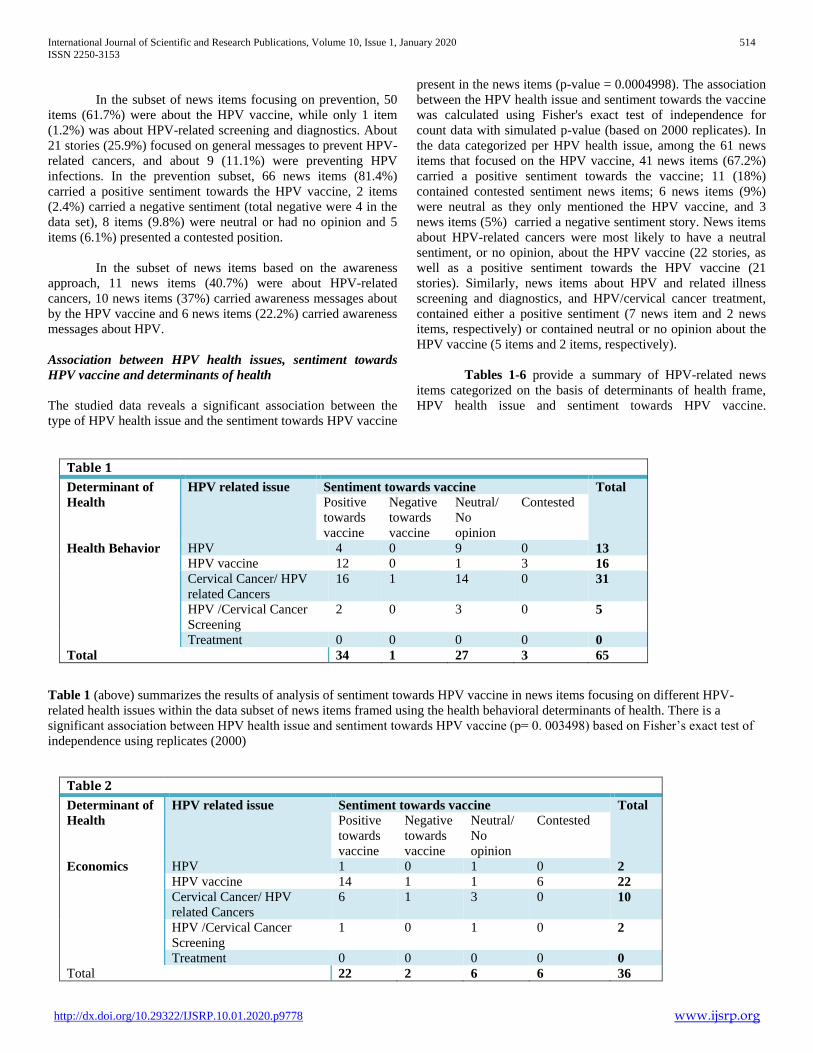
International Journal of Scientific and Research Publications, Volume 10, Issue 1, January 2020 514
ISSN 2250-3153
http://dx.doi.org/10.29322/IJSRP.10.01.2020.p9778 www.ijsrp.org
In the subset of news items focusing on prevention, 50
items (61.7%) were about the HPV vaccine, while only 1 item
(1.2%) was about HPV-related screening and diagnostics. About
21 stories (25.9%) focused on general messages to prevent HPV-
related cancers, and about 9 (11.1%) were preventing HPV
infections. In the prevention subset, 66 news items (81.4%)
carried a positive sentiment towards the HPV vaccine, 2 items
(2.4%) carried a negative sentiment (total negative were 4 in the
data set), 8 items (9.8%) were neutral or had no opinion and 5
items (6.1%) presented a contested position.
In the subset of news items based on the awareness
approach, 11 news items (40.7%) were about HPV-related
cancers, 10 news items (37%) carried awareness messages about
by the HPV vaccine and 6 news items (22.2%) carried awareness
messages about HPV.
Association between HPV health issues, sentiment towards
HPV vaccine and determinants of health
The studied data reveals a significant association between the
type of HPV health issue and the sentiment towards HPV vaccine
present in the news items (p-value = 0.0004998). The association
between the HPV health issue and sentiment towards the vaccine
was calculated using Fisher's exact test of independence for
count data with simulated p-value (based on 2000 replicates). In
the data categorized per HPV health issue, among the 61 news
items that focused on the HPV vaccine, 41 news items (67.2%)
carried a positive sentiment towards the vaccine; 11 (18%)
contained contested sentiment news items; 6 news items (9%)
were neutral as they only mentioned the HPV vaccine, and 3
news items (5%) carried a negative sentiment story. News items
about HPV-related cancers were most likely to have a neutral
sentiment, or no opinion, about the HPV vaccine (22 stories, as
well as a positive sentiment towards the HPV vaccine (21
stories). Similarly, news items about HPV and related illness
screening and diagnostics, and HPV/cervical cancer treatment,
contained either a positive sentiment (7 news item and 2 news
items, respectively) or contained neutral or no opinion about the
HPV vaccine (5 items and 2 items, respectively).
Tables 1-6 provide a summary of HPV-related news
items categorized on the basis of determinants of health frame,
HPV health issue and sentiment towards HPV vaccine.
Table 1
Determinant of
Health
HPV related issue Sentiment towards vaccine Total
Positive
towards
vaccine
Negative
towards
vaccine
Neutral/
No
opinion
Contested
Health Behavior HPV 4 0 9 0 13
HPV vaccine 12 0 1 3 16
Cervical Cancer/ HPV
related Cancers
16 1 14 0 31
HPV /Cervical Cancer
Screening
2 0 3 0 5
Treatment 0 0 0 0 0
Total 34 1 27 3 65
Table 1 (above) summarizes the results of analysis of sentiment towards HPV vaccine in news items focusing on different HPV-
related health issues within the data subset of news items framed using the health behavioral determinants of health. There is a
significant association between HPV health issue and sentiment towards HPV vaccine (p= 0. 003498) based on Fisher’s exact test of
independence using replicates (2000)
Table 2
Determinant of
Health
HPV related issue Sentiment towards vaccine Total
Positive
towards
vaccine
Negative
towards
vaccine
Neutral/
No
opinion
Contested
Economics HPV 1 0 1 0 2
HPV vaccine 14 1 1 6 22
Cervical Cancer/ HPV
related Cancers
6 1 3 0 10
HPV /Cervical Cancer
Screening
1 0 1 0 2
Treatment 0 0 0 0 0
Total 22 2 6 6 36
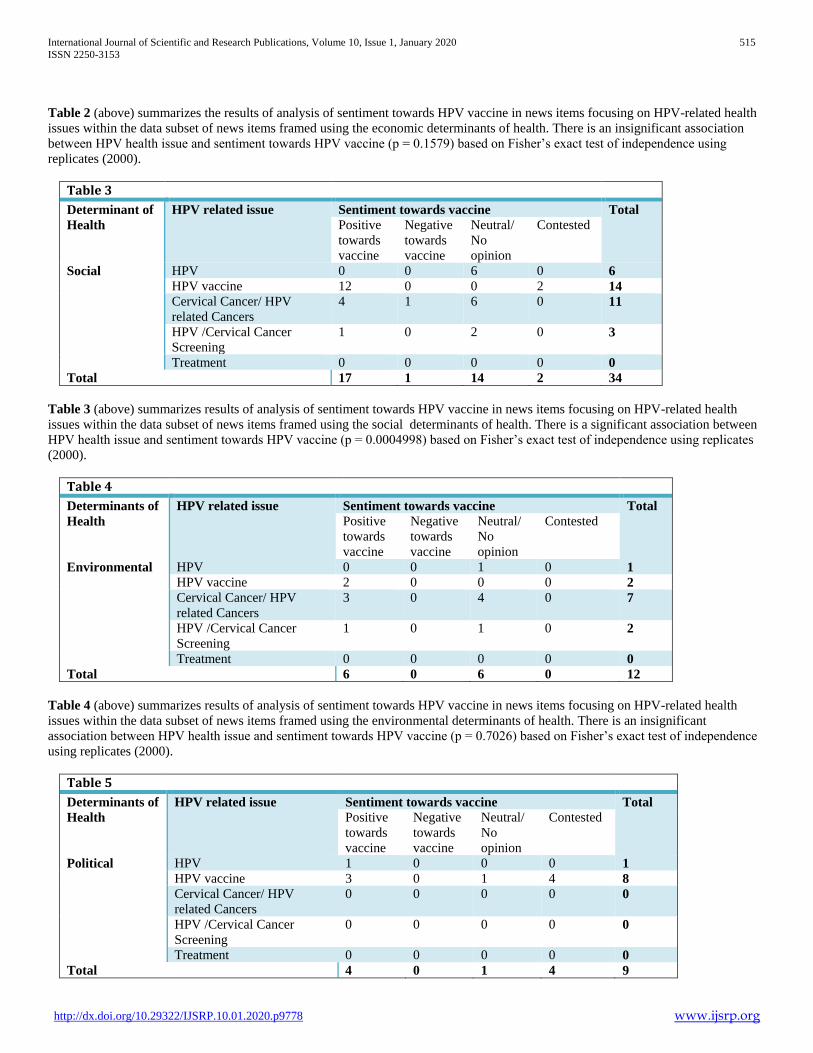
International Journal of Scientific and Research Publications, Volume 10, Issue 1, January 2020 515
ISSN 2250-3153
http://dx.doi.org/10.29322/IJSRP.10.01.2020.p9778 www.ijsrp.org
Table 2 (above) summarizes the results of analysis of sentiment towards HPV vaccine in news items focusing on HPV-related health
issues within the data subset of news items framed using the economic determinants of health. There is an insignificant association
between HPV health issue and sentiment towards HPV vaccine (p = 0.1579) based on Fisher’s exact test of independence using
replicates (2000).
Table 3
Determinant of
Health
HPV related issue Sentiment towards vaccine Total
Positive
towards
vaccine
Negative
towards
vaccine
Neutral/
No
opinion
Contested
Social HPV 0 0 6 0 6
HPV vaccine 12 0 0 2 14
Cervical Cancer/ HPV
related Cancers
4 1 6 0 11
HPV /Cervical Cancer
Screening
1 0 2 0 3
Treatment 0 0 0 0 0
Total 17 1 14 2 34
Table 3 (above) summarizes results of analysis of sentiment towards HPV vaccine in news items focusing on HPV-related health
issues within the data subset of news items framed using the social determinants of health. There is a significant association between
HPV health issue and sentiment towards HPV vaccine (p = 0.0004998) based on Fisher’s exact test of independence using replicates
(2000).
Table 4
Determinants of
Health
HPV related issue Sentiment towards vaccine Total
Positive
towards
vaccine
Negative
towards
vaccine
Neutral/
No
opinion
Contested
Environmental HPV 0 0 1 0 1
HPV vaccine 2 0 0 0 2
Cervical Cancer/ HPV
related Cancers
3 0 4 0 7
HPV /Cervical Cancer
Screening
1 0 1 0 2
Treatment 0 0 0 0 0
Total 6 0 6 0 12
Table 4 (above) summarizes results of analysis of sentiment towards HPV vaccine in news items focusing on HPV-related health
issues within the data subset of news items framed using the environmental determinants of health. There is an insignificant
association between HPV health issue and sentiment towards HPV vaccine (p = 0.7026) based on Fisher’s exact test of independence
using replicates (2000).
Table 5
Determinants of
Health
HPV related issue Sentiment towards vaccine Total
Positive
towards
vaccine
Negative
towards
vaccine
Neutral/
No
opinion
Contested
Political HPV 1 0 0 0 1
HPV vaccine 3 0 1 4 8
Cervical Cancer/ HPV
related Cancers
0 0 0 0 0
HPV /Cervical Cancer
Screening
0 0 0 0 0
Treatment 0 0 0 0 0
Total 4 0 1 4 9
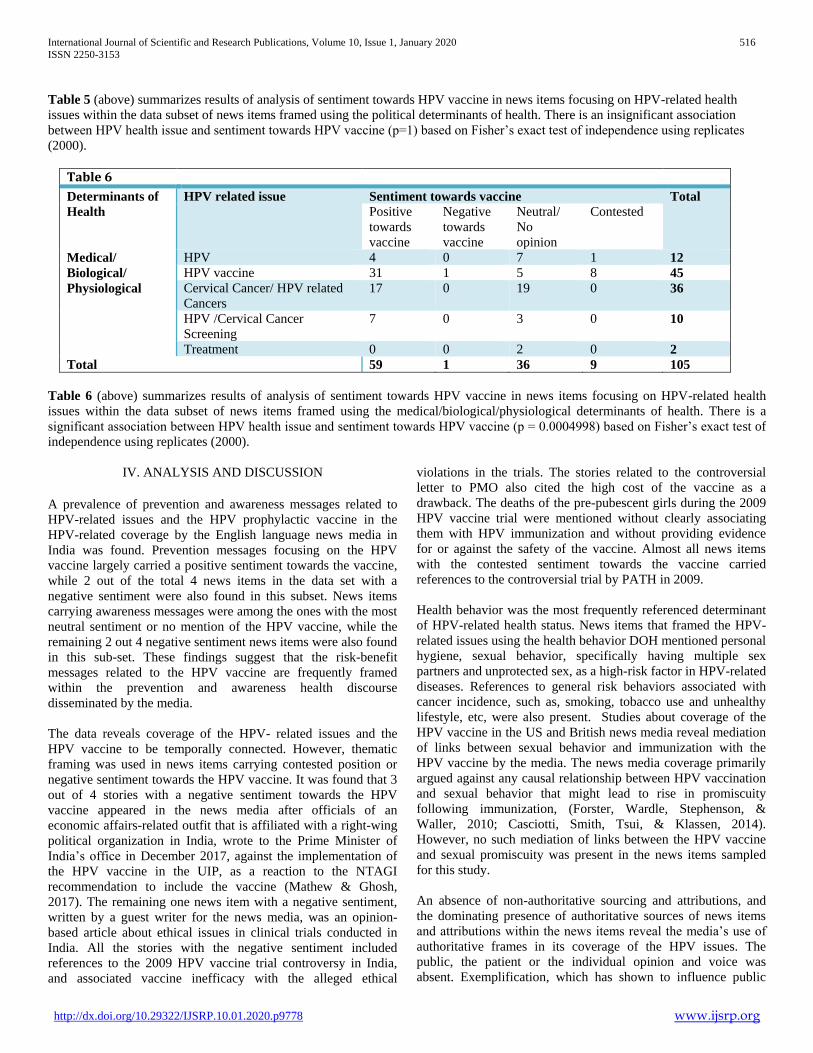
International Journal of Scientific and Research Publications, Volume 10, Issue 1, January 2020 516
ISSN 2250-3153
http://dx.doi.org/10.29322/IJSRP.10.01.2020.p9778 www.ijsrp.org
Table 5 (above) summarizes results of analysis of sentiment towards HPV vaccine in news items focusing on HPV-related health
issues within the data subset of news items framed using the political determinants of health. There is an insignificant association
between HPV health issue and sentiment towards HPV vaccine (p=1) based on Fisher’s exact test of independence using replicates
(2000).
Table 6
Determinants of
Health
HPV related issue Sentiment towards vaccine Total
Positive
towards
vaccine
Negative
towards
vaccine
Neutral/
No
opinion
Contested
Medical/
Biological/
Physiological
HPV 4 0 7 1 12
HPV vaccine 31 1 5 8 45
Cervical Cancer/ HPV related
Cancers
17 0 19 0 36
HPV /Cervical Cancer
Screening
7 0 3 0 10
Treatment 0 0 2 0 2
Total 59 1 36 9 105
Table 6 (above) summarizes results of analysis of sentiment towards HPV vaccine in news items focusing on HPV-related health
issues within the data subset of news items framed using the medical/biological/physiological determinants of health. There is a
significant association between HPV health issue and sentiment towards HPV vaccine (p = 0.0004998) based on Fisher’s exact test of
independence using replicates (2000).
IV. ANALYSIS AND DISCUSSION
A prevalence of prevention and awareness messages related to
HPV-related issues and the HPV prophylactic vaccine in the
HPV-related coverage by the English language news media in
India was found. Prevention messages focusing on the HPV
vaccine largely carried a positive sentiment towards the vaccine,
while 2 out of the total 4 news items in the data set with a
negative sentiment were also found in this subset. News items
carrying awareness messages were among the ones with the most
neutral sentiment or no mention of the HPV vaccine, while the
remaining 2 out 4 negative sentiment news items were also found
in this sub-set. These findings suggest that the risk-benefit
messages related to the HPV vaccine are frequently framed
within the prevention and awareness health discourse
disseminated by the media.
The data reveals coverage of the HPV- related issues and the
HPV vaccine to be temporally connected. However, thematic
framing was used in news items carrying contested position or
negative sentiment towards the HPV vaccine. It was found that 3
out of 4 stories with a negative sentiment towards the HPV
vaccine appeared in the news media after officials of an
economic affairs-related outfit that is affiliated with a right-wing
political organization in India, wrote to the Prime Minister of
India’s office in December 2017, against the implementation of
the HPV vaccine in the UIP, as a reaction to the NTAGI
recommendation to include the vaccine (Mathew & Ghosh,
2017). The remaining one news item with a negative sentiment,
written by a guest writer for the news media, was an opinion-
based article about ethical issues in clinical trials conducted in
India. All the stories with the negative sentiment included
references to the 2009 HPV vaccine trial controversy in India,
and associated vaccine inefficacy with the alleged ethical
violations in the trials. The stories related to the controversial
letter to PMO also cited the high cost of the vaccine as a
drawback. The deaths of the pre-pubescent girls during the 2009
HPV vaccine trial were mentioned without clearly associating
them with HPV immunization and without providing evidence
for or against the safety of the vaccine. Almost all news items
with the contested sentiment towards the vaccine carried
references to the controversial trial by PATH in 2009.
Health behavior was the most frequently referenced determinant
of HPV-related health status. News items that framed the HPV-
related issues using the health behavior DOH mentioned personal
hygiene, sexual behavior, specifically having multiple sex
partners and unprotected sex, as a high-risk factor in HPV-related
diseases. References to general risk behaviors associated with
cancer incidence, such as, smoking, tobacco use and unhealthy
lifestyle, etc, were also present. Studies about coverage of the
HPV vaccine in the US and British news media reveal mediation
of links between sexual behavior and immunization with the
HPV vaccine by the media. The news media coverage primarily
argued against any causal relationship between HPV vaccination
and sexual behavior that might lead to rise in promiscuity
following immunization, (Forster, Wardle, Stephenson, &
Waller, 2010; Casciotti, Smith, Tsui, & Klassen, 2014).
However, no such mediation of links between the HPV vaccine
and sexual promiscuity was present in the news items sampled
for this study.
An absence of non-authoritative sourcing and attributions, and
the dominating presence of authoritative sources of news items
and attributions within the news items reveal the media’s use of
authoritative frames in its coverage of the HPV issues. The
public, the patient or the individual opinion and voice was
absent. Exemplification, which has shown to influence public
International Journal of Scientific and Research Publications, Volume 10, Issue 1, January 2020 517
ISSN 2250-3153
http://dx.doi.org/10.29322/IJSRP.10.01.2020.p9778 www.ijsrp.org
opinion about issues related to health and society (Zillmann,
Gibson, Sundar, & Perkins, 1996), was absent in the authoritative
framing of the HPV issue.
The HPV vaccine-related news items were mostly framed within
the economic DOH, followed by the health behavior DOH. This
suggests that the media’s perception of economic factors, such as
the cost of the vaccine, affordability of health services and
interventions in a low-income country like India, and its
perception of behavioral factors, such as, sexual activity, hygiene
and lifestyle, etc, influences its coverage of the HPV vaccine
issue. News items related to cervical cancer and other HPV-
related cancers were mostly framed within the health behavior
DOH, and almost never within the environmental DOH frame.
The implication of this framing can be studied in future research
related to HPV-related media coverage. It was also found that the
HPV-related issues were routinely covered in a national or global
context, while regional and local perspectives were sparse.
V. CONCLUSION
The study revealed a predominantly positive sentiment towards
the HPV vaccine in the media coverage of the issue. The news
items with the negative or the contested sentiment towards the
vaccine were thematically framed by the media. References to
previous adverse events’ reportage, the vaccine trial controversy,
the cost of vaccine and negative perception related to the
vaccine, appeared as the most significant discursive elements in
the thematic framing of the HPV vaccine issue. All news items
maintained authoritative sourcing and attribution pattern. The
association between the presence of positive attitude towards the
HPV vaccine and authoritative framing using authoritative
sources and attribution can be further investigated.
Becker (1986) stated that the media usually levied responsibility
on the individual for his health and wellbeing, while placating
the role of society, state, etc, in preventing and curing a disease.
The prevalence of an authoritative framing of the HPV-related
issues using behavioral determinants of health by media, as seen
in the studied sample, necessitates a critical examination of
attribution of responsibility and its affect on public policy, public
perception and health behavior. Since the results of this study are
based on a selected sample of the English language news media
in India, it is recommended that the results be used as probes for
studying HPV-related coverage in the vernacular press, online
media and social media as well.
REFERENCES
[1] G. O. Young, “Synthetic structure of industrial plastics (Book style with Becker, M. H. (1986). The tyranny of health promotion. Public Health Reviews , 14, 15-25.
[2] Casciotti, D. M., Smith, K. C., Tsui, A., & Klassen, A. C. (2014). Discussions of adolescent sexuality in news media coverage of the HPV vaccine. Journal of Adolescence , 37 (2), 133-143.
[3] Chawla, P. C., Chawla, A., & Chaudhary, S. (2016). Knowledge, attitude & practice on human papillomavirus vaccination: A cross-sectional study among healthcare providers. The Indian Journal of Medical Research , 144 (5), 741–749.
[4] Commission on Social Determinants of Health. (2008). Closing the Gap in a Generation: Health Equity Through Action on the Social Determinants of Health. Final Report of the Commission on Social Determinants. Geneva, Switzerland: World Health Organization.
[5] Das, M. K., & Singh, D. (2018). Vaccine news in India: trend and content analysis of online mass media. International Journal Of Community Medicine And Public Health , 5 (9), 3951-3956.
[6] Degarege, A., Krupp, K., Fennie, K., Srinivas, V., Li, T., Stephens, D. P., et al. (2019). An integrative behavior theory derived model to assess factors affecting HPV vaccine acceptance using structural equation modeling. Vaccine , 37 (7), 945-955.
[7] Forster, A., Wardle, J., Stephenson, J., & Waller, J. (2010). Passport to Promiscuity or Lifesaver: Press Coverage of HPV Vaccination and Risky Sexual Behavior. Journal of Health Communication : International Perspectives , 15 (2), 205-217.
[8] Goffman, E. (1974). Frame analysis: An essay on the organization of experience. Harvard University Press.
[9] Gupta, B., Johnson, N. W., & Kumar, N. (2016). Global epidemiology of head and neck cancers: a continuing challenge. Oncology , 91 (1), 13-23.
[10] Hsieh, H. F., & Shannon, S. E. (2005). Three Approaches to Qualitative Content Analysis. Qualitative Health Research , 15 (9), 1277-1288.
[11] Hussain, S., Nasare, V., Kumari, M., Sharma, S., Khan, M. A., Das, B. C., et al. (2014). Perception of Human Papillomavirus Infection, Cervical Cancer and HPV Vaccination in North Indian Population. PLoS One , 9 (11), e112861.
[12] ICO/IARC HPV Information Centre. (2018). India: Human Papillomavirus and Related Cancers, Fact Sheet 2018. Barcelona, Spain: HPV Information Centre.
[13] Larson, H. J., Brocard, P., & Garnett, G. (2010). The India HPV-vaccine suspension. The Lancet , 376 (9741), 572-573.
[14] Mathew, L., & Ghosh, A. (2017, December 6). Universal Immunisation Programme: RSS wing writes to PM Modi against introducing HPV vaccine. Retrieved August 23, 2019, from IndianExpress.com: https://indianexpress.com/article/india/universal-immunisation-programme-rss-wing-writes-to-pm-modi-against-introducing-hpv-vaccine-4970012/
[15] Narayanan, N. (2018, January 17). Efficacy, safety, cost: India’s decade-old debate on the cervical cancer vaccine erupts again. Retrieved August 9, 2019, from Scroll.in: https://scroll.in/pulse/865284/efficacy-safety-cost-indias-decade-old-debate-on-the-cervical-cancer-vaccine-erupts-again
[16] NTAGI. (2017, December 19). Minutes of the Meeting of the National Technical Advisory Group on Immunization (NTAGI). Retrieved July 24, 2019, from https://mohfw.gov.in: https://mohfw.gov.in/sites/default/files/Approved%20Minutes%20of%20NTAGI%20meeting%20held%20on%20December%2019%202017.pdf
[17] Parameswaran, R. E. (1997). Colonial Interventions and the Postcolonial Situation in India: The English Language, Mass Media and the Articulation of Class. Gazette (Leiden, Netherlands) , 59 (1), 21-41.
[18] Petrosky, E., Bocchini., J. A., Hariri, S., Chesson, H., Curtis, R. C., Saraiya, M., et al. (2015). Use of 9-valent human papillomavirus (HPV) vaccine: updated HPV vaccination recommendations of the advisory committee on immunization practices. MMWR. Morbidity and mortality weekly report , 64 (11), 300-304.
[19] Rashid, S., Labani, S., & Das, B. C. (2016). Knowledge, awareness and attitude on HPV, HPV vaccine and cervical cancer among the college students in India. PloS one , 11 (11), e0166713.
[20] Ronco, G., Dillner, J., Elfström, M. K., Tunesi, S., Snijders, P. J., Arbyn, M., et al. (2014). Efficacy of HPV-based screening for prevention of invasive cervical cancer: follow-up of four European randomised controlled trials. The lancet , 383 (9916), 524-532.
[21] Sallis, J. F., & Owen, N. (2015). Ecological Models of Health Behavior. In K. Glanz, B. K. Rimer, & K. Viswanath (Eds.), Health Behavior: Theory, Research and Practice (pp. 42-46). San Franscisco, CA, USA: Jossey-Bass.
[22] Schiffman, M., Wentzensen, N., Wachold, S., Kinney, W., Gage, J. C., & Castle, P. E. (2011). Human Papillomavirus Testing in the Prevention of

International Journal of Scientific and Research Publications, Volume 10, Issue 1, January 2020 518
ISSN 2250-3153
http://dx.doi.org/10.29322/IJSRP.10.01.2020.p9778 www.ijsrp.org
Cervical Cancer. JNCI: Journal of the National Cancer Institute , 103 (5), 368-383.
[23] Singh, J., Roy, B., Yadav, A., Siddiqui, S., Setia, A., Ramesh, R., et al. (2018). Cervical cancer awareness and HPV vaccine acceptability among females in Delhi: A cross-sectional study. Indian Journal of Cancer , 55 (3), 233-237.
[24] Suppli, C. H., Hansen, N. D., Rasmussen, M., Valentiner-Branth, P., Krause, T. G., & Mølbak, K. (2018). Decline in HPV-vaccination uptake in Denmark - the association between HPV-related media coverage and HPV-vaccination. BMC Public Health , 18 (1), 1360.
[25] WHO. (2019). Health Impact Assessment (HIA): The determinants of health. Retrieved March 2019, from www.who.int: https://www.who.int/hia/evidence/doh/en/
[26] Zhai, L., & Tumban, E. (2016). Gardasil-9: A global survey of projected efficacy. Antiviral Research , 101-109.
[27] Zillmann, D., Gibson, R., Sundar, S. S., & Perkins, J. J. (1996). Effects of Exemplification in News Reports on the Perception of Social Issues. Journalisma & Mass Communication Quarterly , 73 (2), 427-444.
.
AUTHORS
First Author – Prabhjot Sohal, Senior Research Fellow (UGC),
Ph.D. candidate, School of Communication Studies, Panjab
University, India, [email protected]
Correspondence Author – Prabhjot Sohal, Senior Research
Fellow (UGC), Ph.D. candidate, School of Communication
Studies, Panjab University, India, [email protected] ,
+919711225942

International Journal of Scientific and Research Publications, Volume 10, Issue 1, January 2020 519
ISSN 2250-3153
http://dx.doi.org/10.29322/IJSRP.10.01.2020.p9779 www.ijsrp.org
Status of Education for Sustainable Development in
teacher training institutions in Botswana
Spar Mathews
Department of Teacher Training and Development, Gaborone, Botswana
Reginald Oats
University of Botswana, Department of Educational Foundations
Fana Moffat Kgotlaetsile
University of Botswana
Department of Primary Education
DOI: 10.29322/IJSRP.10.01.2020.p9779 http://dx.doi.org/10.29322/IJSRP.10.01.2020.p9779
Abstract: This paper reports on a qualitative study which evaluated the extent to which the ideals of ESD are incorporated into
teacher training curricula. The study was conducted at 3 teacher training colleges of education and the University of Botswana.
Participants of the study were lecturers. Questionnaire and observation were used to collect data. Findings reveal that in Botswana
information on ESD has been fairly disseminated at teacher training institutions. This has resulted in the infusion of ESD in the
training curriculum in some subjects. However, not much addressed the actual set of MDG and Sustainable Development Goals.
To cover this deficit, the Ministry of Education came up with a strategy of change projects to sensitize institutions on EE and
ESD. These projects range from infusion of ESD in the curricular, proper disposal of used oil and water and rain water harvesting.
Results disclose that most lecturers were aware of the concept of ESD but have not taken much attention to have the concept
aligned to courses they offer. As such amongst the recommendations made are, that there is immediate need to capacitate college
lecturers on ESD.
Key words: curriculum, Education for Sustainable Development (ESD), environmental education, Teacher Training,
qualitative research
INTRODUCTION
The paper evaluated Botswana’s response to Education for Sustainable Development (ESD) and the extent to which the ideals of
ESD are reflected or incorporated into teacher training curricula. In the face of changing climatic and environmental conditions
(such as global warming and depletion of natural resources), education system must infuse into schools and academic oriented
institutions’ relevant subject matter to ensure a collective effort towards mitigation of fast changing environmental and living
conditions. Education for Sustainable Development (ESD) does not only advocates for aspects of Environmental Education and
sustainability but for holistic sustainability which is depicted by the five (5) priority areas as outlined in the United Nations
Educational, Scientific and Cultural Organization (UNESCO) Road Map for Global Action Programme (GAP) on ESD
(UNESCO, 2014). The holistic approaches include amongst others biophysical, social, cultural, political and economic
approaches (Ketlhoilwe, 2010; UNEP, 2005). The interrelationships among these approaches include provision of focal point for
advocacy and promotion of environmental education and training, supporting the development of high quality education learning

International Journal of Scientific and Research Publications, Volume 10, Issue 1, January 2020 520
ISSN 2250-3153
http://dx.doi.org/10.29322/IJSRP.10.01.2020.p9779 www.ijsrp.org
support materials, undertaking ongoing research into environmental education and training and the promotion of Information and
Communication Technology (ICT) with respect to integration of sustainable development principles across all levels of education
(UNEP, 2005).
The United Nations declaration of a Decade of Education for Sustainable Development (DESD) stated that there is need
to integrate sustainable development into education systems at all levels so as to make education a key instrument for change
(UNEP, 2005). This was affirmed at the Johannesburg Summit in 2005 (UNEP, 2005). At the summit, it was made clear that ESD
addresses a wide area of themes that include the following: (which do not necessarily focus on the environment), poverty
alleviation, citizenship, peace, ethics, democracy and governance, justice, human rights, gender equality, corporate responsibility,
natural resource management and biological diversity. All these being the Millennium Development Goals (MDG) set in Rio 24th
summit (UNEP, 2005).
Success of ESD lies mostly on reflecting the equal importance of the learning process and outcomes of the education
process (UN Decade of Education for Sustainable Development (DESD) (UNESCO, 2006) through:
a. Imbedding ESD in curriculum in an interdisciplinary and holistic manner
b. Sharing values and principles that underpin Sustainable Development
c. Developing confidence in addressing the challenges of Sustainable Development
d. Employing variety of educational methods (literature, art, drama, animation, ICT etc.
e. Allowing learners to participate in decision making and designing of educational programs
f. Addressing local and global issues on Sustainable Development
g. Ensuring long-term planning for Sustainable Development
STATEMENT OF THE PROBLEM
Although the concept of ESD has long been deliberated worldwide, Botswana’s education system has since been lagging behind
in the infusion and/or integration of ESD in the curricula at all levels of learning. This may be linked to the fact that the education
Policies of Botswana have not included or adhered to the call for nations to address the MDGs and/or SDGs to integrate ESD in
educational curricular. As a matter of fact, this condition has seen institutions putting very little to no effort in sensitising its
trainees or learners on issues of sustainability. The implication of this state of affairs is that graduates from some training
institutions are more likely to graduate without a concrete foundation on issues of sustainability and ESD.
OBJECTIVES OF THE STUDY
The objectives of the study are to:
- To investigate the extent to which the ideals of ESD are reflected or incorporated into higher education curriculum
- To find out response to Education for Sustainable Development by teacher training institutions
PURPOSE OF STUDY
The purpose of this paper is to examine Botswana’s response to Education for Sustainable Development (ESD) and the extent to
which the ideals of ESD are reflected or incorporated into teacher training curricula.
International Journal of Scientific and Research Publications, Volume 10, Issue 1, January 2020 521
ISSN 2250-3153
http://dx.doi.org/10.29322/IJSRP.10.01.2020.p9779 www.ijsrp.org
CONCEPTUAL FRAMEWORK
This study is compatible with the transformative learning theory from the perspective of Jack Mezirow (1978, 1997) which offers
learning that is uniquely adult, is abstract, idealised, and grounded in the nature of human communication. The theory is partly a
developmental process, but more as “learning is understood as the process of using a prior interpretation to construct a new or
revised interpretation of the meaning of one’s experience in order to guide future action” (Mezirow, 1996:162). Education for
sustainable development requires change in the way education and training is been offered and as such this theory is relevant by
reason that it offers an explanation for change in meaning structures that evolves in the domains of instrumental and
communicative learning. The instrumental domain focuses on learning through task-oriented problem solving and determination
of cause and effect relationships—learning to do, based on empirical- analytic discovery while the communicative learning
domain involves understanding the meaning of what others “communicate concerning values, ideals, feelings, moral decisions,
and such concepts as freedom, justice, love, labour, autonomy, commitment and democracy” (Mezirow, 1991:8). The relevance of
this theory for education for sustainable development at college level is that projects done by student-teachers and staff have
potential to encourage exploration of the environmental and sustainability concepts and ideas to influence transformative learning
among staff and students’ at various teacher training institutions in Botswana.
LITERATURE REVIEW
The concept of Education for Sustainable Development
Since the time sustainable development was first sanctioned at the UN General Assembly in 1987, the parallel concept of
education to support sustainable development has also been explored. From 1987 to 1992, the concept of sustainable development
matured as committees discussed, negotiated, and wrote the 40 chapters of Agenda 21. Consequently, Initial thoughts concerning
ESD were captured in Chapter 36 of Agenda 21, Promoting Education, Public Awareness, and Training (Rosalyn McKeown,
2002).
Education for Sustainable Development is the focus or projection of education that seeks to equip people towards
creating a sustainable future. As such to achieve education for sustainable development can only be fully achieved through a
united force by various stakeholders comprising government, private sector educational institutions, and media. Together these
bodies can achieve expressive efforts towards achieving sustainable development goals. According to UNESCO (2000) the way
each nation, and stakeholder be it private sector, individual, media or cultural group view sustainable development will depend on
its own values. This is so primarily because each of these stakeholders have a different visualization of sustainable development
and education for sustainable development. For instance some are interested in environmental preservation and protection; some
have economic development interests while others may be more interested in social development. These variance in interests and
visualisations deserve to be harmonised to effect mutual benefit of our nation states.
Like revealed above, stakeholders may differ in their interests and visualisations of ESD, but there is need for all to work
within the scope of ESD as outlined by UNESCO (2002). In 2002 UNESCO indicated that ESD shall have the following four
major thrust:
Promotion and improvement of basic education
Reorienting existing education at all levels to address sustainable development
Enhancing public awareness and understanding of sustainability
Training and skills development for the world of work.
International Journal of Scientific and Research Publications, Volume 10, Issue 1, January 2020 522
ISSN 2250-3153
http://dx.doi.org/10.29322/IJSRP.10.01.2020.p9779 www.ijsrp.org
For the purpose of this paper, two (2) thrust above are considered most relevant. These are: Reorienting existing
education at all levels to address sustainable development and Training and skills development for the world of work.
Reorienting existing education at all levels to address sustainable development Education for Sustainable Development
requires the reorientation of many existing education policies, programmes and practices to address the social,
environmental and economic knowledge, skills, perspectives and values inherent to sustainability (UNESCO, 2014).
This goal is a challenge to nations to consider rethinking and revisioning education at all levels with a view to inclusion
of a clear focus on the development of the knowledge, skills, perspectives and values related to sustainability issues
relevant to current life status and going forward. This implies a review of existing curricula in terms of their objectives
and content to develop transdisciplinary understandings of social, economic and environmental sustainability (UNESCO,
2002).
In Botswana’s conditions, this may also bring a challenge and a need to consider a holistic review of approaches
to teaching, learning and assessment to foster lifelong learning skills. Lifelong learning skills are the means by which
students master academic content and translate knowledge into action (McGarrah, 2015). These include skills for
creative and critical thinking, oral and written communication, collaboration and cooperation, conflict management,
decision-making, problem-solving and planning, using appropriate ICTs, and practical citizenship.
The other major thrust relevant for this study is - training and skills development for the world of work.
Sustainable development depends on the provision of specialized training programmes to ensure that all sectors of
society have the skills necessary to perform their work in a sustainable manner (UNESCO, 2002). It implies that all
sectors of the workforce can only contribute meaningfully to sustainability issues provided they have requisite
enlightenment and skills. A challenge of teacher training institutions therefore is to conduct on-going training with a
hands-on approach so that all their graduates have the knowledge and skills necessary to make decisions and perform
their work in a sustainable manner.
Concept and development of Education for Sustainable Development in Botswana
At independence in September 1966, Botswana was young, poor and had a fragile democracy. The education system at
independence was inherited from the British who had colonised and ruled Botswana from 1885 to 1966 (Jotia, 2006). The
inherited education system had several features which were not applicable and therefore not beneficial to Batswana (Oats, 2014).
It was therefore because of colonial influence that after independence immediate efforts were undertaken through various
education policies (Republic of Botswana, 1977; Republic of Botswana, 1994; Presidential Task Group for a Long-Term Vision
for Botswana, 1997) for the building of a politically, socially, economically and educationally strong nation envisaged by the then
government. This shows that since the attainment of self-rule in 1966, the government of Botswana has deemed education as an
essential tool for achievement of economic development and sustainability. The government has always recognized that current
economic development trends are not sustainable and that public awareness, education, and training are keys to moving the
society of Botswana towards sustainability.
According to Ketlhoilwe and Jeremiah (2013), Environmental and sustainability discourses are integral parts of
education and national development plans and policies in Botswana. The authors reveal that sustainable development and
education for sustainable development discourses have been introduced through curriculum documents such as the different
subjects’ syllabi and the Environment Education Guidelines (Ministry of Education, 2002). The Government of Botswana has
also exposed awareness on sustainability issues by making sustainable development a emphasis for National Development Plans
as can been seen from various national development plans such as Botswana Government (1991/7), (1997/2002), (2003/09) and
(2010/16). The other instrumental policy document is the National Environmental Education Strategy and Action Plans 1 and 2
(Botswana Government, 1996 and 2007). The strategy and action plan emphasize both environmental education and education for
sustainable development. Also, the objective in the National Environmental Education Strategy and Action Plan (NEESAP) are
International Journal of Scientific and Research Publications, Volume 10, Issue 1, January 2020 523
ISSN 2250-3153
http://dx.doi.org/10.29322/IJSRP.10.01.2020.p9779 www.ijsrp.org
all encompassing, making it the appropriate document to implement the post ESD activities (Magosi, 2015). These are the
policies and initiatives that gave a drive to change projects in various learning institutions in Botswana.
Among others, the RNPE of 1994 was more direct and robust in authorising EE. Thus environmental education has been
recommended by the 1994 Revised National Policy on Education (Botswana Government, 1994) .Recommendation 44 of the
policy indicated the need for defined national goals for environmental education and that EE should be incorporated into all
subjects. Mostly importantly, the recommendation indicated that educational institutions starting with teacher training institutions
and the University of Botswana should develop an environmental ethos and set an example to the rest of the community
(Government of Botswana, 1994). This was indeed a milestones in terms of policy support for environmental and sustainability
issues in education. However, the yields of this policy support are not satisfactory hence studies such as this one are conducted to
find out the impact teacher training institutions are making in fostering the sustainability aspirations of the country. This is
because from interpretation of the policy recommendations, it is clear that teacher training institutions have been called upon to
in-service and pre-service teachers on environmental education and to be exemplary to the rest of the community through
environmental ethos (Botswana Government, 1994).
METHODOLOGY
This qualitative study undertaken through the case study design targeted colleges of education in Botswana and the
University of Botswana. A case study can be used in diverse forms, hence for this study multiple case study approach was used.
In this approach a number of cases are studied to investigate some general phenomenon. It is for this reason that in this study
multiple case study approach was chosen to fit the phenomenon being studied and to gain the information-rich and thick
descriptions of data portrayed by Patton (2002) and Rubin and Rubin (2005). In this study the use of multiple case studies helped
to select sites and participants with varied backgrounds and experiences on ESD and tertiary education in Botswana and this
venture has added validity to the study.
Lecturers at colleges of education and University of Botswana lecturers were the target population. This study used
probability sampling in particular simple random sampling approach to select two colleges to form the sample. Simple random
sampling was preferred because it allowed each unit in the sample identified to have an equal chance of being selected. Further,
simple random sampling was favoured because it permitted the selection of each unit independent of the selection of every other
unit and increases validity in the study. The same approach to selection was used to identify 5 lecturers at each college selected to
form participants for the study. The lecturers all held master’s degree qualification and were from social studies education,
science and practical subjects. On the side of the University of Botswana lecturers, purposeful sampling was used to select
lecturers who offer environmental education courses. The University of Botswana lecturers all held PhD and were from the
faculty of education with environmental education specialisation.
Questionnaire with semi-structured items was used to collect data. A questionnaire was selected based on the fact that it
allowed collection of Large amounts of information can be collected from a large number of people in a short period of time and
in a relatively cost effective way with limited effect to its validity and reliability. Data analysis followed stages of intensive
reading to familiarise with data before coding for patterns and themes, category formation and triangulating between colleges and
types of interviews.
RESULTS AND DISCUSSION
As open ended questions were used for data collection, the researchers analysed the collected data by searching for the
statements that replicate commonalities or aspects of particular relevance to the study. Data from each college was first exposed
to within case analysis, where data from each college is analysed separately. Then cross-case analysis was done by compiling the

International Journal of Scientific and Research Publications, Volume 10, Issue 1, January 2020 524
ISSN 2250-3153
http://dx.doi.org/10.29322/IJSRP.10.01.2020.p9779 www.ijsrp.org
findings to come up with the final data that was coded into themes. Merriam (2009) stated that in multiple-case study, within case
analysis of each study is first done as a comprehensive case, and then analysed. After that, cross-case analysis was done after
within-case is completed. There three (3) major themes which emerged from the study were that participant’s conceptualisation of
ESD differed, the need for teacher training on ESD and Botswana’s response to the ESD call.
Participant’s comprehension of ESD
It has emerged from findings that people view ESD in diverse ways. As a result, defining of the concepts, ESD, EE and
Sustainable development seem to be problematic as many view the concepts differently. It is in this light that there it was found
necessary to gather educators views on these concepts since the way they understand and practice them has implications for this
study. Lecturers were asked to differential the concepts, ESD and EE, one lecturer, (C1SP2) said: ‘To me ESD is a holistic
approach in that it requires the wellbeing of the society, while EE only focus on the environment’. Another one closer to above
opined that ‘EE focuses on the environment while ESD is holistic in approach because it caters for both the environment and the
society they live in as well as the economy of the country’.
A more elaborate view was from one UB lecturer who indicated that, ESD is a cross cutting interdisciplinary approach to
learning that covers the integrated social, economic and environmental dimensions of the formal and informal curriculum. She
further indicated that ESD is a pedagogical approach that should develop skills, knowledge and experience to contribute to an
environmentally and ethically responsible society that reflects those values in their day to day. On the contrary, a thought-
provoking response was from two (2) college lectures who pointed out that they cannot differentiate the concepts. Along the same
vein, to a closer question, which wanted to find out how much information participants know about ESD, the same respondents
gave answers such as- ‘ Nothing’, ‘very little’, ‘am not sure’. To this question in fact, majority of respondents from colleges of
education indicated that they know little about the depth and breadth of ESD. This is a serious challenge to Botswana aspirations
of achieving UNESCO goals on ESD. The challenge facing Botswana is that if educators are unaware of the critical components
of ESD and sustainable development reorienting education to address sustainable development will not happen.
On the contrary, the results obtained from Colleges of Education indicated that most lecturers were aware of the concept
of Education for Sustainable Development but have not taken much attention to have the concept aligned to courses offered in
these colleges. The implication of this state of affairs is that graduates from these colleges are more likely to graduate without a
concrete foundation on issues of sustainability despite the fact that the colleges are engaged with change projects. This has seen
some of the colleges making effort to sensitize the teacher trainees and other members of staff while other colleges are still
lagging behind. Those colleges that have taken a step to sensitize their trainees are still skewed in their sensitisation as they
mostly emphasise on sustainability with relation to the environment only. One college has taken a different route in their
sensitization though, by including in their ongoing curriculum issues of sustainability in subjects such as the sciences, Art and
design, and English. This has been seen as a great move towards achieving the goals of Education for Sustainable Development as
stipulated by United Nations declaration of Decade of Education for Sustainable Development (DESD) (UNESCO, 2005; UNEP,
2006.
ESD and teacher training curricular
Academic staff members at colleges of education and the University of Botswana were asked questions regarding the
curriculum offered in respect to ESD. On the question of the subjects/courses offered in line with ESD, all participants except two
(2) indicated the yes options meaning that their institutions have courses/subjects with ESD components. When asked to explain
their responses, most of them indicated that “there is infusion of sustainable development issues in lessons, projects and lesson
material”. They also pointed out that at colleges of education subjects like agriculture, home economics, social studies, music and
art are offered which have components on ESD and/or environmental education. As such participants believe that graduates can

International Journal of Scientific and Research Publications, Volume 10, Issue 1, January 2020 525
ISSN 2250-3153
http://dx.doi.org/10.29322/IJSRP.10.01.2020.p9779 www.ijsrp.org
continue using the knowledge and skills learnt from these subjects to sustain themselves. Although this seems to be embraced by
most lecturers at colleges of Education, it was observed and noted during visits to the colleges whose main aim was to carry out
needs analysis with regard to ESD, that most lecturers were either not aware of issues of ESD or they did not really understand
what the whole concept on ESD. This led to some resistance by some lecturers in to join working teams on college change
projects not develop any interest in wanting to get to find out what and how those projects would benefit them individually, their
learners and the college as a whole.
While on overall, majority of college lecturers talked of infusion of ESD components across various subjects, the
University lecturers mentioned a number of courses offered in her department which are in line with ESD. One lecturer further
indicated that she has gone to the extent of developing a new course for anticipated pre-service programme which will be an
introductory course in education for sustainable development.
The findings further show an indication that in Botswana information towards ESD has been fairly disseminated in
teacher training institutions. Although certain subjects had topics which indirectly taught on some aspects of sustainability and
ecological balance such as Biology, Chemistry and social studies like mentioned before, not much addressed the actual set of
MDGs, which is what ESD and EE have been striving towards achieving. Due to this condition, the Ministry of Education and
Skills Development came up with some ways of sensitizing some training institutions such as colleges of education on the issues
of EE and ESD through change projects. These projects are in varied areas ranging from infusion of ESD in the curricular, proper
disposal of used oil from the institutions kitchen, rain water harvesting and proper disposal of wastewater for purposes of safe re-
use. All these projects are in a quest by colleges of Education in Botswana to address matters of sustainability and environmental
protection.
The integration of ESD into curricular by Molepolole College of Education is a move that strives towards empowering
teacher trainees so as to have them well equipped when they graduate to be able to empower learners at the schools where they
will be employed as well as have an impact in the society, which is in line with recommendations by UNESCO (UNESCO, 2014).
This came in the form of a project inspired by Education for Sustainable Development concepts thus the college’s change project.
These will actually result in the colleges of Education in Botswana mainstreaming the concept of sustainable development in their
curriculum. The advantage of which will be to add value to the courses taken by teacher trainees thus graduating globally
competitive well-rounded teachers who will not only be able to teach learners on curriculum issues but also be abreast with global
sustainability issues.
The other colleges reported to have their change projects aligned mostly on addressing issues of the environment and
thus no integration nor infusion into the curriculum. The weakness of this approach is that trainees who are not involved in such
change projects are left out. This therefore implies that the change projects carried out by some of the institutions of higher
education in Botswana may have localised impact unlike when the concepts are shared through integration into the curriculum so
as to benefit all.
Botswana’s response to the ESD call
This research perceived to find out Botswana’s response to the ESD call. As such participants were asked to state how in
their view Botswana has embraced the concept of ESD. Results show that this was a challenging question for most college
lecturers. Expressively, it was noted with a surprise that a huge majority of college lecturers were not aware of any innovations or
strategies in place to address the ESD call. That is, for the question, how has Botswana embraced the concept of ESD, majority
gave answers such as-no idea, I do not know, and, yes (without further explanation). It is therefore imperative for the Ministry of
Education, through the department of training as the producer of teachers to take a deliberate initiative of internalizing the ESD
concepts in order to impart it to the teachers who in turn must engrave it in the minds of the young ones (Tsayang & Bose, 2013).
If government officials or school district administrators are unaware of the critical linkages between education sectors and
sustainable development, reorienting education to address sustainable development will not occur (UNESCO, 2013).
International Journal of Scientific and Research Publications, Volume 10, Issue 1, January 2020 526
ISSN 2250-3153
http://dx.doi.org/10.29322/IJSRP.10.01.2020.p9779 www.ijsrp.org
The University of Botswana lecturers on the other hand were well informed on ESD issues. From their responses, it
emerged that Botswana Government had availed a lot of opportunities to address the ESD call. Participant pointed out that a
number of innovations through collaboration between different stakeholders like University of Botswana, NEEC, Department of
Curriculum, and Department of Training & Development are being made and initiated to attempt to respond to agenda 21.
Participants however decried the fact that there is neither clear national policy nor strategy on ESD. They suggested the need for
the Government of Botswana to give greater attention to develop a policy at national level where ESD should be clearly
articulated and it would be mandatory that it is mainstreamed in all aspects of education.
CONCLUSION
The findings of this study show an overall agreement among the academic staff at colleges of education and the
University of Botswana particularly with respect to curriculum offered to teacher-trainees and ESD components. That is there is a
positive picture that the Government of Botswana through the ministry of education and skills development is attempting to
address ESD related issues. However, a contradiction was noted particularly at colleges of education in instances where lecturers
would indicated that college curriculum has ESD components but fail to show deeper understanding on ESD issues. It is also clear
that college lecturers do not have self-willingness to take part in ESD related initiatives of the country. Simply put, it appears ESD
issues in most colleges are left the subjects which have topics related to ESD. These arguably show the lack of expertise on such
lecturers with the perspective ideals of ESD.
This study maintains that it is imperative to capacitate college lecturers so that they pass requisite knowledge and skills
to their students. If children are raised in good ESD ways, they will not lose these good ways when they are older and there will
be no need to discipline or fight with them as they will be in good understanding of sustainable development (Tsayang & Bose,
2013). Education for Sustainable Development if incorporated and emphasised in the curriculum in teacher training institutions
will enable trainees to understand themselves and others. This will make them understand their links with the wider natural and
social environment. It also enables trainees to highlight the importance of respect and care for life in all its diverse forms that
involve protection and restoration of the earth’s ecosystems, respect for the dignity and human rights of people, respect for the
rights of future generations and respect for cultural diversity.
RECOMMENDATIONS
Bearing in mind the findings, the researchers would advise policy makers in the form of teacher training officers to
update curriculum developers and colleges of education, in particular lecturers on EE and ESD issues. Expressly, college
curricula, both academic and ‘methods course’ material should be reviewed to add more content on EE & ESD. There is also
need for the Government of Botswana to develop an ESD policy at national level to guide all operations and practice with respect
to sustainability. There is also a dire need to develop capacity building programmes specifically for college lecturers on issues of
Education for Sustainable Development.
References
Botswana Government 1991. National Development Plan 7 1991 – 1997. Gaborone: Government Printer.
Botswana Government 1994. Conservation Botswana Newsletter, volume. I, No. I, March.
Botswana Government 1996. National Environmental Education Strategy and Action Plans. Gaborone: Government Printer.
Botswana Government 1997. National Development Plan 8 1997 – 2002/03. Gaborone: Government Printer.
Botswana Government 2003. National Development Plan 9 2003 – 2008/9. Gaborone: Government Printer.
Botswana Government 2007. National Environmental Education Strategy and Action Plans 2. Gaborone: Government Printer.
Botswana Government 2009. National Development Plan 10 2010 – 2016. Gaborone: Government Printer.

International Journal of Scientific and Research Publications, Volume 10, Issue 1, January 2020 527
ISSN 2250-3153
http://dx.doi.org/10.29322/IJSRP.10.01.2020.p9779 www.ijsrp.org
Jotia, A. L 2006. The quest for deep democratic participation: Schools as democratic space in the post-colonial Botswana
(thesis). (Ohio): Ohio University.
Ketlhoilwe MJ & Jeremiah K 2010. Mainstreaming Environment and Sustainability Issues in Institutions of Higher Education:
The Case of the University of Botswana. International Journal of Scientific Research in Education, 3(1):1-9. Accessed
01.02.2017.Available at http://www.ijsre.com.
McGarrah MW 2004. College and Career readiness and Success Centre at American Institutes for Research Lifelong Learning
Skills for College and Career Readiness: Considerations for Education Policy.
McKeown R 2002. Education for Sustainable Development Toolkit. London: Waste Management Research and Education
Institution.
Mezirow J 1997. Transformative Learning: Theory to Practice. In P.Cranton.Transformative Learning In Action: Insights From
Practice. New Directions For Adult and Continuing Education No. 74, pp. 5-12. San Francisco, CA: Jossey-Bass.
Mezirow J 2016. Perspective Transformation. Adult Education. 28. 1978. Accessed 2016 August 7. Available from
http://www.ericdigests.org/1999-2/adulthood.htmCite
Ministry of Education 2002. Environment Education Guidelines for Primary, Secondary and Tertiary Institution. Gaborone:
Government Printer.
Oats R 2014. The responsiveness of social studies teacher training curriculum towards democratic citizenship education in
Botswana. PhD Thesis. Pretoria: University of South Africa.
Patton, M.Q. (1990). Qualitative evaluation and research methods (2nd ed). London: SAGE.
UNESCO 2000. World education report: The right to education for all throughout life. United Nations Educational, Scientific
and Cultural Organization.
UNESCO 2002. The EFA Global Monitoring Report Team. Paris: United Nations Educational, Scientific and Cultural
Organization.
UNESCO 2002. UNESCO-UNEP International Environmental Education Programme Environmental Education Series 21
environmental education activities for primary schools. Paris: International Centre for Conservation Education For
UNESCO-UNEP.
UNESCO 2006. Framework for the UNDESD International Implementation Scheme. Paris: UNESCO
UNESCO 2014. UNESCO Roadmap for the Implementing the Global Action Programme on Education for Sustainable
Development. Paris: UNESCO
International Journal of Scientific and Research Publications, Volume 10, Issue 1, January 2020 528
ISSN 2250-3153
http://dx.doi.org/10.29322/IJSRP.10.01.2020.p9780 www.ijsrp.org
Effectiveness of Integrated Watershed Management
Intervention for Sustainable Development in Meskan
District, Southern Ethiopia
Wunde Sebsibe Teka, Haochen Zhu, M. Mehari, N. Muhammedamin, B.Yonas
Tongji University, UN Environment-Tongji Institute of Environment for Sustainable Development (IESD): College of Environmental Science and
Engineering. Tongji University, Shanghai, 200092, P.R. China.
DOI: 10.29322/IJSRP.10.01.2020.p9780 http://dx.doi.org/10.29322/IJSRP.10.01.2020.p9780
Abstract
The core drive of this study was to measure the effectiveness of integrated watershed management implementation in Meskan district.
Systematic sampling technique and random sampling method were used to select sample micro-watersheds and specific households
from the two selected intervention and less/ non-intervention areas, respectively.
Data were collected through household questionnaire review, focused group discussion, key informant interview, and field
observation .Moreover,, physical soil and water conservation structures’ arrangement measurement was piloted. To analyze the data,
SPSS version -20 software descriptive statistics, chi-square test, independent t-test, and participation index were used. The study
discovered that the intervention has effective progresses in enhancing the attitude of society towards integrated watershed
management practices, protecting soil erosion, improving ground and sub- surface water availability, increasing vegetation cover and
expanding household income source. However, low public involvement, nonexistence of the structures design arrangement with
criteria, and lack of differentiated soil water conservation procedures, lack of regular maintenance time, and unable to use suitable
structures for each micro- watersheds were some of the main drawbacks of the implementation. Therefore, this study commends that
the stakeholders should make appropriate adjustment measures for practical failures and additional interdisciplinary revision should
be heading for discover the difficulties.
Keywords: Meskan district, Integrated, Effectiveness, Intervention, Watershed Management
1. Introduction
The concept of integrated watershed management has established to ensure effective use of social,environmental, and economic
capitals. It has been critical in a country like Ethiopia where morethan 80% of the population depends on agriculture. A large part of
the high land in Ethiopia is categorized by low level of technological change , low productivity, high risk of uncertainty and
vulnerability to natural resources degradation [1]. Deforestation, soil erosion, and nutrient depletion are the major social, ecological,
and economical problem in Ethiopia [2] . Sustainable development and increased food production in agricultural based developing
countries requires availability of sufficient water and fertile land. Water especially affects greatly the prosperity of people and their
development potential and health [3] .
The recent methodology which should be done critically for effectiveness is integrated watershed management through ‘community
based participatory approach’, which requires participation of local people. The government of Ethiopian recognizes the spirit of this
methodology as evidences from effectively implemented model schemes appear encouraging . Substantial effort is occurring to
replicate ‘community based participatory integrated watershed management’ activities in districts of most regions. As an element of
this effort, in the last ten years, a nationwide 30 -40 days watershed management through public work campaign has occurred [4]. But
many problems were also recoginized that threaten the effectivness of watershed management. Lack of information and technical
advice to support the identification of interventions appropriate for the local context;the uneven distribution of the water management
costs and benefits, and uncoordinated interventions of actors and institutions within a watershed weer the main challenges . To solve
these challenges and support, best practices scaling up was very important[5]. Moreover, for the last many years, different social
activities, such as improvements in monitoring and diverting superficial waters, overgrazing, discovering ground water, and in excess

International Journal of Scientific and Research Publications, Volume 10, Issue 1, January 2020 529
ISSN 2250-3153
http://dx.doi.org/10.29322/IJSRP.10.01.2020.p9780 www.ijsrp.org
use of natural resources for a diversity of drives have been accepted without attention. Unable to keeping the natural resource,
mishandling of the watershed, and absence of maintaining the quality of environment have greatly affect the sustainable development
of the country.
In order to improve the aforementioned problems, the role of participatory integrated effective watershed management is essential. It
can prevent the community from flooding and erosion, poor water quality, and water shortage. Subsequently, the rivers, streams, and
wetlands of a certain watershed area can provide ecological facilities that maintain the health safety, social, and economy prosperity
by developing and distributing cleaned drinking water; maintaining ecological diversity ,providing opportunities of recreation that
attract tourists; providing opportunities of spawning for commercially valuable fish; raising property values; supporting agriculture,
and protecting people and property from risk of flooding [6] .
The Government of the country (Ethiopia) is undertaking community based watershed management practices all over the country
mainly during the last 10 years [7]. According to Meskan district office of Agriculture, there are exhaustive watershed management
activities in the local areas following the program launched by the government and almost all kebeles of the district practicing in
different SWC activities, contaning biological and physical measures. However, until now, Effectiveness of those conservation
activities for the local condition was not continually evaluated throughout the country. The monitoring system of those interventions
is fragmentary, and there is week maintenance of physical structures [8]. As it is also the Governmental approach to solve natural
resources degradation and enhance productivity for future sustainable development, the issue should have to get more attention. This
being a general scenario, no much research is yet done to evaluate the sucussfullness of IWSM interventions in relations to its
biological and physical impact in the study area. This study is, therefore, intended to evaluate the effectiveness of IWSM interventions
in Meskan district through identifying the main watershed management interventions implemented, evaluating the outlook of the
local society towards the intervention, identification of supporting institutions, evaluating selected intervention measures in terms of
their scientific standard and investigating the environmental contribution of watershed management activities.
2. Materials and Methods
2.1. Study Area Description
The research was conducted in Southern Nation Nationalities and Peoples Regional State, Gurage Zone, Meskan District, Ethiopia,
.which lies between 7˚50’0’’ N and 38˚20’0’’ E respectively and 130 km far away from the capital city of Addis Ababa, 155 km from
regional capital city of Hawasa, and 100 km from zonal capital city of Wolkite. The district has 42 kebeles totally, among these, 40
of them are rural kebeles while the rest 2 are urban kebeles.
According to (Meskan district finance and economic development office, 2018) and (CSA), the estimated total population of the
Woreda is 222,602 (109,549 men and 113,060 women). The total household number is 46,570 of this 29,398 are men headed
households and 17,172 are women headed households. The district is located at an altitude range of 1501-3500 masl. The mean
annual rainfall of the area is 1001-1200 mm. The topography of the district is 55% leveledland, 35% sloppy and 10% high land. From
50,177 ha, total area coverage of the district the land which used for cultivation is 13,579. Total land covered with perennial and
annual crop is 9.9,31.3 ha,respectively, 25.22 ha shrubs land,grazing, and forest, and 26.73 ha is covered with others. The lower
watershed part of Zebidar mountain (the highest mountain in the region) with high risk area to soil erosion by runoff; land slide and
changing the river direction causing social &economic crisis in the woreda and the administration center of the study area (Butajira
city) with a population of around 100000 the impact watershed has direct impact also on the city administration as well.
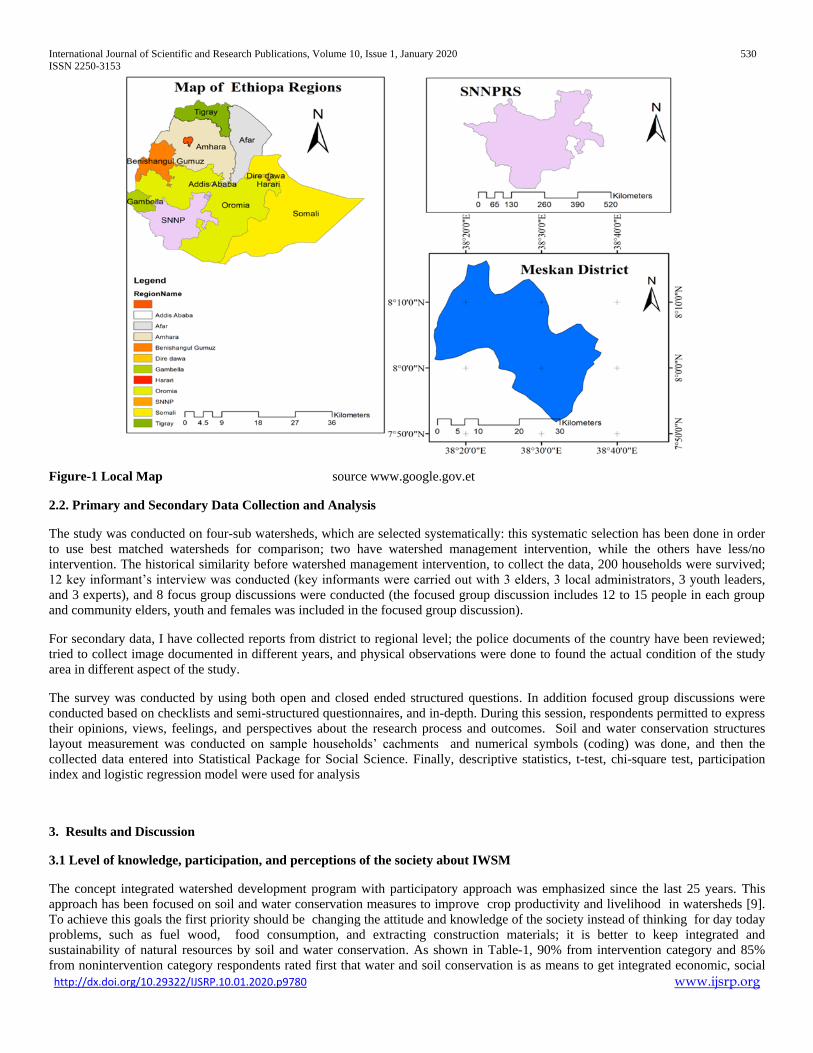
International Journal of Scientific and Research Publications, Volume 10, Issue 1, January 2020 530
ISSN 2250-3153
http://dx.doi.org/10.29322/IJSRP.10.01.2020.p9780 www.ijsrp.org
Figure-1 Local Map source www.google.gov.et
2.2. Primary and Secondary Data Collection and Analysis
The study was conducted on four-sub watersheds, which are selected systematically: this systematic selection has been done in order
to use best matched watersheds for comparison; two have watershed management intervention, while the others have less/no
intervention. The historical similarity before watershed management intervention, to collect the data, 200 households were survived;
12 key informant’s interview was conducted (key informants were carried out with 3 elders, 3 local administrators, 3 youth leaders,
and 3 experts), and 8 focus group discussions were conducted (the focused group discussion includes 12 to 15 people in each group
and community elders, youth and females was included in the focused group discussion).
For secondary data, I have collected reports from district to regional level; the police documents of the country have been reviewed;
tried to collect image documented in different years, and physical observations were done to found the actual condition of the study
area in different aspect of the study.
The survey was conducted by using both open and closed ended structured questions. In addition focused group discussions were
conducted based on checklists and semi-structured questionnaires, and in-depth. During this session, respondents permitted to express
their opinions, views, feelings, and perspectives about the research process and outcomes. Soil and water conservation structures
layout measurement was conducted on sample households’ cachments and numerical symbols (coding) was done, and then the
collected data entered into Statistical Package for Social Science. Finally, descriptive statistics, t-test, chi-square test, participation
index and logistic regression model were used for analysis
3. Results and Discussion
3.1 Level of knowledge, participation, and perceptions of the society about IWSM
The concept integrated watershed development program with participatory approach was emphasized since the last 25 years. This
approach has been focused on soil and water conservation measures to improve crop productivity and livelihood in watersheds [9].
To achieve this goals the first priority should be changing the attitude and knowledge of the society instead of thinking for day today
problems, such as fuel wood, food consumption, and extracting construction materials; it is better to keep integrated and
sustainability of natural resources by soil and water conservation. As shown in Table-1, 90% from intervention category and 85%
from nonintervention category respondents rated first that water and soil conservation is as means to get integrated economic, social
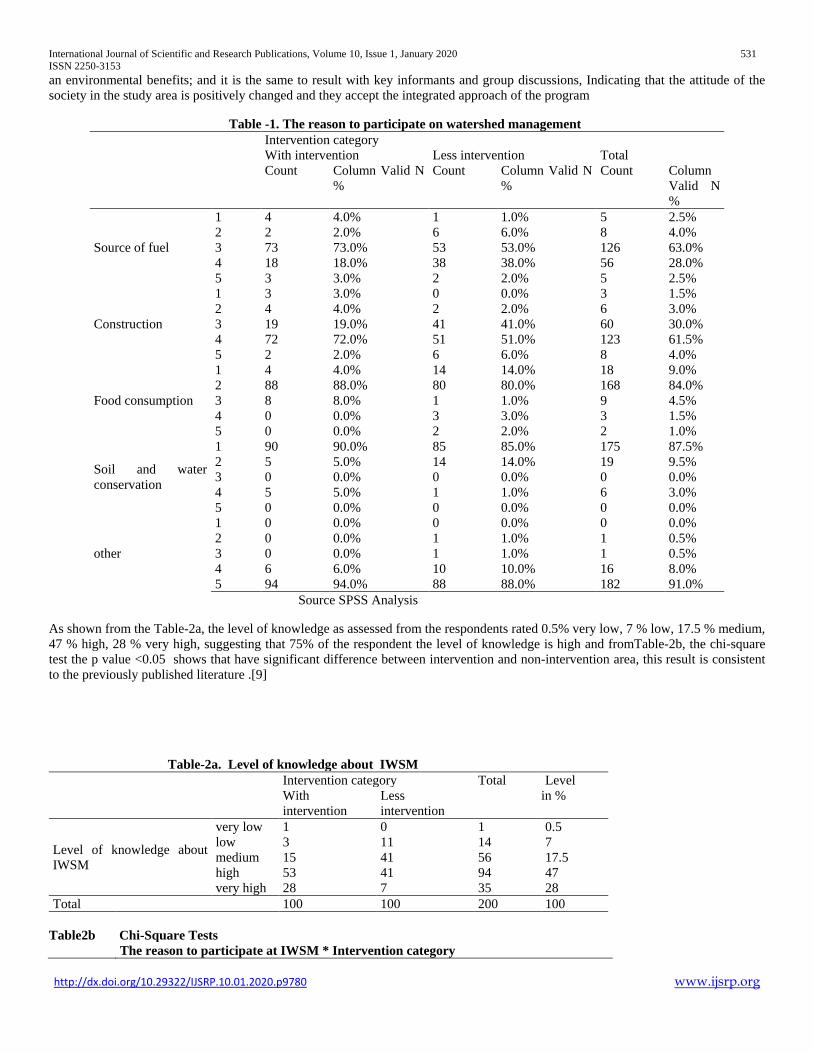
International Journal of Scientific and Research Publications, Volume 10, Issue 1, January 2020 531
ISSN 2250-3153
http://dx.doi.org/10.29322/IJSRP.10.01.2020.p9780 www.ijsrp.org
an environmental benefits; and it is the same to result with key informants and group discussions, Indicating that the attitude of the
society in the study area is positively changed and they accept the integrated approach of the program
Table -1. The reason to participate on watershed management
Intervention category
With intervention Less intervention Total
Count Column Valid N
%
Count Column Valid N
%
Count Column
Valid N
%
Source of fuel
1 4 4.0% 1 1.0% 5 2.5%
2 2 2.0% 6 6.0% 8 4.0%
3 73 73.0% 53 53.0% 126 63.0%
4 18 18.0% 38 38.0% 56 28.0%
5 3 3.0% 2 2.0% 5 2.5%
Construction
1 3 3.0% 0 0.0% 3 1.5%
2 4 4.0% 2 2.0% 6 3.0%
3 19 19.0% 41 41.0% 60 30.0%
4 72 72.0% 51 51.0% 123 61.5%
5 2 2.0% 6 6.0% 8 4.0%
Food consumption
1 4 4.0% 14 14.0% 18 9.0%
2 88 88.0% 80 80.0% 168 84.0%
3 8 8.0% 1 1.0% 9 4.5%
4 0 0.0% 3 3.0% 3 1.5%
5 0 0.0% 2 2.0% 2 1.0%
Soil and water
conservation
1 90 90.0% 85 85.0% 175 87.5%
2 5 5.0% 14 14.0% 19 9.5%
3 0 0.0% 0 0.0% 0 0.0%
4 5 5.0% 1 1.0% 6 3.0%
5 0 0.0% 0 0.0% 0 0.0%
other
1 0 0.0% 0 0.0% 0 0.0%
2 0 0.0% 1 1.0% 1 0.5%
3 0 0.0% 1 1.0% 1 0.5%
4 6 6.0% 10 10.0% 16 8.0%
5 94 94.0% 88 88.0% 182 91.0%
Source SPSS Analysis
As shown from the Table-2a, the level of knowledge as assessed from the respondents rated 0.5% very low, 7 % low, 17.5 % medium,
47 % high, 28 % very high, suggesting that 75% of the respondent the level of knowledge is high and fromTable-2b, the chi-square
test the p value <0.05 shows that have significant difference between intervention and non-intervention area, this result is consistent
to the previously published literature .[9]
Table-2a. Level of knowledge about IWSM
Intervention category Total Level
With
intervention
Less
intervention
in %
Level of knowledge about
IWSM
very low 1 0 1 0.5
low 3 11 14 7
medium 15 41 56 17.5
high 53 41 94 47
very high 28 7 35 28
Total 100 100 200 100
Table2b
Chi-Square Tests
The reason to participate at IWSM * Intervention category
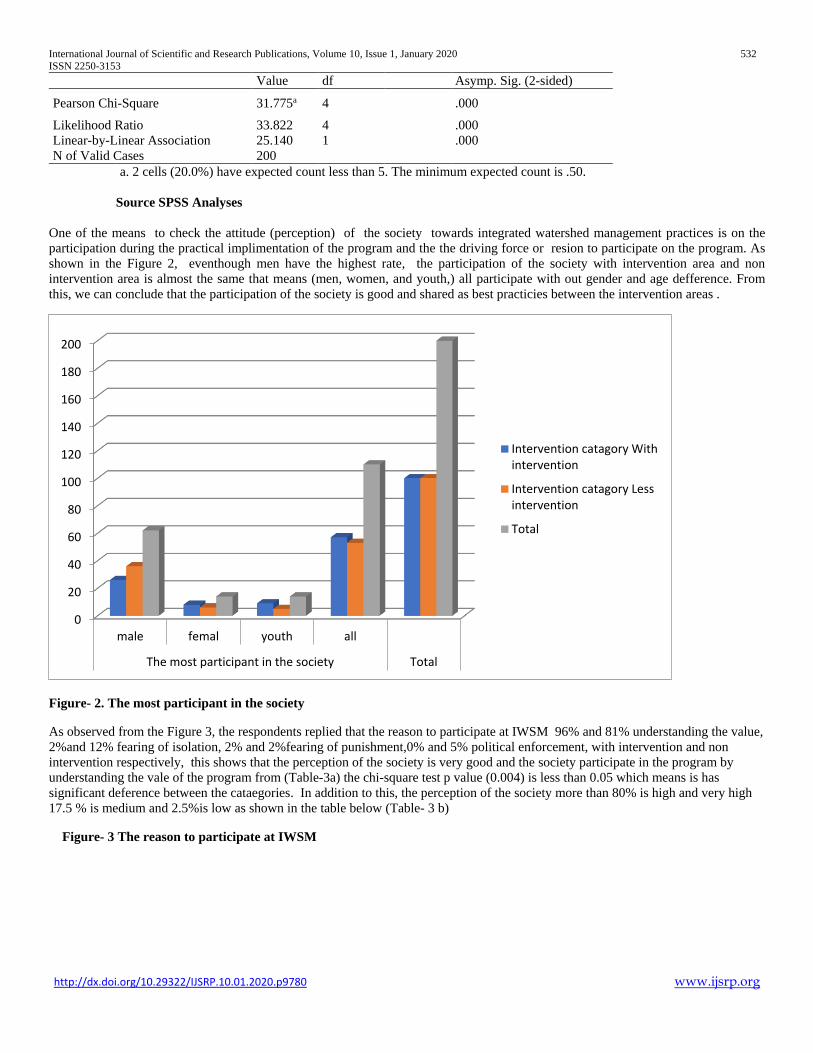
International Journal of Scientific and Research Publications, Volume 10, Issue 1, January 2020 532
ISSN 2250-3153
http://dx.doi.org/10.29322/IJSRP.10.01.2020.p9780 www.ijsrp.org
Value df Asymp. Sig. (2-sided)
Pearson Chi-Square 31.775a 4
.000
Likelihood Ratio 33.822 4 .000
Linear-by-Linear Association 25.140 1 .000
N of Valid Cases 200
a. 2 cells (20.0%) have expected count less than 5. The minimum expected count is .50.
Source SPSS Analyses
One of the means to check the attitude (perception) of the society towards integrated watershed management practices is on the
participation during the practical implimentation of the program and the the driving force or resion to participate on the program. As
shown in the Figure 2, eventhough men have the highest rate, the participation of the society with intervention area and non
intervention area is almost the same that means (men, women, and youth,) all participate with out gender and age defference. From
this, we can conclude that the participation of the society is good and shared as best practicies between the intervention areas .
Figure- 2. The most participant in the society
As observed from the Figure 3, the respondents replied that the reason to participate at IWSM 96% and 81% understanding the value,
2%and 12% fearing of isolation, 2% and 2%fearing of punishment,0% and 5% political enforcement, with intervention and non
intervention respectively, this shows that the perception of the society is very good and the society participate in the program by
understanding the vale of the program from (Table-3a) the chi-square test p value (0.004) is less than 0.05 which means is has
significant deference between the cataegories. In addition to this, the perception of the society more than 80% is high and very high
17.5 % is medium and 2.5%is low as shown in the table below (Table- 3 b)
Figure- 3 The reason to participate at IWSM
0
20
40
60
80
100
120
140
160
180
200
male femal youth all
The most participant in the society Total
Intervention catagory Withintervention
Intervention catagory Lessintervention
Total
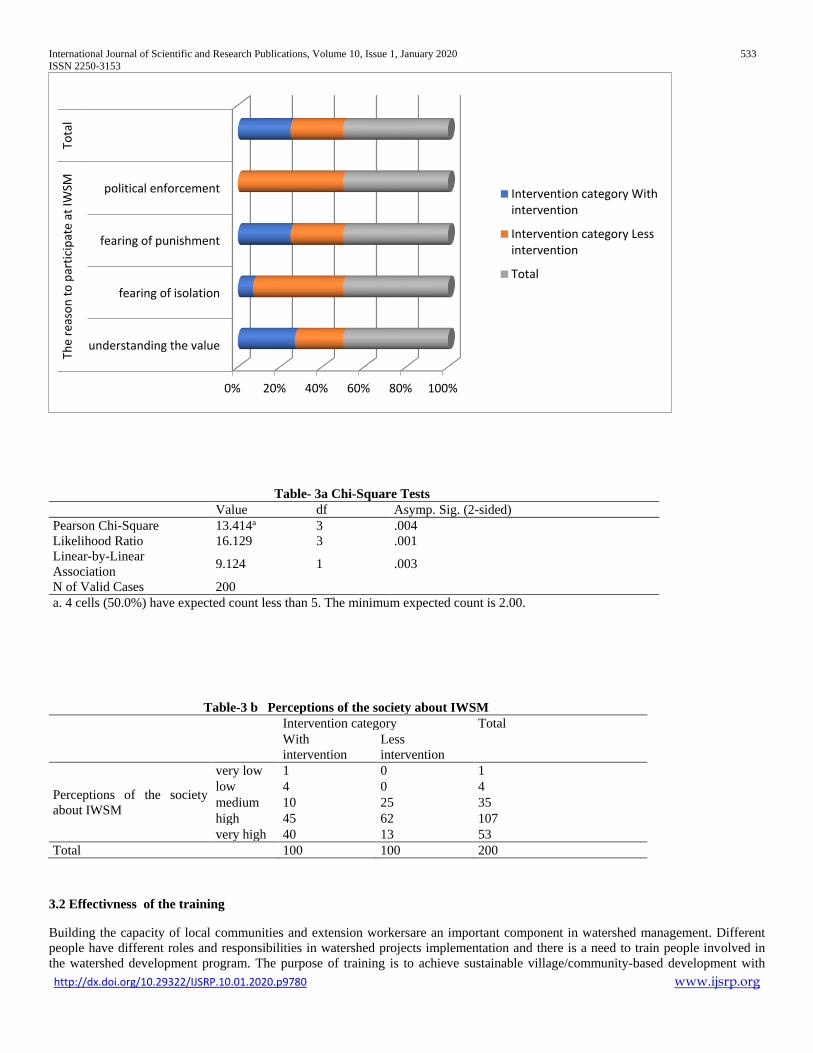
International Journal of Scientific and Research Publications, Volume 10, Issue 1, January 2020 533
ISSN 2250-3153
http://dx.doi.org/10.29322/IJSRP.10.01.2020.p9780 www.ijsrp.org
Table- 3a Chi-Square Tests
Value df Asymp. Sig. (2-sided)
Pearson Chi-Square 13.414a 3 .004
Likelihood Ratio 16.129 3 .001
Linear-by-Linear
Association 9.124 1 .003
N of Valid Cases 200
a. 4 cells (50.0%) have expected count less than 5. The minimum expected count is 2.00.
3.2 Effectivness of the training
Building the capacity of local communities and extension workersare an important component in watershed management. Different
people have different roles and responsibilities in watershed projects implementation and there is a need to train people involved in
the watershed development program. The purpose of training is to achieve sustainable village/community-based development with
0% 20% 40% 60% 80% 100%
understanding the value
fearing of isolation
fearing of punishment
political enforcement
The
reas
on
to
par
tici
pat
e at
IWSM
Tota
l
Intervention category Withintervention
Intervention category Lessintervention
Total
Table-3 b Perceptions of the society about IWSM
Intervention category Total
With
intervention
Less
intervention
Perceptions of the society
about IWSM
very low 1 0 1
low 4 0 4
medium 10 25 35
high 45 62 107
very high 40 13 53
Total 100 100 200
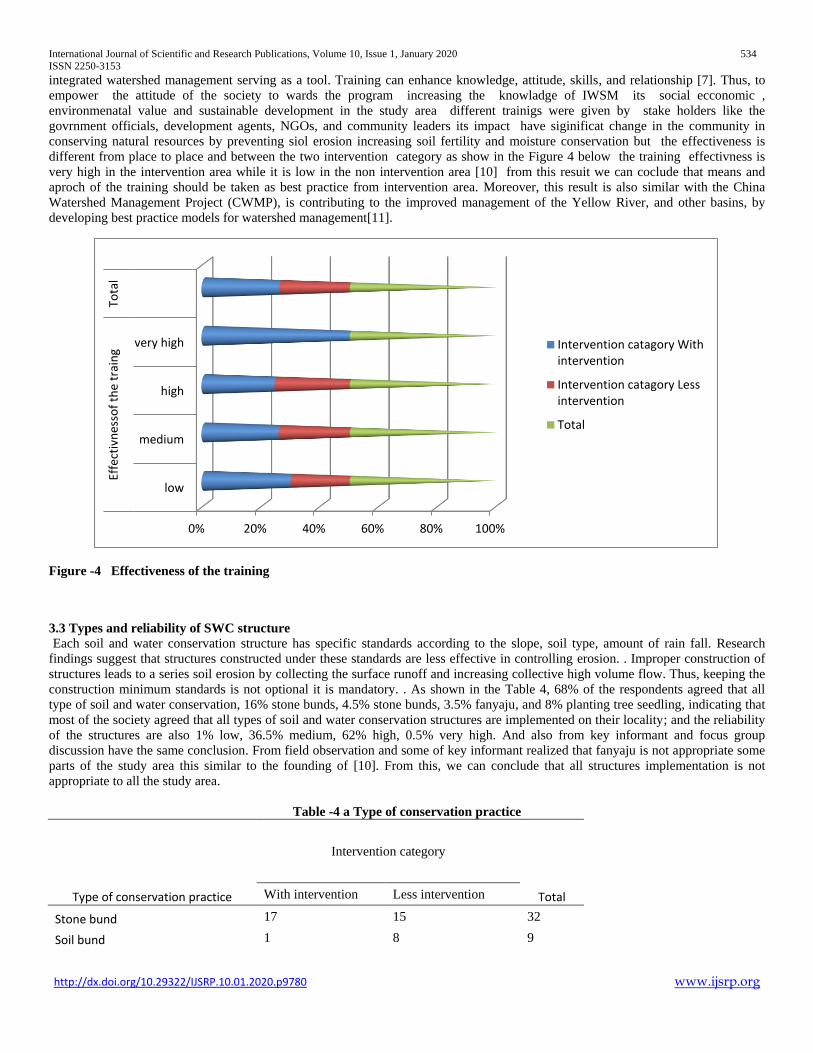
International Journal of Scientific and Research Publications, Volume 10, Issue 1, January 2020 534
ISSN 2250-3153
http://dx.doi.org/10.29322/IJSRP.10.01.2020.p9780 www.ijsrp.org
integrated watershed management serving as a tool. Training can enhance knowledge, attitude, skills, and relationship [7]. Thus, to
empower the attitude of the society to wards the program increasing the knowladge of IWSM its social ecconomic ,
environmenatal value and sustainable development in the study area different trainigs were given by stake holders like the
govrnment officials, development agents, NGOs, and community leaders its impact have siginificat change in the community in
conserving natural resources by preventing siol erosion increasing soil fertility and moisture conservation but the effectiveness is
different from place to place and between the two intervention category as show in the Figure 4 below the training effectivness is
very high in the intervention area while it is low in the non intervention area [10] from this resuit we can coclude that means and
aproch of the training should be taken as best practice from intervention area. Moreover, this result is also similar with the China
Watershed Management Project (CWMP), is contributing to the improved management of the Yellow River, and other basins, by
developing best practice models for watershed management[11].
Figure -4 Effectiveness of the training
3.3 Types and reliability of SWC structure
Each soil and water conservation structure has specific standards according to the slope, soil type, amount of rain fall. Research
findings suggest that structures constructed under these standards are less effective in controlling erosion. . Improper construction of
structures leads to a series soil erosion by collecting the surface runoff and increasing collective high volume flow. Thus, keeping the
construction minimum standards is not optional it is mandatory. . As shown in the Table 4, 68% of the respondents agreed that all
type of soil and water conservation, 16% stone bunds, 4.5% stone bunds, 3.5% fanyaju, and 8% planting tree seedling, indicating that
most of the society agreed that all types of soil and water conservation structures are implemented on their locality; and the reliability
of the structures are also 1% low, 36.5% medium, 62% high, 0.5% very high. And also from key informant and focus group
discussion have the same conclusion. From field observation and some of key informant realized that fanyaju is not appropriate some
parts of the study area this similar to the founding of [10]. From this, we can conclude that all structures implementation is not
appropriate to all the study area.
Table -4 a Type of conservation practice
Type of conservation practice
Intervention category
Total With intervention Less intervention
Stone bund 17 15 32
Soil bund 1 8 9
0% 20% 40% 60% 80% 100%
low
medium
high
very high
Effe
ctiv
nes
sof
the
trai
ng
Tota
l
Intervention catagory Withintervention
Intervention catagory Lessintervention
Total

International Journal of Scientific and Research Publications, Volume 10, Issue 1, January 2020 535
ISSN 2250-3153
http://dx.doi.org/10.29322/IJSRP.10.01.2020.p9780 www.ijsrp.org
water Fanyajuu 3 4 7
conservation planting tree seedling 6 10 16
all 73 63 136
total 100 100 200
3.4 Maintenance responsibility, timing, and management of the structure
As shown in the figure 5 and Table 5a, the sustainability of SWC depends on who takes the responsibility to maintain the structures at
a regular time. From the household survey, 83.6% household leaders, 8% development agents, 8% NGOs, and 0.4% others agreed that
the responsibility is taken by households. However, when we analyze the maintenance time 80.4% of the respondents replied that the
maintaining time is occasional 10.6% regular and 9% replied as unknown, this shows that the society accept the responsibility to
maintain and manage the soil and water conservation by themselves but there is series problem on maintain the structures regularly,
this is the same conclusion with focus group discussions and key informant interviews. This is towing to the problem that the district
agricultural office mainly focus on the expansion of the SWC rather than maintaining the structures at regular time, which is the same
to [12] found poor structure maintenance in Campaign works watershed Management
Table- 5 a Who takes maintenance responsibility * Intervention category
Intervention category Total
With
intervention
Less
intervention
Who takes maintenance
responsibility
household leaders 99 59 158
development agent 1 14 15
NGOs 0 15 15
others 0 1 1
Total 100 89 189
Figure -5 Who take maintenance responsibility
Table- 4 b Reliability the structure * Intervention category
Intervention category Total
With intervention Less intervention
Reliability the structure
low 0 2 2
medium 36 37 73
high 63 61 124
very high 1 0 1
Total 100 100 200
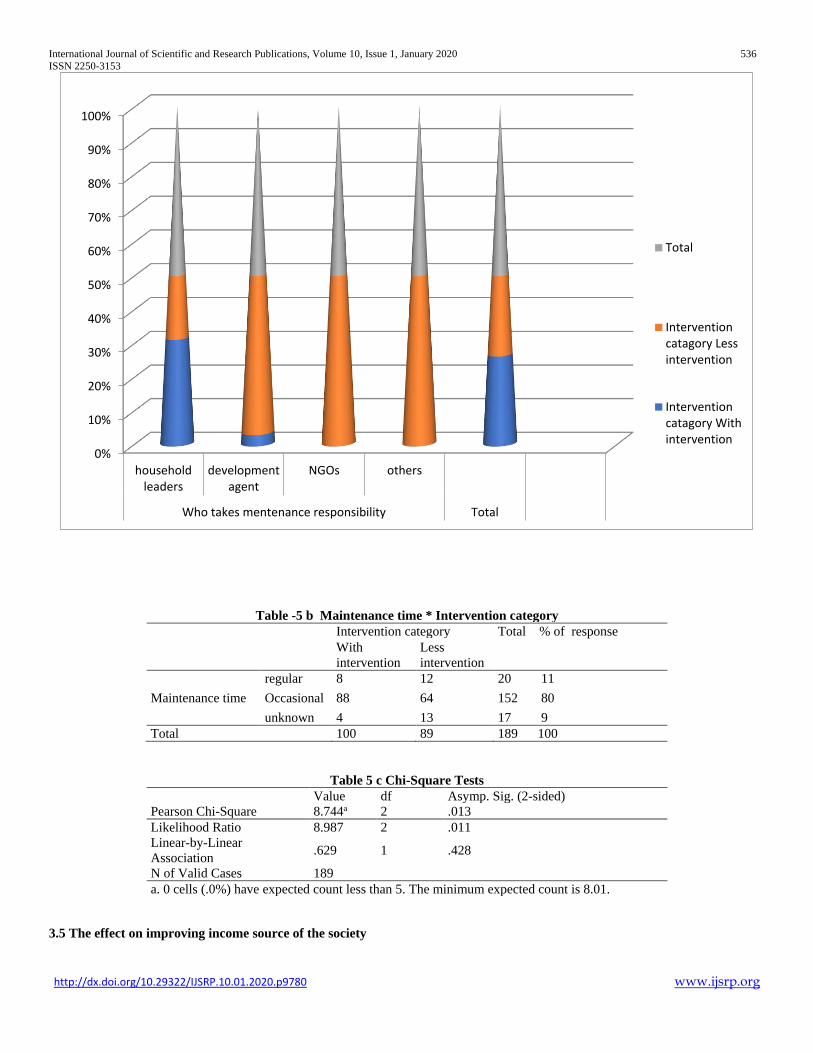
International Journal of Scientific and Research Publications, Volume 10, Issue 1, January 2020 536
ISSN 2250-3153
http://dx.doi.org/10.29322/IJSRP.10.01.2020.p9780 www.ijsrp.org
Table -5 b Maintenance time * Intervention category
Intervention category Total % of response
With
intervention
Less
intervention
Maintenance time
regular 8 12 20 11
Occasional 88 64 152 80
unknown 4 13 17 9
Total 100 89 189 100
Table 5 c Chi-Square Tests
Value df Asymp. Sig. (2-sided)
Pearson Chi-Square 8.744a 2 .013
Likelihood Ratio 8.987 2 .011
Linear-by-Linear
Association .629 1 .428
N of Valid Cases 189
a. 0 cells (.0%) have expected count less than 5. The minimum expected count is 8.01.
3.5 The effect on improving income source of the society
0%
10%
20%
30%
40%
50%
60%
70%
80%
90%
100%
householdleaders
developmentagent
NGOs others
Who takes mentenance responsibility Total
Total
Interventioncatagory Lessintervention
Interventioncatagory Withintervention
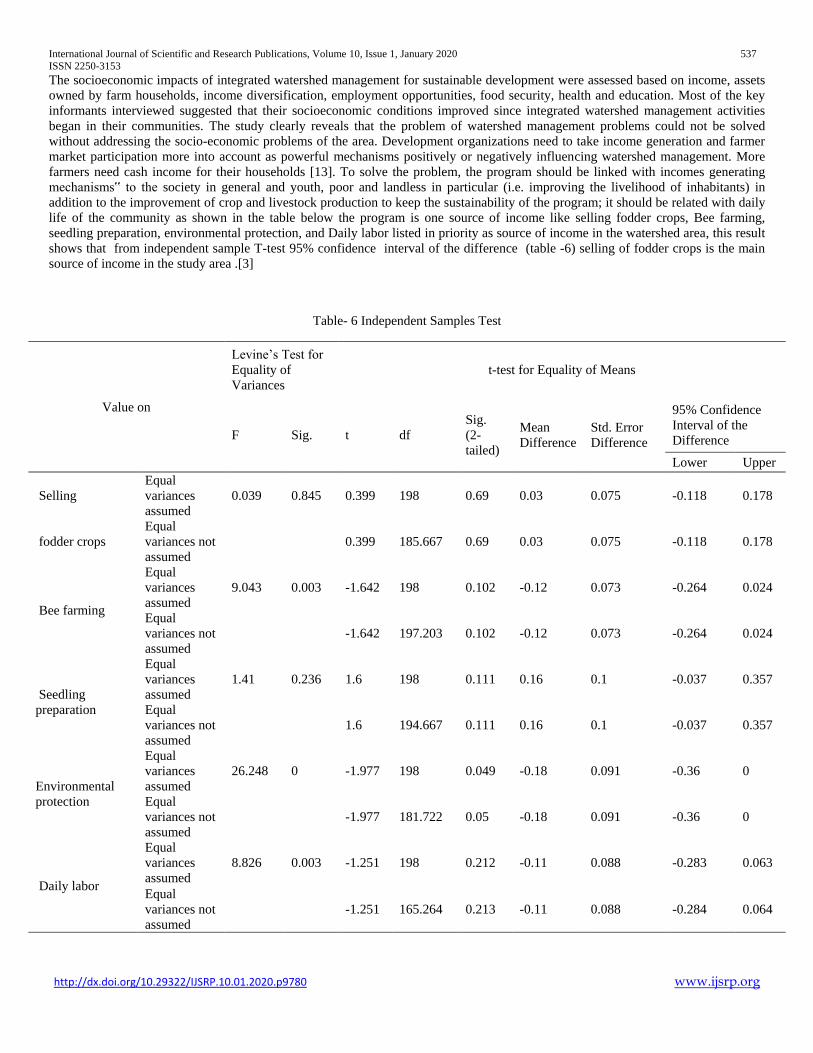
International Journal of Scientific and Research Publications, Volume 10, Issue 1, January 2020 537
ISSN 2250-3153
http://dx.doi.org/10.29322/IJSRP.10.01.2020.p9780 www.ijsrp.org
The socioeconomic impacts of integrated watershed management for sustainable development were assessed based on income, assets
owned by farm households, income diversification, employment opportunities, food security, health and education. Most of the key
informants interviewed suggested that their socioeconomic conditions improved since integrated watershed management activities
began in their communities. The study clearly reveals that the problem of watershed management problems could not be solved
without addressing the socio-economic problems of the area. Development organizations need to take income generation and farmer
market participation more into account as powerful mechanisms positively or negatively influencing watershed management. More
farmers need cash income for their households [13]. To solve the problem, the program should be linked with incomes generating
mechanisms‟ to the society in general and youth, poor and landless in particular (i.e. improving the livelihood of inhabitants) in
addition to the improvement of crop and livestock production to keep the sustainability of the program; it should be related with daily
life of the community as shown in the table below the program is one source of income like selling fodder crops, Bee farming,
seedling preparation, environmental protection, and Daily labor listed in priority as source of income in the watershed area, this result
shows that from independent sample T-test 95% confidence interval of the difference (table -6) selling of fodder crops is the main
source of income in the study area .[3]
Table- 6 Independent Samples Test
Value on
Levine’s Test for
Equality of
Variances
t-test for Equality of Means
F Sig. t df
Sig.
(2-
tailed)
Mean
Difference
Std. Error
Difference
95% Confidence
Interval of the
Difference
Lower Upper
Selling
Equal
variances
assumed
0.039 0.845 0.399 198 0.69 0.03 0.075 -0.118 0.178
fodder crops
Equal
variances not
assumed
0.399 185.667 0.69 0.03 0.075 -0.118 0.178
Bee farming
Equal
variances
assumed
9.043 0.003 -1.642 198 0.102 -0.12 0.073 -0.264 0.024
Equal
variances not
assumed
-1.642 197.203 0.102 -0.12 0.073 -0.264 0.024
Seedling
preparation
Equal
variances
assumed
1.41 0.236 1.6 198 0.111 0.16 0.1 -0.037 0.357
Equal
variances not
assumed
1.6 194.667 0.111 0.16 0.1 -0.037 0.357
Environmental
protection
Equal
variances
assumed
26.248 0 -1.977 198 0.049 -0.18 0.091 -0.36 0
Equal
variances not
assumed
-1.977 181.722 0.05 -0.18 0.091 -0.36 0
Daily labor
Equal
variances
assumed
8.826 0.003 -1.251 198 0.212 -0.11 0.088 -0.283 0.063
Equal
variances not
assumed
-1.251 165.264 0.213 -0.11 0.088 -0.284 0.064

International Journal of Scientific and Research Publications, Volume 10, Issue 1, January 2020 538
ISSN 2250-3153
http://dx.doi.org/10.29322/IJSRP.10.01.2020.p9780 www.ijsrp.org
3.6 Its effect on surface water availability and expansion of irrigation
The implementation of IWSM in the study area has great impact on the availability of surface and ground water and it leads to the
expansion of irrigation The local communities categorized the availability of water into four classes: namely, very low , low,
medium, and high .
The presence of water sources, the volume of water sources, its nearness to the settlement and constant flow rate of the water sources
were the main criteria locally used to categorize the availability of water resources in the study area. According to respondents, the
area which has several water sources with continuous flow rate and nearest to the settlement is characterized as high. On the other
hand, if the area has no several water sources, fluctuated flow rate and far away from the settlement, the water availability is
considered as low. Moreover, if the case is in between the above two category the water availability is termed as medium if it is series
problem they termed as very low.
Most of respondent in the intervention area rated water availability as high, while non-intervention site as medium. The result
observed indicates statistically significant variation between the two intervention categories of areas in water availability. The
availability of water in the less/non intervention area is less than the intervention one. Moreover, from group discussion and all key
informants from the intervention micro watershed also expressed that the soil and water conservation structures constructed on
farmland have contributed to the water from rainfall to be enter in the soil rather than being runoff, and it increased the soil moisture
content. These indicate that the intervention has positive contribution for the improvement of water availability in the area. This result
is similar with findings of [14] in India. The impact of watershed management on subsurface water availability developed springs,
shallow and hand-dug wells, hand-dug wells and water harvesting pond although the level of changes varies from watershed to
watershed. From the respondents,focus group discussion, key informant , and field observation founded that groundwater can be
found at depths of less than 8-12 m, as compared to depths of more than 25- 50 m prior to watershed management interventions. This
leads the farmers to expand the irrigation system in the study area and have significant change in food security. The impact is more
visible on groundwater recharge than surface runoff this result is similar to [15]
3.7 The effect on improving soil fertility and crop production
Agriculture is the main income source of the community in the study area. Mixed farming which involves crop production and animal
husbandry is adopted by all farmers. Crop production in the area includes the production of staple food crops, cash crops and cereal
crops. The survey result depicted that majority of the respondents in both sites categorized their land soil fertility is improved time to
time due to the fact that replied as great change in crop production in general [16] . Empowering farmers to have how to alleviate
degradation and how to maintain sustainability of natural resources through training has a great contribution in conserving watershed
resources. The survey result indicated that most of the respondents agreed the advantage of soil and water conservation structure on
their watershed catchments. Out of the selected respondents more than 99% of them address that soil and water conservation
structures have positive impact by improving their land through preventing erosion, increase soil depth, enhancing land productivity,
and, moisture conservation. The study conducted in Amhara Region by [17] also indicated that the participants had evaluated the soil
and water conservation works as good. Similarly, 95% have believed there were differences between conserved and none conserved
areas in terms of soil erosion problems and productivity. Farmers emphasized that their conserved farm cachments are more fertile
than the non-conserved ones since the latter are more disposed to soil erosion than the former. In similar study conducted Gunano
watershed of Wolaita southern Ethiopia farmers perceive that soil bunds improve the fertility of the soil and then increase yield [18].
3.8 Impact on Sustainable development
Sustainable development is a development that meets the desires of the present without compromising the capability of next-
generation to meet their own need .It is not so easy to realize and answering the key components of IWSM interventions for the
future generation , therefore, it is the time to create the actual research basis and do act depending on it for the future generation of
IWSM for sustainable development issues[19]. Improving the lives of a few hundreds or even thousands of farmers does not
necessarily amount to generating sustainable development. Likewise, conserving the soil in thousands of plots does not automatically
amount to managing and rehabilitating the whole watershed. The only hope of achieving a lasting impact with relatively modest funds
is to foster development which starts something that will continue to grow and spread on its own. This contrasts with many current
projects that continue to provide inputs but do not aim for self-perpetuating growth. Projects need to limit themselves to practices that
are of such benefit to the farmer that s/he will continue them on his/her own and his/her neighbors will emulate, and will continue to
change the landscape, even long after the project itself or other assistance promoting the practice has ended [13] to achieve this goal
the attitude of the society for future generation has great impact on the other hand, as shown in the table -7 below the sustainability
issues of the watershed plans and technologies implementation in both intervention and non-intervention is almost the same 46.% very
high ,44% high ,9% medium ,0.5% low, and 0.5% very low .This result show that 90% of the respondents replied that participating

International Journal of Scientific and Research Publications, Volume 10, Issue 1, January 2020 539
ISSN 2250-3153
http://dx.doi.org/10.29322/IJSRP.10.01.2020.p9780 www.ijsrp.org
in integrated watershed management program highly increased the attitude of the society to work for future generation in sustainable
way this is the same conclusion with key informants and focus group discussions .From this we can concluded that the
implementation of IWSM has significant contributes for the sustainable development of the study area .this is the same result found
[20]
Table -7 The value of thinking for sustainability
Intervention category Total % share
With intervention Less intervention
The value of thinking for
sustainability
very low 1 0 1 0.5
low 0 1 1 0.5
medium 11 8 19 9
high 49 39 88 44
very high 39 52 91 46
Total 100 100 200 100
4. Conclusions
The watershed management intervention in Meskan district was effective in several aspects; mean while it has also the components in
which the implementation has unsatisfactory achievements. The findings indicated that the watershed management intervention
brought decreasing soil erosion, enhance soil fertility, increasing of crop and livestock production, improvement of surface and
ground water availability, and development of vegetation cover and improve income source of the society specially for youth and
landless and create positive attitudinal change on the society about sustainable development in its intervention area.
The participation status of communities in watershed management was good. The structural arrangement of the institution was
participatory; most of community leaders at lower level is committed to take their responsibility .But, some administrative bodies of
the local area instead of dedicating their effort for the community development through sustainable IWSM they have their own
motives and concerns like securing authority for long period of time.
Most of introduced physical soil and water conservation structures are appropriate for the area .that means in most micro-watersheds,
structure selection, design, construction, and spacing were appropriate. However, in some micro-watersheds errors need correcting,
such as; too long bunds without space for land users to move across farmland, bunds with narrow berms, poor stone bund
foundations,and shallow channel depth . Moreover, the effort that exerted to repair the broken/sediment filled/ structures is poor in
some area and needs attention, which affect the long term fate of these structures However, the implemented structures layouts were
not related with the standards. Besides to the limitation on layouts of the structures, the diversity of implemented structure was also
having some problems. And also, the management of implemented SWC structures with regular maintenance was not practiced in the
area. In spite of having the limitations due to many reasons, the overall evaluation showed that IWSM intervention for sustainable
development has effective achievements in the area.
5. Recommendations
The local communities are expected to devote themselves for the success of IWSM interventions for sustainabie
development.
The government of the district is expected to develop the knowledge, skill, and capacity of,the society , community leaders,
community facilitators,in relation to IWSMfor sustainable development through capacity building.
The soil and water conservation structures should be maintained with a regular time and the implementation should be
related with the standard.
The current watershed management approaches mostly focuses on physical part of the implementation /soil and water
conservation/, rather than integrating the biological part, but effective watershed management requires multidisciplinary and
innovative approaches based on the local situation.
Comprehensive baseline survey of the IWSM is needed before onset of the watershed activities at watershed level to expand
best practices of the impact of the intervention.
Furthermore, interdisciplinary study for related to sustainable development is recommended to be done in the same study
area or elsewhere in the region to provide empirical evidences for the country situation.

International Journal of Scientific and Research Publications, Volume 10, Issue 1, January 2020 540
ISSN 2250-3153
http://dx.doi.org/10.29322/IJSRP.10.01.2020.p9780 www.ijsrp.org
In addition to increasing the vegetation cover by expanding the plantation approach shouid be one source income focusing
on edible fruit, and select tree seedling
Acknowledgements
This work was supported by Major Science and Technology Program for Water Pollution Control and Treatment (2017ZX07207004)
and National Natural Science Foundation of China (21603164), Tongji University, And all institutions and individuals. I highly
appreciate the support from Tongji University& UNEP Tongji institute of environment and sustainable development, and
International student office.
And also, I would like to extend my thanks to SNNPR Youth and Sport Bureau for transport and stationary support and Meskan
district agriculture office, development agents, and kebele leaders who take the full responsibility and commitment to facilitate
informants for data collection. Finally, I would also like to thank my advisor for his unfailing guidance and his kind support.
References
1. Tiki, L., M. Tadesse, and F. Yimer, Effects of integrating different soil and water conservation measures into hillside area closure on selected soil
properties in Hawassa Zuria District, Ethiopia. Journal of Soil Science and Environmental Management, 2015. 6(10): p. 268-274.
2. Haileslassie, A., et al., Assessment of soil nutrient depletion and its spatial variability on smallholders’ mixed farming systems in Ethiopia using partial
versus full nutrient balances. Agriculture, ecosystems & environment, 2005. 108(1): p. 1-16.
3. Habtamu, T., Assessment of sustainable watershed management approach case study lenche dima, tsegur eyesus and dijjil watershed. A Project Paper
Presented to the Faculty of the Graduate School of Cornell University in Partial Fulfillment of the Requirements for the Degree of Master of Professional
Studies, 2011.
4. Wolancho, K.W., Evaluating watershed management activities of campaign work in Southern nations, nationalities and peoples’ regional state of Ethiopia.
Environmental Systems Research, 2015. 4(1): p. 6.
5. Gebregziabher, G., et al., An assessment of integrated watershed management in Ethiopia. Vol. 170. 2016: International Water Management Institute
(IWMI).
6. Ontario, C., Valuing benefits from watershed management a supplement to the report" The importance of watershed management in protecting Ontario's
drinking water supplies": a submission to the Walkerton Inquiry on behalf of Conservation Ontario. 2001.
7. Desta, L., et al., Community-based participatory watershed development. a guideline. annex. 2005.
8. Wolka, K., A. Moges, and F. Yimer, Farmers’ perception of the effects of soil and water conservation structures on crop production: The case of Bokole
watershed, Southern Ethiopia. African journal of environmental science and technology, 2013. 7(11): p. 990-1000.
9. Wani, S.P. and K.K. Garg, Watershed management concept and principles. 2009.
10. Meshesha, Y.B. and B.S. Birhanu, Assessment of the effectiveness of watershed management intervention in Chena Woreda, Kaffa Zone, Southwestern
Ethiopia. Journal of Water Resource and Protection, 2015. 7(15): p. 1257.
11. YONGGONG, L., Challenges and lessons learnt. Wagging the dragon’s tail: emerging practices in participatory poverty reduction in China, 2011: p. 104.
12. Weldemariam, D., et al., Farmers’ perceptions’ and participation on Mechanical soil and water conservation techniques in Kembata Tembaro Zone: the
Case of Kachabirra Woreda, Ethiopia. International Journal of Advanced Structures and Geotechnical Engineering, 2013. 2(4): p. 118-131.
13. Perez, C. and H. Tschinkel, Improving watershed management in Developing Countries: A framework for prioritising Sites and practices. 2003: London,
England: Overseas Development Institute. Agricultural Research and ….
14. Singh, P., H. Behera, and A. Singh, Impact and effectiveness of ‘watershed development programmes’ in India. Mussorrie India Centre Rural Stud, 2010.
29: p. 1-55.
15. Bekele, A., A. Aticho, and E. Kissi, Assessment of community based watershed management practices: emphasis on technical fitness of physical structures
and its effect on soil properties in Lemo district, Southern Ethiopia. Environmental Systems Research, 2018. 7(1): p. 20.
16. Gebrehaweria, G., et al., An assessment of integrated watershed management in Ethiopia. IWMI Working Paper, 2016(170).
17. Addisu, H., M. Hailu, and W. Zewdu, Indigenous chicken production system and breeding practice in North Wollo, Amhara Region, Ethiopia. Poultry,
Fisheries & Wildlife Sciences, 2013.
18. Vancampenhout, K., et al., Stone bunds for soil conservation in the northern Ethiopian highlands: Impacts on soil fertility and crop yield. Soil and Tillage
Research, 2006. 90(1-2): p. 1-15.
19. TANAKA, T. Methodology of integrated watershed management for sustainable water resources use. in Proc. Int. Workshop on Integrated Watershed
Management for Sustainable Water Use in a Humid Tropical Region, Bull. Terrestrial Environment Research Center, University of Tsukuba. 2008.
20. Bhowmik, D., Financial crises, US shut down and FDI. Political Economy Journal of India, 2017. 26(1): p. 35.
Abbreviations
IWSM Integrated watershed management
CSA - central statistics agency
KEBELE- Lower administrative structure of the country

International Journal of Scientific and Research Publications, Volume 10, Issue 1, January 2020 541
ISSN 2250-3153
http://dx.doi.org/10.29322/IJSRP.10.01.2020.p9780 www.ijsrp.org
SNNPR-Southern Nation Nationalities Peoples Region
SWC-Soil and Water Conservation
First Author-- Wunde Sebsibe Teka, Master candidate, Tongji University, UN Environment-Tongji Institute of Environment for
Sustainable Development (IESD): College of Environmental Science and Engineering; Email [email protected]: Phone No
+86 13262761617; Address: 1299 Siping Road, Shanghai 200092, China
Second Author – Haochen Zhu, Mentor and Supervisor, Tongji University, UN Environment-Tongji Institute of Environment for
Sustainable Development (IESD); College of Environmental Science and Engineering: Email [email protected]; Phone No
+86 13621945080; Address: 1239 Siping Road, Shanghai 200092, China
Third Author—Mehari Mariye expert ,Environmental and Forest Research institute Ethiopia ,Addis Ababa,Phon No +251993943248
Fourth Author—Nure Muhammedamin Ebrahim, Master candidate, Tongji University, UN Environment-Tongji Institute of
Environment for Sustainable Development (IESD): College of Environmental Science and Engineering; Email mamezamu
@gmail.com: Phone No +8619946253892; Address: 1299 Siping Road, Shanghai 200092, China
Fifth Author—Beyene Yonas Kidane, Master candidate, Tongji University, UN Environment-Tongji Institute of Environment for
Sustainable Development (IESD): College of Environmental Science and Engineering; Email [email protected]: Phone No
+8619946255103; Address: 1299 Siping Road, Shanghai 200092, China
Corresponding Author – Haochen Zhu, Mentor and Supervisor, Tongji University, UN Environment-Tongji Institute of
Environment for Sustainable Development (IESD); College of Environmental Science and Engineering: Email
[email protected]; Phone No +86 13621945080; Address: 1239 Siping Road, Shanghai 200092, China
International Journal of Scientific and Research Publications, Volume 10, Issue 1, January 2020 542
ISSN 2250-3153
http://dx.doi.org/10.29322/IJSRP.10.01.2020.p9781 www.ijsrp.org
Assessing Barriers To Household Waste Recycling: A
Case Study Of Coventry University Postgraduate
Students
Jatau Sarah and Binbol N.L
Geography and Planning Department, University of Jos, Nigeria
DOI: 10.29322/IJSRP.10.01.2020.p9781
http://dx.doi.org/10.29322/IJSRP.10.01.2020.p9781
Abstract- Household waste recycling requires the participation of
all individuals which include student’s population who are
transient in nature but contribute largely to waste generation. A
case study of Coventry University Postgraduate (CUPG) students,
with the objective to identify the barriers facing these group of
students. To give every student an equal opportunity of selection,
simple random sampling was used for data collection. To get at
least 100 responses, a number of 150 CUPG students were
sampled, using questionnaires as a tool for data collection. Out of
150 questionnaires administered, 128 questionnaires were
retrieved. SPSS was used for data analysis to identify the various
barriers that CUPG students face in recycling household waste.
Findings obtained show that behaviour and attitude barrier are
interdependent on knowledge barrier as results reveal that
although 67% are in the habit of recycling, 82% are too busy to
sort out their recyclables (Behaviour Barrier) and 85% are of the
opinion that they will recycle more if they understand the benefit
of recycling (Attitude Barrier); majority of the students (93%)
were in need of bigger bins and more storage space for their bins
(Situational barrier). Emphasis was made on knowledge barrier
being a major challenge therefore, this study recommends the need
for more awareness for students to understand the need and benefit
of recycling.
Index Terms- Household Wastes, Recycling barriers, Transient
Students, Awareness level, Recycling habits, Postgraduate
Students
I. INTRODUCTION
ouse of Commons (2014) report on waste management in
England reported that approximately 177 million tonnes of
waste is discarded yearly in England. 22.6million tonnes of the
total waste discarded are household waste, which weighs
averagely 423kg waste per person. Discarding this amount of
waste shows poor waste consumption which has negative impact
on the environment. House of Commons (2014) identified
household waste recycling to be a top priority in recovering back
lost resources.
Increased recycling is a vital way of mitigating waste
generation as it reduces dependency on landfill which is
detrimental to the environment and leads to air pollution,
groundwater contamination, methane emissions and increase in
resource loss Hershkowitz, (1997) and WRAP (2010a). According
to WRAP (2008) effective recycling has a link with individual
participation. Four basic barriers were identified that are likely to
hinder public participation in recycling: Knowledge, Behavioural,
Attitude and Situational barrier. Perrin and Barton (2001) pointed
out the key barrier as knowledge barrier. Their survey on two
kerbsides identified the main reason given by respondents before
scheme implementation were lack of time and inconvenience, of
which after implementing the scheme, the participation level of
individuals increased by half the population compared to the
previous scheme. According to WRAP (2008) knowledge barrier
could be seen as a challenge, as there could be poor understanding
on why people should recycle. This was further agreed by (Mori
2002) survey which identified that people are unaware of
recycling and its importance. Furthermore, DEFRA (2002); Mee
et al. (2004) and Zen et al. (2014) also agree that storage space and
insufficient facilities are possible factors that limit household
waste recycling. In addition, Hernandez et al. (1999) in Ecuador
ascertained that economic incentives to sell recyclables are a
motivating factor to individuals especially to those who earn a low
income thus enhancing their attitude towards recycling.
The University population is a large, transient group which
significantly contributes to the environment. Assessing their
behaviour and attitude towards the environment is imperative in
enhancing recycling rate and similarly reducing waste generation.
Adomssent (2013), Corcoran and Wals (2004) opined that higher
institutions have key roles to play towards effective recycling rate.
Based on previous studies, to enhance the recycling rate and
reduce waste generation. Students are special group of the public
that their recycling behaviour need to be explored. Studies by
Robertson and Wallington (2009) discovered that recycling
participation is centred on other populations with little or no
attention given to the younger population such as the University
Students. This propelled a study to investigate Oxford University
student’s behaviour on recycling.
Timlett and Williams (2009) studied the impact of transient
or temporary students on recycling using a survey of 1300
households. 40% of the households surveyed, lived in houses for
over three years which he termed as long-term residents and about
48% lived in houses for about a year or less. Based on the results
obtained from these two groups, the study concluded that the
longer the students live in a particular house the better their
recycling participation. It was further discovered that 21% out of
the 1300 households surveyed were students who live in rented
H
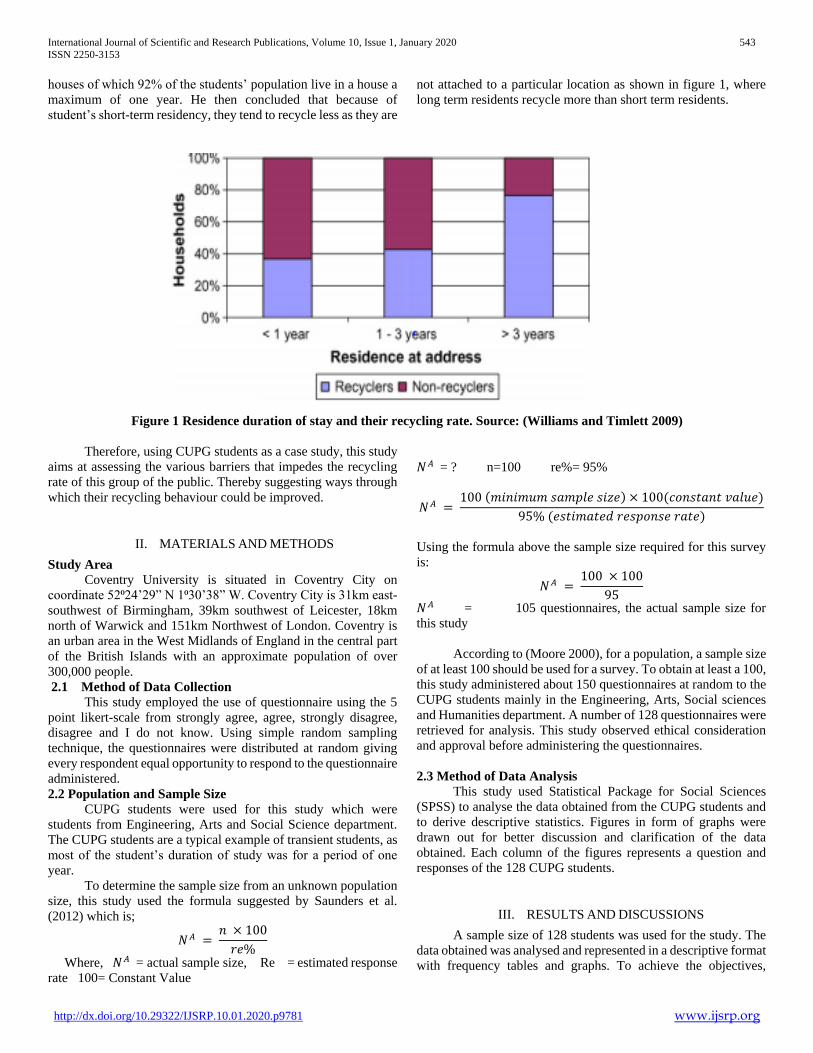
International Journal of Scientific and Research Publications, Volume 10, Issue 1, January 2020 543
ISSN 2250-3153
http://dx.doi.org/10.29322/IJSRP.10.01.2020.p9781 www.ijsrp.org
houses of which 92% of the students’ population live in a house a
maximum of one year. He then concluded that because of
student’s short-term residency, they tend to recycle less as they are
not attached to a particular location as shown in figure 1, where
long term residents recycle more than short term residents.
Figure 1 Residence duration of stay and their recycling rate. Source: (Williams and Timlett 2009)
Therefore, using CUPG students as a case study, this study
aims at assessing the various barriers that impedes the recycling
rate of this group of the public. Thereby suggesting ways through
which their recycling behaviour could be improved.
II. MATERIALS AND METHODS
Study Area
Coventry University is situated in Coventry City on
coordinate 52⁰24’29” N 1⁰30’38” W. Coventry City is 31km east-
southwest of Birmingham, 39km southwest of Leicester, 18km
north of Warwick and 151km Northwest of London. Coventry is
an urban area in the West Midlands of England in the central part
of the British Islands with an approximate population of over
300,000 people.
2.1 Method of Data Collection
This study employed the use of questionnaire using the 5
point likert-scale from strongly agree, agree, strongly disagree,
disagree and I do not know. Using simple random sampling
technique, the questionnaires were distributed at random giving
every respondent equal opportunity to respond to the questionnaire
administered.
2.2 Population and Sample Size
CUPG students were used for this study which were
students from Engineering, Arts and Social Science department.
The CUPG students are a typical example of transient students, as
most of the student’s duration of study was for a period of one
year.
To determine the sample size from an unknown population
size, this study used the formula suggested by Saunders et al.
(2012) which is;
𝑁𝐴 = 𝑛 × 100
𝑟𝑒%
Where, 𝑁𝐴 = actual sample size, Re = estimated response
rate 100= Constant Value
𝑁𝐴 = ? n=100 re%= 95%
𝑁𝐴 = 100 (𝑚𝑖𝑛𝑖𝑚𝑢𝑚 𝑠𝑎𝑚𝑝𝑙𝑒 𝑠𝑖𝑧𝑒) × 100(𝑐𝑜𝑛𝑠𝑡𝑎𝑛𝑡 𝑣𝑎𝑙𝑢𝑒)
95% (𝑒𝑠𝑡𝑖𝑚𝑎𝑡𝑒𝑑 𝑟𝑒𝑠𝑝𝑜𝑛𝑠𝑒 𝑟𝑎𝑡𝑒)
Using the formula above the sample size required for this survey
is:
𝑁𝐴 = 100 × 100
95
𝑁𝐴 = 105 questionnaires, the actual sample size for
this study
According to (Moore 2000), for a population, a sample size
of at least 100 should be used for a survey. To obtain at least a 100,
this study administered about 150 questionnaires at random to the
CUPG students mainly in the Engineering, Arts, Social sciences
and Humanities department. A number of 128 questionnaires were
retrieved for analysis. This study observed ethical consideration
and approval before administering the questionnaires.
2.3 Method of Data Analysis
This study used Statistical Package for Social Sciences
(SPSS) to analyse the data obtained from the CUPG students and
to derive descriptive statistics. Figures in form of graphs were
drawn out for better discussion and clarification of the data
obtained. Each column of the figures represents a question and
responses of the 128 CUPG students.
III. RESULTS AND DISCUSSIONS
A sample size of 128 students was used for the study. The
data obtained was analysed and represented in a descriptive format
with frequency tables and graphs. To achieve the objectives,
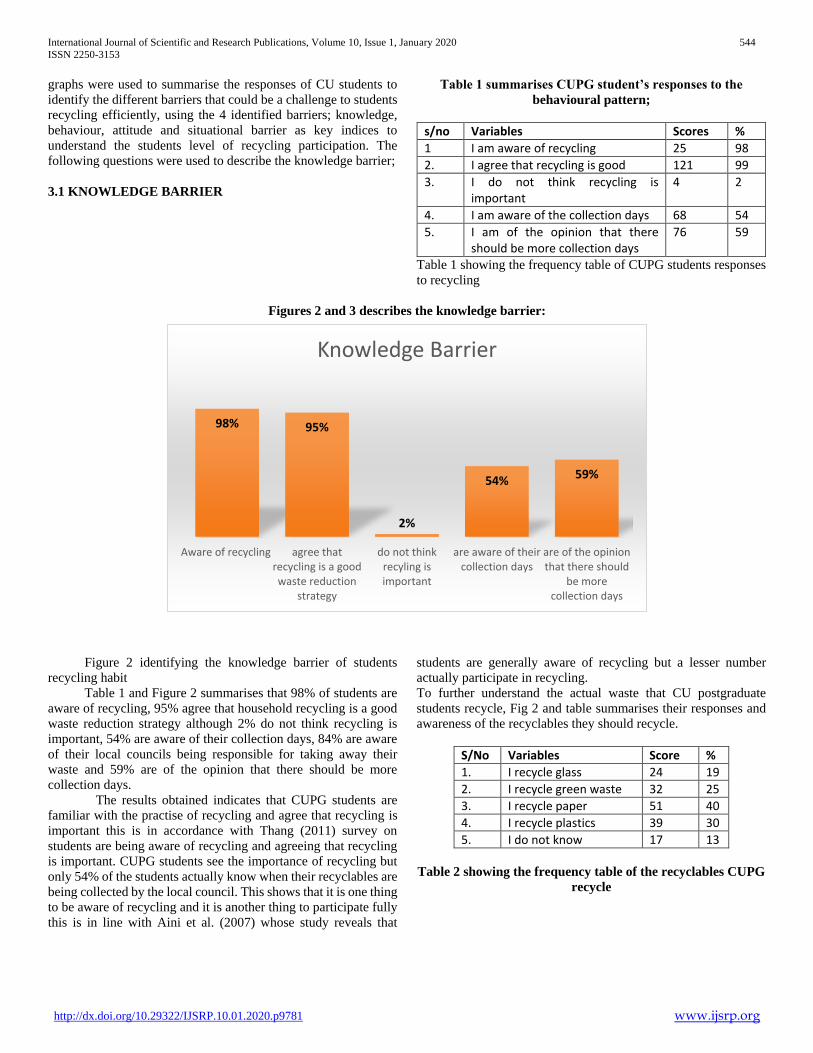
International Journal of Scientific and Research Publications, Volume 10, Issue 1, January 2020 544
ISSN 2250-3153
http://dx.doi.org/10.29322/IJSRP.10.01.2020.p9781 www.ijsrp.org
graphs were used to summarise the responses of CU students to
identify the different barriers that could be a challenge to students
recycling efficiently, using the 4 identified barriers; knowledge,
behaviour, attitude and situational barrier as key indices to
understand the students level of recycling participation. The
following questions were used to describe the knowledge barrier;
3.1 KNOWLEDGE BARRIER
Table 1 summarises CUPG student’s responses to the
behavioural pattern;
s/no Variables Scores %
1 I am aware of recycling 25 98
2. I agree that recycling is good 121 99
3. I do not think recycling is important
4 2
4. I am aware of the collection days 68 54
5. I am of the opinion that there should be more collection days
76 59
Table 1 showing the frequency table of CUPG students responses
to recycling
Figures 2 and 3 describes the knowledge barrier:
Figure 2 identifying the knowledge barrier of students
recycling habit
Table 1 and Figure 2 summarises that 98% of students are
aware of recycling, 95% agree that household recycling is a good
waste reduction strategy although 2% do not think recycling is
important, 54% are aware of their collection days, 84% are aware
of their local councils being responsible for taking away their
waste and 59% are of the opinion that there should be more
collection days.
The results obtained indicates that CUPG students are
familiar with the practise of recycling and agree that recycling is
important this is in accordance with Thang (2011) survey on
students are being aware of recycling and agreeing that recycling
is important. CUPG students see the importance of recycling but
only 54% of the students actually know when their recyclables are
being collected by the local council. This shows that it is one thing
to be aware of recycling and it is another thing to participate fully
this is in line with Aini et al. (2007) whose study reveals that
students are generally aware of recycling but a lesser number
actually participate in recycling.
To further understand the actual waste that CU postgraduate
students recycle, Fig 2 and table summarises their responses and
awareness of the recyclables they should recycle.
S/No Variables Score %
1. I recycle glass 24 19
2. I recycle green waste 32 25
3. I recycle paper 51 40
4. I recycle plastics 39 30
5. I do not know 17 13
Table 2 showing the frequency table of the recyclables CUPG
recycle
98% 95%
2%
54% 59%
Aware of recycling agree thatrecycling is a goodwaste reduction
strategy
do not thinkrecyling isimportant
are aware of theircollection days
are of the opinionthat there should
be morecollection days
Knowledge Barrier
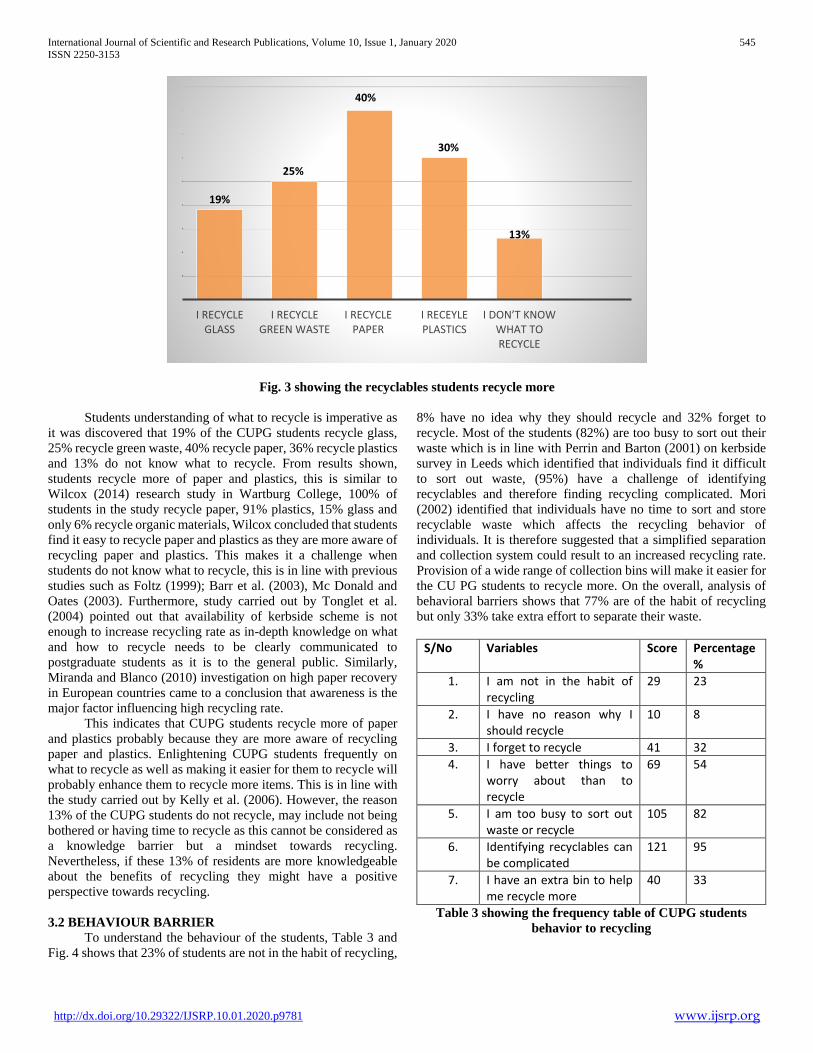
International Journal of Scientific and Research Publications, Volume 10, Issue 1, January 2020 545
ISSN 2250-3153
http://dx.doi.org/10.29322/IJSRP.10.01.2020.p9781 www.ijsrp.org
Fig. 3 showing the recyclables students recycle more
Students understanding of what to recycle is imperative as
it was discovered that 19% of the CUPG students recycle glass,
25% recycle green waste, 40% recycle paper, 36% recycle plastics
and 13% do not know what to recycle. From results shown,
students recycle more of paper and plastics, this is similar to
Wilcox (2014) research study in Wartburg College, 100% of
students in the study recycle paper, 91% plastics, 15% glass and
only 6% recycle organic materials, Wilcox concluded that students
find it easy to recycle paper and plastics as they are more aware of
recycling paper and plastics. This makes it a challenge when
students do not know what to recycle, this is in line with previous
studies such as Foltz (1999); Barr et al. (2003), Mc Donald and
Oates (2003). Furthermore, study carried out by Tonglet et al.
(2004) pointed out that availability of kerbside scheme is not
enough to increase recycling rate as in-depth knowledge on what
and how to recycle needs to be clearly communicated to
postgraduate students as it is to the general public. Similarly,
Miranda and Blanco (2010) investigation on high paper recovery
in European countries came to a conclusion that awareness is the
major factor influencing high recycling rate.
This indicates that CUPG students recycle more of paper
and plastics probably because they are more aware of recycling
paper and plastics. Enlightening CUPG students frequently on
what to recycle as well as making it easier for them to recycle will
probably enhance them to recycle more items. This is in line with
the study carried out by Kelly et al. (2006). However, the reason
13% of the CUPG students do not recycle, may include not being
bothered or having time to recycle as this cannot be considered as
a knowledge barrier but a mindset towards recycling.
Nevertheless, if these 13% of residents are more knowledgeable
about the benefits of recycling they might have a positive
perspective towards recycling.
3.2 BEHAVIOUR BARRIER
To understand the behaviour of the students, Table 3 and
Fig. 4 shows that 23% of students are not in the habit of recycling,
8% have no idea why they should recycle and 32% forget to
recycle. Most of the students (82%) are too busy to sort out their
waste which is in line with Perrin and Barton (2001) on kerbside
survey in Leeds which identified that individuals find it difficult
to sort out waste, (95%) have a challenge of identifying
recyclables and therefore finding recycling complicated. Mori
(2002) identified that individuals have no time to sort and store
recyclable waste which affects the recycling behavior of
individuals. It is therefore suggested that a simplified separation
and collection system could result to an increased recycling rate.
Provision of a wide range of collection bins will make it easier for
the CU PG students to recycle more. On the overall, analysis of
behavioral barriers shows that 77% are of the habit of recycling
but only 33% take extra effort to separate their waste.
S/No Variables Score Percentage %
1. I am not in the habit of recycling
29 23
2. I have no reason why I should recycle
10 8
3. I forget to recycle 41 32
4. I have better things to worry about than to recycle
69 54
5. I am too busy to sort out waste or recycle
105 82
6. Identifying recyclables can be complicated
121 95
7. I have an extra bin to help me recycle more
40 33
Table 3 showing the frequency table of CUPG students
behavior to recycling
19%
25%
40%
30%
13%
I RECYCLE GLASS
I RECYCLE GREEN WASTE
I RECYCLE PAPER
I RECEYLE PLASTICS
I DON’T KNOW WHAT TO RECYCLE
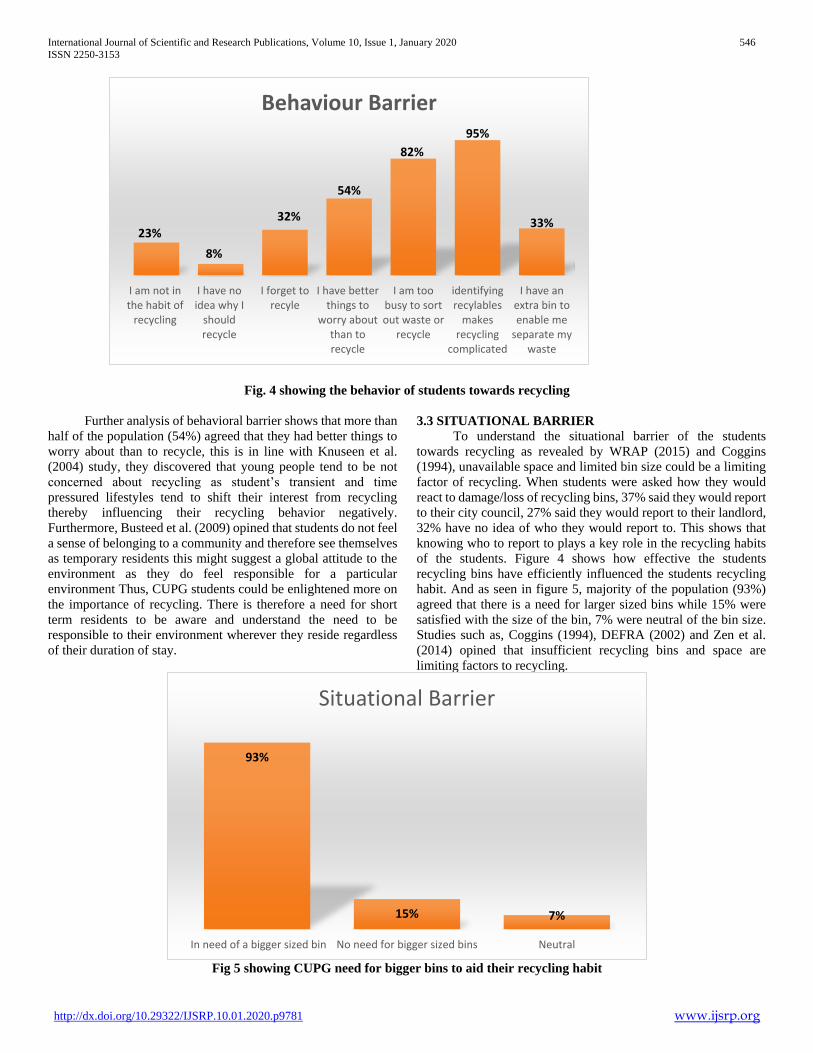
International Journal of Scientific and Research Publications, Volume 10, Issue 1, January 2020 546
ISSN 2250-3153
http://dx.doi.org/10.29322/IJSRP.10.01.2020.p9781 www.ijsrp.org
Fig. 4 showing the behavior of students towards recycling
Further analysis of behavioral barrier shows that more than
half of the population (54%) agreed that they had better things to
worry about than to recycle, this is in line with Knuseen et al.
(2004) study, they discovered that young people tend to be not
concerned about recycling as student’s transient and time
pressured lifestyles tend to shift their interest from recycling
thereby influencing their recycling behavior negatively.
Furthermore, Busteed et al. (2009) opined that students do not feel
a sense of belonging to a community and therefore see themselves
as temporary residents this might suggest a global attitude to the
environment as they do feel responsible for a particular
environment Thus, CUPG students could be enlightened more on
the importance of recycling. There is therefore a need for short
term residents to be aware and understand the need to be
responsible to their environment wherever they reside regardless
of their duration of stay.
3.3 SITUATIONAL BARRIER
To understand the situational barrier of the students
towards recycling as revealed by WRAP (2015) and Coggins
(1994), unavailable space and limited bin size could be a limiting
factor of recycling. When students were asked how they would
react to damage/loss of recycling bins, 37% said they would report
to their city council, 27% said they would report to their landlord,
32% have no idea of who they would report to. This shows that
knowing who to report to plays a key role in the recycling habits
of the students. Figure 4 shows how effective the students
recycling bins have efficiently influenced the students recycling
habit. And as seen in figure 5, majority of the population (93%)
agreed that there is a need for larger sized bins while 15% were
satisfied with the size of the bin, 7% were neutral of the bin size.
Studies such as, Coggins (1994), DEFRA (2002) and Zen et al.
(2014) opined that insufficient recycling bins and space are
limiting factors to recycling.
Fig 5 showing CUPG need for bigger bins to aid their recycling habit
93%
15% 7%
In need of a bigger sized bin No need for bigger sized bins Neutral
Situational Barrier
23%
8%
32%
54%
82%
95%
33%
I am not inthe habit of
recycling
I have noidea why I
shouldrecycle
I forget torecyle
I have betterthings to
worry aboutthan torecycle
I am toobusy to sortout waste or
recycle
identifyingrecylables
makesrecycling
complicated
I have anextra bin toenable me
separate mywaste
Behaviour Barrier
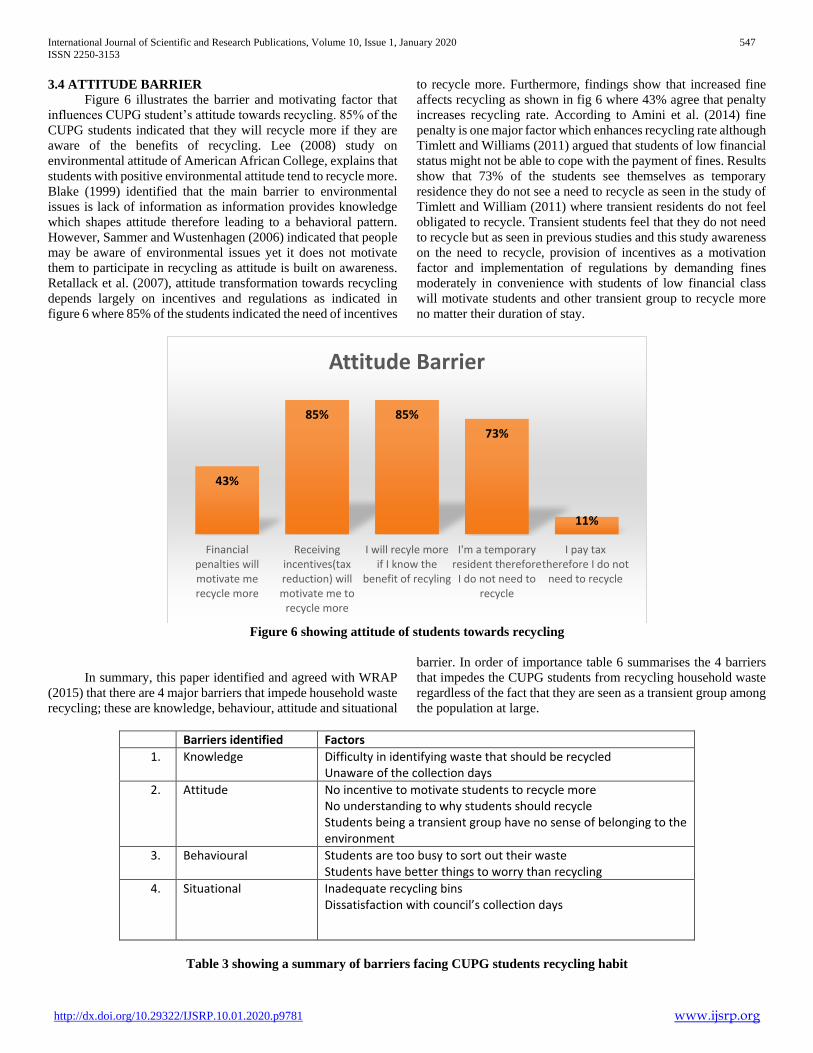
International Journal of Scientific and Research Publications, Volume 10, Issue 1, January 2020 547
ISSN 2250-3153
http://dx.doi.org/10.29322/IJSRP.10.01.2020.p9781 www.ijsrp.org
3.4 ATTITUDE BARRIER
Figure 6 illustrates the barrier and motivating factor that
influences CUPG student’s attitude towards recycling. 85% of the
CUPG students indicated that they will recycle more if they are
aware of the benefits of recycling. Lee (2008) study on
environmental attitude of American African College, explains that
students with positive environmental attitude tend to recycle more.
Blake (1999) identified that the main barrier to environmental
issues is lack of information as information provides knowledge
which shapes attitude therefore leading to a behavioral pattern.
However, Sammer and Wustenhagen (2006) indicated that people
may be aware of environmental issues yet it does not motivate
them to participate in recycling as attitude is built on awareness.
Retallack et al. (2007), attitude transformation towards recycling
depends largely on incentives and regulations as indicated in
figure 6 where 85% of the students indicated the need of incentives
to recycle more. Furthermore, findings show that increased fine
affects recycling as shown in fig 6 where 43% agree that penalty
increases recycling rate. According to Amini et al. (2014) fine
penalty is one major factor which enhances recycling rate although
Timlett and Williams (2011) argued that students of low financial
status might not be able to cope with the payment of fines. Results
show that 73% of the students see themselves as temporary
residence they do not see a need to recycle as seen in the study of
Timlett and William (2011) where transient residents do not feel
obligated to recycle. Transient students feel that they do not need
to recycle but as seen in previous studies and this study awareness
on the need to recycle, provision of incentives as a motivation
factor and implementation of regulations by demanding fines
moderately in convenience with students of low financial class
will motivate students and other transient group to recycle more
no matter their duration of stay.
Figure 6 showing attitude of students towards recycling
In summary, this paper identified and agreed with WRAP
(2015) that there are 4 major barriers that impede household waste
recycling; these are knowledge, behaviour, attitude and situational
barrier. In order of importance table 6 summarises the 4 barriers
that impedes the CUPG students from recycling household waste
regardless of the fact that they are seen as a transient group among
the population at large.
Barriers identified Factors
1. Knowledge Difficulty in identifying waste that should be recycled Unaware of the collection days
2. Attitude No incentive to motivate students to recycle more No understanding to why students should recycle Students being a transient group have no sense of belonging to the environment
3. Behavioural Students are too busy to sort out their waste Students have better things to worry than recycling
4. Situational Inadequate recycling bins Dissatisfaction with council’s collection days
Table 3 showing a summary of barriers facing CUPG students recycling habit
43%
85% 85%
73%
11%
Financialpenalties willmotivate merecycle more
Receivingincentives(taxreduction) willmotivate me to
recycle more
I will recyle moreif I know the
benefit of recyling
I'm a temporaryresident therefore
I do not need torecycle
I pay taxtherefore I do not
need to recycle
Attitude Barrier

International Journal of Scientific and Research Publications, Volume 10, Issue 1, January 2020 548
ISSN 2250-3153
http://dx.doi.org/10.29322/IJSRP.10.01.2020.p9781 www.ijsrp.org
From table 3, knowledge barrier is seen as the main barrier
to CUPG students that impeded that recycling habit as they do not
know what to recycle, how to recycle, and the benefits of
recycling. To encourage them to recycle more, they need to
understand the benefits of recycling and have a sense of belonging
to the environment they live in (attitude Barrier). According to
Byrne and O’regan (2014), Parsons et al. (2012) factors
influencing behavior are knowledge, attitude and practice.
Furthermore, Oskamp et al. (1999) concurs that knowledge is
related to attitude and behavior comes in when people are
interested in what they know and understand. This can further be
enhanced by setting up the right infrastructures i.e. situational
barrier. In summary the four barriers are inextricably interlinked.
IV. CONCLUSION
In conclusion, this paper using the WRAP 2015 barriers to
recycling household waste model, aimed at identifying the four
barriers facing CUPG household waste recycling which are
Knowledge, Attitude, Behavior and Situation barrier. CUPG
students were used as case study to see if this identified barriers
are applicable to this set of population. This paper identified the
four barriers according to importance Knowledge, Attitude,
Behavior and Situational. With Knowledge barrier being the top
most barrier to recycling habit of these group of students. It is
therefore important that in every community no group should be
overlooked and every group should feel a sense of belonging to a
particular environment no matter their duration of stay.
V. RECOMMENDATIONS
Since knowledge is a key barrier, students need to be more
aware of what and how to recycle as well know the benefits of
recycling this can be achieved by creating awareness and
campaigns to create awareness on the need for recycling as well
as its benefits to the environment. Incentives can be given to
students for example vouchers so as to encourage them to recycle
more. Furthermore, the council need to provide larger bins as well
as clearly identify the bin meant for a particular waste or wastes.
REFERENCES
[1] Adomssent, M. (2013) ‘Exploring Universities Transformative Potential for Sustainability Bound Learning in Changing Landscapes of Knowledge
Communication. Journal of Cleaner Production (49), 11-24
[2] Aini, M.S., Nurizan, Y., and Fakhrul’l-Razi, A. (2007) ‘Environmental Comprehension and Participation of Malaysian Secondary School Students’.Environmental Education Research.13(1), 17-31.
[3] Amini, F., Ahmad, J., and Ambali, A.R. (2014) ‘The Influence of Reward and Penalty on Household’ Recycling Intention’. APCBEE Procedia 10(2014), 187-192
[4] Blake, J., (1999) ‘Overcoming the “Value-Action Gap” in environmental policy: Tension between national policy and local experience’. Local Environment, 4(3): 257-278
[5] Busteed, M., Palkhiwala, K., Roma, M., and Shah, B. (2009) ‘Recycling Attitudes and Behaviour of Students at Carlos Pascua Zuniga High School’.[Online] available from <https://www.wpi.edu/Pubs/E-project/Available/E-project-121609-172634/unrestricted/RecyclingAttitudesandBehaviorsofStudentsatCarlosPascu aZunigaHighSchool.pdf> [20 July 2015]
[6] Byrne S., O’Regan B. (2014). ‘Attitudes and Actions towards Recycling Behaviours in the Limerick, Ireland Region’.Resources, Conservation and Recycling, 1(87), 89-96.
[7] Coggins, C. (1994) ‘Who is a recycler?’ Journal on Waste Management and Resource Recovery, 1(62), 3-19 Coventry University (2013) Environmental Sustainability Report 2013 [online] available from http://www.coventry.ac.uk/Global/06%20Life%20on%20Campus%20section %20assets/The%20University/Key%20Information%20Page/Governance/cov entry_university_environmental_report_2013.pdf [31 June 2015]
[8] Corcoran, M., and Wals, A.E.J. (2004) Higher Education and the Challenge of Sustainability. Problematics, Promise and Practise. Netherlands: Kluwer Academic Publishers
[9] Department for Environment Food and Rural Affairs (DEFRA) (2002) Survey of Public Attitudes to quality of Life and the Environment. [online] availablefrom <http://discover.ukdataservice.ac.uk/catalogue/?sn=5741&type=Data%20catalogue> [17 June 2015]
[10] Foltz, D.F. (1999) ‘Municipal Recycling Performance: A Public Sector Environmental Success Story’ Public Administrative Review, 59(4):336-345
[11] Hernandez, O., Rawlins, B., and Schwartz, R. (1999) ‘Voluntary Recycling Quito: factors Associated with Participation in a Pilot Programmes. Journal on Environmental Urban 11(2), 145-159
[12] Hershkowitz, A. (1997) Too good to throw away: Recycling’s Proven Record [online] available from www.nrdc.org/cities/recycling/recycling/recyinx.asp [9 July 2015]
[13] House of Commons Environment, Food and Rural Affairs Committee (2014).‘Great Britain Parliament’.Waste Management in England fourth report of session 2014-2015. London: The Stationery Office Limited. (HC paper 241; 2014-2015)
[14] Kelly, T.C., Mason, L.G., Leiss, M.W., and Ganesh, S., (2006) ‘*University Community Responses to On-Campus Resource Recycling.Journal on Resources, Conservation and Recycling 47(1), 42-55
[15] Knussen, C., Yule, F., MacKenzie, J., & Wells, M. (2004). ‘An analysis of intentions to recycle household waste: The roles of past behaviour, perceived habit, and perceived lack of facilities’. Journal of Environmental Psychology 1(24), 237-246.
[16] Lee, E.B. (2008) ‘Environmental Attitudes and Information Sources among African American College Students’.The Journal of Environmental Education, 40(1),29-42
[17] McDonald, S., and Oates, C., (2003) ‘Reasons for non-participation in a KerbsideRecycling Scheme’.Journal onResources, Conservation and Recycling 39(4),369-385
[18] Miranda, R. and Blanco, A. (2010) ‘Environmental Awareness on paper Recycling’Cellular Chemical Technology 1(44), 431-449
[19] Mori (2002) MORI Social Research Institute.Public attitudes towards recycling andWaste Management [Online] available from <www.number-
10.gov.uk/su/waste/report/dpwnloads/mor.pdf> [24 June 2015]
[20] Moore, N. (2000) How to do research. The complete guide to designing and managing research projects. 3rd end. London: Library Association Publishing
[21] Oskamp, S., Harrington, M.J., Edwards, T.C., Sherwod, D.L., Okuda, S.M., Swanson, D.C., (1999), ‘Factors influencing Household Recycling Behaviour”, Environment and Behaviour, 23(4):494-519
[22] Perrin, D., Barton, J. (2001) ‘Issues Associated with Transforming Household Attitudes and Opinions into Materials Recovery: A Review of Two KerbsideRecycling Schemes’. Journal on Resource Conservation Recycling, 1 (33), 61-74
[23] Retallack, S., and Lawrence, T. (2007) Positive Energy: Harnessing People Power to Prevent Climate Change, London: IPPR [26 June 2015]
[24] Roberston, S. and Wallington, H. (2009) ‘Recycling and Waste Minimisation
[25] Behaviours of the Transient Student Population in Oxford’.Results of an Online Survey Local Environment 14(4), 285-296
[26] Sammer, K. and Wustenhagen, R. (2006) ‘The Influence of Eco-labelling on Consumer Behaviour, Results of a Discrete Choice Analysis for Washing Machines’. Business Strategy and the Environment 15(3): 185-199

International Journal of Scientific and Research Publications, Volume 10, Issue 1, January 2020 549
ISSN 2250-3153
http://dx.doi.org/10.29322/IJSRP.10.01.2020.p9781 www.ijsrp.org
[27] Saunders, M., Lewis, P., and Thornhill, A. (2012) 6th edn. Research methods for Business Students: UK: Pearson Education
[28] Thang, Q.N. (2011) Understanding recycling and Recycling Communication in University settings: A case Study at the University of East Anglia.
[29] Unpublished Msc. Thesis. East Anglia: University of East Anglia
[30] Timlett, R.E and Williams I.D (2009) ‘The Impact of Transient Populations on Recycling Behaviour in a Densely Populated Urban Environment’. Journal of Resources, Conservation and Recycling 53(9), 498-506
[31] Timlett, R., and Williams, I.D. (2011). ‘The ISB model (Infrastructure, Service, Behaviour): a Tool for Waste Practitioners’. Journal on Waste Management, 31(6), 1382-1392
[32] Tonglet, M., Philips, P.S, and Read, A.D (2004) ‘Using the Theory of Planned Behaviour to Investigate the Determinants of Recycling Behaviour: a case Study from Brixworth, UK’. Journal on Resources Conservation Recycling 41(3), 191-214
[33] Waste and Resources Action Programme (WRAP) (2008) Barriers to Recycling: A review of evidence since 2008 [online] <www.wrap.org.uk/.../wrap/WRAP%20Barriers%20Synthesis%20Full%20>[1 August 2015]
[34] Waste and Resources Action Programme (WRAP) (2010a) Waste Arising in the Supply of Food and Drinks to Households in the UK. [online] available
from<www.wrap.org.uk/.../wrap/Waste%20arisings%20in%20the%20supply%>[August 2015]
[35] Waste and Resources Action Programme (WRAP) (2015) New bins make it easier to recycle ‘on the go’ [online] available from
http://www.wrap.org.uk/node/10959 [31 July 2015]
[36] Wilcox, M.A (2014) A Study of College Student Attitudes and Behaviours Related to Recycling. Online PhD thesis. Northern Iowa: University of Northern Iowa
[37] Zen, I.S., Noor, Z.Z., and Yusof, R.O. (2014) ‘The Profiles of Household Recyclers and Non-Recyclers in Kuala Lumpur, Malaysia’. Habitat International 1 (42), 83-89
AUTHORS
First Author – Jatau Sarah, Geography and Planning
Department, University of Jos, Nigeria
Second Author – Binbol N.L, Geography and Planning
Department, University of Jos, Nigeria
International Journal of Scientific and Research Publications, Volume 10, Issue 1, January 2020 550
ISSN 2250-3153
http://dx.doi.org/10.29322/IJSRP.10.01.2020.p9782 www.ijsrp.org
Association of Programmed Death
Ligand1(PDL1)Immunoexpression with Histopathology
Grade of Rhabdomyosarcoma At The Unit Anatomical
Pathology of Adam Malik Hospital In 2016-2018
Fitrikalinda*, Delyuzar, Jessy Chrestella
Department of Anatomical Pathology, Faculty of Medicine, Universitas Sumatera Utara, Medan, Indonesia. *Corresponding author
DOI: 10.29322/IJSRP.10.01.2020.p9782
http://dx.doi.org/10.29322/IJSRP.10.01.2020.p9782
Abstract- Rhabdomyosarcoma (RMS) is a malignancy in the
mesenchyme that shows differentiationof skeletal muscles, most
commonly found in childhood to old age and can occur in any
location throughout the body. PDL1 is an inhibiting molecule
that causes disruption of the immune response against tumor
cells. Revealed expression of PDL1 is associated with a poor
prognosis. This study used tissue samples of rhabdomyosarcoma
tumors to assess the association between immunohistochemical
expressions of PDL1 and histopathology grade among
rhabdomyosarcoma patients. Formalin-fixed paraffin-embedded
tissue blocks of 29 rhabdomyosarcoma patients were
immunohistochemically studied for PDL1 expression. The basic
characteristics of the samples were obtained through medical
records or pathology archieves. The association between PDL1
expression and grade were anylized using SPSS 22 version.
PDL1 was expressed in 17,2% of the rhabdomyosarcoma
specimens. PDL1 positive expression was no significantly
associated with histopathological grade (p >0.05). This not can
be a prognostic indicator and possible target therapy for these
neoplasms.
IndexTerms:PDL1,rhabdomyosarcoma,grade,immunohistochem
istry.
I. INTRODUCTION
habdomyosarcoma is a soft tissue sarcoma most commonly
found in childhood to old age.1 The grade of histopathology
of rhabdomyosarcoma currently used is based on FNCLCC.
Consists of score differentiation, mitotic and necrosis.2
Depending on subtype histopatology and grade, treatment for
rhabdomyosarcoma includes surgery and postoperative radiation
therapy. Rhabdomyosarcoma are generally aggressive neoplasm
and higher grades, they tend to be progressive and recurrent.3 New molecular target therapy was tested in the 2010. Recently,
the possibility of targeted PD1 and PDL1 pathway therapies has
been widely studied in various types of malignancies, and can be
used as new prognostic indicators for soft tissue sarcoma.Can
also be used as a selection criteria for immunotherapy.4,5 Many
researchers have significantly related to clinicopathological
parameters such as clinical stage, presence of metastasis, poor
tumor differentiation and tumor necrosis.6,7
Programmed cell death protein 1 (PD1), a receptor expressed
on T and B cells, NK cells, and monocytes, is included in the
CD28 family that acts as a negative regulator of the immune
system.8 This PD1 binds two ligands namely PDL1 and PDL2.
PDL1 acts as an inhibitor of T cell function in peripheral tissues,
then PDL2 supreessed T cell activation in lymphoid organs.9 To
protect normal tissue by inducing immune tolerance, where the
interaction between these two proteins in tumors will affect the
anti tumor immune response by causing fatigue (exhaustion) and
dysfunction of T cells, so that tumor cells can avoid the immune
system, proliferate and metastasis.10
Where as PDL1 generally experiences an increase in
regulation on the surface of tumor cells. And very high
expression in the lungs, breast, large intestine and bladder.
Tumor cells express PDL1 by increasing T cell apoptosis and to
inhibit CD4+ and CD8 T cell activation.11 Therefore, this study
aimed to evaluate the immunohistochemical expression of PDL1
in rhabdomyosarcoma from the tumor tissue and analyze its
association with histopathology grade of rhabdomyosarcoma.
II. MATERIAL AND METHODS
Sample selection
This cross sectional study was conducted in Department of
Anatomical Pathology, Universitas Sumatera Utara/ H. Adam
Malik General Hospital, Medan and includes 29 cases of
rhabdomyosarcoma. All samples were obtained through surgical
procedure. Inclusion criteria were rhabdomyosarcoma cases with
adequate clinical data, available and undamaged formalin-fixed
paraffin embedded tissue block with sufficient tumor tissue.
Detailed clinical data were obtained from medical records or
pathology archives consisting of age, sex, location of the tumor.
and histological type were determined independently by
researchers through hematoxylin and eosin stained slides
examination.
R
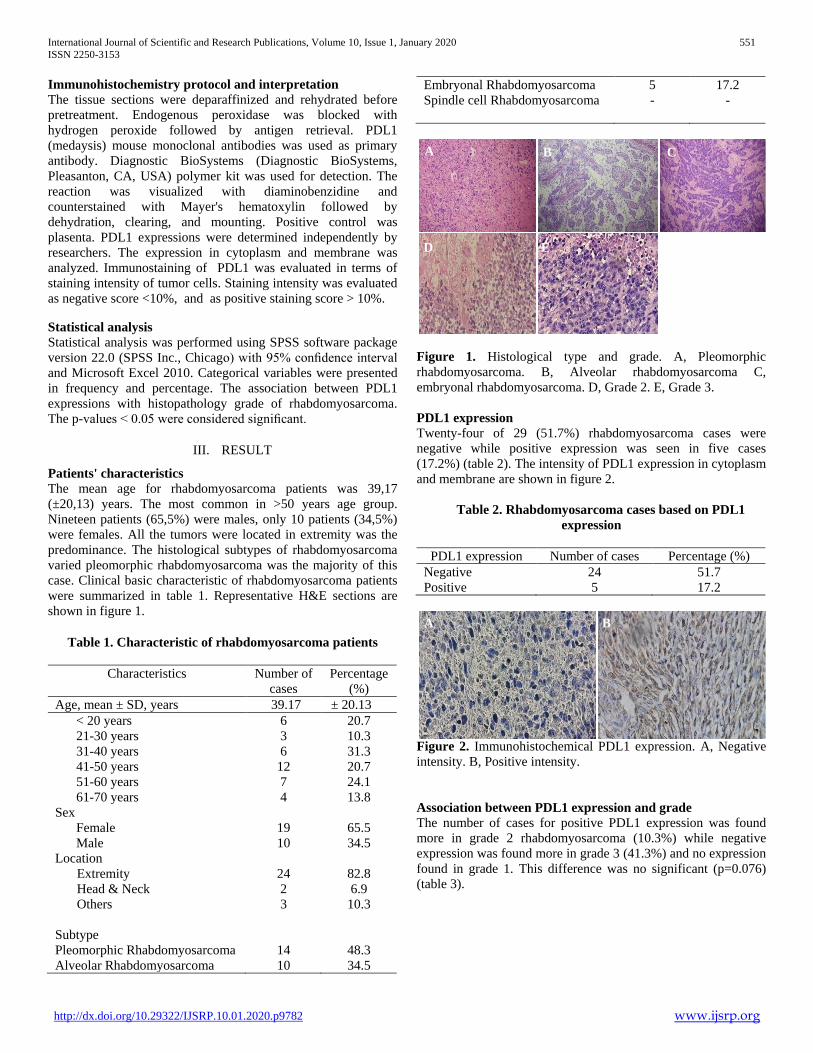
International Journal of Scientific and Research Publications, Volume 10, Issue 1, January 2020 551
ISSN 2250-3153
http://dx.doi.org/10.29322/IJSRP.10.01.2020.p9782 www.ijsrp.org
Immunohistochemistry protocol and interpretation
The tissue sections were deparaffinized and rehydrated before
pretreatment. Endogenous peroxidase was blocked with
hydrogen peroxide followed by antigen retrieval. PDL1
(medaysis) mouse monoclonal antibodies was used as primary
antibody. Diagnostic BioSystems (Diagnostic BioSystems,
Pleasanton, CA, USA) polymer kit was used for detection. The
reaction was visualized with diaminobenzidine and
counterstained with Mayer's hematoxylin followed by
dehydration, clearing, and mounting. Positive control was
plasenta. PDL1 expressions were determined independently by
researchers. The expression in cytoplasm and membrane was
analyzed. Immunostaining of PDL1 was evaluated in terms of
staining intensity of tumor cells. Staining intensity was evaluated
as negative score <10%, and as positive staining score > 10%.
Statistical analysis
Statistical analysis was performed using SPSS software package
version 22.0 (SPSS Inc., Chicago) with 95% confidence interval
and Microsoft Excel 2010. Categorical variables were presented
in frequency and percentage. The association between PDL1
expressions with histopathology grade of rhabdomyosarcoma.
The p-values < 0.05 were considered significant.
III. RESULT
Patients' characteristics
The mean age for rhabdomyosarcoma patients was 39,17
(±20,13) years. The most common in >50 years age group.
Nineteen patients (65,5%) were males, only 10 patients (34,5%)
were females. All the tumors were located in extremity was the
predominance. The histological subtypes of rhabdomyosarcoma
varied pleomorphic rhabdomyosarcoma was the majority of this
case. Clinical basic characteristic of rhabdomyosarcoma patients
were summarized in table 1. Representative H&E sections are
shown in figure 1.
Table 1. Characteristic of rhabdomyosarcoma patients
Characteristics Number of
cases
Percentage
(%)
Age, mean ± SD, years 39.17 ± 20.13
< 20 years
21-30 years
31-40 years
41-50 years
51-60 years
61-70 years
6
3
6
12
7
4
20.7
10.3
31.3
20.7
24.1
13.8
Sex
Female
Male
19
10
65.5
34.5
Location
Extremity
Head & Neck
Others
24
2
3
82.8
6.9
10.3
Subtype
Pleomorphic Rhabdomyosarcoma
Alveolar Rhabdomyosarcoma
14
10
48.3
34.5
Embryonal Rhabdomyosarcoma
Spindle cell Rhabdomyosarcoma
5
-
17.2
-
Figure 1. Histological type and grade. A, Pleomorphic
rhabdomyosarcoma. B, Alveolar rhabdomyosarcoma C,
embryonal rhabdomyosarcoma. D, Grade 2. E, Grade 3.
PDL1 expression
Twenty-four of 29 (51.7%) rhabdomyosarcoma cases were
negative while positive expression was seen in five cases
(17.2%) (table 2). The intensity of PDL1 expression in cytoplasm
and membrane are shown in figure 2.
Table 2. Rhabdomyosarcoma cases based on PDL1
expression
PDL1 expression Number of cases Percentage (%)
Negative
Positive
24
5
51.7
17.2
Figure 2. Immunohistochemical PDL1 expression. A, Negative
intensity. B, Positive intensity.
Association between PDL1 expression and grade
The number of cases for positive PDL1 expression was found
more in grade 2 rhabdomyosarcoma (10.3%) while negative
expression was found more in grade 3 (41.3%) and no expression
found in grade 1. This difference was no significant (p=0.076)
(table 3).
B A C
A B
E D
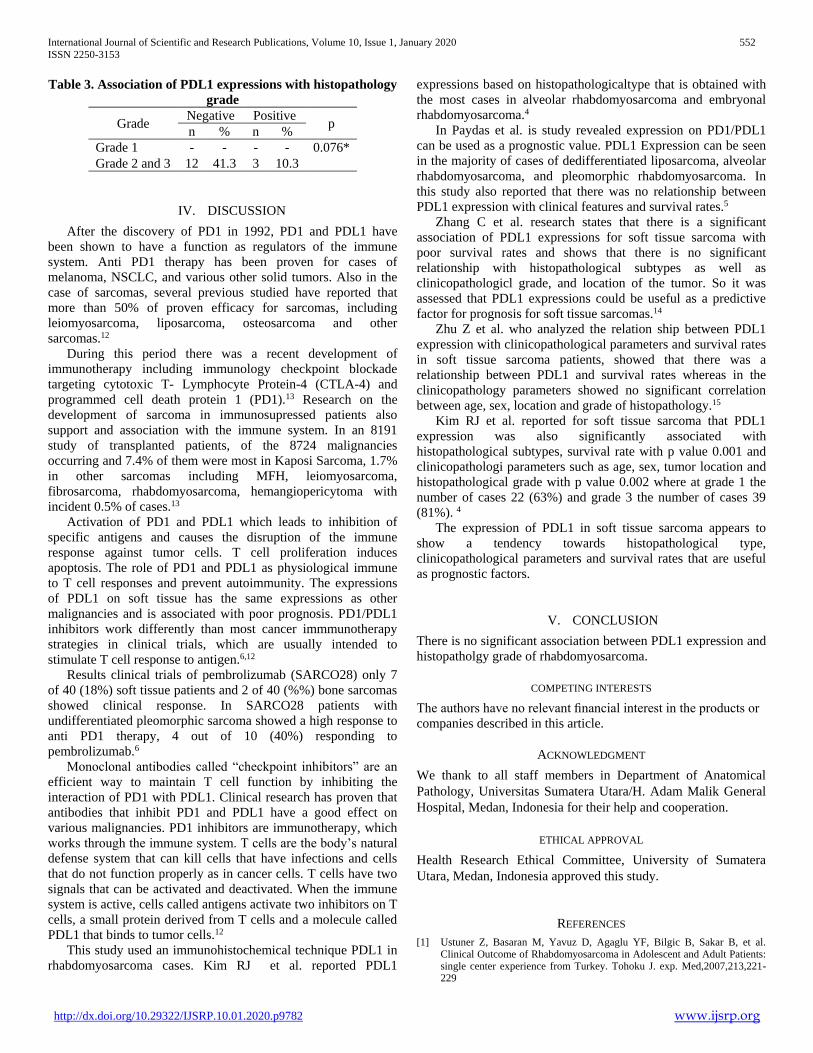
International Journal of Scientific and Research Publications, Volume 10, Issue 1, January 2020 552
ISSN 2250-3153
http://dx.doi.org/10.29322/IJSRP.10.01.2020.p9782 www.ijsrp.org
Table 3. Association of PDL1 expressions with histopathology
grade
Grade Negative Positive
p n % n %
Grade 1 - - - - 0.076*
Grade 2 and 3 12 41.3 3 10.3
IV. DISCUSSION
After the discovery of PD1 in 1992, PD1 and PDL1 have
been shown to have a function as regulators of the immune
system. Anti PD1 therapy has been proven for cases of
melanoma, NSCLC, and various other solid tumors. Also in the
case of sarcomas, several previous studied have reported that
more than 50% of proven efficacy for sarcomas, including
leiomyosarcoma, liposarcoma, osteosarcoma and other
sarcomas.12
During this period there was a recent development of
immunotherapy including immunology checkpoint blockade
targeting cytotoxic T- Lymphocyte Protein-4 (CTLA-4) and
programmed cell death protein 1 (PD1).13 Research on the
development of sarcoma in immunosupressed patients also
support and association with the immune system. In an 8191
study of transplanted patients, of the 8724 malignancies
occurring and 7.4% of them were most in Kaposi Sarcoma, 1.7%
in other sarcomas including MFH, leiomyosarcoma,
fibrosarcoma, rhabdomyosarcoma, hemangiopericytoma with
incident 0.5% of cases.13
Activation of PD1 and PDL1 which leads to inhibition of
specific antigens and causes the disruption of the immune
response against tumor cells. T cell proliferation induces
apoptosis. The role of PD1 and PDL1 as physiological immune
to T cell responses and prevent autoimmunity. The expressions
of PDL1 on soft tissue has the same expressions as other
malignancies and is associated with poor prognosis. PD1/PDL1
inhibitors work differently than most cancer immmunotherapy
strategies in clinical trials, which are usually intended to
stimulate T cell response to antigen.6,12
Results clinical trials of pembrolizumab (SARCO28) only 7
of 40 (18%) soft tissue patients and 2 of 40 (%%) bone sarcomas
showed clinical response. In SARCO28 patients with
undifferentiated pleomorphic sarcoma showed a high response to
anti PD1 therapy, 4 out of 10 (40%) responding to
pembrolizumab.6
Monoclonal antibodies called “checkpoint inhibitors” are an
efficient way to maintain T cell function by inhibiting the
interaction of PD1 with PDL1. Clinical research has proven that
antibodies that inhibit PD1 and PDL1 have a good effect on
various malignancies. PD1 inhibitors are immunotherapy, which
works through the immune system. T cells are the body’s natural
defense system that can kill cells that have infections and cells
that do not function properly as in cancer cells. T cells have two
signals that can be activated and deactivated. When the immune
system is active, cells called antigens activate two inhibitors on T
cells, a small protein derived from T cells and a molecule called
PDL1 that binds to tumor cells.12
This study used an immunohistochemical technique PDL1 in
rhabdomyosarcoma cases. Kim RJ et al. reported PDL1
expressions based on histopathologicaltype that is obtained with
the most cases in alveolar rhabdomyosarcoma and embryonal
rhabdomyosarcoma.4
In Paydas et al. is study revealed expression on PD1/PDL1
can be used as a prognostic value. PDL1 Expression can be seen
in the majority of cases of dedifferentiated liposarcoma, alveolar
rhabdomyosarcoma, and pleomorphic rhabdomyosarcoma. In
this study also reported that there was no relationship between
PDL1 expression with clinical features and survival rates.5
Zhang C et al. research states that there is a significant
association of PDL1 expressions for soft tissue sarcoma with
poor survival rates and shows that there is no significant
relationship with histopathological subtypes as well as
clinicopathologicl grade, and location of the tumor. So it was
assessed that PDL1 expressions could be useful as a predictive
factor for prognosis for soft tissue sarcomas.14
Zhu Z et al. who analyzed the relation ship between PDL1
expression with clinicopathological parameters and survival rates
in soft tissue sarcoma patients, showed that there was a
relationship between PDL1 and survival rates whereas in the
clinicopathology parameters showed no significant correlation
between age, sex, location and grade of histopathology.15
Kim RJ et al. reported for soft tissue sarcoma that PDL1
expression was also significantly associated with
histopathological subtypes, survival rate with p value 0.001 and
clinicopathologi parameters such as age, sex, tumor location and
histopathological grade with p value 0.002 where at grade 1 the
number of cases 22 (63%) and grade 3 the number of cases 39
(81%). 4
The expression of PDL1 in soft tissue sarcoma appears to
show a tendency towards histopathological type,
clinicopathological parameters and survival rates that are useful
as prognostic factors.
V. CONCLUSION
There is no significant association between PDL1 expression and
histopatholgy grade of rhabdomyosarcoma.
COMPETING INTERESTS
The authors have no relevant financial interest in the products or
companies described in this article.
ACKNOWLEDGMENT
We thank to all staff members in Department of Anatomical
Pathology, Universitas Sumatera Utara/H. Adam Malik General
Hospital, Medan, Indonesia for their help and cooperation.
ETHICAL APPROVAL
Health Research Ethical Committee, University of Sumatera
Utara, Medan, Indonesia approved this study.
REFERENCES
[1] Ustuner Z, Basaran M, Yavuz D, Agaglu YF, Bilgic B, Sakar B, et al. Clinical Outcome of Rhabdomyosarcoma in Adolescent and Adult Patients: single center experience from Turkey. Tohoku J. exp. Med,2007,213,221-229

International Journal of Scientific and Research Publications, Volume 10, Issue 1, January 2020 553
ISSN 2250-3153
http://dx.doi.org/10.29322/IJSRP.10.01.2020.p9782 www.ijsrp.org
[2] Fletcher CDM, Bridge JA, Hogendoorn PCW, Mertens F. WHO Classification of tumors of Soft Tissue and Bone. 4th ed. Lyon: IARC;2013
[3] Kumar V, Abbas AK, Aster JC. Bones, Joints and soft tissue tumors. In: Kumar V, Abbas AK, Aster JC, editors. Robbins and Cotran Pathologic Basic of disease. 10th edition. Philadelphia: Saunders;2018.p830-1.
[4] Kim RJ, Moon JY, Kwon SK, Bae SJ, Wagie S, Kim MK, et al. Tumor Infiltrating PD1 positive Lymphocytes and the expression of PDL1 predict poor prognosis of soft tissue sarcomas. Plos ONE December 2013; vol 8
[5] Paydas S, Bagir KE, Deveci AM, Gonlusen G. Clinical and prognostic signigficance of PD1 and PDL1 expression in sarcomas. Med Oncol (2016) 33-93
[6] Nakano K and Takashi S. Current moleculer targeted therapies for bone and soft tissue sarcomas. Int J. Mol. Sci.2018, 19,739;doi:103390/ijms19030739
[7] Kim C, Kim KE, Jung H, Chon JH, Shin HK, Hu H, et al. Prognostic implications of PDL1 expressions in patients with soft tissue sarcoma. Kim et al BMC Cancer (2016) 16: 434 DOI 10.1186/s12885-016-2451-6
[8] Wibisono LA, Harris D, Lukito JS. Association between immunohistochemical expression of programmed death ligand 1 (PDL1) and clinicopathological parameters in invasive breast carcinoma. Volume 8, Issue 5, May 2019. Print ISSN No 2277-8160
[9] Alianto R, Harris D, Soekimin.Association of PDL1 expresssion with histological grade of endometrial carcinoma. Volume 8, issue 5, May 2019. Print ISSN No.2277-8160
[10] Harahap SR, Harris D, soekimin. Differencees of expressions of PDL1 in lung denocarcinoma and lung squamous cell carcinoma. International Joural of Scientific and Research publications, volume 9, Issue 6,June 2019 ISSN 2250-3153
[11] Erp VA, Jonkers VY, Roeffen HM. Houdt VL, Gorris M, Dan VLS, et al. Expression and clinical association of programmed cell death 1 and CD8+ lymphocytes in primary sarcomas is subtype dependent. Oncotarget, 2017, vol.8 (No 41) pp.71371-71384
[12] Park KH, Kim M, Sung M, Lee ES, Kim JY, Choi LY. Status of programmed death lignd 1 expressions in sarcomas. Park et al. J trans Med (2018) 16: 303
[13] Angelo DPS, Tap Dw, Schwartz KG, Carvajal DR. sarcoma Immunotherapy. Past Approaches and future directions. Hindawi publishing corportaion sarcoma volume 2014, article ID 391967
[14] Zheng C, You W, Wan P, Jiang X, Chen J, Zheng Y, et al. Clinicopathological and prognostic significance of pDl1 expressions in sarcoma. Zheng et al. Medicine (2018)97:25
[15] Zhu Z, Jin Z, Zhang M, Tang Y, Yang G. Prognostic value of programmed death ligand 1 in sarcoma: a metaanalysis. Oncotarget, 2017, vol.8 (N0.35)pp: 59570-59580
AUTHORS
First Author – dr. Fitrikalinda, Resident of Department of
Anatomical Pathology, Faculty of Medicine, Universitas
Sumatera Utara, Medan, Indonesia, email ID:
Second Author – DR. dr. Delyuzar, M.Ked(PA), Sp.PA(K),
Department of Anatomical Pathology, Faculty of Medicine,
Universitas Sumatera Utara, Medan, Indonesia.
Third Author – dr.Jessy Chrestella, M.Ked (PA), Sp.PA.
Department of Anatomical Pathology, Faculty of Medicine,
Universitas Sumatera Utara, Medan, Indonesia
Correspondence Author – dr. Fitrikalinda, Resident of
Department of Anatomical Pathology, Faculty of Medicine,
Universitas Sumatera Utara, Medan, Indonesia, email ID: [email protected]

International Journal of Scientific and Research Publications, Volume 10, Issue 1, January 2020 554
ISSN 2250-3153
http://dx.doi.org/10.29322/IJSRP.10.01.2020.p9783 www.ijsrp.org
The Relationship Between the Application of
Neuromarketing and Competitiveness AN Applied Study on (Airtel) for Telecom Services in India”
Dr. Fidaa O. D. Safi *, Dr. Marwan S. Alagha **
* Economic and Administrative science
*Assistant professor at Al- Azhar University- Gaza **Assistant professor at Al- Azhar University- Gaza
DOI: 10.29322/IJSRP.10.01.2020.p9783
http://dx.doi.org/10.29322/IJSRP.10.01.2020.p9783
Abstract- Neuromarketing is one of the effective means to create
competitiveness and more excellence. This study aimed to
examine the relationship between the application of
neuromarketing and competitiveness on Airtel Company. The
study based on primary and secondary data, a total of 200
employees who are patronizing marketing and sales processes
departments of Airtel Company were surveyed by applying a
structured questionnaire. Statistical tools like Cronbach's alpha
coefficient and correlation coefficients, frequencies and
percentages, descriptive statistics analysis, correlation analysis are
employed to assess the relationship between the application of
neuromarketing and competitiveness. The results revealed that
there is a significant relationship between the application of
neuromarketing and competitiveness. This study contributes
invaluable information for both academician and managers for
their theoretical and practical purposes.
Index Terms- Competitiveness, Neuromarketing,
Neuromarketing activities, Neuromarketing applications.
I. INTRODUCTION
arketplace is a very competitive and lively in nature. The
customers are more aware, their needs are complex, and
have an access to diverse channels and choices to get their utilities;
therefore, companies are in a severe need to differentiate their
marketing strategies as they resist. Managers today are under
remarkable pressure to uncover factors driving customers’
attitudes and behaviour. Unfortunately, decades ago traditional
methods suffer from recognized limitations and have remained
largely unchanged since their introduction. Thus, there is a rising
interest in brain-based approaches that may enable managers to
directly investigate customers’ essential thoughts, feelings, and
intentions. Recently, neuroscience concept has gained increasing
popularity in academic literature as well as the practical world to
understand the consumer’s behaviour which can positively
contribute to enhance competitiveness among companies.
Neuroscience has helped the researcher to deeply discuss
marketing science in meaningful ways. The interaction between
both of these sciences has helped in generating deeper insights into
consumer’s behaviour. This has guided to the appearance of a new
field of study, termed as neuromarketing or consumer
neuroscience. This study introduces the readers to this emerging
field in marketing literature and practice. It gives an overview of
the relationship of the applications of neuroscience
competitiveness. In India, (Bharti Airtel) is one the largest mobile
phone companies around India. Within excess of 334, 79 million
subscribers. It is a global company operates in 16 countries in Asia
and Africa, it is one of the top three global mobile service
providers (annual 17- 18, 2019). The organization additionally
gives telephone utilities and Web access over DSL. At the same
time, they continued their aggressive network transformation
program under ‘Project Leap’. With 180,000 mobile sites rolled
out in the preceding two years, this is one of the largest network
rollouts globally. During the year, we also emerged as the only
industry player in India, with both 3G and 4G services in all 22
circles. The total revenue in 2018 for Airtel is 836.87 Billion
Rupees.
The telecommunication industry in India is expanding, and
the completion among companies is arising; thus, Airtel started to
direct the efforts to enrich the lives of customers, win new
customers, increase the market share and revenue, and gain
competitiveness. In the recent study the researcher attempts to give
attention to a new strategy in marketing that will assist companies
to understand the potential feelings, thoughts, and emotions of
their customers. Thus, companies can assimilate the needs and
desires of their customers and directly gain their satisfaction and
loyalty.
II. LITERATURE REVIEW
2.1. Neuromarketing:
Neuromarketing is one of the modern and vital concepts in
marketing that uses techniques for the measurement of customers’
brain to understand and analyze the customers’ behaviours in line
with markets and commercial trade (Lee, Broderick&
Chamberlain, 2006). The use of neuromarketing concept emerged
in June 2002. Particularly when an advertising company from
Atlanta (USA) declared the creation of a department for the use of
functional magnetic resonance image (FMRI) to conduct
marketing research (Fisher, Chin & Klitzman, 2010).
Furthermore, Neuromarketing is the application of neuroscience
to marketing (Perrachione & Perrachione, 2008) that includes the
direct use of brain imaging, scanning, and other brain activity
M

International Journal of Scientific and Research Publications, Volume 10, Issue 1, January 2020 555
ISSN 2250-3153
http://dx.doi.org/10.29322/IJSRP.10.01.2020.p9783 www.ijsrp.org
measurement technology to measure the responses of customers
for specific products, packaging, advertising, or other marketing
factors. As a fact, the brain is the black box that conceals
customers’ emotions and preferences (Marci, 2008; Javor, Koller,
Lee, Chamberlain & Ransmayr, 2013; Fugate, 2007 and Green &
Holbert, 2012), and neuromarketing is the window that reveals and
gives access to these emotions and feelings (Green &Holbert,
2012; Ohme & Matukin, 2012; Fisher, Chin &Klitzman, 2010).
When gaining insights from the brain processes of customers,
researchers will be able to understand, assess, and predict the
customers’ behaviours and preferences (Fisher et al., 2010, Hubert
& Kenning, 2008; Perrachione &Perrachione, 2008). Some
contemporary studies declared that approximately 80% of all new
products fail within its first three years in the markets; thus, further
associations should be made between newly invented products and
actual user requirements ( Calvert & Brammer, 2012). Companies
started to adopt the concept of neuromarketing after they had
assumed that there is an implicit and automatic process which
determine the decision making process that will reveal secret
information about customers behaviours which is not obtainable
by the traditional marketing methods( Ariely & Berns, 2010;
Senior, & Lee, 2008). Eye tracking, skin conductance, and brain
imaging tools (e.g., FMRI, EEG) are considered as psychological
tools of neuromarketing that received increasing attention from
specialists because it helps to make brain observations during the
execution of certain tasks, which provides marketers with
additional secret information about customers (Lieberman, 2007;
Dimoka, Banker, Benbasat, Davis, Dennis, Gefen, &Weber, 2012;
Calvert, &Brammer, 2012; Ariely & Berns, 2010; Venkatraman
et al., 2012). Other researchers assessed neuromarketing as a field
resulting from the relationship between two or more sciences.
According to Senior & Lee (2008), neuromarketing consists of
marketing research domain based on social psychology,
econometrics and social sciences, while Garcia & Saad (2008) and
Hubert & Kenning (2008) associate neuromarketing with the
sciences of consumer behavior and cognitive neuroscience.
According to some researchers, the application of consumer
neuroscience in marketing and consumer researchers has
generated new insights into various facets of branding such as
brand perception (Litt and Shiv 2012; Milosavljevic et al. 2012),
brand evaluation (Esch et al. 2012; Estes et al. 2012; Saad and
Stenstrom 2012), brand preferences (Venkatraman et al. 2012;
Berns and Moore 2012; Yilmaz et al. 2014), brand relationships
(Aggarwal and Larrick 2012; Reimann et al. 2012), pricing
(Plassmann et al. 2007), product packaging (Reimann et al. 2010;
Stoll et al. 2008), brand naming (Hillenbrand et al. 2013), green
consumption (Lee et al. 2014), advertising (Treleaven-Hassard et
al. 2010; Vecchiato 2011), and new product development (Ariely
and Berns 2010).
2.2. Competitiveness:
Competitiveness is a multidimensional concept. It can be
studied from three different levels: country, industry, and firm
level. Competitiveness originated from the Latin word,
”competer”, which means involvement in a business competition
for markets. It has become familiar to describe the economic
strength of an entity with respect to its competitors in the global
market economy in which goods, services, people, skills, and ideas
move freely across geographical borders (Saboniene, 2009;
Malakauskaite, Navickas, 2010). That is to say, it is the ability to
compete. In the literature the word “competitiveness” conveys a
different meaning when applied to an individual firm or an
individual sector or economic activity within a country or region.
A systematic search of the academic literature revealed that
competitiveness is a major issue (Dunning, 1995), it has still not
been a well defined concept (Martin, Westgren and Duren, 1991;
Conner, 2003). Although, many researchers have tried to
determine the concept of competitiveness as a multidimensional
and relative concept (Spence and Hazard, 1988). The support of
this is that different attributes of competitiveness change with time
and context (Ambastha and Momaya, 2004). The dynamic
development of competitiveness research requires the more
frequent and specific analysis with up to date factors. Cook and
Bredahl (1991) stated that competitiveness can be viewed from the
perspective of geographic area, product, or time. The
competitiveness is defined by enormous amount of factors and
determinants depending on the scale, focus, and objectives of the
research. Some studies presented many perspectives and
frameworks at the country, industry and firm level. While some
studies focused on individual firm and its strategies for global
operations, some others observed the role of management in
competition (Oral, 1993; Offstein et al., 2007). The US
Competitiveness Policy Council (1998) defines competition as the
capability of producing goods/services at an international quality
that can compete at international markets, resulting continuous
increase in the welfare of a nation. From Porter (1990) point of
view should be a further emphasis on the productive use of
resources in a nation as a good measure for competitiveness. DC
(2001) stated that Competitiveness involves “a combination of
assets and processes, where assets are inherited (natural resources)
or created (infrastructure) and processes transform assets to
achieve economic gains from sales to customers. Some authors
view competitiveness with the competency approach. They
emphasized on the role of internal factors of the firms to enhance
competitiveness such as firm strategy, structures, competencies,
capabilities to innovate, and other tangible and intangible
resources for their competitive success (Bartlett and Ghoshal,
1989; Doz and Prahalad, 1987; Hamel and Prahalad, 1989, 1990).
The ability to develop capabilities and talents far more effectively
than competitors can help in achieving world-class
competitiveness (Smith, 1995). Johnson (1992) declared that for
providing greater value and satisfaction for customers than their
competitors, companies must be operationally efficient, cost
effective, and quality conscious.
2.3. Terminologies:
2.3.1 Neuromarketing:
Many authors have defined Neuromarketing and some
definitions are presented below;
Neuromarketing is the process of researching the brain
patterns of consumers to reveal their responses to particular
advertisements and products before developing new advertising
campaigns and branding techniques (Collins Dictionary).
Neuromarketing is the study of the cerebral mechanism to
understand the consumer’s behaviour in order to improve the
marketing strategies (Smidts, 2002).
applying the methods of the neurology lab to the questions
of the advertising world’’ (Thompson 2003).

International Journal of Scientific and Research Publications, Volume 10, Issue 1, January 2020 556
ISSN 2250-3153
http://dx.doi.org/10.29322/IJSRP.10.01.2020.p9783 www.ijsrp.org
Neuromarketing aims to understand how consumers think
and why the consumer chooses the products by applying
“neuroscientific methods to analyze and understand human
behaviour in relation to markets and marketing exchanges” (Lee
et al, 2007).
Neuromarketing is the application of findings from
neuroscientific consumer research within the scope of managerial
practice (Kenning & Hubert, 2008).
Neuromarketing is mostly defined as a new field of
marketing research studying consumers’ cognitive and affective
responses to different marketing stimuli (Zaltman & Zaltman,
2008; Boricean, 2009; Dooley, 2010).
Neuromarketing is a relatively new and controversial
interdisciplinary research field, a component of marketing, by
means of which one can properly interpret psychological and
neurological knowledge necessary to understand customer
behaviour (Constensen, 2011).
Neuromarketing is defined as the obtaining of information
useful for marketers by subjecting individuals to functional
magnetic resonance imaging (fMRI) and other similar methods of
studying automatic responses in the brain to certain stimuli,
generally involving products and brands that are part of consumer
culture (Berger, 2011).
Neuromarketing is a subset of the study of neuroeconomics,
which combines neuroscience, genetics, economics, and
psychology to understand how specific neuron activation may lead
to larger scale market behaviour, (Levallois et al, 2012).
Neuromarketing is widely defined as the science that uses
MRI (magnetic resonance imaging),
EEG(electroencephalography), TMS (transcranial magnetic
stimulation), fMRI (functional magnetic resonance imaging) and
other brain wave tools to view the human brain’s responses to
marketing stimuli to figure out what customers’ thoughts are
toward a product, service, advertisement, or even packaging to
perfectly construct marketing campaigns that are based on the
human brain’s response, (Hammou et al, 2013).
Neuromarketing refer to a commercialized market research
method for studying brain activity that combines the
methodologies of neuroscience and behavioural psychology to
generate greater understanding about how consumers respond to
products, brands, and advertising stimuli. These insights are then
used to inform the development of advertising strategies that are
designed primarily to “nudge” particular demographic groups or
population segments to take consumptive action. (Nemorin , S., &
Gandy, Jr, O.H. 2017)
2.3.2 Neuromarketing Activities:
The marketing actions carried out by the institutions through
consumers’ brain researches to identify factors, variables and
motivations, whether in demographic, psychological, behavioural,
mental or emotional terms that associated with the purchase
decision or preferences for certain brands. (Wyer Jr & Xu, 2010)
2.3.3. Neuromarketing Techniques:
The methods and devices used in the field of
neuromarketing alongside the marketing activities related to
consumer behaviour and variables associated with it. The overall
goal of using neuromarketing techniques is to understand the
interconnection between marketing activities and the response
upon that from consumers. (Kumlehn, 2011)
2.3.4. Competitiveness:
Related to the activities and aspects that enable the telecom
company to achieve excellence from competitors by providing
service quality, using methods that meet the needs of customers,
occupying a market share and increase continuously, distinction
prices from competitors, increasing profit and productivity
efficiently and effectively. (The researcher)
III. STATEMENT OF PROBLEM
For (Airtel) to keep its maintenance and gain customer
satisfaction and loyalty in the complex and competitive market of
today they should pay more attention to apply neuromarketing as
a new marketing strategy that help in recognizing the thoughts,
needs, and feelings of their customers. Thus, it could be easier to
meet their needs to achieve customer loyalty and retention, so
consequently (Airtel) can save its market share. Accordingly, the
statement of the problem can be stated in the following questions:
IV. RESEARCH QUESTIONS
4.1. Main Question:
Is there any relationship between the application of
neuromarketing and competitiveness?
4.2. Sub Questions:
a) What are the requirements and factors associated with the
marketing activity related to the application of neuromarketing?
b) What are the technical factors that contribute to the
application of neuromarketing?
V. RESEARCH OBJECTIVES
The general objective of this study is to explore the
relationship between the application of neuromarketing and
competitiveness in telecom sector from the perspective of the
marketing and sales processes department staff of (Airtel).
Particularly the study seeks:
a) To identify the relationship between requirements and
factors associated with the marketing activity related to the
application of neuromarketing and competitiveness in telecom
sector.
b) To identify the relationship between technical factors that
contributes to the application of neuromarketing and
competitiveness in telecom sector.
VI. DELIMITATION OF THE STUDY
The sample of this study covers the employees of one
company (Airtel) that share the market share of
telecommunication sector in India with its competitors, so there is
a need for another study that takes into consideration the whole
telecommunication sector in India.

International Journal of Scientific and Research Publications, Volume 10, Issue 1, January 2020 557
ISSN 2250-3153
http://dx.doi.org/10.29322/IJSRP.10.01.2020.p9783 www.ijsrp.org
* The responses of the study have been collected from
employees from Delhi and Aligarh. The responses of the
employees of Airtel in Delhi and Aligarh may vary from those of
the rest of India.
* The employees of only one Telecom Company were
selected for the present study. As a result, the generalization of the
findings of the present study should be considered carefully.
*The present study has adopted two dimensions of
neuromarketing as suggested in previous studies taking in
consideration the circumstances of the telecom sector employees
in India. For this, a total of 26 parameters belonging to these 2
dimensions were used to measure the responses of the employees
about neuromarketing. There may still a possibility of adding
some new dimensions or some more parameters to the existing
dimensions.
* Convenient sampling technique has been used for the
collection of data from the respondents; thus, the generalization of
the results should be looked carefully.
* The current study as all studies that are based on the
primary data collected by the predesigned questionnaire suffers
from the possibility of dissimilarity between what is recorded and
what is the truth of the respondents’ answers.
* It was not possible for the respondents to explain certain
points related to the questions because the vital source of
collecting the primary data was standardized and structured
questionnaires with two open questions.
VII. HYPOTHESIS OF THE STUDY
7.1. Main Hypothesis
There is no a significance relationship between the
application of neuromarketing and competitiveness in telecom
sector in India.
7.2. Sub hypotheses:
a) There is no significance relationship between the
application of neuromarketing activities and competitiveness.
b) There is no significance relationship between the
application of neuromarketing technology and techniques and
competitiveness.
VIII. RESEARCH METHODOLOGY
8.1. Research Design
Analytical descriptive method has been used to sustain
quantitative measurement and analysis. Data has been collected
through different means which include:
Secondary resources: To introduce the conceptual
literature of neuromarketing and competitiveness, the researcher
has depended on books, periodicals, articles, published papers and
referred previous studies in different countries which have been
conducted on the same subject, the Internet sites and the available
electronic versions.
Primary resources: a questionnaire and interviews have
been used as a primary tool for gathering data from the employees
of (Airtel) Company in order to analyze the qualitative and
quantitative characteristics of the phenomena.
8.2. Study Population/Sample
The population of the study consists of the employees of
marketing and sales processes of Airtel Company for
telecommunications, which is one of a well-known companies in
India.
The sample consists of a total of (200) employees who are
patronizing marketing and sales processes departments of Airtel
Company. They have been requested to complete questionnaires
(self designed with the help of ( Mohammad, E., 2012) that
captured all the variables contained measures of the constructs of
concern.
Sampling Method/ Sample Size:
The convenient sampling method has been used (200)
Questionnaires administered to the respondents. All (200)
questionnaires were dully filled and returned.
8.3. Data Collection Instrument:
The study employed a questionnaire as an instrument for
data collection. The questionnaire was divided into four sections.
Section (1) measures the demographic attributes of the
respondents which include: academic qualifications, career level,
years of experience in telecom sector, while section (2) measures
three variables (neuromarketing activities which contains: items to
measure the ability of implementing neuromarketing activities,
items to measure the ability of applying marketing research, and
items to measure the style of implementing Neuromarketing
activities, neuromarketing technology and techniques, and
competitiveness). The items were measured on a 5-point Likert
Scale ranging from strongly agree (5) to strongly disagree (1). In
terms of section 4, 5, they are open questions.
IX. DATA ANALYSIS
9.1. Methods of Data Analysis
The Statistical Package for Social Sciences (SPSS) was used
to analyze the data. The following statistical procedures were
used:
* Cronbach's alpha coefficient and correlation coefficients
were calculated to assure the reliability and validity of study
scales.
* Frequencies and percentages were calculated to describe
the characteristics of the sample respondents.
* Descriptive statistics analysis was used to summarize the
respondents’ answers and to ranking the sub-items of each
dimension.
* Correlation analysis was carried out to test the presence,
strength and direction of the potential relationships among the
variables of the study.
Reliability of the Scale
To check the reliability of the study instruments, cronbach's
alpha coefficient was calculated. This coefficient generally varies
between zero (for no reliability) and unity (for maximum
reliability). Any values equal to or above 0.6 denote that the scale
is of acceptable reliability. The closer the value is 1; the more
reliable a scale.

International Journal of Scientific and Research Publications, Volume 10, Issue 1, January 2020 558
ISSN 2250-3153
http://dx.doi.org/10.29322/IJSRP.10.01.2020.p9783 www.ijsrp.org
Table(1) demonstrates that all reliability coefficient are
acceptable, since they all exceed the benchmark of 0.60
Table (1): Values of cronbach's alpha coefficient
alpha
coefficient
No. of item Scale
0,753 14 Neuromarketing Activities
0.842 12 Neuromarketing
Techniques
0.881 13 Competitiveness
9.3. Validity Analysis of the results
Self-Validity
Table (2) shows values of self-validity coefficient of the
study scale. The coefficient is defined as the square root of the
reliability coefficient; Cronbach's alpha.
Table (2): Values of self-validity coefficient
alpha
coefficient
No. of item Scale
0,713 14 Neuromarketing Activities
0.804 12 Neuromarketing
Techniques
0.829 13 Competitiveness
The results indicate that the self-validity coefficient ranges
between 0.713 and 0.829. These values are considered high and
acceptable .
Internal consistency validity
To ensure the validity of internal consistency, the
correlation coefficient between each item and the dimension to
which it belongs was calculated. The results are shown in table (3)
Table (3): Correlation coefficients between each dimension and its items
Dimensions and Items
Correlation coefficient
Value Sig.
Neuromarketing Activities Items:
1 Airtel is studying the customers’ behaviors in depth. .721** .000
2 Airtel takes into consideration the mental aspects of its customers and
imply them in the marketing activities.
.584** .000
3 Airtel has the techniques to recognize the emotional aspects of its
customers.
.689** .000
4 Airtel is able to identify the psychological factors associated with its
customers.
.711** .000
5 Airtel is able to identify the demographic attributes for customers. .715** .000
6 Airtel is able to identify the patterns of customers’ buying behaviors. .731** .000
7 Airtel is interested to know the mental motivations of customers. .585** .000
8 Airtel is interested in applying marketing research to identify
customers’ behaviors.
.699** .000
9 Airtel implements the results of marketing research in its marketing
activities.
.851** .000
10 Airtel is interested to know the ways of customers’ thinking. .692** .000
11 Airtel is able to determine the customer’ preferences. .622** .000
12 I consider the Neuromarketing strategy is suitable for improving the
marketing concepts and capabilities.
.801** .000
13 Airtel is able to get help from external specialists to analyze the
psychological behaviors of its customers.
.675** .000
14 Airtel is able to get help from external specialists to analyze the mental
and emotional behaviors of its customers.
.780** .000
Technical and technological factors for neuromarketing items:
1 Airtel provides the essential technical equipments for marketing
research.
.844** .000
2 Airtel develops the techniques used to market its services. .827** .000
3 Airtel can provide sensors that investigate consumers’ behavior. .713** .000
4 Airtel may seek to establish a laboratory for customers’ brain
measurements.
.646** .000
5 Airtel can attract a sample of volunteer customers to conduct
marketing research in its laboratory.
.539** .000

International Journal of Scientific and Research Publications, Volume 10, Issue 1, January 2020 559
ISSN 2250-3153
http://dx.doi.org/10.29322/IJSRP.10.01.2020.p9783 www.ijsrp.org
6 Airtel has the ability to provide neuromarketing devices and
equipments to study customers’ behaviors.
.778** .000
7 Airtel needs specialists in the field of neroumarketing. .867** .000
8 Airtel takes into account the improvement of systems and software in
line with the results of customers’ behaviors research.
.678** .000
9 Airtel has equipments to provide services consistent with the behaviors
and needs of its customers.
.717** .000
10 I believe that if Airtel uses neuromarketing techniques and technology,
it will achieve a significant development in customers’ services.
.756** .000
11 I believe that the use of neuromarketing will enhance the market share. .565** .000
12 I believe that neuromarketing techniques and technology can be used
to face competition with other telecom companies.
.695** .000
Competitiveness Items
1 Airtel has a specialized staff in providing and developing its services. .877** .000
2 Airtel develops an appropriate marketing mix to face the competition. .638** .000
3 Airtel is able to innovate and expand its services. .668** .000
4 Airtel has the ability to reduce the cost of activities without affecting
on its profitability.
.526** .000
5 Airtel has its own pioneer brand in the market .860** .000
6 There is an annual increase in the market share of Airtel .715** .000
7 Airtel seeks to target new segments of society. .626** .000
8 Airtel has a positive brand image. .514** .000
9 Airtel analyzes competition and competitors then develops its services
accordingly.
.606** .000
10 Airtel analyzes the customers’ needs and implies them in the provided
services.
.573** .000
11 Airtel has distinctive techniques to serve customers compared to other
telecom companies.
.673** .000
12 Airtel provides its services by using distinctive methods and
procedures.
.515** .000
13 Airtel works efficiently and effectively in the domestic markets. .625** .000
**. Correlation is significant at the 0.01 level (2-taild).
From the above table, it is concluded that:
The "neuromarketing activities" dimension correlates
positively and strongly, with its items. The values of the
correlation coefficient range between .584 and 0.851 and
all are significant at the 5% level of significant.
The "Neuromarketing technology and techniques"
dimension correlates positively and strongly, with its
items. The values of the correlation coefficient range
between 0.539 and 0.880 and all are significant at the 5%
level of significant.
The "competitiveness" dimension correlates positively
and strongly, with its items. The values of the correlation
coefficient range between 0.514 and 0.877and all are
significant at the 5% level of significant.
9.4. Characteristics of respondents: The following table shows the main characteristics of the
sample respondents.
Table ( 4 ): Characteristics of the sample respondents
Characteristics N %
Academic
Qualification
Diploma 45 22.5
Bachelor 102 51
High
Education
53 26.5
Total 200 100
Career Level
Top
management
15 7.5
Middle
management
57 28.5
Low
management
& first line
employees
128 64
Total 200 100
Years of Experience
in telecom sector
1- 5 63 31.5

International Journal of Scientific and Research Publications, Volume 10, Issue 1, January 2020 560
ISSN 2250-3153
http://dx.doi.org/10.29322/IJSRP.10.01.2020.p9783 www.ijsrp.org
5- 10 94 47
Above 10 43 21.5
Total 200 100
It can be concluded from the table above that:
The sample consisted of 200 respondents; of whom 45
have diploma (22.5%), 102 have bachelor (51%), and 53
have a high education (26.5%).
Regarding career level; more than a half of the total
sample unites (64%) are in low management and first line
employees, while (57%) of the respondents are in middle
management, and (15%) are working in top management.
In terms of years of experience in telecom sector, (31.5%)
of the respondents have experience between 1-5 years,
(47%) were between 5-10 years, while (21.5%) of the
respondents their experience above 10 years.
X. TESTING HYPOTHESES
Testing sub hypothesis (a):
H(a): There is no significance relationship between the
application of neuromarketing activities and competitiveness.
To test this hypothesis, simple regression and correlation
analysis were used. The dependent variable was
competitiveness, and the independent variable was the application
of neuromarketing activities. The results of the analysis are shown
in table (5).
Table ( 5 ): Results of simple regression and correlation
analysis for testing the first hypothesis
Independent
variable
B
T-Test
R
R-Square
Value Sig.
Customer
satisfaction
0.601 13.682 0.000 .623 .393
Source: SPSS_ Output (based on Survey data)
Correlation is significant at the 0.05 level (2-tailed).
It can be concluded from the above table:
There is a significant positive correlation between the
application of neuromarketing activities and
competitiveness. It is pertinent to mention that all the
correlations are significant at 0.05% level of significance.
The value of the correlation coefficient (R) between the
independent variable (the application of neuromarketing
activities) and the dependent variable (competitiveness)
is 0.623 indicating moderate correlation.
As evident from the Table (t= 13.682) the application of
neuromarketing activities shows significant positive
relationship with competitiveness (t > 1.96, p < .05).
The value of the coefficient of determination (R-square)
is 0.393, which means that the application of
neuromarketing activities explains 39.3% of the variance
in competitiveness.
Thus, the first sub hypothesis is accepted.
This means that the application of neuromarketing
activities is positively related to competitiveness and there is a
direct relationship between the tested variables above, although
only 39% of the change in competitiveness can be attributed to the
application of neuromarketing activities. This shows to some
extent that the application of neuromarketing activities is a reliable
predictor of competitiveness.
Testing sub hypothesis (b):
H(b): There is no significance relationship between the
application of neuromarketing technology and techniques and
competitiveness.
To test this hypothesis, simple regression and correlation
analysis were used also. The dependent variable was
competitiveness, and the independent variable was the application
of neuromarketing technology and techniques. The results of the
analysis are shown in table (6).
Table ( 6 ): Results of simple regression and correlation analysis for testing the first hypothesis
Independent
variable
B
T-Test
R
R-Square
Value Sig.
Customer
satisfaction
0.520 16.101 0.000 .598 .413
Source: SPSS_ Output (based on Survey data)
Correlation is significant at the 0.05 level (2-tailed).
It can be concluded from the above table:
There is a significant positive correlation between the
application of neuromarketing technology and
techniques and competitiveness. It is important to
mention that all the correlations are significant at 0.05%
level of significance.
The value of the correlation coefficient (R) between the
independent variable (the application of neuromarketing
technology and techniques) and the dependent variable
(competitiveness) is 0.598 indicating moderate
correlation.
As evident from the Table (t= 16.101) the application of
neuromarketing technology and techniques shows a

International Journal of Scientific and Research Publications, Volume 10, Issue 1, January 2020 561
ISSN 2250-3153
http://dx.doi.org/10.29322/IJSRP.10.01.2020.p9783 www.ijsrp.org
significant positive relationship with competitiveness (t
> 1.96, p < .05).
The value of the coefficient of determination (R-square)
is 0.413, which means that the application of
neuromarketing technology and techniques explains
41.3% of the variance in competitiveness.
Thus, the second sub hypothesis is accepted.
This means that the application of neuromarketing
technology and techniques is positively related to competitiveness
and there is a direct relationship between the tested variables
above, although only 41% of the change in competitiveness can be
attributed to the application of neuromarketing technology and
techniques. This shows to some extent that the application of
neuromarketing technology and techniques is a reliable predictor
of competitiveness.
Testing the main hypothesis:
The main hypotheses were conducted to evaluate the
existence of a positive relationship between the application of
neuromarketing and competitiveness.
H: There is no significance relationship between the
application of neuromarketing and competitiveness in telecom
sector in India.
To test this hypothesis, simple regression and correlation
analysis were used. The dependent variable was competitiveness,
and the independent variable was the application of
neuromarketing. The results of the analysis are shown in table (5).
Table ( 5 ): Results of simple regression and correlation
analysis for testing the first hypothesis
Independent
variable
B
T-Test
R
R-Square
Value Sig.
Customer
satisfaction
0.609 18.312 0.000 .766 .673
Source: SPSS_ Output (based on Survey data)
Correlation is significant at the 0.05 level (2-tailed).
It can be concluded from the above table:
There is a significant positive correlation between the
application of neuromarketing competitiveness. It is
pertinent to mention that all the correlations are
significant at 0.05% level of significance.
The value of the correlation coefficient (R) between the
independent variable (the application of neuromarketing)
and the dependent variable (competitiveness) is 0.766
indicating a high correlation.
As evident from the Table (t= 18.312) the application of
neuromarketing shows a significant positive relationship
with competitiveness (t > 1.96, p < .05).
The value of the coefficient of determination (R-square)
is 0.673, which means that the application of
neuromarketing explains 67.3% of the variance in
competitiveness.
Thus, the main hypothesis is accepted.
This means that the application of neuromarketing is
positively related to competitiveness and there is a direct
relationship between the tested variables above and67% of the
change in the competitiveness can be attributed to application of
neuromarketing. This shows to some extent that the application of
neuromarketingis a reliable predictor of competitiveness.
XI. CONCLUSION
The study examines “relationship between the application of
neuromarketing and competitiveness in telecom sector in India.”
This study guided by objectives and three research questions, three
hypotheses were proposed (one main hypothesis and two sub
hypotheses). The dimensions of neuromarketing in telecom sector
were identified from extent literature which includes the
application of neuromarketing activities and the application of
neuromarketing technology and techniques. Furthermore, the
application of neuromarketing and competitiveness was
investigated. A research framework was developed relating the
application of neuromarketing and competitiveness. The
application of neuromarketing exerted a significant and a strong
relationship with competitiveness.
XII. SUGGESTIONS
The study has found a positive relationship between the
application of neuromarketing and competitiveness in
telecom sector in India; thus, telecom companies should
make efforts to increase their competitiveness in the
market by the application of neuromarketing system as a
new and critical strategy to understand the needs and
thoughts of the customers then they gain customers’
satisfaction and loyalty.
Telecom sector companies should introduce new
innovative services.
Telecom sector companies should also focus on
competitiveness by enhancing internal competitiveness
(i.e., improve the standers of employees selection,
development, rewards, and recognition). Consequently,
employee satisfaction will lead to external
competitiveness.
Telecom sector companies should also focus on
competitiveness by enhancing the application of
neuromarketing activities and techniques to ease the
access to the customers.
REFERENCES
[1] Aggarwal P, Larrick RP (2002) When consumers care about being treated fairly: the interaction of relationship norms and fairness norms. J ConsumPsychol 22(1):114–127.
[2] Ambastha, A., K. Momaya (2004): Competitiveness of Firms: Review of Theory, Frameworks and Models, Singapore Management Review, Vol.26, No. 1; First half 2004, pp. 45-6.
[3] Ariely, D., & Berns, G. S. (2010). Neuromarketing: The hope and hype of neuroimaging in business. Nature Reviews Neuroscience, 11(4), 284-292.
International Journal of Scientific and Research Publications, Volume 10, Issue 1, January 2020 562
ISSN 2250-3153
http://dx.doi.org/10.29322/IJSRP.10.01.2020.p9783 www.ijsrp.org
[4] Bartlett A and S Ghoshal (1989) Managing Across Borders, Harvard Business School Press, Boston, MA.
[5] Berger, A.A (2011). Neuromarketing, Encyclopaedia of Consumer Culture, pp 1040-1041.
[6] Berns GS, Moore SE (2012) A neural predictor of cultural popularity. J ConsumPsychol 22(1):154–160.
[7] Boricean, V. (2009). Brief History of Neuromarketing .
[8] . http://www.itchannel.ro/faa/119-pdfsam_ICEA_FAA_2009.pdf Accessed 15 March 2018.
[9] Calvert, G. A., & Brammer, M. J. (2012). Predicting consumer behavior: using novel mind-reading approaches. Pulse, IEEE, 3(3), 38-41.
[10] Cook, M. L., & Bredahl, M. E. (1991). Agribusiness Competitiveness in the 1990s: Discussion. American Journal of Agricultural Economics, (5), 1472.
[11] DC (2001) Destination Competitiveness: Development of a Model with Application to Australia and the Republic of Korea, An Australian Govt Report, October.
[12] Dimoka, A., Banker, R. D., Benbasat, I., Davis, F. D., Dennis, A. R., Gefen, D., & Weber, B. (2012). On the use of neurophysiological tools in IS research: developing a research agenda for neurois. MIS Quarterly, 36(3).
[13] Dooley, R (2010). Baby pictures do really grab our attention. http://www.neurosciencemarketing.com/blog/article/babies-in-ads-htms Accessed 15 March 2018
[14] Doz YL and CK Prahalad (1987) The Multinational Mission, New York, The Free Press
[15] Dunning, J.H. (1995). ‘Commentary/point, Think again Professor Krugman: competitiveness does matter’, International Executive, 37(4): 315.
[16] Esch FR, Mo ¨ll T, Schmitt B, Elger CE, Neuhaus C, Weber B (2012) Brands on the brain: do consumers use declarative information or experienced emotions to evaluate brands? J ConsumPsychol 22(1):75–85.
[17] Estes Z, Gibbert M, Guest D, Mazursky D (2012) A dual-process model of brand extension: Taxonomic feature-based and the maticrelation-based similarity Independently drive brand extension evaluations. J ConsumPsychol 22(1):86–101.
[18] Fisher, C. E., Chin, L., & Klitzman, R. (2010). Defining neuromarketing: Practices and professional challenges. Harvard Review of Psychiatry, 18(4), 230-237. http://dx.doi.org/10.3109/10673229.2010.496623
[19] Fugate, D. L. (2007). Neuromarketing: A layman's look at neuroscience and its potential application to marketing practice. Journal of Consumer Marketing, 24(7), 385-394.
[20] Green, S., & Holbert, N. (2012). Gifts of the neuro-magi: Science and speculation in the age of neuromarketing. Marketing Research, 24(1), 10-14.
[21] Hamel G and CK Prahalad (1989) “Strategic Intent”, HBR, No 3, pp 63–76.
[22] Hammou, K.A., Galib, H., & Melloul, J (2013). The contributions of neuromarketing in marketing research, Macrothink Institute Journal of Management Research, 5 (4): 20-23.
[23] Hillenbrand P, Alcauter S, Cervantes J, Barrios F (2013) Better branding: brand names can influence consumer choice. J Prod Brand Manag 22(4):300–30.
[24] Hubert, M., & Kenning, P. (2008). A current overview of consumer neuroscience. Journal of Consumer Behaviour, 7(4‐5), 272-292.
[25] Javor, A., Koller, M., Lee, N., Chamberlain, L., & Ransmayr, G. (2013). Neuromarketing and consumer neuroscience: Contributions to neurology. BMC Neurology, 13(1), 1-12.
[26] Johnson HT (1992) Relevance Regained, The Free Press, New York, NY.
[27] Kumlehn, M. (2011). Consumer Neuroscience: Pricing research to gain and sustain a cutting edge competitive advantage by improving customer value and profitability.
[28] Lee EJ, Kwon G, Shin HJ, Yang S, Lee S, Suh M (2014) The spell of green: can frontal EEG activations identify green consumers? J Bus Ethics 122(3):511–52.
[29] Lee, N., Broderick, A.J., and Chamberlain, L (2007). What is neuromarketing? A discussion and agenda for future research, International Journal of Psychophysiology, 63 (2): 199-204.
[30] Lee, N., Broderick, L., & Chamberlain, L. 2007. What is ‘neuromarketing’? A discussion and agenda for future research. International Journal of Psychophysiology, 63, 200–204.
[31] Levallois, C., Clithero, J.A., Wouters, P., Smidts, A., and Huettel, S.A (2012). Translating upwards: linking the neural and social sciences via neuroeconomics, Nature Reviews, Neuroscience, 13 (11): 789-797.
[32] Lieberman, M. D. (2007). ―Social Cognitive Neuroscience: A Review of Core Processes,‖ Annual Review of Psychology (58), pp. 259-289.
[33] Litt A, Shiv B (2012) Manipulating basic taste perception to explore how product information affects experience. J Consum Psychol 22(1):55–66.
[34] Malakauskaite, A., & Navickas, V. (2015). Relation between the level of cauterization and tourism sector competitiveness. Engineering Economics, 66(1).
[35] Marci, C. D. (2008). Minding the gap: The evolving relationships between affective neuroscience and advertising research. International Journal of Advertising, 27(3), 473-475.
[36] Martin, L., Westgren, R., & van Duren, E. (1991). Agribusiness Competitiveness across National Boundaries. American Journal of Agricultural Economics, (5), 1456.
[37] Milosavljevic M, Navalpakkam V, Koch C, Rangel A (2012) Relative visual saliency differences induce sizable bias in consumer choice. J ConsumPsychol 22(1):67–74
[38] Mohammad, E., (2012). The relationship between the application of neuromarketing and the competitiveness of commercial banks: an empirical study of a sample of commercial banks in Egypt .Arab Journal of Administrative sciences. 19. 3.
[39] Nemorin , S., & Gandy, Jr, O.H. (2017). Exploring Neuromarketing and Its Reliance on Remote Sensing: Social and Ethical concerns. International Journal of Communication, 11, 21.
[40] Offstein, E., Harrell-Cook, G. and Tootoonchi, A. (2007), “Executive discretion as a driver of firm competitiveness”, Advances in Competitiveness Research, Vol. 15 Nos 1/2, pp. 1-14.
[41] Ohme, R.,& Matukin, M., (2012). A small frog that makes a big difference: Brain wave testing of TV advertisements. IEEE pulse, 3(3), 28-33.
[42] Oral, M. (1993), “A methodology for competitiveness analysis and strategy formulation in glass industry”, European Journal of Operational Research, Vol. 66 No. 14, pp. 132-45.
[43] Perrachione, T. K., & Perrachione, J. R. (2008). Brains and brands: Developing mutually informative research in neuroscience and marketing. Journal of Consumer Behavior, 7(4‐5).
[44] Plassmann H, O’Doherty J, Rangel A (2007) Orbitofrontal cortex encodes willingness to pay in everyday economic transactions. J Neurosci 27(37):9984–9988.
[45] Porter, M.E. (1990), Competitive Advantage of Nations, The Free Press, New York, NY.
[46] Reimann M, Castan ˜o R, Zaichkowsky J, Bechara A (2012) How we relate to brands: Psychological and neurophysiological insights into close consumer brand relationships. J Consum Psychol 22(1):128–142.
[47] Saad G, Stenstrom E (2012) Calories, beauty, and ovulation: the effects of the menstrual cycle on food and appearance related consumption. J ConsumPsychol 22(1):102–113.
[48] Saboniene, A. (2015). Lithuanian export competitiveness: comparison with other Baltic States. Engineering Economics, 62(2).
[49] Senior, C., & Lee, N. (2008). Editorial: A manifesto for neuromarketing science
[50] Smidts, A (2000). Look in the Brain on the possibilities of neuromarketing, Inaugural Addresses, Research in Management Series, Erasmas Research Institute of Management.
[51] Smith S (1995) “World Class Competitiveness”, Managing Service Quality, vol. 5, no 5, pp 36–42.
[52] Spence, M., Hazard, H. (1988), (eds.) International Competitiveness. Ballinger. Cambridge. Mass.
[53] Stoll M, Baecke S, Kenning P (2008) What they see is what they get? An fMRI-study on neural correlates of attractive packaging. J Consum Behav 7(4–5):342–359.
[54] The US Competitiveness Policy Council (1998), “Building a competitive America”, First Report to the President and Congress, March.
[55] Thompson, Clive. 2003. There’s a Sucker Born in Every Medial Prefrontal Cortex. New York Times Magazine, October 25.
[56] Treleaven-Hassard S, Gold J, Bellman S, Schweda A, Ciorciari J, Critchley C, Varan D (2010) Using the P3a to gauge automatic attention to interactive television advertising. J Econ Psychol 31(5):777–784.

International Journal of Scientific and Research Publications, Volume 10, Issue 1, January 2020 563
ISSN 2250-3153
http://dx.doi.org/10.29322/IJSRP.10.01.2020.p9783 www.ijsrp.org
[57] Vecchiato, G, Toppi. J, Astolfi L, Fallani FDV, Cincotti F, Mattia D, Babiloni F (2011) Spectral EEG frontal asymmetries correlate with the experienced pleasantness of TV commercial advertisements. Med BiolEngComput 49(5):579– 583.
[58] Venkatraman V, Clithero JA, Fitzsimons GJ, Huettel SA (2012) New scanner data for brand marketers: how neuroscience can help better understand differences in brand preferences. J ConsumPsychol 22(1):143–153.
[59] Venkatraman, V., Clithero, J. A., Fitzsimons, G. J., &Huettel, S. A. (2012). New scanner data for brand marketers: How neuroscience can help better understand differences in brand preferences. Journal of Consumer Psychology, 22(1), 143-153.
[60] Wyer Jr., Robert S. & Xu, Alison Jing. 2010. The Role of Behavioral Mind- Sets in Goal- Directed Activity Conceptual: Underpinnings and Cognitive Loyalty. Australasian marketing journal, 18 (1).
[61] Yilmaz B, Korkmaz S, Arslan DB, Gu ¨ngo ¨r E, Asyalı MH (2014) Like/dislike analysis using EEG: determination of most discriminative channels and frequencies. Comput Methods Prog Biomed 113(2):705–713.
[62] Zaltman, G., and Zaltman, L (2008). Marketing Metaphoria , Harvard Business Press.
AUTHORS
First Author – Dr. Fidaa O. D. Safi, Economic and
Administrative science, Assistant professor at Al- Azhar
University- Gaza
Second Author – Dr. Marwan S. Alagha, Assistant professor at Al-
Azhar University- Gaza

International Journal of Scientific and Research Publications, Volume 10, Issue 1, January 2020 564
ISSN 2250-3153
http://dx.doi.org/10.29322/IJSRP.10.01.2020.p9784 www.ijsrp.org
Evaluation of knowledge regarding adverse drug
reaction and its reporting among dentists in GDC,
Hyderabad - A KAP study
Sneha Menga
DOI: 10.29322/IJSRP.10.01.2020.p9784
http://dx.doi.org/10.29322/IJSRP.10.01.2020.p9784
Abstract- Adverse drug reactions was defined by WHO as a
response of a drug which is noxious and unintended and which
occurs at doses normally used in man for prophylaxis , diagnosis
or therapy of a disease or for the modification of physiological
function.1 Detection, recording & reporting of ADR has become
vital & health care professionals should be encouraged to execute
ADR reporting to ensure safer use of medication Many K A P
studies about ADR were conducted among medical professionals
& few among dental professionals. Hence current study was
conducted to asses K A P of adverse drug reactions and its
reporting among dentists.
AIM:
The aim of study is to evaluate knowledge and attitude of
dentists about ADR & its reporting.
OBJECTIVE:
To measure awareness about ADR among dentists & to
determine reasons for ADR underreporting.
METHODS & MATERIALS:
In present study, a self-administered questionnaire was
used to measure the awareness level about ADR & its reporting
among dental practitioners in GDC&H. In this study 96 dentists
were involved who answered predesigned questionnaire prepared
based on previous studies.
RESULT:
It was noticed that knowledge & awareness about ADR was
moderate & ADR reporting was minimal.
CONCLUSION:
we conclude that 96 dentists in our study have satisfactory
knowledge about ADR and its reporting. They have good attitude
towards practice of reporting ADR, but unable to report ADR due
to lack of knowledge and training OD ADR reporting but almost
every dentist was willing to participate in ADR reporting.
I. INTRODUCTION
dverse drug reactions was defined by WHO as a response of
a drug which is noxious and unintended and which occurs at
doses normally used in man for prophylaxis , diagnosis or therapy
of a disease or for the modification of physiological function1.
According to barkar there are 3 possible reactions of drug, they are
the one you want, the one you don’t want and the one you don’t
know. Adverse reactions vary from mild to moderate severity,
sometimes they are very serious. Every year 5-20% of cases
hospitalized are due to ADR’S. Around 4% of patients have fatal
ADR’S. According to UMC (Uppsala monitoring Centre) only 6-
10% of ADR’S are reported, this is because of lack of
knowledge& awareness regarding detection, communication &
spontaneous monitoring of ADR among healthcare professionals
including physicians, surgeons, dentists, and nurses & including
pharmacists. It is important for health care professionals to know
how to report & where to report on ADR. Dentists use various
drugs for treatment of different oral dental & maxillofacial
conditions; most commonly used drugs are NSAIDS, analgesics,
antibiotics & antacids. Other drugs include steroids, multivitamins
& anti epileptics for emergencies are also used, IV drugs like
lignocaine, sodium tetradecyl. These drugs have been reported to
have ADR like headache, tinnitus & severe anaphylactic shock.
Though they are very rare. They were found to be fatal in 3.67%
cases. Hence reporting of these unintended ADR’s become very
important not only for future references & development of better
medicine but also to avoid morbidity (or) mortality of patients4. So
this study is intended to evaluate knowledge regarding ADR
among dentists.
II. MATERIALS AND METHODS:
STUDY DESIGN
This study was conducted at GDCH, a dental hospital in
Hyderabad, Telangana, India. The study was questionnaire based
study. The study participants consisted of dentists who gave their
informed consent and who were working in hospital during the
study period. participants include both senior and junior doctors.
The questionnaire was designed from previous studies which is as
follows:
Sl.
No K A P Questionnaire Dentists Response N=96 , n=%
A

International Journal of Scientific and Research Publications, Volume 10, Issue 1, January 2020 565
ISSN 2250-3153
http://dx.doi.org/10.29322/IJSRP.10.01.2020.p9784 www.ijsrp.org
1 What is adverse drug reaction?
A. Unintentional Reactions caused due to Normal dosage of drugs given to
a person. 47(48.9%)
B. Unintentional Reactions caused due to Over dosage of drugs given to a
person. 32(33.3%)
C. Reactions caused due to drug Abuse. 15(15.6%)
D. None 0
2 What is Adverse drug reaction reporting?
A.HealthCare Professionals Reporting any suspected ADR to Regulatory
body or manufacturer 22(22.9%)
B. Manufacturer Reporting ADR suspected by Healthcare Professional to
National Authority 14(14.5%)
C. Both A&B 60(62.5%)
D. None 0
3 How are Adverse Drug Reactions classified?
A. Dose related 26(27.08%)
B. Unpredictable 21(21.8%)
C. Chronic and Continuous 06(6.25%)
D. All the above 43(44.7%)
4 Do you think Dental Practitioners should be Trained in ADR Reporting?
A. Yes 96(100%)
B. No 0
5 Do you come across Adverse Drug Reactions frequently?
A. Yes 21(21.8%)
B. No 75(78.1%)
6 Do you think it’s necessary to include Pharmacovigilance at Undergraduate
level?
A. Yes 96(100%)
B. No 0
7 Regulatory body for ADR Reporting in India?
A.Central Drug Standard Control Association 45(46.8%)
B. Adverse Drug Reactions Online Information Tracking System 31(32.2%)
C. Eudra Vigilance 13(13.5%)
D. Medwatch 07(7.29%)
8 Most common Adverse Drug Reactions seen frequently?
A.Stomach pain/Heart burn/Vomiting/Diarrhea 43(44.7%)
B. Headache/Dizziness 14(14.5%)
C. Skin rashes/ Allergic reactions 34(35.4%)

International Journal of Scientific and Research Publications, Volume 10, Issue 1, January 2020 566
ISSN 2250-3153
http://dx.doi.org/10.29322/IJSRP.10.01.2020.p9784 www.ijsrp.org
D. Patches on Tongue 05(5.2%)
9 Do you inform patients regarding Adverse Drug Reactions?
A. Yes 96(100%)
B. No 0
10 Do you motivate patients to report any Reactions caused after usage of
drugs?
A. Yes 96(100%)
B. No 0
DATA COLLECTION
Ninety six questionnaires were collected back from dentists. A time of one day was given for collection of anonymously filled
form.
RESULTS:
Out of 100 questionnaires given to dentists 96 were returned. Among 96 dentists 47 i.e. 48.9 percent of dentists were aware of
adverse drug reactions and 60 i.e. 62.5 percent of dentists were aware of ADR reporting. The results are quite satisfactory compared to
other studies conducted in different parts of India.
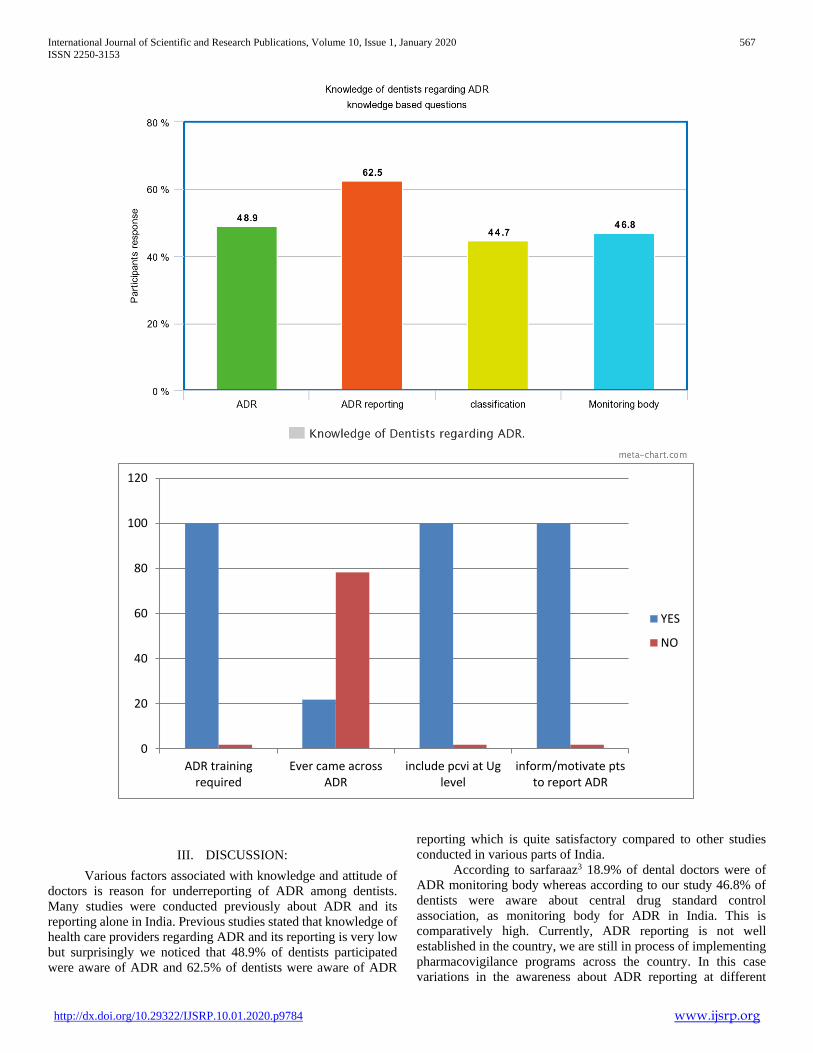
International Journal of Scientific and Research Publications, Volume 10, Issue 1, January 2020 567
ISSN 2250-3153
http://dx.doi.org/10.29322/IJSRP.10.01.2020.p9784 www.ijsrp.org
III. DISCUSSION:
Various factors associated with knowledge and attitude of
doctors is reason for underreporting of ADR among dentists.
Many studies were conducted previously about ADR and its
reporting alone in India. Previous studies stated that knowledge of
health care providers regarding ADR and its reporting is very low
but surprisingly we noticed that 48.9% of dentists participated
were aware of ADR and 62.5% of dentists were aware of ADR
reporting which is quite satisfactory compared to other studies
conducted in various parts of India.
According to sarfaraaz3 18.9% of dental doctors were of
ADR monitoring body whereas according to our study 46.8% of
dentists were aware about central drug standard control
association, as monitoring body for ADR in India. This is
comparatively high. Currently, ADR reporting is not well
established in the country, we are still in process of implementing
pharmacovigilance programs across the country. In this case
variations in the awareness about ADR reporting at different
0
20
40
60
80
100
120
ADR trainingrequired
Ever came acrossADR
include pcvi at Uglevel
inform/motivate ptsto report ADR
YES
NO
International Journal of Scientific and Research Publications, Volume 10, Issue 1, January 2020 568
ISSN 2250-3153
http://dx.doi.org/10.29322/IJSRP.10.01.2020.p9784 www.ijsrp.org
places can be expected. both low or high awareness can be due to
awareness campaigns run by local monitoring bodies.
Even though there is high rate of ADR seen in hospitalized
patients, sarfaraaz3 observed that 34.4% dentists confirmed that
they have never come across ADR, this is similar to our study
where 78.1% dentists never came across ADR and remaining
21.9% dentists who came across ADR never thought of reporting.
This is a matter to be concerned about and measures should be
taken to implement ADR reporting among dentists. Interestingly
almost every dentist thinks that dental practicioners should be
trained in ADR reporting and suggested that pharmacovigilance
programs should be included in undergraduate curriculum to
improve knowledge and create awareness among budding doctors
regarding ADR and its reporting.
In our study almost every dentist was willing to inform
patients regarding unusual reactions caused after ingestion of drug
and motivated them to report any reactions caused after usage of
drug even though most of them were not aware about
pharmacovigilance program sand lack of training in ADR
reporting among dental professionals.
Many studies conducted across country conclude that there
is gradual growth in awareness about adverse drug reactions
among health care professionals .further we noticed positive
attitude of dental practitioners towards ADR and its reporting. As
this is single center study with limited numbers of dentists; the
results of the study may not be generalized. A multicentric study
may provide greater insight about underlying factors for under
reporting of ADRs among dental professionals in India.
IV. CONCLUSION:
The present study concludes that lack of knowledge and
problem in attitudes of dental doctors as causative factors in under
reporting of ADRs. These factors include lack of awareness about
ADR reporting system, inadequate training to recognize ADRs,
fear factors. These factors should be given more importance while
designing awareness programs and pharmacovigilance related
continued dental education programs and training.
REFERENCES
[1] WHO. The importance of pharmacovigilance. Geneva: World Health organization; 2002
[2] Requirements for adverse reaction reporting. Geneva, Switzerland: World Health Organization, 1975.
[3] Sarfaraz A. Chhaya G. S.D. Tonpay: a study of knowledge, attitudes and practice of dental doctors about adverse drug reaction reporting in a teaching hospital in India. Percept Clin Res. July- Set; 6(3): 144-149, 2015.
[4] Ajinath Jadhav, Ajay Chandrikapure, Pooja Tarte (Jadhav), Pharmacovigilance in dental practice: A study to evaluate knowledge, attitude and practices(KAP) of reporting of adverse drug reactions(ADR) among dental practitioner in a city of central region of Maharashtra, India.
AUTHORS
First Author – Sneha Menga
International Journal of Scientific and Research Publications, Volume 10, Issue 1, January 2020 569
ISSN 2250-3153
http://dx.doi.org/10.29322/IJSRP.10.01.2020.p9785 www.ijsrp.org
Differences of Skin Normal Microbiota in Adult Men
and Elderly
Silvia Christie*, Syahril R Lubis
**, Ariyati Yosi
**, Dian D Wahyuni
***
*Post graduate of Dermatology and Venereology, Faculty of Medicine, Universitas Sumatera Utara, Medan, Indonesia **Department of Dermatology and Venereology, Faculty of Medicine, Universitas Sumatera Utara, Medan, Indonesia
***Department of Microbiology, Faculty of Medicine, Universitas Sumatera Utara, Medan, Indonesia
DOI: 10.29322/IJSRP.10.01.2020.p9785
http://dx.doi.org/10.29322/IJSRP.10.01.2020.p9785
Introduction: Skin is the largest human body organ, colonized
by a variety of microorganisms that are mostly harmless or even
beneficial to the host. Microbiota includes bacteria, fungi,
viruses, and archae that inhabit various areas of the body.
Microbiota is a dynamic and will be shift its diversity with age. Objective: To see the difference in normal skin microbiota in
adult men and elderly.
Methods: This research is an observational study using a case
control design to see differences in normal skin microbiota in 10
adult men and 10 elderly men. Each skin smear was taken on the
forehead, axilla and forearms of the patient. Cultivation of
bacteria or fungi is carried out and then isolates of bacterial or
fungal are identified using Vitek-2 compact.
Results: The forehead was dominated by phylum Firmicutes
(adult men: 74%, elderly men: 82.3%) followed by
Actinobacteria (adult men: 25.9%, elderly men: 17.6%). Axilla was dominated by phylum Firmicutes (adult men: 77.2%, elderly
men: 86.9%) followed by Actinobacteria (adult men: 22.7%,
elderly men: 13%). In the forearms was dominated by phylum
Firmicutes (adult men: 57.5%, elderly men: 77.7%) followed by
Actinobacteria (adult men: 42.4%, elderly men: 22.2%).
Conclusion: Based on the predominant phylum, the normal
microbiota of the skin on the forehead, axilla and forearms of
adult men and elderly is not too different. Based on the three
location, we found the forearms area had the highest diversity of
microbiota and was followed by the forehead area and the least
diversity was found in the axilla area.
Index Terms- Microbiota, microbiome
I. INTRODUCTION
he term “normal microbial flora” denotes the population of
microorganisms that inhabit the skin and mucous
membranes of healthy normal persons. The microorganisms that
live inside and on humans (now referred to as the normal microbiota) are estimated to outnumber human somatic. The
genomes of these microbial symbionts are collectively defined as
the microbiome.1 Human skin microbiomes refer to the entire
collection of bacterial microbes, archaea, fungi, viruses, and
mites that are on human skin.2
Sequencing of the skin microbiome showed that the
human skin microbiota comprises around 113 phylotypes that
belong to six bacterial divisions.3 Analyses of the topographical
diversity of microbes of the human skin using 16S rRNA gene
phylotyping revealed that 19 phyla are known to be part of the
bacterial skin microbiome. Major examples are Actinobacteria
(51.8%), Firmicutes (24.4%), Proteobacteria (16.5%) and
Bacteroidetes (6.3%). The majority of the identified genera are Corynebacterium,Propionibacterium and Staphylococcus.4
The skin microbiome is dynamic during a human
lifespan.5 In utero, fetal skin is sterile, but minutes after birth,
colonization begins to occur.6 The initial microbial colonization
of the skin in infants is influenced by the route of delivery.7 In
infants, during the first year of life, the skin bacterial
communities show high interindividual variation, along with
tremendous diversity in both community composition and timing
of bacterial acquisition. During the transition through puberty,
the skin microbiome again shifts dramatically from
predominance of Firmicutes, Bacteroidetes, and Proteobacteria to more lipophilic Corynebacteriaceae and
Propionibacteriaceae. Further alterations during later stages of
life have not yet been explored.5
The diversity of these transient and permanent microbes
on our skin is dependent on the topographical regions of the body
that have distinctive characteristics (pH, moisture, salinity, and
sebum content), and may also vary due to intrinsic factors (e.g.
genotype, age, and sex) and extrinsic individual dependent
factors such as occupation, lifestyle, geographical location, and
use of antibiotics, or cosmetics.8 The stability of the microbial
community are determined primarily by the specific physiological characteristics of the skin sites; different
distribution of hair follicles, eccrine and apocrine glands, and
sebaceous glands contribute to the variable cutaneous
microenvironments and likely select for subsets of bacteria that
can thrive in those specialized conditions. Several structural and
functional changes in the skin occur intrinsically as the skin
ages.9 Skin aging is characterized by a decrease in sweat, sebum
and the immune functions thus resulting in significant alterations
in skin surface physiology including pH, lipid composition and
sebum secretion. These physiological changes provide potential
alterations in the skin ecology that may affect the skin
microbiome.10
Investigations in recent years in the human microbiome
project have revealed the main impact of microbiota on the host.3
Human skin microbiota is able to control the colonization of
potentially pathogenic microorganisms.8 Commensal skin
T
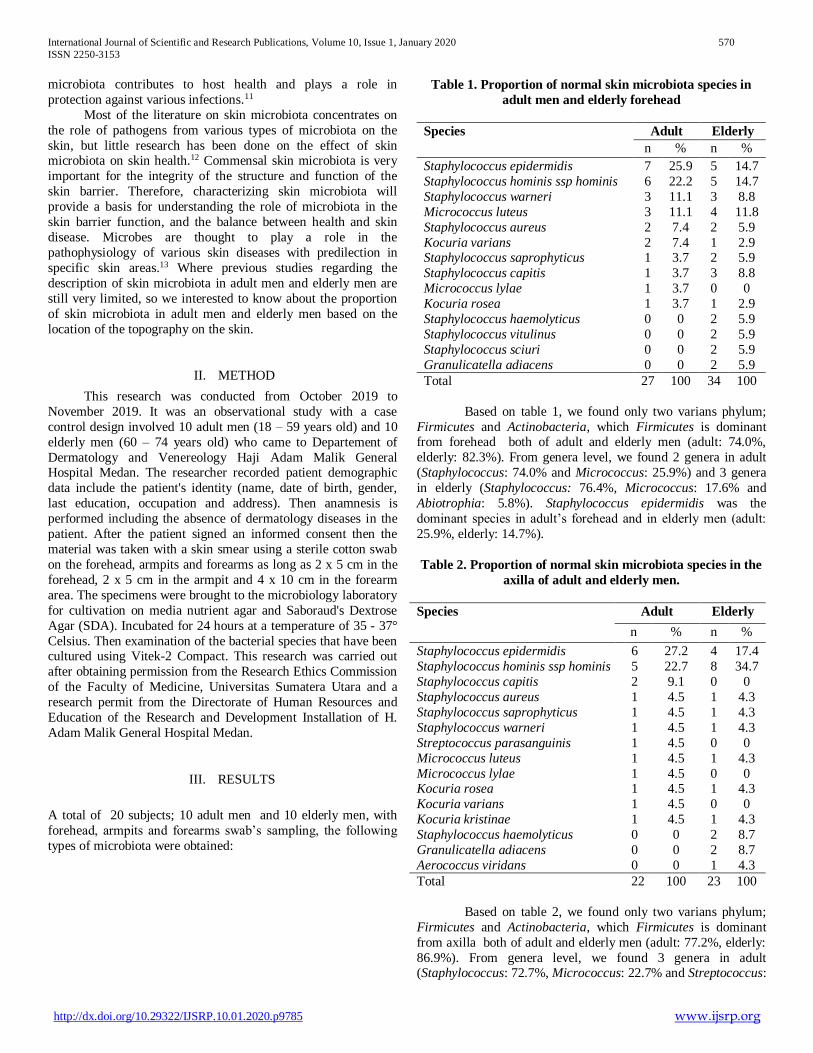
International Journal of Scientific and Research Publications, Volume 10, Issue 1, January 2020 570
ISSN 2250-3153
http://dx.doi.org/10.29322/IJSRP.10.01.2020.p9785 www.ijsrp.org
microbiota contributes to host health and plays a role in
protection against various infections.11
Most of the literature on skin microbiota concentrates on
the role of pathogens from various types of microbiota on the
skin, but little research has been done on the effect of skin microbiota on skin health.12 Commensal skin microbiota is very
important for the integrity of the structure and function of the
skin barrier. Therefore, characterizing skin microbiota will
provide a basis for understanding the role of microbiota in the
skin barrier function, and the balance between health and skin
disease. Microbes are thought to play a role in the
pathophysiology of various skin diseases with predilection in
specific skin areas.13 Where previous studies regarding the
description of skin microbiota in adult men and elderly men are
still very limited, so we interested to know about the proportion
of skin microbiota in adult men and elderly men based on the
location of the topography on the skin.
II. METHOD
This research was conducted from October 2019 to
November 2019. It was an observational study with a case
control design involved 10 adult men (18 – 59 years old) and 10
elderly men (60 – 74 years old) who came to Departement of
Dermatology and Venereology Haji Adam Malik General Hospital Medan. The researcher recorded patient demographic
data include the patient's identity (name, date of birth, gender,
last education, occupation and address). Then anamnesis is
performed including the absence of dermatology diseases in the
patient. After the patient signed an informed consent then the
material was taken with a skin smear using a sterile cotton swab
on the forehead, armpits and forearms as long as 2 x 5 cm in the
forehead, 2 x 5 cm in the armpit and 4 x 10 cm in the forearm
area. The specimens were brought to the microbiology laboratory
for cultivation on media nutrient agar and Saboraud's Dextrose
Agar (SDA). Incubated for 24 hours at a temperature of 35 - 37°
Celsius. Then examination of the bacterial species that have been cultured using Vitek-2 Compact. This research was carried out
after obtaining permission from the Research Ethics Commission
of the Faculty of Medicine, Universitas Sumatera Utara and a
research permit from the Directorate of Human Resources and
Education of the Research and Development Installation of H.
Adam Malik General Hospital Medan.
III. RESULTS
A total of 20 subjects; 10 adult men and 10 elderly men, with
forehead, armpits and forearms swab’s sampling, the following
types of microbiota were obtained:
Table 1. Proportion of normal skin microbiota species in
adult men and elderly forehead
Species Adult Elderly
n % n %
Staphylococcus epidermidis 7 25.9 5 14.7
Staphylococcus hominis ssp hominis 6 22.2 5 14.7
Staphylococcus warneri 3 11.1 3 8.8
Micrococcus luteus 3 11.1 4 11.8
Staphylococcus aureus 2 7.4 2 5.9
Kocuria varians 2 7.4 1 2.9 Staphylococcus saprophyticus 1 3.7 2 5.9
Staphylococcus capitis 1 3.7 3 8.8
Micrococcus lylae 1 3.7 0 0
Kocuria rosea 1 3.7 1 2.9
Staphylococcus haemolyticus 0 0 2 5.9
Staphylococcus vitulinus 0 0 2 5.9
Staphylococcus sciuri 0 0 2 5.9
Granulicatella adiacens 0 0 2 5.9
Total 27 100 34 100
Based on table 1, we found only two varians phylum;
Firmicutes and Actinobacteria, which Firmicutes is dominant from forehead both of adult and elderly men (adult: 74.0%,
elderly: 82.3%). From genera level, we found 2 genera in adult
(Staphylococcus: 74.0% and Micrococcus: 25.9%) and 3 genera
in elderly (Staphylococcus: 76.4%, Micrococcus: 17.6% and
Abiotrophia: 5.8%). Staphylococcus epidermidis was the
dominant species in adult’s forehead and in elderly men (adult:
25.9%, elderly: 14.7%).
Table 2. Proportion of normal skin microbiota species in the
axilla of adult and elderly men.
Species Adult Elderly
n % n %
Staphylococcus epidermidis 6 27.2 4 17.4
Staphylococcus hominis ssp hominis 5 22.7 8 34.7
Staphylococcus capitis 2 9.1 0 0
Staphylococcus aureus 1 4.5 1 4.3
Staphylococcus saprophyticus 1 4.5 1 4.3
Staphylococcus warneri 1 4.5 1 4.3
Streptococcus parasanguinis 1 4.5 0 0
Micrococcus luteus 1 4.5 1 4.3
Micrococcus lylae 1 4.5 0 0 Kocuria rosea 1 4.5 1 4.3
Kocuria varians 1 4.5 0 0
Kocuria kristinae 1 4.5 1 4.3
Staphylococcus haemolyticus 0 0 2 8.7
Granulicatella adiacens 0 0 2 8.7
Aerococcus viridans 0 0 1 4.3
Total 22 100 23 100
Based on table 2, we found only two varians phylum;
Firmicutes and Actinobacteria, which Firmicutes is dominant
from axilla both of adult and elderly men (adult: 77.2%, elderly:
86.9%). From genera level, we found 3 genera in adult (Staphylococcus: 72.7%, Micrococcus: 22.7% and Streptococcus:
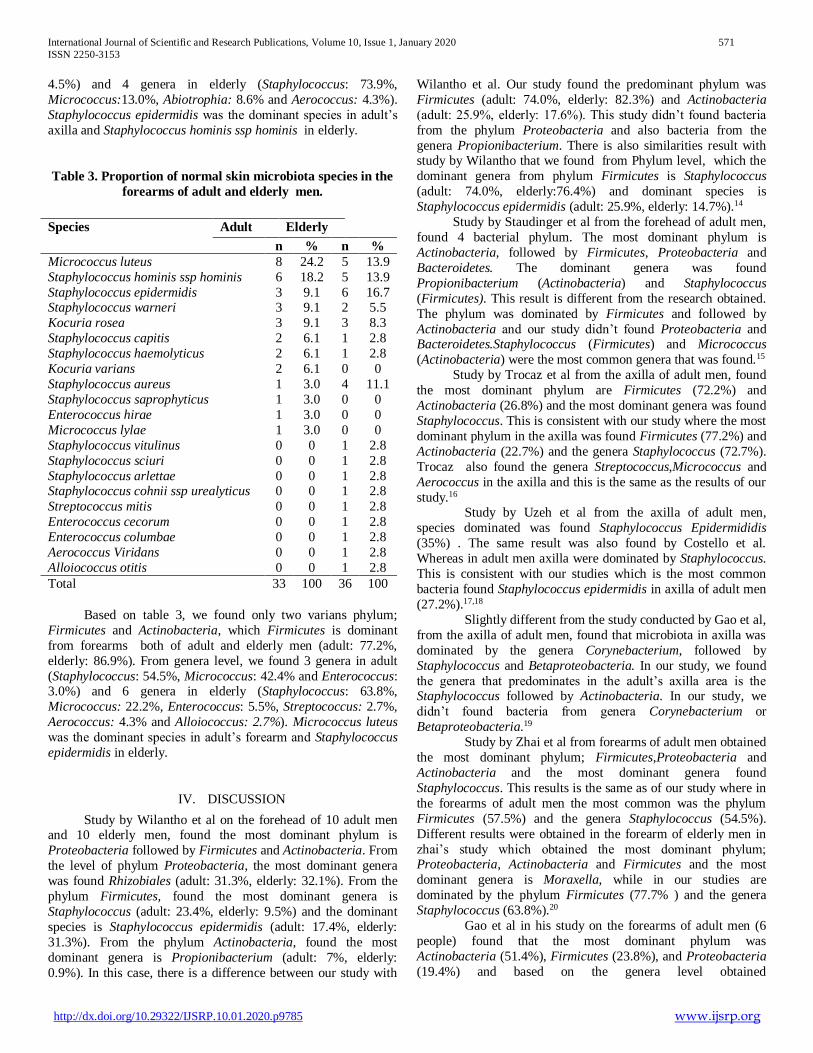
International Journal of Scientific and Research Publications, Volume 10, Issue 1, January 2020 571
ISSN 2250-3153
http://dx.doi.org/10.29322/IJSRP.10.01.2020.p9785 www.ijsrp.org
4.5%) and 4 genera in elderly (Staphylococcus: 73.9%,
Micrococcus:13.0%, Abiotrophia: 8.6% and Aerococcus: 4.3%).
Staphylococcus epidermidis was the dominant species in adult’s
axilla and Staphylococcus hominis ssp hominis in elderly.
Table 3. Proportion of normal skin microbiota species in the
forearms of adult and elderly men.
Based on table 3, we found only two varians phylum;
Firmicutes and Actinobacteria, which Firmicutes is dominant
from forearms both of adult and elderly men (adult: 77.2%,
elderly: 86.9%). From genera level, we found 3 genera in adult
(Staphylococcus: 54.5%, Micrococcus: 42.4% and Enterococcus: 3.0%) and 6 genera in elderly (Staphylococcus: 63.8%,
Micrococcus: 22.2%, Enterococcus: 5.5%, Streptococcus: 2.7%,
Aerococcus: 4.3% and Alloiococcus: 2.7%). Micrococcus luteus
was the dominant species in adult’s forearm and Staphylococcus
epidermidis in elderly.
IV. DISCUSSION
Study by Wilantho et al on the forehead of 10 adult men and 10 elderly men, found the most dominant phylum is
Proteobacteria followed by Firmicutes and Actinobacteria. From
the level of phylum Proteobacteria, the most dominant genera
was found Rhizobiales (adult: 31.3%, elderly: 32.1%). From the
phylum Firmicutes, found the most dominant genera is
Staphylococcus (adult: 23.4%, elderly: 9.5%) and the dominant
species is Staphylococcus epidermidis (adult: 17.4%, elderly:
31.3%). From the phylum Actinobacteria, found the most
dominant genera is Propionibacterium (adult: 7%, elderly:
0.9%). In this case, there is a difference between our study with
Wilantho et al. Our study found the predominant phylum was
Firmicutes (adult: 74.0%, elderly: 82.3%) and Actinobacteria
(adult: 25.9%, elderly: 17.6%). This study didn’t found bacteria
from the phylum Proteobacteria and also bacteria from the
genera Propionibacterium. There is also similarities result with study by Wilantho that we found from Phylum level, which the
dominant genera from phylum Firmicutes is Staphylococcus
(adult: 74.0%, elderly:76.4%) and dominant species is
Staphylococcus epidermidis (adult: 25.9%, elderly: 14.7%).14
Study by Staudinger et al from the forehead of adult men,
found 4 bacterial phylum. The most dominant phylum is
Actinobacteria, followed by Firmicutes, Proteobacteria and
Bacteroidetes. The dominant genera was found
Propionibacterium (Actinobacteria) and Staphylococcus
(Firmicutes). This result is different from the research obtained.
The phylum was dominated by Firmicutes and followed by
Actinobacteria and our study didn’t found Proteobacteria and Bacteroidetes.Staphylococcus (Firmicutes) and Micrococcus
(Actinobacteria) were the most common genera that was found.15
Study by Trocaz et al from the axilla of adult men, found
the most dominant phylum are Firmicutes (72.2%) and
Actinobacteria (26.8%) and the most dominant genera was found
Staphylococcus. This is consistent with our study where the most
dominant phylum in the axilla was found Firmicutes (77.2%) and
Actinobacteria (22.7%) and the genera Staphylococcus (72.7%).
Trocaz also found the genera Streptococcus,Micrococcus and
Aerococcus in the axilla and this is the same as the results of our
study.16 Study by Uzeh et al from the axilla of adult men,
species dominated was found Staphylococcus Epidermididis
(35%) . The same result was also found by Costello et al.
Whereas in adult men axilla were dominated by Staphylococcus.
This is consistent with our studies which is the most common
bacteria found Staphylococcus epidermidis in axilla of adult men
(27.2%).17,18
Slightly different from the study conducted by Gao et al,
from the axilla of adult men, found that microbiota in axilla was
dominated by the genera Corynebacterium, followed by
Staphylococcus and Betaproteobacteria. In our study, we found
the genera that predominates in the adult’s axilla area is the Staphylococcus followed by Actinobacteria. In our study, we
didn’t found bacteria from genera Corynebacterium or
Betaproteobacteria.19
Study by Zhai et al from forearms of adult men obtained
the most dominant phylum; Firmicutes,Proteobacteria and
Actinobacteria and the most dominant genera found
Staphylococcus. This results is the same as of our study where in
the forearms of adult men the most common was the phylum
Firmicutes (57.5%) and the genera Staphylococcus (54.5%).
Different results were obtained in the forearm of elderly men in
zhai’s study which obtained the most dominant phylum; Proteobacteria, Actinobacteria and Firmicutes and the most
dominant genera is Moraxella, while in our studies are
dominated by the phylum Firmicutes (77.7% ) and the genera
Staphylococcus (63.8%).20
Gao et al in his study on the forearms of adult men (6
people) found that the most dominant phylum was
Actinobacteria (51.4%), Firmicutes (23.8%), and Proteobacteria
(19.4%) and based on the genera level obtained
Species Adult Elderly
n % n %
Micrococcus luteus 8 24.2 5 13.9
Staphylococcus hominis ssp hominis 6 18.2 5 13.9
Staphylococcus epidermidis 3 9.1 6 16.7 Staphylococcus warneri 3 9.1 2 5.5
Kocuria rosea 3 9.1 3 8.3
Staphylococcus capitis 2 6.1 1 2.8
Staphylococcus haemolyticus 2 6.1 1 2.8
Kocuria varians 2 6.1 0 0
Staphylococcus aureus 1 3.0 4 11.1
Staphylococcus saprophyticus 1 3.0 0 0
Enterococcus hirae 1 3.0 0 0
Micrococcus lylae 1 3.0 0 0
Staphylococcus vitulinus 0 0 1 2.8
Staphylococcus sciuri 0 0 1 2.8
Staphylococcus arlettae 0 0 1 2.8 Staphylococcus cohnii ssp urealyticus 0 0 1 2.8
Streptococcus mitis 0 0 1 2.8
Enterococcus cecorum 0 0 1 2.8
Enterococcus columbae 0 0 1 2.8
Aerococcus Viridans 0 0 1 2.8
Alloiococcus otitis 0 0 1 2.8
Total 33 100 36 100

International Journal of Scientific and Research Publications, Volume 10, Issue 1, January 2020 572
ISSN 2250-3153
http://dx.doi.org/10.29322/IJSRP.10.01.2020.p9785 www.ijsrp.org
Propionibacterium (22%), Corynebacterium (19%),
Staphylococcus (11.1%) and Streptococcus (5.8%). These results
differ from our study which the most dominant phylum in the
forearms of adult men is Firmicutes (57.5%) and Actinobacteria
(42.4%). Based on the level of the most dominant genus Staphylococcus (54.5%) and followed by the genus Micrococcus
(42.4%) and Enterococcus (3.0%).21
On examination of three skin locations, forehead, axilla
and forearms in adult men and elderly, Firmicutes and
Actinobacteria are the dominant phylum and Staphylococcus is
the most dominant genera which found on the forehead (74%),
axilla (72.7%) and forearms (54.5%). Of the three locations
compared, were found in the forearms area (both in adult men
and elderly) with the highest diversity of genera and species
bacteria. And this is in accordance with the research by Perez et
al which on the forehead, axilla and forearms of adult men
obtained Firmicutes and Actinobacteria as the dominant phylum, with Staphylococcus is the most dominant genera, found in
>80% in the forehead and axilla area and <50% in the arm. Of
the three locations compared by Perez et al also found that the
highest number of genera and species bacteria were found in the
forearms, followed by the forehead and at least in the armpit
area.22
In this study, majority Gram positive bacteria was found
on the forehead, axilla and forearms. This is the same as the
study conducted by Staudinger et al who conducted microbiota
examination on the forehead and forearms of adult men obtained
only Gram-positive bacteria. Previous studies have also reported that Gram-positive bacteria are more common in superficial skin
areas.15,22
V. CONCLUSIONS
Based on the predominant phylum, the normal microbiota
of the skin on the forehead, armpits and forearms of adult men
and elderly is not too different. Of the three locations compared,
it was found that the forearm area had the highest diversity of microbiota and was followed by the forehead area and the least
diversity was found in the armpit area
VI. SUGGESTION
Conduct further research with a larger sample size for
identification of skin microbiota.
ACKNOWLEDGEMENT
We would like to thanks for Department of
Microbiology Faculty of Medicine Universitas Sumatera Utara.
REFERENCES
[1] Carroll KC. Normal Human Microbiota. In: Brooks GF, Carrol KC, Butel JS, Morse SA, Meitzner T, editors. Medical microbiology. 26th ed. United
States America. The Mcgraw-Hills Companies; 2013. p.165-72.
[2] Kong HH. Skin microbiome: genomics-based insights into the diversity and
role of skin microbes. Trends Mol Med [internet]. 2011. [cited 2019
February 21];17(6):320-8. Available from:
https://www.ncbi.nlm.nih.gov/pubmed/21376666
doi: 10.1016/j.molmed.2011.01.013.
[3] Christensen GJ, Bruggemann H. Bacterial skin commensals and their role
as host guardians. Beneficial microbes [internet]. 2014. [cited 2019
February 16];5(2):201-5. Available from:
https://www.ncbi.nlm.nih.gov/pubmed/24322878
doi: 10.3920/BM2012.0062.
[4] Nina N, Schommer, Gallo RL. Structure and function of the human skin
microbiome. Trends in Microbiology [internet]. 2013. [cited 2019 February
16];21(12):660-8. Available from:
https://www.ncbi.nlm.nih.gov/pubmed/24238601
doi: 10.1016/j.tim.2013.10.001.
[5] Kong HH, Segre JA. The molecular revolution in cutaneous biology; investigating the skin microbiome. United states; Journal of Investigative
Dermatology [internet]. 2017. [cited 2019 February 28];137:119-122.
Available from: https://www.ncbi.nlm.nih.gov/pubmed/28411842
doi: 10.1016/j.jid.2016.07.045.
[6] Chen YE, Tsao H. The skin microbiome: current perspectives and future
challenges. J Am acad dermatol [internet]. 2013. [cited 2019 February 16];
69:143-55. Available from:
https://www.ncbi.nlm.nih.gov/pubmed/23489584
doi: 10.1016/j.jaad.2013.01.016.
[7] Yamazaki Y, Nakamura Y, Nunez G. Role of the microbiota in skin immunity and atopic dermatitis. Allergology International [internet]. 2017.
[cited 2019 February 21];66:539-44. Available from:
https://www.ncbi.nlm.nih.gov/pubmed/28882556
doi: 10.1016/j.alit.2017.08.004.
[8] Zeeuwen PL, Kleerebezem M, Timmerman HM, Schalkwijk J. Microbiome and skin diseases. Curr Opin Allergy Clin Immunol [internet]. 2013. [cited
2019 February 16];13(5):514-20. Available from:
https://www.ncbi.nlm.nih.gov/pubmed/23974680
doi: 10.1097/ACI.0b013e328364ebeb.
[9] Charbonneau DL, Song YL, Cheng XL. Aging skin microbiology. In:
Farage MA, Miller KW, Maibach HI editors. Textbook of Aging Skin.
German. Springer Verlag Berlin Heidelberg; 2010. p.1473-85.
[10] Shibagaki N, Suda W, Clavaud C, danBastiaen P, et al. Aging related
changes in the diversity of women’s skin microbiomes associated with oral bacteria. Scientific Reports [internet]. 2017. [cited 2019 February 16];
10834-9. Available from:https://www.ncbi.nlm.nih.gov/pubmed/28874721
doi: 10.1038/s41598-017-10834-9
[11] Sullivan JN, Rea MC, Conor PM, Hill C, et al. Human skin microbiota is a
rich source of bacteriocin-producing staphylococci that kill human pathogens. FEMS microbiology ecology [internet]. 2019. [cited 2019
February 28];95(2):1-10. Available from:
https://academic.oup.com/femsec/article/95/2/fiy241/5259109
[12] Russell CW, Russell SW. Meta analysis of skin microbiome: New link between skin microbiota diversity and skin health with proposal to use this
as a future mechanism to determine whether cosmetic products damage the skin. Cosmetics [internet]. 2017. [cited 2019 February 21];4(14):1-19.
Available from: https://www.mdpi.com/2079-9284/4/2/14
[13] Grice EA, Kong HH, Conian S, Deming CB, et al. Topographical and temporal diversity of the human skin microbiome. Science [internet].
2009. [cited 2019 February 16];324(5931):1190-2. Available from:
https://www.ncbi.nlm.nih.gov/pmc/articles/PMC2805064/
doi: 10.1126/science.1171700
[14] Wilantho A, Deekaew P, Srisuttiyakorn C, Tongsima S, et al. Diversity of
bacterial communities on the facial skin of different age group Thai males.
Peerj [internet]. 2017. [cited 2019 November 20];5:e4084. Available from:
https://www.ncbi.nlm.nih.gov/pubmed/29177119 doi: 10.7717/peerj.4084
[15] Staudinger T, Pipal A, Redi B. Molecular analysis of the prevalent
microbiota of human male and female forehead skin compared to forearm skin and the influence of make-up. Journal of Applied Microbiology
[internet]. 2011. [cited 2019 February 28];110(6):1381-9. Available from:
https://www.ncbi.nlm.nih.gov/pubmed/21362117
doi: 10.1111/j.1365-2672.2011.04991.x.
[16] Troccaz M, Gaia N, Beccucci S, Schrenzel J, et al. Mappping axillary
microbiota responsible for body odours using culture independent approach.

International Journal of Scientific and Research Publications, Volume 10, Issue 1, January 2020 573
ISSN 2250-3153
http://dx.doi.org/10.29322/IJSRP.10.01.2020.p9785 www.ijsrp.org
Microbiome [internet]. 2015. [cited 2019 February 16];3(3):1-15. Available
from: https://www.ncbi.nlm.nih.gov/pubmed/25653852
doi: 10.1186/s40168-014-0064-3
[17] Fredrich E, Barzantny H, Brune I, Tauch A. Daily battle against body odor: towards the activity of the axillary microbiota. Trends in Microbiology
[internet]. 2013. [cited 2019 February 16];21(6):305-12. Available from:
https://www.ncbi.nlm.nih.gov/pubmed/23566668
doi: 10.1016/j.tim.2013.03.002
[18] Uzeh RE, Omotayo EA, Adesoro OO, Ilori MO, et al. Microbial assessment of the armpits of some selected university students in lagos, Nigeria. Int J
Biol Chem Sci [internet]. 2012. [cited 2019 February 21]; 6(6):5022-9.
Available from: https://www.ajol.info/index.php/ijbcs/article/view/88449
[19] Urban j, Fergus Dj, Savage AM, Ehlers M, et al. The effect of habitual and
experimental antiperspirant and deodorant product use on the armpit microbiome. PeerJ [internet]. 2016. [cited 2019 February 16];1-20.
Available from:
https://www.ncbi.nlm.nih.gov/pubmed/26855863 doi: 10.7717/peerj.1605
[20] Zhai W, Huang Y, Zhang X, Fei W, et al. Profile of the skin microbiota in a
healthy chinese population. Journal of Dermatology [internet]. 2018. [cited
2019 February 24];1-12. Available from:
https://www.ncbi.nlm.nih.gov/pubmed/30183092 doi: 10.1111/1346-
8138.14594
[21] Gao Z, Tseng C, Pei Z, Blaser J. Molecular analysis of human forearm superficial skin bacterial biota. Proc Natl Acad Sci USA [internet]. 2007.
[cited 2019 February 16];104(8):2927-32. Available from:
https://www.ncbi.nlm.nih.gov/pubmed/17293459
doi: 10.1073/pnas.0607077104
[22] Perez GI, Ghao Z, Jourdain R, Ramirez J et al. Body site is a more
determinan factor than human population diversity in the healthy skin microbiome. PLoS One [internet]. 2016. [cited 2019 November 20];
11(4):e0151990. Available from:
https://www.ncbi.nlm.nih.gov/pubmed/27088867
doi: 10.1371/journal.pone.0151990
AUTHORS
First Author- Silvia Christie Sinuhaji, Post graduate of Dermatology and Venereology, Faculty of Medicine, Universitas
Sumatera Utara,
Second Author- Syahril R. Lubis, Department of Dermatology
and Venereology, Faculty of Medicine, Universitas Sumatera
Utara.
Third Author- Ariyati Yosi, Department of Dermatology of and
Venereology, Faculty of Medicine, Universitas Sumatera Utara.
Fourth Author- Dian Dwi Wahyuni, Department of
Microbiology, Faculty of Medicine, Universitas Sumatera Utara.

International Journal of Scientific and Research Publications, Volume 10, Issue 1, January 2020 574
ISSN 2250-3153
http://dx.doi.org/10.29322/IJSRP.10.01.2020.p9786 www.ijsrp.org
The competitiveness of tourism enterprises
Nguyen Van Tan*, Luu Thi Thanh Mai**
*Department of Post-graduate education, Lac Hong University
10, Huynh Van Nghe, Buu Long, Bienhoa, Dongnai, Vietnam
**Department of International Economics, Lac Hong University
10, Huynh Van Nghe, Buu Long, Bienhoa, Dongnai, Vietnam
DOI: 10.29322/IJSRP.10.01.2020.p9786
http://dx.doi.org/10.29322/IJSRP.10.01.2020.p9786
Abstract- In order to improve the competitiveness of tourism
startups, tourism enterprises of Vietnam need to move forwards to
catch up with the global trend of developing OTA businesses -
Online Travel Agent (which Vietnam is gradually shaping), to
approach travelers around the world.
Index Terms- Competitiveness, tourism, enterprises.
I. INTRODUCTION
specific characteristic of the tourism industry is that the
relevant factors in the industry are always in the trend of
having to innovate constantly to avoid erosion. In the coming
decades when the sharing economy is growing, as technology
changes and the level of globalization with increasingly
widespread connectivity, tourism businesses in general and
businesses Starting a business in this industry is even more fierce.
The writer wants to come here to gather and share new challenges
so that the young entrepreneurs of the startup members have a
more objective view in the upcoming fierce competition.
II. SITUATION OF TOURISM BUSINESSES IN
VIETNAM AND TOURISM STARTUPS
At the conference to summarize the work of 2018 and deploy
the tasks in 2019 of the Vietnam National Administration of
Tourism, there were positive figures for the industry ...
In 2018, it is estimated that Vietnam has welcomed 15.6 million
international visitors, serving over 80 million domestic visitors.
The total revenue from tourists reaches more than VND 620,000
billion. The localities that are the major tourist centers of the
country are Hanoi and Ho Chi Minh City. Ho Chi Minh City,
Quang Ninh and Da Nang. This year Vietnam also received many
prestigious and prestigious awards in the world for the industry
such as: Asia's leading travel destination award at the World
Travel Award (WTA). Forbes put Vietnam as a top destination in
2019 and has announced a list of 14 tourist destinations for 2019
for tourism enthusiasts, Vietnam is one of the list of 14 places in
the world travelers should visit thanks to Beautiful ancient, unique
cuisine. These places are full of culture with art galleries, historical
museums, many delicious restaurants, top chefs ,etc.
Towards the Plan for 2019, striving to reach over 18 million
international visitors and 85 million domestic visitors. The total
revenue from tourism reaches over VND 700,000 billion
This shows that the demand for supply is increasing to meet the
growing demand of diverse
Until recently, according to Vietnam statistics, there were 2,053
international travel businesses, including 8 state-owned
enterprises, 641 joint-stock enterprises, 15 joint-venture
enterprises, 1,389 limited liability companies and private
enterprises. multiply. The increase or decrease of these businesses
is also very frequent, the number increases more than the number
of reduction, for example, in September 2018, the Vietnam
National Administration of Tourism has appraised 48 applications
for issuance, change, re-issuance and withdrawal of business
licenses International practice, including: granting 30 new
licenses, exchanging 15 licenses and withdrawing 03 licenses.
Along with the participation in the tourism industry ecosystem
of service businesses is an equally strong development, the hotel
and accommodation establishments of international standards ...
big businesses are very brave. invest in developing tourism
facilities, such as Vinpearl Joint Stock Company in the newly
opened 4 international 5-star hotels of Vinpearl Hotel in Hue,
Quang Binh, Thanh Hoa and Lang Son with a 5-star service
system. international standards of Vinpearl. In addition, Muong
Thanh Group organized the opening of Muong Thanh Grand Son
La Hotel in Son La City, bringing the total number of Muong
Thanh Group hotels to 50 units, etc.
Above is the overall picture of supply and demand of the current
tourism market in Vietnam. With specialized human resources,
there is a shortage of skilled and skilled professional personnel,
sufficient qualifications, and abundant resources of public
universities, public and private universities. Tourism in order to
quickly awake young workers to society is seeing this smoke-free
technology as a spearhead of the economy being strongly
promoted.
Along with the current Entrepreneur movement, starting a
business is everywhere, and supporting start-ups to become a
national policy, a startup ecosystem is gradually becoming clearer.
However, for a tourism business to develop and survive
sustainably, the article will introduce the competencies needed in
this area to consider to race against challenges, to maintain, grow
or survive in a red environment of competition.
A
International Journal of Scientific and Research Publications, Volume 10, Issue 1, January 2020 575
ISSN 2250-3153
http://dx.doi.org/10.29322/IJSRP.10.01.2020.p9786 www.ijsrp.org
III. INTRODUCING OTA BUSINESSES - NEW TREND - WITH
APPRECIATION FOR THE PROS AND CONS OF THIS MODEL
Firstly, it is necessary to understand that TA is a traditional
Travel Agent channel, while OTA is the abbreviation for Online
Travel Agent - online travel agent - Travel products and services
agent: tours, air tickets, hotel rooms, passenger cars, etc., for
online travel service providers
According to Google and Temasek's study of Southeast Asia's
Internet economy, online travel ranked third in terms of growth
and revenue contribution, the annual growth rate is 15% / year
(this ratio for e-commerce is 32% and for online advertising is
18%).
Also according to this study, Vietnam's online travel market
(both hotel and flight booking) is forecast to reach USD 9 billion
by 2025, which shows that the development of OTA channel is
quite large.
The Fourth Industrial Revolution is changing everything in
many industries, and tourism is an industry that is directly
affected, according to experts, in the future just one touch
operation on electricity Smart mobile phones connected to the
internet, tourists can sign up for all services anywhere from
transportation, hotels, dining to entertainment ...
In an analysis of research companies and major tourism
enterprises in Vietnam, there were comments that: Vietnam has
many advantages to develop online tourism. But now, nearly 80%
of the domestic online travel reservation market is being exploited
by foreign businesses. Mr. Pham Thanh Cong - representative of
Nielsen Vietnam Company - emphasized that by 2030, the internet
access volume of ASEAN region will account for 44.6%
worldwide. Therefore, ASEAN will be a major region of the world
for e-commerce development. Together with the growth of
connected consumers in Vietnam and ASEAN countries in
general, ASEAN tourism will be developed. Particularly in
Vietnam, urban people have a high demand for connecting by
phone and online shopping related products. According to the
Google Consumer Barometer Survey of Vietnamese phone usage,
Vietnamese people watch the phone 150 times a day, equivalent
to 177 minutes; Of which, up to 48% look for hotel information,
42% look for experience tourism and 37% look for flight
information. The impact of digital technology on consumer
activities has given rise to a new concept of "connected
consumers". They are young consumers, very confident when
connecting information on social networking sites. They are
willing to spend a lot on shopping, entertainment and travel. With
the majority of young people under 30 years old, Nielsen's study
of connected consumer behavior in Vietnam in 2017 estimates that
the number of connected Vietnamese consumers will increase
from 23 million (2017). up to 46 million people (by 2025), with
annual spending of nearly US $ 100 billion, double that of 2017
The majority of online booking market in Vietnam is dominated
by foreign businesses such as Agoda.com, Trivago.com ...,
Take a look at a few OTA channels that are thriving in Vietnam:
- Booking.com is known as the largest travel ecommerce site in
the world with more than 15,000 users with 204 representative
offices in more than 70 countries around the world. Booking.com
is one of the most used hotel OTA channels. This website connects
over 1,500,000 great accommodation places in the world, from
luxury hotels and resorts to homestay and hostel services, even
tree houses or igloos, etc.
- Expedia.com is one of the fastest growing online travel portals
in Asia, offering travelers a wide selection of hotels, activities and
travel services to meet every possibility. finance and operations of
all types of tourism at competitive prices. With over hundreds of
thousands of hotel partners around the world and the ability to
offer the comprehensive number of flights available on
Expedia.com, guests can book all the services needed for a
vacation - a room. meet all financial capabilities, activities of all
types and tourism services
- Agoda.com is an online booking company for hotels focused
primarily in the Asia Pacific region, with existing offices in
Singapore, Bangkok, Hong Kong, Kuala Lumpur, Phuket, Bali,
Sydney, Tokyo, Seoul, Beijing, Shanghai, and Manila.
- Traveloka.com is the leading online travel company in
Southeast Asia, Traveloka meets a variety of travel needs on the
same platform, helping customers get great travel. This is also one
of the favorite hotel OTA channels in Vietnam market.
- TripAdvisor, Inc. is a US travel agency that specializes in
providing travel-related reviews. This hotel reservation website
also includes interactive travel forums. TripAdvisor is founded by
Stephen Kaufer
IV. ANALYZE AND PROPOSE SOLUTIONS TO IMPROVE
COMPETITIVENESS FOR TOURISM STARTUPS
Through the above cases, it can be said that online travel in the
world in general and Vietnam in particular is no longer a trend but
an essential activity for an enterprise that wants to compete and
integrate.
To be able to compete in an Internet booming world, the era of
technology 4.0, it is possible to use Big data to analyze and find
the best solution for all activities quickly, or using artificial
intelligence. In order to mitigate many of the old common
constraints, startups need to identify the problem that needs to be
addressed.
- With home advantage, thanks to the thorough understanding
of the market and national culture, a close relationship with local
suppliers, it is easy to match with existing business practices, if
trying. Better than the fair business, this is a big strength in the
competition that Vietnamese startup needs to take advantage of
- With the youth of learning and intense passion, young people
of Vietnam have also inherited many of the world's elite to create
innovation and apply modern technology.
- The essential qualities of a young entrepreneur are
professional knowledge, this is the field of tourism, this is the
advantage of indigenous people in their environment.
- Perseverance in starting a business is also quite important,
because something new needs to be tested back and forth many
times before continuing to operate to achieve the desired results.
- With high support from the Vietnam National Administration
of Tourism, the Ministry of Science and Technology, the Tourism
Association, promoting smart tourism as well as the current status
of application of information technology in tourism in Vietnam
today.

International Journal of Scientific and Research Publications, Volume 10, Issue 1, January 2020 576
ISSN 2250-3153
http://dx.doi.org/10.29322/IJSRP.10.01.2020.p9786 www.ijsrp.org
- Governmental organizations and businesses support the
creation of a startup ecosystem to connect, support and encourage
Vietnamese entrepreneurs to start innovation ...
- Introducing seven outstanding technology trends in the
tourism industry in 2019:
• Internet of Things (IoT) one of the emerging technology
trends;
• Identification technology, which includes fingerprint
recognition, facial recognition, retina scanning and many other
biometric identifiers;
• Virtual reality (VR) This is one of the most promising
technology trends for travel-related companies, because it allows
customers to experience virtual reality before visiting specific
destinations.
• Augmented reality (AR) augmented reality is similar to virtual
reality, but involves augmenting real people around, through
graphic overlays, people in the tourism industry can greatly
enhance tell the customer experience, provide them with valuable
information, or even pure entertainment.
• Robotics are becoming increasingly popular these days, with
artificially intelligent robots, often equipped with voice
recognition technology, that are used in place of information
points of chains like Hilton. Service robots, room service robots
and receptionists also appear in hotel houses. Moreover, travel
agents are using robots to pre-screen, making waiting times more
efficient for customers.
• Artificial intelligence (AI) Artificial intelligence is also being
used in other ways. For customer service purposes, with chatbots
possessing the ability to provide quick response times for issues or
queries, hotels and other companies operating in the travel
industry can use location. Artificial intelligence to accurately and
seamlessly sort through data. It will be able to draw conclusions
about business performance or trends related to customer
satisfaction, and even manage inventory in a smart way.
• Big Data (Big Data) Big data is a fact of life. One of the biggest
uses for this data is personalization improvements, with travel
agencies using the information they collect to make specific
adjustments to their services. In particular, hoteliers can use big
data for revenue management purposes, using historical
occupancy rates and other past trends to better predict demand
levels.
The remaining challenges remain about the Capital
Fundamentals; Technology; Experience; Integrating Digital
Technology into services; Payment System; The unification of
local laws, etc., will also be matters that need to be completed
within a certain time and accompanying conditions.
It is important to see the general trend of the world, we can not
help but look at ourselves to change, to create, to integrate is
extremely necessary and careful.
REFERENCES
[1] Dan Senor & Saul Singer. (2013) Start up Nation. The Gioi Publishing House
[2] Eric Ries (2012) Lean startup. Publisher Times
[3] Eran Katz. (2016). Jewish intellect. LD LDXHXH
[4] Michael Heppell. (2012). Flip It. (Think differently). Young Publishing House.
[5] “Seven outstanding technology trends in tourism in 2019” https://hotelcareers.vn/tin-tuc/7-xu-huong-cong-nghe-noi-bat-trong-nganh-du-lich -nam-2019
[6] "Starting a travel business is easy but difficult" https://www.thesaigontimes.vn/272628/khoi-nghiep-du-lich-tuong-de-ma-kho.html
[7] "Honor 85 leading tourism enterprises in Vietnam" http://m.kinhtedothi.vn/vinh-danh-85-doanh-nghiep-du-lich-hang-dau-viet-nam-nam-2018- 320460.html
[8] "World's leading 8 OTA channels for tourism businesses" https://www.vietiso.com/blog/top-8-kenh-ota-hang-dau-the-gioi-danh-cho- businesses-du-lich.html
[9] "OTA and efficiency for tourism businesses" https://www.vietiso.com/blog/ota-va-hieu-qua-mang-lai-cho-cac-doanh-nghiep-du-lich .html
[10] “5 trends for travel companies in 2019” https://www.vietiso.com/blog/5-xu-huong-danh-rieng-cho-cac-cong-ty-du-lich -nam-2019.html
[11] "Vietnam OTA before the pressure of innovation" http://tiasang.com.vn/-doi-moi-sang-tao/OTA-Viet-truoc-ap-luc-tu-doi-moi----10980
[12] "Technology Startup industry opportunities and challenges ahead of 4.0 trend" https://m.baomoi.com/startup-cong-nghe-nganh-du-lich-co-hoi-va-thach-thuc -truoc-xu-the-4-0 / c / 27574831.epi
[13] "Inspiring start-up 3 Travel Startup" https://ybox.vn/khoi-nghiep/cam-hung-khoi-nghiep-tu-3-startup-du-lich-292697
[14] "Vietnam can become a world tourism powerhouse" http://m.enternews.vn/viet-nam-co-the-tro-thanh-mot-cuong-quoc-du-lich-cua-the -gioi-141229.html
AUTHORS
First Author – Nguyen Van Tan, DBA, Dean of International Economics department of Lac Hong University, Vietnam.
He has been involved in many projects of entrepreneurship management
and joined in many start-up training activities for organizations of Dong
Nai Province.
Second Author – Luu Thi Thanh Mai received an
M.B.A degree from the Economic University of Ho Chi Minh City in
2006. She has been transferring marketing and soft skills lessons to
business administration and travel-related-majored students since 2007
as guest lecturers for universities of Ho Chi Minh city. At the same time,
she was running her own logistics business for more than 10 years. She
participated in projects about tourism and human recourses for the
sector. There were many pieces of research of her about tourism such as
spiritual travel and also high-quality personnel training. [email protected]
Correspondence Author – Luu Thi Thanh Mai,
[email protected], (+84)96 868.3182
International Journal of Scientific and Research Publications, Volume 10, Issue 1, January 2020 577
ISSN 2250-3153
http://dx.doi.org/10.29322/IJSRP.10.01.2020.p9787 www.ijsrp.org
T
The Effect of Advertising and Personal Selling of
Brand Awareness in Vocational High School YPT
Palembang
Fitri Adhisti*, Zakaria Wahab**, Isnurhadi**
* Student of Magsiter Management, Sriwijaya University
** Lecturer of Magister Management, Sriwijaya University *** Lecturer of Magister Management, Sriwijaya University
DOI: 10.29322/IJSRP.10.01.2020.p9787
http://dx.doi.org/10.29322/IJSRP.10.01.2020.p9787
Abstract- The purpose of this study was to determine the effect
of advertising and personal selling on increasing brand
awareness in Vocational high school YPT Palembang
Development Schools. The population in this study is the
students guardians. Vocational high school Pembangunan YPT
Palembang Vocational Data collection technique is carried out
by distributing questionnaires to 100 student guardians. This
study uses primary data obtained from questionnaires and the
analysis technique used is multiple regression analysis
techniques. The results of this study indicate that Advertising
and Personal Selling partially and simultaneously have a
significant effect on brand awareness in Vocational high school
Pembangunan YPT Palembang. Suggestions that can be given
in this study are the management of the Vocational high school
Pembangunan YPT Palembang can fulfill the improvement of
the quality of teachers and the completeness of teaching and
learning facilities and promotion activities both through the
media and directly, so that the quality of graduates and the
quantity of new students continue to increase.
Index Terms- advertising, personal selling, brand awareness.
I. INTRODUCTION
he 12-year compulsory education program consists of
elementary and secondary education at the elementary, junior
high to senior high / vocational levels. Senior High Schools
(SMA) and Vocational High Schools (SMK) are useful as
determinants for students to continue their higher education or
work. Based on the National Education System Law No. 20 of
2003, high school is a high school in the general category that
prepares students to continue to tertiary education. Meanwhile,
Vocational High School is a secondary education which
prioritizes the development of student skills. Vocational High
Schools (SMK) aim to produce skilled and ready-to-work human
resources.
The government is currently paying more attention to
Vocational High Schools (SMK). According to Presidential
Instruction No. 9 of 2016, Vocational High Schools (SMK) are
included in revitalized vocational education institutions.
"Vocational School is one of the educational institutions which
is said to be the most relevant solution in overcoming
employment problems, as well as fostering domestic industries"
(www.tirto.id/persissue-smk-stigma-putus-school-to
unemployment-cPhn, accessed April 5, 2019). Therefore, both
state and private SMKs are expected to be able to compete with
high schools to increase the number of students. In addition, the
site edukasi.kompas.com also revealed that the government began
directing junior high school graduates to continue their education
to vocational high schools and in the future, the government
estimated the proportion of vocational schools to be more than
high schools, which was around 60 percent for vocational schools
and 40 percent for senior high schools .
Based on information from the Ministry of Education and
Culture, the number of Vocational High Schools in Palembang
City is 80 schools, consisting of: 9 State Vocational Schools and
71 Private Vocational Schools (Dapodikdasmen, 2019).
The large number of private SMKs opens up the possibility of
competition to get new students each year in the city of
Palembang. "The phenomenon that has happened so far, 'favorite'
schools are always flooded with students to reject prospective
students, while schools that happen to be 'not favored' are
somewhat stagnant in getting prospective students, both in quality
and quantity" (Zulaikha, 2017) revealed that the lack awareness
of school branding is the cause of the lack of 'prestige' of the
school to become a favorite school. According to him, private
schools only do promotions once a year. Behind these
promotional activities, on average, the school does not realize that
promotional activities can build brand awareness. The results of
his research concluded that as an institution that deals directly
with the community, schools also need to build brand awareness.
Just like schools in general, promotions conducted by schools
are presented in the form of conventional advertisements without
social media. According to Situmorang (2017) advertising aimed
at motivating potential buyers by supporting the superiority of
goods / services. Ads (advertisements) conducted by the YPT
Development Vocational School using print media. Print media
used are brochures and banners. In addition to print media, the
school also uses social media such as Websites, Instagram,
LinkedIn, Twitter, YouTube and Facebook.
Advertising aimed at motivating potential buyers in the way

International Journal of Scientific and Research Publications, Volume 10, Issue 1, January 2020 578
ISSN 2250-3153
http://dx.doi.org/10.29322/IJSRP.10.01.2020.p9787 www.ijsrp.org
that goods / services are offered (Situmorang, 2017). Therefore,
advertising (advertising) is part of a promotional strategy to
increase brand awareness. Ads (advertisements) that can retain
consumers' memories are advertisements that contain messages
by displaying various pleasures (Pratama, 2011).
According to Noermalitasari, et al (2015), to achieve the
quality of education services, teachers and school staff can
provide attention, understanding, and direct the wishes of
customers of educational services directly. Therefore, teachers
and staff have an important role to do personal selling which is
expected to increase brand awareness. The study found that
personal selling has the potential to verbally as a promotional
medium to potential customers (Kotler & Armstrong, 1994:
596). Tambunan and Wijaksana (2019) explained that the better
advertising and personal selling in promotion strategies would
increase brand awareness.
Several factors can affect the brand awareness is advertising
and personal selling. Based on the above background, encourage
researchers conducted a study entitled “ The Effect of
Advertising and Personal Selling of Brand Awareness in SMK
Pembangunan YPT Palembang”
II. LITERATURE REVIEW
A. Advertising
Image according to Kotler and Keller (According to
Kotler & Keller (2007: 244), "advertising) is all forms of paid
non-personal presentations and promotion of ideas, goods, or
services with certain sponsors." Based on the research of
Pondaag and Soegoto (2016) Advertising is a promotional mix
that is very well known among the general public.
Advertising is an advanced communication process that
brings audiences to the most important information that they
really need to know (Jefkins, 1997: 16). Frank Jefkins'
statement above places advertisements as one form of message
delivered by producers to the public as their potential
customers. With advertising, the audience is expected to obtain
as much information from an advertised product or service.
Advertising provides a message in the presentation of an
information. According to Boyd (2000: 78), messages are the
sum of signs or signals that try to express one or more ideas.
The instructions depend on the media used and the goals of the
speaker (behavior that will be influenced).
B. Personal Selling
According to Simamora (2000: 758) Personal Selling is a
presentation or oral presentation in a conversation with one or
more prospective buyers with the aim of making a purchase. In
private sales exclusive interpersonal contact occurs, someone
makes a sales presentation to another person or group of
potential buyers. Personal sales audiences can be customers,
organizational customers, or marketing intermediaries.
Personal selling is direct communication (face to face)
between sellers and prospective customers and forms the
customer's understanding of the product so that they will try
and buy it (Tjiptono 2008: 224).
C. Brand Awareness
According to Shimp (2010), brand awareness is the ability for
brands to appear in the minds of compilation customers who are
clarifying certain product categories and making it easy for the
name to emerge, furthermore, brand awareness for basic
dimensions in brand equity.
In line with Shrimp (2010), according to Tjiptono (2005), brand
awareness (brand awareness) is the ability of consumers to
facilitate or remember about brands that are members of certain
product categories.
III. RESEARCH ELABORATIONS
The Influence of the Relations Between Advertising
Variables and Personal Selling Against Brand Awareness
Effect of Relationship The relationship between advertising
and personal selling variables on brand awareness was revealed by
Berry (2000) cited by Tjiptono (2014) that brand awareness is part
of service branding to market a service.
Meanwhile, as we already know from the theory explained by
Kotler (2010: 426) in the previous section, advertising and personal
selling are part of the promotion. Promotion is a form of
communication with the market that presents the brand of the
company itself (Kotler, 2010). Presented brand is a form of
communication made by a company regarding its identity and
purpose through advertising, service facilities, and service provider
appearances (Berry, 2000). Variable Advertising and Personal
Selling Against Brand Awareness
According to Keller (1993, 2012) quoted by Tjiptono (2014)
the key to creating brand equity is brand knowledge, which consists
of brand awareness and brand image. Having a strong brand is a
vital aspect of a company, because the advantages that can be
obtained from a wide range of Branding are not only relevant for
goods producers, but also very crucial for service companies that
are intangible, inseparable, variable, and perishable. Strong brands
help customers visualize and understand intangible products.
Brands in the service context are often interpreted as "promises"
(Berry, 2000; Berry & Pasuraman, 1991).
Based on the picture above, Berry (2000) explains each of the chart
points quoted from Keller (1993), including:
1. Presented Brand is a controlled company communication
about its identity and purpose through advertisements, service
facilities, and the appearance of service providers. This includes the
company's name, logo and visual presentation.
2. External brand communication refers to information received
by customers about the company and its services which are in
principle not controlled by the company and services that are not in
principle controlled by the company. The main form of
communication is an external brand company.
3. Brand awareness is the ability of customers to recognize and
remember the brand when given certain instructions or cues.
4. Brand meaning refers to the customer's dominant perception
of the company's brand. Although the brand presented by the brand
and external communication contribute to brand meaning, the main
source of influence for customers who have actually experienced
service is the experience concerned.
5. Customer experience with the company refers to the
customer's actual experience in buying and communicating the
company's previous services.
6. Brand equity is the differentiation effect of a combination of
brand awareness and brand meaning on customer responses to
brand marketing (Keller, 1993).
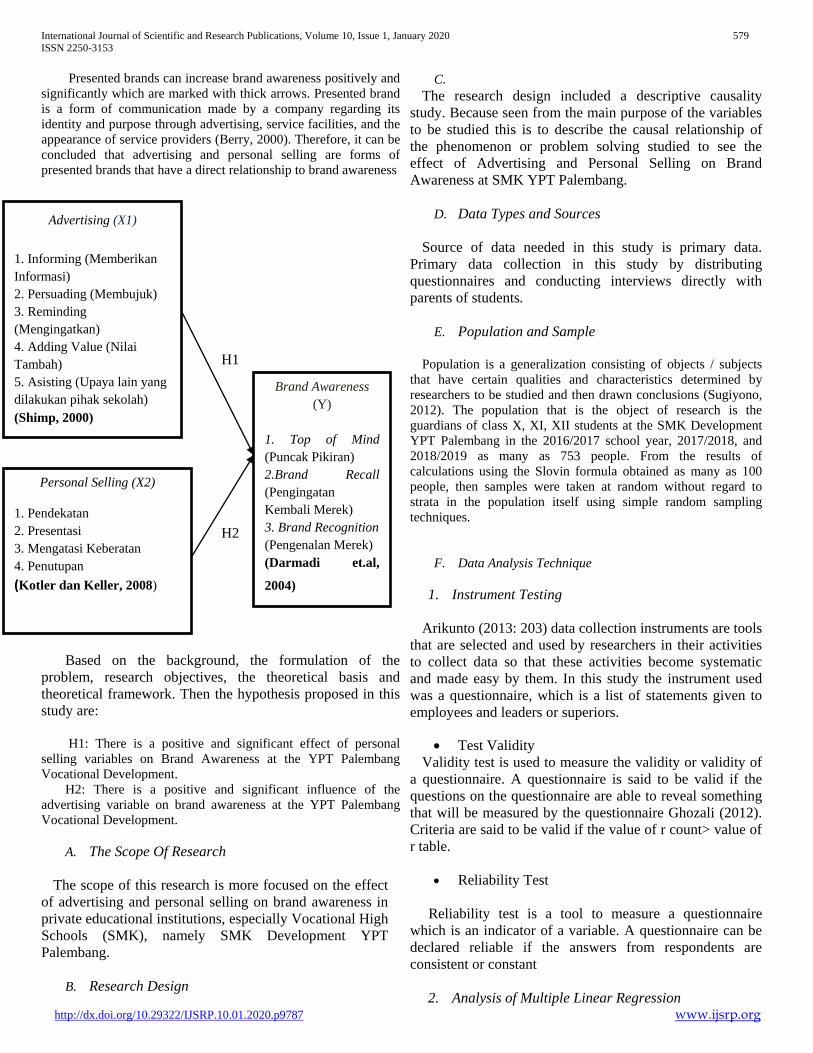
International Journal of Scientific and Research Publications, Volume 10, Issue 1, January 2020 579
ISSN 2250-3153
http://dx.doi.org/10.29322/IJSRP.10.01.2020.p9787 www.ijsrp.org
Presented brands can increase brand awareness positively and
significantly which are marked with thick arrows. Presented brand
is a form of communication made by a company regarding its
identity and purpose through advertising, service facilities, and the
appearance of service providers (Berry, 2000). Therefore, it can be
concluded that advertising and personal selling are forms of
presented brands that have a direct relationship to brand awareness
Based on the background, the formulation of the
problem, research objectives, the theoretical basis and
theoretical framework. Then the hypothesis proposed in this
study are:
H1: There is a positive and significant effect of personal
selling variables on Brand Awareness at the YPT Palembang
Vocational Development.
H2: There is a positive and significant influence of the
advertising variable on brand awareness at the YPT Palembang
Vocational Development.
A. The Scope Of Research
The scope of this research is more focused on the effect
of advertising and personal selling on brand awareness in
private educational institutions, especially Vocational High
Schools (SMK), namely SMK Development YPT
Palembang.
B. Research Design
C.
The research design included a descriptive causality
study. Because seen from the main purpose of the variables
to be studied this is to describe the causal relationship of
the phenomenon or problem solving studied to see the
effect of Advertising and Personal Selling on Brand
Awareness at SMK YPT Palembang.
D. Data Types and Sources
Source of data needed in this study is primary data.
Primary data collection in this study by distributing
questionnaires and conducting interviews directly with
parents of students.
E. Population and Sample
Population is a generalization consisting of objects / subjects
that have certain qualities and characteristics determined by
researchers to be studied and then drawn conclusions (Sugiyono,
2012). The population that is the object of research is the
guardians of class X, XI, XII students at the SMK Development
YPT Palembang in the 2016/2017 school year, 2017/2018, and
2018/2019 as many as 753 people. From the results of
calculations using the Slovin formula obtained as many as 100
people, then samples were taken at random without regard to
strata in the population itself using simple random sampling
techniques.
F. Data Analysis Technique
1. Instrument Testing
Arikunto (2013: 203) data collection instruments are tools
that are selected and used by researchers in their activities
to collect data so that these activities become systematic
and made easy by them. In this study the instrument used
was a questionnaire, which is a list of statements given to
employees and leaders or superiors.
Test Validity
Validity test is used to measure the validity or validity of
a questionnaire. A questionnaire is said to be valid if the
questions on the questionnaire are able to reveal something
that will be measured by the questionnaire Ghozali (2012).
Criteria are said to be valid if the value of r count> value of
r table.
Reliability Test
Reliability test is a tool to measure a questionnaire
which is an indicator of a variable. A questionnaire can be
declared reliable if the answers from respondents are
consistent or constant
2. Analysis of Multiple Linear Regression
H1
-
Ke
mu
dah
an
me
nda
pat
kan
bro
sur
-
Ke
mu
dah
an
me
ne
mu
kan
ban
ner
-
De
sai
n
bro
sur
-
De
sai
n
ban
ner
H2
-
Ke
mu
dah
an
me
nda
pat
kan
bro
sur
-
Ke
mu
dah
an
me
ne
mu
kan
ban
ner
-
De
sai
Advertising (X1)
1. Informing (Memberikan
Informasi) 2. Persuading (Membujuk) 3. Reminding
(Mengingatkan) 4. Adding Value (Nilai
Tambah) 5. Asisting (Upaya lain yang
dilakukan pihak sekolah)
(Shimp, 2000)
Personal Selling (X2)
1. Pendekatan 2. Presentasi 3. Mengatasi Keberatan 4. Penutupan
(Kotler dan Keller, 2008)
Brand Awareness
(Y) 1. Top of Mind
(Puncak Pikiran) 2.Brand Recall
(Pengingatan
Kembali Merek) 3. Brand Recognition
(Pengenalan Merek) (Darmadi et.al,
2004)

International Journal of Scientific and Research Publications, Volume 10, Issue 1, January 2020 580
ISSN 2250-3153
http://dx.doi.org/10.29322/IJSRP.10.01.2020.p9787 www.ijsrp.org
To answer the problem formulation in this study, the
analysis conducted is multiple regression analysis. This
analysis is used to analyze the effect of the independent
variables on the dependent variable, namely the Effect of
Advertising and Personal Selling on Brand Awareness of
SMK YPT Palembang. With the formulation as follows:
Y = a + b1X1 + b2X2 + b3X3 + e
Where:
Y = Brand Awareness
a = constant
b1, b2, b3 = Coefficient of the regression line
X1 = Advertising
X2 = Personal Selling
E = Standard error
3. Test F
If F arithmetic <F table then Ho is accepted and
Ha is rejected. This means that there is no influence of the
independent variables on the dependent variable
simultaneously
If F arithmetic> F table then Ho is rejected and Ha
is accepted. This means that there is an influence of the
independent variables on the dependent variable
simultaneously.
4. Test T
If F arithmetic <F table then Ho is accepted and
Ha is rejected. This means that there is no influence of the
independent variables on the dependent variable
simultaneously.
If F arithmetic> F table then Ho is rejected and Ha
is accepted. This means that there is an influence of the
independent variables on the dependent variable
simultaneously.
IV. RESULTS OR FINDING
1. Descriptive test results
Descriptive statistics provide a general description of the
research object that is sampled as well as being focused on
the maximum, minimum, average, and standard deviation
values. Based on sample data obtained from 100 trustees
of Palembang YPT Vocational School students with
statistics on Advertising, Personal Selling and Brand
Awareness variables can be seen in the table below:
I. TABLE DESCRIPTIVE TEST RESULTS
Sources : Primary Data Processed, 2019
2. Multiple linear regression
The results of multiple regression tests in this study can be
seen in the following table:
Coefficientsa
Model
Unstandardized
Coefficients
Standardize
d
Coefficients
B
Std.
Error Beta
1 (Constant
) .085 .065
Advertisi
ng .720 .099 .694
Personal
Selling .229 .104 .211
Descriptive Statistics
N
Mi
ni Ma
Me
an
Std.
Deviati
on
Advertising 100 36 60
58.
92 4.543
Personal
selling 100 51 85 83.
60 5.643
BrandAwar
esess 100 18 30 29.
76 1.457
Valid N
(listwise) 100
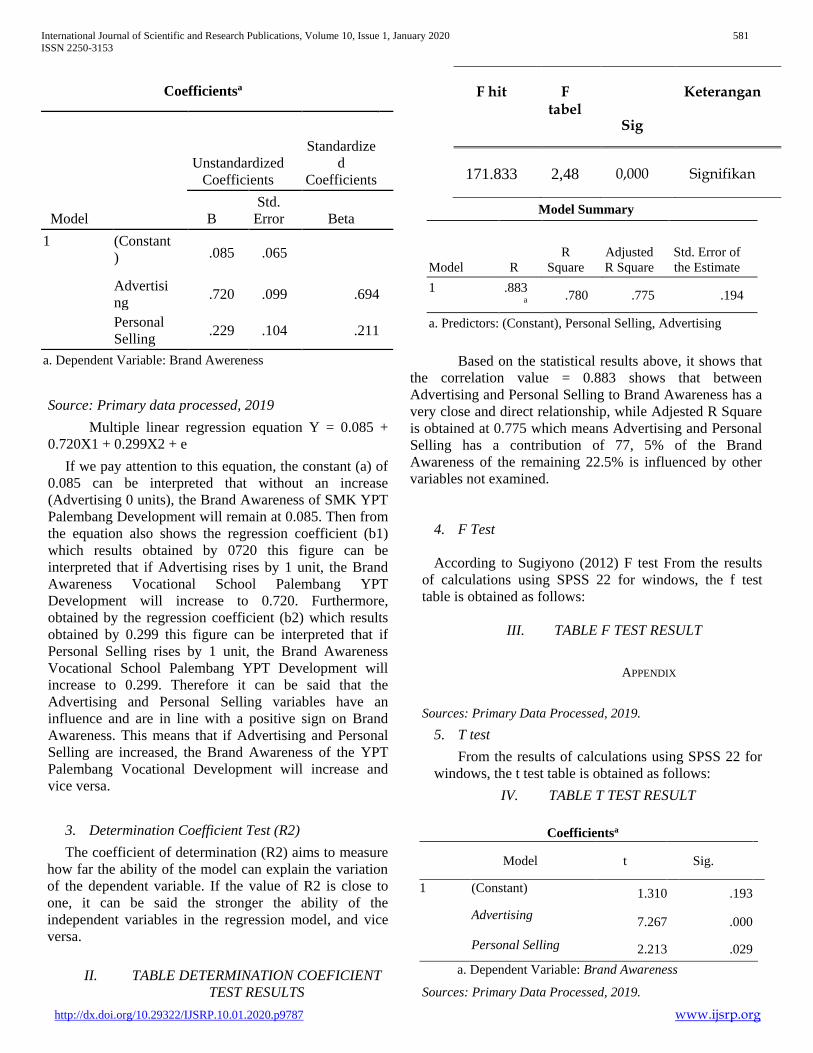
International Journal of Scientific and Research Publications, Volume 10, Issue 1, January 2020 581
ISSN 2250-3153
http://dx.doi.org/10.29322/IJSRP.10.01.2020.p9787 www.ijsrp.org
Coefficientsa
Model
Unstandardized
Coefficients
Standardize
d
Coefficients
B
Std.
Error Beta
1 (Constant
) .085 .065
Advertisi
ng .720 .099 .694
Personal
Selling .229 .104 .211
a. Dependent Variable: Brand Awereness
Source: Primary data processed, 2019
Multiple linear regression equation Y = 0.085 +
0.720X1 + 0.299X2 + e
If we pay attention to this equation, the constant (a) of
0.085 can be interpreted that without an increase
(Advertising 0 units), the Brand Awareness of SMK YPT
Palembang Development will remain at 0.085. Then from
the equation also shows the regression coefficient (b1)
which results obtained by 0720 this figure can be
interpreted that if Advertising rises by 1 unit, the Brand
Awareness Vocational School Palembang YPT
Development will increase to 0.720. Furthermore,
obtained by the regression coefficient (b2) which results
obtained by 0.299 this figure can be interpreted that if
Personal Selling rises by 1 unit, the Brand Awareness
Vocational School Palembang YPT Development will
increase to 0.299. Therefore it can be said that the
Advertising and Personal Selling variables have an
influence and are in line with a positive sign on Brand
Awareness. This means that if Advertising and Personal
Selling are increased, the Brand Awareness of the YPT
Palembang Vocational Development will increase and
vice versa.
3. Determination Coefficient Test (R2)
The coefficient of determination (R2) aims to measure
how far the ability of the model can explain the variation
of the dependent variable. If the value of R2 is close to
one, it can be said the stronger the ability of the
independent variables in the regression model, and vice
versa.
II. TABLE DETERMINATION COEFICIENT
TEST RESULTS
Model Summary
Model R
R
Square
Adjusted
R Square
Std. Error of
the Estimate
1 .883a
.780 .775 .194
a. Predictors: (Constant), Personal Selling, Advertising
Based on the statistical results above, it shows that
the correlation value = 0.883 shows that between
Advertising and Personal Selling to Brand Awareness has a
very close and direct relationship, while Adjested R Square
is obtained at 0.775 which means Advertising and Personal
Selling has a contribution of 77, 5% of the Brand
Awareness of the remaining 22.5% is influenced by other
variables not examined.
4. F Test
According to Sugiyono (2012) F test From the results
of calculations using SPSS 22 for windows, the f test
table is obtained as follows:
III. TABLE F TEST RESULT
APPENDIX
Sources: Primary Data Processed, 2019.
5. T test
From the results of calculations using SPSS 22 for
windows, the t test table is obtained as follows:
IV. TABLE T TEST RESULT
Coefficientsa
Model t Sig.
1 (Constant) 1.310 .193
Advertising 7.267 .000
Personal Selling 2.213 .029
a. Dependent Variable: Brand Awareness
Sources: Primary Data Processed, 2019.
F hit F tabel
Sig
Keterangan
171.833 2,48 0,000 Signifikan
International Journal of Scientific and Research Publications, Volume 10, Issue 1, January 2020 582
ISSN 2250-3153
http://dx.doi.org/10.29322/IJSRP.10.01.2020.p9787 www.ijsrp.org
1. From the t-test results obtained t value of the
independent variable namely: T-value of 7.267> 1.672
with a significant level of probability of 0,000 <0.05.
Then there is a significant influence between Advertising
significant effect on Brand Awareness variable. Thus
means the first hypothesis (H1) is accepted.
2. T-value of 2.213 with a significant level of
probability of 0.029 <0.05. Then there is a significant
influence between Personal Selling on Brand
Awereness. Thus means the second hypothesis (H2) is
accepted.
PRACTICAL IMPLICATIONS
1. Effect of Advertising on Brand Awareness at the
YPT Palembang Development Vocational School
From the results of this study indicate that
Advertising, has a significant effect on Brand Awareness
of the YPT Palembang Vocational Development. The
results of this study are in line with research conducted
by Munyaradzi Mutsikiwa1, Kossam Dhliwayo, Clay
Hutama Basera (2013) from Zimbabwean Universities
which shows that Advertising has a positive and
significant effect on brand awareness. But Sawant
(2012) in his research on the impact of advertising on
brand awareness and consumer preference (with special
references to men's wear) states that advertising is
usually a form of promotion that is responsible for
popularizing products / services, but to build brand
awareness is not enough just to advertising so the results
of this study state that advertising has a positive and not
significant effect on brand awareness.
From the description above, the authors assume in
Advertising, in addition to highlighting the quality of
information content, attractive design strategic
placement will affect the success or failure of
Advertising activities, because the purpose of
Advertising is not only to introduce products but also to
attract consumers to buy products.
2. Effect of Personal Selling on Brand Awareness at
the YPT Palembang Development Vocational
School
From the results of this study indicate that Personal
Selling has a significant effect on Brand Awareness of
the YPT Palembang Vocational Development. The
results of this study are in line with research conducted
by Abdul Jumaat bin Mahajar and Bodi Binti Mohd
Yunus (2011) The Effectiveness Of The Promotional
Tools In Creating Awareness Towards Customers Of
Islamic Banking In Malaysia which shows that
Advertising has a positive and significant effect on brand
awareness. Furthermore Pirathhepan and Pushpatan
(2012) research revealed that the better Personal Selling
in promotional strategies will increase Brand Awareness.
From the description above, the authors assume in
Personal Selling, consumers can not only find out
information about the products offered but also by direct
interaction with representatives of the company / school
consumers can know the extent of the performance of
resources / labor owned by the company both in terms of
knowledge, attitudes and abilities in serving konuen.
Therefore the company must really place its human
resources who have high dedication to the company to
conduct personal selling and if possible do special
training for employees who will be given the task of
conducting personal selling activities.
V. CONCLUSIONS AND SUGGESTION
1. Conclusions
Based on the results of the research that has been
described, it can be concluded that advertising and
personal sales have a positive and significant
relationship to Brand Awareness Vocational
Development of Palembang YPT.
2. Suggestion
The suggestions that the author can give in this
study are as follows:
1. The manager of the Palembang YPT Development
Vocational School can fulfill the improvement of the
quality of teachers and the completeness of teaching and
learning facilities and promotion activities both through the
media and directly, so that the quality of graduates and the
quantity of new students continue to increase.
2. For future researchers, it is hoped that the results of
this study can be used as additional information and add
samples or other variables specifically about brands.
REFERENCES
[1]. Republik Indonesia. 2003. Undang-undang No 20.
Tahun 2003. Tentang Sistem Pendidikan Nasional.
Sekretariat Negara. Jakarta
[2]. Kotler, Philip and Gary Armstrong, 2008, Prinsip-
prinsip Pemasaran, Edisi 12. Jilid 1. Jakarta: Erlangga
[3]. Kotler, Plilip. 2000. Manajemen Pemasaran. Edisi
Mileinium. Jakarta : PT. Indeks Kelompok Gramedia
[4]. Kotler, Plilip. 1994. Marketing Management:
Analysis, Planning, Implementation, Control. Ed. 8. New
Jersey: Prentise Hall Inc.
[5]. Peter, J. Paul dan Jerry C. Olson. 2000. Consumer
Behavior. Perilaku konsumen dan Strategi Pemasaran
Jilid 2. Edisi 4. Jakarta: Erlangga
[6]. Alma, B. 2008. Manajemen Pemasaran dan
Pemasaran Jasa. Alfa Beta. Bandung.
[7]. Tjiptono, F. 2004. Strategi Pemasaran. Edisi Kedua.
International Journal of Scientific and Research Publications, Volume 10, Issue 1, January 2020 583
ISSN 2250-3153
http://dx.doi.org/10.29322/IJSRP.10.01.2020.p9787 www.ijsrp.org
Andi Offset. Yogyakarta.
[8]. Tjiptono, F. 2008. Strategi Pemasaran. Andi Offset.
Yogyakarta.
[9]. Basu Swastha. 2002. Manajemen Pemasaran. Edisi
Kedua. Cetakan Kedelapan. Jakarta: Penerbit Liberty.
[10]. Sugiyono. (2001). Metode Penelitian kuantitatif
kualitatif dan R&D. Bandung: Alfabeta.
[11]. Marshall, G. dan Jhonston. 2011. Essentials of
Marketing Management. New York: Mc Graw Hill
International Edition.
[12]. Kerlinger. 2006. Asas-asas penelitian behavior.
Edisi 3, cetakan 7. Yogyakarta: Gadjah Mada University
Press.
[13]. Masyhuri, M. Z. 2008. Metodologi penelitian
pendekatan praktis dan aplikatif. Bandung: PT Refika
Aditama.
[14]. Wijaya, Ariyadi. 2012. Pendidikan Matematika
Realistik: Suatu Alternatif Pendekatan Pembalajaran
Matematika. Yogyakarta: Graha Ilmu
[15]. Margono. 2004. Metodologi penelitian pendidikan.
Jakarta: PT.Rineka Cipta
[16]. Peter, P, J. dan Olson, Jerry, C. 2000. Costumer
Behavior. Jilid 2, Edisi Kelima (alih Bahasa Damos
Sihombing) Erlangga. Jakarta
[17]. Henry, Simamora.2000. Akutansi Basis
Pengambilan Keputusan Bisnis, Jakarta: Salemba Empat.
Husein Umar
[18]. GunasekharanT., Basha S. Shaik., & Lakshmanna
B.C. (2015). A Study on Impact of Promotion Mix
Elements: Advertising, Personal Selling & Public
Relation of DTH Manufacturers on Customer Behaviour.
IJAHMS, Juni 2015, 20-30.
[19]. Shimp, Terence A.2000. Periklanan Promosi Aspek
Tambahan Komunikasi Pemasaran Terpadu. Terjemahan
oleh : Revyani Sjahrial, S.E. dan Dyah
Anikasari,S.Sos.2003.Jakarta: Erlangga.
[20]. Durianto, Darmadi. (2004). Strategi Menaklukkan
Pasar melalui Riset Ekuisitas dan Perilaku Merek.
Jakarta. Gramedia.
[21]. Yazid. 2008. Pemasaran Jasa: Konsep dan
Implementasi. edisi pertama. Ekonisia Fakultas Ekonomi.
Yogyakarta.
[22]. Durianto,Sugiarto dan Tony Sitinjak, 2001. Strategi
Menaklukkan Pasar Melalui Riset Ekuitas dan Perilaku
Merek, PT. Gramedia Pustaka Utama,Jakarta.
[23]. Ghozali, I. 2011.Aplikasi Analisis Multivariate
dengan Program SPSS (Trans: Application of
Multivariate Analysis using SPSS). Badan Penerbit
UNDIP. ISBN 979.704.300.2. Semarang
[24]. Bimantoro, F., dan Herawati, F.A., 2011. Pengaruh
Frekuensi Melihat Iklan Floating terhadap Tingkat
Kesadaran Merek. Jurnal Ilmu Komunikasi, 8(2).
[25]. Dewi, L., dan Magdalena, F. 2017. PENGARUH
Personal Selling Dan Word Of Mouth Terhadap Brand
Awareness Bisnis Mahasiswa Universitas Ciputra. Jurnal
Eksekutif, 14(2), 253-261.
[26]. Gunawan, F.A., dan Dharmayanti, D. 2014. Analisis
Pengaruh Iklan Televisi Dan Endorser Terhadap Purchase
Intention Pond’s Men Dengan Brand Awareness Sebagai
Variabel Intervening. Jurnal Manajemen Pemasaran Petra,
2(1), 1-14.
[27]. Kurniawati, D., dan Sipayung, C.A.G., 2015. Iklan
Manulife dan Brand Awareness (Studi Korelasional
Analisis Iklan Manulife terhadap Brand Awareness
Nasabah PT. Asuransi Jiwa Manulife Indonesia di Kota
Medan). Jurnal Simbolika, 1(1), 34-50.
[28]. Bangun, B.T., dan Saputri, M.E. 2016. Pengaruh
Advertising Terhadap Pembentukan Brand Awareness
Pada Zalora Indonesia. e-Proceeding of Management,
3(2), 2076-2080.
[29]. Bujangga, P.H., dan Hidayat, R. 2019. Pengaruh
Personal Selling Dan Fitur Iklan Melalui Media Sosial
Terhadap Keputusan Pembelian Produk Indihome. e-
Proceeding of Applied Science, 5(1), 74-81.
[30]. Faristin, L., Hariyadi, S., dan Prihastuty, R. 2013.
Efektivitas Iklan Perguruan Tinggi Dalam Meningkatkan
Brand Awareness Pada Siswa Kelas 3 Di Sma Negeri 1
Bae Kudus. Journal of Social and Industrial Psychology,
2(1), 64-68.
[31]. Febriana, C.N., Kumadhi, S., dan Mawardi, M.K.
2015. Pengaruh Iklan Televisi Terhadap Kesadaran Merek
Serta Dampaknya Pada Keputusan Pembelian. Jurnal
Administrasi Bisnis (JAB), 25(1), 1-7.
[32]. Kurnyawati, M.D., Kumadji, S., dan Yulianto, E.
2014. Pengaruh Iklan Terhadap Brang Awareness Dan
Dampaknya Terhadap Keputusan Pembelian. Jurnal
Administrasi Bisnis (Jab), 16(1), 1-6.
[33]. Naafiani, Chellya Niken Hayyu. 2010. Studi
Tentang Antecedent Brand Attitude Dan Brand Equity.
Jurnal Sains Pemasaran Indonesia, 9(1), 77-94.
[34]. Nofrizal, dan Ukhriyawati, C.F. 2014. Pengaruh
Positioning, Advertising Dan Personal Selling Terhadap
Brand Image (Citra Merek) Keripik Kari Di Kota Batam.
Equilibria, 1(2), 1-17.
[35]. Piratheepan, U., dan Pushpanathan, A. 2013. Impact
of Promotional Strategies on Brand Awareness ; A Study
on Milk Powder Brands in Nuwaraeliya District. IFRSA
Business Review, 3(4), 268-272.
[36]. Prabawa, K.T.S., Sukawati,T.G.R., dan Setiawan,
P.Y. 2017. Peran Brand Awareness Dalam Memediasi
Hubungan Iklan Dan Personal Selling Dengan Niat Beli.
E-Jurnal Manajemen Unud, 6(2), 889-918.
[37]. Sandra, H., Dan Haryanto, J.O. 2010. Pengaruh
Iklan Heritage Terhadap Brand Awarenes, Brand Trust,
Dan Intensi Pembelian. Jurnal Manajemen Teori Dan
Terapan, 3(3).
[38]. Shintarani, Egi Dian. 2017. Pengaruh Promosi
Produk Seafoodking terhadap Brand Awareness Produk.
Journal of Communication (Nyimak), 1(2), 209-220.
[39]. Sukma, F., Sarma, M., dan Syamsun, M. 2015.

International Journal of Scientific and Research Publications, Volume 10, Issue 1, January 2020 584
ISSN 2250-3153
http://dx.doi.org/10.29322/IJSRP.10.01.2020.p9787 www.ijsrp.org
Efektivitas Iklan dalam Menumbuhkan Brand Awareness
SMA Sampoerna. Manajemen IKM, 10(2), 182-193.
[40]. Sulistio, K., dan Ismail, Y. 2018. The Analysis Of
Bekasi Industrial Tourism’s Brand Awareness. Firm
Journal Of Management Studies, 3(2), 167-182.
[41]. Wicaksono, M.P.A., Dan Seminari, N.K. 2017.
Pengaruh Iklan Dan Word Of Mouth Terhadap Brand
Awareness Traveloka. E-Jurnal Manajemen Unud, 5(8),
5098-5127.
[42]. http://edukasi.kompas.com/read/2012/09/16/11314
343/Ini.Syarat.Jika.Swasta.Mau.Dirikan.SMK (diakses 20
Maret 2019)
[43]. www.sumsel.tribunnews.com/2017/07/03/1575-
peserta-yang-mendaftar-ini-jurusan-favorit-di-SMK-
Negeri-2 (diakses pada 11 April 2019)
[44]. www.merdeka.com/uang/smk-indonesia-banyak-
dimiliki-swasta.html, (diakses 5 April 2019)
International Journal of Scientific and Research Publications, Volume 10, Issue 1, January 2020 585
ISSN 2250-3153
http://dx.doi.org/10.29322/IJSRP.10.01.2020.p97XX www.ijsrp.org
Comparison of Richmond Agitation Sedation Scale
(RASS) And Ramsay Sedation Scale (RSS) With
Bispectral Index to Evaluate Depth of Sedation in
Patients at The Intensive Care Unit in Adam Malik
General Hospital Medan
Riza Stya Yulianda*, Akhyar Hamonangan Nasution**, Fadli Armi Lubis**
*Resident of Anaesthesiology and Intensive Therapy, Faculty of Medicine, Universitas Sumatera Utara, Medan, Indonesia
**Departement of Anaesthesiology and Intensive Therapy, Faculty of Medicine, Universitas Sumatera Utara, Medan, Indonesia
DOI: 10.29322/IJSRP.10.01.2020.p9788
http://dx.doi.org/10.29322/IJSRP.10.01.2020.p9788
Abstract- Background: Management of sedation and analgesia in
the Intensive Care Unit requires parameters to evaluate the
sedation that can be done by objective or subjective methods.
Objectively, we can use the Bispectral Index (BIS), while
subjectively we can use thesedation scale, such as Richmond
Agitation Sedation Scale (RASS) and Ramsay Sedation Scale
(RSS).
Objective: This study aims to compare the correlation between
BIS with RASS and RSS.
Method: Thirty-four patients who was treated in the Intensive
Care Unit, mechanically ventilated and receiving Midazolam
sedation with a cross-sectional analytic design were observed with
BIS (target 65-85), then observed with RSS and RASS sedation
scales. Patients with muscle relaxation treatment, central nervous
system disorder, GCS <8, and unstable hemodynamics were
included the exclusion criteria in this study.
Results: The average value of Richmond Agitation Sedation Scale
(RASS) was -0.88 and Ramsay Sedation Score (RSS) was 3.55
after the administration of sedation. The correlation of Bispectral
Index when evaluating the depth of sedation in patients at
Intensive Care Unit with the Richmond Agitation Sedation Scale
(RASS) sedation scale showed a non-significant weak correlation
(r = -0.232 p> 0.05) compared to the correlation of Ramsay
Sedation Score (RSS) sedation scale to Bispectral Index (r = 0.350
p <0.05).
Conclusion: RSS and RASS scoring systems had weak
correlation to BIS but can be used to evaluate the depth of sedation
in the Intensive Care Unit where RSS showed a better correlation
than RASS.
Index Terms- Bispectral Index (BIS), Richmond Agitation
Sedation Scale (RASS), Ramsay Sedation Scale (RSS).
I. INTRODUCTION
ost patients in the Intensive Care Unit experience pain,
agitation, or anxiety during treatment and include
indications for administration of sedation and analgesia.1 Sedation
should be given to patients with critical illness who are treated in
the Intensive Care Unit to reduce anxiety in patients.2 The main
principle of care in the Intensive Care Unit is to provide comfort
so that patients can tolerate to an unfriendly environment in the
Intensive Care Unit.3 Management of analgesia and sedation in
the Intensive Care Unit requires evaluation and also monitoring
parameters to detect and measure the degree of pain, agitation, and
sedation.4
Several sedation scales have been applied to evaluate
sedation. Sedation levels on these scales are assessed and
monitored using a number of different methods. In clinical
practice, several assessments have been used that are objective
methods (measuring plasma concentrations of sedation drugs,
frontal electromyogram, lower oesophageal contraction,
electroencephalogram, Bispectral Index monitoring (BIS),
auditory evoked potentials) and subjective methods such as
Ramsay Sedation Scale (RSS), Motor activity scale, Richmond
Agitation Sedation Scale (RASS), Riker Sedation-Agitation Scale
(RSAS) .5
In 1974, Ramsay published the well-known Ramsay
Sedation Scale (RSS) by evaluating the effects of dalphaxolone or
alphadolone sedation in 30 patients at the Intensive Care Unit
using 6 point anxious or agitation scale to patients who did not
have a response to stimulation. Since being published, the Ramsay
scale has been used by many researchers and has also been used
in 20 of 31 randomized controlled trials (RCTs) to compare
sedation drugs with sedation quality or duration of mechanical
ventilation. In 2002 the Richmond Agitation Sedation Scale
(RASS) was introduced. The RASS scale was designed to have
precise, unambiguous definitions for the level of sedation in the
assessment of wakefulness, awareness, and general response
resistance (open eyes, eye contact, physical movements) to sound
and physical stimuli that are present in logical development.6
Bispectral Index (BIS) is a new electroencephalogram
parameter specifically developed to measure the effects of
sedation and hypnotics that are produced by anesthetic drugs. The
main role of BIS is to measure the depth of anesthesia and it is
useful for adjusting the dose of sedative drugs. The BIS index is a M
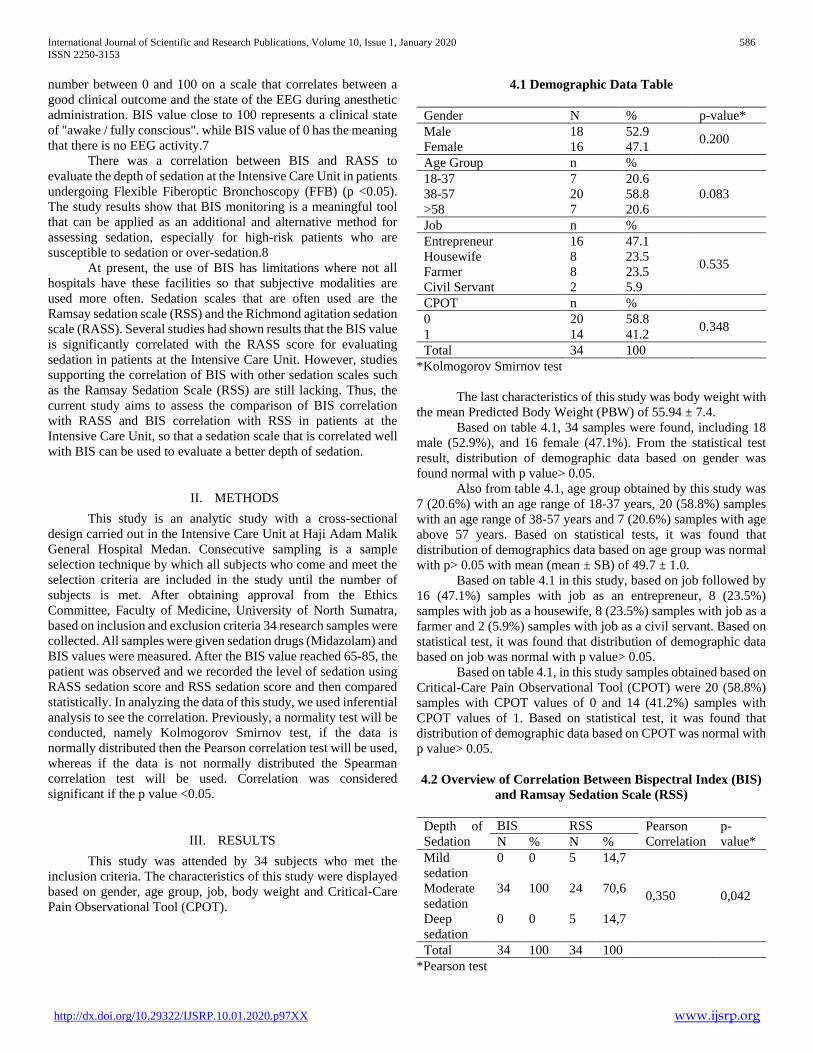
International Journal of Scientific and Research Publications, Volume 10, Issue 1, January 2020 586
ISSN 2250-3153
http://dx.doi.org/10.29322/IJSRP.10.01.2020.p97XX www.ijsrp.org
number between 0 and 100 on a scale that correlates between a
good clinical outcome and the state of the EEG during anesthetic
administration. BIS value close to 100 represents a clinical state
of "awake / fully conscious". while BIS value of 0 has the meaning
that there is no EEG activity.7
There was a correlation between BIS and RASS to
evaluate the depth of sedation at the Intensive Care Unit in patients
undergoing Flexible Fiberoptic Bronchoscopy (FFB) (p <0.05).
The study results show that BIS monitoring is a meaningful tool
that can be applied as an additional and alternative method for
assessing sedation, especially for high-risk patients who are
susceptible to sedation or over-sedation.8
At present, the use of BIS has limitations where not all
hospitals have these facilities so that subjective modalities are
used more often. Sedation scales that are often used are the
Ramsay sedation scale (RSS) and the Richmond agitation sedation
scale (RASS). Several studies had shown results that the BIS value
is significantly correlated with the RASS score for evaluating
sedation in patients at the Intensive Care Unit. However, studies
supporting the correlation of BIS with other sedation scales such
as the Ramsay Sedation Scale (RSS) are still lacking. Thus, the
current study aims to assess the comparison of BIS correlation
with RASS and BIS correlation with RSS in patients at the
Intensive Care Unit, so that a sedation scale that is correlated well
with BIS can be used to evaluate a better depth of sedation.
II. METHODS
This study is an analytic study with a cross-sectional
design carried out in the Intensive Care Unit at Haji Adam Malik
General Hospital Medan. Consecutive sampling is a sample
selection technique by which all subjects who come and meet the
selection criteria are included in the study until the number of
subjects is met. After obtaining approval from the Ethics
Committee, Faculty of Medicine, University of North Sumatra,
based on inclusion and exclusion criteria 34 research samples were
collected. All samples were given sedation drugs (Midazolam) and
BIS values were measured. After the BIS value reached 65-85, the
patient was observed and we recorded the level of sedation using
RASS sedation score and RSS sedation score and then compared
statistically. In analyzing the data of this study, we used inferential
analysis to see the correlation. Previously, a normality test will be
conducted, namely Kolmogorov Smirnov test, if the data is
normally distributed then the Pearson correlation test will be used,
whereas if the data is not normally distributed the Spearman
correlation test will be used. Correlation was considered
significant if the p value <0.05.
III. RESULTS
This study was attended by 34 subjects who met the
inclusion criteria. The characteristics of this study were displayed
based on gender, age group, job, body weight and Critical-Care
Pain Observational Tool (CPOT).
4.1 Demographic Data Table
Gender N % p-value*
Male 18 52.9 0.200
Female 16 47.1
Age Group n %
18-37 7 20.6
0.083 38-57 20 58.8
>58 7 20.6
Job n %
Entrepreneur 16 47.1
0.535 Housewife 8 23.5
Farmer 8 23.5
Civil Servant 2 5.9
CPOT n %
0 20 58.8 0.348
1 14 41.2
Total 34 100
*Kolmogorov Smirnov test
The last characteristics of this study was body weight with
the mean Predicted Body Weight (PBW) of 55.94 ± 7.4.
Based on table 4.1, 34 samples were found, including 18
male (52.9%), and 16 female (47.1%). From the statistical test
result, distribution of demographic data based on gender was
found normal with p value> 0.05.
Also from table 4.1, age group obtained by this study was
7 (20.6%) with an age range of 18-37 years, 20 (58.8%) samples
with an age range of 38-57 years and 7 (20.6%) samples with age
above 57 years. Based on statistical tests, it was found that
distribution of demographics data based on age group was normal
with p> 0.05 with mean (mean ± SB) of 49.7 ± 1.0.
Based on table 4.1 in this study, based on job followed by
16 (47.1%) samples with job as an entrepreneur, 8 (23.5%)
samples with job as a housewife, 8 (23.5%) samples with job as a
farmer and 2 (5.9%) samples with job as a civil servant. Based on
statistical test, it was found that distribution of demographic data
based on job was normal with p value> 0.05.
Based on table 4.1, in this study samples obtained based on
Critical-Care Pain Observational Tool (CPOT) were 20 (58.8%)
samples with CPOT values of 0 and 14 (41.2%) samples with
CPOT values of 1. Based on statistical test, it was found that
distribution of demographic data based on CPOT was normal with
p value> 0.05.
4.2 Overview of Correlation Between Bispectral Index (BIS)
and Ramsay Sedation Scale (RSS)
Depth of
Sedation
BIS RSS Pearson
Correlation
p-
value* N % N %
Mild
sedation
0 0 5 14,7
0,350 0,042 Moderate
sedation
34 100 24 70,6
Deep
sedation
0 0 5 14,7
Total 34 100 34 100
*Pearson test

International Journal of Scientific and Research Publications, Volume 10, Issue 1, January 2020 587
ISSN 2250-3153
http://dx.doi.org/10.29322/IJSRP.10.01.2020.p97XX www.ijsrp.org
In this study based on table 4.2, we found a moderate
positive correlation (0.350) between BIS and RSS using Pearson
correlation and statistically it was significant with p value< 0.05.
4.3 Overview of Correlation Between Bispectral Index (BIS)
and Richmond Agitation Sedation Scale (RASS)
Depth of
sedation
BIS RASS Pearson
correlation
p-
value* N % N %
Mild
sedation
0 0 2 5,9
-0,232 0,187 Moderate
sedation
34 100 30 88,2
Deep
sedation
0 0 2 5,9
Total 34 100 34 100
*Pearson test
In this study based on table 4.3, we found that there is a
weak negative correlation (-0.232) between BIS and RASS using
Pearson correlation and statistically it was insignificant with a p
value> 0.05.
IV. CONCLUSIONS
From the results of this research conducted to see the
comparison of Richmond Agitation Sedation Scale (RASS) and
Ramsay Sedation Scale (RSS) with Bispectral Index (BIS) to
evaluate the depth of sedation in patients at the Intensive Care
Unit, it can be concluded that:
1. The average value of Richmond Agitation Sedation
Scale (RASS) was -0.88 and Ramsay Sedation Scale (RSS) was
3.55 after the administration of sedation.
2. Bisprectal Index Correlation when evaluating the depth
of sedation in patients at the Intensive Care Unit with the
Richmond Agitation Sedation Scale (RASS) showed a non-
significant weak negative correlation (r = -0.232, p> 0.05)
compared to the correlation of the Ramsay Sedation Scale (RSS)
using Bisprectal Index (r = 0.350, p< 0.05).
REFERENCES
[1] Barash G.Paul, Cullen.F.Bruce, et al. Clinical Anesthesia 8th ed. Critical Care Medicine Sedation and Analgesia for the Critically Ill Patient. Wolters Kluwer Health. 2017: P;4126-29
[2] Istanto T, Pujo J.L, Soesilowati D. Penggunaan Sedasi dan Pelumpuh Otot di Unit Rawat Intensif. 2010
[3] Sessler, et al. Evaluating and Monitoring Sedation Arousal and Agitation in the ICU, Thieme Medical. 2013
[4] De Jonghe B, et al. Using and Understanding Sedation Scoring System: A systematic Review. Intensive Care Medicine. 2000
[5] Jacobi J, Fraser GL, Coursin DB, et al. Clinical Practice guidelines for the sustained use of sedatives and analgesics in the critically ill adult. Crit Care Med. 2002; 30: 119-141.
[6] Hogarth DK, Hall J. Management of Sedation in Mechanically Ventilated Patients. Curr Opin Crit Care. 2004;10:40–6
[7] Kelley,Scott D, Monitoring Consciousness Using the Bispectral Index During Anesthesia, A Pocket Guide for Clinicians, 2nd ed, Covidien. 2010. P; 1-11.
[8] Zheng,et al. Correlation of bispectral index and Richmond agitation sedation scale for evaluating sedation depth: a retrospective study. J Thorac Dis. 2018;10(1):190-5.
AUTHORS
First Author – Riza Stya Yulianda, Post graduate of
Anaesthesiology and Intensive Therapy, Faculty of Medicine,
Universitas Sumatera Utara, Medan, Indonesia,
Second Author – Akhyar Hamonangan Nasution,
Anaesthesiology and Intensive Therapy, Faculty of Medicine,
Universitas Sumatera Utara, Medan, Indonesia,
Third Author – Fadli Armi Lubis, Anaesthesiology and
Intensive Therapy, Faculty of Medicine, Universitas Sumatera
Utara,Medan, Indonesia, [email protected]
Correspondence Author – Riza Stya Yulianda,
[email protected], +62 878-2111-6787
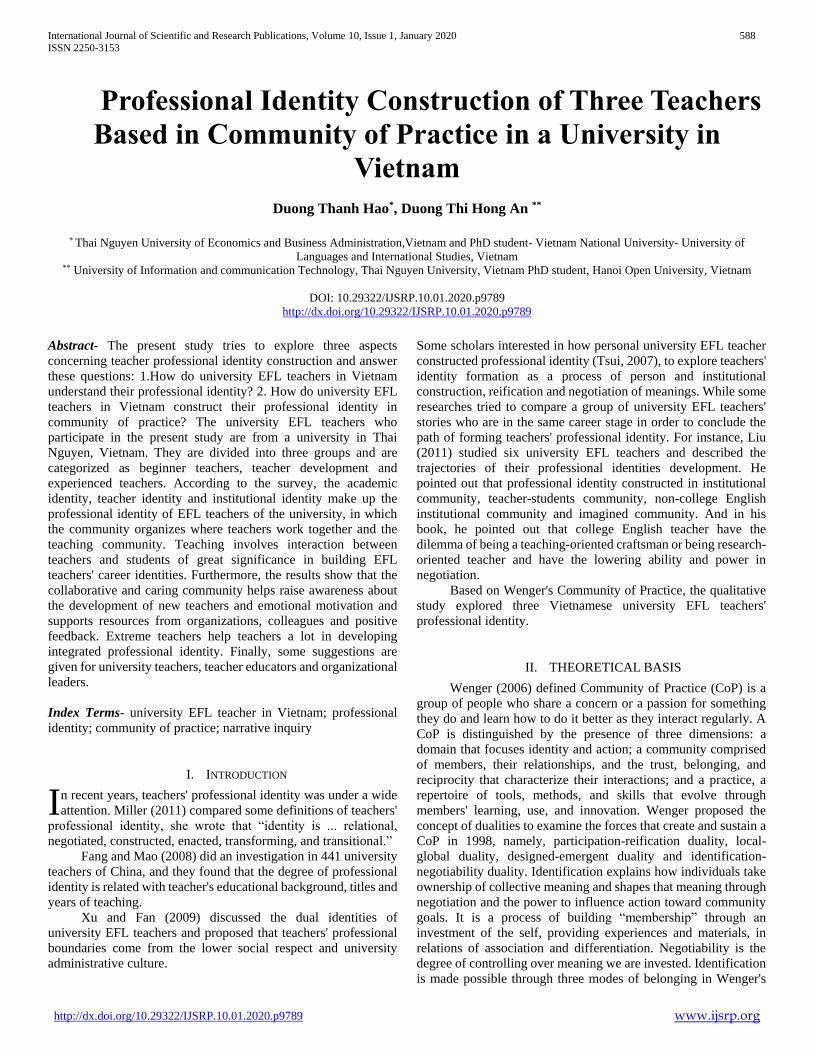
International Journal of Scientific and Research Publications, Volume 10, Issue 1, January 2020 588
ISSN 2250-3153
http://dx.doi.org/10.29322/IJSRP.10.01.2020.p9789 www.ijsrp.org
Professional Identity Construction of Three Teachers
Based in Community of Practice in a University in
Vietnam
Duong Thanh Hao*, Duong Thi Hong An **
* Thai Nguyen University of Economics and Business Administration,Vietnam and PhD student- Vietnam National University- University of
Languages and International Studies, Vietnam ** University of Information and communication Technology, Thai Nguyen University, Vietnam PhD student, Hanoi Open University, Vietnam
DOI: 10.29322/IJSRP.10.01.2020.p9789
http://dx.doi.org/10.29322/IJSRP.10.01.2020.p9789
Abstract- The present study tries to explore three aspects
concerning teacher professional identity construction and answer
these questions: 1.How do university EFL teachers in Vietnam
understand their professional identity? 2. How do university EFL
teachers in Vietnam construct their professional identity in
community of practice? The university EFL teachers who
participate in the present study are from a university in Thai
Nguyen, Vietnam. They are divided into three groups and are
categorized as beginner teachers, teacher development and
experienced teachers. According to the survey, the academic
identity, teacher identity and institutional identity make up the
professional identity of EFL teachers of the university, in which
the community organizes where teachers work together and the
teaching community. Teaching involves interaction between
teachers and students of great significance in building EFL
teachers' career identities. Furthermore, the results show that the
collaborative and caring community helps raise awareness about
the development of new teachers and emotional motivation and
supports resources from organizations, colleagues and positive
feedback. Extreme teachers help teachers a lot in developing
integrated professional identity. Finally, some suggestions are
given for university teachers, teacher educators and organizational
leaders.
Index Terms- university EFL teacher in Vietnam; professional
identity; community of practice; narrative inquiry
I. INTRODUCTION
n recent years, teachers' professional identity was under a wide
attention. Miller (2011) compared some definitions of teachers'
professional identity, she wrote that “identity is ... relational,
negotiated, constructed, enacted, transforming, and transitional.”
Fang and Mao (2008) did an investigation in 441 university
teachers of China, and they found that the degree of professional
identity is related with teacher's educational background, titles and
years of teaching.
Xu and Fan (2009) discussed the dual identities of
university EFL teachers and proposed that teachers' professional
boundaries come from the lower social respect and university
administrative culture.
Some scholars interested in how personal university EFL teacher
constructed professional identity (Tsui, 2007), to explore teachers'
identity formation as a process of person and institutional
construction, reification and negotiation of meanings. While some
researches tried to compare a group of university EFL teachers'
stories who are in the same career stage in order to conclude the
path of forming teachers' professional identity. For instance, Liu
(2011) studied six university EFL teachers and described the
trajectories of their professional identities development. He
pointed out that professional identity constructed in institutional
community, teacher-students community, non-college English
institutional community and imagined community. And in his
book, he pointed out that college English teacher have the
dilemma of being a teaching-oriented craftsman or being research-
oriented teacher and have the lowering ability and power in
negotiation.
Based on Wenger's Community of Practice, the qualitative
study explored three Vietnamese university EFL teachers'
professional identity.
II. THEORETICAL BASIS
Wenger (2006) defined Community of Practice (CoP) is a
group of people who share a concern or a passion for something
they do and learn how to do it better as they interact regularly. A
CoP is distinguished by the presence of three dimensions: a
domain that focuses identity and action; a community comprised
of members, their relationships, and the trust, belonging, and
reciprocity that characterize their interactions; and a practice, a
repertoire of tools, methods, and skills that evolve through
members' learning, use, and innovation. Wenger proposed the
concept of dualities to examine the forces that create and sustain a
CoP in 1998, namely, participation-reification duality, local-
global duality, designed-emergent duality and identification-
negotiability duality. Identification explains how individuals take
ownership of collective meaning and shapes that meaning through
negotiation and the power to influence action toward community
goals. It is a process of building “membership” through an
investment of the self, providing experiences and materials, in
relations of association and differentiation. Negotiability is the
degree of controlling over meaning we are invested. Identification
is made possible through three modes of belonging in Wenger's
I

International Journal of Scientific and Research Publications, Volume 10, Issue 1, January 2020 589
ISSN 2250-3153
http://dx.doi.org/10.29322/IJSRP.10.01.2020.p9789 www.ijsrp.org
Community of Practice: engagement, imagination and alignment.
But all three modes of belonging are not necessary in an
individual's identification in a community. Later, Wenger (1998:
154-155) proposed five types of trajectories of learning in
community of practice: peripheral trajectories, inbound
trajectories, insider trajectories, boundary trajectories, outbound
trajectories.
In this study, the author chose Wenger's theory for 3
reasons. First, Wenger's theory concerns about what happened on
the person and how the person connected self with other things
and other persons, it can explain their behavior, and shed light on
person's inner world. So with Wenger's theory, we can find out
how university EFL teachers identify themselves. Second, the
process of identification is dynamic and shifting, Wenger provided
a perfect and logical basis to explain how teachers make meaning
of their experience and themselves in the negotiation with
changing outside context. Moreover, the trajectories of learning
proposed by Wenger also can be used to describe the path of
university EFL teachers' professional development, so their path
of professional identity construction also will be clear.
III. RESEARCH METHIDOLOGY
3.1 Research questions
1. How do the three university EFL teachers in Vietnam
understand their professional identity?
2. How do the three university EFL teachers in Vietnam
construct their professional identity in community of practice?
■ 3.2 Research subjects
The institution under investigation is a university belonging
Thai Nguyen university.
The three female teachers as the research subjects all come
from there, they studied in this university as undergraduate
students of English major when they were young, and they chose
to be an EFL teacher in this university after graduation.
In this paper, Linh was in the fifth years of teaching, the
author labeled her as the novice teacher in this paper; Trang has
10 years working experience and she was marked as an
experiencing teacher; and Loan has over 20 years working
experience and she was recognized as an experienced teacher.
TABLE 1. BASIC INFORMATION OF THREE TEACHERS
Name Age Gender Title
Degree(wh
en
interviewed
)
Working
Years
Times of
interviews
Linh
30
Female Lecture Master of
English
major
5 years 1
Trang
35
Female Lecture Master of
English
major
10years 1
Loan Approximately
50
Female Lecture Master of
English
major
Above
20 years
1
3.3 Methods and instruments
Case study and narrative inquiry are the methods used in this
study. A case study is an intensive analysis of an individual unit
(e.g., a person, group, or event) stressing developmental factors in
relation to context (Flyvbjerg, 2011). The aim of the narrative is
“understanding and making meaning of experience, and
understand how people think and act in the situated contexts in
which they live through their stories Narrative is the best way to
think about experience”(Clandinin and Connelly, 2000:80). In the
researches of identity, case study and narrative inquiry are of great
significance.
The author used two basic ways to collect the data:
interview and observation. In consideration of different experience
the teachers have, the author chose semi-structured interview. The
author would like to explore the university EFL teacher's identity
by questions which mainly from the perspective of personal family
background, educational background, views on teacher-students
relationship, on the Assessment System and teacher training
programmes. Observation offers the author an opportunity to get
close to the interviewees and observe their behavior in natural
situation, and it can ensure the data's validity and authenticity.
3.4 Data collection and analysis

International Journal of Scientific and Research Publications, Volume 10, Issue 1, January 2020 590
ISSN 2250-3153
http://dx.doi.org/10.29322/IJSRP.10.01.2020.p9789 www.ijsrp.org
The author interviewed the three teachers respectively and
interviews were recorded by a telephone with recording function.
Then the author went into their classrooms for observation, and
the interviews to their students were finished in classroom. The
author chose method of Thematic Analysis to exam and analyze
the collected data. First, the author translates the interviews and
observation notes which were originally conducted in Vietnamese
into English. Then, the author find out some codes and incidents
which of significant to the three teachers. At last, the author
combined vertical and horizontal analysis in exploring the
construction of university EFL teachers' professional identity.
Vertical analysis helped in explaining one university EFL
teacher's professional identity based on her experience as a
student, as a teacher. While horizontal analysis focused on the
comparative analysis between three cases.
IV. NARRATIVE INQUIRY INTO THREE
VIETNAMESE UNIVERSITY EFL TEACHERS'
PROFESSIONALIDENTITY
■ 4.1 Story of Linh
■ 4.1.1 Linh's Biography
Linh has worked in this university for 5 years.
Comparatively, she was the youngest member of the community,
for the School has not recruit new university EFL teacher in recent
years. She was teaching English to non-English major students in
this semester, and she has taught English two.
Linh was an introvert person, but in her class, she “likes to
show her extrovert side to communicate with students openly and
unconstrainedly”. According to her students, Linh was
“hardworking”, “responsible” and “easygoing”. Linh described
herself as “passionate” and her not-explicit passion mainly
presented in the careful preparation of lessons, her gentleness for
the students and tireless of teaching rather than an energetic voice
in her class.
■ 4.1.2 Linh's Life as a University EFL Teacher
■ The Development of the Consciousness of a University
Teacher
Linh never thought about to be a teacher when she was an
undergraduate student. When she studied for her Master Degree in
another Normal University, she taught college English to the
freshmen and tutored some high school students. It was that time
some people said that she is suitable to be a teacher and the idea
of being a teacher planted in her mind. And the teaching
experience helped her build the confidence of being a teacher.
Linh experienced an adjustment stage when she began to
work in this university. She adapted to her teacher identity
gradually in teaching practice. When she was a student, she
thought that teachers are professional and formal. Although she
has some teaching practice when she was a student, she felt that
she was just “a worker” who works for others. When she became
a real teacher, she realized that university teacher is not as simple
and easy as she saw.
■ A Responsible Teacher
Linh was a tolerant “elder sister” for students at the
beginning, but gradually, she found that it is no enough to be a
“sister” for students. She think she is a friend of students, so she
always be tolerant, but some of her students told her that she
should be more strict to students, for her gentleness in classroom
cannot made all students follow her orders, then she realized that
keep authority is important.
Although preparing lessons took lots of time, Linh always
find some time on reading. The interviewer felt that Linh has a
strong awareness of academic research. She already published
several papers and led two academic research projects. For her, a
qualified university EFL teacher should have disciplinary
knowledge, management ability and competence of academic
research. Linh's understanding of qualified EFL teachers matches
the current requirement for university teachers and shows that she
absorbed the new thoughts in teachers training program.
■ 4.1.3 Summary
Linh was in a stable stage. She mentioned the family's
support was very important to her. Her husband who worked in
the same university can understand and support her. Linh has no
child but has the plan of baby, and she showed her worry about
future.
“I am not sure about the future, and the uncertainty of future
makes me worried. I am facing many pressures, from work, from
college, and even from family. Family pressure mainly comes
from my gender, especially in consider the new family member's
coming. Female teacher always shouldered more burden than
male. In a family, women need to take care of housework, children
as well as her own work.” (Linh, interview, 28 Oct. 2012)
Linh has advantages in age and strong awareness of
academic research. She became a university EFL teacher when
College English Teaching Reform has launched for some years,
she has been well trained and accepted the newest ideas of
Teaching Reform. So for her, she internalized the outside
requirements and prepared herself as a teacher as well as a
researcher. In finding her professional identify, she experience a
lot change in finding the “feeling of being a teacher” which reified
in her views on teacher-student relationship.
■ 4.2 Story of Trang:
■ 4.2.1 Trang's Biography
When Trang graduated from this university, she stayed and
taught College English to senior class of non-English major
students, 3 years later, she began to teach students of English
major courses like Comprehensive English, English Listening.
She has won the first title in teaching contest in university level
and her capacity of teaching has been recognized by her colleagues
and leaders. Her students described her as “good temper”,
“interesting”, and “thoughtful”. Trang gave her students lot of
autonomy, and she paid much attention on students' doing and
spared more time for students do the presentation on class.
When talked about the reason why Trang chose to be a
teacher, she said that “I want to be a teacher since I was in junior
high school. I was the English course leader at that time, I helped
my teacher to arrange the class, leaded my classmate to read text
we have learned, which made me feel a kind of honor. So I thought
it is good to be a teacher in the future.” And she became an English
teacher after graduated.
■ 4.2.2 Trang's Life as a University EFL Teacher
■ A “Beginner” and “Practioner”
Trang used “beginner” to describe herself, and stressed on
keeping study: “I am a beginner. There are so many challenges and
I feel the need of studying. It seems that everything just begin to
me. Although I learned something from what I have experienced,
I feel that there are more things need to learn.” Trang also
International Journal of Scientific and Research Publications, Volume 10, Issue 1, January 2020 591
ISSN 2250-3153
http://dx.doi.org/10.29322/IJSRP.10.01.2020.p9789 www.ijsrp.org
described herself as a “practioner” who knows some theories and
willing put theories into practice. It seemed that Trang accepted
the Teaching Reform and realized there are more challenge will
be confronted.
■ Self-identification in Teaching and Research Practice
Trang found her identity mainly in teaching and research
practice. Trang has her own idea of relationship between teacher
and students, she preferred to keep a few distance to protect her
privacy as well as approved of an equal and friendly relationship.
Trang explained that she is a person with a strong sense of being
teacher. She tried to be mature and be decent in front of students,
so she can have the authority. “I think more about how to help
students to learn, so I will use less time on talking current news or
jokes.”
When Trang entered into this institution, the School
involved in College English Teaching Reform, the Department of
College English developed College English as a distinctive course
which became one of National-level Quality Courses later. Trang
was a part of it, and she was the teacher of Oral English and Speech
course. Some methods such as “Task-based Teaching method,
Communicative Teaching method” presented and teachers were
asked to put these into practice to foster students' learning
autonomy, Trang accepted them naturally. She said that she has an
open mind and she has been trained and familiar with these new
teaching methods in her Teaching Methods class as a graduate
student, and she is familiar with computer, she like new things and
adapt them quickly.
Trang said that she has a passion of change. Such passion of
making change showed not only in her class teaching but also in
academic research. Yet this academic research interesting did not
appear at the beginning, she has been pushed by the Assessment
System to write academic papers, but later something unknown
enhanced her understanding of academic research. This
“something unknown” may be self-requirement of professional
developing. But for her heavily workload of teaching, Trang
shared 80% of time in teaching, while the rest 20% went to
academic research.
■ An Active Member in the Institution
Trang was an active member in the institution, which not
only presented in her willingness to be part of collective activities
such as sport meeting, new year party or teaching competition, but
also showed in her willingness to communicate with the senior
members. When Trang entered the SFL, she also benefit from the
Tutorial System, an elder teacher was assigned to help her get
familiar with textbook, the processes of teaching in the first year.
So she can get familiar with conditions quickly. Yet the tutor in
academic research failed her at the first time, she expressed herself
“has no idea on what to do” at that time, but she kept on asking
help from other senior and experienced teachers.
In this semester, Trang has some administrative works to do,
she was in charge of postgraduates who gave English classes to
non-English major students, and she needed to spare her time to
teach them. In the third interview which made in this winter
vacation, Trang could have the time of rest, but she still work as
an editor of English textbook, she said that although she want to
take a break, things on hand cannot make her stop.
■ 4.2.3 Summary
Trang felt happy to be a teacher for this job brings her “a
fulfilling life, contacting with cultured people and respect from the
whole society.” And she has a high level of job satisfaction.
According to Trang, reflection on herself in time made her see
herself clearly. Trang was a thinker rather than a follower. Being
a part of College English Teaching Reform and doing the
administrative work enhanced her sense of belonging, Trang
become accountable to the community of practice and could think
more about the outer context and environment. She has her own
thought on many things and she was in her way of becoming
important in the community.
■ 4.3 Story of Loan: An Energetic Leader
■ 4.3.1 Loan's Biography
Loan was busy but “fulfilling” in this semester. Her students
described her as “knowledgeable”, “vigorous”, “strict” and
“meticulous”. Her students said that Loan was energetic in
classroom, her infectious enthusiasm can affect the students. At
the same time, she was a disciplinarian who strict to students on
learning. Students also said that Loan is an easygoing person after
class.
Loan said that she was very simple at the beginning of her
career, what she want was to be a good and simply teacher who
imparting knowledge and never thought about making money,
also she described that she has not ambitions in career at that time.
The first class she taught was Listening, she has no feelings like
confusion or lost, she just accepted her identity as a teacher
smoothly.
■ 4.3.2 Loan's Life as a University EFL Teacher
■ A “Guider” for Students
Loan has a high reputation in students, she explained that
because she has her unique understanding of being a university
EFL teacher and she has her belief of teaching in classroom. In
Loan's mind, teacher should be a “guider” rather than other
figures. And she paid attention on educating students as “whole
person”, and stressed their emotional experience through
classroom.
“A teacher's role is helping students' learning. Teachers are
richer in knowledge and experience than students, then teacher
should be a guider. I don't think that we are friends. We do have
friendship, but teacher should give other things more than
friendship.
■ A Reflective Practioner
Loan said that “outlines” and the “records” helped her to
summarize her teaching practice in time. Through reflection, Loan
summarized some good experience and imperfect places need to
be improved in teaching.
“Having taught English for so many years, I refined some
experience. In the end of each semester, I always write down
something to summarize the lessons I learned from my students,
then I can improve myself in the next semester. So I will retain the
right thing I have done. When I open a course, I will put forward
of an outline, which including teaching aim, teaching content
learning outcome and my requirements. This outline will not
present to the college, I do it voluntarily and I am the one who read
it. In the first of class in a new semester, I will tell students my
way of teaching, the expectation to them, learning methods and
assessment methods. Usually the students in my class will think
that I'm tough in the first time, because I often say rule No. 1, rule
No. 2 and so on. But these rules work. These teaching experiences
are accumulated up slowly.” (Loan, interview, 26 Oct. 2018)
International Journal of Scientific and Research Publications, Volume 10, Issue 1, January 2020 592
ISSN 2250-3153
http://dx.doi.org/10.29322/IJSRP.10.01.2020.p9789 www.ijsrp.org
Now her enthusiasm for scientific research was rising. She
realized the both teaching and scientific researchers are important
and scientific research can facilitate teaching. In the past six
months, Loan already finished six articles. She stresses on
combination of teaching and scientific researches for many times.
■ A Leader in the Community
In the interview, Loan pointed out a fact that young teachers
do not want to go out for a long-term study when in consideration
of the family, especially the female teachers, who have to take
efforts to balance their family and career. She said that “so did I
when my son was little”, for her husband worked far from home
and she has to spare more time on taking care of her son. But now
the situation is much better, her son grown up to a self-sufficient
age in her teens, with the supportive husband, she can focus on her
work and studying. As the leader of her teaching and research
section and the main instructor of National Teacher Training
Programmes, Loan showed her confidence in these activities. She
has no worries about heavy work might impact on her family and
she enjoyed in this busy but fulfilling life.
■ 4.3.4 Summary
Loan's case illustrated her identity shifting experience as a
middle-aged female teacher, she was more family-focus,
subsequently crossed the boundary and got a more meaningful life
which required by the institution. Now she found herself as a
liberal person. Where there is reform, there will be changes and
conflicts in thoughts. Loan was one followed the wave of reform,
and she learn the newest things continuously, and now she was an
active participator who plays the leading role in the reform.
V. RESULTS AND DISCUSSION
■ 5.1 Result of Research Question 1: How do the three
university EFL teachers in Viet Nam understand their professional
identity?
Teachers' professional identity never be a single conception,
according to the narrative stories of the three teachers, their
integrated professional identity can be generally demonstrated 3
interactive aspects: academic identity, teacher identity and
institutional identity, and the 3 aspects are intertwined in the
teachers work and life. Their understanding of professional
identity reified in their thoughts and translated into teaching and
working practice. The interviewer felt that they were stressed on
their teacher identity, then their academic identity, while their
institutional identity rather implicit in their narrative. They all
mentioned the most important work as a teacher should be
imparting knowledge and educating students.
a) Academic Identity
Taylor (1999) believed that the “academic identity”
including three levels: the workplace, the discipline and the
universal notion of what it means to be an academic. Here the
academic identity in the thesis is related with discipline and
academic research. University EFL teachers' academic identity
comes with discipline specific and disciplinary academic research,
and they are professional for their scholarship. The specializing of
disciplines distinguishes them from other discipline, and their
academic work constructs their recognized image in academic
fields. The academic identity corresponds to the formulation of
research- oriented teacher.
All three teachers showed the willing to be a research- oriented
teacher. Linh has the awareness of academic research as the
youngest teacher. Trang called herself “a participator” in academic
research. Loan stressed her academic identity through doing
researches actively.
b) Teacher Identity
University EFL teachers' teacher identity was produced in
the interaction with students in English classes. Teacher identity
generated with teachers' understanding of this occupation and their
responsibility. The approvals from students in teaching
community enhance the awareness of this identity, and those
approvals reified as students' willing contact with teachers, their
greeting, text message as festival bless. And it mainly reified in
teacher's view on teacher-students relationship and their teaching
beliefs.
Linh has been a “tolerant elder sister”, and later she tried to
keep authority in front of students and be a “responsible” teacher.
Trang described herself as “a friend who keeps distance from
students”. Loan defined herself as a “guider” to her students.
c) Institutional Identity
University EFL teachers belong to a teaching institutional
community where they worked together, they involved in some
institutional activities, and they served the institution as common
members, office directors, programme leaders and so on.
Institutional identity related to the work place and it is the
membership in the teaching institution.
Linh was not an active member and she felt that she is in the
outside of the institutional community, without much right of
speaking. Trang was an active member of the institution and did
some administrative work, which was both challenge and
opportunity, and it was reified the recognition of her capabilities.
Loan was a leader in the institutional community.
■ 5.2 Result of Research Question 2: How do university
EFL teachers construct their professional identity in community
of practice?
Here we discussed their professional identity, so some
meaningful communities they were or are in should be mentioned:
institutional community, teaching community, other learning
community (refers to the community formed in teacher training
programs, part-time jobs, oversea visit study and so on other
learning\teaching practice unconnected with the institution).
Temporary other learning\teaching community may help a lot in
getting the newest pedagogic knowledge and improving teaching
ability, but institutional community and teaching community
played the most important roles in the process of teachers'
professional identification.
Teaching community which involves the teacher and the
students plays an important role in the construction of teacher
identity and academic identity. Students' feedback affect teachers'
sense of achievement and sense of being a teacher, for example.
Linh confirmed herself as a teacher in students' supportive words
and benign teacher-students relationship. At the same time,
university EFL teachers teaching beliefs and philosophy were
putted into practice in the classroom, for teachers who combined
the teaching and academic research, their research results reified
in their teaching practice. University EFL teachers' professional

International Journal of Scientific and Research Publications, Volume 10, Issue 1, January 2020 593
ISSN 2250-3153
http://dx.doi.org/10.29322/IJSRP.10.01.2020.p9789 www.ijsrp.org
identity grows in the interaction between teacher and the students
and substantiates in classroom.
Based on three teachers' stories, the author summarized
three important factors that influence the construction of teachers'
identification in the institutional community. Emotional
motivation involves in the development of teachers' sense of
belonging which is the basic and important emotional motivation
to develop a university EFL teachers' professional identity
especially for a new member. Group activities strengthen the
members' sense of cohesion and pride. Another motivation is the
Assessment and Award Mechanism, which is tied to the
Professional Titles Assessment System and Employment System
for university teachers; it is motivation as well as pressure.
Resources support includes political, financial, material and
chances support in the construction of teachers' professional
identity. All three teachers confirmed the situation that many
favorable policies in the institution aim to accelerate the
development of teachers. Beside the multimedia in English class,
the well-equipped office in new teaching building.
Colleagues' and institution leaders' positive feedback is also
an important factor in the identification, especially for younger
teachers. For instance, the institution hold regular demonstration
lessons and ask younger teachers involved in to improve their
teaching ability they all benefit a lot from that suggestions of
future improvement and grown up through those communication
of instructional experience.
VI. CONCLUSION
Teacher education involves both personal and professional,
the point of teacher training programs is not only a matter of
improving teachers' teaching skills, research methods or knowing
newest pedagogic information, but also a matter embracing
humanity, including cultivate their awareness of professional
development, enhance their sense of responsibility, repel the job
burnout and so on. From the three cases, we can see that university
EFL teachers have different concerns in different stages. For
example, younger teachers always face the problems such as
lacking belongings and confidence. So the training programs,
workshop, seminar should come into play in solving those
problems that teachers are facing with or will confront.
The study also shed light on teachers' professional
development. First, teachers' professional development should be
self-initiated. Second, reflect the context as well as oneself in time
can help a teacher do better in professional development.
Reflection is a process of teachers' recalling, thinking and
evaluating their past teaching experience, which give meaning to
the decision they made, the thing they done, and it is also a process
of identification. People are socially connected beings, how we see
ourselves affected by the shared meanings and rules of the
community, and we negotiated in the interaction with others and
changing outside world. Understanding the context can help us
explain our behavior and make a right decision, and is as vital to
become a good teacher as understanding ourselves in reflection.
REFERENCES
[1] D. J. Clandinin, and F. M. Connelly, Narrative inquiry: Experience and story in qualitative research. San Francisco, CA: Jossey-Bass, 2000.
[2] P. Denicolo, and M. Komf, Connecting policy and practice: Challenges for teaching and learning in schools and universities. New York: Routledge, 2005.
[3] M. J. Fang, and J. P Mao, “A research on university teachers' professional identity,” Journal of High Education, Vol. 29, No.7, pp. 56¬61, 2008.
[4] B. Flyvbjerg, “Case study,” in The sage handbook of qualitative research, 4th Edition, K. D. Norman and S. L. Yvonna, Eds. CA: Sage, 2011, pp. 301-316.
[5] Z.P. Li. (2009). On the ethical thinking of teachers' identity [Online]. Avaliable: www.s-paper.com/52552/index.html
[6] Y. Liu, Professional Identity Construction of College English Teachers A Narrative Perspective. Beijing: Foreign Language Teaching and Research Press, 2011.
[7] J. Miller, “Teacher identity,” in The Cambridge guide to second language teacher education, A. Burns, and J. C. Richards, Eds. London: Cambridge University Press, 2009, pp.172-177.
[8] P. Taylor, Making sense of academic life. Buckingham: The Society for Research into Higher Education and Open University Press, 1999.
[9] A. B. M. Tsui, “The complexities of identity formation: A narrative inquiry of an EFL teacher,” TESOL Quarterly, Vol.41, No.4, pp.657-680, 2007.
[10] E. Wenger, Communities of practice: Learning, meaning, and identity. Cambridge: Cambridge University Press, 1998.
[11] E. Wenger, (2006). Communities of practice - A brief introduction [Online]. Available: http://www.ewenger.com/theory/
[12] L. Xu, and P.J. Fan, “Examining university teachers' identification and the renascence of university's culture,” Journal of National Academy of Education Adminstration, No. 10, pp 53-58, 2009.
AUTHORS
First Author – Duong Thanh Hao, Thai Nguyen University of
Economics and Business Administration,Vietnam and PhD
student- Vietnam National University- University of Languages
and International Studies, Vietnam
Second Author – Duong Thi Hong An, University of
Information and communication Technology, Thai Nguyen
University, Vietnam PhD student, Hanoi Open University,
Vietnam

International Journal of Scientific and Research Publications, Volume 10, Issue 1, January 2020 594
ISSN 2250-3153
http://dx.doi.org/10.29322/IJSRP.10.01.2020.p9790 www.ijsrp.org
Profile of Implanon Acceptors at The Rivers State
University Teaching Hospital, Southern Nigeria: Ten
Years Review 1Nonye-Enyidah EI, 1 Akpo CS.
1 Department of Obstetrics and Gynaecology, Rivers State University Teaching Hospital (RSUTH), Port Harcourt.
DOI: 10.29322/IJSRP.10.01.2020.p9790
http://dx.doi.org/10.29322/IJSRP.10.01.2020.p9790
Abstract- Background: Implanon, a single rod long acting
reversible implant contraceptive containing 68mg of etonogestrel,
has been described as highly effective and is of similar
effectiveness to sterilization.
Objective: To determine the profile of implanon acceptors at the
RSUTH, a South South tertiary hospital.
Method: The case records of all the clients who accepted implanon
at RSUTH between 1st January, 2008 and 31st December, 2017
were retrieved, studied and the information analysed using
statistical package for social sciences (SPSS) IBM version 25.0
(Armonk, NY).
Results: Out of 1893 contraceptive acceptors during the study
period, 308 (16.3%) accepted implanon. Majority of the clients
124 (40.3%) were between the age range of 30-34, married 293
(95.1%), multiparous 228 (74.0%), Christians 296 (96.1%) and
302 (98.1%) had formal education. The acceptors with secondary
level of education were highest, 209 (67.9%). Clinical personnel
were the commonest source of information 231(75%).
Conclusion: Implanon was used mostly by young, married and
educated multiparous women. Education and increased patient
awareness will increase its desirability and uptake.
Index Terms- Implanon, contraceptives, acceptors, Rivers State
University Teaching Hospital.
I. INTRODUCTION
he possibility of the sub-dermal contraceptive implant began
when silicone in the 1940s was found to be bio-compatible
with the body. Long acting reversible contraception has gained
wider acceptance for decades due to overwhelming conveniences
to the users and higher probability of future fertility upon
discontinuation1,2. Implanon which is a single rod sub-dermal
implants was developed by Organon and contains 68mg of
etonogetrel (3-ketodesogestrol) which provides contraception for
3 years. It is silicone free and releases about 60-70 micrograms of
etonogestrel initially reducing to 25-30 micrograms at the end of
third year. Some data have shown its effectiveness for 5 years 1,2.
Implanon is a safe, very effective, convenient and reversible long
term contraceptive with a one year failure rate of 0.05% 2-4.
Implanon acts by inhibiting ovulation, thickening the
cervical mucus and altering the lining of the endometrium.
Hormonal protection starts within 24 hours of insertion and return
of fertility is almost immediately after removal. It is made up of
40mm by 2mm semi rigid single rod inserted subdermally in the
medial aspect of the middle third of the non-dominant upper arm
by a trained provider 5,6. It is inserted within 5 days of a menstrual
cycle. It is safe for lactating mothers, adolescents, diabetics and
hypertensives 4. It reduces the risk of ectopic pregnancy, pelvic
inflammatory disease and improves dysmenorrhoea. Implanon has
also been documented to reduce frequency and severity of sickle
cell crisis making it suitable for use by patients with sickle cell
anaemia by stabilizing cell membrane, reducing the clogging rate
and improving the red cell transit time1,2,6.
The two commonly used and available contraceptive
implants currently available in the family planning clinic of this
hospital are Jadelle and Implanon. There has never been any study
on contraceptive implants in the centre. This study was designed
to determine the profile of the acceptors of implanon, the
acceptance rate and sources of contraceptive information over a
period of 10 years.
II. MATERIALS AND METHODS
This retrospective study was carried out at the family
planning clinic of the Rivers State University Teaching Hospital
(RSUTH), a newly established teaching hospital in Port Harcourt,
the capital of Rivers State in South-South geopolitical zone of
Nigeria. The clinic gets its clients from within and outside the
hospital. It has its own records section different from the hospital
records and this makes it easy to retrieve the clients’ case notes.
The clinic is headed by a consultant Gynaecologist, with the
support of trained family planning nurses and resident doctors.
At presentation, the clients were warmly welcomed by
trained family planning nurses and physicians who also counseled
them. The clients were allowed to make informed choice based on
their needs and available contraceptives suitable for them.
Thereafter medical history and clinical examination were done.
Urine analysis and pregnancy test were also done for the clients
and informed consent obtained.
Insertion and removal of implanon were carried out in strict
compliance with the manufacturer’s protocol. In the absence of
complications, post insertion follow up visits were at 4 weeks, 3
months, 6 months and thereafter annually. They were counseled to
report to the clinic if any complications occur and also to
discontinue the method if the side effects were unbearable. At each
T
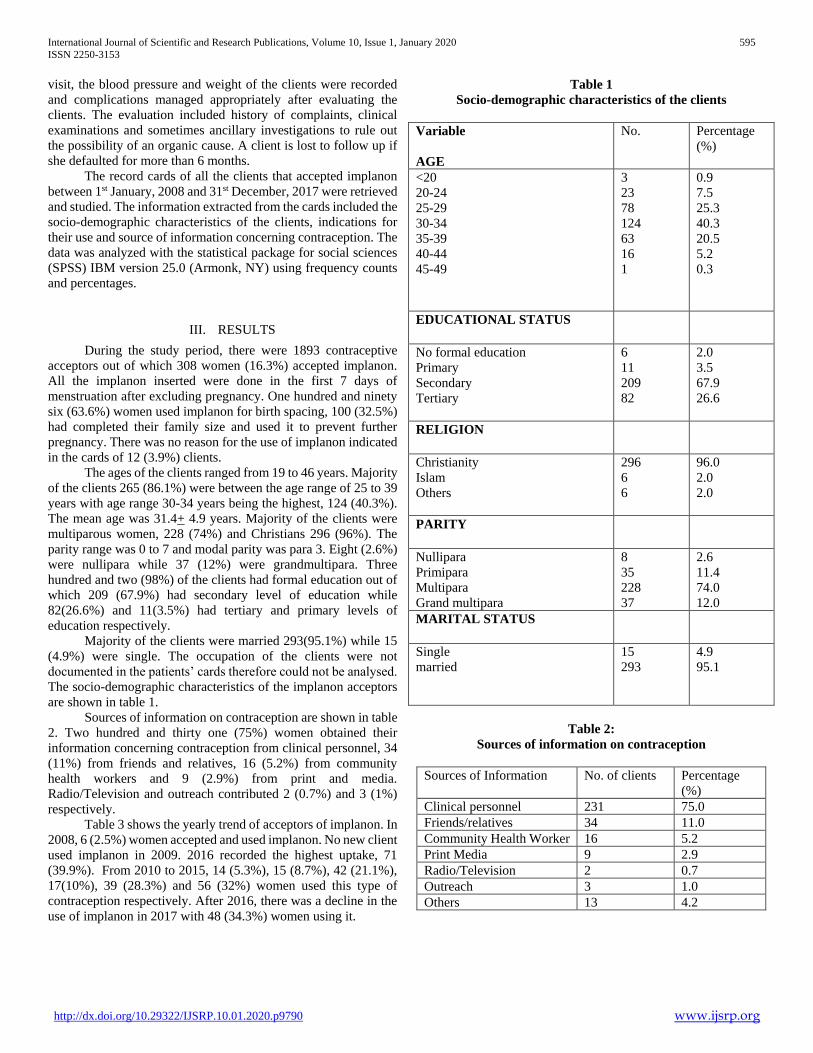
International Journal of Scientific and Research Publications, Volume 10, Issue 1, January 2020 595
ISSN 2250-3153
http://dx.doi.org/10.29322/IJSRP.10.01.2020.p9790 www.ijsrp.org
visit, the blood pressure and weight of the clients were recorded
and complications managed appropriately after evaluating the
clients. The evaluation included history of complaints, clinical
examinations and sometimes ancillary investigations to rule out
the possibility of an organic cause. A client is lost to follow up if
she defaulted for more than 6 months.
The record cards of all the clients that accepted implanon
between 1st January, 2008 and 31st December, 2017 were retrieved
and studied. The information extracted from the cards included the
socio-demographic characteristics of the clients, indications for
their use and source of information concerning contraception. The
data was analyzed with the statistical package for social sciences
(SPSS) IBM version 25.0 (Armonk, NY) using frequency counts
and percentages.
III. RESULTS
During the study period, there were 1893 contraceptive
acceptors out of which 308 women (16.3%) accepted implanon.
All the implanon inserted were done in the first 7 days of
menstruation after excluding pregnancy. One hundred and ninety
six (63.6%) women used implanon for birth spacing, 100 (32.5%)
had completed their family size and used it to prevent further
pregnancy. There was no reason for the use of implanon indicated
in the cards of 12 (3.9%) clients.
The ages of the clients ranged from 19 to 46 years. Majority
of the clients 265 (86.1%) were between the age range of 25 to 39
years with age range 30-34 years being the highest, 124 (40.3%).
The mean age was 31.4+ 4.9 years. Majority of the clients were
multiparous women, 228 (74%) and Christians 296 (96%). The
parity range was 0 to 7 and modal parity was para 3. Eight (2.6%)
were nullipara while 37 (12%) were grandmultipara. Three
hundred and two (98%) of the clients had formal education out of
which 209 (67.9%) had secondary level of education while
82(26.6%) and 11(3.5%) had tertiary and primary levels of
education respectively.
Majority of the clients were married 293(95.1%) while 15
(4.9%) were single. The occupation of the clients were not
documented in the patients’ cards therefore could not be analysed.
The socio-demographic characteristics of the implanon acceptors
are shown in table 1.
Sources of information on contraception are shown in table
2. Two hundred and thirty one (75%) women obtained their
information concerning contraception from clinical personnel, 34
(11%) from friends and relatives, 16 (5.2%) from community
health workers and 9 (2.9%) from print and media.
Radio/Television and outreach contributed 2 (0.7%) and 3 (1%)
respectively.
Table 3 shows the yearly trend of acceptors of implanon. In
2008, 6 (2.5%) women accepted and used implanon. No new client
used implanon in 2009. 2016 recorded the highest uptake, 71
(39.9%). From 2010 to 2015, 14 (5.3%), 15 (8.7%), 42 (21.1%),
17(10%), 39 (28.3%) and 56 (32%) women used this type of
contraception respectively. After 2016, there was a decline in the
use of implanon in 2017 with 48 (34.3%) women using it.
Table 1
Socio-demographic characteristics of the clients
Variable
AGE
No. Percentage
(%)
<20
20-24
25-29
30-34
35-39
40-44
45-49
3
23
78
124
63
16
1
0.9
7.5
25.3
40.3
20.5
5.2
0.3
EDUCATIONAL STATUS
No formal education
Primary
Secondary
Tertiary
6
11
209
82
2.0
3.5
67.9
26.6
RELIGION
Christianity
Islam
Others
296
6
6
96.0
2.0
2.0
PARITY
Nullipara
Primipara
Multipara
Grand multipara
8
35
228
37
2.6
11.4
74.0
12.0
MARITAL STATUS
Single
married
15
293
4.9
95.1
Table 2:
Sources of information on contraception
Sources of Information No. of clients Percentage
(%)
Clinical personnel 231 75.0
Friends/relatives 34 11.0
Community Health Worker 16 5.2
Print Media 9 2.9
Radio/Television 2 0.7
Outreach 3 1.0
Others 13 4.2
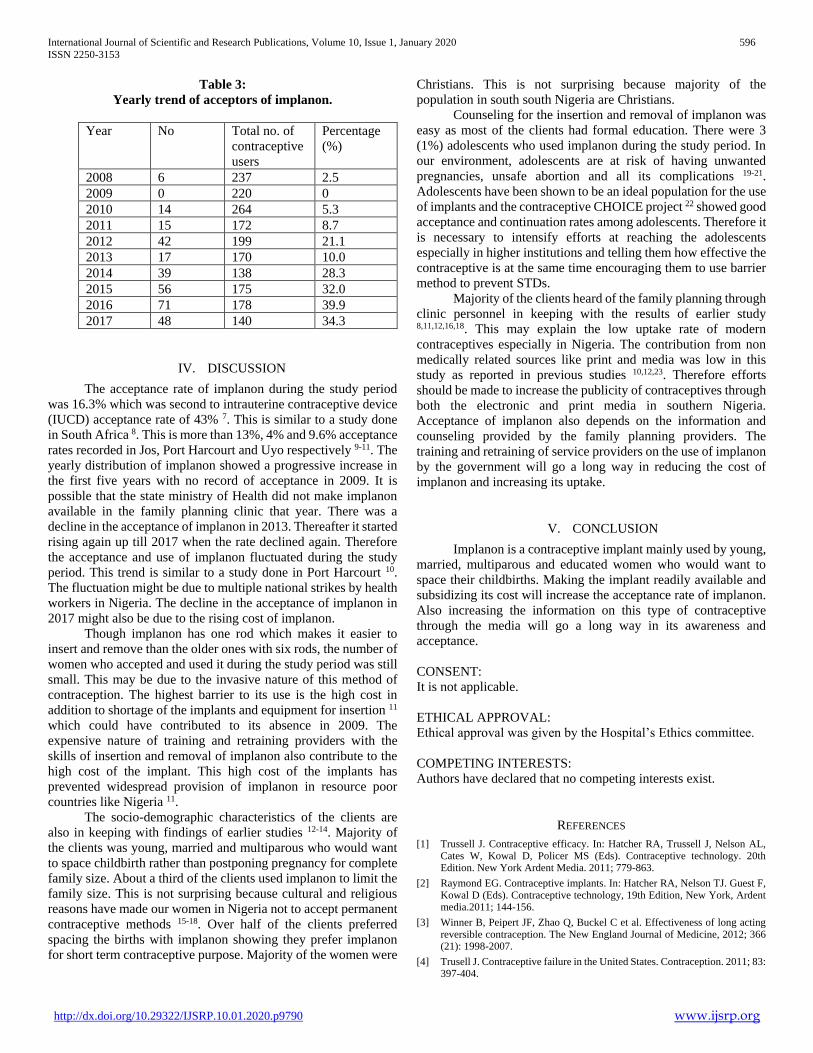
International Journal of Scientific and Research Publications, Volume 10, Issue 1, January 2020 596
ISSN 2250-3153
http://dx.doi.org/10.29322/IJSRP.10.01.2020.p9790 www.ijsrp.org
Table 3:
Yearly trend of acceptors of implanon.
Year No Total no. of
contraceptive
users
Percentage
(%)
2008 6 237 2.5
2009 0 220 0
2010 14 264 5.3
2011 15 172 8.7
2012 42 199 21.1
2013 17 170 10.0
2014 39 138 28.3
2015 56 175 32.0
2016 71 178 39.9
2017 48 140 34.3
IV. DISCUSSION
The acceptance rate of implanon during the study period
was 16.3% which was second to intrauterine contraceptive device
(IUCD) acceptance rate of 43% 7. This is similar to a study done
in South Africa 8. This is more than 13%, 4% and 9.6% acceptance
rates recorded in Jos, Port Harcourt and Uyo respectively 9-11. The
yearly distribution of implanon showed a progressive increase in
the first five years with no record of acceptance in 2009. It is
possible that the state ministry of Health did not make implanon
available in the family planning clinic that year. There was a
decline in the acceptance of implanon in 2013. Thereafter it started
rising again up till 2017 when the rate declined again. Therefore
the acceptance and use of implanon fluctuated during the study
period. This trend is similar to a study done in Port Harcourt 10.
The fluctuation might be due to multiple national strikes by health
workers in Nigeria. The decline in the acceptance of implanon in
2017 might also be due to the rising cost of implanon.
Though implanon has one rod which makes it easier to
insert and remove than the older ones with six rods, the number of
women who accepted and used it during the study period was still
small. This may be due to the invasive nature of this method of
contraception. The highest barrier to its use is the high cost in
addition to shortage of the implants and equipment for insertion 11
which could have contributed to its absence in 2009. The
expensive nature of training and retraining providers with the
skills of insertion and removal of implanon also contribute to the
high cost of the implant. This high cost of the implants has
prevented widespread provision of implanon in resource poor
countries like Nigeria 11.
The socio-demographic characteristics of the clients are
also in keeping with findings of earlier studies 12-14. Majority of
the clients was young, married and multiparous who would want
to space childbirth rather than postponing pregnancy for complete
family size. About a third of the clients used implanon to limit the
family size. This is not surprising because cultural and religious
reasons have made our women in Nigeria not to accept permanent
contraceptive methods 15-18. Over half of the clients preferred
spacing the births with implanon showing they prefer implanon
for short term contraceptive purpose. Majority of the women were
Christians. This is not surprising because majority of the
population in south south Nigeria are Christians.
Counseling for the insertion and removal of implanon was
easy as most of the clients had formal education. There were 3
(1%) adolescents who used implanon during the study period. In
our environment, adolescents are at risk of having unwanted
pregnancies, unsafe abortion and all its complications 19-21.
Adolescents have been shown to be an ideal population for the use
of implants and the contraceptive CHOICE project 22 showed good
acceptance and continuation rates among adolescents. Therefore it
is necessary to intensify efforts at reaching the adolescents
especially in higher institutions and telling them how effective the
contraceptive is at the same time encouraging them to use barrier
method to prevent STDs.
Majority of the clients heard of the family planning through
clinic personnel in keeping with the results of earlier study 8,11,12,16,18. This may explain the low uptake rate of modern
contraceptives especially in Nigeria. The contribution from non
medically related sources like print and media was low in this
study as reported in previous studies 10,12,23. Therefore efforts
should be made to increase the publicity of contraceptives through
both the electronic and print media in southern Nigeria.
Acceptance of implanon also depends on the information and
counseling provided by the family planning providers. The
training and retraining of service providers on the use of implanon
by the government will go a long way in reducing the cost of
implanon and increasing its uptake.
V. CONCLUSION
Implanon is a contraceptive implant mainly used by young,
married, multiparous and educated women who would want to
space their childbirths. Making the implant readily available and
subsidizing its cost will increase the acceptance rate of implanon.
Also increasing the information on this type of contraceptive
through the media will go a long way in its awareness and
acceptance.
CONSENT:
It is not applicable.
ETHICAL APPROVAL:
Ethical approval was given by the Hospital’s Ethics committee.
COMPETING INTERESTS:
Authors have declared that no competing interests exist.
REFERENCES
[1] Trussell J. Contraceptive efficacy. In: Hatcher RA, Trussell J, Nelson AL, Cates W, Kowal D, Policer MS (Eds). Contraceptive technology. 20th Edition. New York Ardent Media. 2011; 779-863.
[2] Raymond EG. Contraceptive implants. In: Hatcher RA, Nelson TJ. Guest F, Kowal D (Eds). Contraceptive technology, 19th Edition, New York, Ardent media.2011; 144-156.
[3] Winner B, Peipert JF, Zhao Q, Buckel C et al. Effectiveness of long acting reversible contraception. The New England Journal of Medicine, 2012; 366 (21): 1998-2007.
[4] Trusell J. Contraceptive failure in the United States. Contraception. 2011; 83: 397-404.

International Journal of Scientific and Research Publications, Volume 10, Issue 1, January 2020 597
ISSN 2250-3153
http://dx.doi.org/10.29322/IJSRP.10.01.2020.p9790 www.ijsrp.org
[5] Bhatia P, Nangia S, Aggarwal S, Tewari C. Implanon: subdermal single rod contraceptive implants. Indian Journal of Obstetrics and Gynaecology, 2001; 61 (4): 422-425.
[6] Pillay D, Cherisch MF, Morroni C et al. User perspective on implanon NXT in South Africa: A survey of 12 public sector facilities. South African Medical Journal, 2017; 107 (10): 815-821.
[7] Nonye-Enyidah EI, Wekere FCC, Donubari R. Oral contraceptive Pills: socio-demographic characteristics of acceptors at the Rivers State University Teaching Hospital, Nigeria. Journal of Advances in Medicine and Medical Research, 2019; 31 (4): 1-6.
[8] Anudha M, Ozayr M. Prevalence and predictors of implanon uptake in Ugu (Ugu North sub-district) 2016/17. South African Family Practice, 2019; 61(2): 48-52.
[9] Mutihir JT, Nyango DD. One year experience with implanon sub dermal implants in Jos, Nigeria. Nigerian Journal of Clinical Practice. 2010; 13(1): 28-31.
[10] Ojule JD, Oranu EO, Enyindah CE. Experience with implanon in Southern Nigeria. Journal of Medicine and Medical Sciences. 2012; 3 (11): 710-714.
[11] Aniekan MA, Ntiense MU, Emmanuel CI. Subdermal contraceptive implants: Profile of acceptors in a tertiary hospital in southern Nigeria. International Journal of Gynaecology, Obstetrics and Neonatal care, 2014; 1 (1): 9-13.
[12] Ojule JD, MacPepple DA. Family planning practice in a tertiary health institution in southern Nigeria. West African Journal of Medicine, 2011; 30 (3): 178-181.
[13] Adebola OR, Imran OM, Michael AO, Adeyeni OA. Profile of implanon acceptors and pattern of side effects. Journal of Reproduction and Contraception. 2015; 26 (1): 46-52.
[14] Madugu NH, Abdul MA, Bawa U et al. Update of hormonal implants contraceptive in Zaria, Northern Nigeria. Obstet. Gynaecol. 2015; 5: 268-273.
[15] Asuquo EF, John ME. Knwledge, attitude, acceptability and practice of permanent methods of contraception. African Journal of Public Health, 2016; 1: 36-42.
[16] Balogun OR, Olaomo N, Adeniran AS, Fawole AA. Implanon subdermal implant: an emerging method of contraception in Ilorin, Nigeria. AJOL. 2014; 3: 1-5
[17] Utoo BT, Mutihir TJ, Utoo PM. Knowledge, attitude and practice of family planning methods among women attending antenatal clinic in Jos, North-Central Nigeria. Nigerian Journal of Medicine 2010; 19 (2): 214-218.
[18] Irinyenikan TA. Perception of women about implanon as a contraceptive method in Akure, Western Nigeria. British Medical Journal, 2016; 12: 1-6.
[19] Guazzelli CA, deQueiroz FT, Barbieri M et al. Etonogestrel implant in adolescents. Evaluation of clinical aspects. Contraception, 2011; 83 (4): 336-339.
[20] Gosari A, Ma Y, Wong H et al. Knowledge and factors determining choice of contraception among Singaporean women. Singapore Medical Journal, 2016; 57: 610-615.
[21] Mastor A, Khaing SL, Oman SZ. User’s perspective on implanon in Maylasia: a multicultural perspective. Asian country. Open access Journal on Contraception. 2011; 2: 79-84.
[22] Mestard R, Secura G, Allsworth JE, Madden T, Zhao Q, Pelpert JF. Acceptance of long acting reversible contraceptive methods by adolescent participants in the contraceptive CHOICE project. Contraception, 2011; 85 (5): 493-498.
[23] Mubarik M, Jameel N, Khalil R. Knowledge, attitude and utilization of sub-dermal birth control implants among married rural women of Pakistan. Int. J Res Med. Sc. 2016; 4: 2229-39.
AUTHORS
First Author – Nonye-Enyidah EI, Department of Obstetrics and
Gynaecology, Rivers State University Teaching Hospital
(RSUTH), Port Harcourt.
Second Author – Akpo CS., Department of Obstetrics and
Gynaecology, Rivers State University Teaching Hospital
(RSUTH), Port Harcourt.
Correspondence: Dr Nonye-Enyidah EI., E mail:
[email protected], +2348033410619
International Journal of Scientific and Research Publications, Volume 10, Issue 1, January 2020 598
ISSN 2250-3153
http://dx.doi.org/10.29322/IJSRP.10.01.2020.p9791 www.ijsrp.org
The Effect of FlexiTime on Employee Performance in
Financial Institutions in Kericho Town
Joseph Mwendwa Musinga1, Dr. Hellen W. Sang2, Dr. Andrew Kipkosgei3
1(MBA, School of Business and Economics, University of Kabianga, Kenya)
2(Lecturer, School of Business and Economics, University of Kabianga) 3(Lecturer, School of Education, University of Kabianga)
DOI: 10.29322/IJSRP.10.01.2020.p9791
http://dx.doi.org/10.29322/IJSRP.10.01.2020.p9791
Abstract- Job design is a process that entails putting together
specific duties and responsibilities to create a variety of tasks that
define the duties and responsibilities for individuals to carry out in
their day to day work. Job design is very crucial for individual
satisfaction and employee performance. It also ensures that a job
is done efficiently, economically, reliably and safely. Therefore,
the main purpose of this study was to find out the effect of
flexitime on employee performance in financial institutions in
Kericho town, Kenya. With the financial institutions struggling
with challenges such as increased operating costs and downsizing,
they have adopted some job design strategies whose effect on
employee performance has not been established. The study
adopted a descriptive survey research design and to achieve the
study objective further, inferential statistics was utilized using the
Pearson correlation to establish the relationship between the
employee performance against flexitime. Mixed-methods
approach was used by doing a census on the target population of
29 financial institutions and stratified the financial institutions into
categories. Convenience sampling was done one each from
Human Resources, Sectional Heads, Cashiers and Operations
Manager per institution per strata where a sample size of 116
respondents was obtained. Questionnaires were used and a
response rate of 73.3% was realized. Validity was ensured through
subject matter experts whereas a reliability coefficient of 0.801
was established through Cronbach’s alpha coefficient. The study
findings indicated that flexitime had a strong positive association
with employee performance of the financial institutions within
Kericho County since it had a coefficient of 0.657 (r=0.657,
p=0.000). Therefore, the study concludes that flexitime
significantly affected employee performance in financial
institutions in Kericho town. The study highly recommends the
improvement of the use of flexitime work arrangement in the
financial institutions. The study forms a useful reference material
that will be used by institutions to develop more effective job
design strategies that shall enhance employee performance and
satisfaction and inculcate the useful attributes of technology use.
It will further broaden the scope of performance appraisal and help
regulatory institutions and agencies in policy development and
formulation.
Index Terms- Flexitime, Financial institutions, Employee
performance, Job design
I. INTRODUCTION
ob design is a process that entails putting together specific
duties and responsibilities of an individual to create a variety of
tasks to create a composite that will guide employees in attaining
their performance targets (Truss et al., 2014). Organizational
theorists strived to enhance on efficiency and effectiveness of
organizations by establishing a certain set of principles during the
early part of this century. According to Brown and Hervey (2011),
the key driving force of an organization is the desire for increased
efficiency as the ultimate criteria in which organizations utilize for
the management to attain rational administrative practices and
procedures. They further noted that several classical theorists
developed sets of principles that were thought to maximize the
efficiency of organizations including the banking sector which is
becoming highly competitive. The principles emphasize the
importance of having clear and unequivocal hierarchies of
authority, centralized systems of decision making, stressed on the
importance of strict observance to rules, procedures, regulations,
and division of labor. More emphasis was on the latter principle
that was believed to manifest a great impact on the worker and the
organization. Alber (2007) re-emphasized, “Maximum work
efficiency could be achieved if jobs were simplified and
specialized to the greatest possible extent.” Of essence was the
notion that an employee would function most efficiently if he
performed the same task over and over again. Numerous studies,
however, indicate that work designed according to these classical
and scientific management principles does not either necessarily
improve the efficiency of the employee nor the productivity of the
organization hence the institutions should redefine their job design
to achieve employee motivation (Slocum and Sims, 2000).
Several studies, however, have challenged the principles of
classical and scientific management particularly in the banking
and financial institutions which have been tremendously
undergone technological digitization (Alber, 2007). Undisputedly,
job design has been one of the most effective tools applied for
maximizing on individual’s performance. In this reference, job
design can be defined as the deliberate work arrangement and
purposeful job planning including all the task aspects and their
effect on the employee. According to Knapp and Mujtaba (2010),
it also includes changing the content and processes of a task to
optimize employees’ productivity and motivation. Broadly the job
design concept features are characterized through task identity,
task variety, task significance and task autonomy (Slocum and
J
International Journal of Scientific and Research Publications, Volume 10, Issue 1, January 2020 599
ISSN 2250-3153
http://dx.doi.org/10.29322/IJSRP.10.01.2020.p9791 www.ijsrp.org
Sims, 2000). Effective job design strategies inculcate employee
involvement forecasting not only the outcomes and organizational
success but also the outcomes of the individual employee (Bates,
2004). However, organizations and particularly the banking
sectors’ job designs, perceive an imbalance between job demands
and the employee’s abilities to cope up with the targets (World of
Work Report, 2011). With such a working environment filled with
conflicting demands from wok place and family commitments,
flexitime arrangement as a job design strategy becomes
appropriate (Grantol- Vallore and Donaldson, 2001).
According to Rau and Hyland, 2002, flexitime arrangement
is a job design strategy that alters the standard workday of an
employee in an organization. The strategy comprehends the
organizational goals as well as the employee’s flexibility in their
job. The increased demand to integrate economic, technological
advancements and social responsibilities have encouraged many
institutions to adopt the flexitime strategy (Hill et al., 2001).
O’Driscoll et al. (2003) pointed out that the use of the strategy for
many years although little literature is available on its
effectiveness in the banking sector. He further noted that
employees’ control and flexibility are critical in achieving
employee motivation to meet their targets in the organization.
According to Galinsky et al. (2008), flexitime strategy helps
achieve employee access to mental health, turn over, and
absenteeism thus increased profit turn over. Although the strategy
is becoming popular for considerations, there is insignificant
information on its effects on employee performance particularly
in the banking sector.
The financial and banking sector in Kenya is becoming
highly competitive with the increased demand for growth in
digitization and technology used in its operations (Banking
Survey, 2010). The demand in growth is associated with an
industry-wide branch network expansion strategy across the
region (Think Business, 2012); digitization and automation of a
large number of services (Banking Survey, 2010). The emphasis
for digitization has led to increased competition culminating in
increased innovations among the financial institution players. In
today’s competitive environment in the industry, the
distinguishing feature has been exemplary customer services
whereby some institutions have managed to edge higher than the
others (Armstrong, 2007). Bloom and Reenen (2007) argued that
for financial institutions to competitively edge higher, they have
continually searched to attract new customers and retain the
existing ones through developing innovative programs and
employee motivation strategies.
Consequently, financial institutions have continually
restructured their operations and job design strategies to develop
more cost-effective and efficient organizational operations. Such
one strategy as proposed by Kombo and Tromp (2006), is through
constant job design arrangement to maximize the employee
performance. An analysis by Macpherson (2017) shows that there
is apprehension and anxiety mounting currently within Kenya’s
banking and financial institutions sector resulting from powerful
converging internal and external pressures to its employees in
balancing their social life and meeting the job targets. As pointed
by O’Driscoll et al. (2003) on the need for employee flexibility in
their workplace, evidence on flexitime arrangement in the banking
system is not clear thus the consequential effect on actual
individual performance.
II. PROBLEM STATEMENT
To keep up with the face pace of the current economic
development across the globe, financial institutions have created
new job design strategies that have enabled them to embrace
digitization and compete to survive the market challenges.
Currently, financial institutions in Kenya are struggling with
threatening challenges such as increased operational costs,
continually reducing profits, redundancy of employees, bottle-
neck competition, legislative and policy changes and job-hopping.
The important aspects that earn competitive advantage are
customer satisfaction and customer service; therefore, an
understanding of the existing and expected jobs and the
anticipated amount of productivity from the specific workers is
essential. Besides, as the financial institutions embark on
digitization into their job design strategies, its impact on the
applied job strategies cannot be disregarded. Many organizations
have embraced flexitime arrangements in their job design as a
model for improving organizational performance. Although the
financial institutions have adopted the strategy to achieve a
competitive advantage, there is little known literature about its
effect on the employee performance of such institutions.
According to ILO (2010), many organizations and especially
financial institutions, involve their employees with longer working
hours which demotivates the worker as the employees fail to
balance their job and their outside work. The results are increased
absenteeism, psychological stress and increased employee
turnover which reduces profit turn over in the organization.
Although many organization have integrated the flextime
arrangement into their job design, Kamau et al. (2015) pointed the
lack of enough literature on the strategy’s effect on organizational
performance particularly in the financial and banking sector. The
researcher therefore isolated this as an interest especially due to
high digitization in the banking sector.
III. JOB CHARACTERISTICS THEORY
The theory is one of the fundamental theories of job design,
first proposed by Richard Hackman and Greg Oldman in 1160.
This theory argues that for employees to be more encouraged and
contented with their jobs certain characteristics must comprise the
job. In a nutshell, these characteristics create the conditions viable
for allowing the employees to experience psychological
satisfaction which is critical as it relates to the outcomes of the job
and leads to high work motivation. Gomez et al. (2010) argued
that the intensity of an individual employee's need for growth
highly determines the strength in the link between the job
characteristics, psychological states and the work outcomes. Job
design strategies are not only geared at improving employee
performance but also the organizational productivity. The Job
Characteristic Theory emphasizes on core characteristics and their
link to job and employee outcomes. This study improves on this
theory by linking flexitime job design to the core characteristics
and employee performance as the key outcome.
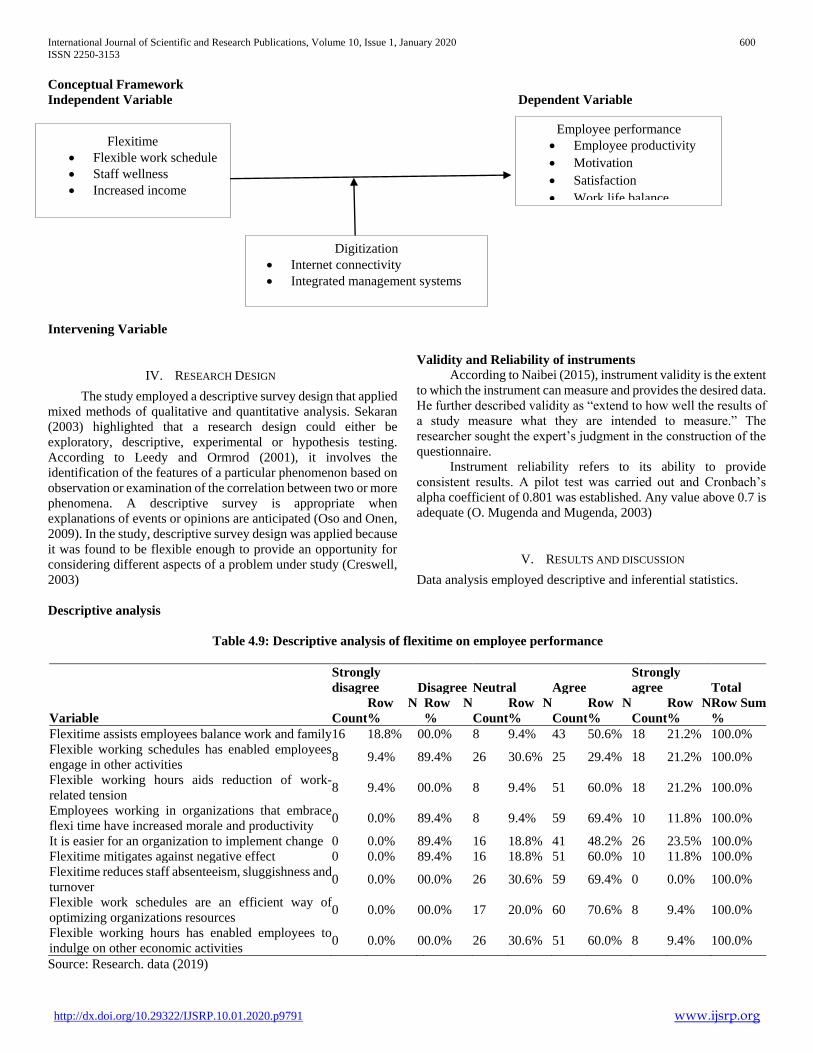
International Journal of Scientific and Research Publications, Volume 10, Issue 1, January 2020 600
ISSN 2250-3153
http://dx.doi.org/10.29322/IJSRP.10.01.2020.p9791 www.ijsrp.org
Conceptual Framework
Independent Variable Dependent Variable
Intervening Variable
IV. RESEARCH DESIGN
The study employed a descriptive survey design that applied
mixed methods of qualitative and quantitative analysis. Sekaran
(2003) highlighted that a research design could either be
exploratory, descriptive, experimental or hypothesis testing.
According to Leedy and Ormrod (2001), it involves the
identification of the features of a particular phenomenon based on
observation or examination of the correlation between two or more
phenomena. A descriptive survey is appropriate when
explanations of events or opinions are anticipated (Oso and Onen,
2009). In the study, descriptive survey design was applied because
it was found to be flexible enough to provide an opportunity for
considering different aspects of a problem under study (Creswell,
2003)
Validity and Reliability of instruments
According to Naibei (2015), instrument validity is the extent
to which the instrument can measure and provides the desired data.
He further described validity as “extend to how well the results of
a study measure what they are intended to measure.” The
researcher sought the expert’s judgment in the construction of the
questionnaire.
Instrument reliability refers to its ability to provide
consistent results. A pilot test was carried out and Cronbach’s
alpha coefficient of 0.801 was established. Any value above 0.7 is
adequate (O. Mugenda and Mugenda, 2003)
V. RESULTS AND DISCUSSION
Data analysis employed descriptive and inferential statistics.
Descriptive analysis
Table 4.9: Descriptive analysis of flexitime on employee performance
Variable
Strongly
disagree Disagree Neutral Agree
Strongly
agree Total
Count
Row N
%
Row N
% Count
Row N
% Count
Row N
% Count
Row N
%
Row Sum
%
Flexitime assists employees balance work and family 16 18.8% 0 0.0% 8 9.4% 43 50.6% 18 21.2% 100.0%
Flexible working schedules has enabled employees
engage in other activities 8 9.4% 8 9.4% 26 30.6% 25 29.4% 18 21.2% 100.0%
Flexible working hours aids reduction of work-
related tension 8 9.4% 0 0.0% 8 9.4% 51 60.0% 18 21.2% 100.0%
Employees working in organizations that embrace
flexi time have increased morale and productivity 0 0.0% 8 9.4% 8 9.4% 59 69.4% 10 11.8% 100.0%
It is easier for an organization to implement change 0 0.0% 8 9.4% 16 18.8% 41 48.2% 26 23.5% 100.0%
Flexitime mitigates against negative effect 0 0.0% 8 9.4% 16 18.8% 51 60.0% 10 11.8% 100.0%
Flexitime reduces staff absenteeism, sluggishness and
turnover 0 0.0% 0 0.0% 26 30.6% 59 69.4% 0 0.0% 100.0%
Flexible work schedules are an efficient way of
optimizing organizations resources 0 0.0% 0 0.0% 17 20.0% 60 70.6% 8 9.4% 100.0%
Flexible working hours has enabled employees to
indulge on other economic activities 0 0.0% 0 0.0% 26 30.6% 51 60.0% 8 9.4% 100.0%
Source: Research. data (2019)
Flexitime
Flexible work schedule
Staff wellness
Increased income
Employee performance
Employee productivity
Motivation
Satisfaction
Work life balance
Digitization
Internet connectivity
Integrated management systems

International Journal of Scientific and Research Publications, Volume 10, Issue 1, January 2020 601
ISSN 2250-3153
http://dx.doi.org/10.29322/IJSRP.10.01.2020.p9791 www.ijsrp.org
The data in Table 4.9 showed that the respondents agreed
43(50.6%) that flexitime as a job strategy assists employees to
balance work and their family responsibilities followed by those
who strongly agreed 18(21.2%) then strongly disagreed
16(18.8%) and those who were neutral 8(9.4%). Less than half of
the respondents 26(30.6%) were neutral on the fact that use of
flexible working schedules has enabled employees to engage in
other economic activities to supplement their employment as the
only source of income followed by the respondents who agreed
25(29.4%) then strongly agree 18(21.2%) and a tie of 8(9.4%)
among those who said that they strongly disagree and disagree.
More than half of the respondents indicated that they agree
51(60%) that use of flexible working hours aids in the reduction
of work-related tension in the workplace followed by the
respondents who strongly agree 18(21.2%) and a tie of strongly
disagree and disagree at 8(9.4%).
The majority of the respondents indicated that they agree
59(69.4%) that employees working in organizations that embrace
flexitime job strategy have increased morale and higher
productivity, followed by 10(11.8%) who strongly agree and a tie
of disagreeing and neutral at 8(9.4%). Less than half of the
respondents agreed 41(48.2%) that it is easier for an organization
to implement change where the employees embrace flexible work
schedules followed by those who strongly agree 26(23.5%) then
16(18.8%) who were neutral and 8(9.4%) who disagreed. More
than half of the respondents agreed 51(60%) that flexitime strategy
mitigates against the negative effects of employees working for
long hours to the advantage of the organization followed by the
respondents who were neutral 16(18.8%) the those who strongly
agreed 10(11.8%) and 8(9.4%) who disagreed.
Inferential analysis
Table 4.16: Flexitime regression coefficients
Model
Unstandardized
Coefficients
Standardized
Coefficients
t Sig. B
Std.
Error Beta
1
(Constant) 2.262 .211 10.712 .000
Flexitime .432 .054 .657 7.934 .000
Source: Research. data (2019)
The flexitime significance level stands at 0.000, which is
less than the 0.05 significance level of the study, implying that
flexitime affects employee performance in financial institutions.
VI. SUMMARY
The study indicated that there was a high positive
association between flexitime and employee performance of the
financial institutions. The results indicated a unit increase in
flexitime would lead to an increase in employee performance, and
the null hypothesis is rejected implying that flexitime has a
significant positive effect on employee performance in financial
institutions in Kericho town
VII. CONCLUSION
The findings established that flexitime had a high
explanatory power on employee performance in financial
institutions. The results also showed that flexitime was positively
associated with employee performance and regression findings
indicated a strong positive relationship which revealed that there
was significant effect of flexitime on employee performance.
VIII. RECOMMENDATION
The analysis of the data in the study necessitates the
following recommendations: Based on the study findings that
flexitime is highly correlated with employee performance then we
can recommend that there is need for financial institutions to
improve the use of flexitime work arrangement since the
enhancement of these flexible working schedules has greatly
impacted on employee performance. The study further
recommends that other institutions should adopt a flexible work
arrangement since it has proven to boost employee performance.
The majority of the financial institutions fall under the
private sector; this implies that the public sector can adopt the
same so that it can achieve the desired productivity. The
implication is organizations that have embraced this strategy have
alleviated conflict between family and work issues, negative
effects of employees working for long hours, stressful work
environments, reduces absenteeism and sluggishness. It was also
noted that these financial institutions ought to have developed
flexitime with proper working schedules, work duration and
methods that involve task assessment which keeps track of the
amount of work done. Thus, ensure the professional development
of employees and less fatigue which develops through the non-
flexible schedules.
REFERENCES
[1] Alber, J (2007). An exploratory study of the benefits and costs of job enrichment. Unpublished doctoral dissertation. University Park, PA.: The Pennsylvania State University
[2] Armstrong, M. (2007). The practice of human resource management. London: Kogan Page.
[3] Bates, S. (2004). ʹGetting engagedʹ, HR Magazine, 49(2), 44–51
[4] Bloom & Reenen (2007). Measuring and explaining management practices across firms and countries. Quart. J. Econ. 122(4), 1351-1408. Bulletin, 1970, 74, 18-31.
[5] Brown, D. R., & Harvey, D. F. (2011). An experiential approach to organization development.
[6] Cracknell, D. (2012). Policy innovations to improve access to financial services in developing countries: Learning from case studies in Kenya. Centre for global development.
[7] Creswell, J.W. (2003) Research design: qualitative, quantitative, mixed-methods approach. (2nd ed.) London: Sage Publications.
[8] Galinsky. E., Bond, J.T., Sakai.k., Kim.S.S., & Giuntoli, N. (2008). Study of Employers. Retrieved from:
[9] Grant-Vallone, E.J., & Donaldson, S.L. (2001). Consequences of work-family conflict on employee well-being over time: Work& Stress, 15,214-226.
[10] Hackman, R.J, & Oldham, G.R. (1160). Work redesign. Menlo Park, CA: Addison-Wesley Publishing Co.
[11] Hill, E. J., Erickson, J. J., Holmes, E. K., & Ferris, M. (2010). Workplace flexibility, work hours, and work-life conflict: finding an extra day or two. Journal of Family Psychology, 24(3), 349.

International Journal of Scientific and Research Publications, Volume 10, Issue 1, January 2020 602
ISSN 2250-3153
http://dx.doi.org/10.29322/IJSRP.10.01.2020.p9791 www.ijsrp.org
[12] http://familiesandwork.org/site/research/reports/200 8nse.pdf.
[13] International Labour Office (2010). World of Work Report 2010: From one crisis to the next? (Geneva, International Institute for Labour Studies).
[14] Kamau, S., Tuwai, B., &Kuria, S. (2015). Effect of corporate wellbeing practices of employee’s performance among commercial banks in Kenya. International Journal of Scientific and Research Publications, 5, (5)
[15] Knapp, P. R. & Mujtaba, B. G. (2010). Strategies for the design and administration of assessment center
[16] Kombo & Tromp (2006) Proposal and thesis writing. Paulines Publication Africa
[17] Leedy, P. & Ormrod, J. (2001). Practical research: Planning and design (7th ed.) Upper Saddle River, NJ: Merrill Prentice Hall. Thousand Oaks: SAGE Publications. 11
[18] Macpherson, R (2016) Making sense of recent turmoil in Kenya's banking industry https://www.howwemadeitinafrica.com/making-sense-recent-turmoil-kenyas-banking, August 3rd.
[19] Mugenda, O. & Mugenda, A. (2003), Research methods; Qualitative & Qualitative Approach, Acts Press
[20] Naibei, I.K. (2015). Research Methodology for Social Sciences. Study manual, press, University of Kabianga
[21] O’Driscoll, M.P., Poelmans, S., Kalliath, T., Allen, T. D., Cooper, C. L., and Sanchez, J. L. (2003), Family-responsive interventions, perceived organizational and supervisor support, work-family conflict, and psychological strain, International Journal of Stress Management, 10, 326-344.
[22] Oso & Onen (2009). A general guide to writing a research proposal and report. ISBN: 9966-9748-3-0
[23] Rau, B. L., & Hyland, M.M. (2002). Role conflict and flexibility arrangements: The effects on attraction applicant. Personnel Psychology, 55.
[24] Sekaran, U. (2003). Research methods for business: A skill-building approach. 4th Edition. Illinois. USA. John Wiley & Sons. Inc
[25] Slocum, J. & Sims, H. (2000) A typology for integrating technology, organization, and job design. Human Relations 33:193-212.
[26] The Banking Survey (2010). The Best Banks in Kenya. Business Journal. Nairobi, Kenya.
[27] Think Business (2012). Equity Periodical Journal. Nairobi, Kenya Umstot DD, Mitchell
[28] Truss, K., Baron, A., Crawford, D., Debenham, T., Emmott, M., Harding, S., ... & Totterdill, P. (2014). Job design and employee engagement.
AUTHORS
First Author – Joseph Mwendwa Musinga, MBA, School of
Business and Economics, University of Kabianga, Kenya
Second Author – Dr. Hellen W. Sang, Lecturer, School of
Business and Economics, University of Kabianga
Third Author – Dr. Andrew Kipkosgei, Lecturer, School of
Education, University of Kabianga
International Journal of Scientific and Research Publications, Volume 10, Issue 1, January 2020 603
ISSN 2250-3153
http://dx.doi.org/10.29322/IJSRP.10.01.2020.p9792 www.ijsrp.org
Management of Endo-Perio Lesion: A Case
Report
Surg Lt Cdr (Dr) Muneesh Joshi*, **, Lt Col (Dr) Manab Kosala**, Maj (Dr) Deepak Sharma, Col (Dr)
T Prasanth**
*Division of Periodontology, *Department of Dental Surgery and Oral Health sciences, *Armed Forces Medical
College, Pune, Pin- 411040, India
Abstract: One of the most challenging problems
encountered by the clinician is the endo-perio
lesion. It is a perplexing problem faced in
diagnosing the lesion and a dilemma as to which
part of the lesion to be addressed first. There are
various schools of thought as to which approach to
take in managing such lesions. Some say
endodontic lesion is to be addressed primarily and
other school advocates for treating periodontal
lesions first. To address this issue, a proper
diagnosis is to be formulated which can only be
achieved by recording a comprehensive history and
meticulous examination of the defect. Examination
of the endo-perio lesion involves thorough clinical
assessment, radiographic assessment, vitality
testing, root fracture assessment without which a
firm diagnosis and complete treatment plan cannot
be made. The lesion can only be treated if it is
classified correctly and many authors over many
decades have proposed various classification
which has helped in categorizing the lesion and
planning the management of the same. One such
classification is Simon classification (1972) which
classified the lesion into primary endo, primary
perio, and combined endo-perio lesions. This gave
an insight to the clinicians as to which part of the
lesion to treat first to achieve favorable results.
This case report discusses the management of an
endo perio lesion.
Index terms: Endo-Perio lesion, Primary-endo,
Primary-perio, Combined Endo-perio
I. Introduction
For many years there was a dilemma on
the interrelationship between and endodontic and
periodontal disease. According to the data, pulpal
and periodontal diseases are responsible for more
than 50% of tooth mortality. Sometimes the patient
may present with a condition where both the
lesions are present simultaneously in the same
tooth. This leads to a state of confusion for the
clinician to formulate a diagnosis and to determine
which condition to give priority. The diagnostic
criteria used to distinguish between a disease that
may have originated from the pulpal necrosis or
from attachment loss are not always sufficiently
specific to allow determination of the disease
etiology. To understand this complicated disease, it
is important to understand the anatomy and the
structures of the tooth which are affected and the
role they play in propagating the lesion in a certain
direction so that they become primary-endo or
primary-perio. There are times when both lesions
occur concurrently, these types of lesions are called
Combined perio-endo lesions and the clinician
must determine the causative factor of the
established lesion and the route of infection to plan
the treatment accordingly. There may be certain
conditions where the destruction of the tissue has
already started and the other may have contributed
to the disease later on. Hence, it is critical in the
case of perio-endo lesion to diagnose the case and
make a treatment plan for the same. Hiatt (1977)
has suggested that such lesions be considered
endodontic in nature for treatment planning
purposes, since endodontic therapy alone may
resolve the lesion. [1] However, resolution of the
defect is highly dependent on the primary source
and the chronicity of the lesion; treatment may
eventually involve both endodontic and periodontal
treatment according to Benenati et al (1981). [2]
To establish correct diagnosis, it starts
with recording clinical case history followed by
clinical examination of the affected tooth and
surrounding region by inspection of the area, this
can be done by direct vision, indirect vision or also
under assisted vision or magnification using loupes
or microscope to detect for any presence of decays
and infiltrated restorations, lines of fracture,
dyschromia, all related elements to pulpal diseases
and possible fractures.
Palpation is done to assess for any
tenderness in the mucosal region covering the root
surface and the apical region for any infection, any
signs of inflammation which is frequently
associated with endodontic lesion and sometimes
with periodontal lesions as well.
Percussion of the involved tooth will give
clarity on the area the inflammation is present as

International Journal of Scientific and Research Publications, Volume 10, Issue 1, January 2020 604
ISSN 2250-3153
http://dx.doi.org/10.29322/IJSRP.10.01.2020.p9792 www.ijsrp.org
positive lateral percussion is suggestive of
periodontal involvement and vertical percussion is
a sign of endodontic involvement.
Evaluation of the tooth mobility is
suggestive of periodontal involvement due to the
destruction of the supporting structures like
periodontal ligament, cementum and alveolar bone
leading to abnormal movement of the tooth in the
alveolar socket.
Clinical tests are imperative for obtaining
a correct diagnosis and differentiating between
endodontic and periodontal disease. The extraoral
and intraoral tissues are examined for the presence
of any abnormality or disease. One test is usually
not sufficient to obtain a conclusive diagnosis.
Radiographic examination of the lesion is one of
the important assessment tools to guide the type of
tissue involved i.e. pulpal, periodontal or both.
Other tests like: Pulp vitality test, Cold test,
Electric pulp testing, blood flow test, Cavity test,
Restored teeth testing, Pocket probing, Fistula
tracking, Lesion with narrow sinus tract-type
probing, Cracked tooth testing with
Transillumination, Wedging, Staining, Selective
anesthesia can be done to determine and diagnose
the lesion.
Classifying the lesion also plays an
important role in treatment planning, hence various
authors over many years have classified endo perio
lesion and various ways. [3-9] The first
classification of the endo perio lesion was given by
Oliet and Pollock in 1968 [10] and after that, many
classifications have been proposed for endo-perio
lesion.
This case report discusses the
management of an Endo-perio case with both
endodontic treatment as well as periodontal
surgical intervention.
II. Case Report
A 49-year-old female patient reported to
the division of Periodontology with a chief
complaint of pain in the upper front tooth region
with respect to 11 and 21 since 3 months. She also
informed about the mobility of teeth 11 and 21
since 2 months. She noticed pus discharge from 21
region one month back for which she did not take
any medication. The patient was a systemically
healthy patient with no history of any dental
treatment.
Intraoral clinical examination of the lesion
was done by conduction a visual examination that
revealed Non-carious teeth with respect to r.t 11
and 21, supragingival plaque and calculus, sinus
tract in relation to 21, Midline diastema in 11 and
21 region. Gingival findings revealed generalized
inflamed marginal gingival which was reddish-pink
in color with greyish brown diffused melanin
pigmentation, rolled out margins, soft & edematous
in consistency, presence of bleeding on probing and
attached gingiva showing loss of stippling.
Periodontal examination showed deep periodontal
pocket in relation to 21 (mesially – 09 mm, mid
buccally – 11 mm, distally – 12 mm) and grade- 2
mobility of tooth 11 and 21. Radiological
examination was done and IOPA revealed
interdental bone loss mesial of tooth 11, mesial and
distal of tooth 21. It also revealed a loss of
interproximal contact (midline diastema) in
between 11 and 21.
A diagnosis of Primary periodontal lesion
with a secondary endodontic lesion in relation 21
with a periodontal abscess in relation to 21 was
established, According to the classification
proposed by Simon et al, 1972 [11] based on
clinical and radiological examination.
According to Rotstein et al in 2004, lesion
should be first treated endodontically along with
Phase-I of periodontal therapy i.e. scaling and root
planning. [12] Further management of the lesion
should be carried out post-evaluation after 2-3
months as suggested by Parolia et al in 2013. [13]
Treatment Plan was formulated and was
divided into different phases. Periodontal therapy
consisted of scaling and root planning; Correction
of brushing technique; Patient Motivation; Oral
Hygiene instructions, Occlusal correction for the
TFO in relation to 11 and 21. Subsequently, Root
canal therapy was carried out in relation to 21. The
access cavity was prepared in 21 using No 2 -
round bur and No 4 - tapered fissure bur. A
working length radiograph was taken and one canal
was compensated in 21 using # 15 K-file (Kerr
Manufacturing Co.TM). Biomechanical preparation
of the canal was done using crown- down technique
using stainless steel files and pro-taper system till
#F2 file under copious irrigation with saline, 5.25%
sodium hypochlorite solution and 17% EDTA
(GlydeTM File Prep, Densply France). After BMP
was done, canals were dried using absorbent paper
points (DentsplyTM Maillefer) and the inter-
appointment dressing was done with calcium
hydroxide and temporary filling (cavit 3M, ESPE)
was placed. The patient was recalled after 10 days
and calcium hydroxide was removed from the
canals using EDTA and sodium hypochlorite
5.25% after which canal was irrigated with normal
saline and dried using absorbent paper point and
obturated with corresponding # F2 gutta-parch
point/cone of Pro-taper systemTM by cold lateral
International Journal of Scientific and Research Publications, Volume 10, Issue 1, January 2020 605
ISSN 2250-3153
http://dx.doi.org/10.29322/IJSRP.10.01.2020.p9792 www.ijsrp.org
compaction of the gutta-percha using root canal
sealer. The access cavity was sealed using glass
ionomer cement (Fuji IITM, GC Corporation,
Japan). Post obturation IOPA was taken to assess
the completed root canal therapy. (Fig 8) After the
endodontic therapy was completed, splinting of the
mobile teeth were done using composite resin
reinforced with Co-axial wire from 13 to 23 to
reduce the occlusal load and mobility of the teeth
and also to stabilize the teeth in form & function by
distribution of the occlusal forces. After one week
the patient was recalled for assessment of the tooth.
After adequate maintenance phase,
periodontal surgery consisting of open flap
debridement in relation to 11, 21 and 22 regions
was planned. Patient was anesthetized with 2%
Lidocaine with 1:80,000 epinephrine by giving
Nasopalatine nerve block, Infraorbital nerve block
on both left and right side of the face following
which a full-thickness mucoperiosteal flap was
raised by giving crevicular incisions from 11 to 22
and two releasing incisions i.e. distal to 11 and
distal to 22 from the line angle of the tooth was
given extension till alveolar mucosa for ease in
reflection and better repositioning of the flap. (Fig
9) Bony defects were debrided of any granulation
tissue using curettes (#1- #2; #3 - #4 GraceyTM
curettes) Residual calculus and altered cementum
was removed using a curette and pocket lining were
removed. After thorough root planning and
complete removal of the granulation tissue, residual
calculus, altered cementum, root surface was
assessed to be smooth and shiny and free of any
debris.(Fig 10) The flap was readapted,
approximated and stabilized with simple
interrupted sutures using 3-0 silk sutures. (Fig 11)
Post-operative instructions were given to the
patient and medication i.e analgesics (Tab
ibuprofen 400mg thrice a day) was prescribed for 3
days. The patient was asked to maintain good oral
hygiene and use of 0.2 % chlorhexidine mouthwash
twice a day for 07 days. The patient was recalled
after 1 week for the removal of the suture.
On the assessment of the surgical site after
one week, the site showed uneventful healing and
sutures were removed and the patient was put on
the maintenance phase and was recalled for follow
up according to Merin’s classification for recall
assessment. Reassessment of the region was done
after 2 months and after 3 months post periodontal
surgery. Periodontal pockets were reassessed by
probing. Mobility was checked by the digital
method of assessment of mobility using the blunt
end of the mouth mirrors and finger/digit. Re-
enforcement of plaque control; re-assessment of
plaque and calculus; re-assessment of mobility;
reinforcement of oral hygiene instruction and
brushing technique was carried out in each
maintenance visit.
Evaluation of the lesion was done after 3
months post flap surgery. On examination, it was
observed that the patient was keeping good oral
hygiene. There was an absence of bleeding on
probing in relation to 11,21 and 22 region.
Resolution of the inflammation was observed and a
considerable amount of reduction in the periodontal
pocket depth in 21 region from previously mesial –
09 mm, mid buccal – 11 mm, distal – 12 mm to
mesial – 02 mm, mid buccal – 02 mm, distal – 02
mm.(Fig 13, 14) On examination it was also
observed that color of the gingiva was coral pink
with melanin pigmentation, marginal gingiva was
knife-edge in contour, firm and resilient in
consistency, position of the marginal gingiva which
was previously at CEJ has shrunk below CEJ
approximately 3 mm as a compensation to the
resolution of the inflammatory component and
removal of the granulation tissue. IOPA was taken
which revealed a decrease in radiolucent areas in
relation to 21. The healthy tissues show signs of
resolution of signs of inflammation and
reattachment. (Fig 15) The mobility component
reduced from Grade-II to Grade-I in tooth 11 and
21. This healthy tissue helps in regeneration and
creeping attachment.
IV. Discussion
Tissues of periodontium and pulpal tissue
share a common embryonic origin. The origins of
both the tissue are mesodermal. Subsequently, the
development takes one from the dental papilla and
other from the dental sac. The inter-relationship
between both is unique and closely related. Simring
and Goldeberg, 1964 [14] elaborated the inter-
relationship between the periodontal tissues and the
endodontic tissues and has aroused a lot of
controversies, speculations, and confusion
regarding the same. A true Endo-perio lesion (EP)
or true combined endo-perio disease is when the
pulpal lesion communicates with the periodontium
via apical foramina, lateral canals or through
furcation. Harrington and Steiner [15] also defined
an Endo perio lesion as a non-vital tooth that shows
the destruction of periodontal attachment reaching
the whole way to the root apex or a lateral canal,
for which both root canal treatment and periodontal
therapy are required.
The sequelae of endodontic involvement
and periodontal disease are increased periodontal
probing depths, localized gingival inflammation or
swelling, bleeding on probing, suppuration, fistula
formation, tenderness to percussion, increased
tooth mobility, angular bone loss, and pain.

International Journal of Scientific and Research Publications, Volume 10, Issue 1, January 2020 606
ISSN 2250-3153
http://dx.doi.org/10.29322/IJSRP.10.01.2020.p9792 www.ijsrp.org
Classifying the endo-perio lesion is a challenge for
the clinician as the disease remains symptom-free
and only expresses once the acute exacerbation of it
happens. This exacerbation can be due to the pulpal
involvement presenting as a periapical abscess or
as periodontal involvement as a periodontal abscess
or dull groaning pain pathognomic of periodontal
pocket pain. According to Simon et al 1972, endo-
perio lesion can be classified into Primary
endodontic lesion, Primary endodontic with
secondary periodontal involvement, Primary-
periodontal, primary periodontal with secondary
endodontic involvement, or True combined lesion.
The latest classification is given by the world
workshop of Periodontology in 2017 divided the
lesion into two according to etiology. [16] First,
endodontic and/or periodontal infections and
second, trauma and/or iatrogenic factors. Endo-
perio lesion caused due to endodontic and/or
periodontal infections can be triggered by a carious
lesion that affects the pulp and, secondarily, affects
the periodontium, or by periodontal destruction that
secondarily affects the root canal; or by both events
concomitantly. Whereas endo-perio lesion caused
due to trauma and/or iatrogenic factors can be
triggered by root/pulp chamber/furcation
perforation; root fracture or cracking; external root
resorption; pulp necrosis draining through the
periodontium.
It is important for the clinician to diagnose
the case as it helps in treatment planning and
further management of the case. Management of
the cases with Endo-perio lesion most of the time
begins with root canal therapy and rarely it requires
initial periodontal intervention. But at times of
periodontal abscess complicates the clinical
scenario with pain and discomfort. The same needs
to be addressed by incision and drainage to
overcome the acute symptoms. Most of the endo
perio cases resolve with good prognosis and
follow-up shows reduction in the periapical
radiolucency. In cases with primary-perio and
combined lesions, periodontal surgical intervention
becomes inevitable for success and good prognosis
of the tooth/teeth. Flap surgery/ Open flap
debridement, removal of the remaining calculus,
altered cementum and removal of the granulation
tissue reduce the inflammation in the region and
healthy tissue can be achieved and regeneration can
be attempted.
V. Conclusion
Endo-perio lesion is a complicated disease
that requires a meticulous diagnosis and schematic
treatment planning. Comprehensive management of
the lesion will lead to a better prognosis of the
involved tooth/teeth. This can only be achieved
with proper case selection, history taking, clinical
examination, and vitality testing and reaching to a
proper diagnosis. Management of such lesion is
made easy once proper protocols are followed and
care is taken for both pulpal and periodontal tissues
and follow-up of the case is done. Hence, an
interdisciplinary approach is a boon for the
management of endo-perio lesion for successful
management of such lesions.
Appendices
Appendix 1: Fig 1 , 2, 3, 4, 5, 6, 7, 8, 9, 10, 11, 12,
13, 14, 15, 16, 17, 18
REFERENCES
1. Hiatt WH. Pulpal periodontal disease. J
Periodontol 1977;48:598-609.
2. Benenati FW, Roane JB, Waldrop TC.
The perio-pulpal connection: an analysis
of the periodontic-endodontic lesion. Gen
Dent 1981;29:515— 520.
3. Guldener PH. The relationship between
periodontal and pulpal disease. IntEndod
J. 1985;(18):41–54.
4. Geurtsen W, Ehrmann E, Löst C. Die
kombinierteendodontal–
parodontaleErkrankung. DtschZahnärztl
Z. 1985;(40):817–822.
5. Torabinjad M, Lemon. RL. Procedural
accidents. Walt RE, Torabinejad M (eds)
PrincPractEndoded 2 Philadelphia, PI WB
Saunders. 1996;306–323.
6. Weine F. Endodontic-periodontal
problems. In: Weine FS (ed). Endodontic
therapy, ed 6. St. Louis: Mosby,:
2004;452–481.
7. Abbott P, Salgado J. Strategies for the
endodontic management of concurrent
endodontic and periodontal diseases. Aust
Dent J. 2009;(54):570–85.
8. Foce E. Endo-periodontal Lesions. Endo-
Periodontal Lesions. 2011;1–3.
9. Hany Mohamed Aly Ahmed. Different
perspectives in understanding the pulp and
periodntal intercommunications with a
new proposed classification for endo-perio
lesions. Endo Engl. 2012;6(2):87–104.
10. Oliet S, Pollock S. Classification and
treatment of endo- perio involved teeth.
Bull PhilaCty Dent Soc. 1968;(34):12–16.
11. Simon J, Glick D, Frank A. The
relationship of endodontic-periodontic
lesions. J Periodontol. 1972;(43):202–208.
12. Rotstein I, Simon JHSS. Diagnosis,
prognosis and decision-making in the
treatment of combined periodontal-
endodontic lesions. Periodontol 2000.
2004;34(101):165–203.

International Journal of Scientific and Research Publications, Volume 10, Issue 1, January 2020 607
ISSN 2250-3153
http://dx.doi.org/10.29322/IJSRP.10.01.2020.p9792 www.ijsrp.org
13. Parolia A, Gait TC, Porto IC, Mala K.
Endo-perio lesion: A dilemma from 19 th
until 21 stcentury.Journal of
Interdisciplinary Dentistry. 2013; 3(1).
14. Simring M GM. The pulpal pocket
approach: Retrograde periodontitis. J
Periodontol. 1964;35:22–48
15. Harrington GW SD. Periodontal-
endodontic considerations. Princ Pract
Endoded 3 Philadelphia, PA WB
Saunders. 2002;466–84.
16. Caton J, Armitage G, Berglundh T, et al.
A new classification scheme for
periodontal and peri‐ implant diseases and
conditions – Introduction and key changes
from the 1999 classification. J Clin
Periodontol. 2018;45(Suppl 20):S1–S8
Authors
First Author - Surg Lt Cdr (Dr) Muneesh
Joshi, Resident Periodontology, Armed
Forces medical college, Pune.
Second author - Lt Col Manab Kosala,
Professor [Periodontology], Armed Forces
Medical college, Pune.
Third Author- Maj (Dr) Deepak Sharma,
Resident Periodontology , Armed Forces
medical college, Pune.
Fourth Author- Col T Prasanth, Associate
Professor [Periodontology] , Armed forces
Medical college, Pune.
Correspondence Author-
Surg Lt Cdr (Dr) Muneesh Joshi, Resident
Periodontology , Armed Forces medical college,
Pune. [email protected], Mobile no -
8007033838
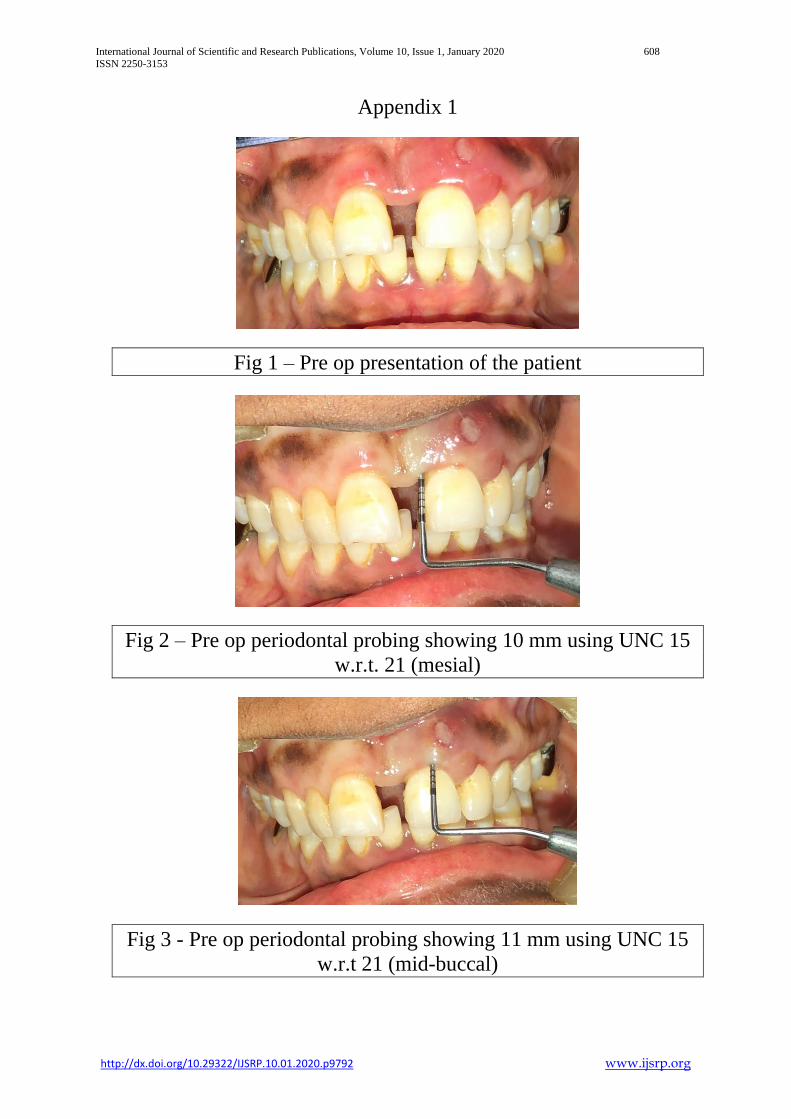
International Journal of Scientific and Research Publications, Volume 10, Issue 1, January 2020 608
ISSN 2250-3153
http://dx.doi.org/10.29322/IJSRP.10.01.2020.p9792 www.ijsrp.org
Appendix 1
Fig 1 – Pre op presentation of the patient
Fig 2 – Pre op periodontal probing showing 10 mm using UNC 15
w.r.t. 21 (mesial)
Fig 3 - Pre op periodontal probing showing 11 mm using UNC 15
w.r.t 21 (mid-buccal)

International Journal of Scientific and Research Publications, Volume 10, Issue 1, January 2020 609
ISSN 2250-3153
http://dx.doi.org/10.29322/IJSRP.10.01.2020.p9792 www.ijsrp.org
Fig 4 - Pre- op periodontal probing showing 13 mm using UNC 15
w.r.t 21 (distal)
Fig 5 - Pre op IOPA w.r.t 21 showing periapical radiolucency

International Journal of Scientific and Research Publications, Volume 10, Issue 1, January 2020 610
ISSN 2250-3153
http://dx.doi.org/10.29322/IJSRP.10.01.2020.p9792 www.ijsrp.org
Fig 7 - Pre op OPG
Fig 8 – Root Canal Treatment done w.r.t 21
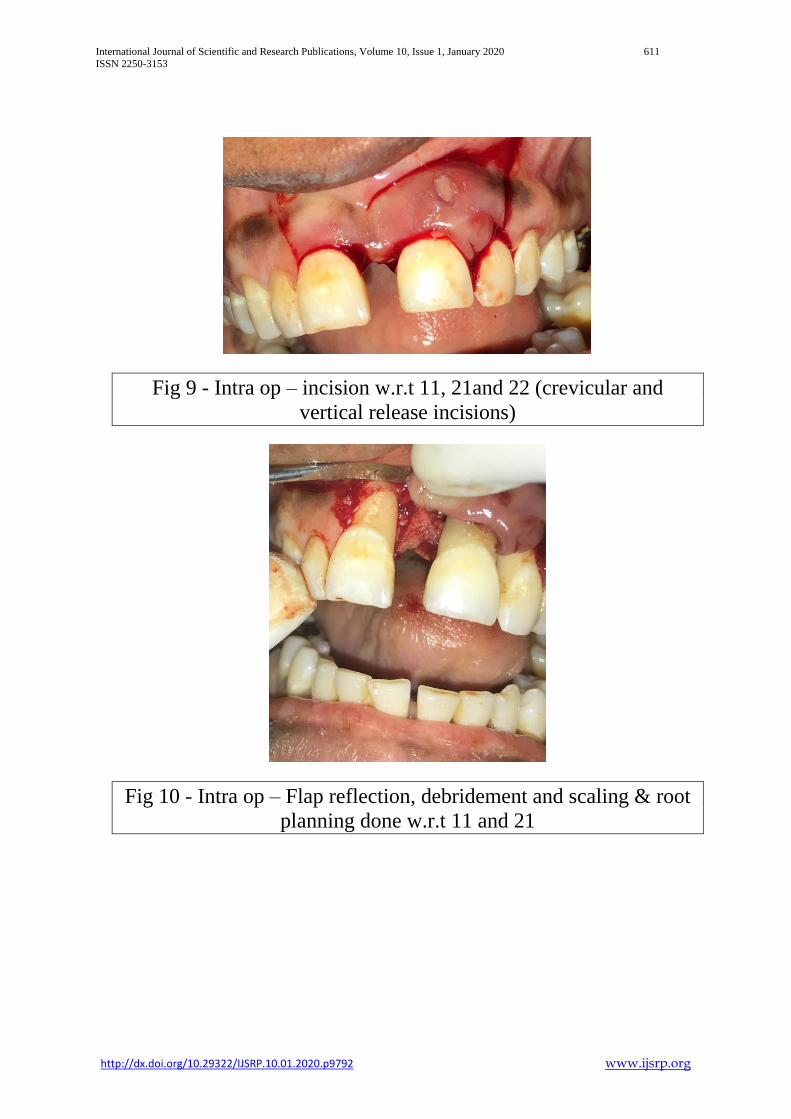
International Journal of Scientific and Research Publications, Volume 10, Issue 1, January 2020 611
ISSN 2250-3153
http://dx.doi.org/10.29322/IJSRP.10.01.2020.p9792 www.ijsrp.org
Fig 9 - Intra op – incision w.r.t 11, 21and 22 (crevicular and
vertical release incisions)
Fig 10 - Intra op – Flap reflection, debridement and scaling & root
planning done w.r.t 11 and 21

International Journal of Scientific and Research Publications, Volume 10, Issue 1, January 2020 612
ISSN 2250-3153
http://dx.doi.org/10.29322/IJSRP.10.01.2020.p9792 www.ijsrp.org
Fig 11 - Flap approximation, stabilization and flap closure
achieved using 3-0 silk sutures
Fig 12 - IOPA showing Splinting done w.r.t 13, 12.11,21, 22 and
23
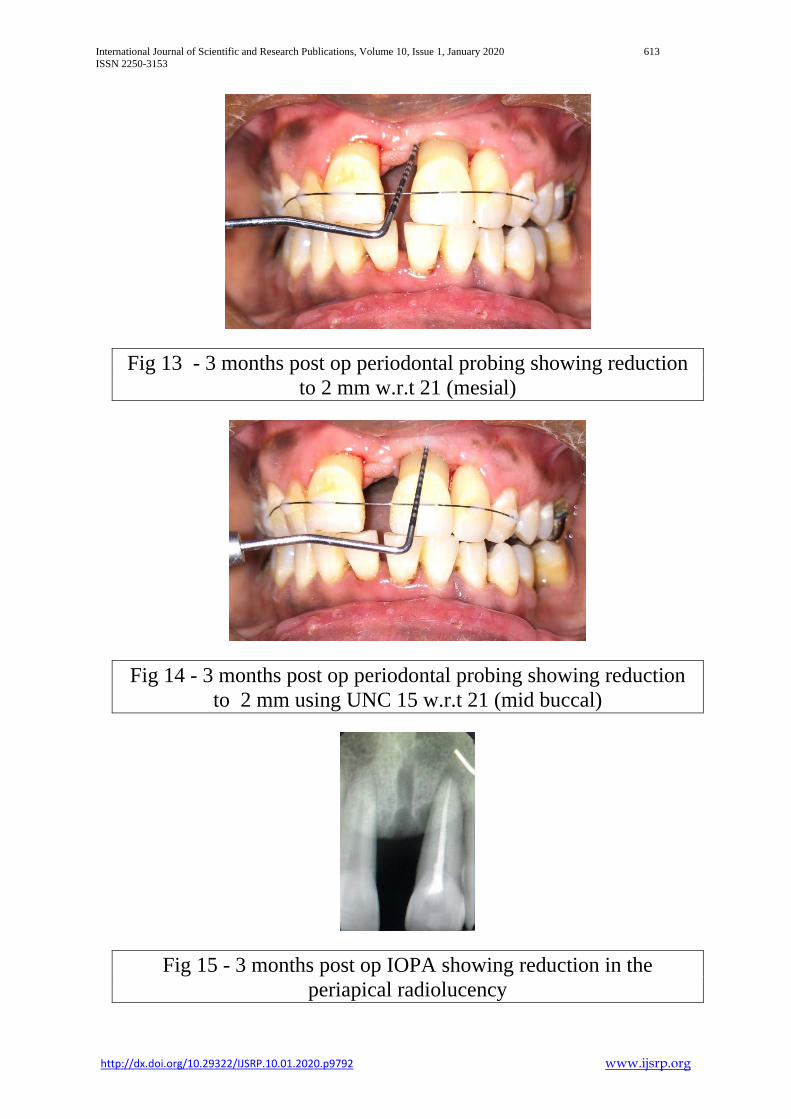
International Journal of Scientific and Research Publications, Volume 10, Issue 1, January 2020 613
ISSN 2250-3153
http://dx.doi.org/10.29322/IJSRP.10.01.2020.p9792 www.ijsrp.org
Fig 13 - 3 months post op periodontal probing showing reduction
to 2 mm w.r.t 21 (mesial)
Fig 14 - 3 months post op periodontal probing showing reduction
to 2 mm using UNC 15 w.r.t 21 (mid buccal)
Fig 15 - 3 months post op IOPA showing reduction in the
periapical radiolucency

International Journal of Scientific and Research Publications, Volume 10, Issue 1, January 2020 614
ISSN 2250-3153
http://dx.doi.org/10.29322/IJSRP.10.01.2020.p9792 www.ijsrp.org
Fig 16 - 3 months post op
Fig 17 - 3 months post op
Fig 18 - 3 months post op
International Journal of Scientific and Research Publications, Volume 10, Issue 1, January 2020 615
ISSN 2250-3153
http://dx.doi.org/10.29322/IJSRP.10.01.2020.p9793 www.ijsrp.org
The Effects of Khat Consumption on Family
Relationships in Kamukunji Constituency, Nairobi
County, Kenya
Rashid Ali Omar1, Kennedy K. Mutundu2, Felix N. Kioli3, Lucy W. Maina4
1School of Social Sciences - Mount Kenya University 2School of Social Sciences - Mount Kenya University
3School of Humanities and Social Sciences - South Eastern Kenya University 4School of Security, Diplomacy and Peace Studies - Kenyatta University
DOI: 10.29322/IJSRP.10.01.2020.p9793
http://dx.doi.org/10.29322/IJSRP.10.01.2020.p9793
Abstract- There are debates whether Khat is a contributor to
divorce and family break ups and social disorder like crimes and
theft. This is corroborated by constant media highlights. For
example, Mungai (1983) Khat consumption retards development
and prosperity of both the individual and his nation. It makes one
sleepy at odd times when others are working. It makes one weak
hence less resistance to diseases. Khat chewers will care less about
family, nutrition and health but spend many hours chewing and
looking for the substance. Thus, this study aimed at examining the
effects of Khat consumption on family relationships in Kamukunji
constituency, Nairobi County, Kenya. Guided by the Structural
Functionalism Theory and Conflict Theory, the study reviewed a
number of existing literature relating to the problem of family
relationships associated with Khat consumption. The study was
conducted in Kamukunji Constituency of Nairobi County. The
Somali community is the dominant tribe in the larger part of the
suburb. This study applied exploratory and descriptive survey
research designs with a mixed method approach. This study
targeted the entire Khat consumers’ households and retail traders
in Kamukunji constituency. The sample consisted of 335 main
consumers who used questionnaires, 5 key informants, 19 FGDs
and 70 retailers (used questionnaires) selected through ward-
clustering and then snowball sampling. Piloting was conducted in
Kibra constituency using 30 consumers’ households and 10 retail
traders. Validity was examined by aligning the questionnaire with
the Structural Functionalism and Conflict Theory. Reliability
statistic of was assessed through obtaining a Cronbach alpha of
0.914. The Statistical Package for the Social Sciences (SPSS -
Version 20) was used for both descriptive and inferential statistics.
The study applied the three analytical types of Univariate,
bivariate and multivariate analysis. Qualitative data were analyzed
through the process of coding where common themes were
identified and examined in relation to the context, meaning and
circumstances. The study found that whereas the consumption of
Khat has been perceived to be associated with men’s low levels of
sexual interest and libido, in the study area, it is noted among the
majority of the respondents, especially men that their interest in
sex increased with consumption of Khat. However, there was an
interesting difference where more women observed that Khat
consumption diminishes sexual interest. Most of the Khat users
had a history of Khat use in their family and the social economic
implication associated with Khat use in Kamukunji Constituency
is comparable to other studies carried out in other parts of the
world. There is urgent need to create awareness on Khat
consumption and available treatment and rehabilitation services
for those who are willing to reform and that schools and religious
institutions can be excellent avenues for information
dissemination.
Index Terms- Khat, Khat consumption, Family relationships,
Structural Functionalism, Social Conflict
I. INTRODUCTION
he consumption of mood enhancing substances has been
documented from ancient times. Drugs and alcohol has had
an influence on both cultures and civilization processes throughout
history of humanity. This is not only limited to African but also
the Sumerians, the Greeks, the Romans, the British and even the
Chinese (Gately, 2008). Archaeological and documentary
evidence describe the ancient use of the substances, ranging from
the use of opium in ancient Greece, harmal in West Indies,
cannabis in Western china, nutmeg in ancient India, cocoa leaf
among the Mayan cultures, and psilocybin across North Africa,
among others. For a quite number of decades and centuries, the
world population has been fermenting grains and fruits to produce
alcoholic drinks. In fact, the known earliest evidence of humans
engaging in brewing alcohol are shown by the residues in pottery
jars found in northern China that are thought to have been
produced between 7000 and 6600 B.C. (Gateley, 2008).
Khat (Catha edulis) is an ever green plant grown by
grafting and cultivated as a bush or small trees. It grows at an
attitude of 1500-2500 meters above the sea level under optimal
conditions requiring 10 years to attain maturity. According to
Anderson and Carrier (2009), it is a hardy crop which grows in
arid areas up to ten meters tall under normal circumstances and
grows up to five meters in non-equatorial regions.
The origin of Khat is not known and has raised various
arguments. Many believe that it its origin can be traced in parts of
Ethiopia, which was later on spread by the immigrants across East
Africa and Yemen. Others hold that Yemen was its initial origins
before spreading to nearby countries. Whether Ethiopia or
T
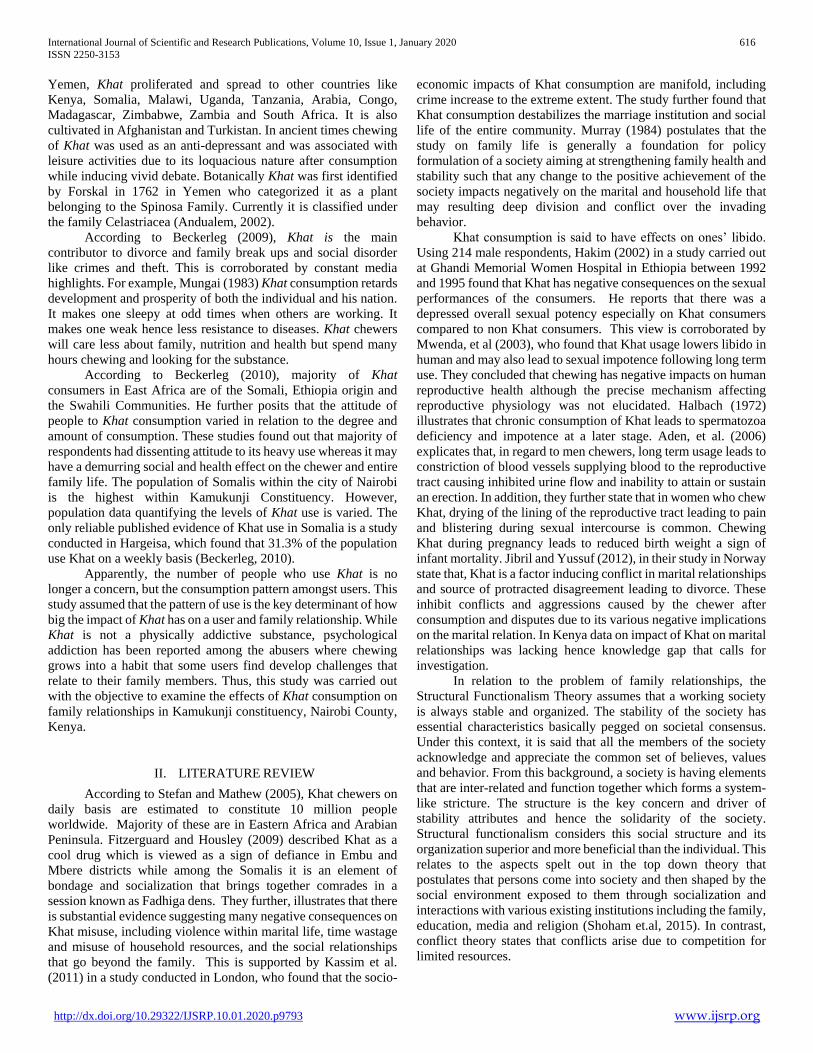
International Journal of Scientific and Research Publications, Volume 10, Issue 1, January 2020 616
ISSN 2250-3153
http://dx.doi.org/10.29322/IJSRP.10.01.2020.p9793 www.ijsrp.org
Yemen, Khat proliferated and spread to other countries like
Kenya, Somalia, Malawi, Uganda, Tanzania, Arabia, Congo,
Madagascar, Zimbabwe, Zambia and South Africa. It is also
cultivated in Afghanistan and Turkistan. In ancient times chewing
of Khat was used as an anti-depressant and was associated with
leisure activities due to its loquacious nature after consumption
while inducing vivid debate. Botanically Khat was first identified
by Forskal in 1762 in Yemen who categorized it as a plant
belonging to the Spinosa Family. Currently it is classified under
the family Celastriacea (Andualem, 2002).
According to Beckerleg (2009), Khat is the main
contributor to divorce and family break ups and social disorder
like crimes and theft. This is corroborated by constant media
highlights. For example, Mungai (1983) Khat consumption retards
development and prosperity of both the individual and his nation.
It makes one sleepy at odd times when others are working. It
makes one weak hence less resistance to diseases. Khat chewers
will care less about family, nutrition and health but spend many
hours chewing and looking for the substance.
According to Beckerleg (2010), majority of Khat
consumers in East Africa are of the Somali, Ethiopia origin and
the Swahili Communities. He further posits that the attitude of
people to Khat consumption varied in relation to the degree and
amount of consumption. These studies found out that majority of
respondents had dissenting attitude to its heavy use whereas it may
have a demurring social and health effect on the chewer and entire
family life. The population of Somalis within the city of Nairobi
is the highest within Kamukunji Constituency. However,
population data quantifying the levels of Khat use is varied. The
only reliable published evidence of Khat use in Somalia is a study
conducted in Hargeisa, which found that 31.3% of the population
use Khat on a weekly basis (Beckerleg, 2010).
Apparently, the number of people who use Khat is no
longer a concern, but the consumption pattern amongst users. This
study assumed that the pattern of use is the key determinant of how
big the impact of Khat has on a user and family relationship. While
Khat is not a physically addictive substance, psychological
addiction has been reported among the abusers where chewing
grows into a habit that some users find develop challenges that
relate to their family members. Thus, this study was carried out
with the objective to examine the effects of Khat consumption on
family relationships in Kamukunji constituency, Nairobi County,
Kenya.
II. LITERATURE REVIEW
According to Stefan and Mathew (2005), Khat chewers on
daily basis are estimated to constitute 10 million people
worldwide. Majority of these are in Eastern Africa and Arabian
Peninsula. Fitzerguard and Housley (2009) described Khat as a
cool drug which is viewed as a sign of defiance in Embu and
Mbere districts while among the Somalis it is an element of
bondage and socialization that brings together comrades in a
session known as Fadhiga dens. They further, illustrates that there
is substantial evidence suggesting many negative consequences on
Khat misuse, including violence within marital life, time wastage
and misuse of household resources, and the social relationships
that go beyond the family. This is supported by Kassim et al.
(2011) in a study conducted in London, who found that the socio-
economic impacts of Khat consumption are manifold, including
crime increase to the extreme extent. The study further found that
Khat consumption destabilizes the marriage institution and social
life of the entire community. Murray (1984) postulates that the
study on family life is generally a foundation for policy
formulation of a society aiming at strengthening family health and
stability such that any change to the positive achievement of the
society impacts negatively on the marital and household life that
may resulting deep division and conflict over the invading
behavior.
Khat consumption is said to have effects on ones’ libido.
Using 214 male respondents, Hakim (2002) in a study carried out
at Ghandi Memorial Women Hospital in Ethiopia between 1992
and 1995 found that Khat has negative consequences on the sexual
performances of the consumers. He reports that there was a
depressed overall sexual potency especially on Khat consumers
compared to non Khat consumers. This view is corroborated by
Mwenda, et al (2003), who found that Khat usage lowers libido in
human and may also lead to sexual impotence following long term
use. They concluded that chewing has negative impacts on human
reproductive health although the precise mechanism affecting
reproductive physiology was not elucidated. Halbach (1972)
illustrates that chronic consumption of Khat leads to spermatozoa
deficiency and impotence at a later stage. Aden, et al. (2006)
explicates that, in regard to men chewers, long term usage leads to
constriction of blood vessels supplying blood to the reproductive
tract causing inhibited urine flow and inability to attain or sustain
an erection. In addition, they further state that in women who chew
Khat, drying of the lining of the reproductive tract leading to pain
and blistering during sexual intercourse is common. Chewing
Khat during pregnancy leads to reduced birth weight a sign of
infant mortality. Jibril and Yussuf (2012), in their study in Norway
state that, Khat is a factor inducing conflict in marital relationships
and source of protracted disagreement leading to divorce. These
inhibit conflicts and aggressions caused by the chewer after
consumption and disputes due to its various negative implications
on the marital relation. In Kenya data on impact of Khat on marital
relationships was lacking hence knowledge gap that calls for
investigation.
In relation to the problem of family relationships, the
Structural Functionalism Theory assumes that a working society
is always stable and organized. The stability of the society has
essential characteristics basically pegged on societal consensus.
Under this context, it is said that all the members of the society
acknowledge and appreciate the common set of believes, values
and behavior. From this background, a society is having elements
that are inter-related and function together which forms a system-
like stricture. The structure is the key concern and driver of
stability attributes and hence the solidarity of the society.
Structural functionalism considers this social structure and its
organization superior and more beneficial than the individual. This
relates to the aspects spelt out in the top down theory that
postulates that persons come into society and then shaped by the
social environment exposed to them through socialization and
interactions with various existing institutions including the family,
education, media and religion (Shoham et.al, 2015). In contrast,
conflict theory states that conflicts arise due to competition for
limited resources.
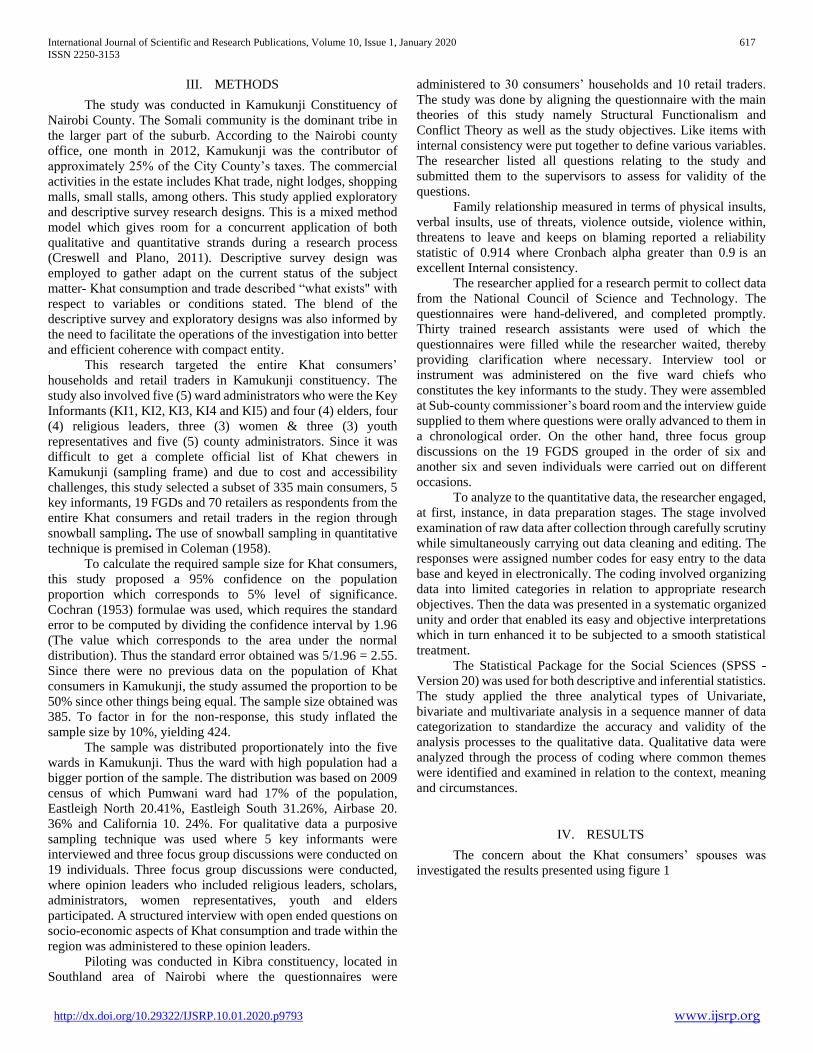
International Journal of Scientific and Research Publications, Volume 10, Issue 1, January 2020 617
ISSN 2250-3153
http://dx.doi.org/10.29322/IJSRP.10.01.2020.p9793 www.ijsrp.org
III. METHODS
The study was conducted in Kamukunji Constituency of
Nairobi County. The Somali community is the dominant tribe in
the larger part of the suburb. According to the Nairobi county
office, one month in 2012, Kamukunji was the contributor of
approximately 25% of the City County’s taxes. The commercial
activities in the estate includes Khat trade, night lodges, shopping
malls, small stalls, among others. This study applied exploratory
and descriptive survey research designs. This is a mixed method
model which gives room for a concurrent application of both
qualitative and quantitative strands during a research process
(Creswell and Plano, 2011). Descriptive survey design was
employed to gather adapt on the current status of the subject
matter- Khat consumption and trade described “what exists" with
respect to variables or conditions stated. The blend of the
descriptive survey and exploratory designs was also informed by
the need to facilitate the operations of the investigation into better
and efficient coherence with compact entity.
This research targeted the entire Khat consumers’
households and retail traders in Kamukunji constituency. The
study also involved five (5) ward administrators who were the Key
Informants (KI1, KI2, KI3, KI4 and KI5) and four (4) elders, four
(4) religious leaders, three (3) women & three (3) youth
representatives and five (5) county administrators. Since it was
difficult to get a complete official list of Khat chewers in
Kamukunji (sampling frame) and due to cost and accessibility
challenges, this study selected a subset of 335 main consumers, 5
key informants, 19 FGDs and 70 retailers as respondents from the
entire Khat consumers and retail traders in the region through
snowball sampling. The use of snowball sampling in quantitative
technique is premised in Coleman (1958).
To calculate the required sample size for Khat consumers,
this study proposed a 95% confidence on the population
proportion which corresponds to 5% level of significance.
Cochran (1953) formulae was used, which requires the standard
error to be computed by dividing the confidence interval by 1.96
(The value which corresponds to the area under the normal
distribution). Thus the standard error obtained was 5/1.96 = 2.55.
Since there were no previous data on the population of Khat
consumers in Kamukunji, the study assumed the proportion to be
50% since other things being equal. The sample size obtained was
385. To factor in for the non-response, this study inflated the
sample size by 10%, yielding 424.
The sample was distributed proportionately into the five
wards in Kamukunji. Thus the ward with high population had a
bigger portion of the sample. The distribution was based on 2009
census of which Pumwani ward had 17% of the population,
Eastleigh North 20.41%, Eastleigh South 31.26%, Airbase 20.
36% and California 10. 24%. For qualitative data a purposive
sampling technique was used where 5 key informants were
interviewed and three focus group discussions were conducted on
19 individuals. Three focus group discussions were conducted,
where opinion leaders who included religious leaders, scholars,
administrators, women representatives, youth and elders
participated. A structured interview with open ended questions on
socio-economic aspects of Khat consumption and trade within the
region was administered to these opinion leaders.
Piloting was conducted in Kibra constituency, located in
Southland area of Nairobi where the questionnaires were
administered to 30 consumers’ households and 10 retail traders.
The study was done by aligning the questionnaire with the main
theories of this study namely Structural Functionalism and
Conflict Theory as well as the study objectives. Like items with
internal consistency were put together to define various variables.
The researcher listed all questions relating to the study and
submitted them to the supervisors to assess for validity of the
questions.
Family relationship measured in terms of physical insults,
verbal insults, use of threats, violence outside, violence within,
threatens to leave and keeps on blaming reported a reliability
statistic of 0.914 where Cronbach alpha greater than 0.9 is an
excellent Internal consistency.
The researcher applied for a research permit to collect data
from the National Council of Science and Technology. The
questionnaires were hand-delivered, and completed promptly.
Thirty trained research assistants were used of which the
questionnaires were filled while the researcher waited, thereby
providing clarification where necessary. Interview tool or
instrument was administered on the five ward chiefs who
constitutes the key informants to the study. They were assembled
at Sub-county commissioner’s board room and the interview guide
supplied to them where questions were orally advanced to them in
a chronological order. On the other hand, three focus group
discussions on the 19 FGDS grouped in the order of six and
another six and seven individuals were carried out on different
occasions.
To analyze to the quantitative data, the researcher engaged,
at first, instance, in data preparation stages. The stage involved
examination of raw data after collection through carefully scrutiny
while simultaneously carrying out data cleaning and editing. The
responses were assigned number codes for easy entry to the data
base and keyed in electronically. The coding involved organizing
data into limited categories in relation to appropriate research
objectives. Then the data was presented in a systematic organized
unity and order that enabled its easy and objective interpretations
which in turn enhanced it to be subjected to a smooth statistical
treatment.
The Statistical Package for the Social Sciences (SPSS -
Version 20) was used for both descriptive and inferential statistics.
The study applied the three analytical types of Univariate,
bivariate and multivariate analysis in a sequence manner of data
categorization to standardize the accuracy and validity of the
analysis processes to the qualitative data. Qualitative data were
analyzed through the process of coding where common themes
were identified and examined in relation to the context, meaning
and circumstances.
IV. RESULTS
The concern about the Khat consumers’ spouses was
investigated the results presented using figure 1
International Journal of Scientific and Research Publications, Volume 10, Issue 1, January 2020 618
ISSN 2250-3153
http://dx.doi.org/10.29322/IJSRP.10.01.2020.p9793 www.ijsrp.org
Figure 1: Distribution of spouses’ attitude towards Khat
consumption
Most of the Khat consumers (47.16%) believed that their
spouses were comfortable with their behavior, while a sizable
number were not comfortable with the question. Khat
consumption was found to weaken sexual performance while to
some respondents Khat enhanced hallucination and led to
masturbation hence a significant number of divorce cases. More
than half of the respondents claimed that Khat consumption
affected their sleep. The Survey response per gender reported that
eight out of ten males preferred regulation as compared to 75% of
the females who advocated for regulation while others preferred
outlawing. Three out of ten Khat consumers surveyed earned
between 2000-5000 Kenya shillings per month and those who
earned above 20,000 were two in every ten consumers with the
difference being quite significant. The study found a significant
association between marital status and monthly income.
Khat consumers who were single had a much more stable
family relationships compared to married and divorcee while the
females Khat consumers had a weaker family relationships
compared to the males. The younger consumers had a stronger
family relationships compared to their older counterparts while
employed consumers had more stable family relationships
compared to unemployed and those who earned more had more
stable relationship compared to those who earned less. The
explanatory variables which had a negative effect on household
economy were: number of hours spent on Khat per day, number of
years one has been consuming Khat, gender, age and marital
status. There was significant association between income and
marital status and that Khat consumption in Kamukunji
Constituency did not differentiate the consumers’ level of income
and marital status.
Most of the Khat retail traders were aged 40 years and
below and were married with more than one child. Khat retail trade
was found to be more lucrative with two thirds of the males who
sell Khat, consumed it compared to partly thirty percent of females
who retail at the same time consume. Most retailers consume for
leisure, to reduce stress and minimize boredom and to attract
customers. Majority of the Khat traders were not involved in other
forms of trade business since they found Khat retail to be lucrative.
It was found that Khat enhances togetherness even though it is
linked with environmental untidiness, family breakdown and
financial constraints. There was mixed results on the impact of
Khat consumption on sexual performance as shown in Figure 2.
Figure 2: Marital status and sexual performance of Khat
consumers
The claim that Khat enhances sexual performance is still
divided as some support and others oppose. This is corroborated
by the qualitative results from FGDs where some reported that
Khat consumption affect sexual performance while others were of
the contrary.
The study of family life is generally a foundation for policy
formulation aiming at strengthening family stability. The family
constitutes the backbone of every society hence the pattern of use
is a determinant on the impact of Khat consumption on the family
life.
V. CONCLUSION
With regard to spousal relations, a major finding of this
study is that whereas the consumption of Khat has been perceived
to be associated with men’s low levels of sexual interest and
libido, in the study area, it is noted among the majority of the
respondents, especially men that their interest in sex increased
with consumption of Khat. However, there was an interesting
difference where more women observed that Khat consumption
diminishes sexual interest.
Most of the Khat users had a history of Khat use in their
family and the social economic implication associated with Khat
use in Kamukunji Constituency is comparable to other studies
carried out in other parts of the world. There is urgent need to
create awareness on Khat consumption and available treatment
and rehabilitation services for those who are willing to reform and
that schools and religious institutions can be excellent avenues for
information dissemination.
VI. ACKNOWLEDGEMENT
Much gratitude to Umma University - Kenya which
funded the study.
To Mount Kenya University fraternity, the Dean of School
of Social Sciences and the HOD, Social and Development Studies,
thank you for the support.
International Journal of Scientific and Research Publications, Volume 10, Issue 1, January 2020 619
ISSN 2250-3153
http://dx.doi.org/10.29322/IJSRP.10.01.2020.p9793 www.ijsrp.org
Finally, I thank all friends and support personnel who
have contributed to the success of this study.
REFERENCES
[1] Aden, A., Ndolo, E. & Cludia, L. (2006). Socio-economic effects of Khat chewing in North Eastern Kenya. East African Medical Journal 83: 69-73.
[2] Anderson, D. & Carrier, N. (2009) Khat in Colonial Kenya. A history of prohibition and control Journal of Africa History (5)377-397
[3] Anderson, D.M., Beckerleg, S., Hailu, D., & Klein, A. (2007). The Khat Controversy: Stimulating the drugs debate. Oxford, Berg.
[4] Andualem, M. (2002). The Prevalence and Socio- Demographic Characteristics of Khat Chewing in JimmaTown, South Western Ethiopian.Journal of Health (12)2
[5] Berkerleg, S. (2009). Khat chewing as a new Ugandan leisure activity. Journal of east African studies Vol 3(1) 42-54
[6] Berkerleg, S. (2010). Ethnic Identity and Development: Khat and Social Change in Africa. East Africa Sociology Journal, (3):158-203
[7] Best, J.N. (1992). Research in education. New Jersey: Prentice Hall, USA
[8] Cochran, W. G (1953) Sampling Techniques.New York: John Wiley & Sons, Inc.
[9] Coleman, J.S. (1958). Relationship analysis: the study of social organization with survey methods Human. Organization, 16:28-36
[10] Creswell, J. W., & Plano, C. (2011). Designing and conducting mixed methods Research(2nded.). Thousand Oaks, CA: Sage
[11] Creswell, J. W. (2009). Research design: Qualitative, Quantitative, and Mixed Methods Approach (3rd Ed.). Thousand Oaks, CA: Sage.
[12] Gately, L. (2008). Drink: A Cultural History of Alcohol. New York: Penguin Publishing.
[13] Halbach, H. (1972) Medical aspects of the chewing Khat leaves. Bull World Health Organization 47(1): 21–29.
[14] Hakim, L.Y. (2002) Influence of Khat on seminal fluid among presumed infertile couples. East African Medical Journal (9), 22-28.
[15] Jamal Al-Shammi (2008). Khat chewing in Yemen: turning over a new leaf. Bulletin of the World Health Organization (8) 10: 737-816
[16] Jibril, M. &Yusuf, I. (2012). Diverse effects of Khat on Somali families. Copenhagen: International Social Work and Social Problems.
[17] Kennedy, J.G., Teague, J., Rokaw, W. & Cooney, E. (1983). A medical evaluation of the use of qat in North Yemen. Social Science and Medicine 17: 783-793
[18] Kennedy, J. K. (1987). The Flower of Paradise: The Institutionalized Use of the Drug Qat-in North Yemen. Boston: D-Redial Publishing Company.
[19] Kenya National Bureau of Statistics (2010). The 2009, Kenya Population and Housing Census “Counting Our People for the Implementation of Vision 2030” Volume IC Population Distribution by Age, Sex and Administrative Unit. Nairobi: Government printers.
[20] Mungai, M. (1983). Miraa: the hidden dangers. Daily Nairobi: February 10th Pg. 10.
[21] Mwenda, J., Arimi, M., Kyama, M., & Langat, D. (2003) Effects of Khat (Catha edulis) Consumption on Reproductive Functions: A review East Africa Medical Journal 80(6): 318-23.
[22] NACADA (2007) rapid situation assessmentofdrug abuse in Kenya, Nairobi NACADA.
[23] NACOSTI (1996). A Report of National Council for Science and Technology. NCST NO. 40 (June 1996).
[24] Shoham, D., Hammond, R., Rahmandad, H., Wang, Y.& Hovmand. P. (2015). Modeling Social Norms and Social Influence in Obesity. Current Epidemiology Reports 2 (1): 71-79
[25] Stark, R. (2007). Sociology (10th ed.). New York: Thomas Wadsworth
[26] Stefan, J. & Mathew, B. (2005). Khat chewing an emerging drug concern in Australia and New Zealand Journal of Psychiatry 39 (9)842-843
[27] Strauss, M, Sherry, L., Sunan, B. & David, B. (1996). The Revised Conflict Tactics Scales; Development and Preliminary Psychometric Data: Journal of Family Issues (17) 283-316
[28] Tashakkori, A. &Teddlie, C. (2003). Handbook of Mixed Methods in Social & Behavioral Research. Thousand Oaks: Sage.
[29] Tekalign, D. Andualem, M. Markos, T. (2011). Socio-demographic characteristic of Khat (Catha Edulis) chewing and its prevalence in Jimma city. Ethiopia.J. Health Sci. 2011 March; 21 (1):37-45.
[30] Telake, M. (2009). The Prevalence and risk factors of Khat chewing among in school and out of school, youth Gonder town. Journal of Health Development, 19(2): 240-256.
[31] Terfera, T., Kristen, J., & Perret, S. (2004). Incentives, farmers’ response and policy dilemma: a case study on expansion of Khat production as a cash crop in the eastern highlands of Ethiopia. Journal of Ethiopian Development Studies,1(2), 206-220
[32] Thuranira, R. M. (2011) Effects of Khat Use on Males’ Performance of Their Urban Household Roles in Eastleigh Estate-Nairobi City. A Research Project Submitted in Partial Fulfillment of the Requirement of the Degree of Master of Arts in Sociology (Counseling). University of Nairobi UoN Repository
[33] Turner, J. (1978). The Structure of Social Theory. Homewood, III. Dorsey.
[34] Turner, J &Maryanski, A. (1979). Functionalism. Menlo Pack Cliff: Benjamin/ Cumming.
[35] Wabel, N. (2011) Psychopharmacological aspects of Catha Edulies (Khat) and consequences of long term use: A review. J. Mood Disorders 2011; 1 (4): 187-94.
[36] Wanja, E. (2010). Challenges Principles face in Enhancing Students Discipline in Secondary Schools in Tigania District, Kenya
[37] White, H., Labouvie, E. &Papadaratsakis, V. (2005). Changes in substance use during the transition to adulthood: A comparison of college students and their non-college age
AUTHORS
First Author: Rashid Ali Omar, PhD student in the School of
Social Sciences - Mount Kenya University, P.O. Box 342, 01000,
Thika, Email: [email protected] Mobile Phone: +254 720 955
752
Second Author: Prof. Kennedy K. Mutundu, Associate Professor,
School of Social Sciences - Mount Kenya University, P.O. Box
342, 01000, Thika
Third Author: Prof. Felix N. Kioli, Associate Professor, School
of Humanities and Social Sciences - South Eastern Kenya
University
Fourth Author: Dr. Lucy W. Maina, Lecturer, School of
Security, Diplomacy and Peace Studies - Kenyatta University
Correspondence Author: Rashid Ali Omar, P.O. Box 342,
01000, Thika, Email: [email protected] Mobile Phone: +254
720 955 752
International Journal of Scientific and Research Publications, Volume 10, Issue 1, January 2020 620
ISSN 2250-3153
http://dx.doi.org/10.29322/IJSRP.10.01.2020.p9794 www.ijsrp.org
Toxicological and Histological Studies of the Ethyl
Acetate, Aqueous and N-Butanol Fractions of the Leaf of
Combretum Molle (R.Br. Ex. G. Don) to Wistar Rats
D. Kulawe1*, Z. A. Abubakar2 and J. S. Hena3
1Department of Biological Sciences, Gombe State University, Gombe, Nigeria 2Department of Biological Sciences, Gombe State University, Gombe, Nigeria
3Nigeria. Marine Environment Management Unit, Nigerian Maritime Administration and Safety Agency, Abuja Office, Nigeria.
DOI: 10.29322/IJSRP.10.01.2020.p9794
http://dx.doi.org/10.29322/IJSRP.10.01.2020.p9794
Abstract- This work was carried out with the aim of determining
the acute toxicity and histology of the aqueous, n-butanol and the
ethyl-acetate fractions of the leaves of Combretum molle to Wistar
rats. Ethanol was used as solvent for extraction, after which
differential fractionization was carried out using distilled water,
ethyl acetate and n-butanol. The limit test at 5000 mg/kg of the
Organization for Economic Cooperation and Development
(OECD) guidelines were used for the study. In the acute
toxicological investigation, there was no mortality in the
experimental animals after orally administering the fractions of C.
molle 5000 mg/kg indicating that the LD50 was above 5000 mg/kg.
There was no histological alterations or changes at the extract dose
of 5000 mg/kg body weight in the kidney organs of rats in the
control group, but all the other organs from the fractions tested
displayed certain observed alterations. Tubular vacuolation
(TVN), Lymphocyte hyperplasia (LH), Glomerular necrosis (GN),
Plaques formation (P), Tubular necrosis (TN) and Tubular
distortions (TD) were observed in the kidneys. There was no
histological alterations or changes at the extract dose of 5000
mg/kg body weight in the internal organs of rats in the control
group and in the liver of group VI, but all the other organs from
the fractions tested displayed certain observed alterations.
Vascular congestion (VC), vascular congestion with slight
necrosis (VCN) and hepatocellular necrosis (HN) were observed
in the livers of all the groups administered the fractions.
Index Terms- Combretum molle, plant fractions, acute toxicity,
Wistar rats,
I. INTRODUCTION
housands of secondary plant products have been identified
and it is estimated that thousands of these compounds still
exist (Koehn and Carter, 2005). Since secondary metabolites from
plants have been elaborated within living systems, they are often
perceived as showing more “potentials and are biologically non-
toxic than totally synthetic molecules” making most of them, good
candidates for further drug development (Koehn and Carter,
2005). According to Alaribe (2008) majority of Nigerian homes,
maintain some sort of private family traditional medicine
practitioner. Existing data and contemporary researchers seem to
authenticate the assumption for general health improvement of the
masses by traditional healers. Ethnobotany is a preliminary
method of research, suitable for gathering information on the use
of plants. It has been proven, time and time again, that the medical
knowledge handed down by the common people constitutes
sources of information useful for scientific research and that many
plants utilized exclusively in popular tradition, when exposed
under scientific investigation, have been found to be useful for
different sectors in the industry, therefore science and tradition
have a strong connection between them. Science in fact often has
traditional origins (Lentini, 2000). The use of plants in the
tropical and subtropical regions is diversified and most of the uses
are for medicine, source of food, clothing and shelter. However,
the medicinal uses of plants are rapidly declining among the
present generation of local people because of modernization and
civilization (Cox, 2005).
II. MATERIALS AND METHODS
Source and preparation of plant materials
The plant leaves were collected from neighboring
communities near ABU dam, in Samaru, Zaria (latitude 11.07o N,
longitude 7.73o E and altitude 613meters), Nigeria. These were
brought and identified by a Taxonomist with voucher number
900191 at the Herbarium unit of the Department of Biological
Sciences, Ahmadu Bello University Zaria. The plant parts were
air-dried for two weeks at room temperature (25oC) in the
laboratory and then ground to powder.
Extraction procedures
The ground plant parts were extracted at the Department of
Pharmacognosy, Faculty of Pharmaceutical Sciences, Ahmadu
Bello University Zaria, following the methods of Sofowora
(2006).
Preparation of Ethanol Extraction of C. molle
Approximately 400 g of the dried leaves of C. molle were
extracted with 10 litres of 80% (v/v) ethanol by maceration at
(25oC) for 3days. The total mixture was strained and filtered. The
filtrate was concentrated to dryness on a water bath at 100o C to
obtain the dry extract after which was stored at -20ºC for further
studies.
T

International Journal of Scientific and Research Publications, Volume 10, Issue 1, January 2020 621
ISSN 2250-3153
http://dx.doi.org/10.29322/IJSRP.10.01.2020.p9794 www.ijsrp.org
Differential Fractionation of the Ethanol Extract of C. molle in
Different Solvents
The dried ethanol extract obtained from the leaves of C.
molle (50 g) were each suspended in 1 litre of distilled water and
partitioned in sequence with ethyl acetate (1 litre), and n-butanol
(1 litre). The different solvent fractions were concentrated on a
water bath at 100o C to obtain the dry extract after which was
stored at -20ºC.
Acute Oral Toxicological Evaluation of the fractions of C.
molle
This study was carried out according to the Organization for
Economic Cooperation and Development (OECD) guidelines
(OECD, 2000). Acute oral toxicity refers to those adverse effects
occurring following oral administration of a single dose of a
substance, or multiple doses given within 24 hours. This is a
measure of the interaction of induced substance with biomolecules
after a single administration within fourteen days
Limit Test at 5000 mg/kg for the Experimental Rats study
The limit test is primarily used in situations where the
experimenter has information indicating that the test plant is likely
to be nontoxic. Since there was prior information on the use of the
test plant (Wickens, 2000), therefore the limit test was used.
Animals (Wistar rats)
A total of 12 female albino rats of Wistar strain weighing about
230 – 280 g were obtained from the Animal house, Department of
Pharmacology and Therapeutic, Faculty of Pharmaceutical
Sciences, Ahmadu Bello University, Zaria, Nigeria. They were fed
a standard rat pellet diet and water was provided and maintained
under standard laboratory conditions (Temperature 21-24 °C,
relative humidity 40 - 60%).
Grouping and Administration of plant fractions
A total of 12 female albino Wistar rats were used for the acute
toxicity study. The test substance was administered orally, in a
single dose by gavage intubation cannula. The animals were
divided in to 4 groups of 3 each. Group I rats were given ethyl-
acetate leaf fraction. Group II rats were given n-butanol leaf
fraction. Group III rats were given aqueous leaf fraction. Group
IV served as normal healthy control. The weight of experimental
rats was measured and recorded on Days 1, 7 and 14 respectively.
The histological parameters of the experimental animals were
evaluated after 14 days. The Wistar rats were subjected to fasting
(for food but not water over-night) prior to dosing. Following the
period of fasting, they were weighed, and the test substance
administered. After the substance was administered, food was not
given to the rats until after 3-4 hours. The plant fractions at fixed
doses of 5000 mg/kg body weight were administered to 3 groups,
each containing 3 rats which was done in two stages. A single rat
each from the first 3 groups were administered the plant fractions
(5000mg/kg) and observed for 24 hours, after which all of them
survived. The 2 remaining rats were also administered the dose
and were observed during the first 30 minutes, periodically for 4
hours, then hourly the first 24 hours and daily thereafter, for a total
of 14 days. All observations were systematically recorded, with
individual records being maintained for each animal.
Histological studies of the kidneys and livers
The experimental animals were sacrificed (chloroform as
anesthesia) and the kidneys and livers were excised and taken to
the Department of Human Anatomy, Faculty of Medical Sciences,
Ahmadu Bello University, Zaria, Nigeria for histological studies.
The various organs were sliced and placed in embedded tissue
baskets. Thereafter, they were fixed with 10 % formalin for 48
hours and afterwards dehydrated with methanol (70, 90 and 100
%) at different concentration in ascending concentration and
different time to remove water from the tissues. Thereafter,
clearing with toluene was done to remove alcohol and prepare the
tissue for waxing. Embedding was done using paraffin wax by
impregnating cassettes with molten wax at 60o C for 3 h. Slicing
was done at 5 microns using a Leica microtome (model no:
RM2125RTS). The slide was dried for 20 min on hot plate.
Afterwards, dewaxing and hydration were done using xylene and
methanol (70, 90 and 100%) at different concentration in
ascending concentration and different time to remove water from
the tissues. Thereafter, staining was done with Cole’s hematoxylin
for 10 min to stain the nucleus after which eosin was used to stain
the cytoplasm for 3 min. Dehydration was once again carried out
in alcohol and alcohol cleared with xylene. A mounting medium,
dibutyl phthalate xylene (DPX) was placed on the tissue section
and they were viewed using the microscope.
III. RESULTS AND DISCUSSION
Table 1. Average body weight of the rats after oral
administration of the fractions of C. molle measured in grams
(g), (Mean ±SE)
GROUPS
(fractions of
extracts)
Day 0 Day 7 Day 14
I (ethyl-acetate
leaf)
247±1.0 253±1.0 261±1.0
II (n-butanol leaf) 235±1.0 237±1.0 241±1.0
III (aqueous leaf) 256±1.0 260±1.0 263±1.0
V (control) 229±1.0 234±1.0 236±1.0
Mean body weight ± SE
Acute toxicological evaluation
The body weights of all tested groups increased
progressively throughout the duration of the experiment (Table 1).
The effect of the extract in causing drowsiness in all the treated
groups was observed for the first hour after administering the
fractions of C. molle, compared with control which showed no
drowsiness. No mortality was recorded for any treated groups
throughout the duration of the experiment. Since the treatment did
not result in latent toxicity, the LD50 was therefore estimated to be
above 5000 mg/kg.
Histopathology of the kidneys of the animals
There was no histological alterations or changes at the
extract dose of 5000 mg/kg body weight in the kidney organs of

International Journal of Scientific and Research Publications, Volume 10, Issue 1, January 2020 622
ISSN 2250-3153
http://dx.doi.org/10.29322/IJSRP.10.01.2020.p9794 www.ijsrp.org
rats in the control group, but all the other organs from the fractions
tested displayed certain observed alterations. Tubular vacuolation
(TVN), Lymphocyte hyperplasia (LH), Glomerular necrosis (GN),
Plaques formation (P), Tubular necrosis (TN) and Tubular
distortions (TD) were observed in the kidneys of groups I-III
(Plates I---III).
Histopathology of the liver of the animals
There was no histological alterations or changes at the
extract dose of 5000 mg/kg body weight in the internal organs of
rats in the control group and in the liver of group III, but all the
other organs from the fractions tested displayed certain observed
alterations. Vascular congestion (VC), vascular congestion with
slight necrosis (VCN) and hepatocellular necrosis (HN) were
observed in the livers of groups I--III (Plates IV--VI).
A
B
Plate I: (A) Photomicrograph of the Rat Kidney under control treatment showing normal tubules and glomerulus, compared with; (B)
Orally administered ethyl-acetate leaf fraction above showing moderate glomerular distortion (GD) and tubular necrosis (TN).
(Magnification, × 400).
Urinary space
Glomerulus
Bowman's capsule
Tubular Necrosis
Glomerular distortion

International Journal of Scientific and Research Publications, Volume 10, Issue 1, January 2020 623
ISSN 2250-3153
http://dx.doi.org/10.29322/IJSRP.10.01.2020.p9794 www.ijsrp.org
A
B
Plate II: (A) Photomicrograph of the Rat Kidney under control treatment showing normal tubules and glomerulus, compared with; (B)
Orally administered n-butanol leaf fraction above showing plaques formation (P) and slight tubular distortion (TD). (Magnification, ×
400).
A
Urinary space Bowman's capsule
Glomerulus
Tubular
Distortion
Plaque Urinary space
Bowman's capsule
Glomerulus
Urinary space

International Journal of Scientific and Research Publications, Volume 10, Issue 1, January 2020 624
ISSN 2250-3153
http://dx.doi.org/10.29322/IJSRP.10.01.2020.p9794 www.ijsrp.org
B
Plate III: (A) Photomicrograph of the Rat Kidney under control treatment showing normal tubules and glomerulus compared with;
(B) Orally administered aqueous leaf fraction above showing plaque formation (P), with slight tubular distortion (TD). (Magnification,
× 400).
A
B
Plate IV: (A) Photomicrograph of the Rat Liver of control showing normal hepatocytes, compared with; (B) Orally administered ethyl-
acetate leaf fraction above shows vascular congestion (VC). (Magnification, × 400).
Plaque
Glomerulus
Tubular distortion
Urinary space
Central vein
Hepatocytes
Sinusoids
Vascular Congestion
Central vein
Hepatocyte
s
Sinusoids

International Journal of Scientific and Research Publications, Volume 10, Issue 1, January 2020 625
ISSN 2250-3153
http://dx.doi.org/10.29322/IJSRP.10.01.2020.p9794 www.ijsrp.org
A
B
Plate V: (A) Photomicrograph of the Rat Liver of control showing normal hepatocytes compared with; (B) Orally administered N-
butanol leaf fraction above also showing normal feature. (Magnification, × 400).
A
Central vein
Sinusoids
Hepatocytes
Hepatocytes
Central vein
Sinusoids
Central vein
Hepatocytes
Sinusoids

International Journal of Scientific and Research Publications, Volume 10, Issue 1, January 2020 626
ISSN 2250-3153
http://dx.doi.org/10.29322/IJSRP.10.01.2020.p9794 www.ijsrp.org
B
Plate VI: (A) Photomicrograph of the Rat Liver of control showing normal hepatocytes compared with; (B) Orally Administered 5000
mg/kg of aqueous leaf fraction also showing normal feature. (Magnification, × 400).
In the acute toxicological investigation, there was no
mortality in the experimental animals at all treatment doses of
5000 mg/kg body weight. The acute toxicity did not result in any
mortality therefore the mean lethal dose (LD50) cannot be
determined, rather estimated that it is above 5000 mg/kg. There
were no signs of toxicity effects such as change in skin color,
behavioral pattern nor diarrhea. This finding suggests that, the
fractions at the limit dose tested are nontoxic and safe in oral
formation. According to the chemical labeling and classification
of acute systemic toxicity recommended by OECD, (2000) the
fractions of Combretum molle were assigned class 5 status (LD50
> 5000 mg/kg) which is the lowest toxicity class. This is in line
with the investigation of David et al. (2015) in the study of the
toxicological evaluation of aqueous and acetone extracts of
Combretum molle leaves in Wistar Rats. They observed that the
limit dose of 2000 mg/kg did not cause any mortality or signs of
acute toxicity in the rats tested during the observation period.
Similarly, Kamo et al. (2015) studied the acute and subacute
toxicity effects of hydro - alcoholic extract of Terminalia mantaly.
They also observed that, the limit dose of 5000 mg/kg did not
cause any mortality or signs of acute toxicity in the mice tested
during the observation period. Similarly, Dodehe et al. (2012)
investigated the acute and sub-acute toxic study of aqueous leaf
extract of Combretum Molle in Wistar rats. They observed that
the limit dose of 8000 mg/kg did not cause any mortality or signs
of acute toxicity in the mice tested during the observation period.
Also, Oyewo et al. (2012) investigated the effects of aqueous
extract of Citrullus lanatus on the histology of the kidney of adult
Wistar Rats. The aqueous extract of Citrullus lanatus was given
once a day to the animals for 27 days of which there was no
mortality recorded. The kidney administered leaf ethyl-acetate had
slight hyperplasia, which is similar to the work of David et al.
(2015) who studied the toxicological effects of aqueous and
acetone extracts of Combretum molle twigs in Wistar rats. They
observed hepatotoxicity and mesengial hyperplasia in the livers
and kidneys. This is different from the result of Oyewo, et al.
(2012) who did not record any histological distortion of the kidney
after the administration of the extract. This could also be as a
result of different concentrations used for the test. There were no
histopathological alterations observed from the liver administered
aqueous leaf and leaf n-butanol fractions. This is similar to the
work of Zaza et al. (2016) investigated the oral toxicity of the X42
fractions of Terminalia ivorensis, observed no histological
distortion of the liver.
IV. CONCLUSION
There was no mortality observed for all the leaf fractions
tested on the Wistar rats. This finding suggests that, the fractions
at the limit dose of 5000 mg/kg body weight tested are nontoxic
and safe in oral formation. The histological investigation,
however, showed certain alterations in the cellular anatomy of the
liver and kidney. This alterations are biomarkers of toxicity and
cellular damage to the liver and kidney. Caution therefore should
be taken in the continuous intake of C. molle at high
concentrations, since it may result to permanent damage of tissues.
REFERENCES
[1] Alaribe, S.I. (2008). A Survey of the Importance and Problems of Traditional Health care medicine, a case study of Ezinihitte Mbaise L.G.A. Imo State. Unpublished B.Sc. project, A.I.F.C.E. Owerri, Imo State.
[2] Cox, P. A. (2005). The seven pillars of ethnomedical wisdom. Ethnobotany, 17, 24-34.
[3] David, M., Sylvie, L.W., Marius, M., Sylviane, L.K.P., Oulianovie, K.G., Legentil, M.N. and Albert, K. (2015). Toxicological Evaluation of Aqueous and Acetone Extracts of Combretum molle Twigs in Wistar Rats.Electronic Journal of Biology. 11(2):33-45
[4] Dodehe, Y., Rita, B., Bernard, N.D., Chonta, T. and Jean David, N. (2012). Acute and Subacute Toxic Study of Aqueous Leaf Extract of Combretum molle. Tropical Journal of Pharmaceutical Research, 11 (2): 217-223.
[5] Kamo, I. L. B. E., Tra, B.I.O., Gnahoue, G., Djyh, B. N., Yeo, D., Djaman, A. J. and N’Guessan, J. D. (2015). Assessment of toxic effects of hydro-alcoholic extract of Terminalia mantaly h. Perrier (Combretaceae). The Pharma Innovation Journal, 3(12): 34-40
[6] Koehn, F.E. and Carter,G.T.(2005). The evolving role of natural products in drug discovery. Natural Reviews, Drug Discovery, 4: 206-220.
[7] Lentini, F. (2000). The role of ethnobotanics in scientific research; State of ethnobotanical knowledge in Sicily. Fitoterapia. 71: 583 – 588.
[8] OECD (2000). Guidance Document on Acute Oral Toxicity. Environmental Health and Safety Monograph Series on Testing and Assessment No.24.
[9] Oyewo, O.O., Onyije, F.M., Akintunde, O.W. and Ashamu, E.A. (2012). Effects of Aqueous Extract of Citrullus lanatus on the Histology of the Kidney of Adult Wistar Rats. World Applied Sciences Journal, 17 (9): 433-446
[10] Sofowora, A. (2006). Medical Plants and Traditional Medicine in Africa.(2ndedition). Spectrum books Ltd, Ibadan. Nigeria. PP. 150 –153.
Central vein
Sinusoids
Hepatocytes

International Journal of Scientific and Research Publications, Volume 10, Issue 1, January 2020 627
ISSN 2250-3153
http://dx.doi.org/10.29322/IJSRP.10.01.2020.p9794 www.ijsrp.org
[11] Wickens, G. E., (2000). Flora of Tropical East Africa. Combretaceae. East African community. Royal Botanic gardens, Kew. PP 99
[12] Zaza, H. V., Tra, B. O., Gnahoué, G., Kouangbé, M. A., Koffi, A. M. and N’Guessan J. D. (2016). Oral Toxicity Study of X42 Fraction of Terminalia ivorensis A.Chev. (Combretaceae) in Rats. International Journal of Pharmacognosy and Phytochemical Research, 8(12): 1913-1919
AUTHORS
First Author – D. Kulawe, Department of Biological Sciences,
Gombe State University, Gombe, Nigeria
Second Author – Z. A. Abubakar, Department of Biological
Sciences, Gombe State University, Gombe, Nigeria
Third Author – J. S. Hena, Nigeria. Marine Environment
Management Unit, Nigerian Maritime Administration and Safety
Agency, Abuja Office, Nigeria.
Corresponding author e-mail: [email protected]
08023169985
International Journal of Scientific and Research Publications, Volume 10, Issue 1, January 2020 628
ISSN 2250-3153
http://dx.doi.org/10.29322/IJSRP.10.01.2020.p9795 www.ijsrp.org
Mobility of charge carriers in the novel green organic
semiconductor, Iodine doped Cis 1,4 polyisoprene
(Natural Rubber) using SCLC method
Jayan Manuvel, P. Predeep
Laboratory for Molecular Photonics and Electronics (LAMP), Department of Physics, National Institute of Technology Calicut, Kerala, India-673601
DOI: 10.29322/IJSRP.10.01.2020.p9795
http://dx.doi.org/10.29322/IJSRP.10.01.2020.p9795
Abstract- Advantages like low temperature processing, cost, and
flexibility make organic semiconductors an ideal choice for the
new generation electronic devices ranging from LEDs, Solar cells
to RFID tags. Many of these devices, especially OLEDs are
already conqured the consumer electronics market in a large scale.
Ironically the potential for large scale production of these
polymeric devices are posing a threat to the emission issues and
waste disposal. This warrants the development of green organic
semiconductors. It has been shown that natural rubber (cis 1,4
polyisoprene) which is a green and natural polymer abundantly
available in tropical areas like Asia can be made into
semiconducting by doping process, and can be used in organic
electronic devices. However the important parameter of mobility
of charge transport in iodine doped natural rubber has yet to be
explored or reported. In this paper the mobility of hole transport
in iodine doped natural rubber has been reported for the first time
using SCLC method. Interesting results are obtained which
confirm the potential of iodine doped natural rubber to be an
alternative low cost and green organic semiconductor.
Index Terms- Organic electronics, Green organic semiconductors,
Mobility by SCLC method.
I. INTRODUCTION
he recent trends in organic electronics focus on the synthesis
of new semiconducting materials from green polymers. Use
of green organic materials in electronic devices can help to
overcome the possibility of organic electronic waste disposal [1]
to a great extent. Further the organic semiconducting materials
presently used for devices fabrication are of high cost and
therefore development of low-cost indigenous materials are
essential for organic device commercialization. Natural polymers
having large number of double bonds present in its polymer
backbone are shown to be [2] transformed to conducting polymers
by suitable doping agents. There are many chemical and physical
methods reported [2][3][4] for the synthesis of conducting
polymers from natural materials. Among these, doping is a facile
method for the synthesis of organic semi conducting materials.
cis-1, 4 polyisoprene (Natural rubber), a green polymer,
having a typical non-conjugated structure[2] was shown to be a
potential natural polymer to form conjugated structure because of
the presence of large number of double bonds in its polymer chain.
The conjugation in natural rubber can be made by doping with [3]
suitable electron accepting materials, which facilitates charge
transfer through the polymer chain. M Thakur reported [2] that
natural rubber on doping with iodine, its conductivity gets raised
by 10 orders of magnitude. Liming Dai et al. clearly explained
[5][3] the mechanism of iodine doping in polyisoprene with the
formation of charge carrier complexes. As per this, on doping
natural rubber with iodine, as a first step conjugation is induced
in the polymer chain followed by the formation of cationic iodine
complexes (I3- and I5-). The charge transfer thus occurs in the
polymer chain by double bond shifting. Sreeja et al. optimized [6]
the molar ratio for better conductivity Fassena et al.[7] and Shiju
et al.[8][9] studied [10][11] the electronic parameters like HOMO
LUMO and application of these complexes in organic electronic
devices like, OFET, schottky diode etc. Even though a number of
characteristics like conductivity, HOMO, LUMO, Bandgap, etc.
of conducting cis-1,4 polyisoprene have been reported, there is no
report available on the mobility of charge carriers in this green
semiconductor. In this context this paper reports for the first time,
the evaluation of mobility charge carriers in conducting natural
rubber using space charge limited current (SCLC) method.
II. EXPERIMENTAL
1.1 Materials
cis 1,4 polyisoprene, MoO3 and Iodine are purchased from
Sigma Aldrich. Polyisoprene is used without any purification and
iodine is re-sublimated before the synthesis. The ITO substrate
with surface resistance 10-12 Ω /cm2 is also purchased from
Sigma Aldrich and is used as substrate for the test device
fabrication. The solvent, Toluene (research grade) is procured
from Merck and used after proper distillation. Aluminum slugs
from Sigma are used for depositing cathode electrode for the test
device.
1.2 Synthesis of Iodine doped Natural Rubber
The mixture of polyisoprene and iodine purified by
distilling with toluene in the molar ratio, given by, [C=C] : [I2] =
40:1. 10.73 mg of polyisoprene and 1 mg of iodine are taken in 1
ml of distilled toluene for the doping process. The prepared
samples are then sealed in amber vial and stirred for 150 hours
continuously for doping reaction to complete. The color of the
solution is seen to be gradually changing from purple to dark
T
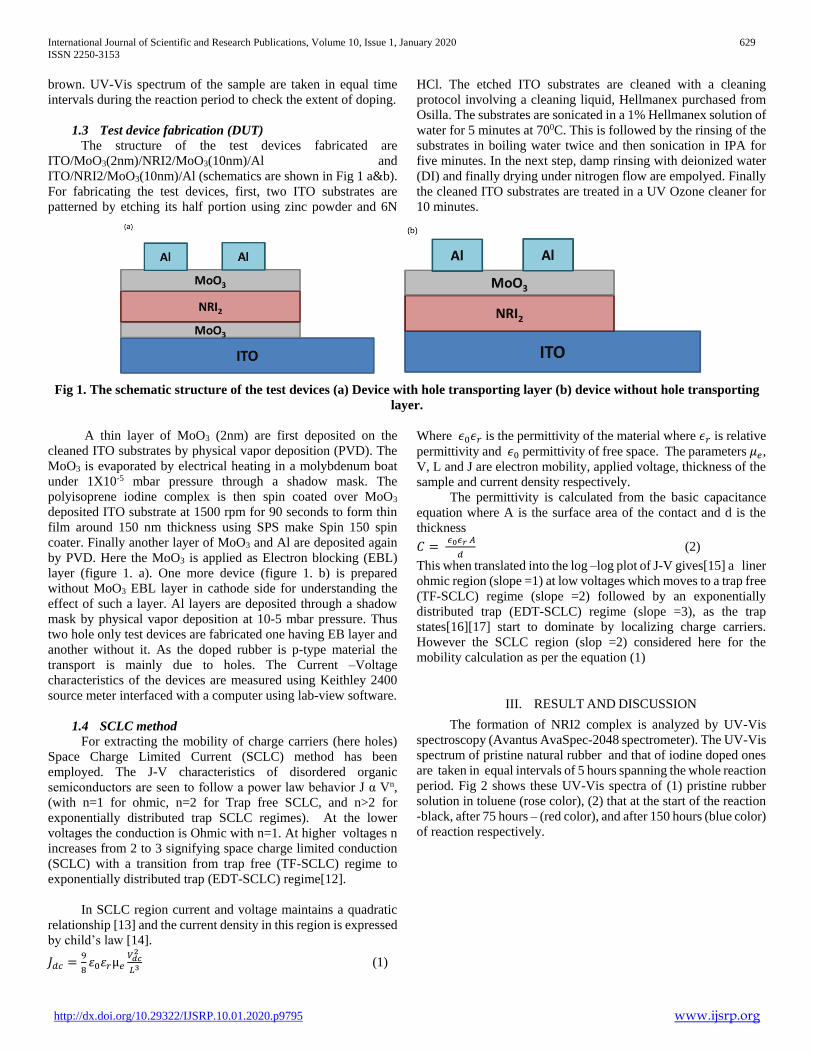
International Journal of Scientific and Research Publications, Volume 10, Issue 1, January 2020 629
ISSN 2250-3153
http://dx.doi.org/10.29322/IJSRP.10.01.2020.p9795 www.ijsrp.org
brown. UV-Vis spectrum of the sample are taken in equal time
intervals during the reaction period to check the extent of doping.
1.3 Test device fabrication (DUT)
The structure of the test devices fabricated are
ITO/MoO3(2nm)/NRI2/MoO3(10nm)/Al and
ITO/NRI2/MoO3(10nm)/Al (schematics are shown in Fig 1 a&b).
For fabricating the test devices, first, two ITO substrates are
patterned by etching its half portion using zinc powder and 6N
HCl. The etched ITO substrates are cleaned with a cleaning
protocol involving a cleaning liquid, Hellmanex purchased from
Osilla. The substrates are sonicated in a 1% Hellmanex solution of
water for 5 minutes at 700C. This is followed by the rinsing of the
substrates in boiling water twice and then sonication in IPA for
five minutes. In the next step, damp rinsing with deionized water
(DI) and finally drying under nitrogen flow are empolyed. Finally
the cleaned ITO substrates are treated in a UV Ozone cleaner for
10 minutes.
Fig 1. The schematic structure of the test devices (a) Device with hole transporting layer (b) device without hole transporting
layer.
A thin layer of MoO3 (2nm) are first deposited on the
cleaned ITO substrates by physical vapor deposition (PVD). The
MoO3 is evaporated by electrical heating in a molybdenum boat
under 1X10⁻⁵ mbar pressure through a shadow mask. The
polyisoprene iodine complex is then spin coated over MoO3
deposited ITO substrate at 1500 rpm for 90 seconds to form thin
film around 150 nm thickness using SPS make Spin 150 spin
coater. Finally another layer of MoO3 and Al are deposited again
by PVD. Here the MoO3 is applied as Electron blocking (EBL)
layer (figure 1. a). One more device (figure 1. b) is prepared
without MoO3 EBL layer in cathode side for understanding the
effect of such a layer. Al layers are deposited through a shadow
mask by physical vapor deposition at 10-5 mbar pressure. Thus
two hole only test devices are fabricated one having EB layer and
another without it. As the doped rubber is p-type material the
transport is mainly due to holes. The Current –Voltage
characteristics of the devices are measured using Keithley 2400
source meter interfaced with a computer using lab-view software.
1.4 SCLC method
For extracting the mobility of charge carriers (here holes)
Space Charge Limited Current (SCLC) method has been
employed. The J-V characteristics of disordered organic
semiconductors are seen to follow a power law behavior J α Vn,
(with n=1 for ohmic, n=2 for Trap free SCLC, and n>2 for
exponentially distributed trap SCLC regimes). At the lower
voltages the conduction is Ohmic with n=1. At higher voltages n
increases from 2 to 3 signifying space charge limited conduction
(SCLC) with a transition from trap free (TF-SCLC) regime to
exponentially distributed trap (EDT-SCLC) regime[12].
In SCLC region current and voltage maintains a quadratic
relationship [13] and the current density in this region is expressed
by child’s law [14].
𝐽𝑑𝑐 =9
8𝜀0𝜀𝑟µ𝑒
𝑉𝑑𝑐2
𝐿3 (1)
Where 𝜖0𝜖𝑟 is the permittivity of the material where 𝜖𝑟 is relative
permittivity and 𝜖0 permittivity of free space. The parameters 𝜇𝑒,
V, L and J are electron mobility, applied voltage, thickness of the
sample and current density respectively.
The permittivity is calculated from the basic capacitance
equation where A is the surface area of the contact and d is the
thickness
𝐶 = 𝜖0𝜖𝑟 𝐴
𝑑 (2)
This when translated into the log –log plot of J-V gives[15] a liner
ohmic region (slope =1) at low voltages which moves to a trap free
(TF-SCLC) regime (slope =2) followed by an exponentially
distributed trap (EDT-SCLC) regime (slope =3), as the trap
states[16][17] start to dominate by localizing charge carriers.
However the SCLC region (slop =2) considered here for the
mobility calculation as per the equation (1)
III. RESULT AND DISCUSSION
The formation of NRI2 complex is analyzed by UV-Vis
spectroscopy (Avantus AvaSpec-2048 spectrometer). The UV-Vis
spectrum of pristine natural rubber and that of iodine doped ones
are taken in equal intervals of 5 hours spanning the whole reaction
period. Fig 2 shows these UV-Vis spectra of (1) pristine rubber
solution in toluene (rose color), (2) that at the start of the reaction
-black, after 75 hours – (red color), and after 150 hours (blue color)
of reaction respectively.
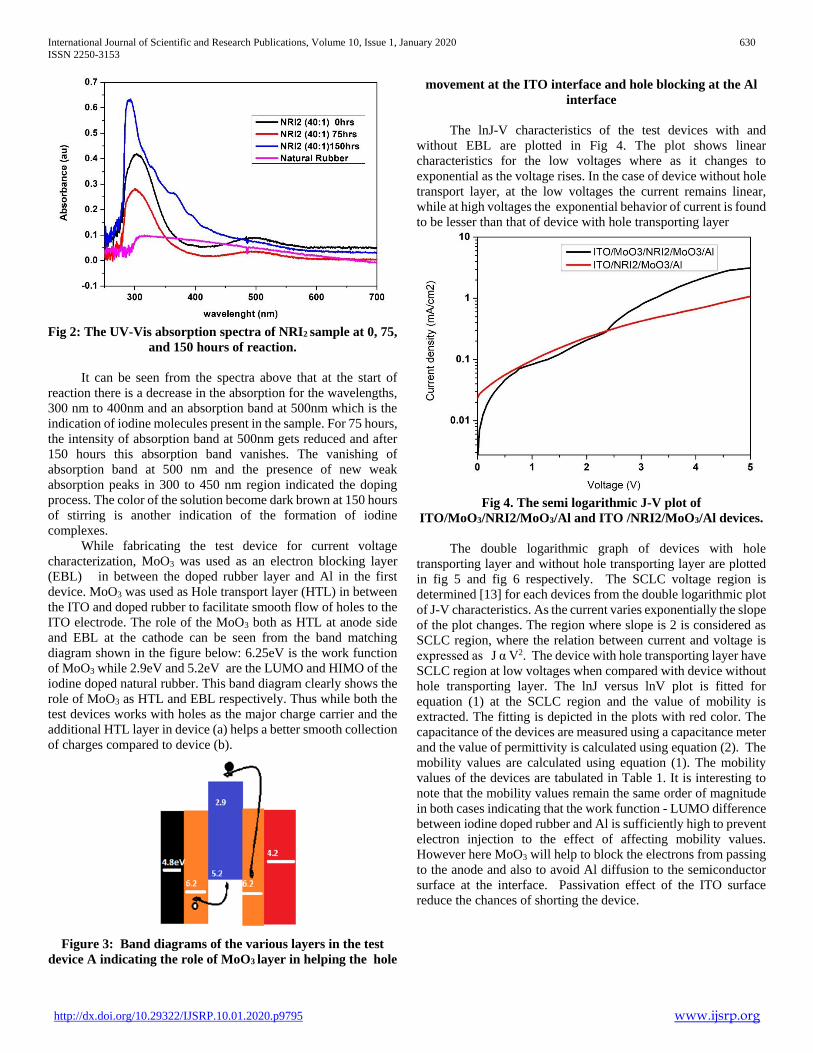
International Journal of Scientific and Research Publications, Volume 10, Issue 1, January 2020 630
ISSN 2250-3153
http://dx.doi.org/10.29322/IJSRP.10.01.2020.p9795 www.ijsrp.org
Fig 2: The UV-Vis absorption spectra of NRI2 sample at 0, 75,
and 150 hours of reaction.
It can be seen from the spectra above that at the start of
reaction there is a decrease in the absorption for the wavelengths,
300 nm to 400nm and an absorption band at 500nm which is the
indication of iodine molecules present in the sample. For 75 hours,
the intensity of absorption band at 500nm gets reduced and after
150 hours this absorption band vanishes. The vanishing of
absorption band at 500 nm and the presence of new weak
absorption peaks in 300 to 450 nm region indicated the doping
process. The color of the solution become dark brown at 150 hours
of stirring is another indication of the formation of iodine
complexes.
While fabricating the test device for current voltage
characterization, MoO3 was used as an electron blocking layer
(EBL) in between the doped rubber layer and Al in the first
device. MoO3 was used as Hole transport layer (HTL) in between
the ITO and doped rubber to facilitate smooth flow of holes to the
ITO electrode. The role of the MoO3 both as HTL at anode side
and EBL at the cathode can be seen from the band matching
diagram shown in the figure below: 6.25eV is the work function
of MoO3 while 2.9eV and 5.2eV are the LUMO and HIMO of the
iodine doped natural rubber. This band diagram clearly shows the
role of MoO3 as HTL and EBL respectively. Thus while both the
test devices works with holes as the major charge carrier and the
additional HTL layer in device (a) helps a better smooth collection
of charges compared to device (b).
Figure 3: Band diagrams of the various layers in the test
device A indicating the role of MoO3 layer in helping the hole
movement at the ITO interface and hole blocking at the Al
interface
The lnJ-V characteristics of the test devices with and
without EBL are plotted in Fig 4. The plot shows linear
characteristics for the low voltages where as it changes to
exponential as the voltage rises. In the case of device without hole
transport layer, at the low voltages the current remains linear,
while at high voltages the exponential behavior of current is found
to be lesser than that of device with hole transporting layer
Fig 4. The semi logarithmic J-V plot of
ITO/MoO3/NRI2/MoO3/Al and ITO /NRI2/MoO3/Al devices.
The double logarithmic graph of devices with hole
transporting layer and without hole transporting layer are plotted
in fig 5 and fig 6 respectively. The SCLC voltage region is
determined [13] for each devices from the double logarithmic plot
of J-V characteristics. As the current varies exponentially the slope
of the plot changes. The region where slope is 2 is considered as
SCLC region, where the relation between current and voltage is
expressed as J α V2. The device with hole transporting layer have
SCLC region at low voltages when compared with device without
hole transporting layer. The lnJ versus lnV plot is fitted for
equation (1) at the SCLC region and the value of mobility is
extracted. The fitting is depicted in the plots with red color. The
capacitance of the devices are measured using a capacitance meter
and the value of permittivity is calculated using equation (2). The
mobility values are calculated using equation (1). The mobility
values of the devices are tabulated in Table 1. It is interesting to
note that the mobility values remain the same order of magnitude
in both cases indicating that the work function - LUMO difference
between iodine doped rubber and Al is sufficiently high to prevent
electron injection to the effect of affecting mobility values.
However here MoO3 will help to block the electrons from passing
to the anode and also to avoid Al diffusion to the semiconductor
surface at the interface. Passivation effect of the ITO surface
reduce the chances of shorting the device.
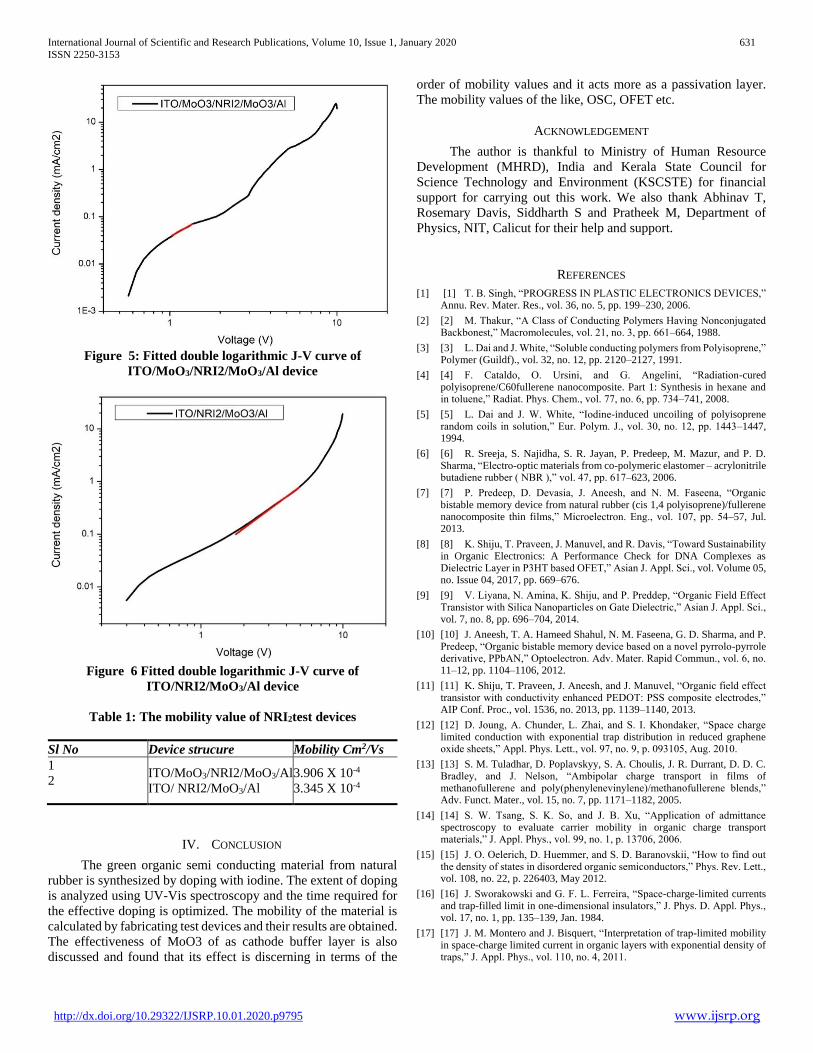
International Journal of Scientific and Research Publications, Volume 10, Issue 1, January 2020 631
ISSN 2250-3153
http://dx.doi.org/10.29322/IJSRP.10.01.2020.p9795 www.ijsrp.org
Figure 5: Fitted double logarithmic J-V curve of
ITO/MoO3/NRI2/MoO3/Al device
Figure 6 Fitted double logarithmic J-V curve of
ITO/NRI2/MoO3/Al device
Table 1: The mobility value of NRI2test devices
Sl No Device strucure Mobility Cm2/Vs
1
2
ITO/MoO3/NRI2/MoO3/Al
ITO/ NRI2/MoO3/Al
3.906 X 10⁻⁴
3.345 X 10⁻⁴
IV. CONCLUSION
The green organic semi conducting material from natural
rubber is synthesized by doping with iodine. The extent of doping
is analyzed using UV-Vis spectroscopy and the time required for
the effective doping is optimized. The mobility of the material is
calculated by fabricating test devices and their results are obtained.
The effectiveness of MoO3 of as cathode buffer layer is also
discussed and found that its effect is discerning in terms of the
order of mobility values and it acts more as a passivation layer.
The mobility values of the like, OSC, OFET etc.
ACKNOWLEDGEMENT
The author is thankful to Ministry of Human Resource
Development (MHRD), India and Kerala State Council for
Science Technology and Environment (KSCSTE) for financial
support for carrying out this work. We also thank Abhinav T,
Rosemary Davis, Siddharth S and Pratheek M, Department of
Physics, NIT, Calicut for their help and support.
REFERENCES
[1] [1] T. B. Singh, “PROGRESS IN PLASTIC ELECTRONICS DEVICES,” Annu. Rev. Mater. Res., vol. 36, no. 5, pp. 199–230, 2006.
[2] [2] M. Thakur, “A Class of Conducting Polymers Having Nonconjugated Backbonest,” Macromolecules, vol. 21, no. 3, pp. 661–664, 1988.
[3] [3] L. Dai and J. White, “Soluble conducting polymers from Polyisoprene,” Polymer (Guildf)., vol. 32, no. 12, pp. 2120–2127, 1991.
[4] [4] F. Cataldo, O. Ursini, and G. Angelini, “Radiation-cured polyisoprene/C60fullerene nanocomposite. Part 1: Synthesis in hexane and in toluene,” Radiat. Phys. Chem., vol. 77, no. 6, pp. 734–741, 2008.
[5] [5] L. Dai and J. W. White, “Iodine-induced uncoiling of polyisoprene random coils in solution,” Eur. Polym. J., vol. 30, no. 12, pp. 1443–1447, 1994.
[6] [6] R. Sreeja, S. Najidha, S. R. Jayan, P. Predeep, M. Mazur, and P. D. Sharma, “Electro-optic materials from co-polymeric elastomer – acrylonitrile butadiene rubber ( NBR ),” vol. 47, pp. 617–623, 2006.
[7] [7] P. Predeep, D. Devasia, J. Aneesh, and N. M. Faseena, “Organic bistable memory device from natural rubber (cis 1,4 polyisoprene)/fullerene nanocomposite thin films,” Microelectron. Eng., vol. 107, pp. 54–57, Jul. 2013.
[8] [8] K. Shiju, T. Praveen, J. Manuvel, and R. Davis, “Toward Sustainability in Organic Electronics: A Performance Check for DNA Complexes as Dielectric Layer in P3HT based OFET,” Asian J. Appl. Sci., vol. Volume 05, no. Issue 04, 2017, pp. 669–676.
[9] [9] V. Liyana, N. Amina, K. Shiju, and P. Preddep, “Organic Field Effect Transistor with Silica Nanoparticles on Gate Dielectric,” Asian J. Appl. Sci., vol. 7, no. 8, pp. 696–704, 2014.
[10] [10] J. Aneesh, T. A. Hameed Shahul, N. M. Faseena, G. D. Sharma, and P. Predeep, “Organic bistable memory device based on a novel pyrrolo-pyrrole derivative, PPbAN,” Optoelectron. Adv. Mater. Rapid Commun., vol. 6, no. 11–12, pp. 1104–1106, 2012.
[11] [11] K. Shiju, T. Praveen, J. Aneesh, and J. Manuvel, “Organic field effect transistor with conductivity enhanced PEDOT: PSS composite electrodes,” AIP Conf. Proc., vol. 1536, no. 2013, pp. 1139–1140, 2013.
[12] [12] D. Joung, A. Chunder, L. Zhai, and S. I. Khondaker, “Space charge limited conduction with exponential trap distribution in reduced graphene oxide sheets,” Appl. Phys. Lett., vol. 97, no. 9, p. 093105, Aug. 2010.
[13] [13] S. M. Tuladhar, D. Poplavskyy, S. A. Choulis, J. R. Durrant, D. D. C. Bradley, and J. Nelson, “Ambipolar charge transport in films of methanofullerene and poly(phenylenevinylene)/methanofullerene blends,” Adv. Funct. Mater., vol. 15, no. 7, pp. 1171–1182, 2005.
[14] [14] S. W. Tsang, S. K. So, and J. B. Xu, “Application of admittance spectroscopy to evaluate carrier mobility in organic charge transport materials,” J. Appl. Phys., vol. 99, no. 1, p. 13706, 2006.
[15] [15] J. O. Oelerich, D. Huemmer, and S. D. Baranovskii, “How to find out the density of states in disordered organic semiconductors,” Phys. Rev. Lett., vol. 108, no. 22, p. 226403, May 2012.
[16] [16] J. Sworakowski and G. F. L. Ferreira, “Space-charge-limited currents and trap-filled limit in one-dimensional insulators,” J. Phys. D. Appl. Phys., vol. 17, no. 1, pp. 135–139, Jan. 1984.
[17] [17] J. M. Montero and J. Bisquert, “Interpretation of trap-limited mobility in space-charge limited current in organic layers with exponential density of traps,” J. Appl. Phys., vol. 110, no. 4, 2011.

International Journal of Scientific and Research Publications, Volume 10, Issue 1, January 2020 632
ISSN 2250-3153
http://dx.doi.org/10.29322/IJSRP.10.01.2020.p9795 www.ijsrp.org
AUTHORS
First Author – Jayan Manuvel, Laboratory for Molecular
Photonics and Electronics (LAMP), Department of Physics,
National Institute of Technology Calicut, Kerala, India-673601
Second Author – P. Predeep, Laboratory for Molecular
Photonics and Electronics (LAMP), Department of Physics,
National Institute of Technology Calicut, Kerala, India-673601
Corresponding author’s email: [email protected]
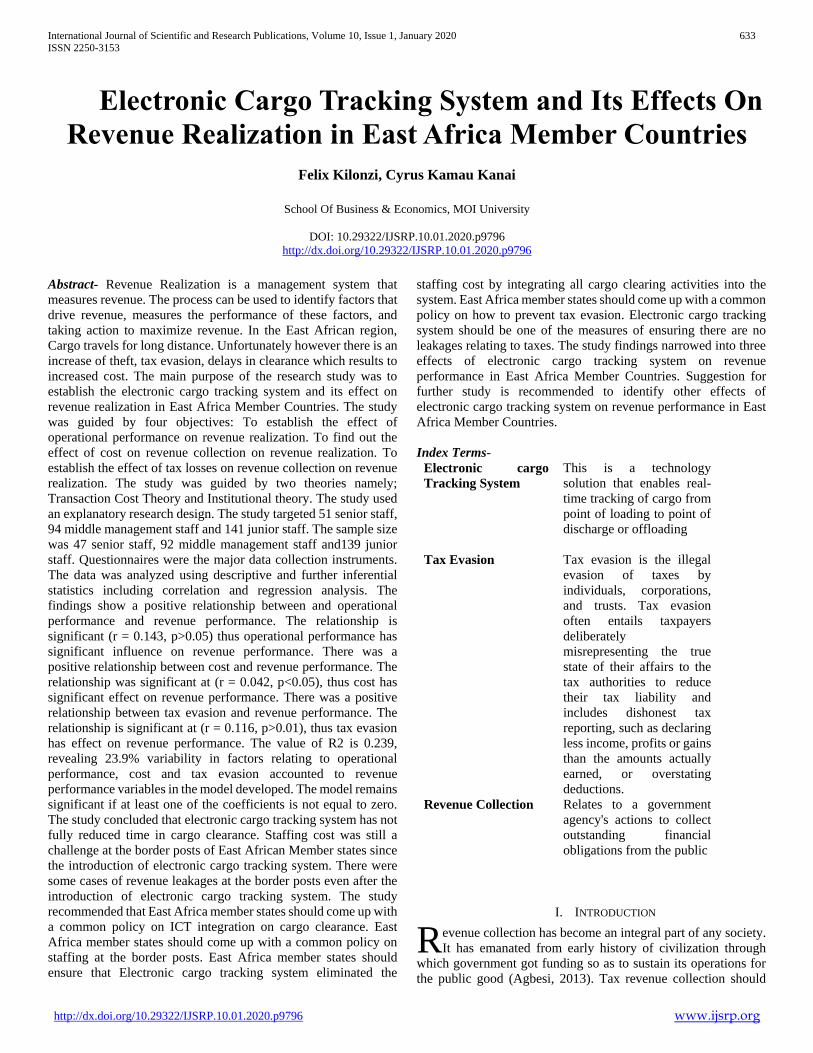
International Journal of Scientific and Research Publications, Volume 10, Issue 1, January 2020 633
ISSN 2250-3153
http://dx.doi.org/10.29322/IJSRP.10.01.2020.p9796 www.ijsrp.org
Electronic Cargo Tracking System and Its Effects On
Revenue Realization in East Africa Member Countries
Felix Kilonzi, Cyrus Kamau Kanai
School Of Business & Economics, MOI University
DOI: 10.29322/IJSRP.10.01.2020.p9796
http://dx.doi.org/10.29322/IJSRP.10.01.2020.p9796
Abstract- Revenue Realization is a management system that
measures revenue. The process can be used to identify factors that
drive revenue, measures the performance of these factors, and
taking action to maximize revenue. In the East African region,
Cargo travels for long distance. Unfortunately however there is an
increase of theft, tax evasion, delays in clearance which results to
increased cost. The main purpose of the research study was to
establish the electronic cargo tracking system and its effect on
revenue realization in East Africa Member Countries. The study
was guided by four objectives: To establish the effect of
operational performance on revenue realization. To find out the
effect of cost on revenue collection on revenue realization. To
establish the effect of tax losses on revenue collection on revenue
realization. The study was guided by two theories namely;
Transaction Cost Theory and Institutional theory. The study used
an explanatory research design. The study targeted 51 senior staff,
94 middle management staff and 141 junior staff. The sample size
was 47 senior staff, 92 middle management staff and139 junior
staff. Questionnaires were the major data collection instruments.
The data was analyzed using descriptive and further inferential
statistics including correlation and regression analysis. The
findings show a positive relationship between and operational
performance and revenue performance. The relationship is
significant (r = 0.143, p>0.05) thus operational performance has
significant influence on revenue performance. There was a
positive relationship between cost and revenue performance. The
relationship was significant at (r = 0.042, p<0.05), thus cost has
significant effect on revenue performance. There was a positive
relationship between tax evasion and revenue performance. The
relationship is significant at (r = 0.116, p>0.01), thus tax evasion
has effect on revenue performance. The value of R2 is 0.239,
revealing 23.9% variability in factors relating to operational
performance, cost and tax evasion accounted to revenue
performance variables in the model developed. The model remains
significant if at least one of the coefficients is not equal to zero.
The study concluded that electronic cargo tracking system has not
fully reduced time in cargo clearance. Staffing cost was still a
challenge at the border posts of East African Member states since
the introduction of electronic cargo tracking system. There were
some cases of revenue leakages at the border posts even after the
introduction of electronic cargo tracking system. The study
recommended that East Africa member states should come up with
a common policy on ICT integration on cargo clearance. East
Africa member states should come up with a common policy on
staffing at the border posts. East Africa member states should
ensure that Electronic cargo tracking system eliminated the
staffing cost by integrating all cargo clearing activities into the
system. East Africa member states should come up with a common
policy on how to prevent tax evasion. Electronic cargo tracking
system should be one of the measures of ensuring there are no
leakages relating to taxes. The study findings narrowed into three
effects of electronic cargo tracking system on revenue
performance in East Africa Member Countries. Suggestion for
further study is recommended to identify other effects of
electronic cargo tracking system on revenue performance in East
Africa Member Countries.
Index Terms-
Electronic cargo
Tracking System
This is a technology
solution that enables real-
time tracking of cargo from
point of loading to point of
discharge or offloading
Tax Evasion Tax evasion is the illegal
evasion of taxes by
individuals, corporations,
and trusts. Tax evasion
often entails taxpayers
deliberately
misrepresenting the true
state of their affairs to the
tax authorities to reduce
their tax liability and
includes dishonest tax
reporting, such as declaring
less income, profits or gains
than the amounts actually
earned, or overstating
deductions.
Revenue Collection Relates to a government
agency's actions to collect
outstanding financial
obligations from the public
I. INTRODUCTION
evenue collection has become an integral part of any society.
It has emanated from early history of civilization through
which government got funding so as to sustain its operations for
the public good (Agbesi, 2013). Tax revenue collection should
R
International Journal of Scientific and Research Publications, Volume 10, Issue 1, January 2020 634
ISSN 2250-3153
http://dx.doi.org/10.29322/IJSRP.10.01.2020.p9796 www.ijsrp.org
comply with best practices of equity, ability to pay, economic
efficiency, convenience and certainty. Just like any other
organization, the government also looks at all ways and means to
reduce the expenditure so as to have a reciprocate effect of the
public national debt of the economy (Ireland P., 1994). Various
accounting and control procedures are usually adopted in order to
ensure that the spending is in line with government policy and
framework. Some of the controls include budgetary measures,
checks and balances and many others. This engulfs the whole
rationale of any corporate be it public or non-public institution
which institutes to lower expenditure and increase in revenue so
as to attain ultimate objectives (Apondi, 2015).
Electronic cargo tracking in developing countries has been
associated with several benefits to the transporters that include
increased efficiency and productivity which results in a cost
reduction benefits. The system also aides in improved reliability
and service quality, usually thought of as tools to retain good
customers and grow market share and revenue and lastly there is
improved shipment and container integrity, built around a core of
security issues (Dennis & Shepherd, 2011). The system similarly
present benefits to the public sector. With the implementation of
the system, there is improvement in efficiency and effectiveness
of operational performance. It is a tool which is double edged with
the expectation that reduction in illicit trade caused by diversion
lead to increased collection of revenue from imports. The process
of information processing by the border officials and other
intelligence agencies is currently quite taxing and the
vulnerabilities associated with container stacking are also quite
high. The introduction of real-time information processing enable
information to be received and dealt with much faster and also
decongest the clearing process (Grottel, 2017).
II. RESEARCH AND COLLECT IDEA
Transaction Cost Theory
The transaction cost theory as advanced by Williamson
(1985) opines that the costs of establishing and monitoring the
actions of partners in influencing the entry mode choice.
Transaction cost theory propose that if there are market based
measures, business players was because a firm can benefit from
the economies of scale of the market place. However, McIvor
(2005) elucidates that a firm faces increased costs in finding or
negotiating a market based agreement due to difficulties of
estimating all contingencies in the agreement or because of the
inability to receive a fair price due to the problems arising from
information asymmetry. The use of the radio frequency
identification (RFID) system use in monitoring of cargo in transit,
in particular, has created enormous value by improving transit
management in long global supply chains, helping reduce
inventory costs by up to 70 percent while improving the service
offered (Norov & Akbarov, 2012).
Institutional Theory
The theory recognizes the embedment of institutional
actors. Institutional theorists suggest that organizational actions
and processes are driven by their actors in order to justify and
plausibly explain their actions. According to this perspective,
strategy implementations are rationally accounted for by
organizational actors and rooted in the normative context,
Organizations adopt a standardized set of practices The Kenya
Revenue Authority would need to align internally to be able to
ensure that the new introduced system becomes part of their day
to day activities. The implementers of the system would therefore
need to educate the staff members internally on the benefits of the
system both internally and externally in order to achieve the
desired results. By educating the members internally the users of
the systems was able to “own” the system (Raghu & Harrop,
2013).
Revenue Realization
Revenue collection is an integral component of fiscal
policy and administration in any economy because of its influence
on national government operations and the grassroots. It is the fuel
of every government as it is the main instrument through which
government funding is ensured. Revenue collection should
comply with best practices of equity, ability to pay, economic
efficiency, convenience and certainty (Visser &Erasmus, 2005).
For a government to match its performance with the needs and
expectations of its citizens, it should increase its fiscal depth
without incurring costly recurring overheads (Gidisu, 2012).
Sound revenue system for governments is a vital pre-condition for
the success in promoting efficiency in the service delivery and
economic development at the counties (Ngotho & Kerongo, 2014).
For most developing countries, revenue collection goes hand-in-
hand with economic growth and the revenue is the lifeblood for
governments to deliver essential services and to make long-term
investments in public goods (OECD, 2008).
Operational Performance
Barka (2012) carried out a study to find out a relationship
between operational performance and profitability. The data from
ceramic companies in Bangladesh have been taken to find out why
the ceramic industry is growing rapidly which was useful to get to
wholesome result. A number of operating ratios has been
established as a proxy for operational efficiency. To find out the
findings of the study quantitative method has been employed.
Standard Deviation, Correlation and simple Linear Regression
have been used with the help of predictive analytics SPSS software
in order to arrive at the end result of the study. The profitability
can be deduced from the fixed asset turnover. Besides it is not
statistically significant. Therefore it can be said that the key
performance indicators of operational performance have a
relationship with the profitability in the context of the ceramic
companies of Bangladesh.
Cost
Gitau & Nzuki (2014) studied how the use of ICT has
modernized cost of Tax administration procedures and improved
revenue Collection at Large Taxpayer Department of Tanzania
Revenue Authority. ICT was introduced into the department in
2001 for easy maintenance and timely access of records and fast
processing of return so as to remove postal delays; minimize
operational costs; curb cheating and plug revenue loss (TRA
2010e). Large Taxpayers and Large Taxpayer Department staff
(100%) agree that, since 2001 time for processing return and
responding to queries have been reasonably shortened (Victor –
Nyambo 2009). TRA reports reveal that, actual revenue collection
increased from TZS. 204.397.5 Million in 2001/02 to TZS.
1,605,751.2 Millions in 2008/09 while revenue contribution share
rose to 41% in 2008/09 from 23% in 2001/02. Although other
factors in the economy like; increased internal trade, reduced
importation and more reliance on home products may cause the
International Journal of Scientific and Research Publications, Volume 10, Issue 1, January 2020 635
ISSN 2250-3153
http://dx.doi.org/10.29322/IJSRP.10.01.2020.p9796 www.ijsrp.org
increase, if there is no good tax administration, revenue was not
reflected in collections. The fact that revenue has increase proves
that, ICT use enhance better tax administration.
Tax Loss
Manji (2015) studied the determinants of tax revenue
performance in the Southern African Development Community.
The results generally highlight the robust role of taxation (tax rates
and tax policy harmonization variables) (alongside other
important determinants) in improving tax revenue in the region,
providing empirical support for extant anecdotal evidence. The
empirical finds the importance of FDI towards tax revenue
collected in the SADC and the existence of reverse causality (that
is, a causal relationship between FDI and taxation or vice versa).
Policy considerations include the need for SADC countries to
carry out extensive pro-regional (coordinated) tax reforms, create
a regional tax forum and promote initiatives aimed at improving
FDI and ultimately tax revenue (as per existing regional
protocols).
III. STUDIES AND FINDINGS
Majority of respondents were neutral that electronic cargo
tracking system has reduced time in cargo clearance as shown by
(M=3.0282 SD=1.17118), this shows that electronic cargo
tracking system has not fully reduced time in cargo clearance. The
study findings agrees with Al-Hawary & Abu-Laimon (2013) who
argued that regional Electronic cargo tracking systems have made
it possible to inspect and clear containers within the pre-set
organizational benchmarks. Respondents agreed that electronic
cargo tracking system has reduced cargo theft as shown by
(M=4.2056 SD=0.93192), this shows that there has been reduction
in cargo theft since the introduction of electronic cargo tracking
system. the study findings agrees with Broadway (2012) who
argued that direct benefits to electronic cargo tracking to the
transporters include increased efficiency and productivity, often
thought of as cost reduction benefits. The system also aides in
improved reliability and service quality, usually thought of as tools
to retain good customers and grow market share and revenue and
lastly there is improved shipment and container integrity, built
around a core of security issues.
Respondents agreed that electronic cargo tracking system
has enabled data to be captured on the system as evidenced by (M=
3.5484 SD=1.31546), this shows that electronic cargo tracking
system has improved how data was captured on goods on transits
among East African member states. The study findings agrees with
Busse et al (2012) who argued that the electronic cargo tracking
system offers a platform whereby data can be analyzed accurately
and therefore KRA being able to generate useful insights into its
operational performance and is done on a real time basis and
therefore the information collected and circulated is timely and
relevant. Similarly, an electronic system eliminates the paper
works involved in the old ways of doing business.
Majority of respondents were neutral that electronic cargo
tracking system ensures internal control systems are enhanced as
shown by (M= 3.3234 SD=0.59179), this shows that electronic
cargo tracking system has not fully improved the internal controls
at boarder post, this has led to delays of cargo on transits. The
study findings agrees with Calabrese & Eberhard-Ruiz, 2016) who
argued that ECT system also has been associated with increased
quality of service and cost control which means that customers are
willing to do business with the revenue authority and this leads to
more trade and revenue collection.
Respondents were neutral that electronic cargo tracking
system has reduced staffing cost as shown by (M= 3.4476
SD=1.39304), this shows that staffing cost was still a challenge at
the border posts of East African Member states since the
introduction of electronic cargo tracking system. The study
findings agrees with Busse et al., (2012) who argued that The
electronic cargo tracking system offers a platform whereby data
can be analyzed accurately and therefore KRA being able to
generate useful insights into its operational performance and is
done on a real time basis and therefore the information collected
and circulated is timely and relevant.
On whether electronic cargo tracking system has reduced
documentation cost, majority of respondents were neutral as
shown by (M= 3.2823 SD=1.36800), this shows that there’s were
still costs associated with the documentations on clearance of
cargo at the border posts which has not been solved by electronic
cargo tracking system. On whether electronic cargo tracking
system has reduced the cost of tax collection, majority of
respondents were neutral as evidenced by (M= 3.2137
SD=1.30349), this shows that there were still costs associated with
tax collection since the introduction of electronic cargo tracking
system. The study findings agrees with Calabrese & Eberhard-
Ruiz, 2016) who argued that ECT system also has been associated
with increased quality of service and cost control which means that
customers are willing to do business with the revenue authority
and this leads to more trade and revenue collection. Respondents
were neutral that electronic cargo tracking system has reduced
operational cost as evidenced by (M= 2.8185 SD=1.19857), this
shows that electronic cargo tracking system has not all reduced
operational cost at the border posts. The study findings agree with
Calabrese & Eberhard-Ruiz (2016) who argued that when
technology is used in repetitive operational tasks, there is a
reduction in mistakes or complete elimination, and the time it
takes to complete a task is greatly reduced.
On whether electronic cargo tracking system has helped
curb revenue leakages, majority of respondents were neutral as
shown by (M= 3.4073 SD=1.44237), this shows that there were
some cases of revenue leakages at the border posts even after the
introduction of electronic cargo tracking system. The study
findings disagrees with Barka (2012) who argued that detection of
tampering while on transit is done immediately and hence
preventing loss before arrival at the unloading port. Monitoring of
any change is registered by RFID signals from the truck associated
with the opening of the container. Real-time reporting of any
exception and incident of container security violation to
destination custom and port authorities for remedial action before
arrival is core issue.
Respondents were neutral that electronic cargo tracking
system has improved targeted tax collections this was shown by
(M= 3.1452 SD=1.38057), this shows that there has been little
improvement in tax collection since the introduction of electronic
cargo tracking system. the study findings disagrees with Calabrese
& Eberhard-Ruiz (2016) who argued that ECT system also has
been associated with increased quality of service and cost control
which means that customers are willing to do business with the
revenue authority and this leads to more trade and revenue
International Journal of Scientific and Research Publications, Volume 10, Issue 1, January 2020 636
ISSN 2250-3153
http://dx.doi.org/10.29322/IJSRP.10.01.2020.p9796 www.ijsrp.org
collection. This is because goods arrive at the border points and
are quickly cleared to leave for the next station.
On whether electronic cargo tracking system has sealed
loopholes for importers this was shown by (M= 3.0685
SD=1.28812), this shows that there were still loopholes for
importers at the border posts which enabled tax evasion. The study
findings agrees with Bennet (2014) mho argued that with the
implementation of the system, there is improvement in efficiency
and effectiveness of operational performance. ECTS helps
government agencies in enhancing enforcement of cargo handing
regulations, maintaining the region as the preferred trade route for
cargo and thereby improving tax collection by curbing incidents
of dumping. Respondents were neutral that electronic cargo
tracking system has improved monitoring transit cargo this was
evidenced by (M= 2.9516 SD=1.32160), this shows that electronic
cargo tracking system made little improvement monitoring transit
cargo at the border posts. The study findings agrees with Barka
(2012) who argued that monitoring of any change is registered by
RFID signals from the truck associated with the opening of the
container. Real-time reporting of any exception and incident of
container security violation to destination custom and port
authorities for remedial action before arrival is core issue.
Respondents who were neutral indicated that electronic
cargo tracking system data is shared on a real time basis resulting
to reduced dumping this was evidenced by (M= 3.1129
SD=1.29283), this shows that electronic cargo tracking system
data was not fully shared on a real time basis which has not full
reduced dumping of goods. The study findings agrees with Barka
(2012) who argued that Monitoring of any change is registered by
RFID signals from the truck associated with the opening of the
container. Real-time reporting of any exception and incident of
container security violation to destination custom and port
authorities for remedial action before arrival is core issue.
On whether revenue realization is a management system
that measures revenue, respondents agreed as evidenced by (M=
3.8266 SD=1.21319), tis shows that revenue performance has
been accepted as a management system that measures revenue.
Respondents agreed that electronic cargo tracking system has
improved revenue performance as shown by (M= 3.9597
SD=1.12318), this shows that electronic cargo tracking system has
improved revenue realization. On whether electronic cargo
tracking system enhances Trade facilitation was evidenced by (M=
4.3105 SD=0.81577), this shows that electronic cargo tracking
system had enhanced Trade facilitation. On whether electronic
cargo tracking system has the advantage of expanding the revenue
sources this was shown by (M= 3.8629 SD=1.06725),
IV. CONCLUSION
The study concluded that electronic cargo tracking system
has not fully reduced time in cargo clearance. There has been
reduction in cargo theft since the introduction of electronic cargo
tracking system. Electronic cargo tracking system has improved
how data was captured on goods on transits among East African
member states. Electronic cargo tracking system has not fully
improved the internal controls at boarder post; this has led to
delays of cargo on transits.
Staffing cost was still a challenge at the border posts of East
African Member states since the introduction of electronic cargo
tracking system. There have been still costs associated with the
documentations on clearance of cargo at the border posts which
has not been solved by electronic cargo tracking system. There
were still costs associated with tax collection since the
introduction of electronic cargo tracking system. Electronic cargo
tracking system has not all reduced operational cost at the border
posts.
There were some cases of revenue leakages at the border
posts even after the introduction of electronic cargo tracking
system. There has been little improvement in tax collection since
the introduction of electronic cargo tracking system. There were
still loopholes for importers at the border posts which enabled tax
evasion. Electronic cargo tracking system made little
improvement monitoring transit cargo at the border posts.
Electronic cargo tracking system data was not fully shared on a
real time basis which has not full reduced dumping of goods.
V. PPENDICES
Appendix I: Introduction Letter
Date: ………………………
To Chief Executive Office
…………………………………………………………………..
NAIROBI.
Dear Sir/ Madam,
RE: CONSENT FOR PROVISION OF ACADEMIC DATA
I am an MBA student. I wish to conduct a study entitled “electronic cargo tracking system and its effect on revenue realization in East
Africa Member Countries.”
To facilitate the completion of this study, I wish to humbly request for your assistance with certain data from your organization. I have
attached a copy of the questionnaire. Kindly answer all the questions as completely as possible. The study results are intended for
academic purposes only and will be treated with utmost confidentiality. No specific reference will be made on your organization and
only the summary results will be made public.
I look forward to your utmost support and remain grateful.

International Journal of Scientific and Research Publications, Volume 10, Issue 1, January 2020 637
ISSN 2250-3153
http://dx.doi.org/10.29322/IJSRP.10.01.2020.p9796 www.ijsrp.org
Appendix II: Questionnaire
PART A: BACKGROUND INFORMATION
1. Gender of the respondent
Male [ ] Female [ ]
2. Designation: …………………………………………………
3. Number of Years in Service
0 – 5 [ ] 6 – 10 [ ]
11 – 15 [ ] 16 – 20 [ ]
Over 20 years [ ]
4. Highest Education Level Attained:
a) Diploma [ ]
b) Undergraduate [ ]
c) Postgraduate [ ]
SECTION B: REVENUE REALIZATION
a. Kindly indicate the extent to which the following on revenue realization using the scale: 1-strongly disagree, 2-disagree, 3-neither
agree nor disagree, 4-agree and 5- strongly agree. Please (√) as appropriate.
Aspects 5 4 3 2 1
Revenue performance is a management system that measures revenue
Electronic cargo tracking system has improved revenue performance
Electronic cargo tracking system enhances Trade facilitation
Electronic cargo tracking system has the advantage of Expanding the revenue
sources
SECTION C: OPERATIONAL PERFOMANCE
A. With regard to effect of operational performance on revenue performance on East Africa Member Countries using the scale: 1-
strongly disagree, 2-disagree, 3-neither agree nor disagree, 4-agree and 5- strongly agree. Please (√) as appropriate.
Factors 5 4 3 2 1
Electronic cargo tracking system has reduced time in cargo clearance
Electronic cargo tracking system has increased quantity of cargo cleared
Electronic cargo tracking system has reduced cargo theft
Electronic cargo tracking system has enabled cargo documents being
processed online.
Electronic cargo tracking system has enabled data to be captured on the
system
Electronic cargo tracking system ensures internal control systems are
enhanced
SECTION D: COST
A. In relation to effect of cost on revenue collection revenue performance on East Africa Member Countries using the scale: 1-strongly
disagree, 2-disagree, 3-neither agree nor disagree, 4-agree and 5- strongly agree. Please (√) as appropriate.
Factors 5 4 3 2 1
Electronic cargo tracking system has reduced staffing cost
Electronic cargo tracking system has reduced documentation cost
Electronic cargo tracking system has reduced clearance documentation cost

International Journal of Scientific and Research Publications, Volume 10, Issue 1, January 2020 638
ISSN 2250-3153
http://dx.doi.org/10.29322/IJSRP.10.01.2020.p9796 www.ijsrp.org
Electronic cargo tracking system has reduced the cost of tax collection
Electronic cargo tracking system has reduced operational cost
SECTION D: TAX EVASION
A. On the effect of tax losses on revenue collection on revenue performance in East Africa Member Countries using the scale: 1-strongly
disagree, 2-disagree, 3-neither agree nor disagree, 4-agree and 5- strongly agree. Please (√) as appropriate.
Factors 5 4 3 2 1
Electronic cargo tracking system has helped curb revenue leakages
Electronic cargo tracking system has improved targeted tax collections
Electronic cargo tracking system has sealed loopholes for importers
Electronic cargo tracking system has improved monitoring transit cargo
Electronic cargo tracking system data is shared on a real time basis resulting
to reduced dumping
ACKNOWLEDGEMENTS
I thank the Almighty God for his undeserving grace that
enabled me to go this far in my studies. To my parents, who took
interest and sacrificed themselves for my education. You are
highly appreciated. My sincere appreciation goes to my
supervisors who were always there for support through guidance,
corrections and professional advice throughout the time of thesis
writing is appreciated. Thank you May God blesses you
abundantly.
REFERENCES
[1] 1.Agbesi, K. (2013). the Impact of Ict on the Clearing of Goods At Ghana Ports : a Study of Tema and Takoradi Ports, 4(3), 87–95.
[2] 2. Al-Hawary, S. I. S., & Abu-Laimon, A. A. A. (2013). The impact of TQM practices on service quality in cellular communication companies in Jordan. International Journal of Productivity and Quality Management, 11 446-474
[3] 3. Apondi, O. S. (2015). The relationship between required trade documentation and the choice of cross-border trade patterns at Busia border post. Unpublished MA Project, University of Nairobi
[4] 4. Barka, H. (2012). “Border posts, checkpoints and intra-Africa trade: Challenges and solutions”, African Development Bank: OPEV Newsletter,
[5] 5.Bennet, G. (2014). Integration, Regional Agglomeration and International Trade; CEPR discussion paper # 3752; London: CEPR. Bribery as a non-tariff barrier to trade – a case study of East Africa trade corridors”, Transparency International-Kenya, 2012
[6] 6. Broadway, R. W. (2012). From optimal tax theory to tax policy: retrospective and prospective views. Cambridge: MIT Press
[7] 7. Busse, M.S, Hoekstra & R.K, Königer, J.S (2012) ‘The impact of aid for trade facilitation on the costs of trading’, Kyklos, 65 143–63.
[8] 8. Calabrese, L., & Eberhard-Ruiz, A. (2016). What types of non-tariff barriers affect the East African Community, London, UK: Overseas Development Institute
[9] 9. Chimilila, C., Sabuni, C., Benjamin, A. (2014). Trade Facilitation in EAC Customs Union: Its Achievement and Implementation in Tanzania. Journal of Economics and Sustainable Development, 5 1-15.
[10] 10.Gerring S.K (2014) Research methods: 1st edition, ACTS publishers. Kenya. Nairobi.
[11] 11.González.V (2016). "Towards energy efficiency smart buildings models based on intelligent data analytics". Procedia Computer Science. 83 994–999
[12] 12. Gunes N, Atilgan, M.(2016). Comparison of the effectiveness of the audit committees in United Kingdom and in Turkish banks. International Journal of Financial Research, 27, 218.
[13] 13. Dennis, G. K., & Shepherd, W. D. (2011). Regional Integration in Africa: Challenges and Prospects; WIDER Working Paper 2014/037; Helsinki: World Institute for Development Economics Research.
[14] 14. Gitau, L., & Nzuki, D. (2014). Analysis of Determinants of M-Commerce Adoption by Online Consumers. International Journal of Business, Humanities and Technology, 4 88–94.
[15] 15. Githinji, R. K., & Mwaniki, M. et al. (2014). Information and Communication Technology (ICT) on Revenue Collection by Kenyan Counties. International Journal of Academic Research in Business and Social Sciences, 4 238–260
[16] 16. Grottel, M. (2017). Improving the functioning of the EU customs union in the context of the Union Customs Code regulations. International Business and Global Economy, 36(1).
[17] 17. Hoffman, A. J. (2014). The use of technology for trade corridor management in Africa, NEPAD Transport Summit, Sandton, South Africa, October 2014.
[18] 18. Hoffman, A. J., & Lusanga, K. (2015). A combined GPS/RFID system for improved cross- border management of freight consignments. Freight tracking data analysis to improve logistics management operations. Conference Paper. Sep 2015
[19] 19. Hoekman, B.C & Nicita, A.K (2010) ‘Assessing the Doha Round: market access, transactions costs and aid for trade facilitation’, Journal of International Trade and Economic Development 9 65-79
[20] 20.Kabiru, V. N. (2016). Electronic cargo tracking system and operational performance at Kenya Revenue Authority and on transporters, Unpublished MBA Project, University of Nairobi
[21] 21. Kafeero, E.M (2008). Customs and Trade Facilitation in the East African Community (EAC). World Customs Journal, 2 120
[22] 22. Khan, S.A. , U-Din, A. (2014). The Strategic Alliance of Marketing Competitors and its Impact on Customer Satisfaction. International Journal of Management and Commerce Innovations, 1, 1-5.
[23] 23.Kidd, M., & Crandall, W. J. (2012). Revenue authorities: Issues and problems in evaluating their success (No. 6-240). International Monetary Fund

International Journal of Scientific and Research Publications, Volume 10, Issue 1, January 2020 639
ISSN 2250-3153
http://dx.doi.org/10.29322/IJSRP.10.01.2020.p9796 www.ijsrp.org
[24] 24. Liu, S.V & Guangping M.N (2008). Review on the implementation of the Second-step Development Strategy for the Establishment of the Modern Customs System. New Yor, New York: McGraw-Hill.
[25] 25.Maisiba, G. J., & Atambo, W. (2016). Effects of Electronic- Tax System on the Revenue Collection Efficiency of Kenya Revenue Authority : A Case of Uasin Gishu County ., 4, 815–827.
[26] 26. Manji, A. (2015). Bulldozers, homes and highways: Nairobi and the right to the city. Review of African Political Economy, 42, 206-224.
[27] 27. Manyika, L. (2016). How digital trade is transforming globalisation, Unpublished MBA project, University of Nairobi.
[28] 28. Meltzer, J. (2013). The Internet, cross-border data flows and international trade, Brookings Issues in Technology Innovation paper number
[29] 29. Mpata, S. (2014). Evaluation of the COMESA/SADC transit management systems – Final Report”, Lilongwe, Malawi, September
[30] 30. Musyoka, M .P. (2016). An analysis of urban household food demand in Nairobi, Kenya. Egerton University, Department of Agricultural Economics and Agri-Business Management, Unpublished Thesis
[31] 31. Naidoo, J. (2012). The time effect of costs on cross-border operations”, Report of the Southern Africa Cross-Border Transport Association
[32] 32.Norov, L., & Akbarov, D. (2012). Customs – time for a change”, Problems of Economic Transition, 52, 47–60
[33] 33. Nkoroi, I. (2015). Assessing the Informal Cross Border Trade Between Kenya and Uganda, Unpublished MA Project, University of Nairobi
[34] 34.Pauwelyn, J.S (2009), ‘Nothing dramatic (regarding administration of customs laws)’, World Trade Review, vol. 8 45-48
[35] 35. Peil, S.K (2005). Research Methodology and Design. , U.S.A, New York, Macmillan. Publishers
[36] 36. Raghu, D., & Harrop, P. (2013) RFID forecasts players and opportunities 2014–2024, IDTechEx,
[37] 37.Tumbarello F, Patrizia N, (2014) “Regional Trade Integration and WTO accession in the CIS:Which is the right Sequencing,” IMF Working Paper Customs Procedures in the Republic of Macedonia. World Customs Journal, 8 , 51-62.
[38] 38.Widdowson, D, Blegen, B, Kashubsky, M , Grainger, A (2014) ‘Review of accredited Operator Schemes: an Australian study’, World Customs Journal 8 17–34
[39] 39.Zikmund, W., (2010). Business Research Methods 8th Edition. McGraw-Hill Publishers.U.S.A. New York.
AUTHORS
First Author – FELIX KILONZI, CYRUS KAMAU KANAI ,
SCHOOL OF BUSINESS & ECONOMICS, MOI
UNIVERSITY

International Journal of Scientific and Research Publications, Volume 10, Issue 1, January 2020 640
ISSN 2250-3153
http://dx.doi.org/10.29322/IJSRP.10.01.2020.p9797 www.ijsrp.org
Existence Of Indigenous Legal Communities On Land In
Procurement Of Land For Public Interest
Marulak Togatorop1, Nirahua Salmon E.M2
1Graduate Student PhD, Study Program : Legal Science. Pattimura University, Ambon Indonesia
2Lecture at Faculty Of Law. Pattimura University, Ambon Indonesia Email : [email protected]
DOI: 10.29322/IJSRP.10.01.2020.p9797
http://dx.doi.org/10.29322/IJSRP.10.01.2020.p9797
Abstract: Land acquisition under the pretext of public interest, sometimes injures the community, including the Customary Law
Community (MHA), because the use of land taken by the government is not as originally planned, and even tends to give birth to
misery of the community which was once the rights holder. Many cases have arisen between the Government, Regional Government
and the private sector with the Customary Law Community (MHA), related to the implementation of development and investment on
land which is the property of the MHA. Research Objectives: 1) Analyzing and discovering the philosophical basis of the protection of
property rights of customary law communities. 2) Analyzing and finding the existence of customary community ownership rights in
land acquisition for public interest. This type of research is normative juridical research. Basically, indigenous peoples have a
philosophical foundation that is closely interrelated with their customary land or customary rights. Customary law communities have
full customary authority for the control and use or management of their customary land, but in formal legal jurisdiction their authority
is not as strong as that of the State such as the State set out in the Basic Rules of Agrarian Principles (UUPA). The existence of
customary law communities in defending their customary rights over land is emphasized in their respective regional regulations in
accordance with the characteristics and characteristics of indigenous and tribal peoples in certain areas.
Keywords: Philosophical, rights, community, customary law, land
1. INTRODUCTION
In order to realize a just and prosperous society, the government made a general plan regarding the supply, allocation and use
of agrarian resources for development needs in order to achieve the greatest prosperity of the people. With this general plan, land use
can be carried out in a guided and orderly manner so as to bring maximum benefits to the country and the people. Land is one type of
object that still has a very important position in the governance of community life. Moreover, the compilation of the modernization
era, all trajectories have begun to be driven, the role of the land is more advanced. At the time of increasing land values increased by
urban communities whose growth rates are increasing, so that the demand for land is increasing and scarce. (Muhammad Yusrizal,
2017). Land and development are an inseparable unity. Besides land also has a social function, in the sense that land owned by
someone does not only function for the owner of that right, but also for the Indonesian people as a whole. As a consequence the use of
the land is not only based on the interests of the right-holders, but also must remember and pay attention to the interests of the
community. Therefore it can be said that land has a dual function, namely as social assets and capital assets. As social assets land is a
means of binding social unity among the people of Indonesia for life and living, while as capital assets land is a capital factor in
development. (Hermayulis, 2000). As social assets and capital assets, the two are a unity, on which there are humans as their
inhabitants and the content of natural resources in them (Elita Rahmi, 2010). Based on the authority possessed by the government in
regulating the land sector, in accordance with the mandate of Article 33 paragraph 3 of the 1945 Constitution which states that: "The
earth, water and natural resources contained therein are controlled by the state to be used for the greatest prosperity of the people".
Then the government followed up by issuing Law Number 5 of 1960 concerning Basic Regulations on Agrarian Principles (UUPA).
The provisions in UUPA itself provide a strong legal basis for the government to take land owned by the community, including taking
land for public purposes as regulated in Article 18, namely: "In the public interest, including the interests of the nation and state, as
well as the common interests of the people, land rights can be revoked, by providing appropriate compensation in the manner
stipulated by law".
Development by the government, especially physical development absolutely requires land. This required land can be in the
form of land that is directly controlled by the state or land that is already owned with rights by a legal subject. Related to the land
needed for development in the form of state land, land acquisition is not difficult, that is, the government can directly apply for land
rights for further use for development, but because of the limited land owned by the government, land is needed from the community
including the customary law community to expedite the course of development in the public interest. The need for land to be used by
the government for development purposes must not be detrimental to the rights of landowners, including the rights of indigenous

International Journal of Scientific and Research Publications, Volume 10, Issue 1, January 2020 641
ISSN 2250-3153
http://dx.doi.org/10.29322/IJSRP.10.01.2020.p9797 www.ijsrp.org
peoples to land. Therefore, to regulate this matter, it is necessary to have a legal regulation that can provide legal protection to holders
of land rights.
Legal arrangements relating to the acquisition of land for public purposes and all other relevant regulations have undergone a
process of development from time to time. Some existing land acquisition regulations are considered not able to accommodate the
interests of holders of land rights, so it is very necessary to have legal instruments at the level of the law to become a strong legal
umbrella. To answer these complaints, the government adopted a policy by issuing Law Number 2 of 2012 concerning Land
Procurement for Development in the Public Interest.
The government hopes that the issuance of this law will become a strong legal umbrella to facilitate the implementation of
infrastructure development in the public interest and at the same time be able to provide legal protection to rights holders, but this still
needs to be explored further to address issues related to land acquisition policies which at the same time protects the landowning
community. The increase in population in Indonesia will have implications for the increasing need for public facilities related to
transportation, housing, education, and so on. Fulfillment of these facilities can not be separated from the need for land as one of the
authorized capital. There are almost no development activities that do not require land, so land plays an important role, even the
success and failure of physical development is largely determined by the availability of land.
The government as the holder of the right to control the country, in order to fulfill the needs of the land the government has
an obligation to hold it. Based on paragraph 33 of the 1945 Constitution, it is evident that the relationship between the state and the
earth, water and natural resources contained therein is a relationship of control, not ownership. This is very different from colonial
agrarian law which creates ownership relations between the state and land, with the existence of the principle of domein verklaring
being reflected. The aim is to improve the welfare and prosperity of the people, in accordance with the ideals of the Indonesian nation
when it freed itself on August 17, 1945 from dependence on other nations that have controlled, exploited, and drained the Indonesian
nation and all of its natural wealth which is the right of the Indonesian people (Daniswara K. Harjono, 2010). Obviously, the ideals of
the Indonesian people can be read in the Preamble to the 1945 Constitution of the Republic of Indonesia, particularly in the fourth
paragraph, the formulation is as follows: "Then, in order to form an Indonesian Government that protects all Indonesian people and all
of Indonesia's blood and to promote public welfare, educate the nation's life, and take part in carrying out world order based on
independence, eternal peace and social justice, Indonesian national independence is drawn up. in a Constitution of the Republic of
Indonesia which is formed in an arrangement of the Republic of Indonesia which is sovereign of the people based on the Almighty
God, Humanity that is just and civilized, Indonesian Unity in Democracy led by wisdom in Consultative / Representative, and with
realizing a social justice for all Indonesian people ".
If we look carefully at paragraph IV above, the noble ideals of the Unitary State of the Republic of Indonesia are contained,
namely "a just and prosperous society". Sumario Waluyo stated that "the ideal of a just and prosperous society in the life of the
Indonesian people is a central problem throughout history. In this connection, fair and prosperous are two pairs of words that are not
released in the philosophy of society and are their life goals. Fair is the main emphasis and is always mentioned before the word, while
prosper is an affirmation and priority that needs to come first "(Sumiaro Waluyo, 1979).
Law Number 5 of 1960 concerning Basic Regulations on Agrarian Principles (Law No. 5 of 1960) in Article 2, states that:
(1) On the basis of the provisions in article 33 paragraph (3) of the Constitution and matters as referred to in article 1, earth,
water and space, including the natural resources contained therein are at the highest level controlled by the State, as power
organization of the whole people.
(2) The controlling right of the State referred to in paragraph (1) of this article authorizes:
a. regulate and carry out the designation, use, supply and maintenance of the earth, water and space;
b. determine and regulate legal relations between people and earth, water and space;
c. determine and regulate legal relations between people and legal actions concerning earth, water and space.
(3) The authority derived from the right to control from the State in paragraph (2) of this article is used to achieve the greatest
prosperity of the people, in the sense of happiness, prosperity and independence in society and the free, sovereign, just and
prosperous Indonesian rule of law.
(4) The controlling right of the said State can be empowered by the autonomous regions and traditional law communities, only as
necessary and not in conflict with national interests, according to the provisions of Government Regulations.
Provisions of Article 2 of Law No. 5 of 1960 above means that the state is given the authority to regulate, organize allotment and use
of BARA. To meet the demands it is not uncommon that land owned or controlled by legal subjects as private rights is subject to the
fulfillment program. So through legislation made by the government, the takeover of private rights is carried out on the grounds for
public interest. There are three ways that can be done by the state to meet these needs, namely first, done in the usual way, namely
through buying and selling, exchanging, and others; secondly, it is carried out through land acquisition institutions; and third, is
carried out through institutions that revoke land rights.
Development activities are not only the responsibility of the government, but also the active role of private companies and the
community in general is needed. To carry out development activities can not be separated from the need for land as a container of its
activities.
Specifically to meet the need for land for the government and private companies, it is unlikely to use land that is directly
controlled by the state due to limited land availability. As a way out is to use land rights by providing compensation to holders of land
rights.

International Journal of Scientific and Research Publications, Volume 10, Issue 1, January 2020 642
ISSN 2250-3153
http://dx.doi.org/10.29322/IJSRP.10.01.2020.p9797 www.ijsrp.org
Activities to obtain land by providing compensation to those entitled to land are known as land acquisition. According to his
interests, land acquisition is carried out for interests of the government or government agencies and land acquisition is for the benefit
of private companies.
Land acquisition for government interests is carried out with the assistance of the Land Procurement Committee formed by
the Governor, while land acquisition for the interests of private companies is carried out directly by the private company without the
assistance of the Land Procurement Committee.
Land acquisition for the benefit of the government or government agencies is better known as the acquisition of land for
public purposes, which is regulated in Presidential Decree Number 55 of 1993 concerning Land Procurement for the Implementation
of Development in the Public Interest (Presidential Decree No. 55 of 1993). Following up as the implementation of this Presidential
Decree, Minister of Agrarian Regulation / Head of National Land Agency No. 1 of 1994 was issued concerning the Provisions for the
Implementation of Presidential Decree Number 55 of 1993 concerning Land Procurement for Implementation of Development for the
Public Interest (Agrarian Regulation of the Head of BPN Number 1 of 1994).
Land Procurement for Public Interest is finally regulated by Law Number 2 of 2012 concerning Land Procurement for
Development in the Public Interest (Law No. 2 of 2012) and Government Regulation Number 40 of 2014 concerning Amendments to
Presidential Regulation Number 71 of 2012 concerning Procurement Implementation Land for Development in the Public Interest.
Land acquisition under the pretext of being in the public interest, sometimes injures the community, including the Customary
Law Community (MHA), because the use of land taken by the government is not as originally planned, and even tends to give birth to
the misery of the community which was once the rights holder. Not infrequently under the pretext of public interest, MHA land is used
to fulfill these needs, for example the needs of industrial development, the construction of shopping centers that are only used by a
handful of groups. Likewise, it is not uncommon for land acquisition to leave legal problems. According to Gunanegara, problems
related to land acquisition are not only juridical issues, but also develop into socio-cultural and economic-political problems.
(Gunanegara, 2008).
An interesting thing to study is the existence of MHA land rights as a result of land acquisition for development. MHA is a
party that is very vulnerable to land acquisition activities for development in the public interest. Under the pretext in the public
interest, MHA rights are often taken over without any effort to replace with other land ownership rights.
In addition, it is also interesting to study the criteria of public interest, specifically how the laws and regulations relating to
land acquisition for development purposes have set these criteria. Without clear criteria on the public interest, various interpretations
can be created to fill the criteria. If this is done, it is not impossible that every activity can be shaded under the pretext of public
interest. It will further make land rights holders the victims.
Investment opportunities that are wide open in Indonesia, including in Maluku, provide the possibility of the acquisition of
MHA rights by the Government, Regional Governments and the private sector for development and investment on the pretext of
public interest. Many cases arising between the Government, Regional Government and the private sector with MHA related to the
implementation of development and investment on land which is the property of the MHA. The cases that occurred such as in West
Seram District (Tanahnahu District, in Southwest Maluku District (Romang Island). In addition, the planned implementation of the
Masela block also in time also did not rule out a conflict of interest with the MHA.
A. Problem Formulation
1. How is the philosophical protection of customary community land rights?
2. What is the existence of customary community land rights in land acquisition for public use?
B. Research Objectives
1. Analyze and discover the philosophical basis of the protection of the ownership rights of indigenous and tribal peoples.
2. Analyzing and finding the existence of customary community ownership rights in land acquisition for public interest
C. Research Benefits
Theoretically, the results of this study are expected to contribute constructive thinking to the development of legal science,
particularly state administration law and state administration law related to the state's responsibility for the protection of all people.
Practically, the results of this study can be a reference for the Government and Regional Governments in carrying out development,
particularly in the acquisition of land for development in the public interest.
2. RESEARCH METHOD
A. Research Type
This type of research is normative juridical research. Normative juridical research is a legal research method carried out by examining
mere library or secondary material. (Soejono Soekanto and Sri Mamudji, 2007)
B. Problem Approach

International Journal of Scientific and Research Publications, Volume 10, Issue 1, January 2020 643
ISSN 2250-3153
http://dx.doi.org/10.29322/IJSRP.10.01.2020.p9797 www.ijsrp.org
The first problem is using normative legal research with a philosophical approach to study and analyze the philosophical protection of
the rights of indigenous peoples. The second problem uses normative legal research using a conceptual approach and case studies to
determine the existence of customary law community property rights in land acquisition for public use.
C. Sources of Legal Materials
The source of legal material in this study comes from library research, where library research uses primary legal materials, secondary
legal materials and tertiary legal materials. Primary legal material is material whose contents are binding because it is issued by a
government or agency that has authority. And secondary legal sources are materials in the form of books and other printed materials,
and software, namely by accessing a number of data via the internet (downloading) various books, scientific journals and research
results, and tertiary legal materials are legal materials that are supporting primary and secondary legal materials. (Devi K. G Sondakh,
2009).
D. Legal Materials Collection Techniques
In this study, the legal material collection techniques used are primary legal materials and secondary legal materials. Secondary legal
materials include materials that support primary legal materials such as text books, articles in various scientific magazines or research
journals in the field of law, papers submitted in various forms of meetings such as discussions, seminars, workshops, etc. other. To
support or complement this research, the authors also use case studies related to this research.
E. Legal Material Analysis Techniques
Analysis of the materials used in the study was carried out in a qualitative and comprehensive analysis. The analysis of legal material
in this study was carried out using descriptive techniques, clarifying the materials by constructing law and argumentation, which were
then assessed based on reasons of legal reasoning related to the problem.
3. RESULTS AND DISCUSSION
1. Regulation of Customary Law Community Rights According to National Law
In examining the substance of other constitutions that have been applied in Indonesia, such as the 1949 Constitution and the
1950 Constitution, it is certain that such regulation has never been carried out. The mandate of the 1945 Constitution was apparently
not followed up, but what was done was to uniform the original arrangement owned by the indigenous people as "village". Meanwhile,
recognition of the existence of indigenous peoples and customary land rights or customary rights can only be formulated in 15
(fifteen) years. Juridically, the regulation of customary rights in legislation in Indonesia is based on the Indonesian Land Law, namely
Law No.5 Year 1960 concerning Basic Rules of Agrarian Basic Law No. 1960 104. September 24, 1960. With the enactment of Law
no. 5 of 1960, then there was a change in Indonesian Agrarian Law. With UUPA. The colonial legal regulations were abolished and
the dualism of the Agrarian Law was ended which consisted of regulations that originated in western law and which guaranteed legal
certainty for all Indonesian people. Our agrarian law is then based on one legal system, namely Customary Law, as the original law of
Indonesia, (Boedi Harsono, 1971) which is clearly formulated in article 3 paragraph (3) of the 1945 Constitution as the foundation.
The main objectives of the Agrarian Law in general explanation are:
a. Laying the groundwork for the drafting of national agrarian law, which will be a tool to bring prosperity, happiness and
justice to the State and the people, especially peasants, in the framework of a just and prosperous society;
b. Laying the groundwork for establishing unity and simplicity in land law;
c. Laying the groundwork to provide legal certainty regarding land rights for the people as a whole.
Customary Law as the basis for the establishment of the National Land Law has 2 (two) positions, namely:
1) Customary Law as the main basis
The appointment of Customary Law as the main basis in the formation of National land law can be concluded in the
Consideration of UUPA letter (a), viz "In connection with what is stated in the above considerations, the need for national agrarian
law, which is based on customary law on land, is simple and guarantees legal certainty for all Indonesian people, without ignoring
elements that are aware of religious law"
"Naturally the new agrarian law must be in accordance with the legal awareness of the people at large. Therefore, the Indonesian
people are partly scattered subject to Customary Law, so the new agrarian law will also be based on the provisions of customary law,
as original law, people in a modern country and in relation to the international world, and adapted to Indonesian socialism . As it is
understood, customary law in its growth cannot be separated from political influence and colonial society which is capitalist and
feudal society. "
2) In connection with the incomplete written National Land Law, the Customary Law norms serve as a supplement. This is
stated in the UUPA article, namely:
"As long as the law regarding ownership rights as referred to in Article 50 paragraph (1) has not yet been formed, then the
provisions of the local Customary Law and other Regulations concerning land rights which give authority as or similar to the intended
in Article 20, as long as it does not conflict with the soul and the provisions of this Law. "

International Journal of Scientific and Research Publications, Volume 10, Issue 1, January 2020 644
ISSN 2250-3153
http://dx.doi.org/10.29322/IJSRP.10.01.2020.p9797 www.ijsrp.org
Recognition of customary law as the basis for national agrarian law is expressly stated in Article 3 and Article 5 of the UUPA In
Article 3 it reads as follows:
Bearing in mind the provisions in Articles 1 and 2 of the implementation of customary rights and similar rights of the Customary Law
communities, as long as in reality they still exist, must be such that they are in accordance with national and state interests, which are
based on national unity and are not may conflict with laws and other high regulations.
In Article 5 also stated as follows :
Agrarian Law that applies to earth, water and space is Customary Law, as long as it does not conflict with national and state interests,
which are based on national unity, with Indonesian socialism and with the regulations contained in this Act with other laws and
regulations, everything by heeding the elements that rely on religious law.
Based on the provisions in Article 5 of the UUPA, the applicable land law is Customary Law with certain limitations. The existence of
these requirements implies that the Customary Law is located as a supplementary law. Requirements and restrictions on the enactment
of Customary Law and national land law are explicitly contained in article 5 of the UUPA, namely:
1. Does not conflict with national and state interests.
2. Does not conflict with Indonesian socialism.
3. Does not conflict with the provisions contained in the UUPA itself
4. Does not conflict with other agrarian regulations.
5. Must heed the elements that rely on religious law.
In connection with the recognition of customary rights or communal rights of customary law communities in Article 3 of the UUPA it
can be stated that there are 2 (two) conditions, namely:
1. Its existence
In terms of the existence of customary land rights or customary rights recognized as long as in reality they still exist. Thus if in areas
where there are no more customary rights, then of course the customary rights will not be revived, and of course in areas where there
are no customary rights will not be given new customary rights.
2. Implementation
In terms of implementation, if in reality it still exists, the implementation of customary community customary rights must be such that
it is in accordance with national and state interests, which are based on national unity. The exercise of customary rights or customary
rights of customary law communities is also customary or may not conflict with other higher laws and regulations. (Boedi Harsono,
1971)
However, by adhering to the conception originating in Customary Law, it would be fair if the criteria for determining the existence of
customary rights are based on the existence of 3 (three) elements which must be fulfilled simultaneously, namely:
1. The subject of customary rights, namely the customary law community, which fulfills the characteristics of termination;
2. Objects of customary rights, namely territorial land which constitutes their lebensraum;
3. The existence of certain authority from the customary law community to manage the land of their territory, intended to
determine the relationship that is pleasing to the supply, establishment, and utilization, as well as the preservation of the
territory's land. (Maris Sumardjono, 2006).
Concerning customary law must not contradict other higher and higher laws and regulations, according to Gautama, (Sundargo
Gautama, 1990) that:
"Customary law may not conflict with the provisions contained in the UUPA. An outline of the UUPA has been outlined what
constitutes the main joints of the new national agrarian legislation. Customary law which is declared to apply to land rights must not
conflict with the principles stated in the UUPA. This also means that where in the UUPA are formulations of new rights regarding
land, then these formulations apply, if there is no conformity between the Customary Laws on rights similar to rights new rights in the
UUPA and the formulation of UUPA itself. In addition to the formulation contained in the UUPA it will be used as a guide for the
perpetrators of law ".
In general explanation II number 3 relating to article 3 of the UUPA, it states that this provision first stems from the
recognition of the existence of customary rights in the new agrarian law. As is known, despite the fact that customary rights exist and
apply and are taken into account in judges' decisions, such rights have never been formally recognized in the law, with the result that
in implementing agrarian regulations, customary rights in ancient times were often ignored.
Due to the mention of customary rights or the rights of indigenous peoples in the basic agrarian law, which in essence also means
recognition of these rights, then the customary rights will be considered, as long as these rights are in fact still in the legal community
concerned. For example, in the granting of land rights (for example, for business purposes), the legal community concerned will be
heard beforehand and will be given an "recognitie". Which indeed he has the right to accept as the winner of the Customary Rights.
The existence of customary community rights is recognized by the UUPA, but it does not provide clear boundaries regarding
whether or not customary rights exist in customary law communities. The UUPA allows the regulation of customary rights to continue
according to local customary law. The lack of clarity about the existence of customary rights or customary rights can cause problems
between the customary law community and the government. For this reason, it is necessary to clarify the customary rights regulation
regarding customary rights related to the position, understanding and content of the National Defense Law system.
As stressed by Simarmata (Rikardo Simarmata, 2007) that the form of recognition of customary rights is more "conditional
recognition". That means, customary rights held by indigenous peoples can only be done "as long as in reality they still exist, do not
conflict with national interests, and may not conflict with other laws and regulations that are higher." The concept of conditional

International Journal of Scientific and Research Publications, Volume 10, Issue 1, January 2020 645
ISSN 2250-3153
http://dx.doi.org/10.29322/IJSRP.10.01.2020.p9797 www.ijsrp.org
recognition of the indigenous peoples' knowledge which was introduced by the UUPA and then followed by standard legislation
afterwards actually has narrowed the space for what was mandated in article 18 of the 1945 Constitution before the amendment.
The concept of conditional recognition of customary rights or customary rights owned by indigenous peoples also took place
in the early days of the new order, especially when a number of laws were issued such as law number 5 of 1967 concerning forestry
article 17, and law number 11 of 1967 concerning the basic provisions of mining which have been amended by law number 4 of 2009
concerning mineral and coal mining. Both of these laws have clauses of recognition of indigenous peoples but as long as they remain
in reality and do not interfere with the achievement of the objectives of the law. It is this style of recognition that makes the forestry
law not optimally provide indigenous peoples with basic freedoms but rather sets boundaries that are increasingly difficult for
indigenous peoples to reach.
After waiting for about 55 (fifty-five) years, it was only in 2000 that a second amendment to the 1945 Constitution resulted in
a new clause regarding indigenous peoples. Article 18B Paragraph (2) of the 1945 Constitution as a result of the amendment confirms
that: "The state recognizes and respects the customary law community units along with their traditional rights as long as they are still
alive and in accordance with the development of the community and the principles of the Republic of Indonesia, which are regulated
in the law. ”A similar style of regulation and recognition is also carried out in the provisions of MPR Number XVII of 1998
concerning Human Rights; Article 6 paragraph (2) of Law no. 39 of 1999 concerning Human Rights; and Regulation of the Minister
of Agrarian Affairs / Head of BPN No. 5 of 1999 concerning Guidance to adjust the Customary Community Rights issue.
Recognition and respect for customary rights are contained in various regulations including regional regulations (PERDA)
that use the legal basis relating to the authority to make regulations and the legal basis relating to the material regulated in these
regulations. Examples of some areas that regulate recognition and respect for customary rights are regional regulations of Kampar
district number 12 of 199 concerning customary rights; lebak district regulation No. 32/2001 concerning protection of the customary
rights of the Baduy community; West Sumatra Regional Regulation No. 6 of 2008 concerning customary land. Some areas that are
drafting Tobelo Land Rights Regulations, North Halmahera Land Rights Regulations.
Recognition of the customary rights of indigenous and tribal peoples was issued in 2001 through the provisions of the MPR
Republic of Indonesia No. IX / MPR / 2001 concerning the reform of Agrarian Law and Natural Resource Management.
Article 5 MPR Decree No. IX / MPR / 2001 determines, inter alia: in sub e: "developing democracy, legal compliance,
transparency and optimization of people's participation; in realizing justice in the experience, ownership, use, utilization and
maintenance of agrarian and natural resources "; and in sub f: "maintaining sustainability that can provide optimal benefits, both for
present and future generations, by being prepared to pay attention to the capacity and support of the environment" and in sub g
"carrying out social functions, sustainability, and ecological functions in accordance with social conditions local culture ", and by
continuing to" respect and uphold human rights "(sub c); "Respect the rule of law by accommodating diversity in law unification" (sub
c). the special thing that is put forward in article 5 of TAP MPR No. IX / MPR / 2001 is as set out in point j, namely: recognizing and
respecting the rights of indigenous peoples and national cultural diversity over agrarian and natural resources. "
Based on the view above it can be concluded that the existence of natural resource law and environmental law can still be
seen as two sides of one currency. Both can only be distinguished but can not be separated. [Ronald Z Titahelu, 2005].
If in the previous thinking the rights to natural resources were emphasized as the rights of the government and entrepreneurs
based on fulfilling the interests of the State's foreign exchange earning and priorities in the private sector to be able to try freely, then
in the current development opportunities for business must also be expanded in a balanced way by including the people's rights as
referred to in item j of MPR Decree No. IX / MPR / 2001 above: "recognizing and respecting the rights of indigenous peoples and the
nation's cultural diversity of agrarian resources and natural resources", and developing democracy, legal compliance, transparency,
and optimization of people's participation.
This style of conditional recognition of indigenous peoples was immediately followed by Law No. 41/1999 concerning
forestry and various other regulations concerning plantations, water resources management, coastal management, and small islands,
utilization and preservation genetic resources, mining, natural resource management and others. As with previous legal products, all
legal products produced in this reform era did indeed recognize indigenous peoples and their customary rights, but still set conditions,
that the new rights could be recognized: (1) as long as in reality they still existed; (2) in tune with the times; (3) does not conflict with
national interests; and (4) must be confirmed by local regulations (Rikardo Simarmata, 2007) Ownership and authority to manage
natural resources in the hands of the government, private sector and local communities. For example, forests are known as state
forests, private forests and also community forests, including customary forests. Even though Law No. 41 of 1999 does not prioritize
community forestry referred to as customary forest as a separate category, but recognition of the existence of community forestry is a
condition for the development of the people's economy. Another example is management of the coast and the sea. The authority
granted by Law No. 22 of 1999 concerning regional governments, heads of provincial and district / city governments as well as
villages, is a good opportunity for each local government to manage existing coastal natural resources. Even for island regions, both
island provinces and island districts, authority can also be exercised over sea areas between islands. (Law Number 6 of 1996).
For example, although seaweed cultivation is carried out by coastal fishing communities. Likewise with the creation of a Sea
Protection Area (a kind of Marine Proctection Area or area called a sanctuary), as well as seaweed cultivation efforts, the creation of a
Sea Protection Area, and so on cannot be said to be traditional activities. Although it is well known that in some countries it is known
as sasi (in Southeast Maluku), and mane's (in Talaud) and eha (in sangir) which are traditional in nature, activities to organize marine
protected areas and so on. In Kalimantan there are rattan forests which are cultivated by the local community. In Lampung, it is known
as Repong Resin. In certain places near Jayapura, West Papua, it is known that there is a "Coffee Forest" which is cultivated by local

International Journal of Scientific and Research Publications, Volume 10, Issue 1, January 2020 646
ISSN 2250-3153
http://dx.doi.org/10.29322/IJSRP.10.01.2020.p9797 www.ijsrp.org
indigenous people. In Central Maluku it is known as "dati dati" or "dusun" in Seram. The rights that are above can be found in the
knowledge of the local Customary Law.
2. Customary Law Community Rights According to Customary Law
Land has a very important position in human life, especially for the Customary Law community. The relationship between
the land and the community itself always occurs in a variety of interests, the land used as a place of settlement, for the purpose of
making fields, a place to take the results, a place to gather with others or a place of worship or for worship. This legal community's
right to land is called land rights or customary rights. (Bushar Muhammad, 2006). The use of the term Customary Rights was first
introduced by Van Vollenhoven, a Dutch legal expert named beschikkingsrecht who described the relationship between the legal
community and the land itself.
According to Ter Haar: beschikkingsrecht (beschkkingskring) as an environment everywhere practically has a term: the term
is a term for the environment of "beschikkingsrecht" both as belonging - petuanan (Ambon) - and as a food-producing area -
panyampeto (Kalimantan) - or as a field which is fenced off (Kalimantan), wewengkon (Java), prabumian (bali), or as forbidden land
for others - tatabuan (Bolang Mongodow). Then there are terms like torluk (Angkola), limpo (South Sulawesi), nuru (Buru), payar
(Bali), paer (Lombok), Ulayat (Minangkabau)
With regard to the rights of indigenous peoples to certain areas or what is commonly referred to as Customary Rights, the
discussion refers to geographical units. Whereas when it comes to rights, the authorities or authorities that are based on the willingness
to do or not do something above customary territory are covered. (Ronald .Z. Titahelu, 2008). As such, Customary Rights refer to a
relationship between indigenous peoples and certain territories. The relationship between customary law communities and their
customary lands gives birth to customary rights, and the relationship between individuals over land. (Boedi Harsono, 2003) Regarding
this relationship, Ter Haar (Ter Haar Bzn-K. Ng.Soebakti Poespono) states:
"The living relationship between human beings who are regularly arranged and related to one another on the one hand and the land on
the other, that is, the land where they dwell, the land that feeds them, the land where they are buried and which is the residence of the
refined protectors. along with the ancestral spirits of the land which permeates the life force, including the life of the Ummah and
therefore depend on it, such affinity is felt and rooted in his "completely paired" mindset (participerend denken) that should be
considered a legal relationship (rechtssbetrekking) humanity is against the land. "
The relationship that exists between customary law communities and land as a unity that cannot be separated as a legal
alliance. The legal alliances (rectsgemeenschappen), namely, "organized groups are permanent by having their own power, also their
own wealth in the form of objects that appear to be rights and not seen". (Ter Haar Bzn-K. Ng.Soebakti Poespono). It is clearly seen
that to be called a legal alliance must meet several elements, namely: 1) the existence of unity; 2) has a fixed area; 3) has its own
power; 4) has own wealth. In the form of objects that are visible or not.
Customary Rights are basically a right of alliance on occupied land, while the implementation is carried out both by the
community itself and by the head of the association on behalf of the alliance. In general the customary area is an area in which there
are parts which are naturally manifested in a single unit that are interrelated and inseparable. With this naturally formed geographical
condition, what becomes the object of the Customary Rights consists of land space, waters that include lakes, rivers and coastal and
marine waters, plants that live wild (trees that can be used both for wood burn or for carpentry needs). Customary territory in
customary law community units in Indonesia are generally located on land along the land in the Dutch Colonial. There are some
benefits to this, but there are also disadvantages. The beneficial influence certainly provides protection for the Customary Rights of its
territory. For example, the charter letters issued by the kingdoms which meant to emphasize the boundaries of the relevant fellowship
concerned. This kind of thing also existed in the Dutch colonial government, namely with the announcement of "ordinances": such as
the village of Staatblaad 1941 No.356 and the clans of Staatblaad 1931 No.6
As a legal alliance in defending their customary rights, basically the customary law community still practices habits
repeatedly accompanied by certain sanctions, in utilizing the natural resources in them, both on land and on the coast, which are
needed for Their life. Activities that utilize natural resources both on land and in coastal areas that are on the surface and that are in the
ground show a tendency for environmental maintenance to damage, habits that are practiced repeatedly in various regions show
variations that tend to be individualistic , although in some villages it still shows communal character.
Meanwhile, the natural mineral wealth in the bowels of the earth that can be mined such as gold, or natural resources in the
form of underground water, and natural resources in the form of energy, are all in the customary territory. On top of this customary
territory, there is unity of activity from the community. Unity of activity in the economic, social, cultural and even political areas, and
settlements within ulayat areas is essentially based on principles inherited from the ancestors of the local customary law community,
which inheritance characterizes differences influenced by the previous government system, such as the sultanate , and also differences
in the characteristics of tenure and land use among the spheres of society.
3. Customary Law Community Rights in Land Procurement for Public Interest
The right to control land by the state in Indonesia is contained in Article 33 paragraph (3) of the 1945 Constitution which
reads: The earth and water and the natural resources contained therein are controlled by the state and used for the greatest prosperity of
the people. Before the amendment of the 1945 Constitution, Article 33 paragraph (3) was explained in the explanation of Article 33

International Journal of Scientific and Research Publications, Volume 10, Issue 1, January 2020 647
ISSN 2250-3153
http://dx.doi.org/10.29322/IJSRP.10.01.2020.p9797 www.ijsrp.org
paragraph 4 which read: Earth and water and natural resources contained therein are the main points of people's prosperity. Because it
must be controlled by the state and used for the greatest prosperity of the people.
Authentic explanation of the understanding of the earth, water and natural resources contained therein (called natural
resources, hereinafter abbreviated as SDA) is controlled by the state, contained in Law No. 5 of 1960 concerning "Basic Regulations
on Agrarian Principles" or better known as the "Basic Agrarian Law" hereinafter abbreviated as UUPA came into force on September
24, 1960. Article 2 of the UUPA which is the implementing regulation of Article 33 paragraph (3) of the Constitution, explain the
definition of the right to control natural resources by the state.
In accordance with General Explanation II / 2 of the UUPA, the words "controlled" in this article do not mean "owned", but
rather are understandings, which give authority to the state, as the power organization of the Indonesian nation, to the highest degree:
a. regulate and carry out the designation, use, inventory and maintenance;
b. determine and regulate the rights that can be owned over (part of) the earth, water and space;
c. determine and regulate legal relations between people and legal actions concerning earth, water and space.
d. Everything with the aim of achieving the greatest prosperity of the people in the framework of a just and prosperous society.
Thus, according to the concept of the UUPA, the notion of being "controlled" by the state does not mean "possessed", but rather the
right that authorizes the state to regulate the three things mentioned above. The contents of State authority originating from the right to
control natural resources by the state are merely "public" in nature, namely the authority to regulate (regulatory authority) and not the
authority to physically control land and use its land as the authority of the holders of land rights that are "private" . The legal
relationship between the state and land gives birth to the right to control land by the state. (A.P. Parlindungan, 1982). The relationship
between customary law communities and their customary land gives birth to customary rights, and the relationship between individual
and land gives birth to individual rights over land. (B. Harsono, 2003). Ideally the relationship between land rights by the state,
customary rights and individual rights to land is harmonious and balanced. That is, the three rights are the same position and strength,
and do not harm each other, but the statutory regulations in Indonesia, giving large powers and unclear boundaries to the state to
control all land in the territory of Indonesia.
As a result, there is a dominance of the state's right to control land over customary rights and individual rights to land,
thereby giving the state an opportunity to act arbitrarily and potentially violating customary rights and individual rights to land. One of
the authority of the state that comes from the right to control land by the state is to give a right to land or other rights to people, both
alone and with other people, as well as legal entities. The granting of this right may violate the customary rights of customary law
communities which are recognized, respected and at the same time denied by the laws and regulations that deny customary rights.
Laws and regulations in Indonesia, in addition to those who recognize and respect customary rights as in the UUPA, there are
also those who deny the customary community's customary rights. The denial is carried out by denying the existence of customary
land which is declared as state land. With the claim of customary land as state land, it causes the loss of the rights of the customary
law community / customary law community members based on their customary rights, because those rights are on the customary land.
Therefore, denial of customary land also means denial of customary community customary rights. Laws and regulations that
deny customary land include: Law Number 5 of 1967 concerning "Basic Forestry Provisions"; Law Number 41 of 1999 concerning
"Forestry"; Law Number 11 of 1967 concerning "Basic Mining Provisions"; and Law Number 22 of 2001 concerning "Oil and Gas.
Related to the government's authority to regulate the use, designation and provision of land, private rights crystallized in
various rights as stipulated in Article 6 of the UUPA must comply with regulations based on state control over the land and natural
resources contained therein . Included in this case is the right of ownership of citizens' land can be taken over or revoked in order to
meet the needs of land intended for the implementation of development activities in the public interest. Considering that land
acquisition involves individual or community rights, land acquisition must pay attention to the principle of justice so that it does not
harm the original owner.
One of the basic principles of universal land acquisition is "no private property shall be taken for public use without just and
fair compensation", meaning that the process of land acquisition is carried out with honest and fair compensation. However, in
practice these principles are often ignored and the government as the organizer of the state puts forward its power by using the shield
of the right to control the state and the public interest.
Efforts to bridge the people's interest in their land and fulfill the needs of land for activities have been carried out by the
government by issuing Presidential Regulation No. 36/2005 concerning Land Procurement for Implementation of Development in the
Public Interest in lieu of Presidential Decree No.55 of 1993. Initially Presidential Regulation No. 36/2005 the controversy stemming
from an overly broad definition of public interest and guarantees of compensation for communities whose lands were taken over for
development activities in the public interest.
But with the issuance of Presidential decree No. 65 of 2006 concerning Amendment to Presidential decree No. 36 of 2005,
the definition of public interest is relatively firmer and has legal certainty, namely with the reduction in the types of public interest
from 21 (twenty one) to 7 (seven) types and the affirmation of restrictions on land acquisition for public interest is limited to public
interests carried out by the Government or Regional Government which is subsequently owned or will be owned by the Government
or Regional Government.
Another important thing that should be underlined is that in the Presidential decree it is no longer possible to procure land for
the implementation of development in the public interest through the revocation of land rights. This means that the government
provides protection to the community not to take over their land rights by force but through the mechanism of releasing or
surrendering of land rights carried out through consultation and agreement of the parties concerned.

International Journal of Scientific and Research Publications, Volume 10, Issue 1, January 2020 648
ISSN 2250-3153
http://dx.doi.org/10.29322/IJSRP.10.01.2020.p9797 www.ijsrp.org
The community basically does not mind if their land should be taken over for development purposes that aim for the common
welfare, but the practice of expropriation of land so far has often been used by certain groups for their own benefit under the guise of
the public interest, creating doubts in the community every time land acquisition activities are in the public interest. In the future, it is
important to consider that land acquisition should not only be seen from the results, but also the process. For every development
activity, whether carried out by the Government / Regional Government or the private sector, as long as it has an impact on reducing
the socio-economic welfare of land rights holders, the procedures must be regulated in law.
Considering that this Presidential decree is problematic, both in terms of substance and its existence and has the potential to
not apply sociologically, it is necessary to postpone its enforcement. To prevent legal vacuum, Presidential Decree No. 55/1993 was
reinstated for a while until the enactment of the law on land acquisition. It is true that after the enactment of Law No. 10/2004
concerning the Formation of Laws and Regulations, the issuance of presidential decree is no longer possible (Article 7). But
presidential decree No. 55/1993 which should have remained in force if it had not been replaced by this problematic Presidential
decree, could be reinstated by reading the Presidential Decree as a Presidential Regulation in accordance with Article 56 of Law No.10
/ 2004.
Another thing that needs attention is regarding "proper compensation losses in the manner regulated by the law", the
government as the party that takes the policy based on public interest, sometimes ignores the rights of the people holding the rights to
the land. Respect for land rights is of course also for the holders of their rights. Therefore, the release and acquisition of land held by
indigenous peoples or customary land must also be carried out in accordance with the correct procedures and the determination of
appropriate compensation. The United Nations Conference on Environment and Development, held in Rio de Janeiro in June 1992,
produced a new development for indigenous peoples regarding their relationship with the United Nations. The conference recognized
that indigenous peoples and their communities have a very important role in environmental management and development, based on
their knowledge and traditional practices.
It was emphasized that efforts in national and international scope to implement sustainable and environmentally oriented
development must recognize, accommodate, advance and strengthen the role of indigenous peoples and their communities. Article 26
of Agenda 21 (the program of action set forth at the conference) is intended for indigenous peoples. Indigenous peoples meet in the
Earth Summit, which is the largest non-governmental organization forum. The forum adopted the Kari-Oka Declaration, a declaration
on the environment and development. One of the results of the forum was the signing of the Convention on Biological Diversity which
included conditions relating to indigenous peoples. (B. Harsono, 2003).
On June 29, 2006 the United Nations Declaration on the Rights of Indigenous Peoples was agreed upon by the United
Nations Declaration on the Rights of Indigenous Peoples. This declaration is progressive because it recognizes important foundations
in the protection, recognition and fulfillment of the rights of indigenous peoples. This declaration contains recognition of both
individual and collective rights of indigenous peoples, the right to cultural identity, the right to education, health, language and other
basic rights. This declaration recognizes the right of indigenous peoples to self-determination, and recognition of the rights of
indigenous peoples to land, territories and natural resources and participation in development. As Human Rights, general rights apply
the general doctrine of the state's obligation to respect (to respect), protect (to protect) and fulfill (to fullfil) the customary rights of
indigenous peoples.
Look at instruments of international human rights law on economic rights. Many social and cultural related to customary
rights, the government must take positive action in the form of a series of actions in respecting, protecting, fulfilling customary rights
and enforcing legal rights against violations of rights that occur. Indonesia as one of the countries that signed the declaration has the
mandate to adopt it in Indonesian national law. The package of four amendments to the 1945 Constitution (1999-2002) became the
space where the battle of ideas took place. There are at least two components related to the relationship between indigenous peoples
and natural resources (customary rights) and the relationship between the state and natural resources, which must be seen as a link.
The linkage stems from the assumption that "rights" are formal, relational and discretive themes.
The most important progress from the recognition of customary rights in the Constitution in Indonesia was found as a result
of the second amendment to the 1945 Constitution of the Unitary State of the Republic of Indonesia. Article 18 B paragraph (1) and
paragraph (2) of the 1945 Constitution of the Unitary State of the Republic of Indonesia stated:
a. The state recognizes and respects special or special regional government units that are regulated by law.
b. The state recognizes and respects the customary law community units along with their traditional rights as long as they are still alive
and in accordance with the development of the community and the principles of the Unitary State of the Republic of Indonesia, which
are regulated in law.
The above provisions separate the special and special governance issues that are regulated by law (Article 18B paragraph 1)
from the issue of customary rights and limitations (Article 18 paragraph 2). All this time, customary issues have often been linked to
rights to natural resources drawn from the royal system in the past. The separation between Article 18B paragraph (1) and Article 18B
paragraph (2) gives an important meaning to distinguish between the forms of community (customary) community and the old "royal"
government that is still alive and can be special.
Even though they have recognized and respected the existence of customary law communities and their customary rights,
declaration of Article 18B paragraph (2) includes several requirements that must be fulfilled by a community in order to be
categorized as customary law communities and their customary rights which can be safely enjoyed. The cumulative requirements are:
a. As long as it's alive.
b. In accordance with the development of society.

International Journal of Scientific and Research Publications, Volume 10, Issue 1, January 2020 649
ISSN 2250-3153
http://dx.doi.org/10.29322/IJSRP.10.01.2020.p9797 www.ijsrp.org
c. In accordance with the principles of the Republic of Indonesia.
d. Regulated in the law.
Rikardo Simarmata said that the requirements for indigenous peoples and their traditional rights carried out by the 1945
Constitution after the amendment had a history that could be traced back to the colonial period. Aglemene Bepalingen (1848),
Regering Regulations (1854) and Indische Staatregeling (1920 and 1929) said that native and eastern foreigners who did not want to
submit to European Civil law, were subject to religious laws, institutions and customs of the people, as long as they did not conflict
with generally recognized principles of justice. (Rikardo Simarmata, 2006). Such requirements are discriminatory because they are
closely related to the existence of culture. The orientation of the emerging requirements is an attempt to subdue customary / local law
and try to direct it into formal / positive / national law. On the other hand it also has a presumption that indigenous peoples are
communities that will be "eliminated" to become modern societies, who practice the pattern of production, distribution and
consumption of the modern economy.
Conditional recognition of indigenous peoples in the history of the Republic of Indonesia began with the UUPA, the old
forestry law, the irrigation law on the new forestry law and several government department and government regulations. After the
1945 Constitution of the Unitary State of the Republic of Indonesia adopted four requirements for indigenous peoples, various laws
that were born after the amendment followed the flow, among others by the water resources law, the fisheries law and the plantation
law. This conditional recognition indicates that the government still has not seriously made clear provisions to respect and recognize
the customary rights of indigenous people.
The regulation of indigenous peoples and their customary rights to date is unclear and unclear. It is not clear because there
are no concrete rules about what are the rights, rights associated with the existence of society that can be enjoyed. It is said to be
indecisive because there is no enforcement mechanism that can be taken in fulfilling the rights of indigenous peoples, which can be
prosecuted before the court (justiciable). The lack of clarity and uncertainty occurs due to two things, namely the inability and
unwillingness of the government to make general provisions regarding the recognition (rights) of indigenous peoples. Not able to
because the alliance of indigenous peoples in Indonesia is very diverse based on the distribution of islands, social systems,
anthropological and religious. Do not want to because a vague arrangement about the community gives space for discretion and
hegemony to the government to be able to manipulate the community's original rights in the interests of exploitation of natural
resources in the territory of indigenous peoples.
This unwillingness benefits the authorities and disadvantages the indigenous people. The requirements in Article 18B
paragraph (2) along with a series of requirements that are continued by several natural resource laws indicate that the country cq. the
new government can recognize and respect the customary rights of indigenous peoples declaratively, not yet up to legal action to
protect and fulfill so that the customary rights of indigenous peoples can be fulfilled. In fact, it has not touched the mechanism of
national law enforcement when there is a violation of customary rights that are considered human rights.
As already stated, the recognition of the existence of customary law communities and their customary rights is contained in
Article 18 B paragraph (2) and Article 28i paragraph (3), but in reality the recognition of the existence of customary law communities
and traditional rights, commonly called customary rights , often inconsistent in the implementation of national development. The
emphasis on customary rights is control over customary land and all its contents by the customary law community. Mastery here is not
in the sense of having but only limited to manage. This can be seen in the laws and regulations issued. In Act Number 23 of 1997
concerning Environmental Management, Act Number 22 of 2001 concerning Oil and Gas, Act Number 21 concerning Special
Autonomy of Papua, Act Number 18 of 2004 concerning Plantations, and Act Number 41 of 1999 concerning Forestry.
As for example in Law No. 41 of 1999 concerning Forestry, explicitly stated that there are only 2 (two) forest statuses,
namely state forests and private forests. Customary forests are referred to as state forests that are within the territory of indigenous and
tribal peoples. Whereas in reality the customary forest existed before the Republic of Indonesia was established on August 17, 1945,
possibly due to the recognition of the existence or existence of indigenous peoples and their customary rights. The inconsistency is
due to the absence of standard criteria regarding the existence of customary law communities and their customary rights in an area.
Regarding the existence of customary rights (Hermayulis, 2008), states that at least three opinions have developed regarding
customary land, namely; customary land is gone, customary land is still there, and the doubtful opinion is that ulayat land exists and
does not exist. These opinions are generally related to the interests contained therein.
To find out whether customary lands in the territory of customary rights/”petuanan” in Maluku still exist or not, of course,
research and research must be done to show that customary lands as customary rights / “petuanan” along with other rights that fall
within the scope of the “petuanan” area, factually still exists and is still maintained by indigenous and tribal peoples in Maluku, even
though the existence of the customary land rights or land has changed because there are parts of the land that have been removed from
the land due to various things related to development and economic needs of the community
The origins of mastering a guide, according to local history, are diverse in the process in different places or islands, even
though there is a common pattern. The arrival of the first people in a certain place, usually that begins the mastery of a customary
territory. To fulfill their daily needs, these people first cleared a piece of land for houses and gardens, then proceed with the opening of
the surrounding forest for shifting cultivation, hunting, and gathering forest products. Then they put a certain sign (usually natural
signs) at the farthest points they can reach from the center of the settlement. By drawing a straight line from connecting all these
points, then a complete boundary line for a state apparatus has been created.
International Journal of Scientific and Research Publications, Volume 10, Issue 1, January 2020 650
ISSN 2250-3153
http://dx.doi.org/10.29322/IJSRP.10.01.2020.p9797 www.ijsrp.org
In Southwest Maluku, West Southeast Maluku, Southeast Maluku, in general the control over customary land is only in the
STATE, SOA, and HOME EYES. While it is not much different from other regencies, customary land tenure in Central Maluku and
Ambon Island generally recognizes three forms of land rights, namely; state / “petuanan” land, land owned by klen (fam) or land
owned by house (“dati” land) and land owned by the head of the family (heirloom). Thus the customary law community's relationship
with land like this is a dominating relationship, not having a civil status, meaning that where they can occupy the land that's where
they control, and use it collectively. The concept of / “petuanan” land rights is not known to exist individually, and even if there is
individual property, the ownership rights are only on the plot of land which is not absolute. However, in the current development and
economic needs of the community, it is unavoidable to individualize the right to customary lands in Maluku, for example “dati” land,
as a relative's land which according to the norms should not be alienated or permanently transferred in the sense of being sold or sold.
granted to people / legal entities from outside the customary law community concerned, it turns out that now many have been
transferred ownership.
The Maluku traditional law community in general is very respectful and aware that a plot of land cultivated since ancestors is
a customary land from which they live and is subject to binding customary rules. For the Maluku customary law community, the
hometown or the country is indeed not only the location of houses, yards and fields, but also all objects on it (forests, hills, valleys,
rivers and seas) or underground. The whole area is / “petuanan” (from the word "lord" or "owner"), so the word / “petuanan” is
always mentioned by the name of the owner, for example the Hutumuri country, a country located in the Ambon city area. By saying
"country" that means a / “petuanan” is a common property of the local customary law community.
The state always has communal meaning, and guidance is always the concept of shared ownership of a communal area as
well. In short, the basic concept of traditional land (and sea) ownership in Maluku, in essence is a concept of joint ownership of the
local customary law community. Based on this concept, the customary law of Maluku, then develops a unique concept of natural
resource management in their territory in accordance with patterns of social relations and kinship that are also locally specific.
According to Roem Topatimasang in Central Maluku, where the social structure is relatively more equal (egalitarian) with a system of
leadership and village governance that is limited to only one country (village), the management of local natural resources is relatively
simpler than other regions in Maluku. The decision making process can be done more quickly and concisely, for example, it is enough
just to listen to the opinions and suggestions of all representatives of the clan or soa. In Southeast Maluku, especially in the Kei
Islands, the process is somewhat different because social coatings still apply on the basis of class (caste) which is quite complicated.
Management of natural resources is more complicated because it does not only involve one country, but also involves local political
processes with multiple power structures (federation) of several countries called Ratcshaap. As a result, the decision-making process
takes longer, and often results in tension and inequality and even inequitable sharing of results among themselves.
One common feature in Maluku is that in natural resource management systems based on the principle of mutual benefit and
reciprocity to maintain the balance of the natural environment called “sasi”. “Sasi” is a customary law that strictly prohibits anyone
from taking something in the natural surroundings, land or sea, at a certain time in order to guarantee its sustainability. Examples of
“sasi“ in the land area such as “sasi ewang “(forest), sasi hamlet sago, sasi coconut (to preserve local food). In some places a kind of
"eternal sasi" for sacred forests (ancestral sites), including "eternal sasi" of mangrove forests, even includes "eternal sasi" for species
of wildlife that are sacred, such as all types of snakes, monitor lizards, and forest rats on Ta Island, Tanimbar Kei, Southeast Maluku.
The customary law community in Maluku and their rights over their customary lands or customary rights or custody rights
were formed in a long historical process, until now it still exists and is maintained. They are also generally very respectful and aware
that a plot of land cultivated since ancestors is a customary land from which they live and is subject to binding customary rules.
Customary lands, known as / “petuanan” lands are essentially a concept of joint ownership of the local customary law community.
Based on this concept, the customary law of Maluku, then develops a unique concept of natural resource management in their territory
in accordance with the patterns of social relations and kinship that are also locally specific, called sasi.
The existence of customary rights / custody rights and management rights, in various regions in Maluku, often confront or
conflict with development policies, particularly related to regional policies in the field of investment (forestry, mining, tourism and so
on) which eventually lead to conflicts between indigenous and tribal peoples government institutions and with investors. Such
conflicts and disputes become easier when the political law of the government, especially the local government, to protect the rights of
indigenous and tribal peoples over land is still inadequate. For this reason, regional legal politics are needed that regulate the
management rights and utilization of natural resources based on community interests, as protection for natural resources in the
territory, as well as efforts to maintain their traditional rights over these natural resources. For this reason, Maluku Provincial
Regulation No. 3/2008 concerning State Petuanan needs to be followed by the same regional regulations in regencies / cities in
Maluku.
4. CONCLUSION
1. Basically, indigenous peoples have a philosophical basis that is closely interrelated with their customary land or customary
rights, especially regarding the pattern of control and use, at first it must be recognized that indigenous peoples have authority
that can be said to be very autonomous and absolute in the control and use of customary land and various agrarian resources in it.
The state on the constitutional basis then claims the lands which have been controlled by the customary law community on the
International Journal of Scientific and Research Publications, Volume 10, Issue 1, January 2020 651
ISSN 2250-3153
http://dx.doi.org/10.29322/IJSRP.10.01.2020.p9797 www.ijsrp.org
grounds that the customary land area needs to be protected for environmental preservation and safety or on the grounds that in
the customary land area there is a very natural resource potential vital to support the interests of the State.
2. Customary law communities have full customary authority for the control and utilization or management of their customary land,
but legally the authority is not as strong as that of the State as stipulated in the UUPA. The existence of customary law
communities in defending their customary rights over land needs to be emphasized in their respective regional regulations in
accordance with the characteristics and characteristics of indigenous and tribal peoples in certain areas. As a result of the absence
of imbalance in legislation will affect the role of the community in the control and use or management of their customary land,
especially those that contain natural resources which are considered vital by the State to meet the lives of many people. In reality,
land problems arise and are experienced by all levels of society. Conflicts have arisen along with population growth,
development progress, and increasingly broad access of various parties to obtain land as a basis for capital in various interests.
The phenomenon of conflict in a number of mining cases that occurred in the regions.
REFERENCES
1. A.P. Parlindungan 1982. Komentar Atas Undang-undang Pokok Agraria, Alumni, Bandung. 1982. hlm. 11.
2. Boedi Harsono,1971. Undang-Undang Pokok Agrarian, Djembatan, Jakarta
3. Boedi Harsono,2003. Hukum Agraria Indonesia, Sejarah Pembentukan Undang-undang Pokok Agraria, Isi dan
Pelaksanaannya, Jilid 1, Djambatan, Jakarta, hlm. 235.
4. Bushar Muhammad,2006. Pokok-Pokok Hukum Adat, Pradnya Paramita,Jakarta, hal,103
5. Daniswara K. Harjono,2010, Hukum Penanaman Modal, Tujuan Terhadap Pemberlakuan Undang-Undang Nomor 25 Tahun
2007 Tentang Penanaman Modal, RajaGrafindo Persada, Jakarta, hlm. 1.
6. Devi K. G Sondakh, 2009, Tanggung Jawab Pidana Individu Bagi Pelaku Pelanggaran Terhadap Hak Asasi Manusia Dalam
Rangka Pembaruan Hukum Nasional, Desertasi, Program Pascasarjana Universitas Hasanuddin, Makassar. hlm. 240.
7. Elita Rahmi. 2010. “Eksistensi Hak Pengelolaan Atas Tanah (HPL) dan Realitas Pembangunan Indonesia. Jurnal Dinamika
Hukum. Fakultas Hukum Universitas Jambi. Vol. 10. No. 3. September. Hal. 356
8. Gunanegara,2008. Rakyat & negara, Dalam Pengadaan Tanah Untuk Pembangunan, Tatanusa, Jakarta, 2008, hal. 5.
9. Hermayulis,2008. Lokakarya “Pemberdayaan Hak Masyarakat Hukum Adat Mendukung Kegiatan Otonomi Daerah 21
Agustus 2008.
10. Hermayulis. 2000. “Aspek-aspek Hukum Hak Pakai Atas Tanah Negara sebagai Obyek Jaminan”. Jurnal Hukum Bisnis,
Yayasan Pengembangan Hukum Bisnis. Jakarta. Volume 10. Hal. 49
11. Kartini Kartono dalam Marzuki 2011. Kartini Kartono dalam Marzuki, Metodologi Riset, edisi 1, UII Press, Yogyakarta,
hlm.55
12. Maris Sumardjono,2006 . Maris Sumardjono, Kompas 13/5/93 Dalam Maria Sumardjono, Kebijakan Pertanahan, Antara
Regulasi Dan Implementasi, Penerbit Buku Kompas, Jakarta, hal.65.
13. Muhammad Yusrizal, 2017. Perlindungan Hukum Pemegang Hak Atas Tanah Dalam Pengadaan Tanah Untuk Kepentingan
Umum. Fakultas Hukum Universitas Muhammadiyah Sumatera Utara, Volume 9. No. 1. Nopember. De Lega Lata, Volume
2, Nomor 1, Januari-Juni 2017. Hal. 4
14. Peter Mahmud Marzuki, 2006, Penelitian Hukum, cet.2, Kencana Prenada Media Group, Jakarta, hlm.35
15. Rikardo Simarmata, 2006. Pengakuan Hukum terhadap Masyarakat Adat di Indonesia, UNDP, Jakarta, him. 309-310.
16. Rikardo Simarmata,2007. “Menyongsong Berakhirnya Abad Masyarakat Adat; Resistensi Pengakuan Bersyarat” Makalah
Program Perkumpulan untuk Pembaharuan Hukum Berbasis Masyarakat Dan Ekologis (HuMA), Jakarta.

International Journal of Scientific and Research Publications, Volume 10, Issue 1, January 2020 652
ISSN 2250-3153
http://dx.doi.org/10.29322/IJSRP.10.01.2020.p9797 www.ijsrp.org
17. Ronald .Z. Titahelu,2008. Asas-Asas Penguasaan Tanah Ulayat Dalam Sistem Hukum Nasional, Disampaikan Dalam
Kerangka Mempersiapkan Naskah Akademik Peraturan Daerah Kabupaten Halmahera Utara, Provinsi Maluku Utara.
18. Ronald Z Titahelu,2005. Ronald Z Titahelu, Makalah, Dipersiapkan Untuk Pembahasan Mengenai Hukum Sumber Daya
Alam, Fakultas Hukum Universitas Pattimura, Ambon.
19. Soerjono Soekanto dan Sri Mamudji, 2007, Penelitian Hukum Normatif Suatu Tinjauan Singkat, Raja Grafindo Persada,
Jakarta, hlm.6
20. Sumiaro Waluyo,1979. Prospek Adil Makmur, Sasaran GNP Perkapita 5.000 Dolar, Pusat Pengembangan Agribisnis,
Jakarta, 1979. hlm. 19.
21. Sundargo Gautama,1990. Tafsiran Undang-Undang Pokok Agrarian, Citra Aditya Bakti, Bandung 1990, hal.20
22. Ter Haar Bzn-K.Ng Soebakti Poesponoto (Penterjemah), Asas-Asas Dan Susunan Hukum Adat, Pradnya Paramita,Jakarta,
hal, 62-63
AUTHORS
First Author – Marulak Togatorop, Graduate Student PhD, Study Program : Legal Science. Pattimura University, Ambon Indonesia
Second Author - Nirahua Salmon E.M, Lecture at Faculty Of Law. Pattimura University, Ambon Indonesia
Email : [email protected]

International Journal of Scientific and Research Publications, Volume 10, Issue 1, January 2020 653
ISSN 2250-3153
http://dx.doi.org/10.29322/IJSRP.10.01.2020.p9798 www.ijsrp.org
Some Theorems on Intuitionistic Multi Fuzzy
Subgroups 1KR. Balasubramaniyan, 2R. Revathy
1Department of Mathematics, H.H.The Rajah’s College, Pudukkottai, Tamil Nadu, India.
2Department of Mathematics, Government Arts College for women, Pudukkottai, Tamil Nadu, India.
DOI: 10.29322/IJSRP.10.01.2020.p9798
http://dx.doi.org/10.29322/IJSRP.10.01.2020.p9798
Abstract- In this paper, we define the algebric structures of
Intuitionistic Multi fuzzy subgroup and some related properties are
investigated. The purpose of this study is to implement the fuzzy
set theory and group theory in intuitionistic multi fuzzy
subgroups.
Index Terms- Fuzzy set, Fuzzy subgroup, intuitionistic fuzzy set
(IFS), Multi fuzzy set (MFS), Intuitionistic fuzzy subgroup
(IFSG), Multi fuzzy subgroup (MFSG), Intuitionistic Multi fuzzy
Subgroup (IMFSG)
I. INTRODUCTION
he idea of Intuitionistic fuzzy set was given by krassimiri,
T.Atanassov [1]. S.Sabu and T.V. Ramkrishan [6] Proposed
the theory of multi fuzzy sets interms of multi dimensional
membership functions. N. Palaniappan, S.Naganathan and
K.Arjunan introduced the theory of Intuitionistic fuzzy subgroup
is an extension theories of fuzzy subgroups. R.Muthuraj and
S.Balamurugan [4] proposed the multi fuzzy group and its level
subgroups. In this paper, we define a new algebraic structure of
Intuitionistic multi fuzzy subgroups and study some of their
related properties.
II. PRELIMINARIES
2.1 : Definition
Let x be any non – empty set. A fuzzy subset α of x is α : x → [0,1]
2.2 : Definition
Let A be a fuzzy set on a group G. Then A is called a fuzzy
subgroup of G if for all x,y G.
(i) A (x, y) ≥ min { A(x), A (y)}
(ii) A (x-1) = A (x)
2.3 Definition
Let X be a fixed non – empty set. An Intuitionistic fuzzy set (IFS)
A of X is an object of the form
A={(x,αA (x), βA (x)) : x x}, where αA : x →[0,1] and βA : x
→[0,1]
Define the degree of membership and degree of non – membership
of the element x X respectively and for any x X, We have 0
≤ αA (x) + βA (x) ≤ 1
2.4 Definition
Let x be a non empty set. A multi fuzzy set (IFS) A in x is defined
as a set of ordered sequences.
A = { (x, α1, (x), α2 (x)….. αi (x)….); x x}, where αi : x→[0,1],
for all i
2.5 Definition
An IFS A = {(x, αA (x), βA (x)) ; x G} of a group G is said to be
intuitionistic fuzzy subgroup of G (IFSG) if,
(i) αA (xy) ≥ min (αA (x), αA (y)) and βA (xy) ≤ max
(βA (x), βA (y))
(ii) αA (x-1) = αA (x) and βA (x-1) = βA (x), for all x,y
G
2.6 Definition
A multi fuzzy set A of a group G is called a multi – fuzzy subgroup
of G (MFSG) if for all x, y G
(i) A(x,y) ≥ min (A (x), A (y))
(ii) A (x-1) = A (x)
2.7 Definition
An IFS A = {(x, αA (x), βA (x)) : x G} of a group G is said to be
intuitionistic Multi fuzzy subgroup of G(IMFSG) if,
(i) αA (xy) ≥ min (αA (x), αA (y) and βA (xy) ≤ max
(βA (x), βA (y))
(ii) αA (x-1) = αA (x) and βA (x-1) = βA (x)
2.8 Definition
Let A= {(x, αA (x), βA (x)), x x} and B = {(x, αB (x), βB (x), x
x} be any two IFS’s of X, then
(i) A B if and only if αA (x) ≤ αB (x) and βA (x) ≥
βB (x) for all x X
(ii) A = B if and only if αA (x) = αB (x) and βA (x) =
βB (x) for all x X
(iii) A Ո B = {(x, (αA Ո αB ) (x), (βA Ո βB) (x) ); x
X} where,
(αA Ո αB) (x) = Min { αA (x), αA (x)} and
(βA Ո βB) (x) = Max { βA (x), βB (x)}
(iv) AՍB ={(x (αA Ս αB ) (x), (βA Ս βB) (x) ); x
X}
Where,
(αA Ս αB ) (x) = Max (αA (x), αB (x))
(βA Ս βB) (x) = Min (βA (x), βB (x))
T

International Journal of Scientific and Research Publications, Volume 10, Issue 1, January 2020 654
ISSN 2250-3153
http://dx.doi.org/10.29322/IJSRP.10.01.2020.p9798 www.ijsrp.org
III. PROPERTIES OF INTUITIONISTIC MULTI FUZZY
SUBGROUPS
3.1 Theorem
Let A be a IMFSG of a group G and e is the identity element of G.
Then
(i) αA (x) ≤ αA (e) and βA (x) ≥ βA (e), for all x G
(ii) The subset H= { x G / αA (x) = αA (e) and βA (x) =
βA (e)} is a group of G.
Proof:
(i) Let x G
αA (x) = min { αA (x), αA (x)}
= min { αA (x), αA (x-1)} ≤ αA (x x-1) = αA (e)
αA (x) ≤ αA (e)
Hence, αA (x) ≤ αA (e)
and
βA (x) = max { βA (x), βA (x)}
= max { βA (x), βA (x-1)}≥ βA (x x-1) = βA (e)
βA (x) ≥ βA (e)
(ii) Let H = { x G / αA (x) = αA (e) and βA (x) = βA (e)}
Clearly, H is non – empty set as e H
Let x,y H
Then αA (x) = αA (y) = αA (e)
αA (xy-1) ≥ min (αA (x), αA (y-1))
= min (αA (x), αA (y))
= min ( αA (e), αA (e))
= αA (e)
Therefore, αA (xy-1) ≥ αA (e)
and Obviously
αA (e) ≥ min { αA (e), αA (e)}
= min { αA (x), αA (y)} = min {(αA (x), αA (y-1)}
αA (e) ≥ {αA (xy-1)}
Therefore, αA (e) ≥ αA (xy-1)
αA (xy-1) = αA (e)
Let x,y H, Then βA (x) = βA (y) = βA (e)
βA (xy-1) ≤ max { βA (x), βA (y-1)}
= max { βA (x), βA (y)}
= max { βA (e), βA (e)}
= βA (e)
Therefore, βA (xy-1) ≤ βA (e)
and βA (e) ≤ max { βA (e), βA (e)}
= max { βA (x), βA (y)}
= max { βA (x), βA (y-1)}
= βA (xy-1)
Therefore, βA (e) ≤ βA (xy-1)
Hence, βA (xy-1) = βA (e)
Clearly, H is a subgroup of G
3.2 Theorem : A is a IFSG of G if and only if AC is a IMFSG of
G
Proof:
(i) Suppose A is a IFSG of G
Then for all x,y G
αA (xy) ≥ min { αA (x), αA (y)}
1-αA (xy) ≥ 1- min {1- αA (x), 1- αA (y)}
βA (xy) ≤ max { βA (x), βA (y)}
and
βA (xy) ≤ max { βA (x), βA (y)}
1-βA (xy) ≤ 1-max{1- βA (x), 1- βA (y)}
αA (xy) ≥ min { αA (x), αA (y)}
(ii) αA (x) = αA (x-1), for all x G
1- αA (x) = 1- αA (x-1)
βA (x) = βA (x-1)
and
βA (x) = βA (x-1) for all x G
1-βA (x) = 1- βA (x-1)
βA (x) = βA (x-1)
Hence, Ac is a IMFSG of G
3.3 Theorem
Let A be any IMFSG of G with indentity ‘e’.Then (i) αA (xy-1) =
αA (e) => αA (x) = αA (y) and βA (xy-1) = βA (e) => βA (x) = βA (y)
for all x,y in G
Proof
(i) Given A is a IMFSG of G
αA (xy-1) = αA (e) for all x,y G
αA (x) = αA (xe) = αA (x(y-1 y))
= αA (xy-1 y) = αA (x y-1) y}
≥ min (αA (xy-1), αA (y)}
= min { αA (e), αA (y)) = αA (y)
Therefore, αA (x) ≥ αA (y)
Now αA (y) = αA (y (x-1x)) = αA (yx-1,x)
αA (y) ≥ min (αA (yx-1), αA (x))
= min (αA (e), αA (x)) = αA (x)
αA (y) ≥ αA (x)
Therefore, αA (x) = αA (y)
(ii) βA (xy-1) = βA (e) for all x,y G
βA (x) = βA (xy y-1) = βA (xy-1 y)
≤ max { βA (xy-1), βA (y)}
= max { βA (e), βA (y)} = βA (y)
βA (x) ≤ βA (y)
βA (y) = βA (y x-1 x)
≤ max { βA (yx-1 x)
= max { βA (e), βA (x)} = βA (x)
βA (y) ≤ βA (x)
Therefore βA (x) = βA (y)
3.4 Theorem
A is a IMFSG of G <=> αA (xy-1) ≥ min {αA (x), αA (y)} & βA (xy-
1) ≤ max {βA (x), βA (y)
Proof :
Let A be a IMFSG of G for all x,y in G
(i) αA (xy-1) ≥ min { αA (x), αA (y-1)}
= min {αA (x), αA (y)}
Therefore, αA (xy-1) ≥ min { αA (x), αA (y)}
(ii) βA (xy-1) ≤ max { βA (x), βA (y-1)}
= max { βA (x), βA (y)}
Therefore, βA (xy-1) ≤ max { βA (x), βA (y)}

International Journal of Scientific and Research Publications, Volume 10, Issue 1, January 2020 655
ISSN 2250-3153
http://dx.doi.org/10.29322/IJSRP.10.01.2020.p9798 www.ijsrp.org
REFERENCES
[1] Atanassov K.T., “ Intuitionistic fuzzy sets”, Fuzzy sets & systems 20(1986), No.1,87-96 (IFS).
[2] Sabu.S & Ramakrishnan. T.V. “Multi - fuzzy subgroups”, Int.J.Contemp.Math. Sciences, Vol.6, 8 (2011), 365-372.
[3] Palaniappan.N, Naganathan.S and Arjunan.K, “ A study on Intuitionistic L.Fuzzy Subgroups”, Applied Mathematical Science, Vol.3, 2009, No.53, 2619-2624.
[4] Muthuraj.R and Balamurugan.S, “Multi fuzzy group and its level subgroups”, General Mathematical notes, Gen. Math-Notes Vol.17, No.1,July 2013, PP 74-81.
[5] Zadeh.L.A, “Fuzzy sets”, Information and control 8, (1965), 338-353.
[6] Sabu.S and Ramakrishnan.T.V, “Multi Fuzzy sets”, International Mathematical forum, 50 (2010), 2471-2476.
AUTHORS
First Author – KR. Balasubramaniyan, Department of
Mathematics, H.H.The Rajah’s College, Pudukkottai, Tamil
Nadu, India.
Second Author – R. Revathy, Department of Mathematics,
Government Arts College for women, Pudukkottai, Tamil Nadu,
India., Email: [email protected]
International Journal of Scientific and Research Publications, Volume 10, Issue 1, January 2020 656
ISSN 2250-3153
http://dx.doi.org/10.29322/IJSRP.10.01.2020.p9799 www.ijsrp.org
Complementary and alternative medicine (CAM) use
among patients presenting in OPD at tertiary care
hospital, Rajasthan; a Questionnaire based study
Parul Gupta1, Riya Gupta2
1-Department of Microbiology, Sawai Man Singh medical college Jaipur, Rajasthan University of health and science
2-Department of Microbiology, Government medical college Kota, Rajasthan University of health and science
DOI: 10.29322/IJSRP.10.01.2020.p9799
http://dx.doi.org/10.29322/IJSRP.10.01.2020.p9799
Abstract- Concurrent CAM utilization with conventional
medicines is increasing both in developed and
developing countries. A questionnaire based study was
conducted among the patients attending OPD of a
tertiary care institute of Southern Rajasthan. The aim of
the study was to find out the pattern of CAM use in
patients as well as their attitude and perception regarding
CAM therapies.
Ayurveda (56%) was the most commonly used
CAM therapy followed by homeopathy (34%). 76%
patients did not inform their physicians about CAM use.
57.2% patients started using CAM on advice of a relative
or friend. ‘No or less adverse effects’ (69.6%) was the
most common reason for CAM preference over
conventional medicines. 65.5% patients believed that
CAM therapy do not cause any adverse effect.
Patients generally consider CAM therapies as safe
and devoid of any adverse effects. Nondisclosure of
CAM utilization to concerned physician can lead to
adverse effects and drug interaction between CAM and
conventional medicines. Thus there is a need to increase
awareness among patients as well as more such studies
need to be conducted in patients and in general public to
know the current scenario of extent, pattern andprevalent
misconceptionsin society regarding CAMuse.
Index Terms- complementary and alternative medicine
(CAM)
I. INTRODUCTION
ational center for complementary and alternative
medicine (NCCAM) defines CAM as a group of
diverse medical and health care systems, practices, and
products that are not generally considered part of
conventional medicine.[1] Conventional medicine
(allopathic medicine) is medicine as practiced by holders
of M.D. and M.B.B.S degrees and by allied health
professionals, such as physical therapists, psychologists,
and registered nurses. Wide variety of alternative
medicine is practiced all over India i.e. Ayurveda,
Homeopathy, Unani, Herbal, Chinese, Acupuncture,
Yoga etc. In India commonly used CAM therapies have
been given official recognition and a separate
department was established in 2003 by the Government
of India named as ‘AYUSH’. This department has the
responsibility of developing and propagating officially
recognized CAM systems - Ayurveda, Yoga,
Naturopathy, Siddha, Unani, and Homoeopathy.
Use of CAM is increasing not only in adult
population, but also in pediatric age groups. According
to a survey done by National Institute of Health (NIH) in
USA approximately 38 % of adults in the United States
and 12 % of children use some form of complementary
and alternative medicine (CAM).[2] Usually the patients
of chronic and intractable diseases end up using CAM
after taking conventional medicine, but in some diseases
they may use CAM as initial treatment.
There can be many reasons why patients opt for
CAM. It has been reported by some studies that
conventional healthcare is perceived as ineffective,
having too many adverse effects or too expensive.[3,4]
However dissatisfaction with conventional system may
not be the only reason why patients turn to CAM.
Concurrent use of CAM with conventional medicine is
also widespread and poses a potential risk of drug
interaction. This risk of drug interaction further increases
because many a time’s patients do not inform their
physician about CAM use. There are also many
misconceptions among patients regarding CAM use.
Studies regarding CAM use have been done in
other countries, but only few studies have been reported
in India.[5,6,7] Also most of the studies on CAM
utilization have focused on special patient group, very
few studies have observed CAM use among patients
attending outpatient department of a general hospital.
Thus this study is planned to develop a baseline data of
CAM use among patients presenting in outpatient
department of a tertiary care teaching hospital in
Southern Rajasthan.
N

International Journal of Scientific and Research Publications, Volume 10, Issue 1, January 2020
657
ISSN 2250-3153
http://dx.doi.org/10.29322/IJSRP.10.01.2020.p9799 www.ijsrp.org
II. LITERATURE SURVEY
CAM utilization is a universal phenomenon both
in developing as well as developed countries. Type of
CAM use can vary from country to country. Studies have
been conducted in other countries & few in India, most
of the studies have observed CAM use among specific
patient group e.g. pediatric patients, cancer patients,
epilepsy patients etc.[8,9,10]
A recent study has done by Adams D et al,
assessed CAM use among pediatric patients in two
hospitals of Canada. CAM use was widely prevalent,
42% in one hospital and 71 % in another. Most common
CAM therapies used were massage, chiropractice,
relaxation and aromatherapy. Most responders felt that
CAM use was helpful & many of them did not discuss
their CAM use with their physician.[11]
A systematic review assessing CAM use in cancer
patients has been done by Adams M et al. In this review
an average 31.4% CAM use was found among cancer
patients across all the studies included. CAM use was
more in females, married people, higher earners & better
educated patients. CAM use was most common among
breast cancer patients. Most of the studies suggested that
only half of the cancer patients inform their physician
about CAM use.[9]
In a recent study done by Biligil SG et al CAM use
was observed among patients attending Dermatology
outdoor, and it was found that 43.7% patients were using
at least one CAM method & 20.8% were using two or
more CAM methods.[9] An Indian study by Tandon M
assessed CAM use among epileptic patients & found
CAM use in 32% patients. Ayurvedic medicines were
most common frequently used CAM therapy. Influence
by ‘family and friends’ was most common reason for
trying CAM in those patients.[10]
Most of the above mentioned studies have
examined CAM use among specific patient group. Very
few studies are available which have focused on CAM
use in patients attending outpatient department of a
general hospital. Hori S et al have conducted a study on
CAM use among outdoor patients of a general hospital
in Japan. CAM use was high (50%) among patients
surveyed, while reporting of CAM use to concerned
physician was low (42%). Similar to other studies CAM
use was more in females as compared to males.[13]
Another Indian study has assessed prescription of CAM
medicine by practitioners of modern medicine. 12% of
prescriptions contained CAM medicines, mainly
ayurvedic drugs. CAM medicines mainly consisted of
liver tonics, anti-inflammatory & analgesic
ointments.[14]
During literature search only limited studies were
found assessing CAM use among outdoor patients. We
were not able to find any such study from Rajasthan.
Thus, present study was conducted among outdoor
patients of a general hospital associated with a tertiary
care teaching institute in southern Rajasthan.
III. AIMS & OBJECTIVES-
1. To find out the pattern of CAM use among
patients presenting in outpatientdepartment.
2. To find out the attitude of patients towards
CAMuse.
3. To develop a baseline data of CAM use in a
tertiary care teaching hospital ofRajasthan.
IV. METHODOLOGY-
Typeofstudy:This was a cross sectional, observational,
questionnaire basedstudy
Place of study:The study was conducted in a Tertiary
Care Hospital of Rajasthan
Durationofstudy:2 months
Samplesize: 200
Inclusion Criteria:All patients visiting out-patient
department of the hospital who were using CAM
Exclusion Criteria:
1. Patients of age less than eighteenyears.
2. All those who denied participation in thestudy.
Procedure:
1. Approval from Institutional Ethics Committee
was taken before starting thestudy.
2. Patients attending the out-patient department of
hospital were randomly contacted personally.
3. The study was explained to them in brief in a
language they can understand. Patients who
were using CAM were included in thestudy.
4. Consent of participants was taken in written
informed consent form. (Appendix2).
5. A pre-decided questionnaire was provided to
them which included thirteen questions for
assessment of pattern of CAM use & attitude of
patients towards CAM therapy. They were
asked to fill the questionnaire, with the help of
the investigator if they were not able to
understand it. It required approximately 10 to
15 minutes in filling the questionnaire.
(Appendix1)
6. All data collected were analyzed using
appropriate statisticaltests.
V. OBSERVATION AND RESULTS-
A total of 200 patients who were using CAM were
recruited in the study. Out of these 87
(43.5%)weremalesand113(56.5%)patientswerefemales.
107(53.5%)patientsbelongedtoage group 20-40 years, 88
(44%) were from 40-60 years and 16 (08%) patients
were of
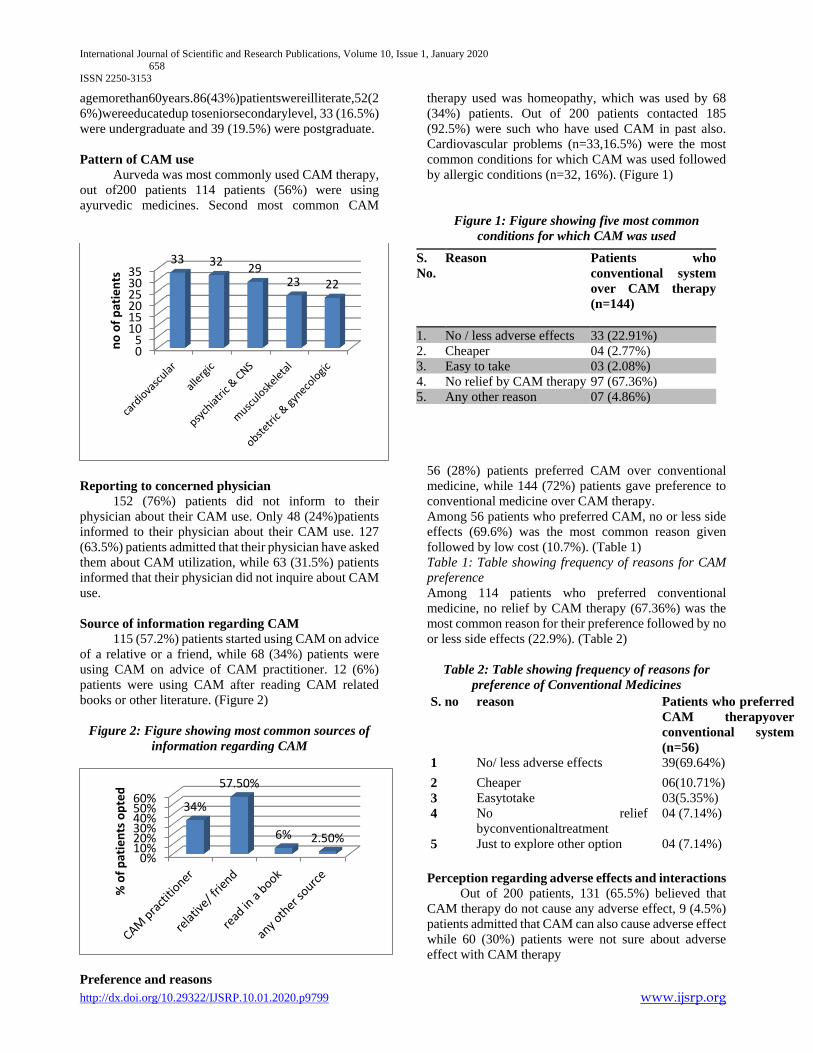
International Journal of Scientific and Research Publications, Volume 10, Issue 1, January 2020
658
ISSN 2250-3153
http://dx.doi.org/10.29322/IJSRP.10.01.2020.p9799 www.ijsrp.org
agemorethan60years.86(43%)patientswereilliterate,52(2
6%)wereeducatedup toseniorsecondarylevel, 33 (16.5%)
were undergraduate and 39 (19.5%) were postgraduate.
Pattern of CAM use
Aurveda was most commonly used CAM therapy,
out of200 patients 114 patients (56%) were using
ayurvedic medicines. Second most common CAM
therapy used was homeopathy, which was used by 68
(34%) patients. Out of 200 patients contacted 185
(92.5%) were such who have used CAM in past also.
Cardiovascular problems (n=33,16.5%) were the most
common conditions for which CAM was used followed
by allergic conditions (n=32, 16%). (Figure 1)
Figure 1: Figure showing five most common
conditions for which CAM was used
Reporting to concerned physician
152 (76%) patients did not inform to their
physician about their CAM use. Only 48 (24%)patients
informed to their physician about their CAM use. 127
(63.5%) patients admitted that their physician have asked
them about CAM utilization, while 63 (31.5%) patients
informed that their physician did not inquire about CAM
use.
Source of information regarding CAM
115 (57.2%) patients started using CAM on advice
of a relative or a friend, while 68 (34%) patients were
using CAM on advice of CAM practitioner. 12 (6%)
patients were using CAM after reading CAM related
books or other literature. (Figure 2)
Figure 2: Figure showing most common sources of
information regarding CAM
Preference and reasons
56 (28%) patients preferred CAM over conventional
medicine, while 144 (72%) patients gave preference to
conventional medicine over CAM therapy.
Among 56 patients who preferred CAM, no or less side
effects (69.6%) was the most common reason given
followed by low cost (10.7%). (Table 1)
Table 1: Table showing frequency of reasons for CAM
preference
Among 114 patients who preferred conventional
medicine, no relief by CAM therapy (67.36%) was the
most common reason for their preference followed by no
or less side effects (22.9%). (Table 2)
Table 2: Table showing frequency of reasons for
preference of Conventional Medicines
Perception regarding adverse effects and interactions
Out of 200 patients, 131 (65.5%) believed that
CAM therapy do not cause any adverse effect, 9 (4.5%)
patients admitted that CAM can also cause adverse effect
while 60 (30%) patients were not sure about adverse
effect with CAM therapy
05101520253035
33 3229
23 22
no
of
pat
ien
ts
0%10%20%30%40%50%60%
34%
57.50%
6% 2.50%
% o
f p
atie
nts
op
ted
S.
No.
Reason Patients who
conventional system
over CAM therapy
(n=144)
1. No / less adverse effects 33 (22.91%)
2. Cheaper 04 (2.77%)
3. Easy to take 03 (2.08%)
4. No relief by CAM therapy 97 (67.36%)
5. Any other reason 07 (4.86%)
S. no reason Patients who preferred
CAM therapyover
conventional system
(n=56)
1 No/ less adverse effects 39(69.64%)
2 Cheaper 06(10.71%)
3 Easytotake 03(5.35%)
4 No relief
byconventionaltreatment
04 (7.14%)
5 Just to explore other option 04 (7.14%)

International Journal of Scientific and Research Publications, Volume 10, Issue 1, January 2020
659
ISSN 2250-3153
http://dx.doi.org/10.29322/IJSRP.10.01.2020.p9799 www.ijsrp.org
Regarding interaction between CAM and
Conventional medicines, 118 (59%) patients were
ignorant about this fact. 65 (32.5%) patients believed that
these two therapies do not interact when taken together,
while 17 (8.5%) patients said that CAM and
Conventional medicines can interact when given
together.
VI. DISCUSSION
In the present study pattern of CAM use and
attitude & misconceptions of patients regarding CAM
was assessed in patients attending outpatient
departments of a general hospital associated with a
tertiary care teaching institute of southern Rajasthan.
Ayurveda (56%) was found to be the most commonly
used CAM therapy. This is in consensus with other
studies done in India that have also reported ayurveda as
the most commonly used CAM therapy.[7] As ayurveda
is the indigenous medicine system of India, it is the most
commonlyused CAM therapy. Homeopathy (34%) was
the next commonly used CAM therapy. Other Indian
studies have also reported homeopathy as one of the
commonly used CAM therapy in India.[7,15] Studies
done in other countries have reported massage, spiritual
practices, acupuncture etc. as the most
commonly used CAM therapies. Use of CAM therapies varies
from country to country depending upon their cultural beliefs and
indigenous medicines prevalent e.g. in China, traditional Chinese
medicine such as herbal medicine, acupuncture, acupressure, qi
gond and t'ai chi chu'an are widely used, while in Japan kampo
and acupuncture are commonly used as CAM therapy.[13]
Cardiovascular problems were the most common conditions for
which CAM was used followed by allergic conditions. Studies
have shown that CAM usage is more in patients suffering from
chronic diseases.[7] As common cardiovascular as well as allergic
conditions are chronic in nature, high CAM utilization is found in
such patients.
76% of patients did not inform their physicians regarding
CAM usage. This figure is alarming and is higher than reported by
other studies. Other studies have found that about 60% of patients
do not disclose their CAM use to concerning physician.[13,16]
This trend can be dangerous as modern medicines and CAM
medicines can have potential interactions when taken together and
physician’s unawareness can result into serious consequences.
Interestingly 63.5% patients admitted that their physician had
asked them about CAM usage. This figure is reassuring, but shows
that some percentage of patients did not disclose their CAM use
even after physician’s questioning. Patients may find it hard to
report their CAM use for fear of anticipating a negative response
and disapproval from their doctor.[17]
More than half of the patients (57.2%) started CAM on
advice of a friend or a relative. Other studies have also reported
similar results where CAM therapy was started under influence of
some friend or relative.[15,18] Only 34% patients were using
CAM on advice of a CAM practitioner. This trend is again
undesirable as CAM and modern medicine can interact and there
can be adverse effects by CAM therapies, CAM usage should be
under guidance of an authorized practitioner.
65.5% patients believed that CAM therapies do not cause
any adverse effect or cause minimum adverse effect, while 59%
patients were ignorant that CAM & modern medicines can
interact.
CAM therapies are generally considered devoid of adverse
effects by the patients. This is further strengthened by the finding
that the most common reason for CAM preference in the present
study was ‘no or less side effects by CAM. However this
misconception among patients can be dangerous as many studies
have reported that CAM therapies can cause serious adverse
effects.[8,19] Thus physicians need to be more vigilant and inquire
about CAM, simultaneously there is a need to remove
misconceptions in patients regarding adverse effects with CAM
therapy. This can be done through awareness campaigns & better
establishment of ‘AYUSH’ centers, so that most of the CAM
utilization occurs in guidance of authorizedpractitioners.
There were some limitations in the present study. The study
findings could not be applied to general public as the study was
limited to patients attending the hospital OPD. Therefore it is
recommended that several studies of similar kind especially in
community setup need to be conducted to know the extent and
pattern of CAM use in the society as well as attitude and
perceptions of people towards CAM therapies.
VII. CONCLUSION
The results of the present study show that Ayurveda is the
most commonly used CAM therapy. Disclosure rate to concerned
physicians about CAM use is low. Patients are largely unaware
about the fact that CAM medicines can cause adverse effects &
can interact when combined with conventional medicines. Thus
physicians should be more vigilant about CAM utilization of their
patients and there is a need to increase awareness among patients
regarding safety of CAM.
REFERENCES
[1] National center for complementary and alternative medicine [Online]. 2008 Oct [cited 2013 Jan 20]; Available from:URL:http://nccam.nih.gov/health/whatiscam#definingcam
[2] Barnes PM, Bloom B, Nahin R. CDC National Health Statistics Report #12. Complementary and alternative medicine use among adults and children: United States, 2007. December 10,2008.
[3] Menniti-Ippolito F, Gargiulo L, Bologna E, Forcella E, Raschetti R. Use of unconventional medicine in Italy: a nation-wide survey. Eur J ClinPharmacol 2002;58:61–4.
[4] Sutherland LR, Verhoef MJ. Why do patients seek a second opinion or alternative medicine? J ClinGastroenterol1994;19:194–7.
[5] Shorofi SA, Arbon P. Complementary and alternative medicine (CAM) among hospitalised patients: an Australian study. Complement TherClinPract 2010 May;16:86- 91.
[6] Bhalla M, Thami GP. Factors predicting the preference of complementary and alternative systems of medicine in treatment of vitiligo. Indian J DermatolVenereolLeprol. 2010 Nov-Dec;76:705-7.
[7] Bhalerao MS, Bolshete PM, Swar BD, Bangera TA, Kohle VR, Tambe MJ et al. Use of and satisfaction with complementary and alternative medicine in four chronic diseases: a cross sectional study from India. Natl Med J India 2013;26:75-8.

International Journal of Scientific and Research Publications, Volume 10, Issue 1, January 2020 660
ISSN 2250-3153
http://dx.doi.org/10.29322/IJSRP.10.01.2020.p9799 www.ijsrp.org
[8] Lim A, Cranswick N, South M. Adverse events associated with the use ofcomplementary and alternative medicine in children. Arch Dis Child 2011Mar;96(3):297-300.
[9] Adams M, Jewell AP. The use of complementary and alternative medicine by cancer patients. IntSeminSurgOncol. 2007Apr;30(4):10.
[10] Tandon M, Prabhakar S, Pandhi P. Pattern of use of complementary/alternative medicine (CAM) in epileptic patients in a tertiary care hospital in India. Pharmacoepidemiol Drug Saf 2002Sep;11(6):457-63.
[11] Adams D, Dagenais S, Clifford D, Baydala L, King WJ, Hervas-Malo M et al. Complementary and alternative medicine use by pediatric speciality outpatient. Pediatrics 2013;131(2);225-32.
[12] Bilgili SG, Ozkol HU, Karadag AS, Calka O. The use of complementary and alternative medicine among dermatology outpatients in Eastern Turkey. Hum ExpToxicol. 2013 Jul[Cited Oct 10]; 8. [Epub ahead of print] Available from: URL:http://het.sagepub.com/content/early/2013/07/04/0960327113494904.abstract
[13] Hori S, Mihaylov I, Vasconcelos JCMcCoubrie M. Patterns of complementary and alternative medicine use amongst outpatients in Tokyo, Japan. BMC Complement Altern Med 2008Apr;8:14.
[14] Verma U, Sharma R, Gupta P, Gupta S, Kapoor B. Allopathic vsayurvedic practices in tertiary care institutes of urban north India. Indian J Pharmacol2007;39(1):52-4.
[15] Zaman T, Agarwal S, Handa R. Complementary and alternative medicine use in rheumatoid arthritis: An audit of patients visiting a tertiary care centre. Natl Med J India 2007;20(5):236-9.
[16] Richardson MA, Sanders T, Palmer JL, Greisinger A, Singletary SE. Complementary/alternative medicine use in a comprehensive cancer center and the implications for oncology. J ClinOncol2000;18:2505-14.E.
[17] Cauffield JS. The psychosocial aspects of complementary and alternative medicine. Pharmacotherapy 2000;20(11):1289-94.
[18] Singh V, Raidoo DM, Harries CS. The prevalence, patterns of usage and people’s attitude towards complementary and alternative medicine (CAM) among the Indian community in Chatsworth, South Africa BMC Complement Altern Med 2004;4:3.
[19] Tabali M, Ostermann T , Jeschke E Witt CM, Matthels H. Adverse drug reactions for CAM and conventional drugs detected in a network of physicisans certified to prescribe CAM drugs , J Manag Care Pharm 2012;18(6):427-38
AUTHORS
First Author – Parul Gupta, Department of Microbiology, Sawai
Man Singh medical college Jaipur, Rajasthan University of
health and science
Second Author – Riya Gupta, Department of Microbiology,
Government medical college Kota, Rajasthan University of
health and science, Email id- [email protected]

International Journal of Scientific and Research Publications, Volume 10, Issue 1, January 2020 661
ISSN 2250-3153
http://dx.doi.org/10.29322/IJSRP.10.01.2020.p97100 www.ijsrp.org
The Effect of Expression Box Media on The Ability to
Express Language and Self-Confidence in Group B
Children in AR Rasyid Kindergarten Sidoarjo
Liez fitri Machfudzoh, Budi Purwoko , Muhammad Turhan Yani
* Continuing Program Development State University Of Surabaya
DOI: 10.29322/IJSRP.10.01.2020.p97100
http://dx.doi.org/10.29322/IJSRP.10.01.2020.p97100
Abstract- This research aims: (1) To find out the effect of the
expression box media on the ability to express language in group
B children in Ar Rasyid Sidoarjo Kindergarten; (2) To determine
the effect of the expression box media on the ability of self-
confidence in group B children in Ar Rasyid Sidoarjo
Kindergarten. This research is based not only on the problems that
occur in group B children in Ar Rasyid Sidoarjo Kindergarten, it
is also based on innovations in learning done in kindergartens.
This research was conducted with a quantitative approach
with an experimental method. The techniques and data collection
used are Pretest and Posttest which function to find out the
influence of expression box media on the ability to express
language and self-confidence in kindergarten B. This study uses
two classes, first the control class and the second the experimental
class whose research uses the design Quasi Experimental. The
research data shows the results obtained tcount> ttable with a real
level of 5% so that 9.2> 0.5 with the average difference in the
experimental class and the control class. The average experimental
class was 8.60 and the average control class was 6.87.
Based on the results of data analysis, it can be concluded
that (1) the expression box media influences the ability to express
language (2) the expression box media influences the ability of
self-confidence in kindergarten B children in Ar Rasyid Sidoarjo.
Index Terms- expression box, express language, self confidence
I. PRELIMINARY
ducation of children aged early (ECD) is the level of
education before primary education, which is a development
effort aimed at children from birth to the age of sixth. The
educational process is carried out by providing educational stimuli
to help physical and spiritual growth and development so that
children have readiness to enter further education, which is held
on a formal, non-formal and informal path. Parents and the
government must provide educational facilities and infrastructure
for children in the context of learning programs. Based on
experience, learning is the right of children, so learning must be
fun, conducive and allow children to be motivated and
enthusiastic.
Past the age of early child going through all golden (the
golden years) who come into one's vision right period when the
child begins to sensitive or sensitive to receive various stimuli.
The sensitive period for each child is different, along with the rate
of growth and development of children individually. Sensitive
period is a period of physical and psychological function maturity
that is ready to respond to the stimulation provided by the
environment. This period is also the foundation for developing
cognitive, motor, language, socio emotional, religious, and moral
abilities.
Agree with (Uthman, 2011: 2) which states that early
childhood is a Golden Age period, which is a golden period
because at this early age (0-6 years) various psychological,
cognitive, language, social emotional and spiritual abilities are in
the developing period . Where all these abilities will develop very
well if the child gets attention from the surrounding environment.
Therefore in the development of children is very important the
direction of parents and teachers when they are at home and at
school.
Based on Law Number 20 of 2003 concerning the National
Education System Article 1 Number 14 states that
" Early childhood education is a coaching effort aimed at
children from birth to the age of six years which is carried out
through the provision of educational stimuli to help physical and
spiritual growth and development so that children have readiness
to enter further education.
Whereas the T safe for children is one form of education on
the track "The general objective of education of children of age
early is developing a variety of potential children early so that they
can adjust to terha d ap environment. This should be the main goal
for educators, namely parents and teachers to help foster and hone
abilities that are already owned or not possessed by children, by
conducting guidance and guidance it is expected that children can
develop their abilities in dealing with future environments.
Aspects of early childhood development must be
developed maximally , there are two aspects of development that
will form other aspects, namely aspects of language development
and aspects of social emotional development. In the development
of language aspects are divided into several parts one of which is
expressing language, at the age of 5-6 years children are expected
to express language. The first time children get language lessons
from the surrounding environment such as from family, peers and
the community or mother tongue. In addition, children's language
development is enriched and complemented by the community
environment where children live.
This will form the personality or special characteristics of
children in language. Language learning for children ages early is
E
International Journal of Scientific and Research Publications, Volume 10, Issue 1, January 2020 662
ISSN 2250-3153
http://dx.doi.org/10.29322/IJSRP.10.01.2020.p97100 www.ijsrp.org
very important therefore kindergartens to be one that deserves to
be precise they learn berbahsa and expected the child to develop
vocabulary, increase vocabulary in children will very quickly
when children have started to speak.
Susanto (2014) "The growth and development of a child is
determined by innate and environmental factors, as well as
interactions on each factor, this is because with the mutual
interaction it will help the child to develop abilities in terms of
language. Another opinion says that the basic education of a
golden age child in a human life span that period cannot be
repeated, so if an error occurs in the child's development at that
time will have an impact on the child in the future then at that time
called "critical period". Therefore, every parent must supervise
and worry about their child's development if the child's
development is not the same as in general.
Language has a very important role for every individual
and, therefore, should developments dikemba n gkan since age
early . According to the theory of language learning behaviorism
the ability to speak and understand language is obtained through
environmental stimuli. Children are only passive recipients of
environmental pressures. Children do not have an active role in
verbal behavior. One part of development is the ability to tell
stories. Storytelling is an activity that someone does verbally to
others with tools or without tools about what must be conveyed or
informed in the form of messages.
Language recognition for children from an early age is
expected to be able to acquire good language skills, many children
can speak but have not heard clearly what is said, it is due to the
lack of environmental contribution and maximum intellectual
development. According to Syaodih (2013) that aspects of
developing language begin with the imitation of sound and
humility, subsequent developments are closely related to the
development of intellectual and social abilities.
In line with social development, the use of language is effective
since one needs others to communicate with each other. Beginning
children can communicate that is from feeling (sound sounds
without meaning) then followed by being able to say one, two
syllables , compile simple sentences and so on to socialize using
complex language in accordance with the level of social behavior,
when early childhood can speak well they will easily adjust to the
social environment and can express their thoughts using the
language to be conveyed so that other people can understand what
is said by the child.
In aspects of social and emotional development, it is
divided into several parts, among others, namely the confidence
that children must have when children are 5-6 years old. In the
early days the child's behavior is sometimes still unstable, it is very
necessary to develop social and emotional values in children.
Development in children is better started since children age early,
because early childhood is to be directed to interact or bersosial
with the family environment or the surrounding community. The
hope is that children are sensitive to the environment in which the
child is located. In accordance with the opinion expressed by
Papalia (in Susanto 2014) "the foundation in psychosocial
development includes children's emotions and initial experiences
with parents ".
On the developmental aspects sos ial emotional in
children aged early to be developed one of them is confidence in
each child. Because the attitude of confidence is an attitude that
will build a child's self in interacting with the community.
According to the Ministry of National Education (2012: 21) self-
confidence is "an attitude that shows understanding one's abilities
and the value of self-esteem". Confidence needs to be instilled in
children from an early age in a fun way , so that children do not
get bored quickly. To foster self-confidence in children it must be
often trained so that children are not always afraid and reject
themselves when they get the activities requested by the teacher to
appear in front of friends and other people, for example telling
stories, singing and so forth.
According to Nurla (2011: 60) revealed that "self-
confidence is an extraordinary force, self-confidence is like a
reactor that generates all the energy that is in a person to achieve
success". As the next generation of the nation, self-confidence is
very important to be instilled in students so that children grow into
someone who is able to develop their potential.
Based on observations at Ar Rasyid Kindergarten, there
are many children whose language development is not perfect, for
example children aged five to six years, who have not been able to
express the language perfectly, the child should have entered an
age where children can speak clearly and can tell well. This could
be due to lack of stimulus received by children. On the other hand
the social emotional development of children also affects the
child's language development. In kindergarten is seen when the
teacher asks children to tell stories in front of their friends and
teachers, self-confidence in kindergarten children aged 5-6 years
is still lacking, this is due to the lack of trust given by their closest
people to the child.
To reduce the problems as above, the teacher can practice
the ability to express language by asking children to tell what is
being experienced by the child, to create confidence in the child
the teacher can ask the child to tell his experience by standing in
front of his friends and teacher. Both of these are expected to
increase the ability to express language and self-confidence in
children. So that children feel interested in this, the teacher can use
the media.
According to Susilana (2007) Media itself means that media is part
of the communication process , media that can be used can be in
the form of expression boxes. An expression box is a box that
contains a variety of facial expressions inside. The expression box
is a media that has a visualization effect that can stimulate the eyes
to be transmitted to the brain so that children can express their
feelings with their language. Develop children's language and
attitude of confidence in children can be a way to play, one with a
medium through which researchers are using the media expression
box. This expression box is expected to help improve children in
expressing language and self-confidence. Where the child will tell
a picture of the expression he has taken in the expression box. The
teacher can ask the child to tell stories in front of his friends to
practice the self-confidence that exists in the child.
Based on the description above, this research is directed at the
application of media which is expected to improve the
development of expressing language and self-confidence in
children aged 5-6 years with the level of Kindergarten B at Ar
Rasyid Sidoarjo kindergarten. the researcher use of media
expression box designed as attractive as possible for children age
prematurely.
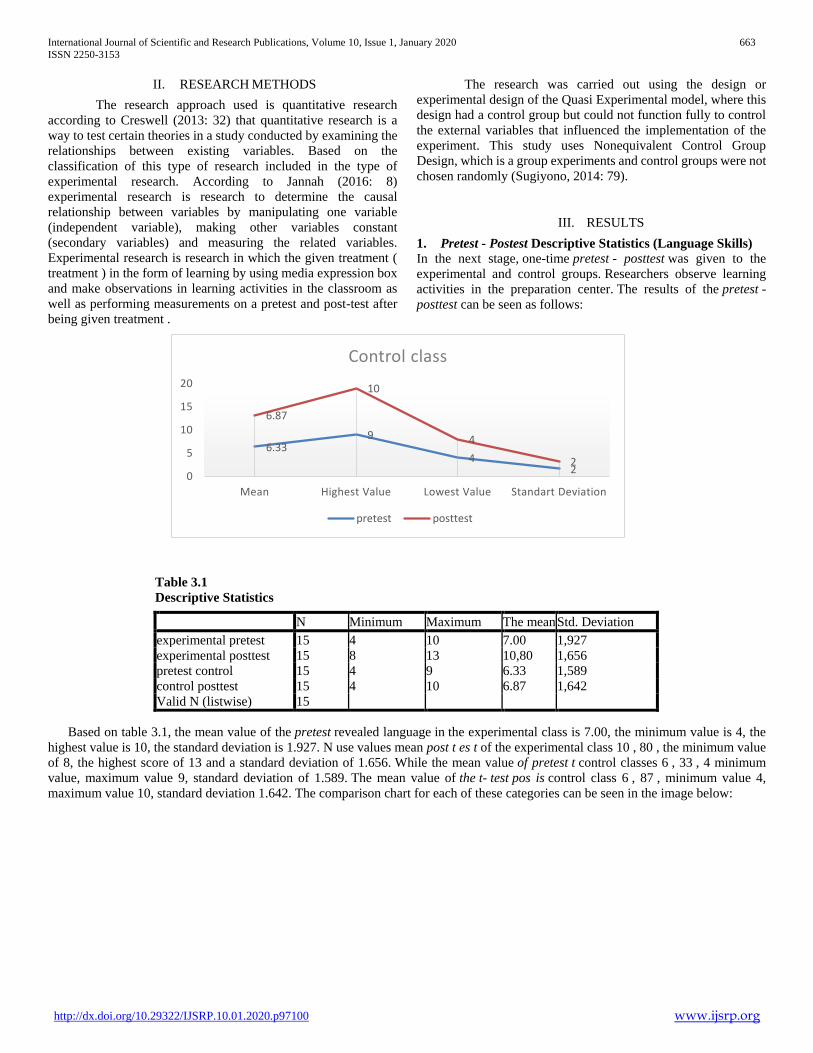
International Journal of Scientific and Research Publications, Volume 10, Issue 1, January 2020 663
ISSN 2250-3153
http://dx.doi.org/10.29322/IJSRP.10.01.2020.p97100 www.ijsrp.org
II. RESEARCH METHODS
The research approach used is quantitative research
according to Creswell (2013: 32) that quantitative research is a
way to test certain theories in a study conducted by examining the
relationships between existing variables. Based on the
classification of this type of research included in the type of
experimental research. According to Jannah (2016: 8)
experimental research is research to determine the causal
relationship between variables by manipulating one variable
(independent variable), making other variables constant
(secondary variables) and measuring the related variables.
Experimental research is research in which the given treatment (
treatment ) in the form of learning by using media expression box
and make observations in learning activities in the classroom as
well as performing measurements on a pretest and post-test after
being given treatment .
The research was carried out using the design or
experimental design of the Quasi Experimental model, where this
design had a control group but could not function fully to control
the external variables that influenced the implementation of the
experiment. This study uses Nonequivalent Control Group
Design, which is a group experiments and control groups were not
chosen randomly (Sugiyono, 2014: 79).
III. RESULTS
1. Pretest - Postest Descriptive Statistics (Language Skills)
In the next stage, one-time pretest - posttest was given to the
experimental and control groups. Researchers observe learning
activities in the preparation center. The results of the pretest -
posttest can be seen as follows:
Based on table 3.1, the mean value of the pretest revealed language in the experimental class is 7.00, the minimum value is 4, the
highest value is 10, the standard deviation is 1.927. N use values mean post t es t of the experimental class 10 , 80 , the minimum value
of 8, the highest score of 13 and a standard deviation of 1.656. While the mean value of pretest t control classes 6 , 33 , 4 minimum
value, maximum value 9, standard deviation of 1.589. The mean value of the t- test pos is control class 6 , 87 , minimum value 4,
maximum value 10, standard deviation 1.642. The comparison chart for each of these categories can be seen in the image below:
Table 3.1
Descriptive Statistics
N Minimum Maximum The mean Std. Deviation
experimental pretest 15 4 10 7.00 1,927
experimental posttest 15 8 13 10,80 1,656
pretest control 15 4 9 6.33 1,589
control posttest 15 4 10 6.87 1,642
Valid N (listwise) 15
6.339
42
6.87
10
4
20
5
10
15
20
Mean Highest Value Lowest Value Standart Deviation
Control class
pretest posttest
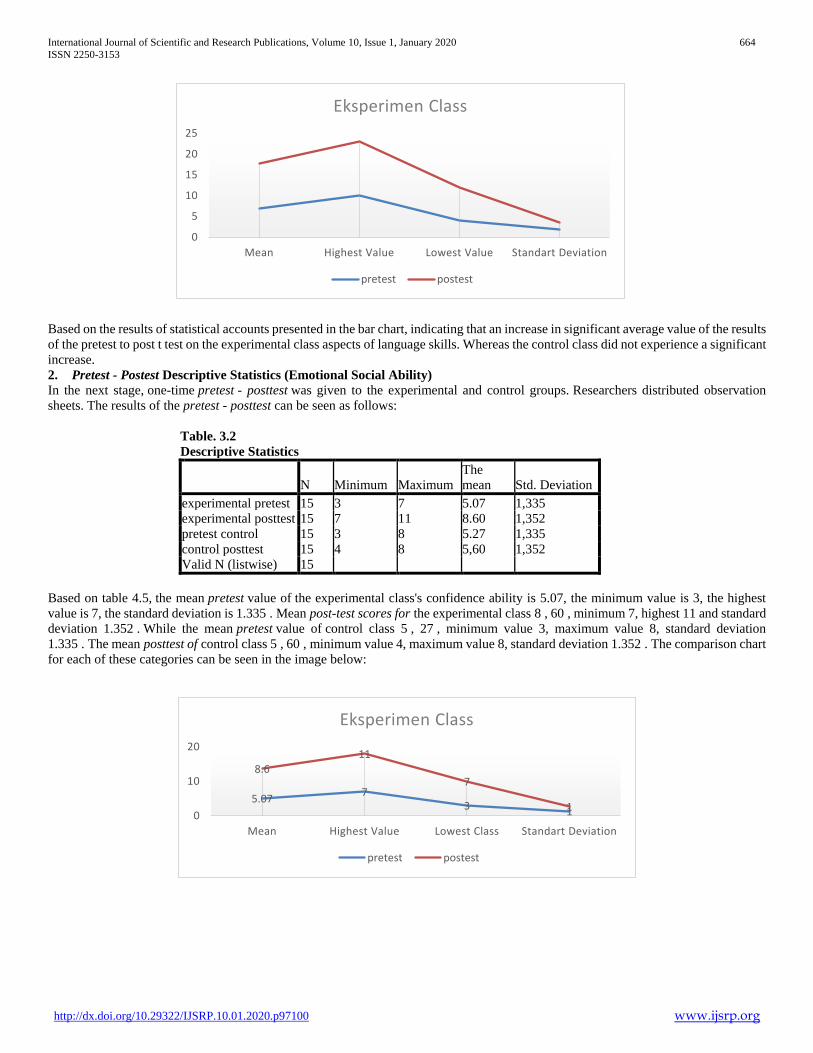
International Journal of Scientific and Research Publications, Volume 10, Issue 1, January 2020 664
ISSN 2250-3153
http://dx.doi.org/10.29322/IJSRP.10.01.2020.p97100 www.ijsrp.org
Based on the results of statistical accounts presented in the bar chart, indicating that an increase in significant average value of the results
of the pretest to post t test on the experimental class aspects of language skills. Whereas the control class did not experience a significant
increase.
2. Pretest - Postest Descriptive Statistics (Emotional Social Ability)
In the next stage, one-time pretest - posttest was given to the experimental and control groups. Researchers distributed observation
sheets. The results of the pretest - posttest can be seen as follows:
Table. 3.2
Descriptive Statistics
N Minimum Maximum
The
mean Std. Deviation
experimental pretest 15 3 7 5.07 1,335
experimental posttest 15 7 11 8.60 1,352
pretest control 15 3 8 5.27 1,335
control posttest 15 4 8 5,60 1,352
Valid N (listwise) 15
Based on table 4.5, the mean pretest value of the experimental class's confidence ability is 5.07, the minimum value is 3, the highest
value is 7, the standard deviation is 1.335 . Mean post-test scores for the experimental class 8 , 60 , minimum 7, highest 11 and standard
deviation 1.352 . While the mean pretest value of control class 5 , 27 , minimum value 3, maximum value 8, standard deviation
1.335 . The mean posttest of control class 5 , 60 , minimum value 4, maximum value 8, standard deviation 1.352 . The comparison chart
for each of these categories can be seen in the image below:
0
5
10
15
20
25
Mean Highest Value Lowest Value Standart Deviation
Eksperimen Class
pretest postest
5.077
3 1
8.611
7
10
10
20
Mean Highest Value Lowest Class Standart Deviation
Eksperimen Class
pretest postest
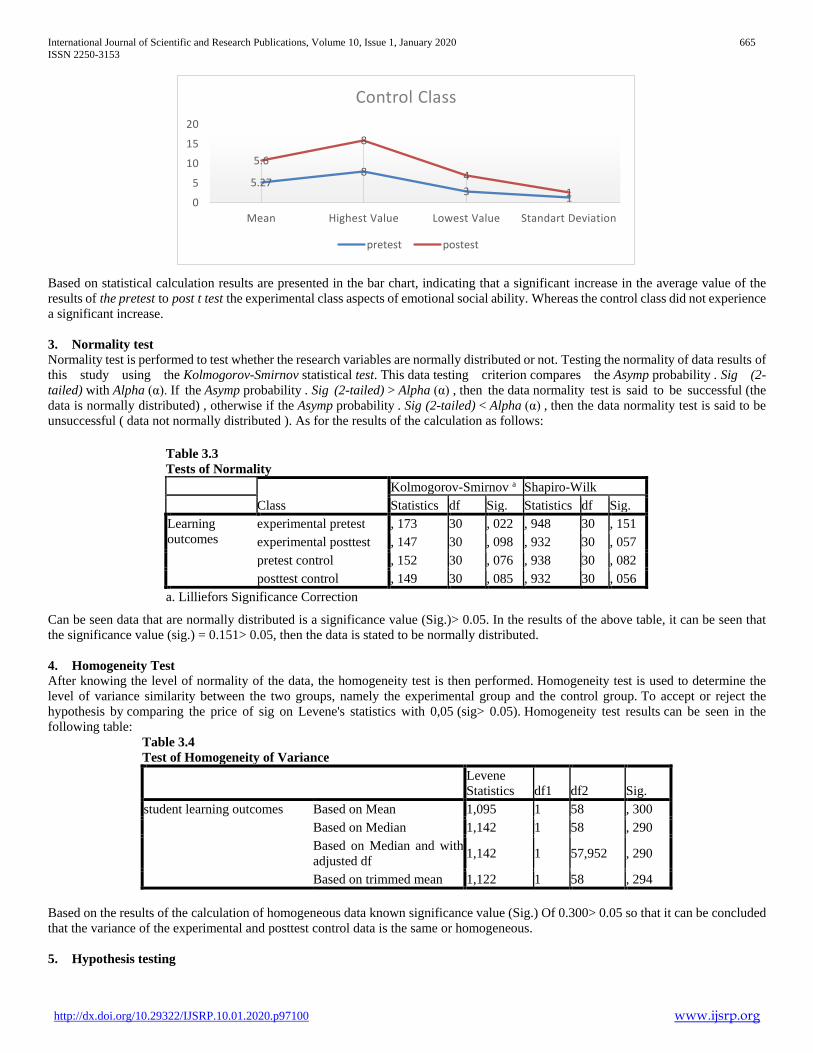
International Journal of Scientific and Research Publications, Volume 10, Issue 1, January 2020 665
ISSN 2250-3153
http://dx.doi.org/10.29322/IJSRP.10.01.2020.p97100 www.ijsrp.org
Based on statistical calculation results are presented in the bar chart, indicating that a significant increase in the average value of the
results of the pretest to post t test the experimental class aspects of emotional social ability. Whereas the control class did not experience
a significant increase.
3. Normality test
Normality test is performed to test whether the research variables are normally distributed or not. Testing the normality of data results of
this study using the Kolmogorov-Smirnov statistical test. This data testing criterion compares the Asymp probability . Sig (2-
tailed) with Alpha (α). If the Asymp probability . Sig (2-tailed) > Alpha (α) , then the data normality test is said to be successful (the
data is normally distributed) , otherwise if the Asymp probability . Sig (2-tailed) < Alpha (α) , then the data normality test is said to be
unsuccessful ( data not normally distributed ). As for the results of the calculation as follows:
Can be seen data that are normally distributed is a significance value (Sig.)> 0.05. In the results of the above table, it can be seen that
the significance value (sig.) = 0.151> 0.05, then the data is stated to be normally distributed.
4. Homogeneity Test
After knowing the level of normality of the data, the homogeneity test is then performed. Homogeneity test is used to determine the
level of variance similarity between the two groups, namely the experimental group and the control group. To accept or reject the
hypothesis by comparing the price of sig on Levene's statistics with 0,05 (sig> 0.05). Homogeneity test results can be seen in the
following table:
Table 3.4
Test of Homogeneity of Variance
Levene
Statistics df1 df2 Sig.
student learning outcomes Based on Mean 1,095 1 58 , 300
Based on Median 1,142 1 58 , 290
Based on Median and with
adjusted df 1,142 1 57,952 , 290
Based on trimmed mean 1,122 1 58 , 294
Based on the results of the calculation of homogeneous data known significance value (Sig.) Of 0.300> 0.05 so that it can be concluded
that the variance of the experimental and posttest control data is the same or homogeneous.
5. Hypothesis testing
Table 3.3
Tests of Normality
Class
Kolmogorov-Smirnov a Shapiro-Wilk
Statistics df Sig. Statistics df Sig.
Learning
outcomes
experimental pretest , 173 30 , 022 , 948 30 , 151
experimental posttest , 147 30 , 098 , 932 30 , 057
pretest control , 152 30 , 076 , 938 30 , 082
posttest control , 149 30 , 085 , 932 30 , 056
a. Lilliefors Significance Correction
5.278
31
5.6
8
4
10
5
10
15
20
Mean Highest Value Lowest Value Standart Deviation
Control Class
pretest postest
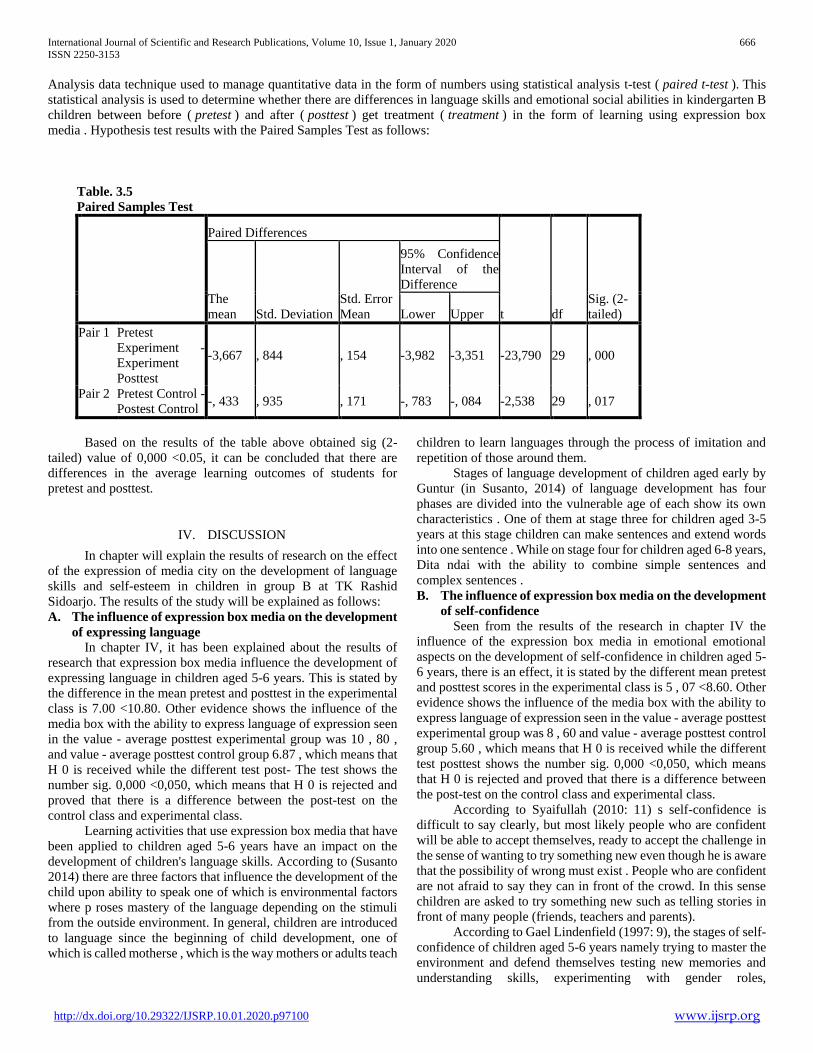
International Journal of Scientific and Research Publications, Volume 10, Issue 1, January 2020 666
ISSN 2250-3153
http://dx.doi.org/10.29322/IJSRP.10.01.2020.p97100 www.ijsrp.org
Analysis data technique used to manage quantitative data in the form of numbers using statistical analysis t-test ( paired t-test ). This
statistical analysis is used to determine whether there are differences in language skills and emotional social abilities in kindergarten B
children between before ( pretest ) and after ( posttest ) get treatment ( treatment ) in the form of learning using expression box
media . Hypothesis test results with the Paired Samples Test as follows:
Table. 3.5
Paired Samples Test
Paired Differences
t df
Sig. (2-
tailed)
The
mean Std. Deviation
Std. Error
Mean
95% Confidence
Interval of the
Difference
Lower Upper
Pair 1 Pretest
Experiment -
Experiment
Posttest
-3,667 , 844 , 154 -3,982 -3,351 -23,790 29 , 000
Pair 2 Pretest Control -
Postest Control -, 433 , 935 , 171 -, 783 -, 084 -2,538 29 , 017
Based on the results of the table above obtained sig (2-
tailed) value of 0,000 <0.05, it can be concluded that there are
differences in the average learning outcomes of students for
pretest and posttest.
IV. DISCUSSION
In chapter will explain the results of research on the effect
of the expression of media city on the development of language
skills and self-esteem in children in group B at TK Rashid
Sidoarjo. The results of the study will be explained as follows:
A. The influence of expression box media on the development
of expressing language
In chapter IV, it has been explained about the results of
research that expression box media influence the development of
expressing language in children aged 5-6 years. This is stated by
the difference in the mean pretest and posttest in the experimental
class is 7.00 <10.80. Other evidence shows the influence of the
media box with the ability to express language of expression seen
in the value - average posttest experimental group was 10 , 80 ,
and value - average posttest control group 6.87 , which means that
H 0 is received while the different test post- The test shows the
number sig. 0,000 <0,050, which means that H 0 is rejected and
proved that there is a difference between the post-test on the
control class and experimental class.
Learning activities that use expression box media that have
been applied to children aged 5-6 years have an impact on the
development of children's language skills. According to (Susanto
2014) there are three factors that influence the development of the
child upon ability to speak one of which is environmental factors
where p roses mastery of the language depending on the stimuli
from the outside environment. In general, children are introduced
to language since the beginning of child development, one of
which is called motherse , which is the way mothers or adults teach
children to learn languages through the process of imitation and
repetition of those around them.
Stages of language development of children aged early by
Guntur (in Susanto, 2014) of language development has four
phases are divided into the vulnerable age of each show its own
characteristics . One of them at stage three for children aged 3-5
years at this stage children can make sentences and extend words
into one sentence . While on stage four for children aged 6-8 years,
Dita ndai with the ability to combine simple sentences and
complex sentences .
B. The influence of expression box media on the development
of self-confidence
Seen from the results of the research in chapter IV the
influence of the expression box media in emotional emotional
aspects on the development of self-confidence in children aged 5-
6 years, there is an effect, it is stated by the different mean pretest
and posttest scores in the experimental class is 5 , 07 <8.60. Other
evidence shows the influence of the media box with the ability to
express language of expression seen in the value - average posttest
experimental group was 8 , 60 and value - average posttest control
group 5.60 , which means that H 0 is received while the different
test posttest shows the number sig. 0,000 <0,050, which means
that H 0 is rejected and proved that there is a difference between
the post-test on the control class and experimental class.
According to Syaifullah (2010: 11) s self-confidence is
difficult to say clearly, but most likely people who are confident
will be able to accept themselves, ready to accept the challenge in
the sense of wanting to try something new even though he is aware
that the possibility of wrong must exist . People who are confident
are not afraid to say they can in front of the crowd. In this sense
children are asked to try something new such as telling stories in
front of many people (friends, teachers and parents).
According to Gael Lindenfield (1997: 9), the stages of self-
confidence of children aged 5-6 years namely trying to master the
environment and defend themselves testing new memories and
understanding skills, experimenting with gender roles,

International Journal of Scientific and Research Publications, Volume 10, Issue 1, January 2020 667
ISSN 2250-3153
http://dx.doi.org/10.29322/IJSRP.10.01.2020.p97100 www.ijsrp.org
experimenting, acting actively and starting to make friends.
Children's self confidence is very influenced by how parents or
educators grow these feelings.
V. CONCLUSSION
Based on the results of the research discussion from
Chapter V and the research objectives, the research conclusions
regarding the influence of the expression box media on the
development of expressing language and trust in children aged 5-
6 years are as follows:
1. Learning activities with expression box media significantly
influence the ability to express language. This influence was
realized because the use of expression box media where the
results of the experimental group were better than the control
group. This can be seen from the p value 0,000 ˂ 0 , 05 .
2. Learning activities with expression box media significantly
influence the ability to express language. This influence was
realized because the use of expression box media where the
results of the experimental group were better than the control
group. This can be seen from the p value 0,000 ˂ 0 , 05 .
REFERENCES
[1] Ameliola, S dan Nugraha H. (2013). Perkembangan Media Informasi dan Teknologi Terhadap Anak Dalam Era Globalisasi. Prosiding The 5 International Conference On Indonesian Studies: “Etnicity And Globalisation”. Malang: Universitas Brawijaya.
[2] Anggani, Sudono. (1995). Alat Permainan dan Sumber Belajar TK. Jakarta : Dirjen PPTA Depdikbud.
[3] Anita E. Woolfolk.(1995). Educational Psychology. USA : Allyn and Bacon
[4] Arif, S Sadiman. (2003). Media Pendidikan: Pengertian, Pengembangan dan Pemanfaatannya. Jakarta : PT Raja Grafindo Persada.
[5] Arikunto, S. (2007). Prosedur Penelitian, suatu Pendekatan Praktek. Jakarta : Rineka Cipta
[6] Arsyad, A. (2013). Media Pembelajaran. Jakarta : Rajawali Pers.
[7] Chaer, Abdul. (2012). Linguistik Umum. Jakarta : Rineka Cipta.
[8] Creswell, J.W. (2012). Wducational Researc Planning Conduction, and Evaluating Quantitatif and Qualitatif Research. New Jersey : Pearson Merrill Prentice Hall.
[9] Creswell, J.W. (2013) Research Design Qualitative, Quantitative, And Mixed Methods Approaches. Sage Publications. Inc
[10] Cristopora. (2017). Pelatihan regulasi emosi anak usia prasekolah. Universitas Indonesia. Jurnal Psikologi Terapan Anak Usia Dini.
[11] Depdiknas. 2012. Panduan Mengajar di TK/RA. Jakarta: Balitung Departemen Pendidikan Nasional
[12] Djais, Julistino. (2002). Pendidikan Holistik Anak Usia Dini dalam Optimalisasi Tumbuh Kembang Anak. Bandung
[13] Goleman, Daniel. (2002). Kecerdasan Emosional. Jakarta : PT. Gramedia Pustaka Utama
[14] Goleman, Daniel. (2015). Emotional Intelligence. Jakarta : Gramedia
[15] Hanson, dkk. (1971). World Book Encyclopedia. Inggris : Scott Fetzer Company.
[16] Hurlock, B Elizabeth. (1980). Psikologi Perkembangan. Jakarta : Erlangga.
[17] Jamaris, Martini. (2006). Perkembangan dan Pengembangan Anak Usia Taman Kanak-Kanak. Jakarta : Gramedia
[18] Jannah, M. (2016). Psikologi Eksperimen Sebuah Pengantar. Surabaya : UNESA University Press
[19] Kemendikbud: Kamus Besar Bahasa Indoesia (KBBI) Kamus versi online/daring (dalam jaringan). (n.d). Diperoleh Januari 20, 2019 dari http://kbbi.web.id/kotak
[20] Kustiawan. 2013. Sumber dan Media Pembelajaran Anak Usia Dini. Malang: FIP Universitas Negeri Malang
[21] Linda, Putu., Asmara Devi. (2014). Penerapan Metode Bercakap-Cakap Berbantuan Media Kotak Alphabet Untuk Meningkatkan Kemampuan Berbahasa Lisan Anak Kelompok B. Jurnal : Universitas Pendidikan Ganesha
[22] Morrison, George S. (2015). Dasar – Dasar Pendidikan Anak Usia Dini (PAUD). Jakarta : Indeks
[23] Munipah. (2015). Meningkatkan Kemampuan Membaca Menggunakan Media Kotak Huruf Pada Anak Kelompok B Ra Al-Amin Desa Kecubung Kecamatan Pace Kabupaten Nganjuk Tahun Ajaran 2014-2015. Artikel Penelitian : Universitas Nusantara PGRI Kediri.
[24] Mursid. (2015). Pengembangan Pembelajaran PAUD. Bandung : PT Remaja Rosdakarya.
[25] Mustaji. (2016). Media Pembelajaran. Surabaya : UNESA UNIVERSITY PRESS
[26] Otto, Beverly. (2015). Perkembangan Bahasa Pada Anak Usia Dini. Jakarta : Prenadamedia Group.
[27] Permendikbud. (2014a). Kurikulum 2013 Pendidikan Anak Usia Dini. Jakarta
[28] Permendikbud. (2014b). Standar Nasional Pendidikan Anak Usia Dini. Jakarta
[29] Rahayuningsih, S.S, Tirtjahjo D.S, Mozes Kuriawan. (2019). Peningkatan Kemampuan Mengenal Huruf Pada Anak Usia 5-6 Tahun Melalui Metode Bermain Dengan Media Kotak Pintar. Jurnal : Universitas Kristen Satya Wacana.
[30] Sadiman, Arief S. (2012). Media Pendidikan: Pengertian, Pengembangan dan Pemanfaatannya. Jakarta : PT Raja Grafindo Persada.
[31] Santrock, John W. (2007). Perkembangan Anak Edisi Kesebelas Jilid 1. Jakarta ; Erlangga.
[32] Sugiyono,.(2016). Metode Penelitian Kuantitatif, Kualitatif, dan R&D. Bandung: Alfabeta.
[33] Sugiyono. (2014). Metode Penelitian Kuantitatif, Kualitatif dan R & D. Bandung : ALFABETA
[34] Sukmadinata, Syaodih N. (2013). Metode Penelitian Pendidikan. Bandung : PT Remaja Rosdakarya
[35] Sumaliwati, N. P. H. S., I Nyoman Jampel, Nice Maylani A. (2015). Penerapan Metode Bermain Dengan Media Kotak Huruf Untuk Meningkatkan Perkembangan Bahasa Pada Anak. Jurnal : Universitas Pendidikan Ganesha.
[36] Susanto, Ahmad. (2014). Perkembangan Anak Usia Dini. Jakarta: Prenada Media Grup.
[37] Susilana, Cepi. (2007). Media Pembelajaran. Bandung : CV Wacana Prima.
[38] Sutiana, Winda., Putu Aditya A., Putu Rahayu, U. (2016). Penerapan Metode Bercakap-Cakap Berbantuan Media Kotak Bergambar Untuk Meningkatkan Kemampuan Berbiacara Anak Paud Nurul Jihad. Jurnal : Universitas Pendidikan Ganesha
[39] Suyadi. (2009). Permainan Edukatif yang Mencerdaskan. Yogyakarta : Power Books
[40] Tirtayani, Luh Ayu dkk. (2014). Perkembangan Sosial Emosional Pada Anak Usia Dini. Yogyakarta : Graha Ilmu.
[41] Usman, Uzer. (2011). Model‐Model Pembelajaran Mengembangkan Profesionalisme Guru. Jakarta: Rajagrafindo Persada.
[42] Yamin, Martinis dan Sabri, Saman J. (2013). Panduan Pendidikan Anak Usia Dini. Jakarta : Gaung Persada Press Group.
AUTHORS
First Author – Liez fitri Machfudzoh, E-mail:
[email protected], , Continuing Program
Development State University Of Surabaya
Second Author – udi Purwoko, E-mail:
[email protected], , Continuing Program Development
State University Of Surabaya
Third Author – Muhammad Turhan Yani
E-mail:[email protected], Continuing Program
Development State University Of Surabaya

International Journal of Scientific and Research Publications, Volume 7, Issue 8, August 2017 668
ISSN 2250-3153
www.ijsrp.org

International Journal of Scientific and Research Publications, Volume 10, Issue 1, January 2020 669
ISSN 2250-3153
http://dx.doi.org/10.29322/IJSRP.10.01.2020.p97101 www.ijsrp.org
Oil Price Volatility And External Debt
Management In Nigeria: Empirical Evidence
Gbalam Peter Eze (Ph.D) Banking & Finance Department, Faculty of Management Sciences, Niger Delta University
Wilberforce Island, Bayelsa State, Nigeria
Email: [email protected] &
*Tonye Richard Apiri
Banking & Finance Department, Faculty of Management Sciences, Niger Delta University
Wilberforce Island, Bayelsa State, Nigeria
Email: [email protected]
DOI: 10.29322/IJSRP.10.01.2020.p97101
http://dx.doi.org/10.29322/IJSRP.10.01.2020.p97101
ABSTRACT
Oil price volatility effect on macroeconomic indices globally has been a long debate among scholars.
This study examined the impact of oil price volatility on external debt management in Nigeria.
The study employs the use of secondary data obtained from the Central Bank of Nigeria (CBN)
Statistical Bulletin, 2018, World Bank, International Debt Statistics and Debt Management
Office of Nigeria. The data were subjected to ADF test, Johansen co-integration test, Granger
Causality test and Vector Auto-Regression (systems model) to estimate parameters and test
outlined hypotheses using Wald Test Chi-square outcome. The empirical results of the study
evidenced a significant impact of oil price volatility on capital investments, while external debt
servicing and aggregate external debt was impacted insignificantly for same period under study.
The study therefore, recommends; Debt Management Office of Nigeria to be empowered more
constitutionally to create a centralized unit within its operations as an institutional strategy to
monitor the practical aspects of the execution of external debt and setting up of follow-up team
with feedback measures to ensure that such borrowed funds are utilized for designed purposes.
Keywords: Oil price, volatility, external debt, management.
I.0 INTRODUCTION
The global financial crisis dated in 2008 which also led to the down turn of oil price and
other essential commodities, crashed the crude oil price in particular from over 140 dollars per
barrel to as low as 39 dollars per barrel within (Adeniyi et al., 2015). Fortunately, previous
administrators comprising of former president Olusegun Obasanjo, and the then economic team:

International Journal of Scientific and Research Publications, Volume 10, Issue 1, January 2020 670
ISSN 2250-3153
http://dx.doi.org/10.29322/IJSRP.10.01.2020.p97101 www.ijsrp.org
Ngozi Okonjo-Iweala and Chukwuma Soludo had accumulated foreign reserves amounted to 53
billion dollars and also had some savings in the excess crude account despite the insistence from
state Governors in disbursing it in disguise of financing capital budgets. Thus, with the
significant slide of revenue in the system, Nigeria was able to go through the period without the
economy going into spin (Adedipe, 2004). Alternative measures were suggested and some were
adopted to help the system (Nigeria) to curtail this ups and down syndrome. Thereafter, oil prices
rebound; the country again relaxed and went back to business as usual. Within the last three
years, upstream oil companies have faced over 75 percent dip in their revenues as barrel prices
dipped from $100 to below $30 per barrel (Englama et al., 2010). And for the commodity
producers that depend on import of raw materials seem to struggle with the exchange rate
dilemma orchestrated by oil price volatility. According to Adedipe (2004), country like Nigeria
that depends solely on crude oil proceeds, the retrogressive impact of recent oil prices cannot be
overemphasized in view of sustainable economic development and survival of allied industries
and its debt management capabilities.
The country has seen crude oil prices increase from $113 to $147 per barrel and then
retreat to the current level under $54 per barrel. Thus, Government established the Petroleum
Support Fund (PSF) to reduce the shocks from the oil price decline in 2006. Which main
objective is to stabilize the domestic effect of fluctuations in crude oil prices in the international
crude oil markets, but how well the Petroleum Support Fund (PSF) has materialized this
objective remains unveiled (Nwanna & Eyedayi, 2014). Adedipe (2004) also argued that the
attendant problems associated with oil price volatility in Nigeria is inability of the institutions to
finance its fiscal projects, decrease in standard of living and persistent rise in its debts profile.

International Journal of Scientific and Research Publications, Volume 10, Issue 1, January 2020 671
ISSN 2250-3153
http://dx.doi.org/10.29322/IJSRP.10.01.2020.p97101 www.ijsrp.org
The current standard of living in Nigeria exhibited that 60% of our populace live below
one dollar per day. The resulting decline in the non-oil sector reinforces and there is also sharp
decline in economic performance due to imbalance in sales of crude oil (Ibrahim, Ayodele,
Hakeem & Yinka, 2014).
Notably, sustainability of any economic performance is anchored largely to the
diversification of such economy. For instance, in developed economy like Canada, oil price
volatility does not necessary posed severe threat as several measures are been put in place to
combat such occurrences (Ibrahim el tal., 2014). Ayoola (2013) argues that Nigeria as a mono-
product economy remains susceptible to the movements in international crude oil prices. Yusuf
(2015) also contends that oil price plays a critical role in Nigeria in the conduct of fiscal and
monetary policies because it accounts for average of 80% of government revenue, 90-95% of the
foreign exchange earnings and 12% of the real gross domestic product. However, despite the
windfall from oil prices doing boom eras, Nigeria still has an increasing proportion of
impoverished population and experienced continue stagnation of the economy (Okonjo-Iweala
and Osafo-Kwaako, 2007).
Nevertheless, the consistent fall in the purchasing power of the naira and the rising poor
standards of living amongst Nigerians cannot be avoided in an economy that depends solely on
proceeds of crude oil. The effects of oil price volatility seem to be very significant and
destabilizing especially in the area of external debt management strategy (Omotola & Saliu
2009).
In view of the above, it pings in the heart of many; home and abroad to question the true
position of Nigerian external debt profile in respect to the recent down turn on oil prices
volatility globally.

International Journal of Scientific and Research Publications, Volume 10, Issue 1, January 2020 672
ISSN 2250-3153
http://dx.doi.org/10.29322/IJSRP.10.01.2020.p97101 www.ijsrp.org
Therefore, the broad objective of this study is to investigate the impact of oil price
volatility on external debt management in Nigeria. However, target objectives of the study are:
I. To examine the influence of oil price volatility on capital investments in Nigeria.
II. To determine the effect of oil price volatility on external debt servicing in Nigeria.
III. To examine the effect of oil price volatility on aggregate external debt in Nigeria.
This study will illuminate the fact that external debt management in Nigeria is anchored
on the trend of oil price volatility. Therefore, this study will stimulate research of specific
objective of oil price volatility and external debt management strategies. It will also come up
with policy option for regulatory authorities and the Nigerian government to redesign effective
measures (diversification) to suite the current polity geared towards achieving sustainable
economic growth in Nigeria.
The rest of the study is subdivided into: Review of related literatures, methodology,
analyses and interpretation of data, summary, concluding remarks and recommendations.
2.0 REVIEW OF RELATED LITERATURES
2.1 CONCEPTUAL FRAME WORK
This section is mainly concerned with the clarifications, conceptual linkages and
historical perspective of the major components of the study.
BACKGROUND OF GLOBAL OIL PRICE TREND: Records shows that as from the early
1940s to the late 1970s the international oil price was relatively stable having only little or no
changes. Then from the late 1970 to the early 1980s the price of oil increased reasonably with
respect to the establishment of OPEC and the intermittent bridges in the supply of crude oil.
OPEC first exercised its oil controlling power during Yom Kippor War which started in 1973 by

International Journal of Scientific and Research Publications, Volume 10, Issue 1, January 2020 673
ISSN 2250-3153
http://dx.doi.org/10.29322/IJSRP.10.01.2020.p97101 www.ijsrp.org
imposing an oil restriction on western countries as a result of U.S and the Europe support for
Israel. Production of Oil was reduced by five million barrels a day, this cut back amounted to
about seven percent of the world production and the price of oil increased 400 percent in six
months. From 1974 to 1978 crude oil prices were relatively stable ranging from $12 to $14 per
barrel. Then between 1979 and 1980 during the Iranian revolution and Iraq war, the world oil
production fell by 10% and caused the increase in crude oil price from $14 to $35 per barrel.
Increasing oil prices forced leading consumers and firms to adopt a more conserve
energy, people purchased cars that could manage fuel and organizations purchased machine that
were more fuel efficient (Sharma 1998). Increased oil price also enlarged search and production
by nations that were not members of OPEC. Beginning from 1982 to 1985 OPEC wanted to
stabilize the price of oil through production of quotas, but safeguarding efforts, global economic
downturn and wrongful quotas produced by OPEC member countries contributed to the plunging
of oil prices beneath $10 per barrel.
From the Mid-1980s the volitlity in the price of oil has occurred more frequent than the
past. OPEC has continually been trying to influence oil price to ensure its stability through
allocation of production quotas to its member countries but has been unable to stabilize it; as
OPEC share of the world oil production has fallen from 55 percent in 1976 to 42 percent today.
Oil prices matter in the economy in various ways; changes in oil price directly affect
transportation costs, heating bills and the prices of goods made with petroleum products. Oil
price spikes induce greater uncertainty about the future, which affects households and firms
spending and investments decisions.
HISTORICAL CHECKS ON OIL DISCOVERY AND PRODUCTION IN NIGERIA

International Journal of Scientific and Research Publications, Volume 10, Issue 1, January 2020 674
ISSN 2250-3153
http://dx.doi.org/10.29322/IJSRP.10.01.2020.p97101 www.ijsrp.org
Quest for oil began in 1900s by a German company named Nigeria Bitumen Corporation,
but there was no success until 1955 when oil was discovered in Oloibiri in the Niger delta region
(now Bayelsa State) by shell-BP. Nigeria started exporting crude oil in 1958 but in major
quantity in 1965, after the establishment of the bonny island on the coast of Atlantic and the
pipeline to link the terminal.
In 1970, as the Biafra war ends, there was an increase in world oil price and Nigeria
benefited immensely from this rise. Nigeria became a member of Organization of petroleum
exporting countries (OPEC) in 1971 and the Nigerian National Petroleum company (NNPC)
which is a government owned and controlled company was established in 1977. By the late
1960s and early 1970s, Nigeria had attained a production level of over 2 million barrels of crude
oil a day. Although there was a decline in production of crude oil in the 1980s due to economic
down turn, by 2004 Nigeria bounced back producing 2.5 million barrels per day, but the Niger
delta crisis and the global financial crises in 2008 reduced Nigeria oil production and the world
oil price.
The discovery of oil brought in the eastern and mid-eastern regions of Nigeria, this
brought hope of a brighter future for Nigeria in terms of economic development as Nigeria
became independent, but there were also grave consequences of the oil industry; as it fuelled
already existing ethnic and political tension. The tension reached its peak with the civil war and
reflected the impact and fate of the oil industry. Nigeria survived the war and was able to recover
mainly from the huge revenue gained from oil in the 1970s. The Nigeria gained wholesomely
from the nearly 36 months oil boom, the boom generates a lot of funds needed to meet all
development need but the oil revenue which was supposed to be a blessing became a curse due
to its misappropriation of windfall gain from oil.

International Journal of Scientific and Research Publications, Volume 10, Issue 1, January 2020 675
ISSN 2250-3153
http://dx.doi.org/10.29322/IJSRP.10.01.2020.p97101 www.ijsrp.org
The enormous impact of the oil shock on Nigeria grabbed the attention of scholars who
tried to analyze the effect of oil price on economic sustainability, as well as its ability to manage
inherent external debt profile. A set of radical oriented writers were interested in the
nationalization that took place during the oil shock as well as the linkages between oil and an
activist foreign policy. Regarding the latter, the emphasis was on OPEC, Nigeria's strategic
alliance formation within Africa, the vigorous efforts to establish the Economic Community of
West African States (ECOWAS), and the country's attempts to use oil as a political weapon,
especially in the liberation of South Africa from apartheid. Many people had hoped that Nigeria
will become an industrial nation and a prosperous nation from the benefits of oil but they were
greatly disappointed when we Nigeria hit a major financial crisis that led to the restructuring of
the economy (Odularu, 2007).
THE CONCEPT OF EXTERNAL DEBT IN NIGERIA
External debt according to World Bank (2004) is defined as debt owed by the
government to non-residents repayable in terms of foreign currency, goods or service. External
debt is one of the sources of financing capital formation in any economy. It is generally expected
that Nigeria and other developing countries, facing paucity of capital, will acquire external debt
to augment domestic saving (Pattito, poirson & Ricci, 2010). The main lesson of oil price
volatility with external debt management literature is that a country should borrow abroad as
long as the capital acquired produces a rate of return that is higher than the cost of the foreign
borrowing. Although there is nothing wrong in borrowing, the utilization of the borrowed fund is
what matters. The incidence of the debt crises in Nigeria hampers economic performance
because a large portion of the country’s oil proceeds is required to service the debt. Thus, the net

International Journal of Scientific and Research Publications, Volume 10, Issue 1, January 2020 676
ISSN 2250-3153
http://dx.doi.org/10.29322/IJSRP.10.01.2020.p97101 www.ijsrp.org
crude oil earnings were grossly inadequate to effectively finance developmental projects after
servicing such debts.
In consonance, external debt refers to the resources of fund in use in a country which is
not generated internally and does not in any way come from any local citizens, whether corporate
or individual. External debt is the portion of a country’s debt that was borrowed from foreign
lenders including commercial banks, government or international financial institutions. On the
other hand, debt management is the scope of technical and institutional arrangement of liabilities
of a given country so as to pragmatically check its burden within sustainable limit. The technical
aspect is concerned with the determination of the amount of debt the economy can sustain and
that the conditions of borrowing are favorable and consistent with future debt servicing ability.
While, the institutional aspect includes the administrative, organizational, legislative, accounting
and monitoring aspect of managing both new and old stock of debt. In both aspects, more
attention is given to reducing the debt service burden.
It is no exaggeration to claim that Nigeria’s huge foreign debt burden was one of the hard
knots of the Structural Adjustment Programme (SAP) introduced in 1986 (Ojo, 1989). Prior to
the $18 billion debt cancellation granted to Nigeria in 2005 by the Paris Club, the country had
external debt of close to $40 billion with over $30 billion of the amount being owned to Paris
Club alone (Semenitari, 2005). The history of Nigerian’s huge debts can hardly be separated
from its decades of continued recklessness of its rulers. Nigeria’s debt stock in 1971 was $1
billion (Semenitari, 2005). by 1991, it risen to $33.4 billion, and rather than decrease, it has been
on the increase, particularly with the insurmountable regime of debt servicing and the insatiable
desire of political leaders to obtain loans for the execution of dubious projects (Semenitari,

International Journal of Scientific and Research Publications, Volume 10, Issue 1, January 2020 677
ISSN 2250-3153
http://dx.doi.org/10.29322/IJSRP.10.01.2020.p97101 www.ijsrp.org
2005). The huge debt was too much burden on the country, in terms of its servicing, leaving it
with little to perform her constitutional obligations to the citizenry.
Debt crisis is a serious problem facing the third world countries today, and Nigeria is not
an exception. This problem could be traced from the era of colonization and as a result of
incorporation of Nigeria into the third world capitalist system. This problem experienced by
these economies has created doubt as to whether development is indeed possible in these nations.
Though, there is nothing wrong in a country going into borrowing, what matters is the proper
management of the debt. For a country to grow, it needs capital and where this is not available, it
poses huge problem for economic performance and development of the said economy. A country
finds itself in debt when there exist a vast gap between domestic savings, investment and export
earning in absolute term over time.
The debt crisis experienced by Nigeria has created quite a number of problems which has
slowed down the pace of economic performance in the country, but what can be done about this
situation we find ourselves into? Nigeria’s position gets worse as the gap widens and debt
cumulate side by side with perpetual accumulation of interest rates. That notwithstanding,
Nigeria has maintained a constant flow of net import and this is why the country is compelled to
borrow externally thereby inhibiting its developmental strives.
Thus, African countries have acquired a large sum of external debt overtime to bridge the
gap between domestic savings and investment. This process was influenced by the act of the
traditional concept of bridging the savings investment gap in order to accelerate the process of
economic performance. This conventional undertone was that the gap between savings and
investment can be bridged either by reducing domestic savings or augmenting domestic savings
International Journal of Scientific and Research Publications, Volume 10, Issue 1, January 2020 678
ISSN 2250-3153
http://dx.doi.org/10.29322/IJSRP.10.01.2020.p97101 www.ijsrp.org
with borrowed external funds. In the former case, economic performance would either
exacerbate, decline or stagnate and income would be depressed, while in the latter, economic
performance would accelerate if the external funding (debt) were optimally deployed to finance
viable projects.
However, the entire numerous problems facing Nigeria today, the external debt burden is
obviously not sea paged and very pernicious and malignant one. Debt as many would imagine,
constitute a very large and big hindrance to the development process especially within the
context of a dependent capitalist formation. In a debt ridden economy, for instance, economic
benefit which would have been channeled into social profitable investment outlet was diverted
into debt servicing. A sustainable external debt service position depends on among other things,
the deployment of external borrowing in productive investment.
In order to resolve the debt problem facing the economy today, the Federal Government
embarked on various policy measures aimed at resolving the debt crisis. One of such policy was
the Structural Adjustment Programme introduced in July 1986. SAP was expected to remove all
the problems in Nigeria economy. But unfortunately, SAP created more problems than it came to
solve. Other strategies are, debt cancellation, debt exchange swaps, debt conversion, debt
repudiating, and debt restructuring.
After the Nigeria civil war, there has been a decline in the relative position of agriculture
in the country with the advent of crude oil production. Irrespective of the oil boom, Federal
Government has embarked on non-productive project that do not have the capacity to grow the
economy. This is against the economic idea of investing in productive ventures basically to have
other sources of foreign earnings to the national treasury. Consequently, exacerbate the country’s

International Journal of Scientific and Research Publications, Volume 10, Issue 1, January 2020 679
ISSN 2250-3153
http://dx.doi.org/10.29322/IJSRP.10.01.2020.p97101 www.ijsrp.org
external debt profile.. No doubt, external debt is good and bad depending on the management
and application of the said debts.
AIMS AND STRATEGIES OF EXTERNAL DEBT MANAGEMENT IN NIGERIA
Nigeria’s external debt management strategies have varied from time to time since the
early 1980’s when the debt crisis became looming. However, this comprehensive following
policy objective upholds:
To evolve strategies for increasing crude oil earnings thereby reducing the need for
external borrowing.
To stipulate the criteria for borrowing from external sources and determine the type
of projects for which external fund may be obtained.
To outline the mechanism for servicing external debt of the public and private
sector.
To define the roles and responsibility of the various organs of the federal and state
government as well as the private sector in the management of external debt.
The following managerial strategies were issued as regards to external funding in Nigeria:
Economic sector projects should have positive internal rate of return as to offset
cost of borrowing in the long run
Social services or infrastructure would be ranked on the basis of their cost/benefit
ratio.
Projects to be financed with external funds (debt) should be supported with
feasibility studies, which include debt (loan) acquisition, deployment and retirement
schedule.

International Journal of Scientific and Research Publications, Volume 10, Issue 1, January 2020 680
ISSN 2250-3153
http://dx.doi.org/10.29322/IJSRP.10.01.2020.p97101 www.ijsrp.org
External debt for private and public sector with quick returns should be sourced
from international capital markets while debt for social services could be sourced
from conventional financial institutions.
Borrowing by state government, parastatals and agencies should receive approval
from the federal government to ensure that the borrowing conforms to national
objectives. While approvals granted to the private sector should not constitute
federal government guarantee of foreign currency undertaking.
The state government’s borrowing proposals should be submitted to the Federal
Ministry of Finance and Central Bank of Nigeria (CBN) for consideration before
they are incorporated in the final public sector borrowing for the annual budgets.
State government and their agencies as well as, Federal parastatals should device
their debts through the foreign exchange Market (FEM) and inform the Federal
Ministry of Finances for record purpose. For failure to service their debts the naira
equivalents would be deducted at source before the balance of their statutory
allocations are allotted.
2.2 THEORETICAL FRAMEWORK
This study is moored on the theoretical linkage of dependency and debt overhang theories.
DEPENDENCY THEORY: Dependency theory holds that “the condition of underdevelopment
is precisely the result of the incorporation of the Third World economies into the capitalist world
system which is dominated by the West and North America” (Randall and Theobald 1998),
hence in managerial studies, dependency implies a situation in which a particular country or
region relies on another for support, survival and general economic performance.

International Journal of Scientific and Research Publications, Volume 10, Issue 1, January 2020 681
ISSN 2250-3153
http://dx.doi.org/10.29322/IJSRP.10.01.2020.p97101 www.ijsrp.org
The third world countries are the economically underdeveloped countries of Asia, Africa,
Oceania, and Latin America, considered as an entity with common characteristics, such as
poverty, high birthrates, and economic dependence on the advanced countries. The term
therefore implies that the third world is exploited, and that its destiny is a revolutionary one.
Distinctively, the underdevelopment of the third world is marked by a number of
common traits; distorted and highly dependent economies devoted to producing primary
products for the developed world and to provide markets for their finished goods; traditional,
rural social structures; high population and widespread poverty. Despite the widespread poverty
these countries, the ruling elites of most third world countries are outrageously wealthy (Woldu,
2000). The wind of change of the late 60s and early 70s with the advent of crude oil had liberated
most of the third worlds, Africa and Nigeria, thus rendering whatever differences in the rate of
development a peculiarity to the specific country concerned.
In the Nigerian perspective, to answer correctly the question; is it environment or is it in
our nature; that we failed or refused to develop, is necessary as it has been rendered impossible
by the current political atmosphere fueled by some kind of anti-colonialism; now turned into
anti-imperialism, which forecloses all discussions by insisting that “we are our own”. This
posturing had not only dissuaded us to ask this basic question but had indeed put thick blinkers
into our eyes that we cannot see in reality, even though we are living in the thick of our
unpalatable reality of underdevelopment (Kyari, 2008).
DEBT OVERHANG THEORY: One of the theories linking external debt management is debt
overhang theory. Krugman (2009) sees debt overhang as a situation in which the expected
repayment on foreign debt falls short of the contractual value of the debt and showed that there is
a limit at which accumulated debt will distort investment and economic performance. The same
International Journal of Scientific and Research Publications, Volume 10, Issue 1, January 2020 682
ISSN 2250-3153
http://dx.doi.org/10.29322/IJSRP.10.01.2020.p97101 www.ijsrp.org
way, Borenszten (2009) argued that the debt overhang crisis is a situation in which the debtor
country benefits very little from the returns on any additional investment because of the debt
service obligation. In line with these, Desta (2015) found that a negative relationship existed
between external debt and economic growth which justified the existence of debt overhang
hypothesis. Similarly, Iyoha (2009) found that in sub-Saharan African countries the external debt
to Gross National Product (GNP) ratio is high and creates debt overhang problems which
consequently affect investment and growth negatively. This is based on the premise that, if debt
will exceed the countries repayment ability, there is tendency of future expected debts service to
likely effects the country’s output level. And as such, future returns on any investment accrue to
the creditor for bigger debt servicing. This may discourage capital accumulation and promotes
capital flight (Elbadawi & John, 2014)
2.3 EMPIRICAL REVIEW
Oil price volatility has received significant considerations for itsr perceived key role in
macroeconomic indices dynamism. The consequences of the vast oil price volatility on
macroeconomic indices has been a great concern among policy makers, as well as the entire
populace of Nigeria considering the major oil price shocks that hits the global economy.
However, the followings are related verified empirical works of the studied phenomenon.
According to Trung and Vinh (2011) there are two reasons why macroeconomic indices
should be affected by oil shocks. First, increase in price of oil leads to lower aggregate demand
given that income is redistributed between net oil import and export countries. Oil price spikes
could alter economic activity because household income is spent more on energy consumption,
and firms reduce the amount of crude oil it purchases which then leads to underutilization of the
factors of production like: labor and capital. Secondly, the supply side effects are related to the

International Journal of Scientific and Research Publications, Volume 10, Issue 1, January 2020 683
ISSN 2250-3153
http://dx.doi.org/10.29322/IJSRP.10.01.2020.p97101 www.ijsrp.org
fact that crude oil is considered as the basic input to production process. A rise in oil price will
lead to a decline in supply of oil due to the fact that a rise in cost of crude oil production will lead
to a decline in potential output. Basically, five of the last seven United States of America
recessions were preceded by significant increases in the price of crude oil (Sill, 2009).
According to Amano and Norden (1998) many researchers suggest that oil price volatility
has a significant consequence on economic activity and the effect differ for both crude oil
exporting countries and crude oil importing countries. It benefits the crude oil exporting
countries when the international oil price increases but it poses a hiccups for the crude oil
importing countries.
Plante (2008), posits theoretically that the immediate positive effect of oil price volatility
is the increase in the cost of product for oil importing countries, this is likely to reduce output
and the magnitude of this will depends on the demand side for crude oil. Higher oil prices lower
disposable income which then leads to a reduction in consumption. Once the increase in oil price
is believed to be permanent, private investments will decrease. But if the oil price volatility is
perceived as transitory, oil is used less in production and the productivity of labor and capital
will decline and potential output will fall.
Kutan and Wyzan (2005) using an extended version of the Balassa-Samuelson model
finds evidence that oil price volatility had a significant effect on the real exchange rate during
1996 to 2003 and that the Balassa- Samuelson working through productivity changes may be
present though its economic significance may not be large.
Cashin et al., (2004) carried out a study on over 50 commodities exporting developing
countries and found a long-run relationship between exchange rate and the exported
commodity’s price in one third of their sample.

International Journal of Scientific and Research Publications, Volume 10, Issue 1, January 2020 684
ISSN 2250-3153
http://dx.doi.org/10.29322/IJSRP.10.01.2020.p97101 www.ijsrp.org
In a recent study, Ozsoz and Akinkunmi (2011) also demonstrated the positive effects of
international oil prices on Nigeria’s exchange rate.
Olomola (2006) investigated the impact of oil price shocks on aggregate economic
activity in Nigeria using quarterly data from 1970 to 2003. He discovered that contrary to
previous empirical findings, oil price shocks do not affect output and inflation in Nigeria
significantly. However oil price shocks were found to significantly influence stock of external
debt.
From the empirical purr view of studies examined globally and within the national hedge
on the studied phenomenon, external debt management as not been holistically examined as an
explained variable in respect to oil price volatility in Nigeria. Thus, it is imperative therefore to
examine oil price volatility impact on external debt management in Nigeria. This is because
external debt rate in Nigeria is becoming an economic evil that affects basic macroeconomic
indices in the economy.
3.0 METHODOLOGY OF THE STUDY
This study adopts the ex-post facto research design. This research design is adopted
because of its strength and it is the most appropriate to use when it is practically impossible to
manipulate variables employed.
RESEARCH HYPOTHESES
The research hypotheses in this study are formulated in the null form in order to bring
fort clarity of purpose.
H01: Oil price volatility has no significant impact on capital investment in Nigeria.
H02: Oil price volatility has no significant impact on external debt servicing in Nigeria.

International Journal of Scientific and Research Publications, Volume 10, Issue 1, January 2020 685
ISSN 2250-3153
http://dx.doi.org/10.29322/IJSRP.10.01.2020.p97101 www.ijsrp.org
H03: Oil price volatility has no significant influence on aggregate external debt in Nigeria.
REQUIRED DATA AND SOURCES
Considering a study of this nature, it is imperative to choose data that will permit the
estimation and testing of the hypotheses formulated. International crude oil prices (ICOP) as the
explanatory variable (oil price volatility) while capital investments (PINV), external debt
servicing (EXDS) and aggregate external debts (EXDA) values are used as explained variables
(external debt management) independently for the period under study.
The average monthly data are employed for this study, span within June, 2017 to
December, 2018. The data were obtained from Central Bank of Nigeria (CBN) statistical bulletin
2018, World Bank, International Debt Statistics, 2019 and Debt Management Office of Nigeria.
METHOD OF DATA ANALYSIS
Basic econometric tools such as: (a). Unit root test, using Augmented Dickey Fuller
(ADF) Approach. (b). Co-integration test with Johansen Approach (c) Granger Causality test and
(d) Vector Auto-Regression (system models) shall be employed for the analysis of the data-set
and the estimation of the models.
SPECIFICATION OF MODEL
In accordance with the formulated hypotheses in this study, the models will be built as:
capital investment (PINV), external debt servicing (EXDS) and aggregate external debts
(EXDA) as determinant for external debt management, which are the explained variables while
International crude oil prices (ICOP) is the explanatory variable employed in the study.
Specifications of these econometric models are based on economic theory relating to the studied
phenomenon that requires basically:

International Journal of Scientific and Research Publications, Volume 10, Issue 1, January 2020 686
ISSN 2250-3153
http://dx.doi.org/10.29322/IJSRP.10.01.2020.p97101 www.ijsrp.org
1. Determination of the explained and the explanatory variables.
2. Theoretical apriori expectation and signs of functional parameters relationships.
3. Determination of the mathematical form of model (Gujarati, 2004).
In analyzing the studied phenomenon we adopt and modified an empirical model of
Nwoba, Nwonu & Agbaeze (2017). Their model was used to examine the impact of fallen oil
price on the Nigeria economy.
Their model will be adjusted to reflect the current study showing the functional
relationship of the variables employed.
PINV = f (ICOP)……………………………………………………………………………..Eqn1
EXDS = f (ICOP)…………………………………………………………………………..Eqn2
EXDA = f (ICOP)…………………………………………………………………………..Eqn3
Where,
PINV = Capital investment.
EXDS = External debt servicing
EXDA = Aggregate external debt
ICOP = International crude oil prices
The econometric specification of the explicit form of the regression models is given as follows;
PINV t = ao + a1ICOPt + Uet....................................................................... Eqn(4)
EXDSt = ao + a1ICOPSt + Uet..................................................................... Eqn(5)
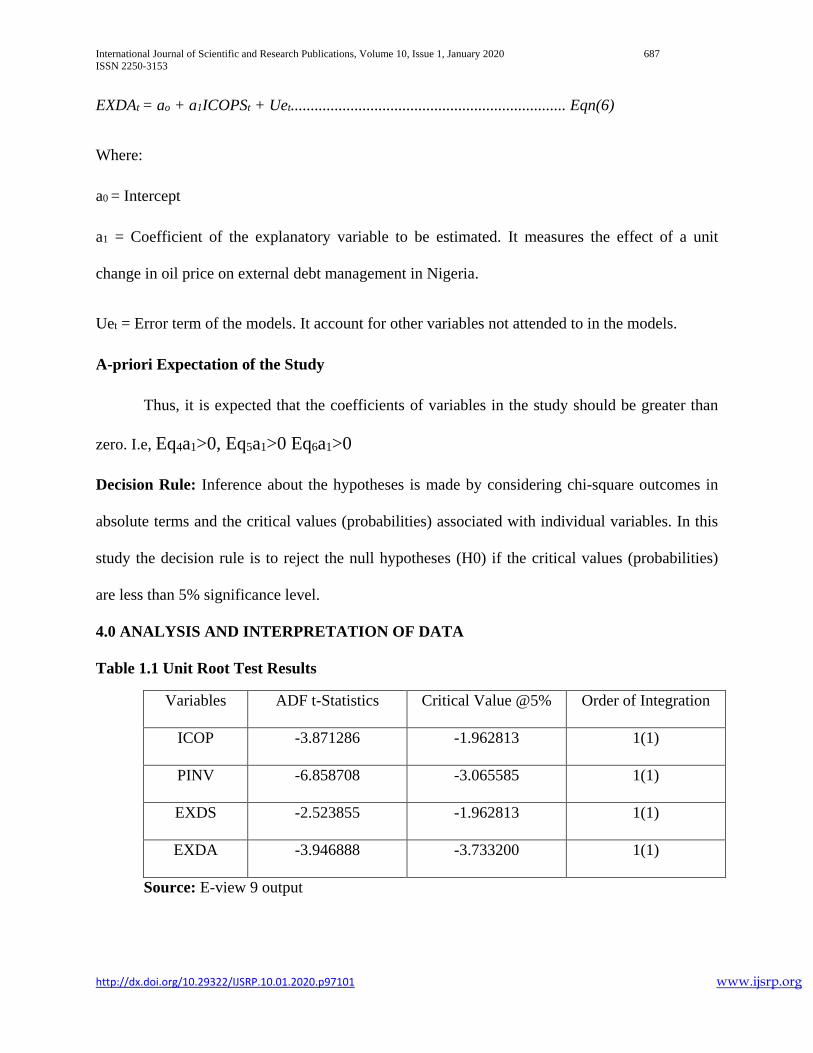
International Journal of Scientific and Research Publications, Volume 10, Issue 1, January 2020 687
ISSN 2250-3153
http://dx.doi.org/10.29322/IJSRP.10.01.2020.p97101 www.ijsrp.org
EXDAt = ao + a1ICOPSt + Uet..................................................................... Eqn(6)
Where:
a0 = Intercept
a1 = Coefficient of the explanatory variable to be estimated. It measures the effect of a unit
change in oil price on external debt management in Nigeria.
Uet = Error term of the models. It account for other variables not attended to in the models.
A-priori Expectation of the Study
Thus, it is expected that the coefficients of variables in the study should be greater than
zero. I.e, Eq4a1>0, Eq5a1>0 Eq6a1>0
Decision Rule: Inference about the hypotheses is made by considering chi-square outcomes in
absolute terms and the critical values (probabilities) associated with individual variables. In this
study the decision rule is to reject the null hypotheses (H0) if the critical values (probabilities)
are less than 5% significance level.
4.0 ANALYSIS AND INTERPRETATION OF DATA
Table 1.1 Unit Root Test Results
Variables ADF t-Statistics Critical Value @5% Order of Integration
ICOP -3.871286 -1.962813 1(1)
PINV -6.858708 -3.065585 1(1)
EXDS -2.523855 -1.962813 1(1)
EXDA -3.946888 -3.733200 1(1)
Source: E-view 9 output

International Journal of Scientific and Research Publications, Volume 10, Issue 1, January 2020 688
ISSN 2250-3153
http://dx.doi.org/10.29322/IJSRP.10.01.2020.p97101 www.ijsrp.org
Table 1.1 shows unit root test results for specified variables in the study. The results
revealed stationarity of variables (integrated) at first difference, symbolized by: 1(1) at 5%
significant level. This implies that variables have no unit root problem. A variable is said to
have no unit root problem if the test statistics is greater than the critical value in absolute terms.
This means that variables employed can be used for meaningful decision making.
Table 1.2 Johansen Cointegration Test Results
Date: 12/12/19 Time: 10:10
Sample (adjusted): 2017M08 2018M12
Included observations: 17 after adjustments
Trend assumption: Linear deterministic trend (restricted)
Series: PINV EXDS EXDA ICOP
Lags interval (in first differences): 1 to 1
Unrestricted Cointegration Rank Test (Trace)
Hypothesized Trace 0.05
No. of CE(s) Eigenvalue Statistic Critical Value Prob.**
None * 0.975265 131.7913 63.87610 0.0000
At most 1 * 0.937077 68.89926 42.91525 0.0000
At most 2 0.591926 21.88003 25.87211 0.1450
At most 3 0.323453 6.642796 12.51798 0.3833
Trace test indicates 2 cointegrating eqn(s) at the 0.05 level
* denotes rejection of the hypothesis at the 0.05 level
**MacKinnon-Haug-Michelis (1999) p-values
Source: E-view 9 output.
Table 1.2 evidenced the Johansen cointegration test result that indicates the existence of two
cointegrating equations. This implies that, there exists a long run relationship among variables

International Journal of Scientific and Research Publications, Volume 10, Issue 1, January 2020 689
ISSN 2250-3153
http://dx.doi.org/10.29322/IJSRP.10.01.2020.p97101 www.ijsrp.org
employed in this study. We arrive at this conclusion by comparing the trace statistic against the
Critical Values at 5% significant level.
Table 1.3 Granger Causality Test Results
VAR Granger Causality/Block Exogeneity Wald
Tests
Date: 12/12/19 Time: 17:28
Sample: 2017M06 2018M12
Included observations: 17
Dependent variable: PINV
Excluded Chi-sq Df Prob.
EXDS 12.29113 2 0.0021
EXDA 4.464118 2 0.1073
ICOP 10.40832 2 0.0055
All 24.67460 6 0.0004
Dependent variable: EXDS
Excluded Chi-sq df Prob.
PINV 52.75349 2 0.0000
EXDA 7.639730 2 0.0219
ICOP 0.210209 2 0.9002
All 85.47901 6 0.0000
Dependent variable: EXDA
Excluded Chi-sq df Prob.
PINV 1.353366 2 0.5083
EXDS 2.681495 2 0.2617
ICOP 1.650465 2 0.4381

International Journal of Scientific and Research Publications, Volume 10, Issue 1, January 2020 690
ISSN 2250-3153
http://dx.doi.org/10.29322/IJSRP.10.01.2020.p97101 www.ijsrp.org
All 3.075777 6 0.7993
Source: Author’s computation: E-view 9 output
Table 1.3 portrays the causal relationship among variables employed. The p-value of
0.0055 of international crude oil prices (ICOP) in respect to capital investment (PINV) is less
than 5% significant level, which means that there exist a causal relationship between the two
variables, while the p-values of international crude oil prices in respect to external debt serving
(EXDS) and aggregate external debt (EXDA) of 0.9002 and 0.4381 respectively are greater than
5% significant level, which means that there exist no causal relationship between international
crude oil prices and external debt servicing and aggregate external debt in Nigeria.
Table 1.4 First System Model Results
Dependent Variable: PINV
Method: Least Squares (Gauss-Newton / Marquardt steps)
Date: 12/12/19 Time: 17:34
Sample (adjusted): 2017M08 2018M12
Included observations: 17 after adjustments
PINV = C(1)*PINV(-1) + C(2)*PINV(-2) + C(3)*EXDS(-1) +
C(4)*EXDS(-2) +
C(5)*EXDA(-1) + C(6)*EXDA(-2) + C(7)*ICOP(-1) +
C(8)*ICOP(-2) + C(9)
Coefficient Std. Error t-Statistic Prob.
C(1) 0.602460 0.283220 2.127182 0.0661
C(2) -0.046264 0.283781 -0.163028 0.8745
C(3) 0.005009 0.001665 3.008742 0.0168
C(4) -0.002640 0.002546 -1.037131 0.3300
C(5) -1.887274 24.15857 -0.078120 0.9397
C(6) -26.73021 20.88612 -1.279807 0.2365
C(7) 33.73645 19.50288 1.729819 0.1219
C(8) -57.06248 23.48189 -2.430064 0.0412
C(9) 2116.316 1824.979 1.159639 0.2796
R-squared 0.854840 Mean dependent var 1097.406
Adjusted R-squared 0.709680 S.D. dependent var 740.9674

International Journal of Scientific and Research Publications, Volume 10, Issue 1, January 2020 691
ISSN 2250-3153
http://dx.doi.org/10.29322/IJSRP.10.01.2020.p97101 www.ijsrp.org
S.E. of regression 399.2432 Akaike info criterion 15.12207
Sum squared resid 1275161. Schwarz criterion 15.56318
Log likelihood -119.5376 Hannan-Quinn criter. 15.16592
F-statistic 5.888950 Durbin-Watson stat 2.333928
Prob(F-statistic) 0.010754
Wald Test:
Equation: Untitled
Test Statistic Value Df Probability
F-statistic 5.204161 (2, 8) 0.0357
Chi-square 10.40832 2 0.0055
Null Hypothesis: C(7)=C(8)=0
Null Hypothesis Summary:
Normalized Restriction (= 0) Value Std. Err.
C(7) 33.73645 19.50288
C(8) -57.06248 23.48189
Restrictions are linear in coefficients.
Source: Author’s computation: E-view 9 output.
Table 1.5 Second System Model Results
Dependent Variable: EXDS
Method: Least Squares (Gauss-Newton / Marquardt steps)
Date: 12/12/19 Time: 17:39
Sample (adjusted): 2017M08 2018M12
Included observations: 17 after adjustments
EXDS = C(10)*PINV(-1) + C(11)*PINV(-2) + C(12)*EXDS(-1) +
C(13)*EXDS(
-2) + C(14)*EXDA(-1) + C(15)*EXDA(-2) + C(16)*ICOP(-1)
+ C(17)
*ICOP(-2) + C(18)
Coefficient Std. Error t-Statistic Prob.
C(10) -50.00837 24.94005 -2.005143 0.0799

International Journal of Scientific and Research Publications, Volume 10, Issue 1, January 2020 692
ISSN 2250-3153
http://dx.doi.org/10.29322/IJSRP.10.01.2020.p97101 www.ijsrp.org
C(11) 174.7305 24.98943 6.992176 0.0001
C(12) 0.901693 0.146599 6.150725 0.0003
C(13) 0.492102 0.224168 2.195234 0.0594
C(14) -1258.635 2127.378 -0.591637 0.5704
C(15) 3992.772 1839.210 2.170917 0.0617
C(16) 547.4842 1717.403 0.318786 0.7581
C(17) 773.2981 2067.790 0.373973 0.7181
C(18) -189235.6 160705.7 -1.177529 0.2728
R-squared 0.982425 Mean dependent var 82715.77
Adjusted R-squared 0.964851 S.D. dependent var 187522.4
S.E. of regression 35156.93 Akaike info criterion 24.07808
Sum squared resid 9.89E+09 Schwarz criterion 24.51920
Log likelihood -195.6637 Hannan-Quinn criter. 24.12193
F-statistic 55.90029 Durbin-Watson stat 2.156107
Prob(F-statistic) 0.000003
Wald Test:
Equation: Untitled
Test Statistic Value df Probability
F-statistic 0.105104 (2, 8) 0.9015
Chi-square 0.210209 2 0.9002
Null Hypothesis: C(16)=C(17)=0
Null Hypothesis Summary:
Normalized Restriction (= 0) Value Std. Err.
C(16) 547.4842 1717.403
C(17) 773.2981 2067.790
Restrictions are linear in coefficients.
Source: Author’s computation: E-view 9 output.
Table 1.6 Third System Model Results
Dependent Variable: EXDA
Method: Least Squares (Gauss-Newton / Marquardt steps)
Date: 12/12/19 Time: 17:43

International Journal of Scientific and Research Publications, Volume 10, Issue 1, January 2020 693
ISSN 2250-3153
http://dx.doi.org/10.29322/IJSRP.10.01.2020.p97101 www.ijsrp.org
Sample (adjusted): 2017M08 2018M12
Included observations: 17 after adjustments
EXDA = C(19)*PINV(-1) + C(20)*PINV(-2) + C(21)*EXDS(-1) +
C(22)*EXDS(
-2) + C(23)*EXDA(-1) + C(24)*EXDA(-2) + C(25)*ICOP(-1)
+ C(26)
*ICOP(-2) + C(27)
Coefficient Std. Error t-Statistic Prob.
C(19) 0.003504 0.003781 0.926682 0.3812
C(20) 0.002644 0.003788 0.698019 0.5049
C(21) 3.51E-05 2.22E-05 1.580349 0.1527
C(22) -4.97E-05 3.40E-05 -1.462631 0.1817
C(23) 0.988213 0.322503 3.064201 0.0155
C(24) -0.384562 0.278817 -1.379260 0.2051
C(25) -0.304805 0.260352 -1.170744 0.2754
C(26) -0.219454 0.313469 -0.700081 0.5037
C(27) 30.38048 24.36239 1.247023 0.2477
R-squared 0.833363 Mean dependent var 11.91176
Adjusted R-squared 0.666726 S.D. dependent var 9.232069
S.E. of regression 5.329661 Akaike info criterion 6.489504
Sum squared resid 227.2423 Schwarz criterion 6.930617
Log likelihood -46.16079 Hannan-Quinn criter. 6.533352
F-statistic 5.001073 Durbin-Watson stat 2.281143
Prob(F-statistic) 0.017621
Wald Test:
Equation: Untitled
Test Statistic Value df Probability
F-statistic 0.825233 (2, 8) 0.4722
Chi-square 1.650465 2 0.4381
Null Hypothesis: C(25)=C(26)=0
Null Hypothesis Summary:
Normalized Restriction (= 0) Value Std. Err.
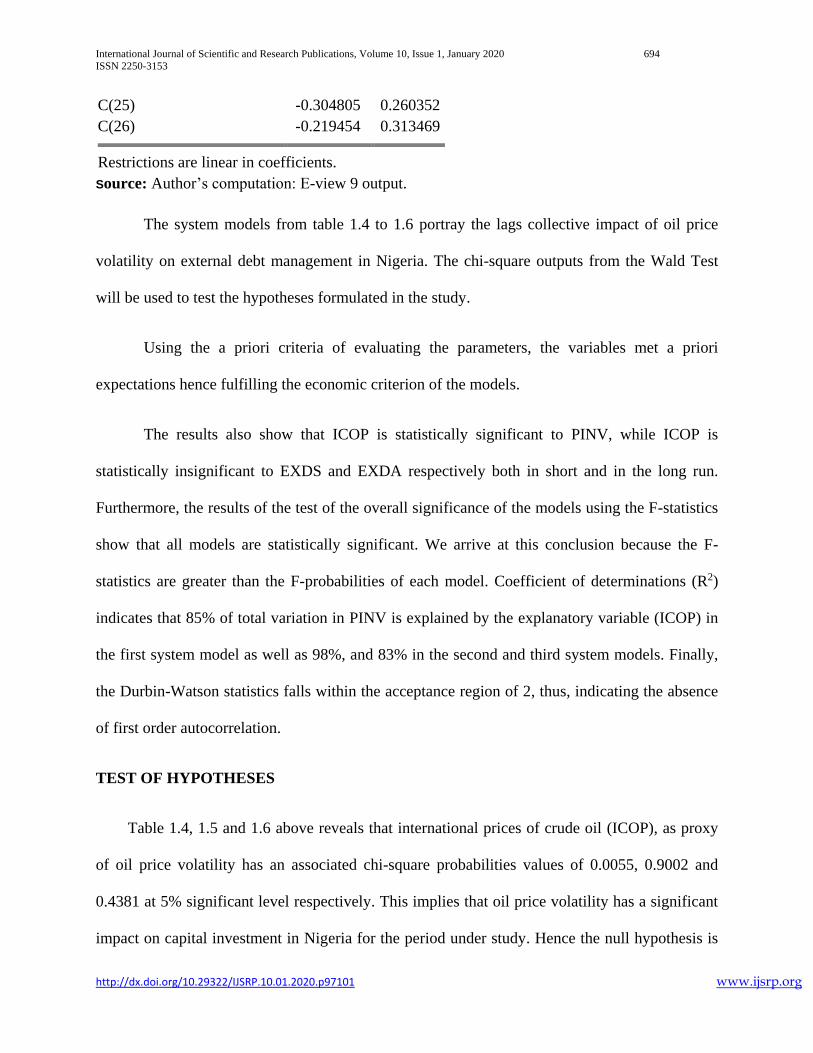
International Journal of Scientific and Research Publications, Volume 10, Issue 1, January 2020 694
ISSN 2250-3153
http://dx.doi.org/10.29322/IJSRP.10.01.2020.p97101 www.ijsrp.org
C(25) -0.304805 0.260352
C(26) -0.219454 0.313469
Restrictions are linear in coefficients.
Source: Author’s computation: E-view 9 output.
The system models from table 1.4 to 1.6 portray the lags collective impact of oil price
volatility on external debt management in Nigeria. The chi-square outputs from the Wald Test
will be used to test the hypotheses formulated in the study.
Using the a priori criteria of evaluating the parameters, the variables met a priori
expectations hence fulfilling the economic criterion of the models.
The results also show that ICOP is statistically significant to PINV, while ICOP is
statistically insignificant to EXDS and EXDA respectively both in short and in the long run.
Furthermore, the results of the test of the overall significance of the models using the F-statistics
show that all models are statistically significant. We arrive at this conclusion because the F-
statistics are greater than the F-probabilities of each model. Coefficient of determinations (R2)
indicates that 85% of total variation in PINV is explained by the explanatory variable (ICOP) in
the first system model as well as 98%, and 83% in the second and third system models. Finally,
the Durbin-Watson statistics falls within the acceptance region of 2, thus, indicating the absence
of first order autocorrelation.
TEST OF HYPOTHESES
Table 1.4, 1.5 and 1.6 above reveals that international prices of crude oil (ICOP), as proxy
of oil price volatility has an associated chi-square probabilities values of 0.0055, 0.9002 and
0.4381 at 5% significant level respectively. This implies that oil price volatility has a significant
impact on capital investment in Nigeria for the period under study. Hence the null hypothesis is

International Journal of Scientific and Research Publications, Volume 10, Issue 1, January 2020 695
ISSN 2250-3153
http://dx.doi.org/10.29322/IJSRP.10.01.2020.p97101 www.ijsrp.org
rejected. While oil price volatility has an insignificant impact on external debt servicing and
aggregate external debt, hence their null hypotheses are accepted. Therefore, we conclude that oil
price volatility has no significant impact on external debt servicing and aggregate external debt
in Nigeria for the period under study.
4.1 DISCUSSIONS OF FINDINGS
The outcome of the system models (VAR) reveals that oil price volatility evidenced from
monthly data sourced has a significant impact on capital investment in Nigeria, while oil price
volatility in respect to external debt servicing and aggregate external debt shows an insignificant
impact for the same period under.
However, the first lag coefficients of oil price volatility; C (5) and C (16) to capital
investment (PINV) and external debt servicing (EXDS) are linear (positive) despite oil price
volatility insignificant relationship with external debt servicing. This implies that increase in
price of crude oil by a percentage also increases capital investment and the amount used to
offsets external debt in Nigeria by 33% and 5% respectively within same period of study.
Conversely, the first lag coefficient of oil price volatility, C (25) to aggregate external debt
(EXDA) is non-linear (negative) and insignificant in relationship. Implying that, an increase in
price of crude oil by a percentage will reduce the stock of external debt recorded in Nigeria by
30% for the period under study.
This finding conforms to the findings of Amano & Norden (1998), according to him; oil
price volatility has a significant consequence on economic activity and its effect differ for both
crude oil exporting countries and crude oil importing countries. However, it benefits the
exporting countries when the international oil price increases but it poses a hiccups for the
importing countries.

International Journal of Scientific and Research Publications, Volume 10, Issue 1, January 2020 696
ISSN 2250-3153
http://dx.doi.org/10.29322/IJSRP.10.01.2020.p97101 www.ijsrp.org
4.0 CONCLUDING REMARKS
Oil price volatility and external debt management has been a contemporary issue in the
Nigerian economy. This study evidenced that oil price volatility has impacted significantly on
capital investments in Nigeria for the period under study. However, the explanatory variable
employed in the study (international prices of crude oil) also reveals contrary that, oil price
volatility does not have a significant impact on external debt servicing and aggregate external
debt in Nigeria for the period under study.
Our conclusion therefore, is that oil price volatility do necessarily determined the extent
to which Nigeria external debt profile is rising and it requires a proactive and effective
administration to curtail it.
Based on the empirical findings of this study, we recommend that:
Debt management office of Nigeria should be empowered more constitutionally as to create a
centralized unit within its operations as an institutional strategy to monitor the practical aspects
of the execution of external debt and setting up of follow-up team with feedback measures to
ensure that such funds are utilized for designed purposes.
REFERENCES
Adebiyi, W. K. & Olowookere, J. K. (2013). Managing Nigerian debt: The practical solutions.
Research journal of finance and accounting, 4(19), 112-123.
Abdullahi, Y. Z., Aliero, H. M. & Abdullahi, M. (2013). Analysis of the relationship between
external debt and economic growth in Nigeria. Interdisciplinary review of economics
and management, 3(1), 1-11.
Adeniyi et al (2015). Financial development and economic growth in Nigeria: Evidence from
threshold modeling. Article of economic analysis policy, 47: 11-21.
Alley, I., Asekomeh, A., Mobolaji, H., & Adeniran, Y. A. (2014). Oil price shocks and Nigerian
economic growth. European scientific journal, 10(19), 1857– 881.
International Journal of Scientific and Research Publications, Volume 10, Issue 1, January 2020 697
ISSN 2250-3153
http://dx.doi.org/10.29322/IJSRP.10.01.2020.p97101 www.ijsrp.org
Amano, R. & Norden, S. (1998). Exchange rate and oil price. Bank of Canada working paper
95-8.
Ayola, J. (2013). Does volatility in crude oil price precipitate macroeconomic performance in
Nigeria? International journal of energy economics policy. 3(2) 143-152.
Barrell, R., Delannoy, A. & Holland, D., (2011). Monetary policy, output growth and oil prices.
National institute of economic review, 215, 37-43.
Fofana, N. F. (2001). Employment and economic growth in the Cote d’Ivoire: An analysis of
structural determinants. African development Bank review, 11, 98-112.
Hakan, M. B., Nildag, B. C. & Nukhet, D. (2010). The impact of oil price shocks on the
economic growth of selected MENA Countries. The energy journal, 31(1), 149-176.
Husain, A. M. Tazhibayeva, K. & Ter-Martirosyan, A. (2008). Fiscal policy and economic
cycles in oil-exporting countries. IMF working paper, Middle East and Central Asia
department. https://www.imf.org/external/pubs/ft/wp/2008/wp08253.pdf, 15/07/2016.
Korhonen, I., Juurikkala, T. & Pankki, S. (2007). Equilibrium exchange rates in oil
dependent countries. Workshops No. 12/2007, Vienna, 393-407.
Lucas, R. (1988). On the mechanics of economic development. Journal of monetary
economics, 22(1), 3-42.
Mordi, N. O. (2006). Challenges of exchange rate volatility in economic management in
Nigeria. The dynamics of exchange rate in Nigeria. Central Bank of Nigeria
Bullion, 30(3), 16-25.
Obadan, M. I. (2006). Overview of exchange rate management in Nigeria from 1986 to Date. In
the dynamics of exchange rate in Nigeria. Central Bank of Nigeria Bullion, 30(3), 17-
25.
Okonjo-Iweala, N. & Osafo-Kwaako, P. (2007). Nigeria’s economic reforms progress and
challenges. http://www.brookingstsinghua.
Oyetunji, B. (2013). Oil price and exchange rate volatility in Nigeria. A research project
submitted to the Department of economics and development studies, College of
Development studies, Covenant University, Ota.
Pattillo, C., Helene, P. & Luca, R. (2004). What are the channels through which external debt
affects growth. International Monetary Fund (IMF).
Romer, D. Gregeory, M. & David W. (1992). A contribution to the empirics of economic
growth. Quarterly journal of economics, 58(4), 407-37.
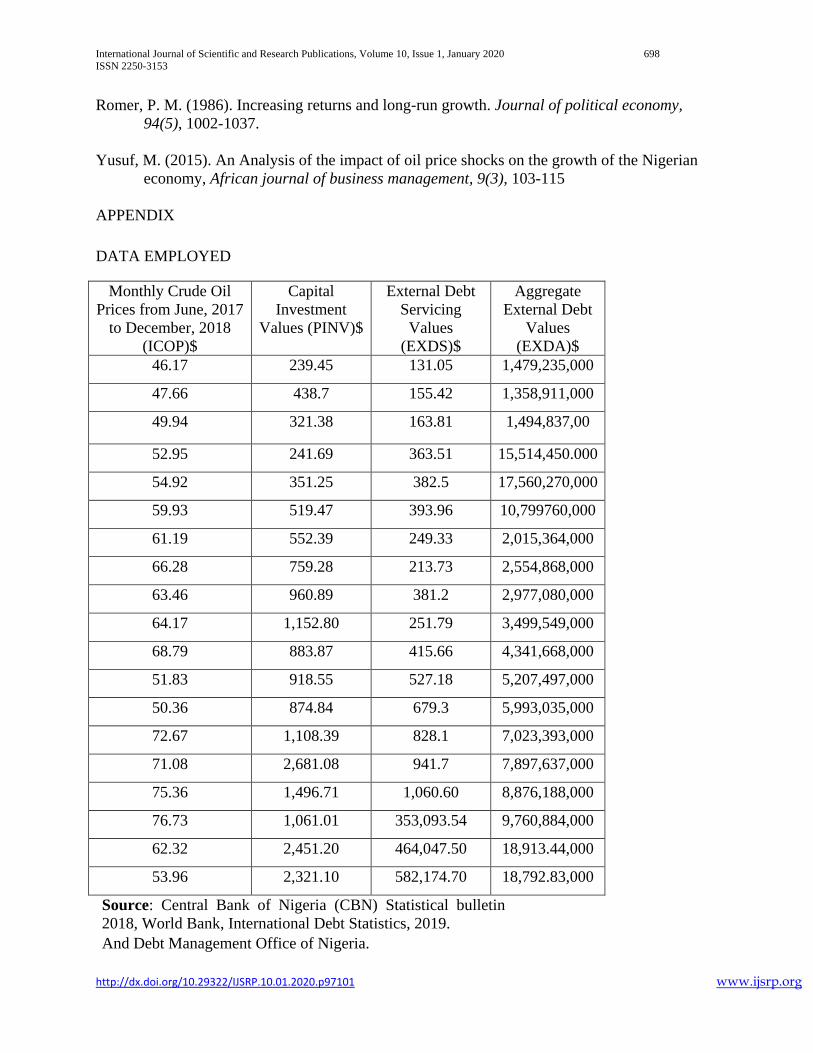
International Journal of Scientific and Research Publications, Volume 10, Issue 1, January 2020 698
ISSN 2250-3153
http://dx.doi.org/10.29322/IJSRP.10.01.2020.p97101 www.ijsrp.org
Romer, P. M. (1986). Increasing returns and long-run growth. Journal of political economy,
94(5), 1002-1037.
Yusuf, M. (2015). An Analysis of the impact of oil price shocks on the growth of the Nigerian
economy, African journal of business management, 9(3), 103-115
APPENDIX
DATA EMPLOYED
Monthly Crude Oil
Prices from June, 2017
to December, 2018
(ICOP)$
Capital
Investment
Values (PINV)$
External Debt
Servicing
Values
(EXDS)$
Aggregate
External Debt
Values
(EXDA)$
46.17 239.45 131.05 1,479,235,000
47.66 438.7 155.42 1,358,911,000
49.94 321.38 163.81 1,494,837,00
52.95 241.69 363.51 15,514,450.000
54.92 351.25 382.5 17,560,270,000
59.93 519.47 393.96 10,799760,000
61.19 552.39 249.33 2,015,364,000
66.28 759.28 213.73 2,554,868,000
63.46 960.89 381.2 2,977,080,000
64.17 1,152.80 251.79 3,499,549,000
68.79 883.87 415.66 4,341,668,000
51.83 918.55 527.18 5,207,497,000
50.36 874.84 679.3 5,993,035,000
72.67 1,108.39 828.1 7,023,393,000
71.08 2,681.08 941.7 7,897,637,000
75.36 1,496.71 1,060.60 8,876,188,000
76.73 1,061.01 353,093.54 9,760,884,000
62.32 2,451.20 464,047.50 18,913.44,000
53.96 2,321.10 582,174.70 18,792.83,000
Source: Central Bank of Nigeria (CBN) Statistical bulletin
2018, World Bank, International Debt Statistics, 2019.
And Debt Management Office of Nigeria.

International Journal of Scientific and Research Publications, Volume 10, Issue 1, January 2020 699
ISSN 2250-3153
http://dx.doi.org/10.29322/IJSRP.10.01.2020.p97101 www.ijsrp.org
Unit Root Test Result for ICOP
Null Hypothesis: D(ICOP) has a unit root
Exogenous: None
Lag Length: 0 (Automatic - based on SIC, maxlag=3)
t-Statistic Prob.*
Augmented Dickey-Fuller test statistic -3.871286 0.0007
Test critical values: 1% level -2.708094
5% level -1.962813
10% level -1.606129
*MacKinnon (1996) one-sided p-values.
Warning: Probabilities and critical values calculated for 20 observations
and may not be accurate for a sample size of 17
Augmented Dickey-Fuller Test Equation
Dependent Variable: D(ICOP,2)
Method: Least Squares
Date: 12/11/19 Time: 23:30
Sample (adjusted): 2017M08 2018M12
Included observations: 17 after adjustments
Variable Coefficient Std. Error t-Statistic Prob.
D(ICOP(-1)) -0.996608 0.257436 -3.871286 0.0014
R-squared 0.482368 Mean dependent var -0.579412
Adjusted R-squared 0.482368 S.D. dependent var 11.97835
S.E. of regression 8.618015 Akaike info criterion 7.202609
Sum squared resid 1188.323 Schwarz criterion 7.251622
Log likelihood -60.22218 Hannan-Quinn criter. 7.207481
Durbin-Watson stat 1.941308
Unit Root Test Result for PINV
Null Hypothesis: D(PINV) has a unit root
Exogenous: Constant
Lag Length: 1 (Automatic - based on SIC, maxlag=3)
t-Statistic Prob.*
Augmented Dickey-Fuller test statistic -6.858708 0.0000
Test critical values: 1% level -3.920350
5% level -3.065585
10% level -2.673459
*MacKinnon (1996) one-sided p-values.
Warning: Probabilities and critical values calculated for 20 observations

International Journal of Scientific and Research Publications, Volume 10, Issue 1, January 2020 700
ISSN 2250-3153
http://dx.doi.org/10.29322/IJSRP.10.01.2020.p97101 www.ijsrp.org
and may not be accurate for a sample size of 16
Augmented Dickey-Fuller Test Equation
Dependent Variable: D(PINV,2)
Method: Least Squares
Date: 12/11/19 Time: 23:35
Sample (adjusted): 2017M09 2018M12
Included observations: 16 after adjustments
Variable Coefficient Std. Error t-Statistic Prob.
D(PINV(-1)) -2.387867 0.348151 -6.858708 0.0000
D(PINV(-1),2) 0.831626 0.230843 3.602563 0.0032
C 237.6491 118.2075 2.010440 0.0656
R-squared 0.831379 Mean dependent var -0.798750
Adjusted R-squared 0.805437 S.D. dependent var 1035.286
S.E. of regression 456.6572 Akaike info criterion 15.25310
Sum squared resid 2710965. Schwarz criterion 15.39796
Log likelihood -119.0248 Hannan-Quinn criter. 15.26052
F-statistic 32.04798 Durbin-Watson stat 2.201037
Prob(F-statistic) 0.00v0009
Unit Root Test Result for EXDS
Null Hypothesis: D(EXDS) has a unit root
Exogenous: None
Lag Length: 0 (Automatic - based on SIC, maxlag=3)
t-Statistic Prob.*
Augmented Dickey-Fuller test statistic -2.523855 0.0151
Test critical values: 1% level -2.708094
5% level -1.962813
10% level -1.606129
*MacKinnon (1996) one-sided p-values.
Warning: Probabilities and critical values calculated for 20 observations
and may not be accurate for a sample size of 17
Augmented Dickey-Fuller Test Equation
Dependent Variable: D(EXDS,2)
Method: Least Squares
Date: 12/11/19 Time: 23:42
Sample (adjusted): 2017M08 2018M12
Included observations: 17 after adjustments
Variable Coefficient Std. Error t-Statistic Prob.
D(EXDS(-1)) -0.616789 0.244384 -2.523855 0.0226
R-squared 0.281513 Mean dependent var 6947.225
Adjusted R-squared 0.281513 S.D. dependent var 106417.2

International Journal of Scientific and Research Publications, Volume 10, Issue 1, January 2020 701
ISSN 2250-3153
http://dx.doi.org/10.29322/IJSRP.10.01.2020.p97101 www.ijsrp.org
S.E. of regression 90203.07 Akaike info criterion 25.71454
Sum squared resid 1.30E+11 Schwarz criterion 25.76355
Log likelihood -217.5736 Hannan-Quinn criter. 25.71941
Durbin-Watson stat 2.113004
Unit Root Test Result for EXDA
Null Hypothesis: D(EXDA) has a unit root
Exogenous: Constant, Linear Trend
Lag Length: 1 (Automatic - based on SIC, maxlag=3)
t-Statistic Prob.*
Augmented Dickey-Fuller test statistic -3.946888 0.0348
Test critical values: 1% level -4.667883
5% level -3.733200
10% level -3.310349
*MacKinnon (1996) one-sided p-values.
Warning: Probabilities and critical values calculated for 20 observations
and may not be accurate for a sample size of 16
Augmented Dickey-Fuller Test Equation
Dependent Variable: D(EXDA,2)
Method: Least Squares
Date: 12/12/19 Time: 09:43
Sample (adjusted): 2017M09 2018M12
Included observations: 16 after adjustments
Variable Coefficient Std. Error t-Statistic Prob.
D(EXDA(-1)) -1.115679 0.282673 -3.946888 0.0019
D(EXDA(-1),2) 0.470757 0.242159 1.944002 0.0757
C -7.376017 3.304807 -2.231905 0.0455
@TREND("2017M06
") 0.599722 0.284607 2.107191 0.0568
R-squared 0.570103 Mean dependent var -0.162500
Adjusted R-squared 0.462628 S.D. dependent var 6.391127
S.E. of regression 4.685057 Akaike info criterion 6.138951
Sum squared resid 263.3971 Schwarz criterion 6.332098
Log likelihood -45.11161 Hannan-Quinn criter. 6.148842
F-statistic 5.304545 Durbin-Watson stat 2.223392
Prob(F-statistic) 0.014698
Johansen co-integration test results
Date: 12/12/19 Time: 10:10
Sample (adjusted): 2017M08 2018M12
Included observations: 17 after adjustments

International Journal of Scientific and Research Publications, Volume 10, Issue 1, January 2020 702
ISSN 2250-3153
http://dx.doi.org/10.29322/IJSRP.10.01.2020.p97101 www.ijsrp.org
Trend assumption: Linear deterministic trend (restricted)
Series: PINV EXDS EXDA ICOP
Lags interval (in first differences): 1 to 1
Unrestricted Cointegration Rank Test (Trace)
Hypothesized Trace 0.05
No. of CE(s) Eigenvalue Statistic Critical Value Prob.**
None * 0.975265 131.7913 63.87610 0.0000
At most 1 * 0.937077 68.89926 42.91525 0.0000
At most 2 0.591926 21.88003 25.87211 0.1450
At most 3 0.323453 6.642796 12.51798 0.3833
Trace test indicates 2 cointegrating eqn(s) at the 0.05 level
* denotes rejection of the hypothesis at the 0.05 level
**MacKinnon-Haug-Michelis (1999) p-values
Unrestricted Cointegration Rank Test (Maximum Eigenvalue)
Hypothesized Max-Eigen 0.05
No. of CE(s) Eigenvalue Statistic Critical Value Prob.**
None * 0.975265 62.89207 32.11832 0.0000
At most 1 * 0.937077 47.01923 25.82321 0.0000
At most 2 0.591926 15.23723 19.38704 0.1811
At most 3 0.323453 6.642796 12.51798 0.3833
Max-eigenvalue test indicates 2 cointegrating eqn(s) at the 0.05 level
* denotes rejection of the hypothesis at the 0.05 level
**MacKinnon-Haug-Michelis (1999) p-values
Unrestricted Cointegrating Coefficients (normalized by b'*S11*b=I):
PINV EXDS EXDA ICOP
@TREND(17
M07)
-0.001941 -5.43E-06 -0.045435 -0.082593 0.149576
-0.006169 4.32E-06 0.150588 0.280457 0.449692
0.000167 8.71E-06 -0.069187 -0.156359 0.228863
-0.000641 4.90E-06 -0.097320 0.108063 -0.211084
Unrestricted Adjustment Coefficients (alpha):
D(PINV) 259.6195 201.5125 166.1496 29.49187
D(EXDS) -67335.64 -8788.612 18928.14 -6183.278
D(EXDA) 0.127597 -3.450908 0.753466 1.755586
D(ICOP) 2.456525 -3.325184 1.493228 -3.083173
1 Cointegrating Equation(s): Log likelihood -414.8500

International Journal of Scientific and Research Publications, Volume 10, Issue 1, January 2020 703
ISSN 2250-3153
http://dx.doi.org/10.29322/IJSRP.10.01.2020.p97101 www.ijsrp.org
Normalized cointegrating coefficients (standard error in parentheses)
PINV EXDS EXDA ICOP
@TREND(17
M07)
1.000000 0.002799 23.40785 42.55149 -77.06101
(0.00045) (3.93751) (5.87043) (10.3689)
Adjustment coefficients (standard error in parentheses)
D(PINV) -0.503923
(0.17978)
D(EXDS) 130.6989
(17.7597)
D(EXDA) -0.000248
(0.00282)
D(ICOP) -0.004768
(0.00393)
2 Cointegrating Equation(s): Log likelihood -391.3404
Normalized cointegrating coefficients (standard error in parentheses)
PINV EXDS EXDA ICOP
@TREND(17
M07)
1.000000 0.000000 -14.83395 -27.83605 -73.72866
(1.69082) (2.67454) (4.50458)
0.000000 1.000000 13663.31 25148.58 -1190.605
(1190.84) (1883.68) (3172.57)
Adjustment coefficients (standard error in parentheses)
D(PINV) -1.747075 -0.000539
(0.45213) (0.00049)
D(EXDS) 184.9168 0.327810
(56.6377) (0.06081)
D(EXDA) 0.021041 -1.56E-05
(0.00655) (7.0E-06)
D(ICOP) 0.015745 -2.77E-05
(0.01138) (1.2E-05)
3 Cointegrating Equation(s): Log likelihood -383.7218
Normalized cointegrating coefficients (standard error in parentheses)
PINV EXDS EXDA ICOP
@TREND(17
M07)
1.000000 0.000000 0.000000 1.778320 -93.82786
(5.05513) (9.24032)
0.000000 1.000000 0.000000 -2128.748 17322.44
(3986.87) (7287.64)
0.000000 0.000000 1.000000 1.996392 -1.354946
(0.29913) (0.54679)
Adjustment coefficients (standard error in parentheses)

International Journal of Scientific and Research Publications, Volume 10, Issue 1, January 2020 704
ISSN 2250-3153
http://dx.doi.org/10.29322/IJSRP.10.01.2020.p97101 www.ijsrp.org
D(PINV) -1.719295 0.000907 7.054163
(0.31547) (0.00054) (8.37933)
D(EXDS) 188.0816 0.492595 426.3484
(42.9743) (0.07397) (1141.46)
D(EXDA) 0.021167 -9.05E-06 -0.577591
(0.00639) (1.1E-05) (0.16964)
D(ICOP) 0.015995 -1.47E-05 -0.715655
(0.01100) (1.9E-05) (0.29227)
Vector Autoregression Estimates
Date: 12/12/19 Time: 17:23
Sample (adjusted): 2017M08 2018M12
Included observations: 17 after adjustments
Standard errors in ( ) & t-statistics in [ ]
PINV EXDS EXDA ICOP
PINV(-1) 0.602460 -50.00837 0.003504 0.010328
(0.28322) (24.9401) (0.00378) (0.00489)
[ 2.12718] [-2.00514] [ 0.92668] [ 2.11253]
PINV(-2) -0.046264 174.7305 0.002644 0.006557
(0.28378) (24.9894) (0.00379) (0.00490)
[-0.16303] [ 6.99218] [ 0.69802] [ 1.33851]
EXDS(-1) 0.005009 0.901693 3.51E-05 1.28E-05
(0.00166) (0.14660) (2.2E-05) (2.9E-05)
[ 3.00874] [ 6.15072] [ 1.58035] [ 0.44583]
EXDS(-2) -0.002640 0.492102 -4.97E-05 -4.38E-05
(0.00255) (0.22417) (3.4E-05) (4.4E-05)
[-1.03713] [ 2.19523] [-1.46263] [-0.99570]
EXDA(-1) -1.887274 -1258.635 0.988213 -0.507789
(24.1586) (2127.38) (0.32250) (0.41702)
[-0.07812] [-0.59164] [ 3.06420] [-1.21765]
EXDA(-2) -26.73021 3992.772 -0.384562 0.119715
(20.8861) (1839.21) (0.27882) (0.36053)
[-1.27981] [ 2.17092] [-1.37926] [ 0.33205]
ICOP(-1) 33.73645 547.4842 -0.304805 0.114590
(19.5029) (1717.40) (0.26035) (0.33666)
[ 1.72982] [ 0.31879] [-1.17074] [ 0.34038]
ICOP(-2) -57.06248 773.2981 -0.219454 -0.786828
(23.4819) (2067.79) (0.31347) (0.40534)
[-2.43006] [ 0.37397] [-0.70008] [-1.94115]
C 2116.316 -189235.6 30.38048 92.15675
(1824.98) (160706.) (24.3624) (31.5026)

International Journal of Scientific and Research Publications, Volume 10, Issue 1, January 2020 705
ISSN 2250-3153
http://dx.doi.org/10.29322/IJSRP.10.01.2020.p97101 www.ijsrp.org
[ 1.15964] [-1.17753] [ 1.24702] [ 2.92537]
R-squared 0.854840 0.982425 0.833363 0.695756
Adj. R-squared 0.709680 0.964851 0.666726 0.391512
Sum sq. resids 1275161. 9.89E+09 227.2423 379.9631
S.E. equation 399.2432 35156.93 5.329661 6.891690
F-statistic 5.888950 55.90029 5.001073 2.286833
Log likelihood -119.5376 -195.6637 -46.16079 -50.53027
Akaike AIC 15.12207 24.07808 6.489504 7.003561
Schwarz SC 15.56318 24.51920 6.930617 7.444674
Mean dependent 1097.406 82715.77 11.91176 62.11412
S.D. dependent 740.9674 187522.4 9.232069 8.834858
Determinant resid covariance (dof adj.) 5.644416
Determinant resid covariance 2.775615
Log likelihood -398.7217
Akaike information criterion 51.14373
Schwarz criterion 52.90818

International Journal of Scientific and Research Publications, Volume 10, Issue 1, January 2020 706
ISSN 2250-3153
http://dx.doi.org/10.29322/IJSRP.10.01.2020.p97102 www.ijsrp.org
Scribal copies of pre-modern texts and the digital
environment: A case study of the Odia Sarala
Mahabharata
Dr. Bijayalaxmi Dash
Asst. Professor in Odia, Ravenshaw University, Cuttack
DOI: 10.29322/IJSRP.10.01.2020.p97102
http://dx.doi.org/10.29322/IJSRP.10.01.2020.p97102
Abstract- No other text fascinates the Odia mind as the eponymous
Sarala Mahabharata. As of now we have at least four complete
editions of the text beginning from the last quarter of the
nineteenth century to the third quarter of the twentieth century. In
spite of this, the question of ‘authentic text’ is yet to be settled;
consequently there continues to be a call by textual scholars to
restore the ‘authentic text’. This is natural, given that there are
around 280 palm leaf manuscript scribal copies of the text in the
Odisha State Museum alone and no two copies are exactly the
same. Hundreds and thousands of copies exist in private
possession and are yet to be taken up for study. Understandably,
no textual scholar would be able to investigate all the extant copies
to arrive at the so-called ‘authentic text’. This paper argues that in
view of the special nature of the Sarala corpus, finding an
authentic way of ‘doing the Mahabharata’ would be more fruitful
than looking for the authentic text. In view of the unlimited
possibilities offered by the digital environment and scope for
computation, this paper reviews the approaches of scholars to the
text and offers a new method of ‘doing the Mahabharata’. It will
study the textual transmission of Sarala Mahabharata in Odisha,
and argue for the need for digital archiving and curtain to enable
fine-grained corpus analysis for enhanced textual criticism.
Index Terms- Manuscript culture, textual criticism, corpus
analysis
I. INTRODUCTION
he Mahabharata of Sarala Das in Oriya language which was
created in about 15th – 16th century A.D. was a long lived
poetic endowment gift in a phase of all India vernacularization.
This spacious work is interpreted as the earliest initial scribble of
Oriya epic and consequently serves as a model archetype for the
blooming of additional epic literature in Orissa in the medieval
phase. The author of the text casted himself as Sarala Das for his
for his fidelity to the goddess Sarala (a village female deity who
synthesize sakta and vaishnaba analysis in herself) and thus he had
this name after the collection of the Mahabharat in Odia. (1) This
Mahabharat of Sarala Das is not the accurate veracious furnishing
of the Sanskrit Mahabharat of Vysa. It is only an encyclopedic
epitome of the Socio-Political-Cultural build up Of India along
with Orissa in the medieval phase in the clutch of the aspects of
the Sanskrit epic. The author calls it as Mahabharat yet he makes
use of sections of other Puranas and upu-Puranas. He homogenizes
them with territorial customary chronicle familiar to him. All most
all significant angle of research of the topical Mahabharat in Oriya
is the identity and nature of the content. As it focus one’s attention
on the early and medieval phase its dominance has been observed
by the historians and language experts who occasionally have been
convinced to use it for further historical research.(2)
Hence in this working paper our emphasis is the textual
problem, critical editions, apply digital humanities method, POS
tagging and chunking of a classical text.
II. STATEMENT OF THE PROBLEM:
‘The textual problem’ and ‘critical editions’:-
The main aim of centre for Odishan studies. The Sarala
Mahabharata is a relevant specimen of the ‘textual
problem’ in the manufacture of academic version.
Actually Sarala Mahabharat was brought to the centre of
attention in the 17th-18th century A.D. by Pitambara Das , the
writer of Odia Nrushingha purna and before that in Orissa’s Pandit
and colon people gave priority to Jaganatha Das’s Bhagavata,
Dandi Ramayana of Balarama Das, Haribansha of Achyutananda
Das and some of the books of ‘Bhakti’ by the enthusiasts of
Chaitanya.
It is wel known as of now that the great researcher
Professor ArtaBallav Mohanty’ study of the Odia
Mahabharata brought out by Directorate of culture in the
year 1964 is less than complete and perhaps unreliable.
According to the own statement of Professor Mohanty,
his study was established on 11 manuscripts accessible at
that time. In spite of the inadequate number of
manuscripts mentioned to, a analysis of subsisting
literature on this proposal displays that the Arta Ballav
Mohanty’s adition is at best an extensive encyclopedic
edition of Sarala Mahabharatas.
Secondly According to eminent scholar Sj. Gopinath
Mohanty, that the author of the Mahabharata was not
Sarala but Sarola and that the text was written in tenth
century. But in Artaballava’s edition says it was based on
two oldest extant manuscripts, collected from a private
source and other is yet to be known.
There are also a handful of private venture to translate,
edit and publish some chapters of Mahabharata. All of
T
International Journal of Scientific and Research Publications, Volume 10, Issue 1, January 2020 707
ISSN 2250-3153
http://dx.doi.org/10.29322/IJSRP.10.01.2020.p97102 www.ijsrp.org
them expect an analytical study therapy of odia
Mahabharata.
At present 240 Mahabharata manuscripts have been
collected from beyond Orissa and considered the
momentousness of Mahabharata as a cross disciplinary
description of Odisha’s by gone Socio-cultural history.
Thus an up to date newfangled critical edition of
Mahabharata in Odia and in English is essential.
There exists no account of how the existence or non-
appearance of par textual components besides from the colophons
may be taken into account learning of Sarala manuscripts. Far
apart from printed books, embellished and enhanced illuminated
manuscripts, palm leaf manuscripts exists an exceptional set of
issues as the differentiation of text and paratext.
In the transmission activity of the manuscripts, certain
unavoidable components are consolidated as a part of the main
text. Whatever such components are to be read as mere additions
or alteration or misrepresentation. It is essential to faithful and
detaild study of Mahabharata and rationalizes the variation
between additions and alterations and various authentic
trademarks for the development of a critical edition.
Bibliographic note:
The main framework of the narrative of the Sarala
Mahabharata but has made several fluctuations and has attached
to it substantially the stories of his own formation and various
other matters known to him.
In the 19th century we find the name in the text of ‘William
Hunter’s Orissa’ in the year 1872 expressed that sarala Das kavi
stayed 300 years ago, transcribed Mahabharata into oriya (3) in the
year 20th century A.D. there was an expanding study on odia
Mahabharat in the well known established odia magazines like
“Utkala Sahitya” ‘Mukura’ and Jhankar, pandit Mrutyuniaya Rath
emerged a comprehensive wall-to wall review on sarala
Mahabharat in 1911 in murura, and then in 1915, Gopinatha
Nandasharma in Utkala sahitya (4)
In 1898: Manmohan chakravarty dates the constitution to
“not later than 16th century like the original Sanskrit it forms a of
diagnostic experiment and takes of about two thousand folios. It
did not affect to any literary conclude and the verse generally
unequally. That verse is popularly known as “Dundi bruta”. But it
has the benefits of having antiquated the Sanskrit Mahabharat
among universal. (5)
In the year 1903: Madhusudan Das classify Sarala
Mahabharata as Purana and concluded his analysis in just one
paragraph (6)
In the year 1904 Researcher Shyamasundar Rajguru clarity
and describes’ Sarala as “Adikabi “of odia litetrature (see:
Biographical note on Sarala appears in Utkala sahitya, year 7, No-
4, April, 1904)
In 1911 , Pt. Mruturjaya Rath wrote “sarala charita “ (A
biography of sarala ) (8) According to Rath sarala was born
between 1435 AD to 1479 AD during the reign of Kapilendra
Deva , around 1415 and Mahabharata was composed in 1465 AD
.
In 1926: A marshalling discourse of sarala Mahabharata
writing by Gopinatha Nanda Sharma, titled as Sri Bharat Darpan :
maheralize in the from of a book contained nine chapters . (9)
In 1948: Another eminent analyst Padit Nilkantha Das in
1948-1953 Sarala and setup its historical awareness of the early
and medieval phase of India.
In 1950s and 60s there was a intense debate between two
literary magazines ‘Jhankara’ and ‘Dagara’ based on the bnature
and content of Mahabharata . The noted contributor of this debate
were ‘GopinathaMohanty’, Banshidhara Mohanty, Achyutananda
Das , and Krushna Chandra Panigrahi , The study was further
concentrate with John Boltion’s curiosity in it and by the critical
analysis by si. Suchidanada Mishra and others It was G.N. Dash
(Gaganendranath Dash ) and man y others it was G.N. Dash who
chtlenge the view that sarala Das deliberately worn histry in the
anthology of his mahabharat. And he recommended that in order
to his mahabharat one mast know the periodical time which he was
following and that one mast not forfet hios sakata hindu mins (10)
Krushna Chandra Panigrahi. Researcher. Well known historian of
odisha was very courageous on the historical consciousness of the
poet (11) He endow numerous historical and geographical
references in sarala Mahabharata which part was not mentioned
in the original Sanskrit Mahabharata text panigrahi appreciating
the views of his ancestors like Mrutunjaya Rath , Gopinatha Nanda
Sharama and Nilakantha Das made a meticulous painstaking study
of the Mahabharata and proposed that the poet had responsively
and knowingly established various historical character and
episodes of early and medieval India . (12) He has carefully
studied the references and contents to sustain that actually poet
was a historian .
The clarification of Panigrahi on the history of Orissa and
India in Sarala Mahabharata has been challenged by professor
G.N. Dash in an appreciative intelligent thoughtful focus on odia
. Just have a look, one action – packed debate of G.N. Dash can
be stated below :-
Where did Sarala Das noticed the political defense history of
India of his period and were his origin ? How could he direct draw
his attention towards history and how could he be able to protect
the past in such a systematic correct manner. In the different
episodes of his Mahabharata. But in the point of geographical
information given by Sarala Das sometimes not accurate and also
imperfect and it cannot be acquired by the contemporary
researchers.
III. AIM AND OBJECTIVE
To seriously survey and critically evaluate the editorial
exercises accepted for the preparation of Sarala Mahabharata and
to rethink scholastic hypothesis about the text and the context.
Moving into the archives and museum, one should discover an
unbelievable captivating and outstanding assortment of
documents to be worked on.
All of this makes it possible to invest in the collection and
digitization of manuscripts so as to enable shape required for
linguistic anatomization of the Sarala Mahabharata manuscripts.
It will be early to create postages for a ancient text.
All this will assist the inscription the historical challenge of
earmark the past in a contemporary version.
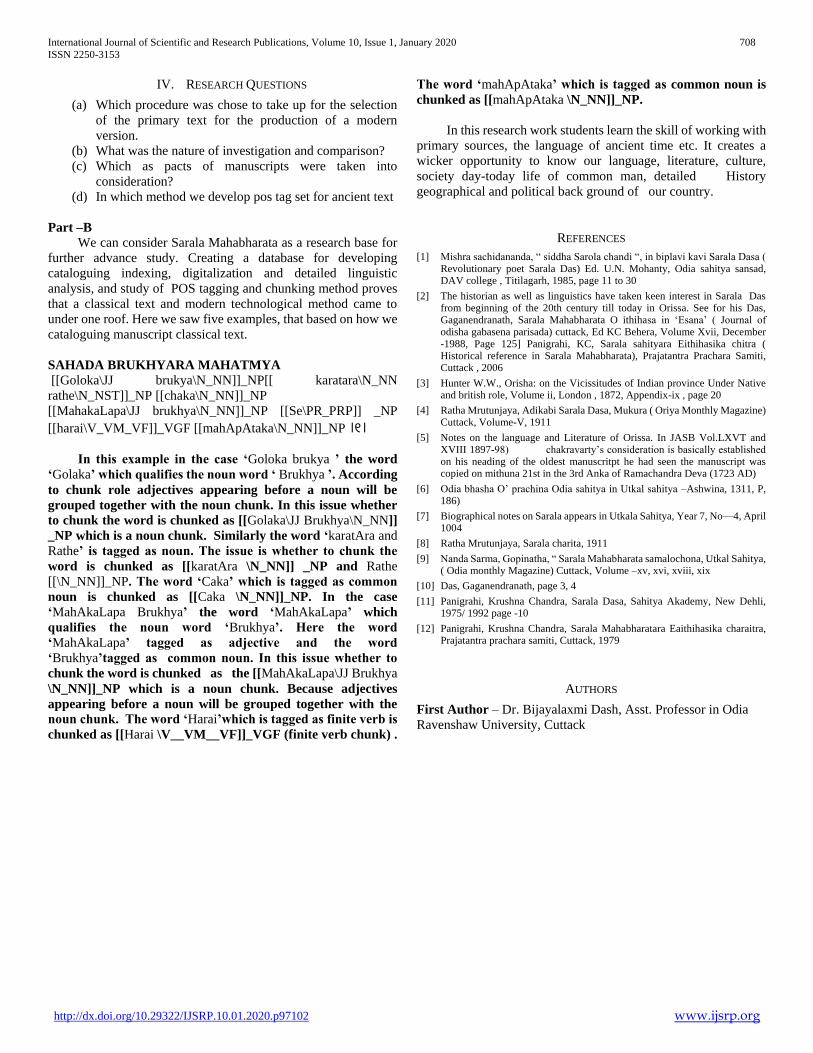
International Journal of Scientific and Research Publications, Volume 10, Issue 1, January 2020 708
ISSN 2250-3153
http://dx.doi.org/10.29322/IJSRP.10.01.2020.p97102 www.ijsrp.org
IV. RESEARCH QUESTIONS
(a) Which procedure was chose to take up for the selection
of the primary text for the production of a modern
version.
(b) What was the nature of investigation and comparison?
(c) Which as pacts of manuscripts were taken into
consideration?
(d) In which method we develop pos tag set for ancient text
Part –B
We can consider Sarala Mahabharata as a research base for
further advance study. Creating a database for developing
cataloguing indexing, digitalization and detailed linguistic
analysis, and study of POS tagging and chunking method proves
that a classical text and modern technological method came to
under one roof. Here we saw five examples, that based on how we
cataloguing manuscript classical text.
SAHADA BRUKHYARA MAHATMYA
[[Goloka\JJ brukya\N_NN]]_NP[[ karatara\N_NN
rathe\N_NST]]_NP [[chaka\N_NN]]_NP
[[MahakaLapa\JJ brukhya\N_NN]]_NP [[Se\PR_PRP]] _NP
[[harai\V_VM_VF]]_VGF [[mahApAtaka\N_NN]]_NP ।୧।
In this example in the case ‘Goloka brukya ’ the word
‘Golaka’ which qualifies the noun word ‘ Brukhya ’. According
to chunk role adjectives appearing before a noun will be
grouped together with the noun chunk. In this issue whether
to chunk the word is chunked as [[Golaka\JJ Brukhya\N_NN]]
_NP which is a noun chunk. Similarly the word ‘karatAra and
Rathe’ is tagged as noun. The issue is whether to chunk the
word is chunked as [[karatAra \N_NN]] _NP and Rathe
[[\N_NN]]_NP. The word ‘Caka’ which is tagged as common
noun is chunked as [[Caka \N_NN]]_NP. In the case
‘MahAkaLapa Brukhya’ the word ‘MahAkaLapa’ which
qualifies the noun word ‘Brukhya’. Here the word
‘MahAkaLapa’ tagged as adjective and the word
‘Brukhya’tagged as common noun. In this issue whether to
chunk the word is chunked as the [[MahAkaLapa\JJ Brukhya
\N_NN]]_NP which is a noun chunk. Because adjectives
appearing before a noun will be grouped together with the
noun chunk. The word ‘Harai’which is tagged as finite verb is
chunked as [[Harai \V__VM__VF]]_VGF (finite verb chunk) .
The word ‘mahApAtaka’ which is tagged as common noun is
chunked as [[mahApAtaka \N_NN]]_NP.
In this research work students learn the skill of working with
primary sources, the language of ancient time etc. It creates a
wicker opportunity to know our language, literature, culture,
society day-today life of common man, detailed History
geographical and political back ground of our country.
REFERENCES
[1] Mishra sachidananda, “ siddha Sarola chandi “, in biplavi kavi Sarala Dasa ( Revolutionary poet Sarala Das) Ed. U.N. Mohanty, Odia sahitya sansad, DAV college , Titilagarh, 1985, page 11 to 30
[2] The historian as well as linguistics have taken keen interest in Sarala Das from beginning of the 20th century till today in Orissa. See for his Das, Gaganendranath, Sarala Mahabharata O ithihasa in ‘Esana’ ( Journal of odisha gabasena parisada) cuttack, Ed KC Behera, Volume Xvii, December -1988, Page 125] Panigrahi, KC, Sarala sahityara Eithihasika chitra ( Historical reference in Sarala Mahabharata), Prajatantra Prachara Samiti, Cuttack , 2006
[3] Hunter W.W., Orisha: on the Vicissitudes of Indian province Under Native and british role, Volume ii, London , 1872, Appendix-ix , page 20
[4] Ratha Mrutunjaya, Adikabi Sarala Dasa, Mukura ( Oriya Monthly Magazine) Cuttack, Volume-V, 1911
[5] Notes on the language and Literature of Orissa. In JASB Vol.LXVT and XVIII 1897-98) chakravarty’s consideration is basically established on his neading of the oldest manuscritpt he had seen the manuscript was copied on mithuna 21st in the 3rd Anka of Ramachandra Deva (1723 AD)
[6] Odia bhasha O’ prachina Odia sahitya in Utkal sahitya –Ashwina, 1311, P, 186)
[7] Biographical notes on Sarala appears in Utkala Sahitya, Year 7, No—4, April 1004
[8] Ratha Mrutunjaya, Sarala charita, 1911
[9] Nanda Sarma, Gopinatha, “ Sarala Mahabharata samalochona, Utkal Sahitya, ( Odia monthly Magazine) Cuttack, Volume –xv, xvi, xviii, xix
[10] Das, Gaganendranath, page 3, 4
[11] Panigrahi, Krushna Chandra, Sarala Dasa, Sahitya Akademy, New Dehli, 1975/ 1992 page -10
[12] Panigrahi, Krushna Chandra, Sarala Mahabharatara Eaithihasika charaitra, Prajatantra prachara samiti, Cuttack, 1979
AUTHORS
First Author – Dr. Bijayalaxmi Dash, Asst. Professor in Odia
Ravenshaw University, Cuttack
International Journal of Scientific and Research Publications, Volume 10, Issue 1, January 2020 709
ISSN 2250-3153
http://dx.doi.org/10.29322/IJSRP.10.01.2020.p97103 www.ijsrp.org
A Clinical Study on the Effect and Efficacy of
Traditional Formulation Derived by Ola Leaves
Manuscript In The Management of Overweight And
Obesity
R. M. D. Jayasena*, K.G.C.Dissanayake**
* Community Medical Officer, Department of Ayurveda, North Western Province, Sri Lanka.
** Senior Lecturer in Kayacikitsa, Department of Cikithsa, Gampaha Wickramarachchi Ayurveda Institute, University of Kalaniya, Yakkala, Sri
Lanka.
DOI: 10.29322/IJSRP.10.01.2020.p97103
http://dx.doi.org/10.29322/IJSRP.10.01.2020.p97103
Abstract- Overweight and obesity are defined as abnormal or
excessive fat accumulation that presents a risk to health. Once
considered a high-income country problem, overweight and
obesity are now on the rise in low and middle-income countries,
particularly in urban settings. The treatment modalities have been
unsuccessful even in this modern technologically-advanced era.
Herbal drugs have been used in the treatment of Staulya since
ancient times. Thus in this research, it was intended to investigate
the effect of Virechana formulae in ola leave manuscript for
overweight and obesity control in Sri Lankan context. Group A
was treated with herbal formula for 4 weeks duration and Group
B was firstly treated with Virechana procedure and then
prescribed herbal formula for two weeks duration. When
analysing the results of Group B, BMI shows a P value of 0.000
which were highly significance. The mentioned traditional herbal
formula is effective for the management of overweight and obesity
related parameters. But it was more effective with the combination
of Virechana procedure than individual. The overall results of
present study evidence that the short term administration of new
herbal formulation has shown significant effect in decreasing the
overweight and Obesity. So the new herbal formulation is an
effective remedy for the management of Overweight and Obesity.
Index Terms- Overweight, Obesity, Staulya, Virechana
I. INTRODUCTION
verweight and obesity are defined as abnormal or excessive
fat accumulation that presents a risk to health (Finucane, et
al., 2011). A crude population measure of overweight and obesity
is the body mass index (BMI), a person’s weight in kilograms
divided by the square of his or her height in meters. A person with
a BMI of 30 or more is generally considered obese. A person with
a BMI equal to or more than 25 is considered overweight (WHO,
2015).
BMI is a simple index of weight-for-height that is
commonly used to classify overweight and obesity in adults. It is
defined as a person's weight in kilograms divided by the square of
his height in meters (kg/m2). The World Health Organization
(WHO) definition is BMI greater than or equal to 25 is overweight;
a BMI greater than or equal to 30 is obesity; 30.0 - 35.0 - class I
obesity; 35.0 - 40.0 - class II obesity; 40.0 - class III obesity and
BMI ≥ 35 or 40 kg/m2 is severe obesity (Debasis and Harry,
2008)i. BMI provides the most useful population level measure of
overweight and obesity as it is the same for both sexes and for all
ages of adults. However, it should be considered a rough guide
because it may not correspond to the same degree of fatness in
different individuals (Molarius, et al, 2005). The worldwide
prevalence of overweight and obesity more than doubled between
1980 and 2014.
Once considered a high-income country problem,
overweight and obesity are now on the rise in low and middle-
income countries, particularly in urban settings (Am and Clin,
1998)ii. In developing countries with emerging economies
(classified by the World Bank as lower and middle-income
countries) the rate of increase of childhood overweight and obesity
has been more than 30% higher than that of developed countries.
According to the proposed World Health Organization cut-
off values for Asians, the percentage of Sri Lankan adults in the
overweight, obese and centrally obese categories were 25.2%,
9.2% and 26.2%, respectively (WHO, 2015). Based on the cut-offs
for Caucasians, these were 16.8%, 3.7% and 10.8%. Our findings
were compatible with prevalence of obesity in regional countries.
In addition, female sex, urban living, higher education, higher
income and being in the middle age were shown to be associated
with overweight and obesity in Sri Lankans (WHO, 2015).
Overweight and obesity are linked to more deaths
worldwide than underweight. Those are major risk factors for a
number of chronic diseases, including diabetes, cardiovascular
diseases and cancer. Once considered a problem only in high
income countries, overweight and obesity are now dramatically on
the rise in low- and middle-income countries, particularly in urban
settings (Flegal, et al., 2010).
The fundamental cause of obesity and overweight is an
energy imbalance between calories consumed and calories
expended (National Institutes of Health, 1998). Globally, there has
been, an increased intake of energy-dense foods that are high in
fat,while an increase in physical inactivity due to the increasingly
sedentary nature of many forms of work, changing modes of
O
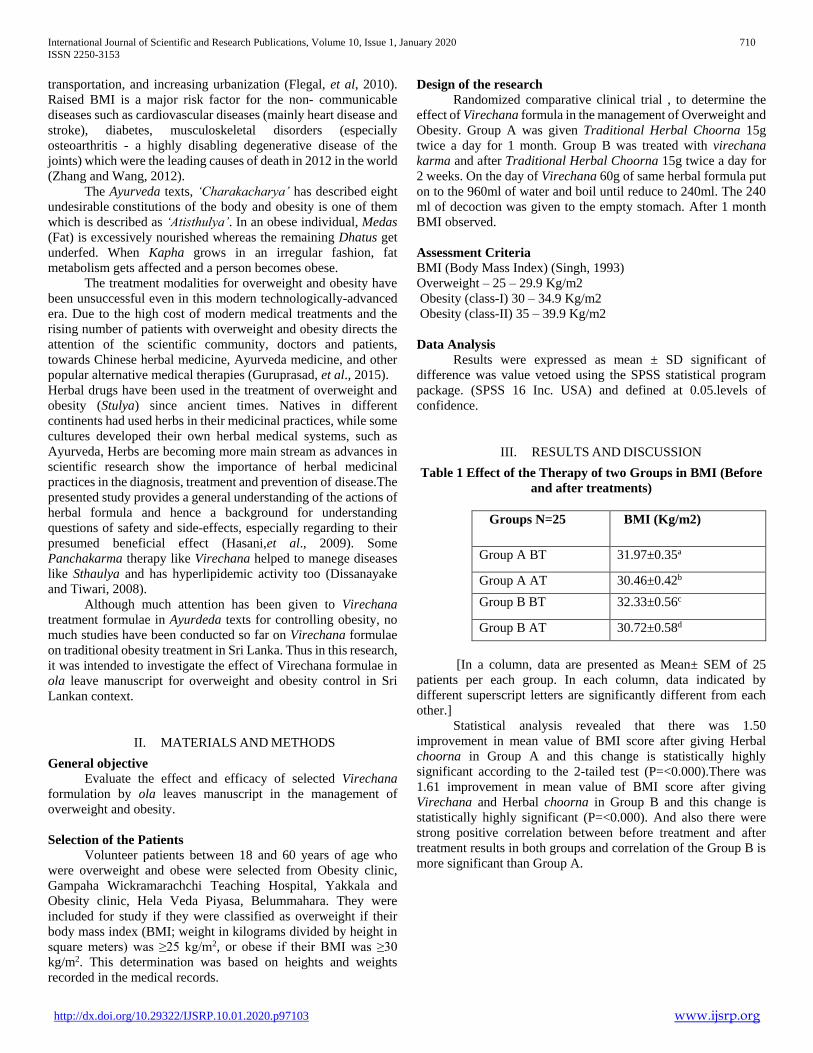
International Journal of Scientific and Research Publications, Volume 10, Issue 1, January 2020 710
ISSN 2250-3153
http://dx.doi.org/10.29322/IJSRP.10.01.2020.p97103 www.ijsrp.org
transportation, and increasing urbanization (Flegal, et al, 2010).
Raised BMI is a major risk factor for the non- communicable
diseases such as cardiovascular diseases (mainly heart disease and
stroke), diabetes, musculoskeletal disorders (especially
osteoarthritis - a highly disabling degenerative disease of the
joints) which were the leading causes of death in 2012 in the world
(Zhang and Wang, 2012).
The Ayurveda texts, ‘Charakacharya’ has described eight
undesirable constitutions of the body and obesity is one of them
which is described as ‘Atisthulya’. In an obese individual, Medas
(Fat) is excessively nourished whereas the remaining Dhatus get
underfed. When Kapha grows in an irregular fashion, fat
metabolism gets affected and a person becomes obese.
The treatment modalities for overweight and obesity have
been unsuccessful even in this modern technologically-advanced
era. Due to the high cost of modern medical treatments and the
rising number of patients with overweight and obesity directs the
attention of the scientific community, doctors and patients,
towards Chinese herbal medicine, Ayurveda medicine, and other
popular alternative medical therapies (Guruprasad, et al., 2015).
Herbal drugs have been used in the treatment of overweight and
obesity (Stulya) since ancient times. Natives in different
continents had used herbs in their medicinal practices, while some
cultures developed their own herbal medical systems, such as
Ayurveda, Herbs are becoming more main stream as advances in
scientific research show the importance of herbal medicinal
practices in the diagnosis, treatment and prevention of disease.The
presented study provides a general understanding of the actions of
herbal formula and hence a background for understanding
questions of safety and side-effects, especially regarding to their
presumed beneficial effect (Hasani,et al., 2009). Some
Panchakarma therapy like Virechana helped to manege diseases
like Sthaulya and has hyperlipidemic activity too (Dissanayake
and Tiwari, 2008).
Although much attention has been given to Virechana
treatment formulae in Ayurdeda texts for controlling obesity, no
much studies have been conducted so far on Virechana formulae
on traditional obesity treatment in Sri Lanka. Thus in this research,
it was intended to investigate the effect of Virechana formulae in
ola leave manuscript for overweight and obesity control in Sri
Lankan context.
II. MATERIALS AND METHODS
General objective
Evaluate the effect and efficacy of selected Virechana
formulation by ola leaves manuscript in the management of
overweight and obesity.
Selection of the Patients
Volunteer patients between 18 and 60 years of age who
were overweight and obese were selected from Obesity clinic,
Gampaha Wickramarachchi Teaching Hospital, Yakkala and
Obesity clinic, Hela Veda Piyasa, Belummahara. They were
included for study if they were classified as overweight if their
body mass index (BMI; weight in kilograms divided by height in
square meters) was ≥25 kg/m2, or obese if their BMI was ≥30
kg/m2. This determination was based on heights and weights
recorded in the medical records.
Design of the research
Randomized comparative clinical trial , to determine the
effect of Virechana formula in the management of Overweight and
Obesity. Group A was given Traditional Herbal Choorna 15g
twice a day for 1 month. Group B was treated with virechana
karma and after Traditional Herbal Choorna 15g twice a day for
2 weeks. On the day of Virechana 60g of same herbal formula put
on to the 960ml of water and boil until reduce to 240ml. The 240
ml of decoction was given to the empty stomach. After 1 month
BMI observed.
Assessment Criteria
BMI (Body Mass Index) (Singh, 1993)
Overweight – 25 – 29.9 Kg/m2
Obesity (class-I) 30 – 34.9 Kg/m2
Obesity (class-II) 35 – 39.9 Kg/m2
Data Analysis
Results were expressed as mean ± SD significant of
difference was value vetoed using the SPSS statistical program
package. (SPSS 16 Inc. USA) and defined at 0.05.levels of
confidence.
III. RESULTS AND DISCUSSION
Table 1 Effect of the Therapy of two Groups in BMI (Before
and after treatments)
Groups N=25 BMI (Kg/m2)
Group A BT 31.97±0.35a
Group A AT 30.46±0.42b
Group B BT 32.33±0.56c
Group B AT 30.72±0.58d
[In a column, data are presented as Mean± SEM of 25
patients per each group. In each column, data indicated by
different superscript letters are significantly different from each
other.]
Statistical analysis revealed that there was 1.50
improvement in mean value of BMI score after giving Herbal
choorna in Group A and this change is statistically highly
significant according to the 2-tailed test (P=<0.000).There was
1.61 improvement in mean value of BMI score after giving
Virechana and Herbal choorna in Group B and this change is
statistically highly significant (P=<0.000). And also there were
strong positive correlation between before treatment and after
treatment results in both groups and correlation of the Group B is
more significant than Group A.
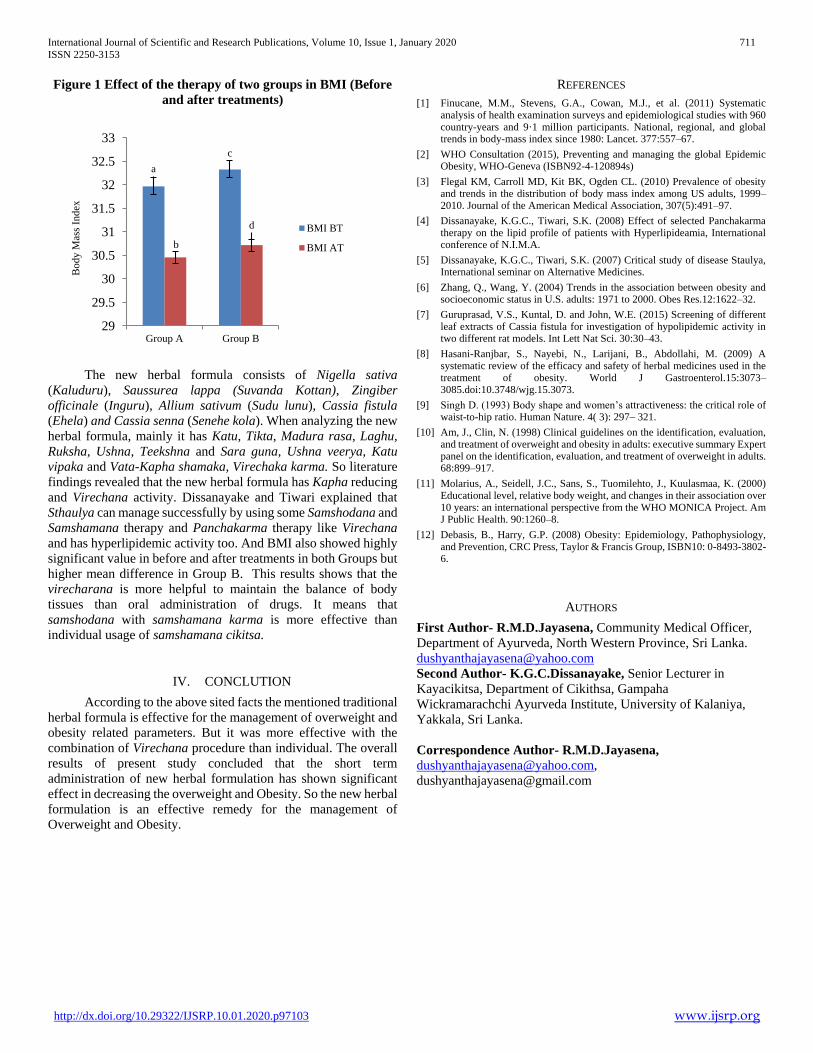
International Journal of Scientific and Research Publications, Volume 10, Issue 1, January 2020 711
ISSN 2250-3153
http://dx.doi.org/10.29322/IJSRP.10.01.2020.p97103 www.ijsrp.org
Figure 1 Effect of the therapy of two groups in BMI (Before
and after treatments)
The new herbal formula consists of Nigella sativa
(Kaluduru), Saussurea lappa (Suvanda Kottan), Zingiber
officinale (Inguru), Allium sativum (Sudu lunu), Cassia fistula
(Ehela) and Cassia senna (Senehe kola). When analyzing the new
herbal formula, mainly it has Katu, Tikta, Madura rasa, Laghu,
Ruksha, Ushna, Teekshna and Sara guna, Ushna veerya, Katu
vipaka and Vata-Kapha shamaka, Virechaka karma. So literature
findings revealed that the new herbal formula has Kapha reducing
and Virechana activity. Dissanayake and Tiwari explained that
Sthaulya can manage successfully by using some Samshodana and
Samshamana therapy and Panchakarma therapy like Virechana
and has hyperlipidemic activity too. And BMI also showed highly
significant value in before and after treatments in both Groups but
higher mean difference in Group B. This results shows that the
virecharana is more helpful to maintain the balance of body
tissues than oral administration of drugs. It means that
samshodana with samshamana karma is more effective than
individual usage of samshamana cikitsa.
IV. CONCLUTION
According to the above sited facts the mentioned traditional
herbal formula is effective for the management of overweight and
obesity related parameters. But it was more effective with the
combination of Virechana procedure than individual. The overall
results of present study concluded that the short term
administration of new herbal formulation has shown significant
effect in decreasing the overweight and Obesity. So the new herbal
formulation is an effective remedy for the management of
Overweight and Obesity.
REFERENCES
[1] Finucane, M.M., Stevens, G.A., Cowan, M.J., et al. (2011) Systematic analysis of health examination surveys and epidemiological studies with 960 country-years and 9·1 million participants. National, regional, and global trends in body-mass index since 1980: Lancet. 377:557–67.
[2] WHO Consultation (2015), Preventing and managing the global Epidemic Obesity, WHO-Geneva (ISBN92-4-120894s)
[3] Flegal KM, Carroll MD, Kit BK, Ogden CL. (2010) Prevalence of obesity and trends in the distribution of body mass index among US adults, 1999–2010. Journal of the American Medical Association, 307(5):491–97.
[4] Dissanayake, K.G.C., Tiwari, S.K. (2008) Effect of selected Panchakarma therapy on the lipid profile of patients with Hyperlipideamia, International conference of N.I.M.A.
[5] Dissanayake, K.G.C., Tiwari, S.K. (2007) Critical study of disease Staulya, International seminar on Alternative Medicines.
[6] Zhang, Q., Wang, Y. (2004) Trends in the association between obesity and socioeconomic status in U.S. adults: 1971 to 2000. Obes Res.12:1622–32.
[7] Guruprasad, V.S., Kuntal, D. and John, W.E. (2015) Screening of different leaf extracts of Cassia fistula for investigation of hypolipidemic activity in two different rat models. Int Lett Nat Sci. 30:30–43.
[8] Hasani-Ranjbar, S., Nayebi, N., Larijani, B., Abdollahi, M. (2009) A systematic review of the efficacy and safety of herbal medicines used in the treatment of obesity. World J Gastroenterol.15:3073–3085.doi:10.3748/wjg.15.3073.
[9] Singh D. (1993) Body shape and women’s attractiveness: the critical role of waist-to-hip ratio. Human Nature. 4( 3): 297– 321.
[10] Am, J., Clin, N. (1998) Clinical guidelines on the identification, evaluation, and treatment of overweight and obesity in adults: executive summary Expert panel on the identification, evaluation, and treatment of overweight in adults. 68:899–917.
[11] Molarius, A., Seidell, J.C., Sans, S., Tuomilehto, J., Kuulasmaa, K. (2000) Educational level, relative body weight, and changes in their association over 10 years: an international perspective from the WHO MONICA Project. Am J Public Health. 90:1260–8.
[12] Debasis, B., Harry, G.P. (2008) Obesity: Epidemiology, Pathophysiology, and Prevention, CRC Press, Taylor & Francis Group, ISBN10: 0-8493-3802-6.
AUTHORS
First Author- R.M.D.Jayasena, Community Medical Officer,
Department of Ayurveda, North Western Province, Sri Lanka.
Second Author- K.G.C.Dissanayake, Senior Lecturer in
Kayacikitsa, Department of Cikithsa, Gampaha
Wickramarachchi Ayurveda Institute, University of Kalaniya,
Yakkala, Sri Lanka.
Correspondence Author- R.M.D.Jayasena,
a
c
b
d
29
29.5
30
30.5
31
31.5
32
32.5
33
Group A Group B
Bo
dy M
ass
Ind
ex
BMI BT
BMI AT

International Journal of Scientific and Research Publications, Volume 7, Issue 8, August 2017 712
ISSN 2250-3153
http://dx.doi.org/10.29322/IJSRP.10.01.2020.p97103 www.ijsrp.org
International Journal of Scientific and Research Publications, Volume 10, Issue 1, January 2020 713
ISSN 2250-3153
http://dx.doi.org/10.29322/IJSRP.10.01.2020.p97104 www.ijsrp.org
Intangible Service Quality on Customer Satisfaction
of Hotel Guest in Nigeria
Juliana Mbum Edike*, Uduak Joseph **
* MSc Marketing, Department of Marketing, Faculty of Business Administration, University of Uyo, Nigeria ** PhD Marketing, Department of Marketing, Faculty of Business Administration, University of Uyo, Nigeria
DOI: 10.29322/IJSRP.10.01.2020.p97104
http://dx.doi.org/10.29322/IJSRP.10.01.2020.p97104
Abstract- Service organisations are significant contributors to the
economy of fast developing nations. However, customers of
service organisations often encounter dissatisfaction when the
delivered service fails to give gratifying height of contentment,
and the need to curb dissatisfaction in the face of competition is
imminent, especially in the hotel industry. This study investigated
the perception of consumers of three to five star hotels towards
four intangible dimensions of service quality in Akwa Ibom State,
Nigeria. A survey research design was adopted for the study. Data
were analysed using frequency distribution statistics, Pearson
correlation analysis and regression. The results showed that
intangible service quality is a good determinant of customer
satisfaction. The intangible dimensions of service quality,
assurance, reliability, empathy and responsiveness have positive
and significant impact on customer satisfaction of hotels in Akwa
Ibom State. The study found that assurance is the best intangible
dimension that predicts customer satisfaction while reliability and
empathy are good predictors and, customers of three to five star
hotels are moderately satisfied with service delivery in Akwa
Ibom State. The study recommends that management of hotels
should strive to deliver quality services in order to further
customer satisfaction.
Index Terms- Assurance, Customer satisfaction, Hotel industry,
Intangible service quality
I. INTRODUCTION
ver the years, organisations in the service industry seek for
strategies that can enhance its performance, profitability,
productivity and market share and service quality emerged as an
exciting area of marketing to enable firms live up to expectations
(Cui, Lewis and Park, 2003). Service quality is seen as a disparity
linked to expectations of service and an assessment of the services
rendered, and it is identified as been slanted because it is based on
the decision provided by consumers and not the organisation
(Machayi and Ahmed, 2016). Service quality is classified as
tangible and intangible. Tangibles are the visible appearance of
equipment and materials used in performing the services while
intangibles are the non-physical component of service quality:
reliability, responsiveness, assurance and empathy. Both
dimensions of service quality are vital concepts that influence the
extent and nature of customer satisfaction.
In the course of providing satisfaction to customers, some
factors influence the quality of services rendered. Aggressive
growth due to globalization, economic and political integration,
new tourist destinations, and sophisticated nature of consumers
play a part in thwarting the effort of management to provide
qualitative services, and failure to provide the desired service may
result in waste of resources, and dissatisfaction. Stemming
customer dissatisfaction is a principal task required of
management; however, for hotels to provide satisfaction,
management must be aware of the right service quality dimensions
which customers expect and this can be achieved through research.
Research on service quality and customer satisfaction has been
conducted in different industries, and little have been done in the
hotel industry in Nigeria. Thus, this paper looks at the intangible
dimensions of service quality and its impact on customer
satisfaction of hotels in Akwa Ibom State, Nigeria.
II. LITERATURE REVIEW
2.1 Service Quality
Different views exist about quality and earlier studies
defined quality as conforming to requirement where goods and
services meet predetermined standards (Ekinci and Riley, 1998),
but since services are hard to be condensed to a set of standards,
the definition cannot be used on service quality. Machayi and
Ahmed (2016) provided an explicit definition of service quality as
meeting or going beyond customers’ anticipation that is, a
comparison between delivered service and expectation. Service
quality can be achieved when customer’s anticipations are
matched with performance regularly.
Service Quality is determined from the perspective of the
consumers due to the differences consumers’ exhibit in taste,
values and diverse views of assessment (Chang, 2008). Service
evaluation does not depend solely on the final service but also on
the production and delivery process; hence the role of employees
is relevant in administering the service (Kumar, Smart, Maddern
and Maull, 2008; Chang, 2008).
2.2 Intangible Dimensions of Service Quality
The four intangible dimensions of service quality are:
reliability, responsiveness, assurance and empathy. Reliability:
This is the capability of organizations to carry out a service
accurately and dependably as promised (Van, Pampallis and Bond,
2002). Responsiveness: This is the service providers’ disposition
to provide immediate service; that is, customers’ demands, inquiry
and criticisms should be handled instantaneously (Akbaba, 2006).
Assurance: Assurance is the employees’ ability and politeness,
O
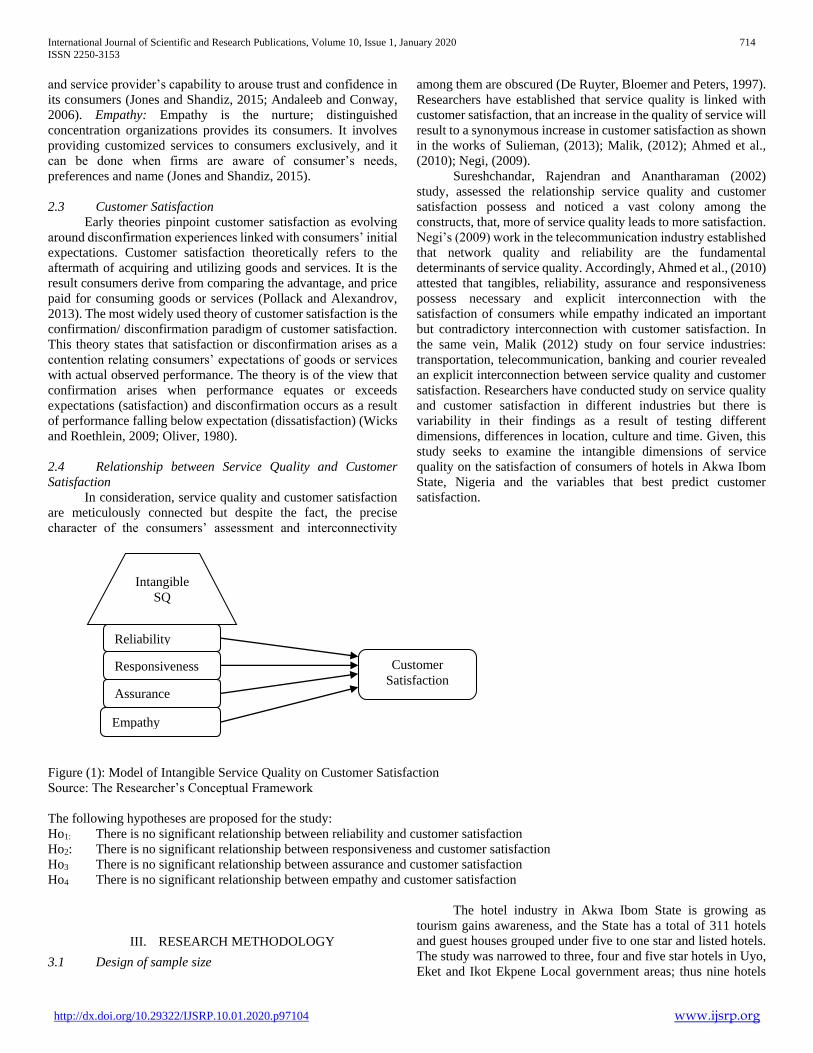
International Journal of Scientific and Research Publications, Volume 10, Issue 1, January 2020 714
ISSN 2250-3153
http://dx.doi.org/10.29322/IJSRP.10.01.2020.p97104 www.ijsrp.org
and service provider’s capability to arouse trust and confidence in
its consumers (Jones and Shandiz, 2015; Andaleeb and Conway,
2006). Empathy: Empathy is the nurture; distinguished
concentration organizations provides its consumers. It involves
providing customized services to consumers exclusively, and it
can be done when firms are aware of consumer’s needs,
preferences and name (Jones and Shandiz, 2015).
2.3 Customer Satisfaction
Early theories pinpoint customer satisfaction as evolving
around disconfirmation experiences linked with consumers’ initial
expectations. Customer satisfaction theoretically refers to the
aftermath of acquiring and utilizing goods and services. It is the
result consumers derive from comparing the advantage, and price
paid for consuming goods or services (Pollack and Alexandrov,
2013). The most widely used theory of customer satisfaction is the
confirmation/ disconfirmation paradigm of customer satisfaction.
This theory states that satisfaction or disconfirmation arises as a
contention relating consumers’ expectations of goods or services
with actual observed performance. The theory is of the view that
confirmation arises when performance equates or exceeds
expectations (satisfaction) and disconfirmation occurs as a result
of performance falling below expectation (dissatisfaction) (Wicks
and Roethlein, 2009; Oliver, 1980).
2.4 Relationship between Service Quality and Customer
Satisfaction
In consideration, service quality and customer satisfaction
are meticulously connected but despite the fact, the precise
character of the consumers’ assessment and interconnectivity
among them are obscured (De Ruyter, Bloemer and Peters, 1997).
Researchers have established that service quality is linked with
customer satisfaction, that an increase in the quality of service will
result to a synonymous increase in customer satisfaction as shown
in the works of Sulieman, (2013); Malik, (2012); Ahmed et al.,
(2010); Negi, (2009).
Sureshchandar, Rajendran and Anantharaman (2002)
study, assessed the relationship service quality and customer
satisfaction possess and noticed a vast colony among the
constructs, that, more of service quality leads to more satisfaction.
Negi’s (2009) work in the telecommunication industry established
that network quality and reliability are the fundamental
determinants of service quality. Accordingly, Ahmed et al., (2010)
attested that tangibles, reliability, assurance and responsiveness
possess necessary and explicit interconnection with the
satisfaction of consumers while empathy indicated an important
but contradictory interconnection with customer satisfaction. In
the same vein, Malik (2012) study on four service industries:
transportation, telecommunication, banking and courier revealed
an explicit interconnection between service quality and customer
satisfaction. Researchers have conducted study on service quality
and customer satisfaction in different industries but there is
variability in their findings as a result of testing different
dimensions, differences in location, culture and time. Given, this
study seeks to examine the intangible dimensions of service
quality on the satisfaction of consumers of hotels in Akwa Ibom
State, Nigeria and the variables that best predict customer
satisfaction.
Figure (1): Model of Intangible Service Quality on Customer Satisfaction
Source: The Researcher’s Conceptual Framework
The following hypotheses are proposed for the study:
Ho1: There is no significant relationship between reliability and customer satisfaction
Ho2: There is no significant relationship between responsiveness and customer satisfaction
Ho3 There is no significant relationship between assurance and customer satisfaction
Ho4 There is no significant relationship between empathy and customer satisfaction
III. RESEARCH METHODOLOGY
3.1 Design of sample size
The hotel industry in Akwa Ibom State is growing as
tourism gains awareness, and the State has a total of 311 hotels
and guest houses grouped under five to one star and listed hotels.
The study was narrowed to three, four and five star hotels in Uyo,
Eket and Ikot Ekpene Local government areas; thus nine hotels
Customer
Satisfaction
Intangible
SQ
Reliability
Empathy
Assurance
Responsiveness
Assurance

International Journal of Scientific and Research Publications, Volume 10, Issue 1, January 2020 715
ISSN 2250-3153
http://dx.doi.org/10.29322/IJSRP.10.01.2020.p97104 www.ijsrp.org
falls under this category. The respondents consists of consumers
from the nine hotels. The study utilized the survey research design,
and the population of interest consist of 4,851 respondents and, the
Taro Yamane formula was employed in determining the sample
size
𝑛 =𝑁
1+𝑁(𝑒)2 - - - - - - - - - - - - - - - (1)
Where
n=sample size, N= 4851, 1= constant, and e = assumed error
margin or tolerable error taken as 5% (0.05).
n= 4851/ (1+ 4851 (0.05)2)
n= 4851/ 13.1275
n= 369.52
n= 370
From the above, 370 copies of questionnaire were
distributed, 206 copies in Uyo, 123 in Eket and 41 in Ikot Ekpene
to consumers of three to five star hotels. The proportion was
derived from dividing the number of hotels in the three LGA with
its total and then multiplied with the total number of the
questionnaire (for Uyo: 5/9 * 307 = 206, Eket: 3/9 * 370 = 123,
Ikot Ekpene: 1/9 * 370 = 41). Data for this research were collected
from primary sources (questionnaire). The research instrument
consists of 18 items arranged on a scale of 7 from disagree very
strongly as 1, to agree very strongly as 7, while the question on the
satisfaction level of hotel services was rated; not satisfactory as 1
to very highly satisfactory as 5. The wait and collect method of
questionnaire administration was employed.
The study utilized the descriptive statistics, frequency
distribution statistics, Pearson Product Moment correlation
analysis, simple linear regression and multiple regression analysis.
A regression equation to examine the impact of intangible service
quality on customer satisfaction of hotels in Akwa Ibom State is
expressed mathematically as follows:
S = α+β1 (RI) + β2 (RS) + β3 (A) + β4 (E) + e --------------
---(2)
Where,
S = the dependent variable representing customer satisfaction
α=Constant,
β1, β2, β3, β4, are the respective regression coefficient for RI, RS,
A and E respectively.
(RI) = Reliability, (RS) = Responsiveness, (A) = Assurance, (E) =
Empathy, e = Error term
A construct validity was used and it was conducted by
administering the research instrument to five consumers of hotels
services and four academicians who are specialists in the field of
marketing. The consumers and academicians agreed that the
instrument is suitable for collecting data from the respondents, and
this did not form part of the final sample. The Cronbach alpha
reliability statistics was also employed to determine the internal
consistency of the scale as shown in Table 1.
By applying Cronbach‘s Alpha to test the reliability of the
research instrument in Table 1, it was found that the Cronbach‘s
Alpha coefficient value for the 19 items for intangible service
quality and customer satisfaction was 0.757, and Nunnally (1967),
opined that a coefficient above 0.70 is considered sufficient for
exploratory studies. Meaning, the instrument is reliable and
indicates high internal consistency among items. The decision of
accepting or rejecting the null hypotheses (Ho) of the statistical test
is based on 95% confidence interval. The null hypothesis will be
accepted if the P-value is more than the 5% level of significance
or rejected if the P-value is at or less than the 5% level of
significance and the alternative will be accepted.
Table 2: Measures used in the study on a seven-point Likert scale
Reliability
When hotels promise to do something by a specific time, it does
so
When customers have problems, hotels shows sincere interest in
solving it
Hotels perform its services right the first time
Hotels provide its services at the time it promises to do so
Responsiveness
Employees of hotels says correctly when services will be
performed
Hotel employees provide prompt services to customers
Hotel employees are always willing to help customers
Hotels are never too busy to respond to customers’ requests
Assurance
The behaviour of hotel employees instil confidence in customers
Customers feel safe in their transactions with hotels
Customers are safe and secured during their stay in hotels
Employees of hotels are polite and courteous to customers
Employees of hotels are knowledgeable to answer customers’
questions
Employees of hotels have the skills to perform the service
Empathy
Hotels give individual attention to customers
Hotels have employees who give personal attention to customers
Hotels have their customers’ best interests at heart
Hotels understand the specific needs of customers
IV. DATA ANALYSIS
The data were analysed using descriptive statistics,
frequencies, correlation, simple linear and multiple regression
analysis. The analysis was performed with the use of statistical
package for social sciences version 21.0. Three hundred and
seventy copies of questionnaire were administered to customers of
nine hotels in Uyo, Eket and Ikot Ekpene Local Government
Area’s. One hundred and fifty four respondents showed positive
response, and out of these, 21 copies of the questionnaire were
incompletely and wrongly filled; thus the researcher utilized the
responses from 133 respondents, making it 36.0% of the total
sample.
Table 1: Reliability Statistics
Cronbach's Alpha No of Items
.757 19
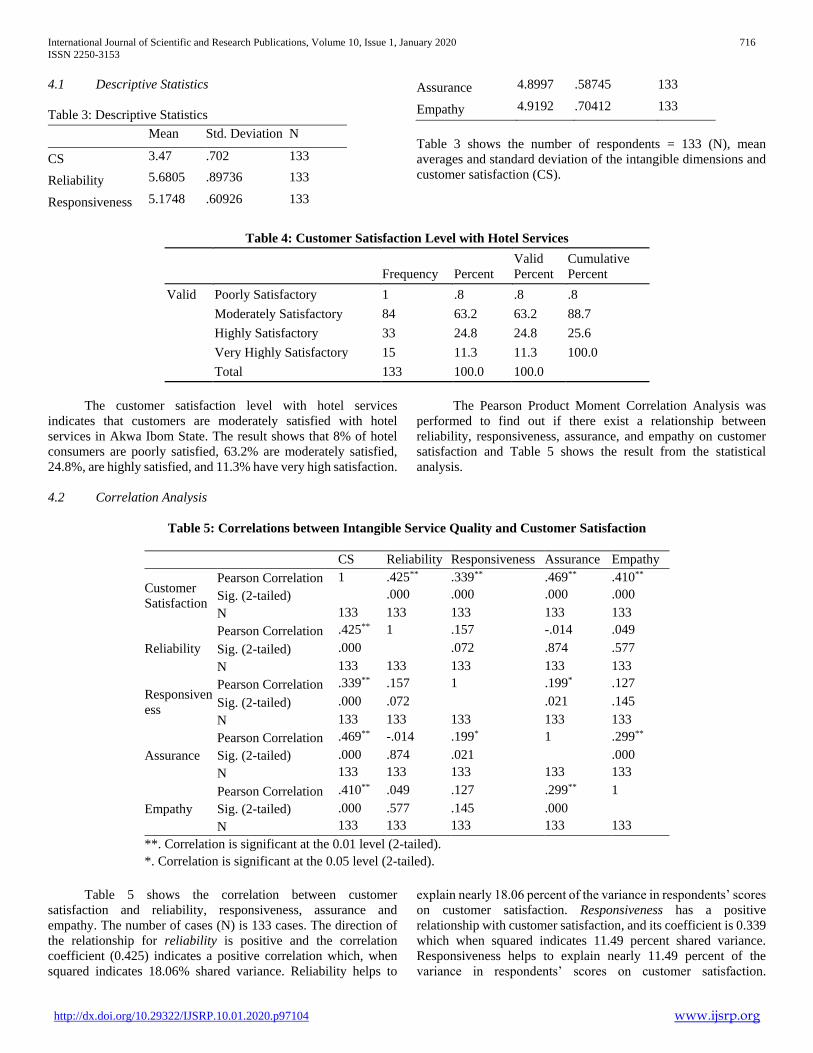
International Journal of Scientific and Research Publications, Volume 10, Issue 1, January 2020 716
ISSN 2250-3153
http://dx.doi.org/10.29322/IJSRP.10.01.2020.p97104 www.ijsrp.org
4.1 Descriptive Statistics
Table 3: Descriptive Statistics
Mean Std. Deviation N
CS 3.47 .702 133
Reliability 5.6805 .89736 133
Responsiveness 5.1748 .60926 133
Assurance 4.8997 .58745 133
Empathy 4.9192 .70412 133
Table 3 shows the number of respondents = 133 (N), mean
averages and standard deviation of the intangible dimensions and
customer satisfaction (CS).
Table 4: Customer Satisfaction Level with Hotel Services
Frequency Percent
Valid
Percent
Cumulative
Percent
Valid Poorly Satisfactory 1 .8 .8 .8
Moderately Satisfactory 84 63.2 63.2 88.7
Highly Satisfactory 33 24.8 24.8 25.6
Very Highly Satisfactory 15 11.3 11.3 100.0
Total 133 100.0 100.0
The customer satisfaction level with hotel services
indicates that customers are moderately satisfied with hotel
services in Akwa Ibom State. The result shows that 8% of hotel
consumers are poorly satisfied, 63.2% are moderately satisfied,
24.8%, are highly satisfied, and 11.3% have very high satisfaction.
4.2 Correlation Analysis
The Pearson Product Moment Correlation Analysis was
performed to find out if there exist a relationship between
reliability, responsiveness, assurance, and empathy on customer
satisfaction and Table 5 shows the result from the statistical
analysis.
Table 5: Correlations between Intangible Service Quality and Customer Satisfaction
CS Reliability Responsiveness Assurance Empathy
Customer
Satisfaction
Pearson Correlation 1 .425** .339** .469** .410**
Sig. (2-tailed) .000 .000 .000 .000
N 133 133 133 133 133
Reliability
Pearson Correlation .425** 1 .157 -.014 .049
Sig. (2-tailed) .000 .072 .874 .577
N 133 133 133 133 133
Responsiven
ess
Pearson Correlation .339** .157 1 .199* .127
Sig. (2-tailed) .000 .072 .021 .145
N 133 133 133 133 133
Assurance
Pearson Correlation .469** -.014 .199* 1 .299**
Sig. (2-tailed) .000 .874 .021 .000
N 133 133 133 133 133
Empathy
Pearson Correlation .410** .049 .127 .299** 1
Sig. (2-tailed) .000 .577 .145 .000
N 133 133 133 133 133
**. Correlation is significant at the 0.01 level (2-tailed).
*. Correlation is significant at the 0.05 level (2-tailed).
Table 5 shows the correlation between customer
satisfaction and reliability, responsiveness, assurance and
empathy. The number of cases (N) is 133 cases. The direction of
the relationship for reliability is positive and the correlation
coefficient (0.425) indicates a positive correlation which, when
squared indicates 18.06% shared variance. Reliability helps to
explain nearly 18.06 percent of the variance in respondents’ scores
on customer satisfaction. Responsiveness has a positive
relationship with customer satisfaction, and its coefficient is 0.339
which when squared indicates 11.49 percent shared variance.
Responsiveness helps to explain nearly 11.49 percent of the
variance in respondents’ scores on customer satisfaction.
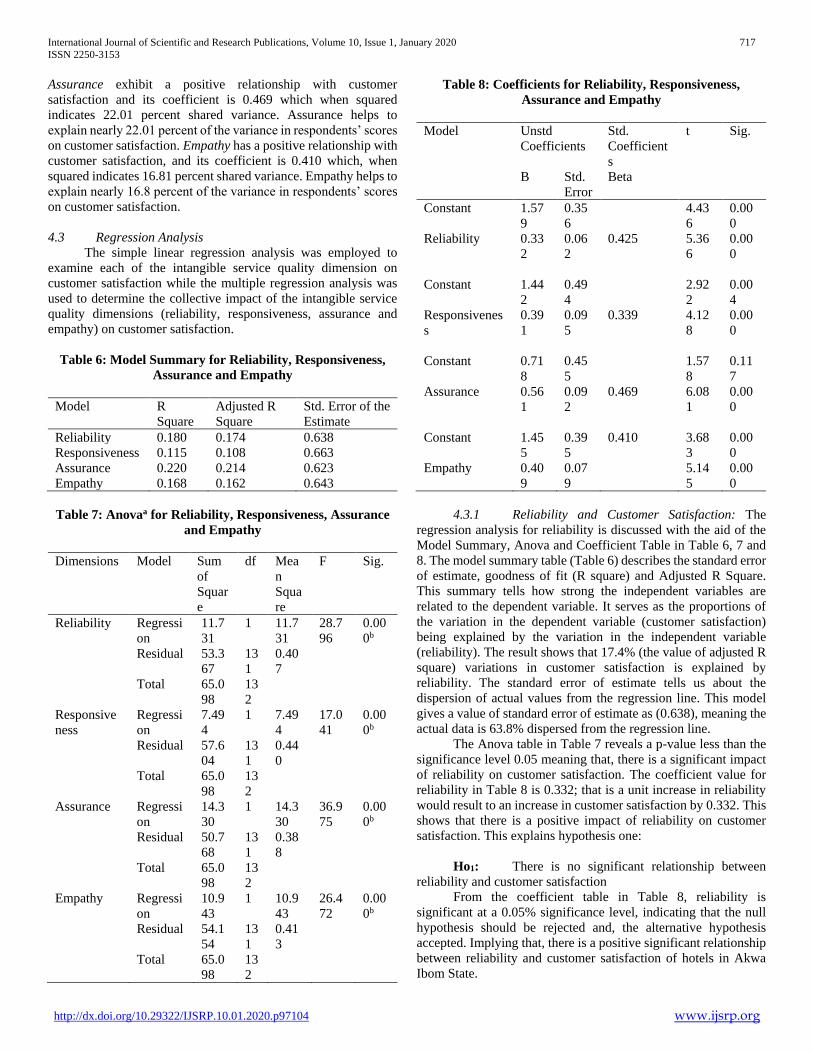
International Journal of Scientific and Research Publications, Volume 10, Issue 1, January 2020 717
ISSN 2250-3153
http://dx.doi.org/10.29322/IJSRP.10.01.2020.p97104 www.ijsrp.org
Assurance exhibit a positive relationship with customer
satisfaction and its coefficient is 0.469 which when squared
indicates 22.01 percent shared variance. Assurance helps to
explain nearly 22.01 percent of the variance in respondents’ scores
on customer satisfaction. Empathy has a positive relationship with
customer satisfaction, and its coefficient is 0.410 which, when
squared indicates 16.81 percent shared variance. Empathy helps to
explain nearly 16.8 percent of the variance in respondents’ scores
on customer satisfaction.
4.3 Regression Analysis
The simple linear regression analysis was employed to
examine each of the intangible service quality dimension on
customer satisfaction while the multiple regression analysis was
used to determine the collective impact of the intangible service
quality dimensions (reliability, responsiveness, assurance and
empathy) on customer satisfaction.
Table 6: Model Summary for Reliability, Responsiveness,
Assurance and Empathy
Model R
Square
Adjusted R
Square
Std. Error of the
Estimate
Reliability 0.180 0.174 0.638
Responsiveness 0.115 0.108 0.663
Assurance 0.220 0.214 0.623
Empathy 0.168 0.162 0.643
Table 7: Anovaa for Reliability, Responsiveness, Assurance
and Empathy
Dimensions Model Sum
of
Squar
e
df Mea
n
Squa
re
F Sig.
Reliability Regressi
on
11.7
31
1 11.7
31
28.7
96
0.00
0b
Residual 53.3
67
13
1
0.40
7
Total 65.0
98
13
2
Responsive
ness
Regressi
on
7.49
4
1 7.49
4
17.0
41
0.00
0b
Residual 57.6
04
13
1
0.44
0
Total 65.0
98
13
2
Assurance Regressi
on
14.3
30
1 14.3
30
36.9
75
0.00
0b
Residual 50.7
68
13
1
0.38
8
Total 65.0
98
13
2
Empathy Regressi
on
10.9
43
1 10.9
43
26.4
72
0.00
0b
Residual 54.1
54
13
1
0.41
3
Total 65.0
98
13
2
Table 8: Coefficients for Reliability, Responsiveness,
Assurance and Empathy
Model Unstd
Coefficients
Std.
Coefficient
s
t Sig.
B Std.
Error
Beta
Constant 1.57
9
0.35
6
4.43
6
0.00
0
Reliability 0.33
2
0.06
2
0.425 5.36
6
0.00
0
Constant 1.44
2
0.49
4
2.92
2
0.00
4
Responsivenes
s
0.39
1
0.09
5
0.339 4.12
8
0.00
0
Constant 0.71
8
0.45
5
1.57
8
0.11
7
Assurance 0.56
1
0.09
2
0.469 6.08
1
0.00
0
Constant 1.45
5
0.39
5
0.410 3.68
3
0.00
0
Empathy 0.40
9
0.07
9
5.14
5
0.00
0
4.3.1 Reliability and Customer Satisfaction: The
regression analysis for reliability is discussed with the aid of the
Model Summary, Anova and Coefficient Table in Table 6, 7 and
8. The model summary table (Table 6) describes the standard error
of estimate, goodness of fit (R square) and Adjusted R Square.
This summary tells how strong the independent variables are
related to the dependent variable. It serves as the proportions of
the variation in the dependent variable (customer satisfaction)
being explained by the variation in the independent variable
(reliability). The result shows that 17.4% (the value of adjusted R
square) variations in customer satisfaction is explained by
reliability. The standard error of estimate tells us about the
dispersion of actual values from the regression line. This model
gives a value of standard error of estimate as (0.638), meaning the
actual data is 63.8% dispersed from the regression line.
The Anova table in Table 7 reveals a p-value less than the
significance level 0.05 meaning that, there is a significant impact
of reliability on customer satisfaction. The coefficient value for
reliability in Table 8 is 0.332; that is a unit increase in reliability
would result to an increase in customer satisfaction by 0.332. This
shows that there is a positive impact of reliability on customer
satisfaction. This explains hypothesis one:
Ho1: There is no significant relationship between
reliability and customer satisfaction
From the coefficient table in Table 8, reliability is
significant at a 0.05% significance level, indicating that the null
hypothesis should be rejected and, the alternative hypothesis
accepted. Implying that, there is a positive significant relationship
between reliability and customer satisfaction of hotels in Akwa
Ibom State.

International Journal of Scientific and Research Publications, Volume 10, Issue 1, January 2020 718
ISSN 2250-3153
http://dx.doi.org/10.29322/IJSRP.10.01.2020.p97104 www.ijsrp.org
4.3.2 Responsiveness and Customer Satisfaction:
The model summary table (Table 6) shows that 10.8% (the
value of adjusted R square) variations in customer satisfaction is
explained by responsiveness. The standard error of estimate 0.663
shows that the actual data is 66.3% dispersed from the regression
line. ANOVA table in Table 7 reveals a p-value less than the
significance level 0.05 meaning, there is a significant impact of
responsiveness on customer satisfaction. The coefficient value for
responsiveness in Table 8 is 0.391; that is, a unit increase in
responsiveness would result in an increase in customer satisfaction
by 0.391. This shows that there is a significant positive impact of
responsiveness on customer satisfaction, and explains hypothesis
two:
Ho2: There is no significant relationship between
responsiveness and customer satisfaction.
The coefficient table in Table 8, shows responsiveness as
significant at 0.05% significance level, thus, the null hypothesis is
rejected and, the alternative accepted. Implying that, there is a
positive significant relationship between responsiveness and
customer satisfaction of hotels in Akwa Ibom State.
4.3.3 Assurance and Customer Satisfaction:
The model summary table (Table 6) shows that 21.4% (the
value of adjusted R square) variations in customer satisfaction is
explained by assurance. The standard error of estimate
0.623shows that the actual data is 62.3% dispersed from the
regression line. The Anova table in Table 7 reveals a p-value less
than the significance level 0.05 meaning, there is a significant
impact of assurance on customer satisfaction. The coefficient
value for assurance in Table 8 is 0.561, that is, a unit increase in
assurance would result to an increase in customer satisfaction by
0.561. This shows that there is a positive impact of assurance on
customer satisfaction, and explains hypothesis three:
Ho3: There is no significant relationship between assurance
and customer satisfaction.
The coefficient table in Table 8, shows assurance as significant at
0.05% significance level, thus, the null hypothesis is rejected and,
the alternative accepted. Implying that, there is a positive
significant relationship between assurance and customer
satisfaction of hotels in Akwa Ibom State.
4.3.4 Empathy and Customer Satisfaction:
The model summary table (Table 6) shows that 16.2% (the
value of adjusted R square) variations in customer satisfaction is
explained by empathy. The standard error of estimate 0.643 shows
that the actual data is 64.3% dispersed from the regression line.
The Anova table in Table 7 reveals a p-value less than the
significance level 0.05 meaning, there is a significant impact of
empathy on customer satisfaction. The coefficient value for
empathy in Table 8 is 0.409, that is, a unit increase in empathy
would result to an increase in customer satisfaction by 0.409. This
shows that there is a positive impact of empathy on customer
satisfaction. The P-value shows there exist a significance between
empathy and customer satisfaction and explains hypothesis four:
Ho4: There is no significant relationship between empathy and
customer satisfaction.
The coefficient table in Table 8, shows empathy as
significant at a 0.05% significance level, thus, the null hypothesis
is rejected and, the alternative hypothesis accepted. Implying that,
there is a positive significant relationship between empathy and
customer satisfaction of hotels in Akwa Ibom State.
4.3.5 Intangible Service Quality Dimensions and
Customer Satisfaction: To find out the overall impact that service
quality has on customer satisfaction, a multiple regression analysis
was done, and Table 9, 10 and 11 reveals the finding.
Table 10: ANOVAa for Intangible Service Quality
M
o
d
el
Sum of Squares df Mean Square F Sig.
1
Regression 32.608 4 8.152 32.117 .000b
Residual 32.489 128 .254
Total 65.098 132
a. Dependent Variable: CS
b. Predictors: (Constant), Empathy, Reliability, Responsiveness, Assurance
The Model summary Table in Table 9 and the ANOVA
Table, Table 10 include the R Square value, which serves as the
proportions of the variation in the dependent variable (customer
satisfaction) being explained by the variation in the independent
variable (intangible service quality). In other words, this means
that the R Square depicts how good the regression model is at
explaining the variance in Customer Satisfaction. It can be
observed that the coefficient of determination (R²) is 0.501
Table 9: Model Summaryb for Intangible Service Quality
Model R R Square Adjusted R Square Std. Error of the
Estimate
1 .708a .501 .485 .504
a. Predictors: (Constant), Empathy, Reliability, Responsiveness, Assurance
b. Dependent Variable: Customer Satisfaction
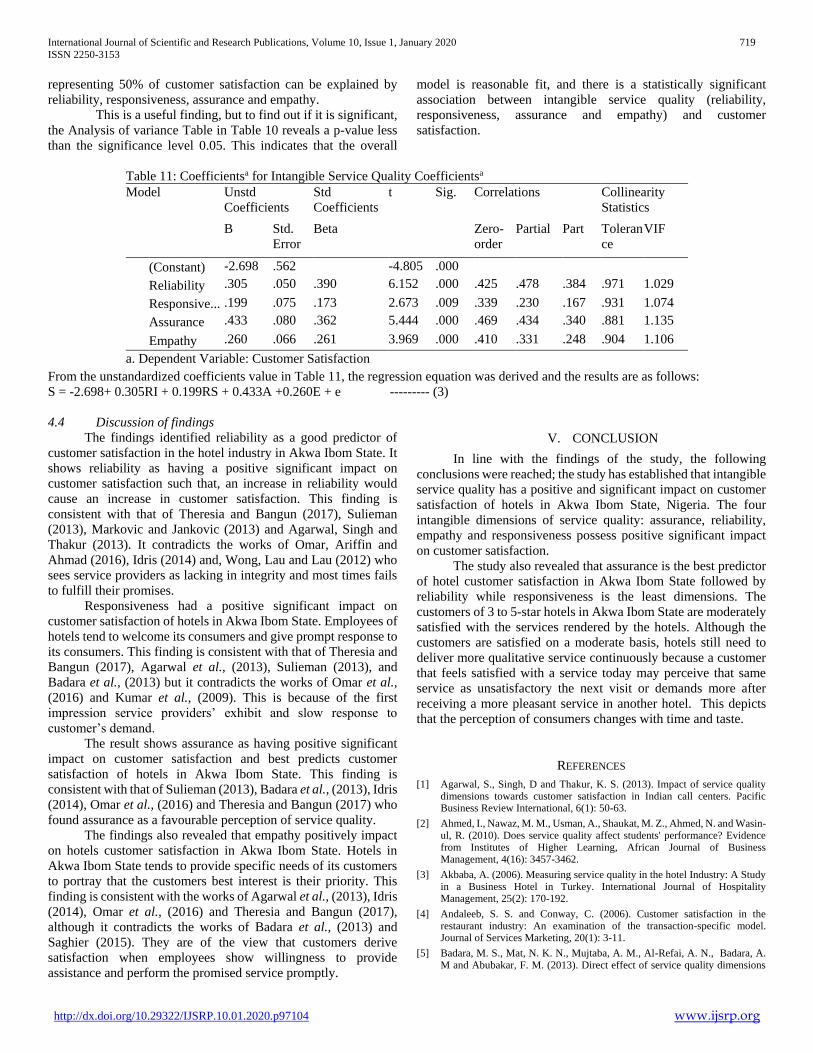
International Journal of Scientific and Research Publications, Volume 10, Issue 1, January 2020 719
ISSN 2250-3153
http://dx.doi.org/10.29322/IJSRP.10.01.2020.p97104 www.ijsrp.org
representing 50% of customer satisfaction can be explained by
reliability, responsiveness, assurance and empathy.
This is a useful finding, but to find out if it is significant,
the Analysis of variance Table in Table 10 reveals a p-value less
than the significance level 0.05. This indicates that the overall
model is reasonable fit, and there is a statistically significant
association between intangible service quality (reliability,
responsiveness, assurance and empathy) and customer
satisfaction.
Table 11: Coefficientsa for Intangible Service Quality Coefficientsa
Model Unstd
Coefficients
Std
Coefficients
t Sig. Correlations Collinearity
Statistics
B Std.
Error
Beta Zero-
order
Partial Part Toleran
ce
VIF
(Constant) -2.698 .562 -4.805 .000
Reliability .305 .050 .390 6.152 .000 .425 .478 .384 .971 1.029
Responsive... .199 .075 .173 2.673 .009 .339 .230 .167 .931 1.074
Assurance .433 .080 .362 5.444 .000 .469 .434 .340 .881 1.135
Empathy .260 .066 .261 3.969 .000 .410 .331 .248 .904 1.106
a. Dependent Variable: Customer Satisfaction
From the unstandardized coefficients value in Table 11, the regression equation was derived and the results are as follows:
S = -2.698+ 0.305RI + 0.199RS + 0.433A +0.260E + e --------- (3)
4.4 Discussion of findings
The findings identified reliability as a good predictor of
customer satisfaction in the hotel industry in Akwa Ibom State. It
shows reliability as having a positive significant impact on
customer satisfaction such that, an increase in reliability would
cause an increase in customer satisfaction. This finding is
consistent with that of Theresia and Bangun (2017), Sulieman
(2013), Markovic and Jankovic (2013) and Agarwal, Singh and
Thakur (2013). It contradicts the works of Omar, Ariffin and
Ahmad (2016), Idris (2014) and, Wong, Lau and Lau (2012) who
sees service providers as lacking in integrity and most times fails
to fulfill their promises.
Responsiveness had a positive significant impact on
customer satisfaction of hotels in Akwa Ibom State. Employees of
hotels tend to welcome its consumers and give prompt response to
its consumers. This finding is consistent with that of Theresia and
Bangun (2017), Agarwal et al., (2013), Sulieman (2013), and
Badara et al., (2013) but it contradicts the works of Omar et al.,
(2016) and Kumar et al., (2009). This is because of the first
impression service providers’ exhibit and slow response to
customer’s demand.
The result shows assurance as having positive significant
impact on customer satisfaction and best predicts customer
satisfaction of hotels in Akwa Ibom State. This finding is
consistent with that of Sulieman (2013), Badara et al., (2013), Idris
(2014), Omar et al., (2016) and Theresia and Bangun (2017) who
found assurance as a favourable perception of service quality.
The findings also revealed that empathy positively impact
on hotels customer satisfaction in Akwa Ibom State. Hotels in
Akwa Ibom State tends to provide specific needs of its customers
to portray that the customers best interest is their priority. This
finding is consistent with the works of Agarwal et al., (2013), Idris
(2014), Omar et al., (2016) and Theresia and Bangun (2017),
although it contradicts the works of Badara et al., (2013) and
Saghier (2015). They are of the view that customers derive
satisfaction when employees show willingness to provide
assistance and perform the promised service promptly.
V. CONCLUSION
In line with the findings of the study, the following
conclusions were reached; the study has established that intangible
service quality has a positive and significant impact on customer
satisfaction of hotels in Akwa Ibom State, Nigeria. The four
intangible dimensions of service quality: assurance, reliability,
empathy and responsiveness possess positive significant impact
on customer satisfaction.
The study also revealed that assurance is the best predictor
of hotel customer satisfaction in Akwa Ibom State followed by
reliability while responsiveness is the least dimensions. The
customers of 3 to 5-star hotels in Akwa Ibom State are moderately
satisfied with the services rendered by the hotels. Although the
customers are satisfied on a moderate basis, hotels still need to
deliver more qualitative service continuously because a customer
that feels satisfied with a service today may perceive that same
service as unsatisfactory the next visit or demands more after
receiving a more pleasant service in another hotel. This depicts
that the perception of consumers changes with time and taste.
REFERENCES
[1] Agarwal, S., Singh, D and Thakur, K. S. (2013). Impact of service quality dimensions towards customer satisfaction in Indian call centers. Pacific Business Review International, 6(1): 50-63.
[2] Ahmed, I., Nawaz, M. M., Usman, A., Shaukat, M. Z., Ahmed, N. and Wasin-ul, R. (2010). Does service quality affect students' performance? Evidence from Institutes of Higher Learning, African Journal of Business Management, 4(16): 3457-3462.
[3] Akbaba, A. (2006). Measuring service quality in the hotel Industry: A Study in a Business Hotel in Turkey. International Journal of Hospitality Management, 25(2): 170-192.
[4] Andaleeb, S. S. and Conway, C. (2006). Customer satisfaction in the restaurant industry: An examination of the transaction-specific model. Journal of Services Marketing, 20(1): 3-11.
[5] Badara, M. S., Mat, N. K. N., Mujtaba, A. M., Al-Refai, A. N., Badara, A. M and Abubakar, F. M. (2013). Direct effect of service quality dimensions

International Journal of Scientific and Research Publications, Volume 10, Issue 1, January 2020 720
ISSN 2250-3153
http://dx.doi.org/10.29322/IJSRP.10.01.2020.p97104 www.ijsrp.org
on customer satisfaction and customer loyalty in Nigerian Islamic Bank. Scientific and Academic Publishing, 3(1): 6-11.
[6] Barsky, J. and Nash L. (2006). Companies update loyalty programs, increase effectiveness. Hotel and Motel Management, 22(11): 28-29.
[7] Chang, E. S. (2008). Barriers to EMS in the hotel industry. International Journal of hospitality Management, 27: 187-196.
[8] Cui, C. C., Lewis, B. R. and Park, W. (2003). Service quality measurement in the banking sector in South Korea. International Journal of Bank Marketing, 21(4): 191-201.
[9] De Ruyter, J. C., Bloemer, J. M. A. and Peters, P. (1997). Merging service quality and service satisfaction: An empirical test of an integrative framework. Journal of Economic Psychology, 18: 387-406.
[10] Ekinci, Y. and Riley, M (1998). A critique of the issues and theoretical assumptions in service quality measurement in the Lodging Industry: Time to move the goal posts. International Journal of Hospitality Management 17(4): 349-362.
[11] Idris, M. B. (2014). Application of Servqual model to the Measurement of Artisans Service Quality and Customer Satisfaction in the North East of Nigeria. Msc Dissertation. Ahmadu Bello University, Zaria, 92p.
[12] Jones, J. L and Shandiz, M. (2015). Service quality expectations: Exploring the importance of Servqual dimensions from different nonprofit constituent groups. Journal of Non Profit and Public Sector Marketing, 27 (1): 48-69.
[13] Kumar, V., Smart, P., Maddern, H., and Maull, R. (2008). Alternative perspectives on service quality and customer satisfaction: the role of BPM. International Journal of Service Industry Management, 19 (2): 176-187.
[14] Machayi, J. and Ahmed, E. M. (2016). Finance Bank Zambia Plc retail customers’ perceptions of service quality. Journal of Business and Financial Affairs, 5: 206.
[15] Malik, S. U. (2012). Customer satisfaction, perceived service quality and mediating role of perceived value. International Journal of Marketing Studies, 4(1): 68-76. 3
[16] Markovic, S and Jankovic, R. (2013). Exploring the relationship between service quality and customer satisfaction in Croatian hotel industry. Tourism and Hospitality Management, 19 (2): 149-164.
[17] Mei, A. W. O., Dean, A. M. and White, C. J. (1999). Analyzing service quality in the Hospitality Industry. Managing Service Quality, 9(2): 36-143.
[18] Negi, R. (2009). Determining customer satisfaction through perceived service quality: A study of Ethiopian mobile users. International Journal of Mobile Marketing,4 (1): 31-38.
[19] Nunnally, J. (1978). Psychometric Theory. McGraw Hill, New York.
[20] Oliver, R. L. (1980). A cognitive model of the antecedents and consequences of satisfaction decisions. Journal of Marketing Research, 17: 460-469.
[21] Omar, M. S., Ariffin, H. F and Ahmad, R. (2016). Service quality, customer’s satisfaction and the moderating effects of gender: A study of Arabic restaurants. Procedia- Social and Behavioural Sciences, 224: 384-393.
[22] Pollack, B. L. and Alexandrov, A. (2013). Nomological validity of the net promoter index question. Journal of Services Marketing, 27(2): 118-129.
[23] Saghier, N. M. (2015). Managing service quality: dimensions of service quality a study in Egypt. International Journal of African and Asian Studies, 9: 56- 63.
[24] Suleiman, A. (2013). Basic dimension of the servqual model and its impact on the level of customer satisfaction: An empirical study of the housing bank in Karak, Jordan: European Scientific Journal: 9(1): 21-34.
[25] Sureshchandar, G. S., Rajendran, C. and Anantharam, R. N. (2002). The relationship between service quality and customer satisfaction: A factor specific approach. Journal of Services Marketing, 16(4): 363-379.
[26] Theresia, L and Bangun, R. (2017). Service quality that improves customer satisfaction in a University: A case study of Institut Technologi Indonesia. IOP Conf. Series: Materials Science and Engineering, 277.
[27] Van der wal, R.W.E., PamPallis, A. and Bond, C. (2002). Service quality in a cellular telecommunications company: A south African experience. Managing service quality, 12(5): 233-246.
[28] Wicks, A. M. and Roethlein, C. J. (2009). A satisfaction-based definition of quality. Journal of Business & Economic Studies, 15(1); 82-97.
[29] Wong, Y. W., Lau, K. W and Lau, H. F. (2012). Measuring customer service quality of luxury fashion brands in Hong Kong.
[30] Zeithaml, V. A. and Bitner, M. J. (2003), Service marketing integrating customer focus across the firm. 3rd edition, United Kingdom: McGraw-Hill.
AUTHORS
First Author- Juliana Mbum Edike, MSc Marketing,
Department of Marketing, Faculty of Business Administration,
University of Uyo, Nigeria. E-mail: [email protected]
Second Author- Uduak Joseph, PhD Marketing, Department of
Marketing, Faculty of Business Administration, University of
Uyo, Nigeria. E-mail: [email protected]
Correspondence Author: E-mail: [email protected]
Contact number: +2347032390640
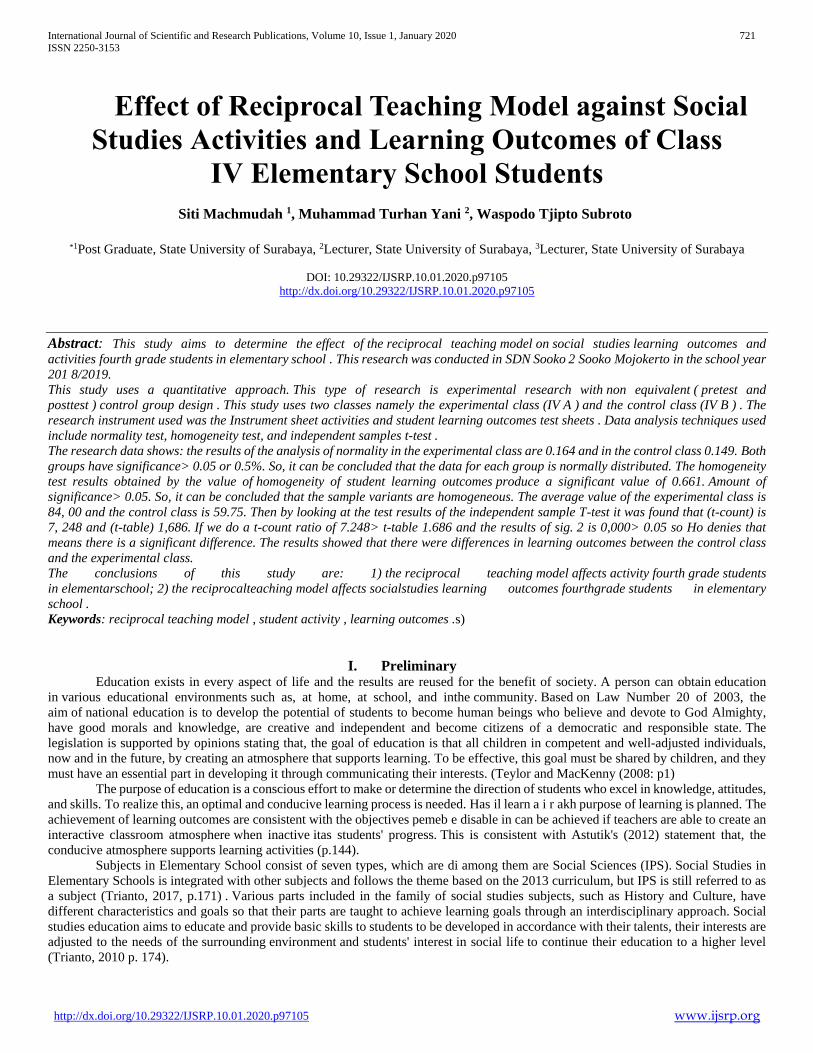
International Journal of Scientific and Research Publications, Volume 10, Issue 1, January 2020 721
ISSN 2250-3153
http://dx.doi.org/10.29322/IJSRP.10.01.2020.p97105 www.ijsrp.org
Effect of Reciprocal Teaching Model against Social
Studies Activities and Learning Outcomes of Class
IV Elementary School Students
Siti Machmudah 1, Muhammad Turhan Yani 2, Waspodo Tjipto Subroto
*1Post Graduate, State University of Surabaya, 2Lecturer, State University of Surabaya, 3Lecturer, State University of Surabaya
DOI: 10.29322/IJSRP.10.01.2020.p97105
http://dx.doi.org/10.29322/IJSRP.10.01.2020.p97105
Abstract: This study aims to determine the effect of the reciprocal teaching model on social studies learning outcomes and
activities fourth grade students in elementary school . This research was conducted in SDN Sooko 2 Sooko Mojokerto in the school year
201 8/2019.
This study uses a quantitative approach. This type of research is experimental research with non equivalent ( pretest and
posttest ) control group design . This study uses two classes namely the experimental class (IV A ) and the control class (IV B ) . The
research instrument used was the Instrument sheet activities and student learning outcomes test sheets . Data analysis techniques used
include normality test, homogeneity test, and independent samples t-test .
The research data shows: the results of the analysis of normality in the experimental class are 0.164 and in the control class 0.149. Both
groups have significance> 0.05 or 0.5%. So, it can be concluded that the data for each group is normally distributed. The homogeneity
test results obtained by the value of homogeneity of student learning outcomes produce a significant value of 0.661. Amount of
significance> 0.05. So, it can be concluded that the sample variants are homogeneous. The average value of the experimental class is
84, 00 and the control class is 59.75. Then by looking at the test results of the independent sample T-test it was found that (t-count) is
7, 248 and (t-table) 1,686. If we do a t-count ratio of 7.248> t-table 1.686 and the results of sig. 2 is 0,000> 0.05 so Ho denies that
means there is a significant difference. The results showed that there were differences in learning outcomes between the control class
and the experimental class.
The conclusions of this study are: 1) the reciprocal teaching model affects activity fourth grade students
in elementarschool; 2) the reciprocalteaching model affects socialstudies learning outcomes fourthgrade students in elementary
school .
Keywords: reciprocal teaching model , student activity , learning outcomes .s)
I. Preliminary Education exists in every aspect of life and the results are reused for the benefit of society. A person can obtain education
in various educational environments such as, at home, at school, and inthe community. Based on Law Number 20 of 2003, the
aim of national education is to develop the potential of students to become human beings who believe and devote to God Almighty,
have good morals and knowledge, are creative and independent and become citizens of a democratic and responsible state. The
legislation is supported by opinions stating that, the goal of education is that all children in competent and well-adjusted individuals,
now and in the future, by creating an atmosphere that supports learning. To be effective, this goal must be shared by children, and they
must have an essential part in developing it through communicating their interests. (Teylor and MacKenny (2008: p1)
The purpose of education is a conscious effort to make or determine the direction of students who excel in knowledge, attitudes,
and skills. To realize this, an optimal and conducive learning process is needed. Has il learn a i r akh purpose of learning is planned. The
achievement of learning outcomes are consistent with the objectives pemeb e disable in can be achieved if teachers are able to create an
interactive classroom atmosphere when inactive itas students' progress. This is consistent with Astutik's (2012) statement that, the
conducive atmosphere supports learning activities (p.144).
Subjects in Elementary School consist of seven types, which are di among them are Social Sciences (IPS). Social Studies in
Elementary Schools is integrated with other subjects and follows the theme based on the 2013 curriculum, but IPS is still referred to as
a subject (Trianto, 2017, p.171) . Various parts included in the family of social studies subjects, such as History and Culture, have
different characteristics and goals so that their parts are taught to achieve learning goals through an interdisciplinary approach. Social
studies education aims to educate and provide basic skills to students to be developed in accordance with their talents, their interests are
adjusted to the needs of the surrounding environment and students' interest in social life to continue their education to a higher level
(Trianto, 2010 p. 174).

International Journal of Scientific and Research Publications, Volume 10, Issue 1, January 2020 722
ISSN 2250-3153
http://dx.doi.org/10.29322/IJSRP.10.01.2020.p97105 www.ijsrp.org
Astuti ( 2009 ) states that social studies examines humans in relation to their social and physical environment (p. 2). IPS is a
very important subject to be studied by students, because it examines things related to values, norms and manners that are different
between each region in the human environment. Social studies aims to provide students with supplies in living in society. Students are
expected to gain knowledge and insights about the basic concepts of social science, gain sensitivity and awareness of social problems in
their environment, so that they are skilled in studying and solving these social problems.
Huda (2011) Well-designed learning can attract students' interest in the learning process. Curiosity (coriosity ) and being
challenged become the initial capital to focus students' attention on teaching materials. Students who have taken an interest in teaching
materials are more dynamic and interactive in receiving and developing the information they obtain during the learning process (p.3).The
teacher is the main character who controls the process of teaching and learning activities in the classroom. The direction of the
educational goals to be achieved is very dependent on the teaching methods and strategies used by the teacher. Rusman (2012) states
that the learning component that is directly involved and gives the main influence is the teacher. (p.58). All learning process controls
are made by the teacher but the teacher does not dominate as an information center but opens the way for information. Shiva learns from
the direction of the teacher and develops their potential.
The importance of these social studies subjects has not been fully realized by many parties . Most people assume that this
charge only contains concepts and obliged to memorize it. The presumption that is still inherent in most of our society, also influences
the ongoing teaching and learning activities taking place in the classroom. Many teachers are more focused on math and science lessons,
and not a few students tend to be interested in exploring and understanding numeracy and science. This is because these lessons are
considered more challenging and more prestigious.
Professionalism of teachers in teaching methods that are used to determine student achievement is the highest is the ideal
learning conditions but in fact learning still use conventional learning models. G uru not use student-oriented method. Bain in
Rustiyani, (2015, p 2) k ecenderungan towards learning teacher-centered to an approach that is centered student centered will
provideopportunities for students to me developers of right / reflect on their own learning, me mperoleh experience added in the
concept of science so that it will become a better critical thinker .
The problem now is that the material presented teachers to be memorized by students without estab ikiran who
se k barrel with ondisiriel, students are less active search for resources other than teachers. Understanding like this results in children
not understanding and interpreting social studies as a whole and can result in activities and learning outcomes a child .
In reality, there are still many students who lack interest and tend to avoid social studies. This happens because the facts and
concepts to memorize too many dit awarkan in social studies. Facts in the field indicate that the achievement of learning objectives is
still far from expectations. It also occurs in the implementation of social studies lesson in class IV Elementary School Sooko
2 Mojokerto, particularly in economic activity and related materials with a variety of occupations and keh i dupan social and cultural
environment. Students still experience difficulties in the learning material.
Reaching in the field students are less active in participating in social studies learning activities and the teacher's role is very
dominant. IPS learning implementation still apply a teacher-centered learning (teacher centered). Learning is carried out with the
delivery of material by the teacher then students only listen to the teacher's explanation, accept concepts, take notes, and memorize
material.Materials in learning, especially in the sub-themes of economic activity and their relationship with various fields of work and
social and cultural life in the surrounding environment are often identified with memorizing material. Mastery of social studies material
becomes verbalistic, so learning outcomes cannot last long.
The teacher becomes one of the parties responsible for improving education. Educational activities in schools in the sense of
providing guidance and teaching to students are the responsibility of the teacher "according to Hamalik's opinion, (2011 p 44). Teachers
are required to make an innovation regarding their duties as educators. These innovations are strived to improve student learning
achievement. In the opinion of Uno (2008) "a teacher is very influential on learning students (p. 17)
Based on these problems, a solution is needed to improve the learning activities that have been carried out. P eneliti offer
solutions to this research by using cooperative learning model reciprocal teaching. According to Oktavianti (2014: 97), cooperative
learning has a positive impact on students who have low learning achievement and can help build self-confidence in one's thinking
ability in understanding the IPS concept. P learning with the model is in accordance with the conditions, situation, and student learning
environment. If this is achieved, the students are expected to be able ,creative , interactive, and active in the learning process so that
student learning outcomes will be good.
(Arends, 1997: 266) argue that Reciprocal Teaching is a constructivist approach designed to teach students about cognitive
strategies in the hope that learning material can be helped to be well understood by students .
Reciprocal Teaching is style learning which was originally developed to train children to be independent . This is
categorized as interactive learning . G aya teacher and students take turns sharing information and discussion is a
notion interactive embelajaran p. The model shows student way cooperate professionally , study , and understand . S students
are prepared to interact in the world outside of school is Reciprocal teaching .
On Reciprocal Teaching The opportunity to communicate and interact socially with friends is given to students to achieve
learning objectives, while motivators and active facilitators of students are played by a teacher. That is, in the learning process, students
build their own knowledge and take responsibility for learning. Reciprocal learning (reciprocal teaching) intended to assess student
activity. A ktiv itas is meant is k e activeities students during the students work in groups, namely (1) notice; (2) provide an
explanation ; (3) respond to explanations ; (4) asking questions, (5) makingresumes ; (6) solving problems ; (7) estimate ; (8)

International Journal of Scientific and Research Publications, Volume 10, Issue 1, January 2020 723
ISSN 2250-3153
http://dx.doi.org/10.29322/IJSRP.10.01.2020.p97105 www.ijsrp.org
enthusiastic and happy with others . Therefore, the early learning implementers reciprocal (reciprocal
teaching) perceived student activity can be improved .
As for in terms of learning outcomes using the reciprocal teaching model student learning outcomes can increase. This is
evidenced by the increase in scores in the experimental class compared to the control class.
By paying attention to the translation / explanation above, m aka researchers interested in formulating this research titled "The
Effect of Reciprocal Teaching Model Against Activities andLearning Outcomes IPS Grade IV S ekolah Basic"
II. Research Methods The approach used in this study is a quantitative approach. Based on the formulation of the problem, this study is categorized
into experimental research, in which researchers want to manipulate vaiabel freely or provide treatment (treatment).
The main characteristic of experimental research is the treatment (treament) imposed on the object or object of research. In this
case penelit want to know the effect of p erlakuan (trea t ment) is. The treatment in question in this research
is in social studies materials keg iatan i dentifikasi economy, including produ ction, distribu si, and the consumers msi, in
the experimental group. The form of experimental research used in this study is the quasi-experimental Nonequivalent Control Group
Design .
The procedure of the research was carried out in three stages, namely : a) the preparation stage which consisted of observation,
determining the sample, determining the experimental class and control, determining the material ; b) the implementation phase by
carrying out a pretest, apply learning in experimental class m odel Reciprocal Teaching, while the control class using conventional
learning, doing post-test the experimental class and control class; c) stage of data analysis by collecting and analyzing data, concluding
the results of data analysis.
The data collection technique in this study is by using observation and test methods. The data collection of this study uses
the results of observations of activities & learning outcomes after the pre test and post test. Data is taken using instruments in the form
of written questions. The instrument or test questions used in this study were tested before students outside the sample. After being
tested, the test questions themselves were tested to determine the feasibility of the instrument. Tests on questions include validity test,
reliability test, difficulty level test and distinguishing test. Data analysis to measure student learning outcomes by using the achievement
values of each individual, class average values, and classical learning completeness values . Students 'initial abilities were measured
using a pretest while students' final abilities were measured using posttest . S elanjutnya measured test was used Independent Sample t-
test (t test), which aims to determine the effect of m odel Reciprocal Teaching on the activity of learning outcomes IPS elementary
school students. To help the analysis used analysis package SPSS for Windows version 2 2 .00.
III. Discussion 1. Simple Regression
This study uses simple regression to find out and analyze the influence of variable X ( reciprocal teaching model ) on variable
Y 1 (student activity) and the effect of variable X ( Activity reciprocal teaching model ) on variable Y 2 (learning outcomes) . Data is
processed statistically using SPSS version 22.
The results of simple regression analysis on research variables can be seen in the following table:
Table 4.24 Multiple Regression Test Results Coefficients a
Model
Unstandardized Coefficients
Standardized
Coefficients
t Sig. B Std. Error Beta
1 (Constant) 38,074 4,783 7,960 .000
Student activities , 403 , 149 , 378 2,710 , 011
Learning outcomes , 961 , 102 1,317 9,439 .000
Decision Making Simple Regression Test
a. If the Sig value is> 0.05, then the variable X does not affect the variable Y
b. If the Sig value is <0.05, then the variable X has an effect on the variable Y
The results of several regression tests in table 4.24 are explained as follows:
a. For the Effect of X ( Reciprocal Teaching Model ) at Y 1 ( Student Activity ) at 0.011> 0.05 so that it can be concluded that there
is an influence of X ( Reciprocal Teaching Model ) at Y 1 ( Student Activity )
b. For the Effect of X ( Reciprocal Teaching Model ) at Y 2 (Learning Outcomes) at 0,000> 0.05 so it can be concluded that there is
an influence of X ( Reciprocal Teaching Model ) at Y 2 (Learning Outcomes)
2. Test F (Simultaneous)
The implementation of F or the simultaneous test is to find out what variable X is ( Reciprocal Teaching Model ) simultaneously
or individually affects the variables Y1 ( Student Activity ) and ( Y 2(Learning Outcomes).
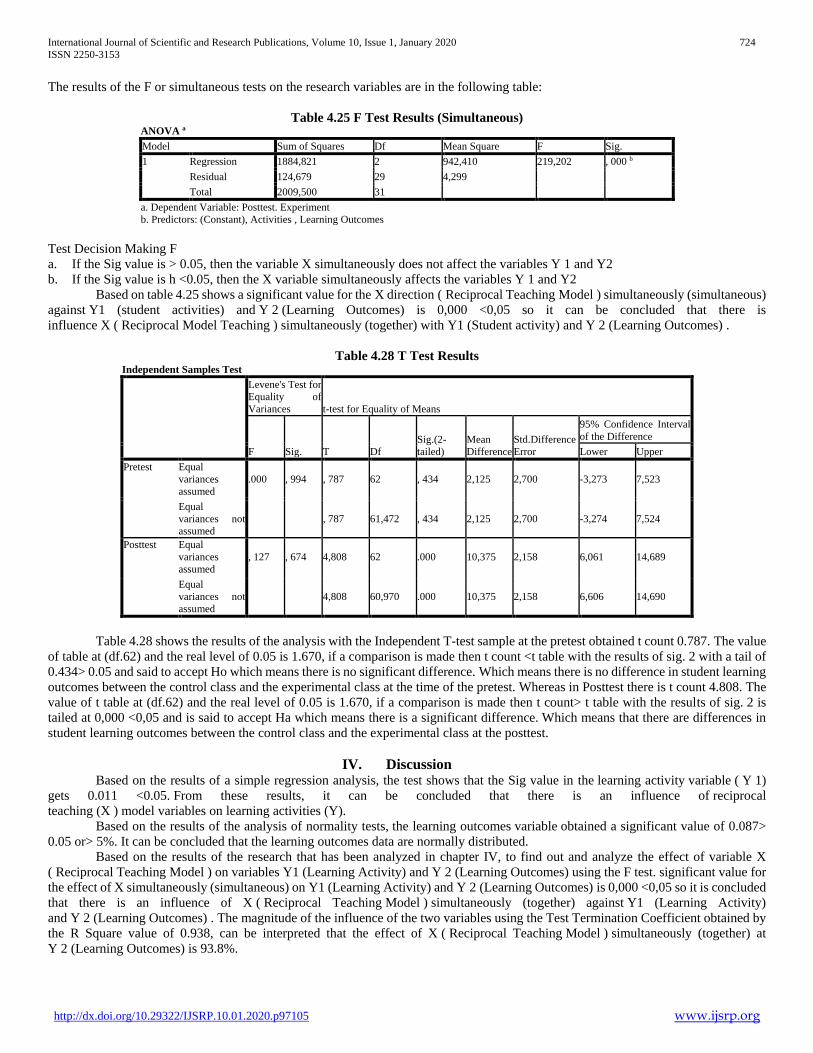
International Journal of Scientific and Research Publications, Volume 10, Issue 1, January 2020 724
ISSN 2250-3153
http://dx.doi.org/10.29322/IJSRP.10.01.2020.p97105 www.ijsrp.org
The results of the F or simultaneous tests on the research variables are in the following table:
Table 4.25 F Test Results (Simultaneous) ANOVA a
Model Sum of Squares Df Mean Square F Sig.
1 Regression 1884,821 2 942,410 219,202 , 000 b
Residual 124,679 29 4,299
Total 2009,500 31
a. Dependent Variable: Posttest. Experiment
b. Predictors: (Constant), Activities , Learning Outcomes
Test Decision Making F
a. If the Sig value is > 0.05, then the variable X simultaneously does not affect the variables Y 1 and Y2
b. If the Sig value is h <0.05, then the X variable simultaneously affects the variables Y 1 and Y2
Based on table 4.25 shows a significant value for the X direction ( Reciprocal Teaching Model ) simultaneously (simultaneous)
against Y1 (student activities) and Y 2 (Learning Outcomes) is 0,000 <0,05 so it can be concluded that there is
influence X ( Reciprocal Model Teaching ) simultaneously (together) with Y1 (Student activity) and Y 2 (Learning Outcomes) .
Table 4.28 T Test Results Independent Samples Test
Levene's Test for
Equality of
Variances t-test for Equality of Means
F Sig. T Df
Sig.(2-
tailed)
Mean
Difference
Std.Difference
Error
95% Confidence Interval
of the Difference
Lower Upper
Pretest Equal
variances
assumed
.000 , 994 , 787 62 , 434 2,125 2,700 -3,273 7,523
Equal
variances not
assumed
, 787 61,472 , 434 2,125 2,700 -3,274 7,524
Posttest Equal
variances
assumed
, 127 , 674 4,808 62 .000 10,375 2,158 6,061 14,689
Equal
variances not
assumed
4,808 60,970 .000 10,375 2,158 6,606 14,690
Table 4.28 shows the results of the analysis with the Independent T-test sample at the pretest obtained t count 0.787. The value
of table at (df.62) and the real level of 0.05 is 1.670, if a comparison is made then t count <t table with the results of sig. 2 with a tail of
0.434> 0.05 and said to accept Ho which means there is no significant difference. Which means there is no difference in student learning
outcomes between the control class and the experimental class at the time of the pretest. Whereas in Posttest there is t count 4.808. The
value of t table at (df.62) and the real level of 0.05 is 1.670, if a comparison is made then t count> t table with the results of sig. 2 is
tailed at 0,000 <0,05 and is said to accept Ha which means there is a significant difference. Which means that there are differences in
student learning outcomes between the control class and the experimental class at the posttest.
IV. Discussion Based on the results of a simple regression analysis, the test shows that the Sig value in the learning activity variable ( Y 1)
gets 0.011 <0.05. From these results, it can be concluded that there is an influence of reciprocal
teaching (X ) model variables on learning activities (Y).
Based on the results of the analysis of normality tests, the learning outcomes variable obtained a significant value of 0.087>
0.05 or> 5%. It can be concluded that the learning outcomes data are normally distributed.
Based on the results of the research that has been analyzed in chapter IV, to find out and analyze the effect of variable X
( Reciprocal Teaching Model ) on variables Y1 (Learning Activity) and Y 2 (Learning Outcomes) using the F test. significant value for
the effect of X simultaneously (simultaneous) on Y1 (Learning Activity) and Y 2 (Learning Outcomes) is 0,000 <0,05 so it is concluded
that there is an influence of X ( Reciprocal Teaching Model ) simultaneously (together) against Y1 (Learning Activity)
and Y 2 (Learning Outcomes) . The magnitude of the influence of the two variables using the Test Termination Coefficient obtained by
the R Square value of 0.938, can be interpreted that the effect of X ( Reciprocal Teaching Model ) simultaneously (together) at
Y 2 (Learning Outcomes) is 93.8%.

International Journal of Scientific and Research Publications, Volume 10, Issue 1, January 2020 725
ISSN 2250-3153
http://dx.doi.org/10.29322/IJSRP.10.01.2020.p97105 www.ijsrp.org
V. Conclusion The conclusion of this study can be taken after all variables meet the requirements for normality test, homogeneity test,
multicollinearity test and heterocedasticity test. The results of the normality and homogeneity test for all variables are normally
distributed and homogeneous. The conclusions that can be taken are based on the description of the research discussion, namely:
1. There is an influence of the Reciprocal Teaching model on the activities of students in class IV of Sooko 2 Elementary School in
Mojokerto. The mean value of learning activities in the control class was 66.23 and the experimental class was 84.52. Then by
looking at the results of the Independent Sample T test in table 4.10 t count = 3.485> t table = 1.677. Sig. 2 tailed 0.001 <0.05 then H o
is rejected and H a is accepted. This shows that there are differences in the results of learning activities of students who have been
treated and without treatment. So it can be concluded that the reciprocal teachinglearning model influences student learning
activities.
2. There is an influence of the Reciprocal Teaching model on the learning outcomes of students in class IV of Sooko 2 Elementary
School in Mojokerto. The results of the statistical test results of the study ( pre-test ) which shows that the value of t count = 0.015
< t table = 1.677. This shows that there were no differences in student learning outcomes in the past. After being treated ( treatment ),
obtained posttest learning results between the control class and the experimental class showed that the value of t count =
3.485> t table = 1.677. This shows that there are differences in learning outcomes of students who have been treated and without
treatment. So that it can be concluded that the reciprocal teaching learning model affects student learning outcomes.
References [1]. Ahmad, Susanto. (2013). Theory of Learning and Learning in Primary Schools . Jakarta: Kencana.
[2]. Arends, R. (2012). Learning To Teach: Nint Edition. America . New York: Mcgraw-Hill, Inc.
[3]. Arends, Richard i. 1997. Classroom Instruction and Management . New York: Mcgraw-Hill, Inc.
[4]. Arikunto , Suharsimi . (2010). Research Procedure ; A Practice Approach (Edition, Revision) . Jakarta: PT. Renika Cipta.
[5]. Arikunto , Suharsimi. (2011 ). Research Procedure ; A Practice Approach (Edition, Revision VII) . Jakarta: PT. Renika Cipta
[6]. Arikunto, S. (2006). Research Procedure A Ptactic Approach . Jakarta: Rineka Cipta.
[7]. Arikunto, S. (2013). Basics of Educational Evaluation . Jakarta: BumiAksara.
[8]. Astutik, Sri. (2012). Improving Student Learning Outcomes with Learning Cycle Models (5E Learning Cycle) Based on Experiments on Science Learning at
Patrang Elementary School 1 Jember. Journal of Primary School Education . Vol. 1 No. 2, pp.143-153 .
[9]. Aunurrahman. (2011). Learn and Learning . Bandung : Alfabeta.
[10]. Aziz, Abdul (2007). Teaching Methods and Models - IPS Bandung Alfabeta
[11]. Crawford, Alan. (2005). Teaching and Learning Strategies For The Thinking Classroom . New York: International Debate Education Association .
[12]. Choo, Tan Ooi Leng et al. (2011). Effects of Reciprocal Teaching Strategies on Reading Comprehension. International Journal of the Reading Matrix, Volume
11 Number 2.
[13]. Daryanto. (2007). Evaluation Education . Jakarta: Rineka Create.
[14]. MinistryofNationalEducation. (2006). UnitLevelCurriculum Education . Jakarta:Department General Management Education Basic and Middle class.
[15]. Djamarah, Syaiful, et al. (2010). Teaching and Learning Strategies . Jakarta: RinekaCipta.
[16]. Diash, kusnia (2017), Effect of Reciprocal Teaching Learning Model (Reverse Teaching) on Student Learning Outcomes on Environmental
Pollution , Proceedings Biology Education Conference Vol. 14, Number 1 Pages 484-489
[17]. Doolittle , Peter E , et al . (2006). Reciprocal Teaching for Reading Comprehension in Higher Education: A Strategy for Fostering the Deeper Understanding of
Texts. International Journal of Teaching and Learning in Higher Education . Volume 17, Number 2 .
[18]. Efendi,Nur. (2013). Approach TeachingPotentialReciprocalTeaching Increase Completeness Results Learn Biology Students . High School. Journal Pedagogia.
Vol 2 No. 1
[19]. Emzir. (2010). Methodology Research Education Quantitative and Qualitative . Jakarta: Rajawali Press.
[20]. Fraenkel, Jack et al. (2012). How to Design and Evaluate Research in Education . New York: McGraw-Hill Companies, Inc.
[21]. Gunawan, Rudy. (2011). IPS Education: Philosophers, Concepts, and Application. Bandung: Alfabeta.
[22]. Hamalik, Oemar. (2008). Basics of Curriculum Development. Bandung: PT RemajaRosdakarya Offset.
[23]. I Gd Ariyasa. (2014). Effect of Reciprocal teaching Learning models on Science Learning Outcomes in fifth grade students of SD Negeri 1 Tulamben, PGSD
Pulpit Journal, University of Education, Ganesha, PGSD Department (Vol.2; 1 year 2014).
[24]. Haqiqi, Irfan M. (2011). Influence Strategy Learning and Ability Think Abstract to Results Studying Islamic Subjects. Journal Technology Education Vol. 13
no.3 (150).
[25]. Huda, Miftahul. (2011). Cooperative Learning Methods, Techniques, Structures, and Applied Models . Yogyakarta: Library Student.
[26]. Herlina, Nirma (2017) Comprehensian Use of Reciprocal Teaching Reading , Proceeding of Fith ISELT - 5, 2017
[27]. Kelly a, Marie (2019) Reciprocal casroom teaching in the primary school, The Journal of Eduation Recearch http://www.tandfonline.com/lof/vjer 20
[28]. M.Lederer, Jeffrey (2015) Reciprocal Teaching of Social Studies in inclusive element cassrooms , journal of learning disability vol 88 Univ.
[29]. Calivornia Santa Cruz Ismail, HairulNizam, et al. (2012). Improving Vocabulary Learning in Foreign Language Learning Through Reciprocal Teaching
Strategy . International Journal of Learning and Development .ISSN 2164-4063. Vol. 2 No. 6
[30]. Kosasih, E. (2013). Strategy Learn and Learning, Implementation 2013 curriculum . Bandung: YramaWidya.
[31]. Maksum, Ali. (2012). Methodology Education . Surabaya: Unesa University Press.
[32]. Ni Ketut (1987). Effect of Reciprocal Teaching Learning Model on Reading Comprehension Reviewed by self-concept and
academics,https://ejournal.undiksha.ac.id/index.php/IKA/article/view/1987
[33]. from the Concept of Student Academic Self
[34]. Takala, Marjatta, Seadinavian Journal of Educational Research Vol 50, No5, November 2006 , pp. 559-576
[35]. Nwabude, AaronRoonie. (2011). Using a Vle To Enhance 'Assessment For Learning' Mathematics In School Scector . International Journal of Managing
Information Technology (IJMIT). Vol. 3, No.3.
[36]. Oktavianti, Ika and Santoso. (2014). Application of Cooperative Learning Type and Snowball Drilling
for Increase Activeness and Achievement Learn IPS. Journal Reflexion Edukatika . Vol. 4
[37]. Omari, HA and Weshah, HA (2010). Using The Reciprocal Teaching Method By Teachers At Agricultural Schools. International Journal Of Social Sciences Vol.
15
[38]. Prasetyo and Jannah (2011 ). Quantitative Research Methods Theory and application . Jakarta PT.Raja Grafindo Persada.
[39]. Purwanto, Ngalim. (2009). Principles and Technique Evaluation Teaching. Bandung: Teenager Rosdakarya.

International Journal of Scientific and Research Publications, Volume 10, Issue 1, January 2020 726
ISSN 2250-3153
http://dx.doi.org/10.29322/IJSRP.10.01.2020.p97105 www.ijsrp.org
[40]. Rusman. (2013). Medel-Integrated Learning model: Developing Teacher Professionalism . Jakarta: Grafindo Persada.
[41]. Rusman. (2012). Learn and Learning Based Computer Develop 21stCenturyTeacherProfessionalism. Bandung: Alfabeta.
[42]. Salehi , Mohammad . (2013) . A Comparative Study of Reciprocal Teaching Only (RTO) and Explicit Teaching of Strategies before Reciprocal Teaching (ET-
RT) On Reading Comprehension of EFL Learners. Australian Journal of Basic and Applied Sciences, ISSN 1991-8178
[43]. Subaryana. (2005 ) . Development Teaching Materials . Yogyakarta: IKIP PGRI Wates.
[44]. Sudjana, N (2011). Basics of the Learning Process Teach. Bandung: Sinar New Alghesindo.
[45]. Sudjana, Nana. (2012). Assessment of Teaching and Learning Results . Bandung: PT Adolescent Rosdakarya.
[46]. Sudjiono, A. (2006). Introduction Evaluation Education . Jakarta: Raja Grafindo Persada.
[47]. Sugiyono. (2010). Statistics for Education . Bandung: Alfabeta.
[48]. Sugiyono. (2010). Method Research Education . Bandung: CV Alfabeta.
[49]. Sugiyono. (2012 ). Qualitative and Quantitative Research Methods R & D. Bandung: CV Alfabeta.
[50]. Sugiyono. (2013 ). Qualitative and Quantitative Research Methods R & D. Bandung: CV Alfabeta.
[51]. Suyonodan, Hariyanto. (2012). Learn and Learning . Bandung: Teenagers Rosdakarya.
[52]. Taylor, George R and MacKenny, Loretta. (2008). Improving Human Learning in the Classroom Theories and Teaching Practices . United States of America: A
Division of Rowman & Littlefield Publisher, Inc.
[53]. Trianto. (2007). LearningModels Innovative Oriented Constructivistic . Jakarta:PublisherLibrary Achievements.
[54]. Triyanto. (2007). Innovative Learning Models Oriented Constructivistic. Jakarta: Achievement Heirloom.
[55]. Utari,R.(2011). Bloom'sTaxonomy. What and How Useit [serialonline]. http://www.bppk.depkeu.go.id/webpkn/attachments/766_ . [January 20, 2016]
[56]. Winarno, ME (2011). Methodology Research in Education . Malang: Horizon Media Main Press.
[57]. Wrench, Jason. (2009). Communication, Affect and Learning in the Classroom . California: Creative Common Atribution.
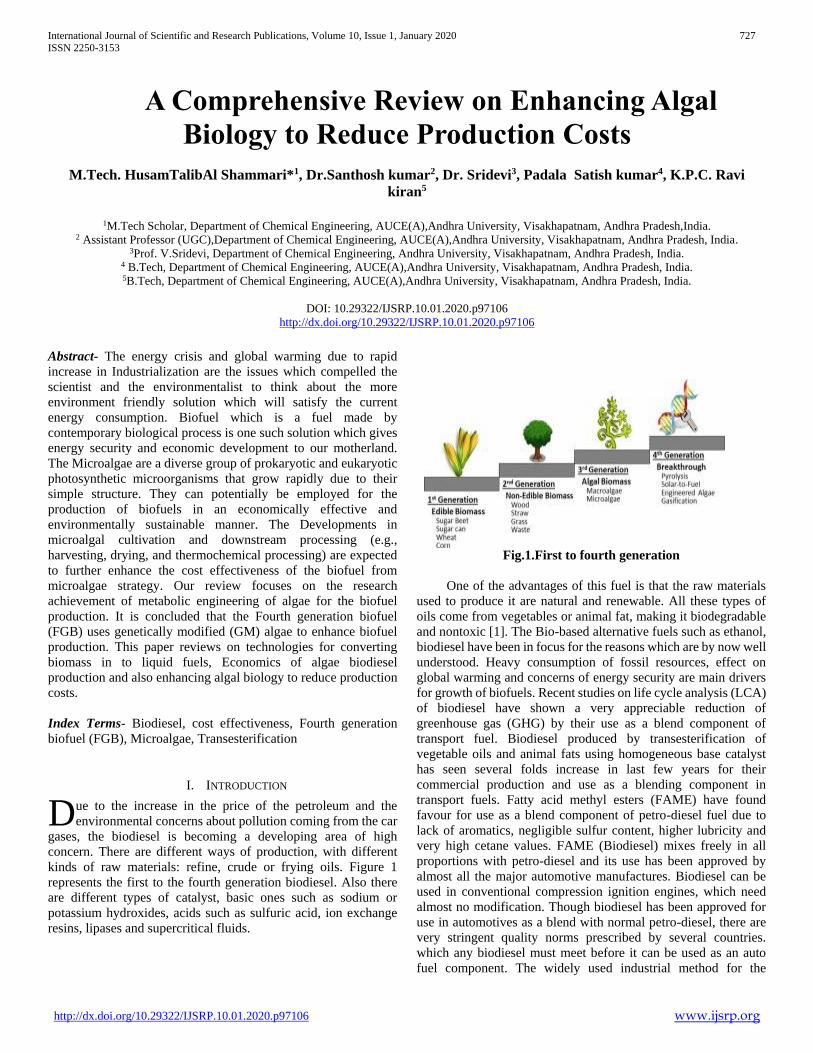
International Journal of Scientific and Research Publications, Volume 10, Issue 1, January 2020 727
ISSN 2250-3153
http://dx.doi.org/10.29322/IJSRP.10.01.2020.p97106 www.ijsrp.org
A Comprehensive Review on Enhancing Algal
Biology to Reduce Production Costs
M.Tech. HusamTalibAl Shammari*1, Dr.Santhosh kumar2, Dr. Sridevi3, Padala Satish kumar4, K.P.C. Ravi
kiran5
1M.Tech Scholar, Department of Chemical Engineering, AUCE(A),Andhra University, Visakhapatnam, Andhra Pradesh,India.
2 Assistant Professor (UGC),Department of Chemical Engineering, AUCE(A),Andhra University, Visakhapatnam, Andhra Pradesh, India. 3Prof. V.Sridevi, Department of Chemical Engineering, Andhra University, Visakhapatnam, Andhra Pradesh, India.
4 B.Tech, Department of Chemical Engineering, AUCE(A),Andhra University, Visakhapatnam, Andhra Pradesh, India. 5B.Tech, Department of Chemical Engineering, AUCE(A),Andhra University, Visakhapatnam, Andhra Pradesh, India.
DOI: 10.29322/IJSRP.10.01.2020.p97106
http://dx.doi.org/10.29322/IJSRP.10.01.2020.p97106
Abstract- The energy crisis and global warming due to rapid
increase in Industrialization are the issues which compelled the
scientist and the environmentalist to think about the more
environment friendly solution which will satisfy the current
energy consumption. Biofuel which is a fuel made by
contemporary biological process is one such solution which gives
energy security and economic development to our motherland.
The Microalgae are a diverse group of prokaryotic and eukaryotic
photosynthetic microorganisms that grow rapidly due to their
simple structure. They can potentially be employed for the
production of biofuels in an economically effective and
environmentally sustainable manner. The Developments in
microalgal cultivation and downstream processing (e.g.,
harvesting, drying, and thermochemical processing) are expected
to further enhance the cost effectiveness of the biofuel from
microalgae strategy. Our review focuses on the research
achievement of metabolic engineering of algae for the biofuel
production. It is concluded that the Fourth generation biofuel
(FGB) uses genetically modified (GM) algae to enhance biofuel
production. This paper reviews on technologies for converting
biomass in to liquid fuels, Economics of algae biodiesel
production and also enhancing algal biology to reduce production
costs.
Index Terms- Biodiesel, cost effectiveness, Fourth generation
biofuel (FGB), Microalgae, Transesterification
I. INTRODUCTION
ue to the increase in the price of the petroleum and the
environmental concerns about pollution coming from the car
gases, the biodiesel is becoming a developing area of high
concern. There are different ways of production, with different
kinds of raw materials: refine, crude or frying oils. Figure 1
represents the first to the fourth generation biodiesel. Also there
are different types of catalyst, basic ones such as sodium or
potassium hydroxides, acids such as sulfuric acid, ion exchange
resins, lipases and supercritical fluids.
Fig.1.First to fourth generation
One of the advantages of this fuel is that the raw materials
used to produce it are natural and renewable. All these types of
oils come from vegetables or animal fat, making it biodegradable
and nontoxic [1]. The Bio-based alternative fuels such as ethanol,
biodiesel have been in focus for the reasons which are by now well
understood. Heavy consumption of fossil resources, effect on
global warming and concerns of energy security are main drivers
for growth of biofuels. Recent studies on life cycle analysis (LCA)
of biodiesel have shown a very appreciable reduction of
greenhouse gas (GHG) by their use as a blend component of
transport fuel. Biodiesel produced by transesterification of
vegetable oils and animal fats using homogeneous base catalyst
has seen several folds increase in last few years for their
commercial production and use as a blending component in
transport fuels. Fatty acid methyl esters (FAME) have found
favour for use as a blend component of petro-diesel fuel due to
lack of aromatics, negligible sulfur content, higher lubricity and
very high cetane values. FAME (Biodiesel) mixes freely in all
proportions with petro-diesel and its use has been approved by
almost all the major automotive manufactures. Biodiesel can be
used in conventional compression ignition engines, which need
almost no modification. Though biodiesel has been approved for
use in automotives as a blend with normal petro-diesel, there are
very stringent quality norms prescribed by several countries.
which any biodiesel must meet before it can be used as an auto
fuel component. The widely used industrial method for the
D

International Journal of Scientific and Research Publications, Volume 10, Issue 1, January 2020 728
ISSN 2250-3153
http://dx.doi.org/10.29322/IJSRP.10.01.2020.p97106 www.ijsrp.org
commercial production of biodiesel from vegetable oils, fats is a
base catalyzed transesterification process using KOH or NaOH as
the homogeneous catalyst and MeOH as the lower alcohol.
II. TECHNOLOGIES FOR CONVERTING BIOMASS
INTO LIQUID FUELS
It is possible to produce a variety of liquid biofuels from the
cellulosic biomass (next generation feedstock), however its cost is
not competitive with petro fuels, even with the recent price hikes.
The Multiple steps are required for the conversion into a liquid
fuel. Recent studies have indicated that 6:10% of the energy in
biomass is utilized in feedstock preparation. The two primary
conversion pathways are thermo chemical and biochemical
process.
2.1. Thermo chemical conversion
These technologies typically use the high temperatures and
pressure to depolymerize lignocelluloses into small molecular
weight organic and inorganic compounds which can be
transformed into hydrocarbons, alcohols, aromatics and other
organics.
2.2. Gasification
The two major thermo chemical pathways for the converting
biomass to gaseous and liquid fuels are the gasification and
pyrolysis, the Gasification is the thermo chemical partial oxidation
of hydrocarbons in the biomass at high temperature ((800–
1000°C)) to a combustible gas mixture ((typically its containing
H2, CH4, CO2 and C2H4)). In the gasification procedure, the
biomass is thermally decayed at great temperature in O2 hungry
environment to avoid the explosive gas from combustion. This
synthesis gas a mixture of ((CO2, CO, CH4 and H2)) is transformed
to a liquid fuel such as synthetic diesel using FischerTropsch
technology [2].
2.3. Pyrolysis
The Pyrolysis method depends on using high temperature in
the non-existence of O2to transforms the biomass into bio-oil.
Pyrolysis can be classified as fast, conventional or flash according
to the heating rate, particle size, operating condition of
temperature and solid seat time. For instance, if bio-oil yield is to
be maximized fast, this is required that the biomass is heated to
(500°C) for around (10 second).The pyrolysis temperatures are
approximately (475°C), where gasification is ready at
temperatures fluctuating from (600 to 1100°C).
2.4. Biochemical conversion
In Biochemical conversion, the process is described as
enzymatic hydrolysis in addition to the microbial digestion. It
includes the decomposition of the biomass into hemi cellulose,
cellulose and lignin and transforming, the hemi cellulose and
cellulose into fermentable sugars, subsequently use of yeast and
specific bacteria to transform the sugar to ethanol. This method
needs a pre-treatment stage (steam, ammonia and acid) to
decomposition of the biomass into fluid slurry. The Use of acid to
destroy lingo cellulosic fibers can be used also to destroy much of
the hemi cellulose sugar earlier then can be fermented into ethanol,
causing low incomes [3].
2.5. Anaerobic digestion
The natural process is called the anaerobic digestion and is
the microbiological conversion of organic matter to CH4 in the
deficiency of O2. The biochemical transformation of biomass is
finished throughout alcoholic fermentation to yield liquid fuels,
while the fermentation with anaerobic digestion produce biogas
((H2, NH4, CO2 and CH4)) generally by four stages that includes
(hydrolysis, acidogensis, acetogensis and methanogensis). The
decomposition is caused by natural bacterial action in different
stages and occurs in a variety of natural aerobic environments
including water sediment, waterlogged soils, natural hot springs,
ocean thermal vents and the stomachs of various animals.
2.6. Fermentation and hydrolysis
There is some methods permit biomass to be converted into
gaseous fuel, for instance, (CH4 or H2). One genetic-modified
procedure uses bacteria and algae to yield (H2) immediately
instead of the usual biotic energy carriers. The second way uses
agricultural remains in fermentation for produce biogas. This
method is documented and used for waste treatment in a wide
range. The high temperature in gasification supplies a crude gas
for the production of hydrogen by a second reaction step. in
biogas, there is the opportunity of using the compact byproduct as
a biofuel. Traditional fermentation plants producing biogas are in
routine use, ranging from farms to large municipal plants [4].
2.7. Transesterification
The Transesterification is a chemical combination of bio-oil
with an alcohol (the methanol or ethanol) [5]. The resulting of
biodiesel is an alkyl ester of the fatty acid, which contains an
alcohol group attached to a single hydrocarbon chain comparable
in length to that of diesel (C10H22–C15H32). The transesterification
method means biodiesel production [5] in which glycerin is
extracted from the fat or vegetable oil [6].The Plants late two
products are methyl esters and glycerin that is used in the soaps
and other products. Transesterification of the triglycerides can be
improved by using catalysts which are divided in to alkali, acid
and enzyme. Alkali-catalyzed transesterification is the best and
faster than acid-catalyzed transesterification, so it used
commercially [7, 8].
Chemical composition
The Natural oils and fats are the esters of glycerol and fatty
acids.They are called the glycerides or triglycerides. There are two
kinds of fatty acids, saturated fatty acids are polarized and contain
a single carbon bond, while unsaturated fatty acids include one or
more carbon-to-carbon doubled bonds and are polarized. Figure 2
represent the Triglycerides transesterification reaction with
methanol. Examples of the common fatty acids are stearic, oleic,
linolenic and the palmitic [9].
Transesterification reaction
The Transesterification of vegetable oils with alcohol is the
best method for biodiesel production. There are two
transesterification methods, which are: (1) with catalyst , (2)
without catalyst. The utilization of the different types of catalysts
improves the rate and yield of biodiesel. The transesterification
reaction is reversible and excess alcohol shifts the equilibrium to
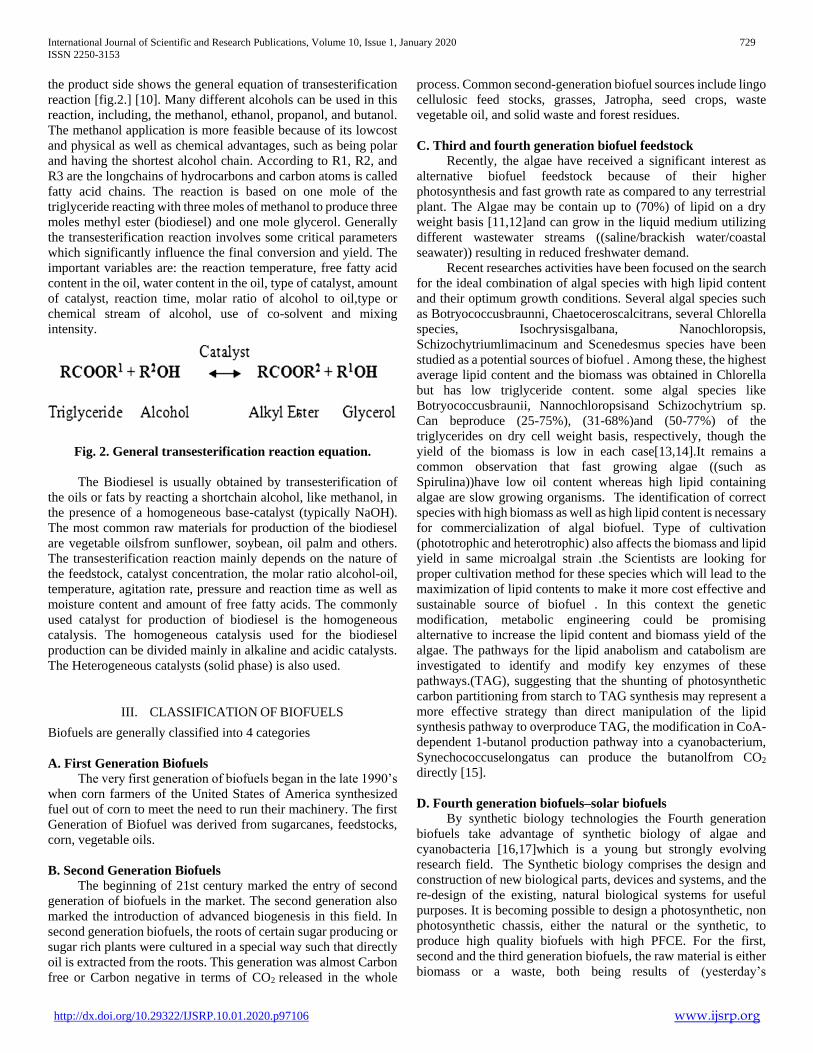
International Journal of Scientific and Research Publications, Volume 10, Issue 1, January 2020 729
ISSN 2250-3153
http://dx.doi.org/10.29322/IJSRP.10.01.2020.p97106 www.ijsrp.org
the product side shows the general equation of transesterification
reaction [fig.2.] [10]. Many different alcohols can be used in this
reaction, including, the methanol, ethanol, propanol, and butanol.
The methanol application is more feasible because of its lowcost
and physical as well as chemical advantages, such as being polar
and having the shortest alcohol chain. According to R1, R2, and
R3 are the longchains of hydrocarbons and carbon atoms is called
fatty acid chains. The reaction is based on one mole of the
triglyceride reacting with three moles of methanol to produce three
moles methyl ester (biodiesel) and one mole glycerol. Generally
the transesterification reaction involves some critical parameters
which significantly influence the final conversion and yield. The
important variables are: the reaction temperature, free fatty acid
content in the oil, water content in the oil, type of catalyst, amount
of catalyst, reaction time, molar ratio of alcohol to oil,type or
chemical stream of alcohol, use of co-solvent and mixing
intensity.
Fig. 2. General transesterification reaction equation.
The Biodiesel is usually obtained by transesterification of
the oils or fats by reacting a shortchain alcohol, like methanol, in
the presence of a homogeneous base-catalyst (typically NaOH).
The most common raw materials for production of the biodiesel
are vegetable oilsfrom sunflower, soybean, oil palm and others.
The transesterification reaction mainly depends on the nature of
the feedstock, catalyst concentration, the molar ratio alcohol-oil,
temperature, agitation rate, pressure and reaction time as well as
moisture content and amount of free fatty acids. The commonly
used catalyst for production of biodiesel is the homogeneous
catalysis. The homogeneous catalysis used for the biodiesel
production can be divided mainly in alkaline and acidic catalysts.
The Heterogeneous catalysts (solid phase) is also used.
III. CLASSIFICATION OF BIOFUELS
Biofuels are generally classified into 4 categories
A. First Generation Biofuels
The very first generation of biofuels began in the late 1990’s
when corn farmers of the United States of America synthesized
fuel out of corn to meet the need to run their machinery. The first
Generation of Biofuel was derived from sugarcanes, feedstocks,
corn, vegetable oils.
B. Second Generation Biofuels
The beginning of 21st century marked the entry of second
generation of biofuels in the market. The second generation also
marked the introduction of advanced biogenesis in this field. In
second generation biofuels, the roots of certain sugar producing or
sugar rich plants were cultured in a special way such that directly
oil is extracted from the roots. This generation was almost Carbon
free or Carbon negative in terms of CO2 released in the whole
process. Common second-generation biofuel sources include lingo
cellulosic feed stocks, grasses, Jatropha, seed crops, waste
vegetable oil, and solid waste and forest residues.
C. Third and fourth generation biofuel feedstock
Recently, the algae have received a significant interest as
alternative biofuel feedstock because of their higher
photosynthesis and fast growth rate as compared to any terrestrial
plant. The Algae may be contain up to (70%) of lipid on a dry
weight basis [11,12]and can grow in the liquid medium utilizing
different wastewater streams ((saline/brackish water/coastal
seawater)) resulting in reduced freshwater demand.
Recent researches activities have been focused on the search
for the ideal combination of algal species with high lipid content
and their optimum growth conditions. Several algal species such
as Botryococcusbraunni, Chaetoceroscalcitrans, several Chlorella
species, Isochrysisgalbana, Nanochloropsis,
Schizochytriumlimacinum and Scenedesmus species have been
studied as a potential sources of biofuel . Among these, the highest
average lipid content and the biomass was obtained in Chlorella
but has low triglyceride content. some algal species like
Botryococcusbraunii, Nannochloropsisand Schizochytrium sp.
Can beproduce (25-75%), (31-68%)and (50-77%) of the
triglycerides on dry cell weight basis, respectively, though the
yield of the biomass is low in each case[13,14].It remains a
common observation that fast growing algae ((such as
Spirulina))have low oil content whereas high lipid containing
algae are slow growing organisms. The identification of correct
species with high biomass as well as high lipid content is necessary
for commercialization of algal biofuel. Type of cultivation
(phototrophic and heterotrophic) also affects the biomass and lipid
yield in same microalgal strain .the Scientists are looking for
proper cultivation method for these species which will lead to the
maximization of lipid contents to make it more cost effective and
sustainable source of biofuel . In this context the genetic
modification, metabolic engineering could be promising
alternative to increase the lipid content and biomass yield of the
algae. The pathways for the lipid anabolism and catabolism are
investigated to identify and modify key enzymes of these
pathways.(TAG), suggesting that the shunting of photosynthetic
carbon partitioning from starch to TAG synthesis may represent a
more effective strategy than direct manipulation of the lipid
synthesis pathway to overproduce TAG, the modification in CoA-
dependent 1-butanol production pathway into a cyanobacterium,
Synechococcuselongatus can produce the butanolfrom CO2
directly [15].
D. Fourth generation biofuels–solar biofuels
By synthetic biology technologies the Fourth generation
biofuels take advantage of synthetic biology of algae and
cyanobacteria [16,17]which is a young but strongly evolving
research field. The Synthetic biology comprises the design and
construction of new biological parts, devices and systems, and the
re-design of the existing, natural biological systems for useful
purposes. It is becoming possible to design a photosynthetic, non
photosynthetic chassis, either the natural or the synthetic, to
produce high quality biofuels with high PFCE. For the first,
second and the third generation biofuels, the raw material is either
biomass or a waste, both being results of (yesterday’s
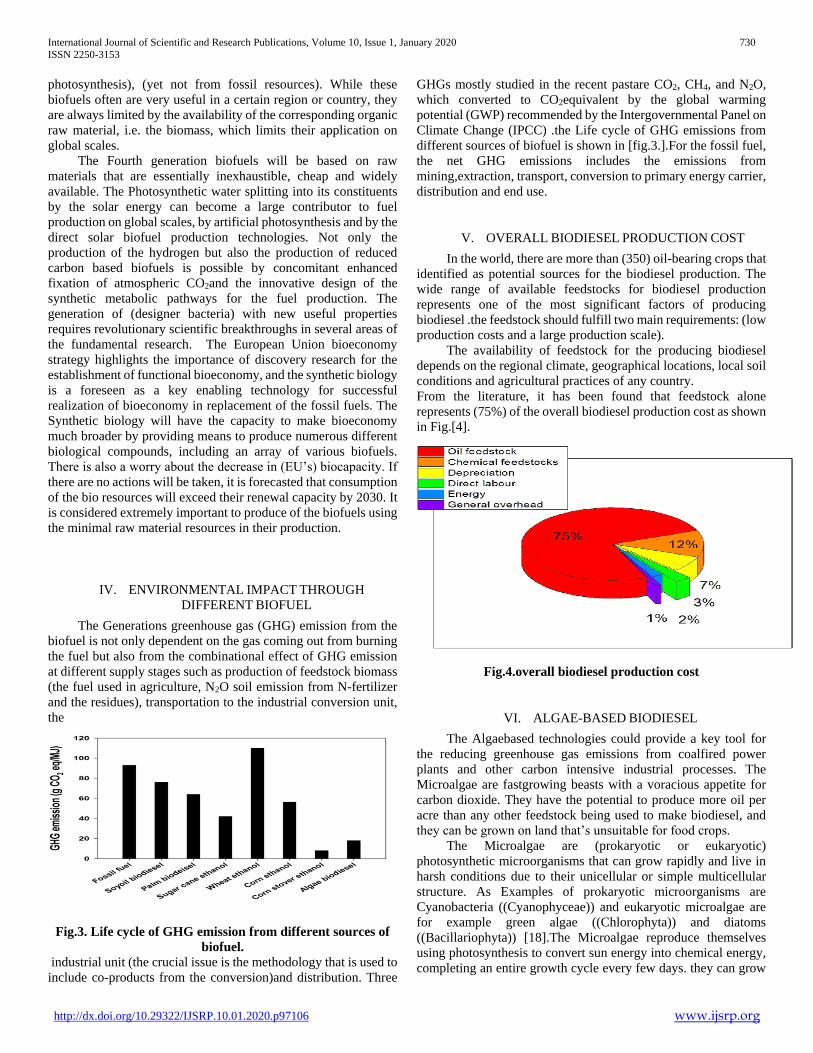
International Journal of Scientific and Research Publications, Volume 10, Issue 1, January 2020 730
ISSN 2250-3153
http://dx.doi.org/10.29322/IJSRP.10.01.2020.p97106 www.ijsrp.org
photosynthesis), (yet not from fossil resources). While these
biofuels often are very useful in a certain region or country, they
are always limited by the availability of the corresponding organic
raw material, i.e. the biomass, which limits their application on
global scales.
The Fourth generation biofuels will be based on raw
materials that are essentially inexhaustible, cheap and widely
available. The Photosynthetic water splitting into its constituents
by the solar energy can become a large contributor to fuel
production on global scales, by artificial photosynthesis and by the
direct solar biofuel production technologies. Not only the
production of the hydrogen but also the production of reduced
carbon based biofuels is possible by concomitant enhanced
fixation of atmospheric CO2and the innovative design of the
synthetic metabolic pathways for the fuel production. The
generation of (designer bacteria) with new useful properties
requires revolutionary scientific breakthroughs in several areas of
the fundamental research. The European Union bioeconomy
strategy highlights the importance of discovery research for the
establishment of functional bioeconomy, and the synthetic biology
is a foreseen as a key enabling technology for successful
realization of bioeconomy in replacement of the fossil fuels. The
Synthetic biology will have the capacity to make bioeconomy
much broader by providing means to produce numerous different
biological compounds, including an array of various biofuels.
There is also a worry about the decrease in (EU’s) biocapacity. If
there are no actions will be taken, it is forecasted that consumption
of the bio resources will exceed their renewal capacity by 2030. It
is considered extremely important to produce of the biofuels using
the minimal raw material resources in their production.
IV. ENVIRONMENTAL IMPACT THROUGH
DIFFERENT BIOFUEL
The Generations greenhouse gas (GHG) emission from the
biofuel is not only dependent on the gas coming out from burning
the fuel but also from the combinational effect of GHG emission
at different supply stages such as production of feedstock biomass
(the fuel used in agriculture, N2O soil emission from N-fertilizer
and the residues), transportation to the industrial conversion unit,
the
Fig.3. Life cycle of GHG emission from different sources of
biofuel.
industrial unit (the crucial issue is the methodology that is used to
include co-products from the conversion)and distribution. Three
GHGs mostly studied in the recent pastare CO2, CH4, and N2O,
which converted to CO2equivalent by the global warming
potential (GWP) recommended by the Intergovernmental Panel on
Climate Change (IPCC) .the Life cycle of GHG emissions from
different sources of biofuel is shown in [fig.3.].For the fossil fuel,
the net GHG emissions includes the emissions from
mining,extraction, transport, conversion to primary energy carrier,
distribution and end use.
V. OVERALL BIODIESEL PRODUCTION COST
In the world, there are more than (350) oil-bearing crops that
identified as potential sources for the biodiesel production. The
wide range of available feedstocks for biodiesel production
represents one of the most significant factors of producing
biodiesel .the feedstock should fulfill two main requirements: (low
production costs and a large production scale).
The availability of feedstock for the producing biodiesel
depends on the regional climate, geographical locations, local soil
conditions and agricultural practices of any country.
From the literature, it has been found that feedstock alone
represents (75%) of the overall biodiesel production cost as shown
in Fig.[4].
Fig.4.overall biodiesel production cost
VI. ALGAE-BASED BIODIESEL
The Algaebased technologies could provide a key tool for
the reducing greenhouse gas emissions from coalfired power
plants and other carbon intensive industrial processes. The
Microalgae are fastgrowing beasts with a voracious appetite for
carbon dioxide. They have the potential to produce more oil per
acre than any other feedstock being used to make biodiesel, and
they can be grown on land that’s unsuitable for food crops.
The Microalgae are (prokaryotic or eukaryotic)
photosynthetic microorganisms that can grow rapidly and live in
harsh conditions due to their unicellular or simple multicellular
structure. As Examples of prokaryotic microorganisms are
Cyanobacteria ((Cyanophyceae)) and eukaryotic microalgae are
for example green algae ((Chlorophyta)) and diatoms
((Bacillariophyta)) [18].The Microalgae reproduce themselves
using photosynthesis to convert sun energy into chemical energy,
completing an entire growth cycle every few days. they can grow
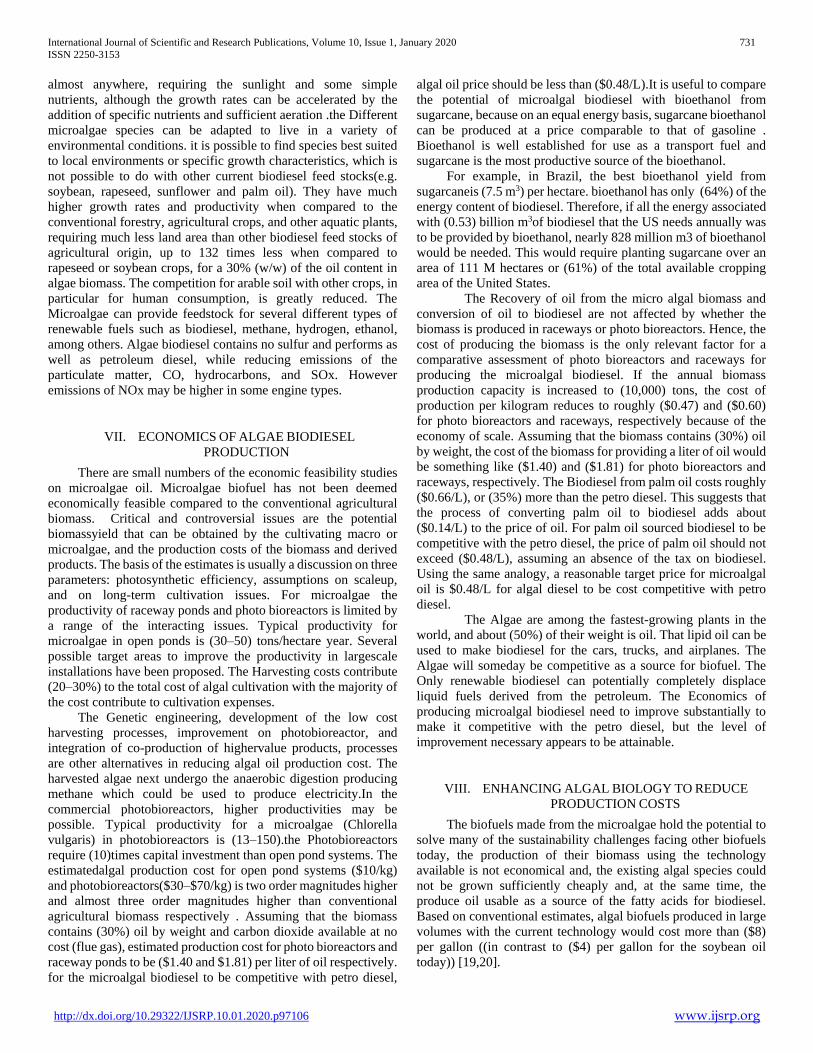
International Journal of Scientific and Research Publications, Volume 10, Issue 1, January 2020 731
ISSN 2250-3153
http://dx.doi.org/10.29322/IJSRP.10.01.2020.p97106 www.ijsrp.org
almost anywhere, requiring the sunlight and some simple
nutrients, although the growth rates can be accelerated by the
addition of specific nutrients and sufficient aeration .the Different
microalgae species can be adapted to live in a variety of
environmental conditions. it is possible to find species best suited
to local environments or specific growth characteristics, which is
not possible to do with other current biodiesel feed stocks(e.g.
soybean, rapeseed, sunflower and palm oil). They have much
higher growth rates and productivity when compared to the
conventional forestry, agricultural crops, and other aquatic plants,
requiring much less land area than other biodiesel feed stocks of
agricultural origin, up to 132 times less when compared to
rapeseed or soybean crops, for a 30% (w/w) of the oil content in
algae biomass. The competition for arable soil with other crops, in
particular for human consumption, is greatly reduced. The
Microalgae can provide feedstock for several different types of
renewable fuels such as biodiesel, methane, hydrogen, ethanol,
among others. Algae biodiesel contains no sulfur and performs as
well as petroleum diesel, while reducing emissions of the
particulate matter, CO, hydrocarbons, and SOx. However
emissions of NOx may be higher in some engine types.
VII. ECONOMICS OF ALGAE BIODIESEL
PRODUCTION
There are small numbers of the economic feasibility studies
on microalgae oil. Microalgae biofuel has not been deemed
economically feasible compared to the conventional agricultural
biomass. Critical and controversial issues are the potential
biomassyield that can be obtained by the cultivating macro or
microalgae, and the production costs of the biomass and derived
products. The basis of the estimates is usually a discussion on three
parameters: photosynthetic efficiency, assumptions on scaleup,
and on long-term cultivation issues. For microalgae the
productivity of raceway ponds and photo bioreactors is limited by
a range of the interacting issues. Typical productivity for
microalgae in open ponds is (30–50) tons/hectare year. Several
possible target areas to improve the productivity in largescale
installations have been proposed. The Harvesting costs contribute
(20–30%) to the total cost of algal cultivation with the majority of
the cost contribute to cultivation expenses.
The Genetic engineering, development of the low cost
harvesting processes, improvement on photobioreactor, and
integration of co-production of highervalue products, processes
are other alternatives in reducing algal oil production cost. The
harvested algae next undergo the anaerobic digestion producing
methane which could be used to produce electricity.In the
commercial photobioreactors, higher productivities may be
possible. Typical productivity for a microalgae (Chlorella
vulgaris) in photobioreactors is (13–150).the Photobioreactors
require (10)times capital investment than open pond systems. The
estimatedalgal production cost for open pond systems ($10/kg)
and photobioreactors($30–$70/kg) is two order magnitudes higher
and almost three order magnitudes higher than conventional
agricultural biomass respectively . Assuming that the biomass
contains (30%) oil by weight and carbon dioxide available at no
cost (flue gas), estimated production cost for photo bioreactors and
raceway ponds to be ($1.40 and $1.81) per liter of oil respectively.
for the microalgal biodiesel to be competitive with petro diesel,
algal oil price should be less than ($0.48/L).It is useful to compare
the potential of microalgal biodiesel with bioethanol from
sugarcane, because on an equal energy basis, sugarcane bioethanol
can be produced at a price comparable to that of gasoline .
Bioethanol is well established for use as a transport fuel and
sugarcane is the most productive source of the bioethanol.
For example, in Brazil, the best bioethanol yield from
sugarcaneis (7.5 m3) per hectare. bioethanol has only (64%) of the
energy content of biodiesel. Therefore, if all the energy associated
with (0.53) billion m3of biodiesel that the US needs annually was
to be provided by bioethanol, nearly 828 million m3 of bioethanol
would be needed. This would require planting sugarcane over an
area of 111 M hectares or (61%) of the total available cropping
area of the United States.
The Recovery of oil from the micro algal biomass and
conversion of oil to biodiesel are not affected by whether the
biomass is produced in raceways or photo bioreactors. Hence, the
cost of producing the biomass is the only relevant factor for a
comparative assessment of photo bioreactors and raceways for
producing the microalgal biodiesel. If the annual biomass
production capacity is increased to (10,000) tons, the cost of
production per kilogram reduces to roughly ($0.47) and ($0.60)
for photo bioreactors and raceways, respectively because of the
economy of scale. Assuming that the biomass contains (30%) oil
by weight, the cost of the biomass for providing a liter of oil would
be something like ($1.40) and ($1.81) for photo bioreactors and
raceways, respectively. The Biodiesel from palm oil costs roughly
($0.66/L), or (35%) more than the petro diesel. This suggests that
the process of converting palm oil to biodiesel adds about
($0.14/L) to the price of oil. For palm oil sourced biodiesel to be
competitive with the petro diesel, the price of palm oil should not
exceed ($0.48/L), assuming an absence of the tax on biodiesel.
Using the same analogy, a reasonable target price for microalgal
oil is $0.48/L for algal diesel to be cost competitive with petro
diesel.
The Algae are among the fastest-growing plants in the
world, and about (50%) of their weight is oil. That lipid oil can be
used to make biodiesel for the cars, trucks, and airplanes. The
Algae will someday be competitive as a source for biofuel. The
Only renewable biodiesel can potentially completely displace
liquid fuels derived from the petroleum. The Economics of
producing microalgal biodiesel need to improve substantially to
make it competitive with the petro diesel, but the level of
improvement necessary appears to be attainable.
VIII. ENHANCING ALGAL BIOLOGY TO REDUCE
PRODUCTION COSTS
The biofuels made from the microalgae hold the potential to
solve many of the sustainability challenges facing other biofuels
today, the production of their biomass using the technology
available is not economical and, the existing algal species could
not be grown sufficiently cheaply and, at the same time, the
produce oil usable as a source of the fatty acids for biodiesel.
Based on conventional estimates, algal biofuels produced in large
volumes with the current technology would cost more than ($8)
per gallon ((in contrast to ($4) per gallon for the soybean oil
today)) [19,20].
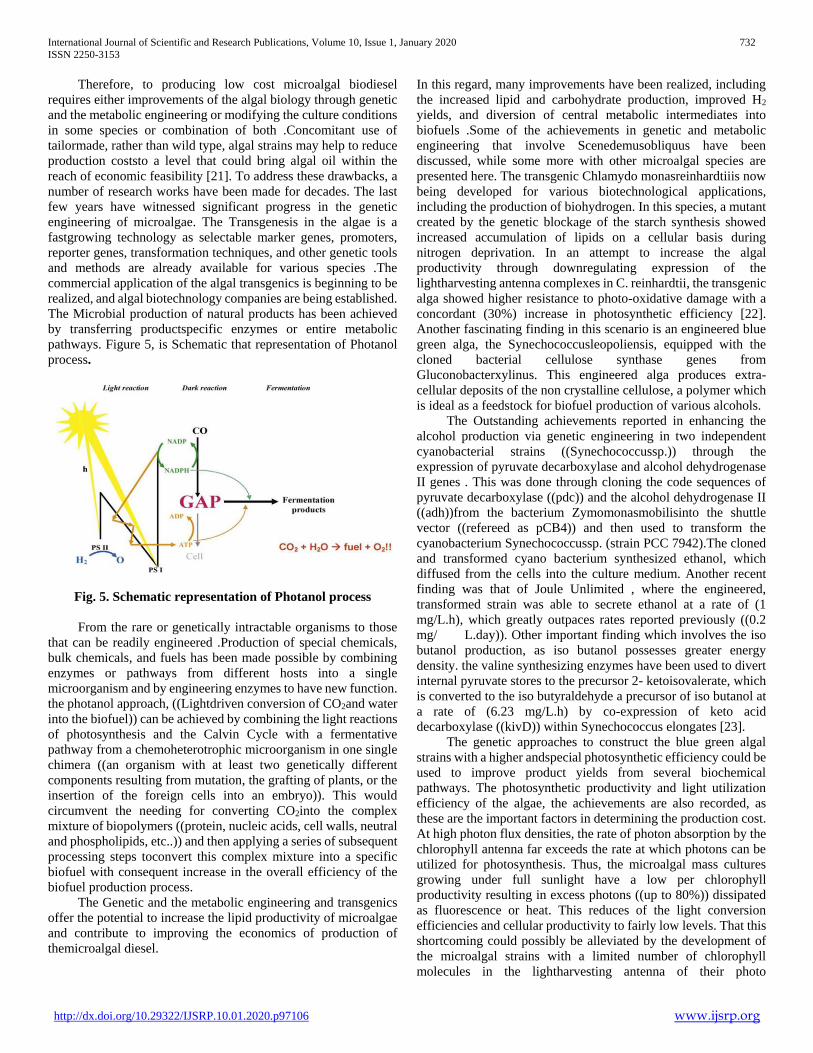
International Journal of Scientific and Research Publications, Volume 10, Issue 1, January 2020 732
ISSN 2250-3153
http://dx.doi.org/10.29322/IJSRP.10.01.2020.p97106 www.ijsrp.org
Therefore, to producing low cost microalgal biodiesel
requires either improvements of the algal biology through genetic
and the metabolic engineering or modifying the culture conditions
in some species or combination of both .Concomitant use of
tailormade, rather than wild type, algal strains may help to reduce
production coststo a level that could bring algal oil within the
reach of economic feasibility [21]. To address these drawbacks, a
number of research works have been made for decades. The last
few years have witnessed significant progress in the genetic
engineering of microalgae. The Transgenesis in the algae is a
fastgrowing technology as selectable marker genes, promoters,
reporter genes, transformation techniques, and other genetic tools
and methods are already available for various species .The
commercial application of the algal transgenics is beginning to be
realized, and algal biotechnology companies are being established.
The Microbial production of natural products has been achieved
by transferring productspecific enzymes or entire metabolic
pathways. Figure 5, is Schematic that representation of Photanol
process.
Fig. 5. Schematic representation of Photanol process
From the rare or genetically intractable organisms to those
that can be readily engineered .Production of special chemicals,
bulk chemicals, and fuels has been made possible by combining
enzymes or pathways from different hosts into a single
microorganism and by engineering enzymes to have new function.
the photanol approach, ((Lightdriven conversion of CO2and water
into the biofuel)) can be achieved by combining the light reactions
of photosynthesis and the Calvin Cycle with a fermentative
pathway from a chemoheterotrophic microorganism in one single
chimera ((an organism with at least two genetically different
components resulting from mutation, the grafting of plants, or the
insertion of the foreign cells into an embryo)). This would
circumvent the needing for converting CO2into the complex
mixture of biopolymers ((protein, nucleic acids, cell walls, neutral
and phospholipids, etc..)) and then applying a series of subsequent
processing steps toconvert this complex mixture into a specific
biofuel with consequent increase in the overall efficiency of the
biofuel production process.
The Genetic and the metabolic engineering and transgenics
offer the potential to increase the lipid productivity of microalgae
and contribute to improving the economics of production of
themicroalgal diesel.
In this regard, many improvements have been realized, including
the increased lipid and carbohydrate production, improved H2
yields, and diversion of central metabolic intermediates into
biofuels .Some of the achievements in genetic and metabolic
engineering that involve Scenedemusobliquus have been
discussed, while some more with other microalgal species are
presented here. The transgenic Chlamydo monasreinhardtiiis now
being developed for various biotechnological applications,
including the production of biohydrogen. In this species, a mutant
created by the genetic blockage of the starch synthesis showed
increased accumulation of lipids on a cellular basis during
nitrogen deprivation. In an attempt to increase the algal
productivity through downregulating expression of the
lightharvesting antenna complexes in C. reinhardtii, the transgenic
alga showed higher resistance to photo-oxidative damage with a
concordant (30%) increase in photosynthetic efficiency [22].
Another fascinating finding in this scenario is an engineered blue
green alga, the Synechococcusleopoliensis, equipped with the
cloned bacterial cellulose synthase genes from
Gluconobacterxylinus. This engineered alga produces extra-
cellular deposits of the non crystalline cellulose, a polymer which
is ideal as a feedstock for biofuel production of various alcohols.
The Outstanding achievements reported in enhancing the
alcohol production via genetic engineering in two independent
cyanobacterial strains ((Synechococcussp.)) through the
expression of pyruvate decarboxylase and alcohol dehydrogenase
II genes . This was done through cloning the code sequences of
pyruvate decarboxylase ((pdc)) and the alcohol dehydrogenase II
((adh))from the bacterium Zymomonasmobilisinto the shuttle
vector ((refereed as pCB4)) and then used to transform the
cyanobacterium Synechococcussp. (strain PCC 7942).The cloned
and transformed cyano bacterium synthesized ethanol, which
diffused from the cells into the culture medium. Another recent
finding was that of Joule Unlimited , where the engineered,
transformed strain was able to secrete ethanol at a rate of (1
mg/L.h), which greatly outpaces rates reported previously ((0.2
mg/ L.day)). Other important finding which involves the iso
butanol production, as iso butanol possesses greater energy
density. the valine synthesizing enzymes have been used to divert
internal pyruvate stores to the precursor 2- ketoisovalerate, which
is converted to the iso butyraldehyde a precursor of iso butanol at
a rate of (6.23 mg/L.h) by co-expression of keto acid
decarboxylase ((kivD)) within Synechococcus elongates [23].
The genetic approaches to construct the blue green algal
strains with a higher andspecial photosynthetic efficiency could be
used to improve product yields from several biochemical
pathways. The photosynthetic productivity and light utilization
efficiency of the algae, the achievements are also recorded, as
these are the important factors in determining the production cost.
At high photon flux densities, the rate of photon absorption by the
chlorophyll antenna far exceeds the rate at which photons can be
utilized for photosynthesis. Thus, the microalgal mass cultures
growing under full sunlight have a low per chlorophyll
productivity resulting in excess photons ((up to 80%)) dissipated
as fluorescence or heat. This reduces of the light conversion
efficiencies and cellular productivity to fairly low levels. That this
shortcoming could possibly be alleviated by the development of
the microalgal strains with a limited number of chlorophyll
molecules in the lightharvesting antenna of their photo

International Journal of Scientific and Research Publications, Volume 10, Issue 1, January 2020 733
ISSN 2250-3153
http://dx.doi.org/10.29322/IJSRP.10.01.2020.p97106 www.ijsrp.org
systems,(i.e. the strains that have a truncated chlorophyll antenna
size). the truncated chlorophyll antenna size minimizes absorption
and wasteful dissipation of sunlight by individual cells, the
resulting in better light utilization efficiency and greater
photosynthetic productivity by the green alga mass culture In
general, metabolic and molecular level engineering can be
potentially useful to promote several desirable features of
microalgae to increase photosynthetic efficiency to enable
increased biomass yield, to enhance biomass growth rate, to
increase oil content of biomass, to improve temperature tolerance
to reduce the expense ofCooling, to eliminate the light saturation
phenomenon so that growth continues to increase in response to
increasing the light level, to reduce the photo inhibition that
actually reduces growth the rate at midday light intensities that
occur in the temperate and tropical zones, and to reduce
susceptibility to photo oxidation that damages cells.
IX. CONCLUSIONS
The Biodiesel is gradually gaining acceptance in the market
as an environmentally friendly alternative diesel fuel. However,
for biodiesel to establish and continue to mature in the market,
various aspects must be examined and overcome. Some of the key
issues such as improving efficiency of the production process,
using low cost feedstock, developing cost effective catalyst, and
managing agricultural land, have been reviewed. As with any new
technology or products, the biodiesel will require continuous
improvement especially in producing cleaner emissions and
having less impact on the environment. Further, the development
on the use ofthe byproduct will enhance the economic viability of
the overall biodiesel production process.
It can also be carried out with seawater as the medium, given
that marine microalgal species are adopted, providing a feasible
alternative for biofuel production to populous and dry coastal
regions. Microalgae can produce a large variety of novel
bioproducts with wide applications in medicine, food, and
cosmetic industries.
Combining the microalgal farming and the production of
biofuels using biorefinery strategy is expected to significantly
enhance the overall costeffectiveness of the biofuel from
microalgae approach. Technological developments, including
advances in photobioreactor design, microalgal biomass
harvesting, drying, and other downstream processing technologies
are important areas that may lead to enhanced costeffectiveness
and therefore, effective commercial implementation of the biofuel
from microalgae strategy.
REFERENCES
[1] [1] J.M.Marchetti, V.U. Miguel, A.F. Errazu, “Possible methods for biodiesel production”, Renewable and Sustainable Energy Reviews, 2007, 11, 1300–1311.
[2] [2] Abd Ellatif Mohamed Hussian, The Role of Microalgae in Renewable Energy Production: Challenges and Opportunities”, Chapter - 12, 2018, 257-283.
[3] [3] W. Wilson, Brand J., “ Principles of bioprospecting for microalgae”, In Proceedings of the Algae Biomass Summit, Orlando, FL, USA, 30,2013, September–3 October .
[4] [4] B. Srensen, S. Njakou , D. Blumberga, “Gaseous Fuels Biomass. Proceedings”, 2006, World Renewable Energy Congress IX. WREN, London.
[5] [5] J. Speight, (2011).The Biofuels Handbook. London, United Kingdom: Royal Society of Chemistry, 2011.
[6] [6]U. Schuchardta , R. Serchelia , R. Vargas, “Transesterification of vegetable oils: A review”, Journal of the Brazilian Chemical Society, 1998, 9,199-210.
[7] [7] F. Ma, M. Hanna , “Biodiesel production: A review”, Bioresource Technology, 1999, 70, 1-15.
[8] [8] C. Stavarache, M. Vinatoru, R. Nishimura ,Y. Maed Y., “Fatty acids methyl esters from vegetable oil by means of ultrasonic energy”, Ultrasonics Sonochemistry, 2005, 12, 367-372.
[9] [9] Amin Talebian-Kiakalaieh, Nor AishahSaidina Amin , HosseinMazaheri, A review on novel processes of biodiesel production from waste cooking Oil”, Applied Energy, 2013,104, 683–710.
[10] [10] Y.Chisti, “Biodiesel production from microalgae”, Biotechnol Adv, 2007, 25 (3), 294–306.
[11] [11] Kasturi Dutta, Achlesh Daverey, Jih-Gaw Lin, “Evolution retrospective for alternative fuels: First to fourth generation”, Renewable Energy, 2014, 69, 114-122.
[12] [12] E. Suali , R. Sarbatly R.,”Conversion of microalgae to biofuel”, Renew Sust Energ Rev,2012, 16,4316-42.
[13] [13] J. Singh, S. Gu, “Commercialization potential of microalgae for biofuels production”, Renew Sust Energ Rev, 2012, 14, 2596-610.
[14] [14] L. Rodolfi, G.C. Zittelli, N. Bassi, G. Padovani, N. Biondi, G. Bonini, “Microalgae for oil: strain selection, induction of lipid synthesis and outdoor mass cultivation in a low-cost photobioreactor”, Biotechnol Bioeng, 2008, 102(1),100-12.
[15] [15] E.I. Lan, J.C. Liao J.C, “Metabolic engineering of cyanobacteria for 1-butanol production from carbon dioxide, Metab Eng, 2011, 13(4),353-63.
[16] [16] Eva-Mari Aro, “From first generation biofuels to advanced solar biofuels”, Ambio,2016, 45(Suppl.1):S24–S31DOI 10.1007/s13280-015-0730-0.
[17] [17] S.G. Hays, D.C. Ducat, ” Engineering cyanobacteria as photosynthetic feedstock factories”, Photosynthesis Research, 2015,123, 285–295.
[18] [18] M.Teresa , Mata ., A. Anto´ nio, Martins, S. Nidia, Caetano, (2010). “Microalgae for biodiesel production and other applications: A review”, Renewable and Sustainable Energy Reviews, 2010,14, 217–232.
[19] [19] Eyasu ShumbuloShuba, DemekeKifle, ” Microalgae to biofuels: ‘Promising’ alternative and renewable energy Review”, Renewable and Sustainable Energy Reviews, 2018, 81, 743–755.
[20] [20] J.Sheehan, T. Dunahay ,J. Benemann , P. Roessler, ”A look back at the U.S. Department of Energy’s Aquatic Species Program—biodiesel from algae”, National Renewable Energy Laboratory,1998.
[21] [21] C. Ratledge, Z. Cohen, “Feature: microbial and algal oils: Do they have a future for biodiesel or as commodity oils?”, Lipid Technol, 2008, 7, 155- 160.
[22] [22] C.G. Dismukes , D. Carrieri, N. Bennette , G.M. Ananyev , M.C. Posewitz , ”Aquatic phototrophs: efficient alternatives to land-based crops for biofuels”, Curr Opin Biotechnol, 2008, 19, 235–40.
[23] [23] S. Atsumi, W. Higashide , J.C. Liao, “Direct photosynthetic recycling of carbon dioxide to isobutyraldehyde”, Nat Biotechnol, 2009,27,1177–80.
AUTHORS
First Author – M.Tech. HusamTalibAl Shammari, M.Tech
Scholar, Department of Chemical Engineering,
AUCE(A),Andhra University, Visakhapatnam, Andhra
Pradesh,India., [email protected]
Second Author – Dr.Santhosh kumar, Assistant Professor
(UGC),Department of Chemical Engineering, AUCE(A),Andhra
University, Visakhapatnam, Andhra Pradesh, India.
Third Author – Dr. Sridevi, Prof. V.Sridevi, Department of
Chemical Engineering, Andhra University, Visakhapatnam,
Andhra Pradesh, India., [email protected]

International Journal of Scientific and Research Publications, Volume 10, Issue 1, January 2020 734
ISSN 2250-3153
http://dx.doi.org/10.29322/IJSRP.10.01.2020.p97106 www.ijsrp.org
Fourth Author – Padala Satish kumar, B.Tech, Department of
Chemical Engineering, AUCE(A),Andhra University,
Visakhapatnam, Andhra Pradesh, India.,
Fifth Author – K.P.C. Ravi kiran, B.Tech, Department of
Chemical Engineering, AUCE(A),Andhra University,
Visakhapatnam, Andhra Pradesh, India.

International Journal of Scientific and Research Publications, Volume 10, Issue 1, January 2020 735
ISSN 2250-3153
http://dx.doi.org/10.29322/IJSRP.10.01.2020.p97107 www.ijsrp.org
Food Waste: Waste or Resource? Current Practices
and Status
Ithabeleng Anna Moleli*, Bing WU, Jianglin CAO, Ahyana Maxine Bowen, Fangnon Firmin Fangninou, Tchamo
Joaquim Minnuse
College of Environmental Science and Engineering
UNEP-Tongji Institute of Environment for Sustainable Development
Tongji University
DOI: 10.29322/IJSRP.10.01.2020.p97107
http://dx.doi.org/10.29322/IJSRP.10.01.2020.p97107
Abstract- Waste management has become a global concern for
both developed and developing countries. Food waste (FW)
causes tremendous environmental, economic, and great social
influence, thus studies on food waste are essential and meanwhile
very complex according to Food and Agriculture Organization of
the United Nation. Countries have adopted different methods and
technologies for both treatment and disposal of food waste from
landfilling, composting, incineration and anaerobic digestion
(AD). However, recently the first three methods have been
questioned in terms of their environmental sustainability. This
paper attempts to study AD of FW as a sustainable technology for
treatment of FW and resource recovery in China and its current
status and achievements in terms of answering environmental and
economic challenges. It also intends to explore FW status in
Lesotho as one of the developing countries with waste
management difficulties and how it can also adopt the use of this
technology to manage environmental pollution and waste of
resources. Recently, China has also been exploring Life Circle
Assessment (LCA) of FW as an alternative and more sustainable
tool for evaluating and assessing environmental, social and
economic impacts of waste treatment technologies. It’s becoming
more popular as it’s proven through research to capture the cause-
effect relationships between resource consumption and the
environmental impacts of a specific service or manufacturing
procedure. Adopting FW treatment technologies that allows FW
to be used as energy substitute could be beneficial to all.
Sensitizing communities on the importance of waste separation
from source and the possible derived benefits and the negative
impacts of not sustainably managing and treating waste is of great
importance.
Index Terms- Food Waste, Anaerobic Digestion, Life Circle
Assessment, Lesotho
I. INTRODUCTION
W is one of the largest and most important components of
municipal solid waste. This includes household FW, food-
processing waste, and canteen and restaurant waste which are
being generated at an amazingly high rate. The mounting of FW
has gradually become a global concern [1]. It is estimated that the
amount of FW will dramatically increase from 2.78 to 4.16 billion
tons in Asian countries by 2025 [2].This is more evident in
countries like China where the growth rate of FW has increased
more than 10% with the acceleration of industrial development
and urbanization processes [3].Sustainable management of
increasing amounts of this waste has therefore become a major
social, economic and environmental concern. Improper FW
management leads to substantial negative environmental impacts
such as air, soil, water pollution, and health safety issues [4].
Landfill space is also becoming very scare and countries are
therefore looking for more alternative methods of dealing with the
ever increasing amounts of FW [5]. Food safety issues frequently
occur due to incomplete FW management systems. Its disposal is
attracting widespread attention in many countries and has become
a major environmental concern and one of the major components
of waste around the globe [6, 7].
Some define FW as a left-over organic matter from
restaurants, hotels and households [8] which is a useful source of
fertilizer and biofuel [9]. A nutrient with high levels of
carbohydrates, lipids, proteins, and other organic molecules which
can support abundant populations of microorganisms [10]. AD,
landfill, incineration, and composting are the most commonly used
treatment technologies for FW. However, high organic matter and
the water content in FW [11], are the main causes for harmful
elements in landfills. Currently, the need for alternative and
energetically more efficient ways of treating FW seems to be a
global goal. AD of FW has demonstrated to be one of the most
advantageous technologies to maximize the substrate and energy
recovery [11].
II. ANAEROBIC DIGESTION OF FOOD WASTE IN CHINA
Anaerobic treatment provides a method of reducing
pollution from agricultural and industrial operations while at the
same time it balances the operations usage of fossil fuels [5]. AD is
considered one of the oldest and well-studied sustainable
biological treatment technologies for stabilization and reduction
of organic wastes, including fruit and vegetable processing wastes,
packinghouse wastes, industrial organic wastes, and agricultural
wastes, especially the sewage sludge [12]. It is one of the most
efficient waste and waste-water treatment technologies. It has
been widely used for the treatment of municipal sludge and limited
application in the treatment of organic industrial wastes [5].
F
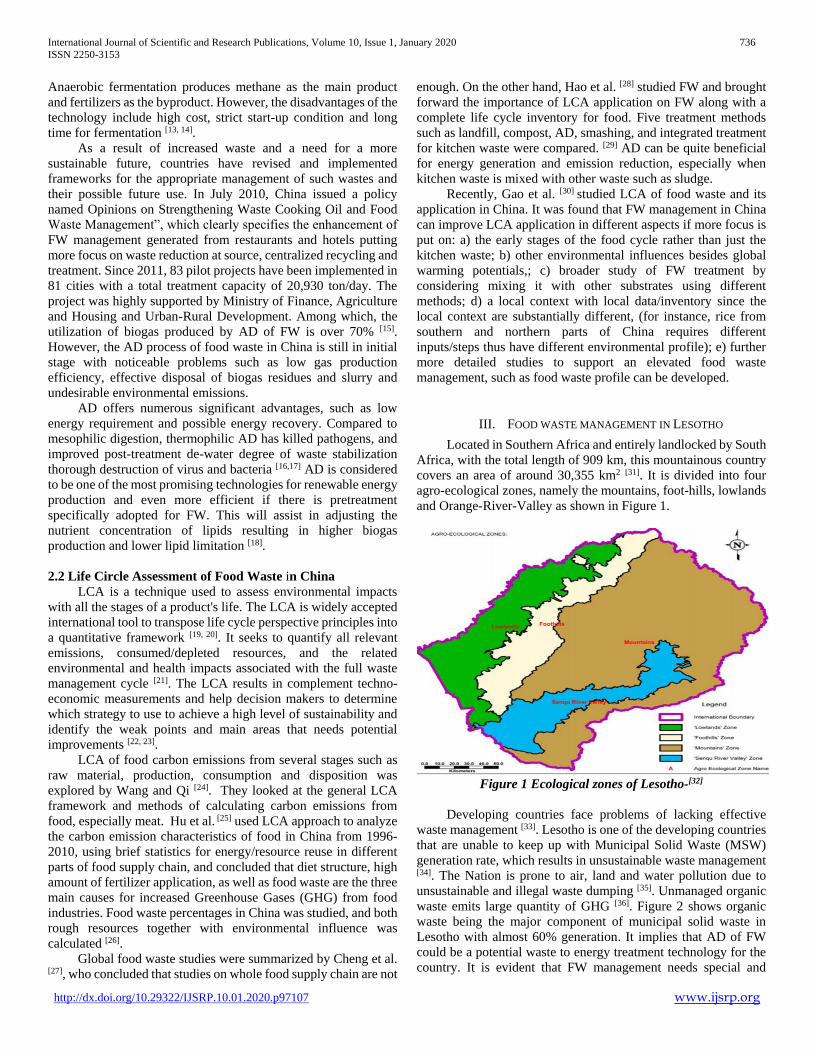
International Journal of Scientific and Research Publications, Volume 10, Issue 1, January 2020 736
ISSN 2250-3153
http://dx.doi.org/10.29322/IJSRP.10.01.2020.p97107 www.ijsrp.org
Anaerobic fermentation produces methane as the main product
and fertilizers as the byproduct. However, the disadvantages of the
technology include high cost, strict start-up condition and long
time for fermentation [13, 14].
As a result of increased waste and a need for a more
sustainable future, countries have revised and implemented
frameworks for the appropriate management of such wastes and
their possible future use. In July 2010, China issued a policy
named Opinions on Strengthening Waste Cooking Oil and Food
Waste Management”, which clearly specifies the enhancement of
FW management generated from restaurants and hotels putting
more focus on waste reduction at source, centralized recycling and
treatment. Since 2011, 83 pilot projects have been implemented in
81 cities with a total treatment capacity of 20,930 ton/day. The
project was highly supported by Ministry of Finance, Agriculture
and Housing and Urban-Rural Development. Among which, the
utilization of biogas produced by AD of FW is over 70% [15].
However, the AD process of food waste in China is still in initial
stage with noticeable problems such as low gas production
efficiency, effective disposal of biogas residues and slurry and
undesirable environmental emissions.
AD offers numerous significant advantages, such as low
energy requirement and possible energy recovery. Compared to
mesophilic digestion, thermophilic AD has killed pathogens, and
improved post-treatment de-water degree of waste stabilization
thorough destruction of virus and bacteria [16,17] AD is considered
to be one of the most promising technologies for renewable energy
production and even more efficient if there is pretreatment
specifically adopted for FW. This will assist in adjusting the
nutrient concentration of lipids resulting in higher biogas
production and lower lipid limitation [18].
2.2 Life Circle Assessment of Food Waste in China
LCA is a technique used to assess environmental impacts
with all the stages of a product's life. The LCA is widely accepted
international tool to transpose life cycle perspective principles into
a quantitative framework [19, 20]. It seeks to quantify all relevant
emissions, consumed/depleted resources, and the related
environmental and health impacts associated with the full waste
management cycle [21]. The LCA results in complement techno-
economic measurements and help decision makers to determine
which strategy to use to achieve a high level of sustainability and
identify the weak points and main areas that needs potential
improvements [22, 23].
LCA of food carbon emissions from several stages such as
raw material, production, consumption and disposition was
explored by Wang and Qi [24]. They looked at the general LCA
framework and methods of calculating carbon emissions from
food, especially meat. Hu et al. [25] used LCA approach to analyze
the carbon emission characteristics of food in China from 1996-
2010, using brief statistics for energy/resource reuse in different
parts of food supply chain, and concluded that diet structure, high
amount of fertilizer application, as well as food waste are the three
main causes for increased Greenhouse Gases (GHG) from food
industries. Food waste percentages in China was studied, and both
rough resources together with environmental influence was
calculated [26].
Global food waste studies were summarized by Cheng et al.
[27], who concluded that studies on whole food supply chain are not
enough. On the other hand, Hao et al. [28] studied FW and brought
forward the importance of LCA application on FW along with a
complete life cycle inventory for food. Five treatment methods
such as landfill, compost, AD, smashing, and integrated treatment
for kitchen waste were compared. [29] AD can be quite beneficial
for energy generation and emission reduction, especially when
kitchen waste is mixed with other waste such as sludge.
Recently, Gao et al. [30] studied LCA of food waste and its
application in China. It was found that FW management in China
can improve LCA application in different aspects if more focus is
put on: a) the early stages of the food cycle rather than just the
kitchen waste; b) other environmental influences besides global
warming potentials,; c) broader study of FW treatment by
considering mixing it with other substrates using different
methods; d) a local context with local data/inventory since the
local context are substantially different, (for instance, rice from
southern and northern parts of China requires different
inputs/steps thus have different environmental profile); e) further
more detailed studies to support an elevated food waste
management, such as food waste profile can be developed.
III. FOOD WASTE MANAGEMENT IN LESOTHO
Located in Southern Africa and entirely landlocked by South
Africa, with the total length of 909 km, this mountainous country
covers an area of around 30,355 km2 [31]. It is divided into four
agro-ecological zones, namely the mountains, foot-hills, lowlands
and Orange-River-Valley as shown in Figure 1.
Figure 1 Ecological zones of Lesotho-[32]
Developing countries face problems of lacking effective
waste management [33]. Lesotho is one of the developing countries
that are unable to keep up with Municipal Solid Waste (MSW)
generation rate, which results in unsustainable waste management [34]. The Nation is prone to air, land and water pollution due to
unsustainable and illegal waste dumping [35]. Unmanaged organic
waste emits large quantity of GHG [36]. Figure 2 shows organic
waste being the major component of municipal solid waste in
Lesotho with almost 60% generation. It implies that AD of FW
could be a potential waste to energy treatment technology for the
country. It is evident that FW management needs special and
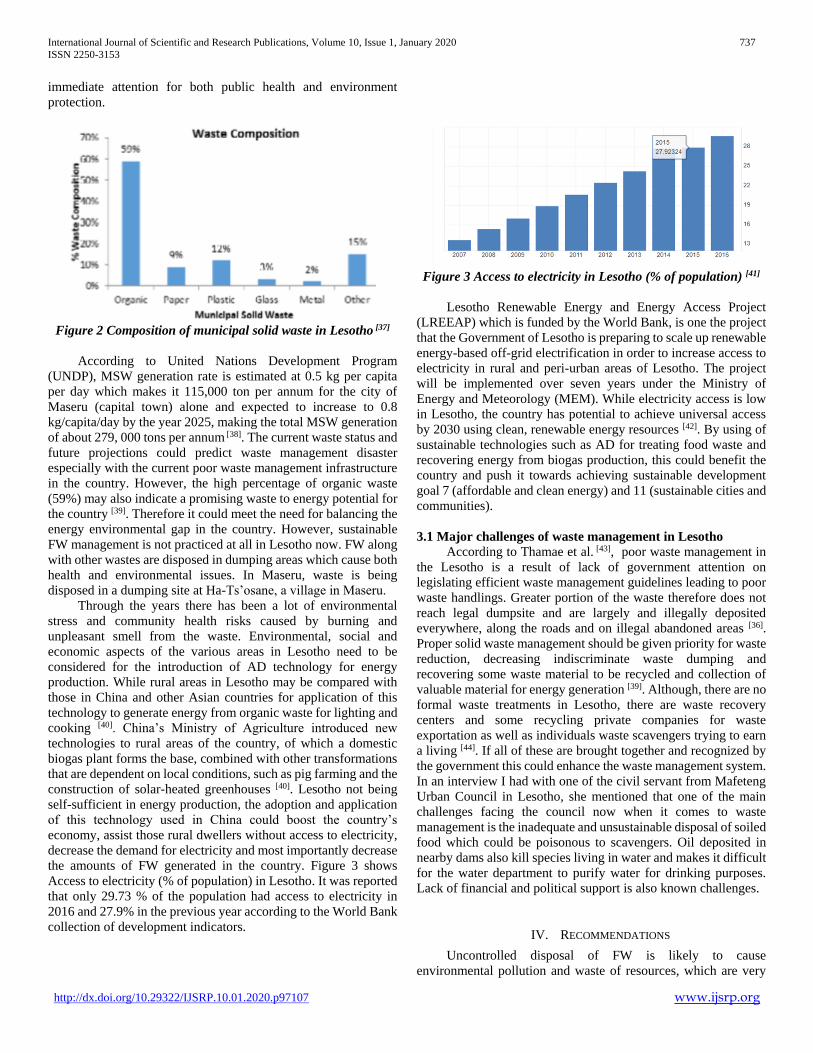
International Journal of Scientific and Research Publications, Volume 10, Issue 1, January 2020 737
ISSN 2250-3153
http://dx.doi.org/10.29322/IJSRP.10.01.2020.p97107 www.ijsrp.org
immediate attention for both public health and environment
protection.
Figure 2 Composition of municipal solid waste in Lesotho [37]
According to United Nations Development Program
(UNDP), MSW generation rate is estimated at 0.5 kg per capita
per day which makes it 115,000 ton per annum for the city of
Maseru (capital town) alone and expected to increase to 0.8
kg/capita/day by the year 2025, making the total MSW generation
of about 279, 000 tons per annum [38]. The current waste status and
future projections could predict waste management disaster
especially with the current poor waste management infrastructure
in the country. However, the high percentage of organic waste
(59%) may also indicate a promising waste to energy potential for
the country [39]. Therefore it could meet the need for balancing the
energy environmental gap in the country. However, sustainable
FW management is not practiced at all in Lesotho now. FW along
with other wastes are disposed in dumping areas which cause both
health and environmental issues. In Maseru, waste is being
disposed in a dumping site at Ha-Ts’osane, a village in Maseru.
Through the years there has been a lot of environmental
stress and community health risks caused by burning and
unpleasant smell from the waste. Environmental, social and
economic aspects of the various areas in Lesotho need to be
considered for the introduction of AD technology for energy
production. While rural areas in Lesotho may be compared with
those in China and other Asian countries for application of this
technology to generate energy from organic waste for lighting and
cooking [40]. China’s Ministry of Agriculture introduced new
technologies to rural areas of the country, of which a domestic
biogas plant forms the base, combined with other transformations
that are dependent on local conditions, such as pig farming and the
construction of solar-heated greenhouses [40]. Lesotho not being
self-sufficient in energy production, the adoption and application
of this technology used in China could boost the country’s
economy, assist those rural dwellers without access to electricity,
decrease the demand for electricity and most importantly decrease
the amounts of FW generated in the country. Figure 3 shows
Access to electricity (% of population) in Lesotho. It was reported
that only 29.73 % of the population had access to electricity in
2016 and 27.9% in the previous year according to the World Bank
collection of development indicators.
Figure 3 Access to electricity in Lesotho (% of population) [41]
Lesotho Renewable Energy and Energy Access Project
(LREEAP) which is funded by the World Bank, is one the project
that the Government of Lesotho is preparing to scale up renewable
energy-based off-grid electrification in order to increase access to
electricity in rural and peri-urban areas of Lesotho. The project
will be implemented over seven years under the Ministry of
Energy and Meteorology (MEM). While electricity access is low
in Lesotho, the country has potential to achieve universal access
by 2030 using clean, renewable energy resources [42]. By using of
sustainable technologies such as AD for treating food waste and
recovering energy from biogas production, this could benefit the
country and push it towards achieving sustainable development
goal 7 (affordable and clean energy) and 11 (sustainable cities and
communities).
3.1 Major challenges of waste management in Lesotho
According to Thamae et al. [43], poor waste management in
the Lesotho is a result of lack of government attention on
legislating efficient waste management guidelines leading to poor
waste handlings. Greater portion of the waste therefore does not
reach legal dumpsite and are largely and illegally deposited
everywhere, along the roads and on illegal abandoned areas [36].
Proper solid waste management should be given priority for waste
reduction, decreasing indiscriminate waste dumping and
recovering some waste material to be recycled and collection of
valuable material for energy generation [39]. Although, there are no
formal waste treatments in Lesotho, there are waste recovery
centers and some recycling private companies for waste
exportation as well as individuals waste scavengers trying to earn
a living [44]. If all of these are brought together and recognized by
the government this could enhance the waste management system.
In an interview I had with one of the civil servant from Mafeteng
Urban Council in Lesotho, she mentioned that one of the main
challenges facing the council now when it comes to waste
management is the inadequate and unsustainable disposal of soiled
food which could be poisonous to scavengers. Oil deposited in
nearby dams also kill species living in water and makes it difficult
for the water department to purify water for drinking purposes.
Lack of financial and political support is also known challenges.
IV. RECOMMENDATIONS
Uncontrolled disposal of FW is likely to cause
environmental pollution and waste of resources, which are very

International Journal of Scientific and Research Publications, Volume 10, Issue 1, January 2020 738
ISSN 2250-3153
http://dx.doi.org/10.29322/IJSRP.10.01.2020.p97107 www.ijsrp.org
crucial issues in the world today [3]. The considerable contribution
of food industry to the climate change cannot be ignored specially
by the policy makers. According to Garnett, Hartmann and Ahring [45, 46], the GHG emissions from food supply chain are produced
during all stages of the food production and consumption. Besides,
for developed countries, food supply chain contributes between
15% and 28% to overall national emissions. All stakeholders
within the food industry must responsibly consider this during the
food supply chain. In recent years, this concern became a major
driving force to reduce the volume of FW as well as evaluating it
as a renewable feed-stock for the production of energy and
chemicals.
FW involves a substantial amount of biomass material that
makes it possible to use for the biofuels. As a result of high amount
of organic material, the management of food wastes must focus on
certain difficulties such as high water content, and fragile
biological stability. Adopting FW treatment technologies that
allows FW to be used as energy substitute could be beneficial to
all. Sensitizing communities on the importance of waste
separation from source and the possible derived benefits and the
negative impacts of not sustainably managing and treating waste
is of great importance. Millions of households in China are already
using biogas. Livestock and poultry farm waste as well as
household waste are the feed sources for the digesters. The biogas
plants are mainly situated in farming communities where they
serve a dual need: the reduction in organic waste and the supply of
biogas as an energy source in areas where no energy was
previously available. Lesotho being one of the African developing
countries whose economy depends heavily on agriculture,
theoretically, department of Agriculture can apply this example
from rural China for improving farming communities in the rural
areas for biogas and created fertilizer to supply nutrients and
organics to the soil.
V. CONCLUSION
FW is considered a sustainable energy source due to its
biomass features. Based on ongoing and previous literature, FW
could be the answer to energy problems and not a problem on its
own if well managed. Profoundly, it has been noted that the costs
of managing waste are very high [47] but unsustainable
management or no management at all can even be more costly.
However, sustainable FW technologies should take center stage
especially for countries like Lesotho where there are not even
basic proper sanitary Landfills for general waste management
regardless of the increasing amounts of municipal waste coupled
with the low percentages of access to electricity. FW is an
untapped resource and there are no LCA studies on FW reported
in Lesotho by far. Therefore, it is crucial for future researchers to
explore and unlock future potential of FW as well as assess and
evaluate its environmental, social and economic impacts.
REFERENCES
[1] Capson, G., Trably, E., Rouez, M., Crest, M, Dry anaerobic digestion of food waste and cardboard at different substrate loads, solid contents and co-digestion proportions. Bioresource technology, 2017. 233: p. 166-175.
[2] Melikoglu, M., C. Lin, and C. Webb, Analysing global food waste problem: pinpointing the facts and estimating the energy content. Open Engineering, 2013. 3(2): p. 157-164.
[3] Zhang, C., Su, H., Baeyenes, J., Tan, T, Reviewing the anaerobic digestion of food waste for biogas production. Renewable and Sustainable Energy Reviews, 2014. 38: p. 383-392.
[4] Yay, A.S.E., Application of life cycle assessment (LCA) for municipal solid waste management: a case study of Sakarya. Journal of Cleaner Production, 2015. 94: p. 284-293.
[5] Chen, Y., J.J. Cheng, and K.S. Creamer, Inhibition of anaerobic digestion process: a review. Bioresource technology, 2008. 99(10): p. 4044-4064.
[6] Girotto, F., L. Alibardi, and R. Cossu, Food waste generation and industrial uses: a review. Waste management, 2015. 45: p. 32-41.
[7] Li, Y., Zhang, R., Liu, X., Chen, C., Xiao, X., Feng, L, Evaluating methane production from anaerobic mono-and co-digestion of kitchen waste, corn stover, and chicken manure. Energy & Fuels, 2013. 27(4): p. 2085-2091.
[8] Li R, Chen S, Li X, Lar JS, He Y, Zhu B. Anaerobic Co digestion of kitchen waste with cattle manure for biogas production. Energy and Fuels. 2009. 23:2225-2228.
[9] Ma H, Wang Q, Qian D, Gong L, Zhang W. The utilization of acid-tolerant bacteria on ethanol production from kitchen garbage. Renewable Energy. 2009. 34:1466-1470.
[10] Wang Q, Yamabe K, Narita J, Morishita M, Ohsumi Y, Kusano K, Shirai Y, Ogawa HI. Suppression of growth of putrefactive and food poisoning bacteria by lactic acid fermentation of kitchen waste. Process Biochemistry. 2001. 37:351-357.
[11] Ecke, H. and M. Svensson, Mobility of organic carbon from incineration residues. Waste management, 2008. 28(8): p. 1301-1309.
[12] Pham, T.P.T., Kaushik, R., Parshetti, GK., Mahmood, R, Food waste-to-energy conversion technologies: current status and future directions. Waste Management, 2015. 38: p. 399-408.
[13] Zhang, J., Li, W., Luo, J., Dai, Y., Tong, YW, Enhancement of biogas production in anaerobic co-digestion of food waste and waste activated sludge by biological co-pretreatment. Energy, 2017. 137: p. 479-486.
[14] Hartmann, H. and B.K. Ahring, Strategies for the anaerobic digestion of the organic fraction of municipal solid waste: an overview. Water science and technology, 2006. 53(8): p. 7-22.
[15] Yin, Y.,Liu, YJ., Meng, SJ., Kiran, EU., Liu, Y, Enzymatic pretreatment of activated sludge, food waste and their mixture for enhanced bioenergy recovery and waste volume reduction via anaerobic digestion. Applied energy, 2016. 179: p. 1131-1137.
[16] Chen, T.C. and C.F. Lin, Greenhouse gases emissions from waste management practices using Life Cycle Inventory model. Journal of Hazardous Materials, 2008. 155(1-2): p. 23-31.
[17] Yuan, H. and N. Zhu, Progress in inhibition mechanisms and process control of intermediates and by-products in sewage sludge anaerobic digestion. Renewable and Sustainable Energy Reviews, 2016. 58: p. 429-438.
[18] Girotto, F., L. Alibardi, and R. Cossu, Food waste generation and industrial uses: a review. Waste management, 2015. 45: p. 32-41.
[19] Campuzano, R. and González-Martínez, S. Characteristics of the organic fraction of municipal solid waste and methane production: A review. Waste Management, 2016. 54: p. 3-12.
[20] Appels, L., Lauwers, J., Degreve, J., Helsen, L, Anaerobic digestion in global bio-energy production: potential and research challenges. Renewable and Sustainable Energy Reviews, 2011. 15(9): p. 4295-4301.
[21] Kirkeby, J.T., Birgisdottir, H., Hansen, TL, Environmental assessment of solid waste systems and technologies: EASEWASTE. Waste Management & Research, 2006. 24(1): p. 3-15.
[22] Chen, Y., Luo, J., Yan, Y., Feng, L, Enhanced production of short-chain fatty acid by co-fermentation of waste activated sludge and kitchen waste under alkaline conditions and its application to microbial fuel cells. Applied energy, 2013. 102: p. 1197-1204.
[23] Gao SM, Huang Y, Yang LL, Wang H, Zhao MX, Xu ZY, Huang ZX, Ruan WQ, Evaluation the anaerobic digestion performance of solid residual kitchen waste by NaHCO 3 buffering. Energy Conversion and Management, 2015. 93: p. 166-174.
[24] Ma Aijin, Zhao Haizhen. Study on carbon emission assessment of food life cycle. Food industry science and technology, 2011 (9):461-463.
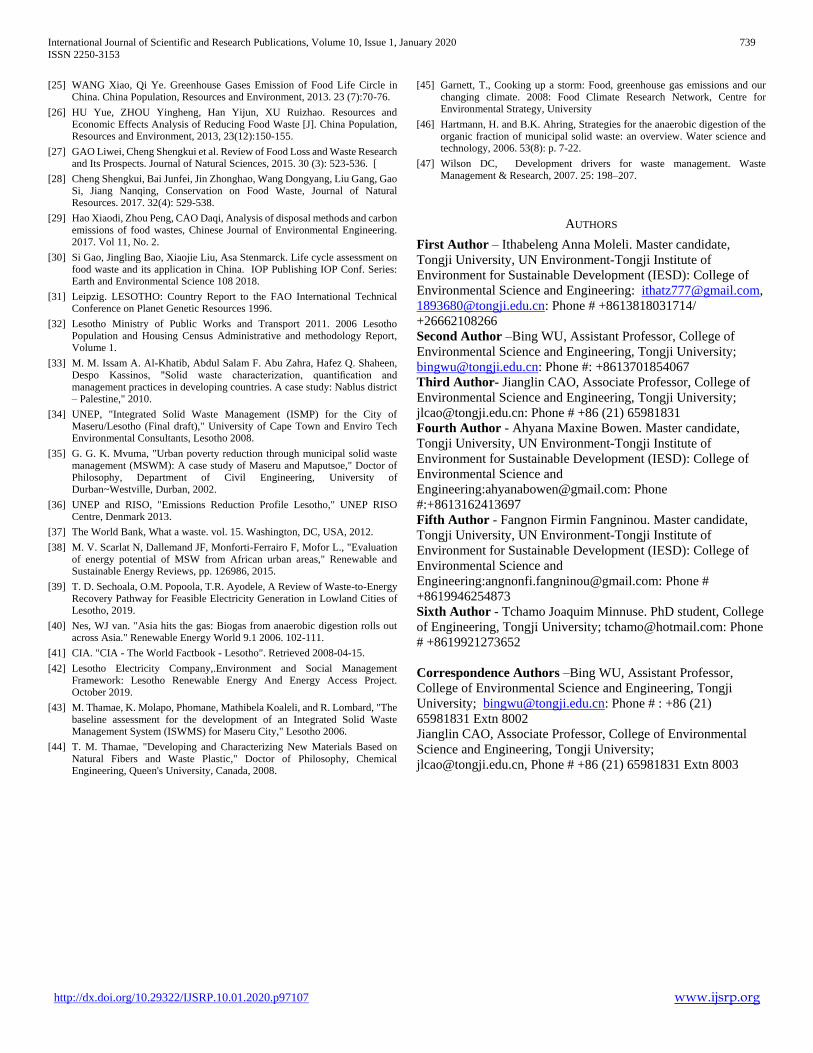
International Journal of Scientific and Research Publications, Volume 10, Issue 1, January 2020 739
ISSN 2250-3153
http://dx.doi.org/10.29322/IJSRP.10.01.2020.p97107 www.ijsrp.org
[25] WANG Xiao, Qi Ye. Greenhouse Gases Emission of Food Life Circle in China. China Population, Resources and Environment, 2013. 23 (7):70-76.
[26] HU Yue, ZHOU Yingheng, Han Yijun, XU Ruizhao. Resources and Economic Effects Analysis of Reducing Food Waste [J]. China Population, Resources and Environment, 2013, 23(12):150-155.
[27] GAO Liwei, Cheng Shengkui et al. Review of Food Loss and Waste Research and Its Prospects. Journal of Natural Sciences, 2015. 30 (3): 523-536. [
[28] Cheng Shengkui, Bai Junfei, Jin Zhonghao, Wang Dongyang, Liu Gang, Gao Si, Jiang Nanqing, Conservation on Food Waste, Journal of Natural Resources. 2017. 32(4): 529-538.
[29] Hao Xiaodi, Zhou Peng, CAO Daqi, Analysis of disposal methods and carbon emissions of food wastes, Chinese Journal of Environmental Engineering. 2017. Vol 11, No. 2.
[30] Si Gao, Jingling Bao, Xiaojie Liu, Asa Stenmarck. Life cycle assessment on food waste and its application in China. IOP Publishing IOP Conf. Series: Earth and Environmental Science 108 2018.
[31] Leipzig. LESOTHO: Country Report to the FAO International Technical Conference on Planet Genetic Resources 1996.
[32] Lesotho Ministry of Public Works and Transport 2011. 2006 Lesotho Population and Housing Census Administrative and methodology Report, Volume 1.
[33] M. M. Issam A. Al-Khatib, Abdul Salam F. Abu Zahra, Hafez Q. Shaheen, Despo Kassinos, "Solid waste characterization, quantification and management practices in developing countries. A case study: Nablus district – Palestine," 2010.
[34] UNEP, "Integrated Solid Waste Management (ISMP) for the City of Maseru/Lesotho (Final draft)," University of Cape Town and Enviro Tech Environmental Consultants, Lesotho 2008.
[35] G. G. K. Mvuma, "Urban poverty reduction through municipal solid waste management (MSWM): A case study of Maseru and Maputsoe," Doctor of Philosophy, Department of Civil Engineering, University of Durban~Westville, Durban, 2002.
[36] UNEP and RISO, "Emissions Reduction Profile Lesotho," UNEP RISO Centre, Denmark 2013.
[37] The World Bank, What a waste. vol. 15. Washington, DC, USA, 2012.
[38] M. V. Scarlat N, Dallemand JF, Monforti-Ferrairo F, Mofor L., "Evaluation of energy potential of MSW from African urban areas," Renewable and Sustainable Energy Reviews, pp. 126986, 2015.
[39] T. D. Sechoala, O.M. Popoola, T.R. Ayodele, A Review of Waste-to-Energy Recovery Pathway for Feasible Electricity Generation in Lowland Cities of Lesotho, 2019.
[40] Nes, WJ van. "Asia hits the gas: Biogas from anaerobic digestion rolls out across Asia." Renewable Energy World 9.1 2006. 102-111.
[41] CIA. "CIA - The World Factbook - Lesotho". Retrieved 2008-04-15.
[42] Lesotho Electricity Company,.Environment and Social Management Framework: Lesotho Renewable Energy And Energy Access Project. October 2019.
[43] M. Thamae, K. Molapo, Phomane, Mathibela Koaleli, and R. Lombard, "The baseline assessment for the development of an Integrated Solid Waste Management System (ISWMS) for Maseru City," Lesotho 2006.
[44] T. M. Thamae, "Developing and Characterizing New Materials Based on Natural Fibers and Waste Plastic," Doctor of Philosophy, Chemical Engineering, Queen's University, Canada, 2008.
[45] Garnett, T., Cooking up a storm: Food, greenhouse gas emissions and our changing climate. 2008: Food Climate Research Network, Centre for Environmental Strategy, University
[46] Hartmann, H. and B.K. Ahring, Strategies for the anaerobic digestion of the organic fraction of municipal solid waste: an overview. Water science and technology, 2006. 53(8): p. 7-22.
[47] Wilson DC, Development drivers for waste management. Waste Management & Research, 2007. 25: 198–207.
AUTHORS
First Author – Ithabeleng Anna Moleli. Master candidate,
Tongji University, UN Environment-Tongji Institute of
Environment for Sustainable Development (IESD): College of
Environmental Science and Engineering: [email protected],
[email protected]: Phone # +8613818031714/
+26662108266
Second Author –Bing WU, Assistant Professor, College of
Environmental Science and Engineering, Tongji University;
[email protected]: Phone #: +8613701854067
Third Author- Jianglin CAO, Associate Professor, College of
Environmental Science and Engineering, Tongji University;
[email protected]: Phone # +86 (21) 65981831
Fourth Author - Ahyana Maxine Bowen. Master candidate,
Tongji University, UN Environment-Tongji Institute of
Environment for Sustainable Development (IESD): College of
Environmental Science and
Engineering:[email protected]: Phone
#:+8613162413697
Fifth Author - Fangnon Firmin Fangninou. Master candidate,
Tongji University, UN Environment-Tongji Institute of
Environment for Sustainable Development (IESD): College of
Environmental Science and
Engineering:[email protected]: Phone #
+8619946254873
Sixth Author - Tchamo Joaquim Minnuse. PhD student, College
of Engineering, Tongji University; [email protected]: Phone
# +8619921273652
Correspondence Authors –Bing WU, Assistant Professor,
College of Environmental Science and Engineering, Tongji
University; [email protected]: Phone # : +86 (21)
65981831 Extn 8002
Jianglin CAO, Associate Professor, College of Environmental
Science and Engineering, Tongji University;
[email protected], Phone # +86 (21) 65981831 Extn 8003
Related Documents