International Journal of Innovative Research in Advanced Engineering (IJIRAE) ISSN: 2349-2163 Volume 1 Issue 10 (November 2014) www.ijirae.com ____________________________________________________________________________________________________ © 2014, IJIRAE- All Rights Reserved Page -146 A modified PSS Filter for an objective image Quality enhancement of noisy images T.Sankara Rao Prof.Prasad Reddy.P.V.G.D G.Srinivas Ch.V.M.K.Hari Associate.Prof Professor Asst.Prof Lecturer GIT,Gitam University Andhra University GIT,Gitam Govt.College for Men Abstract— A problem of fundamental importance in image processing is edge detection since an edge characterizes the boundaries. Due to limitations of the existing techniques finding a better method for edge detection is still an active area of research. The disagreeable properties perverted in the image are called noise. During image acquisition and transmission abundant factors accountable for noise. The most important humiliating attribute of an image is noise, which may become obvious during image capturing, communication or processing and may conceivably be reliant on or sovereign of image. In order to supplement the high-frequency components in this paper a new class of filters called PSS filters is proposed which implies spatial filter shape that has a high positive component at the centre. Since restraint of noise can only be achieved by smoothing the image. Sharpening with PSS filters highlights the fine details of an image and enhances the clarity of the image at the boundaries. Since the perception of human of image quality is not adequate some image quality metrics like Mean Square Error (MSE), Peak Signal to Noise Ratio (PSNR), Average Difference (AD), Normalized Absolute Error (NAE), Structural Content (SC), Normalized Cross Correlation (NCC) and Maximum Difference (MD) were employed for measurement of image quality. Experimental results show that the proposed PSS filter displayed better performance and superior noise resilience. The performance of the PSS filter is measured not only on various images but also on images corrupted with various levels of noise. Keywords: image processing, spatial filter, image sharpening, image smoothing, PSS filter, image quality metrics. I. INTRODUCTION An image may be defined as a two dimensional function, f(x, y), where x and y are spatial (Plane) coordinates, and the amplitude at any pair of co-ordinates (x, y) is called the intensity or grey level of the image at that point. Edge detection is one of the most regularly used operations in image analysis, and there is probably supplementary number of algorithms for enhancing and detecting the boundaries of an image in the literature. The rationale for this is that edges form the outline of an object. An edge is the boundary between an object and the background, and indicates the boundary between overlapping objects. All the objects can be positioned and indispensable properties such as shape, area, and perimeter can be measured accurately if the boundaries identified precisely. Since computer vision involves the detection and categorization of objects in an image. Noise is an imperative preventative aspect in image enhancement. Noise steadily effects the image, predominantly when the interaction of noise with the visual sign of the image. Smoothening[2, 3, and 4] helps in lessen counterfeit effects and noise in an image during image acquisition as a corollary of sampling, quantization, communication. There are quite a few algorithms for image smoothing[2, 4] and sharpening. The design of these algorithms is often pricey to intend, implement, as well as calculate with superior performance. The noise captured by an image during acquisition and transmission can be classified as Impulse noise (Salt-and-pepper noise), Amplifier noise (Gaussian noise), Poisson noise, Multiplicative noise (Speckle noise) and Periodic noise. The above said PSS filter is also applied on the images which are corrupted with Speckle noise with variance 0.01, Poisson noise and Gaussian noise Variance 0.01. There are two ways through which image quality can be assessed, Subjective and Objective. The evaluation based on observers is called Subjective which are time consuming and less accurate. Whereas the subsequent method is objective method of testing the image quality based on mathematical calculations [9]. SHARPENING FILTERS The important area in the field of computer vision is edge detection. Edges classify the boundaries flanked by regions in an image an edge is the boundary between an object and the background, and indicates the boundary between overlapping objects [6]. As the colour and brightness values for each pixel are interpolated, some image softening is applied to even out any fuzziness that has occurred. To preserve the impression of depth, clarity and fine details, the image processor must sharpen edges and contours. It therefore must detect edges correctly and reproduce them smoothly and without over-sharpening. Sobel, Prewitt and Laplacian filters are one among the sharpening filters where each point in the image are done convolution with these two kernels. One kernel has a maximum response to the usual vertical edges and the other kernel has a maximum response to the horizontal edge. It is estimated in 8 possible directions and convolution result of greatest magnitude indicates the greatest direction.

Welcome message from author
This document is posted to help you gain knowledge. Please leave a comment to let me know what you think about it! Share it to your friends and learn new things together.
Transcript
International Journal of Innovative Research in Advanced Engineering (IJIRAE) ISSN: 2349-2163 Volume 1 Issue 10 (November 2014) www.ijirae.com
____________________________________________________________________________________________________ © 2014, IJIRAE- All Rights Reserved Page -146
A modified PSS Filter for an objective image Quality enhancement of noisy images
T.Sankara Rao Prof.Prasad Reddy.P.V.G.D G.Srinivas Ch.V.M.K.Hari Associate.Prof Professor Asst.Prof Lecturer GIT,Gitam University Andhra University GIT,Gitam Govt.College for Men
Abstract— A problem of fundamental importance in image processing is edge detection since an edge characterizes the boundaries. Due to limitations of the existing techniques finding a better method for edge detection is still an active area of research. The disagreeable properties perverted in the image are called noise. During image acquisition and transmission abundant factors accountable for noise. The most important humiliating attribute of an image is noise, which may become obvious during image capturing, communication or processing and may conceivably be reliant on or sovereign of image. In order to supplement the high-frequency components in this paper a new class of filters called PSS filters is proposed which implies spatial filter shape that has a high positive component at the centre. Since restraint of noise can only be achieved by smoothing the image. Sharpening with PSS filters highlights the fine details of an image and enhances the clarity of the image at the boundaries. Since the perception of human of image quality is not adequate some image quality metrics like Mean Square Error (MSE), Peak Signal to Noise Ratio (PSNR), Average Difference (AD), Normalized Absolute Error (NAE), Structural Content (SC), Normalized Cross Correlation (NCC) and Maximum Difference (MD) were employed for measurement of image quality. Experimental results show that the proposed PSS filter displayed better performance and superior noise resilience. The performance of the PSS filter is measured not only on various images but also on images corrupted with various levels of noise.
Keywords: image processing, spatial filter, image sharpening, image smoothing, PSS filter, image quality metrics.
I. INTRODUCTION
An image may be defined as a two dimensional function, f(x, y), where x and y are spatial (Plane) coordinates, and the amplitude at any pair of co-ordinates (x, y) is called the intensity or grey level of the image at that point.
Edge detection is one of the most regularly used operations in image analysis, and there is probably supplementary number of algorithms for enhancing and detecting the boundaries of an image in the literature. The rationale for this is that edges form the outline of an object. An edge is the boundary between an object and the background, and indicates the boundary between overlapping objects. All the objects can be positioned and indispensable properties such as shape, area, and perimeter can be measured accurately if the boundaries identified precisely. Since computer vision involves the detection and categorization of objects in an image. Noise is an imperative preventative aspect in image enhancement. Noise steadily effects the image, predominantly when the interaction of noise with the visual sign of the image.
Smoothening[2, 3, and 4] helps in lessen counterfeit effects and noise in an image during image acquisition as a corollary of sampling, quantization, communication. There are quite a few algorithms for image smoothing[2, 4] and sharpening. The design of these algorithms is often pricey to intend, implement, as well as calculate with superior performance.
The noise captured by an image during acquisition and transmission can be classified as Impulse noise (Salt-and-pepper noise), Amplifier noise (Gaussian noise), Poisson noise, Multiplicative noise (Speckle noise) and Periodic noise. The above said PSS filter is also applied on the images which are corrupted with Speckle noise with variance 0.01, Poisson noise and Gaussian noise Variance 0.01.
There are two ways through which image quality can be assessed, Subjective and Objective. The evaluation based on observers is called Subjective which are time consuming and less accurate. Whereas the subsequent method is objective method of testing the image quality based on mathematical calculations [9].
SHARPENING FILTERS The important area in the field of computer vision is edge detection. Edges classify the boundaries flanked by regions in an image an edge is the boundary between an object and the background, and indicates the boundary between overlapping objects [6]. As the colour and brightness values for each pixel are interpolated, some image softening is applied to even out any fuzziness that has occurred. To preserve the impression of depth, clarity and fine details, the image processor must sharpen edges and contours. It therefore must detect edges correctly and reproduce them smoothly and without over-sharpening.
Sobel, Prewitt and Laplacian filters are one among the sharpening filters where each point in the image are done convolution with these two kernels. One kernel has a maximum response to the usual vertical edges and the other kernel has a maximum response to the horizontal edge. It is estimated in 8 possible directions and convolution result of greatest magnitude indicates the greatest direction.

International Journal of Innovative Research in Advanced Engineering (IJIRAE) ISSN: 2349-2163 Volume 1 Issue 10 (November 2014) www.ijirae.com
____________________________________________________________________________________________________ © 2014, IJIRAE- All Rights Reserved Page -147
II. PSS FILTER
PSS operators perform a 2-Dimensional spatial ascent measurement on an image. Typically it can be used to unearth the approximate absolute gradient magnitude in an input gray scale image at every point. This edge detector uses a pair of 3x3 convolution masks, one estimating the gradient in the x-direction (columns) and the other estimating the gradient in the y-direction (rows). The size of a convolution mask is typically much smaller than the actual image. The ensuing image is untrained by sliding mask over an area of the input image, changing that pixel's value and then shifts one pixel to the right and continues until it reaches the end of a row. It then starts at the beginning of the next row. The proposed operators are in the form of a non singular matrix whose determinant is equal to zero.
The Gx mask brightens the edges in the horizontal direction while the Gy mask highlights the edges in the vertical direction. After taking the magnitude of both, the resulting output detects edges in both directions. The value of the gradient of proposed operators (both in X and Y-directions) is positive so it identifies the boundaries clearly. The Gx mask brightens the edges in the horizontal direction while the Gy mask highlights the edges in the vertical direction. After taking the magnitude of both, the resulting output detects edges in both directions. The value of the gradient of proposed operators (both in X and Y-directions) is positive so it identifies the boundaries clearly.
-1 -1 -2
-1 -1 -1
-1 12 -2 -1 12 -2
-1 -2 -2 -2 -2 -2 Gx Gy
Gx= (- (Z1+Z2+Z4+Z7)-2(Z3+Z6+Z8+Z9) +12Z5) Gy= (- (Z1+Z2+Z3+Z4)-( Z6+Z7+Z8+Z9) +12Z5)
The above formula shows the way value of a particular pixel in the output image is calculated. The centre of the mask is placed over the pixel to be manipulated in the image.
PSS FILTER OF 3*3
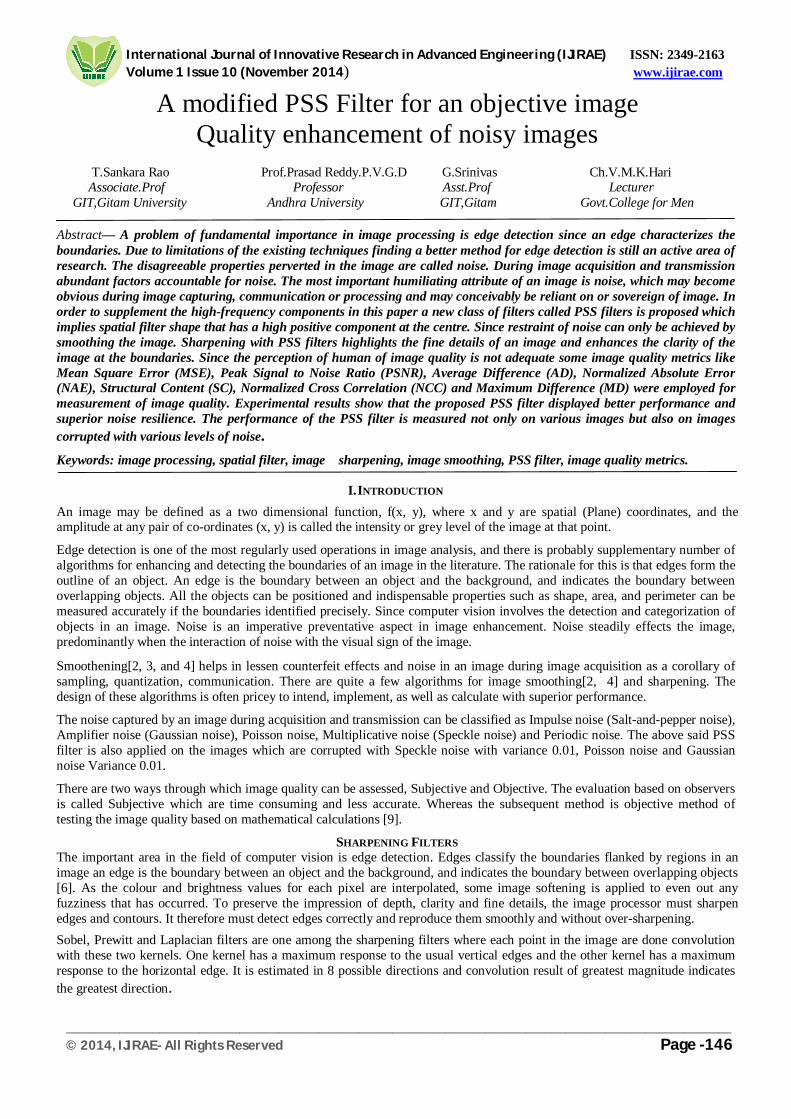
In the present case we use simplest approximations to a first derivative that satisfy the condition in equation [1] is used and the appropriate filter mask may be formulated as:
19273 Z9)+Z8+Z7+ Z6(-Z4)+Z3+Z2+1(512 Z9)+Z8+Z6+Z3(2)7421(512 zzzzzzzzzZf The above equation can be implemented with the two masks and these are referred as PSS – gradient operators.Generalized formula is used to generalize the given filter, but the filter can be generalized only by generalizing the equation i.e in this case it is equation [1]. Later one may increase or decrease the filter size according to quality of the image. In a situation where one has to apply 3*3 filter, then it is needed to divide the image into 3*3 matrixes and then 3*3 PSS mask has to slide over an area of the input image. Changing that pixel's value, and shifting one pixel to the right. It will then continue to the right and moves till the end of a row is reached. It then starts at the beginning of the next row.
The above said PSS filter is also applied on the images which are corrupted with Speckle noise with variance 0.01, Poisson noise and Gaussian noise Variance 0.01. ALGORITHM Step1: Read the Image. Step2: partition the image into 3*3 sizes. Step 3: Apply Gaussian or Poisson noise or Speckle noise. Step4: Smoothening the edges Apply Gaussian filter of 3X3 size with sigma equal to 1.4 for smoothening the image.
Step5: Finding the edges of the image Work out the derivatives GX and GY in x and y directions. This can be done by the application of PSS filter which is of 3*3 sizes for finding the edges of the image
International Journal of Innovative Research in Advanced Engineering (IJIRAE) ISSN: 2349-2163 Volume 1 Issue 10 (November 2014) www.ijirae.com
____________________________________________________________________________________________________ © 2014, IJIRAE- All Rights Reserved Page -148
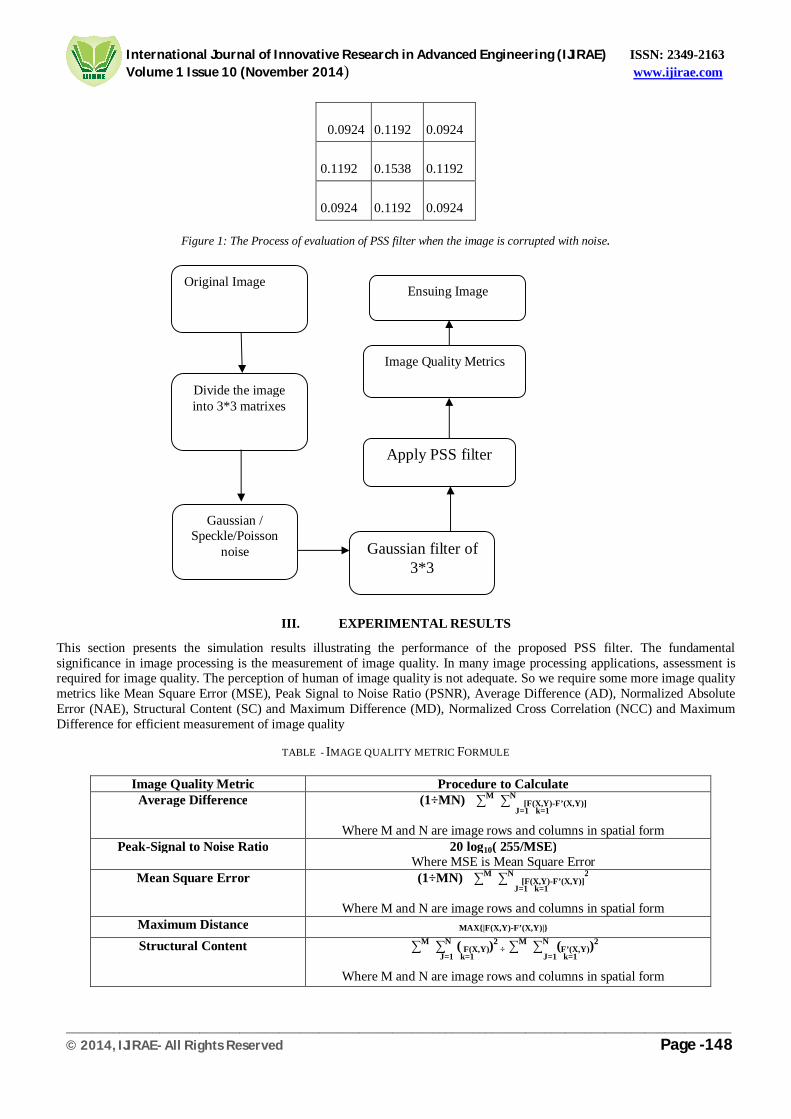
Figure 1: The Process of evaluation of PSS filter when the image is corrupted with noise.
III. EXPERIMENTAL RESULTS
This section presents the simulation results illustrating the performance of the proposed PSS filter. The fundamental significance in image processing is the measurement of image quality. In many image processing applications, assessment is required for image quality. The perception of human of image quality is not adequate. So we require some more image quality metrics like Mean Square Error (MSE), Peak Signal to Noise Ratio (PSNR), Average Difference (AD), Normalized Absolute Error (NAE), Structural Content (SC) and Maximum Difference (MD), Normalized Cross Correlation (NCC) and Maximum Difference for efficient measurement of image quality
TABLE - IMAGE QUALITY METRIC FORMULE
0.0924
0.1192
0.0924
0.1192
0.1538
0.1192
0.0924
0.1192
0.0924
Image Quality Metric Procedure to Calculate Average Difference (1÷MN) ∑M ∑N [F(X,Y)-F’(X,Y)]
J=1 k=1
Where M and N are image rows and columns in spatial form Peak-Signal to Noise Ratio 20 log10( 255/MSE)
Where MSE is Mean Square Error Mean Square Error (1÷MN) ∑M ∑N [F(X,Y)-F’(X,Y)]
2 J=1 k=1
Where M and N are image rows and columns in spatial form Maximum Distance MAX{|F(X,Y)-F’(X,Y)|}
Structural Content ∑M ∑N ( F(X,Y))2
÷ ∑M ∑N (F’(X,Y))2
J=1 k=1 J=1 k=1
Where M and N are image rows and columns in spatial form
Original Image
Divide the image into 3*3 matrixes
Gaussian / Speckle/Poisson
noise Gaussian filter of 3*3
Apply PSS filter
Image Quality Metrics
Ensuing Image

International Journal of Innovative Research in Advanced Engineering (IJIRAE) ISSN: 2349-2163 Volume 1 Issue 10 (November 2014) www.ijirae.com
____________________________________________________________________________________________________ © 2014, IJIRAE- All Rights Reserved Page -149
The mean square error (MSE) is the measure of difference between actual and estimated value of the quantity]. Larger the value of MSE implies poor quality of the image. The most familiar image quality metric is PSNR. If PSNR value is high then the difference between the original image and reconstructed image will be small. Large the value of SC indicates that the image is of pitiable quality. In order to obtain an uncontaminated and less noisy image the value of Average Difference (AD) should be reduced. The quality of the image increases with decrease in the value of NAE, Higher the value of NAE means the quality of the image lower. NCC is the measure of calculating the degree of resemblance between two objects
Table 1: Comparison of Image Quality Metrics for PSS filter for images corrupted with Speckle noise Variance 0.01
S.NO IMAGE PSNR MSE SC AD MD NCC NAE 1 Bottles 7.87 1.060 7.26 73.35 255 0.1848 0.85 2 Cameraman 6.77 1.36 5.166 92.29 255 0.2194 0.8418 3 Characters test pattern 2.33 3.80 12.19 178 255 0.1410 0.8720 4 Chest-xray-vandy 4.57 2.26 23.27 126.29 255 0.1083 0.896 5 Circuit 6.40 1.48 7.32 114.4 240 0.1985 0.8409 6 Cktboard 6.20 1.55 4.44 107.68 255 0.3040 0.7594 7 Fractal_iris 9.45 0.736 4.27 48.57 255 0.2731 0.7992 8 headCT-vandy 7.5 1.13 9.07 66.69 255 0.1918 0.855 9 Kidney-original 7.25 1.22 12.8 98.89 255 0.144 0.8744
10 Microporcessor 8.86 0.843 1.67 55.44 255 0.55 0.658 Table 2: Comparison of Image Quality Metrics for Sobel Filter for images corrupted with Speckle noise ariance 0.01
S.NO IMAGE PSNR MSE SC AD MD NCC NAE 1 Bottles 7.38 1.18 20.92 80.8 255 0.092 0.91 2 Cameraman 6.17 1.57 8.52 99.7 255 0.12 0.91 3 Characters test pattern 1.88 4.21 22.39 188 255 0.0783 0.936 4 Chest-xray-vandy 4.30 2.41 32.9 129.7 255 0.0754 0.92 5 Circuit 5.86 1.68 12.07 122.18 255 0.1228 0.8981 6 Cktboard 5.22 1.95 4.89 110.9 255 0.2142 0.8461 7 Fractal_iris 9.030 0.857 3.75 47.85 255 0.2122 0.9050 8 headCT-vandy 7.01 1.29 9.60 68.11 255 0.115 0.9288 9 Kidney-original 7.03 1.28 18.13 101.07 255 0.112 0.8895
10 Microporcessor 6.47 1.46 3.12 78.10 255 0.239 0.888 Table 3: Comparison of Image Quality Metrics for Prewitt Filter for images corrupted with Speckle noise Variance 0.01.
S.NO IMAGE PSNR MSE SC AD MD NCC NAE 1 Bottles 7.24 1.22 31.42 83.16 255 0.069 0.93 2 Cameraman 6.07 1.6 12.82 104.18 255 0.09 0.923 3 Characters test pattern 1.76 4.32 31.62 192 255 0.059 0.9519 4 Chest-xray-vandy 4.16 2.49 51.7 132.8 255 0.0558 0.944 5 Circuit 5.70 1.74 19.47 126.64 255 0.092 0.9190 6 Cktboard 5.09 2.010 7.32 118.74 255 0.16 0.86
Normalized Absolute Error ∑M ∑N | [F(X,Y)-F’(X,Y)]| /∑M ∑N | F(X,Y) | J=1 k=1 J=1 k=1
Where M and N are image rows and columns in spatial form
Normalized Cross Correlation ∑M ∑N | [F(X,Y)*F’(X,Y)]| /∑M ∑N | F(X,Y) |2
J=1 k=1 J=1 k=1
Where M and N are image rows and columns in spatial form Fidelity criteria 1-∑M ∑N | [F(X,Y)-F’(X,Y)]|2 /∑M ∑N | F(X,Y) |2
J=1 k=1 J=1 k=1
Where M and N are image rows and columns in spatial form Mean Square Error (1÷MN) ∑M ∑N [F(X,Y)-F’(X,Y)]
2 J=1 k=1
Where M and N are image rows and columns in spatial form
International Journal of Innovative Research in Advanced Engineering (IJIRAE) ISSN: 2349-2163 Volume 1 Issue 10 (November 2014) www.ijirae.com
____________________________________________________________________________________________________ © 2014, IJIRAE- All Rights Reserved Page -150
7 Fractal_iris 8.55 0.907 5.99 52.5 255 0.1609 0.9122 8 headCT-vandy 6.91 1.32 13.6 70.7 255 0.089 0.943 9 Kidney-original 6.85 1.34 29.75 104.59 255 0.084 0.9154
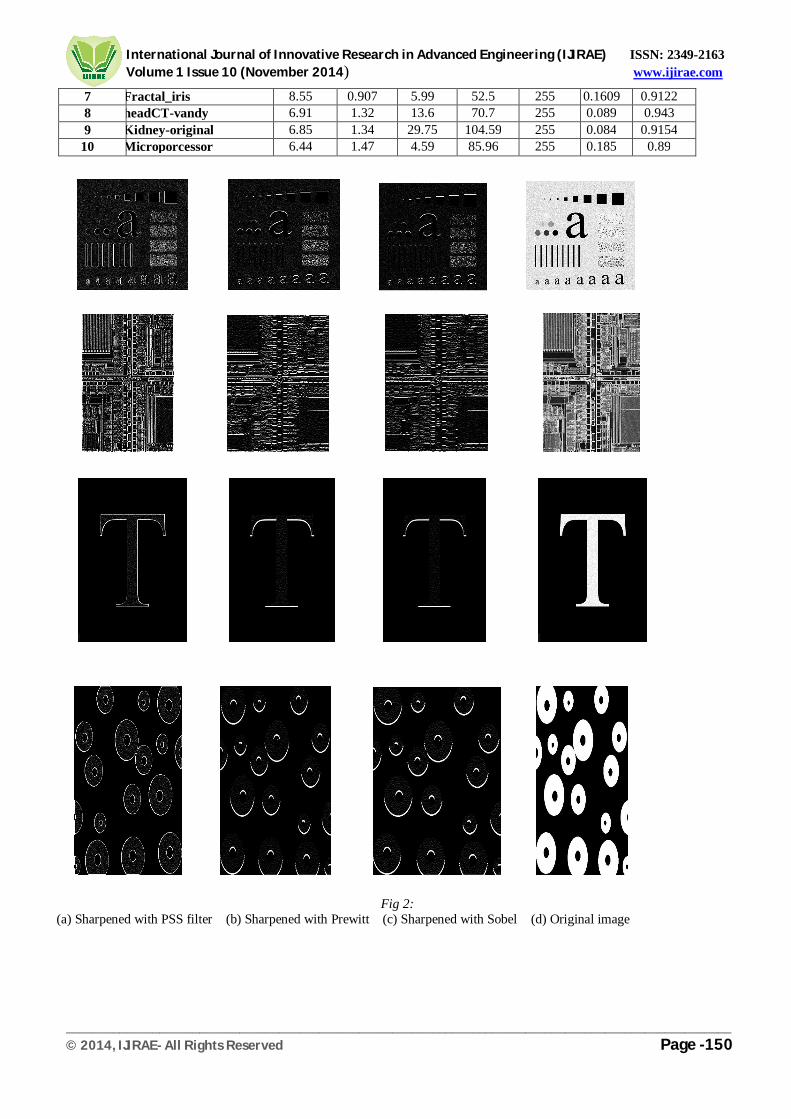
10 Microporcessor 6.44 1.47 4.59 85.96 255 0.185 0.89
Fig 2:
(a) Sharpened with PSS filter (b) Sharpened with Prewitt (c) Sharpened with Sobel (d) Original image
International Journal of Innovative Research in Advanced Engineering (IJIRAE) ISSN: 2349-2163 Volume 1 Issue 10 (November 2014) www.ijirae.com
____________________________________________________________________________________________________ © 2014, IJIRAE- All Rights Reserved Page -151
PSNR MSE
SC AD
MD NCC
NAE
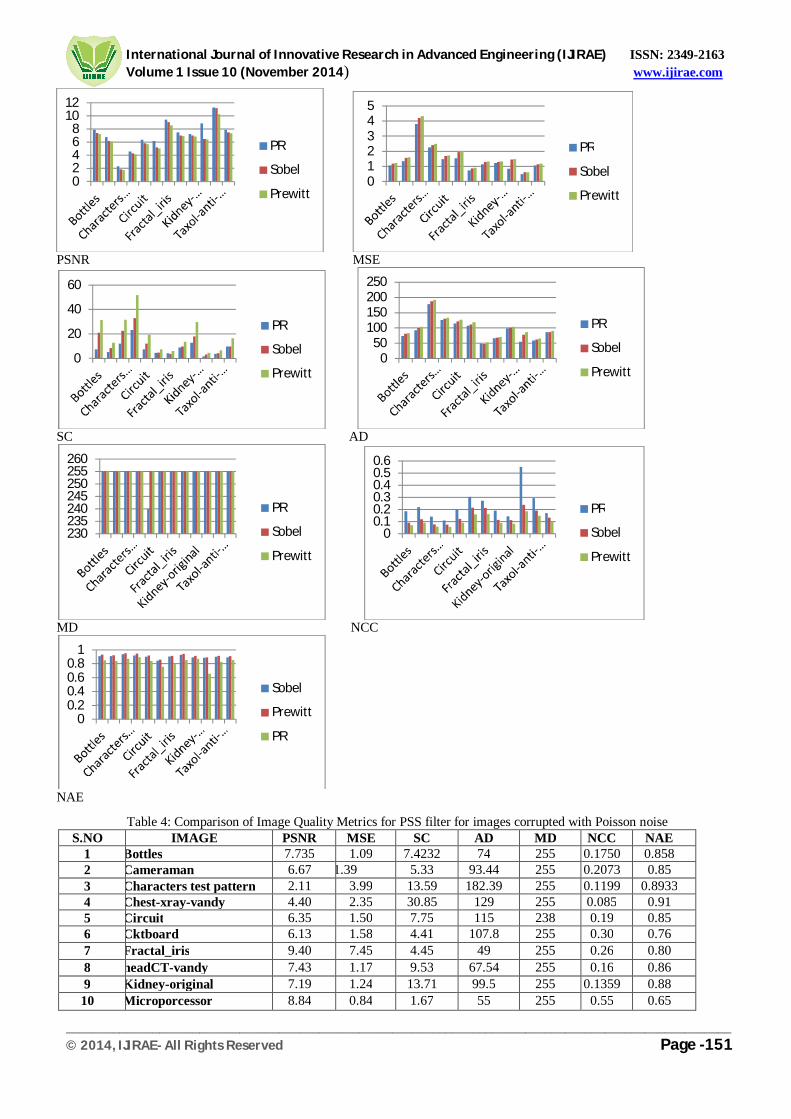
Table 4: Comparison of Image Quality Metrics for PSS filter for images corrupted with Poisson noise S.NO IMAGE PSNR MSE SC AD MD NCC NAE
1 Bottles 7.735 1.09 7.4232 74 255 0.1750 0.858 2 Cameraman 6.67 1.39 5.33 93.44 255 0.2073 0.85 3 Characters test pattern 2.11 3.99 13.59 182.39 255 0.1199 0.8933 4 Chest-xray-vandy 4.40 2.35 30.85 129 255 0.085 0.91 5 Circuit 6.35 1.50 7.75 115 238 0.19 0.85 6 Cktboard 6.13 1.58 4.41 107.8 255 0.30 0.76 7 Fractal_iris 9.40 7.45 4.45 49 255 0.26 0.80 8 headCT-vandy 7.43 1.17 9.53 67.54 255 0.16 0.86 9 Kidney-original 7.19 1.24 13.71 99.5 255 0.1359 0.88 10 Microporcessor 8.84 0.84 1.67 55 255 0.55 0.65
02468
1012
PR
Sobel
Prewitt012345
PR
Sobel
Prewitt
0
20
40
60
PR
Sobel
Prewitt0
50100150200250
PR
Sobel
Prewitt
230235240245250255260
PR
Sobel
Prewitt
00.10.20.30.40.50.6
PR
Sobel
Prewitt
00.20.40.60.8
1
Sobel
Prewitt
PR
International Journal of Innovative Research in Advanced Engineering (IJIRAE) ISSN: 2349-2163 Volume 1 Issue 10 (November 2014) www.ijirae.com
____________________________________________________________________________________________________ © 2014, IJIRAE- All Rights Reserved Page -152
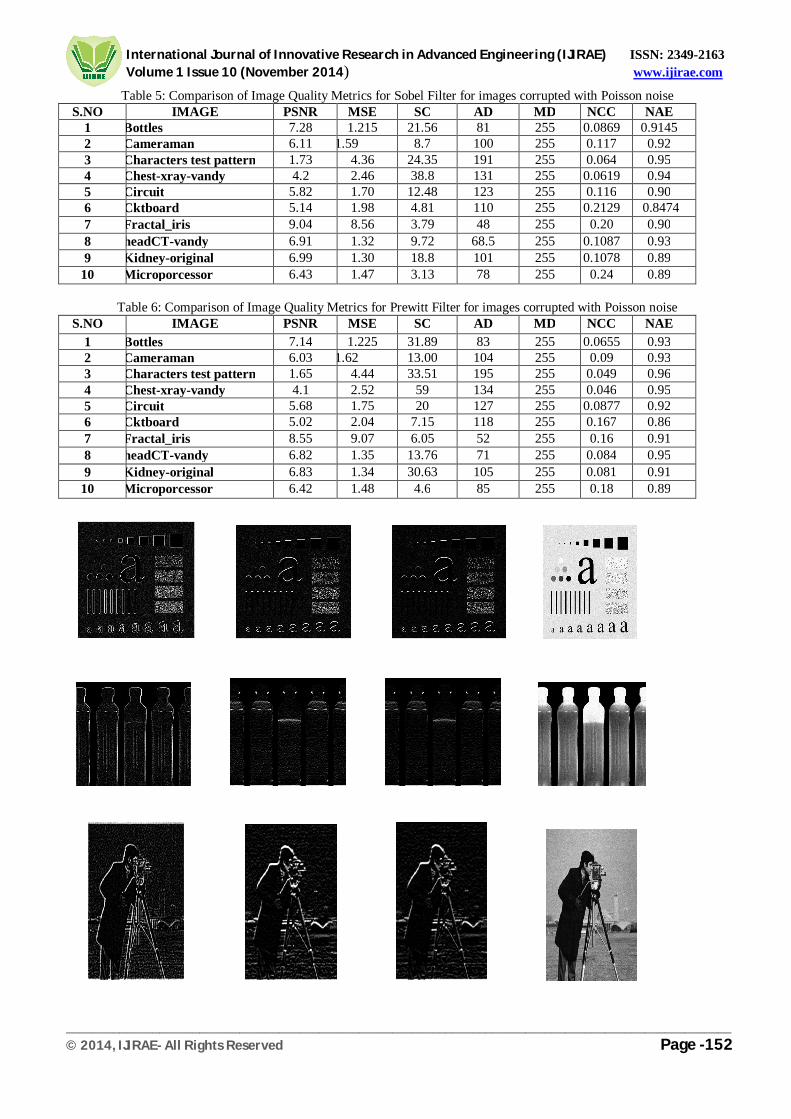
Table 5: Comparison of Image Quality Metrics for Sobel Filter for images corrupted with Poisson noise S.NO IMAGE PSNR MSE SC AD MD NCC NAE
1 Bottles 7.28 1.215 21.56 81 255 0.0869 0.9145 2 Cameraman 6.11 1.59 8.7 100 255 0.117 0.92 3 Characters test pattern 1.73 4.36 24.35 191 255 0.064 0.95 4 Chest-xray-vandy 4.2 2.46 38.8 131 255 0.0619 0.94 5 Circuit 5.82 1.70 12.48 123 255 0.116 0.90 6 Cktboard 5.14 1.98 4.81 110 255 0.2129 0.8474 7 Fractal_iris 9.04 8.56 3.79 48 255 0.20 0.90 8 headCT-vandy 6.91 1.32 9.72 68.5 255 0.1087 0.93 9 Kidney-original 6.99 1.30 18.8 101 255 0.1078 0.89
10 Microporcessor 6.43 1.47 3.13 78 255 0.24 0.89
Table 6: Comparison of Image Quality Metrics for Prewitt Filter for images corrupted with Poisson noise S.NO IMAGE PSNR MSE SC AD MD NCC NAE
1 Bottles 7.14 1.225 31.89 83 255 0.0655 0.93 2 Cameraman 6.03 1.62 13.00 104 255 0.09 0.93 3 Characters test pattern 1.65 4.44 33.51 195 255 0.049 0.96 4 Chest-xray-vandy 4.1 2.52 59 134 255 0.046 0.95 5 Circuit 5.68 1.75 20 127 255 0.0877 0.92 6 Cktboard 5.02 2.04 7.15 118 255 0.167 0.86 7 Fractal_iris 8.55 9.07 6.05 52 255 0.16 0.91 8 headCT-vandy 6.82 1.35 13.76 71 255 0.084 0.95 9 Kidney-original 6.83 1.34 30.63 105 255 0.081 0.91
10 Microporcessor 6.42 1.48 4.6 85 255 0.18 0.89
International Journal of Innovative Research in Advanced Engineering (IJIRAE) ISSN: 2349-2163 Volume 1 Issue 10 (November 2014) www.ijirae.com
____________________________________________________________________________________________________ © 2014, IJIRAE- All Rights Reserved Page -153
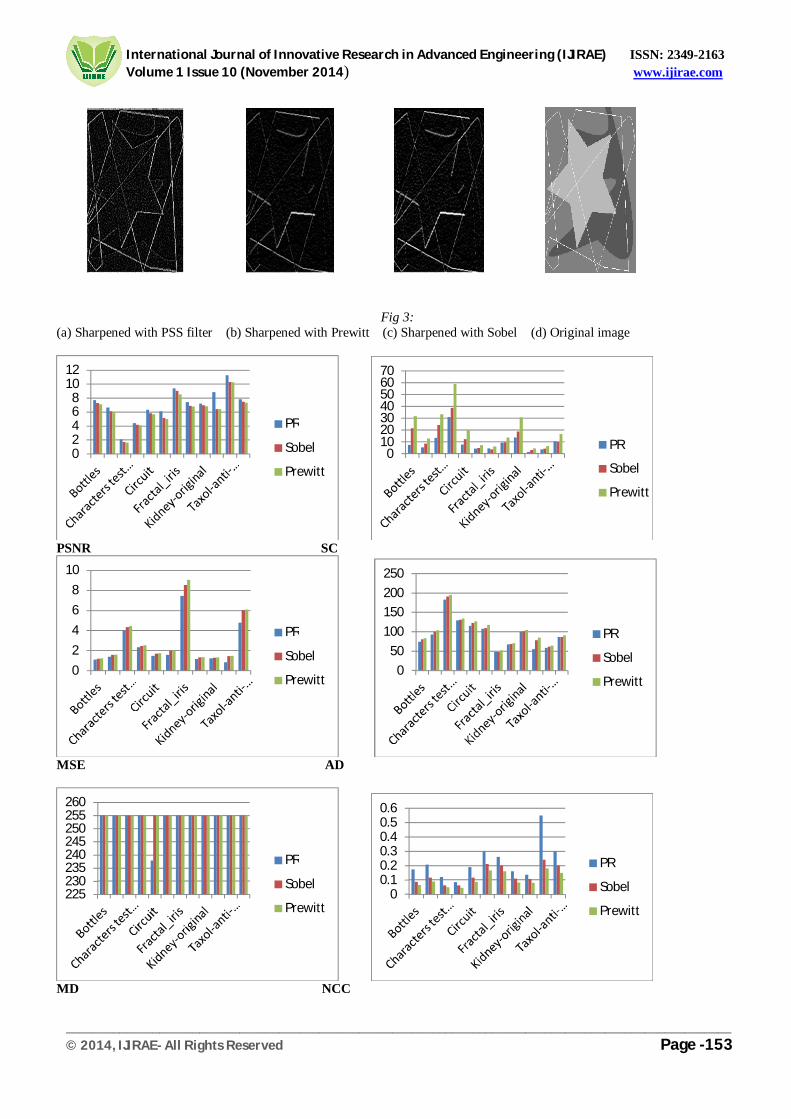
Fig 3:
(a) Sharpened with PSS filter (b) Sharpened with Prewitt (c) Sharpened with Sobel (d) Original image
PSNR SC
MSE AD
MD NCC
02468
1012
PR
Sobel
Prewitt0
10203040506070
PR
Sobel
Prewitt
02468
10
PR
Sobel
Prewitt0
50100150200250
PR
Sobel
Prewitt
225230235240245250255260
PR
Sobel
Prewitt0
0.10.20.30.40.50.6
PR
Sobel
Prewitt

International Journal of Innovative Research in Advanced Engineering (IJIRAE) ISSN: 2349-2163 Volume 1 Issue 10 (November 2014) www.ijirae.com
____________________________________________________________________________________________________ © 2014, IJIRAE- All Rights Reserved Page -154
NAE
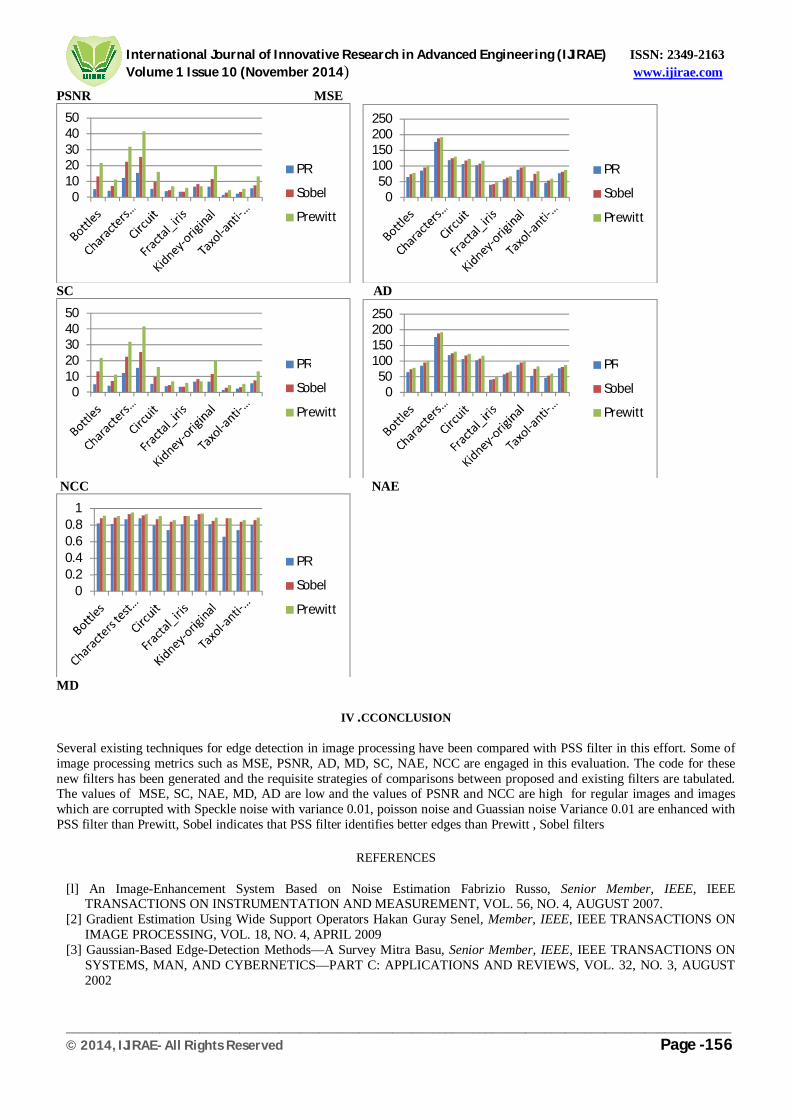
Table 7: Comparison of Image Quality Metrics for PSS filter for images corrupted with Gaussian noise Variance 0.01 S.NO IMAGE PSNR MSE SC AD MD NCC NAE
1 Bottles 7.94 1.0445 5.149 64.48 255 0.22 0.82 2 Cameraman 6.94 1.314 4.2114 85.05 255 0.26 0.811 3 Characters test pattern 2.37 3.76 12.14 177 255 0.14 0.87 4 Chest-xray-vandy 4.69 2.20 15.45 119 255 0.13 0.88 5 Circuit 6.63 1.41 5.36 107 255 0.24 0.7959 6 Cktboard 6.23 1.54 3.98 103 255 0.322 0.74 7 Fractal_iris 9.42 7.43 3.51 40.5 255 0.30 0.81 8 headCT-vandy 7.6 1.13 6.84 58 255 0.198 0.862 9 Kidney-original 7.15 1.15 6.66 88.7 255 0.21 0.81 10 Microporcessor 8.67 8.82 1.6 52.7 255 0.557 0.66
Table 8: Comparison of Image Quality Metrics for Sobel Filter for images corrupted with Gaussian noise Variance 0.01 S.NO IMAGE PSNR MSE SC AD MD NCC NAE
1 Bottles 7.4 1.18 13.22 74.54 255 0.1203 0.880 2 Cameraman 6.223 1.54 7.21 95.08 255 0.15 0.89 3 Characters test pattern 1.92 4.17 22.4 188 255 0.08 0.93 4 Chest-xray-vandy 4.35 2.38 25.41 125 255 0.0879 0.918 5 Circuit 5.96 1.64 9.69 117.7 255 0.15 0.87 6 Cktboard 5.18 1.97 4.62 108 255 0.22 0.84 7 Fractal_iris 8.52 9.13 3.57 43 255 0.22 0.91 8 headCT-vandy 7.0 1.3 8.45 62.8 255 0.129 0.93 9 Kidney-original 7.07 1.27 11.64 95.81 255 0.14 0.85
10 Microporcessor 6.43 1.47 2.97 75 255 0.25 0.88
Table 9: Comparison of Image Quality Metrics for Prewitt Filter for images corrupted with Gaussian noise Variance 0.01 S.NO IMAGE PSNR MSE SC AD MD NCC NAE
1 Bottles 7.23 1.22 21.6 78.6 255 0.089 0.9120 2 Cameraman 6.09 1.59 11.21 100.8 255 0.11 0.91 3 Characters test pattern 1.8 4.3 32 192 255 0.06 0.95 4 Chest-xray-vandy 4.20 2.47 41.5 130 255 0.065 0.93 5 Circuit 5.76 1.72 16 123 255 0.11 0.91 6 Cktboard 5.05 2.03 6.95 117 255 0.17 0.86 7 Fractal_iris 8.42 9.19 5.87 49 255 0.17 0.91 8 headCT-vandy 6.88 1.33 6.88 67 255 0.09 0.94 9 Kidney-original 6.86 1.33 20 100 255 0.10 0.89
10 Microporcessor 6.40 1.48 4.44 83.6 255 0.19 0.88
00.20.40.60.8
11.2
PR
Sobel
Prewitt
International Journal of Innovative Research in Advanced Engineering (IJIRAE) ISSN: 2349-2163 Volume 1 Issue 10 (November 2014) www.ijirae.com
____________________________________________________________________________________________________ © 2014, IJIRAE- All Rights Reserved Page -155
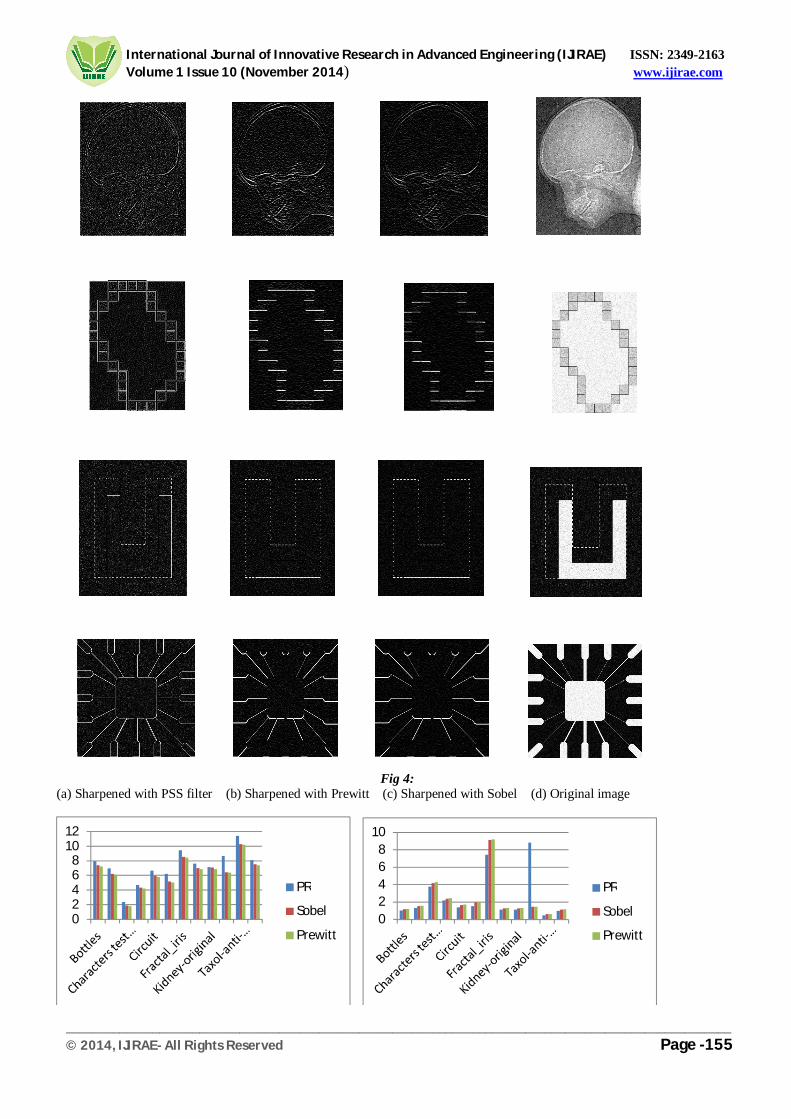
Fig 4:
(a) Sharpened with PSS filter (b) Sharpened with Prewitt (c) Sharpened with Sobel (d) Original image
02468
1012
PR
Sobel
Prewitt02468
10
PR
Sobel
Prewitt
International Journal of Innovative Research in Advanced Engineering (IJIRAE) ISSN: 2349-2163 Volume 1 Issue 10 (November 2014) www.ijirae.com
____________________________________________________________________________________________________ © 2014, IJIRAE- All Rights Reserved Page -156
PSNR MSE
SC AD
NCC NAE
MD
IV .CCONCLUSION
Several existing techniques for edge detection in image processing have been compared with PSS filter in this effort. Some of image processing metrics such as MSE, PSNR, AD, MD, SC, NAE, NCC are engaged in this evaluation. The code for these new filters has been generated and the requisite strategies of comparisons between proposed and existing filters are tabulated. The values of MSE, SC, NAE, MD, AD are low and the values of PSNR and NCC are high for regular images and images which are corrupted with Speckle noise with variance 0.01, poisson noise and Guassian noise Variance 0.01 are enhanced with PSS filter than Prewitt, Sobel indicates that PSS filter identifies better edges than Prewitt , Sobel filters
REFERENCES
[l] An Image-Enhancement System Based on Noise Estimation Fabrizio Russo, Senior Member, IEEE, IEEE TRANSACTIONS ON INSTRUMENTATION AND MEASUREMENT, VOL. 56, NO. 4, AUGUST 2007.
[2] Gradient Estimation Using Wide Support Operators Hakan Guray Senel, Member, IEEE, IEEE TRANSACTIONS ON IMAGE PROCESSING, VOL. 18, NO. 4, APRIL 2009
[3] Gaussian-Based Edge-Detection Methods—A Survey Mitra Basu, Senior Member, IEEE, IEEE TRANSACTIONS ON SYSTEMS, MAN, AND CYBERNETICS—PART C: APPLICATIONS AND REVIEWS, VOL. 32, NO. 3, AUGUST 2002
01020304050
PR
Sobel
Prewitt0
50100150200250
PR
Sobel
Prewitt
01020304050
PR
Sobel
Prewitt0
50100150200250
PR
Sobel
Prewitt
00.20.40.60.8
1
PR
Sobel
Prewitt

International Journal of Innovative Research in Advanced Engineering (IJIRAE) ISSN: 2349-2163 Volume 1 Issue 10 (November 2014) www.ijirae.com
____________________________________________________________________________________________________ © 2014, IJIRAE- All Rights Reserved Page -157
[4] Gray-Scale Image Enhancement as an Automatic Process Driven by Evolution, Cristian Munteanu and Agostinho Rosa, IEEE TRANSACTIONS ON SYSTEMS, MAN, AND CYBERNETICS—PART B: CYBERNETICS, VOL. 34, NO. 2, APRIL 2004
[5] An Image-Enhancement System Based on Noise Estimation Fabrizio Russo, Senior Member, IEEE, TRANSACTIONS ON INSTRUMENTATION AND MEASUREMENT, VOL. 56, NO. 4, AUGUST 2007.
[6] Edge Detection Techniques: Evaluations and Comparisons Ehsan Nadernejad, Applied Mathematical Sciences, Vol. 2, 2008, no. 31, 1507 – 1520.
[7] A survey of image spamming and filtering techniques Abdolrahman Attar · Reza Moradi Rad ,Reza Ebrahimi Atani, © Springer Science+Business Media B.V. 2011.
[8] Zhou Wang, Member, IEEE, Guixing Wu, Hamid Rahim Sheikh,Member, IEEE, Eero P. Simoncelli, Senior Member, IEEE, En- Hui Yang, Senior Member, IEEE, and Alan Conrad Bovik, Fellow, IEEE, “Quality Aware Images”, IEEE TRANSACTIONS ON IMAGE PROCESSING, VOL. 15, NO. 6, JUNE 2006.
[9] VQEG, “Final report from the video quality experts group on the validation of objective models of video quality assessment”, Mar. 2000.
[10] A new approach for edge detection , International Journal of Computer Applications (0975 – 8887), Volume 103 – No 16, October 2014.
Related Documents