1 IITB Summer Internship 2013 Preliminary Project Report Attachment for Aadhar Authentication on Aakash Principal Investigator Prof. D. B. Phatak Project In-charge Mr. Nagesh Karmali Project Mentors Miss. Birundha M. Miss. Firuza Aibara(PMO) Mr. Jugal Mehta Project Team Members Miss. Archana Iyer Mr. Hitesh Yadav Miss. Pooja Deo Mr. Prashant Main Mr. Prateek Somani Mr. Prathamesh Paleyekar Mr. Sonu Philip Mr. Sudhanshu Verma

Welcome message from author
This document is posted to help you gain knowledge. Please leave a comment to let me know what you think about it! Share it to your friends and learn new things together.
Transcript

1
IITB Summer Internship 2013
Preliminary Project Report
Attachment for Aadhar Authentication on Aakash
Principal Investigator
Prof. D. B. Phatak
Project In-charge
Mr. Nagesh Karmali
Project Mentors
Miss. Birundha M.
Miss. Firuza Aibara(PMO)
Mr. Jugal Mehta
Project Team Members
Miss. Archana Iyer
Mr. Hitesh Yadav
Miss. Pooja Deo
Mr. Prashant Main
Mr. Prateek Somani
Mr. Prathamesh Paleyekar
Mr. Sonu Philip
Mr. Sudhanshu Verma

2
Abstract
Aadhar authentication is the process wherein the Aadhar number, along with other
attributes (demographic/biometrics/OTP) is submitted to UIDAI's Central Identities
Data Repository (CIDR) for verification; the CIDR verifies whether the data submitted
matches the data available in CIDR and responds with a “yes/no”. No personal identity
information is returned as part of the response. The purpose of authentication is to
enable residents to prove their identity and for service providers to confirm that the
residents are „who they say they are' in order to supply services and give access to
benefits.
The purpose of the project is to make an optical assembly for Aakash tablet so that it can
be used in place of the current fingerprint scanning devices and to get a clear image of a
fingerprint by using the tablet‟s camera itself, and this fingerprint is in turn used for the
authentication of the Aadhar Id, taking into consideration the cost of the optical device.
Also an Image Enhancement Software is developed which will optimize the provided
image. More specifically the system is designed in order to reduce the cost and to use
the camera on the Aakash tablet for the purpose of fingerprint scanning.
Once completed we will try for its application on other tablets and phones as well.
3
Contents
1.Introduction
1.1 Fingerprint Recognition System for Aadhar. . . . . . . . . . . . . . . . . . . . . .7
1.2 Aadhar Authentication. . . . . . . . . . . . . . . . . . . . . . . . . . . . . . . 9
1.3. Workflow of Aadhar authentication. . . . . . . . . . . . . . . . . . . . . . . . .. 9
2.Image Processing
2.1 Rescaling. . . . . . . . . . . . . . . . . . . . . . . . . . . . . . . . . . . . 11
2.2 Conversion of RGB to Gray scale. . . . . . . . . . . . . . . . . . . . . . . . . 11
2.3 Adaptive Histogram equalization of Grey scale. . . . . . . . . . . . . . . . . 11
2.4 Sharpening. . . . . . . . . . . . . . . . . . . . . . . . . . . . . . . . .11
2.5 Thresholding. . . . . . . . . . . . . . . . . . . . . . . . . . . . . . . . . . . 15
2.6 Edge detection. . . . . . . . . . . . . . . . . . . . . . . . . . . . . . . . . 16
3. Hardware-Optical assembly. . . . . . . . . . . . . . . . . . . . . . . . . . . . 18
4.Experimental Results
4.1 Experiment 1. . . . . . . . . . . . . . . . . . . . . . . . . . . . . . . . . 21
4.2 Experiment 2. . . . . . . . . . . . . . . . . . . . . . . . . . . . . . . . . 26
4.3 Experiment 3. . . . . . . . . . . . . . . . . . . . . . . . . . . . . . . . . 31
4.4 Experiment 4. . . . . . . . . . . . . . . . . . . . . . . . . . . . . . . . . 32
4.5 Experiment 5. . . . . . . . . . . . . . . . . . . . . . . . . . . . . . . . . 33
4.6 Experiment 6. . . . . . . . . . . . . . . . . . . . . . . . . . . . . . . . 34
4.7 Experiment 7. . . . . . . . . . . . . . . . . . . . . . . . . . . . . . . . . 35
5. Conclusion. . . . . . . . . . . . . . . . . . . . . . . . . . . . . . . . . . . . . 36
6. Bibliography. . . . . . . . . . . . . . . . . . . . . . . . . . . . . . . . . . . 37

4
List of Figures
1.1.1 Aadhar authentication process. . . . . . . . . . . . . . . . . . . . . . . . . . . . 8
2.0.0 Image enhancement workflow. . . . . . . . . . . . . . . . . . . . . . . . . 10
2.4.1 Sharpened image. . . . . . . . . . . . . . . . . . . . . . . . . . . . . . . . . .11
2.4.2 Convolution technique. . . . . . . . . . . . . . . . . . . . . . . . . . . . . . .12
2.5.1 Thresholding. . . . . . . . . . . . . . . . . . . . . . . . . . . . . . . . . . . . 16
3.1 Optical assembly attachment for Aakash tablet (Side view). . . . . . . . . . . . 19
3.2 Optical assembly attachment for Aakash tablet (Top view). . . . . . . . . . . . . 20
4.1.1 RGB Image. . . . . . . . . . . . . . . . . . . . . . . . . . . . . . . . . .21
4.1.2 Cropped Image. . . . . . . . . . . . . . . . . . . . . . . . . . . . . . . . 22
4.1.3 Grayscaled Image. . . . . . . . . . . . . . . . . . . . . . . . . . . . . . .23
4.1.4 Resized Image. . . . . . . . . . . . . . . . . . . . . . . . . . . . . . . . 23
4.1.5 Adaptive Histogram Equalization. . . . . . . . . . . . . . . . . . . . . . . 24
4.1.6 Sharpened Image. . . . . . . . . . . . . . . . . . . . . . . . . . . . . . . 24
4.1.7 Image Thresholding. . . . . . . . . . . . . . . . . . . . . . . . . . . . . ..25
4.1.8 Image Thinning. . . . . . . . . . . . . . . . . . . . . . . . . . . . . . . 25
4.2.1 RGB Image. . . . . . . . . . . . . . . . . . . . . . . . . . . . . . . . . . .26
4.2.2 Cropped Image. . . . . . . . . . . . . . . . . . . . . . . . . . . . . . . . 27
4.2.3 Image Grayscaling. . . . . . . . . . . . . . . . . . . . . . . . . . . . . . .27
4.2.4 Image Resizing. . . . . . . . . . . . . . . . . . . . . . . . . . . . . . . . 28
4.2.5 Adaptive Histogram Equalization. . . . . . . . . . . . . . . . . . . . . . . 28
4.2.6 Sharpened Image. . . . . . . . . . . . . . . . . . . . . . . . . . . . . . . 29
4.2.7 Image Thresholding. . . . . . . . . . . . . . . . . . . . . . . . . . . . . 29
4.2.8 Image Thinning. . . . . . . . . . . . . . . . . . . . . . . . . . . . . . . .30
4.3.1 Cropped Image(With LEDs on) . . . . . . . . . . . . . . . . . . . . . . . . 31
4.4.1 Cropped Image(With 3 LEDs) . . . . . . . . . . . . . . . . . . . . . . . . .32
4.5.1 Cropped Image(With 2 LEDs adjacent) . . . . . . . . . . . . . . . . . . . ..33
4.6.1 Cropped Image(With 2 LEDs diagonal) . . . . . . . . . . . . . . . . . . . .34
4.7.1 Cropped Image(With 1 LED) . . . . . . . . . . . . . . . . . . . . . . . . . 35

5
List of Tables
4.1.1 RGB Image. . . . . . . . . . . . . . . . . . . . . . . . . . . . . . . . . .21
4.1.2 Cropped Image. . . . . . . . . . . . . . . . . . . . . . . . . . . . . . . . 22
4.1.3 Grayscaled Image. . . . . . . . . . . . . . . . . . . . . . . . . . . . . . .23
4.1.4 Resized Image. . . . . . . . . . . . . . . . . . . . . . . . . . . . . . . . 23
4.1.5 Adaptive Histogram Equalization. . . . . . . . . . . . . . . . . . . . . . . 24
4.1.6 Sharpened Image. . . . . . . . . . . . . . . . . . . . . . . . . . . . . . . 24
4.1.7 Image Thresholding. . . . . . . . . . . . . . . . . . . . . . . . . . . . . ..25
4.1.8 Image Thinning. . . . . . . . . . . . . . . . . . . . . . . . . . . . . . . 25
4.2.1 RGB Image. . . . . . . . . . . . . . . . . . . . . . . . . . . . . . . . . . .26
4.2.2 Cropped Image. . . . . . . . . . . . . . . . . . . . . . . . . . . . . . . . 27
4.2.3 Image Grayscaling. . . . . . . . . . . . . . . . . . . . . . . . . . . . . . .27
4.2.4 Image Resizing. . . . . . . . . . . . . . . . . . . . . . . . . . . . . . . . 28
4.2.5 Adaptive Histogram Equalization. . . . . . . . . . . . . . . . . . . . . . . 28
4.2.6 Sharpened Image. . . . . . . . . . . . . . . . . . . . . . . . . . . . . . . 29
4.2.7 Image Thresholding. . . . . . . . . . . . . . . . . . . . . . . . . . . . . 29
4.2.8 Image Thinning. . . . . . . . . . . . . . . . . . . . . . . . . . . . . . . .30

6
Acknowledgement
We would like to thank our guide, Prof. Deepak B Phatak for the consistent directions
towards our work. Because of his consistent encouragement and right directions, we are
able to do this project work.
We would also like to thank Mr Nagesh, our project in charge, for his constant support
and suggestions throughout the making of this project and our mentors Mr Jugal Mehta
and Miss Birundha for providing us with a systematic way for performing our project
and helping us solve many problems we faced during the course of this project.
Finally we would also like to thank all the lab maintenance staff for providing us
assistance in various h/w & s/w problems that we encountered during the course of our
project.
7
Chapter 1
Introduction
1.1 Fingerprint Recognition System for Aadhar:
• Aadhar “authentication” means the process wherein Aadhar Number, along with
other attributes, including biometrics, are submitted to the Central Identities Data
Repository (CIDR) for its verification on the basis of information or data or
documents available with it.
• Aadhar authentication service only responds with a “yes/no” and no personal
identity information is returned as part of the response.
• Authentication User Agency (AUA): An organization or an entity using
Aadharauthentication as part of its applications to provide services to residents.
Examples include Government Departments, Banks, and other public or private
organizations.
• Sub-AUA (SA): An organization or a department or an entity having a
business relationship with AUA offering specific services in a particular domain.
All
• Authentication requests emerging from an AUA contains the information on the
specific SA. For example, a specific bank providing Aadhar enabled payment
transaction through NPCI as the AUA becomes the SA.
• Authentication Service Agency (ASA): An organization or an entity
providing secure leased line connectivity to UIDAI‟s data centres for
transmitting authentication requests from various AUAs.
• Terminal Devices: Terminal devices are devices employed by SAs/AUAs
(both government and non-government) to provide services to the residents.
• Authentication Factors:
• Demographic data (name, address, date of birth etc.)
• Biometric data (fingerprint image)
• PIN

8
• OTP
• possession of mobile
Figure 1.1.1 Block diagram for Aadhar Authentication Process

9
1.2 Aadhar Authentication
• Aadhar Number
• The Unique Identification (Aadhar) Number, which identifies a resident, will give
individuals the means to clearly establish their identity to public and private
agencies across the country. Three key characteristics of Aadhar Number are:
• 1. Permanency (Aadhar number remains same during lifetime of a resident)
• 2. Uniqueness (one resident has one ID and no two residents have same ID)
• 3. Global (same identifier can be used across applications and domains)
• Aadhar Number is provided during the initiation process called enrolment where a
resident‟s demographic and biometric information are collected and uniqueness of
the provided data is established through a process called de-duplication.
• Post reduplication, an Aadhar Number is issued and a letter is sent to resident
informing the details.
1.3 Workflow of Aadhar authentication:
1. The hardware attached on the top of tablet‟s camera takes the clear image for
fingerprint authentication (biometric detail).
2. Resident provides Aadhar Number, necessary demographic and biometric details to
terminal devices belonging to the AUA/SA (or merchant/operator appointed by
AUA/SA) to obtain a service offered by the AUA/SA.
3. Aadhar authentication enabled application software that is installed on the device
packages these input parameters, encrypts, and sends it to AUA server over either a
mobile/broadband network using AUA specific protocol.
4. AUA server, after validation adds necessary headers (AUA specific wrapper XML
with license key, transaction id, etc.), and passes the request through ASA server to
UIDAI CIDR.
5. Aadhar authentication server returns a “yes/no” based on the match of the input
parameters.
6. Based on the response from the Aadhar authentication server, AUA/SA conducts the
transaction.

10
Chapter 2
Image Processing
The steps involved in image processing are –
1. Conversion of RGB to Gray scale
2. Rescaling
3. Adaptive Histogram equalization of Grey scale
4. Sharpening
5. Thresholding
6. Thinning
Figure 2.0.0: Image Enhancement Workflow

11
2.1 Conversion of RGB to Gray scale
(a) The R, G and B values for each pixel are obtained.
(b) The average of these three values is calculated.
(c) Each pixel is reassigned this average value.
2.2 Rescaling – It is a process of resizing of the image.
2.3 Adaptive Histogram equalization of Grey scale-
Adaptive histogram equalization (AHE) is a computer image
processing technique used to improve contrast in images. It differs from
ordinary histogram equalization in the respect that the adaptive method
computes several histograms, each corresponding to a distinct section of the
image, and uses them to redistribute the lightness values of the image. It is
therefore suitable for improving the local contrast of an image and bringing out
more detail.
2.4 Sharpening
Sharpening an image means to make the differences between the neighboring pixels
more noticeable. Sharpening brings out the details of an image.
Sharpening can be done by kernel based convolutions.
In image processing a kernel, is a small matrix which is useful for blurring, sharpening,
embossing, edge-detection, and more.
A kernel is a 2D matrix of numbers that can be used as coefficients for numerical
operations on pixels.
Figure 2.4.1:Sharpened image
The third picture is a sharpened version of the original (first) image.

12
Sharpening involves the following steps:
1. Read the original image.
2. Choose the image processing technique-sharpening.
3. Choose the corresponding kernel to do the sharpening.
4. Apply the above kernel to the image matrix using convolution.
5. Display the sharpened image.
The advantages of sharpening are that it brings out the details of an image, it makes the
picture smudge free and it emphasizes on the texture of the image.
The disadvantages of sharpening are that over-sharpening can spoil the originality of an
image and by sharpening the smoothness of the image is lost.
For sharpening one of the most commonly used methods is Laplacian kernel.
The advantages of using laplacian kernel is that since the kernel is usually much smaller
than the image, this method usually requires far fewer arithmetic operations and also, the
Laplacian kernel is known in advance so only one convolution needs to be performed at
run-time on the image.
The disadvantage of Laplacian kernel is that it is sensitive to noise.
To reduce the noise, the image is often Gaussian smoothed before applying the
Laplacian filter.
How convolution is done:
Figure 2.4.2: Convolution technique

13
Complexity of Laplacian Kernel:
Time Complexity:
Multiplication for a single pixel in the image matrix= 9 x 3
We use 9 because our kernel is a 3 x 3 matrix with 9 elements so we have 9
multiplications with the corresponding image matrix elements and 3 because we have
three matrices, one each for Red, Blue and Green.
Addition for a single pixel=9 x 3
(27 multiplications + 27 additions) x size of the image
Size of the image=m
(27 multiplications x m)
Therefore, Time Complexity=O (27 x m x n^2)
n^2=multiplication complexity for two n digit numbers
Space Complexity:
(m x 3 x 8 + 9 x 8 + c)bits
m=size of the image
3 represents the three matrices for R,G and B
8 represents the 8 bits for each cell
9 represents the number of elements in the kernel matrix
C is the constant
Therefore, Space Complexity=O (m x 24)

14
Another technique for doing sharpening is unsharpmasking.
The general algorithm is for unsharp masking is:
· Blur the original.
· Subtract the blurred image from the original (the resulting difference image is called
the "mask").
· Amplify the difference.
· Add the mask to the original.
· The resulting image (original plus mask) will appear "sharper"
Blurring can be done in different ways:
1. Using bilateral filter
2. Using median filter
3. Using mean filter
The general algorithm is the same for all of the above techniques.
They vary in their method of blurring.
The disadvantages of unsharp masking is that there are many steps and choices so the
complexity is more. If we want to sharpen the edges then convolution is better since in
unsharp masking everything is sharpened, not just the edges where sharpening is most
needed. Also by doing unsharp masking the noise is amplified. One convolution has to
be applied to blur the image. In unsharp masking the number of multiplication steps is
more because there are more steps in unsharp masking, as first we have to blur the
image and then we multiply again to enhance the details. Hence multiplication
complexity increases.

15
2.5 Thresholding
Otsu Thresholding
Otsu's thresholding method involves iterating through all thepossible threshold values
and calculating a measure of spread for thepixel levels each side of the threshold, i.e. the
pixels that either fall inforeground or background. The aim is to find the threshold value
where the sum of foreground and background spreads is at its minimum.
Find the threshold that minimizes the weighted within-class variance depending upon
the weiht,mean and variance of the background and foregroung pixels and it gives better
results than any other thresholding technique.
Algorithm:
1.Compute histogram and probabilities of each intensity level.
2.Set up initial weights and mean.
3.Step through all possible thresholds maximum intensity.
1.Update weight and mean.
2.Compute variance.
3.Compute within class variance.
4.Desired threshold corresponds to the minimum within class variance.

16
Results:
Orignal Image After Otsu Thresholding
(300*336)pixels (300*336)pixels
Size:47 kb Size:29.9 kb
Figure 2.5.1 Thresholding
The advantage of Otsu method is that it produces more accurate results.
The disadvantages of Otsu method is that it has lots of calculation involved in
calculating weight,mean&variance.The histogram (and the image) are bimodal. The
method assumes stationary statistics and cannot be modified to be locally adaptive. It
assumes uniform illumination so the bimodalbrightness behavior arises from object
appearance differences only.
2.6 Thinning
Thinning is a morphological operation that is used to remove selected foreground pixels
from binary images, somewhat like erosion or opening. It can be used for several
applications, but is particularly useful for skeletonization. In this mode it is commonly
used to tidy up the output of edge detectors by reducing all lines to single pixel
thickness. Thinning is normally only applied to binary images, and produces another
binary image as output.
17
Gabor filtering is used for filtering and sobel filter is used for Edge detection of the
normalized fingerprint.
In thinning algorithms, the best algorithm is Zhang Suen algorithm as it considers end to
end points and also takes care of the minutiae‟s and the bifurcations in an efficient way.
The disadvantages are that thinning involves loss of data, like minutiaes and bifurcations
which even in some cases Zhang Suen has not been able to solve.
Brightness:
Brightness=(0.2126*r) +( 0.7152*g) +( 0.0722*b)
Contrast:
(Maximum Brightness-Minimum Brightness) / (Maximum Brightness+Minimum
Brightness)
Scilab
Scilab is an open source; cross-platform numerical computation package. It can be used
for signal processing, image and video processing, numerical optimization and modeling
and simulation of explicit and implicit systems. We made use of Scilab because it is an
open source platform and provides good processing results.Image processing and
enhancement needs packages like IPD and SIVP needed to installed separately.

18
Chapter 3
Hardware
It is the optical assembly mounted over the camera of the Aakash tablet.
Apparatus used:
Black acrylic (3 mm thick)
Transparent acrylic (3 mm thick, 32.5mm x 35 mm)
PCB
LEDs (4 quantity, 3 mm thick)
Resistors (4 quantity, 220 ohms)
Wires
Driller
Soldering gun
Soldering wire
Hack saw
File
Polishing paper
Adapter (Output voltage: 5V DC)
Assembly consists of 3 parts-
1. Clamp – To fix the assembly, with the tablet over the camera and also to
hold the spacer.
2. Spacer – To maintain a certain distance between the camera and
fingerprint, such that a clear and consistent image is taken.
3. Optical – To illuminate the finger, while fingerprint image has to be
taken.
Clamp – It is made of black acrylic (opaque) which fits directly onto the
camera of the Aakash tablet and there is also spacer holding capability of the
clamp.

19
Spacer – To get better focusing of the image, there should be a certain distance
between the finger and the camera. I have taken distance as 30 mm. I got this
value by making cardboard prototypes of different heights of the spacer. Spacer
is mounted on the clamp.
Optical – This part is to actually implement the FTIR (frustrated total internal
reflection) principle for fingerprint recognition. This consists of two parts-
1. PCB – On this, leds are mounted just next to the acrylic plate on which
fingerprint has to be kept. When we need to take the fingerprint image,
LEDs glow and due to FTIR principle we get a fingerprint image which
differentiates between the ridges and valleys of the finger.
2. Lid – To cover the PCB so that outside light does not affect the
fingerprint image
Figure 3.1 Optical assembly attachment for Aakash tablet (Side view)

20
Figure 3.2 Optical assembly attachment for Aakash tablet (Top View)

21
Chapter 4
Experimental Results
4.1 Experiment 1:
4.1.1Input RGB Image SPECIFICATIONS:
Figure 4.1.1
Table No. 4.1.1
DIMENSIONS 2048x1536
SIZE 233 KB
DPI 300
FILE TYPE .jpg
COLOUR
REPRESENTATION
RGB(values from 0 TO 255)
CAMERA MAKER NOKIA 5530
EXPOSURE TIME 1/167 SECONDS
FOCAL LENGTH 4 mm
CAMERA
SPECIFICATION
3.0 Megapixel
IMAGE
HISTOGRAM
BRIGHTNESS
HISTOGRAM
CONTRAST 1

22
Note: The minimum dimensions for an image to be accepted is 300x200 pixels.
The maximum size of the image has been decided to be 5MB.
4.1.2 Cropped Image (Manual)
SPECIFICATIONS:
Figure 4.1.2
Table No. 4.1.2
DIMENSIONS 836x639
SIZE 64.2 KB
DPI 300
FILE TYPE .jpg
IMAGE
HISTOGRAM
BRIGHTNESS
HISTOGRAM
CONTRAST 0.8822

23
4.1.3 Image Grayscaling
SPECIFICATIONS:
Figure 4.1.3
Table No. 4.1.3
4.1.4 Image Resizing
SPECIFICATIONS:
Figure 4.1.4
Table No. 4.1.4
DIMENSIONS 836x639
SIZE 46 KB
DPI 300
FILE TYPE .jpg
IMAGE
HISTOGRAM
DIMENSIONS 300x200
SIZE 6.02 KB
DPI 300
FILE TYPE .jpg
IMAGE
HISTOGRAM

24
4.1.5 ImageAdaptive Histogram Equalization
SPECIFICATIONS:
Figure 4.1.5
Table No. 4.1.5
4.1.6 Image Sharpening
SPECIFICATIONS:
Figure 4.1.6
Table No. 4.1.6
DIMENSIONS 300x200
SIZE 12.1 KB
DPI 300
FILE TYPE .jpg
IMAGE
HISTOGRAM
DIMENSIONS 300x200
SIZE 22.4 KB
DPI 300
FILE TYPE .jpg
IMAGE
HISTOGRAM

25
4.1.7 Image Thresholding
SPECIFICATIONS:
Figure 4.1.7
Table No. 4.1.7
4.1.8 IMAGE THINNING
SPECIFICATIONS:
Figure 4.1.8
Table No. 4.1.8
DIMENSIONS 300x200
SIZE 37.1 KB
DPI 300
FILE TYPE .jpg
IMAGE
HISTOGRAM
DIMENSIONS 300x200
SIZE 36.6 KB
DPI 300
FILE TYPE .jpg
IMAGE
HISTOGRAM

26
4.2 Experiment 2:
4.2.1 Input RGB Image(from Aakash tablet)
SPECIFICATIONS:
Figure 4.2.1
Table No. 4.2.1
DIMENSIONS 640x480
SIZE 159 KB
DPI 96
FILE TYPE .jpg
COLOUR
REPRESENTATION
RGB(values from 0 TO 255)
CAMERA MAKER MID 001
FOCAL LENGTH 3 mm
CAMERA
SPECIFICATION
0.3 MEGAPIXELS VGA
IMAGE
HISTOGRAM
BRIGHTNESS
HISTOGRAM
CONTRAST
27
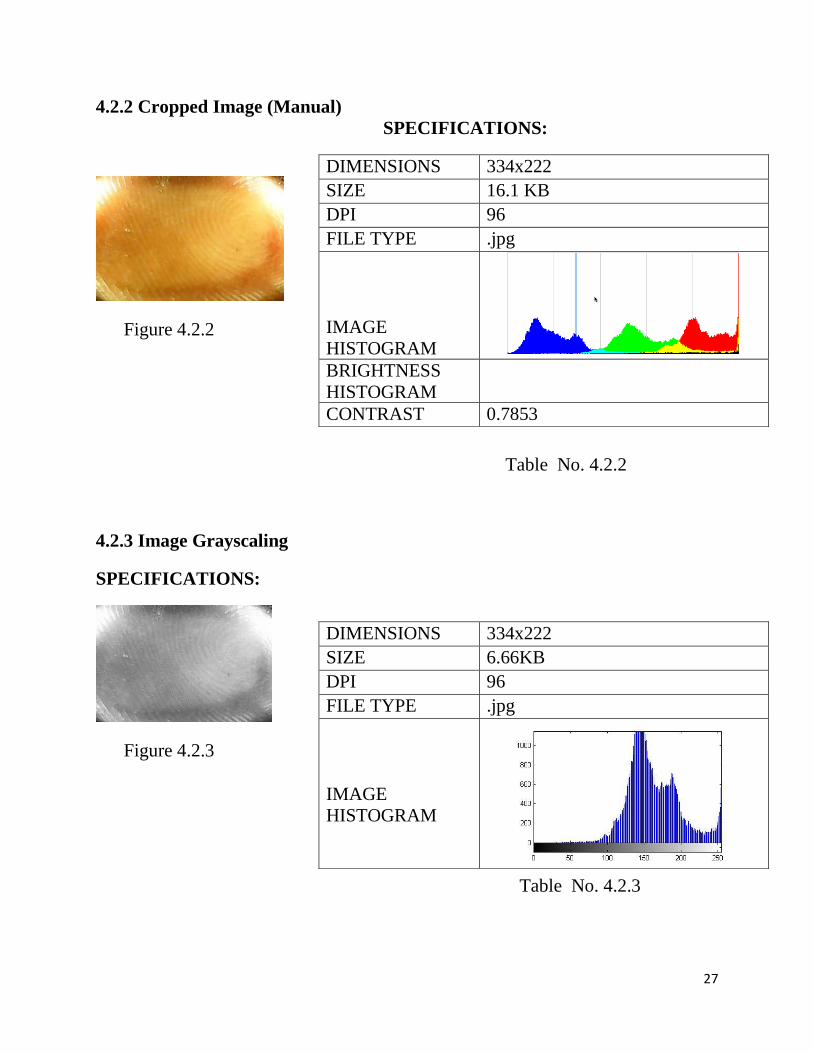
4.2.2 Cropped Image (Manual)
SPECIFICATIONS:
Figure 4.2.2
Table No. 4.2.2
4.2.3 Image Grayscaling
SPECIFICATIONS:
Figure 4.2.3
Table No. 4.2.3
DIMENSIONS 334x222
SIZE 16.1 KB
DPI 96
FILE TYPE .jpg
IMAGE
HISTOGRAM BRIGHTNESS
HISTOGRAM
CONTRAST 0.7853
DIMENSIONS 334x222
SIZE 6.66KB
DPI 96
FILE TYPE .jpg
IMAGE
HISTOGRAM

28
4.2.4 Image Resizing
Figure 4.2.4
Table No. 4.2.4
4.2.5 Image Adaptive Histogram Equalization
SPECIFICATIONS:
Figure 4.2.5
Table No. 4.2.5
DIMENSIONS 300x200
SIZE 5.77 KB
DPI 96
FILE TYPE .jpg
IMAGE
HISTOGRAM
DIMENSIONS 300x200
SIZE 10.8 KB
DPI 96
FILE TYPE .jpg
IMAGE
HISTOGRAM

29
4.2.6 Image Sharpening
SPECIFICATIONS:
Figure 4.2.6
Table No. 4.2.6
4.2.7 Image Thresholding
SPECIFICATIONS:
Figure 4.2.7
DIMENSIONS 300x200
SIZE 19.2 KB
DPI 96
FILE TYPE .jpg
IMAGE
HISTOGRAM
DIMENSIONS 300x200
SIZE 31.9 KB
DPI 96
FILE TYPE .jpg
IMAGE
HISTOGRAM

30
4.2.8 Image Thinning
SPECIFICATIONS:
Figure 4.2.8
Table No. 4.2.8
DIMENSIONS 300x200
SIZE 31.0 KB
DPI 96
FILE TYPE .jpg
IMAGE
HISTOGRAM

31
Experimental Results With Different Number of Leds ON
4.3 Experiment 3: With all Leds on
4.3.1 Cropped Image (Manual)
Figure 4.3.1
SPECIFICATIONS:
Dimensions: 386 x 398
Size: 219 KB
DPI 96
File Type: .jpg
Histogram image

32
4.4 Experiment 4: With 3 Leds on
4.4.1 Cropped Image (Manual)
Figure 4.4.1
SPECIFICATIONS:
Dimensions: 447x 315
Size: 29 KB
DPI: 96
File Type: .jpg
Histogram Image

33
4.5 Experiment 5: With 2 Leds(adjacent) on
4.5.1 Cropped Image (Manual)
Figure 4.5.1
SPECIFICATIONS:
Dimensions: 452 x 323
Size: 30.4 KB
DPI: 96
File type: .jpg
Histogram image

34
4.6 Experiment 6: With 2 Leds(diagonal) on
4.6.1 Cropped Image (Manual)
Figure 4.6.1
SPECIFICATIONS:
Dimensions: 427 x 291
Size: 24.3 KB
DPI: 96
File type: .jpg
Histogram Image

35
4.7 Experiment 7: With 1 Led on
4.7.1 Cropped image (Manual)
Figure 4.7.1
SPECIFICATIONS:
Dimensions: 449 x 310
Size: 27.8 KB
DPI: 96
File type: .jpg
Histogram Image

36
5. Conclusion
In today's world, it is important to be secure from every possible area which has
threads of being attacked. With emerging technology the security can be much
effectively used.
The reliability of any automatic fingerprint system strongly relies on the precision
obtained in the minutia extraction process. A number of factors are detrimental to
the correct location of minutia. Among them, poor image quality is the most
serious one. In this project, wehave combined many methods to build a minutia
extractor and a minutia matcher. The following concepts have been used-
segmentation using Morphological operations, minutia marking byespecially
considering the triple branch counting, minutia unification by decomposing a
branch into three terminations and matching in the unified x-y coordinate system
after a 2-step transformation in order to increase the precision of the minutia
localization process and elimination of spurious minutia with higher accuracy.
The proposed alignment-based elastic matching algorithm is capable of finding the
correspondences between minutiae without resorting to exhaustive research.
There is a scope of further improvement in terms of efficiency and accuracy which
can be achieved by improving the hardware to capture the image or by improving
the image enhancement techniques. So that the input image to the thinning stage
could be made better which could improve the future stages and the final outcome.

37
6. Bibliography
[1] “1998 IEEE Recommended Practice for Software RequirementsSpecifications.
IEEE Computer Society, 1998. - IEEE Std 830”
[2]ChiragDadlani, Arun Kumar Passi, Herman Sahota, MitinKrishan Kumar,
Under Prof. Ajay Kumar Pathak, IIT Delhi- “Fingerprint Recognition Using
Minutiae-Based Features”
[3] Javier Ortega-Garcia,JosefBigun, Douglas Reynolds and Joaquin Gonzalez-
Rodriguez – “Authentication gets personal with biometrics.”
[4] Dario Maio, Anil K. Jain –“Handbook of fingerprint recognition.”
[5] Raman Maini and Dr. HimanshuAgarwal –“Study and Comparison of various
Image edge detection techniques.”
[6] Z.Guo , RW Hall-“Full parallel thinning with tolerance to boundary noise.”
[7] TY Zhang, CY Suen- “Thinning Methodologies : a comprehensive survey.”
[8] P. Kumar, D. Bhatnagar, and P.S. UmapathiRao –“ Pseudo one pass Thinning
Algorithm. Pattern Recognition Letters, 12:543--555, 1991”
[9] Aadhaar Authentication Basics - http://developer.uidai.gov.in/site/auth_basics
[10] “Aadhar Authentication: API Specification- Version 1.5”

38
[11] Unique Identification Authority of India (UIDAI)
http://uidai.gov.in/UID_PDF/Front_Page_Articles/Documents/Strategy_Overveiw
-001.pdf
[12] UIDAI home page - http://uidai.gov.in/UID_PDF
[13] Biometrics Design Standards UID applications
http://uidai.gov.in/UID_PDF/Committees/Biometrics_Standards_Committee_repor
t.pdf
[14] Robert K. Rowe, Kristin Adair Nixon, and Paul W. Butler
-“Multispectral Fingerprint Image Acquisition”
[15] Biometrics Design Standards for UID applications
http://www.it.iitb.ac.in/arndg/brain2013/sites/default/files/SEIR_0.pdf
[16] Richard Wilde -Iris Recognition: “An Emerging Biometric Technology”
[17] Daugman –“How Iris Recognition Works”
Related Documents