III. THE MOVING EARTH As a region host to the collision between the Indian and Eurasian tectonic plates, the Himalayas are an area subject to deformation, its motions being measured by way of GPS, and a DORIS station. CEA/DAM Whether at the scale of geological eras, or over shorter timescales, or even by abrupt surges, the Earth is moving, and changing. The manifestations of this unceasing travail of our planet may prove violent, and destructive to a greater or lesser extent, as e.g. earthquakes, tsunamis and volcanic eruptions. They may also be almost imperceptible, as the evolution of receding coastlines, or estuaries silting up. All the more so as regards the motions of tectonic plates, which are in turn the deep, underlying causes of the violent phenomena mentioned above. Researchers at CEA have long since been addressing such phenomena, for a number of distinct purposes. Those in charge of nuclear tests needed to gain better knowledge of the environments in which these were carried out, if they were to control their effects, and arrive at estimates of their results. This remit led them to avail themselves of the resources to detect tests by other nuclear powers, whether avowed or otherwise – resources that took on their full significance under the aegis of international nuclear proliferation controls. Underground nuclear tests generate seismic waves, similar to those due to earthquakes, and it was a natural step for that monitoring activity to extend to seismology as a whole. Thus, the aim is to detect, and identify, in real time, any seismic event, regardless of its origin, to evaluate whether that event may have caused a tsunami, and, should this be the case, to have the ability to warn exposed coastal areas, while advancing ever further our knowledge of the Earth’s motions. In these various areas, the scientist involved have been at the same time deploying conventional instruments, and developing novel techniques, even as they were putting to use techniques initially developed for other purposes, e.g. satellite positioning. Thus, permanent GPS stations are measuring, with millimeter precision, the motions, and deformations of tectonic plates. For other research workers in the organization, the focus is on implementing the many practical applications of nucleonic methods, for the purposes of investigating sediment dynamics in fluvial, and coastal environments. These methods involve three types of radionuclides. Some are introduced artificially, remaining active however over very short timespans, to preclude effects on the environment. Other radionuclides, standing as traces of past events, e.g. atmospheric nuclear tests, are ultimately pressed into service, to make a positive contribution to Earth, and environmental sciences. Others, finally, of altogether natural origin, as e.g. radon produced in the Earth’s crust, play an irreplaceable part in atmospheric tracing techniques. For the purposes, in particular, of gaining a better understanding of greenhouse gas transport, with regard, more particularly, to carbon dioxide – which brings us right back to the concerns of the first chapter in this issue. CLEFS CEA - No. 57 - WINTER 2008-2009 85

Welcome message from author
This document is posted to help you gain knowledge. Please leave a comment to let me know what you think about it! Share it to your friends and learn new things together.
Transcript
III. THE MOVING EARTH
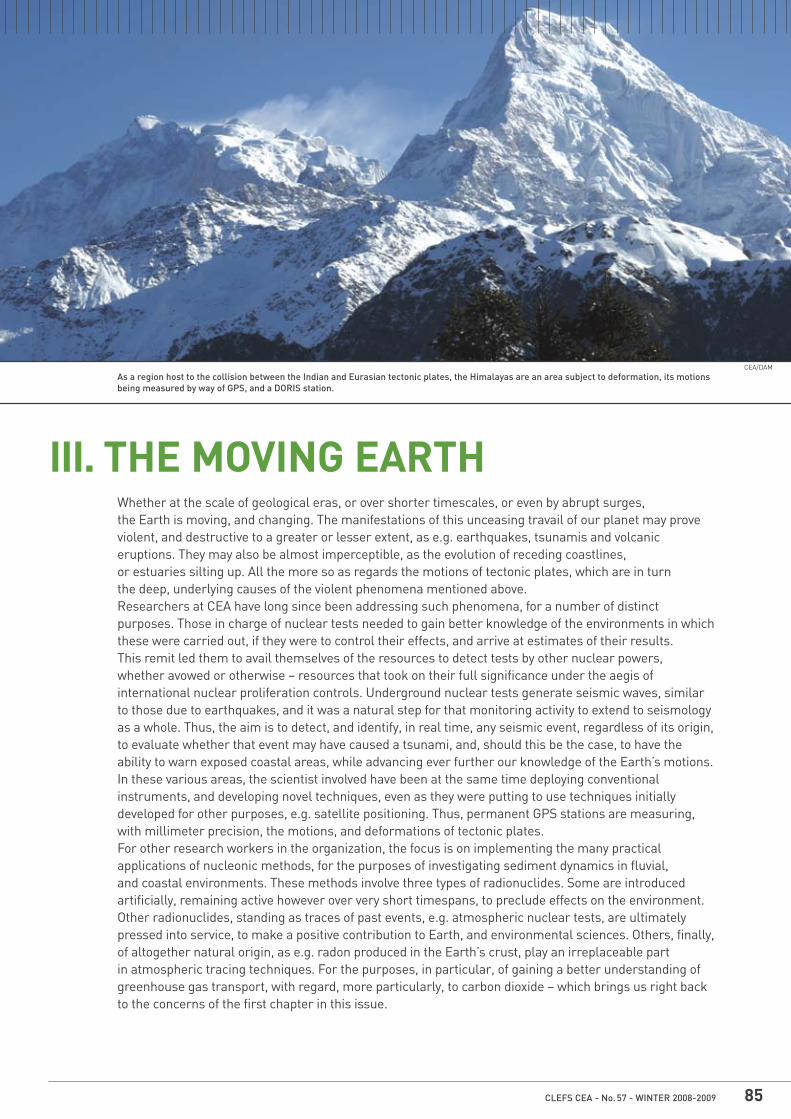
As a region host to the collision between the Indian and Eurasian tectonic plates, the Himalayas are an area subject to deformation, its motionsbeing measured by way of GPS, and a DORIS station.
CEA/DAM
Whether at the scale of geological eras, or over shorter timescales, or even by abrupt surges, the Earth is moving, and changing. The manifestations of this unceasing travail of our planet may proveviolent, and destructive to a greater or lesser extent, as e.g. earthquakes, tsunamis and volcaniceruptions. They may also be almost imperceptible, as the evolution of receding coastlines, or estuaries silting up. All the more so as regards the motions of tectonic plates, which are in turn the deep, underlying causes of the violent phenomena mentioned above.Researchers at CEA have long since been addressing such phenomena, for a number of distinctpurposes. Those in charge of nuclear tests needed to gain better knowledge of the environments in whichthese were carried out, if they were to control their effects, and arrive at estimates of their results. This remit led them to avail themselves of the resources to detect tests by other nuclear powers, whether avowed or otherwise – resources that took on their full significance under the aegis ofinternational nuclear proliferation controls. Underground nuclear tests generate seismic waves, similarto those due to earthquakes, and it was a natural step for that monitoring activity to extend to seismologyas a whole. Thus, the aim is to detect, and identify, in real time, any seismic event, regardless of its origin,to evaluate whether that event may have caused a tsunami, and, should this be the case, to have theability to warn exposed coastal areas, while advancing ever further our knowledge of the Earth’s motions.In these various areas, the scientist involved have been at the same time deploying conventionalinstruments, and developing novel techniques, even as they were putting to use techniques initiallydeveloped for other purposes, e.g. satellite positioning. Thus, permanent GPS stations are measuring,with millimeter precision, the motions, and deformations of tectonic plates.For other research workers in the organization, the focus is on implementing the many practicalapplications of nucleonic methods, for the purposes of investigating sediment dynamics in fluvial, and coastal environments. These methods involve three types of radionuclides. Some are introducedartificially, remaining active however over very short timespans, to preclude effects on the environment.Other radionuclides, standing as traces of past events, e.g. atmospheric nuclear tests, are ultimatelypressed into service, to make a positive contribution to Earth, and environmental sciences. Others, finally,of altogether natural origin, as e.g. radon produced in the Earth’s crust, play an irreplaceable part in atmospheric tracing techniques. For the purposes, in particular, of gaining a better understanding ofgreenhouse gas transport, with regard, more particularly, to carbon dioxide – which brings us right backto the concerns of the first chapter in this issue.
CLEFS CEA - No. 57 - WINTER 2008-2009 85
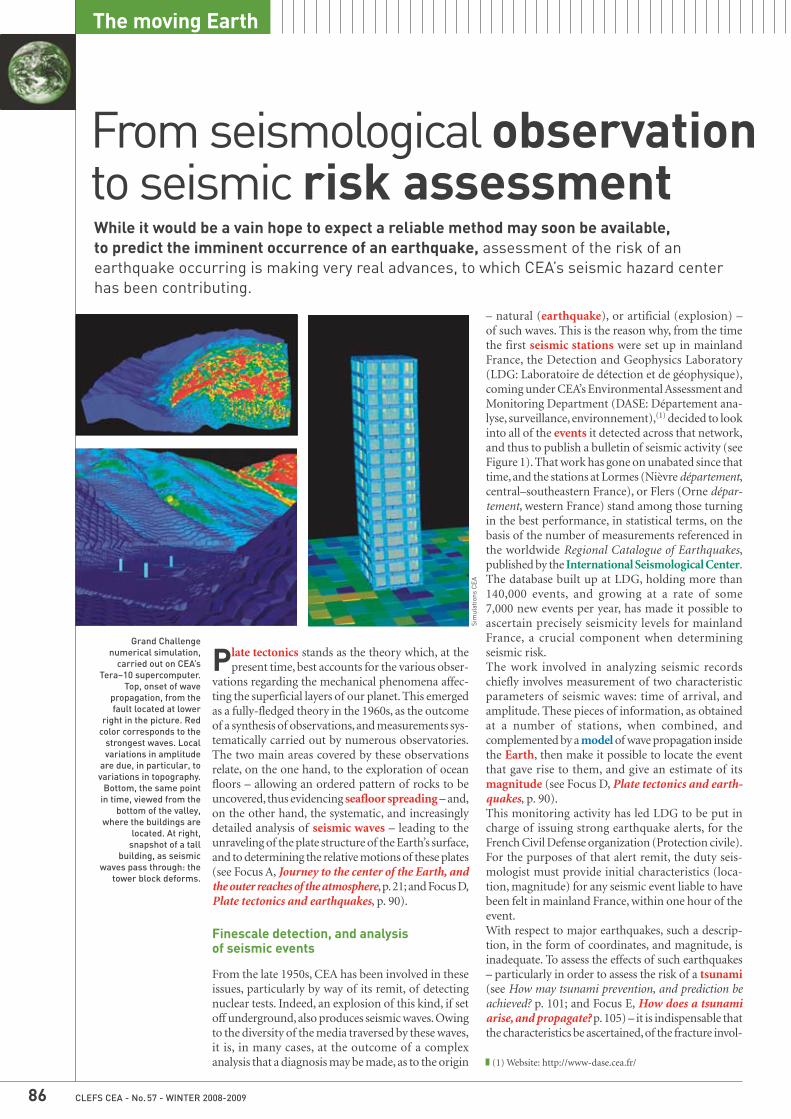
Grand Challengenumerical simulation,
carried out on CEA’sTera–10 supercomputer.
Top, onset of wavepropagation, from thefault located at lower
right in the picture. Redcolor corresponds to the
strongest waves. Localvariations in amplitude
are due, in particular, tovariations in topography.
Bottom, the same pointin time, viewed from the
bottom of the valley,where the buildings are
located. At right,snapshot of a tall
building, as seismicwaves pass through: the
tower block deforms.
Sim
ulat
ions
CEA
CLEFS CEA - No. 57 - WINTER 2008-200986
The moving Earth
While it would be a vain hope to expect a reliable method may soon be available, to predict the imminent occurrence of an earthquake, assessment of the risk of anearthquake occurring is making very real advances, to which CEA’s seismic hazard centerhas been contributing.
From seismological observationto seismic risk assessment
Plate tectonics stands as the theory which, at thepresent time, best accounts for the various obser-
vations regarding the mechanical phenomena affec-ting the superficial layers of our planet. This emergedas a fully-fledged theory in the 1960s, as the outcomeof a synthesis of observations, and measurements sys-tematically carried out by numerous obser vatories.The two main areas covered by these observationsrelate, on the one hand, to the exploration of oceanfloors – allowing an ordered pattern of rocks to beuncovered, thus evidencing seafloor spreading – and,on the other hand, the systematic, and increasinglydetailed analysis of seismic waves – leading to theunraveling of the plate structure of the Earth’s surface,and to determining the relative motions of these plates(see Focus A, Journey to the center of the Earth, andthe outer reaches of the atmosphere, p.21; and Focus D,Plate tectonics and earthquakes, p. 90).
Finescale detection, and analysis of seismic events
From the late 1950s, CEA has been involved in theseissues, particularly by way of its remit, of detectingnuclear tests. Indeed, an explosion of this kind, if setoff underground, also produces seismic waves. Owingto the diversity of the media traversed by these waves,it is, in many cases, at the outcome of a complex analysis that a diagnosis may be made, as to the origin
– natural (earthquake), or artificial (explosion) –of such waves. This is the reason why, from the timethe first seismic stations were set up in mainlandFrance, the Detection and Geophysics Laboratory(LDG: Laboratoire de détection et de géophysique),coming under CEA’s Environmental Assessment andMonitoring Department (DASE: Département ana-lyse, surveillance, environnement),(1) decided to lookinto all of the events it detected across that network,and thus to publish a bulletin of seismic activity (seeFigure 1). That work has gone on unabated since thattime, and the stations at Lormes (Nièvre département,central–southeastern France), or Flers (Orne dépar-tement, western France) stand among those turningin the best performance, in statistical terms, on thebasis of the number of measurements referenced inthe worldwide Regional Catalogue of Earthquakes,published by the International Seismological Center.The database built up at LDG, holding more than140,000 events, and growing at a rate of some7,000 new events per year, has made it possible toascertain precisely seismicity levels for mainlandFrance, a crucial component when determining seismic risk.The work involved in analyzing seismic records chiefly involves measurement of two characteristicparameters of seismic waves: time of arrival, andamplitude. These pieces of information, as obtainedat a number of stations, when combined, and complemented by a model of wave propagation insidethe Earth, then make it possible to locate the eventthat gave rise to them, and give an estimate of itsmagnitude (see Focus D, Plate tectonics and earth-quakes, p. 90).This monitoring activity has led LDG to be put incharge of issuing strong earthquake alerts, for theFrench Civil Defense organization (Protection civile).For the purposes of that alert remit, the duty seis-mologist must provide initial characteristics (loca-tion, magnitude) for any seismic event liable to havebeen felt in mainland France, within one hour of theevent.With respect to major earthquakes, such a descrip-tion, in the form of coordinates, and magnitude, isinadequate. To assess the effects of such earthquakes– particularly in order to assess the risk of a tsunami(see How may tsunami prevention, and prediction beachieved? p. 101; and Focus E, How does a tsunamiarise, and propagate? p. 105) – it is indispensable thatthe characteristics be ascertained, of the fracture invol-
(1) Website: http://www-dase.cea.fr/
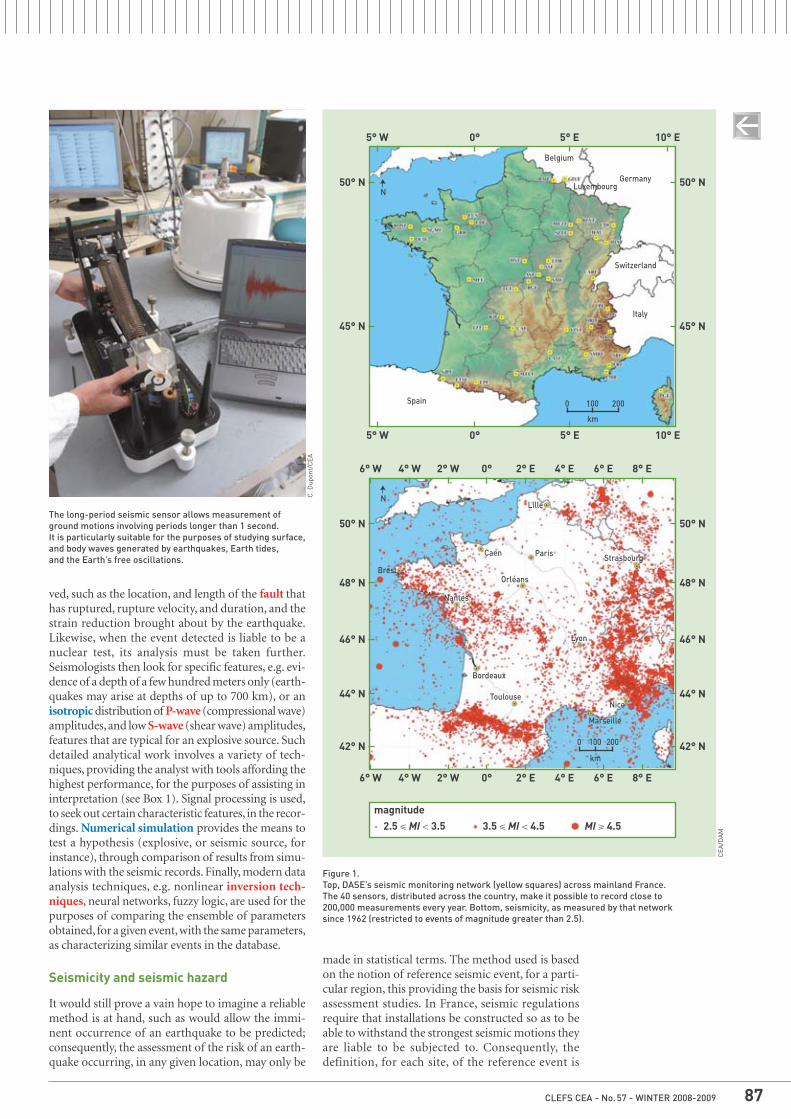
Figure 1.Top, DASE’s seismic monitoring network (yellow squares) across mainland France. The 40 sensors, distributed across the country, make it possible to record close to200,000 measurements every year. Bottom, seismicity, as measured by that network since 1962 (restricted to events of magnitude greater than 2.5).
CEA
/DA
M
CLEFS CEA - No. 57 - WINTER 2008-2009 87
ved, such as the location, and length of the fault thathas ruptured, rupture velocity, and duration, and thestrain reduction brought about by the earthquake.Likewise, when the event detected is liable to be anuclear test, its analysis must be taken further.Seismologists then look for specific features, e.g. evi-dence of a depth of a few hundred meters only (earth-quakes may arise at depths of up to 700 km), or anisotropic distribution of P-wave (compressional wave)amplitudes, and low S-wave (shear wave) amplitudes,features that are typical for an explosive source. Suchdetailed analytical work involves a variety of tech-niques, providing the analyst with tools affording thehighest performance, for the purposes of assisting ininterpretation (see Box 1). Signal processing is used,to seek out certain characteristic features, in the recor-dings. Numerical simulation provides the means totest a hypothesis (explosive, or seismic source, forinstance), through comparison of results from simu-lations with the seismic records. Finally, modern dataanalysis techniques, e.g. nonlinear inversion tech-niques, neural networks, fuzzy logic, are used for thepurposes of comparing the ensemble of parametersobtained, for a given event, with the same parameters,as characterizing similar events in the database.
Seismicity and seismic hazard
It would still prove a vain hope to imagine a reliablemethod is at hand, such as would allow the immi-nent occurrence of an earthquake to be predicted;consequently, the assessment of the risk of an earth-quake occurring, in any given location, may only be
made in statistical terms. The method used is basedon the notion of reference seismic event, for a parti-cular region, this providing the basis for seismic riskassessment studies. In France, seismic regulationsrequire that installations be constructed so as to beable to withstand the strongest seismic motions theyare liable to be subjected to. Consequently, the definition, for each site, of the reference event is
The long-period seismic sensor allows measurement ofground motions involving periods longer than 1 second. It is particularly suitable for the purposes of studying surface,and body waves generated by earthquakes, Earth tides, and the Earth’s free oscillations.
C. D
upon
t/C
EA
Belgium
GermanyLuxembourg
Switzerland
Italy
Spain
Toulouse
Bordeaux
magnitude
Nantes
BrestOrléans
ParisCaen Strasbourg
Lille
Lyon
Marseille
Nice
50° N
45° N
50° N
48° N
46° N
44° N
42° N
50° N
48° N
46° N
44° N
42° N
0°
6° W 4° W 2° W 0° 2° E 4° E 6° E 8° E
6° W 4° W 2° W 0° 2° E 4° E 6° E 8° E
5° E 10° E
50° N
45° N
5° E 10° E5° W
5° W
0°
0 100 200
km
N
N
0 100 200
km
2.5 � MI � 3.5 3.5 � MI � 4.5 MI � 4.5
CLEFS CEA - No. 57 - WINTER 2008-200988
The moving Earth
the cycle governing, at a large scale, plate motions.They must thus be complemented, by researchingevents that have affected a particular region within ahuman timescale (historical seismicity), but equallyin more remote times (paleoseismicity). In France,such effects are difficult to identify, owing to low seis-micity levels. It thus proves indispensable to studymore active regions, such as Nepal, or Mongolia (seeGPS measurement of deformation: a method for theinvestigation of large-scale tectonic motions, p. 95).Site effects, as evidenced by many instances of highlydestructive earthquakes, e.g. the earthquake thatoccurred in China in May 2008, are investigated bothfrom a theoretical standpoint – in particular by wayof numerical simulations (see Box 2) – and field experiments. For that purpose, DASE operates a network of accelerometers, located either close tosensitive sites, or near seismically active areas, inorder to obtain detailed records of strong motions.Through this initiative, DASE is also a participant,
complemented by an investigation of site effects, whichmay, depending on the nature of the soil involved,considerably amplify, or damp down the amplitudeof the seismic waves generated.The definition of reference events relies, first and fore-most, on a detailed analysis of seismicity catalogs. Onthe other hand, these record but a small fraction of
This seismic station,sited in Madagascar,
operates in self-standingmode, by means of solar
panels, and a parabolicVSAT antenna. C
EA/D
AM
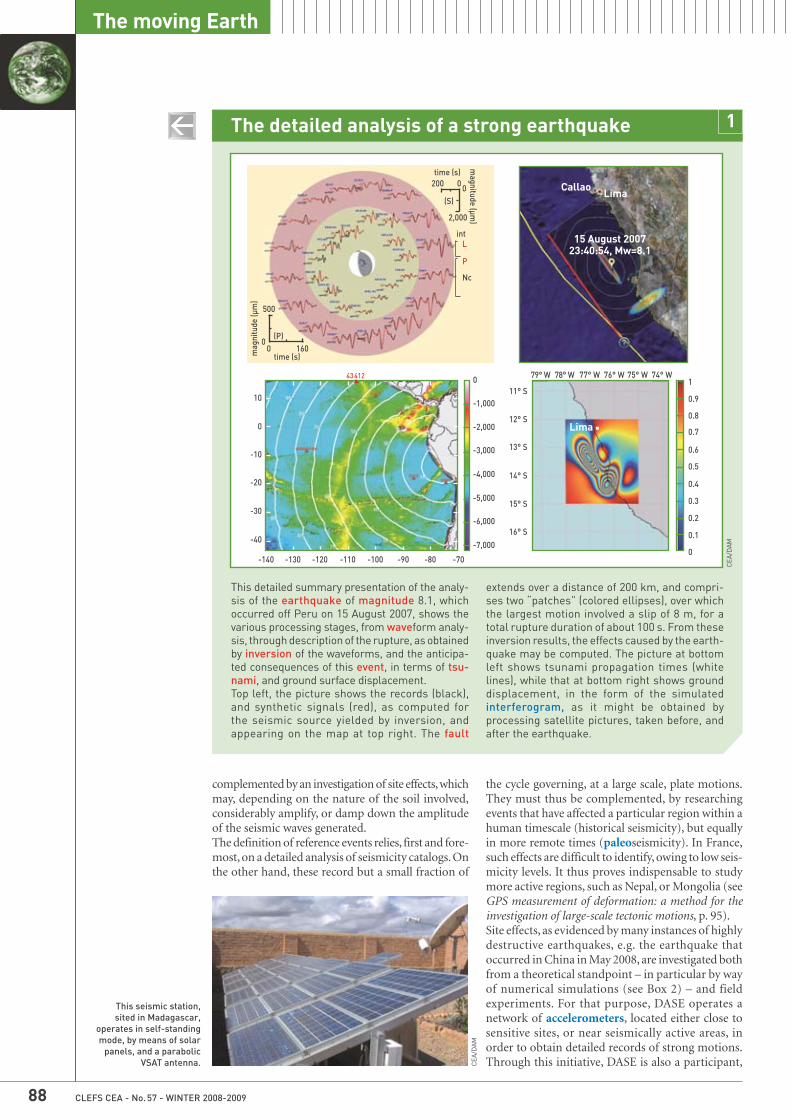
The detailed analysis of a strong earthquake
This detailed summary presentation of the analy-sis of the earthquake of magnitude 8.1, whichoccurred off Peru on 15 August 2007, shows thevarious processing stages, from waveform analy-sis, through description of the rupture, as obtainedby inversion of the waveforms, and the anticipa-ted consequences of this event, in terms of tsu-nami, and ground surface displacement.Top left, the picture shows the records (black),and synthetic signals (red), as computed forthe seismic source yielded by inversion, andappearing on the map at top right. The fault
extends over a distance of 200 km, and compri-ses two “patches” (colored ellipses), over whichthe largest motion involved a slip of 8 m, for atotal rupture duration of about 100 s. From theseinversion results, the effects caused by the earth-quake may be computed. The picture at bottomleft shows tsunami propagation times (whitelines), while that at bottom right shows grounddisplacement, in the form of the simulatedinterferogram, as it might be obtained by processing satellite pictures, taken before, andafter the earthquake.
1
CEA
/DA
M
00
500
mag
nitu
de (μ
m)
time (s)160
int
Nc
P
L
200 0 0
magnitude (μm
)
time (s)
2,000
(S)
(P)
CallaoLima
15 August 2007 23:40:54, Mw=8.1
Lima
0
0.1
0.2
0.3
0.4
0.5
0.6
0.7
0.8
0.9
1
-7,000
-6,000
-5,000
-4,000
-3,000
-2,000
-1,000
0
10
0
-10
-20
-30
-40
-140 -130 -120 -110 -100 -90 -80 -70
11° S
12° S
13° S
14° S
15° S
16 ° S
78° W 76° W 74° W77° W 75° W79° W43 412▲
CLEFS CEA - No. 57 - WINTER 2008-2009 89
at the national scale, in the French PermanentAccelerometer Network (RAP: Réseau accéléromé-trique permanent).All of these activities enable LDG – acting as CEA’sseismic hazard expertise center, since 1996 – to carryout, on behalf of safety authorities, mandatory sitestudies, as required by current legislation.
The contribution of numerical simulation
As soon as the main wave types were identified, seis-mologists sought to arrive at a theoretical formula-tion for these waves, this subsequently serving forthe computation of waveforms. From the 1960sthrough to the 1980s, many algorithms were publis-hed, making it possible, for the various types of seis-mic wave, to produce increasingly realistic, synthe-tic seismograms, by integrating models of the Earth’sinternal structure, of ever greater precision. However,all these methods work on the assumption of a regu-lar, stratified structure of soil horizons. In order toarrive at a more realistic approach, integrating e.g. athree-dimensional model of propagation, discretemethods – i.e. methods resolving space and time intoa cell grid – must be used, for the purposes of com-puting the stepwise evolution of seismic waves, fromone cell to the next, for every point in the grid. Oflate, a new computation code, developed at DASE,and dubbed Mka3D, has made it possible to imple-ment such a formalization, for the purposes of pro-cessing, simultaneously, rupture problems – e.g. alongthe fault, or around unstable blocks, falling understress from the propagation of seismic waves – andproblems of elastic mechanics – e.g. wave propaga-tion through the ground, or in building structures(see Box 2).
A synergy of competences
The remits assigned to CEA mean DASE is able to beinvolved in a wide gamut of activities, related to thearea of Earth sciences. These activities involve exper-tise in a variety of domains, going beyond the strictconfines of Earth sciences. Such synergy of compe-tences, brought together within a single unit, provi-des each research scientist or engineer with the abi-lity to draw on the tools best suited for the issues athand, or, in any event, to be involved in developingsuch tools, with a high assurance of effectiveness inthe process.
> Yves Cansi, Jocelyn Guilbert and Marc Nicolas Environmental Assessment
and Monitoring Department (DASE) Military Applications Division
CEA DAM–Île-de-France Center
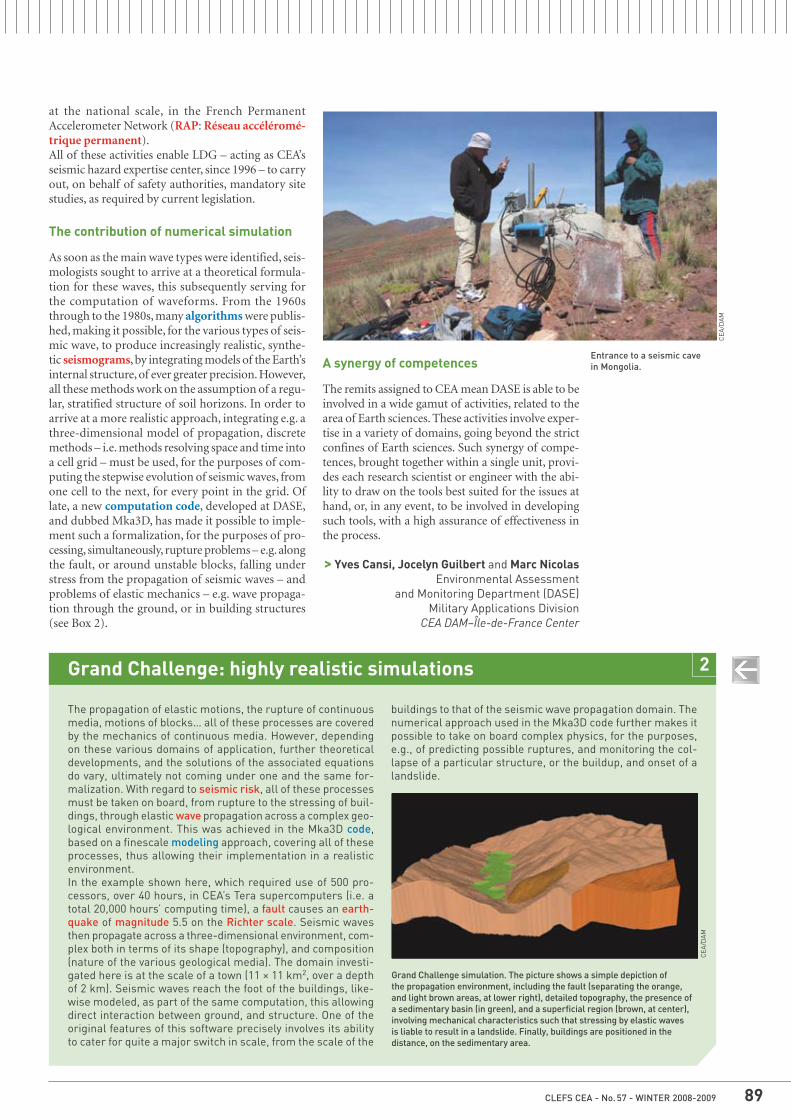
Grand Challenge: highly realistic simulations
The propagation of elastic motions, the rupture of continuousmedia, motions of blocks… all of these processes are coveredby the mechanics of continuous media. However, dependingon these various domains of application, further theoreticaldevelopments, and the solutions of the associated equationsdo vary, ultimately not coming under one and the same for-malization. With regard to seismic risk, all of these processesmust be taken on board, from rupture to the stressing of buil-dings, through elastic wave propagation across a complex geo-logical environment. This was achieved in the Mka3D code,based on a finescale modeling approach, covering all of theseprocesses, thus allowing their implementation in a realisticenvironment.In the example shown here, which required use of 500 pro-cessors, over 40 hours, in CEA’s Tera supercomputers (i.e. atotal 20,000 hours’ computing time), a fault causes an earth-quake of magnitude 5.5 on the Richter scale. Seismic wavesthen propagate across a three-dimensional environment, com-plex both in terms of its shape (topography), and composition(nature of the various geological media). The domain investi-gated here is at the scale of a town (11 × 11 km2, over a depthof 2 km). Seismic waves reach the foot of the buildings, like-wise modeled, as part of the same computation, this allowingdirect interaction between ground, and structure. One of theoriginal features of this software precisely involves its abilityto cater for quite a major switch in scale, from the scale of the
buildings to that of the seismic wave propagation domain. Thenumerical approach used in the Mka3D code further makes itpossible to take on board complex physics, for the purposes,e.g., of predicting possible ruptures, and monitoring the col-lapse of a particular structure, or the buildup, and onset of alandslide.
2
CEA
/DA
M
Entrance to a seismic cave in Mongolia.
CEA
/DA
M
Grand Challenge simulation. The picture shows a simple depiction of the propagation environment, including the fault (separating the orange,and light brown areas, at lower right), detailed topography, the presence ofa sedimentary basin (in green), and a superficial region (brown, at center),involving mechanical characteristics such that stressing by elastic waves is liable to result in a landslide. Finally, buildings are positioned in thedistance, on the sedimentary area.
CLEFS CEA - No. 57 - WINTER 2008-200990
The moving Earth
DFOCUS
The Earth’s crust, i.e. the superficial,outermost portion of our planet, enve-
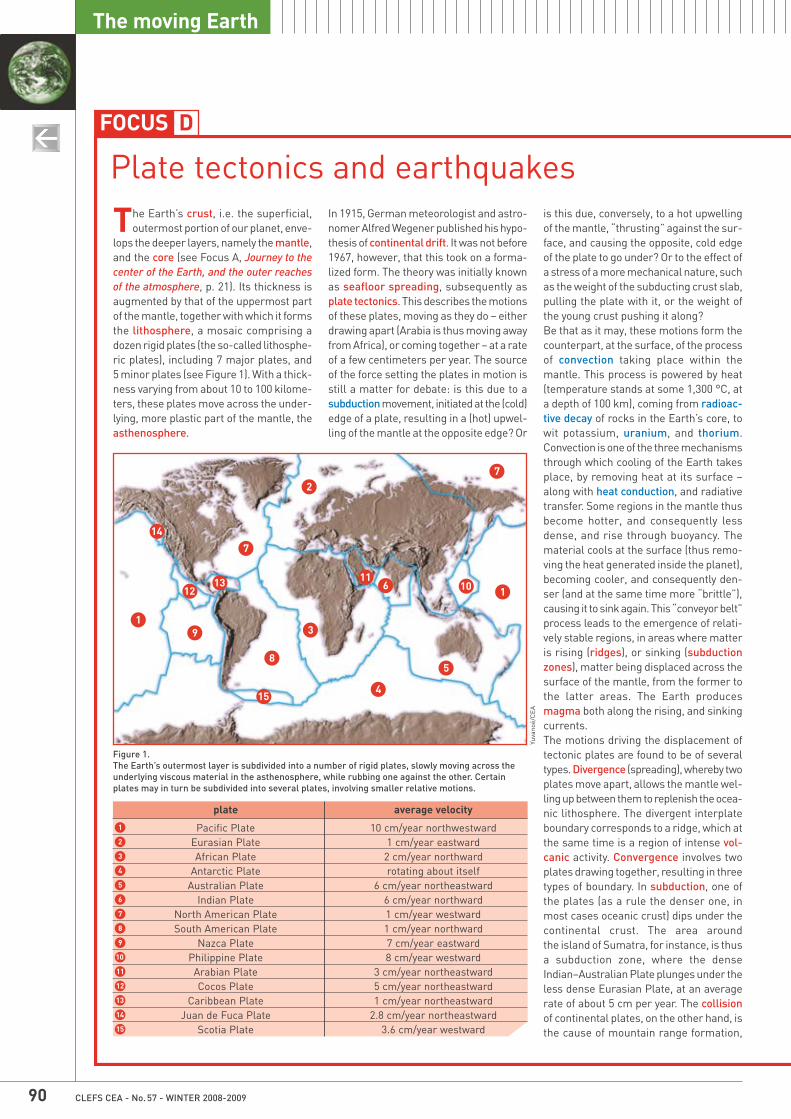
lops the deeper layers, namely the mantle,and the core (see Focus A, Journey to thecenter of the Earth, and the outer reachesof the atmosphere, p. 21). Its thickness isaugmented by that of the uppermost partof the mantle, together with which it formsthe lithosphere, a mosaic comprising adozen rigid plates (the so-called lithosphe-ric plates), including 7 major plates, and 5 minor plates (see Figure 1). With a thick-ness varying from about 10 to 100 kilome-ters, these plates move across the under-lying, more plastic part of the mantle, theasthenosphere.
In 1915, German meteorologist and astro-nomer Alfred Wegener published his hypo-thesis of continental drift. It was not before1967, however, that this took on a forma-lized form. The theory was initially knownas seafloor spreading, subsequently asplate tectonics. This describes the motionsof these plates, moving as they do – eitherdrawing apart (Arabia is thus moving awayfrom Africa), or coming together – at a rateof a few centimeters per year. The sourceof the force setting the plates in motion isstill a matter for debate: is this due to asubduction movement, initiated at the (cold)edge of a plate, resulting in a (hot) upwel-ling of the mantle at the opposite edge? Or
is this due, conversely, to a hot upwellingof the mantle, “thrusting” against the sur-face, and causing the opposite, cold edgeof the plate to go under? Or to the effect ofa stress of a more mechanical nature, suchas the weight of the subducting crust slab,pulling the plate with it, or the weight ofthe young crust pushing it along?Be that as it may, these motions form thecounterpart, at the surface, of the processof convection taking place within themantle. This process is powered by heat(temperature stands at some 1,300 °C, ata depth of 100 km), coming from radioac-tive decay of rocks in the Earth’s core, towit potassium, uranium, and thorium.Convection is one of the three mechanismsthrough which cooling of the Earth takesplace, by removing heat at its surface –along with heat conduction, and radiativetransfer. Some regions in the mantle thusbecome hotter, and consequently lessdense, and rise through buoyancy. Thematerial cools at the surface (thus remo-ving the heat generated inside the planet),becoming cooler, and consequently den-ser (and at the same time more “brittle”),causing it to sink again. This “conveyor belt”process leads to the emergence of relati-vely stable regions, in areas where matteris rising (ridges), or sinking (subductionzones), matter being displaced across thesurface of the mantle, from the former tothe latter areas. The Earth producesmagma both along the rising, and sinkingcurrents.The motions driving the displacement oftectonic plates are found to be of severaltypes. Divergence (spreading), whereby twoplates move apart, allows the mantle wel-ling up between them to replenish the ocea-nic lithosphere. The divergent interplateboundary corresponds to a ridge, which atthe same time is a region of intense vol-canic activity. Convergence involves twoplates drawing together, resulting in threetypes of boundary. In subduction, one ofthe plates (as a rule the denser one, in most cases oceanic crust) dips under thecontinental crust. The area around the island of Sumatra, for instance, is thusa subduction zone, where the denseIndian–Australian Plate plunges under theless dense Eurasian Plate, at an averagerate of about 5 cm per year. The collisionof continental plates, on the other hand, isthe cause of mountain range formation,
Plate tectonics and earthquakes
Figure 1.The Earth’s outermost layer is subdivided into a number of rigid plates, slowly moving across theunderlying viscous material in the asthenosphere, while rubbing one against the other. Certainplates may in turn be subdivided into several plates, involving smaller relative motions.
plate average velocity
Pacific Plate 10 cm/year northwestwardEurasian Plate 1 cm/year eastwardAfrican Plate 2 cm/year northward
Antarctic Plate rotating about itselfAustralian Plate 6 cm/year northeastward
Indian Plate 6 cm/year northwardNorth American Plate 1 cm/year westwardSouth American Plate 1 cm/year northward
Nazca Plate 7 cm/year eastwardPhilippine Plate 8 cm/year westward
Arabian Plate 3 cm/year northeastwardCocos Plate 5 cm/year northeastward
Caribbean Plate 1 cm/year northeastwardJuan de Fuca Plate 2.8 cm/year northeastward
Scotia Plate 3.6 cm/year westward15
14
13
12
11
10
9
8
7
6
5
4
3
2
1
1213 11
10
15
14
9
8
4
6
5
7
72
31
1
Yuva
noé/
CEA
CLEFS CEA - No. 57 - WINTER 2008-2009 91
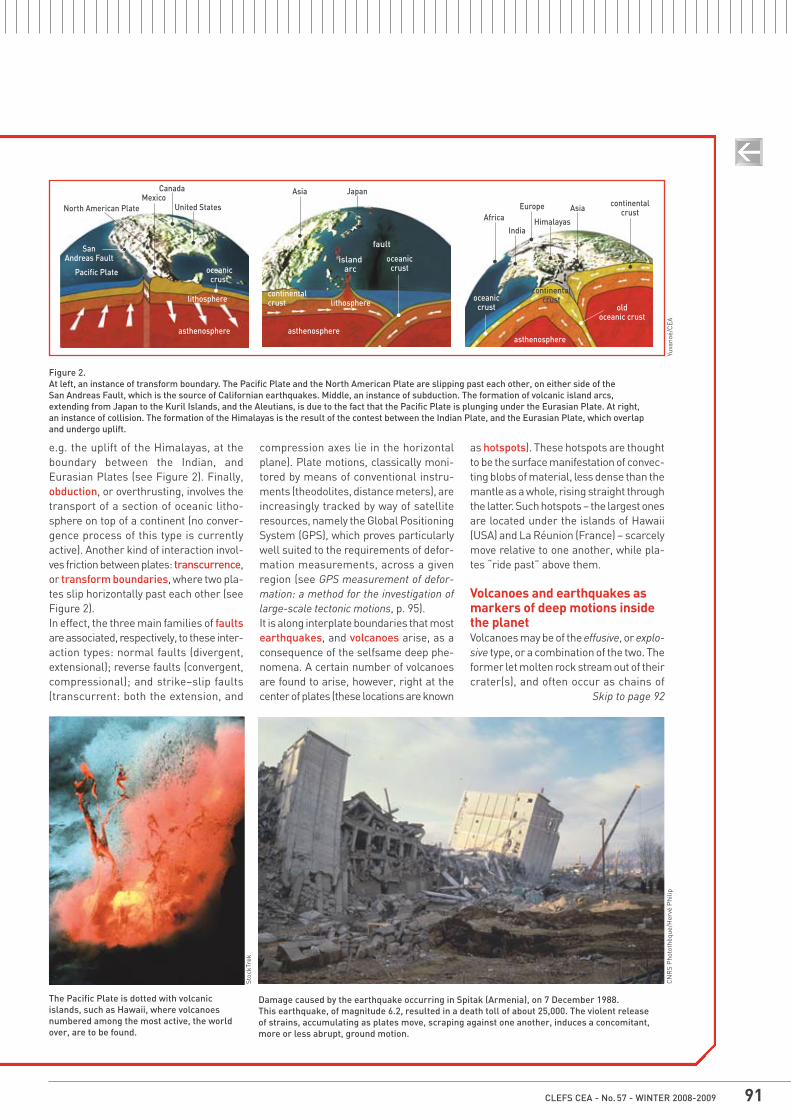
e.g. the uplift of the Himalayas, at theboundary between the Indian, andEurasian Plates (see Figure 2). Finally,obduction, or overthrusting, involves thetransport of a section of oceanic litho-sphere on top of a continent (no conver-gence process of this type is currentlyactive). Another kind of interaction invol-ves friction between plates: transcurrence,or transform boundaries, where two pla-tes slip horizontally past each other (seeFigure 2).In effect, the three main families of faultsare associated, respectively, to these inter-action types: normal faults (divergent,extensional); reverse faults (convergent,compressional); and strike–slip faults(transcurrent: both the extension, and
compression axes lie in the horizontalplane). Plate motions, classically moni-tored by means of conventional instru-ments (theodolites, distance meters), areincreasingly tracked by way of satelliteresources, namely the Global PositioningSystem (GPS), which proves particularlywell suited to the requirements of defor-mation measurements, across a givenregion (see GPS measurement of defor-mation: a method for the investigation oflarge-scale tectonic motions, p. 95).It is along interplate boundaries that mostearthquakes, and volcanoes arise, as aconsequence of the selfsame deep phe-nomena. A certain number of volcanoesare found to arise, however, right at thecenter of plates (these locations are known
as hotspots). These hotspots are thoughtto be the surface manifestation of convec-ting blobs of material, less dense than themantle as a whole, rising straight throughthe latter. Such hotspots – the largest onesare located under the islands of Hawaii(USA) and La Réunion (France) – scarcelymove relative to one another, while pla-tes “ride past” above them.
Volcanoes and earthquakes asmarkers of deep motions insidethe planetVolcanoes may be of the effusive, or explo-sive type, or a combination of the two. Theformer let molten rock stream out of theircrater(s), and often occur as chains of
Figure 2.At left, an instance of transform boundary. The Pacific Plate and the North American Plate are slipping past each other, on either side of the San Andreas Fault, which is the source of Californian earthquakes. Middle, an instance of subduction. The formation of volcanic island arcs, extending from Japan to the Kuril Islands, and the Aleutians, is due to the fact that the Pacific Plate is plunging under the Eurasian Plate. At right, an instance of collision. The formation of the Himalayas is the result of the contest between the Indian Plate, and the Eurasian Plate, which overlap and undergo uplift.
Yuva
noé/
CEA
Asia Japan
oceanic crust
lithosphere lithosphere
asthenosphereasthenosphereasthenosphere
Africa
oceanic crust
Pacific Plate
San Andreas Fault
oceanic crust old
oceanic crust
India
Europe Asia continentalcrust
continentalcrust
continentalcrust
Himalayas
United States
CanadaMexico
North American Plate
Stoc
kTre
k
The Pacific Plate is dotted with volcanicislands, such as Hawaii, where volcanoesnumbered among the most active, the worldover, are to be found.
CN
RS
Pho
toth
èque
/Her
vé P
hilip
Damage caused by the earthquake occurring in Spitak (Armenia), on 7 December 1988. This earthquake, of magnitude 6.2, resulted in a death toll of about 25,000. The violent release of strains, accumulating as plates move, scraping against one another, induces a concomitant,more or less abrupt, ground motion.
Skip to page 92
fault
island arc
CLEFS CEA - No. 57 - WINTER 2008-200992
The moving Earth
DFOCUS
Page 91 cont'dvolcanoes, especially under the sea. Thesecond type involves volcanoes that holdin the rising pressure of imprisoned gases,until they “spring the plug;” these formalignments, and occur on islands, and conti-nents. High-frequency, low-amplitude seis-mic noise (tremors) arises as a precursorof eruptions. Some 3,500 volcanoes havebeen active over the past 10,000 years.Plate motions, as they edge one againstthe other, cause deformations in the Earth’scrust, and a buildup of strains. When suchstrains exceed the crust’s mechanicalstrength, weaker, more brittle zones fail.An earthquake is the violent release of suchaccumulated strains, involving more or lessabrupt ground motion (from a few milli-meters, to several tens of meters) alongthe faults.Most earthquakes are of natural origin –the Earth experiences more than onemillion seismic shocks every year, some140,000 being of a magnitude greater than 3,(1) while some may be due to motionsof volcanic origin – however seismic eventsmay also be induced by human activities,e.g. dam reservoir impounding, or hydro-carbon extraction from oil fields. Further,events such as mining or quarrying blasts,or nuclear tests, particularly undergroundtests, likewise set off seismic waves, verysimilar to those generated by naturalevents.Regions involving intense seismic activityinclude mid-ocean ridges, subduction zones, areas around faults along which plates are slipping past each other (e.g. theSan Andreas Fault, in California [USA]), andregions where collisions between conti-nents are taking place.The release of strains, as the earthquakeoccurs, gives rise to elastic vibrations,known as seismic waves, propagating inall directions, across the Earth and throughwater, from the point of initial rupture ofthe Earth’s crust – the focus (or hypocen-ter) – lying somewhere between the sur-
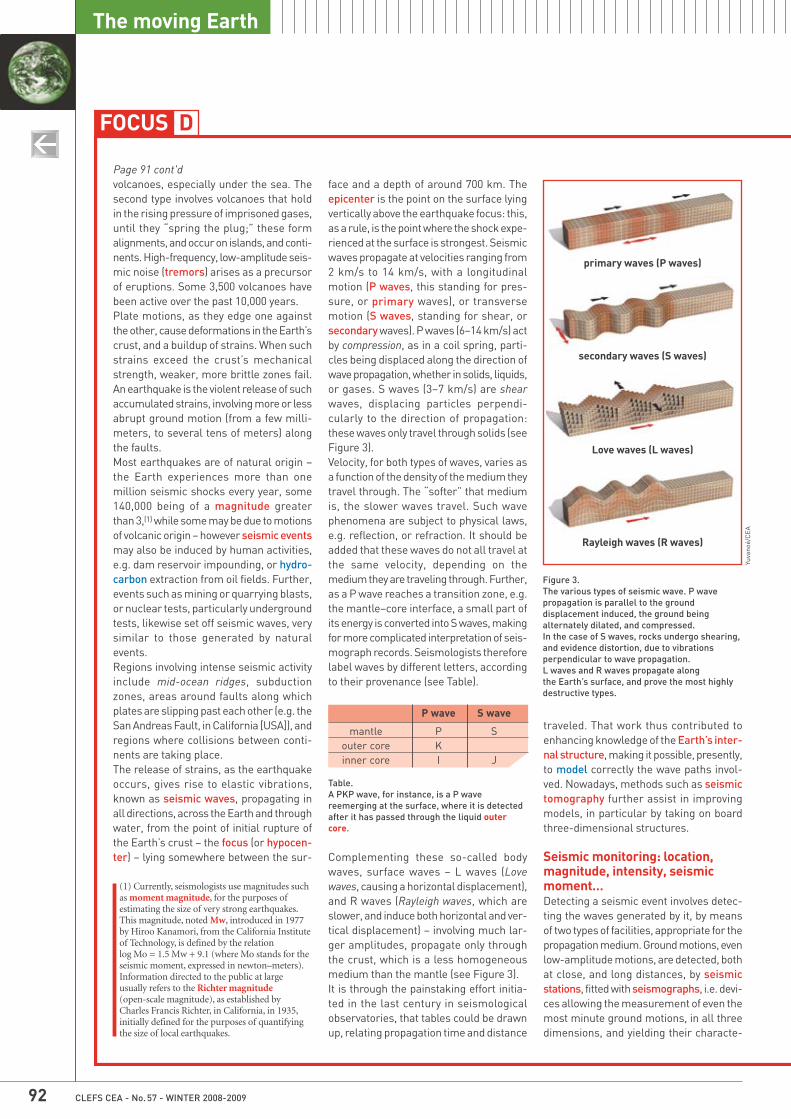
face and a depth of around 700 km. Theepicenter is the point on the surface lyingvertically above the earthquake focus: this,as a rule, is the point where the shock expe-rienced at the surface is strongest. Seismicwaves propagate at velocities ranging from2 km/s to 14 km/s, with a longitudinalmotion (P waves, this standing for pres-sure, or primary waves), or transversemotion (S waves, standing for shear, orsecondary waves). P waves (6–14 km/s) actby compression, as in a coil spring, parti-cles being displaced along the direction ofwave propagation, whether in solids, liquids,or gases. S waves (3–7 km/s) are shearwaves, displacing particles perpendi-cularly to the direction of propagation: these waves only travel through solids (seeFigure 3).Velocity, for both types of waves, varies asa function of the density of the medium theytravel through. The “softer” that mediumis, the slower waves travel. Such wave phenomena are subject to physical laws,e.g. reflection, or refraction. It should beadded that these waves do not all travel atthe same velocity, depending on themedium they are traveling through. Further,as a P wave reaches a transition zone, e.g.the mantle–core interface, a small part ofits energy is converted into S waves, makingfor more complicated interpretation of seis-mograph records. Seismologists thereforelabel waves by different letters, accordingto their provenance (see Table).
Complementing these so-called bodywaves, surface waves – L waves (Lovewaves, causing a horizontal displacement),and R waves (Rayleigh waves, which areslower, and induce both horizontal and ver-tical displacement) – involving much lar-ger amplitudes, propagate only throughthe crust, which is a less homogeneousmedium than the mantle (see Figure 3). It is through the painstaking effort initia-ted in the last century in seismological observatories, that tables could be drawnup, relating propagation time and distance
traveled. That work thus contributed toenhancing knowledge of the Earth’s inter-nal structure, making it possible, presently,to model correctly the wave paths invol-ved. Nowadays, methods such as seismictomography further assist in improvingmodels, in particular by taking on boardthree-dimensional structures.
Seismic monitoring: location,magnitude, intensity, seismicmoment…Detecting a seismic event involves detec-ting the waves generated by it, by meansof two types of facilities, appropriate for thepropagation medium. Ground motions, evenlow-amplitude motions, are detected, bothat close, and long distances, by seismicstations, fitted with seismographs, i.e. devi-ces allowing the measurement of even themost minute ground motions, in all threedimensions, and yielding their characte-
Figure 3.The various types of seismic wave. P wavepropagation is parallel to the grounddisplacement induced, the ground beingalternately dilated, and compressed. In the case of S waves, rocks undergo shearing,and evidence distortion, due to vibrationsperpendicular to wave propagation. L waves and R waves propagate along the Earth’s surface, and prove the most highlydestructive types.
Yuva
noé/
CEA
(1) Currently, seismologists use magnitudes suchas moment magnitude, for the purposes ofestimating the size of very strong earthquakes.This magnitude, noted Mw, introduced in 1977by Hiroo Kanamori, from the California Instituteof Technology, is defined by the relationlog Mo = 1.5 Mw + 9.1 (where Mo stands for theseismic moment, expressed in newton–meters).Information directed to the public at largeusually refers to the Richter magnitude(open-scale magnitude), as established by Charles Francis Richter, in California, in 1935,initially defined for the purposes of quantifying the size of local earthquakes.
primary waves (P waves)
secondary waves (S waves)
Love waves (L waves)
Rayleigh waves (R waves)
P wave S wave
mantle P Souter core Kinner core I J
Table.A PKP wave, for instance, is a P wavereemerging at the surface, where it is detectedafter it has passed through the liquid outercore.
CLEFS CEA - No. 57 - WINTER 2008-2009 93
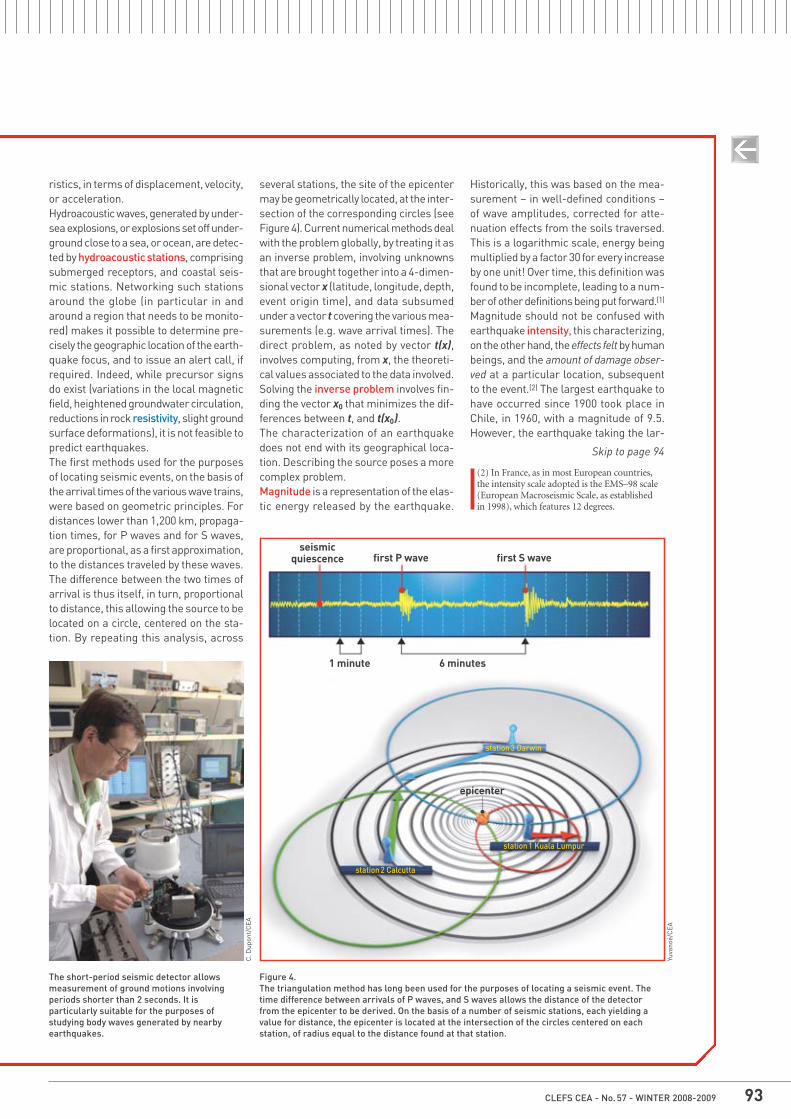
ristics, in terms of displacement, velocity,or acceleration.Hydroacoustic waves, generated by under-sea explosions, or explosions set off under-ground close to a sea, or ocean, are detec-ted by hydroacoustic stations, comprisingsubmerged receptors, and coastal seis-mic stations. Networking such stationsaround the globe (in particular in andaround a region that needs to be monito-red) makes it possible to determine pre-cisely the geographic location of the earth-quake focus, and to issue an alert call, ifrequired. Indeed, while precursor signsdo exist (variations in the local magneticfield, heightened groundwater circulation,reductions in rock resistivity, slight groundsurface deformations), it is not feasible topredict earthquakes.The first methods used for the purposesof locating seismic events, on the basis ofthe arrival times of the various wave trains,were based on geometric principles. Fordistances lower than 1,200 km, propaga-tion times, for P waves and for S waves,are proportional, as a first approximation,to the distances traveled by these waves.The difference between the two times ofarrival is thus itself, in turn, proportionalto distance, this allowing the source to belocated on a circle, centered on the sta-tion. By repeating this analysis, across
several stations, the site of the epicentermay be geometrically located, at the inter-section of the corresponding circles (seeFigure 4). Current numerical methods dealwith the problem globally, by treating it asan inverse problem, involving unknownsthat are brought together into a 4-dimen-sional vector x (latitude, longitude, depth,event origin time), and data subsumedunder a vector t covering the various mea-surements (e.g. wave arrival times). Thedirect problem, as noted by vector t(x),involves computing, from x, the theoreti-cal values associated to the data involved.Solving the inverse problem involves fin-ding the vector x0 that minimizes the dif-ferences between t, and t(x0).The characterization of an earthquakedoes not end with its geographical loca-tion. Describing the source poses a morecomplex problem.Magnitude is a representation of the elas-tic energy released by the earthquake.
Historically, this was based on the mea-surement – in well-defined conditions –of wave amplitudes, corrected for atte-nuation effects from the soils traversed.This is a logarithmic scale, energy beingmultiplied by a factor 30 for every increaseby one unit! Over time, this definition wasfound to be incomplete, leading to a num-ber of other definitions being put forward.(1)
Magnitude should not be confused withearthquake intensity, this characterizing,on the other hand, the effects felt by humanbeings, and the amount of damage obser-ved at a particular location, subsequentto the event.(2) The largest earthquake tohave occurred since 1900 took place inChile, in 1960, with a magnitude of 9.5.However, the earthquake taking the lar-
Figure 4.The triangulation method has long been used for the purposes of locating a seismic event. Thetime difference between arrivals of P waves, and S waves allows the distance of the detectorfrom the epicenter to be derived. On the basis of a number of seismic stations, each yielding avalue for distance, the epicenter is located at the intersection of the circles centered on eachstation, of radius equal to the distance found at that station.
Yuva
noé/
CEA
C. D
upon
t/C
EA
The short-period seismic detector allowsmeasurement of ground motions involvingperiods shorter than 2 seconds. It isparticularly suitable for the purposes ofstudying body waves generated by nearbyearthquakes.
seismicquiescence first P wave first S wave
6 minutes1 minute
epicenter
station 3 Darwin
station 1 Kuala Lumpur
station 2 Calcutta
(2) In France, as in most European countries,the intensity scale adopted is the EMS–98 scale(European Macroseismic Scale, as established in 1998), which features 12 degrees.
Skip to page 94

CLEFS CEA - No. 57 - WINTER 2008-200994
The moving Earth
DFOCUS
Page 93 cont'dgest toll in lives (some 250,000 casual-ties) was the Tangshan earthquake, inChina, in 1976, with a magnitude of 7.5.The earthquake that affected SichuanProvince (southwestern China) on 12 May2008, with a magnitude of 7.9, caused atleast 90,000 casualties. One and the sameearthquake, of a given magnitude, as defi-ned by the energy released at its focus,will be experienced at varying intensitylevels, depending on focus depth, distancefrom the epicenter, and the local charac-teristics of the observation location.The concept of seismic momentwas intro-duced, fairly recently, in an endeavor toprovide a description of an earthquake inmechanical terms: the value of the seis-mic moment is obtained by multiplyingan elastic constant by the average slipgenerated at a fault, and the area of thatfault. This is complemented by the des-cription of the rupture mechanism invol-ved, specifying the parameters of the faultalong which the rupture propagated(direction, length, depth…), the sectionsthat have failed, their displacement, andrupture velocity, on the basis of waverecordings made by a number of detec-tors.Nowadays, data from stations are directlytransmitted via satellite to an analysiscenter, where every event is studied.Networks with a global coverage, such as the US World-Wide StandardizedSeismograph Network (WWSSN), orIncorporated Research Institutions forSeismology (IRIS), or France’s Géoscope,chiefly bring together equipment recording all the components of groundmotion, across a wide band of frequen-cies. At the European level, theEuropean–Mediterranean SeismologicalCenter (EMSC) gathers all the findingsfrom more than 80 institutions, in some60 countries (from Iceland to the ArabianPeninsula, and from Morocco to Russia).In France, alongside the National SeismicMonitoring Network (RéNaSS: Réseaunational de surveillance sismique), head-quarted in Strasbourg, which covers allof mainland France, the global monito-ring remit is entrusted to CEA, more pre-cisely to the Detection and GeophysicsLaboratory (LDG: Laboratoire de détec-tion et de géophysique), coming under the Environmental Assessment andMonitoring Department (DASE: Dépar -tement analyse, surveillance, environne-ment), part of CEA’s Military Applications
Division (DAM). LDG, based at Bruyères-le-Châtel (Essonne département, nearParis), seeks to detect, and identify, inreal time, every seismic event, whileadvancing knowledge of the Earth’smotions. The ensemble of data collectedmakes it possible to draw up a catalog ofseismicity, a reference serving as the basisfor the seismic zoning of mainland France,which was revised in 2007, for the imple-mentation of the European Eurocode 8(EC 8) seismic design standard, due tosupplant existing French seismic designregulations (PS92, PS–MI) from 2010.Finally, the French Permanent Acce-lerometer Network (RAP: Réseau accé-lérométrique permanent) – comprisingmore than one hundred stations, run on
behalf of a scientific interest group, brin-ging together CNRS/INSU, CEA, BRGM,IRSN, IPGP, the Civil Engineers CentralLaboratory (LCPC: Laboratoire centraldes Ponts et chaussées), and a numberof universities – has the remit of provi-ding the scientific, and technological community with data, allowing an understanding to be gained of phenomena related to ground motion during earth-quakes, and arrive at estimates of suchmotion, in future earthquakes. The highsensitivity achieved makes it possible toinvestigate scaling laws, and nonlinearityphenomena. RAP should thus assist inthe determination of reference spectra,allowing structural dimensioning to becarried out.
C. D
upon
t/C
EA
DASE’s geophysical signals analysis room. In this room, all signals are centralized, as they aredetected by monitoring stations set up all around the world. Analysis of these signals makes itpossible to alert instantly government agencies, in the event of a strong earthquake, a nucleartest, or exceptional events.
S. P
oupi
n/C
EA
Tests carried out onvibrating tables, in CEA’s Tamarislaboratory – shownhere, a testinvolving a structureof about 20 tonnes –have contributed to the drawing up of European seismic engineeringstandards forbuildings.
CLEFS CEA - No. 57 - WINTER 2008-2009 95
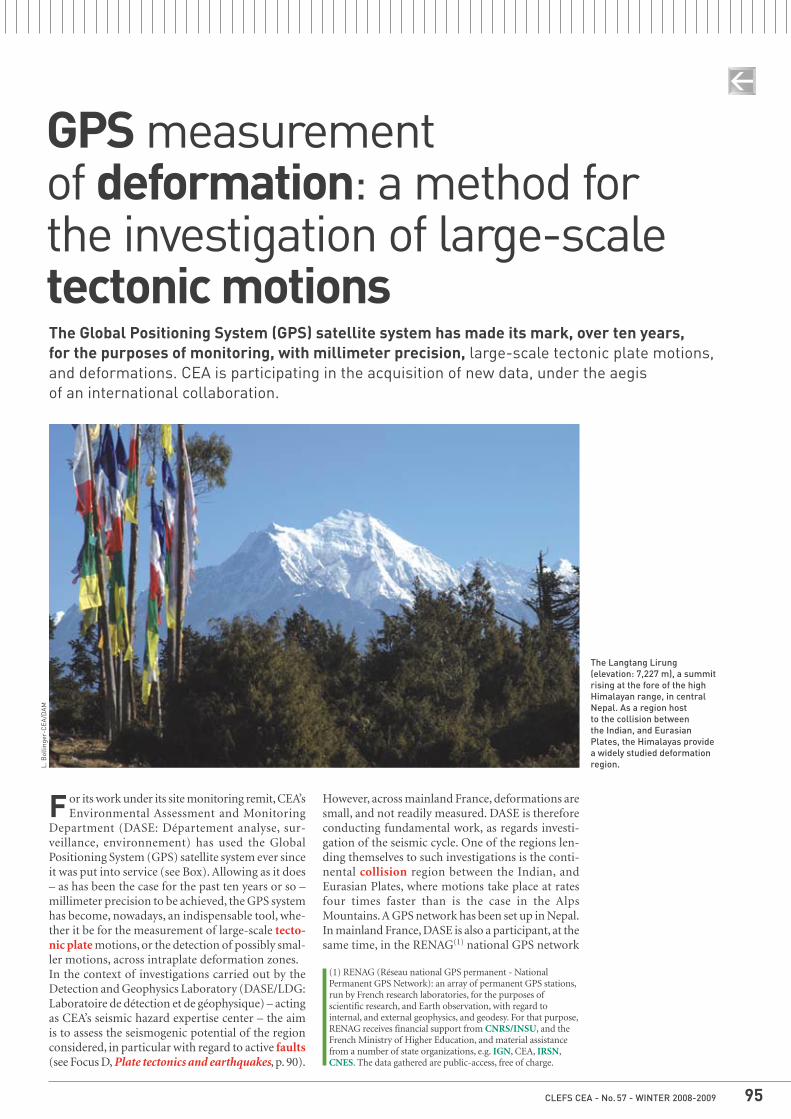
The Global Positioning System (GPS) satellite system has made its mark, over ten years, for the purposes of monitoring, with millimeter precision, large-scale tectonic plate motions,and deformations. CEA is participating in the acquisition of new data, under the aegis of an international collaboration.
GPS measurement of deformation: a method for the investigation of large-scaletectonic motions
F or its work under its site monitoring remit, CEA’sEnvironmental Assessment and Monitoring
Department (DASE: Département analyse, sur-veillance, environnement) has used the GlobalPositioning System (GPS) satellite system ever sinceit was put into service (see Box). Allowing as it does– as has been the case for the past ten years or so –millimeter precision to be achieved, the GPS systemhas become, nowadays, an indispensable tool, whe-ther it be for the measurement of large-scale tecto-nic plate motions, or the detection of possibly smal-ler motions, across intraplate deformation zones.In the context of investigations carried out by theDetection and Geophysics Laboratory (DASE/LDG:Laboratoire de détection et de géophysique) – actingas CEA’s seismic hazard expertise center – the aimis to assess the seismogenic potential of the regionconsidered, in particular with regard to active faults(see Focus D, Plate tectonics and earthquakes, p. 90).
However, across mainland France, deformations aresmall, and not readily measured. DASE is thereforeconducting fundamental work, as regards investi-gation of the seismic cycle. One of the regions len-ding themselves to such investigations is the conti-nental collision region between the Indian, andEurasian Plates, where motions take place at ratesfour times faster than is the case in the AlpsMountains. A GPS network has been set up in Nepal.In mainland France, DASE is also a participant, at thesame time, in the RENAG(1) national GPS network
The Langtang Lirung(elevation: 7,227 m), a summitrising at the fore of the highHimalayan range, in centralNepal. As a region host to the collision between the Indian, and EurasianPlates, the Himalayas providea widely studied deformationregion.L.
Bol
linge
r-C
EA/D
AM
(1) RENAG (Réseau national GPS permanent - NationalPermanent GPS Network): an array of permanent GPS stations,run by French research laboratories, for the purposes ofscientific research, and Earth observation, with regard tointernal, and external geophysics, and geodesy. For that purpose,RENAG receives financial support from CNRS/INSU, and theFrench Ministry of Higher Education, and material assistancefrom a number of state organizations, e.g. IGN, CEA, IRSN,CNES. The data gathered are public-access, free of charge.
What is the operating principle of GPS?
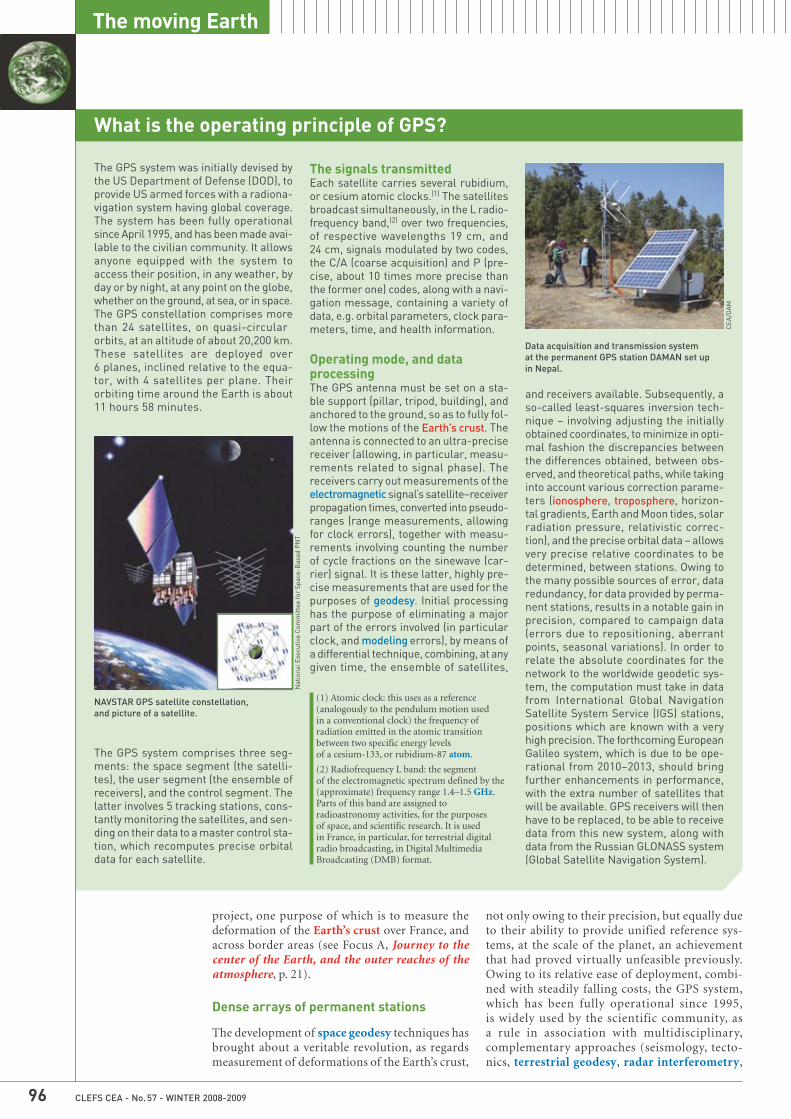
The GPS system was initially devised bythe US Department of Defense (DOD), toprovide US armed forces with a radiona-vigation system having global coverage.The system has been fully operationalsince April 1995, and has been made avai-lable to the civilian community. It allowsanyone equipped with the system toaccess their position, in any weather, byday or by night, at any point on the globe,whether on the ground, at sea, or in space.The GPS constellation comprises morethan 24 satellites, on quasi-circularorbits, at an altitude of about 20,200 km.These satellites are deployed over 6 planes, inclined relative to the equa-tor, with 4 satellites per plane. Theirorbiting time around the Earth is about11 hours 58 minutes.
The GPS system comprises three seg-ments: the space segment (the satelli-tes), the user segment (the ensemble ofreceivers), and the control segment. Thelatter involves 5 tracking stations, cons-tantly monitoring the satellites, and sen-ding on their data to a master control sta-tion, which recomputes precise orbitaldata for each satellite.
The signals transmittedEach satellite carries several rubidium,or cesium atomic clocks.(1) The satellitesbroadcast simultaneously, in the L radio-frequency band,(2) over two frequencies,of respective wavelengths 19 cm, and24 cm, signals modulated by two codes,the C/A (coarse acquisition) and P (pre-cise, about 10 times more precise thanthe former one) codes, along with a navi-gation message, containing a variety ofdata, e.g. orbital parameters, clock para-meters, time, and health information.
Operating mode, and dataprocessingThe GPS antenna must be set on a sta-ble support (pillar, tripod, building), andanchored to the ground, so as to fully fol-low the motions of the Earth’s crust. Theantenna is connected to an ultra-precisereceiver (allowing, in particular, measu-rements related to signal phase). Thereceivers carry out measurements of theelectromagnetic signal’s satellite–receiverpropagation times, converted into pseudo-ranges (range measurements, allowingfor clock errors), together with measu-rements involving counting the numberof cycle fractions on the sinewave (car-rier) signal. It is these latter, highly pre-cise measurements that are used for thepurposes of geodesy. Initial processinghas the purpose of eliminating a majorpart of the errors involved (in particularclock, and modeling errors), by means ofa differential technique, combining, at anygiven time, the ensemble of satellites,
and receivers available. Subsequently, aso-called least-squares inversion tech-nique – involving adjusting the initiallyobtained coordinates, to minimize in opti-mal fashion the discrepancies betweenthe differences obtained, between obs-erved, and theoretical paths, while takinginto account various correction parame-ters (ionosphere, troposphere, horizon-tal gradients, Earth and Moon tides, solarradiation pressure, relativistic correc-tion), and the precise orbital data – allowsvery precise relative coordinates to bedetermined, between stations. Owing tothe many possible sources of error, dataredundancy, for data provided by perma-nent stations, results in a notable gain inprecision, compared to campaign data(errors due to repositioning, aberrantpoints, seasonal variations). In order torelate the absolute coordinates for thenetwork to the worldwide geodetic sys-tem, the computation must take in datafrom International Global NavigationSatellite System Service (IGS) stations,positions which are known with a veryhigh precision. The forthcoming EuropeanGalileo system, which is due to be ope-rational from 2010–2013, should bringfurther enhancements in performance,with the extra number of satellites thatwill be available. GPS receivers will thenhave to be replaced, to be able to receivedata from this new system, along withdata from the Russian GLONASS system(Global Satellite Navigation System).
NAVSTAR GPS satellite constellation, and picture of a satellite.
Data acquisition and transmission system at the permanent GPS station DAMAN set up in Nepal.
(1) Atomic clock: this uses as a reference(analogously to the pendulum motion used in a conventional clock) the frequency ofradiation emitted in the atomic transitionbetween two specific energy levels of a cesium-133, or rubidium-87 atom.
(2) Radiofrequency L band: the segment of the electromagnetic spectrum defined by the(approximate) frequency range 1.4–1.5 GHz.Parts of this band are assigned toradioastronomy activities, for the purposes of space, and scientific research. It is used in France, in particular, for terrestrial digitalradio broadcasting, in Digital MultimediaBroadcasting (DMB) format.
CLEFS CEA - No. 57 - WINTER 2008-200996
The moving Earth
project, one purpose of which is to measure thedeformation of the Earth’s crust over France, andacross border areas (see Focus A, Journey to the center of the Earth, and the outer reaches of theatmosphere, p. 21).
Dense arrays of permanent stations
The development of space geodesy techniques hasbrought about a veritable revolution, as regardsmeasurement of deformations of the Earth’s crust,
not only owing to their precision, but equally dueto their ability to provide unified reference sys-tems, at the scale of the planet, an achievementthat had proved virtually unfeasible previously. Owing to its relative ease of deployment, combi-ned with steadily falling costs, the GPS system,which has been fully operational since 1995, is widely used by the scientific community, as a rule in association with multidisciplinary, complementary approaches (seismology, tecto-nics, terrestrial geodesy, radar interferometry,
CEA
/DA
M
Nat
iona
l Exe
cutiv
e C
omm
ittee
for
Spac
e-B
ased
PN
T
CLEFS CEA - No. 57 - WINTER 2008-2009 97
DORIS).(2) This has enabled, over the past ten yearsor so, many scientific advances to be achieved, asregards knowledge of crust deformation modes, atall spatial scales, and at every stage in the seismiccycle, i.e. before, during, and after an earthquake.One of the most active regions around the world,the San Andreas Fault, in California (USA), wasone of the first to be equipped with the relevantinstrumentation. Motions arising during theLanders earthquake (1992; magnitude 7.4) werethus measured directly. The development of per-manent stations, with the setting up, in particular,of the International Global Navigation SatelliteSystem Service (IGS) – a worldwide academicconsortium, comprising some 350 stations – nowallows millimeter precisions to be achieved. Thedata thus obtained contribute, in conjunction withother data, to defining the International TerrestrialReference Frame (ITRF),(3) and serve for velocitycomputations by member stations. The trend todenser permanent networks is constantly speedingup, at regional level, first and foremost in high-deformation zones, which arise, as a rule, at plateboundaries (California, Japan, Taiwan, Sumatra,Chile, Mexico… to mention but a few of them),and in intraplate deformation zones, some of whichinvolve smaller amplitudes (Mongolia, the AlpsMountains, Jura Mountains in eastern France…).Phenomena that would go completely undetectedpreviously are now being highlighted. Transientdeformations, interpreted as possible aseismic slips(slow earthquakes) – e.g. in the Cascades (Canada),and Guerrero (southern Mexico) regions – or againas possible earthquake precursors – e.g. in Chile –are thus being observed.
Large-scale investigation methods
Among the more spectacular corroborations of platetectonics – a theory initially known as seafloor sprea-ding (see Focus D, Plate tectonics and earthquakes,p. 90) – magnetic anomalies yielded the first quanti-tative estimates, as to plate motions. Basaltic materials,rising up from the mantle at a mid-ocean ridge, andspilling on either side of its axis become magnetized,as they cool, magnetization orienting itself along thedirection of the Earth’s magnetic field, at the time, thus“freezing” the memory of that field as they solidify.Now, the direction of that field undergoes reversals,over time, at more or less regular intervals. As theyspread away from the ridge, rocks on the ocean floorpreserve this imprint, resulting in a pattern of alter-nating anomalies, of varying width, either positive, ornegative, depending on whether the Earth’s field wasnormal, or reversed, compared with present orienta-tion. The phenomenon proves symmetrical, on eitherside of the ridge. Such barcode patterns – so to speak– thus stand as a dated scale, making it possible to deter-mine the spread rate of ocean floors.A large number of observations are also yielded by geo-morphology, and seismicity. Horizontal tectonic platedisplacements were, for a long time, described by wayof models drawn up solely on the basis of geological,and geophysical observations made at plate bounda-ries. One such reference kinematic model is theNUVEL–1 model. This works on the assumption of
rigid tectonic plates, involving displacement velocitiesthat remain constant over 3–4 million years. Amongother methods employed, very-long-baseline interfe-rometry (VLBI) geodetic measurements have made itpossible, e.g., to measure the opening rate of the AtlanticOcean, at 2 cm/year. New geodetic models are nowavailable, combining space geodesy data that are notdependent on geologic models.
Investigation of deformation across the Himalayas in Nepal
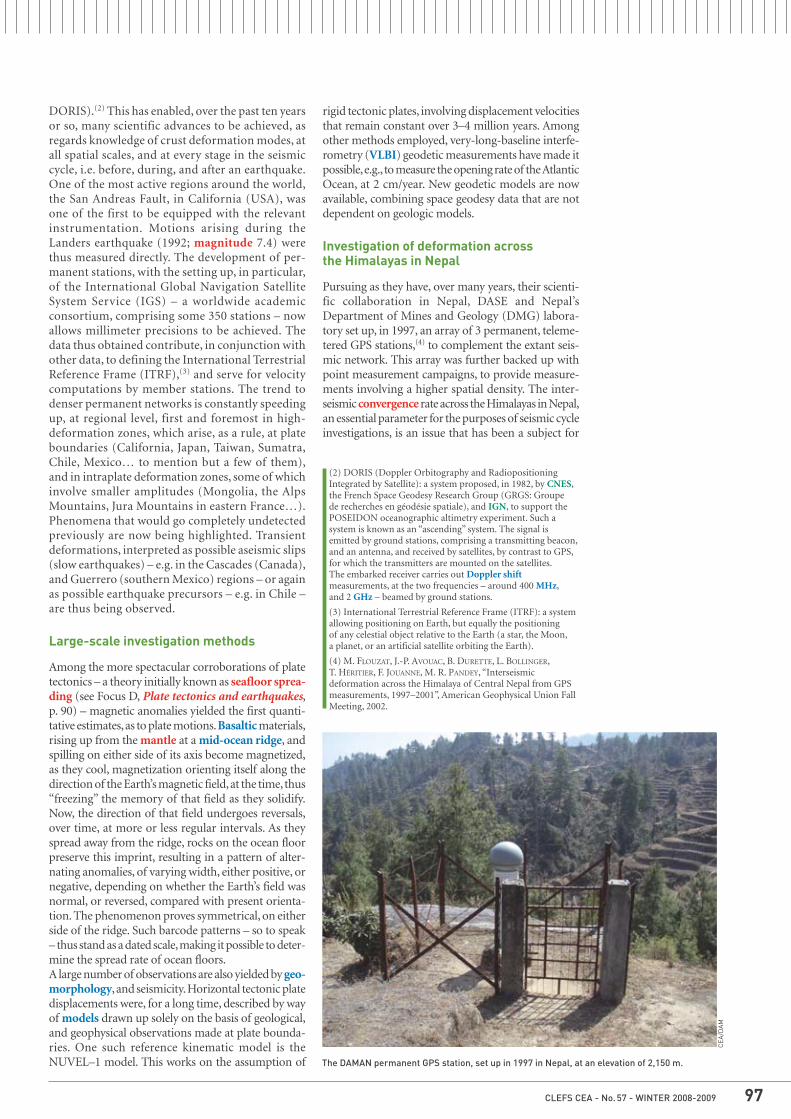
Pursuing as they have, over many years, their scienti-fic collaboration in Nepal, DASE and Nepal’sDepartment of Mines and Geology (DMG) labora-tory set up, in 1997, an array of 3 permanent, teleme-tered GPS stations,(4) to complement the extant seis-mic network. This array was further backed up withpoint measurement campaigns, to provide measure-ments involving a higher spatial density. The inter-seismic convergence rate across the Himalayas in Nepal,an essential parameter for the purposes of seismic cycleinvestigations, is an issue that has been a subject for
The DAMAN permanent GPS station, set up in 1997 in Nepal, at an elevation of 2,150 m.
CEA
/DA
M
(2) DORIS (Doppler Orbitography and RadiopositioningIntegrated by Satellite): a system proposed, in 1982, by CNES,the French Space Geodesy Research Group (GRGS: Groupe de recherches en géodésie spatiale), and IGN, to support thePOSEIDON oceanographic altimetry experiment. Such asystem is known as an “ascending” system. The signal isemitted by ground stations, comprising a transmitting beacon,and an antenna, and received by satellites, by contrast to GPS,for which the transmitters are mounted on the satellites. The embarked receiver carries out Doppler shiftmeasurements, at the two frequencies – around 400 MHz, and 2 GHz – beamed by ground stations.
(3) International Terrestrial Reference Frame (ITRF): a systemallowing positioning on Earth, but equally the positioning of any celestial object relative to the Earth (a star, the Moon, a planet, or an artificial satellite orbiting the Earth).
(4) M. FLOUZAT, J.-P. AVOUAC, B. DURETTE, L. BOLLINGER, T. HÉRITIER, F. JOUANNE, M. R. PANDEY, “Interseismicdeformation across the Himalaya of Central Nepal from GPSmeasurements, 1997–2001”, American Geophysical Union FallMeeting, 2002.
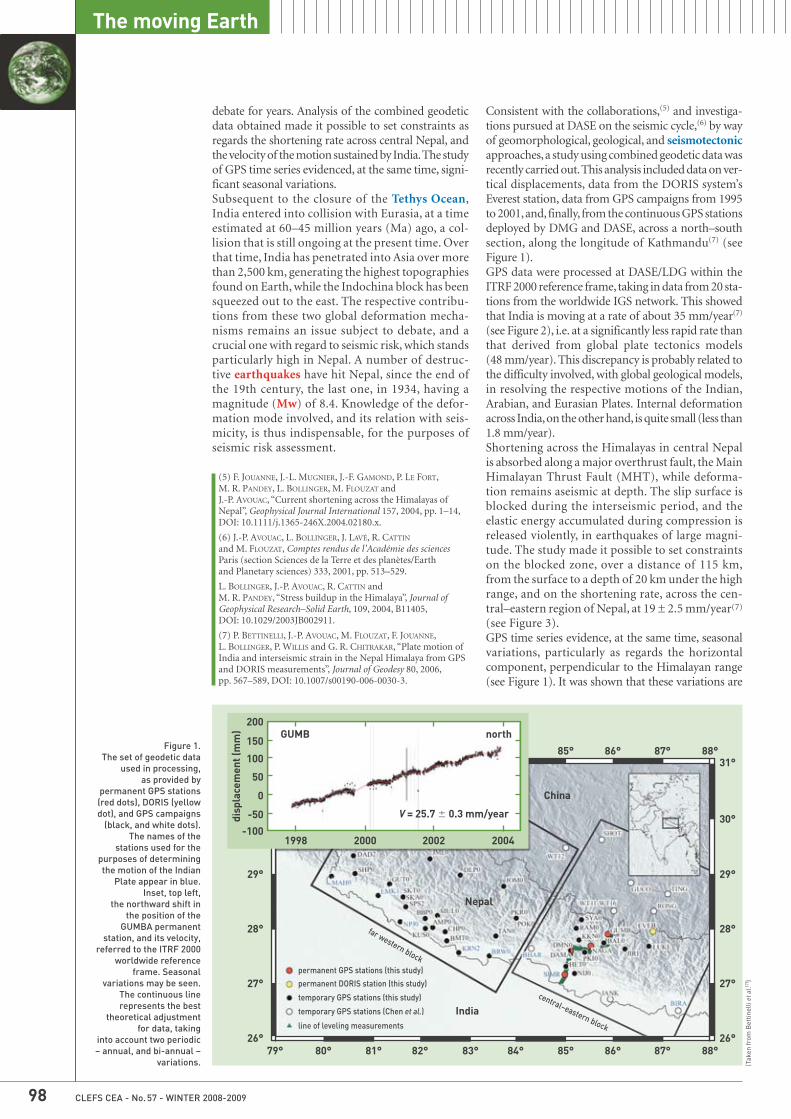
Figure 1.The set of geodetic data
used in processing, as provided by
permanent GPS stations(red dots), DORIS (yellowdot), and GPS campaigns
(black, and white dots).The names of the
stations used for thepurposes of determiningthe motion of the Indian
Plate appear in blue.Inset, top left,
the northward shift in the position of the
GUMBA permanentstation, and its velocity,
referred to the ITRF 2000worldwide reference
frame. Seasonalvariations may be seen.
The continuous linerepresents the best
theoretical adjustmentfor data, taking
into account two periodic– annual, and bi-annual –
variations. (Tak
en fr
om B
ettin
elli
et a
l.(7) )
CLEFS CEA - No. 57 - WINTER 2008-200998
The moving Earth
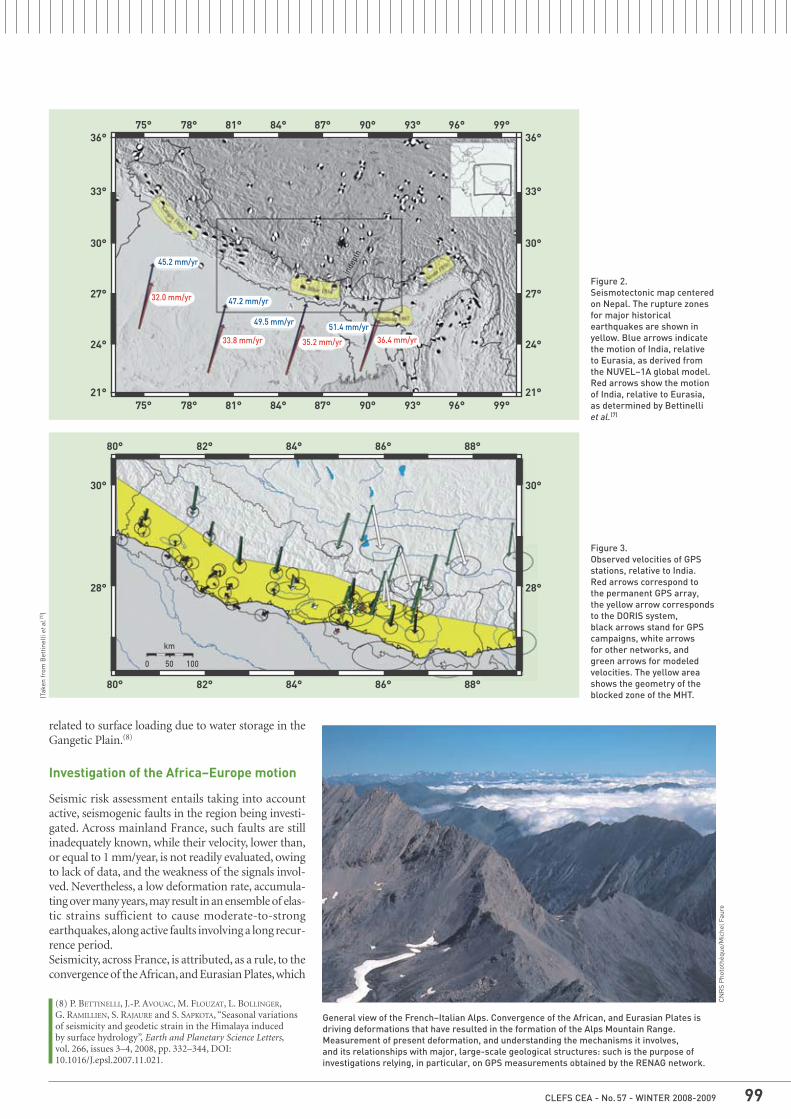
Consistent with the collaborations,(5) and investiga-tions pursued at DASE on the seismic cycle,(6) by wayof geomorphological, geological, and seismotectonicapproaches, a study using combined geodetic data wasrecently carried out. This analysis included data on ver-tical displacements, data from the DORIS system’sEverest station, data from GPS campaigns from 1995to 2001, and, finally, from the continuous GPS stationsdeployed by DMG and DASE, across a north–southsection, along the longitude of Kathmandu(7) (seeFigure 1).GPS data were processed at DASE/LDG within theITRF 2000 reference frame, taking in data from 20 sta-tions from the worldwide IGS network. This showedthat India is moving at a rate of about 35 mm/year(7)
(see Figure 2), i.e. at a significantly less rapid rate thanthat derived from global plate tectonics models(48 mm/year). This discrepancy is probably related tothe difficulty involved, with global geological models,in resolving the respective motions of the Indian,Arabian, and Eurasian Plates. Internal deformationacross India, on the other hand, is quite small (less than1.8 mm/year).Shortening across the Himalayas in central Nepalis absorbed along a major overthrust fault, the MainHimalayan Thrust Fault (MHT), while deforma-tion remains aseismic at depth. The slip surface isblocked during the interseismic period, and theelastic energy accumulated during compression isreleased violently, in earthquakes of large magni-tude. The study made it possible to set constraintson the blocked zone, over a distance of 115 km,from the surface to a depth of 20 km under the highrange, and on the shortening rate, across the cen-tral–eastern region of Nepal, at 19 ± 2.5 mm/year(7)
(see Figure 3).GPS time series evidence, at the same time, seasonalvariations, particularly as regards the horizontal component, perpendicular to the Himalayan range(see Figure 1). It was shown that these variations are
debate for years. Analysis of the combined geodeticdata obtained made it possible to set constraints asregards the shortening rate across central Nepal, andthe velocity of the motion sustained by India. The studyof GPS time series evidenced, at the same time, signi-ficant seasonal variations.Subsequent to the closure of the Tethys Ocean,India entered into collision with Eurasia, at a timeestimated at 60–45 million years (Ma) ago, a col-lision that is still ongoing at the present time. Overthat time, India has penetrated into Asia over morethan 2,500 km, generating the highest topographiesfound on Earth, while the Indochina block has beensqueezed out to the east. The respective contribu-tions from these two global deformation mecha-nisms remains an issue subject to debate, and acrucial one with regard to seismic risk, which standsparticularly high in Nepal. A number of destruc-tive earthquakes have hit Nepal, since the end ofthe 19th century, the last one, in 1934, having amagnitude (Mw) of 8.4. Knowledge of the defor-mation mode involved, and its relation with seis-micity, is thus indispensable, for the purposes ofseismic risk assessment.
(5) F. JOUANNE, J.-L. MUGNIER, J.-F. GAMOND, P. LE FORT, M. R. PANDEY, L. BOLLINGER, M. FLOUZAT and J.-P. AVOUAC, “Current shortening across the Himalayas ofNepal”, Geophysical Journal International 157, 2004, pp. 1–14,DOI: 10.1111/j.1365-246X.2004.02180.x.
(6) J.-P. AVOUAC, L. BOLLINGER, J. LAVÉ, R. CATTIN
and M. FLOUZAT, Comptes rendus de l'Académie des sciencesParis (section Sciences de la Terre et des planètes/Earth and Planetary sciences) 333, 2001, pp. 513–529.
L. BOLLINGER, J.-P. AVOUAC, R. CATTIN and M. R. PANDEY, “Stress buildup in the Himalaya”, Journal ofGeophysical Research–Solid Earth, 109, 2004, B11405, DOI: 10.1029/2003JB002911.
(7) P. BETTINELLI, J.-P. AVOUAC, M. FLOUZAT, F. JOUANNE, L. BOLLINGER, P. WILLIS and G. R. CHITRAKAR, “Plate motion ofIndia and interseismic strain in the Nepal Himalaya from GPSand DORIS measurements”, Journal of Geodesy 80, 2006, pp. 567–589, DOI: 10.1007/s00190-006-0030-3.
29°
28°
27°
26°79° 80° 81° 82° 83° 84° 85° 86° 87° 88°
85° 86° 87° 88°
29°
30°
31°
28°
27°
26°
far western block
central–eastern block
permanent GPS stations (this study)
temporary GPS stations (this study)
temporary GPS stations (Chen et al.)
line of leveling measurements
permanent DORIS station (this study)
-100
-50
0
50
100
150
200
disp
lace
men
t (m
m)
1998
GUMB
China
Nepal
India
north
V = 25.7 � 0.3 mm/year
2000 2002 2004
CLEFS CEA - No. 57 - WINTER 2008-2009 99
related to surface loading due to water storage in theGangetic Plain.(8)
Investigation of the Africa–Europe motion
Seismic risk assessment entails taking into accountactive, seismogenic faults in the region being investi-gated. Across mainland France, such faults are stillinadequately known, while their velocity, lower than,or equal to 1 mm/year, is not readily evaluated, owingto lack of data, and the weakness of the signals invol-ved. Nevertheless, a low deformation rate, accumula-ting over many years, may result in an ensemble of elas-tic strains sufficient to cause moderate-to-strongearthquakes, along active faults involving a long recur-rence period.Seismicity, across France, is attributed, as a rule, to theconvergence of the African, and Eurasian Plates, which
General view of the French–Italian Alps. Convergence of the African, and Eurasian Plates isdriving deformations that have resulted in the formation of the Alps Mountain Range.Measurement of present deformation, and understanding the mechanisms it involves, and its relationships with major, large-scale geological structures: such is the purpose ofinvestigations relying, in particular, on GPS measurements obtained by the RENAG network.
CN
RS
Pho
toth
èque
/Mic
hel F
aure
Figure 2.Seismotectonic map centeredon Nepal. The rupture zonesfor major historicalearthquakes are shown inyellow. Blue arrows indicatethe motion of India, relative to Eurasia, as derived fromthe NUVEL–1A global model.Red arrows show the motionof India, relative to Eurasia,as determined by Bettinelli et al.(7)
Figure 3.Observed velocities of GPSstations, relative to India. Red arrows correspond to the permanent GPS array, the yellow arrow correspondsto the DORIS system, black arrows stand for GPScampaigns, white arrows for other networks, and green arrows for modeledvelocities. The yellow areashows the geometry of theblocked zone of the MHT.(T
aken
from
Bet
tinel
li et
al.(7
) )
21°
28°
30°
24°
27°
30°
33°
36°
21°
24°
27°
30°
33°
36°
75°
80° 82° 84° 86° 88°
80° 82° 84° 86° 88°
78° 81° 84° 87° 90° 93° 96° 99°
75° 78° 81° 84° 87° 90° 93° 96° 99°
45.2 mm/yr
47.2 mm/yr
49.5 mm/yr51.4 mm/yr
35.2 mm/yr 36.4 mm/yr33.8 mm/yr
32.0 mm/yr
inde
pth
28°
30°
0 50
km
100
(8) P. BETTINELLI, J.-P. AVOUAC, M. FLOUZAT, L. BOLLINGER, G. RAMILLIEN, S. RAJAURE and S. SAPKOTA, “Seasonal variationsof seismicity and geodetic strain in the Himalaya induced by surface hydrology”, Earth and Planetary Science Letters, vol. 266, issues 3–4, 2008, pp. 332–344, DOI:10.1016/J.epsl.2007.11.021.
CLEFS CEA - No. 57 - WINTER 2008-2009100
The moving Earth
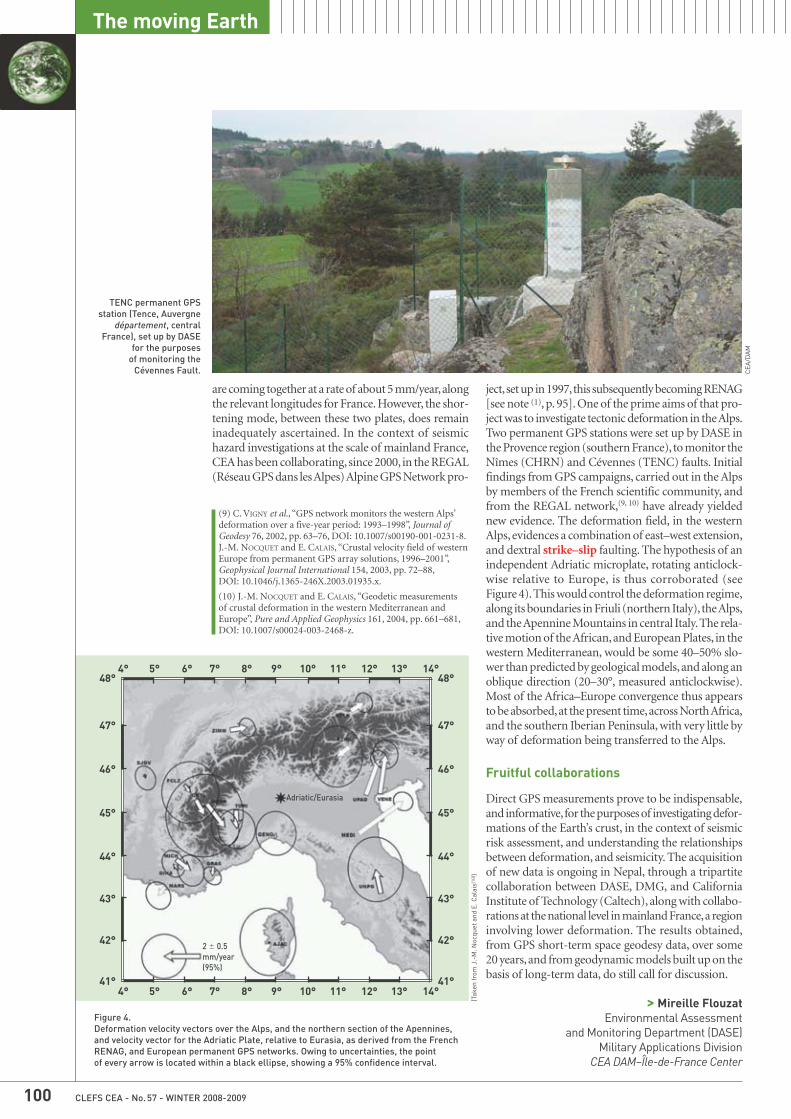
are coming together at a rate of about 5 mm/year, alongthe relevant longitudes for France. However, the shor-tening mode, between these two plates, does remaininadequately ascertained. In the context of seismichazard investigations at the scale of mainland France,CEA has been collaborating, since 2000, in the REGAL(Réseau GPS dans les Alpes) Alpine GPS Network pro-
ject, set up in 1997, this subsequently becoming RENAG[see note (1), p. 95]. One of the prime aims of that pro-ject was to investigate tectonic deformation in the Alps.Two permanent GPS stations were set up by DASE inthe Provence region (southern France), to monitor theNîmes (CHRN) and Cévennes (TENC) faults. Initialfindings from GPS campaigns, carried out in the Alpsby members of the French scientific community, andfrom the REGAL network,(9, 10) have already yieldednew evidence. The deformation field, in the westernAlps, evidences a combination of east–west extension,and dextral strike–slip faulting. The hypothesis of anindependent Adriatic microplate, rotating anticlock-wise relative to Europe, is thus corroborated (seeFigure 4). This would control the deformation regime,along its boundaries in Friuli (northern Italy), the Alps,and the Apennine Mountains in central Italy. The rela-tive motion of the African, and European Plates, in thewestern Mediterranean, would be some 40–50% slo-wer than predicted by geological models, and along anoblique direction (20–30°, measured anticlockwise).Most of the Africa–Europe convergence thus appearsto be absorbed, at the present time, across North Africa,and the southern Iberian Peninsula, with very little byway of deformation being transferred to the Alps.
Fruitful collaborations
Direct GPS measurements prove to be indispensable,and informative, for the purposes of investigating defor-mations of the Earth’s crust, in the context of seismicrisk assessment, and understanding the relationshipsbetween deformation, and seismicity. The acquisitionof new data is ongoing in Nepal, through a tripartitecollaboration between DASE, DMG, and CaliforniaInstitute of Technology (Caltech), along with collabo-rations at the national level in mainland France, a regioninvolving lower deformation. The results obtained,from GPS short-term space geodesy data, over some20 years, and from geodynamic models built up on thebasis of long-term data, do still call for discussion.
> Mireille Flouzat Environmental Assessment
and Monitoring Department (DASE)Military Applications Division
CEA DAM–Île-de-France Center
(9) C. VIGNY et al., “GPS network monitors the western Alps’deformation over a five-year period: 1993–1998”, Journal ofGeodesy 76, 2002, pp. 63–76, DOI: 10.1007/s00190-001-0231-8.J.-M. NOCQUET and E. CALAIS, “Crustal velocity field of westernEurope from permanent GPS array solutions, 1996–2001”,Geophysical Journal International 154, 2003, pp. 72–88, DOI: 10.1046/j.1365-246X.2003.01935.x.
(10) J.-M. NOCQUET and E. CALAIS, “Geodetic measurements of crustal deformation in the western Mediterranean andEurope”, Pure and Applied Geophysics 161, 2004, pp. 661–681,DOI: 10.1007/s00024-003-2468-z.
Figure 4.Deformation velocity vectors over the Alps, and the northern section of the Apennines,and velocity vector for the Adriatic Plate, relative to Eurasia, as derived from the FrenchRENAG, and European permanent GPS networks. Owing to uncertainties, the point of every arrow is located within a black ellipse, showing a 95% confidence interval.
(Tak
en fr
om J
.-M
. Noc
quet
and
E. C
alai
s(10
) )
TENC permanent GPSstation (Tence, Auvergne
département, centralFrance), set up by DASE
for the purposes of monitoring the
Cévennes Fault. CEA
/DA
M
Adriatic/Eurasia
2 � 0.5 mm/year(95%)
41°
42°
43°
44°
45°
46°
47°
48°4° 5° 6° 7° 8° 9° 10° 11° 12° 13° 14°
4° 5° 6° 7° 8° 9° 10° 11° 12° 13° 14°41°
42°
43°
44°
45°
46°
47°
48°
CLEFS CEA - No. 57 - WINTER 2008-2009 101
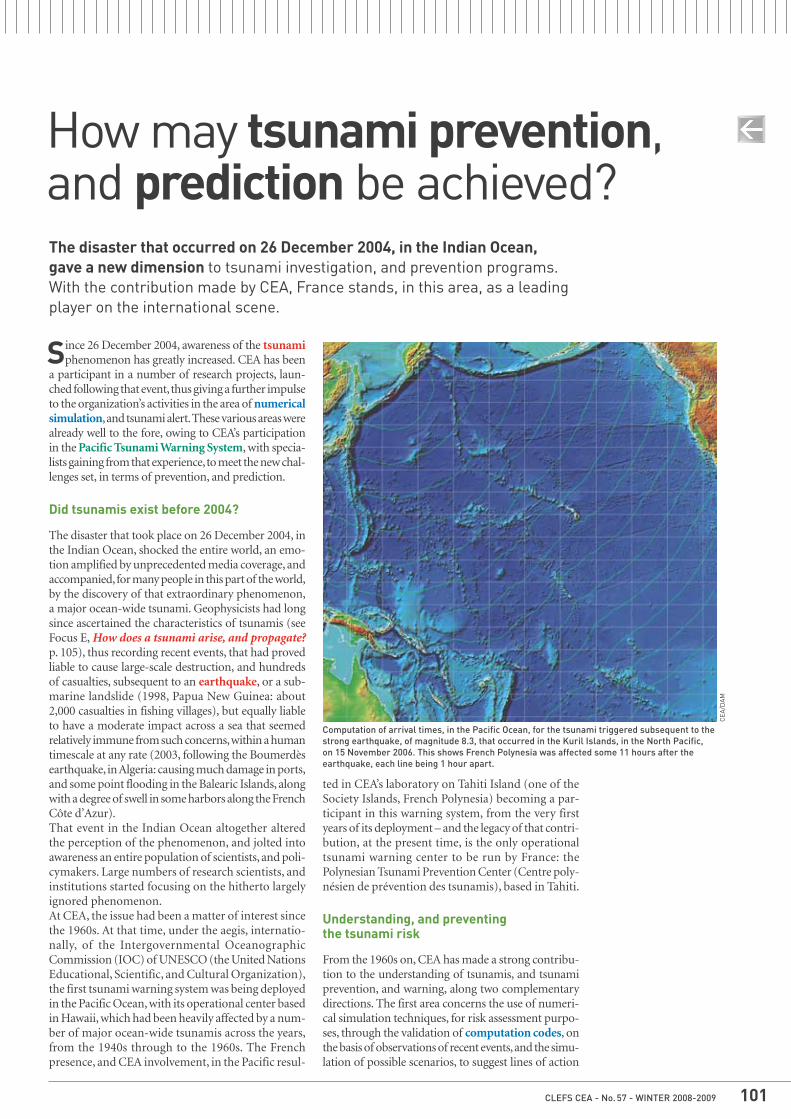
The disaster that occurred on 26 December 2004, in the Indian Ocean, gave a new dimension to tsunami investigation, and prevention programs.With the contribution made by CEA, France stands, in this area, as a leadingplayer on the international scene.
How may tsunami prevention,and prediction be achieved?
Since 26 December 2004, awareness of the tsunamiphenomenon has greatly increased. CEA has been
a participant in a number of research projects, laun-ched following that event, thus giving a further impulseto the organization’s activities in the area of numericalsimulation, and tsunami alert. These various areas werealready well to the fore, owing to CEA’s participationin the Pacific Tsunami Warning System, with specia-lists gaining from that experience, to meet the new chal-lenges set, in terms of prevention, and prediction.
Did tsunamis exist before 2004?
The disaster that took place on 26 December 2004, inthe Indian Ocean, shocked the entire world, an emo-tion amplified by unprecedented media coverage, andaccompanied, for many people in this part of the world,by the discovery of that extraordinary phenomenon,a major ocean-wide tsunami. Geophysicists had longsince ascertained the characteristics of tsunamis (seeFocus E, How does a tsunami arise, and propagate?p. 105), thus recording recent events, that had provedliable to cause large-scale destruction, and hundredsof casualties, subsequent to an earthquake, or a sub-marine landslide (1998, Papua New Guinea: about2,000 casualties in fishing villages), but equally liableto have a moderate impact across a sea that seemedrelatively immune from such concerns, within a humantimescale at any rate (2003, following the Boumerdèsearthquake, in Algeria: causing much damage in ports,and some point flooding in the Balearic Islands, alongwith a degree of swell in some harbors along the FrenchCôte d’Azur).That event in the Indian Ocean altogether alteredthe perception of the phenomenon, and jolted intoawareness an entire population of scientists, and poli-cymakers. Large numbers of research scientists, andinstitutions started focusing on the hitherto largelyignored phenomenon.At CEA, the issue had been a matter of interest sincethe 1960s. At that time, under the aegis, internatio-nally, of the Intergovernmental OceanographicCommission (IOC) of UNESCO (the United NationsEducational, Scientific, and Cultural Organization),the first tsunami warning system was being deployedin the Pacific Ocean, with its operational center basedin Hawaii, which had been heavily affected by a num-ber of major ocean-wide tsunamis across the years,from the 1940s through to the 1960s. The Frenchpresence, and CEA involvement, in the Pacific resul-
ted in CEA’s laboratory on Tahiti Island (one of theSociety Islands, French Polynesia) becoming a par-ticipant in this warning system, from the very firstyears of its deployment – and the legacy of that contri-bution, at the present time, is the only operationaltsunami warning center to be run by France: thePolynesian Tsunami Prevention Center (Centre poly-nésien de prévention des tsunamis), based in Tahiti.
Understanding, and preventing the tsunami risk
From the 1960s on, CEA has made a strong contribu-tion to the understanding of tsunamis, and tsunamiprevention, and warning, along two complementarydirections. The first area concerns the use of numeri-cal simulation techniques, for risk assessment purpo-ses, through the validation of computation codes, onthe basis of observations of recent events, and the simu-lation of possible scenarios, to suggest lines of action
Computation of arrival times, in the Pacific Ocean, for the tsunami triggered subsequent to thestrong earthquake, of magnitude 8.3, that occurred in the Kuril Islands, in the North Pacific, on 15 November 2006. This shows French Polynesia was affected some 11 hours after theearthquake, each line being 1 hour apart.
CEA
/DA
M
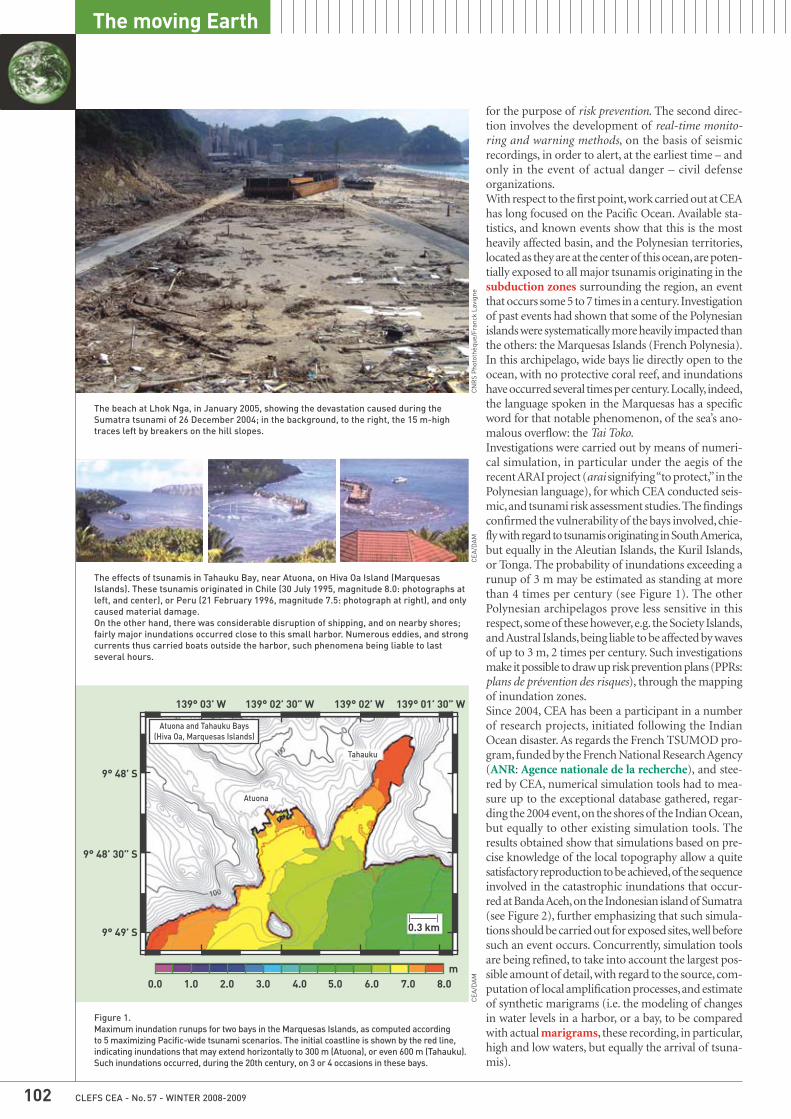
Figure 1.Maximum inundation runups for two bays in the Marquesas Islands, as computed according to 5 maximizing Pacific-wide tsunami scenarios. The initial coastline is shown by the red line,indicating inundations that may extend horizontally to 300 m (Atuona), or even 600 m (Tahauku).Such inundations occurred, during the 20th century, on 3 or 4 occasions in these bays.
CEA
/DA
MC
EA/D
AM
The effects of tsunamis in Tahauku Bay, near Atuona, on Hiva Oa Island (MarquesasIslands). These tsunamis originated in Chile (30 July 1995, magnitude 8.0: photographs atleft, and center), or Peru (21 February 1996, magnitude 7.5: photograph at right), and onlycaused material damage. On the other hand, there was considerable disruption of shipping, and on nearby shores;fairly major inundations occurred close to this small harbor. Numerous eddies, and strongcurrents thus carried boats outside the harbor, such phenomena being liable to lastseveral hours.
CLEFS CEA - No. 57 - WINTER 2008-2009102
The moving Earth
for the purpose of risk prevention. The second direc-tion involves the development of real-time monito-ring and warning methods, on the basis of seismic recordings, in order to alert, at the earliest time – andonly in the event of actual danger – civil defense organizations.With respect to the first point, work carried out at CEAhas long focused on the Pacific Ocean. Available sta-tistics, and known events show that this is the mostheavily affected basin, and the Polynesian territories,located as they are at the center of this ocean, are poten-tially exposed to all major tsunamis originating in thesubduction zones surrounding the region, an eventthat occurs some 5 to 7 times in a century. Investigationof past events had shown that some of the Polynesianislands were systematically more heavily impacted thanthe others: the Marquesas Islands (French Polynesia).In this archipelago, wide bays lie directly open to theocean, with no protective coral reef, and inundationshave occurred several times per century. Locally, indeed,the language spoken in the Marquesas has a specificword for that notable phenomenon, of the sea’s ano-malous overflow: the Tai Toko.Investigations were carried out by means of numeri-cal simulation, in particular under the aegis of therecent ARAI project (arai signifying “to protect,” in thePolynesian language), for which CEA conducted seis-mic, and tsunami risk assessment studies. The findingsconfirmed the vulnerability of the bays involved, chie-fly with regard to tsunamis originating in South America,but equally in the Aleutian Islands, the Kuril Islands,or Tonga. The probability of inundations exceeding arunup of 3 m may be estimated as standing at morethan 4 times per century (see Figure 1). The otherPolynesian archipelagos prove less sensitive in thisrespect, some of these however, e.g. the Society Islands,and Austral Islands, being liable to be affected by wavesof up to 3 m, 2 times per century. Such investigationsmake it possible to draw up risk prevention plans (PPRs:plans de prévention des risques), through the mappingof inundation zones.Since 2004, CEA has been a participant in a numberof research projects, initiated following the IndianOcean disaster. As regards the French TSUMOD pro-gram, funded by the French National Research Agency(ANR: Agence nationale de la recherche), and stee-red by CEA, numerical simulation tools had to mea-sure up to the exceptional database gathered, regar-ding the 2004 event, on the shores of the Indian Ocean,but equally to other existing simulation tools. Theresults obtained show that simulations based on pre-cise knowledge of the local topography allow a quitesatisfactory reproduction to be achieved, of the sequenceinvolved in the catastrophic inundations that occur-red at Banda Aceh, on the Indonesian island of Sumatra(see Figure 2), further emphasizing that such simula-tions should be carried out for exposed sites, well beforesuch an event occurs. Concurrently, simulation toolsare being refined, to take into account the largest pos-sible amount of detail, with regard to the source, com-putation of local amplification processes, and estimateof synthetic marigrams (i.e. the modeling of changesin water levels in a harbor, or a bay, to be comparedwith actual marigrams, these recording, in particular,high and low waters, but equally the arrival of tsuna-mis).
The beach at Lhok Nga, in January 2005, showing the devastation caused during theSumatra tsunami of 26 December 2004; in the background, to the right, the 15 m-hightraces left by breakers on the hill slopes.
CN
RS
Pho
toth
èque
/Fra
nck
Lavi
gne
9° 48’ 30” S
9° 49’ S
0.0 1.0
9° 48’ S
139° 03’ W 139° 02’ W139° 02’ 30” W 139° 01’ 30” W
0.3 km
2.0 3.0 4.0 5.0 6.0 7.0 8.0m
Atuona
Tahauku
Atuona and Tahauku Bays(Hiva Oa, Marquesas Islands)
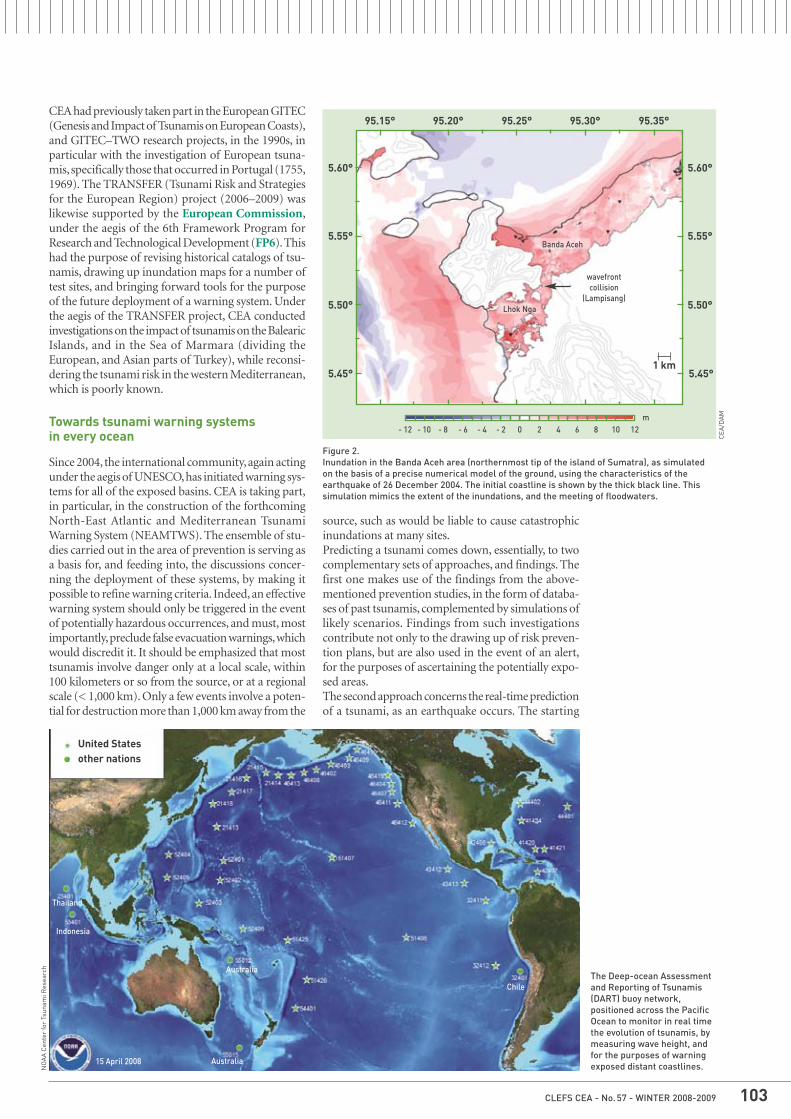
CLEFS CEA - No. 57 - WINTER 2008-2009 103
CEA had previously taken part in the European GITEC(Genesis and Impact of Tsunamis on European Coasts),and GITEC–TWO research projects, in the 1990s, inparticular with the investigation of European tsuna-mis, specifically those that occurred in Portugal (1755,1969). The TRANSFER (Tsunami Risk and Strategiesfor the European Region) project (2006–2009) waslikewise supported by the European Commission,under the aegis of the 6th Framework Program forResearch and Technological Development (FP6). Thishad the purpose of revising historical catalogs of tsu-namis, drawing up inundation maps for a number oftest sites, and bringing forward tools for the purposeof the future deployment of a warning system. Underthe aegis of the TRANSFER project, CEA conductedinvestigations on the impact of tsunamis on the BalearicIslands, and in the Sea of Marmara (dividing theEuropean, and Asian parts of Turkey), while reconsi-dering the tsunami risk in the western Mediterranean,which is poorly known.
Towards tsunami warning systems in every ocean
Since 2004, the international community, again actingunder the aegis of UNESCO, has initiated warning sys-tems for all of the exposed basins. CEA is taking part,in particular, in the construction of the forthcomingNorth-East Atlantic and Mediterranean TsunamiWarning System (NEAMTWS). The ensemble of stu-dies carried out in the area of prevention is serving asa basis for, and feeding into, the discussions concer-ning the deployment of these systems, by making itpossible to refine warning criteria. Indeed, an effectivewarning system should only be triggered in the eventof potentially hazardous occurrences, and must, mostimportantly, preclude false evacuation warnings, whichwould discredit it. It should be emphasized that mosttsunamis involve danger only at a local scale, within100 kilometers or so from the source, or at a regionalscale (< 1,000 km). Only a few events involve a poten-tial for destruction more than 1,000 km away from the
source, such as would be liable to cause catastrophicinundations at many sites.Predicting a tsunami comes down, essentially, to twocomplementary sets of approaches, and findings. Thefirst one makes use of the findings from the above-mentioned prevention studies, in the form of databa-ses of past tsunamis, complemented by simulations oflikely scenarios. Findings from such investigationscontribute not only to the drawing up of risk preven-tion plans, but are also used in the event of an alert,for the purposes of ascertaining the potentially expo-sed areas.The second approach concerns the real-time predictionof a tsunami, as an earthquake occurs. The starting
Figure 2.Inundation in the Banda Aceh area (northernmost tip of the island of Sumatra), as simulatedon the basis of a precise numerical model of the ground, using the characteristics of theearthquake of 26 December 2004. The initial coastline is shown by the thick black line. Thissimulation mimics the extent of the inundations, and the meeting of floodwaters.
CEA
/DA
M
The Deep-ocean Assessmentand Reporting of Tsunamis(DART) buoy network,positioned across the PacificOcean to monitor in real timethe evolution of tsunamis, bymeasuring wave height, andfor the purposes of warningexposed distant coastlines.N
OA
A C
ente
r fo
r Ts
unam
i Res
earc
h
95.15° 95.20° 95.25° 95.30° 95.35°
5.45°
- 12 - 10 - 8 - 6 - 4 - 2 0 2 4 6 8 10 12m
5.50°
5.55°
5.60°
5.45°
5.50°
5.55°
5.60°
1 km
Lhok Nga
Banda Aceh
wavefrontcollision
(Lampisang)
Thailand
Indonesia
Australia
United Statesother nations
Australia
Chile
15 April 2008
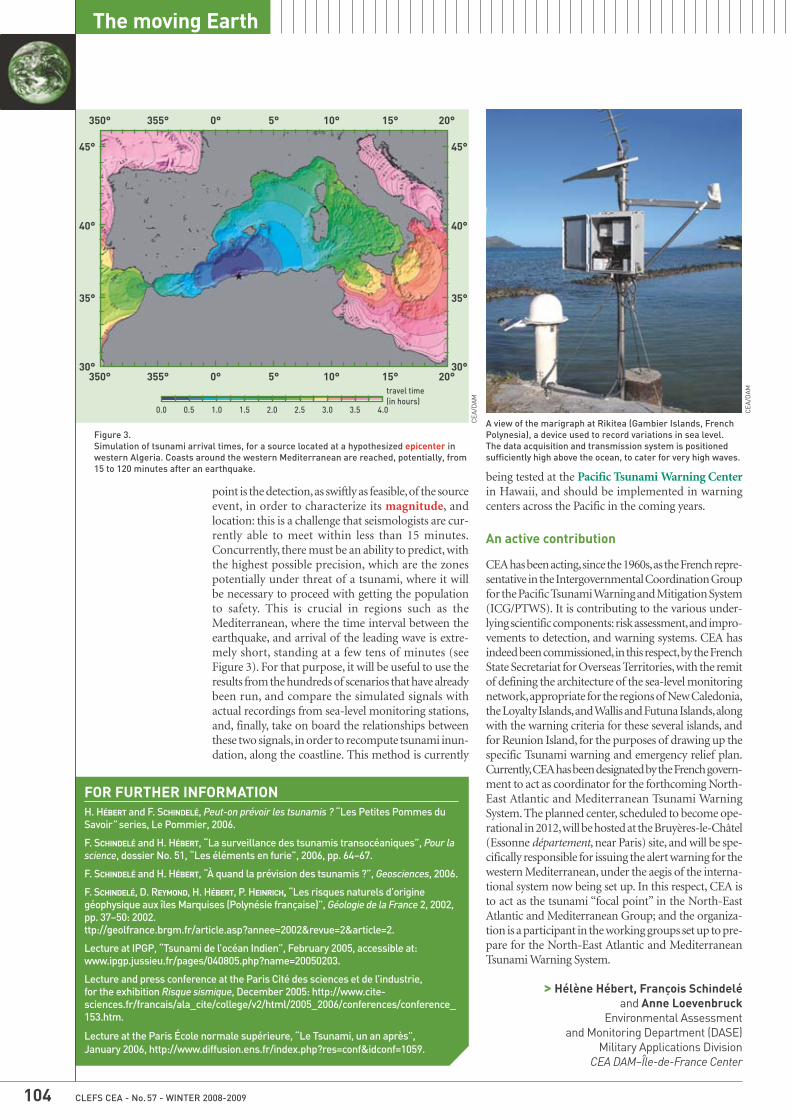
Figure 3.Simulation of tsunami arrival times, for a source located at a hypothesized epicenter inwestern Algeria. Coasts around the western Mediterranean are reached, potentially, from15 to 120 minutes after an earthquake.
CEA
/DA
M
FOR FURTHER INFORMATIONH. HÉBERT and F. SCHINDELÉ, Peut-on prévoir les tsunamis ? “Les Petites Pommes duSavoir” series, Le Pommier, 2006.
F. SCHINDELÉ and H. HÉBERT, “La surveillance des tsunamis transocéaniques”, Pour lascience, dossier No. 51, “Les éléments en furie”, 2006, pp. 64–67.
F. SCHINDELÉ and H. HÉBERT, “À quand la prévision des tsunamis ?”, Geosciences, 2006.
F. SCHINDELÉ, D. REYMOND, H. HÉBERT, P. HEINRICH, “Les risques naturels d’originegéophysique aux îles Marquises (Polynésie française)”, Géologie de la France 2, 2002,pp. 37–50: 2002.ttp://geolfrance.brgm.fr/article.asp?annee=2002&revue=2&article=2.
Lecture at IPGP, “Tsunami de l’océan Indien”, February 2005, accessible at:www.ipgp.jussieu.fr/pages/040805.php?name=20050203.
Lecture and press conference at the Paris Cité des sciences et de l’industrie, for the exhibition Risque sismique, December 2005: http://www.cite-sciences.fr/francais/ala_cite/college/v2/html/2005_2006/conferences/conference_153.htm.
Lecture at the Paris École normale supérieure, “Le Tsunami, un an après”, January 2006, http://www.diffusion.ens.fr/index.php?res=conf&idconf=1059.
CLEFS CEA - No. 57 - WINTER 2008-2009104
The moving Earth
point is the detection, as swiftly as feasible, of the sourceevent, in order to characterize its magnitude, and location: this is a challenge that seismologists are cur-rently able to meet within less than 15 minutes.Concurrently, there must be an ability to predict, withthe highest possible precision, which are the zonespotentially under threat of a tsunami, where it will be necessary to proceed with getting the population to safety. This is crucial in regions such as theMediterranean, where the time interval between theearthquake, and arrival of the leading wave is extre-mely short, standing at a few tens of minutes (seeFigure 3). For that purpose, it will be useful to use theresults from the hundreds of scenarios that have alreadybeen run, and compare the simulated signals with actual recordings from sea-level monitoring stations,and, finally, take on board the relationships betweenthese two signals, in order to recompute tsunami inun-dation, along the coastline. This method is currently
A view of the marigraph at Rikitea (Gambier Islands, FrenchPolynesia), a device used to record variations in sea level. The data acquisition and transmission system is positionedsufficiently high above the ocean, to cater for very high waves.
CEA
/DA
M
30°350° 355° 0°
0.0 0.5 1.0 1.5 2.0 2.5 3.0 3.5 4.0
travel time (in hours)
5° 10° 15° 20°
350° 355° 0° 5° 10° 15° 20°
35°
40°
45°
30°
35°
40°
45°
being tested at the Pacific Tsunami Warning Centerin Hawaii, and should be implemented in warning centers across the Pacific in the coming years.
An active contribution
CEA has been acting, since the 1960s, as the French repre-sentative in the Intergovernmental Coordination Groupfor the Pacific Tsunami Warning and Mitigation System(ICG/PTWS). It is contributing to the various under-lying scientific components: risk assessment, and impro-vements to detection, and warning systems. CEA hasindeed been commissioned, in this respect, by the FrenchState Secretariat for Overseas Territories, with the remitof defining the architecture of the sea-level monitoringnetwork, appropriate for the regions of New Caledonia,the Loyalty Islands, and Wallis and Futuna Islands, alongwith the warning criteria for these several islands, andfor Reunion Island, for the purposes of drawing up thespecific Tsunami warning and emergency relief plan.Currently, CEA has been designated by the French govern-ment to act as coordinator for the forthcoming North-East Atlantic and Mediterranean Tsunami WarningSystem. The planned center, scheduled to become ope-rational in 2012, will be hosted at the Bruyères-le-Châtel(Essonne département, near Paris) site, and will be spe-cifically responsible for issuing the alert warning for thewestern Mediterranean, under the aegis of the interna-tional system now being set up. In this respect, CEA isto act as the tsunami “focal point” in the North-EastAtlantic and Mediterranean Group; and the organiza-tion is a participant in the working groups set up to pre-pare for the North-East Atlantic and MediterraneanTsunami Warning System.
> Hélène Hébert, François Schindelé and Anne Loevenbruck
Environmental Assessment and Monitoring Department (DASE)
Military Applications DivisionCEA DAM–Île-de-France Center
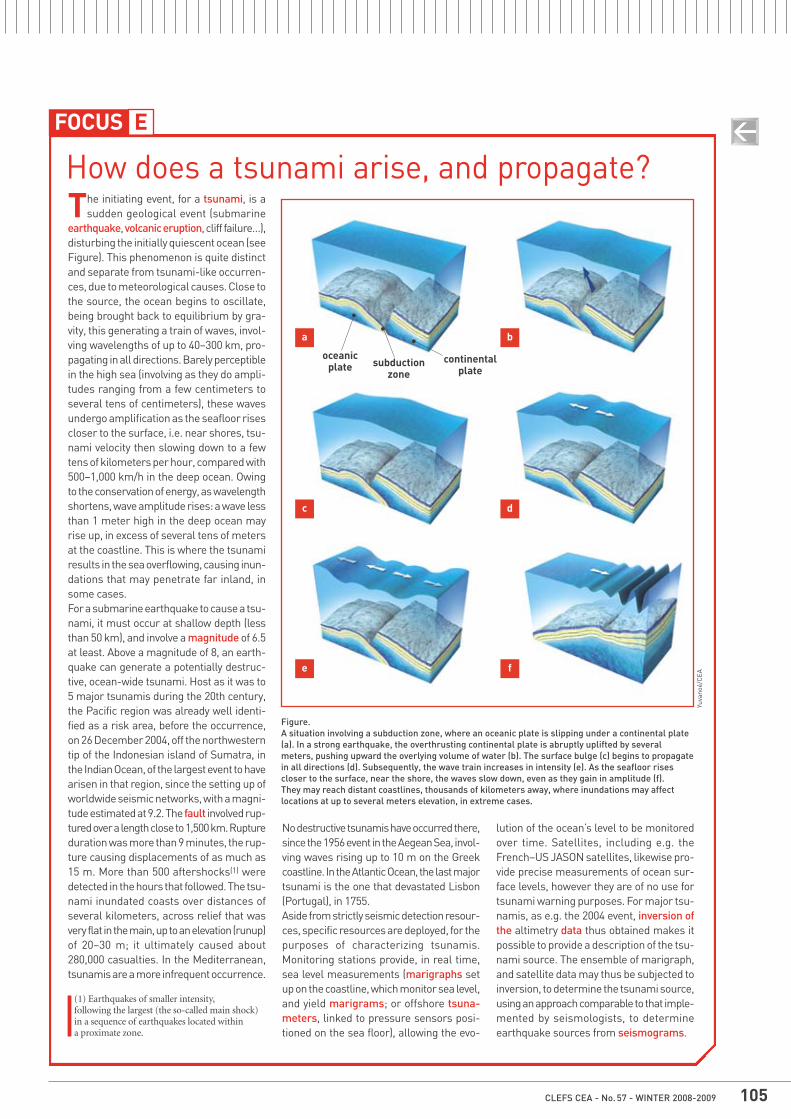
CLEFS CEA - No. 57 - WINTER 2008-2009 105
The initiating event, for a tsunami, is asudden geological event (submarine
earthquake, volcanic eruption, cliff failure…),disturbing the initially quiescent ocean (seeFigure). This phenomenon is quite distinctand separate from tsunami-like occurren-ces, due to meteorological causes. Close tothe source, the ocean begins to oscillate,being brought back to equilibrium by gra-vity, this generating a train of waves, invol-ving wavelengths of up to 40–300 km, pro-pagating in all directions. Barely perceptiblein the high sea (involving as they do ampli-tudes ranging from a few centimeters toseveral tens of centimeters), these wavesundergo amplification as the seafloor risescloser to the surface, i.e. near shores, tsu-nami velocity then slowing down to a fewtens of kilometers per hour, compared with500–1,000 km/h in the deep ocean. Owingto the conservation of energy, as wavelengthshortens, wave amplitude rises: a wave lessthan 1 meter high in the deep ocean mayrise up, in excess of several tens of metersat the coastline. This is where the tsunamiresults in the sea overflowing, causing inun-dations that may penetrate far inland, insome cases.For a submarine earthquake to cause a tsu-nami, it must occur at shallow depth (lessthan 50 km), and involve a magnitude of 6.5at least. Above a magnitude of 8, an earth-quake can generate a potentially destruc-tive, ocean-wide tsunami. Host as it was to5 major tsunamis during the 20th century,the Pacific region was already well identi-fied as a risk area, before the occurrence,on 26 December 2004, off the northwesterntip of the Indonesian island of Sumatra, inthe Indian Ocean, of the largest event to havearisen in that region, since the setting up ofworldwide seismic networks, with a magni-tude estimated at 9.2. The fault involved rup-tured over a length close to 1,500 km. Ruptureduration was more than 9 minutes, the rup-ture causing displacements of as much as15 m. More than 500 aftershocks(1) weredetected in the hours that followed. The tsu-nami inundated coasts over distances ofseveral kilometers, across relief that wasvery flat in the main, up to an elevation (runup)of 20–30 m; it ultimately caused about280,000 casualties. In the Mediterranean,tsunamis are a more infrequent occurrence.
No destructive tsunamis have occurred there,since the 1956 event in the Aegean Sea, invol-ving waves rising up to 10 m on the Greekcoastline. In the Atlantic Ocean, the last majortsunami is the one that devastated Lisbon(Portugal), in 1755.Aside from strictly seismic detection resour-ces, specific resources are deployed, for thepurposes of characterizing tsunamis.Monitoring stations provide, in real time,sea level measurements (marigraphs setup on the coastline, which monitor sea level,and yield marigrams; or offshore tsuna-meters, linked to pressure sensors posi-tioned on the sea floor), allowing the evo-
lution of the ocean’s level to be monitoredover time. Satellites, including e.g. theFrench–US JASON satellites, likewise pro-vide precise measurements of ocean sur-face levels, however they are of no use fortsunami warning purposes. For major tsu-namis, as e.g. the 2004 event, inversion ofthe altimetry data thus obtained makes itpossible to provide a description of the tsu-nami source. The ensemble of marigraph,and satellite data may thus be subjected toinversion, to determine the tsunami source,using an approach comparable to that imple-mented by seismologists, to determineearthquake sources from seismograms.
Figure.A situation involving a subduction zone, where an oceanic plate is slipping under a continental plate(a). In a strong earthquake, the overthrusting continental plate is abruptly uplifted by severalmeters, pushing upward the overlying volume of water (b). The surface bulge (c) begins to propagatein all directions (d). Subsequently, the wave train increases in intensity (e). As the seafloor risescloser to the surface, near the shore, the waves slow down, even as they gain in amplitude (f). They may reach distant coastlines, thousands of kilometers away, where inundations may affectlocations at up to several meters elevation, in extreme cases.
(1) Earthquakes of smaller intensity, following the largest (the so-called main shock)in a sequence of earthquakes located within a proximate zone.
EFOCUS
a b
c d
e f
How does a tsunami arise, and propagate?
Yuva
noé/
CEA
oceanic plate subduction
zonecontinental
plate
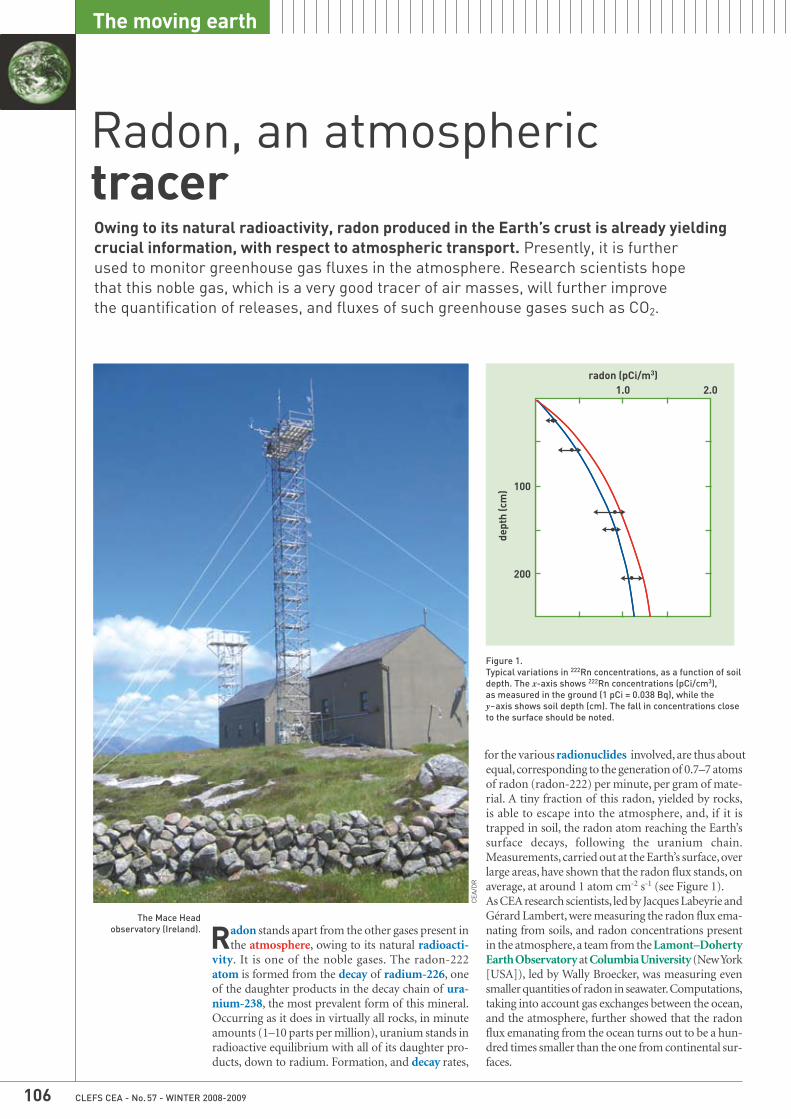
The moving earth
CLEFS CEA - No. 57 - WINTER 2008-2009106
Owing to its natural radioactivity, radon produced in the Earth’s crust is already yieldingcrucial information, with respect to atmospheric transport. Presently, it is further used to monitor greenhouse gas fluxes in the atmosphere. Research scientists hope that this noble gas, which is a very good tracer of air masses, will further improve the quantification of releases, and fluxes of such greenhouse gases such as CO2.
Radon, an atmospheric tracer
The Mace Headobservatory (Ireland).
CEA
/DR
for the various radionuclides involved, are thus aboutequal, corresponding to the generation of 0.7–7 atomsof radon (radon-222) per minute, per gram of mate-rial. A tiny fraction of this radon, yielded by rocks, is able to escape into the atmosphere, and, if it is trapped in soil, the radon atom reaching the Earth’ssurface decays, following the uranium chain.Measurements, carried out at the Earth’s surface, overlarge areas, have shown that the radon flux stands, onaverage, at around 1 atom cm-2 s-1 (see Figure 1).As CEA research scientists, led by Jacques Labeyrie andGérard Lambert, were measuring the radon flux ema-nating from soils, and radon concentrations presentin the atmosphere, a team from the Lamont–DohertyEarth Observatory at Columbia University (New York[USA]), led by Wally Broecker, was measuring evensmaller quantities of radon in seawater. Computations,taking into account gas exchanges between the ocean,and the atmosphere, further showed that the radonflux emanating from the ocean turns out to be a hun-dred times smaller than the one from continental sur-faces.
Figure 1.Typical variations in 222Rn concentrations, as a function of soildepth. The x-axis shows 222Rn concentrations (pCi/cm3), as measured in the ground (1 pCi = 0.038 Bq), while they�axis shows soil depth (cm). The fall in concentrations closeto the surface should be noted.
Radon stands apart from the other gases present inthe atmosphere, owing to its natural radioacti-
vity. It is one of the noble gases. The radon-222atom is formed from the decay of radium-226, oneof the daughter products in the decay chain of ura-nium-238, the most prevalent form of this mineral.Occurring as it does in virtually all rocks, in minuteamounts (1–10 parts per million), uranium stands inradioactive equilibrium with all of its daughter pro-ducts, down to radium. Formation, and decay rates,
radon (pCi/m3)
dept
h (c
m)
200
100
1.0 2.0
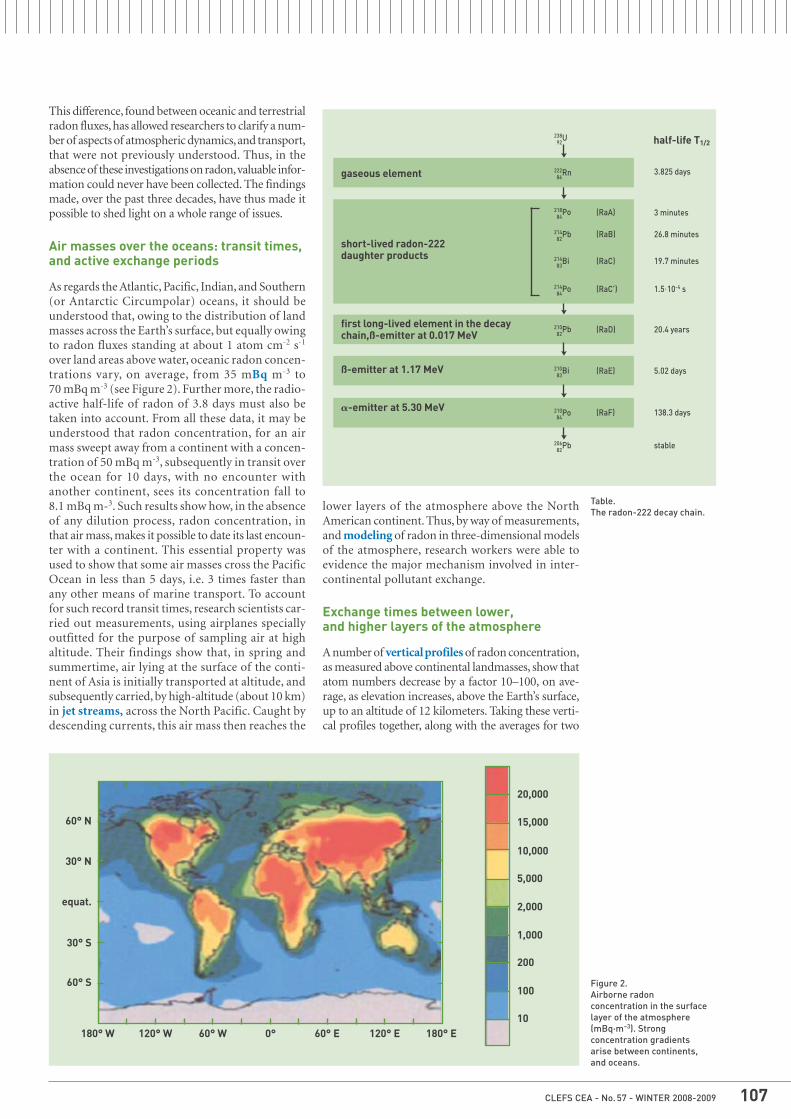
CLEFS CEA - No. 57 - WINTER 2008-2009 107
This difference, found between oceanic and terrestrialradon fluxes, has allowed researchers to clarify a num-ber of aspects of atmospheric dynamics, and transport,that were not previously understood. Thus, in theabsence of these investigations on radon, valuable infor-mation could never have been collected. The findingsmade, over the past three decades, have thus made itpossible to shed light on a whole range of issues.
Air masses over the oceans: transit times,and active exchange periods
As regards the Atlantic, Pacific, Indian, and Southern(or Antarctic Circumpolar) oceans, it should beunderstood that, owing to the distribution of landmasses across the Earth’s surface, but equally owingto radon fluxes standing at about 1 atom cm-2 s-1
over land areas above water, oceanic radon concen-trations vary, on average, from 35 mBq m-3 to70 mBq m-3 (see Figure 2). Further more, the radio-active half-life of radon of 3.8 days must also betaken into account. From all these data, it may beunderstood that radon concentration, for an airmass sweept away from a continent with a concen-tration of 50 mBq m-3, subsequently in transit overthe ocean for 10 days, with no encounter with another continent, sees its concentration fall to8.1 mBq m-3. Such results show how, in the absenceof any dilution process, radon concentration, inthat air mass, makes it possible to date its last encoun-ter with a continent. This essential property wasused to show that some air masses cross the PacificOcean in less than 5 days, i.e. 3 times faster thanany other means of marine transport. To accountfor such record transit times, research scientists car-ried out measurements, using airplanes speciallyoutfitted for the purpose of sampling air at highaltitude. Their findings show that, in spring andsummertime, air lying at the surface of the conti-nent of Asia is initially transported at altitude, andsubsequently carried, by high-altitude (about 10 km)in jet streams, across the North Pacific. Caught bydescending currents, this air mass then reaches the
lower layers of the atmosphere above the NorthAmerican continent. Thus, by way of measurements,and modeling of radon in three-dimensional modelsof the atmosphere, research workers were able toevidence the major mechanism involved in inter-continental pollutant exchange.
Exchange times between lower, and higher layers of the atmosphere
A number of vertical profiles of radon concentration,as measured above continental landmasses, show thatatom numbers decrease by a factor 10–100, on ave-rage, as elevation increases, above the Earth’s surface,up to an altitude of 12 kilometers. Taking these verti-cal profiles together, along with the averages for two
Figure 2.Airborne radonconcentration in the surfacelayer of the atmosphere(mBq·m–3). Strongconcentration gradientsarise between continents,and oceans.
Table.The radon-222 decay chain.
short-lived radon-222daughter products
first long-lived element in the decay chain,ß-emitter at 0.017 MeV
ß-emitter at 1.17 MeV
�-emitter at 5.30 MeV
238U92
218Po84
214Pb82
210Pb82
206Pb82
214Bi83
210Bi83
214Po84
210Po84
(RaA)
(RaB)
(RaC)
(RaC’)
(RaD)
(RaE)
(RaF)
half-life T1/2
3.825 days
3 minutes
26.8 minutes
19.7 minutes
1.5�10-4 s
20.4 years
5.02 days
138.3 days
stable
gaseous element 222Rn86
60° S
180° W 120° W 60° W 60° E 120° E 180° E10
100
200
1,000
2,000
5,000
10,000
15,000
20,000
0°
30° S
30° N
60° N
equat.
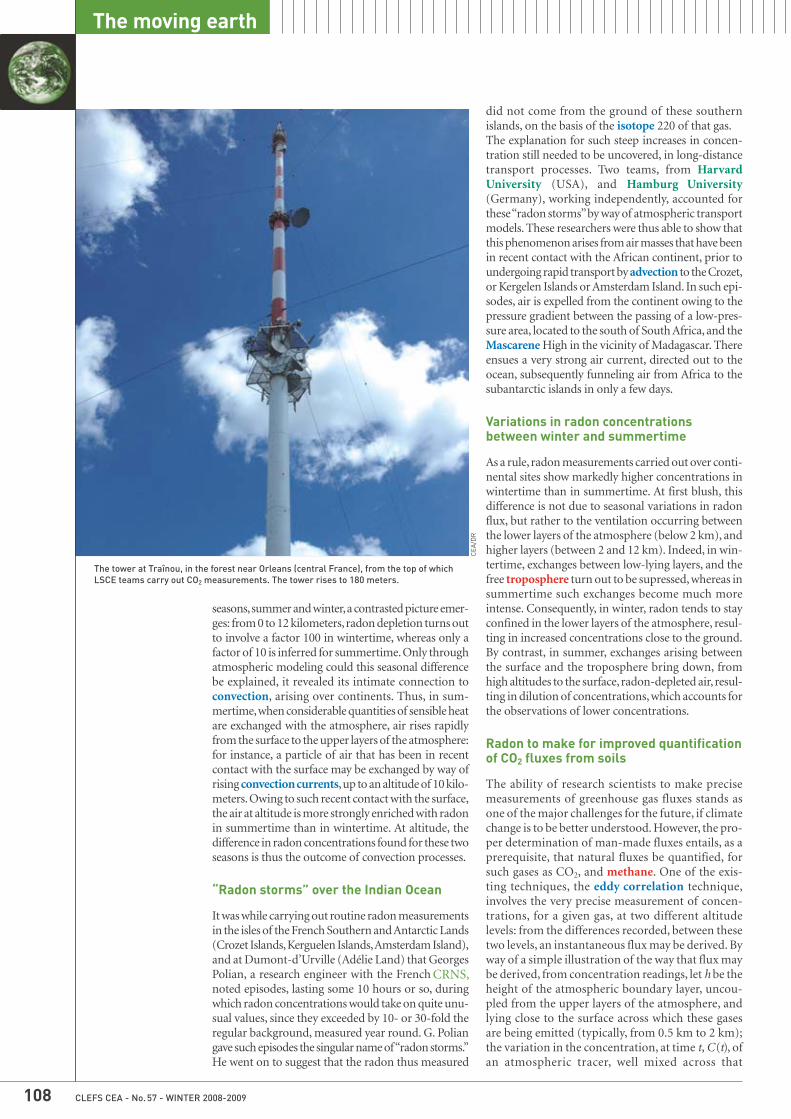
The moving earth
CLEFS CEA - No. 57 - WINTER 2008-2009108
did not come from the ground of these southernislands, on the basis of the isotope 220 of that gas.The explanation for such steep increases in concen-tration still needed to be uncovered, in long-distancetransport processes. Two teams, from HarvardUniversity (USA), and Hamburg University(Germany), working independently, accounted forthese “radon storms” by way of atmospheric transportmodels. These researchers were thus able to show thatthis phenomenon arises from air masses that have beenin recent contact with the African continent, prior toundergoing rapid transport by advection to the Crozet,or Kergelen Islands or Amsterdam Island. In such epi-sodes, air is expelled from the continent owing to thepressure gradient between the passing of a low-pres-sure area, located to the south of South Africa, and theMascarene High in the vicinity of Madagascar. Thereensues a very strong air current, directed out to theocean, subsequently funneling air from Africa to thesubantarctic islands in only a few days.
Variations in radon concentrationsbetween winter and summertime
As a rule, radon measurements carried out over conti-nental sites show markedly higher concentrations inwintertime than in summertime. At first blush, thisdifference is not due to seasonal variations in radonflux, but rather to the ventilation occurring betweenthe lower layers of the atmosphere (below 2 km), andhigher layers (between 2 and 12 km). Indeed, in win-tertime, exchanges between low-lying layers, and thefree troposphere turn out to be supressed, whereas insummertime such exchanges become much moreintense. Consequently, in winter, radon tends to stayconfined in the lower layers of the atmosphere, resul-ting in increased concentrations close to the ground.By contrast, in summer, exchanges arising betweenthe surface and the troposphere bring down, fromhigh altitudes to the surface, radon-depleted air, resul-ting in dilution of concentrations, which accounts forthe observations of lower concentrations.
Radon to make for improved quantificationof CO2 fluxes from soils
The ability of research scientists to make precisemeasurements of greenhouse gas fluxes stands asone of the major challenges for the future, if climatechange is to be better understood. However, the pro-per determination of man-made fluxes entails, as aprerequisite, that natural fluxes be quantified, forsuch gases as CO , and 2 methane. One of the exis-ting techniques, the eddy correlation technique,involves the very precise measurement of concen-trations, for a given gas, at two different altitudelevels: from the differences recorded, between thesetwo levels, an instantaneous flux may be derived. Byway of a simple illustration of the way that flux maybe derived, from concentration readings, let h be theheight of the atmospheric boundary layer, uncou-pled from the upper layers of the atmosphere, andlying close to the surface across which these gasesare being emitted (typically, from 0.5 km to 2 km);the variation in the concentration, at time t, C(t), ofan atmospheric tracer, well mixed across that
seasons, summer and winter, a contrasted picture emer-ges: from 0 to 12 kilometers, radon depletion turns outto involve a factor 100 in wintertime, whereas only afactor of 10 is inferred for summertime. Only throughatmospheric modeling could this seasonal differencebe explained, it revealed its intimate connection toconvection, arising over continents. Thus, in sum-mertime, when considerable quantities of sensible heatare exchanged with the atmosphere, air rises rapidlyfrom the surface to the upper layers of the atmosphere:for instance, a particle of air that has been in recentcontact with the surface may be exchanged by way ofrising convection currents, up to an altitude of 10 kilo-meters. Owing to such recent contact with the surface,the air at altitude is more strongly enriched with radonin summertime than in wintertime. At altitude, thedifference in radon concentrations found for these twoseasons is thus the outcome of convection processes.
“Radon storms” over the Indian Ocean
It was while carrying out routine radon measurementsin the isles of the French Southern and Antarctic Lands(Crozet Islands, Kerguelen Islands, Amsterdam Island),and at Dumont-d’Urville (Adélie Land) that GeorgesPolian, a research engineer with the Frenchnoted episodes, lasting some 10 hours or so, duringwhich radon concentrations would take on quite unu-sual values, since they exceeded by 10- or 30-fold theregular background, measured year round. G. Poliangave such episodes the singular name of “radon storms.”He went on to suggest that the radon thus measured
The tower at Traînou, in the forest near Orleans (central France), from the top of whichLSCE teams carry out CO2 measurements. The tower rises to 180 meters.
CEA
/DR
CRNS,
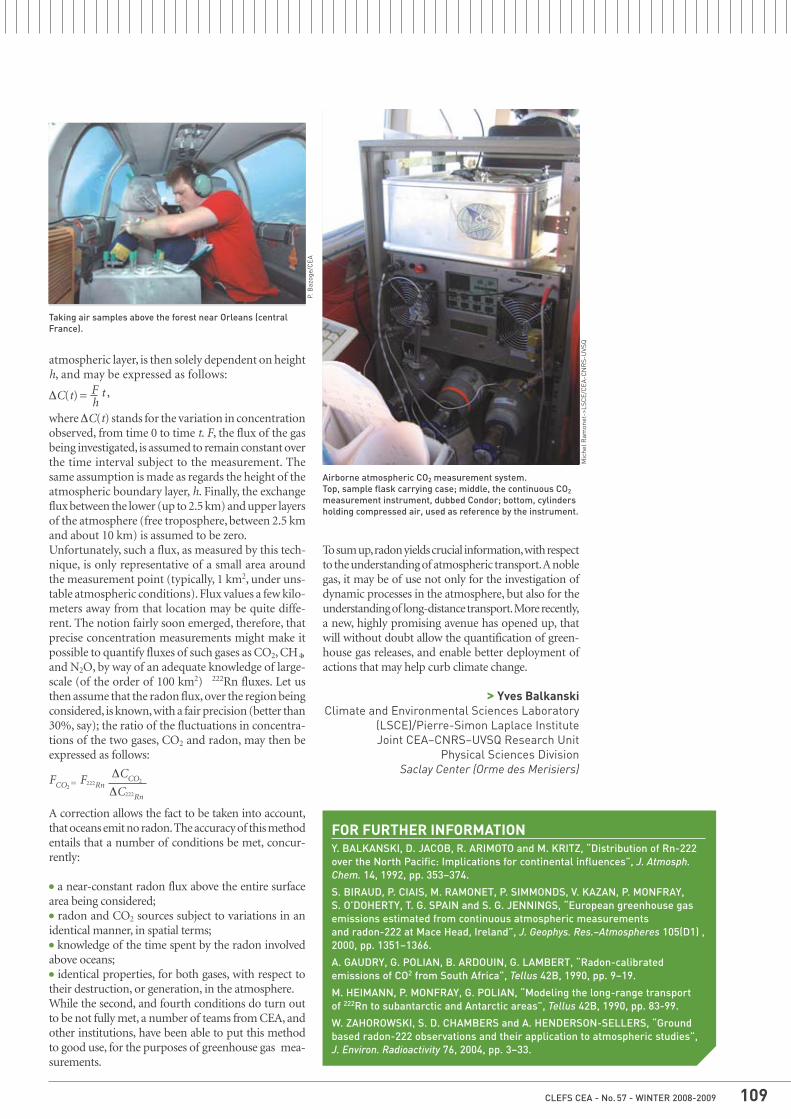
CLEFS CEA - No. 57 - WINTER 2008-2009 109
atmospheric layer, is then solely dependent on heighth, and may be expressed as follows:
where ΔC(t) stands for the variation in concentrationobserved, from time 0 to time t. F, the flux of the gasbeing investigated, is assumed to remain constant overthe time interval subject to the measurement. Thesame assumption is made as regards the height of theatmospheric boundary layer, h. Finally, the exchangeflux between the lower (up to 2.5 km) and upper layersof the atmosphere (free troposphere, between 2.5 kmand about 10 km) is assumed to be zero.Unfortunately, such a flux, as measured by this tech-nique, is only representative of a small area aroundthe measurement point (typically, 1 km2, under uns-table atmospheric conditions). Flux values a few kilo-meters away from that location may be quite diffe-rent. The notion fairly soon emerged, therefore, thatprecise concentration measurements might make itpossible to quantify fluxes of such gases as CO , CH ,2 4
and N2O, by way of an adequate knowledge of large-scale (of the order of 100 km2) 222Rn fluxes. Let usthen assume that the radon flux, over the region beingconsidered, is known, with a fair precision (better than30%, say); the ratio of the fluctuations in concentra-tions of the two gases, CO2 and radon, may then beexpressed as follows:
A correction allows the fact to be taken into account,that oceans emit no radon. The accuracy of this methodentails that a number of conditions be met, concur-rently:
● a near-constant radon flux above the entire surfacearea being considered;● radon and CO2 sources subject to variations in anidentical manner, in spatial terms;● knowledge of the time spent by the radon involvedabove oceans;● identical properties, for both gases, with respect totheir destruction, or generation, in the atmosphere.While the second, and fourth conditions do turn outto be not fully met, a number of teams from CEA, andother institutions, have been able to put this methodto good use, for the purposes of greenhouse gas mea-surements.
Airborne atmospheric CO2 measurement system. Top, sample flask carrying case; middle, the continuous CO2
measurement instrument, dubbed Condor; bottom, cylindersholding compressed air, used as reference by the instrument.
Taking air samples above the forest near Orleans (centralFrance).
Mic
hel R
amon
et->
LSC
E/C
EA-C
NR
S-U
VSQ
P. B
azog
e/C
EA
To sum up, radon yields crucial information, with respectto the understanding of atmospheric transport. A noblegas, it may be of use not only for the investigation ofdynamic processes in the atmosphere, but also for theunderstanding of long-distance transport. More recently,a new, highly promising avenue has opened up, thatwill without doubt allow the quantification of green-house gas releases, and enable better deployment ofactions that may help curb climate change.
> Yves Balkanski Climate and Environmental Sciences Laboratory
(LSCE)/Pierre-Simon Laplace InstituteJoint CEA–CNRS–UVSQ Research Unit
Physical Sciences DivisionSaclay Center (Orme des Merisiers)
FOR FURTHER INFORMATIONY. BALKANSKI, D. JACOB, R. ARIMOTO and M. KRITZ, “Distribution of Rn-222over the North Pacific: Implications for continental influences”, J. Atmosph.Chem. 14, 1992, pp. 353–374.
S. BIRAUD, P. CIAIS, M. RAMONET, P. SIMMONDS, V. KAZAN, P. MONFRAY, S. O’DOHERTY, T. G. SPAIN and S. G. JENNINGS, “European greenhouse gasemissions estimated from continuous atmospheric measurements and radon-222 at Mace Head, Ireland”, J. Geophys. Res.–Atmospheres 105(D1) ,2000, pp. 1351–1366.
A. GAUDRY, G. POLIAN, B. ARDOUIN, G. LAMBERT, “Radon-calibrated emissions of CO2 from South Africa”, Tellus 42B, 1990, pp. 9–19.
M. HEIMANN, P. MONFRAY, G. POLIAN, “Modeling the long-range transport of 222Rn to subantarctic and Antarctic areas”, Tellus 42B, 1990, pp. 83-99.
W. ZAHOROWSKI, S. D. CHAMBERS and A. HENDERSON-SELLERS, “Groundbased radon-222 observations and their application to atmospheric studies”,J. Environ. Radioactivity 76, 2004, pp. 3–33.
ΔC(t) =hF t ,
FCO2= F222Rn
ΔCCO2
ΔC222Rn
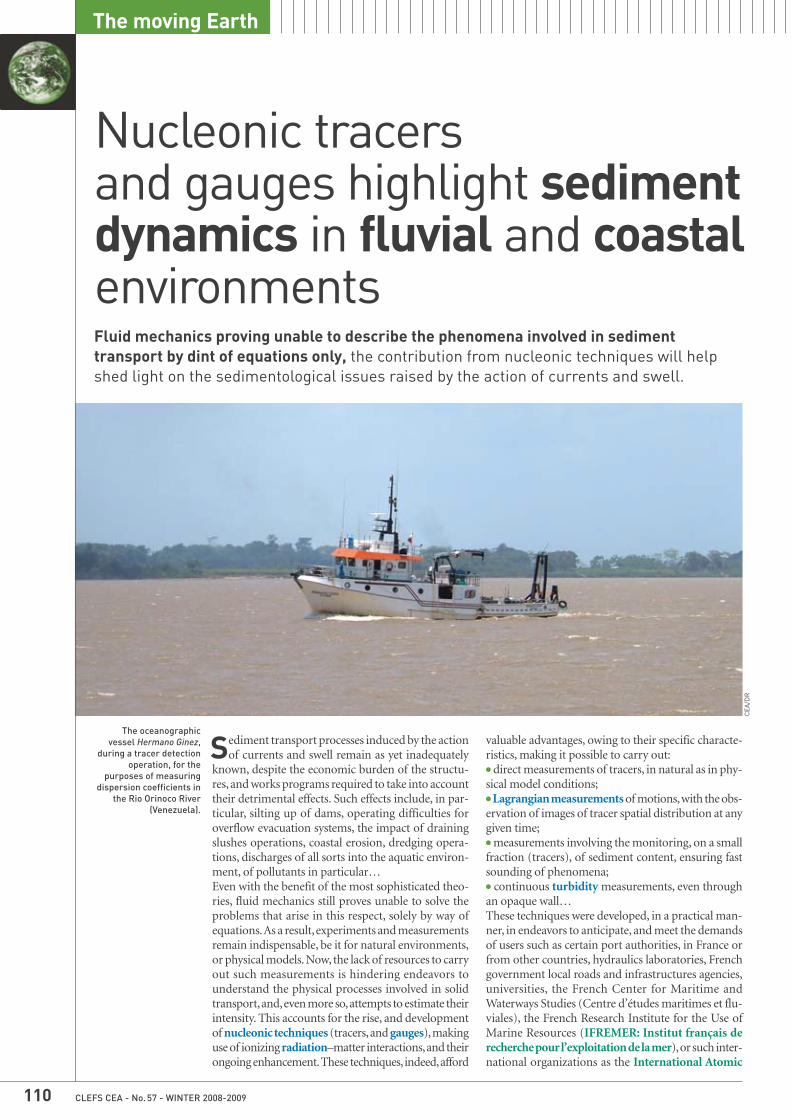
CLEFS CEA - No. 57 - WINTER 2008-2009110
The moving Earth
Fluid mechanics proving unable to describe the phenomena involved in sediment transport by dint of equations only, the contribution from nucleonic techniques will help shed light on the sedimentological issues raised by the action of currents and swell.
Nucleonic tracers and gauges highlight sedimentdynamics in fluvial and coastalenvironments
Sediment transport processes induced by the actionof currents and swell remain as yet inadequately
known, despite the economic burden of the structu-res, and works programs required to take into accounttheir detrimental effects. Such effects include, in par-ticular, silting up of dams, operating difficulties foroverflow evacuation systems, the impact of drainingslushes operations, coastal erosion, dredging opera-tions, discharges of all sorts into the aquatic environ-ment, of pollutants in particular…Even with the benefit of the most sophisticated theo-ries, fluid mechanics still proves unable to solve theproblems that arise in this respect, solely by way ofequations. As a result, experiments and measurementsremain indispensable, be it for natural environments,or physical models. Now, the lack of resources to carryout such measurements is hindering endeavors tounderstand the physical processes involved in solidtransport, and, even more so, attempts to estimate theirintensity. This accounts for the rise, and developmentof nucleonic techniques (tracers, and gauges), makinguse of ionizing radiation–matter interactions, and theirongoing enhancement. These techniques, indeed, afford
valuable advantages, owing to their specific characte-ristics, making it possible to carry out:● direct measurements of tracers, in natural as in phy-sical model conditions;● Lagrangian measurements of motions, with the obs-ervation of images of tracer spatial distribution at anygiven time;● measurements involving the monitoring, on a smallfraction (tracers), of sediment content, ensuring fastsounding of phenomena;● continuous turbidity measurements, even throughan opaque wall…These techniques were developed, in a practical man-ner, in endeavors to anticipate, and meet the demandsof users such as certain port authorities, in France orfrom other countries, hydraulics laboratories, Frenchgovernment local roads and infrastructures agencies,universities, the French Center for Maritime andWaterways Studies (Centre d’études maritimes et flu-viales), the French Research Institute for the Use ofMarine Resources (IFREMER: Institut français derecherche pour l’exploitation de la mer), or such inter-national organizations as the International Atomic
The oceanographicvessel Hermano Ginez,
during a tracer detectionoperation, for the
purposes of measuringdispersion coefficients in
the Rio Orinoco River(Venezuela).
CEA
/DR
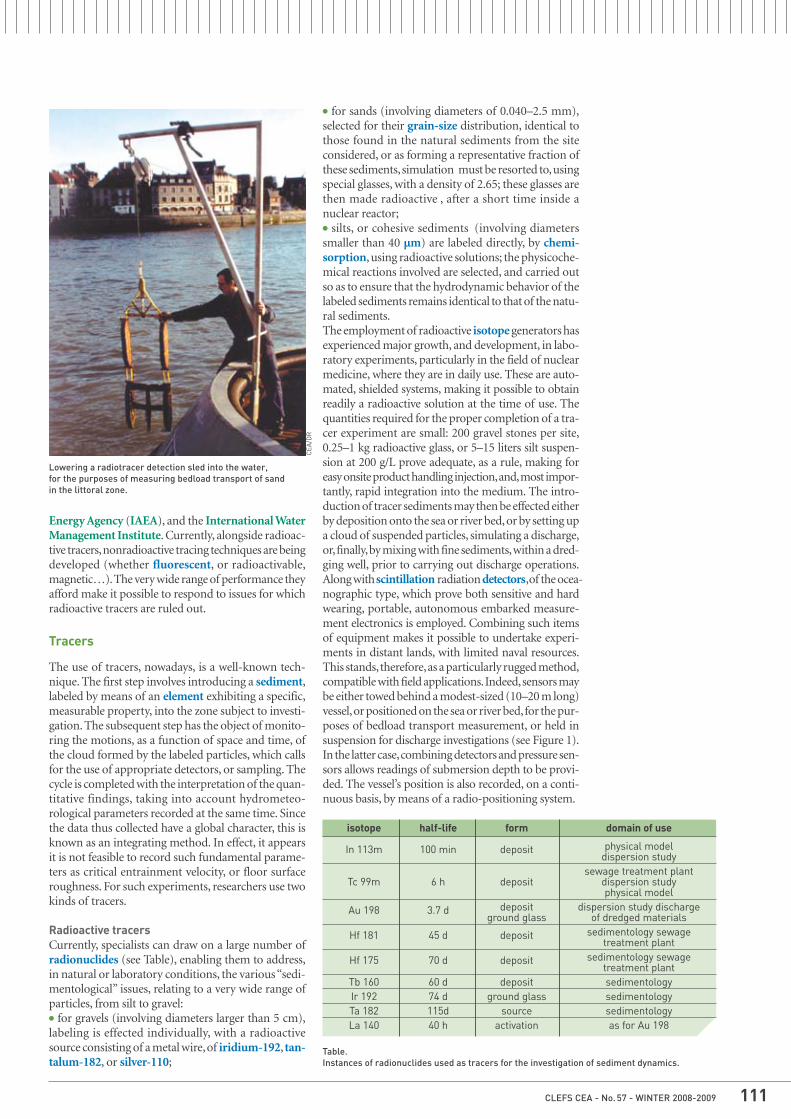
isotope half-life form domain of use
In 113m 100 min deposit physical model dispersion study
sewage treatment plant Tc 99m 6 h deposit dispersion study
physical model
Au 198 3.7 d deposit dispersion study dischargeground glass of dredged materials
Hf 181 45 d deposit sedimentology sewagetreatment plant
Hf 175 70 d deposit sedimentology sewagetreatment plant
Tb 160 60 d deposit sedimentologyIr 192 74 d ground glass sedimentologyTa 182 115d source sedimentologyLa 140 40 h activation as for Au 198
Table.Instances of radionuclides used as tracers for the investigation of sediment dynamics.
CLEFS CEA - No. 57 - WINTER 2008-2009 111
Energy Agency (IAEA), and the International WaterManagement Institute. Currently, alongside radioac-tive tracers, nonradioactive tracing techniques are beingdeveloped (whether fluorescent, or radioactivable,magnetic…). The very wide range of performance theyafford make it possible to respond to issues for whichradioactive tracers are ruled out.
Tracers
The use of tracers, nowadays, is a well-known tech-nique. The first step involves introducing a sediment,labeled by means of an element exhibiting a specific,measurable property, into the zone subject to investi-gation. The subsequent step has the object of monito-ring the motions, as a function of space and time, ofthe cloud formed by the labeled particles, which callsfor the use of appropriate detectors, or sampling. Thecycle is completed with the interpretation of the quan-titative findings, taking into account hydrometeo -rological parameters recorded at the same time. Sincethe data thus collected have a global character, this isknown as an integrating method. In effect, it appearsit is not feasible to record such fundamental parame-ters as critical entrainment velocity, or floor surfaceroughness. For such experiments, researchers use twokinds of tracers.
Radioactive tracersCurrently, specialists can draw on a large number ofradionuclides (see Table), enabling them to address,in natural or laboratory conditions, the various “sedi-mentological” issues, relating to a very wide range ofparticles, from silt to gravel:● for gravels (involving diameters larger than 5 cm),labeling is effected individually, with a radioactivesource consisting of a metal wire, of iridium-192, tan-talum-182, or silver-110;
● for sands (involving diameters of 0.040–2.5 mm),selected for their grain-size distribution, identical tothose found in the natural sediments from the siteconsidered, or as forming a representative fraction ofthese sediments, simulation must be resorted to, usingspecial glasses, with a density of 2.65; these glasses arethen made radioactive , after a short time inside anuclear reactor;● silts, or cohesive sediments (involving diameterssmaller than 40 µm) are labeled directly, by chemi-sorption, using radioactive solutions; the physicoche-mical reactions involved are selected, and carried outso as to ensure that the hydrodynamic behavior of thelabeled sediments remains identical to that of the natu-ral sediments.The employment of radioactive isotope generators hasexperienced major growth, and development, in labo-ratory experiments, particularly in the field of nuclearmedicine, where they are in daily use. These are auto-mated, shielded systems, making it possible to obtainreadily a radioactive solution at the time of use. Thequantities required for the proper completion of a tra-cer experiment are small: 200 gravel stones per site,0.25–1 kg radioactive glass, or 5–15 liters silt suspen-sion at 200 g/L prove adequate, as a rule, making foreasy onsite product handling injection, and, most impor-tantly, rapid integration into the medium. The intro-duction of tracer sediments may then be effected eitherby deposition onto the sea or river bed, or by setting upa cloud of suspended particles, simulating a discharge,or, finally, by mixing with fine sediments, within a dred-ging well, prior to carrying out discharge operations.Along with scintillation radiation detectors, of the ocea-nographic type, which prove both sensitive and hardwearing, portable, autonomous embarked measure-ment electronics is employed. Combining such itemsof equipment makes it possible to undertake experi-ments in distant lands, with limited naval resources.This stands, therefore, as a particularly rugged method,compatible with field applications. Indeed, sensors maybe either towed behind a modest-sized (10–20 m long)vessel, or positioned on the sea or river bed, for the pur-poses of bedload transport measurement, or held insuspension for discharge investigations (see Figure 1).In the latter case, combining detectors and pressure sen-sors allows readings of submersion depth to be provi-ded. The vessel’s position is also recorded, on a conti-nuous basis, by means of a radio-positioning system.
Lowering a radiotracer detection sled into the water, for the purposes of measuring bedload transport of sand in the littoral zone.
CEA
/DR

CLEFS CEA - No. 57 - WINTER 2008-2009112
The moving Earth
Figure 1.An instance of detection for the purposes of investigating bedload transport.
Detection of tracers on ariver bed. Investigation of
bedload transport ofsandy sediments in the
Rio Orinoco River(Venezuela).
CEA
/DR
Once the operation is completed, and the measure-ment readings collected, their interpretation yields awealth of qualitative, and quantitative findings. Asregards sediment motions along the sea or river bed,such findings concern motion direction, or directions;maximum, and average horizontal displacement velo-cities; the quantities of sediment involved in bedloadtransport, returned to suspension, or subject to pos-sible overlaying… On the other hand, as regards displa-cements of sediment suspensions, artificially dischar-ged into the environment (e.g. industrial, and urbandischarges, or dredged materials), the information yiel-ded concern excursion, and drift (direction, horizon-tal velocity); longitudinal, and transverse dispersioncoefficients; dilution rate as a function of time, and ofthe distance traveled by the cloud; average particle sedi-mentation rate; the quantities of material depositingon the seabead…The use of tracers in natural environments has ena-bled a whole range of studies to be carried out:● systematic site studies, as e.g. those carried out aroundthe harbor, and coastline at Zeebrugge (Belgium), inthe bay around the mouth of the River Seine (westernFrance), at Cap Breton (southwestern France), orHonfleur (western France)… In this respect, a CEAteam, led by Charles Beck, carried out, in particular,
an altogether exhaustive investigation on the FrenchNorth Sea coast – a maritime region characterized bya succession of sites involving sandy beds, featuringsubaqueous dunes, megaripples, and sand ribbons.The technique used is that of the sideways-lookingsonar, combined with point sampling, carried outhowever at numerous locations. Injections of radio-active tracers (iridium -192), at 8 points located in 3 dif-ferent zones, at depths ranging from –4.5m to –20 m,allowed the drawing up of precise bathymetric maps.The broad spread of readings obtained evidenced avery wide difference in sediment dynamics, on eitherside of Cape Gris Nez (northwestern France, nearCalais). This finding accounts, in part, for the verystrong erosion affecting beaches located to the north-east of Wissant (close to Cape Gris Nez), and the sedi-ment transit – very intense, though varying, depen-ding on depth – generated by the action of swell, andtide currents. Such transit remains low (about0.03 m3/m/d) when depths are greater than –15 m,rising however to 0.2 m3/m/d, should water height, atlow water, remain less than –5 m. It should be notedthat theoretical calculations yield an estimate, on ave-rage, of 0.4 m3/m/d, at a depth of –18 m, for currentsof 0.5 m/s, 1 m from the bottom; such computed valueshave yet to be corroborated by measurements;● studies to gain knowledge of discharges of dredgedmaterials, as carried out e.g. in the harbors at Le Havre(western France), Antifer (north of Le Havre), Lorient(western France), or Singapore…● investigations on the recycling of dredged materials,as occurs at the ports of Lorient, and particularlyZeebrugge, where it was found that more than twothirds of materials discharged 18 km away from thecoast, over seabed lying at –15 m, swiftly return (withinless than 100 days) to the coast, due to tide currents.These materials are thus involved in coastal transit pro-cesses, prior to undergoing deposition again, in thecalm waters of harbor basins. Such recycling, over astretch of coast more than 60 km long, was evidencedby means of radioactive elements (hafnium, terbium)that do not occur naturally. Carried out as they wereby specialized laboratories, some measurements requi-red dilutions to 10–14;● investigations of a general character, on the mecha-nism involved in “silt plug”/fluid mud formation inestuaries, or the effects of swell on sediment transportprocesses;
power-carrying cable probe
sled
buoy
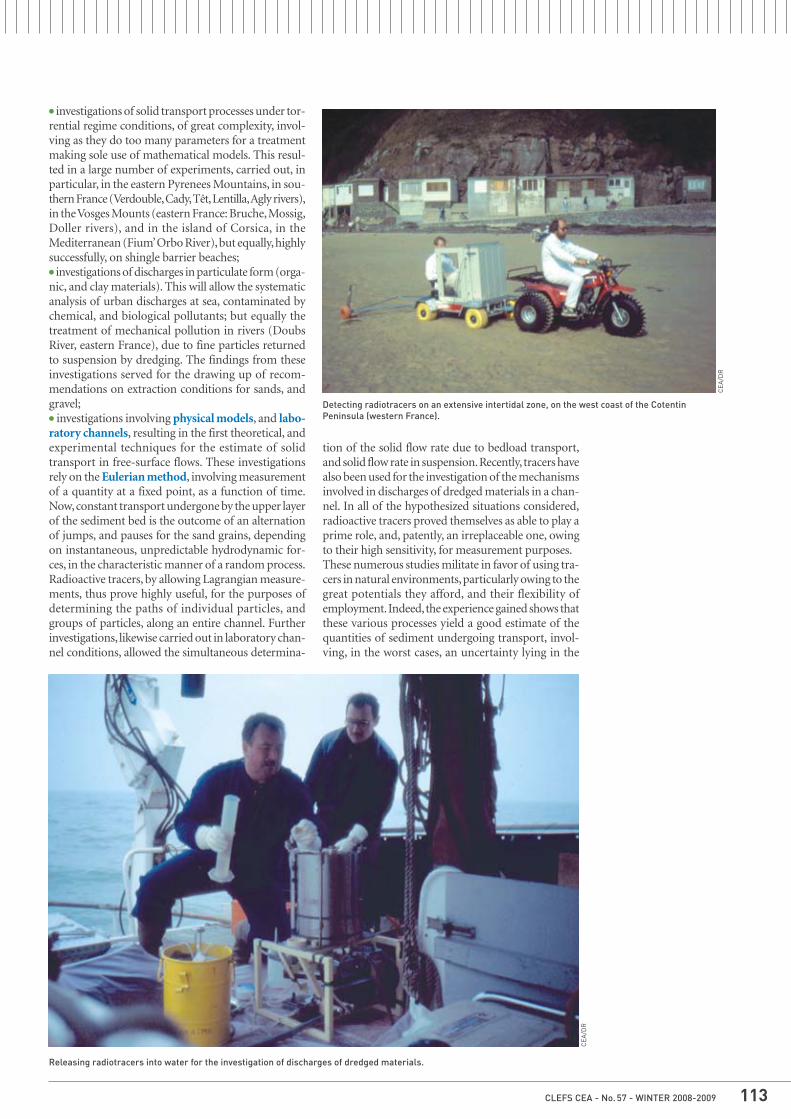
CLEFS CEA - No. 57 - WINTER 2008-2009 113
● investigations of solid transport processes under tor-rential regime conditions, of great complexity, invol-ving as they do too many parameters for a treatmentmaking sole use of mathematical models. This resul-ted in a large number of experiments, carried out, inparticular, in the eastern Pyrenees Mountains, in sou-thern France (Verdouble, Cady, Têt, Lentilla, Agly rivers),in the Vosges Mounts (eastern France: Bruche, Mossig,Doller rivers), and in the island of Corsica, in theMediterranean (Fium’ Orbo River), but equally, highlysuccessfully, on shingle barrier beaches;● investigations of discharges in particulate form (orga-nic, and clay materials). This will allow the systematicanalysis of urban discharges at sea, contaminated bychemical, and biological pollutants; but equally thetreatment of mechanical pollution in rivers (DoubsRiver, eastern France), due to fine particles returnedto suspension by dredging. The findings from theseinvestigations served for the drawing up of recom-mendations on extraction conditions for sands, andgravel;● investigations involving physical models, and labo-ratory channels, resulting in the first theoretical, andexperimental techniques for the estimate of solidtransport in free-surface flows. These investigationsrely on the Eulerian method, involving measurementof a quantity at a fixed point, as a function of time.Now, constant transport undergone by the upper layerof the sediment bed is the outcome of an alternationof jumps, and pauses for the sand grains, dependingon instantaneous, unpredictable hydrodynamic for-ces, in the characteristic manner of a random process.Radioactive tracers, by allowing Lagrangian measure-ments, thus prove highly useful, for the purposes ofdetermining the paths of individual particles, andgroups of particles, along an entire channel. Furtherinvestigations, likewise carried out in laboratory chan-nel conditions, allowed the simultaneous determina-
tion of the solid flow rate due to bedload transport,and solid flow rate in suspension. Recently, tracers havealso been used for the investigation of the mechanismsinvolved in discharges of dredged materials in a chan-nel. In all of the hypothesized situations considered,radioactive tracers proved themselves as able to play aprime role, and, patently, an irreplaceable one, owingto their high sensitivity, for measurement purposes.These numerous studies militate in favor of using tra-cers in natural environments, particularly owing to thegreat potentials they afford, and their flexibility ofemployment. Indeed, the experience gained shows thatthese various processes yield a good estimate of thequantities of sediment undergoing transport, invol-ving, in the worst cases, an uncertainty lying in the
Detecting radiotracers on an extensive intertidal zone, on the west coast of the CotentinPeninsula (western France).
CEA
/DR
CEA
/DR
Releasing radiotracers into water for the investigation of discharges of dredged materials.
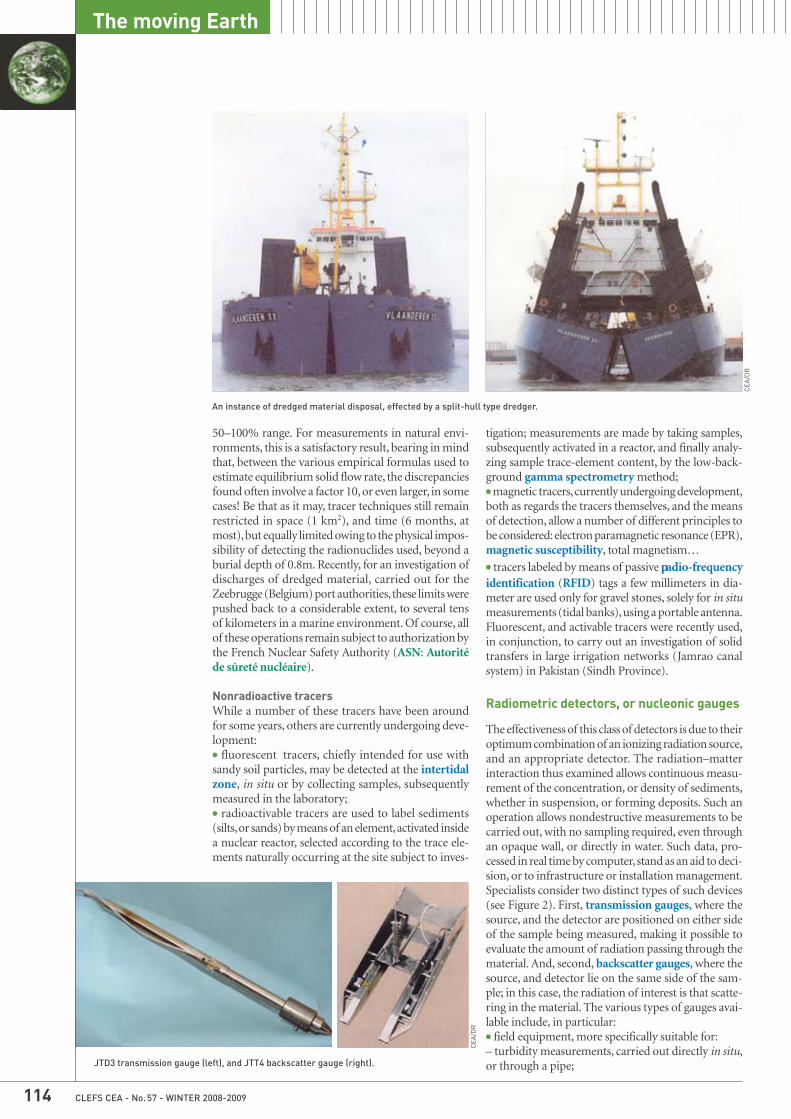
CEA
/DR
JTD3 transmission gauge (left), and JTT4 backscatter gauge (right).
CLEFS CEA - No. 57 - WINTER 2008-2009114
The moving Earth
50–100% range. For measurements in natural envi-ronments, this is a satisfactory result, bearing in mindthat, between the various empirical formulas used toestimate equilibrium solid flow rate, the discrepanciesfound often involve a factor 10, or even larger, in somecases! Be that as it may, tracer techniques still remainrestricted in space (1 km2), and time (6 months, atmost), but equally limited owing to the physical impos-sibility of detecting the radionuclides used, beyond aburial depth of 0.8m. Recently, for an investigation ofdischarges of dredged material, carried out for theZeebrugge (Belgium) port authorities, these limits werepushed back to a considerable extent, to several tensof kilometers in a marine environment. Of course, allof these operations remain subject to authorization bythe French Nuclear Safety Authority (ASN: Autoritéde sûreté nucléaire).
Nonradioactive tracersWhile a number of these tracers have been around for some years, others are currently undergoing deve-lopment:● fluorescent tracers, chiefly intended for use withsandy soil particles, may be detected at the intertidalzone, in situ or by collecting samples, subsequentlymeasured in the laboratory;● radioactivable tracers are used to label sediments(silts, or sands) by means of an element, activated insidea nuclear reactor, selected according to the trace ele-ments naturally occurring at the site subject to inves-
tigation; measurements are made by taking samples,subsequently activated in a reactor, and finally analy-zing sample trace-element content, by the low-back-ground gamma spectrometry method;● magnetic tracers, currently undergoing development,both as regards the tracers themselves, and the meansof detection, allow a number of different principles tobe considered: electron paramagnetic resonance (EPR),magnetic susceptibility, total magnetism…● tracers labeled by means of passive adio-frequencyidentification (RFID) tags a few millimeters in dia-meter are used only for gravel stones, solely for in situmeasurements (tidal banks), using a portable antenna. Fluorescent, and activable tracers were recently used,in conjunction, to carry out an investigation of solidtransfers in large irrigation networks (Jamrao canalsystem) in Pakistan (Sindh Province).
Radiometric detectors, or nucleonic gauges
The effectiveness of this class of detectors is due to theiroptimum combination of an ionizing radiation source,and an appropriate detector. The radiation–matterinteraction thus examined allows continuous measu-rement of the concentration, or density of sediments,whether in suspension, or forming deposits. Such anoperation allows nondestructive measurements to becarried out, with no sampling required, even throughan opaque wall, or directly in water. Such data, pro-cessed in real time by computer, stand as an aid to deci-sion, or to infrastructure or installation management.Specialists consider two distinct types of such devices(see Figure 2). First, transmission gauges, where thesource, and the detector are positioned on either sideof the sample being measured, making it possible toevaluate the amount of radiation passing through thematerial. And, second, backscatter gauges, where thesource, and detector lie on the same side of the sam-ple; in this case, the radiation of interest is that scatte-ring in the material. The various types of gauges avai-lable include, in particular:● field equipment, more specifically suitable for:– turbidity measurements, carried out directly in situ,or through a pipe;
An instance of dredged material disposal, effected by a split-hull type dredger.
CEA
/DR
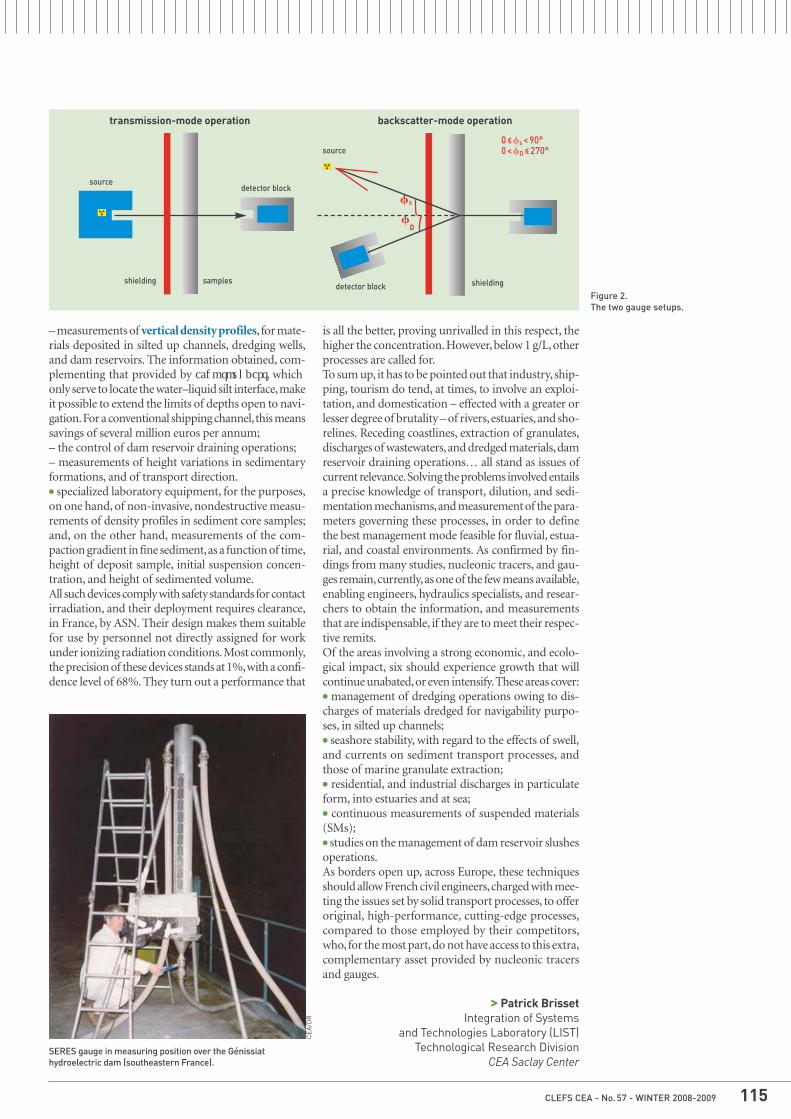
CLEFS CEA - No. 57 - WINTER 2008-2009 115
– measurements of vertical density profiles, for mate-rials deposited in silted up channels, dredging wells,and dam reservoirs. The information obtained, com-plementing that provided by , whichonly serve to locate the water–liquid silt interface, makeit possible to extend the limits of depths open to navi-gation. For a conventional shipping channel, this meanssavings of several million euros per annum;– the control of dam reservoir draining operations;– measurements of height variations in sedimentaryformations, and of transport direction.● specialized laboratory equipment, for the purposes,on one hand, of non-invasive, nondestructive measu-rements of density profiles in sediment core samples;and, on the other hand, measurements of the com-paction gradient in fine sediment, as a function of time,height of deposit sample, initial suspension concen-tration, and height of sedimented volume.All such devices comply with safety standards for contactirradiation, and their deployment requires clearance,in France, by ASN. Their design makes them suitablefor use by personnel not directly assigned for workunder ionizing radiation conditions. Most commonly,the precision of these devices stands at 1%, with a confi-dence level of 68%. They turn out a performance that
is all the better, proving unrivalled in this respect, thehigher the concentration. However, below 1 g/L, otherprocesses are called for.To sum up, it has to be pointed out that industry, ship-ping, tourism do tend, at times, to involve an exploi-tation, and domestication – effected with a greater orlesser degree of brutality – of rivers, estuaries, and sho-relines. Receding coastlines, extraction of granulates,discharges of wastewaters, and dredged materials, damreservoir draining operations… all stand as issues ofcurrent relevance. Solving the problems involved entailsa precise knowledge of transport, dilution, and sedi-mentation mechanisms, and measurement of the para-meters governing these processes, in order to definethe best management mode feasible for fluvial, estua-rial, and coastal environments. As confirmed by fin-dings from many studies, nucleonic tracers, and gau-ges remain, currently, as one of the few means available,enabling engineers, hydraulics specialists, and resear-chers to obtain the information, and measurementsthat are indispensable, if they are to meet their respec-tive remits.Of the areas involving a strong economic, and ecolo-gical impact, six should experience growth that willcontinue unabated, or even intensify. These areas cover:● management of dredging operations owing to dis-charges of materials dredged for navigability purpo-ses, in silted up channels;● seashore stability, with regard to the effects of swell,and currents on sediment transport processes, andthose of marine granulate extraction;● residential, and industrial discharges in particulateform, into estuaries and at sea;● continuous measurements of suspended materials(SMs);● studies on the management of dam reservoir slushesoperations.As borders open up, across Europe, these techniquesshould allow French civil engineers, charged with mee-ting the issues set by solid transport processes, to offeroriginal, high-performance, cutting-edge processes,compared to those employed by their competitors,who, for the most part, do not have access to this extra,complementary asset provided by nucleonic tracersand gauges.
> Patrick Brisset Integration of Systems
and Technologies Laboratory (LIST)Technological Research Division
CEA Saclay Center
Figure 2.The two gauge setups.
SERES gauge in measuring position over the Génissiathydroelectric dam (southeastern France).
CEA
/DR
source
source
detector block
detector block shieldingshielding samples
backscatter-mode operationtransmission-mode operation
0 < �s < 90°0 < �D < 270°
�s
�D
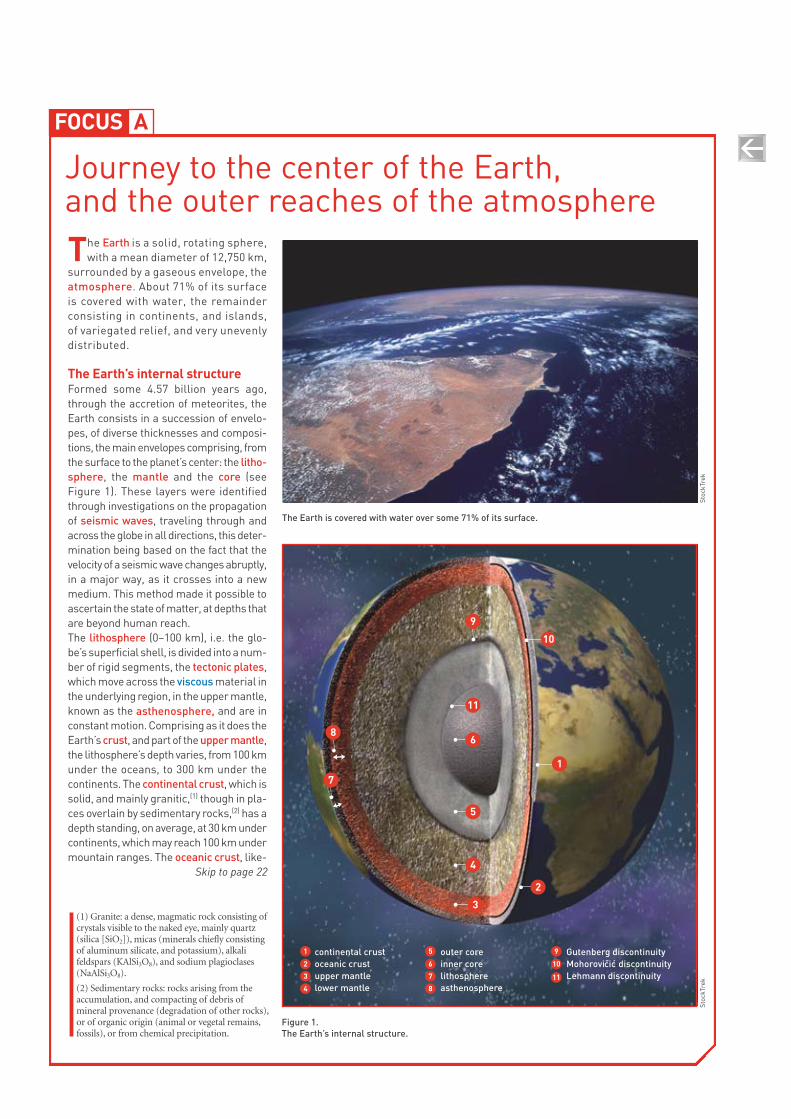
The Earth is a solid, rotating sphere,with a mean diameter of 12,750 km,
surrounded by a gaseous envelope, theatmosphere. About 71% of its surfaceis covered with water, the remainderconsisting in continents, and islands,of variegated relief, and very unevenlydistributed.
The Earth’s internal structureFormed some 4.57 billion years ago,through the accretion of meteorites, theEarth consists in a succession of envelo-pes, of diverse thicknesses and composi-tions, the main envelopes comprising, fromthe surface to the planet’s center: the litho-sphere, the mantle and the core (seeFigure 1). These layers were identifiedthrough investigations on the propagationof seismic waves, traveling through andacross the globe in all directions, this deter-mination being based on the fact that thevelocity of a seismic wave changes abruptly,in a major way, as it crosses into a newmedium. This method made it possible toascertain the state of matter, at depths thatare beyond human reach.The lithosphere (0–100 km), i.e. the glo-be’s superficial shell, is divided into a num-ber of rigid segments, the tectonic plates,which move across the viscous material inthe underlying region, in the upper mantle,known as the asthenosphere, and are inconstant motion. Comprising as it does theEarth’s crust, and part of the upper mantle,the lithosphere’s depth varies, from 100 kmunder the oceans, to 300 km under thecontinents. The continental crust, which issolid, and mainly granitic,(1) though in pla-ces overlain by sedimentary rocks,(2) has adepth standing, on average, at 30 km undercontinents, which may reach 100 km undermountain ranges. The oceanic crust, like-
Journey to the center of the Earth, and the outer reaches of the atmosphere
AFOCUS
(1) Granite: a dense, magmatic rock consisting ofcrystals visible to the naked eye, mainly quartz(silica [SiO2]), micas (minerals chiefly consistingof aluminum silicate, and potassium), alkalifeldspars (KAlSi3O8), and sodium plagioclases(NaAlSi3O8).
(2) Sedimentary rocks: rocks arising from theaccumulation, and compacting of debris ofmineral provenance (degradation of other rocks),or of organic origin (animal or vegetal remains,fossils), or from chemical precipitation.
The Earth is covered with water over some 71% of its surface.
Stoc
kTre
k
Figure 1.The Earth’s internal structure.
Stoc
kTre
k
continental crustoceanic crustupper mantlelower mantle
outer coreinner corelithosphereasthenosphere
Gutenberg discontinuityMohorovicic discontinuityLehmann discontinuity
1
10
11
1
3
4
2
5
7
8
6
9
11
10
2
3
6
5
4
7
8
9
Skip to page 22
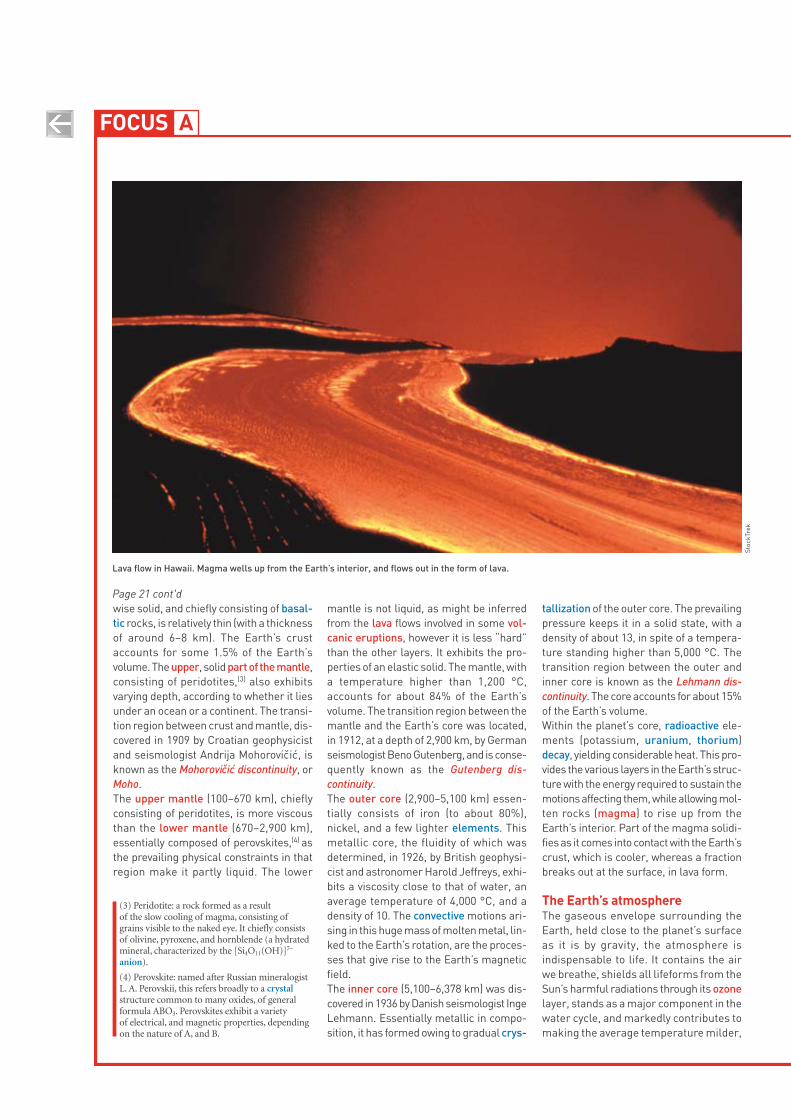
wise solid, and chiefly consisting of basal-tic rocks, is relatively thin (with a thicknessof around 6–8 km). The Earth’s crustaccounts for some 1.5% of the Earth’svolume. The upper, solid part of the mantle,consisting of peridotites,(3) also exhibitsvarying depth, according to whether it liesunder an ocean or a continent. The transi -tion region between crust and mantle, dis-covered in 1909 by Croatian geophysicistand seismologist Andrija Mohorovicic, isknown as the Mohorovicic discontinuity, orMoho.The upper mantle (100–670 km), chieflyconsisting of peridotites, is more viscousthan the lower mantle (670–2,900 km),essentially composed of perovskites,(4) asthe prevailing physical constraints in thatregion make it partly liquid. The lower
mantle is not liquid, as might be inferredfrom the lava flows involved in some vol-canic eruptions, however it is less “hard”than the other layers. It exhibits the pro-perties of an elastic solid. The mantle, witha temperature higher than 1,200 °C,accounts for about 84% of the Earth’svolume. The transition region between themantle and the Earth’s core was located,in 1912, at a depth of 2,900 km, by Germanseismologist Beno Gutenberg, and is conse-quently known as the Gutenberg dis -continuity.The outer core (2,900–5,100 km) essen-tially consists of iron (to about 80%), nickel, and a few lighter elements. Thismetallic core, the fluidity of which wasdetermined, in 1926, by British geophysi-cist and astronomer Harold Jeffreys, exhi-bits a viscosity close to that of water, anaverage temperature of 4,000 °C, and adensity of 10. The convective motions ari-sing in this huge mass of molten metal, lin-ked to the Earth’s rotation, are the proces-ses that give rise to the Earth’s magneticfield.The inner core (5,100–6,378 km) was dis-covered in 1936 by Danish seismologist IngeLehmann. Essentially metallic in compo-sition, it has formed owing to gradual crys-
tallization of the outer core. The prevailingpressure keeps it in a solid state, with adensity of about 13, in spite of a tempera-ture standing higher than 5,000 °C. Thetransition region between the outer andinner core is known as the Lehmann dis-continuity. The core accounts for about 15%of the Earth’s volume.Within the planet’s core, radioactive ele-ments (potassium, uranium, thorium)decay, yielding considerable heat. This pro-vides the various layers in the Earth’s struc-ture with the energy required to sustain themotions affecting them, while allowing mol-ten rocks (magma) to rise up from theEarth’s interior. Part of the magma solidi-fies as it comes into contact with the Earth’scrust, which is cooler, whereas a fractionbreaks out at the surface, in lava form.
The Earth’s atmosphereThe gaseous envelope surrounding theEarth, held close to the planet’s surfaceas it is by gravity, the atmosphere isindispensable to life. It contains the airwe breathe, shields all lifeforms from theSun’s harmful radiations through its ozonelayer, stands as a major component in thewater cycle, and markedly contributes tomaking the average temperature milder,
AFOCUS
(3) Peridotite: a rock formed as a result of the slow cooling of magma, consisting ofgrains visible to the naked eye. It chiefly consistsof olivine, pyroxene, and hornblende (a hydratedmineral, characterized by the [Si4O11(OH)]7–
anion).
(4) Perovskite: named after Russian mineralogistL. A. Perovskii, this refers broadly to a crystalstructure common to many oxides, of generalformula ABO3. Perovskites exhibit a variety of electrical, and magnetic properties, dependingon the nature of A, and B.
Lava flow in Hawaii. Magma wells up from the Earth’s interior, and flows out in the form of lava.
Stoc
kTre
k
Page 21 cont'd
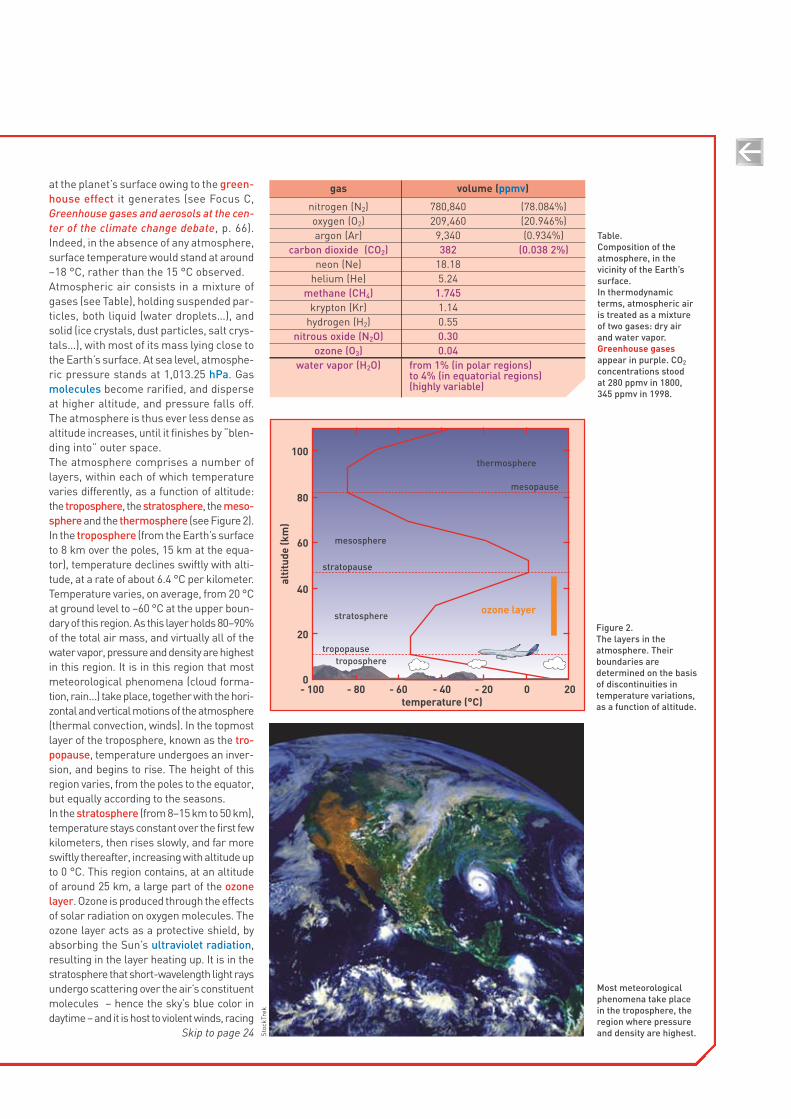
at the planet’s surface owing to the green-house effect it generates (see Focus C,Greenhouse gases and aerosols at the cen-ter of the climate change debate, p. 66).Indeed, in the absence of any atmosphere,surface temperature would stand at around–18 °C, rather than the 15 °C observed.Atmospheric air consists in a mixture ofgases (see Table), holding suspended par-ticles, both liquid (water droplets…), andsolid (ice crystals, dust particles, salt crys-tals…), with most of its mass lying close tothe Earth’s surface. At sea level, atmosphe-ric pressure stands at 1,013.25 hPa. Gasmolecules become rarified, and disperseat higher altitude, and pressure falls off.The atmosphere is thus ever less dense asaltitude increases, until it finishes by “blen-ding into” outer space.The atmosphere comprises a number oflayers, within each of which temperaturevaries differently, as a function of altitude:the troposphere, the stratosphere, the meso-sphere and the thermosphere (see Figure2).In the troposphere (from the Earth’s surfaceto 8 km over the poles, 15 km at the equa-tor), temperature declines swiftly with alti-tude, at a rate of about 6.4 °C per kilometer.Temperature varies, on average, from 20 °Cat ground level to –60 °C at the upper boun-dary of this region. As this layer holds 80–90%of the total air mass, and virtually all of thewater vapor, pressure and density are highestin this region. It is in this region that mostmeteorological phenomena (cloud forma-tion, rain…) take place, together with the hori-zontal and vertical motions of the atmosphere(thermal convection, winds). In the topmostlayer of the troposphere, known as the tro-popause, temperature undergoes an inver-sion, and begins to rise. The height of thisregion varies, from the poles to the equator,but equally according to the seasons.In the stratosphere (from 8–15 km to 50 km),temperature stays constant over the first fewkilometers, then rises slowly, and far moreswiftly thereafter, increasing with altitude upto 0 °C. This region contains, at an altitudeof around 25 km, a large part of the ozonelayer. Ozone is produced through the effectsof solar radiation on oxygen molecules. Theozone layer acts as a protective shield, byabsorbing the Sun’s ultraviolet radiation,resulting in the layer heating up. It is in thestratosphere that short-wavelength light raysundergo scattering over the air’s constituentmolecules – hence the sky’s blue color indaytime – and it is host to violent winds, racing
Skip to page 24
Figure 2.The layers in theatmosphere. Theirboundaries aredetermined on the basisof discontinuities intemperature variations,as a function of altitude.
Most meteorologicalphenomena take placein the troposphere, theregion where pressureand density are highest.St
ockT
rek
gas volume (ppmv)
nitrogen (N2) 780,840 (78.084%)oxygen (O2) 209,460 (20.946%)argon (Ar) 9,340 (0.934%)
carbon dioxide (CO2) 382 (0.038 2%)neon (Ne) 18.18
helium (He) 5.24methane (CH4) 1.745
krypton (Kr) 1.14hydrogen (H2) 0.55
nitrous oxide (N2O) 0.30ozone (O3) 0.04
water vapor (H2O) from 1% (in polar regions) to 4% (in equatorial regions)(highly variable)
Table. Composition of theatmosphere, in thevicinity of the Earth’ssurface. In thermodynamicterms, atmospheric airis treated as a mixtureof two gases: dry airand water vapor.Greenhouse gasesappear in purple. CO2
concentrations stood at 280 ppmv in 1800,345 ppmv in 1998.
0- 100 - 80 - 60 - 40
temperature (°C)
altit
ude
(km
)
- 20 0 20
20
40
60
80
100
mesosphere
mesopause
stratopause
tropopause
thermosphere
ozone layerstratosphere
troposphere
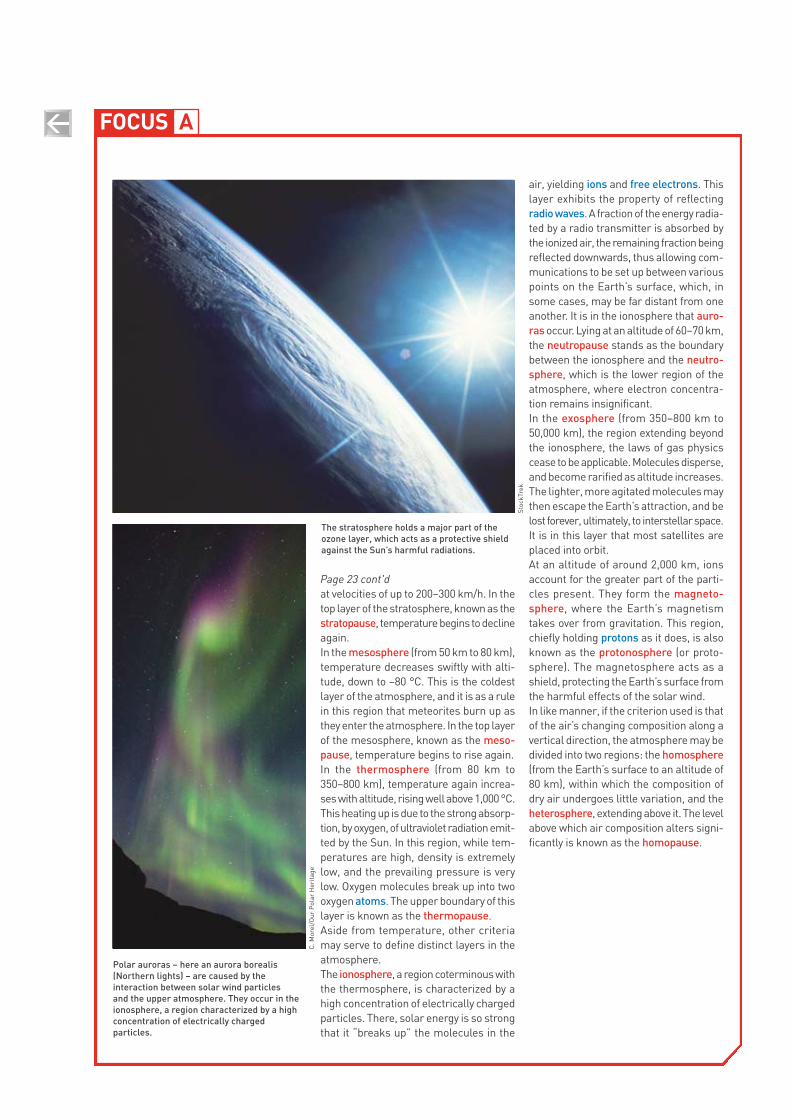
AFOCUS
Page 23 cont'd
The stratosphere holds a major part of theozone layer, which acts as a protective shieldagainst the Sun’s harmful radiations.
Stoc
kTre
k
Polar auroras – here an aurora borealis(Northern lights) – are caused by theinteraction between solar wind particles and the upper atmosphere. They occur in theionosphere, a region characterized by a highconcentration of electrically chargedparticles.
C. M
orel
/Our
Pol
ar H
erita
ge
at velocities of up to 200–300 km/h. In thetop layer of the stratosphere, known as thestratopause, temperature begins to declineagain.In the mesosphere (from 50 km to 80 km),temperature decreases swiftly with alti-tude, down to –80 °C. This is the coldestlayer of the atmosphere, and it is as a rulein this region that meteorites burn up asthey enter the atmosphere. In the top layerof the mesosphere, known as the meso-pause, temperature begins to rise again.In the thermosphere (from 80 km to350–800 km), temperature again increa-ses with altitude, rising well above 1,000°C.This heating up is due to the strong absorp-tion, by oxygen, of ultraviolet radiation emit-ted by the Sun. In this region, while tem-peratures are high, density is extremelylow, and the prevailing pressure is verylow. Oxygen molecules break up into twooxygen atoms. The upper boundary of thislayer is known as the thermopause.Aside from temperature, other criteriamay serve to define distinct layers in theatmosphere.The ionosphere, a region coterminous withthe thermosphere, is characterized by ahigh concentration of electrically chargedparticles. There, solar energy is so strongthat it “breaks up” the molecules in the
air, yielding ions and free electrons. Thislayer exhibits the property of reflectingradio waves. A fraction of the energy radia-ted by a radio transmitter is absorbed bythe ionized air, the remaining fraction beingreflected downwards, thus allowing com-munications to be set up between variouspoints on the Earth’s surface, which, insome cases, may be far distant from oneanother. It is in the ionosphere that auro-ras occur. Lying at an altitude of 60–70 km,the neutropause stands as the boundarybetween the ionosphere and the neutro-sphere, which is the lower region of theatmosphere, where electron concentra-tion remains insignificant.In the exosphere (from 350–800 km to50,000 km), the region extending beyondthe ionosphere, the laws of gas physicscease to be applicable. Molecules disperse,and become rarified as altitude increases.The lighter, more agitated molecules maythen escape the Earth’s attraction, and belost forever, ultimately, to interstellar space.It is in this layer that most satellites areplaced into orbit.At an altitude of around 2,000 km, ionsaccount for the greater part of the parti-cles present. They form the magneto-sphere, where the Earth’s magnetismtakes over from gravitation. This region,chiefly holding protons as it does, is alsoknown as the protonosphere (or proto-sphere). The magnetosphere acts as ashield, protecting the Earth’s surface fromthe harmful effects of the solar wind.In like manner, if the criterion used is thatof the air’s changing composition along avertical direction, the atmosphere may bedivided into two regions: the homosphere(from the Earth’s surface to an altitude of80 km), within which the composition ofdry air undergoes little variation, and theheterosphere, extending above it. The levelabove which air composition alters signi-ficantly is known as the homopause.
Whether of natural or anthropic pro-venance, substances found in the
environment call for the use of analyti-cal methods that are flexible – the aimbeing both to detect, and identify extre-mely diverse compounds – and highlysensitive. They further entail the imple-mentation of rigorous procedures, ope-rating step by step.
Rigorous preparation of samples Standing as a fundamental step in theanalytical process, the pretreatment ofsamples involves either preconcentra-ting substances occurring with too lowa content to allow direct detection, orseparating them from an overly complexmatrix. If research workers spend nearly60% of the time required, for an overallanalysis, on this preliminary step, it isbecause, according to a number of stu-dies, it accounts for nearly 30% of errorsin findings. Presently, these sameresearch workers have developed agamut of fast, economical, automated,reliable techniques, for the purposes oftreating samples, depending on theirnature, or the concentration being considered:• Solid-phase extraction (SPE) allowsthe isolation of chemicals present in aliquid (e.g. water), through use of anabsorbent polymer, conditioned as a rulein filtration cartridge form. This proveshighly effective for the purposes of pre-concentrating traces, in highly dilutemedia, or purifying samples.• Fiber-supported solid-phase micro-extraction (SPME) is used to extract che-micals present in a gas, or a liquid (e.g.air, or water), this being effected bymeans of an absorbent polymer, coatinga glass fiber a few millimeters long, pla-ced in contact with the sample. As SPMErequires neither solvents, nor any spe-cific equipment, it thus proves simple todeploy. This is an innovative technique,seeing increasing use for the purposesof air quality monitoring, or the analysisof organic micropollutants in water.• Stir-bar sorptive extraction (SBSE) seesbroader employment, for the purposesof extracting chemicals present in a liquid(water). Such extraction is effected by
means of an absorbent polymer, coatinga (magnetic) stir bar, impelled inside thesample. Based as it is on the same prin-ciple as SPME, this technique allows theextraction of greater quantities of ana-lytes, and thus makes for increased sen-sitivity.• Solvent extraction – this as a rule invol-ving a volatile solvent, sparingly solublein water (a light alkane, ethyl acetate…)– allows the extraction of molecules fromaqueous media. Solvent–water separa-tion is effected simply, through settling.• Preparative ion chromatography, whichrelies on the interaction, in an aqueousmedium, of ion species with ion-exchange resins, allows the extractionof inorganic substances (ions) occurringin trace form, from a complex environ-mental matrix.
Separation for selection purposesUsed nowadays for the purposes of iden-tifying, or titrating, the chemical com-pounds in a mixture, chromatographywas invented, in 1906, by Russian bota-nist Mikhail Tsvet (1872–1919), who wasseeking to separate out various plant pig-ments. Nowadays, the technique invol-
ves allowing a solution of the substancebeing investigated to percolate througha column, packed with adsorbent mate-rials: the constituents, each traveling atdifferent rates, become partitioned intodistinct regions, or bands, which can sim-ply be considered separately, for analy-tical purposes.• Liquid chromatography (LC), or high-performance liquid chromatography(HPLC) relies on the separation of thesubstances present in a mixture throughtheir introduction into, and subsequentdifferential migration along, a separa-tion column (chromatographic column)through which an eluting liquid (e.g. amixture of water and methanol) advan-ces. Thereafter, a sequence of physico-chemical interactions between the substances subject to analysis, and thetwo separation phases (the stationaryphase, and the mobile, eluent phase)allows the constituents to be separatedout. Coupling the chromatographic sepa-ration module with specific detectors(mass spectrometer, UV–visible absorp-tion spectrometer…) results in a varietyof analytical instrumental setups(HPLC–MS, HPLC–UV…).
BFOCUS
The main extraction, separation, and analysis techniques
Figure 1.Examples of pretreatment techniques for environmental samples
solvent extractionion exchangerscoprecipitationelectrodepositionmembrane technologies
extraction– liquid–liquid extraction– solvent extraction– solid-phase extractionsolid-phase microextractionsorption…
solid-phase sorptionmicroextractioncondensation
solid-phase sorption
extraction– solvent extraction– supercritical fluid extraction– HP, HT extraction– matrix solid-phase dispersion (MSPD)…
acid leachingcalcinationalkaline melting
extractionvolatilization
inorganicanalysis
organicanalysissolid
solid
liquid
liquid gas
gas
sample collection
• Capillary electrophoresis (CE), as indeedall electrophoretic separation methods,is used to separate electrically chargedparticles (ions), through their differentialmigration under the influence of an electric field. Each species migrates at aspecific rate, which is a function of itscharge-to-size ratio. As regards, morespecifically, capillary electrophoresis, asits name implies, the separation supportmedium is a capillary, filled with a speci-fic liquid medium (the electrolyte),and immersed at either end in electrolytereservoirs, connected by way of a high-voltage generator. The sample isinserted into the electrolyte flow, and thesample’s constituent species migrate at their respective specific rates, thesebeing dependent, as a whole, both onthe distance between the injection,and detection points, and migration time.• Gas chromatography (GC) allows theseparation of volatile, or semivolatile sub-stances from a complex mixture. Thisrelies on the introduction of the mixture,by vaporization, into a separation column(chromatographic column), and subse-quent differential migration (elution) of
the substances, due to entrainment by acarrier gas (e.g. helium). Chromatographiccolumns, nowadays, chiefly involvecapillary tubes, 30–100 m long, internallycoated with an appropriate polymer, withregard to the substances subjected to ana-lysis. A detection system, located at thecolumn outlet, measures the signals emit-ted by the various constituents, allowingtheir identification, and quantification (e.g.GC–MS).• Ion chromatography (IC) relies on theapplication of the various liquid chroma-tography methods to the analysis of orga-nic, or inorganic ions (whether anions, orcations).
Analysis to gain knowledgeTo determine a sample’s composition,researchers can draw on the full range,and variety of spectrometric methods, i.e.methods of spectral analysis allowing thematerial’s composition, and structure tobe ascertained. Such methods may begrouped into two categories: radiationspectrometry, and mass spectrometry, thisin turn being subdivided, as a rule, intoatomic spectrometry, and molecular spec-trometry.
Radiation spectrometryRadiation spectrometry relies on the inter-action of electromagnetic radiation withmatter. It makes use of processes asdiverse as emission, absorption, fluores-cence, and diffusion, whether involvingvisible, or nonvisible radiation. Whetherin the atomic, or molecular state, everysubstance exhibits a characteristic spec-trum, whether the spectrum consideredbe an emission, or an absorption spec-trum (or indeed a diffusion, or fluores-cence spectrum); it is thus sufficient torecognize the occurrence of that spec-trum, to have evidence of the presence ofthe corresponding substance.• Atomic absorption spectrometry relieson the principle whereby atoms mayabsorb photons of a certain wavelength(characteristic of the element subject toanalysis). The number of photons absor-bed being related to the number of atomsabsorbing them, the element’s concen-tration may thus be derived from such ameasurement.• Emission spectrometry is based on thecharacteristic photon emission yielded byatoms excited by an energy input. Such
Continued p. 54
In the analytical chemistry laboratory. Separation, and purification of actinide traces in environmental samples, as preliminary steps for massspectrometry measurements.
C.D
upon
t/C
EA
energy may be provided by means e.g. ofan inductively coupled argon plasmasource; this allows the measurement ofelemental content (copper, lead, tin,arsenic, nickel…), however without yiel-ding any information as to the chemicalform in which these elements occur inthe sample.• Glow-discharge spectrometry (GD-OES) involves the process of cathodicsputtering of the sample undergoing ana-lysis, this being positioned in a sourceoperating on the cathode-ray tube prin-ciple. The elements sputtered into theglow discharge lamp are then identifiedfrom their light emission spectra. Theglow-discharge source may also be com-bined with a mass spectrometer.• Laser-induced breakdown spectros-copy (LIBS) is an optical emission spec-troscopy technique, making use of theinteraction of a pulsed laser beam witha material, resulting in the latter’s vapo-rization, in plasma form. The ejected exci-ted atoms, and ions, as they relax, emita UV, and visible spectrum made of lines,the wavelengths of which allow the iden-tification, and quantification of the ele-ments present in the sample.• X-ray fluorescence spectrometryinvolves bombarding the material with
BFOCUS
X-radiation, the material then reemittingenergy, in the form, in particular, ofsecondary X-rays; analysis of the spec-trum allows the sample’s elemental com-position to be derived, in both qualitativeand quantitative terms.• UV–visible absorption spectrometryrelies on the absorption of light by mat-ter. This technique chiefly allows the mea-surement of chemical species concen-trations in aqueous solutions, or solutionsof other types.• Infrared (IR) spectrometry allows, byway of the molecular absorption of IRradiation, the determination of the che-mical bonds making up a molecule,and thus makes it possible to build upstructural hypotheses. Since IR spectracan prove highly complex, they may thusbe seen as a veritable molecular ID docu-ment.• Time-resolved laser-induced fluores-cence (TRLIF) is an ultrasensitive analy-tical technique, used for the determina-tion of certain actinides, and lanthanides,which are fluorescent in solution. Its prin-ciple relies on excitation, carried out bymeans of a pulsed laser, and subsequenttime resolution of the fluorescence signal(by setting a measurement time gate, ata few microseconds’ delay after the laser
pulse), allowing the elimination of unwan-ted, short-lived fluorescence signals.Current developments involving this tech-nique concern speciation (i.e. the deter-mination of chemical species), andremote measurement via optical fiber inthe nuclear industry, and for environ-mental analysis.• Raman scattering spectrometry isemployed to ascertain a sample’s che-mical structure, and molecular compo-sition, by placing it under laser radiation,and analyzing the scattered light emis-sion. This is a nondestructive method,complementing infrared spectroscopy.Raman spectroscopy is a local measu-rement technique: by focusing the laserbeam onto a small region in the medium,that medium’s properties may be pro-bed, over a volume of a few cubic microns.This is known as micro-Raman spec-troscopy.• Nuclear magnetic resonance (NMR)spectrometry involves a principle relyingon the spin alignment that occurs in cer-tain atomic nuclei, under the influenceof an intense magnetic field. These nucleimay then interact with radio waves, emit-ting signals that allow the molecularstructure of the compounds present tobe identified.
Preparing samples, for the purposes of radiological analysis. Environmental samples undergoing treatment: chromatography, for the purposes ofextracting radionuclides.
C.D
upon
t/C
EA
Continued from p. 53
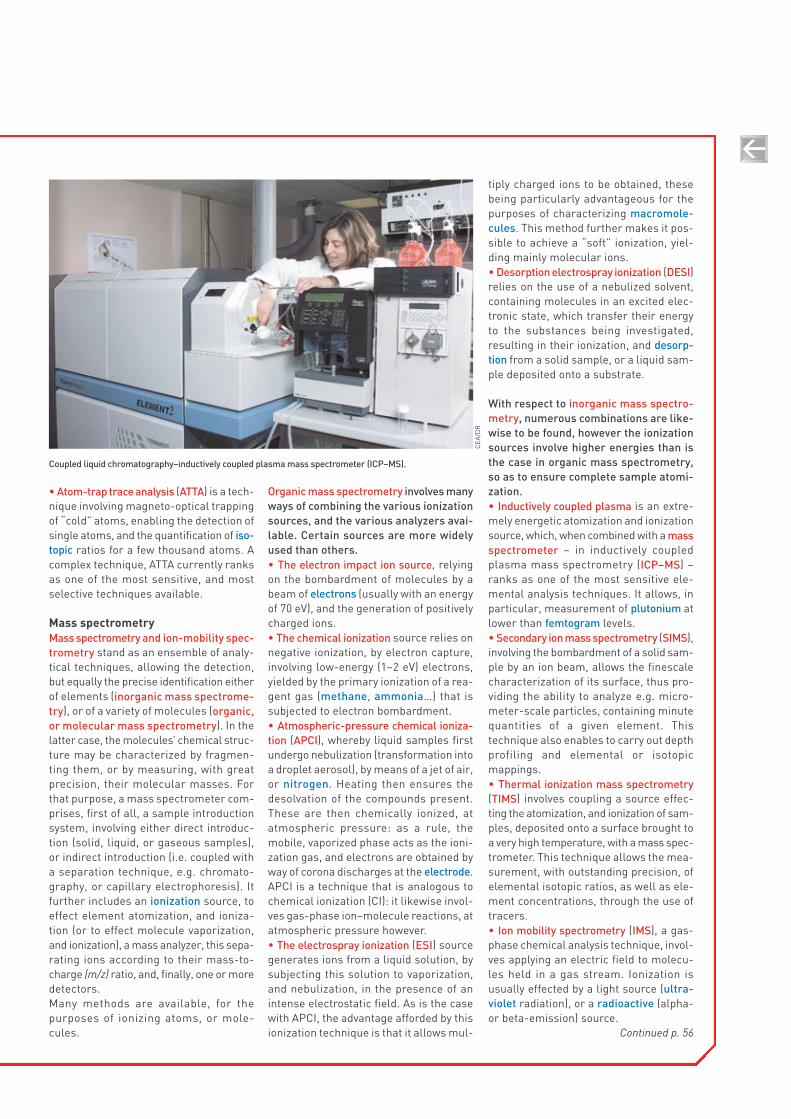
• Atom-trap trace analysis (ATTA) is a tech-nique involving magneto-optical trappingof “cold” atoms, enabling the detection ofsingle atoms, and the quantification of iso-topic ratios for a few thousand atoms. Acomplex technique, ATTA currently ranksas one of the most sensitive, and mostselective techniques available.
Mass spectrometryMass spectrometry and ion-mobility spec-trometry stand as an ensemble of analy-tical techniques, allowing the detection,but equally the precise identification eitherof elements (inorganic mass spectrome-try), or of a variety of molecules (organic,or molecular mass spectrometry). In thelatter case, the molecules’ chemical struc-ture may be characterized by fragmen-ting them, or by measuring, with greatprecision, their molecular masses. Forthat purpose, a mass spectrometer com-prises, first of all, a sample introductionsystem, involving either direct introduc-tion (solid, liquid, or gaseous samples),or indirect introduction (i.e. coupled witha separation technique, e.g. chromato-graphy, or capillary electrophoresis). Itfurther includes an ionization source, toeffect element atomization, and ioniza-tion (or to effect molecule vaporization,and ionization), a mass analyzer, this sepa-rating ions according to their mass-to-charge (m/z) ratio, and, finally, one or moredetectors.Many methods are available, for the purposes of ionizing atoms, or mole -cules.
Organic mass spectrometry involves manyways of combining the various ionizationsources, and the various analyzers avai-lable. Certain sources are more widelyused than others.• The electron impact ion source, relyingon the bombardment of molecules by abeam of electrons (usually with an energyof 70 eV), and the generation of positivelycharged ions.• The chemical ionization source relies onnegative ionization, by electron capture,involving low-energy (1–2 eV) electrons,yielded by the primary ionization of a rea-gent gas (methane, ammonia…) that issubjected to electron bombardment.• Atmospheric-pressure chemical ioniza-tion (APCI), whereby liquid samples firstundergo nebulization (transformation intoa droplet aerosol), by means of a jet of air,or nitrogen. Heating then ensures thedesolvation of the compounds present.These are then chemically ionized, atatmospheric pressure: as a rule, themobile, vaporized phase acts as the ioni-zation gas, and electrons are obtained byway of corona discharges at the electrode.APCI is a technique that is analogous tochemical ionization (CI): it likewise invol-ves gas-phase ion–molecule reactions, atatmospheric pressure however.• The electrospray ionization (ESI) sourcegenerates ions from a liquid solution, bysubjecting this solution to vaporization,and nebulization, in the presence of anintense electrostatic field. As is the casewith APCI, the advantage afforded by thisionization technique is that it allows mul-
tiply charged ions to be obtained, thesebeing particularly advantageous for thepurposes of characterizing macromole-cules. This method further makes it pos-sible to achieve a “soft” ionization, yiel-ding mainly molecular ions.• Desorption electrospray ionization (DESI)relies on the use of a nebulized solvent,containing molecules in an excited elec-tronic state, which transfer their energyto the substances being investigated,resulting in their ionization, and desorp-tion from a solid sample, or a liquid sam-ple deposited onto a substrate.
With respect to inorganic mass spectro-metry, numerous combinations are like-wise to be found, however the ionizationsources involve higher energies than isthe case in organic mass spectrometry,so as to ensure complete sample atomi-zation.• Inductively coupled plasma is an extre-mely energetic atomization and ionizationsource, which, when combined with a massspectrometer – in inductively coupledplasma mass spectrometry (ICP–MS) –ranks as one of the most sensitive ele-mental analysis techniques. It allows, inparticular, measurement of plutonium atlower than femtogram levels.• Secondary ion mass spectrometry (SIMS),involving the bombardment of a solid sam-ple by an ion beam, allows the finescalecharacterization of its surface, thus pro-viding the ability to analyze e.g. micro-meter-scale particles, containing minutequantities of a given element. This technique also enables to carry out depthprofiling and elemental or isotopic mappings.• Thermal ionization mass spectrometry(TIMS) involves coupling a source effec-ting the atomization, and ionization of sam-ples, deposited onto a surface brought toa very high temperature, with a mass spec-trometer. This technique allows the mea-surement, with outstanding precision, ofelemental isotopic ratios, as well as ele-ment concentrations, through the use oftracers.• Ion mobility spectrometry (IMS), a gas-phase chemical analysis technique, invol-ves applying an electric field to molecu-les held in a gas stream. Ionization isusually effected by a light source (ultra-violet radiation), or a radioactive (alpha-or beta-emission) source.
Coupled liquid chromatography–inductively coupled plasma mass spectrometer (ICP–MS).C
EA/D
R
Continued p. 56
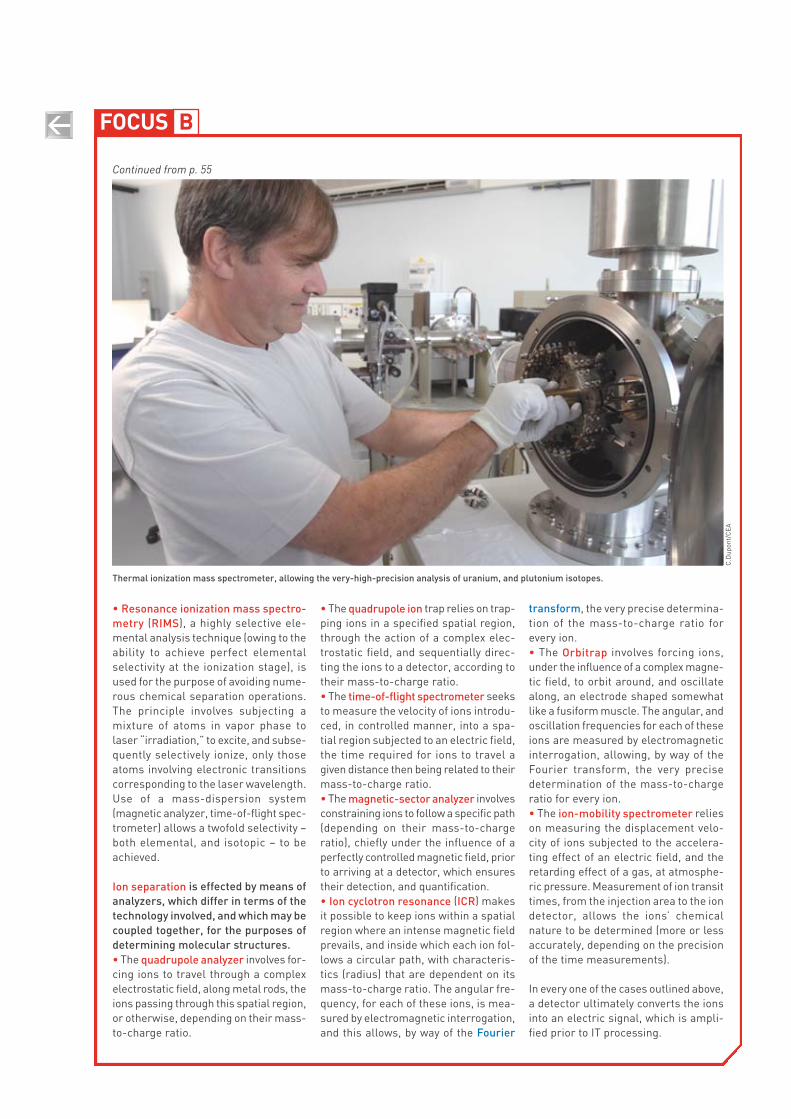
BFOCUS
Continued from p. 55
• The quadrupole ion trap relies on trap-ping ions in a specified spatial region,through the action of a complex elec-trostatic field, and sequentially direc-ting the ions to a detector, according totheir mass-to-charge ratio.• The time-of-flight spectrometer seeksto measure the velocity of ions introdu-ced, in controlled manner, into a spa-tial region subjected to an electric field,the time required for ions to travel agiven distance then being related to theirmass-to-charge ratio.• The magnetic-sector analyzer involvesconstraining ions to follow a specific path(depending on their mass-to-chargeratio), chiefly under the influence of aperfectly controlled magnetic field, priorto arriving at a detector, which ensurestheir detection, and quantification.• Ion cyclotron resonance (ICR) makesit possible to keep ions within a spatialregion where an intense magnetic fieldprevails, and inside which each ion fol-lows a circular path, with characteris-tics (radius) that are dependent on itsmass-to-charge ratio. The angular fre-quency, for each of these ions, is mea-sured by electromagnetic interrogation,and this allows, by way of the Fourier
transform, the very precise determina-tion of the mass-to-charge ratio for every ion.• The Orbitrap involves forcing ions,under the influence of a complex magne-tic field, to orbit around, and oscillatealong, an electrode shaped somewhatlike a fusiform muscle. The angular, andoscillation frequencies for each of theseions are measured by electromagneticinterrogation, allowing, by way of theFourier transform, the very precisedetermination of the mass-to-chargeratio for every ion.• The ion-mobility spectrometer relieson measuring the displacement velo-city of ions subjected to the accelera-ting effect of an electric field, and theretarding effect of a gas, at atmosphe-ric pressure. Measurement of ion transittimes, from the injection area to the iondetector, allows the ions’ chemicalnature to be determined (more or lessaccurately, depending on the precisionof the time measurements).
In every one of the cases outlined above,a detector ultimately converts the ionsinto an electric signal, which is ampli-fied prior to IT processing.
C.D
upon
t/C
EA
Thermal ionization mass spectrometer, allowing the very-high-precision analysis of uranium, and plutonium isotopes.
• Resonance ionization mass spectro-metry (RIMS), a highly selective ele-mental analysis technique (owing to theability to achieve perfect elementalselectivity at the ionization stage), isused for the purpose of avoiding nume-rous chemical separation operations.The principle involves subjecting a mixture of atoms in vapor phase to laser “irradiation,” to excite, and subse -quently selectively ionize, only thoseatoms involving electronic transitionscorresponding to the laser wavelength.Use of a mass-dispersion system(magnetic analyzer, time-of-flight spec-trometer) allows a twofold selectivity –both elemental, and isotopic – to beachieved.
Ion separation is effected by means ofanalyzers, which differ in terms of thetechnology involved, and which may becoupled together, for the purposes ofdetermining molecular structures.• The quadrupole analyzer involves for-cing ions to travel through a complexelectrostatic field, along metal rods, theions passing through this spatial region,or otherwise, depending on their mass-to-charge ratio.
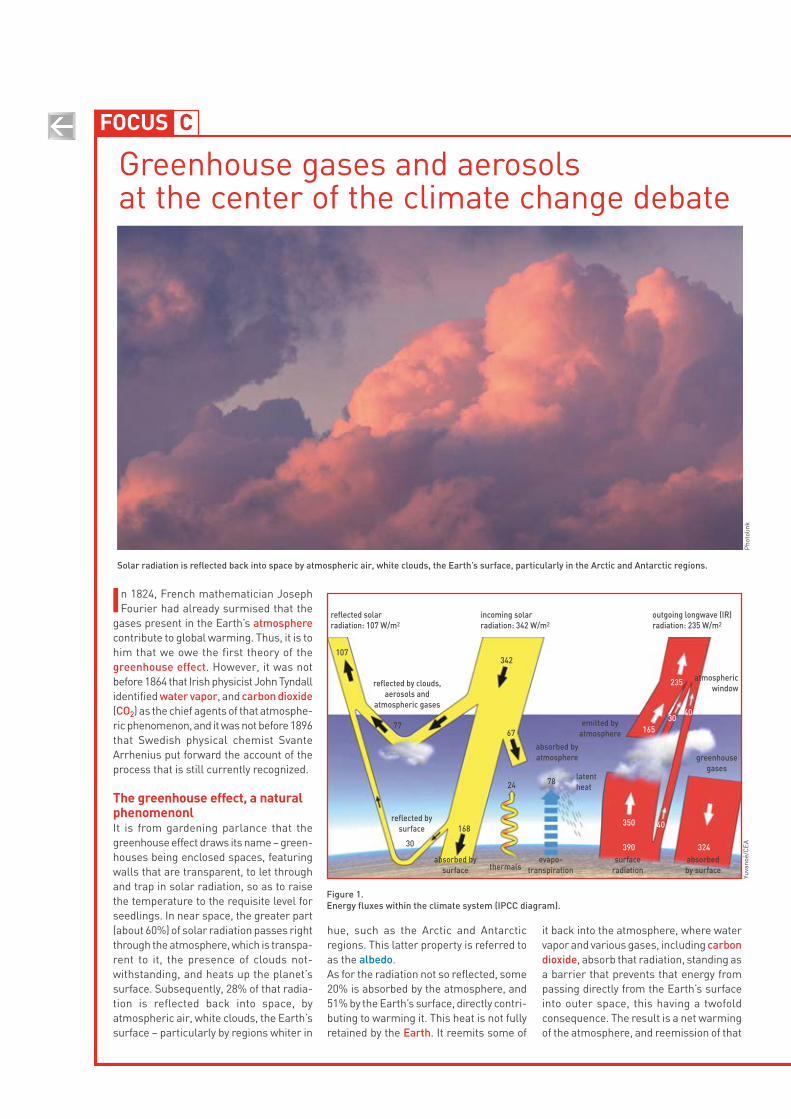
In 1824, French mathematician JosephFourier had already surmised that the
gases present in the Earth’s atmospherecontribute to global warming. Thus, it is tohim that we owe the first theory of thegreenhouse effect. However, it was notbefore 1864 that Irish physicist John Tyndallidentified water vapor, and carbon dioxide(CO2) as the chief agents of that atmosphe-ric phenomenon, and it was not before 1896that Swedish physical chemist SvanteArrhenius put forward the account of theprocess that is still currently recognized.
The greenhouse effect, a naturalphenomenonlIt is from gardening parlance that thegreenhouse effect draws its name – green-houses being enclosed spaces, featuringwalls that are transparent, to let throughand trap in solar radiation, so as to raisethe temperature to the requisite level forseedlings. In near space, the greater part(about 60%) of solar radiation passes rightthrough the atmosphere, which is transpa-rent to it, the presence of clouds not-withstanding, and heats up the planet’ssurface. Subsequently, 28% of that radia-tion is reflected back into space, byatmospheric air, white clouds, the Earth’ssurface – particularly by regions whiter in
hue, such as the Arctic and Antarcticregions. This latter property is referred toas the albedo.As for the radiation not so reflected, some20% is absorbed by the atmosphere, and51% by the Earth’s surface, directly contri-buting to warming it. This heat is not fullyretained by the Earth. It reemits some of
it back into the atmosphere, where watervapor and various gases, including carbondioxide, absorb that radiation, standing asa barrier that prevents that energy frompassing directly from the Earth’s surfaceinto outer space, this having a twofoldconsequence. The result is a net warmingof the atmosphere, and reemission of that
CFOCUS
Greenhouse gases and aerosols at the center of the climate change debate
Figure 1.Energy fluxes within the climate system (IPCC diagram).
Solar radiation is reflected back into space by atmospheric air, white clouds, the Earth’s surface, particularly in the Arctic and Antarctic regions.
Pho
tolin
kYu
vano
é/C
EA
reflected solar radiation: 107 W/m2
reflected by clouds,aerosols and
atmospheric gases
atmosphericwindow
greenhousegases
absorbed by surface
absorbed bysurface
absorbed byatmosphere
emitted byatmosphere
reflected bysurface
latentheat
surfaceradiation
evapo -transpirationthermals
incoming solar radiation: 342 W/m2
outgoing longwave (IR)radiation: 235 W/m2
107
7767
168
30
24 78
350
390 324
40
4030
165
235
342
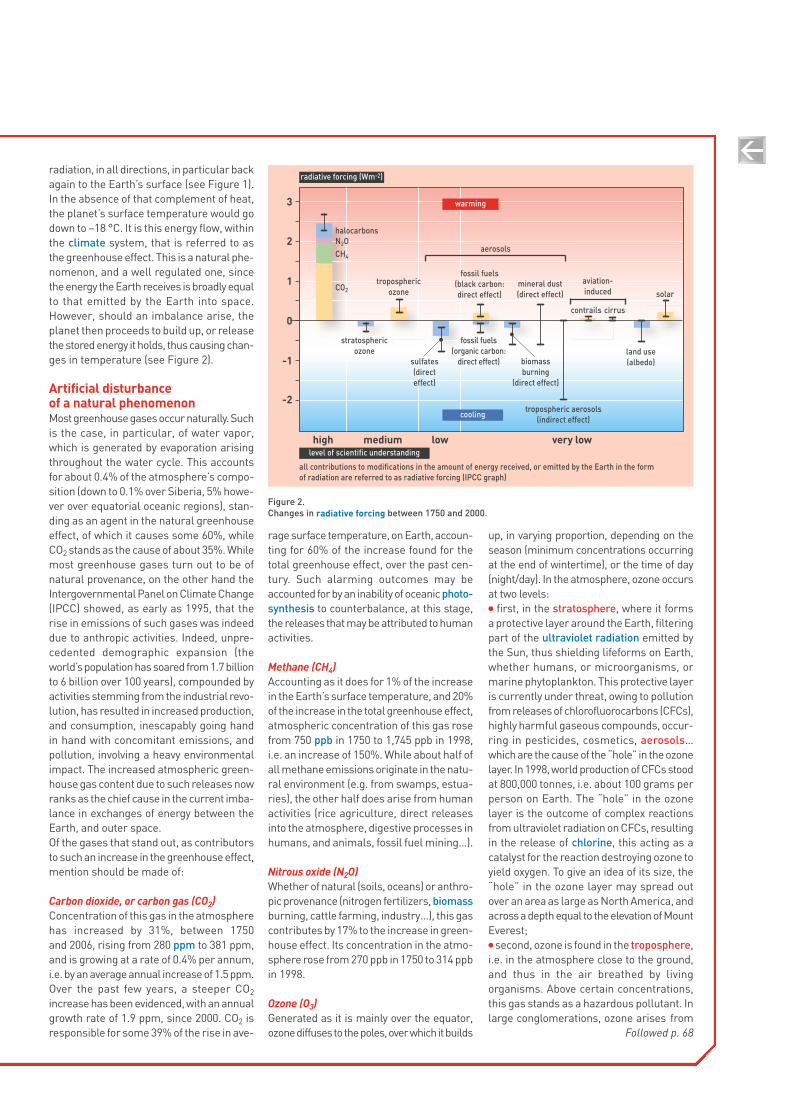
radiation, in all directions, in particular backagain to the Earth’s surface (see Figure 1).In the absence of that complement of heat,the planet’s surface temperature would godown to –18 °C. It is this energy flow, withinthe climate system, that is referred to asthe greenhouse effect. This is a natural phe-nomenon, and a well regulated one, sincethe energy the Earth receives is broadly equalto that emitted by the Earth into space.However, should an imbalance arise, theplanet then proceeds to build up, or releasethe stored energy it holds, thus causing chan-ges in temperature (see Figure 2).
Artificial disturbance of a natural phenomenonMost greenhouse gases occur naturally. Suchis the case, in particular, of water vapor,which is generated by evaporation arisingthroughout the water cycle. This accountsfor about 0.4% of the atmosphere’s compo-sition (down to 0.1% over Siberia, 5% howe-ver over equatorial oceanic regions), stan-ding as an agent in the natural greenhouseeffect, of which it causes some 60%, whileCO2 stands as the cause of about 35%. Whilemost greenhouse gases turn out to be ofnatural provenance, on the other hand theIntergovernmental Panel on Climate Change(IPCC) showed, as early as 1995, that therise in emissions of such gases was indeeddue to anthropic activities. Indeed, unpre-ce dented demographic expansion (the world’s population has soared from 1.7 billionto 6 billion over 100 years), compounded byactivities stemming from the industrial revo-lution, has resulted in increased production,and consumption, inescapably going handin hand with concomitant emissions, andpollution, involving a heavy environmentalimpact. The increased atmospheric green-house gas content due to such releases nowranks as the chief cause in the current imba-lance in exchanges of energy between theEarth, and outer space.Of the gases that stand out, as contributorsto such an increase in the greenhouse effect,mention should be made of:
Carbon dioxide, or carbon gas (CO2)Concentration of this gas in the atmospherehas increased by 31%, between 1750and 2006, rising from 280 ppm to 381 ppm,and is growing at a rate of 0.4% per annum,i.e. by an average annual increase of 1.5 ppm.Over the past few years, a steeper CO2
increase has been evidenced, with an annualgrowth rate of 1.9 ppm, since 2000. CO2 isresponsible for some 39% of the rise in ave-
rage surface temperature, on Earth, accoun-ting for 60% of the increase found for thetotal greenhouse effect, over the past cen-tury. Such alarming outcomes may beaccounted for by an inability of oceanic photo-synthesis to counterbalance, at this stage,the releases that may be attributed to humanactivities.
Methane (CH4)Accounting as it does for 1% of the increasein the Earth’s surface temperature, and 20%of the increase in the total greenhouse effect,atmospheric concentration of this gas rosefrom 750 ppb in 1750 to 1,745 ppb in 1998,i.e. an increase of 150%. While about half ofall methane emissions originate in the natu-ral environment (e.g. from swamps, estua-ries), the other half does arise from humanactivities (rice agriculture, direct releasesinto the atmosphere, digestive processes inhumans, and animals, fossil fuel mining…).
Nitrous oxide (N2O)Whether of natural (soils, oceans) or anthro-pic provenance (nitrogen fertilizers, biomassburning, cattle farming, industry…), this gascontributes by 17% to the increase in green-house effect. Its concentration in the atmo-sphere rose from 270 ppb in 1750 to 314 ppbin 1998.
Ozone (O3)Generated as it is mainly over the equator,ozone diffuses to the poles, over which it builds
up, in varying proportion, depending on theseason (minimum concentrations occurringat the end of wintertime), or the time of day(night/day). In the atmosphere, ozone occursat two levels:● first, in the stratosphere, where it formsa protective layer around the Earth, filteringpart of the ultraviolet radiation emitted bythe Sun, thus shielding lifeforms on Earth,whether humans, or microorganisms, ormarine phytoplankton. This protective layeris currently under threat, owing to pollutionfrom releases of chlorofluorocarbons (CFCs),highly harmful gaseous compounds, occur-ring in pesticides, cosmetics, aerosols…which are the cause of the “hole” in the ozonelayer. In 1998, world production of CFCs stoodat 800,000 tonnes, i.e. about 100 grams perperson on Earth. The “hole” in the ozonelayer is the outcome of complex reactionsfrom ultraviolet radiation on CFCs, resultingin the release of chlorine, this acting as acatalyst for the reaction destroying ozone toyield oxygen. To give an idea of its size, the“hole” in the ozone layer may spread outover an area as large as North America, andacross a depth equal to the elevation of MountEverest;● second, ozone is found in the troposphere,i.e. in the atmosphere close to the ground,and thus in the air breathed by living organisms. Above certain concentrations,this gas stands as a hazardous pollutant. Inlarge conglomerations, ozone arises from
Followed p. 68
Figure 2.Changes in radiative forcing between 1750 and 2000.
-2
high medium
radiative forcing (Wm-2)
warming
cooling
level of scientific understandinglow very low
0
1
2
3
-1
all contributions to modifications in the amount of energy received, or emitted by the Earth in the form of radiation are referred to as radiative forcing (IPCC graph)
tropospheric aerosols(indirect effect)
aerosols
stratosphericozone
troposphericozoneCO2
N2Ohalocarbons
CH4
fossil fuels(organic carbon:
direct effect)
fossil fuels(black carbon:direct effect)
mineral dust(direct effect)
aviation-induced
sulfates(directeffect)
biomassburning
(direct effect)
land use(albedo)
cirrus
solar
contrails
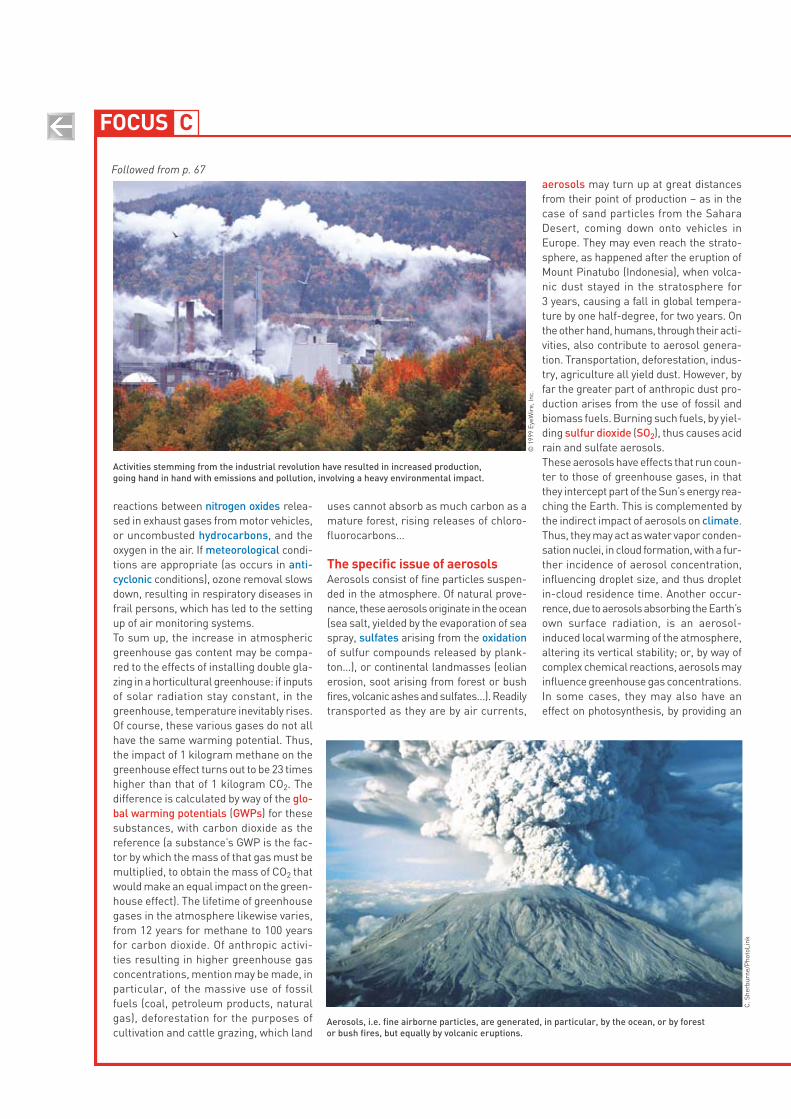
reactions between relea-sed in exhaust gases from motor vehicles,or uncombusted hydrocarbons, and theoxygen in the air. If meteorological condi-tions are appropriate (as occurs in anti-cyclonic conditions), ozone removal slowsdown, resulting in respiratory diseases infrail persons, which has led to the settingup of air monitoring systems.To sum up, the increase in atmosphericgreenhouse gas content may be compa-red to the effects of installing double gla-zing in a horticultural greenhouse: if inputsof solar radiation stay constant, in thegreenhouse, temperature inevitably rises.Of course, these various gases do not allhave the same warming potential. Thus,the impact of 1 kilogram methane on thegreenhouse effect turns out to be 23 timeshigher than that of 1 kilogram CO2. Thedifference is calculated by way of the glo-bal warming potentials (GWPs) for thesesubstances, with carbon dioxide as thereference (a substance’s GWP is the fac-tor by which the mass of that gas must bemultiplied, to obtain the mass of CO2 thatwould make an equal impact on the green-house effect). The lifetime of greenhousegases in the atmosphere likewise varies,from 12 years for methane to 100 yearsfor carbon dioxide. Of anthropic activi-ties resulting in higher greenhouse gasconcentrations, mention may be made, inparticular, of the massive use of fossilfuels (coal, petroleum products, naturalgas), deforestation for the purposes of cultivation and cattle grazing, which land
CFOCUS
uses cannot absorb as much carbon as amature forest, rising releases of chloro-fluorocarbons…
The specific issue of aerosolsAerosols consist of fine particles suspen-ded in the atmosphere. Of natural prove-nance, these aerosols originate in the ocean(sea salt, yielded by the evaporation of seaspray, sulfates arising from the oxidationof sulfur compounds released by plank-ton…), or continental landmasses (eolianerosion, soot arising from forest or bushfires, volcanic ashes and sulfates…). Readilytransported as they are by air currents,
aerosols may turn up at great distancesfrom their point of production – as in thecase of sand particles from the SaharaDesert, coming down onto vehicles inEurope. They may even reach the strato-sphere, as happened after the eruption ofMount Pinatubo (Indonesia), when volca-nic dust stayed in the stratosphere for3 years, causing a fall in global tempera-ture by one half-degree, for two years. Onthe other hand, humans, through their acti-vities, also contribute to aerosol genera-tion. Transportation, deforestation, indus-try, agriculture all yield dust. However, byfar the greater part of anthropic dust pro-duction arises from the use of fossil andbiomass fuels. Burning such fuels, by yiel-ding sulfur dioxide (SO2), thus causes acidrain and sulfate aerosols.These aerosols have effects that run coun-ter to those of greenhouse gases, in thatthey intercept part of the Sun’s energy rea-ching the Earth. This is complemented bythe indirect impact of aerosols on climate.Thus, they may act as water vapor conden-sation nuclei, in cloud formation, with a fur-ther incidence of aerosol concentration,influencing droplet size, and thus dropletin-cloud residence time. Another occur-rence, due to aerosols absorbing the Earth’sown surface radiation, is an aerosol- induced local warming of the atmosphere,altering its vertical stability; or, by way ofcomplex chemical reactions, aerosols mayinfluence greenhouse gas concentrations.In some cases, they may also have an effect on photosynthesis, by providing an
Aerosols, i.e. fine airborne particles, are generated, in particular, by the ocean, or by forest or bush fires, but equally by volcanic eruptions.
C. S
herb
urne
/Pho
toLi
nk
Followed from p. 67
Activities stemming from the industrial revolution have resulted in increased production, going hand in hand with emissions and pollution, involving a heavy environmental impact.
© 1
999
EyeW
ire,
Inc.
nitrogen oxides
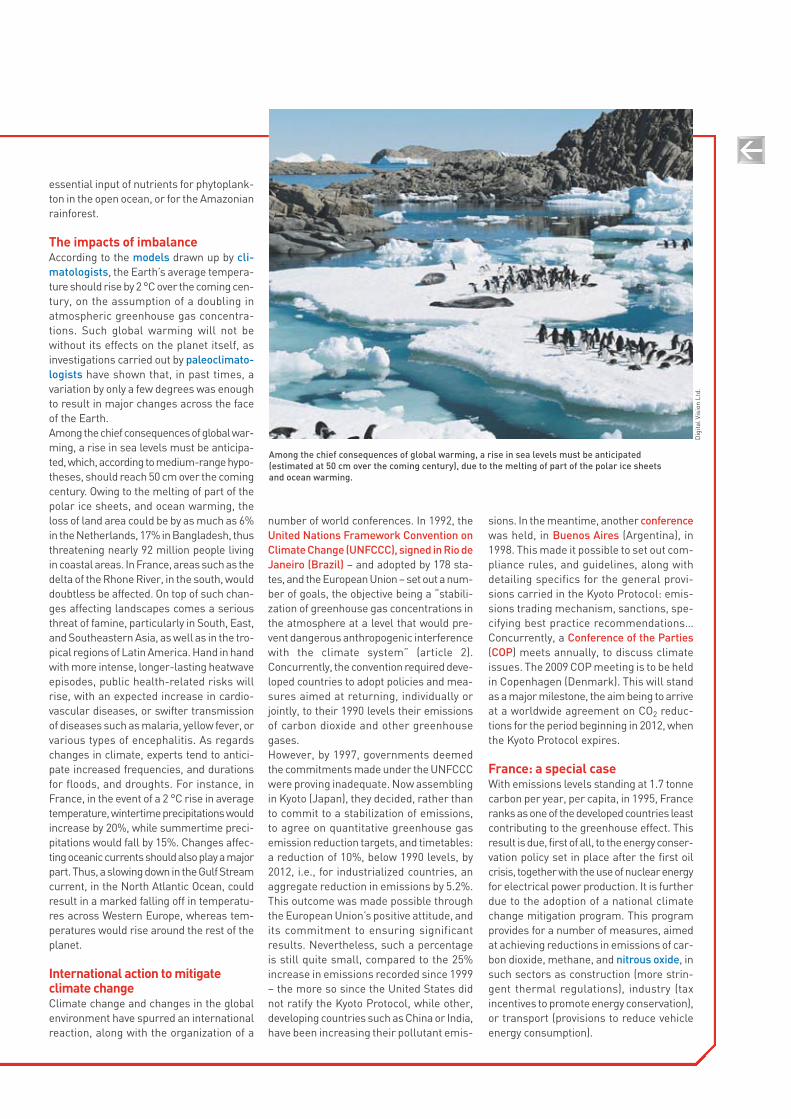
essential input of nutrients for phytoplank-ton in the open ocean, or for the Amazonianrainforest.
The impacts of imbalanceAccording to the models drawn up by cli-matologists, the Earth’s average tempera-ture should rise by 2 °C over the coming cen-tury, on the assumption of a doubling inatmospheric greenhouse gas concentra-tions. Such global warming will not bewithout its effects on the planet itself, asinvestigations carried out by paleoclimato-logists have shown that, in past times, avariation by only a few degrees was enoughto result in major changes across the faceof the Earth.Among the chief consequences of global war-ming, a rise in sea levels must be anticipa-ted, which, according to medium-range hypo-theses, should reach 50 cm over the comingcentury. Owing to the melting of part of thepolar ice sheets, and ocean warming, theloss of land area could be by as much as 6%in the Netherlands, 17% in Bangladesh, thusthreatening nearly 92 million people livingin coastal areas. In France, areas such as thedelta of the Rhone River, in the south, woulddoubtless be affected. On top of such chan-ges affecting landscapes comes a seriousthreat of famine, particularly in South, East,and Southeastern Asia, as well as in the tro-pical regions of Latin America. Hand in handwith more intense, longer-lasting heatwaveepisodes, public health-related risks willrise, with an expected increase in cardio-vascular diseases, or swifter transmissionof diseases such as malaria, yellow fever, orvarious types of encephalitis. As regardschanges in climate, experts tend to antici-pate increased frequencies, and durationsfor floods, and droughts. For instance, inFrance, in the event of a 2 °C rise in averagetemperature, wintertime precipitations wouldincrease by 20%, while summertime preci-pitations would fall by 15%. Changes affec-ting oceanic currents should also play a majorpart. Thus, a slowing down in the Gulf Streamcurrent, in the North Atlantic Ocean, couldresult in a marked falling off in temperatu-res across Western Europe, whereas tem-peratures would rise around the rest of theplanet.
International action to mitigate climate changeClimate change and changes in the globalenvironment have spurred an internationalreaction, along with the organization of a
number of world conferences. In 1992, theUnited Nations Framework Convention onClimate Change (UNFCCC), signed in Rio deJaneiro (Brazil) – and adopted by 178 sta-tes, and the European Union – set out a num-ber of goals, the objective being a “stabili-zation of greenhouse gas concentrations inthe atmosphere at a level that would pre-vent dangerous anthropogenic interferencewith the climate system” (article 2).Concurrently, the convention required deve-loped countries to adopt policies and mea-sures aimed at returning, individually orjointly, to their 1990 levels their emissionsof carbon dioxide and other greenhousegases.However, by 1997, governments deemedthe commitments made under the UNFCCCwere proving inadequate. Now assemblingin Kyoto (Japan), they decided, rather thanto commit to a stabilization of emissions,to agree on quantitative greenhouse gasemission reduction targets, and timetables:a reduction of 10%, below 1990 levels, by2012, i.e., for industrialized countries, anaggregate reduction in emissions by 5.2%.This outcome was made possible throughthe European Union’s positive attitude, andits commitment to ensuring significantresults. Nevertheless, such a percentageis still quite small, compared to the 25%increase in emissions recorded since 1999– the more so since the United States didnot ratify the Kyoto Protocol, while other,developing countries such as China or India,have been increasing their pollutant emis-
sions. In the meantime, another conferencewas held, in Buenos Aires (Argentina), in1998. This made it possible to set out com-pliance rules, and guidelines, along withdetailing specifics for the general provi-sions carried in the Kyoto Protocol: emis-sions trading mechanism, sanctions, spe-cifying best practice recommendations…Concurrently, a Conference of the Parties(COP) meets annually, to discuss climateissues. The 2009 COP meeting is to be heldin Copenhagen (Denmark). This will standas a major milestone, the aim being to arriveat a worldwide agreement on CO2 reduc-tions for the period beginning in 2012, whenthe Kyoto Protocol expires.
France: a special caseWith emissions levels standing at 1.7 tonnecarbon per year, per capita, in 1995, Franceranks as one of the developed countries leastcontributing to the greenhouse effect. Thisresult is due, first of all, to the energy conser-vation policy set in place after the first oilcrisis, together with the use of nuclear energyfor electrical power production. It is furtherdue to the adoption of a national climatechange mitigation program. This programprovides for a number of measures, aimedat achieving reductions in emissions of car-bon dioxide, methane, and nitrous oxide, insuch sectors as construction (more strin-gent thermal regulations), industry (taxincentives to promote energy conservation),or transport (provisions to reduce vehicleenergy consumption).
Among the chief consequences of global warming, a rise in sea levels must be anticipated(estimated at 50 cm over the coming century), due to the melting of part of the polar ice sheets and ocean warming.
Dig
ital V
isio
n Lt
d.
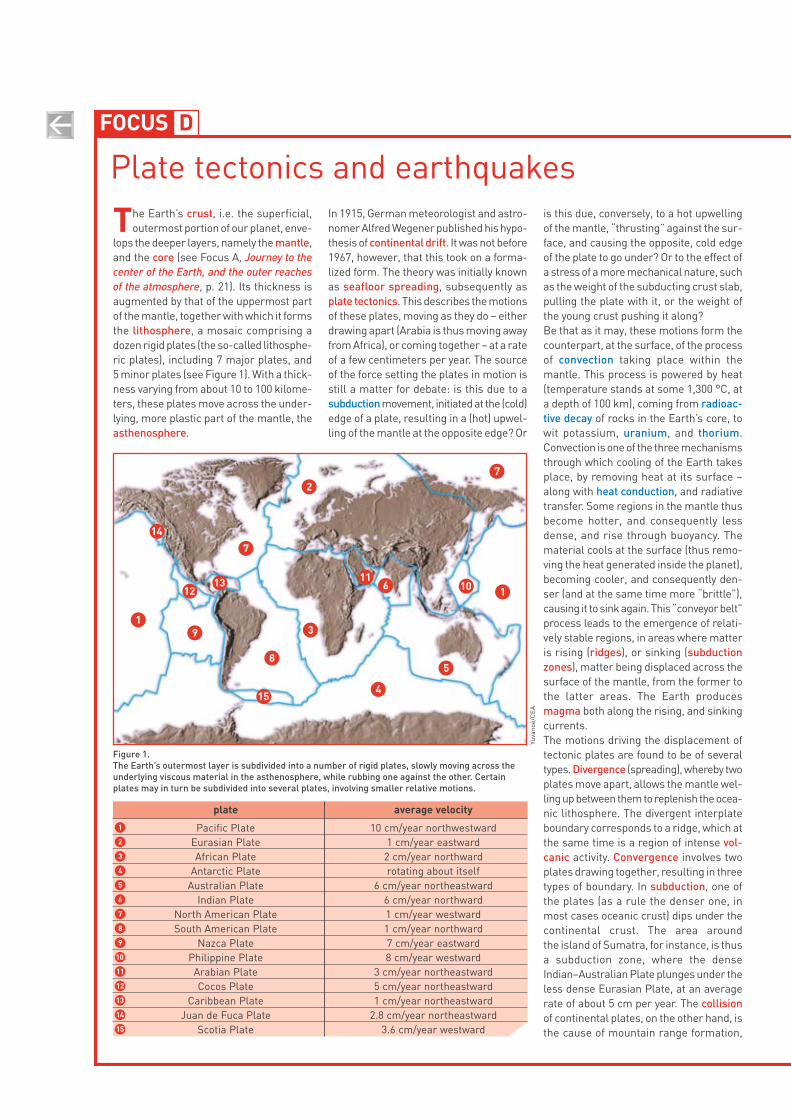
DFOCUS
The Earth’s crust, i.e. the superficial,outermost portion of our planet, enve-
lops the deeper layers, namely the mantle,and the core (see Focus A, Journey to thecenter of the Earth, and the outer reachesof the atmosphere, p. 21). Its thickness isaugmented by that of the uppermost partof the mantle, together with which it formsthe lithosphere, a mosaic comprising adozen rigid plates (the so-called lithosphe-ric plates), including 7 major plates, and 5 minor plates (see Figure 1). With a thick-ness varying from about 10 to 100 kilome-ters, these plates move across the under-lying, more plastic part of the mantle, theasthenosphere.
In 1915, German meteorologist and astro-nomer Alfred Wegener published his hypo-thesis of continental drift. It was not before1967, however, that this took on a forma-lized form. The theory was initially knownas seafloor spreading, subsequently asplate tectonics. This describes the motionsof these plates, moving as they do – eitherdrawing apart (Arabia is thus moving awayfrom Africa), or coming together – at a rateof a few centimeters per year. The sourceof the force setting the plates in motion isstill a matter for debate: is this due to asubduction movement, initiated at the (cold)edge of a plate, resulting in a (hot) upwel-ling of the mantle at the opposite edge? Or
is this due, conversely, to a hot upwellingof the mantle, “thrusting” against the sur-face, and causing the opposite, cold edgeof the plate to go under? Or to the effect ofa stress of a more mechanical nature, suchas the weight of the subducting crust slab,pulling the plate with it, or the weight ofthe young crust pushing it along?Be that as it may, these motions form thecounterpart, at the surface, of the processof convection taking place within themantle. This process is powered by heat(temperature stands at some 1,300 °C, ata depth of 100 km), coming from radioac-tive decay of rocks in the Earth’s core, towit potassium, uranium, and thorium.Convection is one of the three mechanismsthrough which cooling of the Earth takesplace, by removing heat at its surface –along with heat conduction, and radiativetransfer. Some regions in the mantle thusbecome hotter, and consequently lessdense, and rise through buoyancy. Thematerial cools at the surface (thus remo-ving the heat generated inside the planet),becoming cooler, and consequently den-ser (and at the same time more “brittle”),causing it to sink again. This “conveyor belt”process leads to the emergence of relati-vely stable regions, in areas where matteris rising (ridges), or sinking (subductionzones), matter being displaced across thesurface of the mantle, from the former tothe latter areas. The Earth producesmagma both along the rising, and sinkingcurrents.The motions driving the displacement oftectonic plates are found to be of severaltypes. Divergence (spreading), whereby twoplates move apart, allows the mantle wel-ling up between them to replenish the ocea-nic lithosphere. The divergent interplateboundary corresponds to a ridge, which atthe same time is a region of intense vol-canic activity. Convergence involves twoplates drawing together, resulting in threetypes of boundary. In subduction, one ofthe plates (as a rule the denser one, in most cases oceanic crust) dips under thecontinental crust. The area around the island of Sumatra, for instance, is thusa subduction zone, where the denseIndian–Australian Plate plunges under theless dense Eurasian Plate, at an averagerate of about 5 cm per year. The collisionof continental plates, on the other hand, isthe cause of mountain range formation,
Plate tectonics and earthquakes
Figure 1.The Earth’s outermost layer is subdivided into a number of rigid plates, slowly moving across theunderlying viscous material in the asthenosphere, while rubbing one against the other. Certainplates may in turn be subdivided into several plates, involving smaller relative motions.
plate average velocity
Pacific Plate 10 cm/year northwestwardEurasian Plate 1 cm/year eastwardAfrican Plate 2 cm/year northward
Antarctic Plate rotating about itselfAustralian Plate 6 cm/year northeastward
Indian Plate 6 cm/year northwardNorth American Plate 1 cm/year westwardSouth American Plate 1 cm/year northward
Nazca Plate 7 cm/year eastwardPhilippine Plate 8 cm/year westward
Arabian Plate 3 cm/year northeastwardCocos Plate 5 cm/year northeastward
Caribbean Plate 1 cm/year northeastwardJuan de Fuca Plate 2.8 cm/year northeastward
Scotia Plate 3.6 cm/year westward15
14
13
12
11
10
9
8
7
6
5
4
3
2
1
1213 11
10
15
14
9
8
4
6
5
7
72
31
1
Yuva
noé/
CEA

e.g. the uplift of the Himalayas, at theboundary between the Indian, andEurasian Plates (see Figure 2). Finally,obduction, or overthrusting, involves thetransport of a section of oceanic litho-sphere on top of a continent (no conver-gence process of this type is currentlyactive). Another kind of interaction invol-ves friction between plates: transcurrence,or transform boundaries, where two pla-tes slip horizontally past each other (seeFigure 2).In effect, the three main families of faultsare associated, respectively, to these inter-action types: normal faults (divergent,extensional); reverse faults (convergent,compressional); and strike–slip faults(transcurrent: both the extension, and
compression axes lie in the horizontalplane). Plate motions, classically moni-tored by means of conventional instru-ments (theodolites, distance meters), areincreasingly tracked by way of satelliteresources, namely the Global PositioningSystem (GPS), which proves particularlywell suited to the requirements of defor-mation measurements, across a givenregion (see GPS measurement of defor-mation: a method for the investigation oflarge-scale tectonic motions, p. 95).It is along interplate boundaries that mostearthquakes, and volcanoes arise, as aconsequence of the selfsame deep phe-nomena. A certain number of volcanoesare found to arise, however, right at thecenter of plates (these locations are known
as hotspots). These hotspots are thoughtto be the surface manifestation of convec-ting blobs of material, less dense than themantle as a whole, rising straight throughthe latter. Such hotspots – the largest onesare located under the islands of Hawaii(USA) and La Réunion (France) – scarcelymove relative to one another, while pla-tes “ride past” above them.
Volcanoes and earthquakes asmarkers of deep motions insidethe planetVolcanoes may be of the effusive, or explo-sive type, or a combination of the two. Theformer let molten rock stream out of theircrater(s), and often occur as chains of
Figure 2.At left, an instance of transform boundary. The Pacific Plate and the North American Plate are slipping past each other, on either side of the San Andreas Fault, which is the source of Californian earthquakes. Middle, an instance of subduction. The formation of volcanic island arcs, extending from Japan to the Kuril Islands, and the Aleutians, is due to the fact that the Pacific Plate is plunging under the Eurasian Plate. At right, an instance of collision. The formation of the Himalayas is the result of the contest between the Indian Plate, and the Eurasian Plate, which overlap and undergo uplift.
Yuva
noé/
CEA
Asia Japan
oceanic crust
lithosphere lithosphere
asthenosphereasthenosphereasthenosphere
Africa
oceanic crust
Pacific Plate
San Andreas Fault
oceanic crust old
oceanic crust
India
Europe Asia continentalcrust
continentalcrust
continentalcrust
Himalayas
United States
CanadaMexico
North American Plate
Stoc
kTre
k
The Pacific Plate is dotted with volcanicislands, such as Hawaii, where volcanoesnumbered among the most active, the worldover, are to be found.
CN
RS
Pho
toth
èque
/Her
vé P
hilip
Damage caused by the earthquake occurring in Spitak (Armenia), on 7 December 1988. This earthquake, of magnitude 6.2, resulted in a death toll of about 25,000. The violent release of strains, accumulating as plates move, scraping against one another, induces a concomitant,more or less abrupt, ground motion.
Skip to page 92
fault
island arc
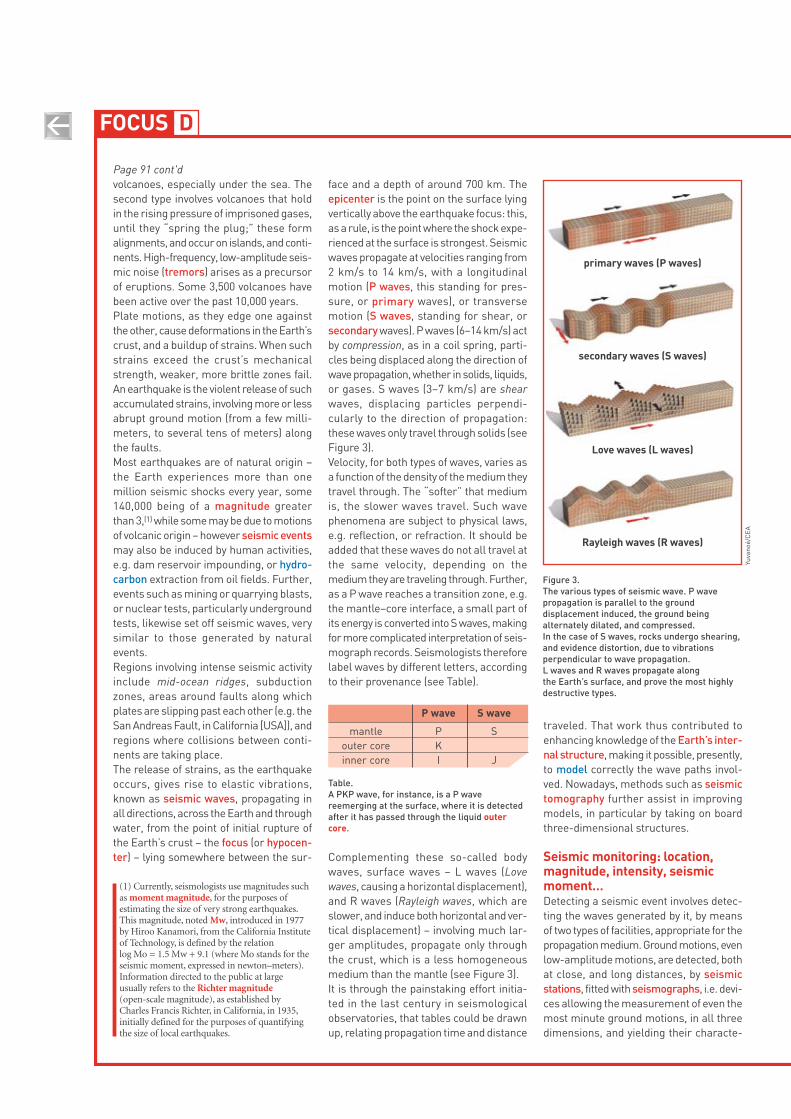
DFOCUS
Page 91 cont'dvolcanoes, especially under the sea. Thesecond type involves volcanoes that holdin the rising pressure of imprisoned gases,until they “spring the plug;” these formalignments, and occur on islands, and conti-nents. High-frequency, low-amplitude seis-mic noise (tremors) arises as a precursorof eruptions. Some 3,500 volcanoes havebeen active over the past 10,000 years.Plate motions, as they edge one againstthe other, cause deformations in the Earth’scrust, and a buildup of strains. When suchstrains exceed the crust’s mechanicalstrength, weaker, more brittle zones fail.An earthquake is the violent release of suchaccumulated strains, involving more or lessabrupt ground motion (from a few milli-meters, to several tens of meters) alongthe faults.Most earthquakes are of natural origin –the Earth experiences more than onemillion seismic shocks every year, some140,000 being of a magnitude greater than 3,(1) while some may be due to motionsof volcanic origin – however seismic eventsmay also be induced by human activities,e.g. dam reservoir impounding, or hydro-carbon extraction from oil fields. Further,events such as mining or quarrying blasts,or nuclear tests, particularly undergroundtests, likewise set off seismic waves, verysimilar to those generated by naturalevents.Regions involving intense seismic activityinclude mid-ocean ridges, subduction zones, areas around faults along which plates are slipping past each other (e.g. theSan Andreas Fault, in California [USA]), andregions where collisions between conti-nents are taking place.The release of strains, as the earthquakeoccurs, gives rise to elastic vibrations,known as seismic waves, propagating inall directions, across the Earth and throughwater, from the point of initial rupture ofthe Earth’s crust – the focus (or hypocen-ter) – lying somewhere between the sur-
face and a depth of around 700 km. Theepicenter is the point on the surface lyingvertically above the earthquake focus: this,as a rule, is the point where the shock expe-rienced at the surface is strongest. Seismicwaves propagate at velocities ranging from2 km/s to 14 km/s, with a longitudinalmotion (P waves, this standing for pres-sure, or primary waves), or transversemotion (S waves, standing for shear, orsecondary waves). P waves (6–14 km/s) actby compression, as in a coil spring, parti-cles being displaced along the direction ofwave propagation, whether in solids, liquids,or gases. S waves (3–7 km/s) are shearwaves, displacing particles perpendi-cularly to the direction of propagation: these waves only travel through solids (seeFigure 3).Velocity, for both types of waves, varies asa function of the density of the medium theytravel through. The “softer” that mediumis, the slower waves travel. Such wave phenomena are subject to physical laws,e.g. reflection, or refraction. It should beadded that these waves do not all travel atthe same velocity, depending on themedium they are traveling through. Further,as a P wave reaches a transition zone, e.g.the mantle–core interface, a small part ofits energy is converted into S waves, makingfor more complicated interpretation of seis-mograph records. Seismologists thereforelabel waves by different letters, accordingto their provenance (see Table).
Complementing these so-called bodywaves, surface waves – L waves (Lovewaves, causing a horizontal displacement),and R waves (Rayleigh waves, which areslower, and induce both horizontal and ver-tical displacement) – involving much lar-ger amplitudes, propagate only throughthe crust, which is a less homogeneousmedium than the mantle (see Figure 3). It is through the painstaking effort initia-ted in the last century in seismological observatories, that tables could be drawnup, relating propagation time and distance
traveled. That work thus contributed toenhancing knowledge of the Earth’s inter-nal structure, making it possible, presently,to model correctly the wave paths invol-ved. Nowadays, methods such as seismictomography further assist in improvingmodels, in particular by taking on boardthree-dimensional structures.
Seismic monitoring: location,magnitude, intensity, seismicmoment…Detecting a seismic event involves detec-ting the waves generated by it, by meansof two types of facilities, appropriate for thepropagation medium. Ground motions, evenlow-amplitude motions, are detected, bothat close, and long distances, by seismicstations, fitted with seismographs, i.e. devi-ces allowing the measurement of even themost minute ground motions, in all threedimensions, and yielding their characte-
Figure 3.The various types of seismic wave. P wavepropagation is parallel to the grounddisplacement induced, the ground beingalternately dilated, and compressed. In the case of S waves, rocks undergo shearing,and evidence distortion, due to vibrationsperpendicular to wave propagation. L waves and R waves propagate along the Earth’s surface, and prove the most highlydestructive types.
Yuva
noé/
CEA
(1) Currently, seismologists use magnitudes suchas moment magnitude, for the purposes ofestimating the size of very strong earthquakes.This magnitude, noted Mw, introduced in 1977by Hiroo Kanamori, from the California Instituteof Technology, is defined by the relationlog Mo = 1.5 Mw + 9.1 (where Mo stands for theseismic moment, expressed in newton–meters).Information directed to the public at largeusually refers to the Richter magnitude(open-scale magnitude), as established by Charles Francis Richter, in California, in 1935,initially defined for the purposes of quantifying the size of local earthquakes.
primary waves (P waves)
secondary waves (S waves)
Love waves (L waves)
Rayleigh waves (R waves)
P wave S wave
mantle P Souter core Kinner core I J
Table.A PKP wave, for instance, is a P wavereemerging at the surface, where it is detectedafter it has passed through the liquid outercore.
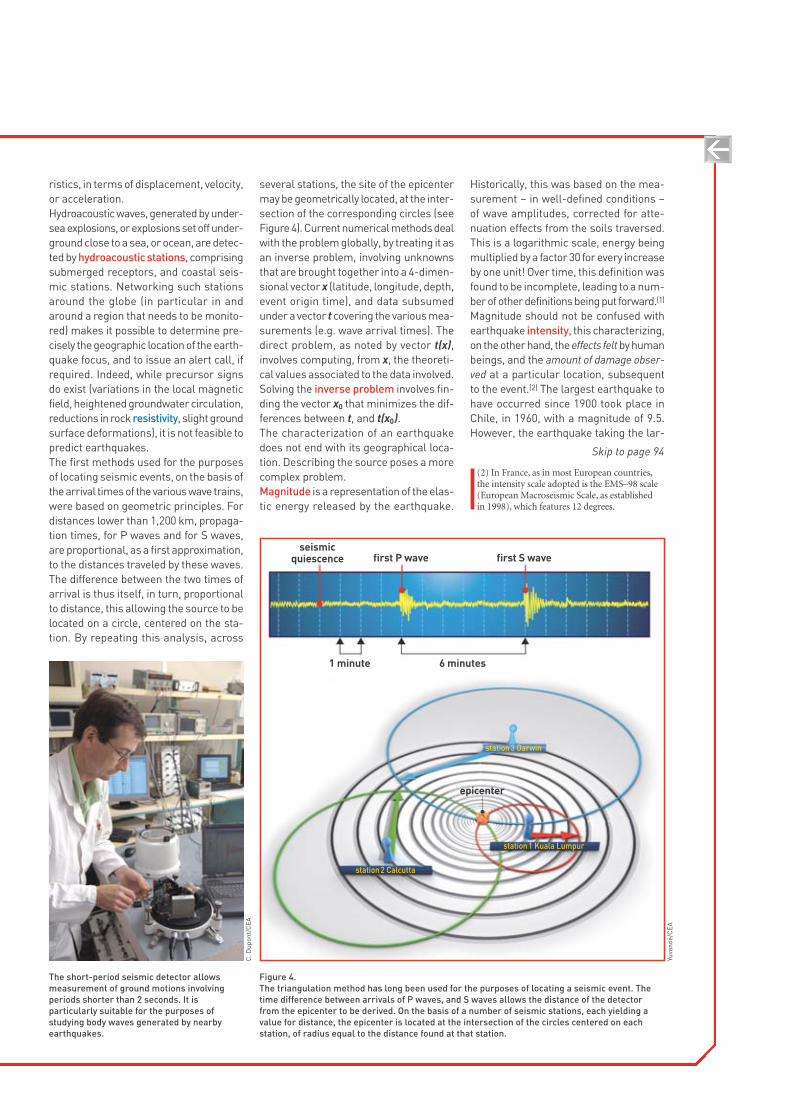
ristics, in terms of displacement, velocity,or acceleration.Hydroacoustic waves, generated by under-sea explosions, or explosions set off under-ground close to a sea, or ocean, are detec-ted by hydroacoustic stations, comprisingsubmerged receptors, and coastal seis-mic stations. Networking such stationsaround the globe (in particular in andaround a region that needs to be monito-red) makes it possible to determine pre-cisely the geographic location of the earth-quake focus, and to issue an alert call, ifrequired. Indeed, while precursor signsdo exist (variations in the local magneticfield, heightened groundwater circulation,reductions in rock resistivity, slight groundsurface deformations), it is not feasible topredict earthquakes.The first methods used for the purposesof locating seismic events, on the basis ofthe arrival times of the various wave trains,were based on geometric principles. Fordistances lower than 1,200 km, propaga-tion times, for P waves and for S waves,are proportional, as a first approximation,to the distances traveled by these waves.The difference between the two times ofarrival is thus itself, in turn, proportionalto distance, this allowing the source to belocated on a circle, centered on the sta-tion. By repeating this analysis, across
several stations, the site of the epicentermay be geometrically located, at the inter-section of the corresponding circles (seeFigure 4). Current numerical methods dealwith the problem globally, by treating it asan inverse problem, involving unknownsthat are brought together into a 4-dimen-sional vector x (latitude, longitude, depth,event origin time), and data subsumedunder a vector t covering the various mea-surements (e.g. wave arrival times). Thedirect problem, as noted by vector t(x),involves computing, from x, the theoreti-cal values associated to the data involved.Solving the inverse problem involves fin-ding the vector x0 that minimizes the dif-ferences between t, and t(x0).The characterization of an earthquakedoes not end with its geographical loca-tion. Describing the source poses a morecomplex problem.Magnitude is a representation of the elas-tic energy released by the earthquake.
Historically, this was based on the mea-surement – in well-defined conditions –of wave amplitudes, corrected for atte-nuation effects from the soils traversed.This is a logarithmic scale, energy beingmultiplied by a factor 30 for every increaseby one unit! Over time, this definition wasfound to be incomplete, leading to a num-ber of other definitions being put forward.(1)
Magnitude should not be confused withearthquake intensity, this characterizing,on the other hand, the effects felt by humanbeings, and the amount of damage obser-ved at a particular location, subsequentto the event.(2) The largest earthquake tohave occurred since 1900 took place inChile, in 1960, with a magnitude of 9.5.However, the earthquake taking the lar-
Figure 4.The triangulation method has long been used for the purposes of locating a seismic event. Thetime difference between arrivals of P waves, and S waves allows the distance of the detectorfrom the epicenter to be derived. On the basis of a number of seismic stations, each yielding avalue for distance, the epicenter is located at the intersection of the circles centered on eachstation, of radius equal to the distance found at that station.
Yuva
noé/
CEA
C. D
upon
t/C
EA
The short-period seismic detector allowsmeasurement of ground motions involvingperiods shorter than 2 seconds. It isparticularly suitable for the purposes ofstudying body waves generated by nearbyearthquakes.
seismicquiescence first P wave first S wave
6 minutes1 minute
epicenter
station 3 Darwin
station 1 Kuala Lumpur
station 2 Calcutta
(2) In France, as in most European countries,the intensity scale adopted is the EMS–98 scale(European Macroseismic Scale, as established in 1998), which features 12 degrees.
Skip to page 94
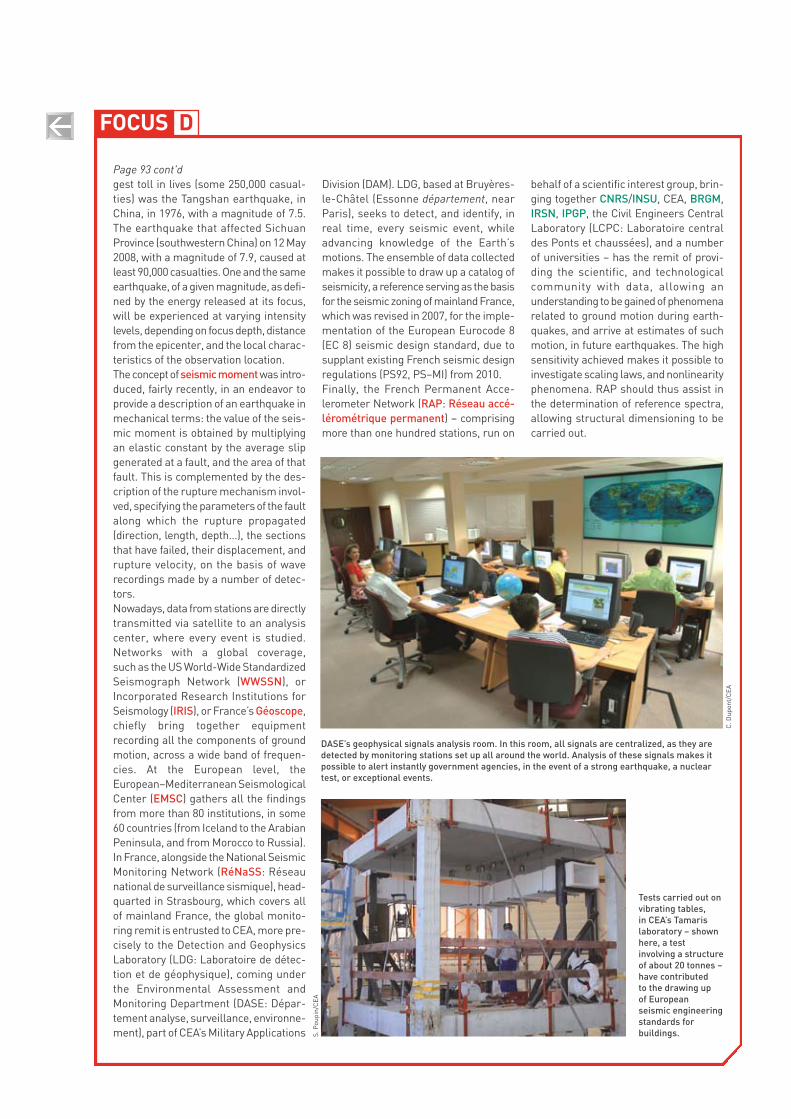
DFOCUS
Page 93 cont'dgest toll in lives (some 250,000 casual-ties) was the Tangshan earthquake, inChina, in 1976, with a magnitude of 7.5.The earthquake that affected SichuanProvince (southwestern China) on 12 May2008, with a magnitude of 7.9, caused atleast 90,000 casualties. One and the sameearthquake, of a given magnitude, as defi-ned by the energy released at its focus,will be experienced at varying intensitylevels, depending on focus depth, distancefrom the epicenter, and the local charac-teristics of the observation location.The concept of seismic momentwas intro-duced, fairly recently, in an endeavor toprovide a description of an earthquake inmechanical terms: the value of the seis-mic moment is obtained by multiplyingan elastic constant by the average slipgenerated at a fault, and the area of thatfault. This is complemented by the des-cription of the rupture mechanism invol-ved, specifying the parameters of the faultalong which the rupture propagated(direction, length, depth…), the sectionsthat have failed, their displacement, andrupture velocity, on the basis of waverecordings made by a number of detec-tors.Nowadays, data from stations are directlytransmitted via satellite to an analysiscenter, where every event is studied.Networks with a global coverage, such as the US World-Wide StandardizedSeismograph Network (WWSSN), orIncorporated Research Institutions forSeismology (IRIS), or France’s Géoscope,chiefly bring together equipment recording all the components of groundmotion, across a wide band of frequen-cies. At the European level, theEuropean–Mediterranean SeismologicalCenter (EMSC) gathers all the findingsfrom more than 80 institutions, in some60 countries (from Iceland to the ArabianPeninsula, and from Morocco to Russia).In France, alongside the National SeismicMonitoring Network (RéNaSS: Réseaunational de surveillance sismique), head-quarted in Strasbourg, which covers allof mainland France, the global monito-ring remit is entrusted to CEA, more pre-cisely to the Detection and GeophysicsLaboratory (LDG: Laboratoire de détec-tion et de géophysique), coming under the Environmental Assessment andMonitoring Department (DASE: Dépar -tement analyse, surveillance, environne-ment), part of CEA’s Military Applications
Division (DAM). LDG, based at Bruyères-le-Châtel (Essonne département, nearParis), seeks to detect, and identify, inreal time, every seismic event, whileadvancing knowledge of the Earth’smotions. The ensemble of data collectedmakes it possible to draw up a catalog ofseismicity, a reference serving as the basisfor the seismic zoning of mainland France,which was revised in 2007, for the imple-mentation of the European Eurocode 8(EC 8) seismic design standard, due tosupplant existing French seismic designregulations (PS92, PS–MI) from 2010.Finally, the French Permanent Acce-lerometer Network (RAP: Réseau accé-lérométrique permanent) – comprisingmore than one hundred stations, run on
behalf of a scientific interest group, brin-ging together CNRS/INSU, CEA, BRGM,IRSN, IPGP, the Civil Engineers CentralLaboratory (LCPC: Laboratoire centraldes Ponts et chaussées), and a numberof universities – has the remit of provi-ding the scientific, and technological community with data, allowing an understanding to be gained of phenomena related to ground motion during earth-quakes, and arrive at estimates of suchmotion, in future earthquakes. The highsensitivity achieved makes it possible toinvestigate scaling laws, and nonlinearityphenomena. RAP should thus assist inthe determination of reference spectra,allowing structural dimensioning to becarried out.
C. D
upon
t/C
EA
DASE’s geophysical signals analysis room. In this room, all signals are centralized, as they aredetected by monitoring stations set up all around the world. Analysis of these signals makes itpossible to alert instantly government agencies, in the event of a strong earthquake, a nucleartest, or exceptional events.
S. P
oupi
n/C
EA
Tests carried out onvibrating tables, in CEA’s Tamarislaboratory – shownhere, a testinvolving a structureof about 20 tonnes –have contributed to the drawing up of European seismic engineeringstandards forbuildings.
Related Documents