IGT Project 61067 R. J. Remick, E. H. Camara, Engineering Research Divison Institute of Gas Technology Prepared for D SPACE AD I N ISTWATIO earch Center er Contract DE

Welcome message from author
This document is posted to help you gain knowledge. Please leave a comment to let me know what you think about it! Share it to your friends and learn new things together.
Transcript

IGT Project 61067
R. J. Remick, E. H. Camara, Engineering Resea rch D ivison Institute of Gas Technology
Prepared for D SPACE AD I N ISTWATIO
earch Center er Contract DE
This report was prepared as an account of work sponsored by an agency of the United States Government. Neither the United Slates Government nor any agency thereof, nor any of their employees, makes any warranty, express or implied, or assumes any legal liability or responsibility for the accuracy, completeness, or usefulness of any information, apparatus, product, or process disclosed, or represents that its use would not infringe privately owned rights. Reference herein to any specific commercial product, process, or service by trade name, trademark, manufacturer, or otherwise, does not necessarily constitute or imply its endorsement, recommendation, or favoring by the United States Government or any agency thereof. The views and opinions of authors expressed herein do not necessarily state or reflect those of the United States Government or any agency thereof.
Printed in the United States of America Available from
National Technical Information Service U.S. Department of Commerce 5285 Port Royal Road Springfield, VA 22161
Printed copy: A07 Microfiche copy: A01
NTlS price codes1
1Codes are used for pricing all publications. The code is determined by the number of pages in the publication. Information pertaining to the pricing codes can be found in the current issues of the following publications, which are generally available in most libraries: Energy Research Abstracts {ERA); Government Reports Announcements and Index (GRA and I); Scientific and Technical Abstract Reports (STAR); and publication, NTIS-PR-360 available from MTlS at the above address.
DOEINASA10327-1 NASA CR-I 74655 IGT Project 61 067
Advanced Onboard Storage Concepts for Natural Gas=Fueled Automotive Vehicles
R. J. Remic, R. H. Elkins, E. H. Camara and T. Bulicz Engineering Research Division Institute of Gas Technology Chicago, Illinois 6061 6
June 1984
Prepared for National Aeronautics and Space Administration Lewis Research Center Cleveland, Ohio 441 35 Under Contract DEN 3-327
for U.S. DEPARTMENT OF ENERGY Conservation and Renewable Energy Office of Vehicle and Energy R&D Washington, D.C. 20545 Under Interagency Agreement DE-AI01 -81 CS50006

TABLE OF CONTENTS
INTRODUCTION
Page
2
1 TASK 1. ADSORPTION STUDIES
Task 1.1. Effect of Storage Medium Characteristics on Methane Storage Capacity
A. Experimental Efforts - Carbons
1. 2 . 3 . 4 . 5 . 6 .
8. 9 . 10. 11.
\ 7 .
Suppliers Residue After Ignit-ion Acidity Surface Area Determination - Theory Surface Area Determination - Practice Packing Density Particle Size - Activated Carbon Pellets Particle Size Distribution - Carbon Black Powders Cumulative Pore Volume Pore Size Distribution Methane Adsorption Isbtherms for Carbons
B. Experimental Effort - Mblecular Sieves
1. Description of Samples 2 . Adsorption Isotherms
C. Bench-Scale Storage Experiments D. Discussion of Results
E. Conclusions Task 1 . 2 . Modeling Effort
A.
B. C. D. E.
F. G .
H. I.
TASK 2 .
Calculations to Determine the Weight of a Storage Tank Model Automobile Fuel Consumption for Dual-Fuel Mode Dedicated Engine Mode
Energy Density of Pressurized Storage
On-Board Storage Adbitional Weight of Gas Storage Hardware
Vehicle Range and Fuel Efficiency Discussion of Results
LITERATURE SURVEY AND ADVANCED STORAGE MEDIUM EVALUATION
A. Clathration of Methane B. Dissolution of Methane
Conclusions
4
4
4 5 5 8 9
1 0 1 2 1 2 1 7 1 7 1 7
22
2 2 26
2 8
3 1
3 3
35
3 5
36
37 3 8
3 8
3 9
4 0
41
41
4 5
4 5
4 8
5 0
iii

TABLE OF CONTENTS, Cont.
TASK 3. F'UTURE RESEARCH AND DEVELOPMENT RECOMMENDATIONS
References
APPENDIX A. PORE SIZE DISTRIBUTION FOR CARBON SAMPLES
APPENDIX B. METHANE ADSORPTION ISOTHERMS FOR CARBON AND ZEOLITE SAMPLES
APPENDIX C. SUPPORTING CALCULATIONS FOR TASK 1.2 WORK
APPENDIX D. EVALUATION OF CLATHRATION COMPOUNDS AS A MEANS OF STORING NATURAL GAS
APPENDIX E. EVALUATION OF DISSOLUTION AS A MEANS OF STORING NATURAL GAS
Page
51
52
A-1
B- 1
c-1
D-1
E-1
iv

SUMMARY
The objective of this study was the evaluation, through both experimenta- tion and a literature review, of several advanced concepts for storing natural gas at reduced pressure. The advanced concepts included in this study were adsorption on high surface area carbon, adsorption in high porosity zeolite, storage in clathration compounds, and storage by dissolution in liquid sol- vents. The literature review indicated that high storage capacity could be
obtained with adsorption systems.
Seventeen carbon samples and seven zeolite samples were then secured and evaluated experimentally in a pressurized microbalance apparatus to determine their methane adsorption isotherm. The methane storage capacity of each sam-
ple was also determined using a bench-scale storage system. Results indicated that high surface area carbons with high packing density were the best low pressure storage mediums.
A simple mathematical model was used to compare adsorption storage on a state-of-the-art carbon with compression storage. The model indicated that a vehicle using adsorption storage of natural gas at 3.6 MPa (500 psig) will have 36% of the range, on the EPA city cycle, of a vehicle operating on a com- pression storage system having the same physical size and a peak storage pres-
sure of 21 MPa (3000 psig). literature suggest that the storage capacity of state-of-the-art carbons could be improved by as much as 50%, and that adsorption systems having a capacity
equal to compression storage at 14 MPa are possible.
However, preliminary experiments and current
1
INTRODUCTION
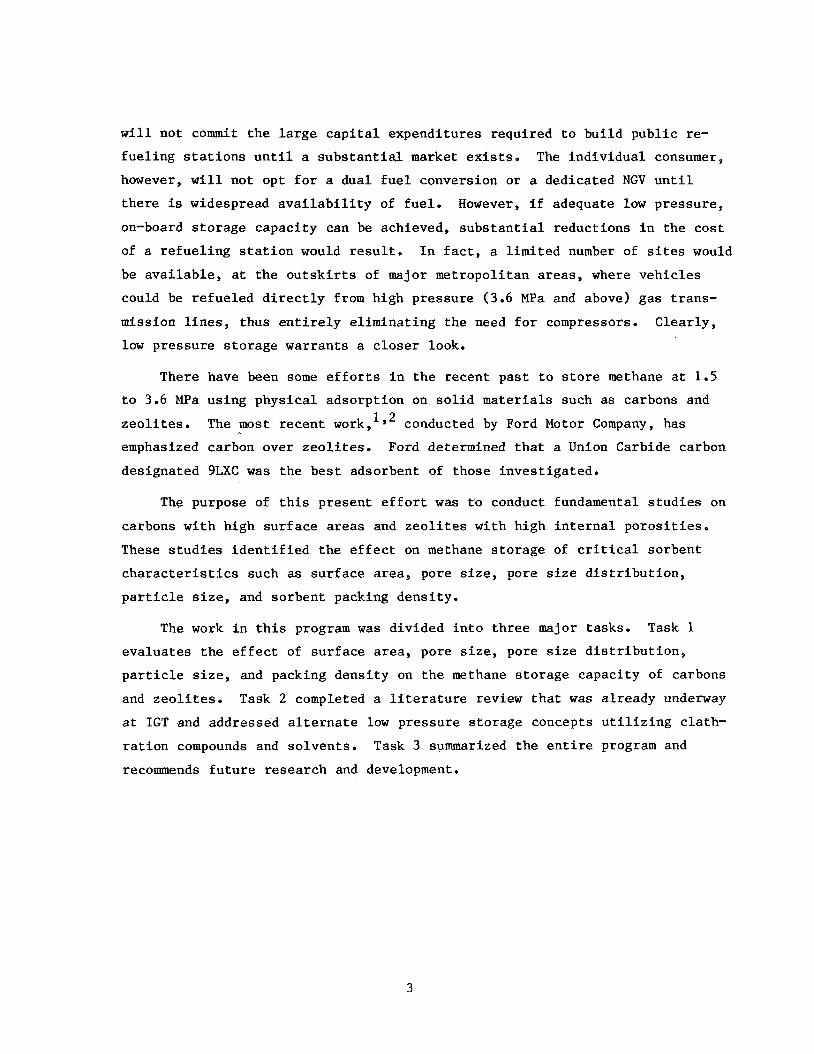
Recently there has been increased interest in the use of natural gas (methane) as fuel for vehicles in the United States. The primary reason for this interest is that natural gas is currently lower priced than either gaso-
line or diesel fuel, but other factors are also important. For example, methane-fueled vehicles would decrease both oil imports and vehicular contri-
bution to photochemical smog. At the present time, there are nearly 30,000
natural gas fueled vehicles (NGV) in regular operation in the United States; most of these are part of commercial fleet operations. However, this number pales in significance when compared to the approximately 140,000,000 licensed vehicles in the U . S . To achieve a more wide spread acceptance of N G V s and a deeper market penetration, more economical methods must be developed for re-
fueling and for on-board storage of natural gas.
Two alternative storage approaches are available to provide compressed natural gas (CNG)-fueled vehicles with driving ranges comparable to those of
liquid-fueled vehicles. These are high storage pressure at pressures up to 21
MPa (3000 psi) and low-pressure adsorption storage at pressures below 3.6 )Pa.
Most NGVs in operation today use high-pressure storage, and many studies are available to justify their use -primarily for multi-vehicle fleets. But only a limited amount of work has been done in low-pressure absorption storage
where the biggest potential cost benefits lie. For example, a recent (October 1982) estimate of costs for converting a 70 vehicle fleet to dual fuel high pressure (21 MPa) operation broke down as follows: $83,500 for vehicle con- version equipment and $140,000 for a quick fill refueling station. When an overnight fill was substituted for the quick fill, refueling station costs
dropped to $94,000, still more than half the cost of conversion. These costs average $3,200 per vehicle for the quick fill option and $2,500 per vehicle
for an overnight fill refueling station. Payback periods as short as 2 years are possible for this fleet if the fleet averages 45,000 miles per vehicle per year and the combined average fuel economy is under 20 miles per gallon. Clearly, the high cost of compressor equipment is a major stumbling block to
deeper market penetration.
The,high costs of refueling stations has also helped to bring about a
"chicken or the egg" syndrome in this fledgling industry. The private sector
2
w i l l not commit t h e large c a p i t a l expendi tures required t o bu i ld pub l i c re-
fue l ing s t a t i o n s u n t i l a s u b s t a n t i a l market exists. The ind iv idua l consumer,
however, w i l l not opt f o r a dual f u e l conversion or a dedicated NGV u n t i l
t he re i s widespread a v a i l a b i l i t y of fue l . However, i f adequate low pressure ,
on-board s to rage capac i ty can be achieved, s u b s t a n t i a l reduct ions i n the cos t
of a r e fue l ing s t a t i o n would r e s u l t . In f a c t , a l imi t ed number of si tes would
be ava i l ab le , a t the o u t s k i r t s of major metropol i tan areas, where veh ic l e s
could be re fue led d i r e c t l y from high pressure (3.6 MPa and above) gas t rans-
mission l i n e s , thus e n t i r e l y e l iminat ing t h e need f o r compressors. Clear ly ,
low pressure s to rage warrants a c l o s e r look.
There
t o 3.6 MPa
z e o l i t e s .
emphasized
designated
have been some e f f o r t s i n t h e recent pas t t o s t o r e methane a t 1.5
using phys ica l adsorp t ion on s o l i d materials such as carbons and
The most recent work, lY2 conducted by Ford Motor Company, has
carbon over z e o l i t e s . Ford determined t h a t a Union Carbide carbon
9LXC w a s t h e b e s t adsorbent of those inves t iga ted .
The purpose of t h i s present e f f o r t w a s t o conduct fundamental s t u d i e s on
carbons wi th high su r face areas and z e o l i t e s wi th high i n t e r n a l p o r o s i t i e s .
These s t u d i e s i d e n t i f i e d the e f f e c t on methane s to rage of c r i t i ca l sorbent
c h a r a c t e r i s t i c s such as su r face area, pore s i z e , pore s i z e d i s t r i b u t i o n ,
p a r t i c l e s i z e , and sorbent packing dens i ty .
The work i n t h i s program was divided i n t o th ree major tasks . Task 1
eva lua tes t h e e f f e c t of su r f ace area, pore s i z e , pore s i z e d i s t r i b u t i o n ,
p a r t i c l e s i z e , and packing dens i ty on t h e methane s to rage capac i ty of carbons
and z e o l i t e s . Task 2 completed a l i t e r a t u r e review t h a t was a l ready underway
a t IGT .and addressed a l t e r n a t e low pressure s torage concepts u t i l i z i n g claeh-
r a t i o n compounds and so lvents . Task 3 summarized t h e e n t i r e program and
recommends f u t u r e research and development.
3

TASK 1. ADSORPTION STUDIES
Task 1.1 Effect of Storage Medium Characteristics on Methane Storage Capacity
The objective of this task was to document the effect of surface area, pore volume, pore size distribution, particle size, and packing density on the methane storage capacity of carbons and zeolites at room temperature and at pressures up to 3.6 ma.
A. Experimental Efforts -Carbons
1. Suppliers
Samples of high-surface-area carbon blacks and activated carbons were obtained from various manufacturers. Table 1 is a list of suppliers and
product names.
Table 1. LIST OF CARBONS BY SUPPLIER
Supplier Designation
Gulf Oil Chemicals Co. Acetylene Black (Shawinigan Products Div.) 50% Dense
100% Dense
Cabot, Corp. CSX-179-B
IC1 Americas, Inc.
Westvaco
DXL-0-8334 DARCO SG
Nuchar WV-B Nuchar WV-G
J. T. Baker Co. Acid-Washed Carbon
CECA, Inc. GAC 50G
Witco Chemicals JXC 4 x 6
Calgotl Corp . North American Carbon
Union Carbide (No longer in production)
PCB 30 x 140 BPL 30 X 140
GlOl G104 G2 10 G216
9LXC
Sample No.
c1 c2
c3
c4 c5
C6 c7
C8
c9
c10
c11 c12
C13 C14 C15 C16
C17

2 . Residue Af te r I g n i t i o n
One-gram samples of each of these 17 carbons were placed i n weighed,
porce la in c r u c i b l e s and heated overnight i n air a t 1000°C.
determined, and where poss ib l e the res idue present a f t e r i g n i t i o n w a s re-
covered. Some of t he a c t i v a t e d carbons obtained commercially are i n the form
of c y l i n d r i c a l p e l l e t s and conta in a c lay binder. Others have been impreg-
nated with inorganic materials t o enhance t h e i r a b i l i t y t o absorb r e a c t i v e
gases such as hydrogen cyanide. S t i l l o the r s , because of t h e i r o r ig in , con-
t a i n a l k a l i metal carbonates or a l k a l i n e e a r t h phosphates and s u l f a t e s . It i s
important t o know how much of each sample i s carbon i n order t h a t only high
pu r i ty carbons might be used t o eva lua te t h e importance of sur face area and
pore volume. Such information w i l l be e s s e n t i a l i n t he modeling e f f o r t t o be
undertaken i n la ter s t ages of Task 1. Resul t s are l i s t e d i n Table 2.
Weight l o s s w a s
3 . Acidi ty
The key t o t h e adsorp t ion of gases on high-surface-area ac t iva t ed carbons
is the na ture of t he carbon sur face . The a c t i v a t i o n of charcoal , f o r example,
' by p a r t i a l ox ida t ion i n a i r produces an uns tab le su r face layer . Upon contact
wi th air a t room temperature, t h i s uns tab le l a y e r r e v e r t s t o a more s t a b l e
modif icat ion c a l l e d oxidized charcoal. This oxidized charcoal possesses a
v a r i e t y of carboxyl and carbonyl groups on i t s sur face t h a t con t r ibu te s ig-
n i f i c a n t l y t o its adsorp t ion p rope r t i e s . Boem, f o r example, has charac te r ized
the sur face groups on oxidized charcoal by t i t r a t i o n wi th bases of d i f f e r e n t
s t r e n g t h s and by chemical a n a l y ~ i s . ~ H e proposes t h a t oxidized charcoal has
a t least four types of su r face s t r u c t u r e s (Figure 1). S t ruc tu res I1 and 111
both possess carboxyl ic ac id groups while S t ruc tu re IV has p o s i t i v e l y charged
counter ions a s soc ia t ed wi th it . When mixed wi th water, S t ruc tu res 11 and 111
can d i s s o c i a t e t o g ive a d i s t i n c t l y ac id cha rac t e r t o t h e water; S t ruc tu re I V
can hydrolyze t o y i e l d a base. Although q u a n t i t a t i v e chemical charac te r iza-
t i o n of t he 17 carbon samples with r e spec t t o the na tu re of t h e su r face w a s
beyond t h e scope of t he present program, some i n d i c a t i o n of t he sur face func-
t i o n a l i t y was obtained by mixing t h e carbon with water and measuring t h e pH.
One-gram samples of each of t he 17 carbons were placed i n approximately
50 mL of degassed, deionized water and mixed i n a high-speed blender f o r 1
minute under a n i t rogen atmosphere. The r e s u l t i n g suspension w a s allowed t o
se t t le f o r 10 minutes, and t h e pH of the so lu t ion w a s then determined using a
5
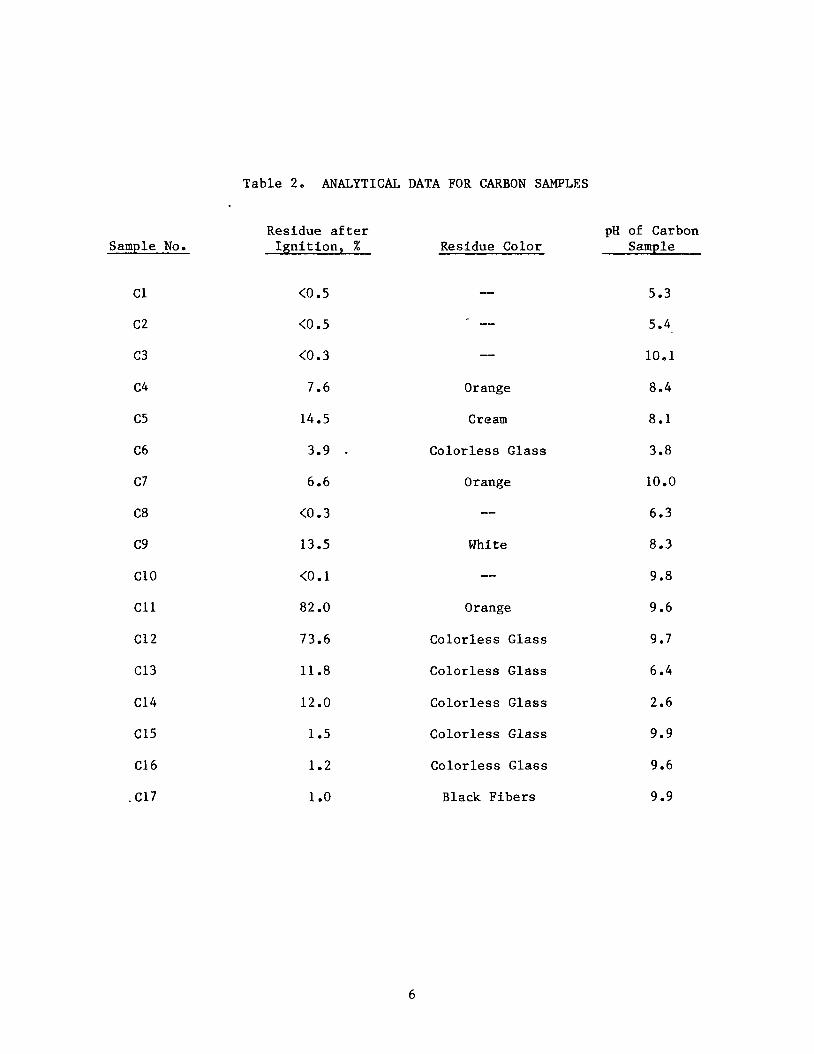
Table 2. ANALYTICAL DATA FOR CARBON SAMPLES
Residue a f t e r pH of Carbon Sample No. I g n i t i o n , X Residue Color Sample
c1
c2
c3
c4
c5
C6
c7
C 8
c9
c10
c11
c12
C13
C14
C15
C16
. C17
<O .5
<0.5
(0.3
7.6
14.5
3.9 - 6.6
<0.3
13.5
<0.1
82 .O
73.6
11.8
-- Orange
Cream
Colo r l e s s Glass
Orange
White
-- Orange
Co lo r l e s s Glass
Co lo r l e s s Glass
5.3
5.4
10.1
8.4
8.1
3.8
10.0
6.3
8.3
9 e8
9.6
9.7
6.4
12.0 Co lo r l e s s Glass 2.6
1.5 Co lo r l e s s Glass 9.9
1.2 Co lo r l e s s Glass 9.6
1 .o Black F i b e r s 9.9
6

O= kH 0 0 I I
HO
I rI
0 0
HO-C C-OH II II
O a H
0 0
-0
m Ip
F i g u r e 1. FOUR TYPES OF SURFACE STRUCTURES FOUND I N OXIDIZED CHARCOAL AS PROPOSED BY BOEM I N REFERENCE 3
7

Corning Model 476223 Semi Micro Combined Electrode and a Markson Scientific
Model 90 digital pH meter. The results are listed in Table 2. It should be noted that with those carbons having a high amount of residue after ignition, a substantial contribution to pH could come from sources other than carbon.
4. Surface Area Determination - Theory
The physical adsorption of gas molecules onto the surface of 'a solid
results from relatively weak interaction between molecules of the solid and molecules of the gas. This interaction is frequently referred to as van der Waal's forces. Physical adsorption contrasts with chemical adsorption, where chemical bonds are responsible for the interaction between solid and gas. In physi'cal adsorption, the quantity of adsorbed gas increases with decreasing temperature. In chemical adsorption, because it depends upon chemical reac- tion, the quantity of adsorbed gas decreases with decreasing temperature. For this reason, adsorption measurements to determine surface area or pore distri- bution are made at lower temperatures where physical adsorption predominates.
Brunauer, Emmett, and Teller (B.E.T.)4,5 have derived the following expression for relating the volume of gas adsorbed to the nature of the solid surface and the temperature and pressure of the gas:
vm CP - P) [l. + (C - 1) P/Psl v = a (Ps
where - Va = Volume of adsorbed gas
Vm = Volume of gas required to form a monolayer over entire surface
P = Pressure of gas
Ps = Equilibrium vapor pressure of gas and its liquid at temperature of ,measurement (760 torr at 77.35'K for nitrogen)
C = A constant dependent upon the nature of the solid adsorbent.
This expression describes the great majority of low-temperature adsorption data. Vm can be calculated from a series of physical measurements of the volume of gas adsorbed as a function of pressure at a fixed temperature by
rearranging Equation 1 to a linear form:
8
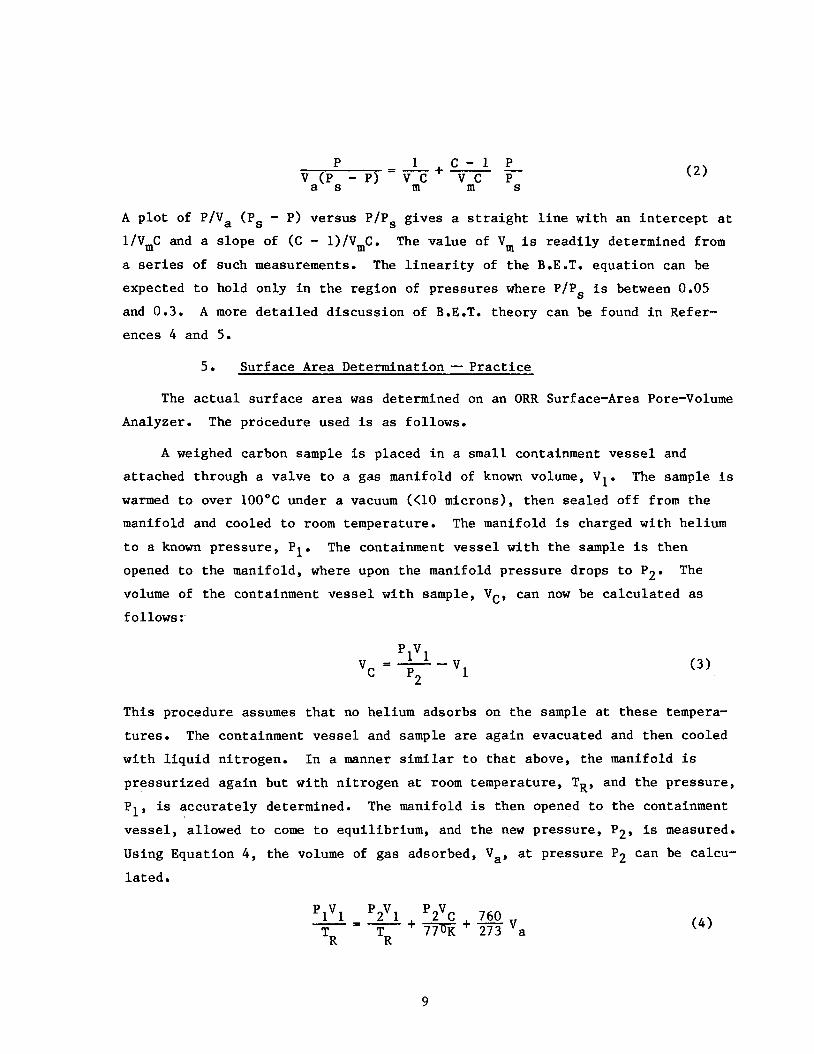
1 c - 1 P = - +- - S
P Va(Ps - P) vmc vmc P
A plot of P/Va (Ps - P) versus P/Ps gives a straight line with an intercept at l/VmC and a slope of (C - l)/V,C. a series of such measurements. The linearity of the B.E.T. equation can be expected to hold only in the region of pressures where P/Ps is between 0.05
and 0.3 .
ences 4 and 5.
The value of Vm is readily determined from
A more detailed discussion of B.E.T. theory can be found in Refer-
5. Surface Area Determination - Practice The actual surface area was determined on an ORR Surface-Area Pore-Volume
Analyzer. The procedure used is as follows.
A weighed carbon sample is placed in a small containment vessel and attached through a valve to a gas manifold of known volume, VI. warmed to over 100°C under a vacuum (<lo microns), then sealed off from the manifold and cooled to room temperature. The manifold is charged with helium
to a known pressure, PI. opened to the manifold, where upon the manifold pressure drops to P2. The volume of the containment vessel with sample, Vc, can now be calculated as follows :,
The sample is
The containment vessel with the sample is then
plvl =-- vc P2 ( 3 )
This procedure assumes that no helium adsorbs on the sample at these tempera- tures. The containment vessel and sample are again evacuated and then cooled with liquid nitrogen. In a manner similar to that above, the manifold is pressurized again but with nitrogen at room temperature, TR, and the pressure, P1, is accurately determined. vessel, allowed to come to equilibrium, and the new pressure, P2, is measured.
Using Equation 4 , the volume of gas adsorbed, Va, at pressure P2 can be calcu- lated.
The manifold is then opened to the containment
'1'1 '2'1 '2'C 760 +m+TE a
- = -
TR TR ( 4 )
9

The process is then repeated f o r s eve ra l incremental add i t ions of n i t rogen
gas , with a d d i t i o n a l t e r m s being added t o Equation 4 t o account f o r t h e f a c t
t h a t the i n i t i a l p ressure is no longer zero. I n t h i s way, s eve ra l simultane-
ous values f o r Va and P2 can be generated from which a B.E.T. p l o t can be con-
s t r u c t e d using Equation 2.
The above d iscuss ion is somewhat s impl i f i ed i n t h a t we have neglected
seve ra l co r rec t ions t o Va t h a t must be included because of t h e nonideal
behavior of n i t rogen and because of p e c u l i a r i t i e s of t h e instrument i t s e l f .
But once a cor rec ted B.E.T. p l o t i s made u s i n g ' t h e var ious Va versus P2/Ps d a t a poin ts , the s p e c i f i c su r face area of the sample may be ca l cu la t ed from
the fol lowing formula:
M.A. x N S p e c i f i c Surface Area = M.V. (Slope + I n t e r c e p t )
where - M.A. = Molecular area i n cm2 (16.2 X cm2 f o r n i t rogen)
N = Avogadro's number
M.V. = Molar volume i n cm 3
This equat ion can be s impl i f i ed t o Equation 6 f o r ni t rogen:
4.35 Slope + I n t e r c e p t S p e c i f i c Surface Area =
The r e s u l t s f o r t he s p e c i f i c su r face area determinat ions f o r t h e 17 carbon
samples are l i s t e d i n Table 3. It should be noted t h a t with high su r face area
samples where Vm is l a r g e , t h e s lope and the i n t e r c e p t become s m a l l , thus in-
c reas ing measurement e r r o r . Although the s p e c i f i c su r face areas are given t o
th ree s i g n i f i c a n t f i g u r e s i n Table 3, the r e l a t i v e e r r o r f o r these measure-
ments may be as much as &lo%.
6 . Packing Density
The packing dens i ty of t he adsorbent , def ined he re as t h e mass i n grams
of one cubic cent imeter of s e t t l e d ma te r i a l , is one of the cr i t ical parameters
assoc ia ted wi th the use of adsorbents f o r CNG s to rage i n automotive vehic les .
Packing dens i ty can be convenient ly measured by p lac ing a weighed amount of
material i n a graduated cy l inde r and v ib ra t ing the cy l inde r a rate of 100 .Hz
10

Sample Designation
c1 c2
c3
c4
c5
C6
c7
C8
c9
c10
c11
c12
C13
C14
C15
C16
C17
Table 3. SPECIFIC SURFACE AREA, APPARENT DENSITY, AND SURFACE AREA PER LITER FOR 17 CARBON SAMPLES
S p e c i f i c Surface Area, m2/g
76
74
1600
1030
700
1610
1260
480
1030
1050
1270
1100
1680
1650
1420
1370
1280
Packing Density, g/cm3
0.10
0.20
0.13
0.44
0.45
0.30
0.45
0.37
0.56
0.45
0.44
0 -47
0.30
0.30
0.50
0.50 ,
0.32
Surfac Area, k m /L 'i.
0.008
0.015
0.21
0.45
0.32
0.48
0.57
0.18
0.58
0.47
0.56
0.52
0.50
0.50
0.71
0.69
0.41
11
o r higher f o r s e v e r a l minutes t o allow t h e sample t o set t le under t h e in f lu -
ence of g rav i ty . Packing dens i ty measured i n t h i s way can be used t o calcu-
l a t e t h e quan t i ty of material t h a t can be placed i n a s torage cy l inder from a
free-flowing r e se rvo i r . Table 3 l i s ts t h e packing dens i ty of t h e 17 carbon
samples i n grams per cubic centimeter. The s p e c i f i c su r face a rea and the
packing dens i ty can a l s o be used t o estimate the su r face area a v a i l a b l e f o r
s torage i n a 1-liter conta iner f i l l e d wi th carbon. The f i n a l column of
Table 3 conta ins such es t imates f o r the var ious carbon samples.
7. Par t ic le S ize -Ac t iva t ed Carbon P e l l e t s
A l l of t he a c t i v a t e d carbons suppl ied t o us were i n the form of pe l le i s
o r granules while t he carbon blacks were i n the form of powders. I n the csze
of the ac t iva t ed -ca rbons , t he p a r t i c l e s i z e s f e l l w i th in narrow l i m i t s which
is l i k e l y t h e r e s u l t of a screening s t e p i n t h e i r manufacture. The var ious
s u p p l i e r s prclvided us wi th information on the upper and lower l i m i t s of par-
t i c l e s ize f o r each sample as measured i n U.S. mesh. Table 4 i s a p a r t i c l e
s i z e conversion t a b l e comparing the U.S. mesh s i z e wi th the equiva len t par-
t i c l e diameter i n microns. This t a b l e is included s o l e l y f o r convenience.
Table 5 conta ins a l i s t of t he 17 carbon samples and t h e maximum and minimum
mesh s i z e s f o r t h e 13 a c t i v a t e d carbons. Because b e t t e r than 95% of t h e par-
t ic les i n any given sample f e l l w i th in t h e narrow l i m i t s of s i z e l i s t e d by the
r e spec t ive s u p p l i e r , no f u r t h e r a t t e m p t was made t o determine a p a r t i c l e s i z e
d i s t r i b u t i o n f o r the a c t i v a t e d carbon samples.
8. Par t ic le S ize D i s t r i b u t i o n - Carbon Black Powders
The p a r t i c l e s i z e d i s t r i b u t i o n s f o r t h e four carbon black samples were
determined on an automated Coulter counter. Table 6 l is ts the r e s u l t s f o r
50% dense Shawinigan Acetylene Black. These r e s u l t s do not' agree wi th the
par t ic le s i z e d i s t r i b u t i o n provided by t h e manufacturer. When viewed under an
e l e c t r o n microscope, Shawinigan Acetylene Black appears t o cons i s t of spheri-
cal par t ic les clumped toge ther i n much l a r g e r agglomerates. The median par-
t i c l e s i z e f o r t hese spheres as determined from a micrograph is 42.5 nm
whereas the mean agglomerate s i z e as determined by t h e Coulter counter i s 23
um o r about 540 times larger. Since it i s the agglomerate s i z e r a t h e r than
the par t ic le s i z e which determines handling c h a r a c t e r i s t i c s such as packing
dens i ty , t h e agglomerate s i z e d i s t r i b u t i o n is the more important parameter.
Table 7 l i s ts the agglomerate s i z e d i s t r i b u t i o n f o r 100% dense Shawinigan
. ,
1 2

Mesh Size -
4
6
8
1 2
16
20
30
40
50
60
70
80
100
140
200
230
270
325
400
625
1250
2500
Table 4. PARTICLE SIZE CONVERSION TABLE
Approximate Size in Microns*
4760
3360
2380
1680
1190
840
590
420
297
250
2 10
177
149
105
74
62
53
44
37
20
10
5
* 1 nun = 1000 microns.
13

c1 c2
c3
c4
c5
C6
c7
C8
c9
c10
c11
c12
C13
C14
C15
C16 C17
Table 5 . PARTICLE SIZE DISTRIBUTION BY MESH SIZE
Carbon
Shawinigan 50%
Shawinigan 100%
Cab0 t CSX-17 9-B
I C 1 DXL-0-8334
I C 1 DARCO-SG
Nuchar WV-B
Nuchar WV-G
Baker Acid Washed
CECA GAC-5OG
Witcarb J X C
Calgon PCB
Calgon BPL
North American G l O l
North American G104
North American 6210
North American G216 Union Carbide 9LXC
S ize
( s e e Table 6)
(see Table 7)
( s e e Table 8)
20 x 60 mesh .
20 x 60 mesh
14 x 35 mesh
12 x 14 mesh
( see Table 9 )
20 x 50 mesh
4 x 6 mesh
30 x 140 ,mesh
30 x 140 mesh
10 x 25 mesh
14 x 35 mesh
8 x 16 mesh
14 x 35 mesh 12 x 28 mesh
14

Table 6 . PARTICLE SIZE DISTRIBUTION FOR 50% DENSE SHAWINIGAN ACETYLENE BLACK
S i z e Range
Less than 4 microns
4.0 to 5.0 microns
5.0 t o 6.4 microns
6.4 t o 8.0 microns
8.0 t o 10.1 microns
10.1 t o 12.7 microns
12.7 t o 16.0 microns
16.0 t o 20.2 microns
20.2 t o 25.4 microns
25.4 t o 32.0 microns
32.0 t o 40.3 microns
40.3 to 50.8 microns
Larger than 50.8 microns,
Weight Percent
0
1.1
2.4
4.4
5.9
6.5
7.6
11.2
16 .O
20.4
13.7
6.9
3 09
15
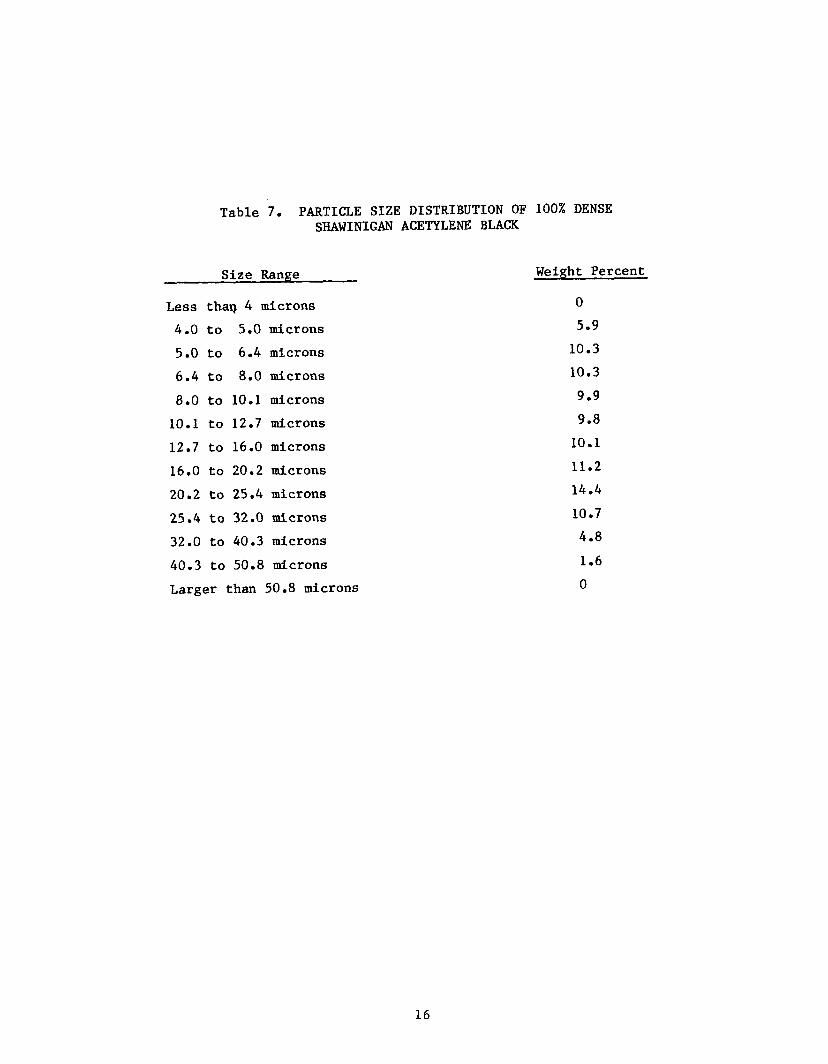
Table 7. PARTICLE SIZE DISTRIBUTION OF 100% DENSE SHAWINIGAN ACETYLENE BLACK
Size Range
Less thaq 4 microns
4.0 t o 5.0 microns
5.0 t o 6.4 microns
6.4 t o 8.0 microns
8.0 to 10.1 microns
10.1 t o 12.7 microns
12.7 to 16.0 microns
16.0 to 20.2 microns
20.2 to 25.4 microns
25.4 t o 32.0 microns
32.0 to 40.3 microns
40.3 to 50.8 microns
Larger than 50.8 microns
Weight Percent
0
5.9
10.3
10.3
9.9
9.8
10.1
11.2
14 04
10.7
4.8
1.6
0
16

Acetylene Black; Table 8, f o r Cabot Corporation carbon black CSX-179-B; and
Table 9, the agglomerate s i z e d i s t r i b u t i o n f o r Baker-Acid Washed Carbon.
9. Cumulative Pore Volume
Both n i t rogen adsorp t ion and desorp t ion isotherms were determined at 78'K
f o r a l l carbon samples and the r e s u l t s used t o estimate the cumulative pore
volume of each sample and t o ascertain t h e pore s i z e d i s t r i b u t i o n . Table 10
l is ts 16 carbon samples and t h e cumulative pore volume of a l l pores less than
200 Angstroms i n radius . It should be noted t h a t our cumulative numbers have
a cut-off f o r maximum pore r ad ius a t 200 Angstroms and, t he re fo re , pores l a r g e r
than 200 8 are ignored, s i n c e the i n t e r i o r sur faces of pores l a r g e r than 2008
i n rad ius would be l i t t l e d i f f e r e n t from f l a t sur faces . However, as a conse-
quence, our cumulative pore volume may d i f f e r somewhat from t h e t o t a l pore
volume numbers adve r t i s ed f o r these carbons by t h e i r var ious manufacturers.
It can be seen from Table 10 t h a t Cabot's CSX-179-B h i s t h e h ighes t cumu-
l a t i v e pore volume of t h e carbon blacks, while Nuchar WV-B is h ighes t among
t h e ac t ivased carbons. Of p a r t i c u l a r i n t e r e s t are the four North American
Carbon, Inc., samples. The 100 series samples have high cumulative pore
volume while t h e 200 series have t h e lowest measured.
10. Pore S ize D i s t r i b u t i o n
The n i t rogen desorp t ion isotherm d a t a were used t o p l o t pore s i z e d i s t r i -
but ions f o r 16 of t h e carbon samples. Subsequent work ind ica ted no i d e n t i f i -
a b l e r e l a t i o n s h i p between pore s i z e d i s t r i b u t i o n and methane s torage capaci ty .
Ind iv idua l p l o t s of pore s i z e d i s t r i b u t i o n as pore volume versus pore r ad ius
are provided i n Appendix A f o r carbons C1 through C16.
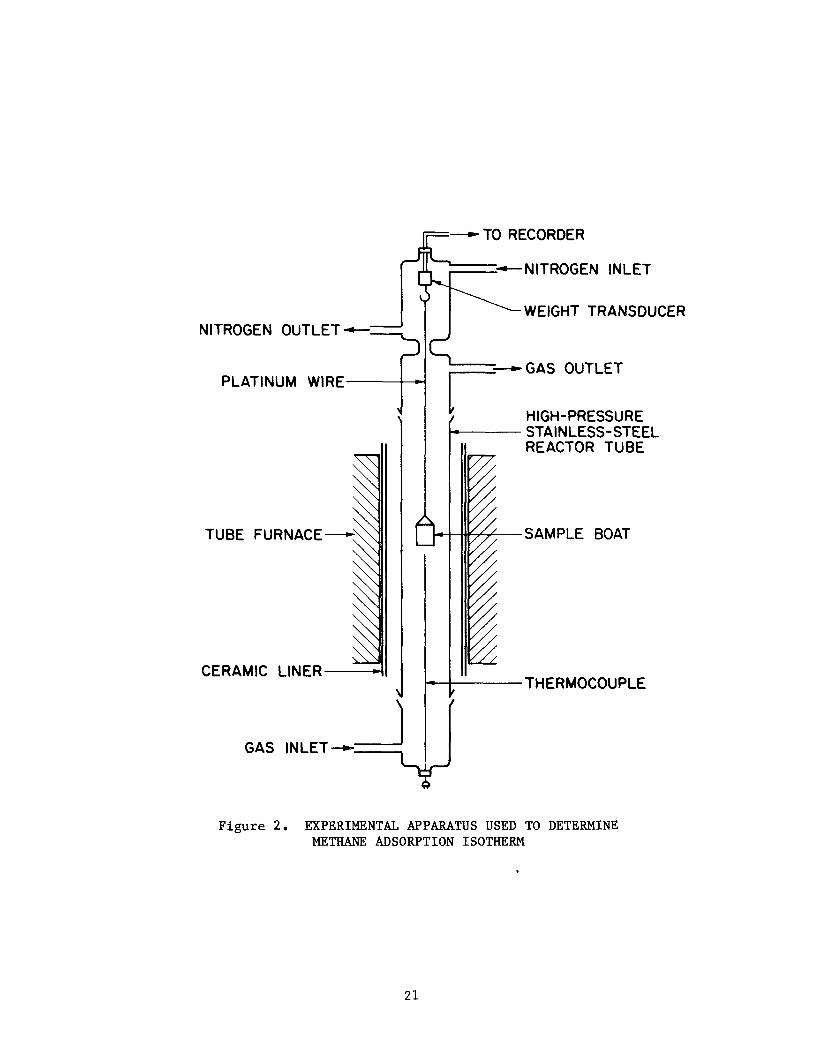
11. Methane Adsorption Isotherms f o r Carbons
Figure 2 is a schematic diagram of t h e apparatus used t o determine the
methane adsorp t ion isotherms f o r s e l e c t e d carbon and z e o l i t e samples. The
experimental technique used was t o suspend a measured quan t i ty of adsorbent
from an e l e c t r o n i c t ransducer type balance i n a methane atmosphere and de ter -
mine the weight of t h e sample as t h e v e s s e l i s pressur ized from 101.4 KPa (0
ps ig) t o 3.6 MPa (500 ps ig) i n 50 p s i s t eps . Weight changes as l i t t l e as 1
p a r t i n 2000 can be measured wi th t h i s apparatus. However, it is necessary t o
make co r rec t ions on t h e ind ica ted weight f o r t h e buoyancy of t he sample. The
fol lowing may serve as an example. I n t h e carbon experiments, a sample of J X C
17

Table 8. PARTICLE SIZE DISTRIBUTION FOR CABOT CSX- 17 9-B
S i z e Range
Less than 4 microns
4.0 t o 5.0 microns
5.0 t o 6.4 microns
6.4 t o 8.0 microns
8.0 t o 10.1 microns
10.1 t o 12.7 microns
12.7 t o 16.0 microns
16.0 t o 20.2 microns
20.2 t o 25.4 microns
25.4 t o 32.0 microns
32.0 t o 40.3 microns
40.3 t o 50.8 microns
Larger than 50.8 microns
Weight Percent
0
7.7
12.5
14 .O 15.4
14.7
11.8
8.2
4.9
2.7
1.5
0.8
5.8
18
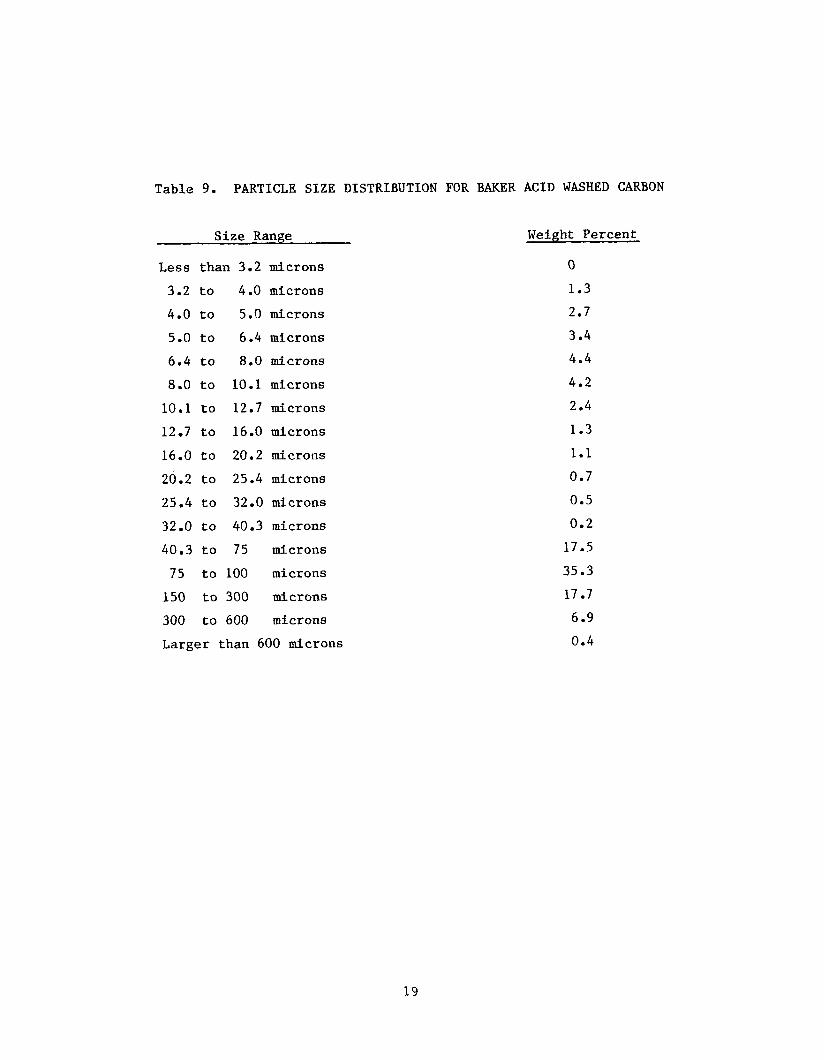
Table 9. PARTICLE SIZE DISTRIBUTION FOR BAKER ACID WASHED CARBON
Size Range
Less than 3.2 microns
3.2 to 4.0 microns
4.0 to 5.0 microns
5.0 t o 6.4 microns
6.4 t o 8.0 microns
8.0 to 10.1 microns
10.1 t o 12.7 microns
12.7 t o 16.0 microns
16.0 t o 20.2 microns
20.2 to 25.4 microns
25.4 to 32.0 microns
32.0 t o 40.3 microns
40.3 to 75 microns
75 to 100 microns
150 to 300 microns
300 t o 600 microns
Larger than 600 microns
Weight Percent
0
1.3
2.7
3 04
4.4
4.2
2.4
1.3
1.1
0.7
0.5
0.2
17.5
35.3
17.7
6 .9
0.4
19

Number
c1 c2 c3
c4 c5 C6 c7 C8 c9 c10 c11 c12 C13 C14
C15 C16
Table 10. * CUMULATIVE PORE VOLUME FOR PORES OF RADIUS LESS THAN 200 ANGSTROMS
Carbon
Shawinigan 50%
Shawinigan 100% Cabot CSC-179-B
IC1 DXL-0-8334 IC1 DARCO-SG Nuchar WV-B Nuchar WV-G Baker Acid Washed CECA GAC-50G Witcarb JXC Calgon P.CB Calgon BPL North American GlOl North American G104 North American G210 North American G216
Pore Volume
0.10 ml/g 0.11 mug 0.99 ml/g 0.17 ml/g 0.53 ml/g 0.66 ml/g 0.14 ml/g 0.82 ml/g
0.09 ml/g 0.13 ml/g 0.05 ml/g 0.09 ml/g
0.54 ml/g 0.58 ml/g 0.024 ml/g
0.026 ml/g
20
F- TO RECORDER
NITROGEN OUTLET - PLAT IN U M WIRE
INLET
WEIGHT TRANSDUCER
<-GAS OUTLET
I- HIGH-PRESSURE STAINLESS- STEEL REACTOR TUBE
TUBE FURNACE SAMPLE BOAT
THERMOCOUPLE CERAMIC LINER
GAS INLET-
Figure 2. EXPERIMENTAL APPARATUS USED TO DETERMINE METHANE ADSORPTION ISOTHERM
2 1

carbon weighing 10.076 grams under one atmosphere pressure (101.3 KPa) of methane was pressurized to 35 atmospheres (3.6 MPa). Using the adsorption
isotherm data previously obtained, we would expect this sample to gain 0.856 gram in weight due to methane adsorption. The microbalance, however, indi-
cated a gain of only 0.746 gram. The difference, 0.11 gram, is due to buoyancy effects. actual volume of only 4.80 cc and displaces 0.110 gram of methane at 35 atmo- spheres. The key to calculating the buoyancy correction is the actual density
of the solid material. Witco's JXC carbon (C10) has a packing density of only 450 grams/liter; however, almost 80% of a sample of JXC is accessible void
space which can fill with compressed gas and does not contribute to buoyancy. In the case of most of the carbon samples, the solid material contributing to buoyancy effects can be considered to have an effective density equal to that of graphite, 2100 grams/liter.
The carbon in a 10.076 gram sample of JXC carbon has an
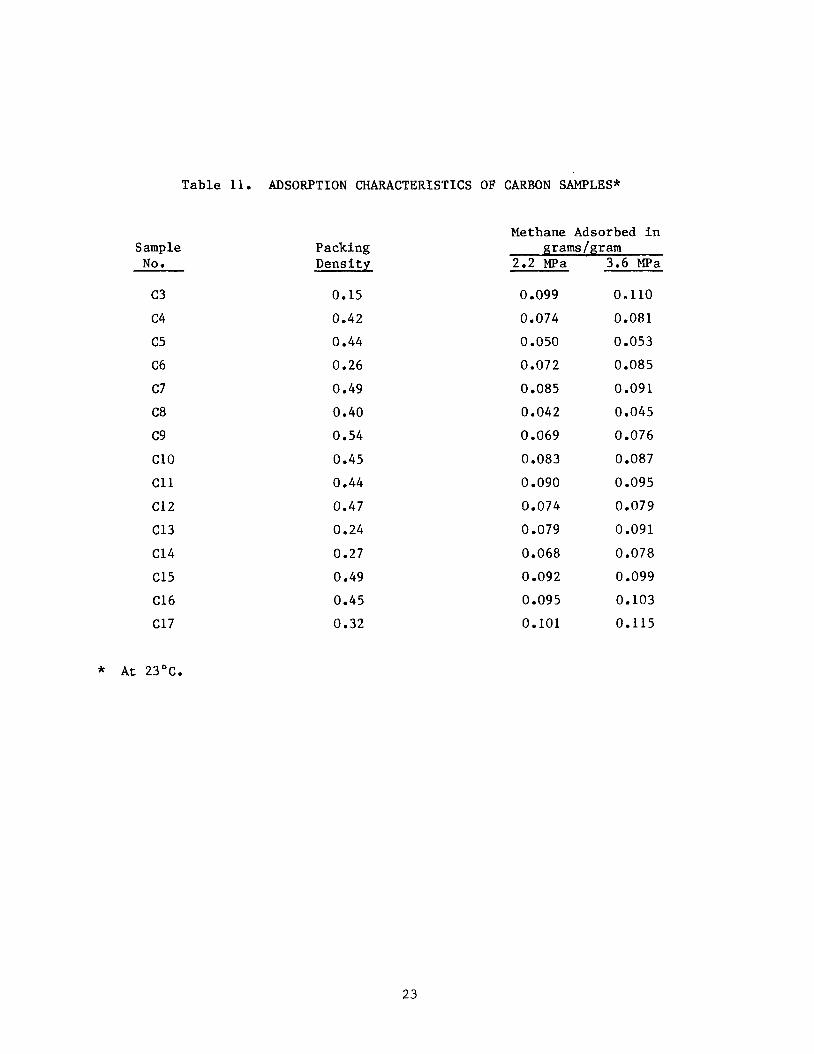
Adsorption isotherms for each of the carbons C3 through C17 are provided in Appendix B. Table 11 summarizes the results. others are working with adsorption systems operating at about 2.2 MPa (300 psig), we have reported data for methane adsorption at this pressure in Table 11. which is the maximum pressure used in the present study. Because of the par-
ticulate nature of the Shawinagan Acetylene Blacks, these carbons tended to €luidize during depressurization of the microbalance and reliable adsorption
measurements were not possible for Samples C1 and C2.
Since Ford Motor Co.' and
We have also included data for methane adsorption at 3.6 MPa (500 psig)
B. Experimental Effort - Molecular Sieves 1. Description of Samples
Zeolites. Six samples of commercially available crystalline molecular sieves were obtained from the Linde Division of Union Carbide.. Four of these
samples are zeolites of the Sodalite Group, one sample is of the Chabazite
Group, and one sample is of the Mordenite Group. One additional sample was prepared by ion exchange, Table 12 lists the samples by experimental designation (Zl through 27) and provides information on structure, critical
diameter, and nonframework cation.
22
Sample NO s
Table 11. ADSORPTION CHARACTERISTICS OF CARBON SAMPLES*
Methane Adsorbed in
c3 c4 c5 C6 c7 C8 c9 c10 c11 c12 C13 C14 C15 C16 C17
Packing Density
0.15 0.42 0.44 0.26
0.49 0.40 0.54 0.45 0.44 0.47 0.24 0.27 0.49 0.45 0.32
grams/gram 2.2 Wa 3.6 W a
0.099 0.074 0.050 0.072 0.085 0.042 0.069 0.083 0.090 0.074 0 -079 0.068
0.092 0.095 0.101
0.110 0.081 0.053 0.085 0.091 0.045 0.076 0.087 0.095 0.079 0.091 0.078 0.099 0.103 0.115
* At 23'c.
23

Table 12. INFORMATION ON VARIOUS ZEOLITES
Linde Critical Nonframework Designation Structure Designation Diameter, 8 Cat ion
z1 22 23 24 25 26 27
Zeolite A 3A 3 Zeolite A 4A 4 Zeolite A 5A 5 Zeolite X 13X 10
11 Zeolite A -- 'Mor deni t e AW-300 3 to 4 Chabaz ite AW-500 4 to 5
Potassium Sodium Ca 1 cium Sodium Lithium Mixed Mixed
The structure of the Sodalite Group, Zeolite A, is based on frameworks that are simple arrangements of truncated octahedra. These truncated octa-
hedra share square and hexagonal faces. In the structure of Zeolite A, the octahedra are linked by adjoining cubes (Figure 3). This produces a central truncated octahedron with an internal cavity of 118 diameter. Access to this cavity is by way of the six apertures, which are the cubes with a free diameter of 4.28. In Zeolite A of the formula Na2[(A102)12(Si02)12]027 H20,
there are 12 nonframework sodium ions per unit cell. Eight of these sodium ions reside in the center of the eight hexagonal faces and are referred to as Type I cations. The other four cations, Type 11, occupy positions adjacent to the openings that interconnect the cavities. When completely hydrated, these four ions probably float within a coordination sphere of water molecules; but
when dehydrated, they locate on the walls of the cavity and exert an influence on the critical diameter of the opening between cavities. The critical
diameter is, for our purposes, the largest diameter a gas molecule can have and still pass between cavities. As is illustrated in Table 12, the large diameter of the potassium ion (2.668) restricts the critical diameter in Type A zeolites to 38. Thus, methane with a kinetic diameter of 3.88 cannot gain
access to the interior of the cavity, whereas water molecules with a kinetic dfintteter of 2.658 can be admitted. ions (sodium and lithium, having ionic diameters of 1.90A and 1.368, respec- tively) increase the critical diameter to 48 and thus permit methane to enter the cavity. Dipositive calcium ions increase the critical diameter to 58
partly because of size, 1.988, and partly by perturbing the framework itself. The Type X zeolites, on the other hand, have a different crystallographic morphology in which adjacent cavities share large hexagonal openings. Type X
Type A zeolites with smaller nonframework
24
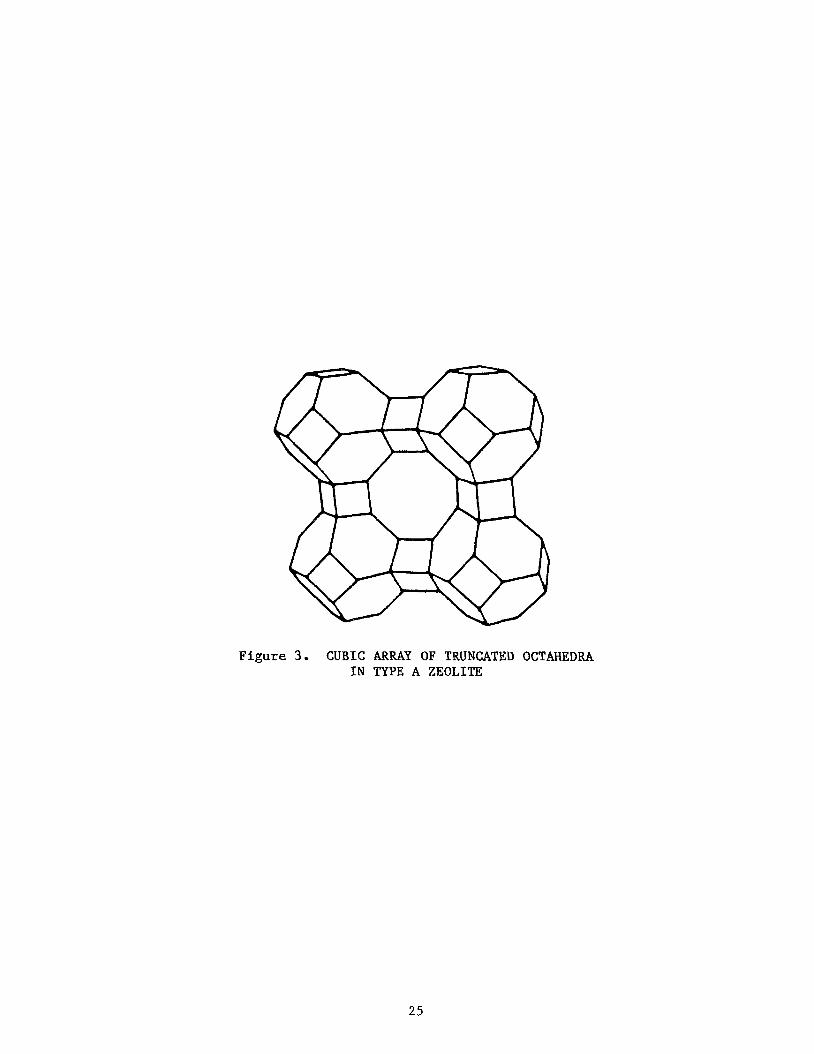
Figure 3 . CUBIC ARRAY OF TRUNCATED OCTAHEDRA I N TYPE A ZEOLITE
25
zeolites have a critical diameter of 108. In dehydrated chabazite, the cavi- ties share ellipsoidal apertures with dimensions of 4.48 by 3.18. The zeolite
mordenite possesses a predominance of 5-member rings that align to form circu- lar channels with a free diameter of 6.68. This structure is sensitive to stacking faults, however, which can reduce the large-channel diameter from 6.6 to 48. A more detailed discussion of crystalline molecular sieves can be found in Reference 6. Of importance here is that the nonframework cations in both Type A and Type X zeolites can easily be exchanged. Thus, lithium- containing Type A zeolite can be prepared from sodium-containing material (Linde 4A).
The phenomenon of ion exchange was used to prepare Sample 25. The fol- lowing procedure was used.
One hundred grams of Linde 4A molecular sieves were placed in a 1-liter flask fitted with a reflux condenser, and 500 mL, of a 0.1M lithium chloride solution was added. The mixture was heated to 8OoC and maintained at this temperature for 24 hours with occasional gentle agitation. After 24 hours,
the LiCl solution was drained and replaced with 500 of fresh LiCl solution and reheated. This process was repeated through four consecutive 24-hour treatments. The zeolite was then recovered and washed 10 times with 500 mT.,
each of deionized water, drained, and allowed to air dry for 24 hours at room
temperature. for 1 week, at 36OOC in air for 24 hours, and at 36OOC for 24 hours under vacuum (<lo microns). The vacuum flask was finally cooled and pressurized with dry argon to 1 atm. The lithium-containing zeolite was then loaded into
an airtight container under an argon atmosphere and stored for later use.
The lithium-containing zeolite was then dried at 200°C in air
2. Adsorption Isotherms
All zeolite samples were dried prior to determining their adsorption isotherm. ' The drying process used was that of heating the sample to 36OOC for
24 hours under a continually increasing vacuum which was below 10 microns
pressure at the end of the 24 hour period. The samples were cooled under vacuum and then pressurized to 1 atmosphere with dry argon. The sample was transported to the microbalance under argon and quickly transferred to the sample pan in a manner designed to limit its exposure to moisture laden air (ambient laboratory conditions) to a few minutes.
26
A problem was encountered when at tempts were made t o c a l c u l a t e a correc-
t i o n f a c t o r f o r buoyancy.
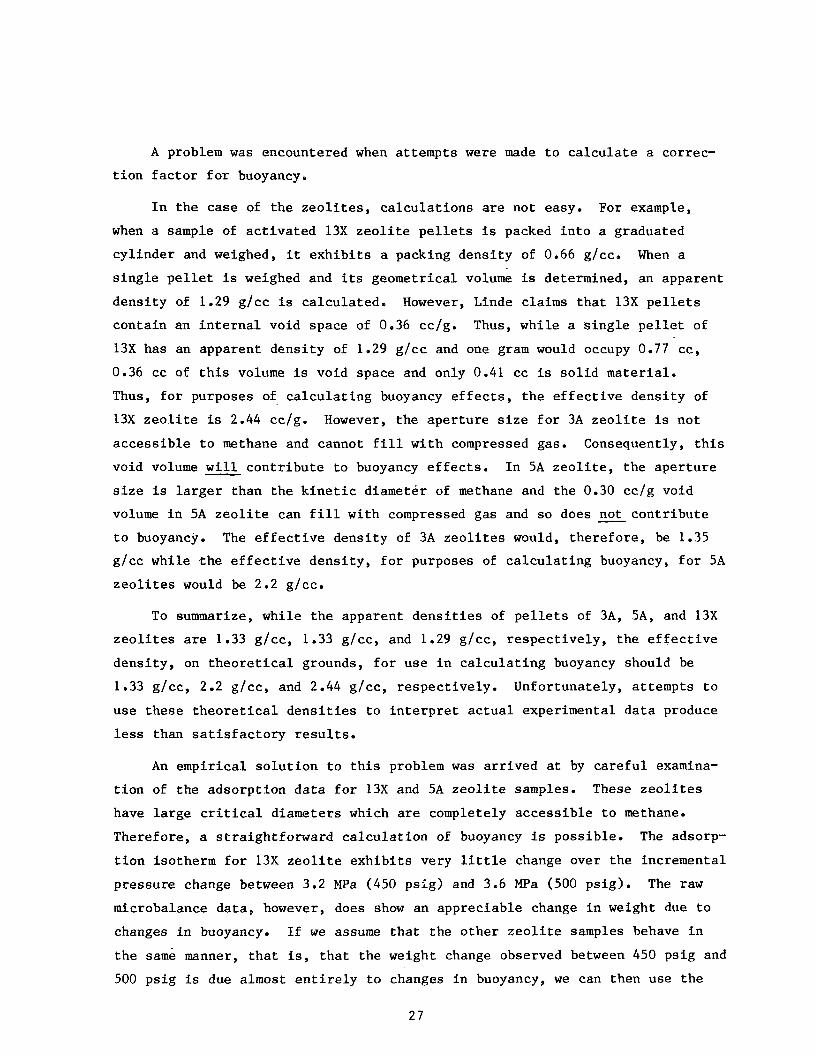
I n t h e case of t he z e o l i t e s , ca l cu la t ions are not easy. For example,
when a sample of a c t i v a t e d 13X z e o l i t e p e l l e t s i s packed i n t o a graduated
cy l inder and weighed, it e x h i b i t s a packing dens i ty of 0.66 g/cc. When a
s i n g l e p e l l e t i s weighed and i t s geometr ical volume is determined, an apparent
dens i ty of 1.29 g/cc i s ca lcu la ted . However, Linde claims t h a t 13X p e l l e t s
contain an i n t e r n a l void space of 0.36 cc/g.
13X has an apparent dens i ty of 1.29 g /cc and one gram would occupy 0.77 cc,
0.36 cc of t h i s volume is void space and only 0.41 cc is s o l i d material.
Thus, f o r purposes of c a l c u l a t i n g buoyancy e f f e c t s , t h e e f f e c t i v e dens i ty of
13X z e o l i t e i s 2.44 cc/g. However, the ape r tu re s i z e f o r 3A z e o l i t e i s no t
access ib l e t o methane and cannot f i l l w i th compressed gas. Consequently, t h i s
void volume w i l l con t r ibu te t o buoyancy e f f e c t s . I n 5A z e o l i t e , t h e ape r tu re
s i z e i s l a r g e r than t h e k i n e t i c diameter of methane and the 0.30 cc/g void
volume i n 5A z e o l i t e can f i l l wi th compressed gas and so does = c o n t r i b u t e
t o buoyancy. The e f f e c t i v e dens i ty of 3A z e o l i t e s would, t he re fo re , be 1.35
g/cc while t h e e f f e c t i v e dens i ty , f o r purposes of c a l c u l a t i n g buoyancy, f o r 5A
z e o l i t e s would be 2.2 g/cc.
Thus, while a s i n g l e p e l l e t of
To sumnarize, while t h e apparent d e n s i t i e s of p e l l e t s of 3A, SA, and 13X
z e o l i t e s are 1.33 g/cc, 1.33 g/cc, and 1.29 g/cc, r e spec t ive ly , t he e f f e c t i v e
dens i ty , on t h e o r e t i c a l grounds, f o r use i n c a l c u l a t i n g buoyancy should be
1.33 g/cc, 2.2 g/cc, and 2.44 g/cc, r e spec t ive ly . Unfortunately, a t tempts t o
use these t h e o r e t i c a l d e n s i t i e s t o i n t e r p r e t a c t u a l experimental d a t a produce
less than s a t i s f a c t o r y r e s u l t s .
An empir ica l s o l u t i o n t o t h i s problem w a s a r r ived a t by c a r e f u l examina-
t i o n of the adsorp t ion d a t a f o r 13X and 5A z e o l i t e samples. These z e o l i t e s
have 1arg.e c r i t i ca l diameters which are completely access ib l e t o methane.
Therefore, a s t ra ight forward c a l c u l a t i o n of buoyancy is possible . The adsorp-
t i o n isotherm f o r 13X z e o l i t e e x h i b i t s very l i t t l e change over t he incremental
p r e s s u r e change between 3.2 MPa (450 ps ig) and 3.6 MF'a (500 ps ig) . The r a w
microbalance da ta , however, does show an apprec iab le change i n weight due t o
changes i n buoyancy. I f we assume t h a t the o the r z e o l i t e samples behave i n
t h e same manner, t h a t is , t h a t t he weight change observed between 450 ps ig and
500 ps ig is due almost e n t i r e l y t o changes i n buoyancy, we can then use t h e
27
raw microbalance data as a direct measurement of the buoyancy and eliminate the need for a calculated value.
The relative errors introduced by this assumption are cumulative. In other words, a 1% relative error in estimating the buoyancy between 450 psig and 500 psig becomes a 10% relative error over the entire range of pressures measured (0 to 500 psig). As a consequence, we cannot have a high degree of confidence in th’e adsorption isotherms for 3A, 4A, AW-300, and AW-400. However, since the performance of these materials falls far short of the performance of the 5A zeolites, they are effectively eliminated from consideration as an advanced concept for methane storage anyway and no harm is done.
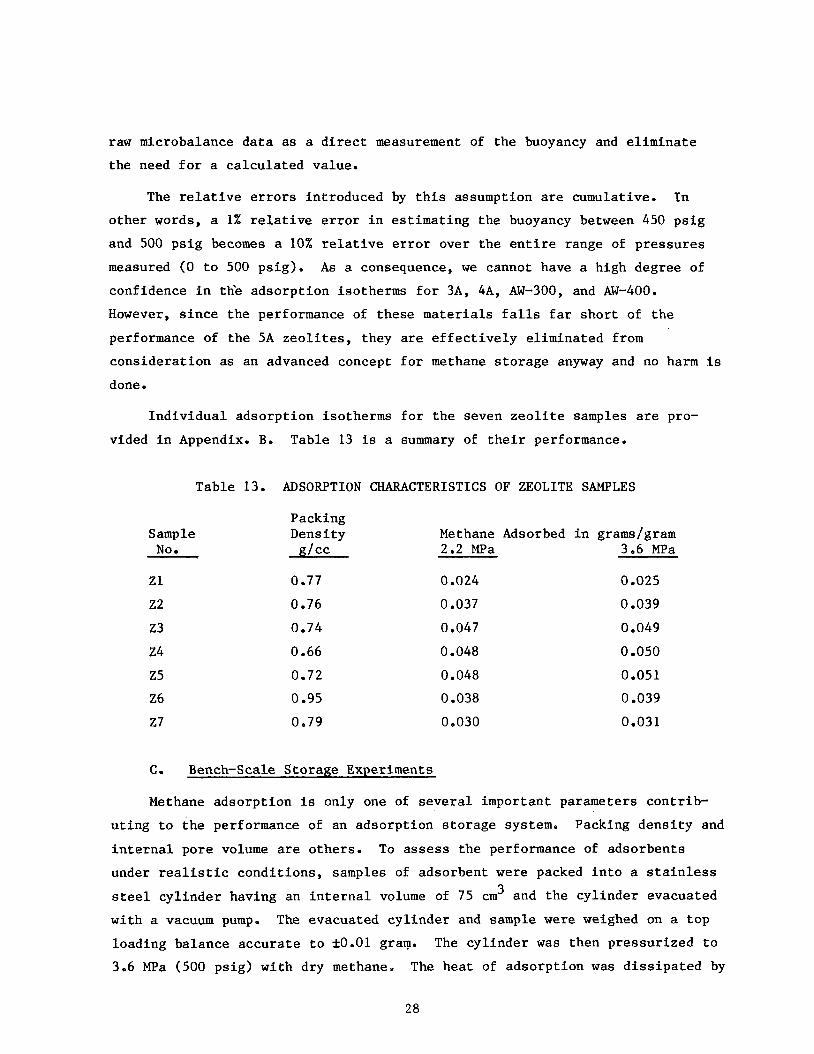
Individual adsorption isotherms for the seven zeolite samples are pro- vided in Appendix. B. Table 13 is a summary of their performance.
Table 13. ADSORPTION CHARACTERISTICS OF ZEOLITE SAMPLES
Packing Sample Density Methane Adsorbed in grams/gram NO d c c 2.2 MPa 3.6 MPa
Zl 22 23
24 25 26
27
C.
0.77 0.76 0.74
0.66 0.72 0.95 0.79
Bench-Scale Storage Experiments
0 -024
0.037
0.047 0 -048 0.048 0.038 0.030
0.025
0.039 0.049 0.050 0.051 0.039 0.031
Methane adsorption is only one of several important parameters contrib- uting to the performance of an adsorption storage system.
internal pore volume are others. To assess the performance of adsorbents under realistic conditions, samples of adsorbent were packed into a stainless
steel cylinder having an internal volume of 75 cm3 and the cylinder evacuated with a vacuum pump. loading balance accurate to fO.O1 gram. 3.6 MPa (500 psig) with dry methane.
Packing density and
The evacuated cylinder and sample were weighed on a top The cylinder was then pressurized to
The heat of adsorption was dissipated by
28
blowing a i r a t 25OC over t h e cy l inde r f o r two hours while maintaining a con-
s t a n t p re s su re with a high pressure r egu la to r . The cy l inde r w a s then reweighed.
This provided a d i r e c t measure of t h e t o t a l mass of methane s to red a t 3.6 MPa
and includes both t h a t po r t ion s to red by adsorpt ion and t h a t po r t ion s t o r e d by
compression i n t h e void spaces. The mass (g) of methane s to red per u n i t
volume (L) is he re def ined as methane s t o r a g e capaci ty . The dependence of
methane s to rage capaci ty upon packing dens i ty and s p e c i f i c adsorpt ion is
i l l u s t r a t e d f o r s e l e c t e d samples i n Figure 4 . The s o l i d l i n e s represent a
locus of p o i n t s determined by the the t h e o r e t i c a l r e l a t i o n s h i p between packing
dens i ty and methane s t o r a g e f o r carbons having s p e c i f i c adsorpt ions of 0.165,
0.115, 0.100, and 0.085 g/g a t 3.6 MPa (35 a t m o r 500 p s i g ) a t 25°C. Actual
experimentally determined values f o r carbon C6, C10, C15, C15C, and C17 are
a l s o p l o t t e d i n Figure 4. I n Reference 7 , Amos Golovoy r e p o r t s success i n
inc reas ing t h e packing dens i ty of 9LXC by crushing the p e l l e t s . The s t o r a g e
capac i ty a t 3.6 MF'a and packing dens i ty reported by Golovoy are p l o t t e d i n
Figure 7 as Po in t R1. The same procedure w a s appl ied by IGT t o i nc rease t h e
apparent d e n s i t y of Sample C15. A 50 gram sample of t h i s carbon w a s placed i n
a hydraul ic p re s s and crushed a t a pressure of 1000 p s i ( 7 . 3 MPa). The broken
p e l l e t s were then placed i n a mortar and fragmented f u r t h e r with a p e s t l e
using a rocking motion r a t h e r than a gr inding motion.
number of f i n e p a r t i c l e s w i th a minimum amount of powder. This carbon w a s
then d r i ed a t 14OOC i n a vacuum oven and the methane adsorpt ion isotherm w a s
determined. Although the crushed carbon sample now exh ib i t ed a packing
dens i ty of 0.58 g/cc, t h e adsorpt ion isotherm f o r t h i s carbon w a s i d e n t i c a l t o
t h a t of t he o r i g i n a l i n d i c a t i n g t h a t t he adsorpt ion c h a r a c t e r i s t i c s were not
changed by t h e crushing process. This carbon sample w a s designated as C15C
and is a l s o p l o t t e d i n Figure 4 .
This produced a l a r g e
B a r t o n s &.8 have determined t h e methane adsorpt ion isotherm a t 25°C
f o r a carbon which w a s not included i n t h i s study, Amoco GX-32. This carbon
has t h e h ighes t s u r f a c e area of any known carbon, 2500 m2/g (Nitrogen BET) and
the h ighes t s p e c i f i c adsorpt ion f o r methane of any carbon reported i n t h e
l i t e r a t u r e , , O . l 6 5 g/g a t 3.6 MPa and 25OC.
the s to rage capaci ty of Amoco GX-32 and w a s placed on the b a s i s of information
provided by Barton.
a l s o might be increased by crushing.
Point R2 i n Figure 4 r e p r e s e n t s
It is poss ib l e t h a t t h e packing dens i ty of t h i s material
29

W 2 a r r- W 3
SPECIFIC ADSORPTION, g-CH4Ig-C / 0.165 /~*'~>O.IOO
0 LITERATURE VALUE 0 EXPERIMENTAL VALUE
2oi d.l 0:2 0:3 0!4 d.5 d.6 d.7 0!8 d.9 I.\
PACKING DENSITY, g/cm3
Figure 4 . RELATIONSHIP OF SPECIFIC ADSORPTION AND PACKING DENSITY OP CARBON TO METHANE STORAGE CAPACITY AT 3.6 MPa PRESSURE
30

The amount of methane s to red by compression alone i n an empty cy l inder a t
14 MPa (2000 psig) would be about 108 grams/liter.
A s can be seen from Figure 4, t h e s to rage capac i ty of Sample C15C is
super ior t o any thus f a r reported i n the l i t e r a t u r e and is 70% t h a t of com-
press ion s to rage at 14 ma. I f , by some chemical means, t he s p e c i f i c adsorp-
t i o n of C15C could be enhanced from 0.100 t o 0.120 g/cc, a t 3.6 MPa t h e
s to rage capac i ty would a l s o increase by 20%. Such a goal is not unreasonable
but no method of a t t a i n i n g it has been i d e n t i f i e d as ye t .
Caution should be used, however, when comparing an adsorpt ion system with
a compression s to rage system on the b a s i s of methane s torage capac i ty alone.
The amount o f ' n a t u r a l gas s to red by both systems is always g r e a t e r than t h e
amount de l ive red but because of t h e shape of the adsorp t ion isotherm, t h i s
la t ter quan t i ty is not a l i n e a r func t ion of pressure f o r t he adsorpt ion system
as it is f o r simple compression s torage . The most p r a c t i c a l method of de te r -
mining t h e amount of methane t h a t can be de l ivered by an adsorpt ion system is
t o cons t ruc t a bench-scale apparatus . This was accomplished by connecting t h e
75 c m s t a i n l e s s s t ee l cy l inde r f i l l e d with t h e appropr ia te adsorbent t o a gas
manifold and a w e t tes t meter. To determine a practical de l ive ry capac i ty f o r
t h e var ious adsorbents , t h e cy l inder descr ibed above w a s p ressur ized with
methane and the methane w a s then slowly bled through a w e t test meter over a
2-hour period.
from 3.6 MPa (500 ps ig) t o 101.4 KF'a (0 ps ig) w a s determined d i r e c t l y . An air
stream a t 25OC w a s d i r e c t e d at the cy l inder t o maintain temperature during
desorpt ion. Table 14 l ists the quan t i ty of methane de l ivered i n grams p e r
l i t e r and t h e percentage of t he t o t a l adsorbed which t h i s represents f o r 16 of
the carbon samples and t w o of the bes t z e o l i t e samples.
3
The quan t i ty of methane de l ivered by the system i n cycl ing
D. Discussion of Resul t s
A s can be seen from Table 14 i n t h e previous sec t ion , Carbon Sample C15C
e x h i b i t s t h e bes t performance, most methane de l ive red , of a l l samples t e s t ed .
However, t h i s sample does not have t h e h ighes t s p e c i f i c adsorpt ion f o r methane
nor the h ighes t micropore volume. It does have one of the h ighes t spec i f ic
su r face areas and the h ighes t packing dens i ty of a l l carbons t e s t ed . These
two parameters then become the most d e s i r a b l e c h a r a c t e r i s t i c s of a good sor-
bent material f o r an adsorp t ion s to rage system.
31
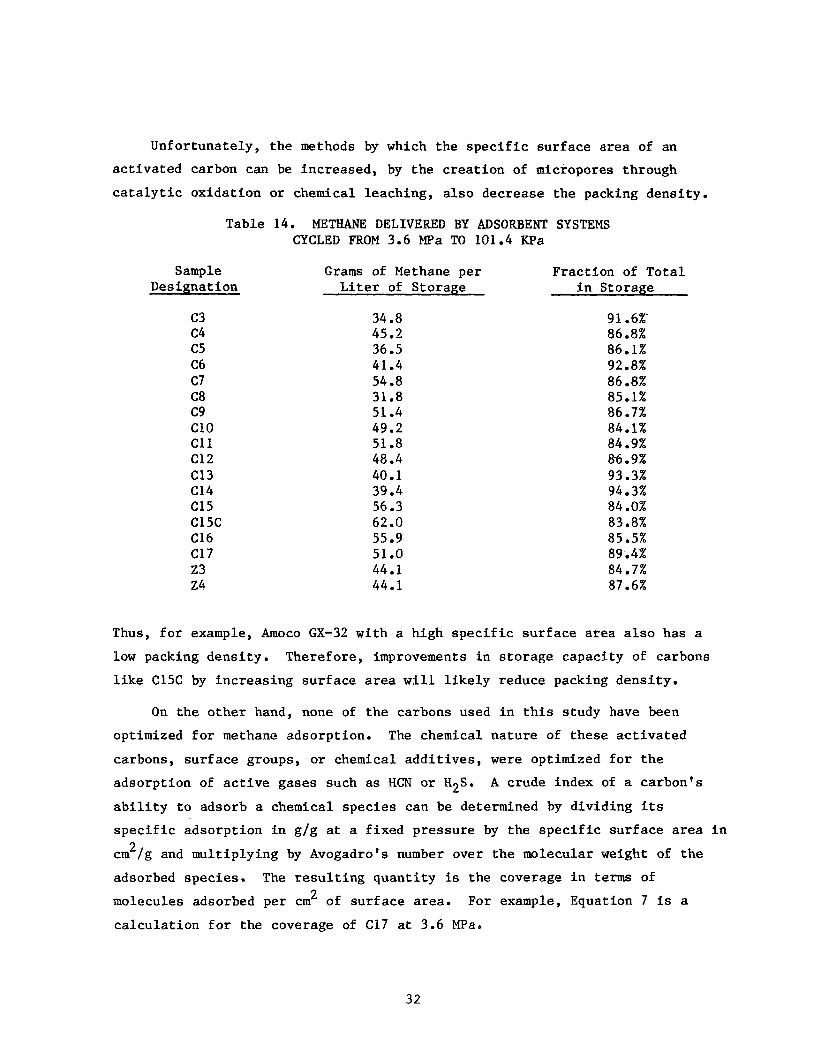
Unfortunately, t he methods by which the s p e c i f i c su r face area of an
a c t i v a t e d carbon can be increased, by the c r e a t i o n of micropores through
c a t a l y t i c ox ida t ion o r chemical leaching, a l s o decrease the packing dens i ty .
Table 14. METHANE DELIVERED BY ADSORBENT SYSTEMS CYCLED FROM 3.6 MPa TO 101.4 KPa
Thus
Sample Designation
c3 c4 c5 C6 c7 C8 c9 c10 c11 c12 C13 C14 C15 C15C C16 C17 23 24
f o r example
G r a m s of Methane per Fract ion of T o t a l L i t e r of Storage i n Storage
34.8 45.2 36.5 41.4 54.8 31.8 51.4 49.2 51.8 48.4 40.1 39.4 56.3 62.0 55.9 51.0 44.1 44.1
91.6X 86.8% 86.1% 92.8% 86.8% 85.1% 86.7% 84.1% 84 -9% 86.9% 93.3% 94.3% 84 .O% 83.8% 85 -5% 89.4% 84.7% 87.6%
Amoco GX-32 with a high s p e c i f i c s u r f a c e a rea a l s o has a
low packing dens i ty . Therefore, improvements i n s t o r a g e capaci ty of carbons
l i k e C15C by inc reas ing su r face area w i l l l i k e l y reduce packing dens i ty .
On t h e o t h e r hand, none of t h e carbons used i n t h i s study have been
optimized f o r methane adsorpt ion. The chemical na tu re of t hese a c t i v a t e d
carbons, s u r f a c e groups, o r chemical a d d i t i v e s , were optimized f o r t h e
adsorpt ion of a c t i v e gases such as HCN o r H2S.
a b i l i t y t o adsorb a chemical spec ie s can be determined by d iv id ing i ts specific adsorpt ion i n g/g a t a f ixed p res su re by t h e s p e c i f i c su r face area i n
c m /g and mult iplying by Avogadro's number over t h e molecular weight of t h e
adsorbed species . The r e s u l t i n g q u a n t i t y i s the coverage i n terms of
A crude index of a carbon's
2
molecules adsorbed per cm2 of s u r f a c e area.
c a l c u l a t i o n f o r the coverage of C17 a t 3.6 MPa.
For example, Equation 7 is a
32

0.115 g/ 6.023 x lo1-' molecules/mole = 3.38 1014 molecules/cm 2 4 R 2 16 grams/mole 1280 x 10 cm /g
Table 15 lists the methane coverage for representative carbon samples. It can be seen that the coverage for C15 is about average. If the methane coverage of C15 can be increased to equal that of C17 or C8, without altering the surface area or the packing density, a 35% improvement in methane adsorp- tion and a 25% improvement in methane storage capacity would result.
A comparison of the methane coverage for pure carbons having high inter-
nal porosity with substantial pore volume contributed by pores of less than 200 A radius (C3, C6, and C8) with those carbons having virtually no pores smaller than 2008 radius (C10, C15, and C16) indicate no significant differ- ence. Thus, micropore structure appears to contribute no additional benefits to methane adsorption. It should be noted that Carbons C5, C9, and C11 through C14 cannot be included in this evaluation because of their substantial inorganic content, see Table 2.
A comparison of methane coverage versus pH for the carbon samples indi- cates a slight positive relationship with the most basic carbons having a high methane coverage. Figure 5 plots methane coverage from Table 15 versus pH values from Table 2. However, here too, no significance can be assigned to this observation since the pH contribution of the inorganic materials present in each sample was not determined.
1.
2.
3 .
4.
E. Conclusions
The following conclusions can be drawn from the Task 1.1 results.
Activated carbons proved superior to zeolites in this program, both on a grams/gram and grams/liter basis.
The best performance, defined here as methane delivered per liter of storage, was turned 4" by North American Carbon G210 crushed to a packing density of 0.58 g/cm
High surface area and high packing density are desirable attributes for candidate sorbent materials.
Results indicate that there is room for improvement in the performance of even the best carbon evaluated.
33

' 2
0 0
3 4 5 6 7
PH 8 9 10 I I
Figure 5, RELATIONSHIP BETWEEN COVERAGE AND pH
34

5. There is hope that an adsorption storage system operating at a maximum pressure of 3.6 MPa can be developed having a storage capacity equal to compression storage at 14 MPa (2000 psig).
Table 15. METHANE COVERAGE FOR CARBON SAMPLES AT 3.6 MPa OF METHANE
Sample Designation
c3 c4 c5 C6 c7 C8 c9 c10 c11 c12 C13 C14 C15 C16 C17
14 Coverage in
Molecules/cm x 10 2
2.59 2.96 2 -85 1.99 2 -72 3.53 2.78 3.12 2.82 2.70 2 -03 1.78 2.62 2.83 3.38
Task 1.2 Modeling Effort
The purpose of this modeling effort is to develop a simplified model suitable for predicting weight, capacity, and vehicle range as well as esti- mate the change in each parameter required to obtain a methane storage cap- ability for adsorption systems consistent with the range, weight, and fuel
tank capacity of conventional (gasoline fueled) and high-pressure CNG vehicles. Although a rigorous analytical model was beyond the scope of this work, the following results are sufficient to provide a semi-quantitative comparison of compression storage and adsorption storage.
A. Calculations to Determine the Weight of a Storage Tank
Considerable developmental work has been performed to reduce the weight of D.O.T. approved high-pressure gas cylinders for vehicular applications. Aluminum-fiberglass composite cylinders having an internal volume of 3 8 ~ , an operating pressure of 21 MPa (3000 psig), a burst pressure of 52 MPa, and a mass of only 28 Kg (62 lbs) are currently available from commercial suppliers. However, in order to accurately assess the performance of a low pressure
35
adsorption storage system, it would be necessary to determine the weight of a storage tank optimized for operation at a maximum pressure of 3.6 MPa (500 psig). Unfortunately, at the present time, there is little interest in weight reduction programs for cylinders operating in this pressure range. As a con- sequence, the 28 Kg cylinder was used as a storage container for both the high pressure model and the adsorption model systems.
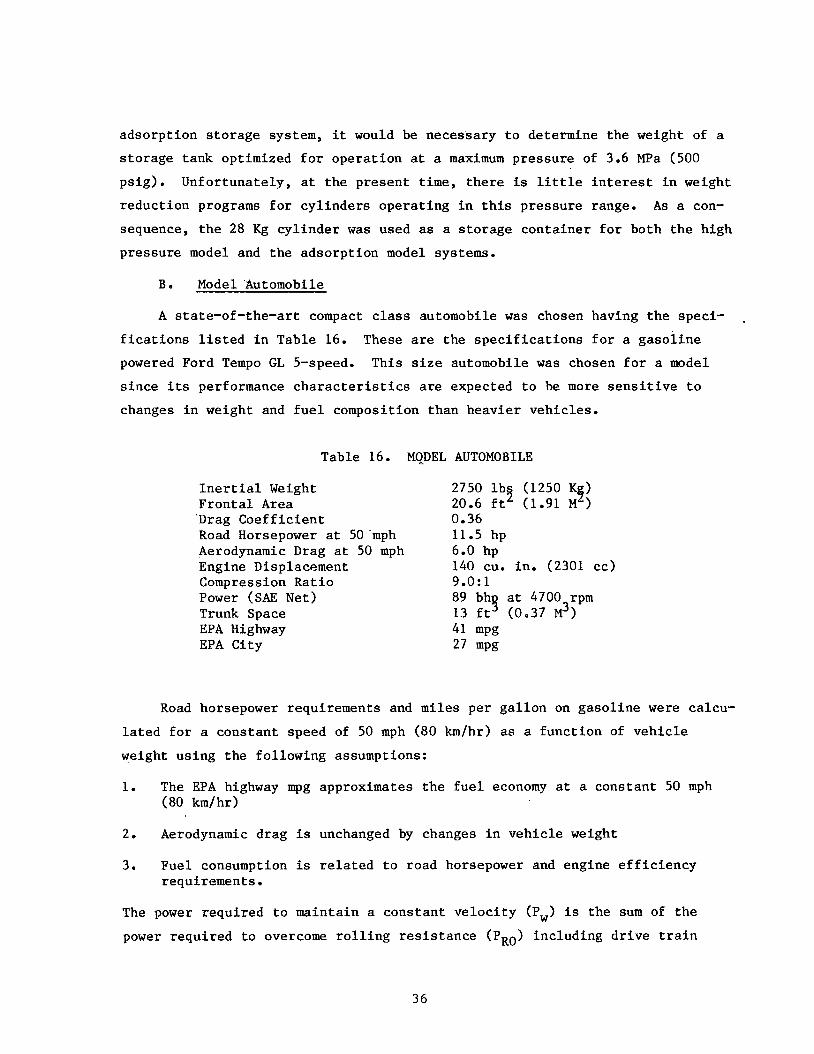
B. Model Automobile
A state-of-the-art compact class automobile was chosen having the speci- . fications listed in Table 16. powered Ford Tempo GL 5-speed. This size automobile was chosen for a model since its performance characteristics are expected to be more sensitive to changes in weight and fuel composition than heavier vehicles.
These are the specifications for a gasoline
Table 16. MQDEL AUTOMOBILE
Inertial Weight Frontal Area 'Drag Coefficient Road Horsepower at 50 'mph Aerodynamic Drag at 50 mph Engine Displacement Compression Ratio Power ( S A E Net) Trunk Space EPA Highway EPA City
2750 lbg (1250 K ) 20.6 ft (1.91 M ) 0.36 11.5 hp 6.0 hp 140 CU. in. (2301 cc) 9.0: 1 89 bh at 4700 rpm
5
13 ft 3 (0.37 M3)
41 mPg 27 mPg
Road horsepower requirements and miles per gallon on gasoline were calcu- lated for a constant speed of 50 mph (80 km/hr) as a function of vehicle
weight using the following assumptions:
1. The EPA highway mpg approximates the fuel economy at a constant 50 mph (80 kmlhr)
2. Aerodynamic drag is unchanged by changes in vehicle weight
3. Fuel consumption is related to road horsepower and engine efficiency requirements.
The power required to maintain a constant velocity (P,) is the sum of the
power required to overcome rolling resistance (PRO) including drive train
36
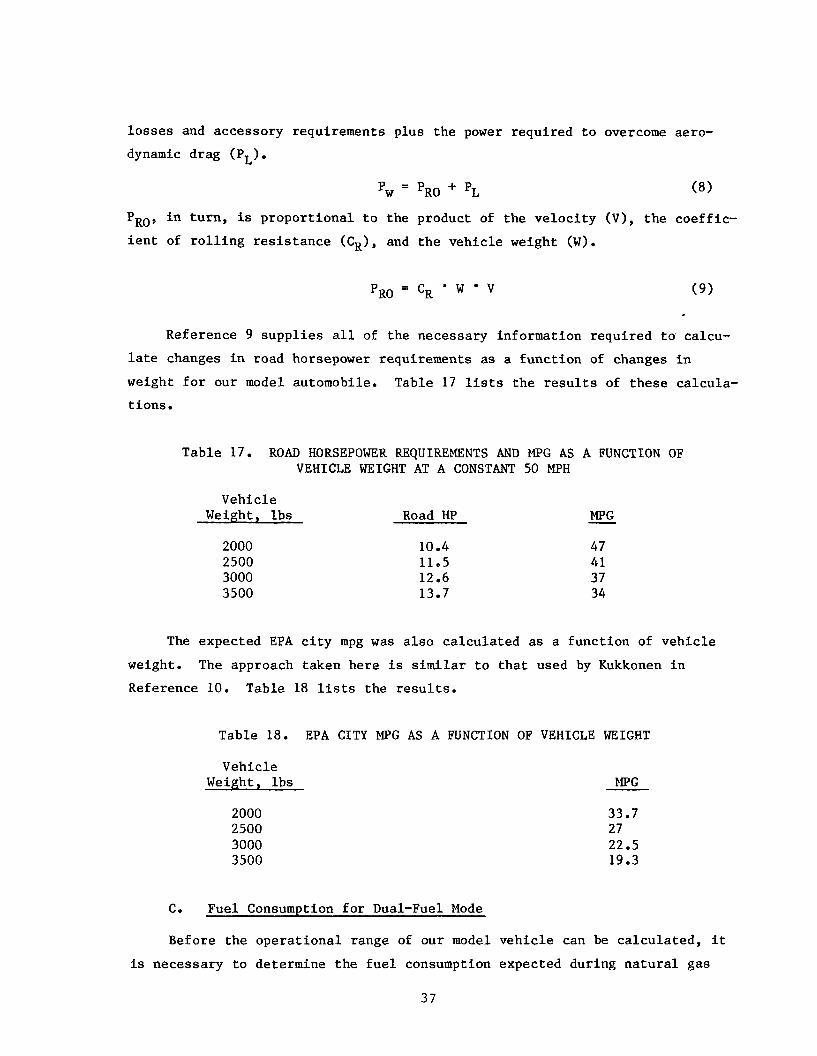
l o s s e s and accessory requirements p lus the power required t o overcome aero-
dynamic drag (PL)*
- pw -
PRO, i n t u r n , is p ropor t iona l t o the
i e n t of r o l l i n g r e s i s t a n c e (C,), and
Reference 9 supp l i e s a l l of the
'RO 'L ( 8 )
product of t he v e l o c i t y (V> , the coef f ic-
t h e vehic le weight (W) .
necessary information required t o calcu-
l a te changes i n road horsepower requirements as a func t ion of changes i n weight f o r our model automobile. Table 17 lists t h e r e s u l t s of t hese calcula-
t ions .
Table 17. ROAD HORSEPOWER REQUIREMENTS AND MPG AS A FUNCTION OF VEHICLE WEIGHT AT A CONSTANT 50 MPH
Vehicle MPG - Weight, l b s Road HP
2000 2500 3000 3500
10.4 11.5 12.6 13.7
47 41 37 34
The expected EPA c i t y mpg was a l s o ca l cu la t ed as a func t ion of veh ic l e
weight. The approach taken here i s similar t o t h a t used by Kukkonen i n
Reference 10. Table 18 l is ts the r e s u l t s .
Table 18. EPA CITY MPG AS A FUNCTION OF VEHICLE WEIGHT
Vehicle Weight, l b s
2000 2500 3000 3500
C. Fuel Consumption f o r Dual-Fuel Mode
MPG
33.7 27 22.5 19.3
Before the ope ra t iona l range of our model veh ic l e can be ca l cu la t ed , i t
is necessary t o determine the f u e l consumption expected during n a t u r a l gas
37
operation. run on natural gas with only minor modifications, it has become standard
practice in the U.S.A. and elsewhere to perform dual-fuel conversions. Such conversions allow the driver to select the fuel desired and to change from one fuel to the other at will. Such conversions do not take advantage of all of the positive attributes of natural gas as an SI engine fuel but, since such
conversions are common, the decision was made to include a dual-fuel mode in our model.
Since a gasoline fueled spark ignition (SI) engine can be made to
Work carried out by the University of British Columbia allows some quan- tification of the fuel consumption for gasoline engines converted to natural gas fuels.'' This work indicates that the overall operating efficiency of a vehicle equipped with a natural gas-fueled converted gasoline engine is, at best, 12% better on natural gas than the same engine on gasoline, provided modifications are made to the timing curve to advance the spark when operating on natural gas. A more detailed discussion of engine efficiency in the dual- fuel mode can be found in Part 1 of Appendix C.
D. Dedicated Engine Node
Natural gas exhibits many excellent qualities as an internal combustion (IC) spark-ignited engine fuel. Chief among these qualities is the high octane number of 130 RON. However, to take advantage of this high octane characteristic, it is necessary to use high compression ratios which are not
compatible with gasoline operation.
An engine designed to make optimum use of natural gas as a fuel is classed as a dedicated engine. Such an engine could be expected to be 25%
more efficient on natural gas than the same displacement size engine running
on gasoline. engine can be found in Part 2 of Appendix C.
A more detailed discussion of the efficiency of a dedicated
E. Energy Density of Pressurized Storage
In addition to knowing the efficiency and, therefore, the range per unit mass of fuel, it is also necessary to know the total amount of fuel stored on board. Because the term "pipeline quality" natural gas does not carry with it a definitive gas composition, it is necessary, at this point, to define terms.
For purposes of this model, natural gas will have an average molecular weight of 16.0 and a lower heating value of 11,800 Kcal/kg (21,250 Btu/lb). By
38
placing the average molecular weight equal to that of methane, we can apply, without further adjustment, the data gathered for methane adsorption on car-
bons. This leads, however, to underestimating vehicle range by a factor equal to the ratio of the actual average molecular weight of a specific gas sample
to that of methane.
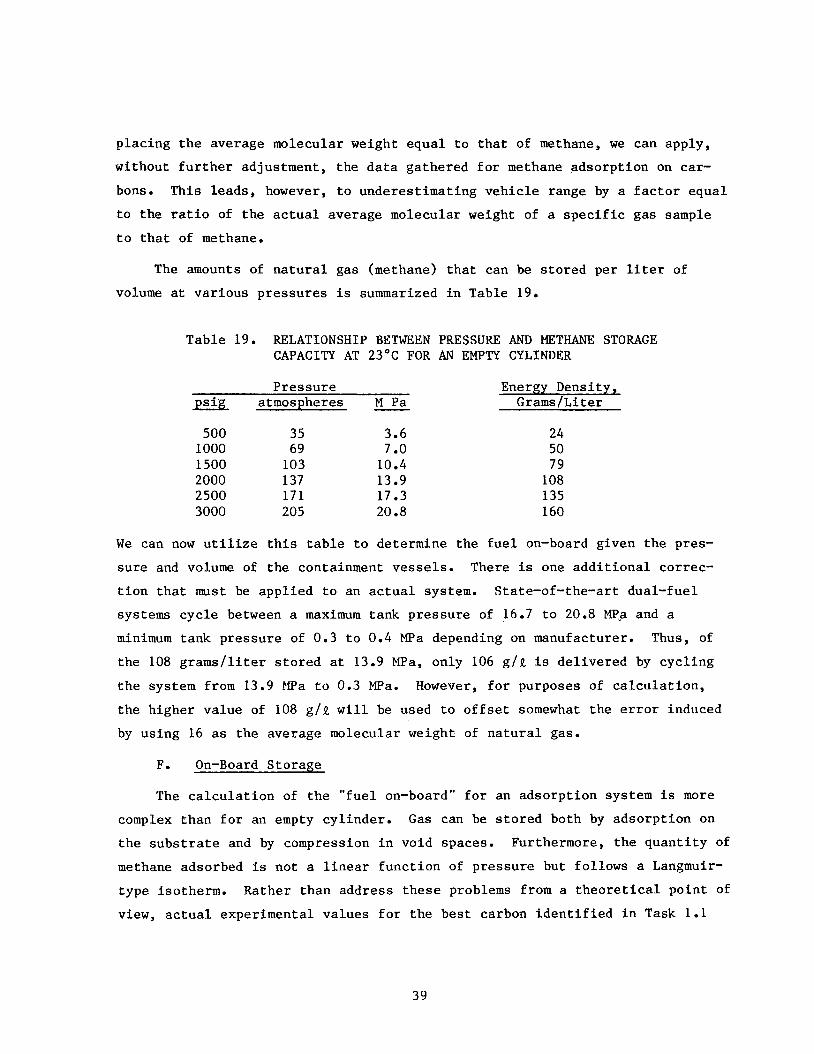
The amounts of natural gas (methane) that can be stored per liter of volume at various pressures is summarized in Table 19.
Table 19. RELATIONSHIP BETWEEN PRESSURE AND METHANE STORAGE CAPACITY AT 23OC FOR AN EMPTY CYLINDER
Pressure Enerpy Density, p i g atmospheres M Pa Grams/Liter
500 35 3.6 1000 69 7 .O 1500 103 10.4 2000 137 13.9 2500 17 1 17.3 3000 205 20.8
24 50 79
108 135 160
We can now utilize this table to determine the fuel on-board given the pres- sure and volume of the containment vessels. There is one additional correc-
tion that must be applied to an actual system. State-of-the-art dual-fuel systems cycle between a maximum tank pressure of 16.7 to 20.8 MPUa and a minimum tank pressure of 0.3 to 0.4 MPa depending on manufacturer. Thus, of the 108 grams/liter stored at 13.9 MPa, only 106 g/R is delivered by cycling
the system from 13.9 PPa to 0.3 MPa. However, for purposes of calculation,
the higher value of 108 g/R will be used to offset somewhat the error induced
by using 16 as the average molecular weight of natural gas.
F. On-Board Storage
The calculation of the "fuel on-board'' for an adsorption system is more complex than for an empty cylinder. Gas can be stored both by adsorption on the substrate and by compression in void spaces.
methane adsorbed is not a linear function of pressure but follows a Langmuir- type isotherm. view, actual experimental values for the best carbon identified in Task 1.1
Furthermore, the quantity of
Rather than address these problems from a theoretical point of
39

were used.
g/cc w a s loaded i n t o a cy l inde r and cycled between 3.6 MPa and 170 kPa (500
p s i g and 10 p s i g r e s p e c t i v e l y ) . About 58 grams of methane were de l ive red per
l i t e r of carbon during the discharge cycle . It is premature t o conclude t h a t
t h e 58 g / % of methane de l ive red by t h e bes t carbon r ep resen t s a maximum value
f o r absorbent systems i n general .
North American Carbon G-210 crushed t o a packing dens i ty of 0.58
G . Addit ional Weight of Gas Storage Hardware
I n o rde r t o determine t h e performance and range on n a t u r a l gas of a
veh ic l e ope ra t ing i n t h e dual-fuel mode, i t is necessary t o know t h e addi-
t i o n a l weight added t o t h e v e h i c l e by t h e gas s to rage system. Table 20
summarizes t h e a d d i t i o n a l weight of one, two, and t h r e e tank s to rage systems
based on 38- l i t e r , i n t e r n a l volume, aluminum-fiberglass composite cyl inders .
The 28-Kg high p res su re cy l inde r previously descr ibed is used t o c a l c u l a t e t h e
weight of t h e va r ious s to rage systems. The packing d e n s i t i e s of t h e carbon
adsorbents are set a t 0.58 g/cc, which r ep resen t s t h e most dense carbon
evaluated i n t h i s program.
hardware would occupy about one-third of t he a v a i l a b l e t runk space i n our
model veh ic l e .
A s i n g l e 38% tank with manifold and bracket ing
Table 20. APPROXIMATE MASS OF STORAGE SYSTEMS I N Kg
Pressurized Storage
Fuel Tanks Brackets Conversion K i t s
6 12 18 28 56 84 10 20 30 25 25 25 -
T o t a l 69 113 157
AdsorptiQn Storage
Fuel Tanks Brackets Manif o ld Carbon
1 Tank 2 Tanks 3 Tanks
3 5 7 28 56 84 15 30 45 30 30 30 22 44 66
To ta l 98 165 23 2
40
H. Vehicle Range and Fuel Ef f ic iency
Having determined the weight and s to rage capac i ty of t he var ious s torage
systems and the r e l a t i v e f u e l e f f i c i e n c i e s of t he SI engine opera t ing on gaso-
l i n e and on n a t u r a l gas i n both dual-fuel and dedicated modes, i t is now pos-
s i b l e t o combine these r e l a t i o n s h i p s with the r e l a t i o n s h i p between t o t a l
veh ic l e weight and veh ic l e f u e l economy t o c a l c u l a t e both gasol ine equiva len t
mpg and range on n a t u r a l gas f o r t he var ious s torage opt ions. Table 21 com-
pares f u e l e f f i c i e n c y on gasol ine and t h e est imated range on n a t u r a l gas f o r
the var ious s to rage opt ions f o r a model veh ic l e opera t ing i n the dual-fuel
mode on t h e EPA-city cycle. Table 22 i s a similar comparison f o r t h e constant
speed approach. Resul t s i n Tables 21 and 22 assume that pressur ized s to rage
system cyc les between 20.8 MPa (3000 ps ig) and 0.3 MPa (25 ps ig) while adsorp-
t i o n s to rage systems cycle between 3.6 MPa (500 ps ig) and 0.2 MPa (10 ps ig) .
Range on n a t u r a l gas is based on the r e s u l t s of the s tudy discussed i n
Appendix. C.
The pro jec ted range of t he model veh ic l e equipped with a, dedicated engine
would be about 10% longer than those l i s t e d f o r var ious s torage opt ions i n
Tables 2 1 and 22.
I. Discussion of Resul t s
Fuel Economy: The r e s u l t s of our model i n d i c a t e t h a t a s i g n i f i c a n t
+pena l ty i s paid, up t o 15%, i n t h e form of a l o s s i n f u e l economy on the EPA
c i t y cyc le when a dual-fuel c a p a b i l i t y is added t o t h e base automobile. On
the o ther hand, t he re is l i t t l e a d d i t i o n a l performance l o s s with adsorp t ion
s to rage over t h a t experienced wi th pressur ized s torage . This is an important
r e s u l t s i n c e one of t he pas t ob jec t ions t o adsorpt ion s to rage has been t h e
added weight of t he sorbent bed. This has added s ign i f i cance since our model
calls f o r 'heavier bracke ts and manifolding hardware wi th adsorpt ion s to rage
than with pressur ized s torage . I n o ther words, t h e r e is no s i g n i f i c a n t
d i f f e rence between pressur ized s torage and adsorpt ion s torage i n t h e f u e l
economy l o s s experienced i n the dual-fuel mode.
Range: The range of a veh ic l e is d i r e c t l y r e l a t e d t o the f u e l s to red on-
board and it is genera l ly accepted i n a l t e r n a t i v e l y fue led veh ic l e circles
t h a t f o r an a l t e r n a t i v e l y fue led vehic le , regard less of the propuls ion system,
41

Table 21. ESTIMATED FUEL ECONOMY AND RANGE ON THE EPA CITY CYCLE FOR VEHICLE OPERATING I N A DUAL-FUEL MODE
Range on Gasoline Fuel Storage System Economy* Natural Gas Only**
Gasoline Only 11.5 (27)
Pressurized Storage (20.8 MPa)
1 Tank 2 Tanks 3 Tanks
Adsorption Storage (3.6 MPa)
1 Tank 2 Tanks 3 Tanks
10.9 (25.4) 10.5 (24.6) 10.1 (23.7)
10.7 (25.1) 10.2 (23.9) 9.7 (22.8)
95 182 262
32 63 93
* Kilometers per l i t e r (miles per ga l lon ) . ** Kilometers (miles) .
42
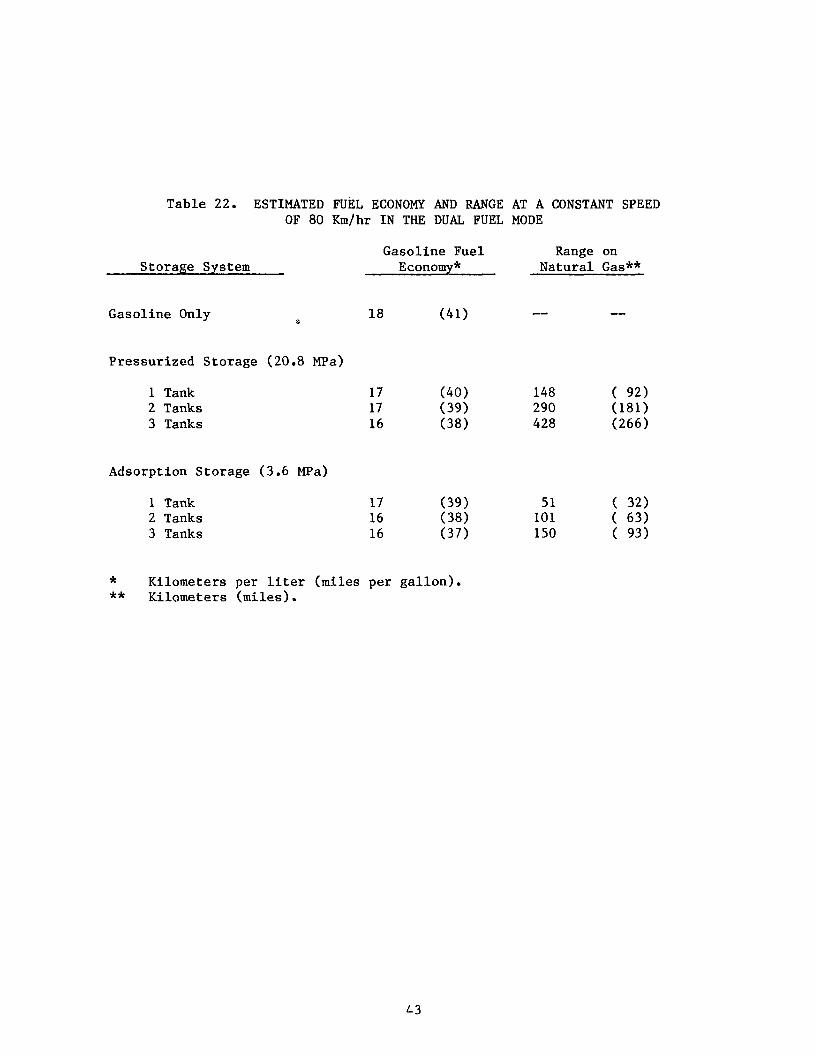
Table 22. ESTIMATED mTEL ECONOMY AND RANGE AT A CONSTANT SPEED OF 80 Km/hr IN THE DUAL FUEL MODE
Storage System
Gasoline Only e.
Pressurized Storage (20.8 MPa)
1 Tank 2 Tanks 3 Tanks
Adsorption Storage (3.6 MPa)
1 Tank 2 Tanks 3 Tanks
Gasoline Fuel Range on Economy* Natural Gas**
* Kilometers per liter (miles per gallon). ** Kilometers (miles).
43
to make significant market penetration it must have a range of at least 100
miles between refuelings on the EPA city cycle. Although this is less criti- cal for a dual-fuel vehicle, it is absolutely necessary for a dedicated vehicle.
As can be seen in Table 21, our model predicts that this can be achieved with a pressuriged storage system operating at 20.8 MPa (3000 psig) equipped with two 382 storage tanks. On the other hand, the state-of-the-art adsorp- tion system with three 382 tanks can only manage 58 miles (93 km). possible that future research and development can boost the storage capacity of sorbent beds based on carbon to the point where a 100 mile range on the EPA
city cycle is feasible with three tanks. Also, it should be recognized that this model assumes that storage is limited to the space available in the auto- mobile trunk and assumes cylindrical shaped containers, the maximum possible being three 382 tanks. If, however, storage volumes in excess of 1802 (about
five 382 tanks) can be made available either by locating tanks in other unused spaces, by redesigning the automobile, or by using more efficient geometrical shapes, a state-of-the-art adsorption system could achieve a range in excess of 100 miles on the EPA city cycle at the expense of an additional weight increase without further improvements in the sorbent beds. It is unlikely, however, that an adsorption storage system will ever be designed with the
energy density of a pressurized storage system charged to 20.8 MPa.
It is
44
TASK 2. LITERATURE SURVEY AND ADVANCED STORAGE MEDIUM EVALUATION
The o b j e c t i v e of t h i s t a s k w a s t o survey t h e a v a i l a b l e l i t e r a t u r e and
i d e n t i f y materials and concepts with t h e p o t e n t i a l t o s t o r e methane a t low
pressures . The survey concentrated on the concepts of c l a t h r a t i o n , encapsu-
l a t i o n , and d i s so lu t ion . A 33-page eva lua t ion of c l a t h r a t e s to rage concepts,
complete wi th its own bibl iography, is included as Appendix D. A 27-page
d i scuss ion of methane s t o r a g e by d i s s o l u t i o n i s included as Appendix E.
summary of t h e f ind ings is provided below.
A
A. C l a t h r a t i o n of Methane
The t e r m c l a t h r a t e w a s o r i g i n a l l y defined as a compound " i n which two o r
more molecular components are as soc ia t ed without ordinary chemical union but
through complete enclosure of one set of molecules i n a s u i t a b l e s t r u c t u r e
formed by another.':!
w i th in spaces formed by t h e c r y s t a l s t r u c t u r e of t he host. The phenomenon is
dependeqt pr imari ly upon the r e l a t i v e s i z e of t he ho le s i n the hos t c r y s t a l
s t r u c t u r e and s i z e of t he guest molecules.
Thus, t he term c l a t h r a t e implies guest molecules caged
Although t h e r e is considerable work i n progress toward developing t h e
know-how f o r t a i l o r i n g new c l a t h r a t e h o s t s f o r s p e c i f i c guest molecules, most
of t he work is o r i en ted toward b i o l o g i c a l and c a t a l y t i c a p p l i c a t i o n s such as
enzymes and i o n i c species . P r a c t i c a l l y no r e fe rences have been found f o r
t a i l o r i n g the c l a t h r a t e hos t molecules f o r s m a l l and r e l a t i v e l y i n e r t mole-
cu le s such as methane o r t he i n e r t gases; thus, tailor-making hos t molecules
f o r c l a t h r a t i n g methane s t i l l r e q u i r e s a l a r g e l y empir ical approach i n devel-
opment. Nonetheless, t h e r e are a few precepts a v a i l a b l e t o guide such a
development:
0 C l a t h r a t e formulat ion depends on t h e a b i l i t y of t he hos t molecules t o form a c r y s t a l h a b i t which has c a v i t i e s l a r g e enough t o accommodate the s p e c i f i e d guest molecules.
0 The c r y s t a l h a b i t formed i n the presence of t h e guest molecule is usual ly d i f f e r e n t from the normal crystal s t r u c t u r e found i n the absence of t h e guest .
o The primary p r e r e q u i s i t e f o r t he hos t i s hydrogen-bonding o r o the r com- plex forming a b i l i t y while a secondary p r e r e q u i s i t e is a molecular geom- e t r y which w i l l c r y s t a l l i z e i n t h e presence of t he guest t o a s t r u c t u r e with c a v i t i e s s i z e d t o accommodate the guest
45
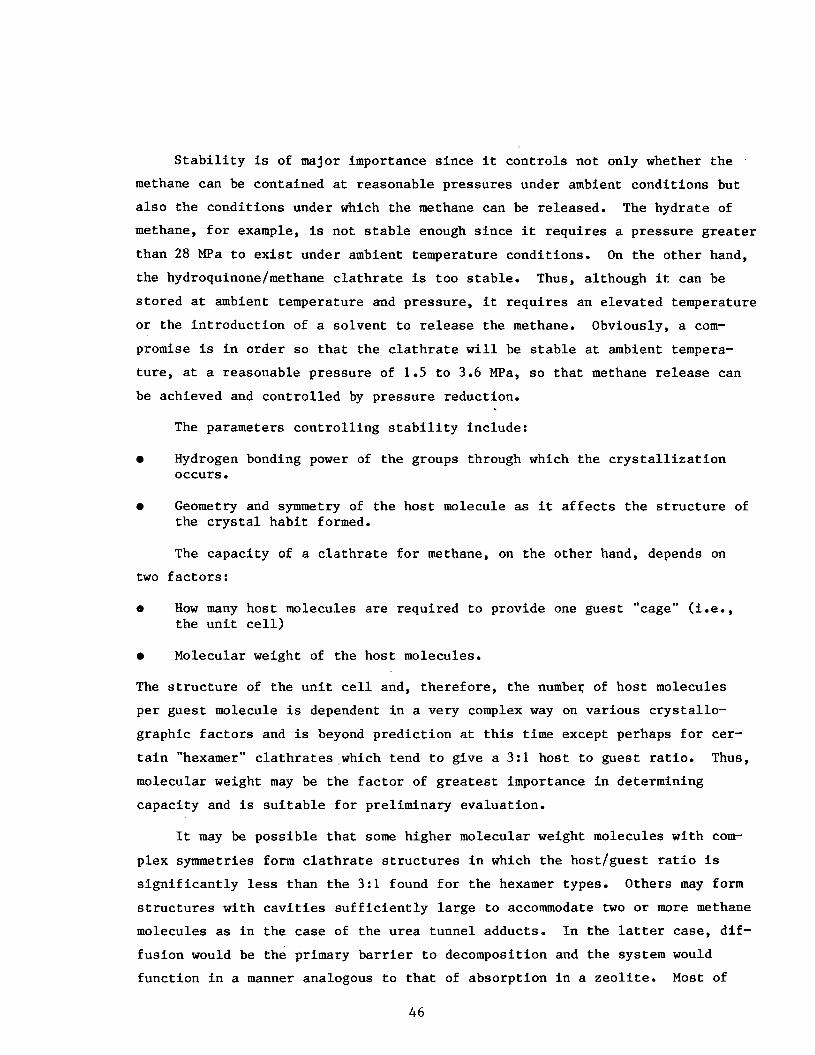
Stability is of major importance since it controls not only whether the .
methane can be contained at reasonable pressures under ambient conditions but also the conditions under which the methane can be released. methane, for example, is not stable enough since it requires a pressure greater
than 28 MPa to exist under ambient temperature conditions. the hydroquinone/methane clathrate is too stable. stored at ambient temperature and pressure, it requires an elevated temperature or the introduction of a solvent to release the methane. Obviously, a com-
promise is in order so that the clathrate will be stable at ambient tempera- ture, at a reasonable pressure of 1.5 to 3.6 MPa, so that methane release can
be achieved and controlled by pressure reduction.
The hydrate of
On the other hand, Thus, although it can be
The parameters controlling stability include:
0 Hydrogen bonding power of the groups through which the crystallization occurs.
0 Geometry and symmetry of the host molecule as it affects the structure of the crystal habit formed.
The capacity of a clathrate for methane, on the other hand, depends on
two factors:
0 How many host molecules are required to provide one guest "cage" (i.e., the unit cell)
0 Molecular weight of the host molecules.
The structure of the unit cell and, therefore, the number of host molecules per guest molecule is dependent in a very complex way on various crystallo-
graphic factors and is beyond prediction at this time except perhaps for cer- tain "hexamer" clathrates,which tend to give a 3 : l host to guest ratio. Thus, molecular weight may be the factor of greatest importance in determining capacity and is suitable for preliminary evaluation.
It may be possible that some higher molecular weight molecules with com-
plex symmetries form clathrate structures in which the host/guest ratio is significantly less than the 3: l found for the hexamer types. Others may form structures with cavities sufficiently large to accommodate two or more methane molecules as in the case of the urea tunnel adducts. In the latter case, dif- fusion would be the primary barrier to decomposition and the system would function in a manner analogous to that of absorption in a zeolite. Most of
46
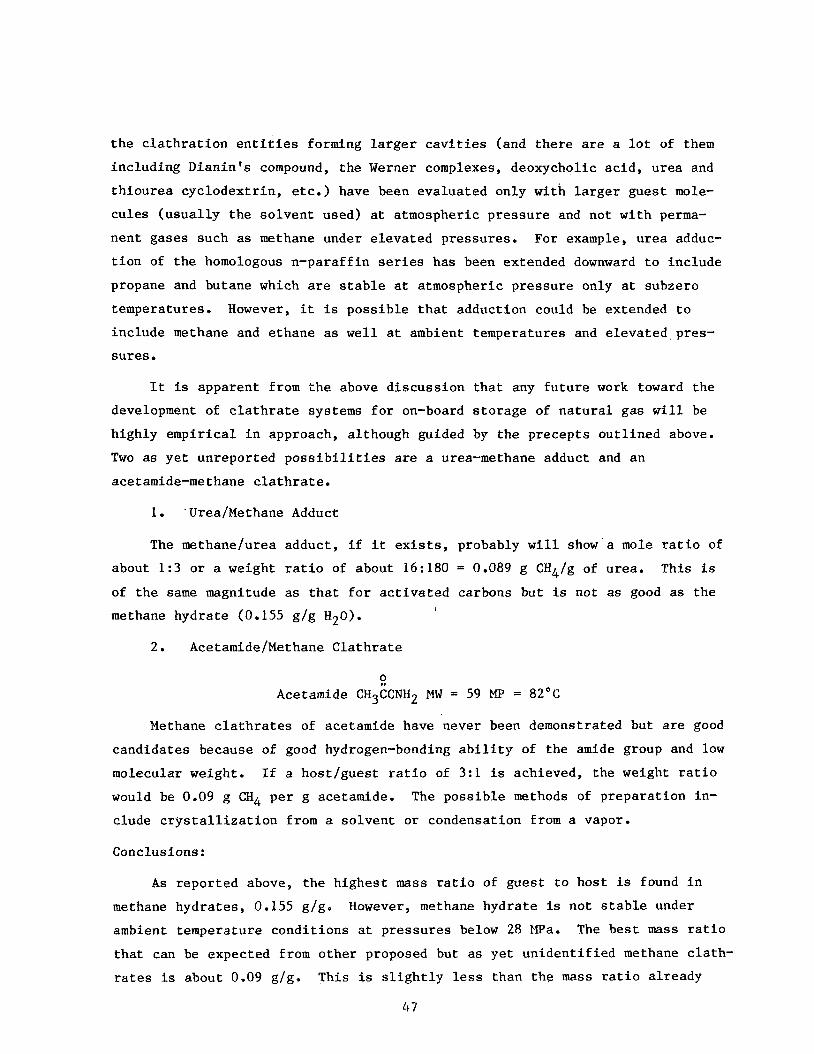
the clathration entities forming larger cavities (and there are a lot of them including Dianin's compound, the Werner complexes, deoxycholic acid, urea and
thiourea cyclodextrin, etc.) have been evaluated only with larger guest mole- cules (usually the solvent used) at atmospheric pressure and not with perma- nent gases such as methane under elevated pressures. For example, urea adduc- tion of the homologous n-paraffin series has been extended downward to include
propane and butane which are stable at atmospheric pressure only at subzero temperatures. However, it is possible that adduction could be extended to include methane and ethane as well at ambient temperatures and elevated pres- sures.
It is apparent from the above discussion that any future work toward the development of clathrate systems for on-board storage of natural gas will be highly empirical in approach, although guided by the precepts outlined above. Two as yet unreported possibilities axe a urea-methane adduct and an acetamide-methane clathrate.
1. .Urea/Methane Adduct
The methane/urea adduct, if it exists, probably will show'a mole ratio of about 1:3 or a weight ratio of about 16:180 = 0.089 g CHq/g of urea. This is
of the same magnitude as that for activated carbons but is not as good as the methane hydrate (0.155 g/g H20). I
2. Acetamide/Methane Clathrate
f! Acetamide CH3CCNH2 MW = 59 MP = 82OC
Methane clathrates of acetamide have never been demonstrated but are good
candidates because of good hydrogen-bonding ability of the amide group and low molecular weight. If a host/guest ratio of 3:l is achieved, the weight ratio would be 0.09 g CH4 per g acetamide. The possible methods of preparation in-
clude crystallization from a solvent or condensation from a vapor.
Conclusions:
As reported above, the highest mass ratio of guest to host is found in methane hydrates, 0.155 g/g. However, methane hydrate is not stable under ambient temperature conditions at pressures below 28 tPa. The best mass ratio that can be expected from other proposed but as yet unidentified methane clath-
rates is about 0.09 g/g. This is slightly less than the mass ratio already
47
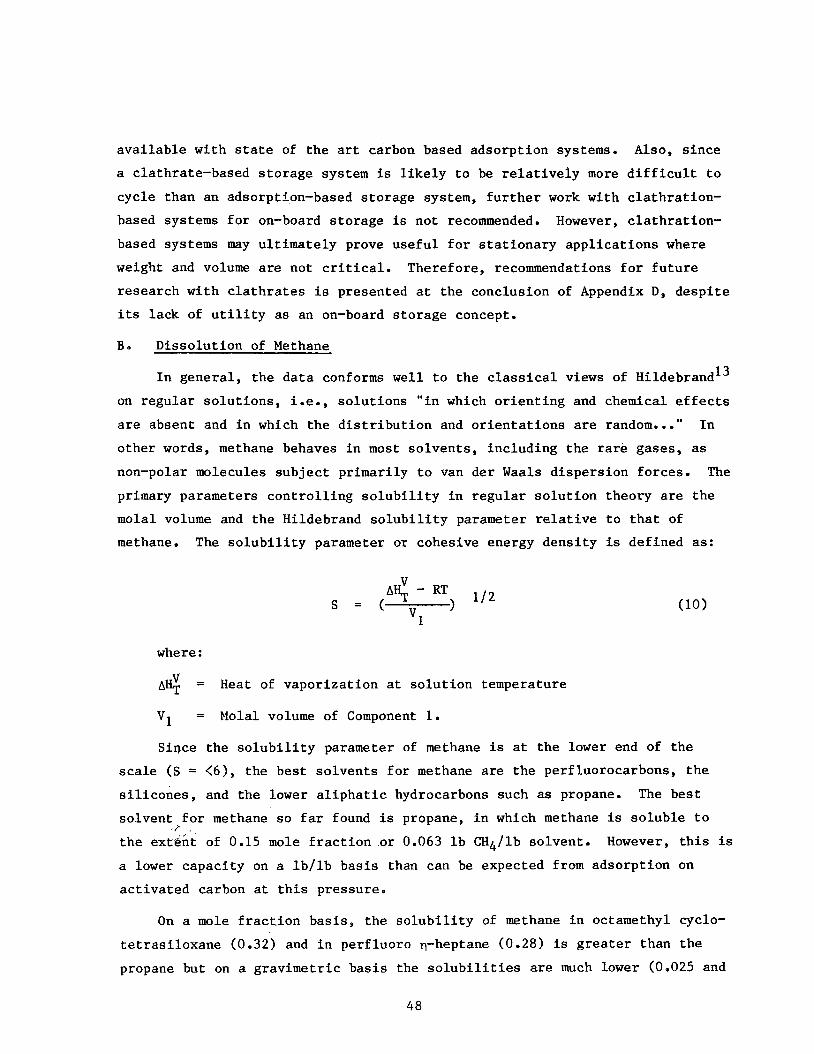
available with state of the art carbon based adsorption systems. Also, since a clathrate-based storage system is likely to be relatively more difficult to
cycle than an adsorption-based storage system, further work with clathration- based systems for on-board storage is not recommended. However, clathration-
based systems may ultimately prove useful for stationary applications where weight and volume are not critical. Therefore, recommendations for future research with clathrates is presented at the conclusion of Appendix D, despite its lack of utility as an on-board storage concept.
B. Dissolution of Methane
13
on regular solutions, i.e., solutions "in which orienting and chemical effects are absent and in which the distribution and orientations are random..." In other words, methane behaves in most solvents, including the rare gases, as non-polar molecules subject primarily to van der Waals dispersion forces. The
primary parameters controlling solubility in regular solution theory are the molal volume and the Hildebrand solubility parameter relative to that of methane. The solubility parameter or cohesive energy density is defined as:
In general, the data conforms well to the classical views of Hildebrand
where :
AH; = Heat of vaporization at solution temperature
V1 = Molal volume of Component 1.
Siace the solubility parameter of methane is at the lower end of the scale (S = <6), the best solvents for methane are the perfluorocarbons, the silicones, and the lower aliphatic hydrocarbons such as propane. The best solvent for methane so far found is propane, in which methane is soluble to
the extdnt of 0.15 mole fraction or 0.063 lb CH4/lb solvent. a lower capacity on a lb/lb basis than can be expected from adsorption on
activated carbon at this pressure.
-r , However, this is
On a mole fract,ion basis, the solubility of methane in octamethyl cyclo- tetrasiloxane (0.32) and in perfluoro q-heptane (0.28) is greater than the
propane but on a gravimetric basis the solubilities are much lower (0.025 and
48

0.016, respectively) due to the high molecular weights of these solvents. Nevertheless, it is possible that lower molecular weight perfluorocarbons and
silicones could exhibit acceptable methane solubilities on a mass ratio basis. However, information regarding methane solubility in these solvents is not available in the literature.
I n the aliphatic hydrocarbon series, the solubility of methane decreases
with increasing molecular weight as the result of the solubility parameter in- creasing with increasing molecular weight. This trend of decreasing methane solubility with increasing molecular weight continues up to about C6 (n-
hexane). basis increases with increasing molecular weight to 0.32 for C30 (squalane) . Unfortunately, the solvent molecular weight increases more rapidly than solu- bility so that the solubility on a gravimetric basis continues to decrease with increasing molecular weight. These results are based primarily upon data for straight chain hydrocarbons, squalane being the exception with 6 methyl groups on a straight chain of 24 carbons. However, the solubility of methane
in isobutane (2-methyl propane), 0.061 g/g, and in neo pentane (2,2-dimethyl propane), 0.057 g/g, suggest that the decrease in methane solubility on a gravimetric basis with increasing molecular weight may be less severe for highly branched paraffin hydrocarbons. Unfortunately, data on the solubility of methane in highly branched high molecular weight paraffins is not available.
Above c6, however, the solubility of methane on a mole fraction
The solubilities of methane in aliphatic alcohols appear to be greater, at the same solubility parameter value, than for other solvents having no
hydroxyl groups. This suggests that hydrogen bonding may contribute in some as yet unidentified manner to enhancing methane solubility. This further suggests that it may be possible to enhance the adsorptive capacity of solid
adsorbents by providing a multiplicity of hydroxyl groups on the surface.
The solubility data for the lower paraffin hydrocarbons (e.g., propane) actually represent the concentration of methane in the liquid phase of a mix-
ture in equilibrium with a vapor phase containing both methane and solvent
vapor.
MPa total pressure is corrected to 3.5 MPa partial pressure of methane, the solubility would increase from 0.063 g/g to 0.11 g/g but the total system
pressure would also increase. Likewise, the solubility of methane in liquid ethane at 25OC and a methane partial pressure of 3.6 MPa is 0.35 g/g, however,
If the equilibrium concentration of methane in propane at 25°C and 3.6
49

system pressures exceeding 7 MPa would be required. If we could tie down ethane or propane as ethyl or propyl groups and still maintain their solvent capacity for methane, gravimetric capacities similar to those of the best adsorbent systems might be achieved.
Conclusions
No high molecular weight solvent has been identified which can dissolve
enough methane to be competitive with adsorption storage. On the other hand, no method has been identified to prevent low molecular weight highly vola'tile solvents such as propane, in which methane is highly soluble, from vaporizing along with the methane during system discharge. Although this is not consid- ered a serious problem with propane, it does present a significant environmen- tal hazard when low molecular weight fluorocarbons and silicones are considered. The possibility of tying low molecular weight solvents to polymer backbones, however, is at least within the realm of speculation, and warrants some future
consideration.
50
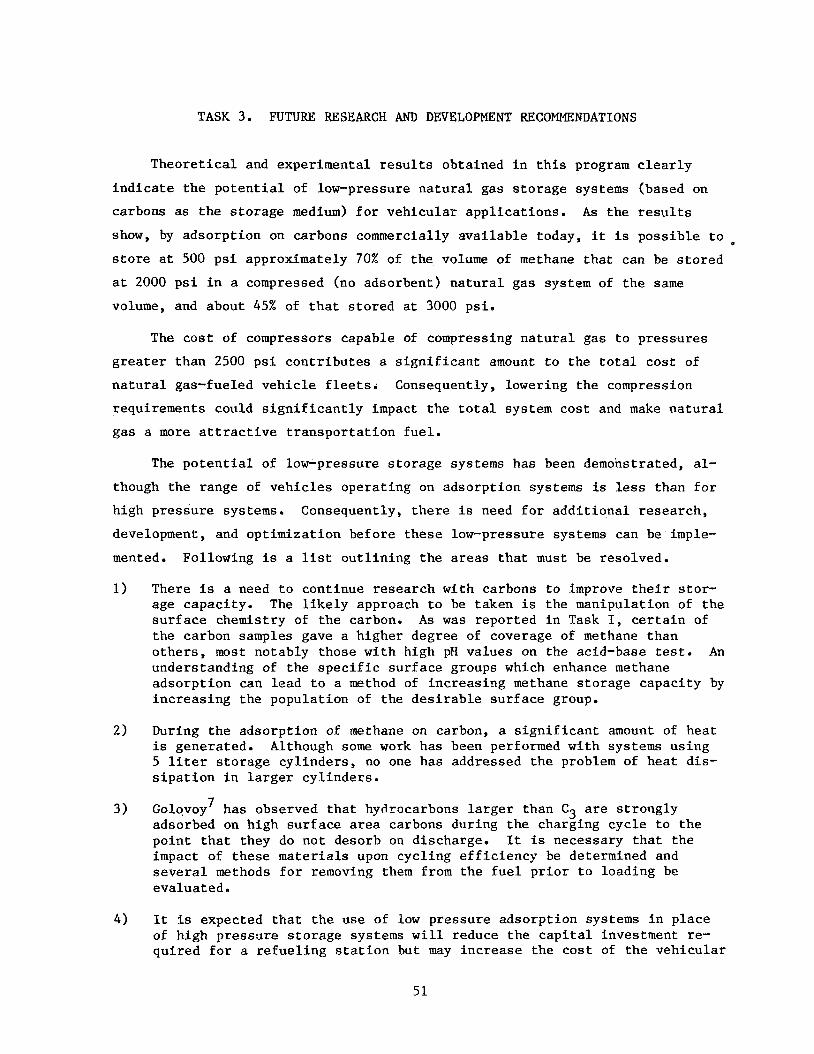
TASK 3. FUTURE RESEARCH AND DEVELOPMENT RECONMENDATIONS
Theore t i ca l and experimental r e s u l t s obtained i n t h i s program c l e a r l y
i n d i c a t e t h e p o t e n t i a l of low-pressure n a t u r a l gas s to rage systems (based on
carbons as t h e s to rage medium) f o r veh icu la r app l i ca t ions .
show, by adsorp t ion on carbons commercially a v a i l a b l e today, i t i s poss ib l e t o
s t o r e a t 500 p s i approximately 70% of the volume of methane t h a t can be s to red
a t 2000 p s i i n a compressed (no adsorbent) n a t u r a l gas system of the same
volume, and about 45% of that s to red a t 3000 ps i .
A s the r e s u l t s
The cos t of compressors capable of compressing n a t u r a l gas t o pressures
g r e a t e r than 2500 p s i con t r ibu te s a s i g n i f i c a n t amount t o the t o t a l cos t of
n a t u r a l gas-fueled veh ic l e f l e e t s . Consequently, lowering the compression
requirements could s i g n i f i c a n t l y impact t h e t o t a l system cos t and make n a t u r a l
gas a more a t t r a c t i v e t r a n s p o r t a t i o n fue l .
The p o t e n t i a l of low-pressure s to rage systems has been demonstrated, al-
though t h e range of veh ic l e s opera t ing on adsorp t ion systems is less than f o r
high pressure systems. Consequently, t h e r e is need f o r a d d i t i o n a l research ,
development, and opt imiza t ion before these low-pressure systems can be imple-
mented. Following is a l i s t ou t l in ing the areas t h a t must be resolved.
There is a need t o cont inue research with carbons t o improve t h e i r s t o r - age capaci ty . The l i k e l y approach t o be taken is the manipulation of t h e s u r f a c e chemistry of t h e carbon. A s w a s reported i n Task I, c e r t a i n of t he carbon samples gave a higher degree of coverage of methane than o t h e r s , most notably those wi th high pH values on the acid-base test. An understanding of t he s p e c i f i c su r face groups which enhance methane adsorp t ion can lead t o a method of increas ing methane s torage capac i ty by inc reas ing the populat ion of t he d e s i r a b l e su r face group.
During t h e adsorp t ion of methane on carbon, a s i g n i f i c a n t amount of hea t is generated. Although some work has been performed wi th sys tems us ing 5 l i t e r s to rage cy l inde r s , no one has addressed t h e problem of hea t d i s - s i p a t i o n i n l a r g e r cy l inders .
Go10voy7 has observed t h a t hydrocarbons l a r g e r than Cg are s t rong ly adsorbed on high su r face area carbons during the charging cyc le t o t h e po in t t h a t they do not desorb on discharge. It is necessary t h a t t he impac t of these materials upon cyc l ing e f f i c i e n c y be determined and several methods f o r removing them from t h e f u e l p r i o r t o loading be evaluated.
It is expected t h a t t h e use of low pressure adsorp t ion systems in place of high p r e s s m e s to rage systems w i l l reduce t h e c a p i t a l investment re- qui red f o r a r e f u e l i n g s t a t i o n but may inc rease the cos t of t he vehicu lar
51

storage system. It is necessary to conduct an economic evaluation to quantify tKe expected savings which will be realized by reduced com- pressor costs so that an upper limit can be placed on the cost of the vehicular adsorption storage system.
To date, most adsorption system experiments have been conducted at about 25OC. However, real world methane storage systems may be exposed to environmental extremes of from -30' to +6OoC with daily temperatures swings of as much as f20". both performance and safety of daily and annual temperature variations.
It is necessary to determine the impact upon
Vibrational settling of adsorbent may present a problem in actual vehic- ular systems. This problem, if it exists, needs to be identified.early enough for corrective measures to be taken prior to actual full-scale demonstration tests.
The above issues need to be resolved in order that enlightened full-scale demonstration tests can be undertaken.
References
1.
2.
3.
40
5.
6.
7,
8.
9.
10.
Braslaw, J., Nasea, Jr., J. and Golovoy, A., "Low Pressure Methane Stor- age System for Vehicles." Paper presented at the 4th International Con- ference on Alternative Energy Sources, Miami, December 1981.
Otto, K., "Adsorption of Methane on Active Carbons and Zeolites." Paper presented at the 4th International Conference on Alternative Energy Sources, Miami, December 1981.
Straszhesko, D. N., Ed., Adsorption and Adsorbents No. 1. New York: John Wiley, 1973.
de Boer, J. He, The Dynamical Characteris of Adsorption. London: Oxford University Press, 1968.
Brunauer, Stephen, The Adsorption of Gases and Vapors, Volume I. Prince- ton: Princeton University Press, 1943.
D. W. Breck, "Crystalline Molecular Sieves," Journal of Chemical Educa- tion 48m 678 (1964). -- Amos Golovoy, "Sorbent-Containing Storage Systems for Natural Gas Powered Vehicles," SAE Conference Proceedings P-129 Page 39, June 1983. SAE Inc. Warrendale, PA 15096.
S. S. Barton, J. R. Dacey, and D. F. Quinn, "High Pressure adsorption of Methane on Porous Carbons," Preprint. Dept. of Chemistry and Chemical Engineering, Royal Military College of Canada, Kingston, Ontario.
"Car and Driver" Volume 29, Number 3, Page 81, September 1983.
Kukkonen, C. A., "Hydrogen as an Alternative Automotive Fuel," Society of Automotive Engineers, Paper No. 810349 (1981).
52
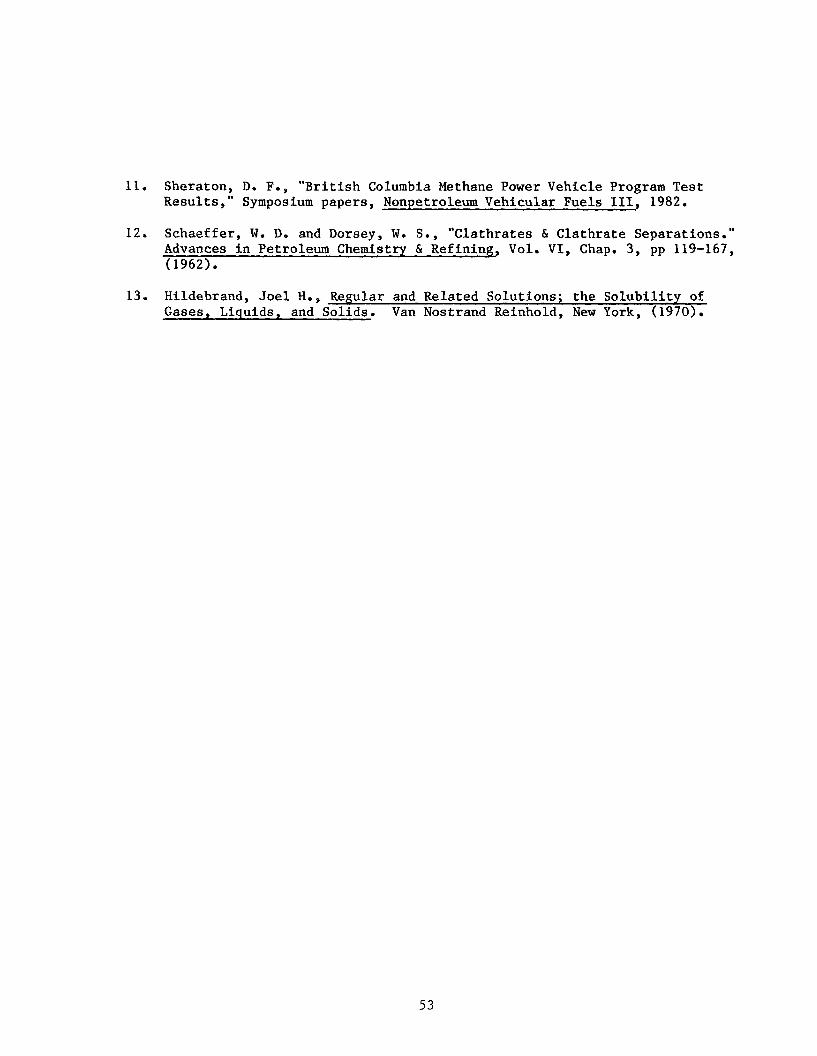
11. Sheraton, D. F., "British Columbia Methane Power Vehicle Program Test Results," Symposium papers, Nonpetroleum Vehicular Fuels 111, 1982.
12. Schaeffer, W. D. and Dorsey, W. S., "Clathrates & Clathrate Separations." Advances in Petroleum Chemistry & Refining, Vol. VI, Chap. 3, pp 119-167, (1962).
13. Hildebrand, Joel H., Regular and Related Solutions; the Solubility of Gases, Liquids, and Solids. Van Nostrand Reinhold, New York, (1970)
53

LD x W \ UJ Lk: W I- -I
I 0 fY 0
x W x 3 -I 0 > W Lk: 0
H
H
a
35
30
25
20
15
18
5 -
0 x CII \ LD lx w I- H -I
I 0 IY U H x W x 3 J 0 > W lx 0 a
-
-
-
-
-
-
APPENDIX A.
PORE S I Z E D I S T R I B U T I O N FOR CARBON SAMPLES
PORE SIZE DISTRIBUTION BY N2 DESORPTION 40
Legend
0 20 40 60 ea iaa 120 140 168 180 200
PORE RADIUS flNGSTROMS
PORE SIZE DISTRIBUTION BY N2 DESORPTION 30 1
0' I I I I I I
0 4 0 88 120 160 2 0 8 2 4 0 280
PORE RflDIUS ANGSTROMS
A-l

m x (3 \ m rY W t- H -I I 0 rY u t W x 3 J 0 > W rY 0
H
a
228
2aa
lea
168
148
128
iaa ea
6 8
4a
2a
a
PORE SIZE DISTRIBUTION BY N 2 DESORPTION
- - - - - - - - - -
I I I I I I I 1 I 1
cn x (3 \ m w W t- J I 0 V
x W x 3 J 0 > W a: 0
H
H
a
PORE SIZE DISTRIBUTION BY N2 DESORPTION
30 r Legend
c-4
a I I I I b I 1 I I 1
a 2s sa 75 100 12s isa 17s 2aa 22s 256
PORE RADIUS ANGSTROMS
A-2

r W \ cn Q W I- J
I 0 lY
I: W I: 3 -I 0 > W Q 0
H
z
a
cn x W \ cn Q W t- J
I 0 Q 0 t W t 3 -J 0 > W lY 0
H
W
a
100
88
68
4 0
20
0
I
PORE SIZE DISTRIBUTION BY N2 DESORPTION
Legend
0 c-5
0 25 50 75 1 80 125 150
PORE RADIUS ANGSTROMS
PORE SIZE DISTRIBUTION BY N2 DESORPTION 1
78
68
58
4 8
38
28
10
0 8 0 25 50 75 100 125 158 175 208 225 258
PORE RADIUS ANGSTROMS
A-3

cn E: u \ cn IY W I- -I
I 0 e u E: W E: 3 -I 0 > W IY 0
H
H
a
25
20
15
10
5 .
PORE SIZE DISTRIBUTION BY N2 DESORPTION
30 I -
-
.
.
Legend
0 c-7 Legend
0 c-7
0-l 1 I 1 I I I
0 20 40 60 e0 100 120 140 160 180 200 220
PORE RRDIUS ANGSTROMS
PORE RRDIUS RNGSTROMS
A-4
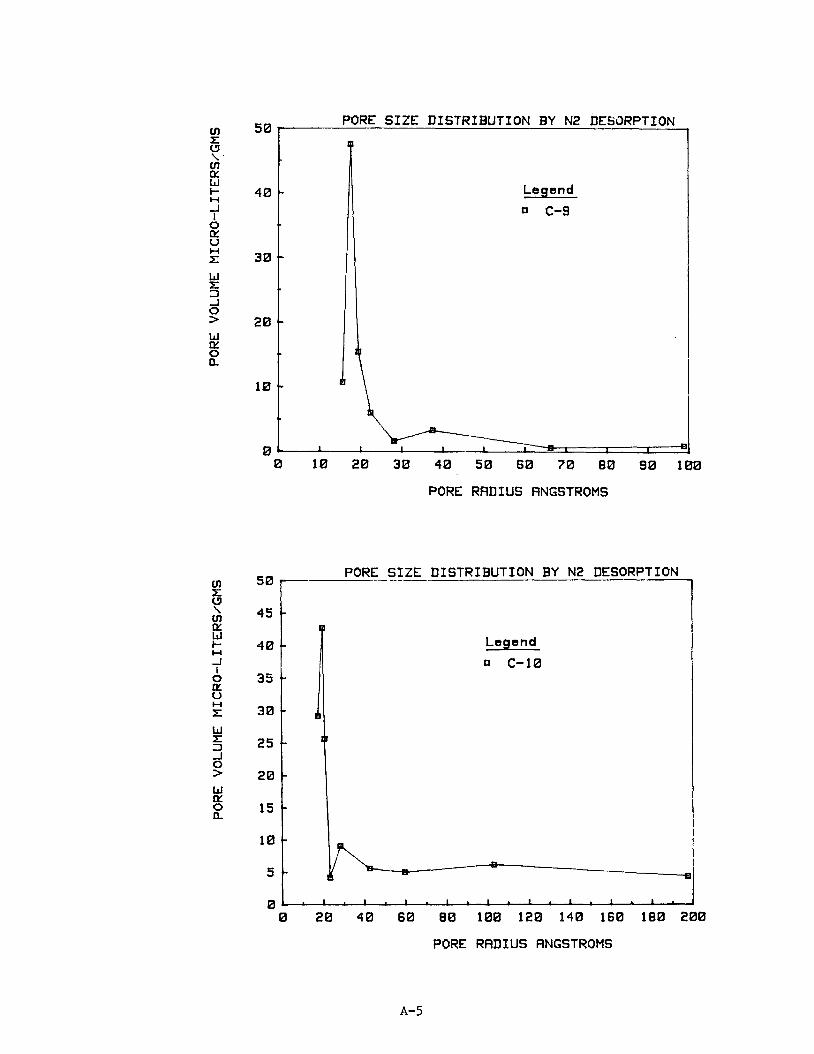
II) II u \ cn rY W I- H J
I 0 [k: V
I: W z 3 J 0 > W [k: 0 (L
H
0) t W \ cn [k: W t- -I I 0 fY 0
II W x 3 -J 0 > W n! 0
H
H
a
4s
4 0
35
30
PORE SIZE DISTRIBUTION BY N2 DESORPTION 50
40 Legend
cl c-9
30
20
10
0 0 10 20 3 0 40 50 60 70 e0 90 180
' -
-
- -
PORE RRDIUS ANGSTROMS
PORE SIZE DISTRIBUTION BY N2 DESORPTION -- __ so r
I
Legend
cl c-10
Legend
cl c-10
0 0 20 4 0 60 80 100 120 140 160 180 200
PORE RADIUS ANGSTROMS
A-5

rn I: c3 \ cn a: w b-
J I 0 CY V
r w I: 3 J 0 > W a: 0
l-4
W
a
Ln x W \ ul a: W I- H -I I 0 a: W H
W II: 3 -I 0 > W a: 0 a
PORE SIZE DISTRIBUTION BY lj2 DESORPTION _ - ~ - -
20 i
15
10
5
0
Legend
0 c-11
t i f
L .L( I I I I 1
0 50 100 150 200 250 300 350
PORE RRDIUS RNGSTROMS
PORE SIZE DISTRIBUTION BY N2 DESORPTION
30 r 25 -
20 -
15 -
10 -
5 -
L e g e n d
c-12
0 50 100 150 2 00 250
PORE RflDIUS ANGSTROMS
A-6
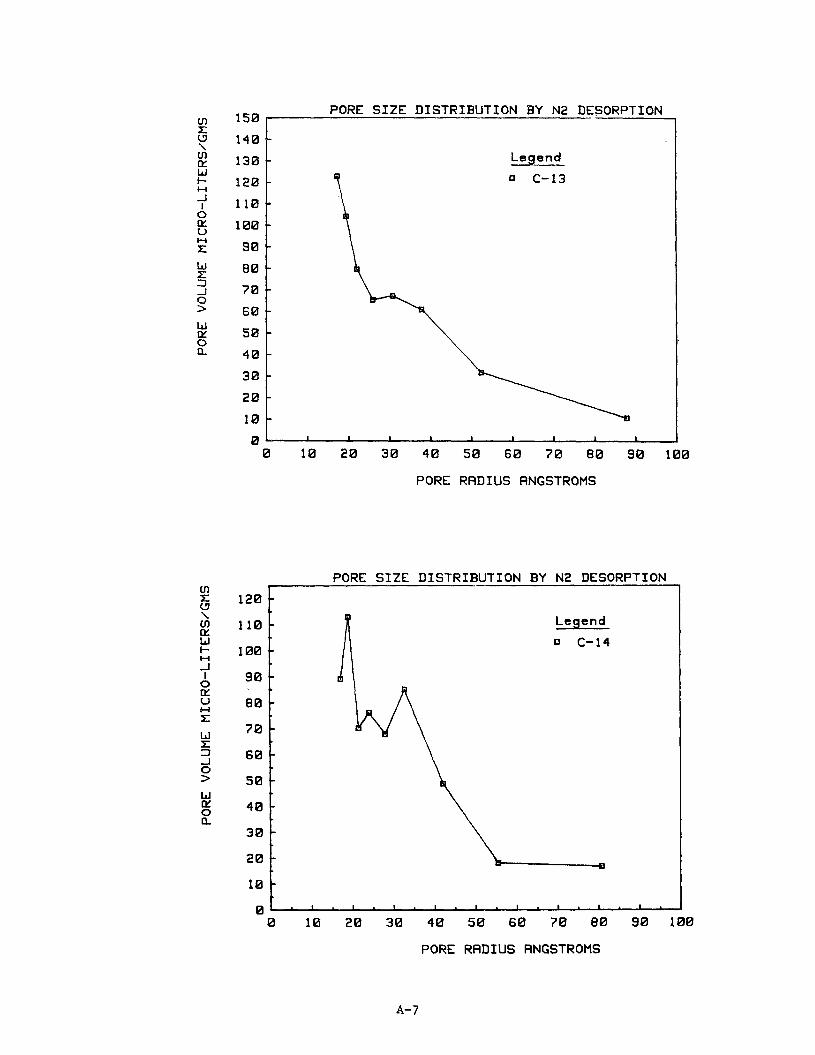
cn I: CII \ cn IY w I- C(
-I I 0 D: u s2 w z 3 J 0 > w IY 0 0
H
150
140
130
120
110
100
90
80
7 0
60
50
4 0
30
20
10
0
PORE SIZE DISTRIBUTION BY N2 DESORPTION
- Legend -
- 0 C-13
- - - - - - - - - - -
I I I 1 I I I 1 I
cn E: (3 \ u) D: W I-
-J I 0 fY U
z W z 3 J 0 > W w 0
H
W
a
110
100
90
80
70
6 0
5 0
40
3 0
2 0
PORE SIZE DISTRIBUTION BY N2 DESORPTION 120 F
- - - - - - - - -
Legend
0 C-14
D
0 0 0 16 20 30 40 5 0 6 0 7 0 88 9 0 100
PORE RADIUS RNGSTROMS
A- 7
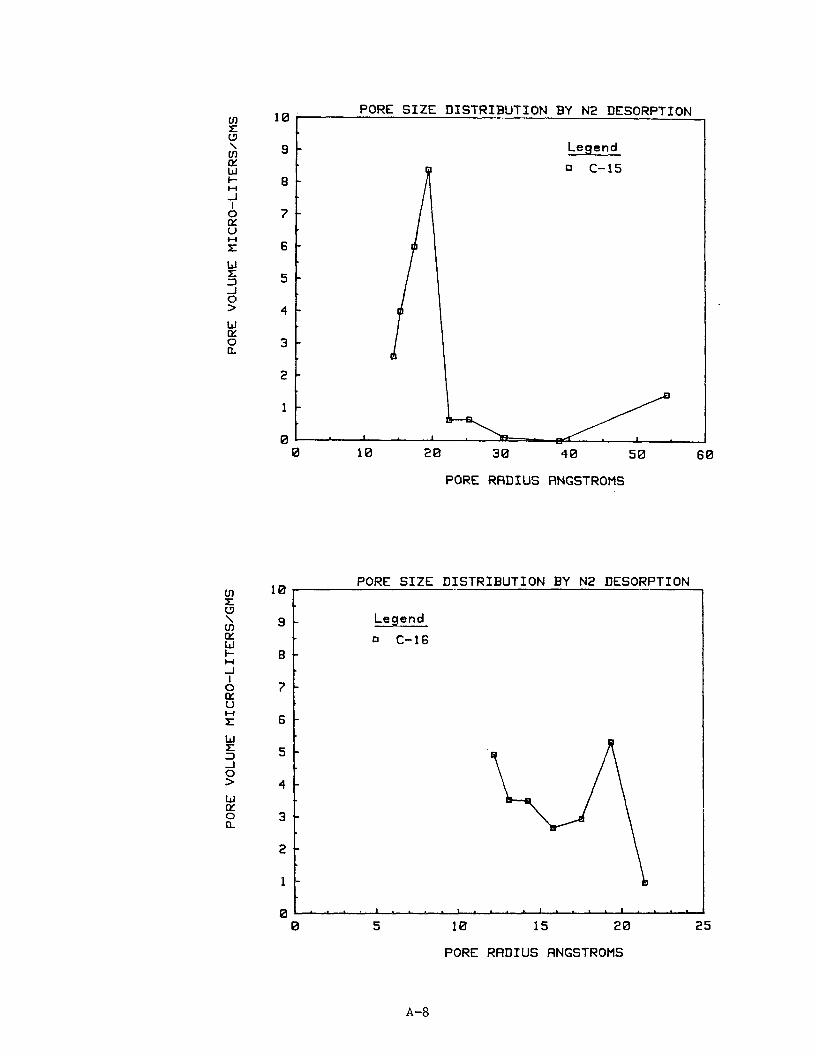
n -I
I 0 a: W
z H
10
9 -
8 -
7 -
6 -
W z 3 J 0 >
--
Legend
0 C-16
v) t u \ v) IY W I- -J
1 0 a: W
t w t 3 -I 0 > W a: 0 Q
C(
H
PORE SIZE DISTRIBUTION BY N2 DESORPTION 10
9
8
7
6
5
4
3
2
1
0
0 C-15
0 10 2 0 30 40 50 6 0
PORE RADIUS RNGSTROMS
0 5 10 15 20 25
PORE RADIUS ANGSTROMS
A-8
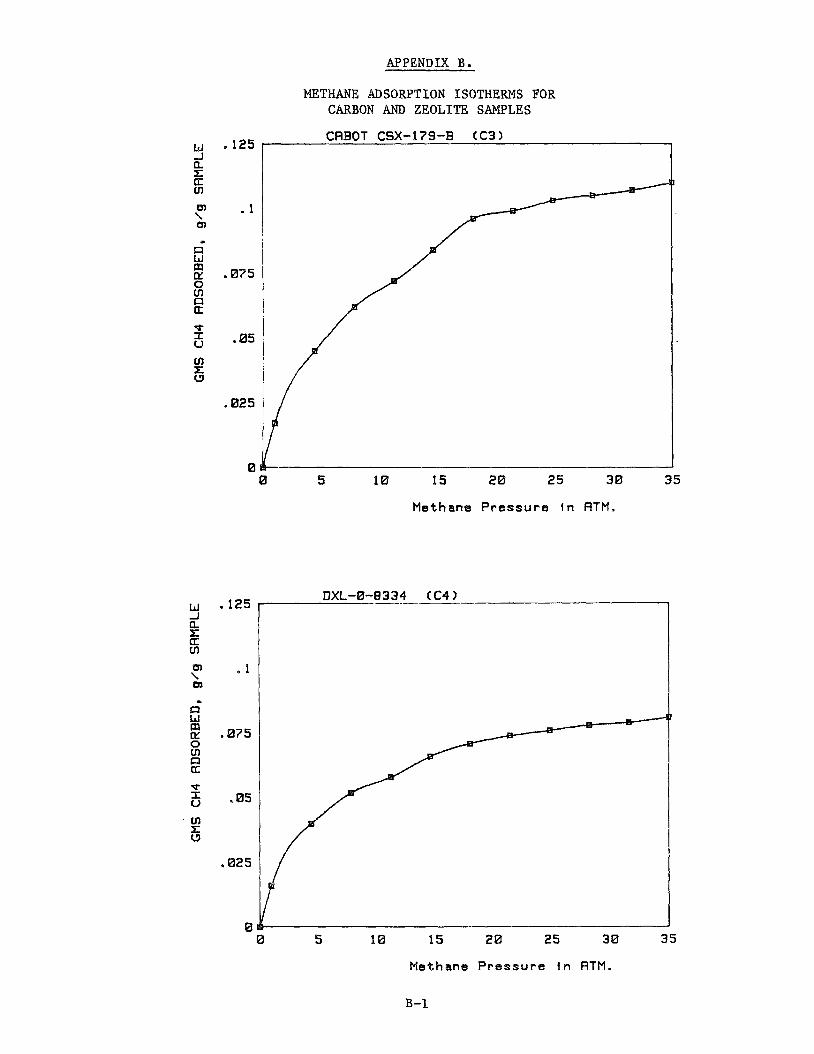
APPENDIX Be
w -.I
E ul 8) \ 8)
R w m a: 0 tn R a: * I u cn I: u
a a
-
.125
. 1
.075
.05
825
0
.I25
.1
,075
. os
M E T W E ADSORPTION ISOTHERMS FOR CARBON AND ZEOLITE S M L E S
CABOT CSX-I 79-PJ (C3 )
0 5 10 15 20 25 30 35
Methane P r e s s u r e In RTM.
0 61 5 10 15 20 25 30 35
Methane P r e s s u r e i n RTM.
B-1
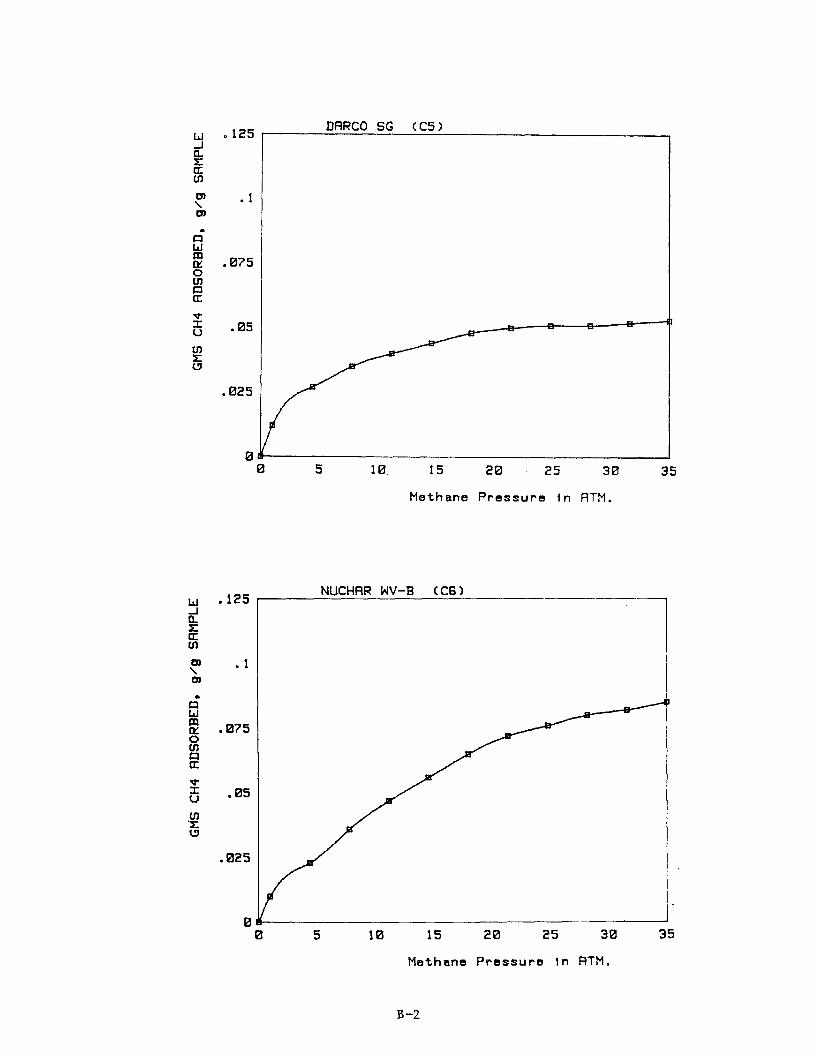
DRRCO SG (C5) w -125 J
r: CII tn
0) .1 \ 0)
n
1
n w @ .075 0 tn R
v a
6 .05 tn r u
.025
0 0 5 1.0. 15 2 0 25 30 35
Methane P r e s s u r e i n RTM.
.125 -I n x a tn
03 . l \ 03
n W m 0 UJ 17
0
. ty .a75
a
6 .05 tn 't W
.025
0 - 0 5 10 15 2 0 25 3 0 35
Methane P r e s s u r e I n RTM.
B -2

w -125 -I
r m
\ 0)
R w $ .075 0 tn n U -u 3 .05 m r eJ
n a
m .1
.)
.025
El
w .125 -I n r a m 01 .1 \ m
n w m IY .a75 0 cn n a
I)
- 0 5 10 15 20 25 30 35
Methane P r e s s u r e i n ATM.
r
m t eJ
.025
El
I
- 0 5 10 15 20 25 30 35
Methane P r e s s u r e i n RTM.
B-3

I) 125
.1
. 8 5
e 125
- 1
0 B75
0 65
.E25
5 15 20 25 30 35
ssure fn RTM.
WPfCO JXC (C10)
0 5 10 15 20 25 30 35
Methane Pressure i n RTM.
B -4

w -I Q t U rn 0) \ m I
R W a3 Lt: 0 cn R
w I 0 rn II c!)
a
.I25
.1
e 075
. a5
025
0
CALGON PCB (Cl11
.I25
. I
.075
.05
.025
0
0 5 10 15 20 25 30 35
Methane Pressure i n RTM.
CRLGON BPL (C12 1
0 5 10 15 20 25 30 35
Methane Pressure i n ATM.
B-5

W -1
IT CK cn 0, \ 0)
a
- n W m cs: 0 cn U v I W
U J IT u
n
0
W -f
x U cn
\ 0)
n W 111 0 cn
a
m
- m
n a v I u UJ x W
1
.125
. 1
.075
.05
.025
0
. 125
. 1
.075
.05
.025
NORTH RMERICRN CRRBON GlBl ( C 1 3 )
0 5 lb 15 20 25 3 0 35
Methane P r e s s u r e i n ATM.
NORTH RMERICAN CARBON G104 (C14) - . - -. ____
0 5 18 15 20 25 ? 0 35
Methane Pressure i n ATM.
B-6
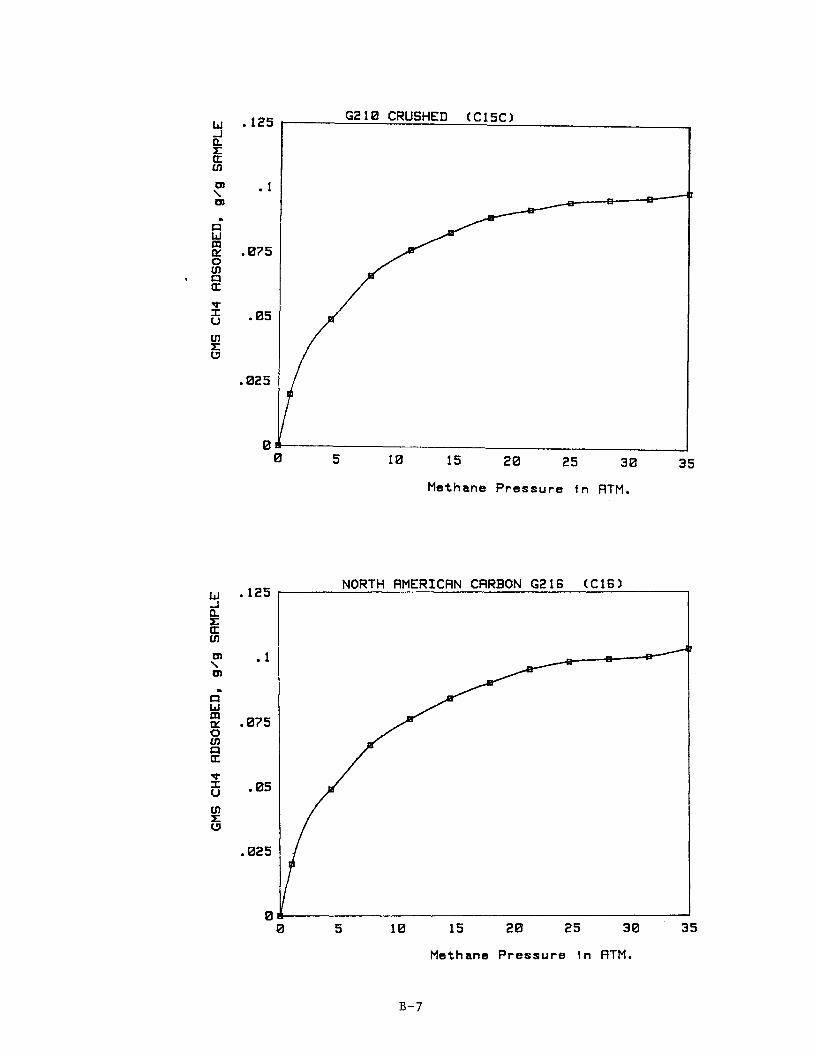
w .125 n t U m \" . 1 m .
R w
0 cn l c l a:
.075
w. 3 . 0 5 m x c3
.025
0
w .125 J r U m m . 1 \ m
n
.. c1 W
0 m R U
0
.E75
6 . 0 5
m x W
.E25
G 2 10 CRUSHED (C15C)
I
5 10 15 2 0 25 3 0 35 0
Methane Pressure i n ATM.
NORTH AMERICAN CARBON G216 (C16)
0 0 5 10 15 20 25 3 0 35
Methane Pressure i n ATM.
B-7

s 125
. I
.875
.05
.025
0 0
SLXC (C17)
5 10 15 20 25 30 35
Methane Pressure i n ATM.
B-8

W -I a t U Lo
a, \ rn
R W m Iy. 0 Lo R U
v I u Lo
W
,.
. 125
. I
.075
.05
.025
3 A MOLECULAR SEIVES ( Z 1 )
0 0 5 10 15 2 0 2 5 ?El 3 5
I25
. 
.075
. a5
M e t h a n e P r e s s u r e i n ATP!.
4 A MOLECULAR SEIVES (22)
5 10 15 20 25 30 35 0
Methane P r e s s u r e I n RTM.
B-9

w .125 -I e z Ln
\
a
m . 1 m
n -
W m 0 m
.075
n a
5 .05
Ln z (3
-3-
.025
0
5A MOLECULAR SEIVES ( 2 3 )
w -125 -I e z Ln
\
a
m .1 m
n W m IL: .075 0 m n 6
6 .05 w
Ln z (3
.025
0
-
E 5 10 !5 2@ 25 3c? 3 5
Methane P r e s s u r e i n ATI.?.
13X MOLECULRR SEIVES ( 2 4 )
0 5 10 15 2 0 25 3c3 35
Methane P r e s s u r e i n ATM.
B-10

W -I a x U cn rn \ rn
n m
n a
W
0: 0 cn
w I 0
cn x W
.I25
. 1
.075
.05
-025
L i - A MOLECULAR SEIVES ( 2 5 )
0 0 5 10 15 2 0 25 3 0 3 5
Methane P r e s s u r e i n ATF?.
. 125
. I
.075
.05
.025
0
AW-300 MOLECULAR SEIVES (ZF)
>-- - 0 5 10 15 20 25 30 35
Methane P r e s s u r e i n ATM.
B-11
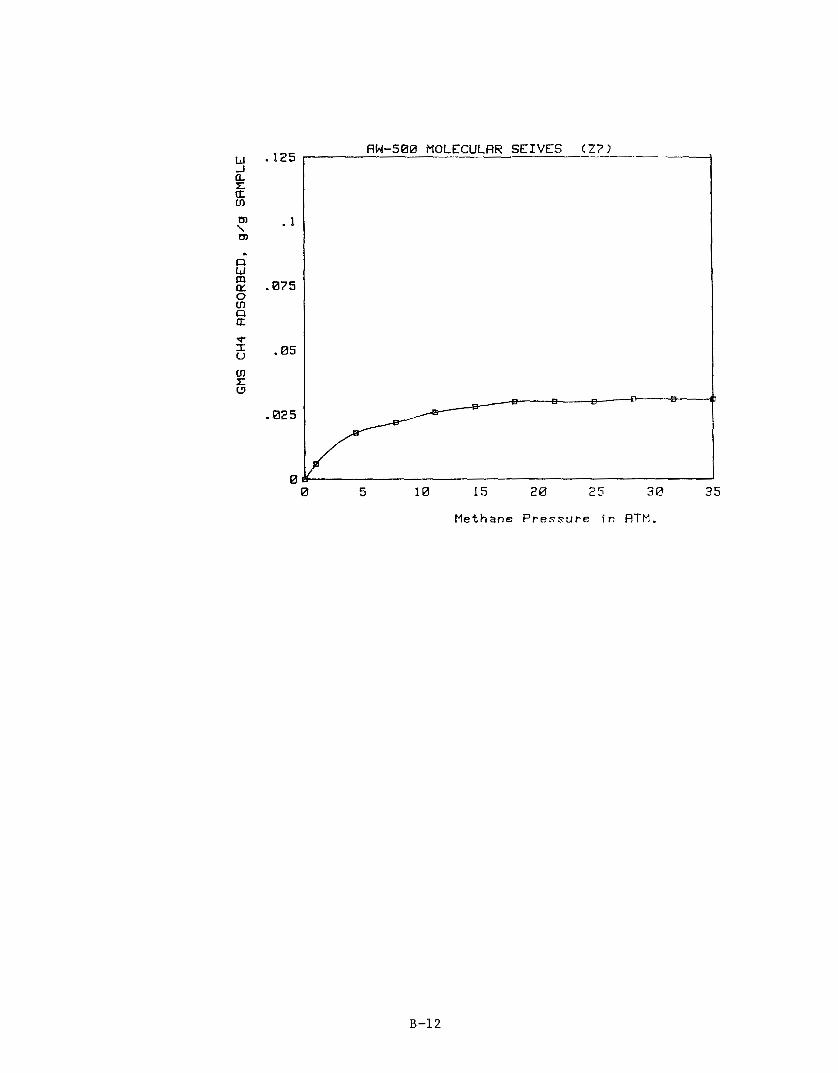
.025
0 5 10 15 2 0 25 38 35
M e t h a n e Pressure i n AlM.
B-12

APPENDIX 6.
SUPPORTING CALCULATIONS FOR TASK 1,2 WORK
I. Estimation of the Fuel Economy of a Gasoline Engine Converted to Run on Natural Gas in a Dual Fuel Mode
Assumptions
o Model vehicle achieves 17 km/g (40 mpg) or 22-9 km/kg (6.54 miles/lb) on gasoline
o Lower heating value of gasoline is 10.5 kcal/gram (18,900 Btu/lb) 1
o Lower heating value of natural gas is 11.56 kcal/gram (20,800 Btu/lb)'
Work carried out by the University of British Columbia (UBC) has provided some quantification of the fuel economies for vehicles operating in a dual fuel mode on gasoline or natural gas.2 12.5% increase in operating efficiencies for vehicles operating on natural gas
over the same vehicle operating on gasoline on the basis of BTU input. This translates into a 23% increase in fuel economy on a mass to mass basis. In other words, the UBC results suggest that our model vehicle which achieves 22.9 km per Kg of gasoline will travel 28 km per Kg of natural gas.
The UBC study documented an average
The proposed explanations for such an improvement in fuel economy were a higher thermal efficiency for the engine operating cycle due t o more complete combustion of the natural gas-air mixture and a leaner stoichiometric ratio in the natural gas mode. However, the performance of the older carbureted engines
used in the UBC study are not representative of the high efficiency, electronic fuel injected engine used in the model vehicle chosen for this study. Conse- quently, most of the 12% efficiency improvements, on a Btu basis, would not be
achieved with a state-of-the-art engine. Not because of a decrease in perfor-
mance on natural gas, but rather a result of improved performance and fuel economy on gasoline.
For the purposes of the modeling work in Task 1.2, it was assumed that 1 kilogram of natural gas delivered about 12% greater range than 1 kilogram of gasoline, 10% as a consequence of the higher energy content of natural gas and 2% as the result of improved engine efficiency.
To conduct a more meaningful analysis of the potential efficiency improve- ment or vehicle range (beyond that performed here) would require the following:
Modeling of natural gas-air and gasoline-air cycles for selected design specification of IC engines and numerical simulation of the performance within a defined range of operating conditions
c-1
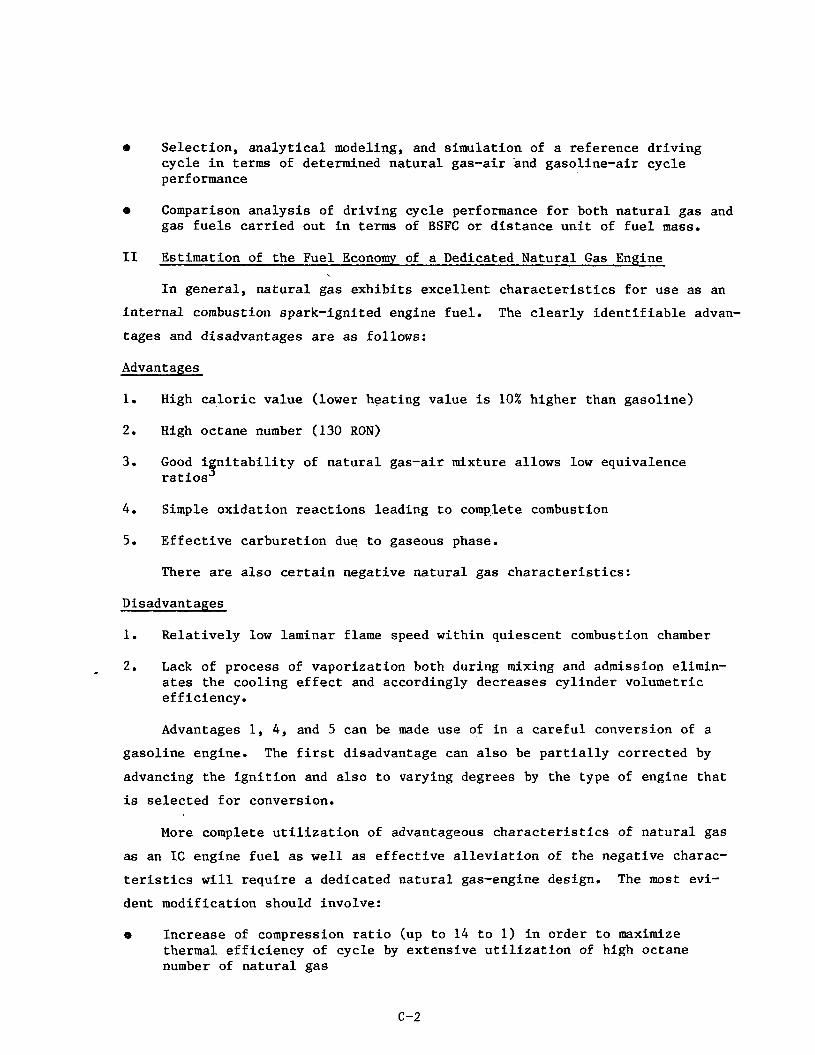
e Selection, analytical modeling, and simulation of a reference driving cycle in terms of determined natural gas-air and gasoline-air cycle performance
o Comparison analysis of driving cycle performance for both natural gas and gas fuels carried out in terms of BSFC or distance unit of fuel mass.
IT Estimation of the Fuel Economy of a Dedicated Natural Gas Engine
In general, natural gas exhibits excellent characteristics for use as an internal combustion spark-ignited engine fuel. The clearly identifiable advan-
tages and disadvantages are as follows:
Advantages
1. High caloric value (lower heating value is 10% higher than gasoline)
2. High octane number (130 RON)
3 . Good i nitability of natural gas-air mixture allows low equivalence 5 ratios
4. Simple oxidation reactions leading to comp.lete combustion
5. Effective carburetion due to gaseous phase.
There are also certain negative natural gas characteristics:
Disadvantages
1. Relatively low laminar flame speed within quiescent combustion chamber
2. Lack of process of vaporization both during mixing and admission elimin- ates the cooling effect and accordingly decreases cylinder volumetric efficiency.
Advantages 1, 4 , and 5 can be made use of in a careful conversion of a gasoline engine. The first disadvantage can also be partially corrected by
advancing the ignition and also to varying degrees by the type of engine that is selected for conversion.
More complete utilization of advantageous characteristics of natural gas
as an IC engine fuel as well as effective alleviation of the negative charac- teristics will require a dedicated natural gas-engine design. The most evi- dent modification should involve:
o Increase of compression ratio (up to 14 to 1) in order to maximize thermal efficiency of cycle by extensive utilization of high octane number of natural gas
c-2

e Application of "fast burn" combustion system in order to alleviate disadvantage of slow flame propagation of natural gas-air mixture and enhance cycle thermal efficiency by bringing cycle conditions closer to those characterizing a constant-volume cycle
e Application of some sort of supercharging to alleviate the deterioration of volumetric efficiency caused by the lack of cooling upon carburetion.
Figure C-1 defines the functional relation between theoretical thermal efficiency of an internal combustion-spark ignition engine and design compres- sion ratio developed for gasoline-air mixtures with different equivalency ratios Fro4 a "dedicated"'natura1 gas engine can be represented in this figure by the transition from Point A to Point B.
compression ratio rG = 9 typical for a modern gasoline engine operating on slightly over-stoichiometric mixture with FR = 1.1 which seems to be approp- riate for assuring the satisfactory combustion process in a gasoline engine
The process of transition from a converted natural gas engine t o
Point A represents an engine with a
converted to natural gas fuel. Although lean methane-air mixtures have good ignitability, their poor flame propagation characteristics seem to'prevent
effective burning in a conventional gasoline mixture combustion chamber. Satisfactory fast combustion of natural gas mixtures in such conditions will call for an ignition advance and for a rather enriched equivalency ratio. A dedicated design can be provided with a compression ratio rNG = 11.5 and a combustion system intentionally promoting faster combustion, therefore capable of accepting leaner mixtures. Point B can be then quite realistically extrap- olated as to be located on curve FR = 0.8 and abscissa rNG = 11.5. trapolation suggests a possible corresponding thermal efficiency gain An' = 8%. An' can still be increased by supercharging allowing for approximately a 5% additional increase in theoretical thermal efficiency of an IC engine. The total efficiency increase for a dedicated natural gas IC engine will then be approximately 13% over a natural gas converted version, or if the gasoline engine is taken as the baseline, the potential efficiency improv'ement of a natural gas dedicated design would be about 25%.
This ex-
To a first approximation, the ranges of the model vehicle described in Task 1.2 and listed in Tables 21 and 22 for natural gas operation can be extended by 13% if a dedicated engine is substituted for a converted gasoline
engine.
c-3

0.65
0.60
0.55
0.50
F 0.45
0.40
0.35
0.30
0.25 0
r
Figure C-1. FUNCTIONAL RELATIONSHIP BETWEEN THEORETICAL THERMAL EFFICIENCY AND COMPRESSION RATIO
c -4
References for Appendix C
1. Assessment of Methane-Related Fuels for Automotive Fleet Vehicles, DOE/CE/50179-1, February 1982, page 2-29.
2. Sheraton, D. F., "B. C. Methane Power Vehicle Program Test Results." Symposium papers, Nonpetroleum Vehicular Fuels 111, 1982.
3. Thring, R. H., "Gasoline Engines and Their Future," Mechanical Engineering, October 1983.
4 . Taylor, C. F., "The Internal Combustion Engine in Theory and Practice." The MIT Press, Second Edition, 1977.
c-5

APPENDIX D.
EVALUATION OF CLATHRATION COMPOUNDS AS A MEANS OF STORING NATURAL GAS
1-16 CLATHRATES
1 Background
I n t e r e s t i n i nc lus ion compounds i n recent years has been found i n two
major areas. I n the f i r s t and most recent , the binding or complexing of gues t
spec ie s by unimolecular hos t s , i n s o l u t i o n , has received much a t t e n t i o n , par-
t i c u l a r l y i n the f i e l d s of biology and c a t a l y s i s . The second relates t o t h e
study of c r y s t a l l i n e inc lus ion compounds o r c l a t h r a t e s which may be subclas-
s i f i e d as:
0 The cage c l a t h r a t e s i n which the gues t molecules are imprisoned i n d is - crete closed c a v i t i e s or cages, i n the host c r y s t a l and inc lude the hydro- quinone and ice c l a t h r a t e s
0 The channel type i n which the guest spec ies are accommodated i n continu- ous channels i n the c r y s t a l such as the urea and th iourea adducts
0 The l a y e r t y p e - i n which the guest spec ie s are s i t u a t e d between l aye r s (e.g., wi th g raph i t e and c e r t a i n c l ays ) .
I n addi t ion , molecular s i eves and, i n p a r t i c u l a r , t h e z e o l i t e s are sometimes
c l a s s i f i e d *as c l a t h r a t e o r i nc lus ion hos t s s i n c e they possess d i s c r e t e cages
and channels, and inc lus ion depends on t h e molecular dimensions of t h e guest
molecules r e l a t i v e t o t h a t of t he channels and cages of the hos t . 17,18 From
t h e point of view of methane s torage , t h e c l a t h r a t e type of i nc lus ion is of
greatest i n t e r e s t . However, t he re may be a l a rge overlap i n concept and prin-
c i p l e between inc lus ion i n the s o l u t i o n s and i n c l a t h r a t e s . Furthermore,
i nc lus ion i n s o l u t i o n s may provide a means of s i g n i f i c a n t l y enhancing methane
s torage.
The t e r m c l a t h r a t e w a s o r i g i n a l l y def ined, on t h e bas i s of x-ray d i f f r ac -
t i o n s t r u c t u r a l ana lys i s of a number of such e n t i t i e s by Powell and a s s o c i a t e s ,
as a compound "in which two or more molecular components are assoc ia ted with-
out ordinary chemical union but through complete enclosure of one set of
molecules i n a s u i t a b l e s t r u c t u r e formed by another. **15
c l a t h r a t e s are noteworthy:
Two aspects of t he
0 The c r y s t a l l i n e l a t t i ce s t r u c t u r e of t he host is usua l ly not i n i t s nor- m a l c r y s t a l l i n e mode (a-form) but i n a form (usua l ly r e fe r r ed t o as the 0-form) which is usua l ly less s t a b l e i n the absence of guest molecules than t h e r f orm.
D-1
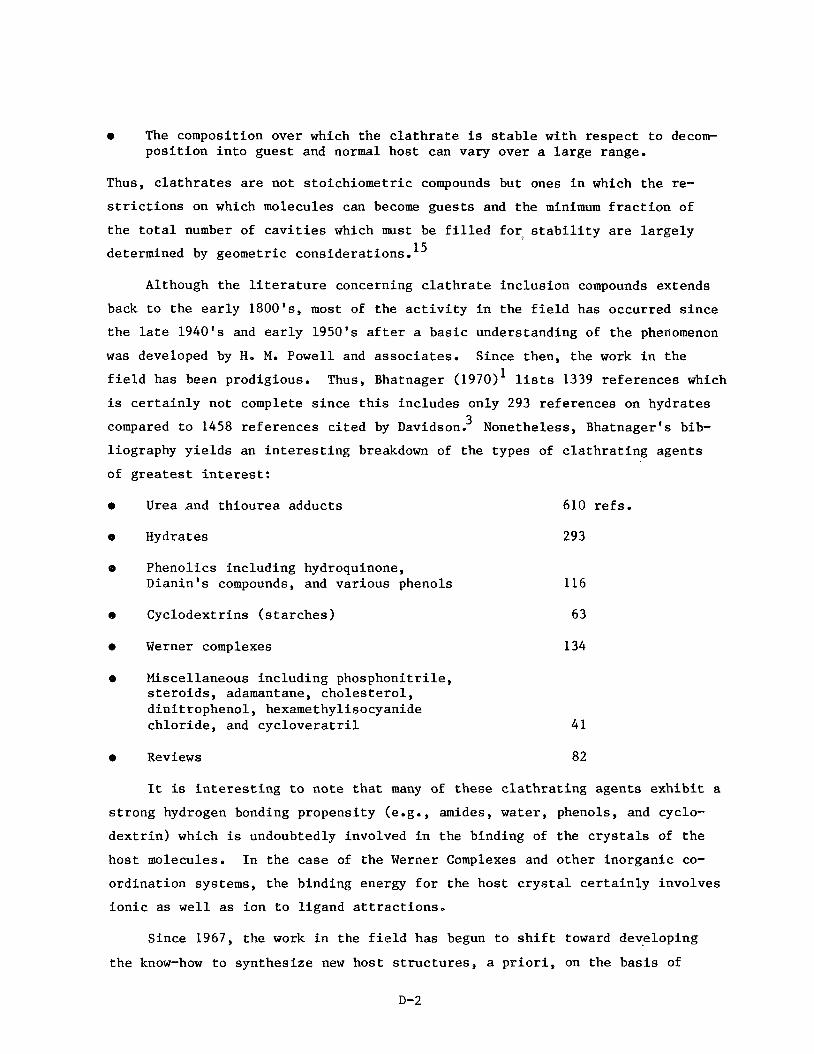
0 The composition over which the clathrate is stable with respect to decom- position into guest and normal host can vary over a large range.
Thus, clathrates are not stoichiometric compounds but ones in which the re- strictions on which molecules can become guests and the minimum fraction of
the total number of cavities which must be filled foro stability are largely determined by geometric considerations. 15
Although the literature concerning clathrate inclusion compounds extends back to the early 1800's, most of the activity in the field has occurred since the late 1940's and early 1950's after a basic understanding of the phenomenon
was developed by H. M. Powell and associates. Since then, the work in the field has been prodigious. is certainly not complete since this includes only 293 references on hydrates
Thus, Bhatnager (1970)l lists 1339 references which
compared to 1458 references cited by Davidson? Nonetheless, Bhatnager's bib- liography yields an interesting breakdown of the types of clathrating agents
of greatest interest:
0 Urea .and thiourea adducts
o Hydrates
8 Phenolics including hydroquinone, Dianin's compounds, and various phenols
e Cyclodextrins (starches)
e Werner complexes
9 Miscellaneous including phosphonitrile, steroids, adamantane, cholesterol, dinitrophenol, hexamethylisocyanide chloride, and cycloveratril
0 Reviews
610 refs.
293
116
63
134
41
82
ing a ents exhibi It is interesting to note that many of these clathra a strong hydrogen bonding propensity (e.g., amides, water, phenols, and cyclo- dextrin) which is undoubtedly involved in the binding of the crystals of the
host molecules. In the case of the Werner Complexes and other inorganic co- ordination systems, the binding energy for the host crystal certainly involves ionic as well as ion to ligand attractions.
Since 1967, the work in the field has begun to shift toward developing
the know-how to synthesize new host structures, a priori, on the basis of
D-2
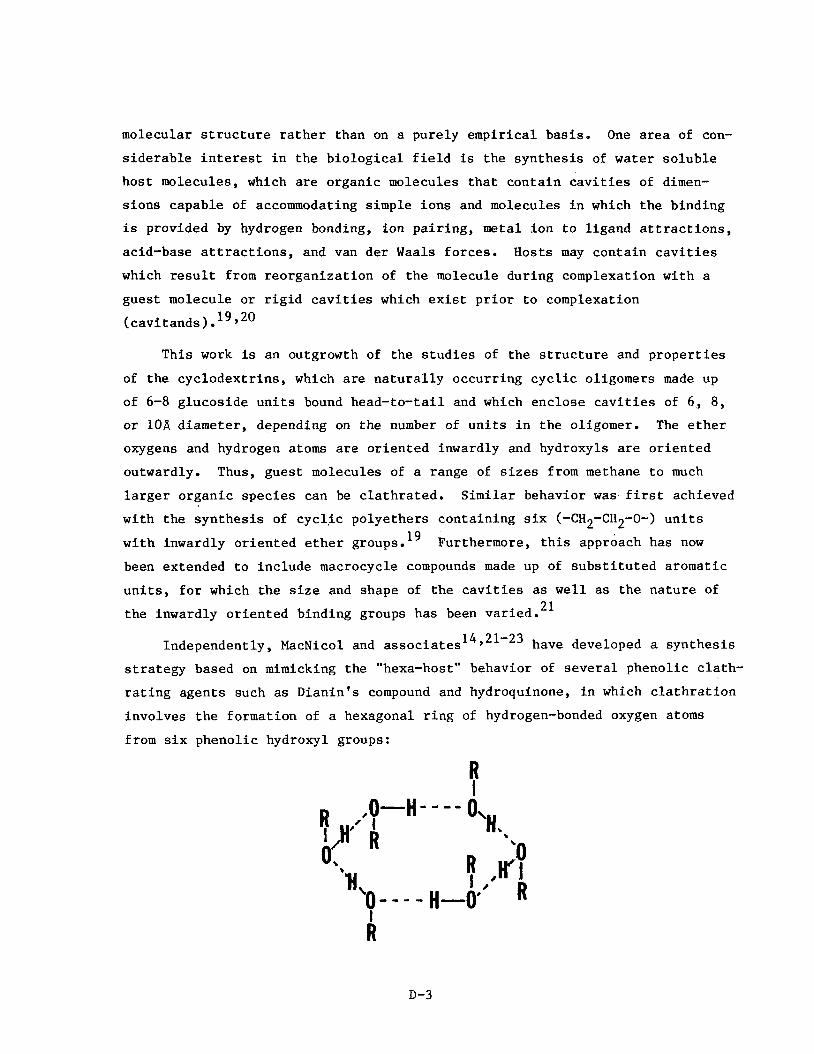
molecular structure rather than on a purely empirical basis. One area of con- siderable interest in the biological field is the synthesis of water soluble host molecules, which are organic molecules that contain cavities of dimen- sions capable of accommodating simple ions and molecules in which the binding is provided by hydrogen bonding, ion pairing, metal ion to ligand attractions, acid-base attractions, and van der Waals forces. Hosts may contain cavities which result from reorganization of the molecule during complexation with a guest molecule or rigid cavities which exist prior to complexation (cavitands). 19,20
This work is an outgrowth of the studies of the structure and properties
of the cyclodextrins, which are naturally occurring cyclic oligomers made up of 6-8 glucoside units bound head-to-tail and which enclose cavities of 6 , 8, or 108 diameter, depending on the number of units in the oligomer. The ether oxygens and hydrogen atoms are oriented inwardly and hydroxyls are oriented outwardly. Thus, guest molecules of a range of sizes from methane to much
larger organic species can be clathrated. Similar behavior was first achieved with the synthesis of cyclic polyethers containing six (-CH2-CH2-0-) units
with inwardly oriented ether groups. l9 Furthermore, this approach has now
been extended to include macrocycle compounds made up of substituted aromatic units, for which the size and shape of the cavities as well as the nature of
the inwardly oriented binding groups has been varied. 21
Independently, MacNicol and associates 14,21-23 have developed a synthesis
strategy based on mimicking the "hexa-host" behavior of several phenolic clath-
rating agents such as Dianin's compound and hydroquinone, in which clathration involves the formation of a hexagonal ring of hydrogen-bonded oxygen atoms from six phenolic hydroxyl groups:
D-3
Each group of s ix s u b s t i t u t e d phenol molecules is assoc ia ted wi th two cavi-
t ies , one above the hexagonal hydrogen bonded planes and one below.
They were then ab le t o demonstrate t h a t t he c l a t h r a t i o n a b i l i t y of such
hexagonal s t r u c t u r e s could be simulated using t h e permanent s t r u c t u r e of cer-
t a i n hexa-subst i tuted benzene r i n g compounds. Thus, two independent approaches.
s t a r t i n g wi th empir ica l observat ions of two r a d i c a l l y d i f f e r e n t types of c l a th -
rates have converged on a c y c l i c model f o r t h e syn thes i s of new clathrate hos ts .
However, the gues t molecules bound by both types of c l a t h r a t e hos t s so f a r
have been r e l a t i v e l y larger than methane.
Thermodynamics of C la th ra t e S t a b i l i t y
21,22
16
The thermodynamics of c l a t h r a t e s t a b i l i t i e s has been reviewed by Child
(1964)15 and w i l l not be repeated here.
of i n t e r e s t i n guiding f u r t h e r syn thes i s attempts. H e po in ts out t h a t i n many
respects c l a t h r a t e s are s imilar t o equi l ibr ium s o l u t i o n s i n t h a t :
However, the g i s t of h i s a n a l y s i s i s
0 Solu te molecules are placed i n c a v i t i e s wi th in t h e so lvent
o The energy of i n t e r a c t i o n between hos t and guest i s normally s m a l l and t h e entropy term is similar i n magnitude t o t h e entropy of vapor iza t ion of a s o l u t e from a s o l u t i o n which obeys Raoul t ' s l a w
0 The gues t may be s a i d t o obey Henry's l a w i n the sense t h a t guest-guest i n t e r a c t i o n s are n e g l i g i b l e compared t o the guest-host i n t e r a c t i o n s .
On t h i s bas i s , Child suggests t h a t t h e entropy t e r m con t r ibu t ion t o sta-
b i l i t y i s r e l a t i v e l y small and t h a t the s t a b i l i t y depends pr imar i ly on the
o v e r a l l hea t of formation of the c l a t h r a t e and, t he re fo re , on the magnitude of
i n t e r a c t i o n between hos t molecules, and between the gues t and the surrounding
molecules of t h e hos t lattice.
number of c l a t h r a t e s formed from hydroquinol and water have been shown t o be
about 0.8-2.2 of the va lue of two t i m e s t h e heat of vapor iza t ion AH of t he
guest molecules, i.e., AHp = 0.8 t o 2.2 (2AHvap).
Thus, the hea t s of formation (AHp) f o r a
VaP
An explana t ion f o r t hese high r a t i o s w a s given i n terms of:
0 The removal of a guest molecule from a c l a t h r a t e leaves an empty cav i ty (with l i t t l e i n t e r a c t i o n between hos t molecules ac ross the ho le ) , whereas the removal of a molecule of guest from a l i q u i d leaves no ho le
0 The i n t e r a c t i o n s between guest molecules and the w a l l of t he cage may be g r e a t e r than between t h e two guest molecules i n t h e l i q u i d s ta te
D-4
o The coord ina t ion number of t he guest molecule may be l a r g e r i n t h e cav i ty than i n the l i q u i d state. Thus, t he vapor iza t ion of t he pure guest may be v i sua l i zed as a two-step process i n which t h e vapor iza t ion s t e p leaving empty holes i n the remaining l i q u i d has an enthalpy increase of 2Mvap, and t h e subsequent co l l apse of t he holes an enthalpy decrease of -AHvap
I n the case of c l a t h r a t e s , on the o the r hand, f o r a ne t change of AH t h e vapor iza t ion en tha py change of 2 AH is counterbalanced not by t h e co l l apse of t he holes remaining, but by tge enthalpy change i n convert ing t h e f3 s t r u c t u r e t o t h e a-form which i s o f t en much less than AH Fur- thermore, the hea t of vaporizing the guest molecule from the cIg&ate s t r u c t u r e MY a c t u a l l y be g r e a t e r than the hea t of vapor iza t ion of t he pure l i q u i d because of t he i n t e r a c t i o n between guest and host by an amount depending on t h e energy of i n t e r a c t i o n (which depends on the chem- ical na ture of t he gues t and hos t ) and the coordinat ion number of i n t e r - a c t i o n (which w i l l depend on the s i z e and shape of t he cav i ty r e l a t i v e t o t h a t of CH4).
yap' V P
S ince methane is non-polar i n na ture , t h e host-guest i n t e r a c t i o n s are l i k e l y t o be l imi t ed t o van der Waals forces . Thus, t he most impor- t a n t host-guest i n t e r a c t i o n f a c t o r a f f e c t i n g the s t a b i l i t y of i t s c la th- rates w i l l probably be the diameter of the c a v i t i e s formed by the hos t molecules. r a t i o s f o r i t s c l a t h r a t e with hydroquinone (1 .8) and wi th water (0.89 are approximately' i nve r se ly propor t iona l t o t h e cav i ty diameters of t he two, 4.2 and 5.2 & respec t ive ly . However, the i n t e r a c t i o n s between methane and i ts host might be enhanced somewhat i f t he hos t c a v i t i e s were l ined with groups (such as hydroxyl or amino groups) having a high hydrogen bonding power as i n t h e case of t he apparent ly enhanced s o l u b i l i t y of methane i n a lcohol so lven t s a t a given s o l u b i l i t y parameter. I n t h e case of c l a t h r a t e s wi th hydrogen bonding power, one would not have t o be con- cerned wi th the s o l u b i l i t y parameter of t he host .
This is cons i s t en t with the f a c t t h a t measured AHp/2AHv
3,25,26 1.0 Natura l Gas Hydrates
Perhaps the most f a m i l i a r example of c l a t h r a t i o n t o the gas indus t ry are
the hydrates of methane and o ther n a t u r a l gas hydrocarbons.
became of i n t e r e s t t o t h e U. S . gas indus t ry around 1934 when i t w a s noted
t h a t plugging of n a t u r a l gas t ransmission l i n e s was no t due t o f r eez ing of
water a t O"F, but t o formation of hydrates of hydrocarbon cons t i t uen t s of
n a t u r a l gas a t temperatures as high as 1 5 0 ' ~ ? . ~ ~
t h a t gas hydrates e x i s t i n two d i s t i n c t but d i f f e r e n t c r y s t a l s t r u c t u r e s
depending on t h e s i z e of t he guest molecule:
These hydrates
It w a s subsequently found
0 S t r u c t u r e I hydrates cons i s t of s m a l l hydrat ing (gues t ) molecules, f o r example, A r , K r , X e , CH4, C H have 46 water (hos t ) molecufei 'ani 8 c a v i t i e s (voids , cages) where guest (hydrat ing) molecules may be located. f i l l e d ) would be -
H S, and CH3C1. The cubic u n i t cells
The i d e a l formula ( a l l c a v i t i e s
D-5

(So lu te ) "46/8 H20 o r (Solute) "5.75 H20
a S t r u c t u r e I1 hydrates c o n s i s t of l a r g e r hydrat ing (guest) molecules; f o r example, C3H8, CHC13, and C2H C1 . ( h o s t ) molecules and 8 voids 5 c a v i t i e s , cages) f o r guest molecules. The i d e a l formula ( a l l c a v i t i e s f i l l e d ) would be -
The cubic u n i t cells have 136 water
(Solute) '136/8 H20 o r ( S o l u t e ) * l 7 H 2 0
The above s toichiometry i n d i c a t e s t h a t methane could be s to red as the
hydrate t o the e x t e n t of 0.155 g of methane/g water.
Unfortunately, methane hydrate i s not s u f f i c i e n t l y s t a b l e f o r purposes of
s to rage a t ambient condi t ions. This is shown by Figure D-1 which i n d i c a t e s
t h a t methane hydrate i s most s t a b l e above 4000 ps ig a t 70°F (27.7 W a a t 2 loC) ,
or above 20,000 ps ig a t 100°F27 (138 MPa a t 38OC).
a t a given temperature i s reduced considerably f o r t he mixed hydrates of
methane wi th e i t h e r ethane (Figure D-2)28 or propane (Figure D-3).29
t h e o v e r a l l vapor p re s su re of the hydrate at a given temperature can be
reduced by blending methane with higher hydrocarbons. However, t h e e f f e c t
with ethane and propane is not s u f f i c i e n t t o make t h e hydrate u s e f u l f o r
s to rage under t r u l y ambient condi t ions. Furthermore, t he hydrates of hydro-
carbons above C5 are not known.
The equi l ibr ium p res su re
Thus,
Dissolved salts such as sodium ch lo r ide s i g n i f i c a n t l y decrease t h e tem- 30 pe ra tu re a t which t h e hydrate is s t a b l e at a given p res su re (Figure D-4),
presumably because they i n t e r f e r e with t h e c r y s t a l l i z a t i o n ( f r e e z i n g po in t
lowering).
Thus, it would appear t h a t t he mechanical s t r e n g t h of t he c r y s t a l l i n e
water host i n these hydrates is not s u f f i c i e n t t o con ta in the vapor p re s su re
of methane at ambient temperatures. Furthermore, it does not appear t h a t t h e
vapor p re s su re t o be contained can be lowered s u f f i c i e n t l y by blending t h e
methane with higher hydrocarbons or o the r lower vapor pressure"molecu1es . wonders then i f the s t r e n g t h of t he host ice c r y s t a l s t r u c t u r e can be increased
i n some o t h e r way.
might have t h i s e f f e c t . However, t he d a t a on the e f f e c t of sodium c h l o r i d e
above suggests t h a t t h e presence of MgC12 would a l s o be de l e t e r ious .
t i c u l a r , i no rgan ic c a t i o n s tend t o complex with water (i .e. , form chemical
hydrates) through the oxygen atom, thus i n t e r f e r i n g wi th the hydrogen bonding
between hydrogen and oxygen and, t hus , with ice formation, On the o the r hand,
One
It w a s suggested t h a t hydrate forming salts such as MgC12
I n par-
D-6
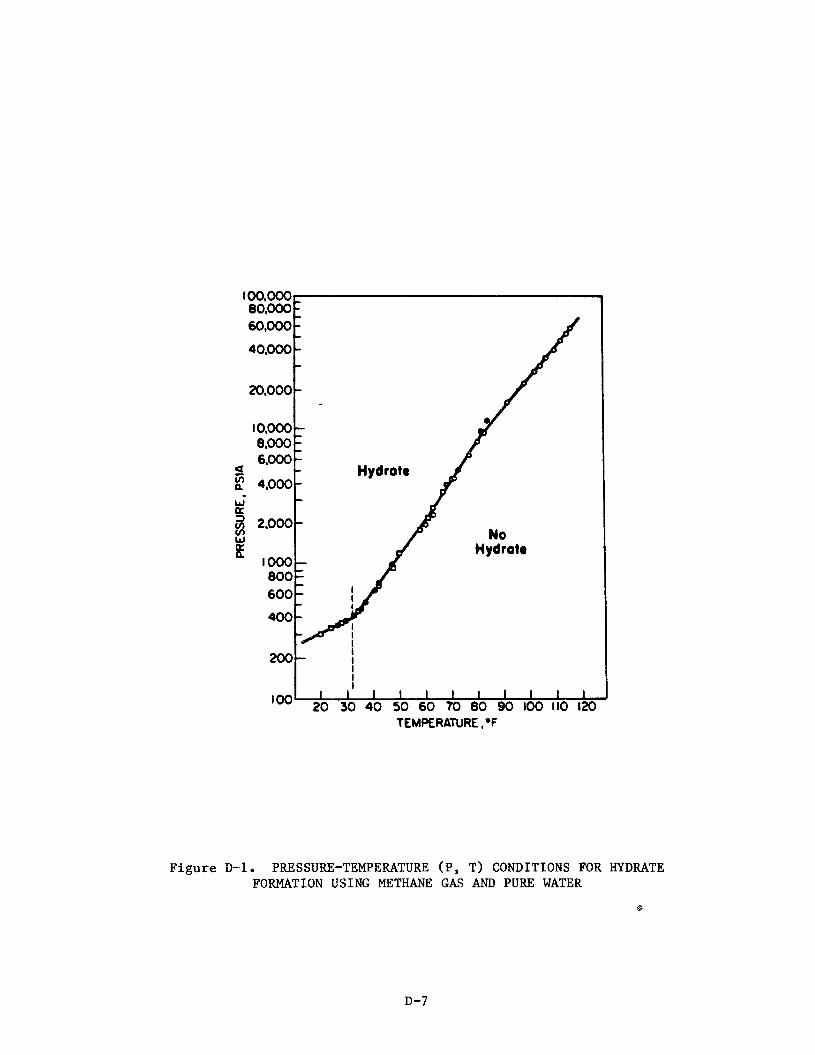
TEMPERATURE ,OF
Figure D-1. PRESSURE-TEMPERATURE (P, T) CONDITIONS FOR HYDRATE FORMATION USING METHANE GAS AND PURE WATER
D-7

175
150
125
100
75
50
25
0
HYDRATE ’ REGION
METHANE
90% METHANE I 10% ETHANE
/ ETHANE
TWO PHASE REG I O N
0 5 10 15 20 25 TEMPERATURE i n O c
F i g u r e D-2. HYDRATE EXISTENCE CONDITIONS FOR METHANE, ETHANE, AND A 90% METHANE-10% ETHANE MIXTURE (0.6 Sp. Gr. Gas) FROM REFERENCE 28
D-8

1500
1000
800
600 500
400
300
20 0
100
80
60
50
40
30
20 30 35 4 0 45 50 55 60
TEMPERATURE, 0 F
Figure D-3. HYDRATE-FORMING CONDITIONS FOR METHANE-PROPANE MIXTURES (From Reference 29)
D-9

n
2
2 3 v) v)
!4
w E.-l 3 I4 0 rn c w
TEMPERATURE, 0 F
Figure D-4. METHANE HYDRATE PRESSURE-TEMPERATURE CONDITIONS FOR VARIOUS SODIUM CHLORIDE BRINE CONCENTRATIONS (From Reference 10)
D-10
i t might be poss ib l e t o f i n d a s u i t a b l e inorganic salt which, i n t h e process
of c r y s t a l l i z i n g as a hydrate , w i l l c l a t h r a t e s m a l l molecules such as methane.
However, such a system would not be an e x t r a p o l a t i o n from the gas hydrate o r
any o the r known system but r a t h e r a new and unexplored area.
A t r a d i t i o n a l method of i nc reas ing t h e s t r e n g t h of materials, of course,
is by reinforcement of t he material with f i b e r (composite materials). A com-
mon example is g l a s s f i b e r r e in fo rced epoxy r e s ins . Perhaps then, methane
hydrate formed i n the presence of a matr ix of c o l l o i d i a l s i l i ca which g e l s
i n t o a highly cross-linked f ib rous mass could show enhanced vapor pressure-
temperature r e l a t i o n s h i p s . However, t h i s i s obviously a specu la t ive sugges-
t i o n a t t he moment.
Urea and Thiourea Inc lus ion Compounds 1 ,4 ,8 , l o , 11
Considerable l i t e r a t u r e e x i s t s on the p repa ra t ion and p r o p e r t i e s of u rea
and th iou rea c l a t h r a t e s , pr imari ly because of t h e i r use i n t h e sepa ra t ion of
isomers o r o the r mixtures on the b a s i s of d i f f e rence i n molecular s i z e and
shape. III p a r t i c u l a r , s t r a i g h t chain p a r a f f i n hydrocarbons (and f a t t y ac ids )
have been separated commerclLally on the b a s i s of t he f a c t t h a t , the urea c l a th -
rate s t r u c t u r e w i l l accommodate n-paraff in chains but not branched chai%
hydrocarbons. Thus, a number of e x c e l l e n t reviews are ava i l ab le .
The urea and th iou rea adducts are examples of t h e tunnel c l a t h r a t e s
formed by c r y s t a l l i z a t i o n through hydrogen bonding of t he hos t molecules i n
t h e form of an extended h e l i x or tunnel around the gues t molecule. The tunnel
diameter is of the order of 0.52 nm f o r urea and about 0.61 nm f o r thiourea.
The adducts are usua l ly prepared b a s i c a l l y by c r y s t a l l i z a t i o n from a s u i t -
a b l e so lven t (e.g., water o r methanol) i n the presence of t he guest molecule.
n-hexane appears t o be t h e s h o r t e s t s t r a i g h t chain hydrocarbon t h a t w i l l form
a urea adduct a t ambient condi t ions. However, urea adducts of propane and
butane have been prepared by Schl ief by lowering the temperature t o s l i g h t l y
below the b o i l i n g po in t of t he hydrocarbon with methanol as solvent.31 It is
poss ib l e t h a t t he urea adduct of methane may a c t u a l l y e x i s t and be s t a b l e
under ambient temperatures at e levated pressures .
Figure D-5 from Schl ief3 ' suggests t h a t i f i t does e x i s t , t he methane/
urea adduct would have a composition approximating 1 CH4/3 ureas corresponding
D-11

12
1 1
10
9
8
7
6
5
4
3
2
1
0 0 1 2 3 4 5 6 7 8 9 1 0 1 1 1 2 1 3 1 4 1 5 1 6
CHAIN LENGTH I N CARBON ATOMS
Figure D-5. DEPENDENCE OF THE GUEST/HOST RATIO UPON CHAIN LENGTH FOR HYDROCARBON/UREA CLATHRATES (From R e f e r e n c e 31)
D - 1 2
t o a weight r a t i o of 0.089 g/g which is of t he same order of magnitude as t h a t
f o r adsorp t ion on a c t i v a t e d carbon a t 3.6 MPa.
1,2,4,5,12,13 2.0 Phenol ic C la th ra t e s
Of considerable i n t e r e s t is t h e c l a t h r a t i o n behavior of phenols i n genera l ,
and hydroquinone i n p a r t i c u l a r .
such as methane (or 02, N2, C2H2, CH30H, H C l , SO2, A r , K r , Xe), hydroquinone
c r y s t a l l i z e s i n the metastable "B" modif icat ion i n a r a t i o of 1 cav i ty t o
every 3 hydroquinone molecules. This c r y s t a l modif icat ion, however, i s s t a b l e
only i f a c e r t a i n f r a c t i o n of the c a v i t i e s are f i l l e d wi th guest molecules
which are n e i t h e r too small (He) nor too l a rge (CC14). The cavi ty has a diam-
eter of 3.958, when occupied by small molecules comparable t o 3.88 f o r methane.
However, larger molecules can be accommodated by d i s t o r t i o n of the c a v i t i e s .
Although t h e c r y s t a l s t r u c t u r e is held toge ther by hydrogen bonding i n a man-
ne r similar t o ice, t h e s t a b i l i t y of t he hydroquinone c l a t h r a t e i s f a r grea t -
er:
pressure. X-ray d i f f r a c t i o n s t u d i e s i n d i c a t e t h a t t h e c l a t h r a t e involves the
formation of the t y p i c a l hexagonally hydrogen bonded s t r u c t u r e formed from s i x
hydroxyl groups as discussed above.
I n the presence of small gaseous molecules
the CH4'3C6H4(OH)2 complex is q u i t e s t a b l e a t ambient temperature and
The c l a t h r a t e can be prepared by c r y s t a l l i z a t i o n from a sa tu ra t ed solu-
t i o n of hydroquinone i n e thanol i n the presence of methane pressure32 or from 34 t h e vapor phase comprising hydroquinone vaporized i n a methane c a r r i e r gas ._
In both cases, the f r a c t i o n of the c a v i t i e s f i l l e d wi th methane is h ighly
dependent on the methane pressure (Figure 0-6); thus, complete f i l l i n g t o
y i e l d the one t o th ree s toichiometry r equ i r e s a pressure of about 100 a t m
(10.4 ma). The methane can be recovered f o r use by d i s s o l u t i o n i n water o r
e thanol or by hea t ing (melt ing) . No da ta w a s found on the thermal s t a b i l i t y
of t h e c l a t h r a t e . However, t he melt ing poin t of the modif icat ion of hydro-
quinone is 50°C (123OF).
t h a t temperature .
Thus, i t is probable t h a t it w i l l decompose a t about
Unfortunately, t h e grav imet r ic capaci ty of t he methane/hydroquinone d a t h -
rate is only 0.0485 g CH4/g hydroquinone due t o the high molecular weight of
t he host.
Phenol and s e v e r a l s u b s t i t u t e d phenols a l s o form c l a t h r a t e s with methane 1,34 and o ther gases , inc luding rare gases , e thane, propane, and the butanes.
D-13
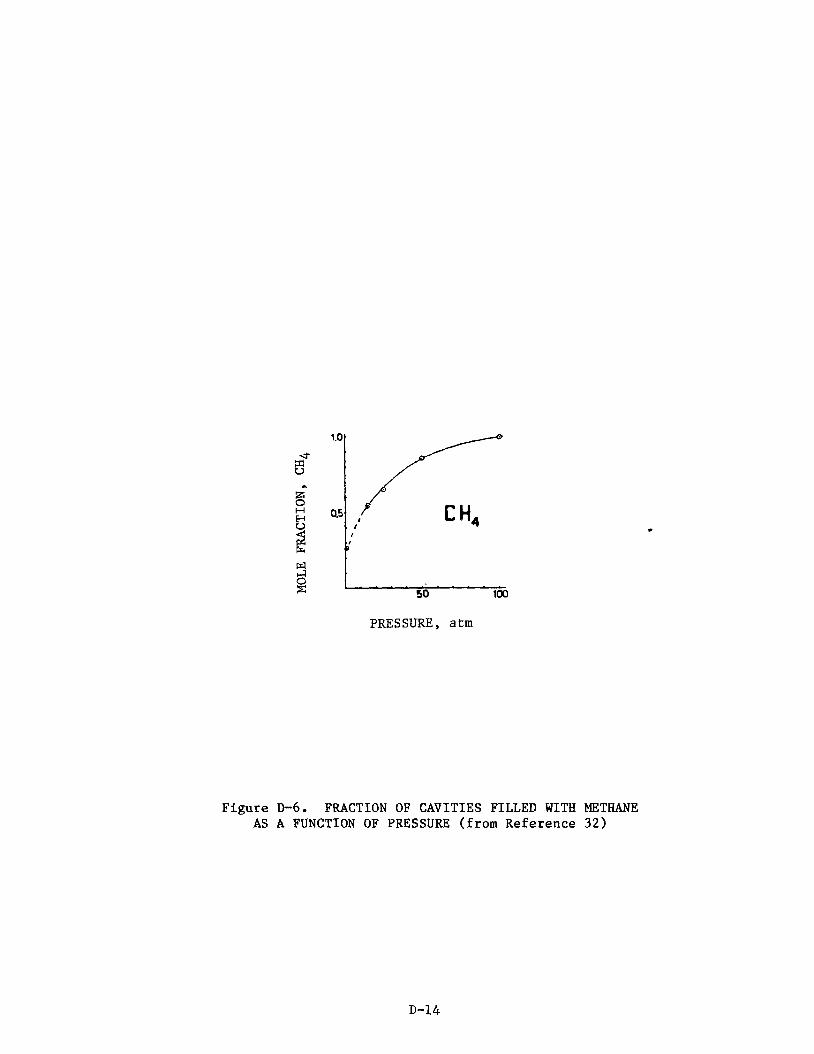
PRESSURE, a t m
Figure D-6. FRACTION OF CAVITIES FILLED WITH METHANE AS A FUNCTION OF PRESSURE (from Reference 32)
D-14
These c l a t h r a t e s are a l s o presumed t o involve the t y p i c a l hexagonal hydrogen
bonded oxygen s t r u c t u r e from s i x phenol groups toge ther with the t y p i c a l 1 /3
s toichiometry. However, t he da t a f o r methane c l a t h r a t e s with the phenols pre-
pared a t -196OC i n d i c a t e a s toichiometry c l o s e r t o 1 CH4/2.4-2.6 phenol
molecules ( i n s t e a d of 1 /3 as with hydroquinone). This may i n d i c a t e t h a t more
than 1 methane molecule can be accommodated i n the cage s t r u c t u r e of the less
l i g h t l y bound phenol group. This hypothesis i s supported by the f a c t t h a t
hydrocarbons up t o n-butane can a l s o be c l a t h r a t e d by the phenols although a t
levels less than 1 molecule per cavi ty . 34
The d a t a of Lahr and W i l l i a m s on rare gas/phenol c l a t h r a t e s i n d i c a t e s
t h a t t he CHq/phenol c l a t h r a t e would be much less s t a b l e than the hydroquinone
analog a t ambient temperature. 35
1,2,4,5,12-14 Dianin 's Compound
Dianin 's compound (C18H2002) i s t h e product of t he condensation of m e s i t y l
oxide wi th phenol and is another example of t he hexa-host class of c l a t h r a t e s
descr ibed 'above, based on the hydrogen bonding of t he phenolic hydroxyl groups.
The c a v i t i e s formed are hour-glass sbaped, about 118 i n length, 4.28 a t t h e
w a i s t , and 6.48 a t t h e two widest points . Although bes t known f o r i nc lus ion
of so lvent molecules, i t a l s o forms c l a t h r a t e s wi th f ixed gases inc luding
methane (Barrer and Shanson) .36
c l a t h r a t e s i n t h a t i t s $ c l a t h r a t e s t r u c t u r e i s s t a b l e whether the c a v i t i e s
are f i l l e d o r not. Normally, three mole of phenol ic o r o ther hexa-host type
are assoc ia ted with each cavi ty .
compound f o r methane is 6 CH4/6 Dianin compounds o r 0.06 g/g which may indi-
cate t h a t t h ree CH4 molecules occupy each hour shaped cavi ty . However, t h i s
w a s measured a t the b o i l i n g poin t , 182.5OC, and Barrer ind ica t e s t h a t t h e
apparent s a t u r a t i o n capac i ty v a r i e s wi th temperature (a t atmospheric pres-
sure).36
temperature wi th e leva ted pressure.
Dianin' s compound d i f f e r s f rom o t h e r phenol ic
The apparent s a t u r a t i o n capac i ty of Dianiz ' s
This suggests t h a t such c a p a c i t i e s might a l s o exist a t ambient
Even more important , t he d a t a i n d i c a t e t h a t s e v e r a l CH4 molecules can
e x i s t i n a clathrate cav i ty , a t least i n more or less c y l i n d r i c a l c a v i t i e s
having diameters not too much larger than t h e k i n e t i c diameter of methane.
D-15 B
1,2,9-13 Cyclodextrins
The cyclodextrins are cyclic oligosaccharides containing six (a), seven ( B ) , or eight ( v ) glucose units. The molecules in solution are presumably doughnut shaped with hole diameters of 68, 88, or 10-118, respectively, for the a, 6, and v forms. The voids in the center have been described as having a high electron density (Shaeffer and Dorsey) ,lo capable of complexing with various molecular species since no cage structure is evident. Furthermore, clathration has been shown to change the oxidation-reduction potential of certain molecules such as methylene blue. 10
Alpha cyclodextrin (68) also forms clathrates with various fixed gases, including methane at ambient temperature-pressure to the extent of 0.014 g CHq/g-a cyclodextrin.
state and, therefore, may involve cage structures. Nonetheless, this illus- trates that cages as large as 68, (about 28 greater than the kinetic diameter of methane) can exhibit relatively high stability at ambient conditions, prob- ably due t o the inherent stability of the "beta" structure. The latter is identical to the "alpha" structure, at least in the dry state, since the cav- ity is held together by covalent bonds rather than hydrogen bonds. However, the vaporization of methane from the clathrate may also exhibit an enthalpy change greater than llHvap in spite of the minimal coordination number due to the high electron density of the oxygen atoms lining the cavity walls.
However, these clathrates are stable only in the dry
The six, seven, and eight membered cyclodextrins are natural products produced by enzymatic action on amylose. membered analog could be produced synthetically. If so, the hole diameter would be of the order of 48 (by extrapolation), just right for inclusion of methane (d = 3.8-4.18). Furthermore, it may be possible to synthesize cyclic
polyethers (from ethylene oxide) tailored for inclusion of methane.
However, one wonders whether a five
A further possible approach would involve the complete synthesis or modi- fication of existing cyclic polyethers or cyclodextrins with low solubility parameter detergent-like tails to produce inclusion hosts soluble in solvents which also dissolve methane. In this manner, the solvent capacity for methane
might be enhanced by the action of the dissolved inclusion hosts.
D-16

17,18,37,38 3.0 Encapsulation i n Preformed Molecular Sieves
I n the broadest sense, z e o l i t e s , molecular s i e v e s , and a c t i v a t e d carbons
can be considered analogous t o the host c r y s t a l of a c l a t h r a t e except t h a t t h e
s t r u c t u r e is preformed and s t a b l e without t he included guest molecules. Such
molecules have high i n t e r n a l su r f ace areas contained wi th in cages, o r pores
( t u n n e l s ) having p r e c i s e l y s i zed e n t r i e s . Such materials a r e used not only
f o r adsorpt ion but a l s o f o r s epa ra t ion of molecules having d i f f e r e n t k i n e t i c
diameters. Under ordinary condi t ions, t h e guest molecules must be smaller
than the k i n e t i c diameter of t he host ; otherwise, they w i l l be excluded. It
has r ecen t ly been found t h a t such molecular s i e v e s t r u c t u r e s can a l s o be used
f o r encapsulat ion or c l a t h r a t i o n of guest molecules l a r g e r than the charac-
t e r i s t ic pore opening size.37
elevated temperatures such t h a t t he molecules are forced i n t o the s l i g h t l y
expanded pore openings. Once i n s i d e , and af ter the temperature has been
quenched t o ambient l e v e l s , the molecules are trapped a t high p res su re i n s i d e
t h e sieve. Such a system tends t o be q u i t e s t a b l e a t ambient temperature and
p r e s s u r e u n t i l reheated, destroyed by a c i d , or exposed t o a s t ronge r absorbate
This i s accomplished a t high p res su res and
( e m g o , H20).
More s p e c i f i c a l l y , it has been found t h a t i n e r t gases such as argon,
krypton, and methane can be s to red e f f e c t i v e l y i n K-A-type z e o l i t e s a t 25°C
a f t e r encapsulat ion a t 300" t o 400°C and 200 t o 400 MF'a (2050 t o 4100 a t m ) .
Data f o r encapsulat ion of CH4 and ethylene as w e l l as krypton and argon are
shown i n t h e following t ab le .
Table 1. ENCAPSULATION OF GASES I N ZEOLITE A17
Afte r t Temperature, Pressure, Days a t
Gas u ( A ) ("C) (ma) cm3 STP/g 25°C -- CH4 3.8 3 50 268 105, t = 4 98, t = 37
C2H4 3.9 250 84 81, t = 2 76, t = 35
A r 3.4 350 268 109, t = 3 77, t = 79
K r 3.6 350 436 90.5, t = 1 90.5, t = 30
D-17
d
Thus, at 350°C and 270 MPa, 105 cc STP/g are encapsulated. This corresponds
t o 0.075 g/g, which is of t he same order of magnitude as f o r adsorpt ion of CH4
on z e o l i t e s a t 3.6 MPa and 25°C. It should a l so be noted t h a t a f t e r 37 days
a t 25OC and 1 a t m , less than 7% of the CH4 is l o s t . However, because of t h e
d r a s t i c condi t ions r equ i r ed f o r t h e encapsulat ion of cH4 i n t o z e o l i t e A, t h e
process is obviously not f e a s i b l e . Furthermore, t h e temperature r equ i r ed t o
decapsulate is undoubtedly too high (350°C)
Figure D-7 shows the pore s i z e s of a number of z e o l i t e s re la t ive t o t h e
k i n e t i c diameters of a number of gases including cH4.18
z e o l i t e KA has a pore s i z e opening of about 38 compared t o 3.88 f o r methane,
while L i A a t 3.38 o r N a A at 3.5A are c l o s e r t o t h a t of methane.
o the r molecular s i e v e materials, including a c t i v a t e d carbons and t h e newly
developed alumino phosphates, could be of i n t e r e s t . 39y40 The average pore
s i z e of an a c t i v a t e d charcoal can be var ied over wide l i m i t s , depending not
only on the condi t ions of a c t i v a t i o n , but p a r t i c u l a r l y on t h e b a s i c s t r u c t u r e
of t he char s u b s t r a t e before a c t i v a t i o n . For example, Saran charcoals made by
py ro lys i s of polyvinylidene ch lo r ide have been shown t o have a uniform s l o t -
l i k e pore s t r u c t u r e between graphi te- l ike l a y e r s of carbon. The s l o t - l i k e
pores are about 10A i n l eng th and t h i n enough t o restrict but not exclude t h e
flow of branched chain hydrocarbons (neopentane) as compared t o p l ana r (ben-
zene) o r l i n e a r (0-pentane) hydrocarbon^.^' Takeda Chemical I n d u s t r i e s , Osaka, Japan, e x h i b i t s an even smaller uniform
pore s t r u c t u r e of only 58,42
adsorpt ion of var ious gases on these materials were twice those measured f o r
g raph i t i zed carbon black.43 The increased AH ( adso rp t ion ) was a t t r i b u t e d t o
the f a c t t h a t adsorbed spec ie s i n t e r a c t w i th carbon l a y e r planes on both
s i d e s , while molecules adsorbed on su r faces i n t e r a c t with only one carbon
l a y e r plane. Thus, even though t h e pore openings of t h e s e carbons are too
l a r g e f o r encapsulates , t he small pores o f f e r t he advantage of higher hea t s of
adsorpt ion which w i l l r e s u l t i n t he achievement of a given su r face coverage a t
a lower pressure.
It w i l l be noted t h a t
In add i t ion ,
A molecular s i e v e carbon made by
It is i n t e r e s t i n g t o note t h a t the h e a t s of
A new class of molecular s i eves , t h e alumino phosphates, have r e c e n t l y
None of these materials, which been introduced by Union Carbide Corp. 40941
D-18
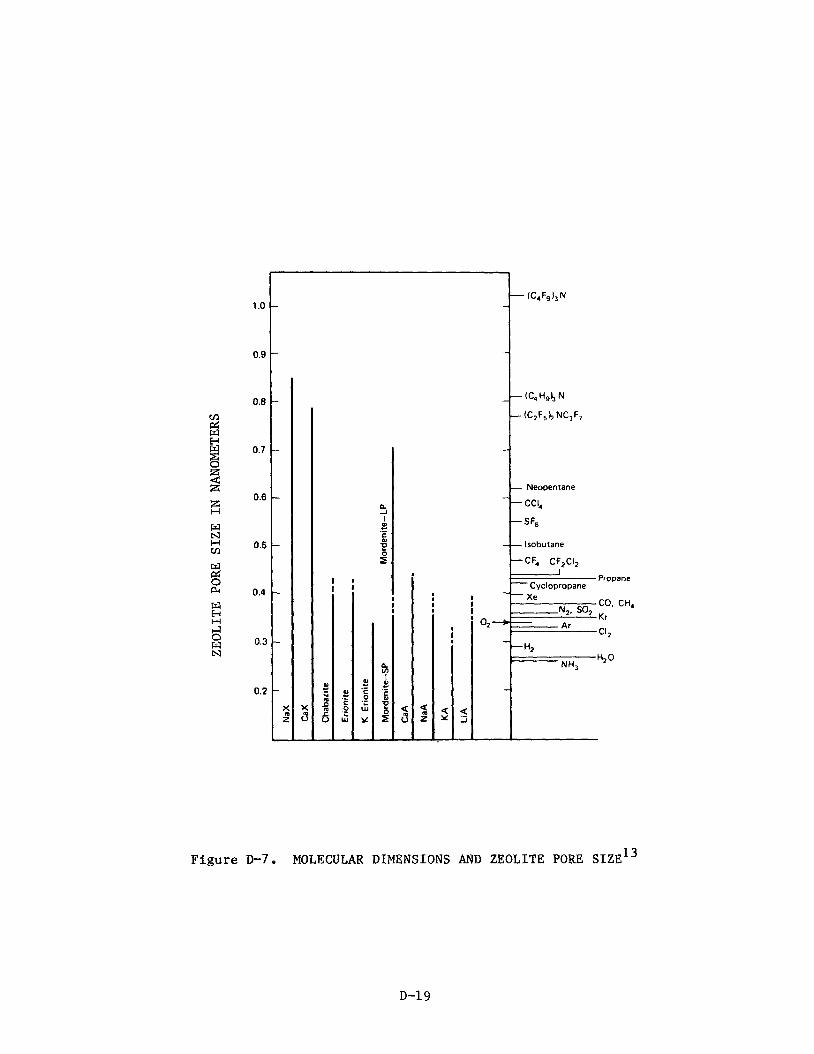
z w N H cn
Figure D-7. MOLECULAR DIMENSIONS AND ZEOLITE PORE SIZE13
D-19

have so far been described, is particularly suited for encapsulating methane.
Nonetheless, it seems a reasonable possibility that alumino phosphate or even zeolite molecular sieves could be tailored specifically for that possibility.
5.0 Cross-Linked Sorbents Formed in the Presence of Templates
The addition of templates or inclusion bodies during formation to control the size of the cavities and, therefore, the specificity of various adsorbents has been done with a number of materials including:
alumino phosphates in which the templates are the cations d y l 2
e Zeolites involved
e Silica gels in which the gels ,are gelled around the template molecules, which are usual1 relatively larger, water-soluble molecules such as butyl orange dye 1 3
e Modified dextrans which are macromolecular polysaccharides cross-linking to varying degrees in the presence of a suitable solvent and are used f r gel permeation separation of molecules on the basis of molecular size. 1 9
Thus, it may be possible to develop adsorbents or absorbents tailored
specifically for methane by controlled cross-linking of organic as well as inorganic polymers in the presence of high pressures of methane (or other
templates of a similar size, including propane and butane). Examples would include:
Polymerization of isobuty,lene with suitable cross-linking agent (e.g., diisobutylene) in a propane or butane solvent
Three-dimensional polymerization of a silicon monomer or ,oligomer with a suitable cross-linking agent
Cross-linking of various polymers including a hydrogen bonding polymer such as cellulose (with its appended hydroxyl groups) or polyacrylamide (with its amido or substituted amido groups) o r polymers having a solvent affinity for methane such as polyisobutylene swollen by a low molecular weight solvent which in the dry state should contain a multiplicity of cavities lined with either hydrogen bonding groups or methyl groups.
Vapor .phase formation of cross-linked silica gels in the presence of high concentrations or pressures of methane. This might be accomplished by saturating a methane stream with a suitable silicon compound (e.g., SIC14 or Si(0-CH 1 4 ) followed by vapor phase hydrolysis or vapor phase thermal decomposit 2 on.
D-20

6 ,O Other C l a t h r a t e Systems 9 3 3 9 ''-I4
There are many o the r molecules which have been shown t o c l a t h r a t e guest
molecules including:
0 Phosphon i t r i t e s
e Werner complexes
0 Other metal ion-ligand combinations
0 Ste ro ids
0 Cholesterol
0 Hexamethyl isocyanide ch lo r ide
o Methyl naphthalene
0 Cyc love ra t r i l .
These c l a t h r a t e types w i l l not be described here s i n c e no methane clath-
rates were attempted, even though higher molecular weight gues t s were included.
However, such c l a t h r a t e h o s t s should not be excluded from any f u r t h e r s t u d i e s
with methane since t h e la t ter was never even t r i e d . For example, it i s pos-
s i b l e t h a t some of t hese would c r y s t a l l i z e d i f f e r e n t l y i n t h e presence of
methane or may contain l aye r - l i ke cavities which would accommodate methane as
w e l l as l a r g e r guest molecules. I n any case, it may be poss ib l e t o vary the
molecular s t r u c t u r e s of t h e hos t t o give the methane c l a t h r a t e . Of p a r t i c u l a r
i n t e r e s t are t h e metal-ion-ligand combinations s i n c e they are capable of wide
v a r i a t i o n i n both t h e ion and t h e l igand used.
7.0 Summary I
We have seen t h a t methane c l a t h r a t e s e x i s t which s e p a r a t e l y e x h i b i t t h e
var ious p r o p e r t i e s required f o r on-board s to rage , although not together i n t h e
same c l a t h r a t e . Furthermore, a study of the l i t e r a t u r e suggests t h a t near ly
any chemical spec ie s near o r below i t s f r eez ing point has the p o t e n t i a l of
a c t i n g as a c l a t h r a t e host under the r i g h t condi t ions and i n t h e presence of a
reasonable concentrat ion of a s u i t a b l e guest molecule. Thus, i t is p o s s i b l e
t h a t a methane c l a t h r a t e having a l l of t h e p r o p e r t i e s required f o r on-board
s to rage can be found or developed although t h i s may e n t a i l a compromise be-
tween s t a b i l i t y , capac i ty , and methane release p rope r t i e s .
D-21

We a l s o recognize t h a t c l a t h r a t e s have p r o p e r t i e s ak in t o s o l u t i o n s on
one hand and t o molecular sieve-absorbate i n t e r a c t i o n s on the other . This is
i l l u s t r a t e d by a comparison of i n t r a c r y s t a l l i n e f r e e volumes a v a i l a b l e f o r in-
c lus ion of B-clathrate h o s t s with the volumes a v a i l a b l e i n z e o l i t e s as f 0 1 l o w s : ~
Hydroquinbne/argon -0.05 c c / C C
Urea /pa ra f f tn s 0.37
Thiourea/hydrocarbons 0.41
Gas hydrates 0 -46
Z e o l i t e s 0.18-0 -54
T k s , t h e r e is a l a r g e overlap i n the p o t e n t i a l i n c l u s i o n volumes of z e o l i t e s
and c l a t h r a t e s which is comparable t o t h a t i n so lu t ions . Inc lus ion of up t o
about 50% by volume are p o t e n t i a l l y poss ib l e by a l l t h r e e approaches, although
t h e r u l e s governing t h e accomplishment thereof are d i f f e r e n t .
For s o l u t i o n s , t h e primary in f luence appears t o be the s o l u b i l i t y param-
eter which appears t o be inve r se ly p ropor t iona l t o molecular weight so t h a t
50% (by volume) s o l u t i o n s can only be achieved using so lven t s with molecular
weights c l o s e t o t h a t of methane i t s e l f . This is not f e a s i b l e f o r our pur-
poses. With z e o l i t e s (and o the r adsorbents) f o r which t h e hos t s t r u c t u r e i s
inhe ren t ly s t a b l e by i t s e l f , t he i n c l u s i o n is l imi t ed at a reasonable pres-
su re , e.g., 3.6 MPa, by t h e hea t of adsorpt ion of methane on t h e s u r f a c e t o
less than a monomolecular coverage of t h e su r face , which is usua l ly less than
p o t e n t i a l l y p o s s i b l e with i n c l u s i o n compounds. The la t ter , however, can only
be accomplished a t high p res su res or w i th l a r g e molecules at lower pressures .
With c l a t h r a t e s , s t a b i l i t y of the c l a t h r a t e depends on the s t a b i l i t y of
t h e B-crystal la t t ice r e l a t i v e t o t h a t of t he usua l a-form and upon t h e magni-
tude of t he hea t of i n t e r a c t i o n between hos t and gbest . Both c o n t r i b u t e t o
t h e d i f f i c u l t y of removal of t he guests . With most of the methane c l a t h r a t e s
so f a r found, t he p o t e n t i a l s a t u r a t i o n of t he f r e e volume a v a i l a b l e approaches
loo%, probably because t h e c l a t h r a t e i s not discovered un le s s s t a b i l i t y i s
achieved. A s i nd ica t ed above, s t a b i l i t y under reasonable condi t ions is usu-
a l l y not achieved un le s s t h e c a v i t y dimensions approach t h a t of t h e guest
molecule so t h a t a r e l a t i v e l y high coordinat ion number f o r i n t e r a c t i o n i s
achieved.
D-22
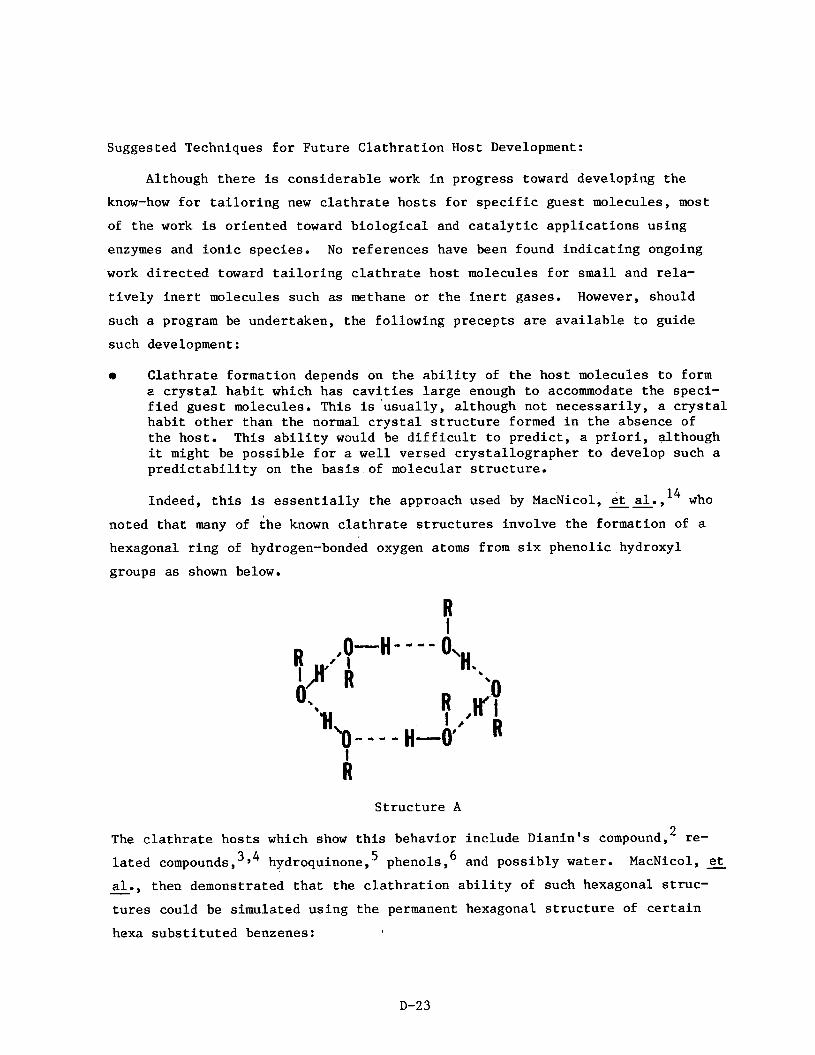
Suggested Techniques f o r Future C la th ra t ion Host Development:
Although the re i s considerable work i n progress toward developing t h e
know-how f o r t a i l o r i n g new c l a t h r a t e h o s t s f o r s p e c i f i c guest molecules, most
of the work is or ien ted toward b io log ica l and c a t a l y t i c app l i ca t ions us ing
enzymes and i o n i c species . No re ferences have been found ind ica t ing ongoing
work d i r ec t ed toward t a i l o r i n g c l a t h r a t e host molecules f o r small and rela-
t i v e l y i n e r t molecules such as methane o r t he i n e r t gases. However, should
such a program be undertaken, t he fol lowing p r e c e p t s are ava i l ab le t o guide
such development:
a C l a t h r a t e formation depends on t h e a b i l i t y of t he hos t molecules t o form a c r y s t a l h a b i t which has c a v i t i e s l a r g e enough t o accommodate the speci- f i e d gues t molecules. This is 'usua l ly , although not necessa r i ly , a c r y s t a l hab i t o the r than the normal c r y s t a l s t r u c t u r e formed i n the absence of t h e host . This a b i l i t y would be d i f f i c u l t t o p red ic t , a p r i o r i , al though it might be poss ib l e f o r a w e l l versed c rys ta l lographer t o develop such a p r e d i c t a b i l i t y on the bas i s of molecular s t r u c t u r e .
Indeed, t h i s is e s s e n t i a l l y the approach used by MacNicol, e t al . , l4 who ,
noted t h a t many of t he known c l a t h r a t e s t r u c t u r e s involve the formation of a
hexagonal r i n g of hydrogen-bonded oxygen atoms from s i x phenol ic hydroxyl
groups as shown below.
Th c l a t h r a t e h
S t r u c t u r e A
ts which show t h i s behavior include Dianin's compound,2 re-
l a t e d corn pound^,^'^ h y d r ~ q u i n o n e , ~ phenols,6 and poss ib ly water.
-., a1 then demonstrated t h a t t he c l a t h r a t i o n a b i l i t y of such hexagonal s t ruc -
t u r e s could be s imulated us ing t h e permanent hexagonal s t r u c t u r e of c e r t a i n
MacNicol, =
hexa s u b s t i t u t e d benzenes:
D-23

Structure B
where R-Z-radicals included a variety of substituted oxygen and sulfur radi-
cals. However, the guest molecules bound by these clathrate hosts are larger than methane, indicating relatively large cavities.
By the same token, new clathrate hosts might also be derived by varying the nature of R- in Structure A to include substituted phenol and also various
aliphatic, alicyclic, and olefinic species, substituted or unsubstituted. Furthermore, the formation of suitable hydrogen-bonded hexagonal structures can also be formed with elements other than oxygen from Rows 5A and 6A of the periodic table, in particular through nitrogen atoms in amides. In addition,
the formation of a hexagonally arrayed hydrogen-bonded structure is not an exclusive prerequisite, since urea forms tunnel clathrates with straight chain paraffins by forming a hydrogen-bonded two-dimensional helix spiral. (tunnel) around the paraffin molecule. Thus, the primary prerequisite is the hydrogen- bonding (or other complex forming) ability of the host while 'the secondary prerequisite is a molecular geometry (at least partially unpredictable) which will crystallize in the presence of a guest to a structure with cavities sized to accommodate the guest.
Methods for Increasing the Stability of Clathrates and Improving Methane Release Properties:
Stability is of major importance since it controls not only whether the methane can be contained at reasonable pressures under ambient conditions but
D-24

a l s o the condi t ions under which t h e methane can be released. The hydrate of
methane f o r example is not s t a b l e enough s i n c e it r e q u i r e s a p res su re of 28
MPa t o e x i s t under ambient temperature conditions. On t h e o the r hand, t he
hydroquinone/methane c l a t h r a t e is too s t a b l e .
a t ambient temperature and pressure, it r e q u i r e s an elevated temperature
(-50°C) or t h e in t roduc t ion of a so lven t t o release the methane.
compromise is i n order so t h a t t he c l a t h r a t e w i l l be s t a b l e a t ambient condi-
t i o n s a t a reasonable p re s su re of 1.4 t o 3.6 MPa, i n o rde r t h a t methane re-
lease can be achieved and c o n t r o l l e d by pressure reduction.
Thus, although it can be s t o r e d
, Obviously, a
The parameters c o n t r o l l i n g s t a b i l i t y would include:
e Hydrogen bonding power of the groups through which the c r y s t a l l i z a t i o n occurs, as determined by the na tu re of the groups themselves, as w e l l as t h e s i z e and e l e c t r o p h i l i c cha rac t e r of t h e o t h e r groups i n t h e molecule. O f p a r t i c u l a r i n t e r e s t i n t h i s regard would be the amides and s u b s t i t u t e d amides . Geometry and symmetry of the hos t molecule as it a f f e c t s t he s t r u c t u r e of the c r y s t a l h a b i t formed. The importance .of symmetry is suggested by t h e f a c t t h a t t he hydroquinone (p-dihydroxybenzene) gives a highly s t a b l e c l a t h r a t e with HBr , whereas the meta analogue does not e x i s t a t atmo- s p h e r i c pressure.
Suggestions f o r Inc reas ing Storage Capacity of Methane:
The capaci ty of a c l a t h r a t e f o r s t o r i n g methane depends on t w o ' f a c t o r s :
o How many host molecules are required t o provide one guest "cage" (i .e. , t h e u n i t c e l l )
e Molecular weight of t h e host molecule.
The s t r u c t u r e of the u n i t cell and, t h e r e f o r e , the number of hos t molecules
pe r guest molecule is dependent i n a very complex way on var ious c r y s t a l l o -
graphic f a c t o r s and is beyond p r e d i c t i o n at t h i s t i m e , except perhaps f o r t h e
"hexamer" c l a t h r a t e s (descr ibed above) which tend t o g ive a 3/1 hos t t o guest
r a t i o . However, t he u n i t c e l l is l i k e l y t o contain a reasonably small number
of host molecules, e.g.,
e 3 i n t h e hydroquinone-methane c l a t h r a t e and o t h e r "hexamer" h o s t s
e 5.75 i n the methane hydrate.
Thus, molecular weight may be the f a c t o r of g r e a t e s t importance i n determining
capaci ty e
D-25

On the other hand, it may be possible that some higher molecular weight molecules with complex symmetries may form clathrate structures in which the host/guest ratio is significantly less than the 3/1 found for the hexamer types, or that form structures with cavities sufficiently large to accommodate
two or more methane molecules, as in the case of the urea tunnel adducts. In the latter case, diffusion would be the primary barrier to decomposition and
the system would 'function in a manner analogous to that of absorption in a zeo ite. Most of the clathration entities forming larger cavities (and there are a lot of them, including Dianin's compound, the Werner complexes, deoxy- cho ic acid, and urea and thiourea, etc.) have been evaluated only with larger guest molecules (usually the solvent used) at atmospheric pressure and not with permanent gases such as methane under elevated pressures. For example, urea adduction of the homologous n-paraffin series has been extended downward
to include propane and butane, which are stable at atmospheric pressure only at subzero temperatures. However, it is possible that adduction could be extended to include methane and ethane as well at ambient temperatures and elevated pressures.
8 . Future Research Recommendations
It is apparent from the above discussion that any future work toward the development of clathrate systems for storage of natural gas will be highly empirical in approach. Such a program would involve:
Evaluation of the formation and stability of clathrates of the known host systems toward methane at pressures up to 7.0 MPa. In particular, this would include the urea and thiourea systems and those whose cavities are presumed to be too large for methane as suggested above (particularly the ligand cross-linked metal ion, e.g., Werner complexes).
Evaluation of the effect of variations in structure on stability and capacity. Of particular interest would be:
N-substituted ureas and thioureas to enhance hydrogen bonding strength and, therefore, stability of the adducts
Diphenols including the effect of ring substitution on stability of hydroquinone clathrates and the use of meta and ortho diphenols
Variations based on cyclodextrin, including synthesis and evaluation of the five membered oligomer and conversion of the inwardly-oriented hydroxyl groups to ethers of varying size, amides, etc. to decrease the hole size, and/or the interaction chemistry with methane.
D-26
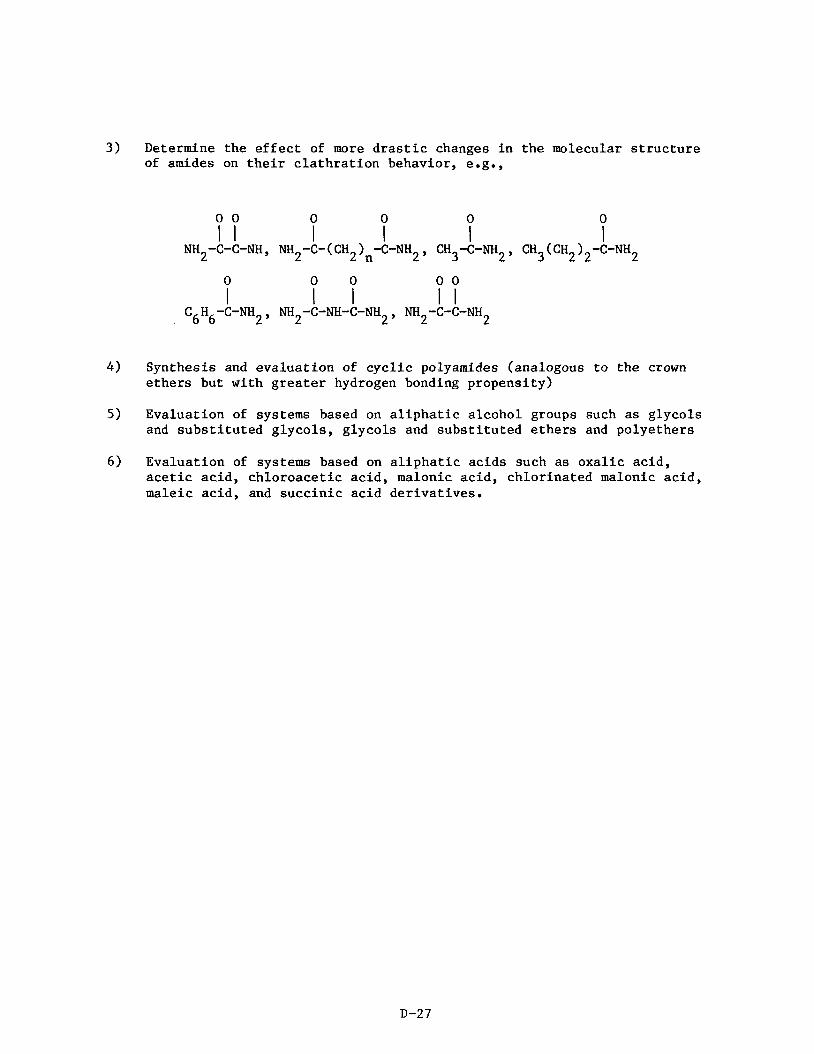
3) Determine the effect of more drastic changes in the molecular structure of amides on their clathration behavior, e.g.,
0 0 0 0 0 0
NH2-C-C-NH, NH2-C-(CH 2 n ) -C-NH2, CH3-C-NH2, CH3(CH 2 2 ) -C-NH2 I I I I I I
0 0 0 0 0
C 6 6 H -C-NH2, NH2-C-NH-C-NH2, NH2-C-C-NH2 I I I I I
4 ) Synthesis and evaluation of cyclic polyamides (analogous to the crown ethers but with greater hydrogen bonding propensity)
5) Evaluation of systems based on aliphatic alcohol groups such as glycols and substituted glycols, glycols and substituted ethers and polyethers
6 ) Evaluation of systems based on aliphatic acids such as oxalic acid, acetic acid, chloroacetic acid, malonic acid, chlorinated malonic acid, maleic acid, and succinic acid derivatives.
D-27
REFERENCES FOR APPENDIX D
1.
2.
3.
4.
5.
6.
7.
8.
9.
10.
11.
12.
13.
14 . 15.
Bhatnagar, V. M., Clathrate Compounds, 1970, Chemical Publishing Co., NY
Makin, E. C., "Clathration," Encyclopedia of Chemical Technology, Vol. 6, p. 179-189, Kirk and Othmer, Eds., New York: Wiley (1978).
Davidson, D. W., Water: A Comprehensive Treaties, Vol. 2, Plenum Press, New York (1973).
Hagan, Sister Martinette, Clathrate Inclusion Compounds, 1962, Reinhold Publishing Co., NY
Powell, H. M., "Clathrates", Chapter 7 in Non-Stoichiometric Compounds, Mandelcorn, L., Ed., Academic Press, NY (1964).
Fetterly, L. C., "Organic Adducts," Chapter 8, Ibid.
Barrer, R. M., "Inorganic Inclusion Complexes," Chapter 6, Ibid. .
Senti, F. R. and Erlander, S. R., "Carbohydrates," Chapter 9, Ibid.
Staveley, L. A. K., "Physics and Chemistry of Inclusion Complexes," Chap- ter 10, Ibid.
Schaeffer, W. D. and Dorsey, W. S., "Clathrates and Clathrate Separa- tions," Chapter 3, Advances in Petroleum Char and Refinfng VI, 119-167 (1962) . Cramer, F. D., "Inclusion Compounds," Rev. of Pure and Applied Chem., Vol. 5, 143-164, (1955).
Mandelcorn, L., "Clathrates," Chem. Rev. - 59, 827-839 (1959).
Frank, S. G., "Inclusion Compounds," J. Pharmaceutical Sciences, 64, b10, 1585-1604, (1975).
MacNicol, D. D., McKendrick, J. J., and Wilson, D. R., "Clathrates and Molecular Inclusion Phenomena," Chemical SOC. Reviews, 65-87 (1978).
Child, W. C., "Molecular Interactions in Clathrates: A Comparison with Other Condensed Phases," Quart. Rev., Vol. 18, p 321-346.
16. Van der Waals, J. H. and Platteeuw, J. C., "Clathrate Solutions" in Advances in Chemical Physics, Vol. 11, Edited by Prigogine, I. Inter- science Publishers, Inc., NY, 1959, p. 1-57.
17. Breck, D. W., "Crystalline Molecular Sieves," J. Chem. Ed. 41, 678-689, (1964).
D-28
18. Breck, D. W., Zeolite Molecular Sieves, John Wiley & Sons: New York, NY, 1974.
19.
20 a
21.
22.
23.
25.
26.
27.
28.
29.
Cram, D. J., "Cavitands: Organic Hosts with Enforced Cavities," Science 2 219 1177-1183, (1983).
Cram, D. J. and Cram, J. M., "Host-Guest Chemistry," Science,=, 803- 809, (1974).
MacNicol, D. D., and Wilson, D. R., "New Strategy for the Design of In- _ _ clusion Compounds: Discovery of the '*Hexa-hosts"," J. Chem. So:. Corn. p. 494-495, (1976).
Hardy, A. D. Ua, MacNicol, D. D., and Wilson, D. R., "A New Approach for the Design of Inclusion Compounds," J. Chem. SOC. Perkin 11, 1011-~019, (1970).
MacNicol, D. D., Hardy, A. D. U., and Wilson, D. R., "Crystal and Molecu- lar Structure of a "Hexa-host" Inclusion Compound,*' Nature, 266, 611, (1976).
Scott, M. I., Randolph, P. L . , and Pangborn, J. B., "Assessment of Methane Hydrates.'' Final report for period Dec. 1978 through June 1980, GRI-79/0070, Contract H5011-310-0097, Oct. 1980.
Hammerschmidt, E. G., Knapp, K. R. and Perkins, C. L., "Gas Hydrates and Gas Dehydration," in Gas,Engineers Handbook. New York: Industrial Press, 1969 . Parent, J. D., "The Storage of Natural Gas as Hydrate, " IGT Res. Bull. No. 1, Chicago, 1948.
Hand, J. H., Katz, D. L . , and Verma, V. K., "Review of Gas Hydrates With Implication for Ocean Sediments," in I. R. Kaplan, Ed., Natural Gas in Marine Sediments, 179-94. New York: Plenum Press, 1974.
Baker, P. E., "Experiments on Hydrocarbon Gas Hydrates in Unconsolidated Sand," in I. R. Kaplan, Ed., Natural Gas in Marine Sediments, 227-34. New York: Plenum Press, 1974.
Katz, D. L. et. &., "Water-Hydrocarbon Systems," in Handbook of Natural Gas Engineering. New York: McGraw-Hill, 1959.
30. Kobayashi, R. et.&., "Gas Hydrate Formation with Brine and Ethanol Solutions," in Proceedings Thirtieth Annual Convention, Natural Gasoline Association of America, 27-31, Tulsa, Okla., April 25-27, 1951.
31. Schlief, V. H., "Harnstaffein Schlusverb in dungen von n-Butan und v-Propan," J. Prakt. Chem., 5 335-339 (1955)
32. Peyronel, G. and Barbieri, G., "On Some New Clathrates of Hydroquinon," J. Inorg. and Nuclear Chem., 8, 582-585 (1958).
D-29

33 e
34 e
35.
36 . 37 . 38.
39.
40.
41.
42.
43 .
Coutant, R. W., "Solventless Preparation of Hydroquinon Clathrates," - J. Org. Chem., 39, 1593-1594 (1974).
Barrer, R. M. and Shanson, V. H., "Clathration by Para-Substituted Phenols," J. Chem. SOC., Faraday, T., 2348-2354, (1976).
Lakr, P. H. and Williams, H. L., "Properties of Some Rare Gas Clathrate Compounds," J. Phys. Chem., 63, 1432-1433, (1959).
Barrer, R. M. and Shanson, V. H., "Dianin's Compound as a Zeolitic Sorbent," .I. Chem. SOC. Comm., 333-334, (1976).
Sesny, W. J. and Shaffer, L. H., U.S. Patent No. 3,316,691 (1967).
Fraenkel, D., "Encapsulate Hydrogen," Chemtech., 1 1 , 60-65 (Jan. 1981).
Dacey, J. R. and Thomas, D. G., "Adsorption on Saran Charcoal," Trans. Faraday SOC., 50, 740-748 (1954).
Wilson, S . T., et. &., "Alumino Phosphate Molecular Sieves: A New Class of Microporous Crystalline Inorganic Solids," JACS, 104, 1146-47, (1982).
Haggin, J., "Alumino Phosphates Broaden Shape Selective Catalyst Types," C&EN, June 20, 1983, 36-37.
Kaaazoe, K., et. g., "Correlation of Adsorption Equilibrium Data of Various Gases and Vapors on Molecular-Sieving Carbon," J. Chem. Eng. of Japan, Vol. 7 , p. 158-162 (Eng.), (1974).
Kazuyuki, C . , Suzuki, M., and Kawazoe, K., "Adsorption Rate on Molecular Sieving Carbon by Chromatography," A.1.Ch.E. Journal, Vol. 24, March, 237-246, (1978).
D-30
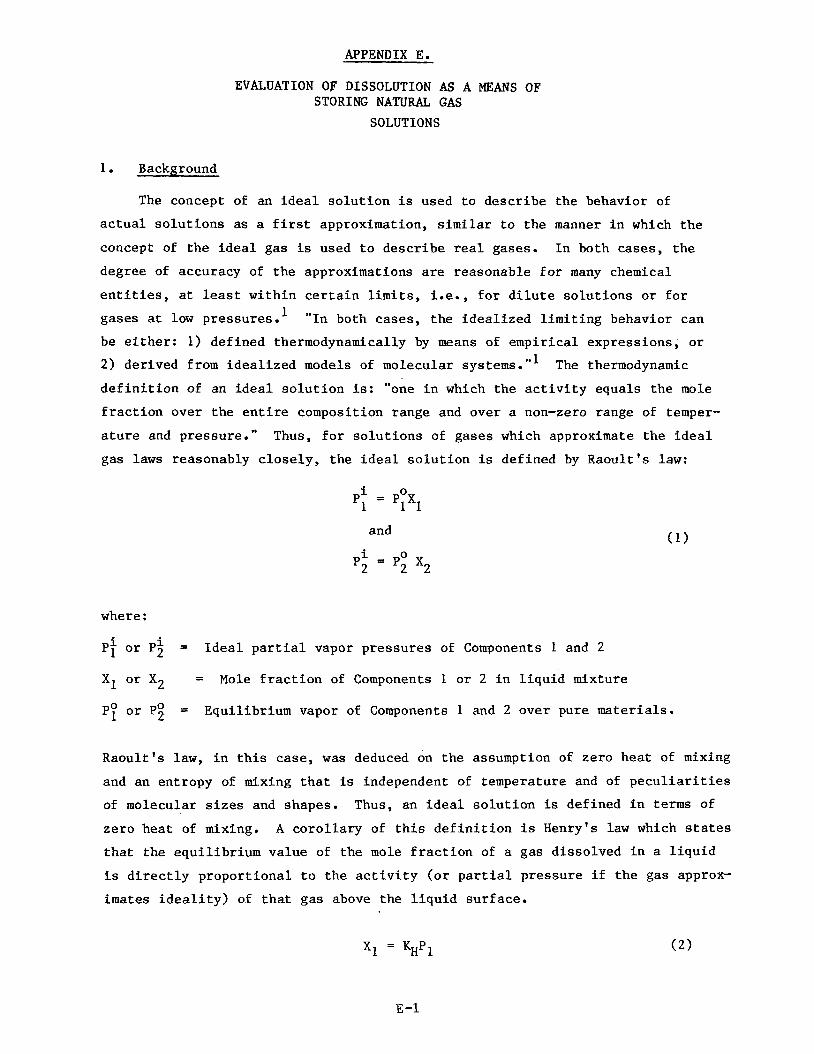
APPENDIX E.
EVALUATION OF DISSOLUTION AS A MEANS OF STORING NATURAL GAS
SOLUTIONS
1. Background
The concept of an i d e a l s o l u t i o n is used t o descr ibe the behavior of
a c t u a l s o l u t i o n s as a f i r s t approximation, similar t o the manner i n which t h e
concept of t he i d e a l gas is used t o descr ibe real gases. I n both cases, the
degree of accuracy of the approximations are reasonable f o r many chemical
e n t i t i e s , a t least wi th in c e r t a i n l i m i t s , i.e., f o r d i l u t e so lu t ions or f o r
gases a t low pressures. ' "In both cases, t h e idea l i zed l i m i t i n g behavior can
be e i t h e r : 1) def ined thermodynamically by means of empir ica l expressions, o r
2) derived from idea l i zed models of molecular systems. **' d e f i n i t i o n of an i d e a l s o l u t i o n is: "one i n which the a c t i v i t y equals t he mole
f r a c t i o n over the e n t i r e composition range and over a non-zero range of temper-
a t u r e and pressure." Thus, f o r s o l u t i o n s of gases which approximate the i d e a l
gas l a w s reasonably c lose ly , t he i d e a l s o l u t i o n i s def ined by Raoul t ' s l a w :
The thermodynamic
P1 i = POX1
and
p i E po x 2 2 2
where :
P i o r Pi =
X1 o r X2
I d e a l p a r t i a l vapor pressures of Components 1 and 2
= Mole f r a c t i o n of Components 1 o r 2 i n l i q u i d mixture
P y o r P!$ = Equil ibr ium vapor of Components 1 and 2 over pure materials.
Raoul t ' s l a w , i n t h i s case, w a s deduced on t h e assumption of zero hea t of mixing
and an entropy of mixing t h a t is independent of temperature and of p e c u l i a r i t i e s
of molecular s i z e s and shapes. Thus, an i d e a l s o l u t i o n is def ined i n terms of
zero heat of mixing. A c o r o l l a r y of t h i s d e f i n i t i o n is Henry's l a w which states
t h a t the equi l ibr ium value of t he mole f r a c t i o n of a gas dissolved i n a l i q u i d
is d i r e c t l y propor t iona l t o the a c t i v i t y (o r p a r t i a l p ressure i f t h e gas approx-
imates i d e a l i t y ) of t h a t gas above the l i q u i d sur face .
Where:
KH = Henry's l a w constant.
Henry's l a w is not r e s t r i c t e d t o i d e a l s o l u t i o n s , a t least i f c o r r e c t i o n s f o r
dev ia t ions of t h e gas from i d e a l i t y a r e taken i n t o account. Thus, s o l u b i l -
i t i e s of gases i n var ious s o l u t e s are o f t e n defined i n terms of the Henry's
l a w constant determined a t 1 atmosphere p re s su re ( o r p a r t i a l p re s su re ) . According t o Raoul t ' s l a w , methane can be s t o r e d a t ambient temperatures
at s u b s t a n t i a l l y reduced p res su res as an i d e a l s o l u t i o n i n a l i q u i d of low
v o l a t i l i t y . However, t h e vapor pressure of l i q u i d methane a t 25°C (extrapo-
l a t e d ) i s 29.3 MPa (4.248 psia) . '
percent s o l u t i o n i n a non-volati le so lven t w i l l s t i l l exert a pressure i n
excess of 14 MPa (2000 p s i ) .
MPa a t 25OC r e q u i r e s reducing t h e mole f r a c t i o n of methane i n t h e s o l u t i o n t o
somewhat less than 0.135; reduct ion t o 1.8 MPa, t o less than 0.07 mole f r ac -
Thus, methane s t o r e d a t 25OC as a 50 mole
To reduce t h e ambient s t o r a g e pressure t o 3.6
t i on . It is apparent, t h e r e f o r e , t h a t t h e u t i l i t y of s to rage as an i d e a l
s o l u t i o n is not a p a r t i c u l a r l y promising approach, un le s s a nonideal so lven t
r a n be found such t h a t t h e s o l u t i o n with methane e x h i b i t s a l a r g e negat ive
dev ia t ion from Raoult ' s l aw.
2. Regular So lu t ion Theory' * Many non-ideal s o l u t i o n s have s u f f i c i e n t thermal energy t o overcome t h e
tendency t o seg rega te , t hus d i sp lay ing nea r ly i d e a l entropy of mixing. Such
s o l u t i o n s have been designated by Hildebrand and Sco t t as "regular" solu-
t ions. '
energy of mixing, AFM) compared t o i d e a l i t y w i l l depend on d i f f e r e n c e s i n t h e
heat of mixing, AHM.
developed an equat ion f o r t h e s o l u b i l i t y of gases i n t h e form:
Differences i n s o l u b i l i t y (i.e., d i f f e r e n c e s i n the change of f r e e
On t h e b a s i s of r egu la r s o l u t i o n theory, Hildebrand
(3) 2 (sl - s2> i v2 log x2 = log x2 - 2.303 RT
Gjaldbaek and Hildebrand3 subsequently modified t h e equat ion f o r Flory-Huggins
mixing as follows:
E-2

i v2 2- [log - v2 + 0.434(1 - -I[ v2 ( 4 )
v1 v1 2.303 RT ('1- '2) log x2 = log x2 -
Where:
= Equilibrium mole fraction of Component 2 in a liquid mixture *2
xzi = Ideal solubility of Component 2 in mixture
V1,V2 = Molar volumes of components
R = Gas constant = 1.9865
T = Temperature of solution, OK
S1, S2 = Solubility parameters of Components 1 and 2.
The solubility parameter, also called the cohesive energy density, S, in turn is defined as follows:
AH: - RT 1 /2 s1 = ( )
v1
Where :
AH!
R,T,V1 = A s above.
The ideal solubility, Xi, can be estimated by the following equation:
= Heat of vaporization of Component 1 at solution temperature
i AH 1 1 2.303 R (7 - log x2 =
( 5 )
Where:
T =I Solution temperature, O K
TB = Boiling point, OK.
Thus, the primary parameters controlling the solubility of a non-polar gas such as methane in non-polar solutions is presumably the temperature of the solution relative to the boiling point of the gas, the molal volumes of the components and, in particular, the solubility parameter, S , as defined above.
E -3

It will be noted that if methane (or any other non-polar gas) is dissolved in a solvent having the same molal volume and the same solubility parameter as
methane, the last two terms in the equation would be zero and the solubility would be that calculated for an ideal solution.
The Hildebrand treatment of regular solutions has been modified empiric- ally to yield better correlations with non-associated polar solvents by Yen and M~Ketta.~ correlations are marginal compared to the effects sought in this review. Other reviews of the literature on gas solubility in liquids include Battino,
However, the differences in actual solubility covered by these
22 La~son,'~ and Pierotti. 24
Considerable data on the solubility parameters of various molecular species are available in the literature, most of which are based on heats of vaporization measured at ~5"c.l , 2 , 5 , 6 3 9
ScottlS2 specifies the temperature at which AH However, the temperature at which the AH were derived is not necessarily clear in other sources although 25OC is usually implied. methane and ethane <AHv + V) were not found to give good estimates of S at 25°C. Furthermore, in some literature sources, solubility parameters were estimated from solubility data in solvents for which S values are avail- able.19297s8 However, in this case, variations attributed to S may actually
be the result of variations in molar volume (i.e., in the Flory Huggins cor-
rection).
The data presented by Hildebrand and V was measured.
V
In particular, sufficient data for
Alternate methods of estimating the solubility parameter are also avail- 5 able as outlined by Hildebrand and ScottlS2 and by others.
According to the data cited by Hildebrand and Scott,:! methane behaves in most solutions like other non-polar molecules, subject primarily to the van der Waals forces. For example, the solubility of methane in various solvents correlates nicely with that of other non-polar gases, including H2, N2, CO,
02, C02, and the rare gases, on the basis of their "force constants," the parameters' of the intermolecular energy function as expressed by Lennard- Jones. Furthermore, the solubility of methane correlates rather well with the
solubility parameter of the solvent, which is a measure of the cohesive energy density of the solvent. Exceptions -to this, which tend to indicate solvation or some degree of polar or acid-base interaction (as in the case of C02-
benzene mixtures), have not been found for methane solutions.
E -4
The efficacy of Equation 4 for estimating the solubilities of a number of non-polar gases, including CH4, in various solvents has been tested by Gjaldbaek
and associates with reasonably positive *8 However, these results were dependent on estimations of the solubility parameter of methane (and other
gases near or above their critical points) from Equation 4 using solubility data in other solvents of known solubility parameters. Their estimate of S
for methane on this basis is 6.2, far greater than our 'own estimate of some- thing less than 4.
It is also interesting to note that some of the higher members of the paraffin series, such as n-heptane (C7HI6) and in particular isooctane
(C8H18), behave in solutions with perfluorocarbons as if their solubility
parameters are significantly greater than those calculated from presumably reliable AH density data at solution temperature. v 2
The effect is greatest with i-CgH18, which has a labile tertiary hydrogen atom that may behave somewhat as a Lewis acid. However, the effect apparently disappears with paraffins below 7 carbon atoms whose hydrogen atoms are less labile (at least toward thermal decomposition). Thus, such an effect would
not be expected with methane.
Negative deviations from ideal solution behavior would be expected pri- marily with strong interactions (e.g., dipole, acid-base, or hydrogen bonding)
between solute and solvent, which appear to be unlikely to occur with methane,
at least with common solvents.
On the other hand, physical adsorption of methane on surfaces such as activated carbon or silica gel do in fact represent strong (van der Waals forces) interactions between methane and a chemical substrate (solid, in this
case) which are comparable to negative deviations from "ideal interaction." Thus, negative interactions with methane are possible and might be simulated
in the liquid phase by surface forces either in mixed interacting solvent combinations or by adding solid surfaces to form a colloidal suspension.
Data Collection
The solubility data found in this study, covering a broad spectrum of solubility parameters and molal volumes as well as polarities, are shown in
Table 2, and in Figure 1 plotted as a function of solubility parameter. In general, the data correlates reasonably well with the solubility parameter
E-5
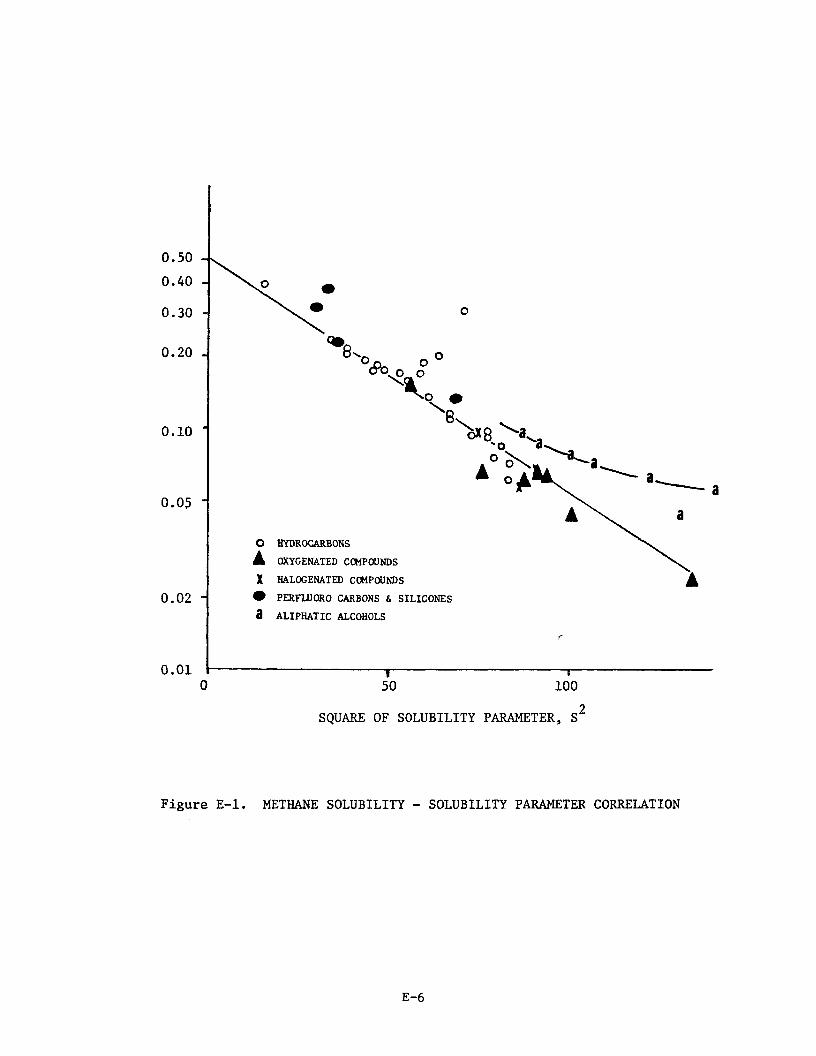
0.50 0.40
0.30
0.20
0.10
0.05
0.02
0.01 0
0
50 100
SQUARE OF SOLUBILITY PARAMETER, S 2
Figure E-1. METHANE SOLUBILITY - SOLUBILITY PARAMETER CORRELATION
E-6
from 5.5 to 10 with solubility decreasing with increasing solubility param- eter.
Most of the solubility data available in the literature were measured in terms of mole fraction of methane in equilibrium solution at the standard con- ditions of 25OC and 1 atmosphere total pressure. For our purposes, these data have been converted to molal solubilities at more practicable conditions of 34
atmospheres ( 5 0 0 psia). and 25OC (77'F) assuming that Henry's Law is obeyed,
which is reasonably accurate for methane up to at least 34 atm. Solubilities in the lower paraffinic hydrocarbons (C2-C4), however, were derived from vapor-liquid equilibrium data for those systems in which both components 'have appreciable, or high concentrations in both phases in two ways: 1) equilibrium concentrations in liquid at a total pressure of 34 atm as measured, and 2 ) by
correcting the measured mole fractions of methane in the liquid phase at 25°C
to a methane partial pressure of 34 atm via Henry's Law.
\
Solubility @ 34. atm cH4, 250C =
x 34 (7 ) Mole Fraction in Liquid Phase (3 25oC
Mole Fraction cH4 in'Vapor Phase x Total Press
Such values are fictitious in the sense that they can be achieved only at pres- sures much greater than 34 atm or not at all in the case of ethane. However,
they do represent the approximate solubilities which would be achieved if the solvent had the same solution properties as C2-C4 hydrocarbons but were non- volatile.
It will be noted from Figure 1 that the solubilities of methane in a wide
variety of solvents other than alcohols correlate more or less linearly with the solubility parameter of the solvent on a log molal solubility versus S
basis, semiquantitatively in agreement with Equations 3 or 4. However, Figure 1 is intended primarily to be illustrative and not as a definitive correlation. Thus, the scatter in the data may result from failure to account properly for differences in molal volume of solute and solvent as well as
inaccuracies in:
2
e . Solubility measurements
0 Estimation of solubility parameters
E-7
e Deviations from ideal gas behavior.
There are several features of the correlation that need comment.
1 . Applicability of Solubility Parameter Values
Although the correlation conforms, in general, to Equation 3 which has a theoretical basis, it should not be considered rigorous and quantitative. In particular, the aesignment of quantitative values to the solubility parameter, S , is somewhat in question since values of heats of vaporization and molar volumes at solution temperature (25") are sometimes difficult to find. Fur- thermore, as Hildebrand has pointed out, in some cases paraffin hydrocarbons in perfluorocarbons tend to behave as if the solubility parameter of one (or hnth) of the components is shifted.2 literature to use alternate methods of estiniating S , in particular, by de- fining the solubility parameter using empirical solubility determinations with solvents or solutes whose solubility parameters are known.
Thus, there is a tendency in the
The solubility parameter of methane at 25OC cannot be estimated by the method used in this study (based on AHv + V,), since 25OC is considerably above its critical temperatures (TC = -82OC). at 25°C is presumably zero and the net energy of vaporization (AHv - RT) may actually be negative (i.e., (0 - RT) = -592 cal/mole). However, in our case we have skirted the problem by correlating in terms of S2 rather than ( S 1 - S2) of methane corresponding to the values used for various hydrocarbon solvents is presumed to be less than those estimated for propane ( S = 5.85) from actual
AHv + VM data, and for ethane ( S = 4.05) estimated by extrapolation of AHv from lower temperatures and by extrapolation of S values at lower temperatures from measured hHV + VM data. presumably less than 4.0, comparable only to the perfluorocarbons, silicones, or lower hydrocarbons which have been found to be the best solvents.
Thus, the heat of vaporization
2
2 as suggested by Equations 3 or 4. In any case, the solubility parameter
Thus, the solubility parameter of methane is
2. Effect of Molecular Weight
It will be noted that with the paraffin hydrocarbon series, the correla- tion appears to hold up to about C, above which the mole fraction solubility
increases with increasing molecular weight. These deviations are qualita- tively if not quantitatively accountable in terms of the differences in molal
E-8

volumes which a f f e c t t h e t h i r d t e r m i n Equation 4 ,
i t ies i n perf luoroheptane and octamethyl cyc lo t e t r a s i loxane can a l s o poss ib ly
be explained i n these terns. However, t h e phys ica l explanat ion of th i s phe-
nomenon may be t h a t i n the l a r g e r molecular weight so lven t s , the d isso lved
methane is i n t e r a c t i n g not with the molecule as a whole but wi th smaller seg-
ments of the molecule. This physical p i c t u r e i s cons i s t en t wi th the f a c t t h a t
(n-ChF9I3N which might be expected t o behave as a s p h e r i c a l e n t i t y appears t o
conform t o t h e s o l u b i l i t y parameters c o r r e l a t i o n very w e l l , whereas n-C7FI6
and octamethyl cyc lo t e t r a s i loxane do not. This concept could be important i n
designing h igher molecular weight so lvents having good capac i ty on a gravimet-
r i c as w e l l as a mole f r a c t i o n basis . It is unfor tuna te t h a t with t h e
n-paraffin series of so lven t s , the increase i n s o l u b i l i t y on a mole f r a c t i o n
b a s i s with inc reas ing molecular wieght above n-heptane is not s u f f i c i e n t t o
overcome the l o s s i n grav imet r ic capaci ty due t o the molecular weight i nc rease
(compare s o l u b i l i t i e s i n Table 2 on a mole f r a c t i o n and l b / l b bas i s ) .
The somewhat high so lub i l -
On the o the r hand, i f high solvency of propane o r p a r t i c u l a r l y methane,
e thane, and propane could be simulated i n terms of a m u l t i p l i c i t y of methyl-,
ethyl- , or propyl-group branches on a sur face (e.g., s i l i c a g e l ) o r on an
oligomer, t h e inc rease i n molecular weight might be overcome by the inc rease
i n solvency i n the s i d e chains so t h a t the so lvent maintains the methane
capac i ty on a gravimet r ic b a s i s c lose t o that of methane, ethane, o r propane.
Ethane a t 3.6 MPa vapor pressure , f o r example, would d i s so lve methane at a
r a t i o of 0.35 g CH4/g ethane. I f t h i s solvency can be maintained wi th the
e t h y l group branches on a low polymer, a gravimet r ic capac i ty exceeding t h a t
of adsorp t ion could be achieved.
3. Al ipha t i c Hydroxyl-Group Ef fec t
The s o l u b i l i t i e s of methane i n a l i p h a t i c a lcohols , al though c o r r e l a t a b l e
wi th s o l u b i l i t y parameters appear t o be g r e a t e r at the same s o l u b i l i t y param-
e te r value than found f o r t h e o ther so lven t s having no hydroxyl groups. This
suggests t h a t hydrogen bonding, i f s t rong enough, does con t r ibu te t o so lvent
power f o r methane independent of t h e s o l u b i l i t y parameter. However, t he
con t r ibu t ion of the hydroxyl groups t o s o l u b i l i t y tends t o be overwhelmed by
t h e i r e f f e c t on s o l u b i l i t y parameter. Nonetheless, t h e very ex is tence of t he
e f f e c t suggests t h a t i t should be poss ib l e t o u t i l i z e i t t o design systems
wi th enhanced s o l u b i l i t y f o r methane as discussed below.
E-9
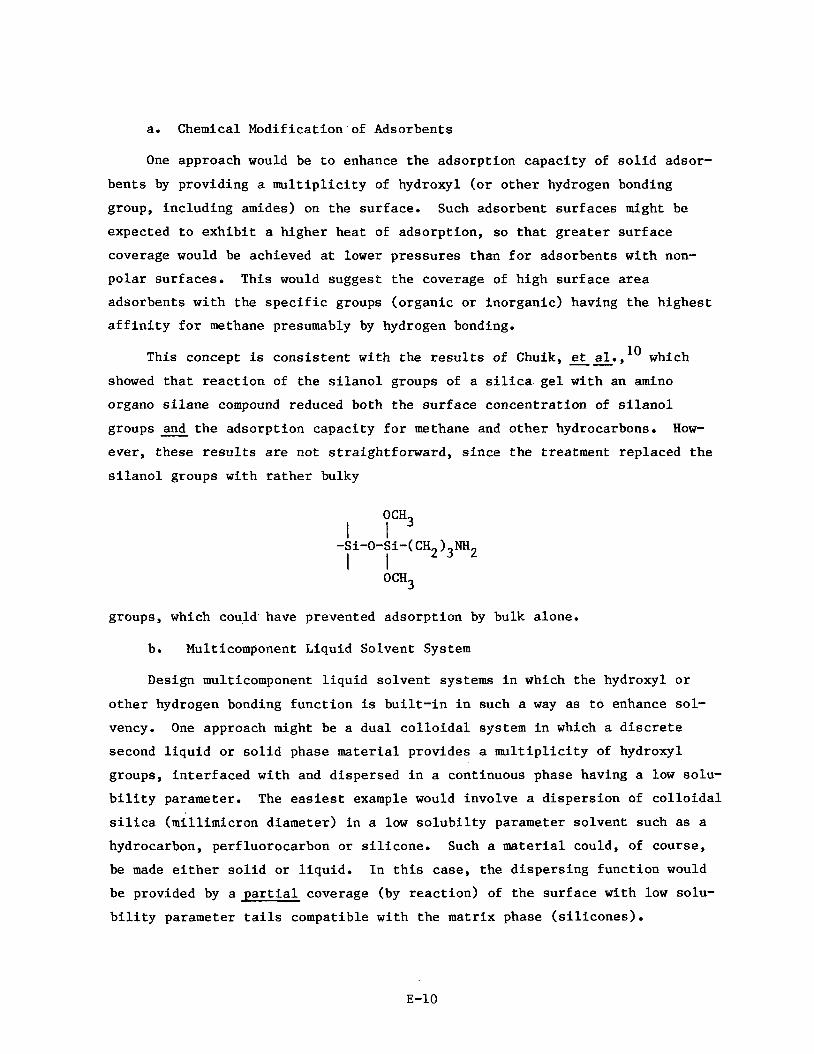
a. Chemical Modification of Adsorbents
One approach would be t o enhance t h e adsorpt ion capaci ty of s o l i d adsor-
bents by providing a m u l t i p l i c i t y of hydroxyl ( o r o t h e r hydrogen bonding
group, i nc lud ing amides) on the surface. Such adsorbent su r faces might be
expected t o e x h i b i t a higher heat of adsorpt ion, so t h a t g r e a t e r s u r f a c e
coverage would be achieved a t lower p re s su res than f o r adsorbents w i th non-
po la r surfaces . This would suggest t h e coverage of high su r face area
adsorbents w i th the s p e c i f i c groups (o rgan ic o r i no rgan ic ) having t h e h ighes t
a f f i n i t y f o r methane presumably by hydrogen bonding.
This concept i s c o n s i s t e n t with the r e s u l t s of Chuik, et al., lo which
showed t h a t r e a c t i o n of t h e s i l a n o l groups of a s i l ica g e l w i th an amino
organo s i l a n e compound reduced both the s u r f a c e concentrat ion of s i l a n o l
groups * the adsorpt ion capaci ty f o r methane and o t h e r hydrocarbons.
ever, these r e s u l t s are not s t r a igh t fo rward , since t h e treatment replaced t h e
s i l a n o l groups with r a t h e r bulky
How-
OCH3 I I I 1
-Si-O-Si-(CH2)3NH2
OCH3
groups, which could.have prevented adsorpt ion by bulk alone.
b. Multicomponent Liquid Solvent System
Design multicomponent l i q u i d so lven t systems i n which the hydroxyl o r
o t h e r hydrogen bonding func t ion is b u i l t - i n i n such a way as t o enhance sol-
vency. One approach might be a dual c o l l o i d a l system i n which a d i s c r e t e
second l i q u i d o r s o l i d phase material provides a m u l t i p l i c i t y of hydroxyl
groups, i n t e r f a c e d with and dispersed i n a continuous phase having a low solu-
b i l i t y parameter. The easiest example would involve a d i spe r s ion of c o l l o i d a l
s i l i c a (mil l imicron diameter) i n a low s o l u b i l t y parameter so lven t such as a
hydrocarbon, perfluorocarbon or s i l i c o n e . Such a material could, of course,
be made e i t h e r s o l i d or l i q u i d . I n t h i s case, the d i spe r s ing funct ion would
be provided by a p a r t i a l coverage (by r e a c t i o n ) of t h e su r face with low solu-
b i l i t y parameter t a i l s compatible with the matrix phase ( s i l i c o n e s )
E-10

C. Dual Function' Solvents
Design single, dual function molecules or dual functional mixtures of
solvent molecules containing both a low solubility parameter function and a hydrogen bonding or other affinity function in the form of a hydroxyl, amido or other groups. In particular, if the hydroxyl group effect on the solubil- ity parameter of the solution could be minimized by either:
0 Hindrance of the hydroxyl effect on S by surrounding it with low so lu - bility tails in a single solvent molecule.
e Neutralization of the effect of the hydroxyl group on solubility param- eter of the solution by hydrogen bond formation in a manner similar to the effect of ether formation on solubility parameter and solvent power of alcohols (e.g., S for diethyl ether = 7.5 compared to 12.7 for ethyl alcohol from which it is made). Similarly perhaps, the solubility param- eter of R-O*"H-CH3 may be considerably less than ROH itself. solvent migtures containing a low solubility parameter solvent molecule as a matrix plus a strongly hydrogen bonding species (such as alcohol) & concentrations comparable to that of the expected solute concentrations could exhibit the advantages of both hydrogen bonding and low solubility parameter.
If so,
d. .Hydrogen-Bonding Groups Other: than Hydroxyl
Find other organic or inorganic groups having even greater hydrogen bonding
power than aliphatic hydroxyl groups. In particular, Wolfenden has reviewed and analyzed the "hydrophilicity" of various organic groups in terms of the water-to-vapor distribution coefficients for various aqueous solutfons of uncharged organic compounds containing these groups. l 2
that the hydrogen bonding propensity of various groups increases in the fol- lowing order: hydes and ketones < nitriles < amines < alcohols < H20 < acids, phosphotri- esters < Amides and diols < q-substituted amides < peptides < guanidines. This suggests that q-substituted amides and guanidines in which the
q-substituent is a long chain hydrocarbon or perfluorocarbon dissolved in an
appropriate solvent of low solubility parameter should be worthy of evalu-
ation.
The results suggest
Alkanes < - SH < - C1 < ethers and thioethers < esters < alde-
14 Solubility of Efethane in Polymers
Considerable literature exists on the solubility of various gases including methane in a number of polymers. the diffusion characteristics of polymeric films, one of the basic parameters
Most of this work was aimed at determining
of which is solubility. The best polymeric solvent found so far is silicone rubber, which exhibits a significantly greater capacity for methane (0.018 g/g) than polyethylenes, polyisobutylene and other systems. l4 the gravimetric capacity of even silicone rubber is very low compared to the low molecular weight solvents.
Unfortunately,
The factors controlling solubility of fixed gases in these systems was
not completely delineated by the literature review. For example, the solubility of methane in polyethylene in some studies appears to be limited to (or correlatable with) the amorphous phase. 18,19 Yet other studies have found relatively little difference between the highly crystallizable linear poly- ethylene and amorphous systems such as polyisobutylene. '' be trending toward a "hole" theory comparable to adsorption in such common adsorbents as activated carbon in that the solubility is a function of the "hole" volume.
The theory seems to
16,20
Nonetheless, solubility would be expected to be greatest in relatively
low solubility parameter polymers such as polyisobutylene and the silicones. Furthermore, amorphous polymers would be expected to exhibit greater "hole volume" than crystalline polymers. In any case, one wonders if the free "hole" volume in polyisobutylene or silicone polymers could be controlled by controlled cross-linking while in a swollen state with an easily volatilized solvent. Of particular interest would be silicon-containing polymers in- cluding:
0 Polyvinyl trimethyl silane which has been shown to dissolve m thane to 13 the extent of four times that of polyethylene terephthalate.
e Poly 1-(Trimethyl Sily1)-1-propyne which has recently been shown to 21 dissolve oxygen to an extent ten times that of other known polymers.
It is interesting to speculate as well that specialized adsorbents, as opposed to absorbents, could be developed from polymeric systems cross-linked in the swollen state, containing hydrogen bonding groups such as hydroxyl or amide groups, e.g., polyvinyl alcohol or polyethylene terephthalate. Such
polymeric systems are sometimes called reticulated polymers and offer the pos- sibility of adsorbents with surface chemistries tailored for the particular adsorbate desired. We do not have surface area data on such systems but dry reticulated ion exchange resins have been evaluated as catalysts.
E-12

Such systems could be of considerable i n t e r e s t , a t l e a s t conceptually,
s ince they may lead t o negative deviat ions from idea l interact ion at the s o l i d
surfaces. However, strong adsorption would be expected to occur only for
monomolecular surface coverage. Thus, surface area would be important.
E-1 3
SUMMARY AND CONCLUSIONS
The available literature data on the solubility of methane in a wide var- _ *
iety of solvents has been collected and analyzed and the general conclusions are as follows:
e In general, the data pretty well conforms to the classical views of Hildebrand on regular solutions, i.e., solutions "in which orienting and chemical effects are absent and in which the distributions and orienta- tions are random..." In other words, methane behaves in most solutions as non-polar molecules (including the rare gases) subject primarily to Van der Waals dispersion forces.
0 The primary parameters controlling solubility in regular solution theory are the molal volume and the Hildebrand solubility parameter relative to that of methane, the solubility parameter (or cohesive energy density) being defined as:
where:
AH; = Heat of vaporization at solution temperature
VI = Molal volume of Component 1.
0 Since the solubility parameter of methane is at the lower end of the scale (S = <4), the best solvents for methane are the perfluorocarbons, the silicones, and the lower aliphatic hydrocarbons such as propane.
0 The best solvent for methane so far identified is propane, in which methane is soluble to the extent of 0.15 mole fraction or.0.063 g CH4/g solvent. However, this is a lower capacity on a mass ratio basis than can be expected from adsorption on activated carbon.
0 On a mole fraction basis, the solubility of methane in octamethyl cyclo- tetrasiloxane (0.32) and in perfluoro n-heptane (0.28) is greater than in propane but on a gravimetric basis the solubilities are much lower (0.025 and 0.016 respectively) due to their high molecular weight. solubilities in lower molecular weight perfluorocarbons and silicones s hou id be determined .
Thus, methane
0 In the aliphatic hydrocarbon series, the solubility of methane decreases
fi with increasing molecular weight (and increasing S) up to about C
Above (n-hexane) e
tion basis in this c ass of solvents increases rapidly with increasing molecular weight to 0.32 for C32 (squalane). weight increases more rapidly than solubility so that the solubility on a gravimetric basis continues to decrease with molecular weight.
however, the solubility of methane on a mo e frac-
Unfortunately, the solvent
E-14

o The s o l u b i l i t y of methane i n isobutane (0.061 g/g) and neopentane (0.057 g/g) suggests t h a t t h e s o l u b i l i t y on a gravimet r ic b a s i s may be main- t a ined whi le molecular weight i nc reases f o r highly branched p a r a f f i n hydrocarbon. Unfortunately, d a t a on t h e s o l u b i l i t y of methane in higher molecular weight highly branched p a r a f f i n s is lacking.
6 I n p a r t i c u l a r , prel iminary ca l cu la t ions suggest that i t may be poss ib l e t o design h igher molecular weight so lven t s having gravimet r ic c a p a c i t i e s i n the range o f , o r g r e a t e r than, f o r adsorpt ion. The s o l u b i l i t y d a t a presented above f o r t h e lower p a r a f f i n i c hydrocarbons (e.g., propane) a c t u a l l y represent t he concent ra t ion of methane i n the l i q u i d phase of a mixture i n equi l ibr ium wi th a vapor phase conta in ing a considerable propor t ion of so lvent vapor. For example, i f t he equi l ibr ium concent ra t ion of methane i n propane a t 25°C and 3.5 MPa t o t a l p ressure i s cor rec ted t o 3.5 MPa p a r t i a l p ressure of methane, t h e s o l u b i l i t y would inc rease from 0.063 g /g t o 0.11 g/g propane. With ethane, the equi l ib- rium concent ra t ion of methane i n the l i q u i d phase a t 25OC and 4.9 MPa is about 0.05. Thus, i f cor rec ted t o 3.5 MPa p a r t i a l p ressure of methane, t he s o l u b i l i t y i n methane becomes 0.35 g/g of ethane. Thus, i f we could t i e down t h e methyl, e t h y l or propyl groups and s t i l l achieve t h e i r sol- vent power f o r methane, it may be poss ib l e t o achieve a v i ab le non- v o l a t i l e so lvent f o r our purposes. I n p a r t i c u l a r , i f we could s imula te the high solvency of methane, ethane, or propane i n terms of a mul t ip l ic - i t y of methyl, e t h y l , or propyl groups as branches on a sur face (e.g., s i l i ca g e l ) o r an oligomer, the gravimetri ,c s o l u t i o n capaci ty f o r methane might be maintained a t a reasonable l eve l . For example, i f t he solvency of e thane can be maintained wi th e t h y l groups on a low molecular weight polymer, a gravimet r ic capac i ty exceeding t h a t f o r adsorpt ion might be achieved:
Calculated g /g
CH3-CH3
CH3 CH3 CH3 I l l CH2 CH2 CH2 I l l ... C - C - C ... n
CH3 I CH2 I
CH3 I . CH2 I
.C- C - C - C ... n
0.35
0.24
0.18
The s o l u b i l i t i e s of methane i n a l i p h a t i c a l coho l s , al though c o r r e l a t a b l e wi th s o l u b i l i t y parameters, appear t o be g r e a t e r a t the same s o l u b i l i t y parameter value than f o r o the r so lven t s having no hydroxyl groups. This sugges ts t h a t hydrogen bonding power can con t r ibu te t o so lvent power f o r
E-1 5
methane independent of the solubility parameter. However, this contribu- tion to solvency by the hydroxyl group is overwhelmed by its effect on solubilty parameter. Nonetheless, the effect suggests that it may be possible t 0:
1) Enhance the adsorptive capacity of solid adsorbents by providing a multi- plicity of hydroxyl groups on the surface.
2) Design multicomponent liquid solvent systems in which the hydroxyl or other hydrogen bonding function is build into the system to enhance solvency.
3 ) Design dual function systems, either single detergent-like molecules or a dispersion of hydroxyl group containing molecules in a matrix of l,ow sol- ubilty parameter, in which the hydroxyl group effect on the solubility parameter of the solvent as a whole is suppressed or minimized by.
4 ) Evaluate the effect of other groups having stronger hydrogen bonding power than aliphatic hydroxyl groups including amides, n-substituted amides and n-substituted guanidines.
5) Of particular interest would be tailor-made polymers (or oligomers) of various silicon containing monomers and particularly the trialkyl silanes (as opposed to the dialkyl silicone type).
E-1 6

REFERENCES FOR APPENDIX E
1. Hildebrand, J. H. and Scott, R. L., The Solubility of Nonelectrolytes, New York: Reinhold (1950).
2. Hildebrand, J. H. and Scott, R. L., Regular Solutions, Englewood Cliffs, NJ: Prentice Hall (1962).
3. J. C. Gjaldbaek and J. H. Hildebrand, J. Am. Chem. SOC., 2, 3147 (1949).
4. ' Yen, L. C, and McKetta, J. J., "A Thermodynamic Correlation of Non-Polar Gas Solubilities in Polar Non-Associated Liquids," A.1.Ch.E. Journal, 5 501-507 (1972) e
5. Burrell, H., "Solubility Parameters for Fil Formers," Official Digest, 4 27 726-758 (1955).
6. Lieberman, E. P., "Quantification of the Hydrogen Bonding Parameter," Official Digest, 34, pp 30-50 (1972).
7. Thomsen, E. S . and Gjaldbaek, J. C., "Solubility of Propane in Non-Polar Solvents," Acta Chemica Scand. 17, 134-138 (1963).
8. Thomsen, E. S , and Gjaldbaek, J. C., "The Solubility of Hydrogen, Nitro- gen, Oxygen, and Ethane in Normal Hydrocarbons." Acta Chemica Scand.,
-9 17 127-133 (1963).
9. Sebastian, H. M., Lin, H. M., and Chao, K. E., "Correlation of Solubility of Hydrogen in Hydrocarbon Solvents," A.1.Ch.E J., 27, 138-148 (1981).
10. Chuiko, A. A., et. &., "Aminoorgeno Silicon Compounds as Chemically Active Sorbents and Fillers of Polymer Materials. I. Surface Reaction of (y-amino propyl) Triethoxysilane with Silica and Adsorption Properties of Amino Organo Silicon Compounds," Chemical Abstracts, 64, 6825d (1966).
11. Koltsov, S. I., et. &., "Molecular-Layers Deposition of Carbon on Siliceons Adsorbents of Different Porous Structure,"
-9 91 27745h (1979).
12. Wolfenden, Richard, "Waterlogged Molecules," Science, 222, 1087-1093 (1983).
13. Volkop, V. V., et. &., "Solubility of Gases in Poly (Vinyltrimethyl- silane)," 86, 122132r (1977).
14. Robb. W. L., "Thin Silicone Membranes - Their Permeation Properties and Some Applications," Annals, NY Acad. Sciences, Vol. 46, 119-137 (1968).
E-1 7
15 o
16.
17.
18.
19 0
20 . 21
22 . 23
24
W. L. Robb, Thin Silicone Membranes - Their Permeation Properties and Some Applications, General Electric, Technical information series, 65-C- 031 (Okt. 65), Research and Development Center, Schenectady, M I .
Lundberg, J. L. and Mooney, E. J., "Diffusion and Solubility of Methane in Polyisobutylene," J. Poly. Sci., Part A-2, Vol 3 974-962 (1969). Van Amerongen, G. J., "The Permeability of Different Rubbers to Gases and its Relation to Diffusivity and Solubility," J. Applied Physics, 17, 972- 985 (1946).
Michaels, A. S. and Parker, Re B., "Sorption and Flow of Gases in Poly- ethylene," J. Poly. Sci., XLI, 53-71 (1959).
Michaels, A, S. and Bixter, H. J., "Solubility of Gases in Polyethylene," J. Poly. Sei., Val. L, 393-412 (1961).
Michaels, A. S., Vieth, W. R., and Barrie, J. A., "Solution of Gases in Polyethylene Terephthalate," J. Applied Physics, 34, 1-20 (1963).
Takada, K., et al., J. Am. Chem. SOC., 105, 7473 (1983). Battino, R. and Clever, H. L., "The Solubility of Gases in Liquids," Chem. Rev., 66, 395 (1966).
Lawson, D. D., "Methods of Calculating Engineering Parameters for Gas Separations," Applied Energy 6, 240-251 (1980).
Pierotti, R. A., "The Solubility of Gases in Liquids," J. Phys. Chem. 67, 1810-1845 (1963).
E-18

Table 2. EXPERIMENTAL SOLUBILITIES OF METHANE IN VARIOUS SOLVENTS
Equilibrium
at 25OC Composition Methane Solubility Liquid
at 25OC and 34 - atm Total Pressure
34 atm CHI, Pressure,
Faction, g CH4/g Weight @ Mol
Solvent Ref . S CHI, Solvent Percent g/g
ALIPHATIC HYDROCARBONS
Ethane Propane n-Bu t ane i-Butane n-Pen t ane i-Pent ane neo-Pentane n-Hexane z-Methylperitane n-Hep t ane n-Oc tane 224-Trimethl
Pentane n-Decane Polyethylene
38 1,2Y3 4Y5 6 7
14 8-11,13,35 12 35 17
15 17 41
Cyclohexane 9 CIS 1,2 Dimethyl 24 Cyclohexane Trans-Cyclohexane 24 1,3 Dimethyl 24 Cyclohexame CIS l Y 4 Cyclohexane 24 Methyl Cyclohexane 25 Bicyclohexyl 16 Cyclooctane 28
Benzene Toluene o-Xylene m-X y 1 e ne p-Xylene D i phyny 1
1-Me t hyl Methane
Naphthalene
9,23 19,25,35 26 26 26
16
31,32
4 -05 5.85 6.6 6.2 7 .O 6.8 6.2 7 03
7.45 7 -65
--
0 -40 0.235 0.192 0.205 0.175 0 . 177 0.218 0.17 0.17 0.16 0.17
0.21 0.05 0.027 0.11 0.148 0 -063 0.66 0.17 0.054
0 -06 1 0.071 0.18 0.175 0.046 0 -046 0. 0.165 -- 0.062 0 -206 0 -057 0.038 0 -038 0.030 0.029
6.85 0.184 0.032 7.7 0.20 0 -028 -- 0.005 -- ALICYCLIC HYDROCARBONS
8.2 0.11 0 -024
0.135 0.145
0.145 0.147
7 .8 0.135 8.2 0.115 8.5 0.094
AROMATIC HYDROCARBONS
9.15 0.071 0.012 8.9 0.076 0.013 9 00 0.085 0.014 8 .8 0.092 8.8 0.098 0.016
9.1 0.06 1
0.053
E-19

Table 2. EXPERIMENTAL SOLUBILITIES OF METHANE IN VARIOUS SOLVENTS, CON'T.
Equilibrium
at 25OC Composition
@ Mol atm Total Pressure
Methane Solubility Liquid
34 atm CHI, Pressure, at 25OC and 34
Faction, g CH4/g Weight Solvent Ref. S CHI, Solvent Percent g/g
PERFLUOROCARBONS AND SILICONES
(C4Fg) N 21 C7F1$ 22 Hexa luoro
Benzene 23 Octamethylcyclo
Tetrasilane 31 Silicone Rubber 42
CH2Cl-CH2Cl CCL4 Chlorobenzene CHC13 CClZF-CClF2
H20 Methyl Alcohol Ethyl Alcohol Propyl Alcohol i-Propyl Alcohol n-Butyl Alcohol .n-Amyl Alcohol n-Hexyl Alcohol n-Heptyl Alcohol n-Octyl Alcohol n-Decyl Alcohol Cyclo Hexyl Alcohol
35
9,35 35 15
5 .9 0.23 5.7 0.28 0.016
a .25 0.13
5.5 0.32 0 -025 o .oia
CHLORINATED HYDROCARBONS
0.029 8.6 0.097 0.011
9.25 0.058 0.008 0.17
9 05 o .06a
ALIPHATIC ALCOHOLS
23 .4 14.5 12.7 11*9 11.5 11.0 10.3 10 .o 9 .5 9.3
0.0009 0,029 0 ,044 0.055 0 -049 0.065 0.073 0 -080
0.095
0.043
o .oaa
o .loa
E-20

Solvent
Table 2. EXPERIMENTAL SOLUBILITIES OF METHANE IN VARIOUS SOLVENTS, CON'T.
Methane Solubility at 25OC
34 atm CHI, Pressure, @ Mol
Diethyl Ether Dioxane Methyl Acetate Ace tone Ethylene Oxide Methyl Ethyl Ketone Propylene
Carbonat e Glycerol tri-
Acetate Sulfur Dioxide cos Dime thy 1
Tributyl
cs2
Sulfoxide
Phosphate
Ammonia Aniline Cyclohexyl
Amine Methyl
Pyrrolidane Nitrobenzene
Faction; g CH4/g Ref . S CHI, Solvent
MISCELLANEOUS OXYGEN COMPOUNDS
9 7.45 0.154 0 -039 9 10 .o 0.044 9 9.5 0.066 9 9.65 0 -063 27 0.055
9.3 0.06
39 13.3 0.023
39
29 21,22 10 .o
0 -065 0.035 0.076 0.044
30 0.013
39 0.155
MISCELLANEOUS NITROGEN COMPOUNDS
33 0.012 35 11.6 0 -023
29 8.7 0 -065
39 0.033 35 10 .o 0.030
E-23
REFEReNCES FOR TABLE 2 ONLY
1. Reamer, H. He, Sage, B. H., and Lacey, We N., "Phase Equilibria in Hydro- carbon Systems Volumetric and Phase Behavior of the Methane-Propane Sys- tem, Ind. Eng. Chem., 42, 534-539 (1950).
2. Sage, B. H., Lacey, W. N., and Schaafsma, J. G., "Phase Equilibria in Hydrocarbon System I1 Methane-Propane System, Ind. Eng. Chem. 26, 214-217 (1934).
3. Akers, W. W., Burns, J. F., and Fairchild, W. R., "Low Temperature Phase Equilibria Methane-Propane System," Ind. Eng. Chem. 46, 2531-2536 (1954) *
4. Sage, B. H., Hicks, B. L. and Lacey, W. N., "Phase Equilibria in Hydro- carbon Systems. Ind. Eng. Chem. 32, 1087-92 (1940).
The Methane-n-Butane System in the Two Phase Region,"
5. Roberts, L. R. et. &., "Methane-n-Butane System in the Two Phase Region," J. Chem. & Eng. Data, L, 484-85 (1962).
6. Olds, Re H., Sage, B. H., and Lacey, W. N., "Methane-Isobutane System," Ind. Eng. Chem., 34, 1008-1013 (1942).
7. Sage, B. H., et. &., "Phase Equilibria in Hydrocarbon Systems, Volumet- ric and Phase Behavior of Methane-n-Pentane System," Ind. Eng. Chem., 34, 1108-1113 (1942).
8. Shim, J. and Kohn, J. P., "Multiphase and Volumetric Equilibria of Methane-n-Hexane Binary System at Temperatures Between -110' and 15OoC," J. Chem. ti Eng. Data, 3-8 (1962).
9. Laming, A. and Gjaldbaek, J. C., "The Solubility of Methane in Hydrocar- bons, Alcohols, Water and Other Solvents," Acta. Chem. Scand., l4, 1124- 1128 (1960).
10. Reamer, H. H., Sage, B. He, and Lacey, W. N., "Phase Equilibria in Hydro- carbon Systems, Volumetric and Phase Behavior of the Methane-Cyclohexane System," Ind. & Eng. Chem., Chem. & Eng. Data Series, 3 240-245 (1958).
11. Lin, Y. et. &., "Vapor-Liquid Equilibrium of the Methane-n-Hexane System at Low Temperatures," J. Chem. ti Eng. Data, -, 22 402-408 (1977).
12. Kohn, J. P. and Haggin, J. H. S . , "Low Pressure Vapor-Liquid Isotherms in the.Flethane-3-Methylpentane Binary System," J. Chem. & Eng. Data, 12, 313-315 (1967).
13. Poston, R. S. and McKetta, J. J., "Vapor-Liquid Equilibrium in the Methane-n-Hexane System," J. Chem. & Eng. Data, 11, 362-363 (1966).
E-22

14.
15.
16.
17.
18.
19.
20.
21.
22.
23.
24.
25.
Rogers, B. L. and Prausnitz, J. Me, "High Pressure Vapor-Liquid Equilib- rium for Argone and Neopentane and Methane and Neopentane," J. Chem. Thermodynamics, & 211-216 (1971)-
Hiraoka, H. and Hildebrand, J. H., "The Solubility and Entropy of Solu- tion of- Certain Gases in (C4Fg) N; CC12F'CC1F2 and 2,2,4(CH3j; C5Hg," J. Phys. Chem., 68, 213-214 (1964).
Cukor, P. M. and Prausnitz, J. M., "Solubilities of Gases in Liquids at Elevated Temperatures. Henry's Constants for Hydrogen, Methane, and Ethane in Hexadecane, Bicyclohexyl and Diphenylmethane," J. Phys. Chem., 76, 598-602 (1972).
Wilcock, R, J., et. &., "Solubilities of Gases in Liquids. Solubilities of He, Ne, Ar, Kr, 02, N2, CO, C02, CH4, and SF6 in n- Octane, 1-Octanol, n-decane, and 1-decanol," J. Chem. Thermodynamics, 10, 817-822 (1978) .
11. The
Cukor, P. M. and Prausnitz, J. M., "Apparatus for Accurate Rapid Deter- minations of the Solubilities of Gases in Liquids at Elevated Tempera- tures," Ind. Eng. Chem. Fundam., 10, 638-640 (1971). Lin, Y., Hwang, S., and Kobayashi, Re, "Vapor-Liquid Equilibrium of the Methane-Toluene System at Low Temperatures," J. Chem. & Eng. Data,=, 231-234 (1978).
Senturk, N. H., Kalra, H., and Robinson, D. B., "Vapor-Liquid Equilibrium in the Methane-Carbonyl Sulfide Binary System," J. Chem. & Eng, Data, 24, 311-313 (1979).
Powell, R. J., "Solubility of 16 Gases in (C4F9)N and CS2," J. Chem. & Eng. Data, 17, 302-304 (1972).
Kobatuke, Y. and Hildebrand, J. L., "Solubility and Entropy of Solution of He, N2, A, 02, C2H6, CO and SF in Various Solvents; Regularity of Gas So1ubilitie~~"ACS -9 - 65 35;-335 (1861).
Evans, F. D. and Baltuno, R., "The Solubility of Gases in Liquids. 3. The Solubilities of Gases in Hexafluoro Benzene and in Benzene. 4. Calcula- tions on Gas Solubilities in Hexafluoro Benzene and Benzene," J. Chem. Thermo., 3 753-760 (1971). Geller, E. B., Battino, R., and Wilhelm, E., "The Solubility of Gases in Liquids. 9. Solubility of Ne, Ne, Ar, Kr, N SF 'in Some Dimethylcyclohexanes at 298' t o 3i3 K, J. Chem. Thermo., 5, 199-202 (1976).
:2,,,C0, C02, CH4, CF4, and
Field, L. F., Wilhelm, E., and BaHino, R., "The Solubility of Gases in Liquids. 6 . Solubility of N2,
243 (1974).
CO, C02, CH4, and CF4 in Methyl Cyclo- hexane and Toluene at 283" and J. Chem. Thermodynamics,h 237-
E-23

26
27 . 28 .
29.
30
31.
32.
33.
34 .
35.
36.
37.
38.
39 0
Byrne, J. E. and Battino, RE, "The Solubility of Gases in Liquids. 8. Solubility of He, Ne, Ar, Kr, C02, CH4, CF4, and SF xylene at 283' to 313'K," J. Chem. Thermo. L, 515-522 f1975).
in 0-, m-, and p-
Olson, J. D., "Solubility of Nitrogen, Argone, Methane, and Elbane in Ethylene Oxide," J. Chem. Eng. Data, -9 22 326-329 (1977).
Wilcock, R. N., Battino, R., and Wilhelm, E., "The Solubility of Gases in Liquids. CF4, and SF 2 9 111-115 f1977).
10. The Solubility of He, Ne, Ar, Kr, N2, 02, CO, C03, CH4, in Cyclooctane at 289' to 313'K," J. Chem. Thermo ynamics,
Keevil, T. A., Taylor, D. R., and Streitweiser, A., "Solubility of Hydro- carbons in Cyclohexylamin," J. Chem. & Eng. Data, 23, 237-239 (1978).
Dymond, J. H., "Solubility of a Series of Gases in Cyclohexane and Di- methylsulfoxide," J- 71, 1829-31 (1967)
Chappelow, C. C., 111, and Prausnitz, J. M., "Solubilities of Gas in High Boiling Hydrocarbon Solvents," A.1.Ch.E. J., 20, 1097-1104 (1974).
Sebastian, H. M., Lin, H., and Chao, K., "Correlation of the Solubility of Methane in Hydrocarbon Solvents," 20, 346-349 (1981).
Kaninishi, G., "Gas-Liquid Equilibrium undei High Pressure. V. The Solu- bility of Methane and Argone in Liquid Ammonia at Elevated Pressure." Chem. Abstracts, 63, 4999 (1965).
Boyer, F. L. and Bircher, L. J., "The Solubility of Nitrogen, Argone, Methane, Ethylene, and Ethane in Normal Primary Alcohols," J. Phys. Chem., 64, 1330-31 (1960) . Gerrard, William, "Significance of the Solubility of Hydrocarbon Gases in Liquids in Relation t o the Intermolecular Structure of Liquids and the Essential Pattern of Data for all Gases," J. Applied Chem, Biotechnol. , 3 23 1-17 (1973).
Yen, L. C. and McKetta, J. J., "A Thermodynamic Correlation of Nonpolar Gas Solubilities in Polar Non-Associated Liquids," A.1.Ch.E. Journal, &, 501-507 (1967) . Frolich, P. K., et. &., "Solubilities of Gases in Liquids at High Pres- sure," J&E C, 23, 548-550 (1931).
Bloomen, 0. T., Gami, D. C., and Parent, J. D., "Physical Chemical Proper- ties of Methane-Ethane Mixtures," July 1953.
Shakhova, S. F. and Zubchenko, Y. P., "Solubility of Methane and Argone in Organic Solvents," Chemical Abstracts, 3 1401392, (1973).
E-24
40. Koonce, K. T. and Kobayashi, R., "A Method for Determining the Solubility Solubility of Methane in n- of Gases in Relatively Non-Volatile Liquids.
decane," J. *em. & Eng. Data, 3 490-494 ( 1 9 6 4 ) .
41. Michaels, A. S. and Bixter, H. J., "Solubility of Gases in Polyethylene," J. Polymer Sci., 50, 393-412 (1961) .
42. Robb, W. L., "Thin Silicone Membranes - Their Permeation Properties and Some Applications," Annals N.Y. Acad. Sciences, Vol. 146, 119-137 (1968) .
E-2 5

1. Report No. 2. Government Accession No.
NASA CR-174655 4. Title and Subtitle
Advanced Onboard Storage Concepts f o r Natura l Gas-Fueled Automotive Vehic les
3. Recipient's Catalog No.
5. Report Date
June 1984 6. Performing Organization Code
R. J. Remick, R. H. E lk ins , E. H. Camara, and T. B u l i c z
7. Author@) * 10. Work Unit No.
61 067 8. Performing Organization Report No.
9. Performing Organization Name and Address
3424 South Sta te S t r e e t Chicago, I l l i n o i s 60616
I n s t i t u t e o f Gas Technology
12. Sponsoring Agency Name and Address
Contractor Report 14. Sponsoring Agency -Report No.
11. Contract or Grant No.
DEN 3-327 13. Type of Report and Period Covered
I DO E/ NASA/ 0 3 2 7- 1
7. Key Words (Suggested by Author@))
I 5. Supplementary Notes
F ina l Report. Prepared under Interagency Agreement DE-AI01-81CS50006. P r o j e c t Manager, Fred Simon, Aerothermodynamics and Fuels D iv i s ion , NASA Lewis Research Center, Cleveland, Ohio 44135.
18. Distribution Statement
6. Abstract
The o b j e c t i v e o f t h i s study was t h e evaluat ion, both through exper imentat ion and a l i t e r a t u r e review, o f several advanced concepts f o r s t o r i n g na tu ra l gas a t reduced pressure. The advanced concepts inc luded adsorpt ion on h igh sur face m a carbon, adsorpt ion i n h igh p o r o s i t y z e o l i t e , storage i n c l a t h r a t i o n com- pounds, and s torage by d i s s o l u t i o n i n l i q u i d solvents. Resul ts i nd i ca ted t h a t h igh sur face area carbons w i t h h igh packing dens i t y were t h e best low pressure storage mediums. A s imple mathematical model was used t o compare adsorpt ion storage on a state-of- the-art carbon w i t h compression storage. The model ind ica- t e d t h a t a v e h i c l e us ing adsorpt ion storage o f na tu ra l gas a t 3.6 MPa w i l l have 36 percent o f t h e range, on t h e EPA c i t y cycle, o f a veh ic le operat ing on a com- press ion storage system having t h e same phys ica l s i z e and a peak storage pressure o f 2 1 MPa. However, p r e l i m i n a r y experiments and cu r ren t l i t e r a t u r e suggest t h a t t h e storage capac i t y o f state-of- the-art carbons cou ld be improved by a much as 50 percent, and t h a t adsorpt ion systems having a capac i ty equal t o compression storage a t 14 MPa are poss ib le w i thou t exceeding a maximum pressure o f 3.6 MPa.
9. Security Classif. (of this report)
Unc lass i f i ed 20. Security ClRSSif. (of this page) 21. No. of pages 22. Price"
Unc lass i f ied 134 A07
Natura l gas vehi c l es Low pressure storage A1 t e r n a t i ve f u e l s
Unc lass i f i ed - Un l im i ted STAR Category 44 DOE Category UC-96
Related Documents