Supplier Management: The business case to empower your upstream supply chain October 2015 Omar Nadi Director, Supplier Product Management

Ignite 2015 NA Procurement Breakout Session - "The Business Case to Empower Your Upstream Supply Chain"
Apr 14, 2017
Welcome message from author
This document is posted to help you gain knowledge. Please leave a comment to let me know what you think about it! Share it to your friends and learn new things together.
Transcript

Supplier Management: The business case to empower your upstream supply chain October 2015 Omar Nadi Director, Supplier Product Management

Agenda
• StateofP2P• Whatischanging?• HowdoIstartbuildingabusinesscasetogetthere?

State of P2P in Process Industries
Supplier Management is stuck so to speak, relying on decades old methods
Missing a shared vision across purchasing and finance Lack of a champion
Stalled Automation of Direct Suppliers
Limited focus on Requisitioning Process & Indirect Spend

What is changing?
It starts with Automation of your Network
Environmental Shifts
Organization
• Rise of CSCO
• Global Service teams across purchasing, finance, logistics
• Renewed focus on upstream opportunities
• Searching for new technologies
Technology
• Business Networks quickly build robust partner connections
• SaaS solutions are able to scale networks extremely fast
• New technologies around risk/disruption
Competition
• Process Industry Clients are focused on building Supplier Networks
• Automation will not be a competitive advantage but a basic requirement
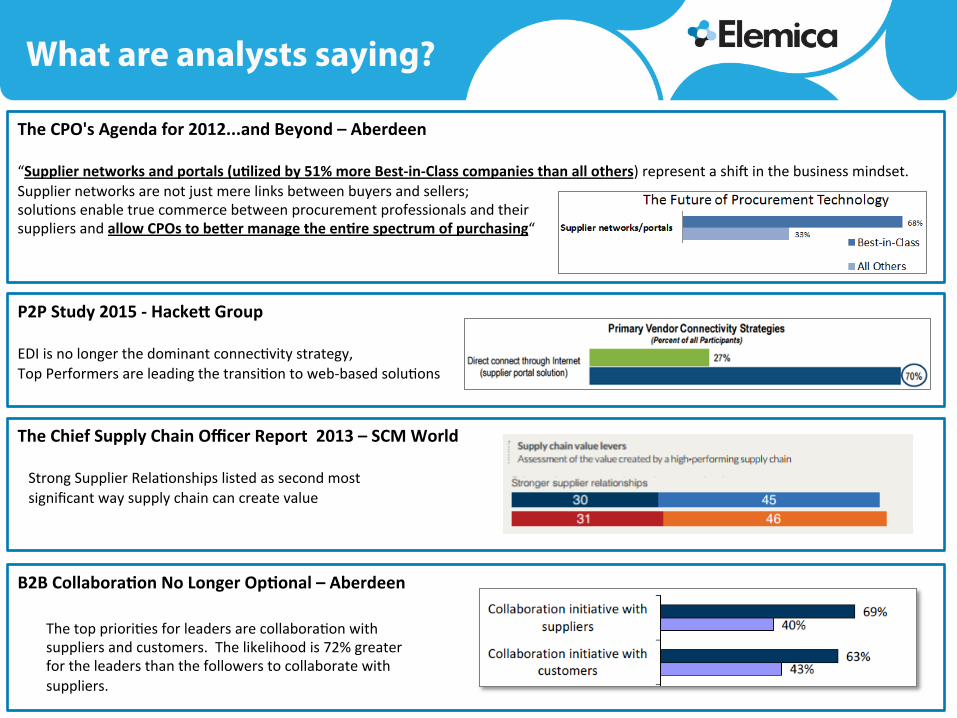
TheCPO'sAgendafor2012...andBeyond–Aberdeen“Suppliernetworksandportals(uHlizedby51%moreBest-in-Classcompaniesthanallothers)representashi-inthebusinessmindset.Suppliernetworksarenotjustmerelinksbetweenbuyersandsellers;solu;onsenabletruecommercebetweenprocurementprofessionalsandtheirsuppliersandallowCPOstobeNermanagetheenHrespectrumofpurchasing“
P2PStudy2015-HackeNGroupEDIisnolongerthedominantconnec;vitystrategy,TopPerformersareleadingthetransi;ontoweb-basedsolu;ons
TheChiefSupplyChainOfficerReport2013–SCMWorldStrongSupplierRela;onshipslistedassecondmostsignificantwaysupplychaincancreatevalue
What are analysts saying?
B2BCollaboraHonNoLongerOpHonal–Aberdeen
Thetoppriori;esforleadersarecollabora;onwithsuppliersandcustomers.Thelikelihoodis72%greaterfortheleadersthanthefollowerstocollaboratewithsuppliers.

What is changing?
EDI Internal Portal
Fax eMail
Business Network
Network Nervous System
Moving data faster Moving clean data faster
Linking cross
partner/process data
Scalability
Opening new communication
channels
Applying new data feeds and to
your network
Sense & Respond

Elemica’sNextGenera;onNetworkPlaPorm

How do I get there?
Agent of Change Identify someone to lead the with executive approval that will take an objective look at what is best for the company and that is willing to challenge the status quo to lead the program.
Build the Team • Finance resources who touch inbound invoices • Purchasing resources centrally and at plants that touch orders,
confirmations, shipments, invoices

Building a Business Case
Build the Business Case Purchasing Metrics
• FTEs per PO Line • FTEs per Shipment Processed
• % of Orders requiring intervention
• % of Orders requiring rush transportation • Cost of rush shipments
• Inventory Turns
Invoice Metrics
• FTEs per Invoice • % Invoices requiring intervention
• DPO • On-time payments
• Discounts captured

Building a Business Case
Build the Business Case Sample Company
• Spend = $5B • PO Lines = 150,000
• Average Inventory = $833M
• Invoices paid on time = 80% • FTE’s processing Order Confirmations and Shipments = 30
• FTE’s processing Invoices, Invoices Statuses, Payment Advice = 50 • Salary Rate = $40/hour
• Cost of Capital = 5%

Building a Business Case
Annual OrdersSpend
Personnel Hourly RateInventory Turns
Cost of Capital
Labor Savings Minutes Saved Occurrence Total SavingsOrder Response Processing 5 100% $500,000ASN Processing 10 100% $1,000,000Data quality issues 60 4% $240,000Expedition issues 120 1% $120,000
Operational Improvements Cost per Error Occurrence Total SavingsExpedited/Delayed Orders $3,000 1.0% $225,000
Working Capital Improvements Improvement Occurrence Total SavingsIventory Turn Improvement 0.25 100% $1,666,667
Total Annual Savings: $3,751,667 Per PO: $25.01
150,000
$4065%
$5,000,000,000

Building a Business Case
Annual InvoicesSpend
Personnel Hourly RateCost of Capital
Late Payment ChargeEarly Payment Discount
Labor Savings Minutes Saved Occurrence Total SavingsInvoice Processing 15 100% $1,500,000Payment Processing 15 50% $750,000Data quality issues 120 5% $600,000
Payment Discounts Improvement Occurrence Total SavingsInvoice Discounts 30% 15% $225,000
Working Capital Improvements Increase Occurrence Total SavingsDPO Improvement 1 80% $547,945On-time Payment Improvement 50% 20% $500,000
Total Annual Savings: $4,122,945 Per Invoice: $27.49
$40
150,000$5,000,000,000
2%
5%2%

Building a Business Case
Build the Business Case Total Savings $7.9M
Total Savings per PO = $25.01 Total Savings per Invoice = $27.49
Best in Class Automated
All Others Manual
Percent Improvement
Order to ASN $38.10 $6.13 84%
Invoice & Payment $34.65 $4.17 88%
Total $72.75 10.30 86%
Consistent with Analyst Studies*
Efficiency KPI Current Automated Improvement
Orders per FTE 5,000 18,000 3.5x
Invoices per FTE 3,000 9,400 3x
*B2BIntegra;onandCollabora;on:StrategiesforBuildingaROIBusinessCase-Aberdeen
Efficiency KPI Current Automated Improvement
Rush Shipments 2% 1% 50%
Inventory Turns 6 6.25 6%
DPO 1 day
On-Time Payment 80% 90% 11%
Human Capital ($4.7M) • Savings Purchasing = 23 Years
• Savings Finance = 36 Years
Working Capital ($3.2M) • Savings per PO = $13
• Savings Per Invoice = $8.50

Building a Business Case
Other Benefits Being a better customer – priority from your supplier
Improved Relationships • On-time payments
• Improved communication
• Less work for both sides Efficiency gains upstream unlock further benefits downstream
Calculating TCO Supplier Performance Visibility
• % of orders with ORE
• % of orders with ASN Standardized Processes
Digitization- eliminate paper Free up IT resources – managing your own point to point connections or portal

Word of caution
Be Careful Have to look at total cost to system before choosing a partner
NumberofSuppliers4,000
TotalAnnualspend$5,000,000,000
AnnualInvoices150,000
Vendors VendorAvg.Spend TransactionFees MembershipFees TotalFees/Invoice2,200 $22,727 $0.00 $0.00 $0.001,000 $200,000 $15.90 $2.56 $18.46520 $1,923,077 $34.44 $28.83 $63.28240 $7,291,667 $48.87 $10.79 $59.6640 $50,000,000 $35.56 $13.32 $48.88
TotalMembershipCosttoSuppliers
ValueBasedModel
SupplierNetworkTransactionValueFees
TotalLicenseCosttoBuyers$400,000
$2,246,000
$5,372,500
TotalAnnualCosttoSystem
$8,018,500
TotalTransactionCosttoSuppliers

Questions?
Related Documents