Managing risk with insurance and savings: Experimental Evidence for male and female farm managers in West Africa Clara Delavallade (MTID) RISE – March 2015 with Ruth Hill (World Bank) Felipe Dizon (UC Davis) Jean-Paul Petraud (IMPAQ)

IFPRI Gender Methods Seminar, April 1, 2015: Managing Risk with Insurance and Savings: Experimental Evidence for Male and Female Farm Managers in West Africa
Jul 16, 2015
Welcome message from author
This document is posted to help you gain knowledge. Please leave a comment to let me know what you think about it! Share it to your friends and learn new things together.
Transcript

Managing risk with insurance and savings:Experimental Evidence for male and female farm managers in West Africa
Clara Delavallade (MTID)
RISE – March 2015
with Ruth Hill (World Bank)Felipe Dizon (UC Davis)Jean-Paul Petraud (IMPAQ)

Motivation
• Individuals in developing countries are subject to a multitude of hazards– Covariant shocks (droughts, unpredictable rainfall)
– Idiosyncratic shocks (falling sick)
• Men and women may face different risks and have different risk management strategies
• Literature on specific risk-mitigating instruments– Weather index insurance (Cole et al 2013, Mobarak and Rosenzweig 2013)
– Access to savings accounts (Dupas and Robinson 2013)
– Micro-health insurance products (Thornton et al 2012, Dercon et al 2011, Delavallade 2014)

Research Questions
Which product might be better to help farmers cope with different risks?
Do men and women have different demand for different types of products?
What are the implications for
their ability to manage risk
their agricultural investments and production
their consumption and welfare?
Compare demand for and effectiveness of different types of risk-mitigating products by randomizing their provision

Four financial products
• Insurance (T1): weather index product designed by Planet Guarantee (NGO) to cover main crop in the area and offered by local financial institutions
• Senegal: rainfall index, IFPRI mediated
• Burkina Faso: NDVI, local NGO mediated
• Agricultural savings at home (T2): sealed envelope with purpose of savings written on it (low commitment)
• Agricultural savings with the treasurer (T3): money given to group treasurer for purpose of ag input, could request money from treasurer at any time, interest paid if kept with treasurer for one month (high commitment)
• Emergency savings with the treasurer (T4): as above, but purpose was for emergency – mostly health issues (high commitment)

• Sample = 800 farmers in Senegal and Burkina Faso (same design)
• Baseline survey conducted and invitation to experimental session the following day
• 40 experimental sessions: – Monetary endowment of 6,000 CFA = $12 (cost of ½ bag of fertilizer) – Randomly offered one of four financial products and given the choice
of how much of the 6,000 CFA to allocate to the product and how much to take home
– Exogenously determined price or interest rate (by session)
• Midline survey (and input fair) after 1 month
• Endline survey after 6 months (after harvest)
Experimental Design


Sample Description
Table 2 - Sample Description
Senegal Burkina Faso
Panel A: Baseline Sample
Total number of individuals surveyed at baseline 403 403
Number of ROSCAS 7 7
Number of participants 200 203
Percentage female (in %) 100 100
Number of farmers' groups 9 8
Number of participants 203 200
Percentage female (in %) 4.4 47.5
Panel B: Endline
Number of individuals in initial sample not found at endline 1 1
Percentage of baseline sample (in %) 0.25 0.25
Total number of individuals surveyed at endline 402 402
Percentage female (in %) 50.60 71.98

Demand: Take-Up
Table 5: Take-up: Amount invested in financial product
Burkina Faso Senegal
Mean sd Median N Mean sd Median N
Amount invested in insurance product2 178 1 167 2 000 101 1 575 1 127 1 000 100
Amount invested in envelope3 345 1 804 3 000 100 3 896 1 624 4 000 101
Amount invested in agricultural investment savings product 4 307 1 756 5 000 101 3 115 1 542 3 000 100
Amount invested in emergency savings product4 930 1 479 6 000 100 2 847 1 841 3 000 101
Amount re-invested in emergency saving one month later 2 212 1 790 2 000 99 2 079 1 673 2 000 101

Demand: Take-Up Correlates(1) (2)
Insurance Savings
Male 570.66 -613.27
[241.80]** [356.44]*
Burkina Faso 319.27 1,557.92
[210.06] [266.06]***
Agricultural savings 200.44
[473.55]
Agricultural savings * male 702.91
[316.25]**
Low commitment savings 1,000.70
[381.84]**
Controls Yes Yes
Sample T1 T2,T3,T4
Observations 201 603
R-squared 0.25 0.17

Impact: Model Specification
• Impact of different treatments:
• LATE:
– instrument the amount of insurance invested by:• insurance treatment• day on which insurance was offered
– instrument the amount of savings undertaken by:• type of savings instrument randomly offered • interest rate
𝑦𝑖𝑡 = 𝛽0 + 𝛽𝑇𝑇𝑖 + 𝛽𝑦𝑦𝑖,𝑡=0 + 𝛽𝐵𝐹𝐵𝐹𝑖 + 𝛽𝑀𝑀𝑎𝑙𝑒𝑖 + 𝜀𝑖𝑡

Impact of insurance (LATE) on ag
investment(1) (2) (3) (4) (5)
After one month Over whole season
Total
spending
Fertilizer per
acre
Fertilizer per
acre
Land
cultivated Yield
Insurance amount
(FCFA)
0.0003 0.0002 0.0002 -0.0001 0.0001
[0.0001]** [0.0001]* [0.0001]* [0.0002] [0.0000]*
Agricultural savings
0.1230 0.2881 0.0444 0.3922 0.1209
[0.3051] [0.1721]* [0.1861] [0.8965] [0.0634]*
Low commitment
savings
0.0656 -0.6254 -0.2068 -0.8998 -0.0206
[0.4559] [0.2664]** [0.2445] [0.7210] [0.0617]
Male 1.0251 0.8204 0.4798 1.7119 0.0990
[0.4104]** [0.3271]** [0.3525] [0.8374]** [0.0765]
Constant 9.6026 1.4609 3.2106 6.6218 -0.1671
[0.4796]*** [0.3128]*** [0.3353]*** [0.7969]*** [0.0650]**
Controls Yes Yes Yes Yes Yes
Observations 804 780 781 787 804
R-squared 0.0529 0.0752 0.0448 0.0234 0.0088
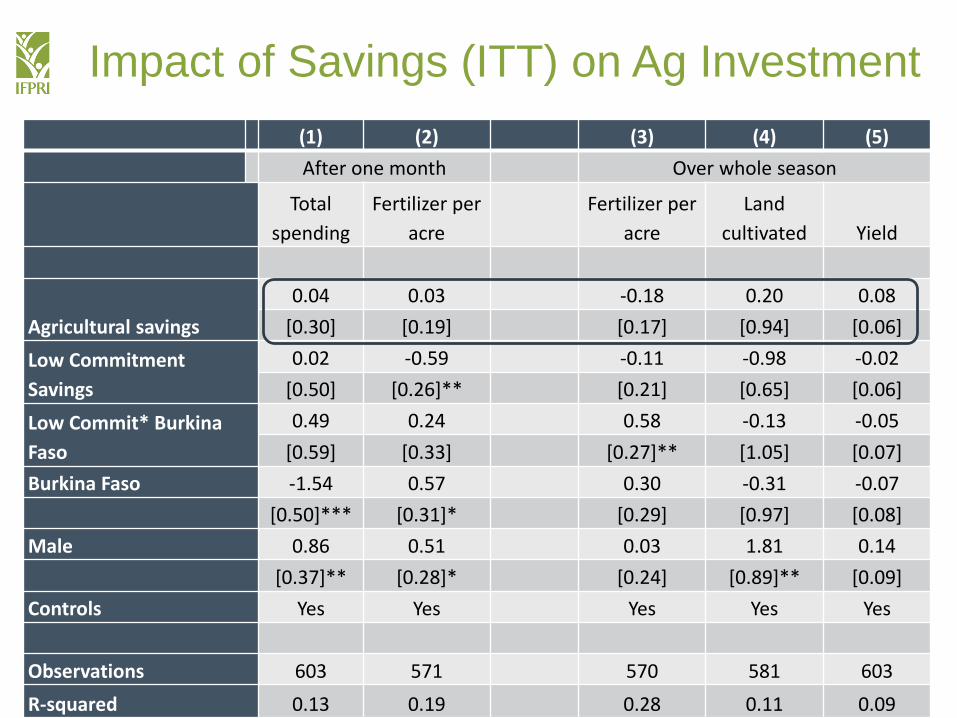
Impact of Savings (ITT) on Ag Investment
(1) (2) (3) (4) (5)
After one month Over whole season
Total
spending
Fertilizer per
acre
Fertilizer per
acre
Land
cultivated Yield
Agricultural savings
0.04 0.03 -0.18 0.20 0.08
[0.30] [0.19] [0.17] [0.94] [0.06]
Low Commitment
Savings
0.02 -0.59 -0.11 -0.98 -0.02
[0.50] [0.26]** [0.21] [0.65] [0.06]
Low Commit* Burkina
Faso
0.49 0.24 0.58 -0.13 -0.05
[0.59] [0.33] [0.27]** [1.05] [0.07]
Burkina Faso -1.54 0.57 0.30 -0.31 -0.07
[0.50]*** [0.31]* [0.29] [0.97] [0.08]
Male 0.86 0.51 0.03 1.81 0.14
[0.37]** [0.28]* [0.24] [0.89]** [0.09]
Controls Yes Yes Yes Yes Yes
Observations 603 571 570 581 603
R-squared 0.13 0.19 0.28 0.11 0.09

Impact of Experimental Savings
(LATE) on Ag Investment(1) (2) (3) (4) (5)
After one month Over whole season
Total spending
Fertilizer per
acre
Fertilizer per
acre
Land
cultivated Yield
Amount saved 0.0001 0.0010 0.0007 0.0001 0.0009
[0.0009] [0.0010] [0.0008] [0.0002] [0.0020]
Burkina Faso -1.2669 -0.8385 -0.5310 -0.2348 -2.3897
[1.6896] [1.7916] [1.3335] [0.3741] [3.4828]
Male 1.0254 0.9624 0.4970 0.1427 1.8254
[0.4217]** [0.3910]** [0.4191] [0.1083] [1.0597]*
Constant 9.4292 -1.5551 1.2575 -0.5763 3.7750
[2.7792]*** [3.1309] [2.4265] [0.7056] [6.2733]
Controls Yes Yes Yes Yes Yes
Observations 603 588 587 603 591
R-squared 0.0454 -0.5038 -0.2291 -0.1482 0.0019
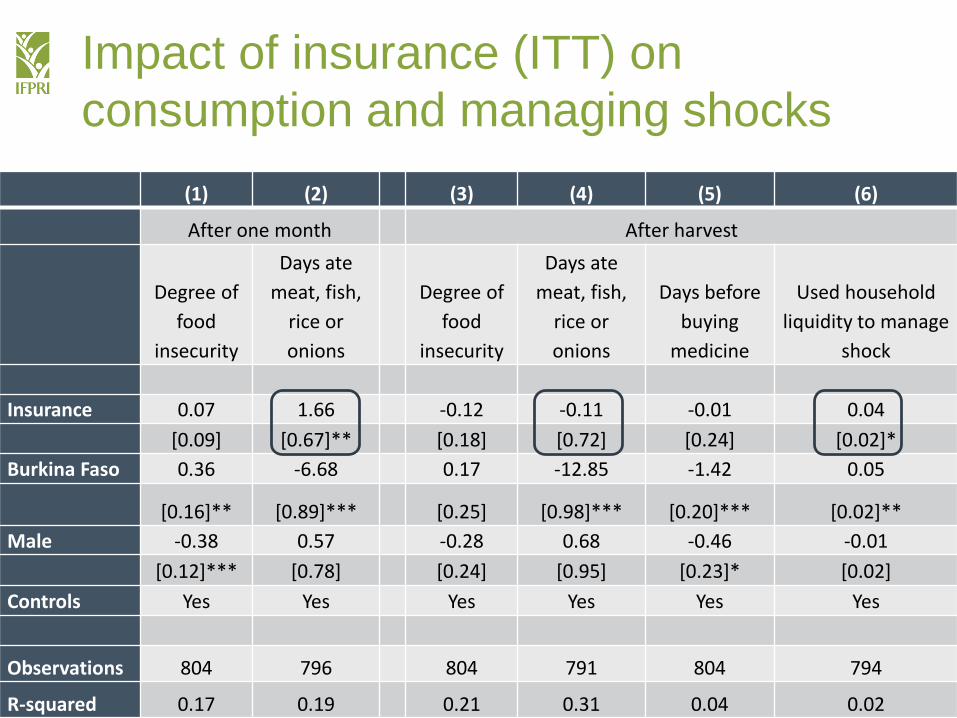
Impact of insurance (ITT) on
consumption and managing shocks
(1) (2) (3) (4) (5) (6)
After one month After harvest
Degree of
food
insecurity
Days ate
meat, fish,
rice or
onions
Degree of
food
insecurity
Days ate
meat, fish,
rice or
onions
Days before
buying
medicine
Used household
liquidity to manage
shock
Insurance 0.07 1.66 -0.12 -0.11 -0.01 0.04
[0.09] [0.67]** [0.18] [0.72] [0.24] [0.02]*
Burkina Faso 0.36 -6.68 0.17 -12.85 -1.42 0.05
[0.16]** [0.89]*** [0.25] [0.98]*** [0.20]*** [0.02]**
Male -0.38 0.57 -0.28 0.68 -0.46 -0.01
[0.12]*** [0.78] [0.24] [0.95] [0.23]* [0.02]
Controls Yes Yes Yes Yes Yes Yes
Observations 804 796 804 791 804 794
R-squared 0.17 0.19 0.21 0.31 0.04 0.02

Main Findings
• Purchasing insurance increased input spending and use more than savings. Those who purchased more insurance realized higher average yields, and were better able to manage food insecurity and shocks.
• But women invest significantly less in the insurance product.
• Given the impact of purchasing insurance on agricultural investment, yields and wellbeing, lower take-up of agricultural insurance disadvantages women’s productivity, resilience and welfare.
• Need to inform how new financial products, such as index insurance products currently becoming more available, are designed to meet the needs of both men and women.

Thank you !

Additional slides
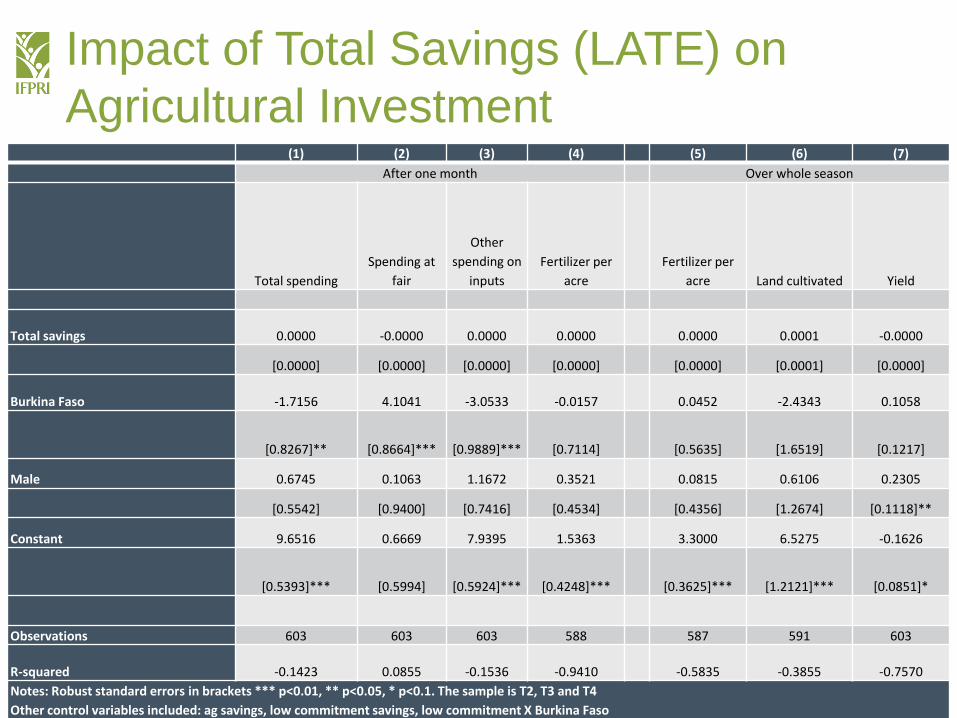
Impact of Total Savings (LATE) on
Agricultural Investment (1) (2) (3) (4) (5) (6) (7)
After one month Over whole season
Total spending
Spending at
fair
Other
spending on
inputs
Fertilizer per
acre
Fertilizer per
acre Land cultivated Yield
Total savings 0.0000 -0.0000 0.0000 0.0000 0.0000 0.0001 -0.0000
[0.0000] [0.0000] [0.0000] [0.0000] [0.0000] [0.0001] [0.0000]
Burkina Faso -1.7156 4.1041 -3.0533 -0.0157 0.0452 -2.4343 0.1058
[0.8267]** [0.8664]*** [0.9889]*** [0.7114] [0.5635] [1.6519] [0.1217]
Male 0.6745 0.1063 1.1672 0.3521 0.0815 0.6106 0.2305
[0.5542] [0.9400] [0.7416] [0.4534] [0.4356] [1.2674] [0.1118]**
Constant 9.6516 0.6669 7.9395 1.5363 3.3000 6.5275 -0.1626
[0.5393]*** [0.5994] [0.5924]*** [0.4248]*** [0.3625]*** [1.2121]*** [0.0851]*
Observations 603 603 603 588 587 591 603
R-squared -0.1423 0.0855 -0.1536 -0.9410 -0.5835 -0.3855 -0.7570
Notes: Robust standard errors in brackets *** p<0.01, ** p<0.05, * p<0.1. The sample is T2, T3 and T4
Other control variables included: ag savings, low commitment savings, low commitment X Burkina Faso
Related Documents