IESE Cities in Motion Index 2019

Welcome message from author
This document is posted to help you gain knowledge. Please leave a comment to let me know what you think about it! Share it to your friends and learn new things together.
Transcript
IESECities in Motion
Index2019


IESE Cities in Motion Index2019
We gratefully acknowledge the financial support of the Agencia Estatal de Investigación (AEI) of the Ministry of
Economy and Competitiveness—ECO2016-79894-R (MINECO/FEDER), the Schneider-Electric Sustainability and
Business Strategy Chair, the Carl Schroeder Chair in Strategic Management and the IESE’s High Impact Projects
initiative (2017/2018).
DOI: https://dx.doi.org/10.15581/018.ST-509


Foreword 07
About Us 09
Working Team 09
Introduction: The Need for a Global Vision 10
Our Model: Cities in Motion. Conceptual Framework, Definitions and Indicators 11
Limitations of the Indicators 23
Geographic Coverage 23
Cities in Motion: Ranking 25
Cities in Motion: Ranking by Dimension 28
Cities in Motion: Regional Ranking 40
Noteworthy Cases 46
Evolution of the Cities in Motion Index 50
Cities in Motion Compared With Other Indexes 53
Cities in Motion: City Ranking by Population 54
Cities in Motion: Analysis of Dimensions in Pairs 57
Cities in Motion: A Dynamic Analysis 64
Recommendations and Conclusions 66
Appendix 1. Indicators 69
Appendix 2. Graphical Analysis of the Profiles of the 174 Cities 76
CONTENTS

IESE Business School - IESE Cities in Motion Index / ST-509-E7
Foreword
Once again, we are pleased to present a new edition (the sixth) of our IESE Cities in Motion Index (CIMI). Over the past years, we have observed how various cities, companies and other social actors have used our study as a benchmark when it comes to understanding the reality of cities through comparative analysis.
As in every edition, we have tried to improve the structure and coverage of the CIMI and this, the sixth edition, has been no exception. As in the previous editions, we have tried to provide an index that is objective, comprehensive, wide-ranging and guided by the criteria of conceptual relevance and statistical rigor. However, this edition features some different elements with respect to the others. The first important difference is that we have significantly increased the number of variables in relation to the cities. This edition includes a total of 96 indicators (13 more than in the previous edition), which reflect both objective and subjective data and offer a comprehensive view of each city. Among the new variables, there are, for example, the hourly wage, purchasing power, mortgage as a percentage of income, and whether a city is a favorable environment for the development of women. In our opinion, this increase in the quantity and quality of the variables used allows for a more accurate assessment of the reality of the cities that appear in the CIMI.
A second difference is reflected in our effort to widen the geographical coverage, which has resulted in the analysis of a greater number of cities than in the previous edition: we cover a total of 174 cities (79 of them capitals), which represent 80 countries. In this regard, 11 new cities have been added, notably Quebec (Canada), Edinburgh (United Kingdom) and Denver and Seattle (United States). The breadth and scope of the CIMI establish it as one of the city indexes with the widest geographical coverage existing today. On the website citiesinmotion.iese.edu/indicecim/?lang=en, the data about each of the cities can be consulted in an interactive way and two cities can be compared at the same time.
As in the previous edition, we have merged two dimensions of our conceptual model, which originally took into account 10 key dimensions: human capital, social cohesion, the economy, public management, governance, the environment, mobility and transportation, urban planning, international outreach, and technology. We have kept governance and public management in a single category (“governance”) for two fundamental reasons: in the first place, because there is a certain overlapping between both dimensions that makes it difficult to distinguish between them conceptually and, secondly, because the limited number of city-related indicators that cover each of these dimensions led us to join them together so we have a more reliable measure. We believe that this change does not significantly affect the conclusions of the CIMI but rather it strengthens them. In any case, we continue to strive to obtain more and better indicators that will capture these dimensions.
These differences with respect to previous editions oblige us to remind the reader that the rankings are not directly comparable from one year to another. The inclusion of new cities and new indicators produces variations that do not necessarily reflect the trajectory of the cities over time. To be able to study the evolution of the cities, in each edition we analyze the trend of the cities by calculating the index of the previous three years, which allows us to make more appropriate comparisons.
We see this index as a dynamic project and therefore we continue to work so that the future editions of the index will have better indicators for all the dimensions and give wider coverage, as well as a growing analytical and predictive value. In this respect, your comments and suggestions are always welcome as they will enable us to progress, and we invite you to contact us via the channels you will find on our website: www.iese.edu/cim.
Likewise, we would like to inform our readers that our efforts here at the IESE Cities in Motion platform have not been limited to just ranking cities but we have continued to publish our series of minibooks in English, which identify good practices in each of the dimensions of the IESE Cities in Motion model. Currently there are four publications available on Amazon about the dimensions
IESE Business School - IESE Cities in Motion Index / ST-509-E8
of the environment, mobility and transportation, the economy, and social cohesion, while the next volume will be devoted to international outreach and shortly this collection will be expanded to cover the rest of the dimensions.
Moreover, new case studies have been published in addition to those that already exist about Vancouver ("Vancouver: The Challenge of Becoming the Greenest City"), Barcelona ("Barcelona: A Roman Village Becoming a Smart City") and Málaga ("Málaga: In Search of Its Identity as a Smart City"). During this academic year, moreover, we have added a case about the city of Medellín, which has the title "Medellín: Transformation Toward a More Equitable, Innovative and Participatory Urban Society." These documents are available on the IESE case study portal (www.iesepublishing.com), and there will be new cases available shortly, including one about the city of Singapore and its digital identity project. This new teaching material has allowed us to consolidate our courses linked to cities in both IESE programs and those undertaken in collaboration with other schools and institutions.
In parallel, we continue to work on a series of academic papers, especially focused on the Sustainable Development Goals (SDGs) adopted by the United Nations in urban contexts. We hope that these publications will soon be added to other articles already published in prestigious journals such as the Academy of Management Journal, the California Management Review and the Harvard Deusto Business Review.* We have also strengthened the presence of the IESE Cities in Motion platform on the Internet with our Twitter account (@iese_cim) and our monthly posts on the IESE Cities in Motion blog (blog.iese.edu/cities-challenges-and-management). Finally, it is worth highlighting our participation in various projects, such as GrowSmarter, financed by the European Commission (www.grow-smarter.eu/home), or the technical guide about public-private partnerships (PPPs) that we have produced with the CAF-Development Bank of Latin America. This guide can be acquired free of charge (scioteca.caf.com/handle/123456789/1179) and it is complemented by a series of explanatory videos (www.ieseinsight.com/doc.aspx?id=2165&idioma=1).
We regard both our publications and our presence in cyberspace as being the ideal complements of this index as they contribute to a better understanding of the reality of cities. Therefore, we believe that it will be useful for those in charge of making cities better environments in which to live, work and enjoy life. Urban managers face significant obstacles such as difficulties in mobility, aging populations, increases in inequality, the persistence of poverty and pollution, among many others. Their scope and magnitude demonstrate the need for all of the world’s cities to carry out a strategic review process that covers: what type of city they want to be, what their priorities are, and what changes they should undertake in order to take advantage of the opportunities—and minimize the threats—of urbanization. Therefore, our effort focuses on the concept of smart governance. This report is our modest contribution to advancing this process. We are convinced that we can live in better cities, but this will be possible only if all the social actors—the public sector, private companies, civic organizations and academic institutions—actively participate and collaborate to achieve this common goal.
THE AUTHORS
Prof. Pascual BerroneHolder of the Schneider Electric Sustainability and Business Strategy Chair Academic codirector of IESE Cities in Motion
Prof. Joan Enric RicartHolder of the Carl Schrøder Chair of Strategic ManagementAcademic codirector of IESE Cities in Motion
*You will find a complete list of publications on our website: www.iese.edu/cim.

IESE Business School - IESE Cities in Motion Index / ST-509-E9
ACADEMIC TEAM
Pascual Berrone Professor of Strategic Management and holder of the Schneider Electric Sustainability and Business Strategy Chair of IESE Business School
Joan Enric Ricart Professor of Strategic Management and holder of the Carl Schrøder Chair of Strategic Management of IESE Business School
Ana Isabel Duch T-FiguerasResearch Collaborator
Carlos CarrascoResearch Collaborator
TECHNICAL TEAM
David Augusto Giuliodori Professor of Statistics 2 at the National University of Córdoba (Argentina) and Econfocus Consulting
María Andrea GiuliodoriProfessor of Statistics at the Institute of Stock Exchange Studies (IEB)
About Us
Working Team
IESE Cities in Motion is a research platform launched jointly by the Center for Globalization and Strategy and IESE Business School’s Department of Strategy.
The initiative connects a global network of experts in cities, specialist private companies and local governments from around the world. The aim is to promote changes at the local level and to develop valuable ideas and innovative tools that will lead to more sustainable and smarter cities.
The platform’s mission is to promote the Cities in Motion model, with an innovative approach to city governance and a new urban model for the 21st century based on four main factors: sustainable ecosystem, creative activities, equality among citizens, and connected territory.
IESE Business School - IESE Cities in Motion Index / ST-509-E10
Introduction: The Need for a Global Vision Today more than ever, cities need to develop strategic planning processes, since only then can they outline paths toward innovation and prioritize the aspects that are most important for their future.
This process should be participatory and flexible, and a central aim must be established: to define a sustainable action plan that will make the metropolis unique and re-nowned. Just as two companies do not have the same recipe for success, each city must look for its own model based on a series of common reflections and consider-ations.
Experience shows that large cities must eschew short-ter-mism and broaden their field of view, as well as turn to innovation more frequently to improve the efficiency and sustainability of their services. Also, they should promote communication and ensure that the public and business-es are involved in their projects.
The time has come to practice smart governance that takes into account all the factors and all the social actors, with a global vision. In fact, over the past few decades, various national and international organizations have produced studies focusing on the definition, creation and use of indicators with a variety of aims, although mainly that of contributing to a diagnosis of the state of cities. The definition of the indicators and the process of their creation are the result of the characteristics of each study and of the statistical and econometric techniques that best fit the theoretical model and the available data, as well as the analysts’ preferences.
Today we have a great deal of “urban” indicators, al-though many of them are neither standardized nor consistent and they cannot be used to compare cities. Actually, despite numerous attempts to develop city indi-cators at a regional, national and international level, few
have been sustainable in the medium term as, in some cases, they were created for studies meant to cover the specific information needs of certain bodies, whose life span depended on how long the financing would last and, in other cases, the system of indicators depended on a political desire in specific circumstances, so they were abandoned when political priorities or the authori-ties themselves changed. As for the indicators developed by international organizations, it is true that they strive for the consistency and solidity necessary to compare cit-ies; however, for the most part, they tend to be biased or focused on a particular area (technology, the economy, and the environment, among others).
Taking all this into account, the index that provides this publication with its title, the Cities in Motion Index (CIMI), has been designed with the aim of constructing a “breakthrough” indicator—in terms of its completeness, its properties, its comparability, its quality and the ob-jectivity of its information included—that would enable measurement of sustainability with regard to the future of the world’s leading cities, as with the quality of life of their inhabitants.
The CIMI is intended to help the public and governments to understand the performance of nine fundamental di-mensions for a city: human capital, social cohesion, the economy, governance, the environment, mobility and transportation, urban planning, international outreach, and technology. All the indicators are linked with a strate-gic purpose whose goal is to implement a novel form of local economic development that involves the creation of a global city, the promotion of the entrepreneurial spirit, and innovation, among other aspects.
Each city, unique and unrepeatable, has its own needs and opportunities, so it must design its own plan, set its priorities, and be flexible enough to adapt to changes.
IESE Business School - IESE Cities in Motion Index / ST-509-E11
Smart cities generate numerous business opportunities and possibilities for collaboration between the public and private sectors. All stakeholders can contribute, so an ecosystem network must be developed that will in-volve all of them: members of the public, organizations, institutions, government, universities, experts, research centers, etc.
Networking has its advantages: better identification of the needs of the city and its residents, the establishment of common aims and constant communication among participants, the expansion of learning opportunities, in-creased transparency, and the implementation of more flexible public policies. As a report by the Organization for Economic Cooperation and Development (OECD) pointed out back in 2001, the network approach allows local pol-icies to be focused on the public.
Private enterprise also has much to gain with this system of networking, given that it can collaborate with the ad-ministration in the long term, access new business op-portunities, gain a greater understanding of the needs of the local ecosystem, gain greater international visibility and attract talent.
Thanks to its technical expertise and its experience in project management, private enterprise, in collaboration with universities and other institutions, is suited to lead and develop smart city projects. In addition, it can pro-vide efficiency and result in significant savings for pub-lic-private partnerships.
Finally, it must not be forgotten that the human factor is fundamental in the development of cities. Without a participatory and active society, any strategy, albeit intel-ligent and comprehensive, will be doomed to failure. Be-yond technological and economic development, it is the inhabitants who hold the key for cities to go from “smart” to “wise.” That is precisely the goal to which every city should aspire: that its residents and its rulers deploy all their talent in favor of progress.
To help cities identify effective solutions, we have created an index that integrates nine dimensions in a single indi-cator and covers 174 cities worldwide. Thanks to its broad and integrated vision, the CIMI enables the strengths and weaknesses of each of the cities to be identified.
Our Model: Cities in Motion. Conceptual Framework, Definitions and IndicatorsOur platform proposes a conceptual model based on the study of a large number of success stories and a series of in-depth interviews with city leaders, entrepreneurs, academics and experts linked to the development of cities.
This model proposes a set of steps that include diagnosis of the situation, the development of a strategy, and its subsequent implementation. The first step to making a good diagnosis is to analyze the status of the key dimensions, which we will set out below along with the indicators used to calculate the CIMI.
Human CapitalThe main goal of any city should be to improve its human capital. A city with smart governance must be capable of attracting and retaining talent, creating plans to improve education, and promoting both creativity and research.
Table 1 sets out the indicators used in the human capital dimension, along with descriptions of them, their units of measurement, and the sources of information.
While human capital includes factors that make it more extensive than what can be measured with these indica-tors, there is international consensus that level of educa-tion and access to culture are irreplaceable components for measuring human capital. One of the pillars of human development is this capital and, given that the Human Development Index published annually by the United Na-tions Development Program (UNDP) includes education and culture as dimensions, it is valid to use these indica-tors to explain the differences in human capital in a city.
To define this dimension, the CIMI includes the 10 vari-ables detailed in Table 1. Most of the variables are incor-porated into the index with a positive sign due to their contribution to the development of the dimension, the exception being expenditure on education per capita.
To measure access to culture, the number of museums, art galleries and theaters and the expenditure on leisure and recreation are taken into account. These indicators show the city’s commitment to culture and human cap-ital. Cities that are considered creative and dynamic on a global level typically have museums and art galleries open to the public, offer visits to art collections, and carry out

IESE Business School - IESE Cities in Motion Index / ST-509-E12
activities aimed at their conservation. The existence of a city’s cultural and recreation provision implies greater ex-penditure on these activities by the population.
Finally, expenditure on education per capita represents what each member of the public spends individually to obtain an appropriate level of education. A high level of expenditure is an indicator that the state’s budget alloca-tions for education are insufficient, since they oblige the public to assume that cost in order to gain access to a suit-able education. For this reason, this variable is included with a negative sign.
Social CohesionSocial cohesion is a sociological dimension of cities that can be defined as the degree of consensus among the members of a social group or as the perception of be-longing to a common situation or project. It is a measure of the intensity of social interaction within the group. Social cohesion in the urban context refers to the level of coexistence among groups of people with different in-comes, cultures, ages, and professions who live in a city. Concern about the city’s social setting requires an anal-ysis of factors such as immigration, community develop-ment, care of the elderly, the effectiveness of the health system, and public safety and inclusion.
The presence of various groups in the same space and mixing and interaction between them are essential in a sustainable urban system. In this context, social cohesion is a state in which citizens and the government share a vision of a society based on social justice, the primacy
of the rule of law, and solidarity. This allows us to under-stand the importance of policies that foment and rein-force social cohesion based on democratic values.
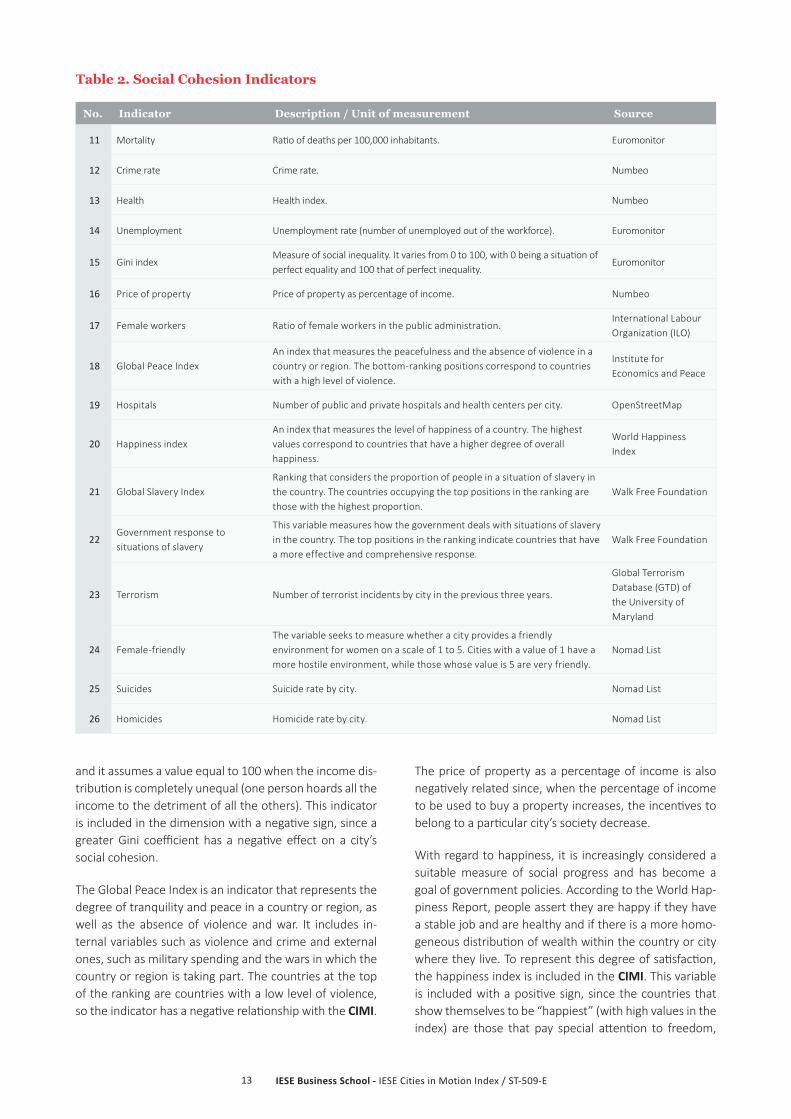
Table 2 sets out the indicators selected to analyze this dimension, descriptions of them, their units of measure-ment and the sources of information. This selection seeks to incorporate all the sociological subdimensions of so-cial cohesion, taking into account the different variables available.
The ratio of deaths per 100,000 inhabitants and the crime rate are incorporated with a negative sign when this di-mension is created. Furthermore, the health index and the number of public and private hospitals and health centers per city are added with a positive sign, since ac-cess to and coverage provided by basic social services help strengthen social cohesion.
Employment, meanwhile, is a fundamental aspect in the societies, to the extent that, according to historical evi-dence, a lack of it can break the consensus or the implicit social contract. For this reason, the unemployment rate is incorporated with a negative sign in the dimension of social cohesion. With regard to the ratio of women who work in public administration, this is incorporated with a positive sign, since it is an indicator of gender equality in access to government jobs.
The Gini index, calculated on the basis of the Gini coeffi-cient to measure social inequality, assumes a value equal to 0 for situations in which there is a perfectly equitable distribution of income (everyone has the same income)
No. Indicator Description / Unit of measurement Source
1 Higher education Proportion of population with secondary and higher education. Euromonitor
2 Business schools Number of business schools (top 100). Financial Times
3 Movement of students International movement of higher-level students. Number of students. UNESCO
4 Universities Number of universities in the city that are in the top 500. QS Top Universities
5 Museums and art galleries Number of museums and art galleries per city. OpenStreetMap
6 Schools Number of public or private schools per city. OpenStreetMap
7 Theaters Number of theaters per city. OpenStreetMap
8Expenditure on leisure and recreation
Expenditure on leisure and recreation per capita. Euromonitor
9Expenditure on leisure and recreation
Expenditure on leisure and recreation. In millions of dollars, according to 2016 prices.
Euromonitor
10 Expenditure on education Expenditure on education per capita. Euromonitor
Table 1. Human Capital Indicators
IESE Business School - IESE Cities in Motion Index / ST-509-E13
and it assumes a value equal to 100 when the income dis-tribution is completely unequal (one person hoards all the income to the detriment of all the others). This indicator is included in the dimension with a negative sign, since a greater Gini coefficient has a negative effect on a city’s social cohesion.
The Global Peace Index is an indicator that represents the degree of tranquility and peace in a country or region, as well as the absence of violence and war. It includes in-ternal variables such as violence and crime and external ones, such as military spending and the wars in which the country or region is taking part. The countries at the top of the ranking are countries with a low level of violence, so the indicator has a negative relationship with the CIMI.
The price of property as a percentage of income is also negatively related since, when the percentage of income to be used to buy a property increases, the incentives to belong to a particular city’s society decrease.
With regard to happiness, it is increasingly considered a suitable measure of social progress and has become a goal of government policies. According to the World Hap-piness Report, people assert they are happy if they have a stable job and are healthy and if there is a more homo-geneous distribution of wealth within the country or city where they live. To represent this degree of satisfaction, the happiness index is included in the CIMI. This variable is included with a positive sign, since the countries that show themselves to be “happiest” (with high values in the index) are those that pay special attention to freedom,
No. Indicator Description / Unit of measurement Source
11 Mortality Ratio of deaths per 100,000 inhabitants. Euromonitor
12 Crime rate Crime rate. Numbeo
13 Health Health index. Numbeo
14 Unemployment Unemployment rate (number of unemployed out of the workforce). Euromonitor
15 Gini indexMeasure of social inequality. It varies from 0 to 100, with 0 being a situation of perfect equality and 100 that of perfect inequality.
Euromonitor
16 Price of property Price of property as percentage of income. Numbeo
17 Female workers Ratio of female workers in the public administration.International Labour Organization (ILO)
18 Global Peace IndexAn index that measures the peacefulness and the absence of violence in a country or region. The bottom-ranking positions correspond to countries with a high level of violence.
Institute for Economics and Peace
19 Hospitals Number of public and private hospitals and health centers per city. OpenStreetMap
20 Happiness indexAn index that measures the level of happiness of a country. The highest values correspond to countries that have a higher degree of overall happiness.
World Happiness Index
21 Global Slavery IndexRanking that considers the proportion of people in a situation of slavery in the country. The countries occupying the top positions in the ranking are those with the highest proportion.
Walk Free Foundation
22Government response to situations of slavery
This variable measures how the government deals with situations of slavery in the country. The top positions in the ranking indicate countries that have a more effective and comprehensive response.
Walk Free Foundation
23 Terrorism Number of terrorist incidents by city in the previous three years.
Global Terrorism Database (GTD) of the University of Maryland
24 Female-friendlyThe variable seeks to measure whether a city provides a friendly environment for women on a scale of 1 to 5. Cities with a value of 1 have a more hostile environment, while those whose value is 5 are very friendly.
Nomad List
25 Suicides Suicide rate by city. Nomad List
26 Homicides Homicide rate by city. Nomad List
Table 2. Social Cohesion Indicators
IESE Business School - IESE Cities in Motion Index / ST-509-E14
employment, health care, income and good governance. Thus, the happiness of a country or city would also be re-flected in greater social coexistence.
The proportion of people enduring slavery and the mea-sures that governments take to respond to this type of crime are incorporated with a negative sign in the ranking, since they do not contribute to the development of a just and socially cohesive city.
The terrorism variable takes into account the acts of ter-rorism that have been committed in the previous three years in the city. It is included with a negative sign since such acts undermine the social peace of the city.
This year, three new variables have been incorporated. The female-friendly variable seeks to measure the ur-ban degree of freedom and safety for the development of women and it is expressed in categories from 1 to 5, where the highest score corresponds to cities that are more female-friendly. It is included in the index with a positive sign. The other two variables incorporated are the suicide rate and the homicide rate by city, with a neg-
ative sign in the index, due to their impact on the dimen-sion also being negative: the higher the homicide rate, the more insecure the city becomes; the higher the suicide rate, the less attractive it is as a place to live.
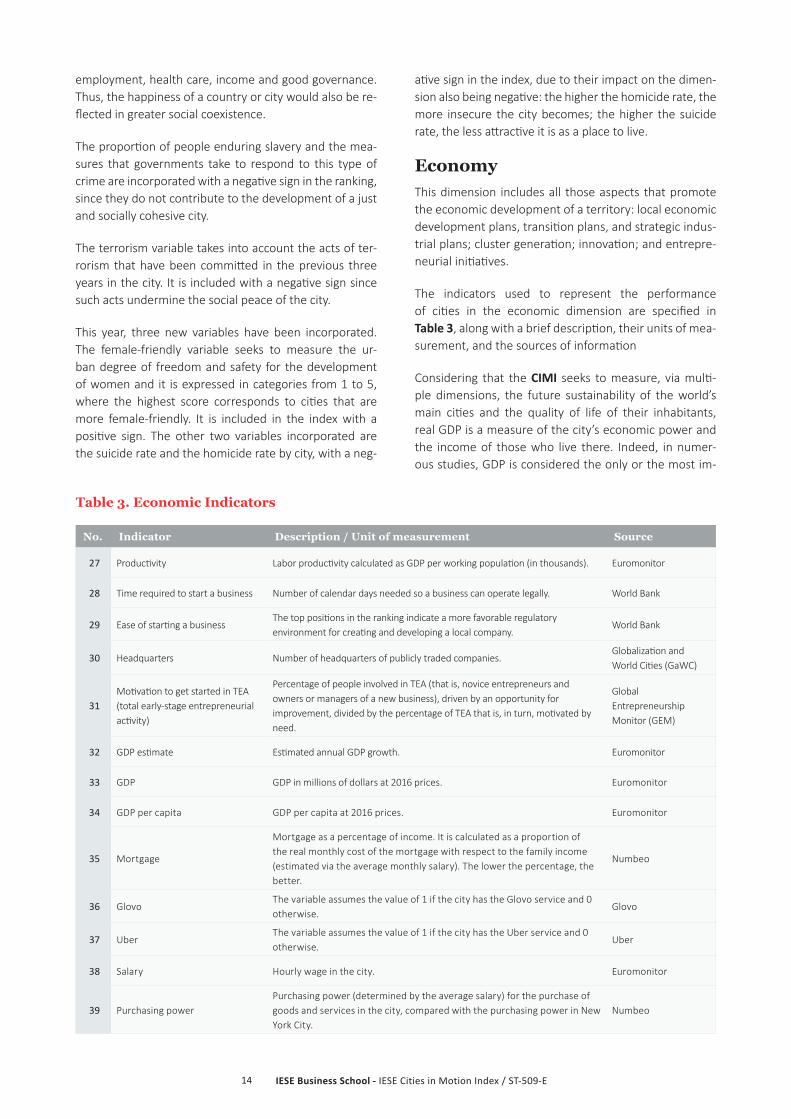
EconomyThis dimension includes all those aspects that promote the economic development of a territory: local economic development plans, transition plans, and strategic indus-trial plans; cluster generation; innovation; and entrepre-neurial initiatives.
The indicators used to represent the performance of cities in the economic dimension are specified in Table 3, along with a brief description, their units of mea-surement, and the sources of information
Considering that the CIMI seeks to measure, via multi-ple dimensions, the future sustainability of the world’s main cities and the quality of life of their inhabitants, real GDP is a measure of the city’s economic power and the income of those who live there. Indeed, in numer-ous studies, GDP is considered the only or the most im-
No. Indicator Description / Unit of measurement Source
27 Productivity Labor productivity calculated as GDP per working population (in thousands). Euromonitor
28 Time required to start a business Number of calendar days needed so a business can operate legally. World Bank
29 Ease of starting a businessThe top positions in the ranking indicate a more favorable regulatory environment for creating and developing a local company.
World Bank
30 Headquarters Number of headquarters of publicly traded companies.Globalization and World Cities (GaWC)
31Motivation to get started in TEA (total early-stage entrepreneurial activity)
Percentage of people involved in TEA (that is, novice entrepreneurs and owners or managers of a new business), driven by an opportunity for improvement, divided by the percentage of TEA that is, in turn, motivated by need.
Global Entrepreneurship Monitor (GEM)
32 GDP estimate Estimated annual GDP growth. Euromonitor
33 GDP GDP in millions of dollars at 2016 prices. Euromonitor
34 GDP per capita GDP per capita at 2016 prices. Euromonitor
35 Mortgage
Mortgage as a percentage of income. It is calculated as a proportion of the real monthly cost of the mortgage with respect to the family income (estimated via the average monthly salary). The lower the percentage, the better.
Numbeo
36 GlovoThe variable assumes the value of 1 if the city has the Glovo service and 0 otherwise.
Glovo
37 UberThe variable assumes the value of 1 if the city has the Uber service and 0 otherwise.
Uber
38 Salary Hourly wage in the city. Euromonitor
39 Purchasing powerPurchasing power (determined by the average salary) for the purchase of goods and services in the city, compared with the purchasing power in New York City.
Numbeo
Table 3. Economic Indicators
IESE Business School - IESE Cities in Motion Index / ST-509-E15
portant measure of the performance of a city or country. However, in this report, it is not considered as exclusive nor as the most important measure but as one more indi-cator within the framework of the nine dimensions of the CIMI. Thus, its share of the total is similar to that of other indicators. For example, if a city with a high or relatively high GDP does not have a good performance in other in-dicators, it may not be in one of the top positions. In this way, a city that is very productive but has problems with transportation, inequality, weak public finance or a pro-duction process that uses polluting technology probably will not be in the top positions of the ranking. Additional-ly, we have included the estimated annual GDP growth to study the future progress of the city.
For its part, labor productivity allows for a measurement of the strength, efficiency and technological level of the production system. With regard to local and internation-al competitiveness, productivity will have repercussions, obviously, on real salaries, capital income, and business profits—for which reason, it is very important to consid-er the measure in the economic dimension, since differ-ent productivity rates can explain differences in workers’ quality of life—and the sustainability over time of the production system.
Other indicators selected as representative of this di-mension enable the measurement of some aspects of the business landscape of a city, such as the number of headquarters of publicly traded parent companies; the entrepreneurial capacity and possibilities of a city’s inhabitants, represented by the percentage of entre-preneurs who start their activity motivated by personal improvement; and the time required to start a business and the ease of setting up a business in regulatory terms. These indicators measure a city’s sustainability capacity over time and the potential ability to improve the quality of life of its inhabitants. The time required to start a busi-ness and the ease of launching it are incorporated into the economic dimension with a negative sign, since lower values indicate a greater ease of starting businesses. The number of headquarters of publicly traded parent com-panies, the entrepreneurial capacity and possibilities of a city’s inhabitants and the number of entrepreneurs have a positive relationship, since the high values of these indi-cators reflect the economic dynamism of a city, as well as the ease of setting up and starting a new business.
This year, five new variables have been incorporated in this dimension. In the case of the percentage of the fam-ily income represented by mortgage payments, this is added to complement the information collected by the variable of the price of private property. An attempt is made to measure the extent to which access to a 20-year mortgage is within the reach of a middle-income family. The higher the percentage of the family income taken up
by the mortgage, the worse the situation will be for the family. For that reason, the variable is incorporated with a negative sign.
Taking into account the degree of dissemination of new technologies and the services that emerge from them, we also incorporated the Glovo and Uber variables as in-dicators of the new digital economy. Both variables show the coverage of the respective service in the city. They are binary variables and are incorporated with a positive sign. Information concerning the Mytaxi service was also collected but this was discarded, since it currently has a presence in all the cities considered in the ranking.
Finally, the variable for the hourly wage in the city has been incorporated, along with the index that represents the purchasing power relating to goods and services in the city compared with the purchasing power of a New York resident. Both indicators are added with a positive sign, since high values of these represent a better work situation.
Governance“Governance” is the term commonly used to describe the effectiveness, quality and sound guidance of state in-tervention. Given that the city resident is the focal point for solving all the challenges facing cities, factors such as the level of the public’s participation and the authorities’ ability to involve business leaders and local stakeholders should be taken into account, as well as the application of e government plans. Moreover, this dimension en-compasses all those actions aimed at improving the ad-ministration’s efficiency, including the design of new or-ganizational and management models. In this area, great opportunities open up for private initiative, which can bring greater efficiency.
In this work, governance is understood to have a strong correlation with the state of public finances of a city or country. In this sense, public accounts decisively affect the population’s quality of life and a city’s sustainability, since they determine the level of present and future taxes that the residents and the production system must face, the expected growth of the general level of prices, the possi-bilities of public investment in basic social infrastructure, and incentives for private investment. In addition, if the state has financing needs, it will compete with the private sector for funds available in the financial system, which will affect investment.
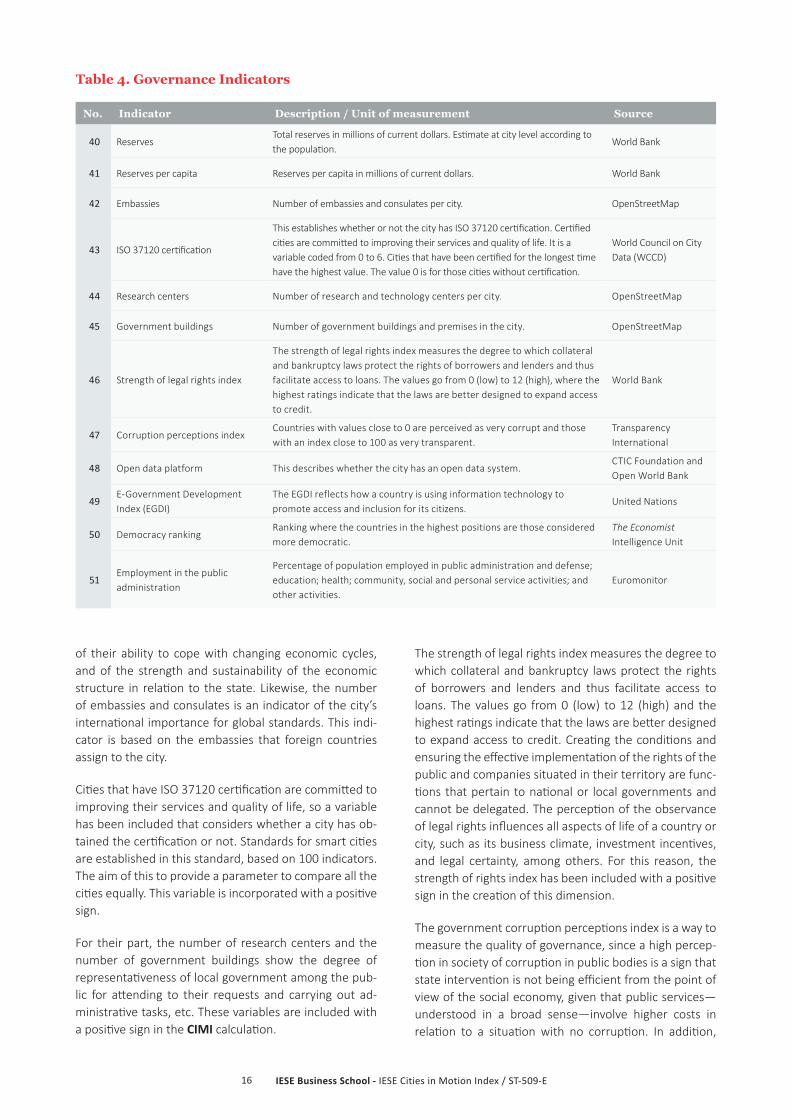
The indicators that represent the governance dimension in this report are listed in Table 4, along with descriptions of them, their units of measurement and the sources of information.
The level of reserves is an indicator of the strength of the public finance system in the short and medium term,
IESE Business School - IESE Cities in Motion Index / ST-509-E16
of their ability to cope with changing economic cycles, and of the strength and sustainability of the economic structure in relation to the state. Likewise, the number of embassies and consulates is an indicator of the city’s international importance for global standards. This indi-cator is based on the embassies that foreign countries assign to the city.
Cities that have ISO 37120 certification are committed to improving their services and quality of life, so a variable has been included that considers whether a city has ob-tained the certification or not. Standards for smart cities are established in this standard, based on 100 indicators. The aim of this to provide a parameter to compare all the cities equally. This variable is incorporated with a positive sign.
For their part, the number of research centers and the number of government buildings show the degree of representativeness of local government among the pub-lic for attending to their requests and carrying out ad-ministrative tasks, etc. These variables are included with a positive sign in the CIMI calculation.
The strength of legal rights index measures the degree to which collateral and bankruptcy laws protect the rights of borrowers and lenders and thus facilitate access to loans. The values go from 0 (low) to 12 (high) and the highest ratings indicate that the laws are better designed to expand access to credit. Creating the conditions and ensuring the effective implementation of the rights of the public and companies situated in their territory are func-tions that pertain to national or local governments and cannot be delegated. The perception of the observance of legal rights influences all aspects of life of a country or city, such as its business climate, investment incentives, and legal certainty, among others. For this reason, the strength of rights index has been included with a positive sign in the creation of this dimension.
The government corruption perceptions index is a way to measure the quality of governance, since a high percep-tion in society of corruption in public bodies is a sign that state intervention is not being efficient from the point of view of the social economy, given that public services—understood in a broad sense—involve higher costs in relation to a situation with no corruption. In addition,
No. Indicator Description / Unit of measurement Source
40 ReservesTotal reserves in millions of current dollars. Estimate at city level according to the population.
World Bank
41 Reserves per capita Reserves per capita in millions of current dollars. World Bank
42 Embassies Number of embassies and consulates per city. OpenStreetMap
43 ISO 37120 certification
This establishes whether or not the city has ISO 37120 certification. Certified cities are committed to improving their services and quality of life. It is a variable coded from 0 to 6. Cities that have been certified for the longest time have the highest value. The value 0 is for those cities without certification.
World Council on City Data (WCCD)
44 Research centers Number of research and technology centers per city. OpenStreetMap
45 Government buildings Number of government buildings and premises in the city. OpenStreetMap
46 Strength of legal rights index
The strength of legal rights index measures the degree to which collateral and bankruptcy laws protect the rights of borrowers and lenders and thus facilitate access to loans. The values go from 0 (low) to 12 (high), where the highest ratings indicate that the laws are better designed to expand access to credit.
World Bank
47 Corruption perceptions indexCountries with values close to 0 are perceived as very corrupt and those with an index close to 100 as very transparent.
Transparency International
48 Open data platform This describes whether the city has an open data system.CTIC Foundation and Open World Bank
49E-Government Development Index (EGDI)
The EGDI reflects how a country is using information technology to promote access and inclusion for its citizens.
United Nations
50 Democracy rankingRanking where the countries in the highest positions are those considered more democratic.
The Economist Intelligence Unit
51Employment in the public administration
Percentage of population employed in public administration and defense; education; health; community, social and personal service activities; and other activities.
Euromonitor
Table 4. Governance Indicators
IESE Business School - IESE Cities in Motion Index / ST-509-E17
incentives to invest or settle in countries or cities with a high perception of corruption will be lower than in others with low levels, which negatively affects sustainability. In the case of the CIMI, it is taken as an explanatory indi-cator of the governance dimension, with a positive sign, due to how the index is calculated by the organization Transparency International, which assigns a value of 0 to countries with a high level of corruption and 100 to those with a high degree of transparency.
Finally, the variable that considers whether a city’s gov-ernment has an open data platform is an indicator of transparency in government management, a communi-cation channel with the public and a platform for gener-ating new business models. The variable assigns a value of 1 if there is an open data platform and 0 otherwise. Therefore, the indicator is incorporated with a positive sign into this dimension.
The E-Government Development Index (EGDI) reflects how a country is using information technology to pro-mote access and inclusion for its citizens. It is a measure composed of three important dimensions of e govern-ment: the provision of online services, telecommunica-tions connectivity and human capacity. This variable is included with a positive sign.
The Democracy Index, for its part, shows a country’s de-gree of democracy, represented by its electoral system, its freedom of expression, the functioning of the govern-ment, and political participation and culture. It is includ-ed with a negative sign since the countries in the highest positions are those considered more democratic.
This year, a new variable has been incorporated for the percentage of employees in public-sector jobs, such as education, defense and health, and it is included with a positive sign in the dimension, since it is an indicator of the human capital in the public sector.
The EnvironmentSustainable development of a city can be defined as “development that meets the needs of the present with-out compromising the ability of future generations to meet their own needs.”1 In this respect, factors such as improving environmental sustainability through antipol-lution plans, support for green buildings and alternative
1 Definition used in 1987 by the UN’s World Commission on Environment and Development, created in 1983.
energy, efficient water and waste management, and the existence of policies that help counter the effects of cli-mate change are essential to guarantee the long-term sustainability of cities.
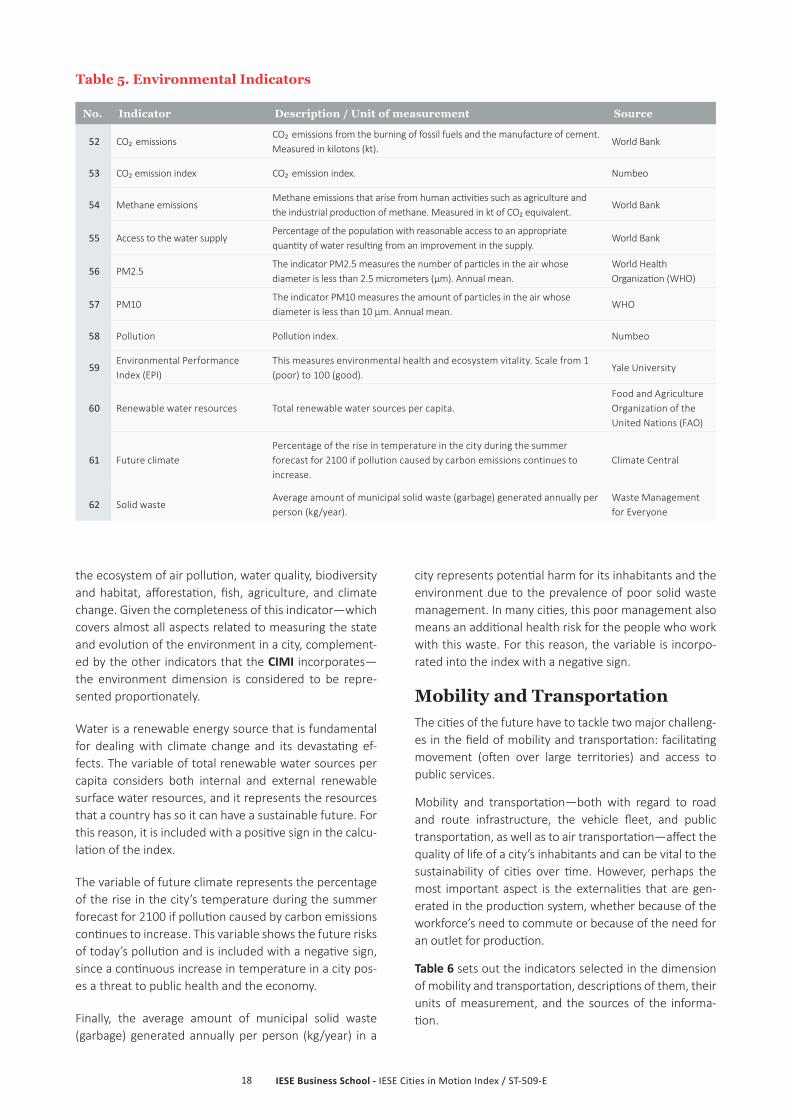
Since the CIMI also seeks to measure environmental sustainability, the environment is included as one of the essential aspects of measurement. Table 5 sets out the indicators selected in this dimension, as well as brief de-scriptions, their units of measurement, and the sources of the information.
The indicators selected include measurements of air pol-lution sources and water quality in cities, which are in-dicators of the quality of life of their inhabitants, as well as the sustainability of their production or urban matrix.
CO₂ emissions come from the burning of fossil fuels and the manufacture of cement, while methane emissions arise from human activities such as agriculture and the industrial production of methane. Both types of emis-sions are the main measures that are commonly used to evaluate the degree of air pollution, since they are substances that are strongly related to the greenhouse effect. In fact, reducing these indicators’ values is one of the goals of the Kyoto Protocol.
Other very important indicators for measuring air pol-lution in cities are PM2.5 and PM10, designations that correspond to small particles (solid or liquid) of dust, ash, soot, metal, cement, or pollen, scattered in the at-mosphere and whose diameter is less than 2.5 µm and 10 µm, respectively. These particles are formed primarily by inorganic compounds such as silicates and aluminates, heavy metals, and organic material associated with car-bon particles (soot). These indicators are commonly used in the indexes that seek to measure the state of environ-mental pollution. They are also complemented by the in-formation provided by a city’s pollution index, which es-timates its overall pollution. The greatest weight is given to those cities with the highest air pollution.
The Environmental Performance Index (EPI), calculat-ed by Yale University, is an indicator based on the mea-surement of two major dimensions related to the envi-ronment, namely: environmental health and ecosystem vitality. The first is divided into three subdimensions: effects on human health of air pollution, water quality and the environmental burden of diseases. In turn, eco-system vitality contains seven subdimensions: effects on
IESE Business School - IESE Cities in Motion Index / ST-509-E18
the ecosystem of air pollution, water quality, biodiversity and habitat, afforestation, fish, agriculture, and climate change. Given the completeness of this indicator—which covers almost all aspects related to measuring the state and evolution of the environment in a city, complement-ed by the other indicators that the CIMI incorporates—the environment dimension is considered to be repre-sented proportionately.
Water is a renewable energy source that is fundamental for dealing with climate change and its devastating ef-fects. The variable of total renewable water sources per capita considers both internal and external renewable surface water resources, and it represents the resources that a country has so it can have a sustainable future. For this reason, it is included with a positive sign in the calcu-lation of the index.
The variable of future climate represents the percentage of the rise in the city’s temperature during the summer forecast for 2100 if pollution caused by carbon emissions continues to increase. This variable shows the future risks of today’s pollution and is included with a negative sign, since a continuous increase in temperature in a city pos-es a threat to public health and the economy.
Finally, the average amount of municipal solid waste (garbage) generated annually per person (kg/year) in a
city represents potential harm for its inhabitants and the environment due to the prevalence of poor solid waste management. In many cities, this poor management also means an additional health risk for the people who work with this waste. For this reason, the variable is incorpo-rated into the index with a negative sign.
Mobility and TransportationThe cities of the future have to tackle two major challeng-es in the field of mobility and transportation: facilitating movement (often over large territories) and access to public services.
Mobility and transportation—both with regard to road and route infrastructure, the vehicle fleet, and public transportation, as well as to air transportation—affect the quality of life of a city’s inhabitants and can be vital to the sustainability of cities over time. However, perhaps the most important aspect is the externalities that are gen-erated in the production system, whether because of the workforce’s need to commute or because of the need for an outlet for production.
Table 6 sets out the indicators selected in the dimension of mobility and transportation, descriptions of them, their units of measurement, and the sources of the informa-tion.
No. Indicator Description / Unit of measurement Source
52 CO₂ emissions CO₂ emissions from the burning of fossil fuels and the manufacture of cement. Measured in kilotons (kt).
World Bank
53 CO₂ emission index CO₂ emission index. Numbeo
54 Methane emissionsMethane emissions that arise from human activities such as agriculture and the industrial production of methane. Measured in kt of CO₂ equivalent.
World Bank
55 Access to the water supplyPercentage of the population with reasonable access to an appropriate quantity of water resulting from an improvement in the supply.
World Bank
56 PM2.5The indicator PM2.5 measures the number of particles in the air whose diameter is less than 2.5 micrometers (µm). Annual mean.
World Health Organization (WHO)
57 PM10 The indicator PM10 measures the amount of particles in the air whose diameter is less than 10 µm. Annual mean.
WHO
58 Pollution Pollution index. Numbeo
59Environmental Performance Index (EPI)
This measures environmental health and ecosystem vitality. Scale from 1 (poor) to 100 (good).
Yale University
60 Renewable water resources Total renewable water sources per capita.Food and Agriculture Organization of the United Nations (FAO)
61 Future climatePercentage of the rise in temperature in the city during the summer forecast for 2100 if pollution caused by carbon emissions continues to increase.
Climate Central
62 Solid wasteAverage amount of municipal solid waste (garbage) generated annually per person (kg/year).
Waste Management for Everyone
Table 5. Environmental Indicators

IESE Business School - IESE Cities in Motion Index / ST-509-E19
The indexes for general traffic, traffic caused by commut-ing to work, and inefficiency are estimates of the traffic inefficiencies caused by long driving times and by the dis-satisfaction that these situations generate in the popula-tion. These indicators are a measure of the safety of roads and public transportation, which, if it is effective and has a good infrastructure, promotes a decrease in vehicular traffic on public thoroughfares and reduces the number of accidents. All these are included with a negative sign in the calculation of the CIMI, since they have a negative impact on the development of a sustainable city.
The bike-sharing indicator, for its part, collects informa-tion about a city’s public system of shared bicycles aimed at making it possible to move from one location to anoth-er using them. It varies between 0 and 8, where 0 refers to the lack of such a system in the city and 8 refers to a highly developed system. It is incorporated with a posi-tive sign in the CIMI.
The number of metro stations and the length of the sys-tem are indicators of commitment to the development of the city and investment with respect to the population size. The number of air routes (arrivals) and the posses-sion of a high-speed train represent the degree of mo-bility development of a city. A highly developed city will favor the incorporation of new commercial air routes, as well as the circulation and transit of passengers using different means of transport. These indicators are includ-ed with a positive sign in the calculation of the index be-cause of the good influence they have on the dimension.
This year we have also incorporated variables for the number of vehicles and the percentage of bicycles that the city has. The former is integrated with a negative sign, and the latter with a positive sign, due to the negative and positive influence they respectively have on traffic and traffic congestion.
Urban PlanningUrban planning has several subdimensions and is close-ly related to sustainability. If this is inadequate, it causes a reduction in the public’s quality of life in the medium term and can also negatively affect investment incen-tives, since bad planning or a complete lack of planning hinders and increases the costs of logistics and workers’ transportation, among other aspects.
To improve the habitability of any territory, it is necessary to take into account the local master plans and the design of green areas and spaces for public use, as well as opt-ing for smart growth. The new urban planning methods should focus on creating compact, well-connected cities with accessible public services.
Depending on the information available, several aspects related to urban plans, the quality of health infrastruc-ture, and housing policies are incorporated as indicators of this dimension. Table 7 sets out the indicators includ-ed in this dimension, along with descriptions of them, their units of measurement, and the sources of informa-tion used.
No. Indicator Description / Unit of measurement Source
63 Traffic index Consideration of the time spent in traffic, the dissatisfaction this generates, CO₂ consumption and other inefficiencies of the traffic system.
Numbeo
64 Inefficiency indexEstimation of traffic inefficiencies (such as long journey times). High values represent high rates of inefficiency in driving.
Numbeo
65Index of traffic for commuting to work
Index of time that takes into account how many minutes it takes to commute to work.
Numbeo
66 Bike sharingThis system shows the automated services for the public use of shared bicycles that provide transport from one location to another within a city. The indicator varies between 0 and 8 according to how developed the system is.
Bike-Sharing World Map
67 Length of the metro system Length of the metro system per city. Metrobits
68 Metro stations Number of metro stations per city. Metrobits
69 Flights Number of arrival flights (air routes) in a city. OpenFlights
70 High-speed train Binary variable that shows whether the city has a high-speed train or not. OpenRailwayMap
71 Vehicles Number of commercial vehicles in the city (in thousands). Euromonitor
72 Bicycles per household Percentage of bicycles per household. Euromonitor
Table 6. Mobility and Transportation Indicators

IESE Business School - IESE Cities in Motion Index / ST-509-E20
The bicycle is an effective, fast, economical, healthy, and environmentally friendly means of transportation. There-fore its use has a positive impact on a city’s sustainable development as it does not cause pollution or use fuel, among other benefits. Considering this positive effect, the index includes in the CIMI the number of points for the rental or sharing of this means of transport, based on docking stations where bicycles can be picked up or dropped off. Many cities historically considered to be smart cities have a certain positive correlation with wide-spread bicycle use. As a result, this variable is included with a positive sign.
For its part, the quality of health infrastructure refers to the percentage of the urban population with improved sanitation facilities that are not shared with other house-holds. This indicator has a high correlation with that of urban planning, since it can be shown that inadequate planning inevitably results in health problems in the short and medium term.
In addition, from the urban planning and housing point of view, a city with proper urban planning generally has few or no problems of overcrowding in households, since nor-mally housing policy, in relation to the estimated growth in the number of residents, is a determining factor in urban planning. For this reason, within the explanatory indicators of this dimension, the number of occupants of each household is included with a negative sign.
In turn, the number of completed buildings and the per-centage of high-rises contribute to the creation of com-pact and organized cities. These variables are incorporat-ed with a positive sign.
International OutreachCities that want to progress must secure a privileged place in the world. Maintaining global impact involves improving the city brand and its international recognition through strategic tourism plans, the attracting of foreign investment and representation abroad.
Cities can have a greater or lesser international outreach even if they are from the same country but this aspect is not independent of the degree of openness nationally. This dimension seeks to reflect these differences and to measure the international outreach of cities.
In this respect, the following indicators have been includ-ed: airports, number of passengers by airport, number of hotels in a city, ranking of the most popular places in the world according to Sightsmap, and number of meetings and conferences that are held according to data from the International Congress and Convention Association. This last indicator is important for a city’s international reputation, taking into account that these events usual-ly take place in cities with international hotels, meeting rooms specially fitted out for such ends, good frequency of international flights, and appropriate security mea-sures. Table 8 summarizes these indicators, along with descriptions of them, their units of measurement, and the sources of information.
All indicators of this dimension, except Sightsmap, are incorporated with a positive sign into the calculation of the CIMI since the higher the value of the indicators, the greater the impact that the city has on the world. Sights-map is incorporated with a negative sign, since the top positions in its ranking correspond with the most-pho-tographed cities, of which there is a higher number of references in Wikipedia and Foursquare.
No. Indicator Description / Unit of measurement Source
73 Bicycles for rentNumber of bike-rental or bike-sharing points, based on docking stations where they can be picked up or dropped off.
OpenStreetMap
74Percentage of the urban population with adequate sanitation facilities
Percentage of the urban population that uses at least basic sanitation services—that is, improved sanitation facilities that are not shared with other households.
World Bank
75 Number of people per householdNumber of people per household. Occupancy by household is measured compared to the average. This makes it possible to estimate if a city has overoccupied or underoccupied households.
Euromonitor
76 High-rise buildingsPercentage of buildings considered high-rises. A high-rise is a building of at least 12 stories or 35 meters (115 feet) high.
Skyscraper Source Media
77 Buildings
This variable is the number of completed buildings in the city. It includes structures such as high-rises, towers and low-rise buildings but excludes other various others, as well as buildings in different states of completion (in construction, planned, etc.).
Skyscraper Source Media
Table 7. Urban Planning Indicators

IESE Business School - IESE Cities in Motion Index / ST-509-E21
This year, the variable “restaurant index” is included. It seeks to compare the price of the restaurants in the city with respect to those of New York. It is incorporated with a positive sign as an indicator of the international culinary quality.
TechnologyAlthough it is not the only important aspect for cities, in-formation and communications technology (ICT) is part of the backbone of any society that wants to achieve “smart” status.
Technology, an integral dimension of the CIMI, is an as-pect of society that improves the present quality of life, and its level of development or spread is an indicator of the quality of life achieved or the potential quality of life. In addition, technological development is a dimension that allows cities to be sustainable over time and to main-tain or extend the competitive advantages of their pro-duction system and the quality of employment. A tech-nologically backward city has comparative disadvantages with respect to other cities, both from the point of view of security, education, and health—all fundamental for the sustainability of society—and from the point of view of the productive apparatus. As a consequence, the pro-duction functions become anachronistic. So competitive-ness, without protectionism, becomes depleted and has a negative effect on the city’s capacity for consumption and investment, as well as reducing labor productivity.
The indicators selected for measuring the cities’ perfor-mance in terms of the reach of technology and growth in the cities are set out in Table 9 below, along with de-scriptions of them, their units of measurement, and the sources of information.
The indicators that represent the number of Twitter and LinkedIn users are grouped into a variable called “social media.” This is incorporated with a positive sign in the CIMI, since it shows the degree to which a city’s inhabi-tants are connected with technology.
The variables showing the percentage of households with the Internet and with mobile phones, as well as the variables for landline and broadband subscriptions, show the degree of technological development that a city has, as they enable households and businesses to access the means necessary to make efficient use of technology.
The innovation cities index is calculated by carrying out assessments on the basis of various factors relating to ur-ban technological innovation in sectors such as health, the economy in general and the population, among others. It is now the most comprehensive indicator for measuring the degree of development of innovation in cities, and is divided methodologically into three aspects or dimensions: cultural assets, human infrastructure and interconnected markets.
The number of wireless access points globally represents the connection options available to the city’s inhabitants when they are outside their home. This variable shows the city’s degree of commitment to technological devel-opment.
This year, four new variables have been incorporated: percentage of households with some kind of telephone service, percentage of households with personal com-puters, Internet speed in the city, and Web Index. The four variables attempt to show, along with the previous ones, the degree of technology penetration of the city.
All the indicators of this dimension are related directly to technology, so they are incorporated with a positive sign in this dimension.
No. Indicator Description / Unit of measurement Source
78 McDonald’s Number of McDonald’s chain restaurants per city. OpenStreetMap
79 Number of passengers per airport Number of passengers per airport in thousands. Euromonitor
80 SightsmapRanking of cities according to the number of photos taken there and uploaded to Panoramio (community where photographs were shared online). The top positions correspond to the cities with the most photographs.
Sightsmap
81Number of conferences and meetings
Number of international conferences and meetings that are held in a city.International Congress and Convention Association (ICCA)
82 Hotels Number of hotels per capita. OpenStreetMap
83 Restaurant indexThe index shows the prices of food and beverages in restaurants and bars compared to New York City.
Numbeo
Table 8. International Outreach Indicators

IESE Business School - IESE Cities in Motion Index / ST-509-E22
No. Indicator Description / Unit of measurement Source
84 Twitter Registered Twitter users in the city. This is part of the social media variable. Tweepsmap
85 LinkedIn Number of users in the city. This is part of the social media variable. LinkedIn
86 Mobile phonesNumber of mobile phones in the city via estimates based on country-level data.
International Telecommunication Union
87 Wi-Fi hot spotNumber of wireless access points globally. These represent the options in the city for connecting to the Internet.
WiFi Map app
88 Innovation Cities IndexInnovation index of the city. Valuation of 0 (no innovation) to 60 (a lot of innovation).
Innovation Cities Program
89 Landline subscriptions Number of landline subscriptions per 100 inhabitants.International Telecommunication Union
90 Broadband subscriptions Broadband subscriptions per 100 inhabitants.International Telecommunication Union
91 Internet Percentage of households with access to the Internet. Euromonitor
92 Mobile telephony Percentage of households with mobile phones in the city. Euromonitor
93 Web IndexThe Web Index seeks to measure the economic, social and political benefit that countries obtain from the Internet.
World Wide Web Foundation
94 Telephony Percentage of households with some kind of telephone service. Euromonitor
95 Internet speed Internet speed in the city. Nomad List
96 Computers Percentage of households with a personal computer in the city. Euromonitor
Table 9. Technology Indicators
IESE Business School - IESE Cities in Motion Index / ST-509-E23
Limitations of the Indicators
Appendix 1 describes, by way of summary, all the indica-tors used in each dimension, and brief descriptions, units of measurement and the sources of information are in-cluded.
Perhaps the most significant limitation in the calculation of the CIMI is linked to the availability of data, although efforts were made to minimize the impact of this. First of all, for those indicators that did not have data for the entire period under analysis, extrapolation techniques were used. Secondly, for situations where the indicator values by city were nonexistent but where there were valid values by country, individual values were assigned to each city, connecting the indicator at the country level via some other variable linked theoretically at the city level. Lastly, in those cases where no data were available for a particular city or group of cities for the whole period under consideration, statistical cluster techniques were used. The scope and detail of these tools are discussed thoroughly in the supplementary document IESE Cities in Motion Index 2014: Methodology and Modeling.
With the CIMI platform, we continue to work to obtain more complete and accurate indicators, while we urge cities to allow access to their information, since analyzing it will make it easier to improve those aspects that can be optimized.
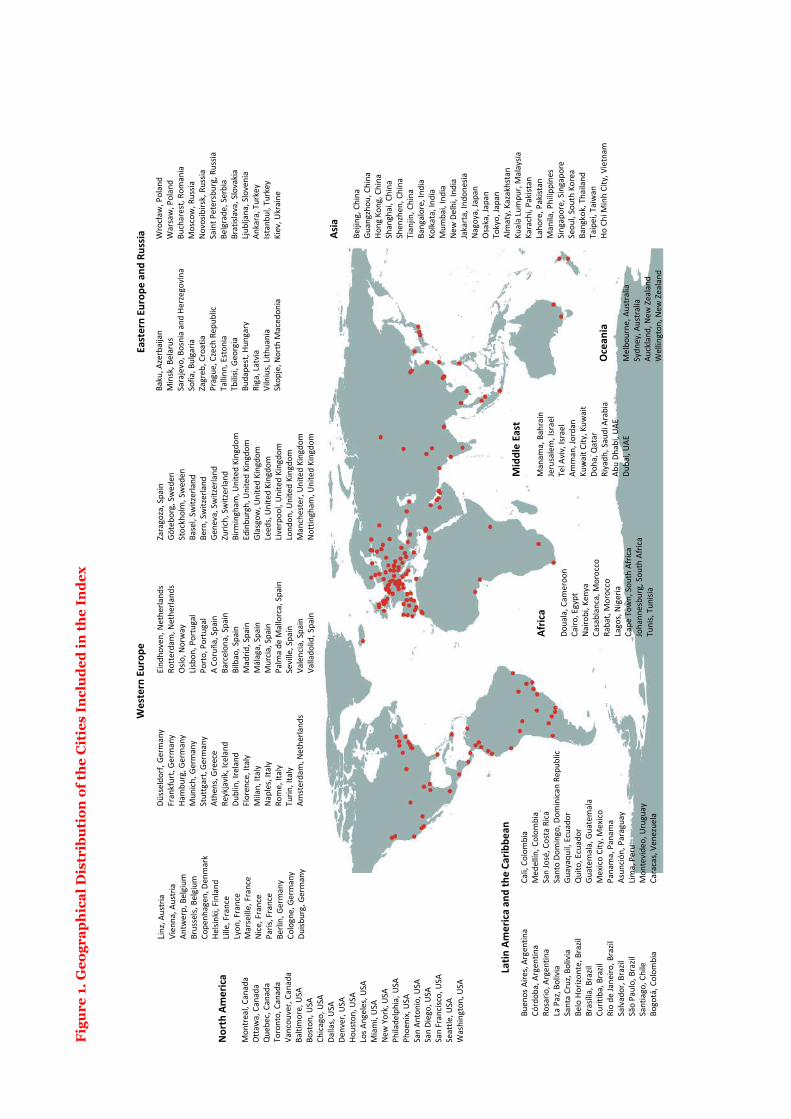
Geographic Coverage
For the production of this year’s CIMI, 174 cities have been studied, 79 of which are capitals, with the geographical distribution depicted in Figure 1.
Fig
ure
1. G
eogr
aph
ical
Dis
trib
uti
on o
f th
e C
itie
s In
clu
ded
in t
he
Ind
ex
Nort
h Am
erica
Mon
treal
, Can
ada
Otta
wa,
Can
ada
Que
bec,
Can
ada
Toro
nto,
Can
ada
Vanc
ouve
r, Ca
nada
Balti
mor
e, U
SABo
ston
, USA
Chica
go, U
SADa
llas,
USA
Denv
er, U
SAHo
usto
n, U
SALo
s Ang
eles
, USA
Mia
mi,
USA
New
Yor
k, U
SAPh
ilade
lphi
a, U
SAPh
oeni
x, U
SASa
n An
toni
o, U
SASa
n Di
ego,
USA
San
Fran
cisco
, USA
Seat
tle, U
SAW
ashi
ngto
n, U
SA
Buen
os A
ires,
Arge
ntin
aCó
rdob
a, A
rgen
tina
Rosa
rio, A
rgen
tina
La P
az, B
oliv
iaSa
nta
Cruz
, Bol
ivia
Belo
Hor
izont
e, B
razil
Bras
ília,
Bra
zilCu
ritib
a, B
razil
Rio
de Ja
neiro
, Bra
zilSa
lvad
or, B
razil
São
Paul
o, B
razil
Sant
iago
, Chi
leBo
gotá
, Col
ombi
a
Cali,
Col
ombi
aM
edel
lín, C
olom
bia
San
José
, Cos
ta R
icaSa
nto
Dom
ingo
, Dom
inica
n Re
publ
icGu
ayaq
uil,
Ecua
dor
Qui
to, E
cuad
orGu
atem
ala,
Gua
tem
ala
Mex
ico C
ity, M
exico
Pana
ma,
Pan
ama
Asun
ción,
Par
agua
yLim
a, P
eru
Mon
tevi
deo,
Uru
guay
Cara
cas,
Vene
zuel
a
Afric
a
Doua
la, C
amer
oon
Cairo
, Egy
ptNa
irobi
, Ken
yaCa
sabl
anca
, Mor
occo
Raba
t, M
oroc
coLa
gos,
Nige
riaCa
pe T
own,
Sou
th A
frica
Joha
nnes
burg
, Sou
th A
frica
Tuni
s, Tu
nisia
Ocea
nia
Mel
bour
ne, A
ustr
alia
Sydn
ey, A
ustr
alia
Auck
land
, New
Zea
land
Wel
lingt
on, N
ew Z
eala
nd
Mid
dle
East
Man
ama,
Bah
rain
Jeru
sale
m, I
srae
lTe
l Avi
v, Is
rael
Amm
an, J
orda
nKu
wai
t City
, Kuw
ait
Doha
, Qat
arRi
yadh
, Sau
di A
rabi
aAb
u Dh
abi,
UAE
Duba
i, UA
E
Asia
Beiji
ng, C
hina
Guan
gzho
u, C
hina
Hong
Kon
g, C
hina
Shan
ghai
, Chi
naSh
enzh
en, C
hina
Tian
jin, C
hina
Bang
alor
e, In
dia
Kolk
ata,
Indi
aM
umba
i, In
dia
New
Del
hi, I
ndia
Jaka
rta,
Indo
nesia
Nago
ya, J
apan
Osak
a, Ja
pan
Toky
o, Ja
pan
Alm
aty,
Kaz
akhs
tan
Kual
a Lu
mpu
r, M
alay
siaKa
rach
i, Pa
kist
anLa
hore
, Pak
istan
Man
ila, P
hilip
pine
sSi
ngap
ore,
Sin
gapo
reSe
oul,
Sout
h Ko
rea
Bang
kok,
Tha
iland
Taip
ei, T
aiw
anHo
Chi
Min
h Ci
ty, V
ietn
am
Linz,
Aust
riaVi
enna
, Aus
tria
Antw
erp,
Bel
gium
Brus
sels,
Bel
gium
Cope
nhag
en, D
enm
ark
Helsi
nki,
Finl
and
Lille
, Fra
nce
Lyon
, Fra
nce
Mar
seill
e, F
ranc
eNi
ce, F
ranc
ePa
ris, F
ranc
eBe
rlin,
Ger
man
yCo
logn
e, G
erm
any
Duisb
urg,
Ger
man
y
Düss
eldo
rf, G
erm
any
Fran
kfur
t, Ge
rman
yHa
mbu
rg, G
erm
any
Mun
ich, G
erm
any
Stut
tgar
t, Ge
rman
yAt
hens
, Gre
ece
Reyk
javí
k, Ic
elan
dDu
blin
, Ire
land
Flor
ence
, Ita
lyM
ilan,
Ital
yNa
ples
, Ita
lyRo
me,
Ital
yTu
rin, I
taly
Amst
erda
m, N
ethe
rland
s
Eind
hove
n, N
ethe
rland
sRo
tterd
am, N
ethe
rland
sOs
lo, N
orw
ayLis
bon,
Por
tuga
lPo
rto,
Por
tuga
lA
Coru
ña, S
pain
Barc
elon
a, S
pain
Bilb
ao, S
pain
Mad
rid, S
pain
Mál
aga,
Spa
inM
urcia
, Spa
inPa
lma
de M
allo
rca,
Spa
inSe
ville
, Spa
inVa
lenc
ia, S
pain
Valla
dolid
, Spa
in
Zara
goza
, Spa
inGö
tebo
rg, S
wed
enSt
ockh
olm
, Sw
eden
Base
l, Sw
itzer
land
Bern
, Sw
itzer
land
Gene
va, S
witz
erla
ndZu
rich,
Sw
itzer
land
Birm
ingh
am, U
nite
d Ki
ngdo
mEd
inbu
rgh,
Uni
ted
King
dom
Glas
gow
, Uni
ted
King
dom
Leed
s, Un
ited
King
dom
Liver
pool
, Uni
ted
King
dom
Lond
on, U
nite
d Ki
ngdo
mM
anch
este
r, Un
ited
King
dom
Notti
ngha
m, U
nite
d Ki
ngdo
m
Baku
, Aze
rbai
jan
Min
sk, B
elar
usSa
raje
vo, B
osni
a an
d He
rzeg
ovin
aSo
fia, B
ulga
riaZa
greb
, Cro
atia
Prag
ue, C
zech
Rep
ublic
Talli
nn, E
ston
iaTb
ilisi,
Geor
gia
Buda
pest
, Hun
gary
Riga
, Lat
via
Viln
ius,
Lithu
ania
Skop
je, N
orth
Mac
edon
ia
Wrocław
, Pol
and
War
saw
, Pol
and
Buch
ares
t, Ro
man
iaM
osco
w, R
ussia
Novo
sibirs
k, R
ussia
Sain
t Pet
ersb
urg,
Rus
siaBe
lgra
de, S
erbi
aBr
atisl
ava,
Slo
vaki
aLju
blja
na, S
love
nia
Anka
ra, T
urke
yIst
anbu
l, Tu
rkey
Kiev
, Ukr
aine
Wes
tern
Eur
ope
East
ern
Euro
pe a
nd R
ussia
Latin
Am
erica
and
the
Carib
bean

IESE Business School - IESE Cities in Motion Index / ST-509-E25
Cities in Motion. Ranking
The CIMI, which is the subject of this report, is a synthetic indicator and, as such, is a function based on the partial indicators available.
The process of creating this synthetic indicator is based on a model of weighted aggregation of partial indicators that represent each of the nine dimensions that make up the CIMI theoretical model. The dimensions selected to describe the situation of cities in terms of sustainability and the quality of life of their inhabitants, both in the present and in the future, are as follows: human capital, social cohesion, the economy, governance, the environment, mobility and transportation, urban planning, international outreach, and technology.
The partial indicators representative of each dimension also correspond to the category of synthetic indicators, which are defined as “weighted aggregations of each of the selected indicators that represent different factors of each dimension.”
Given the type of indicator in question and the data available, for the calculation of the CIMI, the DP2 technique has been used, this being the most widely used internationally and the most suitable. Its methodology is based on distance—that is, the difference between an indicator’s given value and another value taken as a reference or target. Likewise, this technique attempts to correct the dependence among the partial indicators, which would artificially increase the indicator’s sensitivity to variations in certain partial values. The correction consists of applying the same factor to each partial indicator, assuming a linearly dependent function is established between them.2
2 Because linear estimates are involved, variables with a normal distribution are required, so a log transformation has been applied to some variables to obtain the said normality. Likewise, outlier techniques have been applied to avoid bias and overestimations of coefficients.
Given the partial indicators, the factors are given by the complement of the coefficient of determination (R2) for each indicator compared with the rest of the partial indicators. The order in which the indicators of each dimension have been included, as well as their relative weight in the CIMI, is as follows: the economy (1), human capital (0.612), international outreach (0.511), urban planning (0.487), the environment (0.831), technology (0.356), governance (0.404), social cohesion (0.567) and mobility and transportation (0.548).
While the order in which the synthetic indexes of each dimension are incorporated influences the value of the CIMI, the sensitivity studies carried out concluded that there are no significant variations in it. More details on the methodology can be seen in the supplementary document IESE Cities in Motion Index 2014: Methodology and Modeling, mentioned previously.
Table 10 sets out the CIMI city ranking, together with the index value. The cities are grouped according to their performance, measured by the value of the synthetic indicator. The performance of the cities is rated as follows: high (H) if they have an index greater than 90; relatively high (RH) if the city is between 60 and 90; medium (M) if it is in the range between 45 and 60; low (L) if it is between 45 and 15; and very low (VL) if it is below 15.
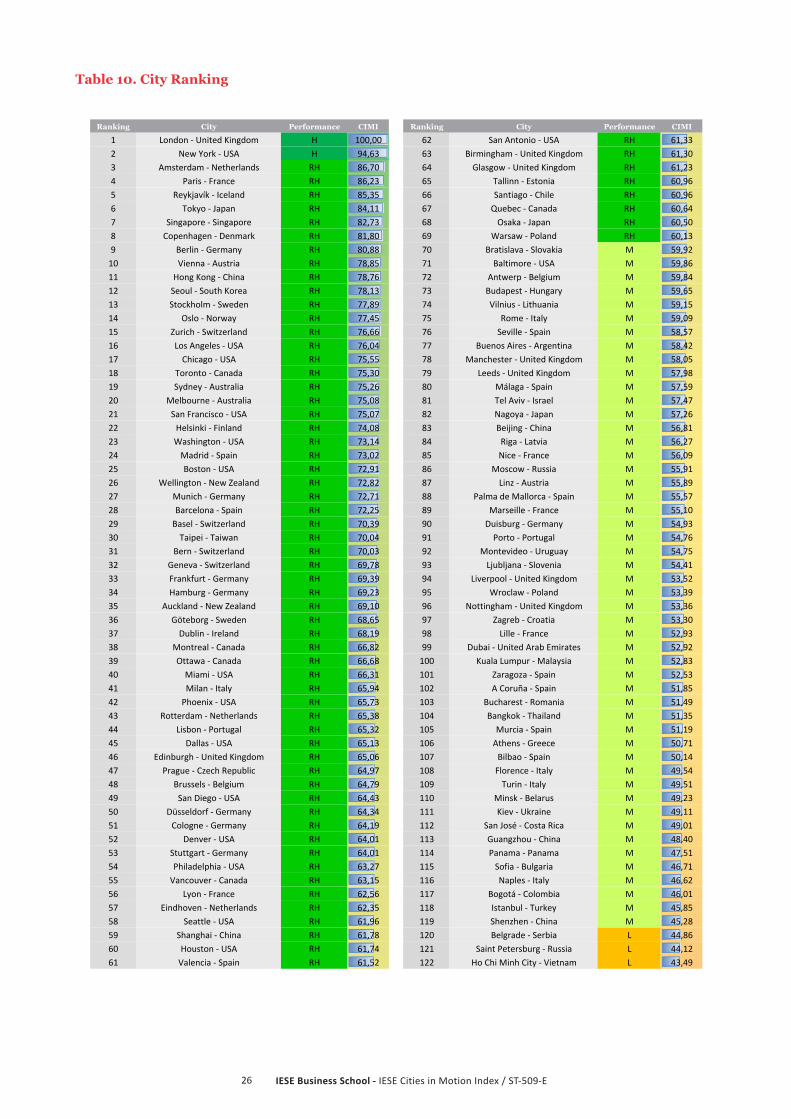
IESE Business School - IESE Cities in Motion Index / ST-509-E26
Ranking City Performance CIMI Ranking City Performance CIMI
1 London ‐ United Kingdom H 100,00 62 San Antonio ‐ USA RH 61,332 New York ‐ USA H 94,63 63 Birmingham ‐ United Kingdom RH 61,303 Amsterdam ‐ Netherlands RH 86,70 64 Glasgow ‐ United Kingdom RH 61,234 Paris ‐ France RH 86,23 65 Tallinn ‐ Estonia RH 60,965 Reykjavík ‐ Iceland RH 85,35 66 Santiago ‐ Chile RH 60,966 Tokyo ‐ Japan RH 84,11 67 Quebec ‐ Canada RH 60,647 Singapore ‐ Singapore RH 82,73 68 Osaka ‐ Japan RH 60,508 Copenhagen ‐ Denmark RH 81,80 69 Warsaw ‐ Poland RH 60,139 Berlin ‐ Germany RH 80,88 70 Bratislava ‐ Slovakia M 59,9210 Vienna ‐ Austria RH 78,85 71 Baltimore ‐ USA M 59,8611 Hong Kong ‐ China RH 78,76 72 Antwerp ‐ Belgium M 59,8412 Seoul ‐ South Korea RH 78,13 73 Budapest ‐ Hungary M 59,6513 Stockholm ‐ Sweden RH 77,89 74 Vilnius ‐ Lithuania M 59,1514 Oslo ‐ Norway RH 77,45 75 Rome ‐ Italy M 59,0915 Zurich ‐ Switzerland RH 76,66 76 Seville ‐ Spain M 58,5716 Los Angeles ‐ USA RH 76,04 77 Buenos Aires ‐ Argentina M 58,4217 Chicago ‐ USA RH 75,55 78 Manchester ‐ United Kingdom M 58,0518 Toronto ‐ Canada RH 75,30 79 Leeds ‐ United Kingdom M 57,9819 Sydney ‐ Australia RH 75,26 80 Málaga ‐ Spain M 57,5920 Melbourne ‐ Australia RH 75,08 81 Tel Aviv ‐ Israel M 57,4721 San Francisco ‐ USA RH 75,07 82 Nagoya ‐ Japan M 57,2622 Helsinki ‐ Finland RH 74,08 83 Beijing ‐ China M 56,8123 Washington ‐ USA RH 73,14 84 Riga ‐ Latvia M 56,2724 Madrid ‐ Spain RH 73,02 85 Nice ‐ France M 56,0925 Boston ‐ USA RH 72,91 86 Moscow ‐ Russia M 55,9126 Wellington ‐ New Zealand RH 72,82 87 Linz ‐ Austria M 55,8927 Munich ‐ Germany RH 72,71 88 Palma de Mallorca ‐ Spain M 55,5728 Barcelona ‐ Spain RH 72,25 89 Marseille ‐ France M 55,1029 Basel ‐ Switzerland RH 70,39 90 Duisburg ‐ Germany M 54,9330 Taipei ‐ Taiwan RH 70,04 91 Porto ‐ Portugal M 54,7631 Bern ‐ Switzerland RH 70,03 92 Montevideo ‐ Uruguay M 54,7532 Geneva ‐ Switzerland RH 69,78 93 Ljubljana ‐ Slovenia M 54,4133 Frankfurt ‐ Germany RH 69,39 94 Liverpool ‐ United Kingdom M 53,5234 Hamburg ‐ Germany RH 69,23 95 Wroclaw ‐ Poland M 53,3935 Auckland ‐ New Zealand RH 69,10 96 Nottingham ‐ United Kingdom M 53,3636 Göteborg ‐ Sweden RH 68,65 97 Zagreb ‐ Croatia M 53,3037 Dublin ‐ Ireland RH 68,19 98 Lille ‐ France M 52,9338 Montreal ‐ Canada RH 66,82 99 Dubai ‐ United Arab Emirates M 52,9239 Ottawa ‐ Canada RH 66,68 100 Kuala Lumpur ‐ Malaysia M 52,8340 Miami ‐ USA RH 66,31 101 Zaragoza ‐ Spain M 52,5341 Milan ‐ Italy RH 65,94 102 A Coruña ‐ Spain M 51,8542 Phoenix ‐ USA RH 65,73 103 Bucharest ‐ Romania M 51,4943 Rotterdam ‐ Netherlands RH 65,38 104 Bangkok ‐ Thailand M 51,3544 Lisbon ‐ Portugal RH 65,32 105 Murcia ‐ Spain M 51,1945 Dallas ‐ USA RH 65,13 106 Athens ‐ Greece M 50,7146 Edinburgh ‐ United Kingdom RH 65,06 107 Bilbao ‐ Spain M 50,1447 Prague ‐ Czech Republic RH 64,97 108 Florence ‐ Italy M 49,5448 Brussels ‐ Belgium RH 64,79 109 Turin ‐ Italy M 49,5149 San Diego ‐ USA RH 64,43 110 Minsk ‐ Belarus M 49,2350 Düsseldorf ‐ Germany RH 64,34 111 Kiev ‐ Ukraine M 49,1151 Cologne ‐ Germany RH 64,19 112 San José ‐ Costa Rica M 49,0152 Denver ‐ USA RH 64,01 113 Guangzhou ‐ China M 48,4053 Stuttgart ‐ Germany RH 64,01 114 Panama ‐ Panama M 47,5154 Philadelphia ‐ USA RH 63,27 115 Sofia ‐ Bulgaria M 46,7155 Vancouver ‐ Canada RH 63,15 116 Naples ‐ Italy M 46,6256 Lyon ‐ France RH 62,56 117 Bogotá ‐ Colombia M 46,0157 Eindhoven ‐ Netherlands RH 62,35 118 Istanbul ‐ Turkey M 45,8558 Seattle ‐ USA RH 61,96 119 Shenzhen ‐ China M 45,2859 Shanghai ‐ China RH 61,78 120 Belgrade ‐ Serbia L 44,8660 Houston ‐ USA RH 61,74 121 Saint Petersburg ‐ Russia L 44,1261 Valencia ‐ Spain RH 61,52 122 Ho Chi Minh City ‐ Vietnam L 43,49
Table 10. City Ranking
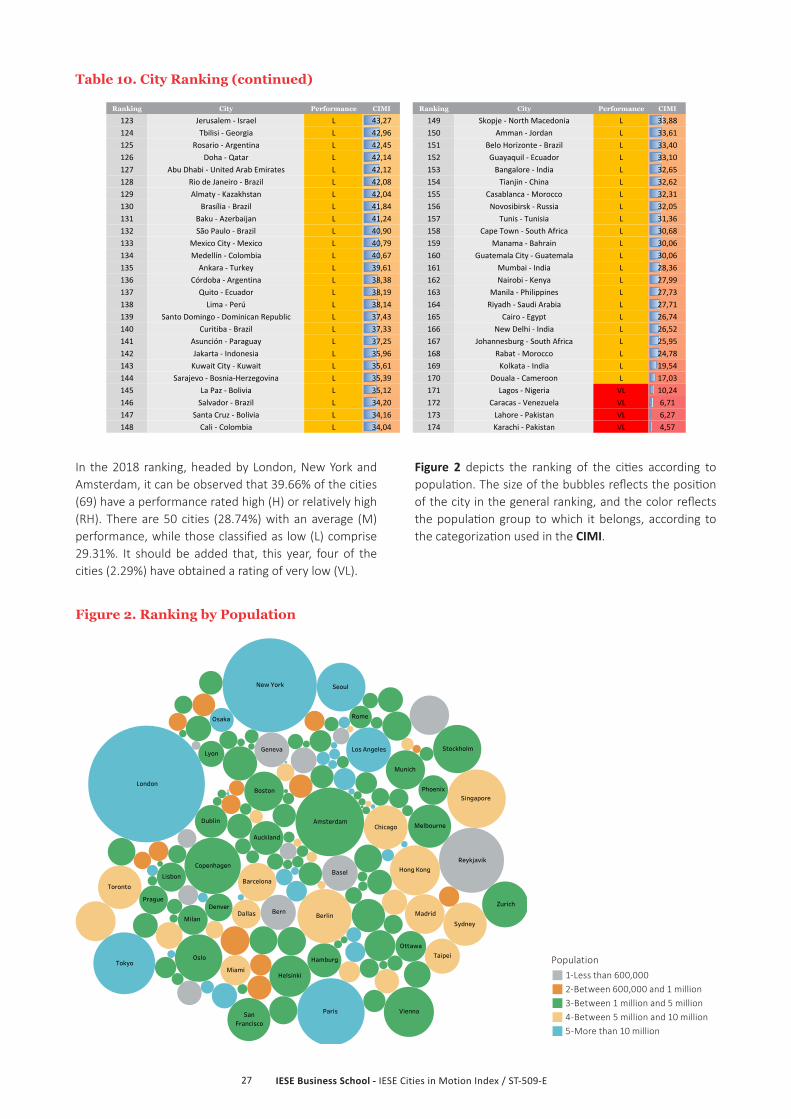
IESE Business School - IESE Cities in Motion Index / ST-509-E27
Ranking City Performance CIMI Ranking City Performance CIMI
123 Jerusalem ‐ Israel L 43,27 149 Skopje ‐ North Macedonia L 33,88124 Tbilisi ‐ Georgia L 42,96 150 Amman ‐ Jordan L 33,61125 Rosario ‐ Argentina L 42,45 151 Belo Horizonte ‐ Brazil L 33,40126 Doha ‐ Qatar L 42,14 152 Guayaquil ‐ Ecuador L 33,10127 Abu Dhabi ‐ United Arab Emirates L 42,12 153 Bangalore ‐ India L 32,65128 Rio de Janeiro ‐ Brazil L 42,08 154 Tianjin ‐ China L 32,62129 Almaty ‐ Kazakhstan L 42,04 155 Casablanca ‐ Morocco L 32,31130 Brasília ‐ Brazil L 41,84 156 Novosibirsk ‐ Russia L 32,05131 Baku ‐ Azerbaijan L 41,24 157 Tunis ‐ Tunisia L 31,36132 São Paulo ‐ Brazil L 40,90 158 Cape Town ‐ South Africa L 30,68133 Mexico City ‐ Mexico L 40,79 159 Manama ‐ Bahrain L 30,06134 Medellín ‐ Colombia L 40,67 160 Guatemala City ‐ Guatemala L 30,06135 Ankara ‐ Turkey L 39,61 161 Mumbai ‐ India L 28,36136 Córdoba ‐ Argentina L 38,38 162 Nairobi ‐ Kenya L 27,99137 Quito ‐ Ecuador L 38,19 163 Manila ‐ Philippines L 27,73138 Lima ‐ Perú L 38,14 164 Riyadh ‐ Saudi Arabia L 27,71139 Santo Domingo ‐ Dominican Republic L 37,43 165 Cairo ‐ Egypt L 26,74140 Curitiba ‐ Brazil L 37,33 166 New Delhi ‐ India L 26,52141 Asunción ‐ Paraguay L 37,25 167 Johannesburg ‐ South Africa L 25,95142 Jakarta ‐ Indonesia L 35,96 168 Rabat ‐ Morocco L 24,78143 Kuwait City ‐ Kuwait L 35,61 169 Kolkata ‐ India L 19,54144 Sarajevo ‐ Bosnia‐Herzegovina L 35,39 170 Douala ‐ Cameroon L 17,03145 La Paz ‐ Bolivia L 35,12 171 Lagos ‐ Nigeria VL 10,24146 Salvador ‐ Brazil L 34,20 172 Caracas ‐ Venezuela VL 6,71147 Santa Cruz ‐ Bolivia L 34,16 173 Lahore ‐ Pakistan VL 6,27148 Cali ‐ Colombia L 34,04 174 Karachi ‐ Pakistan VL 4,57
In the 2018 ranking, headed by London, New York and Amsterdam, it can be observed that 39.66% of the cities (69) have a performance rated high (H) or relatively high (RH). There are 50 cities (28.74%) with an average (M) performance, while those classified as low (L) comprise 29.31%. It should be added that, this year, four of the cities (2.29%) have obtained a rating of very low (VL).
Figure 2 depicts the ranking of the cities according to population. The size of the bubbles reflects the position of the city in the general ranking, and the color reflects the population group to which it belongs, according to the categorization used in the CIMI.
Figure 2. Ranking by Population
Table 10. City Ranking (continued)
Zurich
Vienna
Toronto
TokyoTaipei
Sydney
Stockholm
Singapore
Seoul
SanFrancisco
Rome
Reykjavik
Prague
Phoenix
Paris
Ottawa
Oslo
Osaka
New York
Munich
Milan
Miami
Melbourne
Madrid
Lyon Los Angeles
London
LisbonHong Kong
Helsinki
Hamburg
Geneva
Dublin
DenverDallas
Copenhagen
Chicago
Boston
Bern Berlin
BaselBarcelona
Auckland
Amsterdam
Población1-Less than 600,0002-Between 600,000 mil and 1,000,0003-Between 1 million and 5 millions4-Between 5 and 10 millions5-More than 10 millions
Population1-Less than 600,0002-Between 600,000 and 1 million3-Between 1 million and 5 million4-Between 5 million and 10 million5-More than 10 million

IESE Business School - IESE Cities in Motion Index / ST-509-E28
Cities in Motion: Ranking by Dimension
This section sets out the ranking according to each of the dimensions that make up the index, together with the city’s position overall and in each dimension. To make the visual layout more intuitive, the darker greens correspond to the top positions in the CIMI ranking, and the darker reds to the worst-ranked cities, while yellow shades reflect the intermediate positions.
Year after year, the top place in the ranking seems to be disputed by London (United Kingdom) and New York (United States), two highly developed and smart cities. This year it has been London’s turn to occupy the top position in the overall ranking, thanks to its performance in the dimensions of international outreach (position 1), human capital (position 1), mobility and transportation (position 3) and the economy (position 12). However, the city does not show such a good performance in the dimensions of social cohesion (position 45) and the environment (position 34). It should be made clear that, although the city is not in a prominent position in these dimensions, each year it shows an improvement, consistent with the work being done to turn it into a smart city in every way.
New York is in second place in the overall ranking, thanks to its performance in the dimensions of the economy (position 1), human capital (position 3), urban planning (position 2) and mobility and transportation (position 5). As in previous years, it shows a worse performance in social cohesion (position 137) and the environment (position 78) and, although it has made some improvement in the latter with respect to the previous year, it has not achieved an outstanding position.
The city of Amsterdam (Netherlands) ranks third, having improved a lot in international outreach (position 2) and also standing out in the economy, urban planning, and mobility and transportation.
Table 11 shows the rankings, both overall and by dimension, for the 174 cities included in the index. The interpretation of the table is very important for the analysis of the results, since it allows the relative position of all the cities in each dimension to be known. In Figure 3, the positions of the cities on the world map can also be seen.
Zurich
Zagreb
Wroclaw
Wellington
Washington
Warsaw
Vilnius
Vienna
Vancouver
Valencia
Turin
Tunis
Toronto
Tokyo
Tianjin Tel Aviv
Tbilisi
Tallinn
Taipei
Sydney
Stuttgart
Stockholm
Sofia
Skopje
Singapore
Shenzhen
Shanghai
Seville
Seoul
Seattle
SarajevoSaragossa
Sao Paulo
Santo DomingoSantiago
Santa Cruz
San Jose
San FranciscoSan Diego
San Antonio
SalvadorSaint Petersburg
Rotterdam
RosarioRome
Riyadh
Rio de Janeiro
Riga
Reykjavik
Rabat
Quito
Quebec
Prague
Porto
Phoenix
Philadelphia
ParisPanama
Palma de Mallorca
Ottawa
Oslo
Osaka
Novosibirsk
Nottingham
Nice
New York
Naples
Nairobi
Nagoya
Murcia
Munich
Mumbai
Moscow
MontrealMontevideo
Minsk
Milan
Miami
Mexico City
Melbourne
Medellin
Marseille
Manila
Manchester
Manama
Malaga
Madrid
Lyon
Los Angeles
LondonLjubljana
Liverpool
Lisbon
Linz
Lima
LilleLeeds
Lahore
Lagos
La PazKuwait CityKuala Lumpur
Kolkata
Kiev
Karachi
Johannesburg
Jerusalem
JakartaIstanbul
Houston
Hong Kong
Ho Chi Minh City
Helsinki
Hamburg
GuayaquilGuatemala City
Guangzhou
Gothenburg
GlasgowGeneva
Frankfurt
Florence
Eindhoven
Edinburgh
Dusseldorf
Duisburg
DublinDubai
Douala
Doha
Denver
Delhi
Dallas
Curitiba
Cordoba
Copenhagen Cologne
Chicago
Casablanca
Caracas
Cape Town
Cali
Cairo
Buenos Aires
Budapest
Bucharest
Brussels
Bratislava
Brasilia
Boston
Bogota
Birmingham
Bilbao
Bern
Berlin
Belo Horizonte
Belgrade
Beijing
Basel
BarcelonaBangkok
Bangalore
Baltimore
Baku
Auckland
Athens
Asuncion
Antwerp
Ankara Amsterdam
Amman
Almaty
Abu Dhabi
A Coruña

IESE
Bus
ines
s Sc
hool
- IE
SE C
ities
in M
otio
n In
dex
/ ST
-509
-E29
Tab
le 1
1. R
anki
ng
by D
imen
sion
Cit
yE
con
omy
Hu
man
ca
pit
alS
ocia
l co
hes
ion
E
nvi
ron
men
tG
over
nan
ceU
rban
pla
nn
ing
Inte
rnat
ion
al
outr
each
Tec
hn
olog
yM
obil
ity
and
tr
ansp
orta
tion
Cit
ies
in
Mot
ion
Lond
on ‐ United King
dom
121
4534
79
18
31
New
York ‐ U
SA1
313
778
262
811
52
Amsterda
m ‐ Nethe
rland
s10
3638
2827
112
711
3
Paris ‐ Fran
ce8
686
5437
503
154
4
Reykjavík ‐ Iceland
9053
181
1910
822
446
5
Tokyo ‐ Jap
an3
949
671
2435
2029
6
Sing
apore ‐ S
ingapo
re21
4447
1020
314
167
7
Cope
nhagen
‐ De
nmark
2528
113
1275
1610
258
Berlin ‐ G
erman
y50
539
476
405
326
9
Vien
na ‐ Au
stria
5723
3115
2545
713
710
Hong
Kon
g ‐ C
hina
2917
140
2021
815
240
11
Seou
l ‐ Sou
th Korea
1514
9532
3927
346
1712
Stockh
olm ‐ Sw
eden
1858
605
2448
2414
2113
Oslo
‐ Norway
1771
208
5254
1917
2014
Zuric
h ‐ S
witzerland
2235
125
968
2125
5515
Los A
ngeles ‐ USA
22
8215
25
1433
2113
416
Chicago ‐ U
SA7
1010
413
041
518
3538
17
Toronto ‐ C
anad
a40
3076
5317
127
1658
18
Sydn
ey ‐ Au
stralia
2829
2218
2223
1026
109
19
Melbo
urne
‐ Au
stralia
3433
2331
415
640
111
20
San Fran
cisco ‐ U
SA4
1179
122
6413
363
100
21
Helsink
i ‐ Finland
3255
1012
864
3966
4722
Washing
ton ‐ U
SA5
871
141
1310
4031
9223
Mad
rid ‐ Sp
ain
3941
5558
4633
1734
924
Boston
‐ USA
94
8411
515
2169
1913
125
Wellin
gton
‐ New
Zea
land
3168
62
1441
7979
7026
Mun
ich ‐ G
erman
y36
6316
6932
5828
388
27
Barcelon
a ‐ S
pain
5146
8951
2929
1124
1228
Basel ‐ Switzerland
3554
436
1113
649
5719
29
Taipei ‐ Taiwan
8320
314
53
1255
2310
30
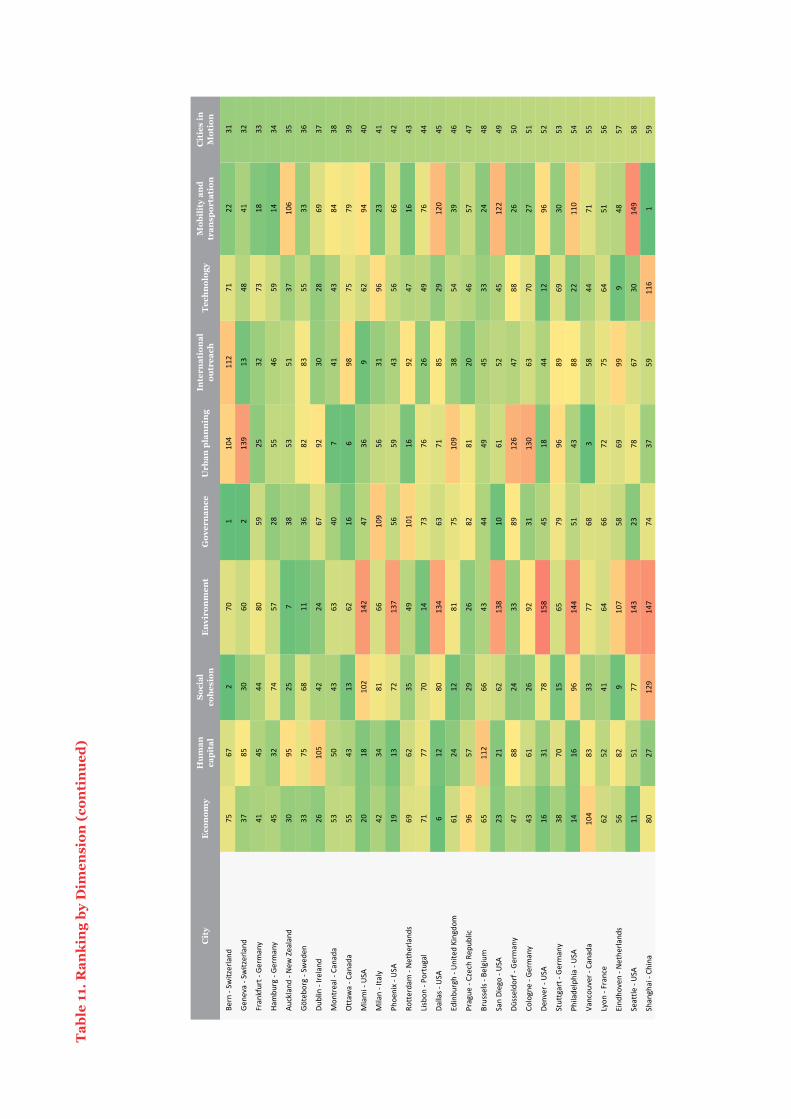
Cit
yE
con
omy
Hu
man
ca
pit
alS
ocia
l co
hes
ion
E
nvi
ron
men
tG
over
nan
ceU
rban
pla
nn
ing
Inte
rnat
ion
al
outr
each
Tec
hn
olog
yM
obil
ity
and
tr
ansp
orta
tion
Cit
ies
in
Mot
ion
Bern ‐ Sw
itzerland
7567
270
110
411
271
2231
Gene
va ‐ Sw
itzerland
3785
3060
213
913
4841
32
Fran
kfurt ‐ German
y41
4544
8059
2532
7318
33
Hambu
rg ‐ Ge
rman
y45
3274
5728
5546
5914
34
Auckland
‐ New
Zea
land
3095
257
3853
5137
106
35
Götebo
rg ‐ Sw
eden
3375
6811
3682
8355
3336
Dublin ‐ Ire
land
2610
542
2467
9230
2869
37
Mon
trea
l ‐ Can
ada
5350
4363
407
4143
8438
Ottaw
a ‐ C
anad
a55
4313
6216
698
7579
39
Miami ‐ USA
2018
102
142
4736
962
9440
Milan ‐ Italy
4234
8166
109
5631
9623
41
Phoe
nix ‐ U
SA19
1372
137
5659
4356
6642
Rotterda
m ‐ Nethe
rland
s69
6235
4910
116
9247
1643
Lisbon
‐ Po
rtug
al71
7770
1473
7626
4976
44
Dallas ‐ USA
612
8013
463
7185
2912
045
Edinbu
rgh ‐ U
nited King
dom
6124
1281
7510
938
5439
46
Prague
‐ Czech Re
public
9657
2926
8281
2046
5747
Brussels ‐ B
elgium
6511
266
4344
4945
3324
48
San Diego ‐ U
SA23
2162
138
1061
5245
122
49
Düsseldo
rf ‐ Ge
rman
y47
8824
3389
126
4788
2650
Cologn
e ‐ G
erman
y43
6126
9231
130
6370
2751
Denv
er ‐ USA
1631
7815
845
1844
1296
52
Stuttgart ‐ German
y38
7015
6579
9689
6930
53
Philade
lphia ‐ U
SA14
1696
144
5143
8822
110
54
Vancou
ver ‐ Can
ada
104
8333
7768
358
4471
55
Lyon
‐ Fran
ce62
5241
6466
7275
6451
56
Eind
hoven ‐ N
ethe
rland
s56
829
107
5869
999
4857
Seattle
‐ USA
1151
7714
323
7867
3014
958
Shan
ghai ‐ Ch
ina
8027
129
147
7437
5911
61
59
Tab
le 1
1. R
anki
ng
by D
imen
sion
(co
nti
nu
ed)
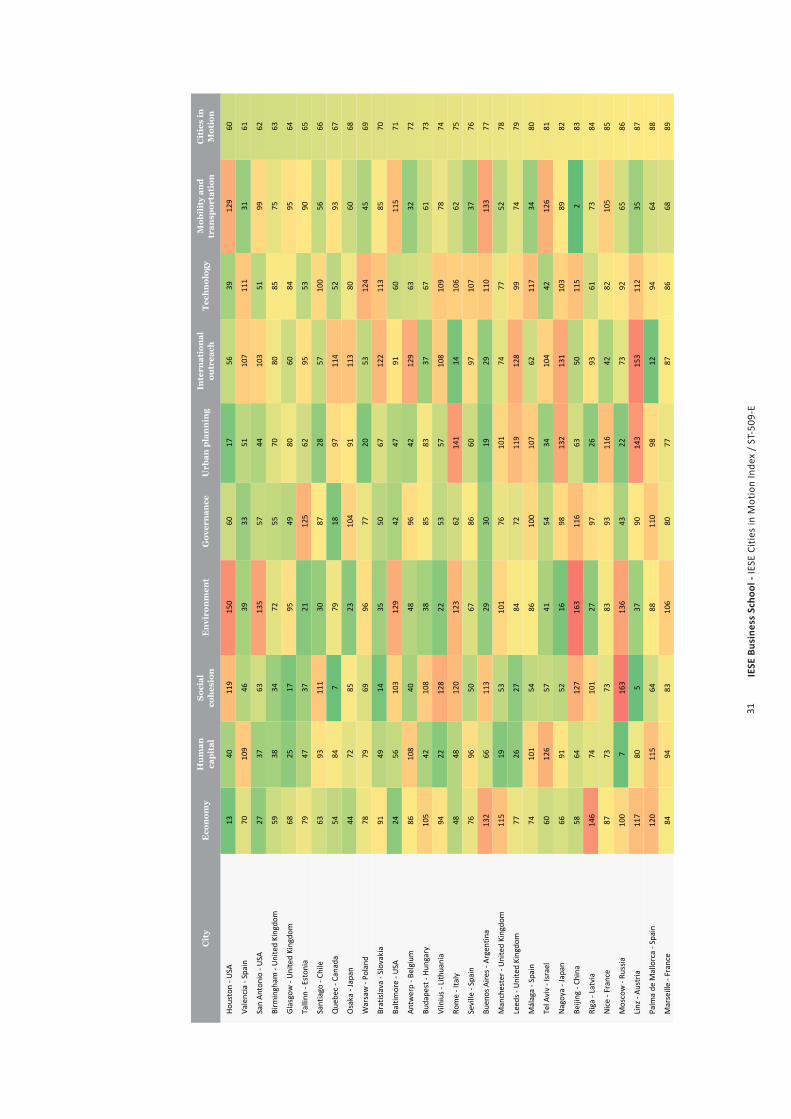
IESE
Bus
ines
s Sc
hool
- IE
SE C
ities
in M
otio
n In
dex
/ ST
-509
-E31
Cit
yE
con
omy
Hu
man
ca
pit
alS
ocia
l co
hes
ion
E
nvi
ron
men
tG
over
nan
ceU
rban
pla
nn
ing
Inte
rnat
ion
al
outr
each
Tec
hn
olog
yM
obil
ity
and
tr
ansp
orta
tion
Cit
ies
in
Mot
ion
Houston ‐ U
SA13
4011
915
060
1756
3912
960
Valencia ‐ Sp
ain
7010
946
3933
5110
711
131
61
San An
tonio ‐ U
SA27
3763
135
5744
103
5199
62
Birm
ingh
am ‐ United King
dom
5938
3472
5570
8085
7563
Glasgo
w ‐ United King
dom
6825
1795
4980
6084
9564
Tallinn
‐ Estonia
7947
3721
125
6295
5390
65
Santiago
‐ Ch
ile63
9311
130
8728
5710
056
66
Que
bec ‐ C
anad
a54
847
7918
9711
452
9367
Osaka ‐ Japa
n44
7285
2310
491
113
8060
68
Warsaw ‐ Po
land
7879
6996
7720
5312
445
69
Bratislava ‐ S
lovakia
9149
1435
5067
122
113
8570
Baltimore ‐ U
SA24
5610
312
942
4791
6011
571
Antw
erp ‐ B
elgium
8610
840
4896
4212
963
3272
Buda
pest ‐ Hu
ngary
105
4210
838
8583
3767
6173
Vilnius ‐ Lith
uania
9422
128
2253
5710
810
978
74
Rome ‐ Italy
4848
120
123
6214
114
106
6275
Seville ‐ Sp
ain
7696
5067
8660
9710
737
76
Buen
os Aire
s ‐ Argen
tina
132
6611
329
3019
2911
013
377
Man
chester ‐ United King
dom
115
1953
101
7610
174
7752
78
Leed
s ‐ United King
dom
7726
2784
7211
912
899
7479
Málaga ‐ S
pain
7410
154
8610
010
762
117
3480
Tel A
viv ‐ Israe
l60
126
5741
5434
104
4212
681
Nagoy
a ‐ Jap
an66
9152
1698
132
131
103
8982
Beijing
‐ Ch
ina
5864
127
163
116
6350
115
283
Riga ‐ Latvia
146
7410
127
9726
9361
7384
Nice ‐ F
rance
8773
7383
9311
642
8210
585
Moscow ‐ Ru
ssia
100
716
313
643
2273
9265
86
Linz ‐ Au
stria
117
805
3790
143
153
112
3587
Palm
a de
Mallorca ‐ S
pain
120
115
6488
110
9812
9464
88
Marseille ‐ F
rance
8494
8310
680
7787
8668
89

Tab
le 1
1. R
anki
ng
by D
imen
sion
(co
nti
nu
ed)
Cit
yE
con
omy
Hu
man
ca
pit
alS
ocia
l co
hes
ion
E
nvi
ron
men
tG
over
nan
ceU
rban
pla
nn
ing
Inte
rnat
ion
al
outr
each
Tec
hn
olog
yM
obil
ity
and
tr
ansp
orta
tion
Cit
ies
in
Mot
ion
Duisb
urg ‐ G
erman
y12
692
2110
510
213
566
108
2890
Porto ‐ P
ortugal
8512
556
1992
138
8689
103
91
Mon
tevide
o ‐ U
rugu
ay10
613
110
64
6984
110
6511
892
Ljub
ljana
‐ Slov
enia
136
100
3245
9193
134
3672
93
Liverpoo
l ‐ United King
dom
110
6519
109
7810
312
793
101
94
Wroclaw
‐ Po
land
9289
9298
112
4613
512
849
95
Nottin
gham
‐ United King
dom
8169
2811
781
124
147
9010
496
Zagreb
‐ Croa
tia13
511
061
4635
8613
078
9897
Lille ‐ Fran
ce88
9759
9911
711
113
795
5398
Duba
i ‐ United Arab
Emira
tes
6414
536
159
7090
255
117
99
Kuala Lumpu
r ‐ M
alaysia
4911
610
911
312
694
6413
059
100
Zarago
za ‐ Sp
ain
122
8175
9383
102
149
9842
101
A Co
ruña
‐ Sp
ain
128
9867
5913
573
150
101
4410
2
Bucharest ‐ Rom
ania
7210
297
104
122
8878
8112
710
3
Bang
kok ‐ T
hailand
4613
312
312
515
030
2312
714
010
4
Murcia ‐ S
pain
125
111
4897
108
6516
374
5010
5
Athe
ns ‐ Gr
eece
114
7815
552
143
133
6127
8010
6
Bilbao
‐ Sp
ain
118
117
8891
107
8912
587
6310
7
Floren
ce ‐ Ita
ly12
159
9012
812
714
768
121
5410
8
Turin
‐ Ita
ly11
187
9813
310
513
110
113
136
109
Minsk ‐ Be
larus
113
9010
561
132
113
146
118
7711
0
Kiev ‐ Ukraine
107
103
158
120
114
412
311
910
811
1
San José ‐ Co
sta Rica
9715
811
213
6114
610
010
513
811
2
Guan
gzho
u ‐ C
hina
8212
811
715
414
510
590
132
1311
3
Pana
ma ‐ P
anam
a11
914
611
042
147
9981
5012
511
4
Sofia
‐ Bu
lgaria
164
7687
9088
149
115
9782
115
Nap
les ‐ Italy
127
9999
112
141
115
111
136
8111
6
Bogo
tá ‐ Co
lombia
124
106
159
8934
112
7612
514
811
7
Istanb
ul ‐ Tu
rkey
6712
416
513
215
166
4876
112
118
Shen
zhen
‐ Ch
ina
7313
713
615
315
810
012
613
315
119

IESE
Bus
ines
s Sc
hool
- IE
SE C
ities
in M
otio
n In
dex
/ ST
-509
-E33
Cit
yE
con
omy
Hu
man
ca
pit
alS
ocia
l co
hes
ion
E
nvi
ron
men
tG
over
nan
ceU
rban
pla
nn
ing
Inte
rnat
ion
al
outr
each
Tec
hn
olog
yM
obil
ity
and
tr
ansp
orta
tion
Cit
ies
in
Mot
ion
Belgrade
‐ Serbia
161
107
132
5612
812
196
6812
112
0
Saint P
etersburg ‐ R
ussia
145
3915
315
599
5277
120
135
121
Ho Chi M
inh City ‐ Vietna
m98
154
124
7315
611
494
153
8312
2
Jerusalem ‐ Israel
150
136
150
5548
148
6513
413
912
3
Tbilisi ‐ G
eorgia
102
139
122
100
129
140
132
7214
112
4
Rosario
‐ Argentina
171
118
5187
103
3213
814
414
212
5
Doha
‐ Qatar
5216
858
166
149
129
8418
128
126
Abu Dh
abi ‐ United Arab
Emira
tes
116
157
816
984
118
5483
9712
7
Rio de
Jane
iro ‐ Brazil
149
114
168
110
9538
7212
915
412
8
Almaty ‐ K
azakhstan
123
127
138
108
153
7416
714
087
129
Brasília ‐ B
razil
144
151
151
8510
610
611
813
988
130
Baku
‐ Azerba
ijan
137
123
100
7516
413
714
312
211
913
1
São Pa
ulo ‐ B
razil
138
129
167
102
123
3970
123
168
132
Mexico City ‐ Mexico
131
6014
116
811
135
7113
511
613
3
Med
ellín
‐ Co
lombia
140
132
143
114
113
8715
514
310
713
4
Ankara ‐ Tu
rkey
162
113
115
139
131
9514
213
886
135
Córdob
a ‐ A
rgen
tina
170
120
9374
119
123
148
151
146
136
Quito ‐ Ecua
dor
139
130
130
8216
912
211
615
714
313
7
Lima ‐ P
eru
101
122
139
140
115
142
136
147
152
138
Santo Do
mingo
‐ Do
minican
Rep
ublic
134
166
149
4413
712
013
315
915
813
9
Curitiba ‐ B
razil
153
149
145
7113
812
815
214
512
414
0
Asun
ción
‐ Pa
ragu
ay16
811
994
916
015
916
216
513
714
1
Jakarta ‐ Ind
onesia
160
1515
212
713
915
110
214
217
414
2
Kuwait C
ity ‐ Ku
wait
163
161
9114
612
416
111
741
123
143
Sarajevo
‐ Bo
snia‐Herzego
vina
173
8616
012
413
385
158
146
102
144
La Paz ‐ Bo
livia
152
155
131
6814
214
412
016
915
614
5
Salvad
or ‐ Brazil
157
135
162
103
148
110
139
161
144
146
Santa Cruz ‐ Bo
livia
148
147
135
1716
716
714
016
815
714
7
Cali ‐ C
olom
bia
143
140
114
118
146
155
170
155
151
148
Skop
je ‐ North M
aced
onia
169
150
142
119
121
162
154
102
113
149

Cit
yE
con
omy
Hu
man
ca
pit
alS
ocia
l co
hes
ion
E
nvi
ron
men
tG
over
nan
ceU
rban
pla
nn
ing
Inte
rnat
ion
al
outr
each
Tec
hn
olog
yM
obil
ity
and
tr
ansp
orta
tion
Cit
ies
in
Mot
ion
Amman
‐ Jordan
154
173
126
121
118
153
141
114
169
150
Belo Horizo
nte ‐ B
razil
156
141
154
116
154
127
160
148
159
151
Guayaq
uil ‐ Ecuad
or14
215
310
711
117
315
215
616
215
015
2
Bang
alore ‐ Ind
ia93
134
116
165
140
156
106
154
166
153
Tian
jin ‐ Ch
ina
8913
812
517
216
113
416
113
743
154
Casablan
ca ‐ Morocco
9916
513
415
617
015
415
158
160
155
Nov
osibirsk ‐ R
ussia
147
121
147
157
120
117
165
149
163
156
Tunis ‐ Tun
isia
166
152
118
7613
615
816
816
314
515
7
Cape
Tow
n ‐ S
outh Africa
165
142
169
131
9414
510
915
216
115
8
Man
ama ‐ B
ahrain
129
156
6516
716
617
211
991
9115
9
Guatem
ala City ‐ Gu
atem
ala
141
164
144
126
134
163
144
166
165
160
Mum
bai ‐ In
dia
103
162
148
164
155
157
121
150
164
161
Nairobi ‐ Ke
nya
130
170
166
4015
216
914
517
117
316
2
Man
ila ‐ Ph
ilipp
ines
133
148
161
149
162
160
105
158
170
163
Riyadh
‐ Saud
i Arabia
108
169
121
173
6516
515
710
413
616
4
Cairo
‐ Egyp
t10
914
417
016
017
212
515
914
116
716
5
New
Delhi ‐ India
9515
915
717
014
416
882
160
114
166
Joha
nnesbu
rg ‐ So
uth Afric
a15
814
317
115
113
015
016
415
615
516
7
Raba
t ‐ M
orocco
167
174
133
148
163
166
169
126
132
168
Kolkata ‐ Ind
ia15
516
015
616
115
716
417
117
017
216
9
Doua
la ‐ Ca
meroo
n17
216
314
650
171
173
172
174
162
170
Lago
s ‐ Nigeria
159
167
164
162
165
170
173
173
171
171
Caracas ‐ Ven
ezue
la17
410
417
494
159
7912
416
413
017
2
Laho
re ‐ Pa
kistan
151
172
173
171
168
174
166
172
147
173
Karachi ‐ Pakistan
112
171
172
174
174
171
174
167
153
174
Tab
le 1
1. R
anki
ng
by D
imen
sion
(co
nti
nu
ed)
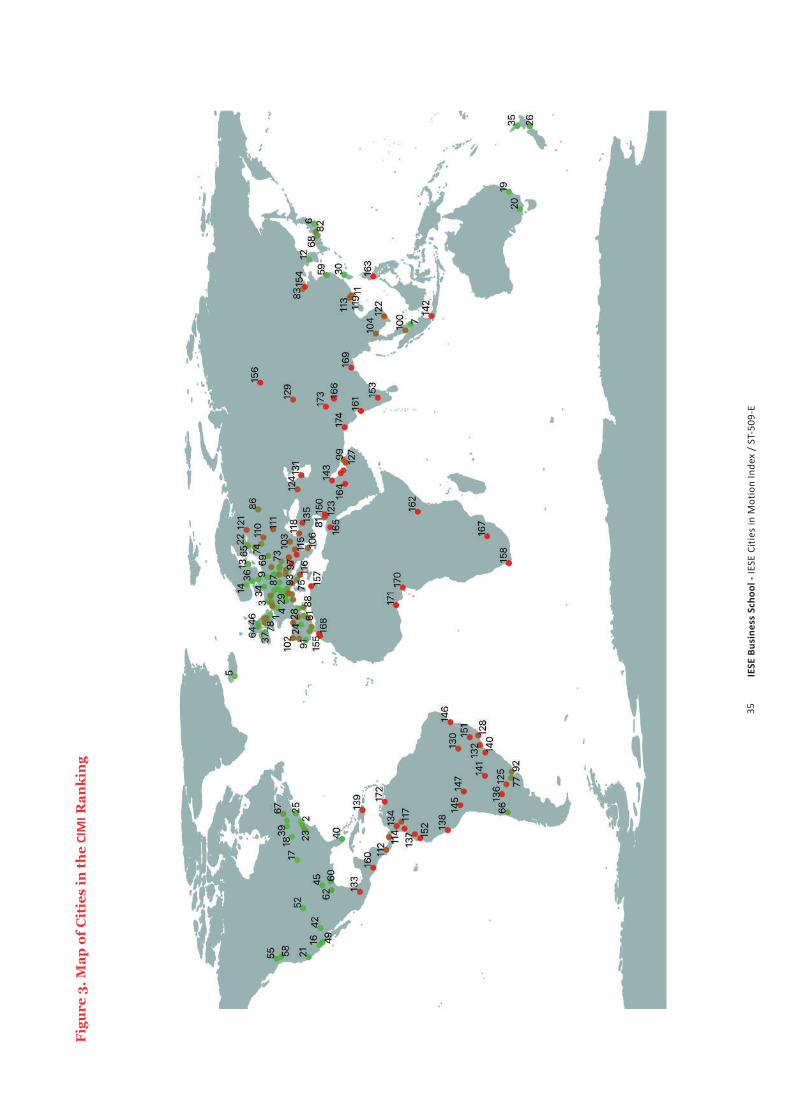
IESE
Bus
ines
s Sc
hool
- IE
SE C
ities
in M
otio
n In
dex
/ ST
-509
-E35
Fig
ure
3. M
ap o
f C
itie
s in
th
e CI
MI R
anki
ng
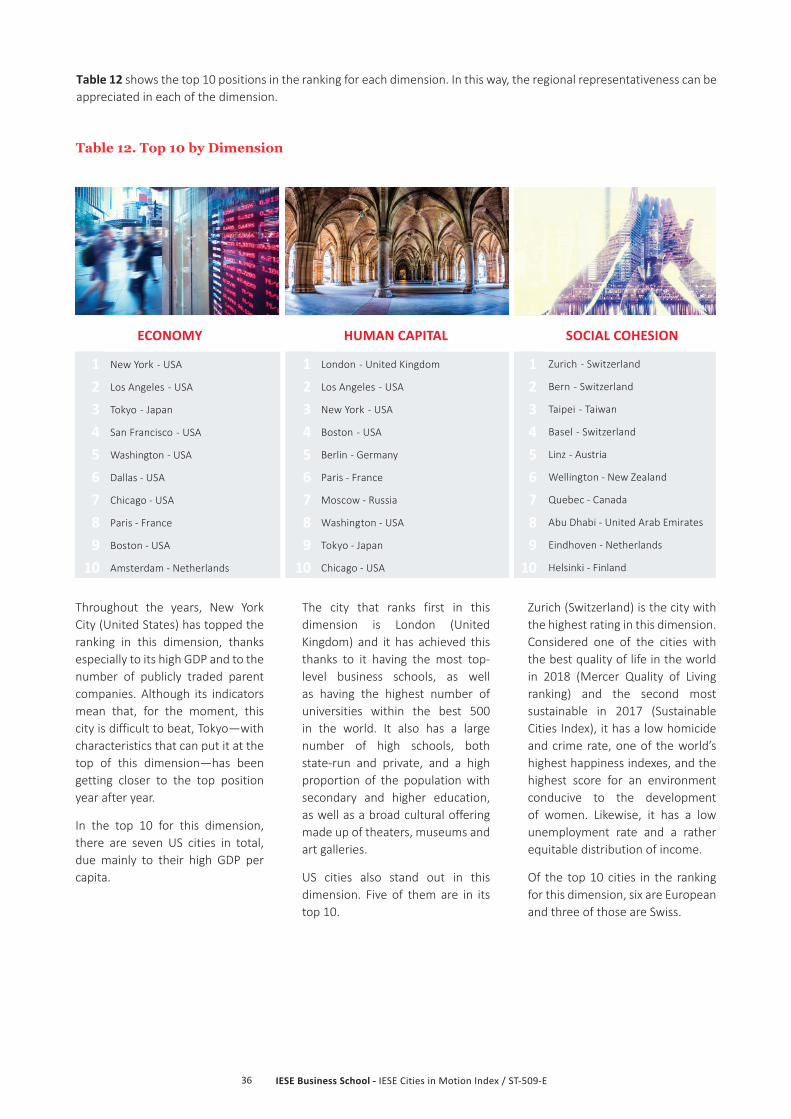
IESE Business School - IESE Cities in Motion Index / ST-509-E36
Table 12. Top 10 by Dimension
Table 12 shows the top 10 positions in the ranking for each dimension. In this way, the regional representativeness can be appreciated in each of the dimension.
Throughout the years, New York City (United States) has topped the ranking in this dimension, thanks especially to its high GDP and to the number of publicly traded parent companies. Although its indicators mean that, for the moment, this city is difficult to beat, Tokyo—with characteristics that can put it at the top of this dimension—has been getting closer to the top position year after year.
In the top 10 for this dimension, there are seven US cities in total, due mainly to their high GDP per capita.
The city that ranks first in this dimension is London (United Kingdom) and it has achieved this thanks to it having the most top-level business schools, as well as having the highest number of universities within the best 500 in the world. It also has a large number of high schools, both state-run and private, and a high proportion of the population with secondary and higher education, as well as a broad cultural offering made up of theaters, museums and art galleries.
US cities also stand out in this dimension. Five of them are in its top 10.
Zurich (Switzerland) is the city with the highest rating in this dimension. Considered one of the cities with the best quality of life in the world in 2018 (Mercer Quality of Living ranking) and the second most sustainable in 2017 (Sustainable Cities Index), it has a low homicide and crime rate, one of the world’s highest happiness indexes, and the highest score for an environment conducive to the development of women. Likewise, it has a low unemployment rate and a rather equitable distribution of income.
Of the top 10 cities in the ranking for this dimension, six are European and three of those are Swiss.
New York - USA
Los Angeles - USA
Tokyo - Japan
San Francisco - USA
Washington - USA
Dallas - USA
Chicago - USA
Paris - France
Boston - USA
Amsterdam - Netherlands
London - United Kingdom
Los Angeles - USA
New York - USA
Boston - USA
Berlin - Germany
Paris - France
Moscow - Russia
Washington - USA
Tokyo - Japan
Chicago - USA
Zurich - Switzerland
Bern - Switzerland
Taipei - Taiwan
Basel - Switzerland
Linz - Austria
Wellington - New Zealand
Quebec - Canada
Abu Dhabi - United Arab Emirates
Eindhoven - Netherlands
Helsinki - Finland
123456789
10
123456789
10
123456789
10
ECONOMY HUMAN CAPITAL SOCIAL COHESION
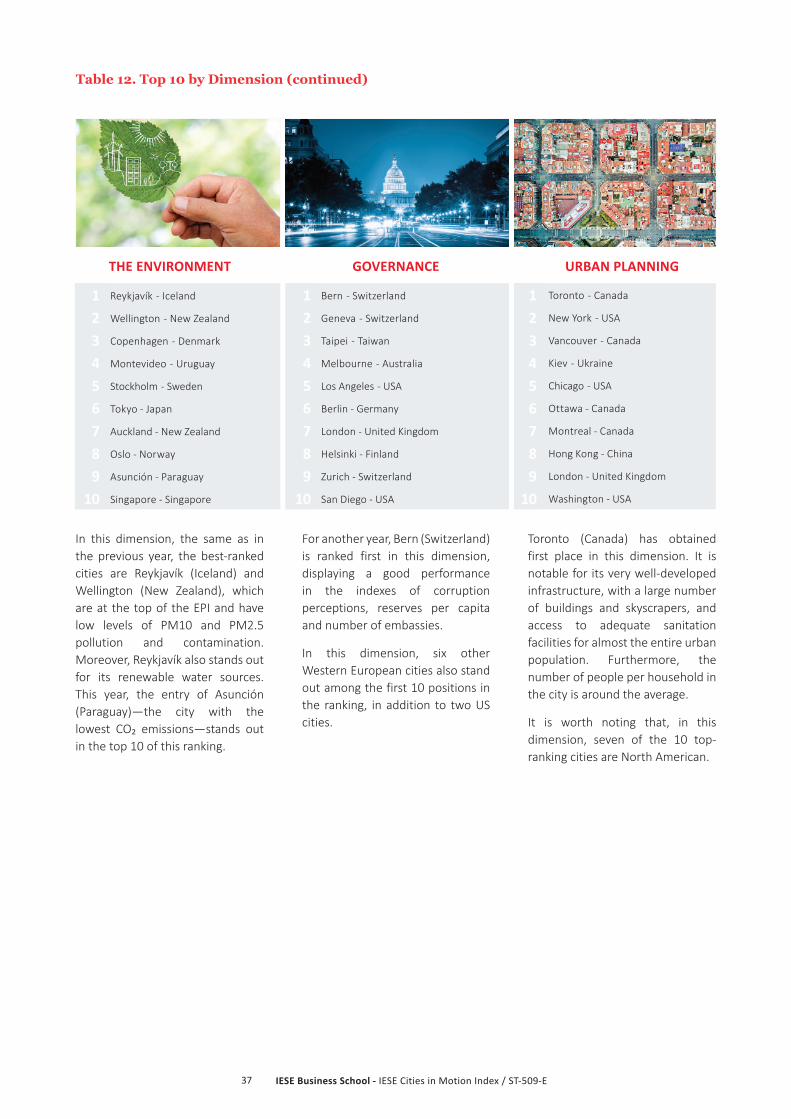
IESE Business School - IESE Cities in Motion Index / ST-509-E37
Table 12. Top 10 by Dimension (continued)
In this dimension, the same as in the previous year, the best-ranked cities are Reykjavík (Iceland) and Wellington (New Zealand), which are at the top of the EPI and have low levels of PM10 and PM2.5 pollution and contamination. Moreover, Reykjavík also stands out for its renewable water sources. This year, the entry of Asunción (Paraguay)—the city with the lowest CO₂ emissions—stands out in the top 10 of this ranking.
For another year, Bern (Switzerland) is ranked first in this dimension, displaying a good performance in the indexes of corruption perceptions, reserves per capita and number of embassies.
In this dimension, six other Western European cities also stand out among the first 10 positions in the ranking, in addition to two US cities.
Toronto (Canada) has obtained first place in this dimension. It is notable for its very well-developed infrastructure, with a large number of buildings and skyscrapers, and access to adequate sanitation facilities for almost the entire urban population. Furthermore, the number of people per household in the city is around the average.
It is worth noting that, in this dimension, seven of the 10 top-ranking cities are North American.
Reykjavík - Iceland
Wellington - New Zealand
Copenhagen - Denmark
Montevideo - Uruguay
Stockholm - Sweden
Tokyo - Japan
Auckland - New Zealand
Oslo - Norway
Asunción - Paraguay
Singapore - Singapore
Bern - Switzerland
Geneva - Switzerland
Taipei - Taiwan
Melbourne - Australia
Los Angeles - USA
Berlin - Germany
London - United Kingdom
Helsinki - Finland
Zurich - Switzerland
San Diego - USA
Toronto - Canada
New York - USA
Vancouver - Canada
Kiev - Ukraine
Chicago - USA
Ottawa - Canada
Montreal - Canada
Hong Kong - China
London - United Kingdom
Washington - USA
123456789
10
123456789
10
123456789
10
THE ENVIRONMENT GOVERNANCE URBAN PLANNING
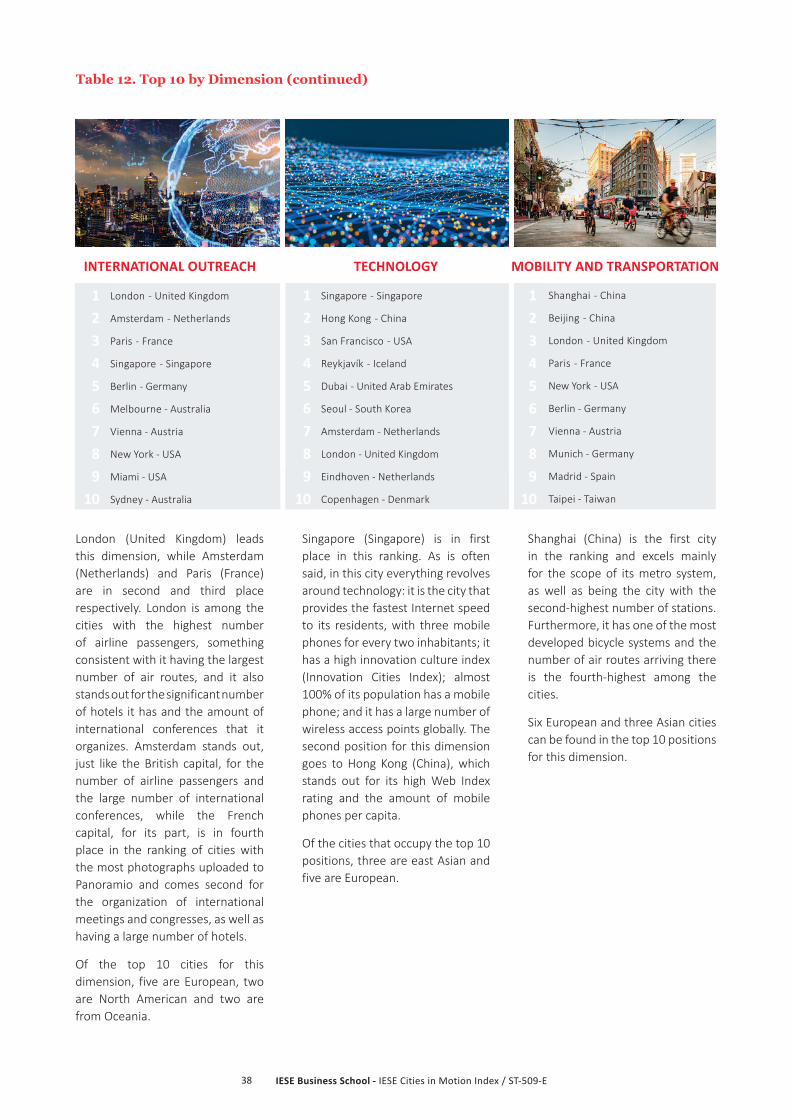
IESE Business School - IESE Cities in Motion Index / ST-509-E38
Table 12. Top 10 by Dimension (continued)
London (United Kingdom) leads this dimension, while Amsterdam (Netherlands) and Paris (France) are in second and third place respectively. London is among the cities with the highest number of airline passengers, something consistent with it having the largest number of air routes, and it also stands out for the significant number of hotels it has and the amount of international conferences that it organizes. Amsterdam stands out, just like the British capital, for the number of airline passengers and the large number of international conferences, while the French capital, for its part, is in fourth place in the ranking of cities with the most photographs uploaded to Panoramio and comes second for the organization of international meetings and congresses, as well as having a large number of hotels.
Of the top 10 cities for this dimension, five are European, two are North American and two are from Oceania.
Singapore (Singapore) is in first place in this ranking. As is often said, in this city everything revolves around technology: it is the city that provides the fastest Internet speed to its residents, with three mobile phones for every two inhabitants; it has a high innovation culture index (Innovation Cities Index); almost 100% of its population has a mobile phone; and it has a large number of wireless access points globally. The second position for this dimension goes to Hong Kong (China), which stands out for its high Web Index rating and the amount of mobile phones per capita.
Of the cities that occupy the top 10 positions, three are east Asian and five are European.
Shanghai (China) is the first city in the ranking and excels mainly for the scope of its metro system, as well as being the city with the second-highest number of stations. Furthermore, it has one of the most developed bicycle systems and the number of air routes arriving there is the fourth-highest among the cities.
Six European and three Asian cities can be found in the top 10 positions for this dimension.
London - United Kingdom
Amsterdam - Netherlands
Paris - France
Singapore - Singapore
Berlin - Germany
Melbourne - Australia
Vienna - Austria
New York - USA
Miami - USA
Sydney - Australia
Singapore - Singapore
Hong Kong - China
San Francisco - USA
Reykjavík - Iceland
Dubai - United Arab Emirates
Seoul - South Korea
Amsterdam - Netherlands
London - United Kingdom
Eindhoven - Netherlands
Copenhagen - Denmark
Shanghai - China
Beijing - China
London - United Kingdom
Paris - France
New York - USA
Berlin - Germany
Vienna - Austria
Munich - Germany
Madrid - Spain
Taipei - Taiwan
123456789
10
123456789
10
123456789
10
INTERNATIONAL OUTREACH TECHNOLOGY MOBILITY AND TRANSPORTATION

IESE Business School - IESE Cities in Motion Index / ST-509-E39
“THE GREAT CHALLENGES THAT CITIES FACE WILL NOT BE SOLVED SIMPLY WITH TECHNOLOGY. ALSO NECESSARY ARE A LONG-TERM VISION, A SINCERE DESIRE TO COLLABORATE, AND A CLEAR FOCUS ON THE NEEDS OF THE PUBLIC”.
Pascual Berrone
“A TRULY SMART CITY IS ONE THAT HAS AS ITS GOAL IMPROVING THE
QUALITY OF LIFE OF ITS RESIDENTS, WHICH MEANS ENSURING ECONOMIC,
SOCIAL AND ENVIRONMENTAL SUSTAINABILITY”.
Joan Enric Ricart
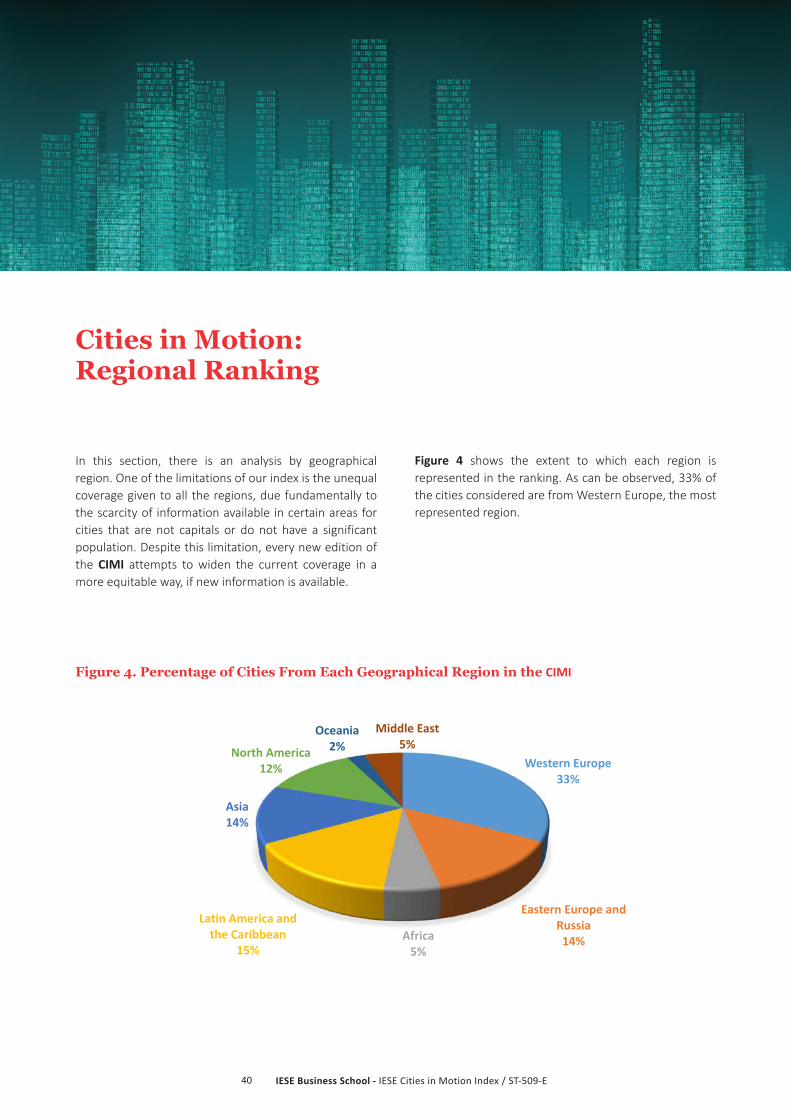
IESE Business School - IESE Cities in Motion Index / ST-509-E40
Cities in Motion: Regional Ranking
In this section, there is an analysis by geographical region. One of the limitations of our index is the unequal coverage given to all the regions, due fundamentally to the scarcity of information available in certain areas for cities that are not capitals or do not have a significant population. Despite this limitation, every new edition of the CIMI attempts to widen the current coverage in a more equitable way, if new information is available.
Figure 4. Percentage of Cities From Each Geographical Region in the CIMI
Western Europe33%
Eastern Europe and Russia14%Africa
5%
Latin America and the Caribbean
15%
Asia14%
North America12%
Oceania2%
Middle East5%
Figure 4 shows the extent to which each region is represented in the ranking. As can be observed, 33% of the cities considered are from Western Europe, the most represented region.
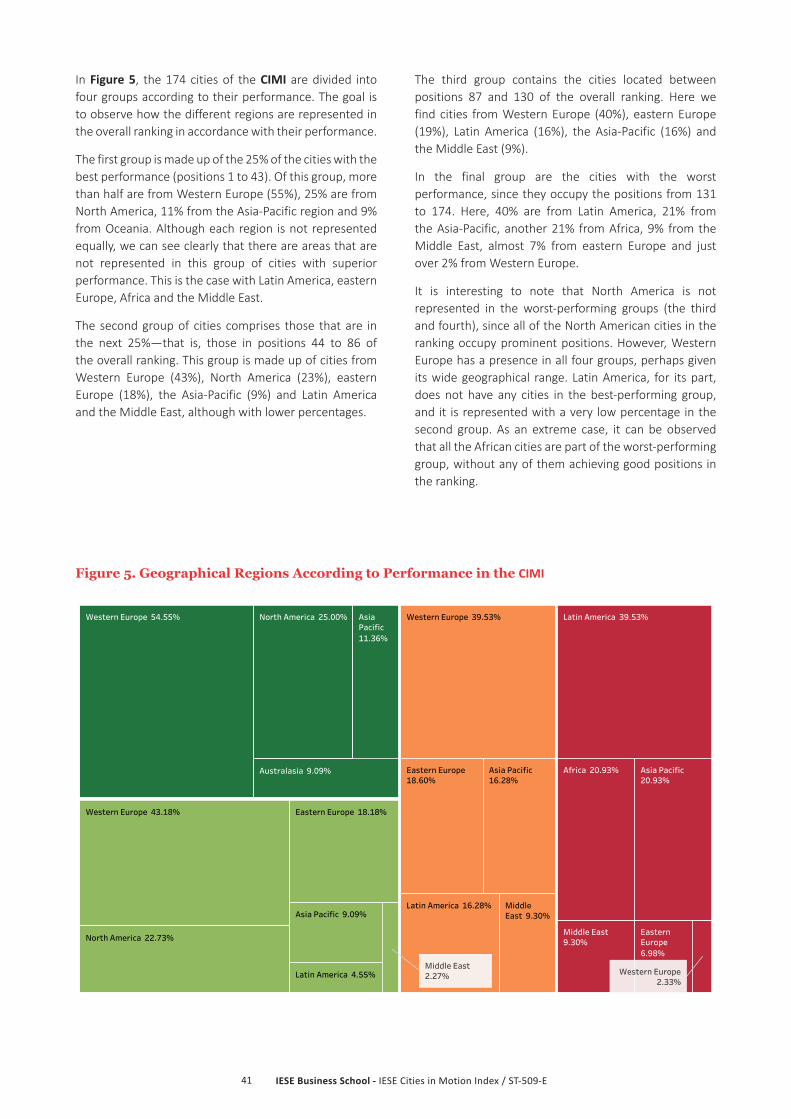
IESE Business School - IESE Cities in Motion Index / ST-509-E41
In Figure 5, the 174 cities of the CIMI are divided into four groups according to their performance. The goal is to observe how the different regions are represented in the overall ranking in accordance with their performance.
The first group is made up of the 25% of the cities with the best performance (positions 1 to 43). Of this group, more than half are from Western Europe (55%), 25% are from North America, 11% from the Asia-Pacific region and 9% from Oceania. Although each region is not represented equally, we can see clearly that there are areas that are not represented in this group of cities with superior performance. This is the case with Latin America, eastern Europe, Africa and the Middle East.
The second group of cities comprises those that are in the next 25%—that is, those in positions 44 to 86 of the overall ranking. This group is made up of cities from Western Europe (43%), North America (23%), eastern Europe (18%), the Asia-Pacific (9%) and Latin America and the Middle East, although with lower percentages.
The third group contains the cities located between positions 87 and 130 of the overall ranking. Here we find cities from Western Europe (40%), eastern Europe (19%), Latin America (16%), the Asia-Pacific (16%) and the Middle East (9%).
In the final group are the cities with the worst performance, since they occupy the positions from 131 to 174. Here, 40% are from Latin America, 21% from the Asia-Pacific, another 21% from Africa, 9% from the Middle East, almost 7% from eastern Europe and just over 2% from Western Europe.
It is interesting to note that North America is not represented in the worst-performing groups (the third and fourth), since all of the North American cities in the ranking occupy prominent positions. However, Western Europe has a presence in all four groups, perhaps given its wide geographical range. Latin America, for its part, does not have any cities in the best-performing group, and it is represented with a very low percentage in the second group. As an extreme case, it can be observed that all the African cities are part of the worst-performing group, without any of them achieving good positions in the ranking.
Figure 5. Geographical Regions According to Performance in the CIMI
Middle East9.30%
Latin America 39.53%
EasternEurope6.98%
Asia Pacific20.93%
Africa 20.93%
Western Europe 39.53%
MiddleEast 9.30%
Latin America 16.28%
Eastern Europe18.60%
Asia Pacific16.28%
Western Europe 43.18%
North America 22.73%
Latin America 4.55%
Eastern Europe 18.18%
Asia Pacific 9.09%
Western Europe 54.55% North America 25.00%
Australasia 9.09%
AsiaPacific11.36%
Middle East2.27% Western Europe
2.33%
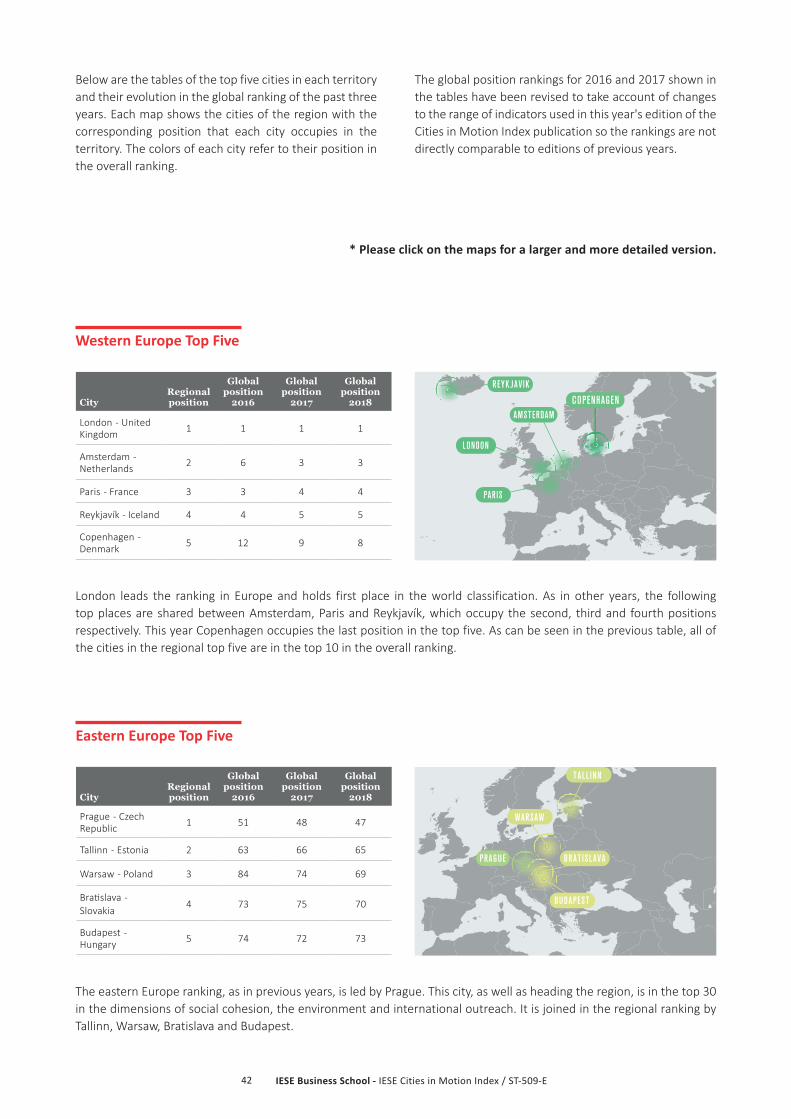
IESE Business School - IESE Cities in Motion Index / ST-509-E42
Western Europe Top Five
London leads the ranking in Europe and holds first place in the world classification. As in other years, the following top places are shared between Amsterdam, Paris and Reykjavík, which occupy the second, third and fourth positions respectively. This year Copenhagen occupies the last position in the top five. As can be seen in the previous table, all of the cities in the regional top five are in the top 10 in the overall ranking.
Below are the tables of the top five cities in each territory and their evolution in the global ranking of the past three years. Each map shows the cities of the region with the corresponding position that each city occupies in the territory. The colors of each city refer to their position in the overall ranking.
Eastern Europe Top Five
The eastern Europe ranking, as in previous years, is led by Prague. This city, as well as heading the region, is in the top 30 in the dimensions of social cohesion, the environment and international outreach. It is joined in the regional ranking by Tallinn, Warsaw, Bratislava and Budapest.
CityRegional position
Global position
2016
Global position
2017
Global position
2018
London - United Kingdom 1 1 1 1
Amsterdam - Netherlands 2 6 3 3
Paris - France 3 3 4 4
Reykjavík - Iceland 4 4 5 5
Copenhagen - Denmark 5 12 9 8
CityRegional position
Global position
2016
Global position
2017
Global position
2018
Prague - Czech Republic 1 51 48 47
Tallinn - Estonia 2 63 66 65
Warsaw - Poland 3 84 74 69
Bratislava - Slovakia
4 73 75 70
Budapest - Hungary 5 74 72 73
REYKJAV IK
LONDON
PARIS
AMSTERDAMCOPENHAGEN
TALL INN
WARSAW
PRAGUE BRATISLAVA
BUDAPEST
The global position rankings for 2016 and 2017 shown in the tables have been revised to take account of changes to the range of indicators used in this year's edition of the Cities in Motion Index publication so the rankings are not directly comparable to editions of previous years.
* Please click on the maps for a larger and more detailed version.
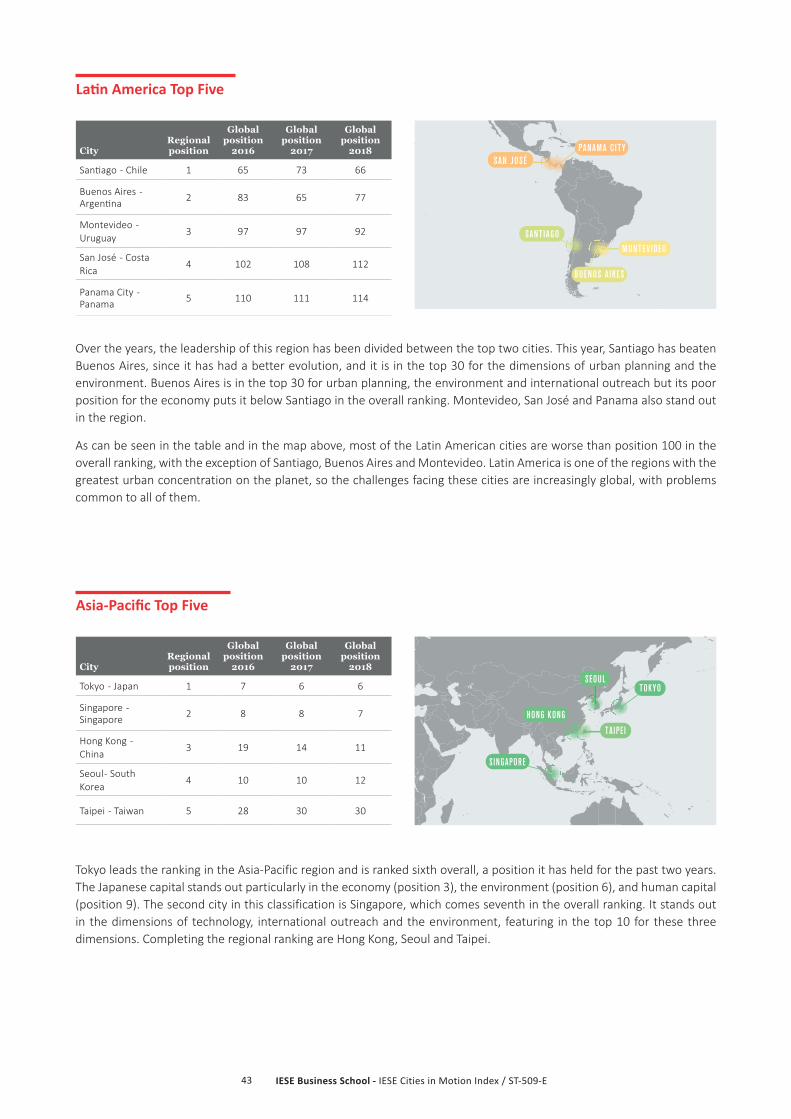
IESE Business School - IESE Cities in Motion Index / ST-509-E43
Latin America Top Five
Over the years, the leadership of this region has been divided between the top two cities. This year, Santiago has beaten Buenos Aires, since it has had a better evolution, and it is in the top 30 for the dimensions of urban planning and the environment. Buenos Aires is in the top 30 for urban planning, the environment and international outreach but its poor position for the economy puts it below Santiago in the overall ranking. Montevideo, San José and Panama also stand out in the region.
As can be seen in the table and in the map above, most of the Latin American cities are worse than position 100 in the overall ranking, with the exception of Santiago, Buenos Aires and Montevideo. Latin America is one of the regions with the greatest urban concentration on the planet, so the challenges facing these cities are increasingly global, with problems common to all of them.
Asia-Pacific Top Five
Tokyo leads the ranking in the Asia-Pacific region and is ranked sixth overall, a position it has held for the past two years. The Japanese capital stands out particularly in the economy (position 3), the environment (position 6), and human capital (position 9). The second city in this classification is Singapore, which comes seventh in the overall ranking. It stands out in the dimensions of technology, international outreach and the environment, featuring in the top 10 for these three dimensions. Completing the regional ranking are Hong Kong, Seoul and Taipei.
MONTEV IDEO
BUENOS A IRES
SAN JOSÉPANAMA C ITY
SANTIAGO
SINGAPORE
HONG KONG
TAIPE I
SEOULTOKYO
CityRegional position
Global position
2016
Global position
2017
Global position
2018
Santiago - Chile 1 65 73 66
Buenos Aires - Argentina 2 83 65 77
Montevideo - Uruguay
3 97 97 92
San José - Costa Rica
4 102 108 112
Panama City - Panama 5 110 111 114
CityRegional position
Global position
2016
Global position
2017
Global position
2018
Tokyo - Japan 1 7 6 6
Singapore - Singapore 2 8 8 7
Hong Kong - China
3 19 14 11
Seoul - South Korea
4 10 10 12
Taipei - Taiwan 5 28 30 30
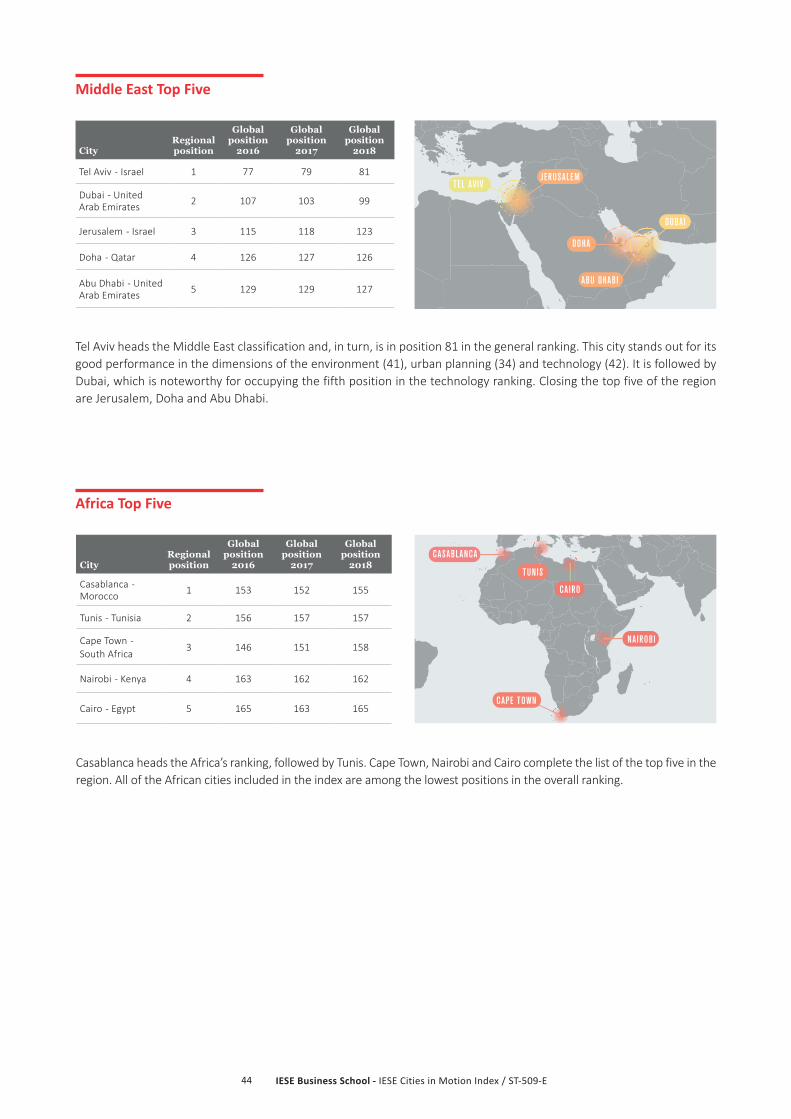
IESE Business School - IESE Cities in Motion Index / ST-509-E44
Africa Top Five
Casablanca heads the Africa’s ranking, followed by Tunis. Cape Town, Nairobi and Cairo complete the list of the top five in the region. All of the African cities included in the index are among the lowest positions in the overall ranking.
Middle East Top Five
Tel Aviv heads the Middle East classification and, in turn, is in position 81 in the general ranking. This city stands out for its good performance in the dimensions of the environment (41), urban planning (34) and technology (42). It is followed by Dubai, which is noteworthy for occupying the fifth position in the technology ranking. Closing the top five of the region are Jerusalem, Doha and Abu Dhabi.
TEL AV IVJERUSALEM
DOHA
ABU DHABI
DUBAI
CASABLANCA
TUNIS
CAPE TOWN
CAIRO
NAIROBI
CityRegional position
Global position
2016
Global position
2017
Global position
2018
Tel Aviv - Israel 1 77 79 81
Dubai - United Arab Emirates 2 107 103 99
Jerusalem - Israel 3 115 118 123
Doha - Qatar 4 126 127 126
Abu Dhabi - United Arab Emirates 5 129 129 127
CityRegional position
Global position
2016
Global position
2017
Global position
2018
Casablanca - Morocco 1 153 152 155
Tunis - Tunisia 2 156 157 157
Cape Town - South Africa
3 146 151 158
Nairobi - Kenya 4 163 162 162
Cairo - Egypt 5 165 163 165

IESE Business School - IESE Cities in Motion Index / ST-509-E45
North America Top Five
New York leads the North America ranking and is also in second position in the overall classification. In the regional top five, it is followed by Los Angeles, in position 16 in the general ranking, and by Chicago, Toronto and San Francisco. It should be noted that, as in previous years, Toronto is the only city that is always in the region’s top ranking and is not in the United States.
As mentioned previously and as can be seen in the table above, North American cities occupy some of the top places in the overall ranking. In the case of US cities, six of the 16 included in the study are among the top 30 at a global level.
Oceania Top Three
The Oceania ranking is always contested by the top two cities. Although Sydney is leading on this occasion, Melbourne also has a significant performance, not only in the region but also at a global level. Sydney is noteworthy for its rather homogeneous performance across the dimensions, which leads it to be situated around about position 25 in each one of them. Melbourne, for its part, has a somewhat lower performance in some dimensions but it stands out in governance and international outlook, where it is in positions 4 and 6 respectively.
Completing the regional ranking is Wellington, which performs very well—especially in the environment dimension, where it is in second place, and in social cohesion, where it is sixth.
LOS ANGELES
SAN FRANCISCO
NEW YORK C ITY
TORONTO
CHICAGO
WELL INGTON
SYDNEY
MELBOURNE
CityRegional position
Global position
2016
Global position
2017
Global position
2018
New York - United States 1 2 2 2
Los Angeles - United States 2 16 15 16
Chicago - United States
3 20 21 17
Toronto - Canada 4 14 13 18
San Francisco - United States 5 11 17 21
CityRegional position
Global position
2016
Global position
2017
Global position
2018
Sydney - Australia 1 22 18 19
Melbourne - Australia 2 17 20 20
Wellington - New Zealand
3 23 23 26
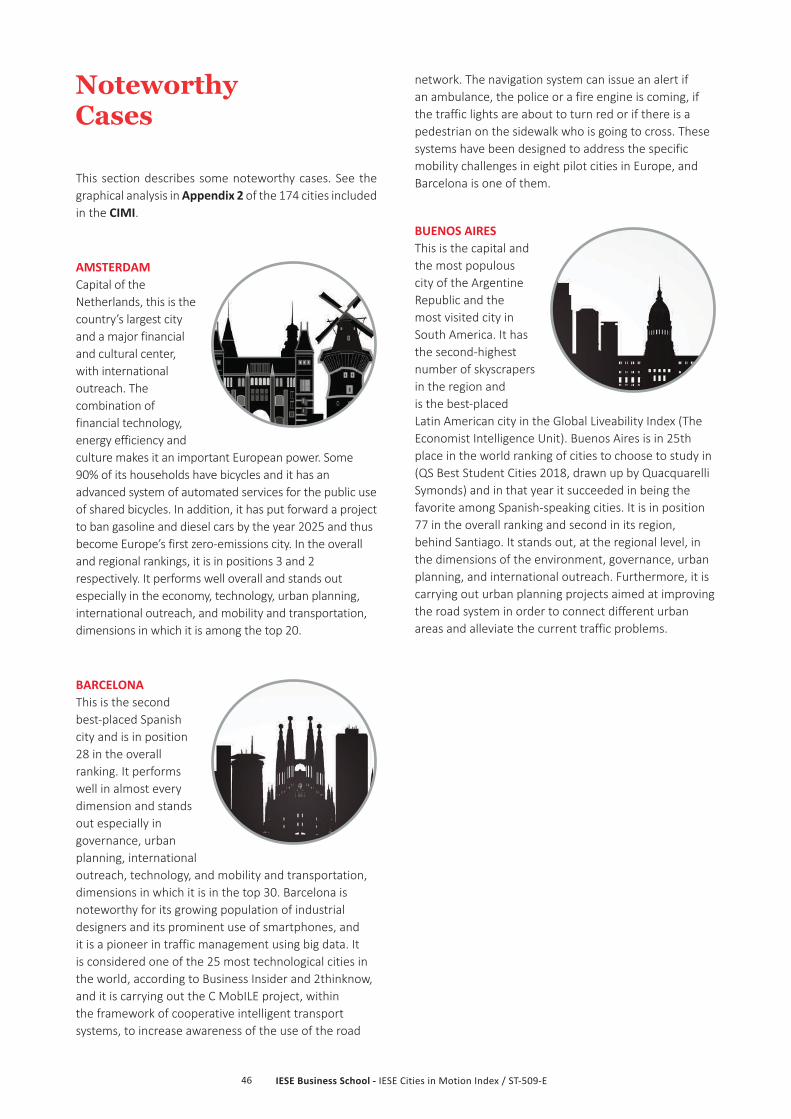
IESE Business School - IESE Cities in Motion Index / ST-509-E46
network. The navigation system can issue an alert if an ambulance, the police or a fire engine is coming, if the traffic lights are about to turn red or if there is a pedestrian on the sidewalk who is going to cross. These systems have been designed to address the specific mobility challenges in eight pilot cities in Europe, and Barcelona is one of them.
BUENOS AIRES This is the capital and the most populous city of the Argentine Republic and the most visited city in South America. It has the second-highest number of skyscrapers in the region and is the best-placed Latin American city in the Global Liveability Index (The Economist Intelligence Unit). Buenos Aires is in 25th place in the world ranking of cities to choose to study in (QS Best Student Cities 2018, drawn up by Quacquarelli Symonds) and in that year it succeeded in being the favorite among Spanish-speaking cities. It is in position 77 in the overall ranking and second in its region, behind Santiago. It stands out, at the regional level, in the dimensions of the environment, governance, urban planning, and international outreach. Furthermore, it is carrying out urban planning projects aimed at improving the road system in order to connect different urban areas and alleviate the current traffic problems.
Noteworthy Cases
This section describes some noteworthy cases. See the graphical analysis in Appendix 2 of the 174 cities included in the CIMI.
AMSTERDAM Capital of the Netherlands, this is the country’s largest city and a major financial and cultural center, with international outreach. The combination of financial technology, energy efficiency and culture makes it an important European power. Some 90% of its households have bicycles and it has an advanced system of automated services for the public use of shared bicycles. In addition, it has put forward a project to ban gasoline and diesel cars by the year 2025 and thus become Europe’s first zero-emissions city. In the overall and regional rankings, it is in positions 3 and 2 respectively. It performs well overall and stands out especially in the economy, technology, urban planning, international outreach, and mobility and transportation, dimensions in which it is among the top 20.
BARCELONA This is the second best-placed Spanish city and is in position 28 in the overall ranking. It performs well in almost every dimension and stands out especially in governance, urban planning, international outreach, technology, and mobility and transportation, dimensions in which it is in the top 30. Barcelona is noteworthy for its growing population of industrial designers and its prominent use of smartphones, and it is a pioneer in traffic management using big data. It is considered one of the 25 most technological cities in the world, according to Business Insider and 2thinknow, and it is carrying out the C MobILE project, within the framework of cooperative intelligent transport systems, to increase awareness of the use of the road
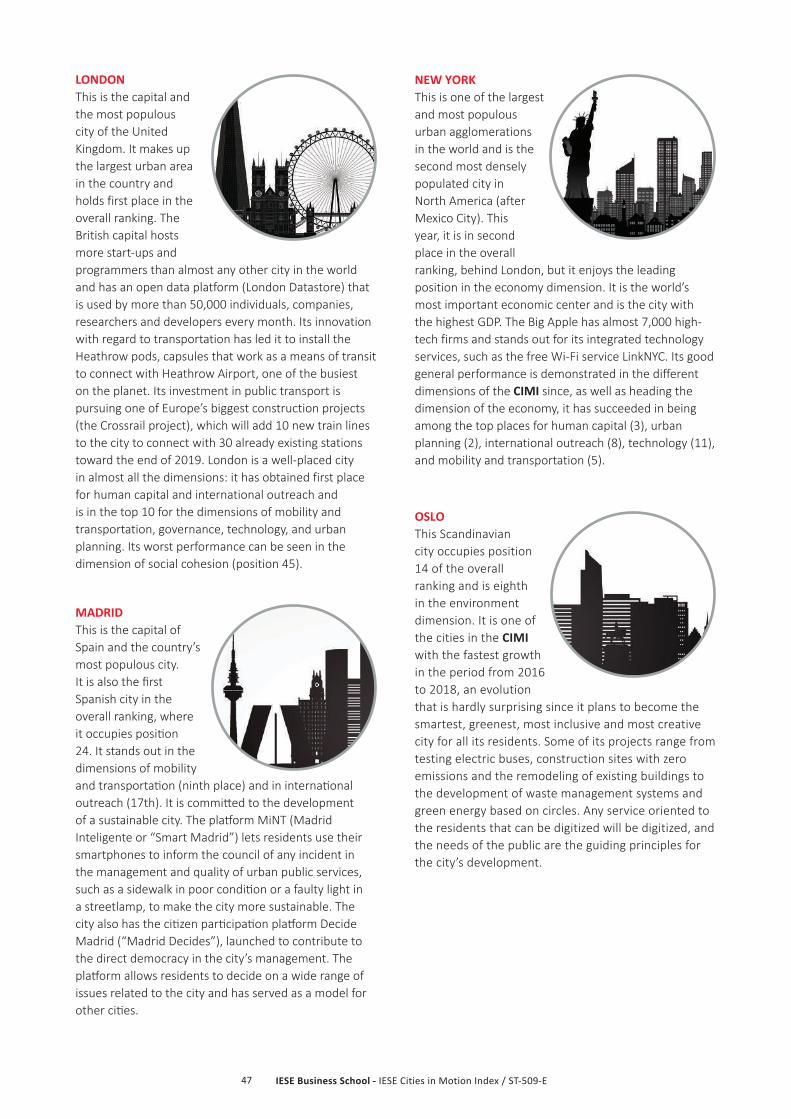
IESE Business School - IESE Cities in Motion Index / ST-509-E47
LONDON This is the capital and the most populous city of the United Kingdom. It makes up the largest urban area in the country and holds first place in the overall ranking. The British capital hosts more start-ups and programmers than almost any other city in the world and has an open data platform (London Datastore) that is used by more than 50,000 individuals, companies, researchers and developers every month. Its innovation with regard to transportation has led it to install the Heathrow pods, capsules that work as a means of transit to connect with Heathrow Airport, one of the busiest on the planet. Its investment in public transport is pursuing one of Europe’s biggest construction projects (the Crossrail project), which will add 10 new train lines to the city to connect with 30 already existing stations toward the end of 2019. London is a well-placed city in almost all the dimensions: it has obtained first place for human capital and international outreach and is in the top 10 for the dimensions of mobility and transportation, governance, technology, and urban planning. Its worst performance can be seen in the dimension of social cohesion (position 45).
MADRID This is the capital of Spain and the country’s most populous city. It is also the first Spanish city in the overall ranking, where it occupies position 24. It stands out in the dimensions of mobility and transportation (ninth place) and in international outreach (17th). It is committed to the development of a sustainable city. The platform MiNT (Madrid Inteligente or “Smart Madrid”) lets residents use their smartphones to inform the council of any incident in the management and quality of urban public services, such as a sidewalk in poor condition or a faulty light in a streetlamp, to make the city more sustainable. The city also has the citizen participation platform Decide Madrid (“Madrid Decides”), launched to contribute to the direct democracy in the city’s management. The platform allows residents to decide on a wide range of issues related to the city and has served as a model for other cities.
NEW YORK This is one of the largest and most populous urban agglomerations in the world and is the second most densely populated city in North America (after Mexico City). This year, it is in second place in the overall ranking, behind London, but it enjoys the leading position in the economy dimension. It is the world’s most important economic center and is the city with the highest GDP. The Big Apple has almost 7,000 high-tech firms and stands out for its integrated technology services, such as the free Wi-Fi service LinkNYC. Its good general performance is demonstrated in the different dimensions of the CIMI since, as well as heading the dimension of the economy, it has succeeded in being among the top places for human capital (3), urban planning (2), international outreach (8), technology (11), and mobility and transportation (5).
OSLO This Scandinavian city occupies position 14 of the overall ranking and is eighth in the environment dimension. It is one of the cities in the CIMI with the fastest growth in the period from 2016 to 2018, an evolution that is hardly surprising since it plans to become the smartest, greenest, most inclusive and most creative city for all its residents. Some of its projects range from testing electric buses, construction sites with zero emissions and the remodeling of existing buildings to the development of waste management systems and green energy based on circles. Any service oriented to the residents that can be digitized will be digitized, and the needs of the public are the guiding principles for the city’s development.
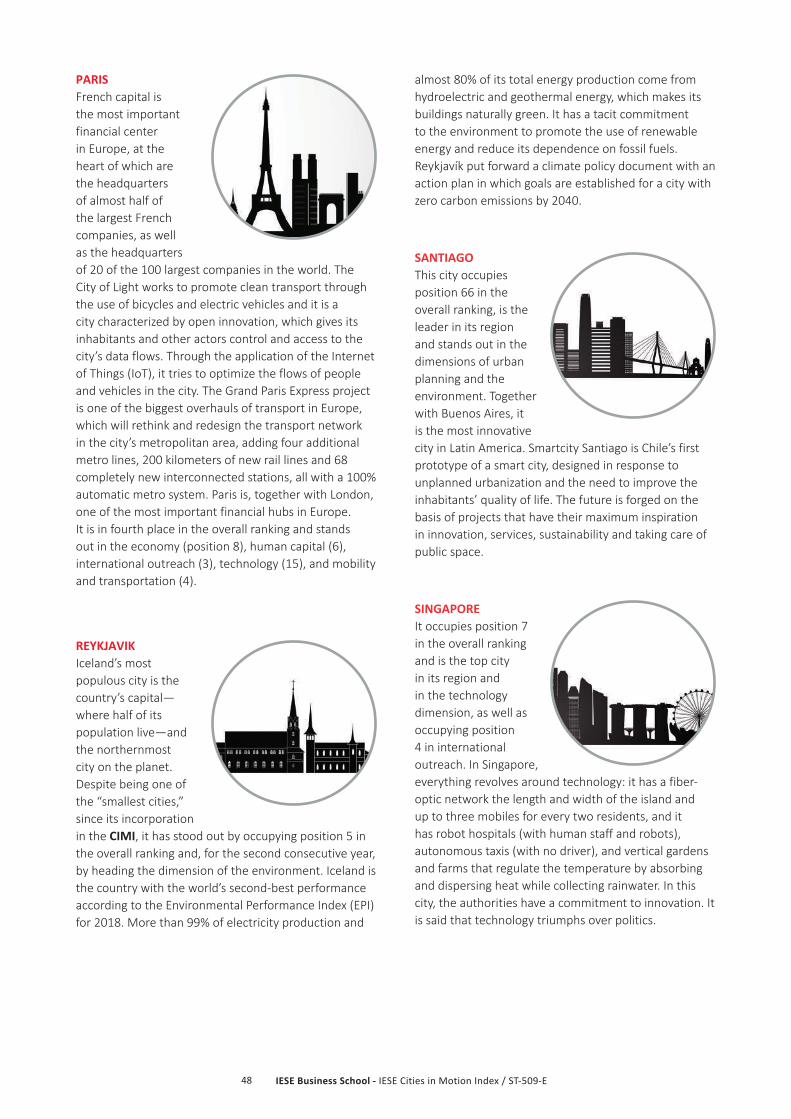
IESE Business School - IESE Cities in Motion Index / ST-509-E48
PARIS French capital is the most important financial center in Europe, at the heart of which are the headquarters of almost half of the largest French companies, as well as the headquarters of 20 of the 100 largest companies in the world. The City of Light works to promote clean transport through the use of bicycles and electric vehicles and it is a city characterized by open innovation, which gives its inhabitants and other actors control and access to the city’s data flows. Through the application of the Internet of Things (IoT), it tries to optimize the flows of people and vehicles in the city. The Grand Paris Express project is one of the biggest overhauls of transport in Europe, which will rethink and redesign the transport network in the city’s metropolitan area, adding four additional metro lines, 200 kilometers of new rail lines and 68 completely new interconnected stations, all with a 100% automatic metro system. Paris is, together with London, one of the most important financial hubs in Europe. It is in fourth place in the overall ranking and stands out in the economy (position 8), human capital (6), international outreach (3), technology (15), and mobility and transportation (4).
REYKJAVIK Iceland’s most populous city is the country’s capital—where half of its population live—and the northernmost city on the planet. Despite being one of the “smallest cities,” since its incorporation in the CIMI, it has stood out by occupying position 5 in the overall ranking and, for the second consecutive year, by heading the dimension of the environment. Iceland is the country with the world’s second-best performance according to the Environmental Performance Index (EPI) for 2018. More than 99% of electricity production and
almost 80% of its total energy production come from hydroelectric and geothermal energy, which makes its buildings naturally green. It has a tacit commitment to the environment to promote the use of renewable energy and reduce its dependence on fossil fuels. Reykjavík put forward a climate policy document with an action plan in which goals are established for a city with zero carbon emissions by 2040.
SANTIAGO This city occupies position 66 in the overall ranking, is the leader in its region and stands out in the dimensions of urban planning and the environment. Together with Buenos Aires, it is the most innovative city in Latin America. Smartcity Santiago is Chile’s first prototype of a smart city, designed in response to unplanned urbanization and the need to improve the inhabitants’ quality of life. The future is forged on the basis of projects that have their maximum inspiration in innovation, services, sustainability and taking care of public space.
SINGAPORE It occupies position 7 in the overall ranking and is the top city in its region and in the technology dimension, as well as occupying position 4 in international outreach. In Singapore, everything revolves around technology: it has a fiber-optic network the length and width of the island and up to three mobiles for every two residents, and it has robot hospitals (with human staff and robots), autonomous taxis (with no driver), and vertical gardens and farms that regulate the temperature by absorbing and dispersing heat while collecting rainwater. In this city, the authorities have a commitment to innovation. It is said that technology triumphs over politics.
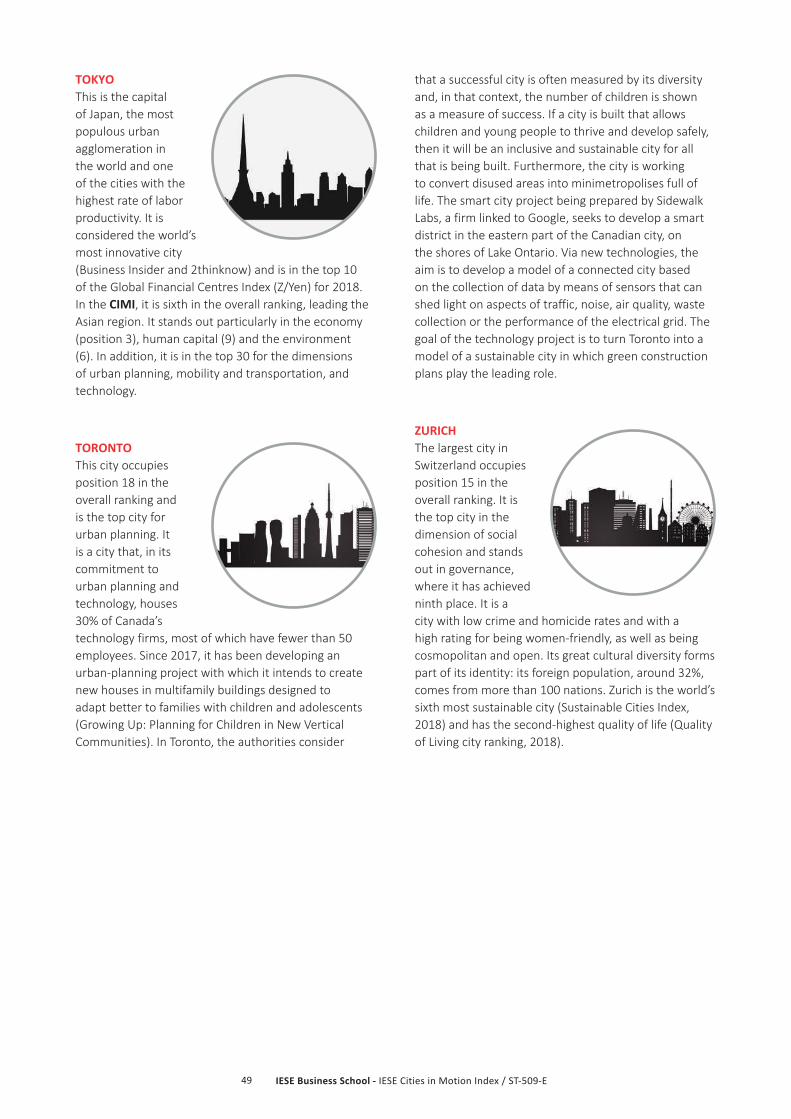
IESE Business School - IESE Cities in Motion Index / ST-509-E49
TOKYO This is the capital of Japan, the most populous urban agglomeration in the world and one of the cities with the highest rate of labor productivity. It is considered the world’s most innovative city (Business Insider and 2thinknow) and is in the top 10 of the Global Financial Centres Index (Z/Yen) for 2018.In the CIMI, it is sixth in the overall ranking, leading the Asian region. It stands out particularly in the economy (position 3), human capital (9) and the environment (6). In addition, it is in the top 30 for the dimensions of urban planning, mobility and transportation, and technology.
TORONTO This city occupies position 18 in the overall ranking and is the top city for urban planning. It is a city that, in its commitment to urban planning and technology, houses 30% of Canada’s technology firms, most of which have fewer than 50 employees. Since 2017, it has been developing an urban-planning project with which it intends to create new houses in multifamily buildings designed to adapt better to families with children and adolescents (Growing Up: Planning for Children in New Vertical Communities). In Toronto, the authorities consider
that a successful city is often measured by its diversity and, in that context, the number of children is shown as a measure of success. If a city is built that allows children and young people to thrive and develop safely, then it will be an inclusive and sustainable city for all that is being built. Furthermore, the city is working to convert disused areas into minimetropolises full of life. The smart city project being prepared by Sidewalk Labs, a firm linked to Google, seeks to develop a smart district in the eastern part of the Canadian city, on the shores of Lake Ontario. Via new technologies, the aim is to develop a model of a connected city based on the collection of data by means of sensors that can shed light on aspects of traffic, noise, air quality, waste collection or the performance of the electrical grid. The goal of the technology project is to turn Toronto into a model of a sustainable city in which green construction plans play the leading role.
ZURICH The largest city in Switzerland occupies position 15 in the overall ranking. It is the top city in the dimension of social cohesion and stands out in governance, where it has achieved ninth place. It is a city with low crime and homicide rates and with a high rating for being women-friendly, as well as being cosmopolitan and open. Its great cultural diversity forms part of its identity: its foreign population, around 32%, comes from more than 100 nations. Zurich is the world’s sixth most sustainable city (Sustainable Cities Index, 2018) and has the second-highest quality of life (Quality of Living city ranking, 2018).
IESE Business School - IESE Cities in Motion Index / ST-509-E50
A city’s transformation is vitally important in understanding the focus of its development target. Thus, Table 13 sets out the evolution of the index during the past three years with respect to the top 50 cities in the 2018 CIMI ranking.
The results show a lot of stability in almost all the cities, with no very sudden changes, neither in a positive nor in a negative direction. However, two US cities stand out with a positive evolution in the period from 2016 to 2018: Dallas, which rises 11 places due to its better performance in human capital, and San Diego, which goes up eight positions because of a better performance in the economy. Moreover, Frankfurt and Oslo rise three and four places respectively while, in the case of the Spanish cities, Madrid has gone up one place and Barcelona has fallen one.
Within the group of cities with a negative evolution in the period from 2016 to 2018, San Francisco is noteworthy, falling 10 positions: despite its good performance in general terms, it has not achieved the same success in the dimensions of the environment and mobility and transportation. Another successful city that has fallen—down four places—is Toronto, whose general evolution is negative due to its performance in specific dimensions, including those of social cohesion and mobility and transportation.
Evolution of the Cities in Motion Index
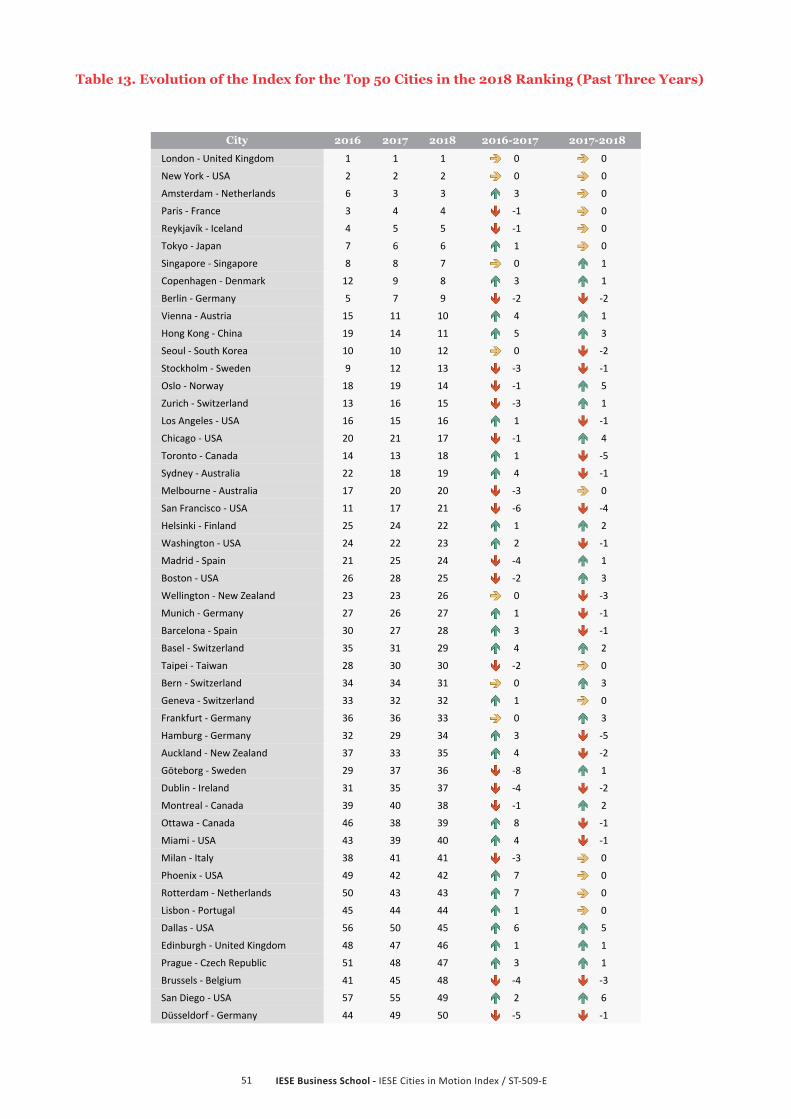
IESE Business School - IESE Cities in Motion Index / ST-509-E51
City 2016 2017 2018 2016-2017 2017-2018
London ‐ United Kingdom 1 1 1 0 0
New York ‐ USA 2 2 2 0 0
Amsterdam ‐ Netherlands 6 3 3 3 0
Paris ‐ France 3 4 4 ‐1 0
Reykjavík ‐ Iceland 4 5 5 ‐1 0
Tokyo ‐ Japan 7 6 6 1 0
Singapore ‐ Singapore 8 8 7 0 1
Copenhagen ‐ Denmark 12 9 8 3 1
Berlin ‐ Germany 5 7 9 ‐2 ‐2
Vienna ‐ Austria 15 11 10 4 1
Hong Kong ‐ China 19 14 11 5 3
Seoul ‐ South Korea 10 10 12 0 ‐2
Stockholm ‐ Sweden 9 12 13 ‐3 ‐1
Oslo ‐ Norway 18 19 14 ‐1 5
Zurich ‐ Switzerland 13 16 15 ‐3 1
Los Angeles ‐ USA 16 15 16 1 ‐1
Chicago ‐ USA 20 21 17 ‐1 4
Toronto ‐ Canada 14 13 18 1 ‐5
Sydney ‐ Australia 22 18 19 4 ‐1
Melbourne ‐ Australia 17 20 20 ‐3 0
San Francisco ‐ USA 11 17 21 ‐6 ‐4
Helsinki ‐ Finland 25 24 22 1 2
Washington ‐ USA 24 22 23 2 ‐1
Madrid ‐ Spain 21 25 24 ‐4 1
Boston ‐ USA 26 28 25 ‐2 3
Wellington ‐ New Zealand 23 23 26 0 ‐3
Munich ‐ Germany 27 26 27 1 ‐1
Barcelona ‐ Spain 30 27 28 3 ‐1
Basel ‐ Switzerland 35 31 29 4 2
Taipei ‐ Taiwan 28 30 30 ‐2 0
Bern ‐ Switzerland 34 34 31 0 3
Geneva ‐ Switzerland 33 32 32 1 0
Frankfurt ‐ Germany 36 36 33 0 3
Hamburg ‐ Germany 32 29 34 3 ‐5
Auckland ‐ New Zealand 37 33 35 4 ‐2
Göteborg ‐ Sweden 29 37 36 ‐8 1
Dublin ‐ Ireland 31 35 37 ‐4 ‐2
Montreal ‐ Canada 39 40 38 ‐1 2
Ottawa ‐ Canada 46 38 39 8 ‐1
Miami ‐ USA 43 39 40 4 ‐1
Milan ‐ Italy 38 41 41 ‐3 0
Phoenix ‐ USA 49 42 42 7 0
Rotterdam ‐ Netherlands 50 43 43 7 0
Lisbon ‐ Portugal 45 44 44 1 0
Dallas ‐ USA 56 50 45 6 5
Edinburgh ‐ United Kingdom 48 47 46 1 1
Prague ‐ Czech Republic 51 48 47 3 1
Brussels ‐ Belgium 41 45 48 ‐4 ‐3
San Diego ‐ USA 57 55 49 2 6
Düsseldorf ‐ Germany 44 49 50 ‐5 ‐1
Table 13. Evolution of the Index for the Top 50 Cities in the 2018 Ranking (Past Three Years)

IESE Business School - IESE Cities in Motion Index / ST-509-E52
LondonNew York
AmsterdamParisReykjavík Tokyo
SingaporeCopenhagen
Berlin ViennaHong Kong
SeoulStockholm Oslo
Zurich Los AngelesChicago
Toronto SydneyMelbourne
San Francisco HelsinkiWashington
Madrid BostonWellington Munich
Barcelona BaselTaipei Bern
GenevaFrankfurt
Hamburg AucklandGöteborg Dublin Montreal
OttawaMiami
Milan PhoenixRotterdam
LisbonDallasEdinburgh
PragueBrussels
San DiegoDüsseldorf
0
10
20
30
40
50
60
0 10 20 30 40 50 60
Citie
s in Motion rank
ing
Cities in Motion ranking 2016
Figure 6. Evolution of the Index for the Top 50 Cities in the 2018 Ranking
Figure 6 below shows the positions of the top 50 cities in the ranking in 2016 and 2018. Those cities that show a positive evolution are below the 45-degree angle formed by the diagonal, while those that did not experience such an evolution are above the line. As could be observed
in Table 13, there is no city among the top 50 that experienced a very sudden variation in the period being considered, with the exception of San Francisco, which has dropped 10 positions. The rest show a rather stable evolution over time.

IESE Business School - IESE Cities in Motion Index / ST-509-E53
Cities in Motion Compared With Other Indexes
In this section, we conduct a comparative study of the CIMI and other indexes. Table 14 shows the top 10 cities in this ranking (2018) and those in six other indexes that have been considered. Cities that also appear in the CIMI are shaded.
While the classifications being studied vary in terms of methodology and indicators, they all agree that a city is more powerful, prosperous, and competitive if it manages to develop in its various dimensions: from the economy and finance, via the ease of ensuring the creation of businesses, the quality of life, and the use of high technology, to its cultural importance, which could be measured by how it promotes music and fashion. Moreover, it can be noted that all of the cities in the CIMI frequently appear in some of the other indexes under consideration, with the exception of Reykjavík.
The city of Singapore, which occupies position 7 in the CIMI and is in the top 10 of four of the six other rankings analyzed, stands out for showing a high performance in the dimensions of international outreach, the environment, governance, and the economy. In terms of technology, as mentioned previously, it shows a very good performance and heads the dimension.
New York, London, Paris, Tokyo, Vienna and Copenhagen, for their part, also appear frequently in other classifications with respect to the 10 most prosperous cities or those with the best quality of life in the world
As can be seen, all the cities in our top 10, with the exception of Reykjavík, appear in the top positions of the indexes under consideration. The Icelandic city is often excluded from many rankings due to the size of its population although, despite this, it has been demonstrating its capabilities and strengths over the years and has managed to stand out among the best cities. Unlike many of the indexes with which it is compared, the CIMI takes into account a greater geographical coverage.
Finally, it can be observed that the top two positions in the Global Financial Centers Index (Z/Yen) and the Global Power City Index (Mori Memorial Foundation) coincide exactly with the top two of the CIMI.
Table 14. Comparison With Other Indexes (Top 10)
Ranking by city
CIMI 2018 (IESE)
Global Cities Index 2018
(A.T. Kearney)
Global Financial Centres Index
(GFCI) 2018 (Z/Yen)
Global Power City Index 2018
(MMF)
Quality of Living City
Ranking 2018 (Mercer)
Global Liveability Index 2018 (Economist
Intelligence Unit)
Sustainable Cities
Index 2018 (Arcadis)
1 London New York London London Vienna Vienna London
2 New York London New York New York Zurich Melbourne Stockholm
3 Amsterdam Paris Hong Kong Tokyo Munich Osaka Edimburgh
4 Paris Tokyo Singapore Paris Auckland Calgary Singapore
5 Reykjavík Hong Kong Tokyo Singapore Vancouver Sydney Vienna
6 Tokyo Los Angeles Shangai Amsterdam Düsseldorf Vancouver Zurich
7 Singapore Singapore Toronto Seoul Frankfurt Toronto Munich
8 Copenhagen Chicago San Francisco Berlin Geneva Tokyo Oslo
9 Berlin Beijing Sydney Hong Kong Copenhagen Copenhagen Hong Kong
10 Vienna Brussels Boston Sydney Basel Adelaide Frankfurt

IESE Business School - IESE Cities in Motion Index / ST-509-E54
Cities in Motion: City Ranking by Population
Table 15. Classification of Cities According to Their Population (Number of Inhabitants)
Category Number of cities
Less than 600,000 Smallest cities 12
Between 600,000 and 1 million Small cities 13
Between 1 million and 5 million Medium cities 93
Between 5 million and 10 million Large cities 26
More than 10 million Megacities 30
RANKING OF THE “SMALLEST CITIES”
Like the previous year, the top five so-called “smallest cities” are headed by Reykjavík, which comes fifth in the overall ranking and fourth in the Western Europe region. In the general ranking, this city has a far superior performance compared to the other cities of a similar size, which are more than 20 positions below. In second place in this classification is Wellington, which, along with Reykjavík, also heads the ranking for the environment. The top five are completed by three Swiss cities—Bern, Geneva and Basel—which stand out for their good performance in the governance dimension.
This section presents a ranking of cities according to their population, obtained after producing a classification of the 174 cities included in the index according to this value. The cities were grouped by considering various sources, such as The Economist and the United Nations. Table 15 shows the various categories and the number of CIMI cities included in each.
Top Five Cities With Fewer Than 600,000 Inhabitants
City Position by size
Global position
2016
Global position
2017
Global position
2018
Reykjavík - Iceland 1 4 5 5
Wellington - New Zealand 2 23 23 26
Basel - Switzerland 3 35 31 29
Bern - Switzerland 4 34 34 31
Geneva - Switzerland 5 33 32 32
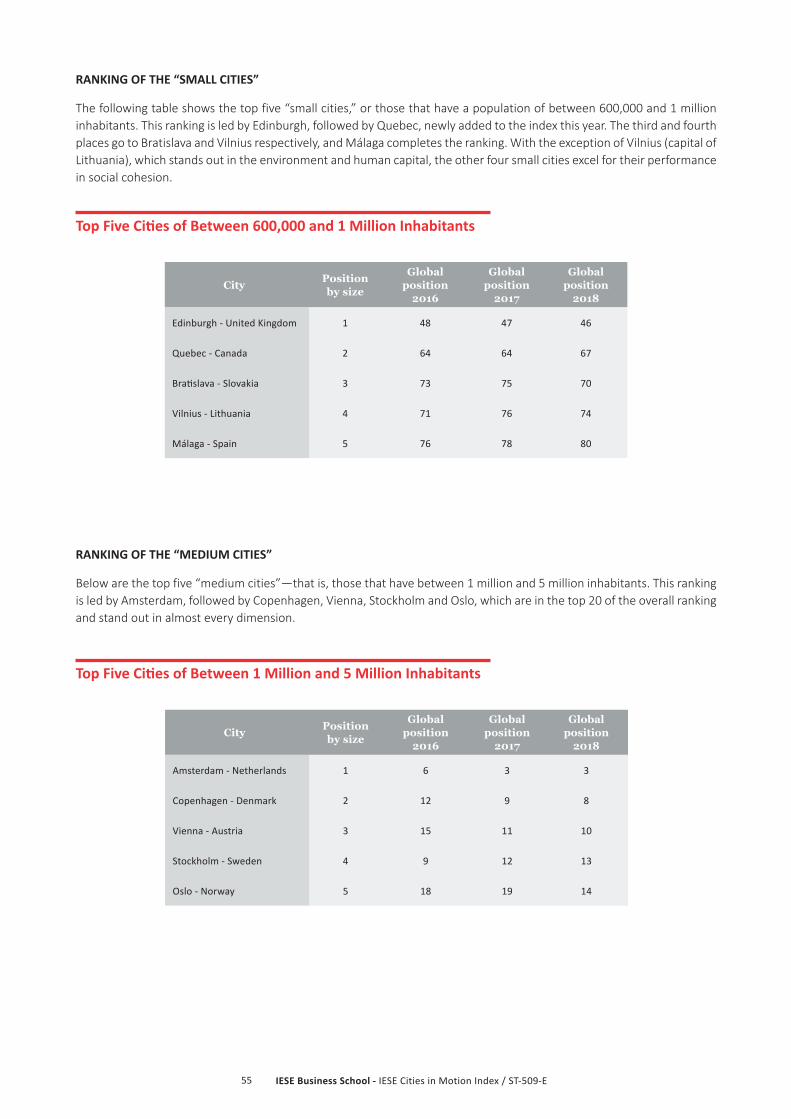
IESE Business School - IESE Cities in Motion Index / ST-509-E55
RANKING OF THE “SMALL CITIES”
The following table shows the top five “small cities,” or those that have a population of between 600,000 and 1 million inhabitants. This ranking is led by Edinburgh, followed by Quebec, newly added to the index this year. The third and fourth places go to Bratislava and Vilnius respectively, and Málaga completes the ranking. With the exception of Vilnius (capital of Lithuania), which stands out in the environment and human capital, the other four small cities excel for their performance in social cohesion.
RANKING OF THE “MEDIUM CITIES”
Below are the top five “medium cities”—that is, those that have between 1 million and 5 million inhabitants. This ranking is led by Amsterdam, followed by Copenhagen, Vienna, Stockholm and Oslo, which are in the top 20 of the overall ranking and stand out in almost every dimension.
Top Five Cities of Between 600,000 and 1 Million Inhabitants
Top Five Cities of Between 1 Million and 5 Million Inhabitants
City Position by size
Global position
2016
Global position
2017
Global position
2018
Edinburgh - United Kingdom 1 48 47 46
Quebec - Canada 2 64 64 67
Bratislava - Slovakia 3 73 75 70
Vilnius - Lithuania 4 71 76 74
Málaga - Spain 5 76 78 80
City Position by size
Global position
2016
Global position
2017
Global position
2018
Amsterdam - Netherlands 1 6 3 3
Copenhagen - Denmark 2 12 9 8
Vienna - Austria 3 15 11 10
Stockholm - Sweden 4 9 12 13
Oslo - Norway 5 18 19 14

IESE Business School - IESE Cities in Motion Index / ST-509-E56
RANKING OF THE “LARGE CITIES”
Below is shown the ranking of the “large cities,” those that have between 5 million and 10 million inhabitants. Singapore heads this classification, followed by Berlin and Hong Kong, while Toronto and Chicago occupy the final positions.
RANKING OF THE “MEGACITIES”
The “megacities” ranking includes those cities with a population of more than 10 million inhabitants. This year, it is headed by London, followed by New York, Paris, Tokyo and Seoul, which are in the overall top 20 and stand out in almost every dimension, with the exception of that of social cohesion.
Top Five Cities of Between 5 Million and 10 Million Inhabitants
Top Five Cities of More Than 10 Million Inhabitants
City Position by size
Global position
2016
Global position
2017
Global position
2018
Singapore - Singapore 1 8 8 7
Berlin - Germany 2 5 7 9
Hong Kong - China 3 19 14 11
Chicago - United States 4 20 21 17
Toronto - Canada 5 14 13 18
City Position by size
Global position
2016
Global position
2017
Global position
2018
London - United Kingdom 1 1 1 1
New York - United States 2 2 2 2
Paris - France 3 3 4 4
Tokyo - Japan 4 7 6 6
Seoul - South Korea 5 10 10 12
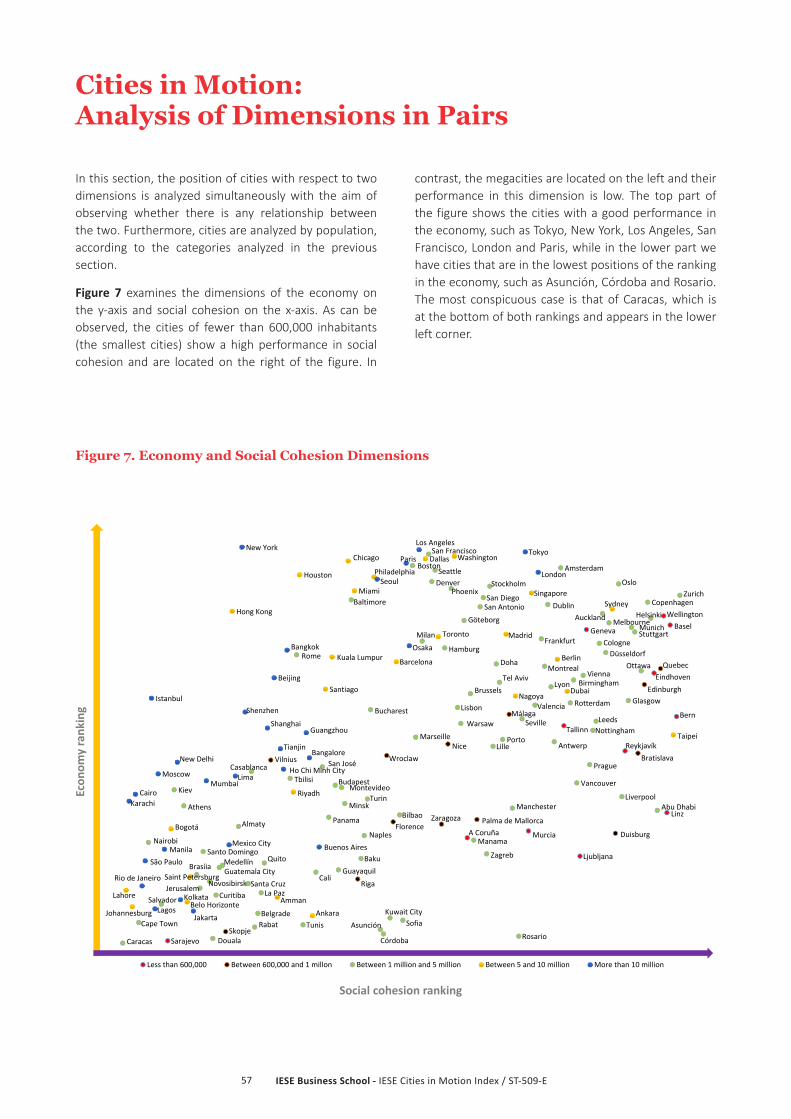
IESE Business School - IESE Cities in Motion Index / ST-509-E57
In this section, the position of cities with respect to two dimensions is analyzed simultaneously with the aim of observing whether there is any relationship between the two. Furthermore, cities are analyzed by population, according to the categories analyzed in the previous section.
Figure 7 examines the dimensions of the economy on the y-axis and social cohesion on the x-axis. As can be observed, the cities of fewer than 600,000 inhabitants (the smallest cities) show a high performance in social cohesion and are located on the right of the figure. In
contrast, the megacities are located on the left and their performance in this dimension is low. The top part of the figure shows the cities with a good performance in the economy, such as Tokyo, New York, Los Angeles, San Francisco, London and Paris, while in the lower part we have cities that are in the lowest positions of the ranking in the economy, such as Asunción, Córdoba and Rosario. The most conspicuous case is that of Caracas, which is at the bottom of both rankings and appears in the lower left corner.
Figure 7. Economy and Social Cohesion Dimensions
Cities in Motion: Analysis of Dimensions in Pairs
Reykjavík
WellingtonBasel
Bern
Geneva
Eindhoven
Tallinn
Linz
Ljubljana
MurciaA Coruña
Sarajevo
Edinburgh
Quebec
BratislavaVilnius
Málaga
Riga
Nice
Palma de Mallorca
Duisburg
Wroclaw
ZaragozaFlorence
Skopje
Amsterdam
Copenhagen
Vienna
Stockholm OsloZurich
San Francisco
MelbourneHelsinki
Boston
Munich
FrankfurtHamburg
AucklandGöteborg
Dublin
Montreal Ottawa
Milan
Phoenix
RotterdamLisbon
Prague
Brussels
San Diego
DüsseldorfCologne
Denver
Stuttgart
Vancouver
Lyon
Seattle
Valencia
San Antonio
Birmingham
Glasgow
Warsaw
Baltimore
Antwerp
Budapest
Rome
Seville
Manchester
Leeds
Tel Aviv
Marseille Porto
MontevideoLiverpool
Nottingham
Zagreb
Lille
Bucharest
AthensBilbao
TurinMinsk
Kiev
San José
Panama
Sofia
Naples
Belgrade
Brasíia
Jerusalem
Tbilisi
Rosario
Abu Dhabi
Doha
Almaty
BakuMedellín
Córdoba
Quito
CuritibaSalvador
Santo Domingo
Asunción
Kuwait City
La PazSanta Cruz
CaliGuayaquil
Casablanca
Novosibirsk
TunisCape Town
Manama
Guatemala City
Nairobi
Rabat
DoualaCaracas
Singapore
Berlin
Hong Kong
Chicago
Toronto
Sydney
Washington
Madrid
Barcelona
Taipei
Miami
Dallas
PhiladelphiaHouston
SantiagoNagoya
Dubai
Kuala Lumpur
Bogotá
Saint Petersburg
AnkaraAmmanBelo Horizonte
Riyadh
Johannesburg
Lahore
London
New YorkParis
Tokyo
Seoul
Los Angeles
Shanghai
Osaka
Buenos Aires
Beijing
Moscow
Bangkok
Guangzhou
IstanbulShenzhen
Ho Chi Minh City
Mexico City
Rio de Janeiro
São Paulo
Lima
Jakarta
BangaloreTianjin
Mumbai
Manila
Cairo
New Delhi
KolkataLagos
Karachi
Less than 600.000 Between 600.000 and 1 millon Between 1 million and 5 million Between 5 and 10 million More than 10 million
Social cohesion ranking
Econ
omyrank
ing
600,000 600,000

IESE Business School - IESE Cities in Motion Index / ST-509-E58
Figure 8 analyzes the dimensions of the economy and the environment. The former is shown on the y-axis and latter on the x-axis.
In the upper left are the Asian and US cities, which stand out because they perform well in the dimension of the economy but whose performance is deficient in that of the environment. This information could lead to the belief that a high level of economic development is detrimental to the well-being of the environment if cities do not take ecological criteria into account during that development. However, on the opposite side—the upper right—appear those cities that have a good performance in both dimensions. This group includes a large number
of European cities, such as Stockholm, Copenhagen, Amsterdam, London, Oslo and Zurich, as well as Asian cities such as Tokyo and Seoul, and cities from Oceania such as Sydney and Wellington. In the lower left corner are those cities with a low performance level in these two dimensions, such as Lagos, Kolkata, Lahore and Rabat. Finally, the lower right-hand side shows the cities with low economic development but a good performance in the environment, with cities such as Asunción, Riga, Santa Cruz and Buenos Aires. In this case, a conclusion could be drawn that cities with less economic development preserve the environment better.
Environment ranking
Reykjavík
WellingtonBasel
Bern
Geneva
Eindhoven
Tallinn
Linz
Ljubljana
MurciaA Coruña
Sarajevo
Edinburgh
Quebec
BratislavaVilnius
Málaga
Riga
Nice
Palma de Mallorca
Duisburg
Wroclaw
ZaragozaFlorence
Skopje
Amsterdam
Copenhagen
Vienna
StockholmOslo
Zurich
San Francisco
MelbourneHelsinki
Boston
MunichFrankfurt
Hamburg
Auckland
Göteborg
Dublin
MontrealOttawa
Milan
Phoenix
Rotterdam Lisbon
Prague
Brussels
San Diego
DüsseldorfCologne
Denver
Stuttgart
Vancouver
Lyon
Seattle
Valencia
San Antonio
Birmingham
Glasgow
Warsaw
Baltimore
Antwerp
Budapest
Rome
Seville
Manchester
Leeds
Tel Aviv
Marseille Porto
MontevideoLiverpool
Nottingham
Zagreb
Lille
Bucharest
AthensBilbao
Turin MinskKiev
San José
Panama
Sofia
Naples
Belgrade
BrasiliaJerusalem
Tbilisi
Rosario
Abu Dhabi
Doha
Almaty
BakuMedellín
Córdoba
Quito
CuritibaSalvador
Santo Domingo
AsunciónKuwait City
La PazSanta Cruz
CaliGuayaquil
Casablanca
Novosibirsk
TunisCape Town
Manama
Guatemala City
Nairobi
RabatDoualaCaracas
Singapore
Berlin
Hong Kong
Chicago
Toronto
Sydney
Washington
Madrid
Barcelona
Taipei
Miami
Dallas
PhiladelphiaHouston
SantiagoNagoyaDubai
Kuala Lumpur
Bogotá
Saint Petersburg
Ankara
AmmanBelo Horizonte
Riyadh
JohannesburgLahore
London
New York
ParisTokyo
Seoul
Los Angeles
Shanghai
Osaka
Buenos Aires
Beijing
Moscow
Bangkok
Guangzhou
Istanbul
Shenzhen
Ho Chi Minh City
Mexico City
Rio de Janeiro
São Paulo
Lima
Jakarta
BangaloreTianjin
Mumbai
Manila
Cairo
New Delhi
KolkataLagos
Karachi
Less than 600.000 Between 600.000 and 1 millon Between 1 million and 5 million Between 5 and 10 million More than 10 million
Econ
omyrank
ing
600,000 600,000
Figure 8. Economy and Environment Dimensions
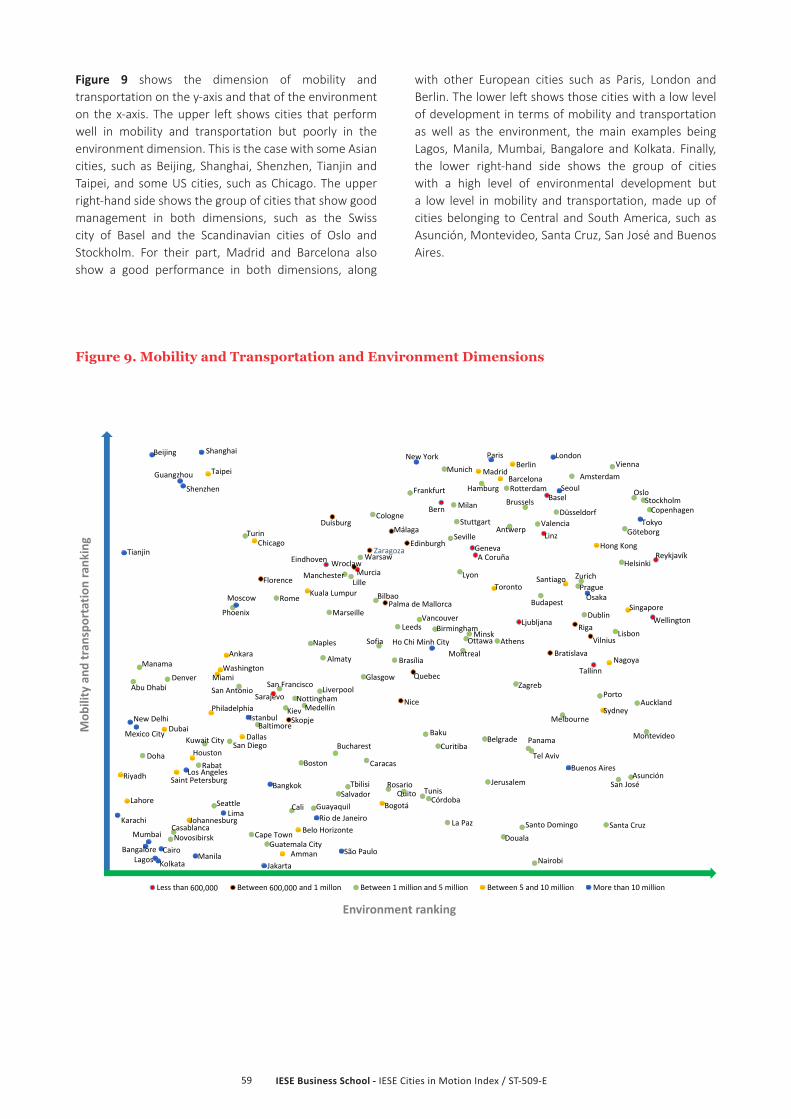
IESE Business School - IESE Cities in Motion Index / ST-509-E59
Figure 9 shows the dimension of mobility and transportation on the y-axis and that of the environment on the x-axis. The upper left shows cities that perform well in mobility and transportation but poorly in the environment dimension. This is the case with some Asian cities, such as Beijing, Shanghai, Shenzhen, Tianjin and Taipei, and some US cities, such as Chicago. The upper right-hand side shows the group of cities that show good management in both dimensions, such as the Swiss city of Basel and the Scandinavian cities of Oslo and Stockholm. For their part, Madrid and Barcelona also show a good performance in both dimensions, along
with other European cities such as Paris, London and Berlin. The lower left shows those cities with a low level of development in terms of mobility and transportation as well as the environment, the main examples being Lagos, Manila, Mumbai, Bangalore and Kolkata. Finally, the lower right-hand side shows the group of cities with a high level of environmental development but a low level in mobility and transportation, made up of cities belonging to Central and South America, such as Asunción, Montevideo, Santa Cruz, San José and Buenos Aires.
Mob
ility
and tran
sportatio
nrank
ing
Reykjavík
Wellington
BaselBern
GenevaEindhoven
Tallinn
Linz
Ljubljana
Murcia
A Coruña
Sarajevo
Edinburgh
Quebec
BratislavaVilnius
Málaga
Riga
Nice
Palma de Mallorca
Duisburg
WroclawZaragoza
Florence
Skopje
Amsterdam
Copenhagen
Vienna
StockholmOslo
Zurich
San Francisco
Melbourne
Helsinki
Boston
Munich
Frankfurt Hamburg
Auckland
Göteborg
Dublin
MontrealOttawa
Milan
Phoenix
Rotterdam
Lisbon
Prague
Brussels
San Diego
DüsseldorfCologne
Denver
Stuttgart
Vancouver
Lyon
Seattle
Valencia
San Antonio
Birmingham
Glasgow
Warsaw
Baltimore
Antwerp
BudapestRome
Seville
Manchester
Leeds
Tel Aviv
Marseille
Porto
Montevideo
LiverpoolNottingham
Zagreb
Lille
Bucharest
Athens
Bilbao
Turin
Minsk
Kiev
San José
Panama
SofiaNaples
Belgrade
Brasília
JerusalemTbilisi Rosario
Abu Dhabi
Doha
Almaty
Baku
Medellín
CórdobaQuito
Curitiba
Salvador
Santo Domingo
Asunción
Kuwait City
La Paz Santa Cruz
Cali Guayaquil
CasablancaNovosibirsk
Tunis
Cape Town
Manama
Guatemala City
Nairobi
Rabat
Douala
Caracas
Singapore
Berlin
Hong KongChicago
Toronto
Sydney
Washington
MadridBarcelona
Taipei
Miami
Dallas
Philadelphia
Houston
Santiago
Nagoya
Dubai
Kuala Lumpur
Bogotá
Saint Petersburg
Ankara
Amman
Belo Horizonte
Riyadh
Johannesburg
Lahore
LondonNew York Paris
Tokyo
Seoul
Los Angeles
Shanghai
Osaka
Buenos Aires
Beijing
Moscow
Bangkok
Guangzhou
Istanbul
Shenzhen
Ho Chi Minh City
Mexico City
Rio de Janeiro
São Paulo
Lima
Jakarta
Bangalore
Tianjin
Mumbai
ManilaCairo
New Delhi
KolkataLagos
Karachi
Less than 600.000 Between 600.000 and 1 millon Between 1 million and 5 million Between 5 and 10 million More than 10 million
Environment ranking
600,000 600,000
Figure 9. Mobility and Transportation and Environment Dimensions
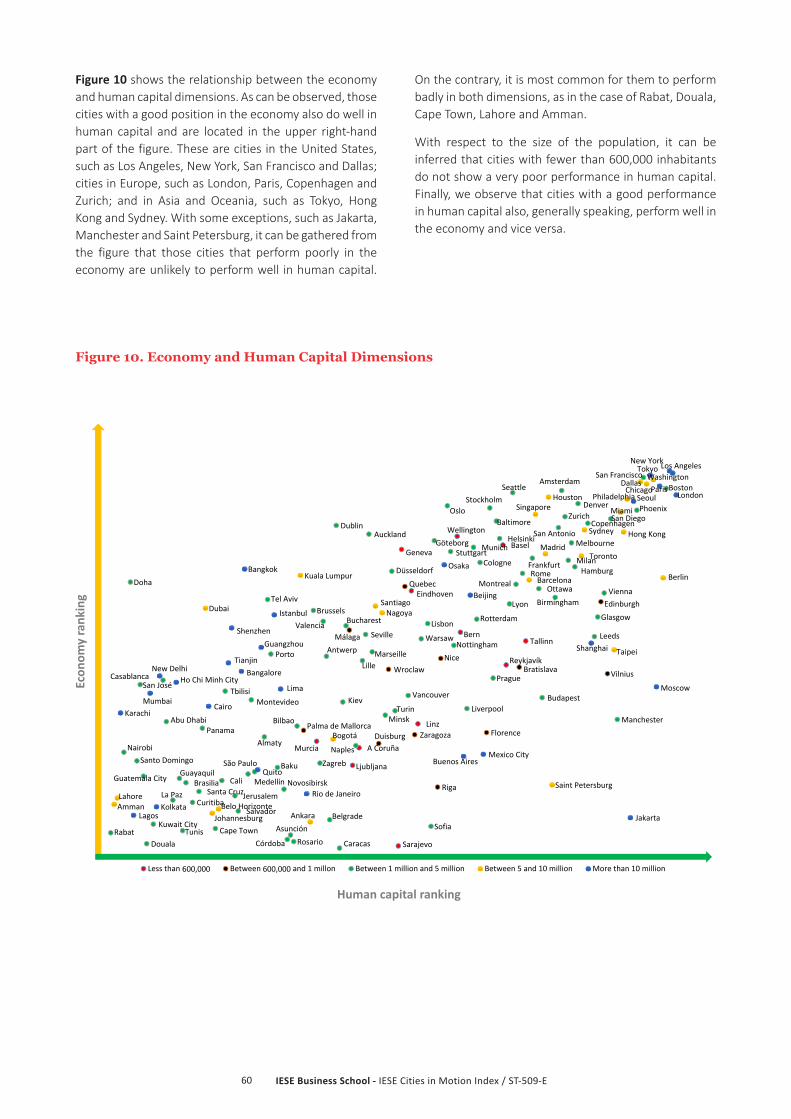
IESE Business School - IESE Cities in Motion Index / ST-509-E60
Figure 10 shows the relationship between the economy and human capital dimensions. As can be observed, those cities with a good position in the economy also do well in human capital and are located in the upper right-hand part of the figure. These are cities in the United States, such as Los Angeles, New York, San Francisco and Dallas; cities in Europe, such as London, Paris, Copenhagen and Zurich; and in Asia and Oceania, such as Tokyo, Hong Kong and Sydney. With some exceptions, such as Jakarta, Manchester and Saint Petersburg, it can be gathered from the figure that those cities that perform poorly in the economy are unlikely to perform well in human capital.
On the contrary, it is most common for them to perform badly in both dimensions, as in the case of Rabat, Douala, Cape Town, Lahore and Amman.
With respect to the size of the population, it can be inferred that cities with fewer than 600,000 inhabitants do not show a very poor performance in human capital. Finally, we observe that cities with a good performance in human capital also, generally speaking, perform well in the economy and vice versa.
Figure 10. Economy and Human Capital Dimensions
Reykjavík
Wellington
Basel
Bern
Geneva
Eindhoven
Tallinn
Linz
Ljubljana
Murcia A Coruña
Sarajevo
Edinburgh
Quebec
Bratislava Vilnius
Málaga
Riga
Nice
Palma de MallorcaDuisburg
Wroclaw
Zaragoza Florence
Amsterdam
Copenhagen
Vienna
StockholmOslo Zurich
San Francisco
MelbourneHelsinki
Boston
Munich
FrankfurtHamburg
AucklandGöteborg
Dublin
Montreal Ottawa
Milan
Phoenix
RotterdamLisbon
Prague
Brussels
San Diego
DüsseldorfCologne
Denver
Stuttgart
Vancouver
Lyon
Seattle
Valencia
San Antonio
Birmingham
Glasgow
Warsaw
Baltimore
Antwerp
Budapest
Rome
Seville
Manchester
Leeds
Tel Aviv
MarseillePorto
MontevideoLiverpool
Nottingham
Zagreb
Lille
Bucharest
BilbaoTurin
Minsk
Kiev
San José
Panama
Sofia
Naples
Belgrade
BrasiliaJerusalem
Tbilisi
Rosario
Abu Dhabi
Doha
Almaty
Baku
Medellín
Córdoba
Quito
CuritibaSalvador
Santo Domingo
AsunciónKuwait City
La Paz Santa CruzCali
Guayaquil
Casablanca
Novosibirsk
Tunis Cape Town
Guatemala City
Nairobi
RabatDouala Caracas
Singapore
Berlin
Hong Kong
Chicago
Toronto
Sydney
Washington
Madrid
Barcelona
Taipei
Miami
Dallas
PhiladelphiaHouston
SantiagoNagoyaDubai
Kuala Lumpur
Bogotá
Saint Petersburg
AnkaraAmman Belo Horizonte
Johannesburg
Lahore
London
New York
Paris
Tokyo
Seoul
Los Angeles
Shanghai
Osaka
Buenos Aires
Beijing
Moscow
Bangkok
Guangzhou
Istanbul
Shenzhen
Ho Chi Minh City
Mexico City
Rio de Janeiro
São Paulo
Lima
Jakarta
BangaloreTianjin
MumbaiCairo
New Delhi
KolkataLagos
Karachi
Less than 600.000 Between 600.000 and 1 millon Between 1 million and 5 million Between 5 and 10 million More than 10 million
Human capital ranking
Econ
omyrank
ing
600,000 600,000

IESE Business School - IESE Cities in Motion Index / ST-509-E61
In Figure 11, we have the relationship between the technology and social cohesion dimensions. Here we observe that, with the exception of London and Tokyo, the most-populous cities that achieve a good performance in technology have a poor performance in social cohesion. This is the case with New York, Hong Kong and Seoul. On the opposite side of the figure, the upper right, we have less populated cities with a good performance in both dimensions: Reykjavík, Copenhagen, Eindhoven, Taipei, Oslo and Amsterdam, for example. Furthermore,
Reykjavík
Wellington
Basel
Bern
Geneva
Eindhoven
Tallinn
Linz
Ljubljana
Murcia
A Coruña
Sarajevo
Edinburgh
Quebec
Bratislava
Vilnius
Málaga
Riga
Nice
Palma de Mallorca
Duisburg
Wroclaw
Zaragoza
Florence
Amsterdam
CopenhagenViennaStockholmOslo
Zurich
San Francisco
Melbourne
Helsinki
Boston
Munich
Frankfurt
Hamburg
Auckland
Göteborg
Dublin
Montreal
Ottawa
Milan
Phoenix
RotterdamLisbon Prague
Brussels
San Diego
Düsseldorf
Cologne
Denver
Stuttgart
Vancouver
Lyon
Seattle
Valencia
San Antonio
BirminghamGlasgow
Warsaw
BaltimoreAntwerp
Budapest
RomeSeville
Manchester
Leeds
Tel Aviv
MarseillePorto
Montevideo
LiverpoolNottingham
Zagreb
Lille
Bucharest
Bilbao
Turin
MinskKiev
San José
Panama
Sofia
Naples
Belgrade
BrasíliaJerusalem
Tbilisi
Rosario
Abu Dhabi
Doha
Almaty
Baku
Medellín
Córdoba
Quito
Curitiba
SalvadorSanto Domingo
Asunción
Kuwait City
La PazSanta Cruz
Cali
Guayaquil
Casablanca
Novosibirsk
Tunis
Cape Town
Guatemala CityNairobi
Rabat
Douala
Caracas
Singapore
Berlin
Hong Kong
Chicago
Toronto
Sydney
Washington Madrid
BarcelonaTaipei
Miami
Dallas
Philadelphia
Houston
SantiagoNagoya
Dubai
Kuala LumpurBogotáSaint Petersburg
Ankara
Amman
Belo Horizonte
Johannesburg
Lahore
LondonNew York
Paris
Tokyo
Seoul
Los Angeles
Shanghai
Osaka
Buenos AiresBeijing
Moscow
BangkokGuangzhou
Istanbul
Shenzhen
Ho Chi Minh City
Mexico City
Rio de Janeiro
São Paulo
LimaJakarta
Bangalore
Tianjin
Mumbai
Cairo
New Delhi
KolkataLagos
Karachi
Less than 600.000 Between 600.000 and 1 millon Between 1 million and 5 million Between 5 and 10 million More than 10 million
Techno
logy
rank
ing
Social cohesion ranking
600,000 600,000
Figure 11. Technology and Social Cohesion Dimensions
the smaller cities (of fewer than 1 million inhabitants) show a relatively good performance in social cohesion. This is the case with Basel, Bern, Wellington and Linz. In the bottom left quadrant, we find cities with a poor performance in both dimensions, such as Brasília, Cape Town, Santo Domingo and New Delhi, all located in emerging countries.

IESE Business School - IESE Cities in Motion Index / ST-509-E62
Figure 12 sets out the relationship between the economy and international outreach. Here we observe the following pattern: the cities either perform well in the two dimensions or, on the other hand, perform poorly in both. This allows us to see the relationship between the dimensions, where, in this case, a good performance in the economy could translate into good international outreach or, on the contrary, a bad performance in the economy manifests itself in less international outreach. So, it is not strange to find that, of the cities considered in the index, there are none with a good performance in
Reykjavík
WellingtonBasel
Bern
Geneva
Eindhoven
Tallinn
Linz
Ljubljana
MurciaA Coruña
Sarajevo
Edinburgh
Quebec
BratislavaVilnius
Málaga
Riga
Nice
Palma de Mallorca
Duisburg
Wroclaw
Zaragoza Florence
Amsterdam
Copenhagen
Vienna
StockholmOslo
Zurich
San Francisco
MelbourneHelsinki
Boston
Munich
FrankfurtHamburg
AucklandGöteborg
Dublin
MontrealOttawa
Milan
Phoenix
RotterdamLisbon
Prague
Brussels
San Diego
DüsseldorfCologne
Denver
Stuttgart
Vancouver
Lyon
Seattle
Valencia
San Antonio
Birmingham
Glasgow
Warsaw
Baltimore
Antwerp
Budapest
Rome
Seville
Manchester
Leeds
Tel Aviv
MarseillePorto
MontevideoLiverpool
Nottingham
Zagreb
Lille
Bucharest
Bilbao
TurinMinskKiev
San José
Panama
Sofia
Naples
Belgrade
Brasília
Jerusalem
Tbilisi
Rosario
Abu Dhabi
Doha
Almaty
BakuMedellín
Córdoba
Quito
CuritibaSalvador
Santo Domingo
Asunción
Kuwait City
La PazSanta Cruz
Cali Guayaquil
Casablanca
Novosibirsk
Tunis Cape Town
Guatemala City
Nairobi
RabatDouala Caracas
Singapore
Berlin
Hong Kong
Chicago
Toronto
Sydney
Washington
Madrid
Barcelona
Taipei
Miami
Dallas
Philadelphia Houston
SantiagoNagoya Dubai
Kuala Lumpur
Bogotá
Saint Petersburg
Ankara
AmmanBelo HorizonteJohannesburg
Lahore
London
New YorkParis
Tokyo
Seoul
Los Angeles
Shanghai
Osaka
Buenos Aires
Beijing
Moscow
Bangkok
Guangzhou
IstanbulShenzhen
Ho Chi Minh City
Mexico City
Rio de Janeiro
São Paulo
Lima
Jakarta
BangaloreTianjin
Mumbai
Cairo
New Delhi
KolkataLagos
Karachi
Less than 600.000 Between 600.000 and 1 millon Between 1 million and 5 million Between 5 and 10 million More than 10 million
International outreach ranking
Econ
omyrank
ing
600,000 600,000
Figure 12. Economy and International Outreach Dimensions
the economy and a bad one in international outreach. In the opposite case, we find only exceptional examples—such as Buenos Aires and Palma de Mallorca—that do not achieve good positions in the economy but do perform well in international outreach. Among those cities that perform well in both dimensions are the US cities New York, Los Angeles, Chicago and San Francisco; the European cities Paris, London and Amsterdam; and the Asian cities Tokyo, Seoul, Singapore and Hong Kong. The cities with a poor performance in both dimensions, include Tunis, Asunción, Sarajevo and Córdoba.
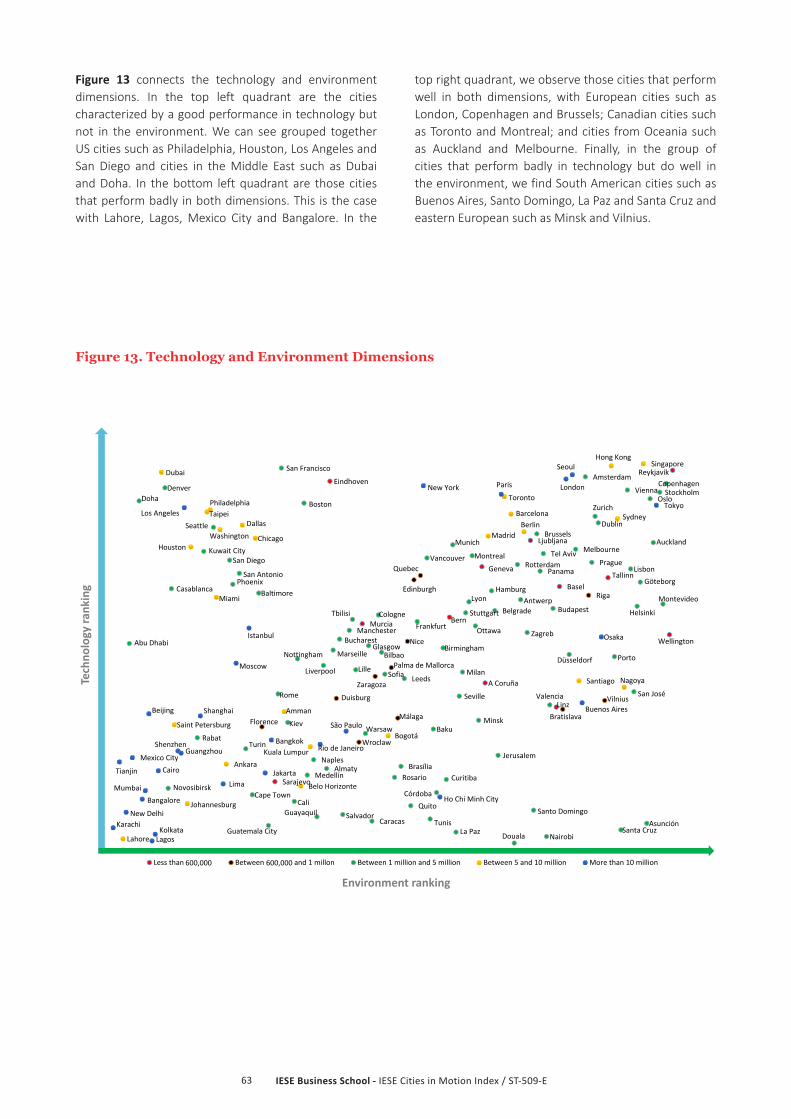
IESE Business School - IESE Cities in Motion Index / ST-509-E63
Figure 13 connects the technology and environment dimensions. In the top left quadrant are the cities characterized by a good performance in technology but not in the environment. We can see grouped together US cities such as Philadelphia, Houston, Los Angeles and San Diego and cities in the Middle East such as Dubai and Doha. In the bottom left quadrant are those cities that perform badly in both dimensions. This is the case with Lahore, Lagos, Mexico City and Bangalore. In the
Reykjavík
Wellington
Basel
Bern
Geneva
Eindhoven
Tallinn
Linz
Ljubljana
Murcia
A Coruña
Sarajevo
Edinburgh
Quebec
Bratislava
Vilnius
Málaga
Riga
Nice
Palma de Mallorca
Duisburg
Wroclaw
Zaragoza
Florence
AmsterdamCopenhagen
Vienna StockholmOslo
Zurich
San Francisco
Melbourne
Helsinki
Boston
Munich
Frankfurt
Hamburg
Auckland
Göteborg
Dublin
Montreal
Ottawa
Milan
Phoenix
Rotterdam LisbonPrague
Brussels
San Diego
Düsseldorf
Cologne
Denver
Stuttgart
Vancouver
Lyon
Seattle
Valencia
San Antonio
BirminghamGlasgow
Warsaw
BaltimoreAntwerp
Budapest
Rome Seville
Manchester
Leeds
Tel Aviv
Marseille Porto
Montevideo
Liverpool
Nottingham
Zagreb
Lille
Bucharest
Bilbao
Turin
MinskKiev
San José
Panama
Sofia
Naples
Belgrade
BrasíliaJerusalem
Tbilisi
Rosario
Abu Dhabi
Doha
Almaty
Baku
Medellín
CórdobaQuito
Curitiba
Salvador Santo DomingoAsunción
Kuwait City
La Paz Santa Cruz
CaliGuayaquil
Casablanca
Novosibirsk
Tunis
Cape Town
Guatemala CityNairobi
Rabat
Douala
Caracas
Singapore
Berlin
Hong Kong
Chicago
Toronto
Sydney
Washington Madrid
BarcelonaTaipei
Miami
Dallas
Philadelphia
Houston
Santiago Nagoya
Dubai
Kuala Lumpur
BogotáSaint Petersburg
Ankara
Amman
Belo Horizonte
Johannesburg
Lahore
LondonNew York Paris
Tokyo
Seoul
Los Angeles
Shanghai
Osaka
Buenos AiresBeijing
Moscow
BangkokGuangzhou
Istanbul
Shenzhen
Ho Chi Minh City
Mexico CityRio de Janeiro
São Paulo
LimaJakarta
Bangalore
Tianjin
Mumbai
Cairo
New Delhi
KolkataLagos
Karachi
Less than 600.000 Between 600.000 and 1 millon Between 1 million and 5 million Between 5 and 10 million More than 10 million
Techno
logy
rank
ing
Environment ranking
600,000 600,000
Figure 13. Technology and Environment Dimensions
top right quadrant, we observe those cities that perform well in both dimensions, with European cities such as London, Copenhagen and Brussels; Canadian cities such as Toronto and Montreal; and cities from Oceania such as Auckland and Melbourne. Finally, in the group of cities that perform badly in technology but do well in the environment, we find South American cities such as Buenos Aires, Santo Domingo, La Paz and Santa Cruz and eastern European such as Minsk and Vilnius.

IESE Business School - IESE Cities in Motion Index / ST-509-E64
Cities in Motion: A Dynamic Analysis
To assess the growth trends and potential of the different cities, we have created a figure that seeks to capture these aspects. Thus, Figure 14 sets out the current position of each of the cities considered in the CIMI (x-axis) and the trend (y-axis). As a measure to calculate the latter value, the change in position experienced between 2016 and 2018 by the cities in this study’s ranking has been used. This means that those cities in the top part of the figure have improved in position while those in the bottom part have dropped position. Consequently, in the center are those that have not experienced significant changes in their position in the years analyzed.
The figure’s area has been divided into four quadrants according to the type of city: consolidated, challenger, potential, and vulnerable.
The first group, that of consolidated cities (bottom right quadrant), includes those that, although they have a middle to high overall position, have not experienced any changes throughout the period or have lost a few positions. It is made up of cities from different
geographical regions: Philadelphia, Vancouver, San Francisco and Toronto (North America); Berlin, Göteborg, Brussels, Birmingham, Stuttgart, Rome, Stockholm, Madrid, Milan, Lyon, Valencia, Düsseldorf and Glasgow (Europe); Wellington and Melbourne (Oceania); and Taipei (Asia).
The second group, that of challenger cities (top right quadrant), is made up of those that have improved their positions in the index at a fast rate and are already in the middle to high area of the classification. Some examples are Warsaw, Eindhoven, Dallas, Hong Kong, Basel, Ottawa, San Diego, San Antonio, Houston, Buenos Aires, Barcelona, Chicago and Frankfurt.
The third group is made up of those cities that show great potential and that, despite their current position in the middle to low area of the index, are evolving positively at great speed (top left quadrant). They are cities such as Minsk, Dubai, Wrocław, Córdoba, Belo Horizonte and Murcia; Latin American capitals such as Brasília, Bogotá and Montevideo; and Asian cities such as Bangkok and Kuala Lumpur.
The final group includes those that are in a vulnerable position (bottom left quadrant), are growing at a slower pace than the rest and are in the middle to low position of the classification, such as Mexico City, Cape Town and Sarajevo.
Figure 14. Current Position of the Cities in the CIMI and Their Trend
Consolidated
ChallengersPotential
Tren
d
Current position
Vulnerable
London
New York
Amsterdam
Paris
Reykjavíc
TokyoSingapore
Copenhagen
Berlin
Vienna
Hong Kong
Seoul
Stockholm
Oslo
Zurich
Los Angeles
Chicago
Toronto
Sydney
Melbourne
San Francisco
Helsinki
Washington
Madrid
Boston
Wellington
Munich
Barcelona
Basel
Taipei
Bern
Geneva
Frankfurt
Hamburg
Auckland
Göteborg
Dublin
Montreal
Ottawa
Miami
Milan
Phoenix
Rotterdam
Lisbon
Dallas
Edinburgh
Prague
Brussels
San Diego
Düsseldorf
Cologne
Denver
Stuttgart
Philadelphia
Vancouver
Lyon
Eindhoven
Seattle
Shanghai
Houston
Valencia
San Antonio
Birmingham
Glasgow
Tallinn
Santiago
Quebec
Osaka
Warsaw
Bratislava
Baltimore
AntwerpBudapest
Vilnius
Rome
Seville
Buenos Aires
ManchesterLeeds
MálagaTel Aviv
Nagoya
Beijing
Riga
NiceMoscow
Linz
Palma de Mallorca
Marseille
Duisburg
Porto
Montevideo
Ljubljana
Liverpool
Wroclaw
Nottingham
Zagreb
Lille
Dubai
Kuala Lumpur
Zaragoza
A Coruña
Bucharest
Bangkok
Murcia
Athens
BilbaoFlorence
Turin
Minsk
KievSan José
Guangzhou
Panama
Sofia
Naples
Bogotá
Istanbul
Shenzhen
Belgrade
Saint Petersburg
Ho Chi Minh City
Jerusalem
Tbilisi
Rosario
Doha
Abu Dhabi
Rio de Janeiro
Almaty
Brasília
Baku
São Paulo
Mexico City
Medellín
Ankara
Córdoba
Quito
Lima
Santo Domingo
Curitiba
Asunción
Jakarta
Kuwait City
Sarajevo
La PazSalvador
Santa Cruz
Cali
Skopje
Amman
Belo Horizonte
Guayaquil
Bangalore
Tianjin
Casablanca
Novosibirsk
Tunis
Cape Town
Manama
Guatemala City
Mumbai
Nairobi
Manila
Riyadh
CairoNew Delhi
Johannesburg
Rabat
Kolkata
Douala
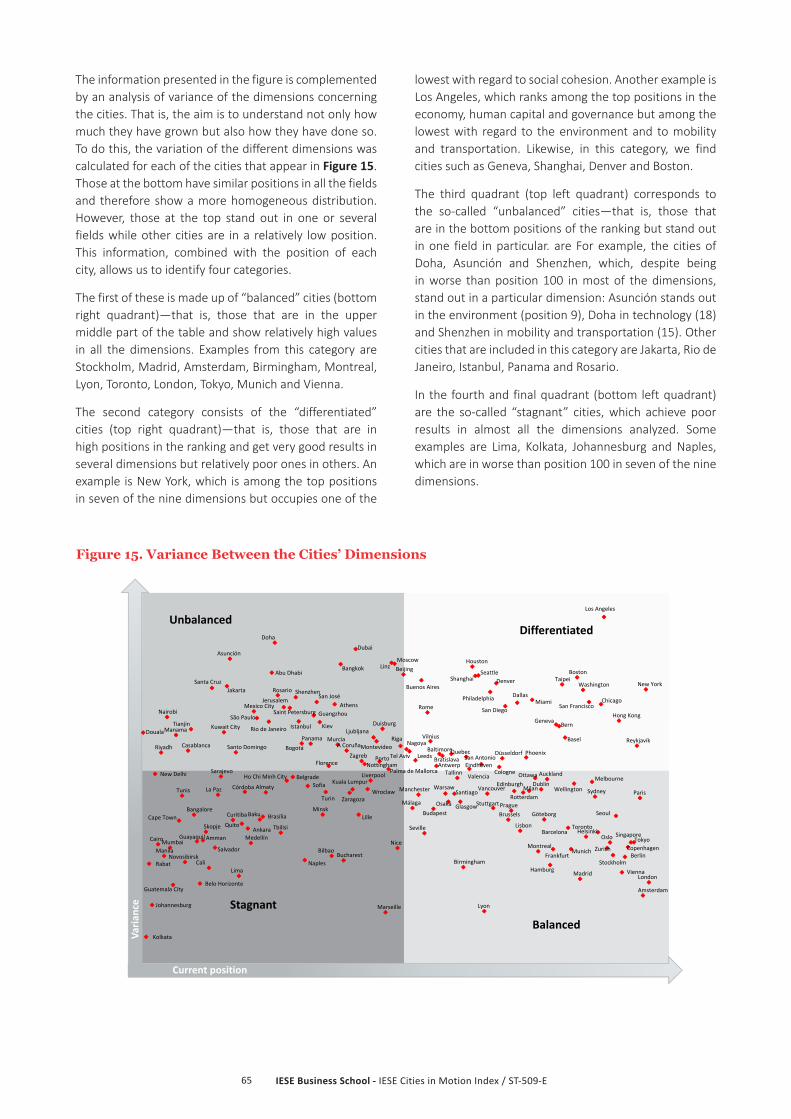
IESE Business School - IESE Cities in Motion Index / ST-509-E65
The information presented in the figure is complemented by an analysis of variance of the dimensions concerning the cities. That is, the aim is to understand not only how much they have grown but also how they have done so. To do this, the variation of the different dimensions was calculated for each of the cities that appear in Figure 15. Those at the bottom have similar positions in all the fields and therefore show a more homogeneous distribution. However, those at the top stand out in one or several fields while other cities are in a relatively low position. This information, combined with the position of each city, allows us to identify four categories.
The first of these is made up of “balanced” cities (bottom right quadrant)—that is, those that are in the upper middle part of the table and show relatively high values in all the dimensions. Examples from this category are Stockholm, Madrid, Amsterdam, Birmingham, Montreal, Lyon, Toronto, London, Tokyo, Munich and Vienna.
The second category consists of the “differentiated” cities (top right quadrant)—that is, those that are in high positions in the ranking and get very good results in several dimensions but relatively poor ones in others. An example is New York, which is among the top positions in seven of the nine dimensions but occupies one of the
lowest with regard to social cohesion. Another example is Los Angeles, which ranks among the top positions in the economy, human capital and governance but among the lowest with regard to the environment and to mobility and transportation. Likewise, in this category, we find cities such as Geneva, Shanghai, Denver and Boston.
The third quadrant (top left quadrant) corresponds to the so-called “unbalanced” cities—that is, those that are in the bottom positions of the ranking but stand out in one field in particular. are For example, the cities of Doha, Asunción and Shenzhen, which, despite being in worse than position 100 in most of the dimensions, stand out in a particular dimension: Asunción stands out in the environment (position 9), Doha in technology (18) and Shenzhen in mobility and transportation (15). Other cities that are included in this category are Jakarta, Rio de Janeiro, Istanbul, Panama and Rosario.
In the fourth and final quadrant (bottom left quadrant) are the so-called “stagnant” cities, which achieve poor results in almost all the dimensions analyzed. Some examples are Lima, Kolkata, Johannesburg and Naples, which are in worse than position 100 in seven of the nine dimensions.
Varia
nce Stagnant
Unbalanced
Balanced
Differentiated
Current position
London
New York
Amsterdam
Paris
Reykjavík
TokyoSingapore
CopenhagenBerlin
Vienna
Hong Kong
Seoul
Stockholm
Oslo
Zurich
Los Angeles
Chicago
Toronto
Sydney
Melbourne
San Francisco
Helsinki
Washington
Madrid
Boston
Wellington
Munich
Barcelona
Basel
Taipei
BernGeneva
Frankfurt
Hamburg
Auckland
Göteborg
Dublin
Montreal
Ottawa
Miami
Milan
Phoenix
Rotterdam
Lisbon
Dallas
Edinburgh
PragueBrussels
San Diego
Düsseldorf
Cologne
Denver
Stuttgart
Philadelphia
Vancouver
Lyon
Eindhoven
SeattleShanghai
Houston
Valencia
San Antonio
Birmingham
Glasgow
Tallinn
Santiago
Quebec
Osaka
Warsaw
Bratislava
Baltimore
Antwerp
Budapest
Vilnius
Rome
Seville
Buenos Aires
Manchester
Leeds
Málaga
Tel Aviv
Nagoya
Beijing
Riga
Nice
MoscowLinz
Palma de Mallorca
Marseille
Duisburg
Porto
Montevideo
Ljubljana
Liverpool
Wroclaw
NottinghamZagreb
Lille
Dubai
Kuala Lumpur
Zaragoza
A Coruña
Bucharest
Bangkok
Murcia
Athens
Bilbao
Florence
Turin
Minsk
Kiev
San José
Guangzhou
Panama
Sofia
Naples
Bogotá
Istanbul
Shenzhen
Belgrade
Saint Petersburg
Ho Chi Minh City
Jerusalem
Tbilisi
Rosario
Doha
Abu Dhabi
Rio de Janeiro
Almaty
BrasíliaBaku
São Paulo
Mexico City
MedellínAnkara
Córdoba
Quito
Lima
Santo Domingo
Curitiba
Asunción
Jakarta
Kuwait City
Sarajevo
La Paz
Salvador
Santa Cruz
Cali
Skopje
Amman
Belo Horizonte
Guayaquil
Bangalore
Tianjin
Casablanca
Novosibirsk
Tunis
Cape Town
Manama
Guatemala City
Mumbai
Nairobi
Manila
Riyadh
Cairo
New Delhi
Johannesburg
Rabat
Kolkata
Douala
Figure 15. Variance Between the Cities’ Dimensions

IESE Business School - IESE Cities in Motion Index / ST-509-E66
Recommendations and Conclusions
The CIMI synthetic index makes it possible, through an objective calculation methodology, to compile a ranking of cities taking into account various aspects. The different dimensions analyzed offer a broad and holistic vision of what a city represents, while allowing greater understanding of its composition and its evolution over time.
The results of the index and our experience of using it to assess different cities allow us to make the following recommendations and reach some significant conclusions:
Size matters (although not so much). This new edition of the CIMI makes clear that large cities occupy leading positions in the ranking. The first 10 positions are held by megacities such as London, New York, Paris and Tokyo. However, among the top positions some medium-sized cities also stand out such as Amsterdam, Vienna and Copenhagen and even small cities, as in the case of Reykjavík in particular. These results reveal that size is not a prerequisite for achieving top positions in the ranking.
Finding the right balance is a complex (and permanent) process. The report’s dynamic analysis shows that only a select number of cities is capable of doing well in all the dimensions. For instance, London, Amsterdam, Seoul and Vienna stand out in this regard. Many struggle to balance their performance across the different fields but lose that battle. For example, when analyzing the relationship between the dimensions of technology and the environment, we can observe how several US cities perform relatively well in the former dimension but fail in the latter. So they could use as benchmarks other cities, such as Singapore, which are able to perform well in both dimensions, and identify practices applicable to their situation. Something similar comes to light when studying the relationship between the economy and social cohesion. It can be observed in this respect that many cities that are capable of reaching high economic levels (in average terms) are, at the same time, more inequitable and unequal. This aspect, which seems prevalent in large cities—such as Hong Kong, New York, Houston and Bangkok—must be managed properly as it can generate tensions and conflict between different strata in society. To do so, it is essential to understand the relationships and interactions between the different dimensions of a city and to identify where the trade-offs
are with the aim of looking for creative ways to resolve them. Undoubtedly, one of the great challenges for cities in the 21st century is to transform themselves into urban areas that are simultaneously prosperous, equitable and inclusive. This goal is essentially a permanent, holistic and long-term process.
An all-embracing vision is necessary. Related to the previous point, the CIMI makes clear that it is not enough to be good in only one dimension. There are cities at the top of the ranking in some dimensions, such as Asunción, Abu Dhabi, Moscow and Kiev, which do relatively well in the environment, social cohesion, human capital and urban planning respectively but, in the overall classification, are located in positions 141, 127, 86 and 111, again respectively. These cities—called “unbalanced” in the analysis of variance—are recommended to be capable of reaching acceptable minimums in the dimensions as a whole if they seek to play in the big leagues. This message must also reach those cities that understand technology to be the main (or only) ingredient of a smart city and do not take into account other critical fields that define the urban situation. If a city does not see the whole picture, it will be difficult for it to become a smart city.
A long-term vision is necessary. Cities need to define their identity and establish a strategic plan. One of the most important (and difficult) questions that must be asked is what kind of city they want in the future. The answer will not only define their identity but also set out the path of transformation that they must travel to achieve it. That is, they must consider what their strategic plan will be. In fact, a sound strategic plan will prevent changes that may veer the city away from its identity as circumstances or governments change, and the plan must be unique and individual for each city. This means that local governments must escape from the one-size-fits-all approach and define a specific long-term vision for their city. The CIMI makes clear that there is no single model of success.
Strategic priorities must be established. In relation to the previous point, the CIMI shows that the cities that top the ranking are not only not identical but they prioritize various dimensions. (See Appendix 2.) Moreover, there are several paths to get to the top of the index. Establishing and defining strategic priorities whose goal is to achieve the long-term vision defined in

IESE Business School - IESE Cities in Motion Index / ST-509-E67
the strategic plan mentioned previously will strengthen the city’s capacity for organization and action, as well as its ability to achieve those goals successfully.
The first step is a good diagnosis. One of the first activities that must be carried out in any strategic definition is to understand where we are. In this regard, the CIMI can be used as a diagnostic tool to do a first assessment of the current status of the city in the different dimensions of our model. Likewise, it allows a quick X-ray to be taken of the cities to identify their strengths and point out where there may be room for improvement.
The benchmark is the beginning of change. The ability to compare 174 cities across nine different dimensions helps us to identify those that perform best in the different urban aspects. In this sense, cities that are lagging behind or stagnant in one or more dimensions can study the best in each category with the aim of identifying the practices that will improve their performance. This comparison will allow cities to start moving in the right direction. That said, it must be borne in mind that, while the challenges facing cities are global, their effects are local. Therefore, the benchmark should serve as a source of inspiration rather than as a road map for action. In this regard, at IESE Cities in Motion, we have published a series of books—available on Amazon—that identify good practices across the different dimensions and we invite the public to read them.
The CIMI is not a “beauty contest.” It has surprised us to see how many cities included in the index are more concerned about their position in the ranking than the analysis that can be derived from it. Our perspective is that the value of the CIMI lies not only in its ability to detect strengths and weaknesses but also in its temporal component, which makes it possible to identify where each city is heading toward. In this regard, our recommendation to urban managers is that they pay more attention to the trend (dynamic analysis) than to the position.
Collaboration is the cornerstone of success. Our experience from IESE Cities in Motion and the associated platform PPP for Cities (www.pppcities.org) tells us that the cities that do best in the ranking understand fully that the challenges facing them are too big to be tackled individually. Collaboration is needed between different social partners—public, private, educational institutions, or nonprofit organizations—and, although it can adopt various formats (from public-private partnerships to collaborative economy structures), it is essential for achieving long-term success. Ideas of collaboration and cooperation should be extended within city councils themselves, where there are often “silos” that prevent people from seeing the relationships and the possible synergies among the different dimensions of our conceptual model. Finally, we ask that cities collaborate
with each other, especially those that, in addition to being in proximity, share infrastructures and services. In this way, they will achieve more efficient urban systems.
The participation of the public must be a tool for transformation. In addition, the collaboration mentioned in the previous point must be fluid between residents and the administration because, otherwise, any solutions adopted will not be efficient when it comes to responding to society’s real needs. More and more cities are becoming aware of the importance of involving the public in the processes of transforming and managing them, as reflected in the proliferation of initiatives such as participatory budgets and digital participation platforms, where members of the public can give their opinions, make suggestions and, in short, have a voice in the definition and execution of strategic plans.
There are many good cities but the perfect city does not exist. It is very difficult for a single city to maximize all the dimensions. Even those cities in the top positions of the rankings have weak points. Cities such as New York and Los Angeles have a long way to go with regard to social cohesion and the environment. Therefore, they have been classified as “differentiated” and so we recommend that they make the most of the advantages they have in the fields in which they are leaders in order to progress in the positions where they are lagging behind more. For example, a city can make the most of its technological leadership to improve its results in terms of the environment. In addition, for the cities that we have classified as “balanced,” the main recommendation is that they should not rest on their laurels. Despite their more harmonious growth, they still have room for improvement.
Change is slow for most of the cities. While our temporal analysis of the CIMI indicates that some cities are capable of making great advances in a relatively short time and of moving to higher positions quickly (Oslo, Dallas, San Diego and Frankfurt, for example), in general it shows us that, in most cases, cities’ positions in the ranking have not changed significantly from one year to the next. This is due, to a large extent, to the time that projects of any magnitude need to crystallize. Therefore, when seeking to generate changes needed to become smart and sustainable, cities should adopt long-term policies as soon as possible—especially the worst-placed cities, which we have called “stagnant” in our analysis. There are many cities that still have problems when it comes to dealing with the major challenges, including the lack of collaboration between public and private bodies and between civic institutions and the public; the impossibility of promoting new business models that could provide financing for new businesses; and a shortsighted vision of smart cities.
IESE Business School - IESE Cities in Motion Index / ST-509-E68
The urbanization process is one of the most significant challenges of the 21st century. As the world population moves toward cities, existing problems grow and new ones are generated that, in turn, are influenced profoundly by the globalization process. This trend means a closer relationship between global dynamics and cities, which generates local impacts: effects on the economy and demographics, social divisions or environmental impacts.
Despite these challenges, cities and their leaders should understand the positive aspect that these generate. From our perspective, the city offers a much more delimited sphere of action, which enables work to be done more directly for people’s benefit. However, urban managers must take a step back and analyze their problems, try to discover what other cities do, and learn what good practices are being carried out elsewhere in the world. Day-to-day management makes it difficult for cities to ask themselves how to promote the positive effects of the urbanization process and reduce the negative ones. For this reason, from the IESE Cities in Motion platform, we want to create awareness and generate innovative tools with the goal of achieving smarter governments. With this index, we hope to have contributed to this aim.

IESE Business School - IESE Cities in Motion Index / ST-509-E69
No. Indicator Description / Unit of measurement Dimension Source
1 Higher education Proportion of population with secondary and higher education. Human capital Euromonitor
2 Business schools Number of business schools (top 100). Human capital Financial Times
3 Movement of students International movement of higher-level students. Number of students. Human capital UNESCO
4 Universities Number of universities in the city that are in the top 500. Human capital QS Top Universities
5 Museums and art galleries Number of museums and art galleries per city. Human capital OpenStreetMap
6 Schools Number of public or private schools per city. Human capital OpenStreetMap
7 Theaters Number of theaters per city. Human capital OpenStreetMap
8 Expenditure on leisure and recreation Expenditure on leisure and recreation per capita. Human capital Euromonitor
9 Expenditure on leisure and recreation Expenditure on leisure and recreation. In millions of dollars, according to 2016 prices. Human capital Euromonitor
10 Expenditure on education Expenditure on education per capita. Human capital Euromonitor
11 Mortality Ratio of deaths per 100,000 inhabitants. Social cohesion Euromonitor
12 Crime rate Crime rate. Social cohesion Numbeo
13 Health Health index. Social cohesion Numbeo
14 Unemployment Unemployment rate (number of unemployed out of the workforce). Social cohesion Euromonitor
15 Gini indexMeasure of social inequality. It varies from 0 to 100, with 0 being a situation of perfect equality and 100 that of perfect inequality.
Social cohesion Euromonitor
16 Price of property Price of property as percentage of income. Social cohesion Numbeo
17 Female workers Ratio of female workers in the public administration. Social cohesion International Labour Organization (ILO)
18 Global Peace Index
An index that measures the peacefulness and the absence of violence in a country or region. The bottom-ranking positions correspond to countries with a high level of violence.
Social cohesionInstitute for Economics and Peace
19 Hospitals Numbers of public and private hospitals and health centers per city. Social cohesion OpenStreetMap
20 Happiness indexAn index that measures the level of happiness of a country. The highest values correspond to countries that have a higher degree of overall happiness.
Social cohesion World Happiness Index
Appendix 1. Indicators
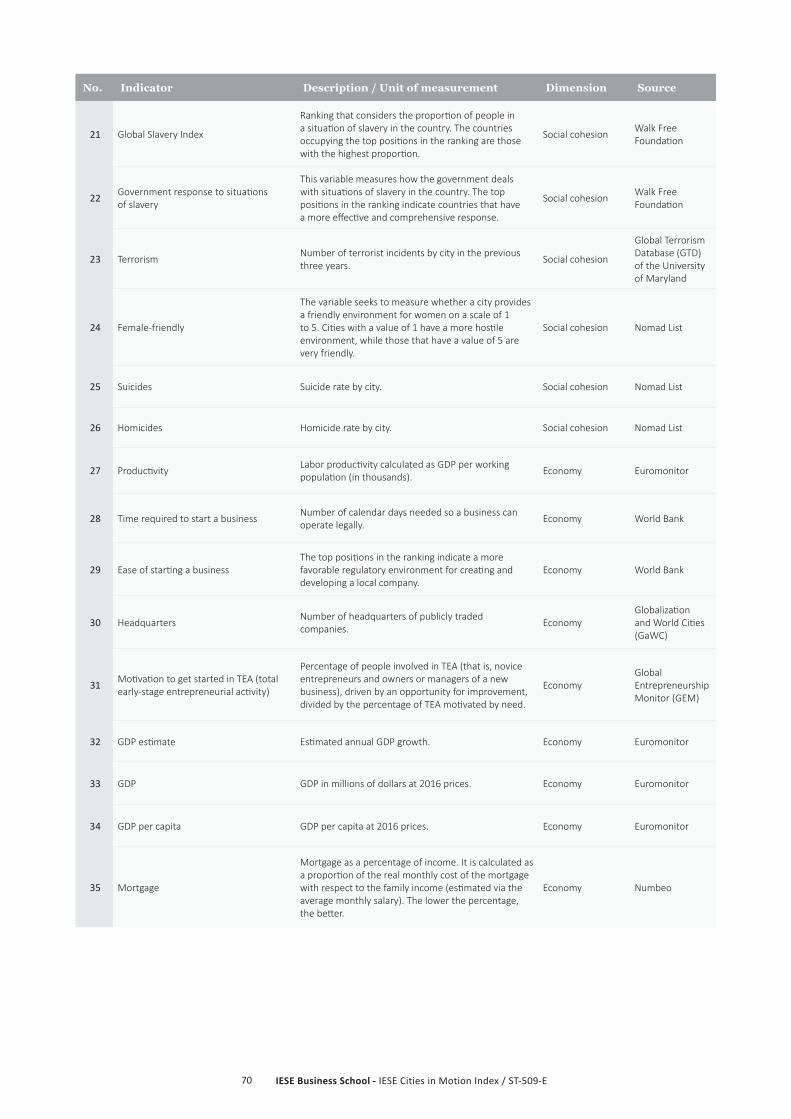
IESE Business School - IESE Cities in Motion Index / ST-509-E70
No. Indicator Description / Unit of measurement Dimension Source
21 Global Slavery Index
Ranking that considers the proportion of people in a situation of slavery in the country. The countries occupying the top positions in the ranking are those with the highest proportion.
Social cohesion Walk Free Foundation
22 Government response to situations of slavery
This variable measures how the government deals with situations of slavery in the country. The top positions in the ranking indicate countries that have a more effective and comprehensive response.
Social cohesion Walk Free Foundation
23 Terrorism Number of terrorist incidents by city in the previous three years. Social cohesion
Global Terrorism Database (GTD) of the University of Maryland
24 Female-friendly
The variable seeks to measure whether a city provides a friendly environment for women on a scale of 1 to 5. Cities with a value of 1 have a more hostile environment, while those that have a value of 5 are very friendly.
Social cohesion Nomad List
25 Suicides Suicide rate by city. Social cohesion Nomad List
26 Homicides Homicide rate by city. Social cohesion Nomad List
27 Productivity Labor productivity calculated as GDP per working population (in thousands). Economy Euromonitor
28 Time required to start a business Number of calendar days needed so a business can operate legally. Economy World Bank
29 Ease of starting a businessThe top positions in the ranking indicate a more favorable regulatory environment for creating and developing a local company.
Economy World Bank
30 Headquarters Number of headquarters of publicly traded companies. Economy
Globalization and World Cities (GaWC)
31 Motivation to get started in TEA (total early-stage entrepreneurial activity)
Percentage of people involved in TEA (that is, novice entrepreneurs and owners or managers of a new business), driven by an opportunity for improvement, divided by the percentage of TEA motivated by need.
EconomyGlobal Entrepreneurship Monitor (GEM)
32 GDP estimate Estimated annual GDP growth. Economy Euromonitor
33 GDP GDP in millions of dollars at 2016 prices. Economy Euromonitor
34 GDP per capita GDP per capita at 2016 prices. Economy Euromonitor
35 Mortgage
Mortgage as a percentage of income. It is calculated as a proportion of the real monthly cost of the mortgage with respect to the family income (estimated via the average monthly salary). The lower the percentage, the better.
Economy Numbeo

IESE Business School - IESE Cities in Motion Index / ST-509-E71
No. Indicator Description / Unit of measurement Dimension Source
36 Glovo The variable assumes the value of 1 if the city has the Glovo service and 0 otherwise. Economy Glovo
37 Uber The variable assumes the value of 1 if the city has the Uber service and 0 otherwise. Economy Uber
38 Salary Hourly wage in the city. Economy Euromonitor
39 Purchasing powerPurchasing power (determined by the average salary) for the purchase of goods and services in the city, compared with the purchasing power in New York City.
Economy Numbeo
40 Reserves Total reserves in millions of current dollars. Estimate at urban level according to the population. Governance World Bank
41 Reserves per capita Reserves per capita in millions of current dollars. Governance World Bank
42 Embassies Number of embassies and consulates per city. Governance OpenStreetMap
43 ISO 37120 certification
This establishes whether or not the city has ISO 37120 certification. Certified cities are committed to improving their services and quality of life. It is a variable coded from 0 to 6. Cities that have been certified for the longest time have the highest value. The value 0 is for those cities without certification.
Governance World Council on City Data (WCCD)
44 Research centers Number of research and technology centers per city. Governance OpenStreetMap
45 Government buildings Number of government buildings and premises in the city. Governance OpenStreetMap
46 Strength of legal rights index
The strength of legal rights index measures the degree to which collateral and bankruptcy laws protect the rights of borrowers and lenders and thus facilitate access to loans. The values go from 0 (low) to 12 (high), where the highest ratings indicate that the laws are better designed to expand access to credit.
Governance World Bank
47 Corruption perceptions indexCountries with values close to 0 are perceived as very corrupt and those with an index close to 100 as very transparent.
Governance Transparency International
48 Open data platform This describes whether the city has an open data system. Governance
CTIC Foundation and Open World Bank
49 E-Government Development Index (EGDI)
The EGDI reflects how a country uses information technology to promote access and inclusion for its citizens.
Governance United Nations
50 Democracy ranking Ranking where the countries in the highest positions are those considered more democratic. Governance The Economist
Intelligence Unit
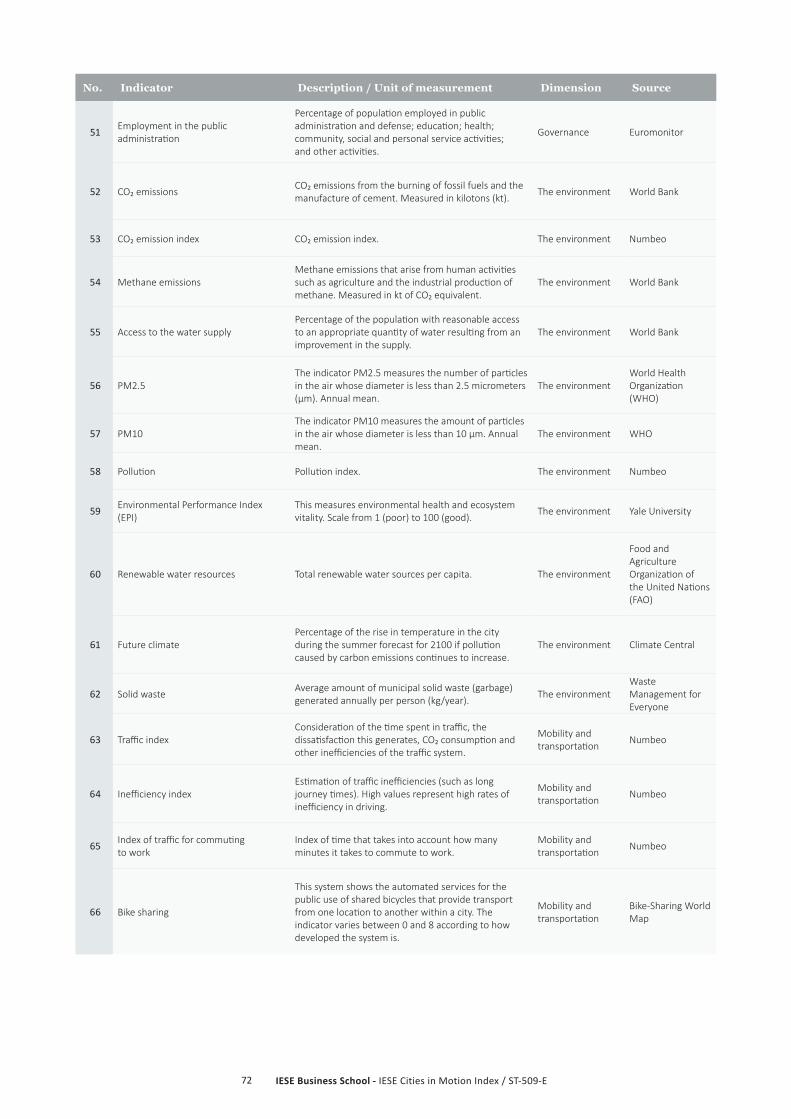
IESE Business School - IESE Cities in Motion Index / ST-509-E72
No. Indicator Description / Unit of measurement Dimension Source
51 Employment in the public administration
Percentage of population employed in public administration and defense; education; health; community, social and personal service activities; and other activities.
Governance Euromonitor
52 CO₂ emissions CO₂ emissions from the burning of fossil fuels and the manufacture of cement. Measured in kilotons (kt). The environment World Bank
53 CO₂ emission index CO₂ emission index. The environment Numbeo
54 Methane emissionsMethane emissions that arise from human activities such as agriculture and the industrial production of methane. Measured in kt of CO₂ equivalent.
The environment World Bank
55 Access to the water supplyPercentage of the population with reasonable access to an appropriate quantity of water resulting from an improvement in the supply.
The environment World Bank
56 PM2.5The indicator PM2.5 measures the number of particles in the air whose diameter is less than 2.5 micrometers (µm). Annual mean.
The environmentWorld Health Organization (WHO)
57 PM10 The indicator PM10 measures the amount of particles in the air whose diameter is less than 10 µm. Annual mean.
The environment WHO
58 Pollution Pollution index. The environment Numbeo
59 Environmental Performance Index (EPI)
This measures environmental health and ecosystem vitality. Scale from 1 (poor) to 100 (good). The environment Yale University
60 Renewable water resources Total renewable water sources per capita. The environment
Food and Agriculture Organization of the United Nations (FAO)
61 Future climatePercentage of the rise in temperature in the city during the summer forecast for 2100 if pollution caused by carbon emissions continues to increase.
The environment Climate Central
62 Solid waste Average amount of municipal solid waste (garbage) generated annually per person (kg/year). The environment
Waste Management for Everyone
63 Traffic index Consideration of the time spent in traffic, the dissatisfaction this generates, CO₂ consumption and other inefficiencies of the traffic system.
Mobility and transportation Numbeo
64 Inefficiency indexEstimation of traffic inefficiencies (such as long journey times). High values represent high rates of inefficiency in driving.
Mobility and transportation Numbeo
65 Index of traffic for commuting to work
Index of time that takes into account how many minutes it takes to commute to work.
Mobility and transportation Numbeo
66 Bike sharing
This system shows the automated services for the public use of shared bicycles that provide transport from one location to another within a city. The indicator varies between 0 and 8 according to how developed the system is.
Mobility and transportation
Bike-Sharing World Map
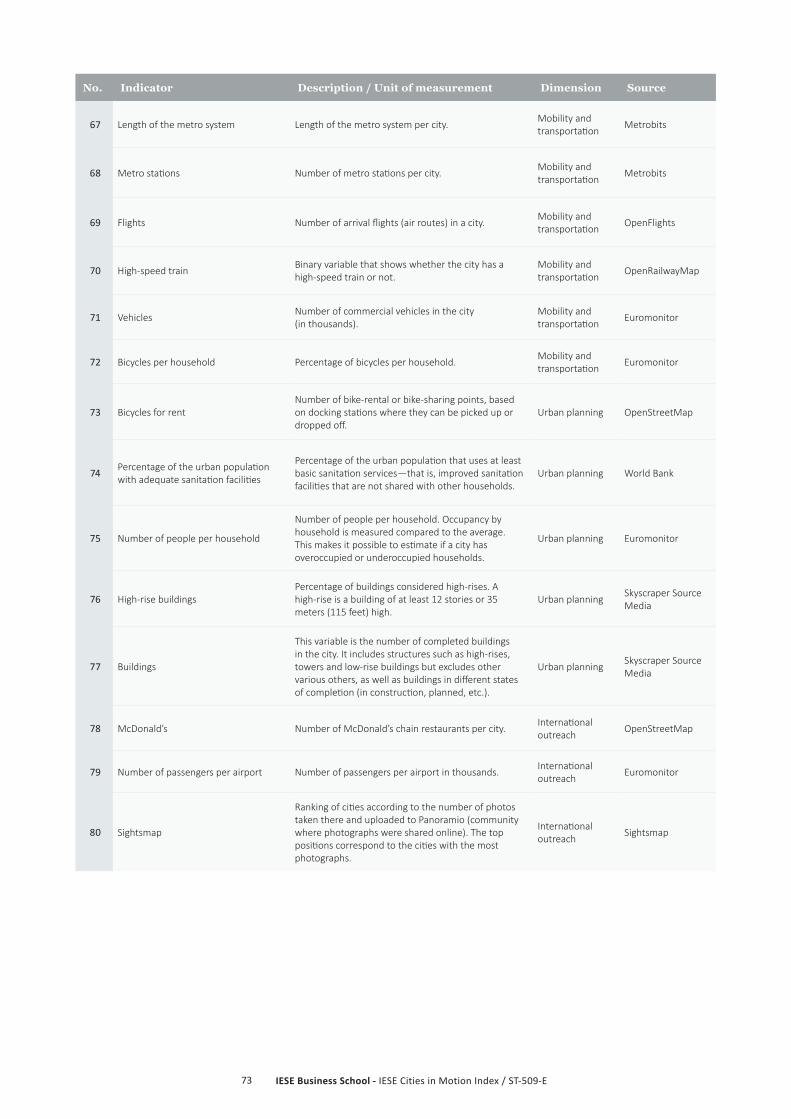
IESE Business School - IESE Cities in Motion Index / ST-509-E73
No. Indicator Description / Unit of measurement Dimension Source
67 Length of the metro system Length of the metro system per city. Mobility and transportation Metrobits
68 Metro stations Number of metro stations per city. Mobility and transportation Metrobits
69 Flights Number of arrival flights (air routes) in a city. Mobility and transportation OpenFlights
70 High-speed train Binary variable that shows whether the city has a high-speed train or not.
Mobility and transportation OpenRailwayMap
71 Vehicles Number of commercial vehicles in the city (in thousands).
Mobility and transportation Euromonitor
72 Bicycles per household Percentage of bicycles per household. Mobility and transportation Euromonitor
73 Bicycles for rentNumber of bike-rental or bike-sharing points, based on docking stations where they can be picked up or dropped off.
Urban planning OpenStreetMap
74 Percentage of the urban population with adequate sanitation facilities
Percentage of the urban population that uses at least basic sanitation services—that is, improved sanitation facilities that are not shared with other households.
Urban planning World Bank
75 Number of people per household
Number of people per household. Occupancy by household is measured compared to the average. This makes it possible to estimate if a city has overoccupied or underoccupied households.
Urban planning Euromonitor
76 High-rise buildingsPercentage of buildings considered high-rises. A high-rise is a building of at least 12 stories or 35 meters (115 feet) high.
Urban planning Skyscraper Source Media
77 Buildings
This variable is the number of completed buildings in the city. It includes structures such as high-rises, towers and low-rise buildings but excludes other various others, as well as buildings in different states of completion (in construction, planned, etc.).
Urban planning Skyscraper Source Media
78 McDonald’s Number of McDonald’s chain restaurants per city. International outreach OpenStreetMap
79 Number of passengers per airport Number of passengers per airport in thousands. International outreach Euromonitor
80 Sightsmap
Ranking of cities according to the number of photos taken there and uploaded to Panoramio (community where photographs were shared online). The top positions correspond to the cities with the most photographs.
International outreach Sightsmap
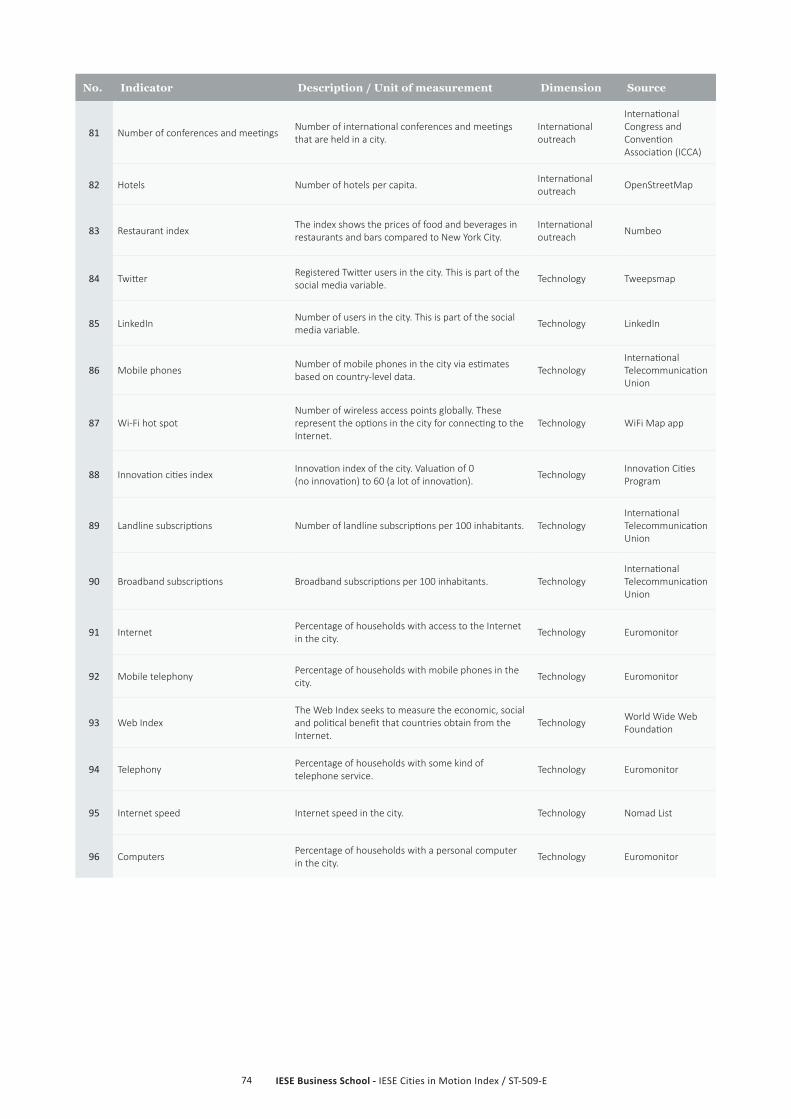
IESE Business School - IESE Cities in Motion Index / ST-509-E74
No. Indicator Description / Unit of measurement Dimension Source
81 Number of conferences and meetings Number of international conferences and meetings that are held in a city.
International outreach
International Congress and Convention Association (ICCA)
82 Hotels Number of hotels per capita. International outreach OpenStreetMap
83 Restaurant index The index shows the prices of food and beverages in restaurants and bars compared to New York City.
International outreach Numbeo
84 Twitter Registered Twitter users in the city. This is part of the social media variable. Technology Tweepsmap
85 LinkedIn Number of users in the city. This is part of the social media variable. Technology LinkedIn
86 Mobile phones Number of mobile phones in the city via estimates based on country-level data. Technology
International Telecommunication Union
87 Wi-Fi hot spotNumber of wireless access points globally. These represent the options in the city for connecting to the Internet.
Technology WiFi Map app
88 Innovation cities index Innovation index of the city. Valuation of 0 (no innovation) to 60 (a lot of innovation). Technology Innovation Cities
Program
89 Landline subscriptions Number of landline subscriptions per 100 inhabitants. TechnologyInternational Telecommunication Union
90 Broadband subscriptions Broadband subscriptions per 100 inhabitants. TechnologyInternational Telecommunication Union
91 Internet Percentage of households with access to the Internet in the city. Technology Euromonitor
92 Mobile telephony Percentage of households with mobile phones in the city. Technology Euromonitor
93 Web IndexThe Web Index seeks to measure the economic, social and political benefit that countries obtain from the Internet.
Technology World Wide Web Foundation
94 Telephony Percentage of households with some kind of telephone service. Technology Euromonitor
95 Internet speed Internet speed in the city. Technology Nomad List
96 Computers Percentage of households with a personal computer in the city. Technology Euromonitor
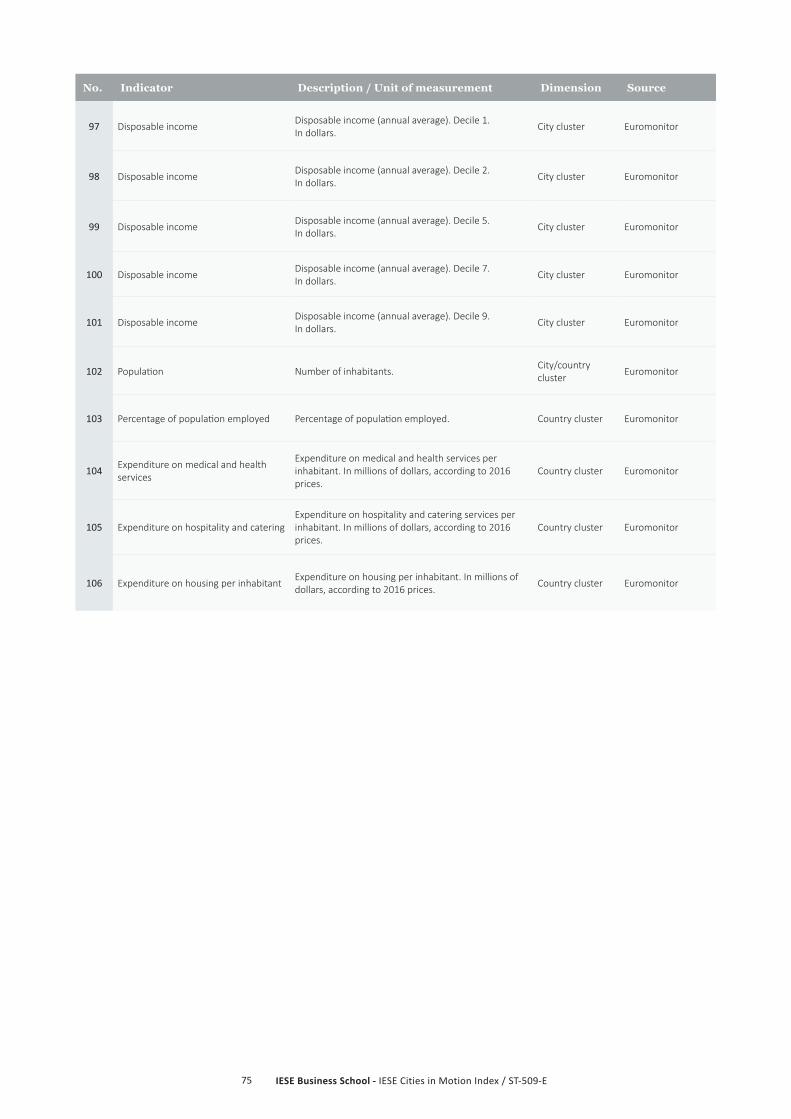
IESE Business School - IESE Cities in Motion Index / ST-509-E75
No. Indicator Description / Unit of measurement Dimension Source
97 Disposable income Disposable income (annual average). Decile 1. In dollars. City cluster Euromonitor
98 Disposable income Disposable income (annual average). Decile 2. In dollars. City cluster Euromonitor
99 Disposable income Disposable income (annual average). Decile 5. In dollars. City cluster Euromonitor
100 Disposable income Disposable income (annual average). Decile 7. In dollars. City cluster Euromonitor
101 Disposable income Disposable income (annual average). Decile 9. In dollars. City cluster Euromonitor
102 Population Number of inhabitants. City/country cluster Euromonitor
103 Percentage of population employed Percentage of population employed. Country cluster Euromonitor
104 Expenditure on medical and health services
Expenditure on medical and health services per inhabitant. In millions of dollars, according to 2016 prices.
Country cluster Euromonitor
105 Expenditure on hospitality and catering Expenditure on hospitality and catering services per inhabitant. In millions of dollars, according to 2016 prices.
Country cluster Euromonitor
106 Expenditure on housing per inhabitant Expenditure on housing per inhabitant. In millions of dollars, according to 2016 prices. Country cluster Euromonitor

IESE Business School - IESE Cities in Motion Index / ST-509-E76
Below is a graphical analysis of the 174 cities included in the CIMI, based on the nine key dimensions. These radar charts, arranged according to ranking, aim to facilitate
Appendix 2. Graphical Analysis of the Profiles of the 174 Cities
interpretation of each city’s profile by identifying the values of the various fields and, at the same time, they enable comparisons of two or more cities at a glance.
020406080
100Economy
Human capital
Internationaloutreach
Mobility andtransportation
EnvironmentTechnology
Urban planning
Governance
Social cohesion
# 1 ‐ London ‐ United Kingdom
020406080
100Economy
Human capital
Internationaloutreach
Mobility andtransportation
EnvironmentTechnology
Urban planning
Governance
Social cohesion
# 2 ‐ New York ‐ USA
020406080
100Economy
Human capital
Internationaloutreach
Mobility andtransportation
EnvironmentTechnology
Urban planning
Governance
Social cohesion
# 3 ‐ Amsterdam ‐ Netherlands
020406080
100Economy
Human capital
Internationaloutreach
Mobility andtransportation
EnvironmentTechnology
Urban planning
Governance
Social cohesion
# 4 ‐ Paris ‐ France
020406080
100Economy
Human capital
Internationaloutreach
Mobility andtransportation
EnvironmentTechnology
Urban planning
Governance
Social cohesion
# 5 ‐ Reykjavík ‐ Iceland
020406080
100Economy
Human capital
Internationaloutreach
Mobility andtransportation
EnvironmentTechnology
Urban planning
Governance
Social cohesion
# 6 ‐ Tokyo ‐ Japan

IESE Business School - IESE Cities in Motion Index / ST-509-E77
020406080
100Economy
Human capital
Internationaloutreach
Mobility andtransportation
EnvironmentTechnology
Urban planning
Governance
Social cohesion
# 7 ‐ Singapore ‐ Singapore
020406080100Economy
Human capital
Internationaloutreach
Mobility andtransportation
EnvironmentTechnology
Urban planning
Governance
Social cohesion
# 8 ‐ Copenhagen ‐ Denmark
020406080
100Economy
Human capital
Internationaloutreach
Mobility andtransportation
EnvironmentTechnology
Urban planning
Governance
Social cohesion
# 9 ‐ Berlin ‐ Germany
020406080100Economy
Human capital
Internationaloutreach
Mobility andtransportation
EnvironmentTechnology
Urban planning
Governance
Social cohesion
# 10 ‐ Vienna ‐ Austria
020406080
100Economy
Human capital
Internationaloutreach
Mobility andtransportation
EnvironmentTechnology
Urban planning
Governance
Social cohesion
# 11 ‐ Hong Kong ‐ China
020406080100Economy
Human capital
Internationaloutreach
Mobility andtransportation
EnvironmentTechnology
Urban planning
Governance
Social cohesion
# 12 ‐ Seoul ‐ South Korea
020406080
100Economy
Human capital
Internationaloutreach
Mobility andtransportation
EnvironmentTechnology
Urban planning
Governance
Social cohesion
# 13 ‐ Stockholm ‐ Sweden
020406080100Economy
Human capital
Internationaloutreach
Mobility andtransportation
EnvironmentTechnology
Urban planning
Governance
Social cohesion
# 14 ‐ Oslo ‐ Norway

IESE Business School - IESE Cities in Motion Index / ST-509-E78
020406080
100Economy
Human capital
Internationaloutreach
Mobility andtransportation
EnvironmentTechnology
Urban planning
Governance
Social cohesion
# 15 ‐ Zurich ‐ Switzerland
020406080100Economy
Human capital
Internationaloutreach
Mobility andtransportation
EnvironmentTechnology
Urban planning
Governance
Social cohesion
# 16 ‐ Los Angeles ‐ USA
020406080
100Economy
Human capital
Internationaloutreach
Mobility andtransportation
EnvironmentTechnology
Urban planning
Governance
Social cohesion
# 17 ‐ Chicago ‐ USA
020406080100Economy
Human capital
Internationaloutreach
Mobility andtransportation
EnvironmentTechnology
Urban planning
Governance
Social cohesion
# 18 ‐ Toronto ‐ Canada
020406080
100Economy
Human capital
Internationaloutreach
Mobility andtransportation
EnvironmentTechnology
Urban planning
Governance
Social cohesion
# 19 ‐ Sydney ‐ Australia
020406080100Economy
Human capital
Internationaloutreach
Mobility andtransportation
EnvironmentTechnology
Urban planning
Governance
Social cohesion
# 20 ‐ Melbourne ‐ Australia
020406080
100Economy
Human capital
Internationaloutreach
Mobility andtransportation
EnvironmentTechnology
Urban planning
Governance
Social cohesion
# 21 ‐ San Francisco ‐ USA
020406080100Economy
Human capital
Internationaloutreach
Mobility andtransportation
EnvironmentTechnology
Urban planning
Governance
Social cohesion
# 22 ‐ Helsinki ‐ Finland
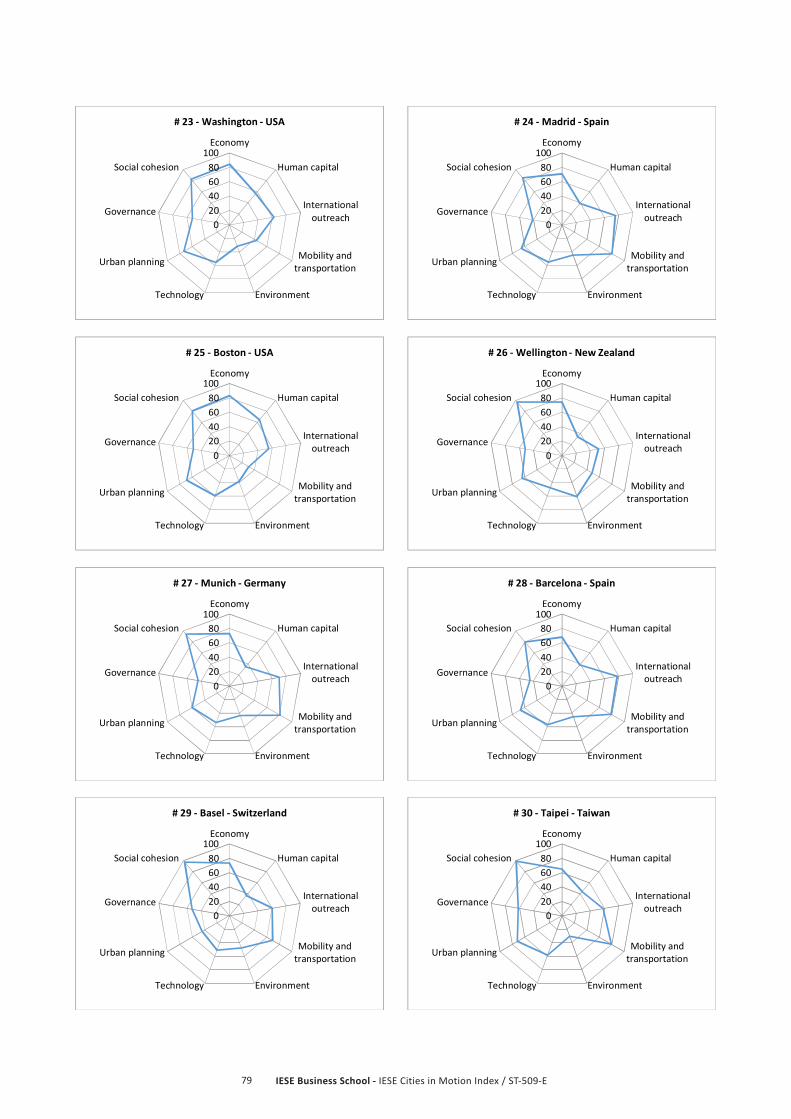
IESE Business School - IESE Cities in Motion Index / ST-509-E79
020406080
100Economy
Human capital
Internationaloutreach
Mobility andtransportation
EnvironmentTechnology
Urban planning
Governance
Social cohesion
# 23 ‐ Washington ‐ USA
020406080100Economy
Human capital
Internationaloutreach
Mobility andtransportation
EnvironmentTechnology
Urban planning
Governance
Social cohesion
# 24 ‐ Madrid ‐ Spain
020406080
100Economy
Human capital
Internationaloutreach
Mobility andtransportation
EnvironmentTechnology
Urban planning
Governance
Social cohesion
# 25 ‐ Boston ‐ USA
020406080100Economy
Human capital
Internationaloutreach
Mobility andtransportation
EnvironmentTechnology
Urban planning
Governance
Social cohesion
# 26 ‐ Wellington ‐ New Zealand
020406080
100Economy
Human capital
Internationaloutreach
Mobility andtransportation
EnvironmentTechnology
Urban planning
Governance
Social cohesion
# 27 ‐ Munich ‐ Germany
020406080100Economy
Human capital
Internationaloutreach
Mobility andtransportation
EnvironmentTechnology
Urban planning
Governance
Social cohesion
# 28 ‐ Barcelona ‐ Spain
020406080
100Economy
Human capital
Internationaloutreach
Mobility andtransportation
EnvironmentTechnology
Urban planning
Governance
Social cohesion
# 29 ‐ Basel ‐ Switzerland
020406080100Economy
Human capital
Internationaloutreach
Mobility andtransportation
EnvironmentTechnology
Urban planning
Governance
Social cohesion
# 30 ‐ Taipei ‐ Taiwan

IESE Business School - IESE Cities in Motion Index / ST-509-E80
020406080
100Economy
Human capital
Internationaloutreach
Mobility andtransportation
EnvironmentTechnology
Urban planning
Governance
Social cohesion
# 31 ‐ Bern ‐ Switzerland
020406080100Economy
Human capital
Internationaloutreach
Mobility andtransportation
EnvironmentTechnology
Urban planning
Governance
Social cohesion
# 32 ‐ Geneva ‐ Switzerland
020406080
100Economy
Human capital
Internationaloutreach
Mobility andtransportation
EnvironmentTechnology
Urban planning
Governance
Social cohesion
# 33 ‐ Frankfurt ‐ Germany
020406080100Economy
Human capital
Internationaloutreach
Mobility andtransportation
EnvironmentTechnology
Urban planning
Governance
Social cohesion
# 34 ‐ Hamburg ‐ Germany
020406080
100Economy
Human capital
Internationaloutreach
Mobility andtransportation
EnvironmentTechnology
Urban planning
Governance
Social cohesion
# 35 ‐ Auckland ‐ New Zealand
020406080100Economy
Human capital
Internationaloutreach
Mobility andtransportation
EnvironmentTechnology
Urban planning
Governance
Social cohesion
# 36 ‐ Göteborg ‐ Sweden
020406080
100Economy
Human capital
Internationaloutreach
Mobility andtransportation
EnvironmentTechnology
Urban planning
Governance
Social cohesion
# 37 ‐ Dublin ‐ Ireland
020406080100Economy
Human capital
Internationaloutreach
Mobility andtransportation
EnvironmentTechnology
Urban planning
Governance
Social cohesion
# 38 ‐ Montreal ‐ Canada

IESE Business School - IESE Cities in Motion Index / ST-509-E81
020406080100Economy
Human capital
Internationaloutreach
Mobility andtransportation
EnvironmentTechnology
Urban planning
Governance
Social cohesion
# 39 ‐ Ottawa ‐ Canada
020406080
100Economy
Human capital
Internationaloutreach
Mobility andtransportation
EnvironmentTechnology
Urban planning
Governance
Social cohesion
# 40 ‐ Miami ‐ USA
020406080100Economy
Human capital
Internationaloutreach
Mobility andtransportation
EnvironmentTechnology
Urban planning
Governance
Social cohesion
# 41 ‐ Milan ‐ Italy
020406080
100Economy
Human capital
Internationaloutreach
Mobility andtransportation
EnvironmentTechnology
Urban planning
Governance
Social cohesion
# 42 ‐ Phoenix ‐ USA
020406080100Economy
Human capital
Internationaloutreach
Mobility andtransportation
EnvironmentTechnology
Urban planning
Governance
Social cohesion
# 43 ‐ Rotterdam ‐ Netherlands
020406080
100Economy
Human capital
Internationaloutreach
Mobility andtransportation
EnvironmentTechnology
Urban planning
Governance
Social cohesion
# 44 ‐ Lisbon ‐ Portugal
020406080100Economy
Human capital
Internationaloutreach
Mobility andtransportation
EnvironmentTechnology
Urban planning
Governance
Social cohesion
# 45 ‐ Dallas ‐ USA
020406080
100Economy
Human capital
Internationaloutreach
Mobility andtransportation
EnvironmentTechnology
Urban planning
Governance
Social cohesion
# 46 ‐ Edinburgh ‐ United Kingdom
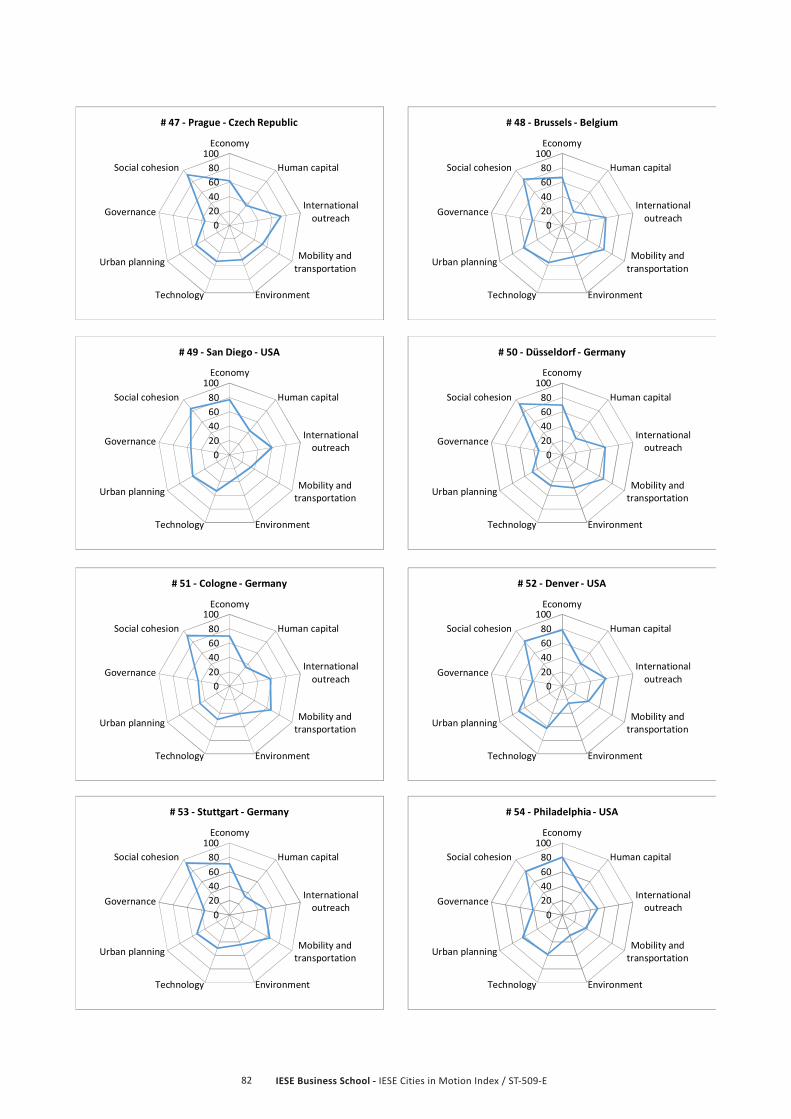
IESE Business School - IESE Cities in Motion Index / ST-509-E82
020406080
100Economy
Human capital
Internationaloutreach
Mobility andtransportation
EnvironmentTechnology
Urban planning
Governance
Social cohesion
# 47 ‐ Prague ‐ Czech Republic
020406080
100Economy
Human capital
Internationaloutreach
Mobility andtransportation
EnvironmentTechnology
Urban planning
Governance
Social cohesion
# 48 ‐ Brussels ‐ Belgium
020406080
100Economy
Human capital
Internationaloutreach
Mobility andtransportation
EnvironmentTechnology
Urban planning
Governance
Social cohesion
# 49 ‐ San Diego ‐ USA
020406080
100Economy
Human capital
Internationaloutreach
Mobility andtransportation
EnvironmentTechnology
Urban planning
Governance
Social cohesion
# 50 ‐ Düsseldorf ‐ Germany
020406080
100Economy
Human capital
Internationaloutreach
Mobility andtransportation
EnvironmentTechnology
Urban planning
Governance
Social cohesion
# 51 ‐ Cologne ‐ Germany
020406080
100Economy
Human capital
Internationaloutreach
Mobility andtransportation
EnvironmentTechnology
Urban planning
Governance
Social cohesion
# 52 ‐ Denver ‐ USA
020406080
100Economy
Human capital
Internationaloutreach
Mobility andtransportation
EnvironmentTechnology
Urban planning
Governance
Social cohesion
# 53 ‐ Stuttgart ‐ Germany
020406080
100Economy
Human capital
Internationaloutreach
Mobility andtransportation
EnvironmentTechnology
Urban planning
Governance
Social cohesion
# 54 ‐ Philadelphia ‐ USA
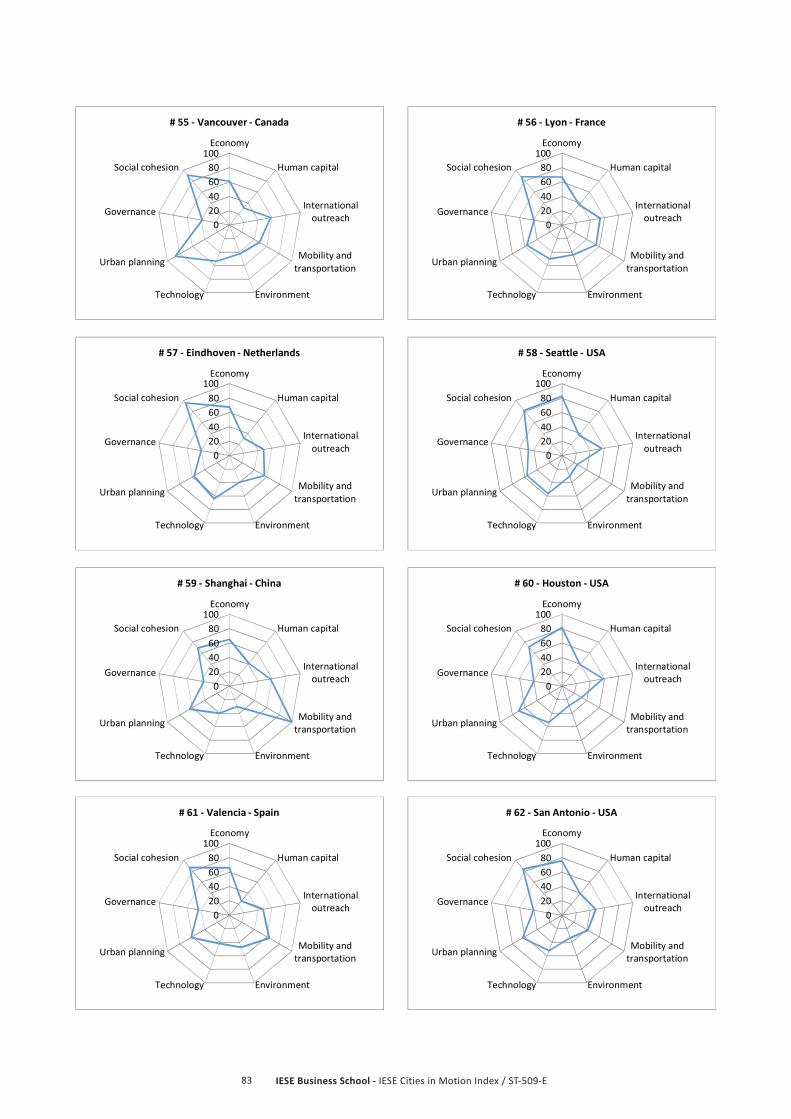
IESE Business School - IESE Cities in Motion Index / ST-509-E83
020406080
100Economy
Human capital
Internationaloutreach
Mobility andtransportation
EnvironmentTechnology
Urban planning
Governance
Social cohesion
# 55 ‐ Vancouver ‐ Canada
020406080
100Economy
Human capital
Internationaloutreach
Mobility andtransportation
EnvironmentTechnology
Urban planning
Governance
Social cohesion
# 56 ‐ Lyon ‐ France
020406080
100Economy
Human capital
Internationaloutreach
Mobility andtransportation
EnvironmentTechnology
Urban planning
Governance
Social cohesion
# 57 ‐ Eindhoven ‐ Netherlands
020406080
100Economy
Human capital
Internationaloutreach
Mobility andtransportation
EnvironmentTechnology
Urban planning
Governance
Social cohesion
# 58 ‐ Seattle ‐ USA
020406080
100Economy
Human capital
Internationaloutreach
Mobility andtransportation
EnvironmentTechnology
Urban planning
Governance
Social cohesion
# 59 ‐ Shanghai ‐ China
020406080
100Economy
Human capital
Internationaloutreach
Mobility andtransportation
EnvironmentTechnology
Urban planning
Governance
Social cohesion
# 60 ‐ Houston ‐ USA
020406080
100Economy
Human capital
Internationaloutreach
Mobility andtransportation
EnvironmentTechnology
Urban planning
Governance
Social cohesion
# 61 ‐ Valencia ‐ Spain
020406080
100Economy
Human capital
Internationaloutreach
Mobility andtransportation
EnvironmentTechnology
Urban planning
Governance
Social cohesion
# 62 ‐ San Antonio ‐ USA

IESE Business School - IESE Cities in Motion Index / ST-509-E84
020406080
100Economy
Human capital
Internationaloutreach
Mobility andtransportation
EnvironmentTechnology
Urban planning
Governance
Social cohesion
# 63 ‐ Birmingham ‐ United Kingdom
020406080
100Economy
Human capital
Internationaloutreach
Mobility andtransportation
EnvironmentTechnology
Urban planning
Governance
Social cohesion
# 64 ‐ Glasgow ‐ United Kingdom
020406080
100Economy
Human capital
Internationaloutreach
Mobility andtransportation
EnvironmentTechnology
Urban planning
Governance
Social cohesion
# 65 ‐ Tallinn ‐ Estonia
020406080
100Economy
Human capital
Internationaloutreach
Mobility andtransportation
EnvironmentTechnology
Urban planning
Governance
Social cohesion
# 66 ‐ Santiago ‐ Chile
020406080
100Economy
Human capital
Internationaloutreach
Mobility andtransportation
EnvironmentTechnology
Urban planning
Governance
Social cohesion
# 67 ‐ Quebec ‐ Canada
020406080
100Economy
Human capital
Internationaloutreach
Mobility andtransportation
EnvironmentTechnology
Urban planning
Governance
Social cohesion
# 68 ‐ Osaka ‐ Japan
020406080
100Economy
Human capital
Internationaloutreach
Mobility andtransportation
EnvironmentTechnology
Urban planning
Governance
Social cohesion
# 69 ‐ Warsaw ‐ Poland
020406080
100Economy
Human capital
Internationaloutreach
Mobility andtransportation
EnvironmentTechnology
Urban planning
Governance
Social cohesion
# 70 ‐ Bratislava ‐ Slovakia

IESE Business School - IESE Cities in Motion Index / ST-509-E85
020406080100Economy
Human capital
Internationaloutreach
Mobility andtransportation
EnvironmentTechnology
Urban planning
Governance
Social cohesion
# 71 ‐ Baltimore ‐ USA
020406080
100Economy
Human capital
Internationaloutreach
Mobility andtransportation
EnvironmentTechnology
Urban planning
Governance
Social cohesion
# 72 ‐ Antwerp ‐ Belgium
020406080100Economy
Human capital
Internationaloutreach
Mobility andtransportation
EnvironmentTechnology
Urban planning
Governance
Social cohesion
# 73 ‐ Budapest ‐ Hungary
020406080
100Economy
Human capital
Internationaloutreach
Mobility andtransportation
EnvironmentTechnology
Urban planning
Governance
Social cohesion
# 74 ‐ Vilnius ‐ Lithuania
020406080100Economy
Human capital
Internationaloutreach
Mobility andtransportation
EnvironmentTechnology
Urban planning
Governance
Social cohesion
# 75 ‐ Rome ‐ Italy
020406080
100Economy
Human capital
Internationaloutreach
Mobility andtransportation
EnvironmentTechnology
Urban planning
Governance
Social cohesion
# 76 ‐ Seville ‐ Spain
020406080100Economy
Human capital
Internationaloutreach
Mobility andtransportation
EnvironmentTechnology
Urban planning
Governance
Social cohesion
# 77 ‐ Buenos Aires ‐ Argentina
020406080
100Economy
Human capital
Internationaloutreach
Mobility andtransportation
EnvironmentTechnology
Urban planning
Governance
Social cohesion
# 78 ‐ Manchester ‐ United Kingdom
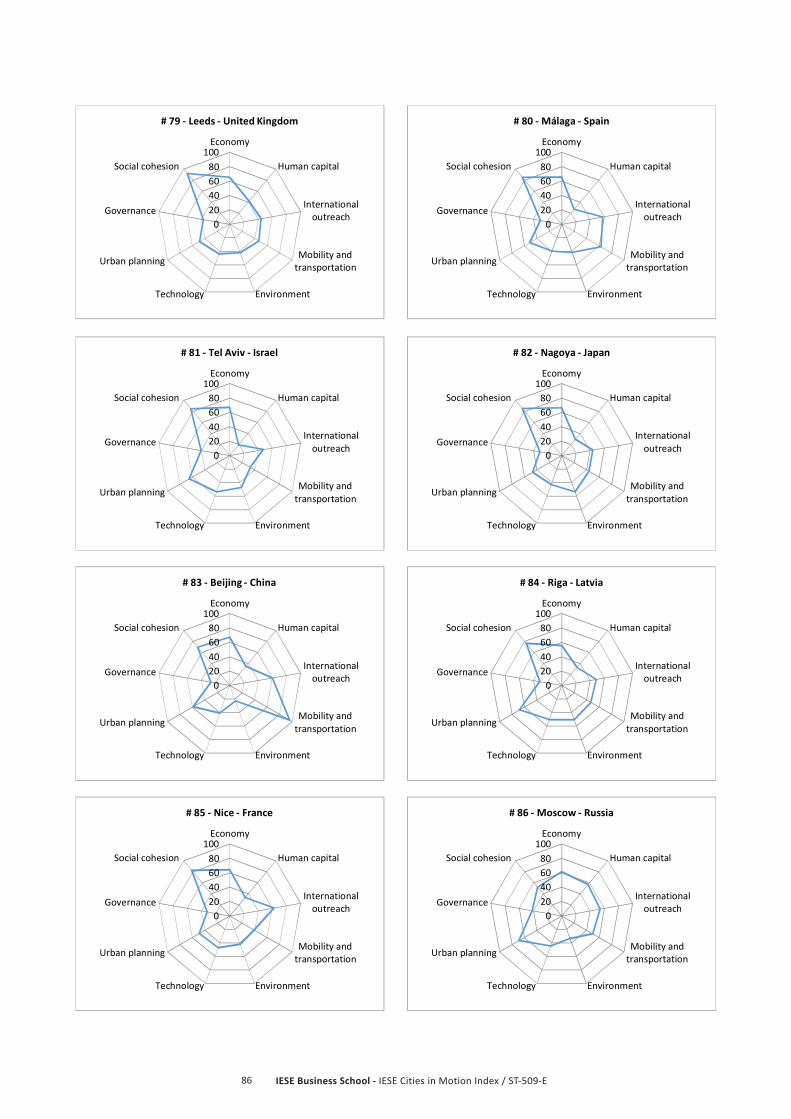
IESE Business School - IESE Cities in Motion Index / ST-509-E86
020406080
100Economy
Human capital
Internationaloutreach
Mobility andtransportation
EnvironmentTechnology
Urban planning
Governance
Social cohesion
# 79 ‐ Leeds ‐ United Kingdom
020406080100Economy
Human capital
Internationaloutreach
Mobility andtransportation
EnvironmentTechnology
Urban planning
Governance
Social cohesion
# 80 ‐ Málaga ‐ Spain
020406080
100Economy
Human capital
Internationaloutreach
Mobility andtransportation
EnvironmentTechnology
Urban planning
Governance
Social cohesion
# 81 ‐ Tel Aviv ‐ Israel
020406080100Economy
Human capital
Internationaloutreach
Mobility andtransportation
EnvironmentTechnology
Urban planning
Governance
Social cohesion
# 82 ‐ Nagoya ‐ Japan
020406080
100Economy
Human capital
Internationaloutreach
Mobility andtransportation
EnvironmentTechnology
Urban planning
Governance
Social cohesion
# 83 ‐ Beijing ‐ China
020406080100Economy
Human capital
Internationaloutreach
Mobility andtransportation
EnvironmentTechnology
Urban planning
Governance
Social cohesion
# 84 ‐ Riga ‐ Latvia
020406080
100Economy
Human capital
Internationaloutreach
Mobility andtransportation
EnvironmentTechnology
Urban planning
Governance
Social cohesion
# 85 ‐ Nice ‐ France
020406080100Economy
Human capital
Internationaloutreach
Mobility andtransportation
EnvironmentTechnology
Urban planning
Governance
Social cohesion
# 86 ‐ Moscow ‐ Russia

IESE Business School - IESE Cities in Motion Index / ST-509-E87
020406080
100Economy
Human capital
Internationaloutreach
Mobility andtransportation
EnvironmentTechnology
Urban planning
Governance
Social cohesion
# 87 ‐ Linz ‐ Austria
020406080
100Economy
Human capital
Internationaloutreach
Mobility andtransportation
EnvironmentTechnology
Urban planning
Governance
Social cohesion
# 88 ‐ Palma de Mallorca ‐ Spain
020406080
100Economy
Human capital
Internationaloutreach
Mobility andtransportation
EnvironmentTechnology
Urban planning
Governance
Social cohesion
# 89 ‐ Marseille ‐ France
020406080
100Economy
Human capital
Internationaloutreach
Mobility andtransportation
EnvironmentTechnology
Urban planning
Governance
Social cohesion
# 90 ‐ Duisburg ‐ Germany
020406080
100Economy
Human capital
Internationaloutreach
Mobility andtransportation
EnvironmentTechnology
Urban planning
Governance
Social cohesion
# 91 ‐ Porto ‐ Portugal
020406080
100Economy
Human capital
Internationaloutreach
Mobility andtransportation
EnvironmentTechnology
Urban planning
Governance
Social cohesion
# 92 ‐ Montevideo ‐ Uruguay
020406080
100Economy
Human capital
Internationaloutreach
Mobility andtransportation
EnvironmentTechnology
Urban planning
Governance
Social cohesion
# 93 ‐ Ljubljana ‐ Slovenia
020406080
100Economy
Human capital
Internationaloutreach
Mobility andtransportation
EnvironmentTechnology
Urban planning
Governance
Social cohesion
# 94 ‐ Liverpool ‐ United Kingdom

IESE Business School - IESE Cities in Motion Index / ST-509-E88
020406080
100Economy
Human capital
Internationaloutreach
Mobility andtransportation
EnvironmentTechnology
Urban planning
Governance
Social cohesion
# 95 ‐ Wroclaw ‐ Poland
020406080
100Economy
Human capital
Internationaloutreach
Mobility andtransportation
EnvironmentTechnology
Urban planning
Governance
Social cohesion
# 96 ‐ Nottingham ‐ United Kingdom
020406080
100Economy
Human capital
Internationaloutreach
Mobility andtransportation
EnvironmentTechnology
Urban planning
Governance
Social cohesion
# 97 ‐ Zagreb ‐ Croatia
020406080
100Economy
Human capital
Internationaloutreach
Mobility andtransportation
EnvironmentTechnology
Urban planning
Governance
Social cohesion
# 98 ‐ Lille ‐ France
020406080
100Economy
Human capital
Internationaloutreach
Mobility andtransportation
EnvironmentTechnology
Urban planning
Governance
Social cohesion
# 99 ‐ Dubai ‐ United Arab Emirates
020406080
100Economy
Human capital
Internationaloutreach
Mobility andtransportation
EnvironmentTechnology
Urban planning
Governance
Social cohesion
# 100 ‐ Kuala Lumpur ‐ Malaysia
020406080
100Economy
Human capital
Internationaloutreach
Mobility andtransportation
EnvironmentTechnology
Urban planning
Governance
Social cohesion
# 101 ‐ Zaragoza ‐ Spain
020406080
100Economy
Human capital
Internationaloutreach
Mobility andtransportation
EnvironmentTechnology
Urban planning
Governance
Social cohesion
# 102 ‐ A Coruña ‐ Spain

IESE Business School - IESE Cities in Motion Index / ST-509-E89
020406080
100Economy
Human capital
Internationaloutreach
Mobility andtransportation
EnvironmentTechnology
Urban planning
Governance
Social cohesion
# 103 ‐ Bucharest ‐ Romania
020406080100Economy
Human capital
Internationaloutreach
Mobility andtransportation
EnvironmentTechnology
Urban planning
Governance
Social cohesion
# 104 ‐ Bangkok ‐ Thailand
020406080
100Economy
Human capital
Internationaloutreach
Mobility andtransportation
EnvironmentTechnology
Urban planning
Governance
Social cohesion
# 105 ‐ Murcia ‐ Spain
020406080100Economy
Human capital
Internationaloutreach
Mobility andtransportation
EnvironmentTechnology
Urban planning
Governance
Social cohesion
# 106 ‐ Athens ‐ Greece
020406080
100Economy
Human capital
Internationaloutreach
Mobility andtransportation
EnvironmentTechnology
Urban planning
Governance
Social cohesion
# 107 ‐ Bilbao ‐ Spain
020406080100Economy
Human capital
Internationaloutreach
Mobility andtransportation
EnvironmentTechnology
Urban planning
Governance
Social cohesion
# 108 ‐ Florence ‐ Italy
020406080
100Economy
Human capital
Internationaloutreach
Mobility andtransportation
EnvironmentTechnology
Urban planning
Governance
Social cohesion
# 109 ‐ Turin ‐ Italy
020406080100Economy
Human capital
Internationaloutreach
Mobility andtransportation
EnvironmentTechnology
Urban planning
Governance
Social cohesion
# 110 ‐ Minsk ‐ Belarus
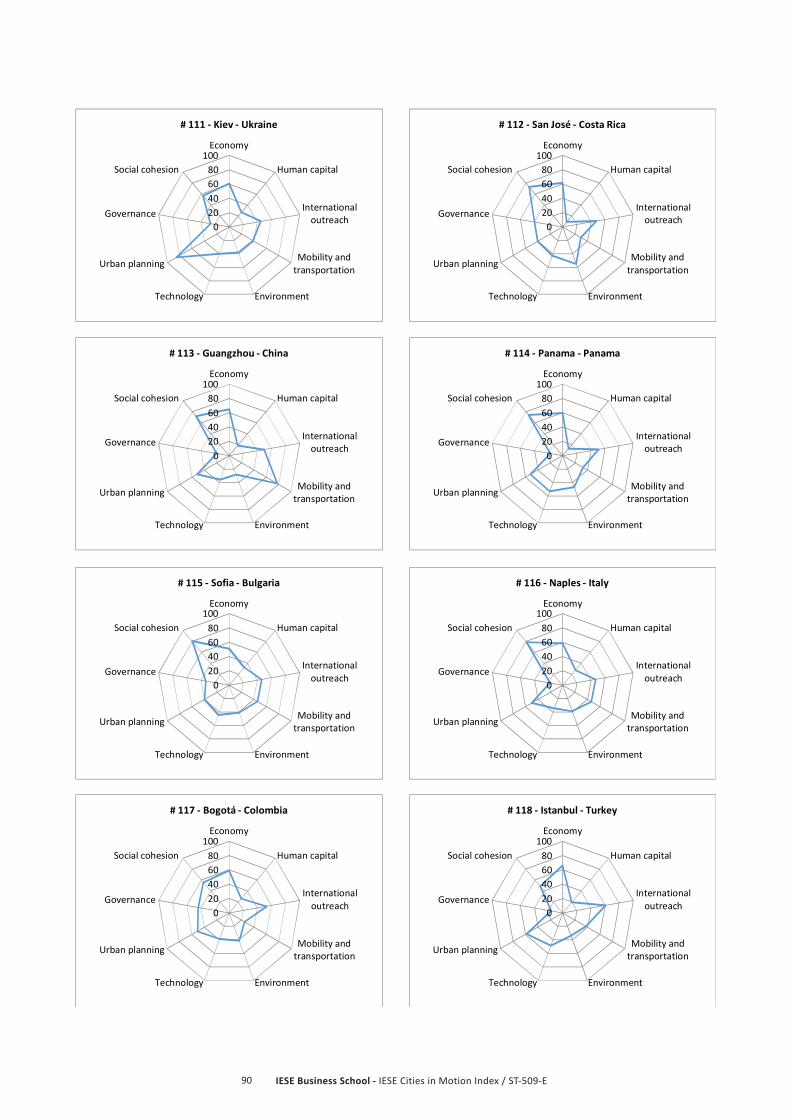
IESE Business School - IESE Cities in Motion Index / ST-509-E90
020406080
100Economy
Human capital
Internationaloutreach
Mobility andtransportation
EnvironmentTechnology
Urban planning
Governance
Social cohesion
# 111 ‐ Kiev ‐ Ukraine
020406080
100Economy
Human capital
Internationaloutreach
Mobility andtransportation
EnvironmentTechnology
Urban planning
Governance
Social cohesion
# 112 ‐ San José ‐ Costa Rica
020406080
100Economy
Human capital
Internationaloutreach
Mobility andtransportation
EnvironmentTechnology
Urban planning
Governance
Social cohesion
# 113 ‐ Guangzhou ‐ China
020406080
100Economy
Human capital
Internationaloutreach
Mobility andtransportation
EnvironmentTechnology
Urban planning
Governance
Social cohesion
# 114 ‐ Panama ‐ Panama
020406080
100Economy
Human capital
Internationaloutreach
Mobility andtransportation
EnvironmentTechnology
Urban planning
Governance
Social cohesion
# 115 ‐ Sofia ‐ Bulgaria
020406080
100Economy
Human capital
Internationaloutreach
Mobility andtransportation
EnvironmentTechnology
Urban planning
Governance
Social cohesion
# 116 ‐ Naples ‐ Italy
020406080
100Economy
Human capital
Internationaloutreach
Mobility andtransportation
EnvironmentTechnology
Urban planning
Governance
Social cohesion
# 117 ‐ Bogotá ‐ Colombia
020406080
100Economy
Human capital
Internationaloutreach
Mobility andtransportation
EnvironmentTechnology
Urban planning
Governance
Social cohesion
# 118 ‐ Istanbul ‐ Turkey

IESE Business School - IESE Cities in Motion Index / ST-509-E91
020406080
100Economy
Human capital
Internationaloutreach
Mobility andtransportation
EnvironmentTechnology
Urban planning
Governance
Social cohesion
# 119 ‐ Shenzhen ‐ China
020406080
100Economy
Human capital
Internationaloutreach
Mobility andtransportation
EnvironmentTechnology
Urban planning
Governance
Social cohesion
# 120 ‐ Belgrade ‐ Serbia
020406080
100Economy
Human capital
Internationaloutreach
Mobility andtransportation
EnvironmentTechnology
Urban planning
Governance
Social cohesion
# 121 ‐ Saint Petersburg ‐ Russia
020406080
100Economy
Human capital
Internationaloutreach
Mobility andtransportation
EnvironmentTechnology
Urban planning
Governance
Social cohesion
# 122 ‐ Ho Chi Minh City ‐ Vietnam
020406080
100Economy
Human capital
Internationaloutreach
Mobility andtransportation
EnvironmentTechnology
Urban planning
Governance
Social cohesion
# 123 ‐ Jerusalem ‐ Israel
020406080
100Economy
Human capital
Internationaloutreach
Mobility andtransportation
EnvironmentTechnology
Urban planning
Governance
Social cohesion
# 124 ‐ Tbilisi ‐ Georgia
020406080
100Economy
Human capital
Internationaloutreach
Mobility andtransportation
EnvironmentTechnology
Urban planning
Governance
Social cohesion
# 125 ‐ Rosario ‐ Argentina
020406080
100Economy
Human capital
Internationaloutreach
Mobility andtransportation
EnvironmentTechnology
Urban planning
Governance
Social cohesion
# 126 ‐ Doha ‐ Qatar

IESE Business School - IESE Cities in Motion Index / ST-509-E92
020406080
100Economy
Human capital
Internationaloutreach
Mobility andtransportation
EnvironmentTechnology
Urban planning
Governance
Social cohesion
# 127 ‐ Abu Dhabi ‐ United Arab Emirates
020406080
100Economy
Human capital
Internationaloutreach
Mobility andtransportation
EnvironmentTechnology
Urban planning
Governance
Social cohesion
# 128 ‐ Rio de Janeiro ‐ Brazil
020406080
100Economy
Human capital
Internationaloutreach
Mobility andtransportation
EnvironmentTechnology
Urban planning
Governance
Social cohesion
# 129 ‐ Almaty ‐ Kazakhstan
020406080
100Economy
Human capital
Internationaloutreach
Mobility andtransportation
EnvironmentTechnology
Urban planning
Governance
Social cohesion
# 130 ‐ Brasília ‐ Brazil
020406080
100Economy
Human capital
Internationaloutreach
Mobility andtransportation
EnvironmentTechnology
Urban planning
Governance
Social cohesion
# 131 ‐ Baku ‐ Azerbaijan
020406080
100Economy
Human capital
Internationaloutreach
Mobility andtransportation
EnvironmentTechnology
Urban planning
Governance
Social cohesion
# 132 ‐ São Paulo ‐ Brazil
020406080
100Economy
Human capital
Internationaloutreach
Mobility andtransportation
EnvironmentTechnology
Urban planning
Governance
Social cohesion
# 133 ‐ Mexico City ‐ Mexico
020406080
100Economy
Human capital
Internationaloutreach
Mobility andtransportation
EnvironmentTechnology
Urban planning
Governance
Social cohesion
# 134 ‐ Medellín ‐ Colombia
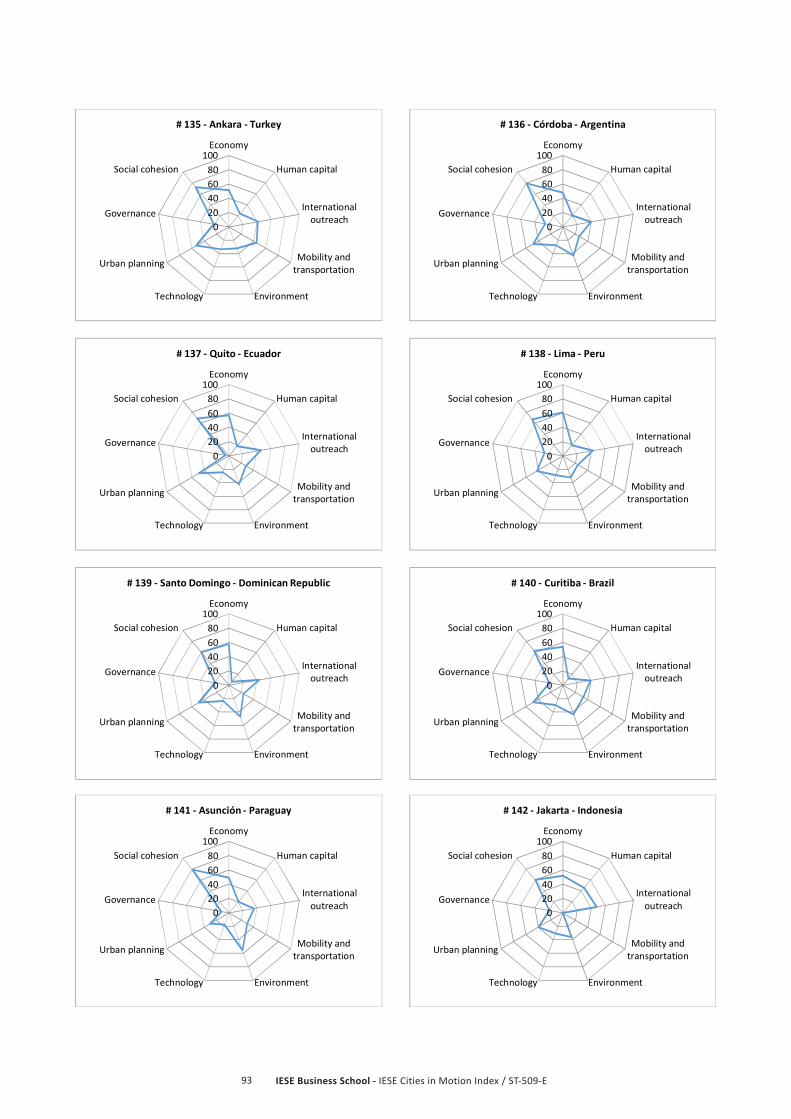
IESE Business School - IESE Cities in Motion Index / ST-509-E93
020406080
100Economy
Human capital
Internationaloutreach
Mobility andtransportation
EnvironmentTechnology
Urban planning
Governance
Social cohesion
# 135 ‐ Ankara ‐ Turkey
020406080
100Economy
Human capital
Internationaloutreach
Mobility andtransportation
EnvironmentTechnology
Urban planning
Governance
Social cohesion
# 136 ‐ Córdoba ‐ Argentina
020406080
100Economy
Human capital
Internationaloutreach
Mobility andtransportation
EnvironmentTechnology
Urban planning
Governance
Social cohesion
# 137 ‐ Quito ‐ Ecuador
020406080
100Economy
Human capital
Internationaloutreach
Mobility andtransportation
EnvironmentTechnology
Urban planning
Governance
Social cohesion
# 138 ‐ Lima ‐ Peru
020406080
100Economy
Human capital
Internationaloutreach
Mobility andtransportation
EnvironmentTechnology
Urban planning
Governance
Social cohesion
# 139 ‐ Santo Domingo ‐ Dominican Republic
020406080
100Economy
Human capital
Internationaloutreach
Mobility andtransportation
EnvironmentTechnology
Urban planning
Governance
Social cohesion
# 140 ‐ Curitiba ‐ Brazil
020406080
100Economy
Human capital
Internationaloutreach
Mobility andtransportation
EnvironmentTechnology
Urban planning
Governance
Social cohesion
# 141 ‐ Asunción ‐ Paraguay
020406080
100Economy
Human capital
Internationaloutreach
Mobility andtransportation
EnvironmentTechnology
Urban planning
Governance
Social cohesion
# 142 ‐ Jakarta ‐ Indonesia
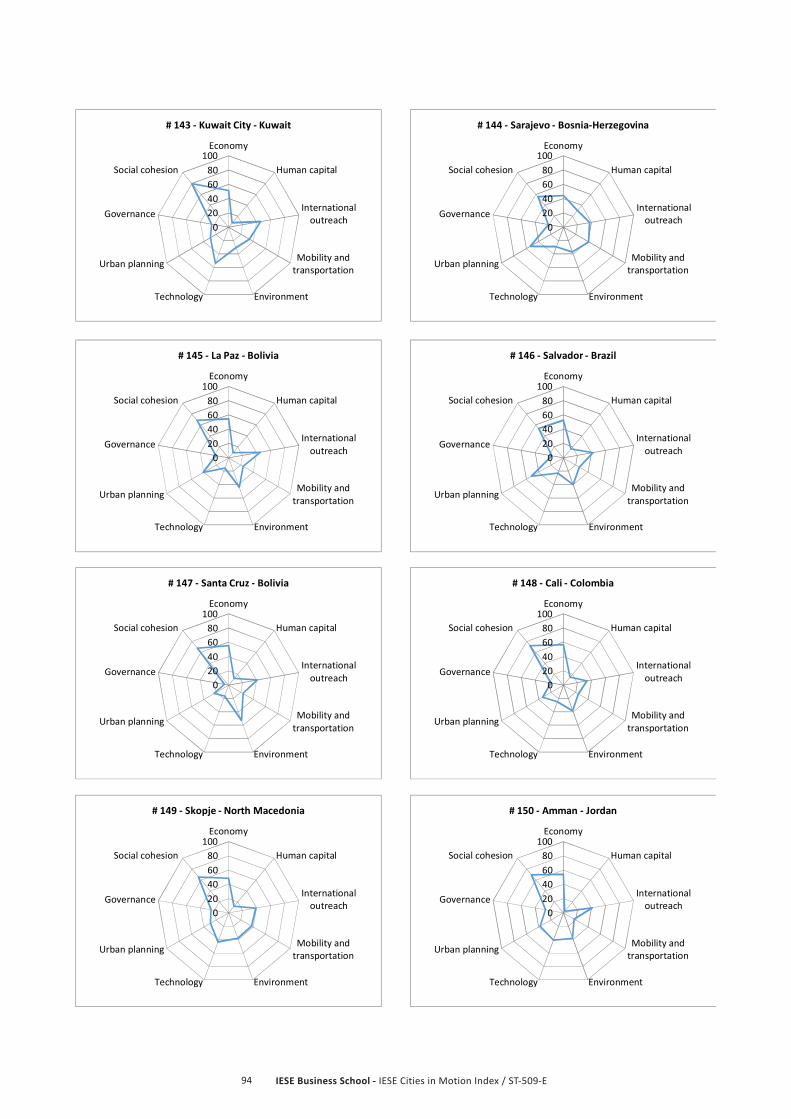
IESE Business School - IESE Cities in Motion Index / ST-509-E94
020406080
100Economy
Human capital
Internationaloutreach
Mobility andtransportation
EnvironmentTechnology
Urban planning
Governance
Social cohesion
# 143 ‐ Kuwait City ‐ Kuwait
020406080
100Economy
Human capital
Internationaloutreach
Mobility andtransportation
EnvironmentTechnology
Urban planning
Governance
Social cohesion
# 144 ‐ Sarajevo ‐ Bosnia‐Herzegovina
020406080
100Economy
Human capital
Internationaloutreach
Mobility andtransportation
EnvironmentTechnology
Urban planning
Governance
Social cohesion
# 145 ‐ La Paz ‐ Bolivia
020406080
100Economy
Human capital
Internationaloutreach
Mobility andtransportation
EnvironmentTechnology
Urban planning
Governance
Social cohesion
# 146 ‐ Salvador ‐ Brazil
020406080
100Economy
Human capital
Internationaloutreach
Mobility andtransportation
EnvironmentTechnology
Urban planning
Governance
Social cohesion
# 147 ‐ Santa Cruz ‐ Bolivia
020406080
100Economy
Human capital
Internationaloutreach
Mobility andtransportation
EnvironmentTechnology
Urban planning
Governance
Social cohesion
# 148 ‐ Cali ‐ Colombia
020406080
100Economy
Human capital
Internationaloutreach
Mobility andtransportation
EnvironmentTechnology
Urban planning
Governance
Social cohesion
# 149 ‐ Skopje ‐ North Macedonia
020406080
100Economy
Human capital
Internationaloutreach
Mobility andtransportation
EnvironmentTechnology
Urban planning
Governance
Social cohesion
# 150 ‐ Amman ‐ Jordan

IESE Business School - IESE Cities in Motion Index / ST-509-E95
020406080100Economy
Human capital
Internationaloutreach
Mobility andtransportation
EnvironmentTechnology
Urban planning
Governance
Social cohesion
# 151 ‐ Belo Horizonte ‐ Brazil
020406080
100Economy
Human capital
Internationaloutreach
Mobility andtransportation
EnvironmentTechnology
Urban planning
Governance
Social cohesion
# 152 ‐ Guayaquil ‐ Ecuador
020406080100Economy
Human capital
Internationaloutreach
Mobility andtransportation
EnvironmentTechnology
Urban planning
Governance
Social cohesion
# 153 ‐ Bangalore ‐ India
020406080
100Economy
Human capital
Internationaloutreach
Mobility andtransportation
EnvironmentTechnology
Urban planning
Governance
Social cohesion
# 154 ‐ Tianjin ‐ China
020406080100Economy
Human capital
Internationaloutreach
Mobility andtransportation
EnvironmentTechnology
Urban planning
Governance
Social cohesion
# 155 ‐ Casablanca ‐ Morocco
020406080
100Economy
Human capital
Internationaloutreach
Mobility andtransportation
EnvironmentTechnology
Urban planning
Governance
Social cohesion
# 156 ‐ Novosibirsk ‐ Russia
020406080100Economy
Human capital
Internationaloutreach
Mobility andtransportation
EnvironmentTechnology
Urban planning
Governance
Social cohesion
# 157 ‐ Tunis ‐ Tunisia
020406080
100Economy
Human capital
Internationaloutreach
Mobility andtransportation
EnvironmentTechnology
Urban planning
Governance
Social cohesion
# 158 ‐ Cape Town ‐ South Africa
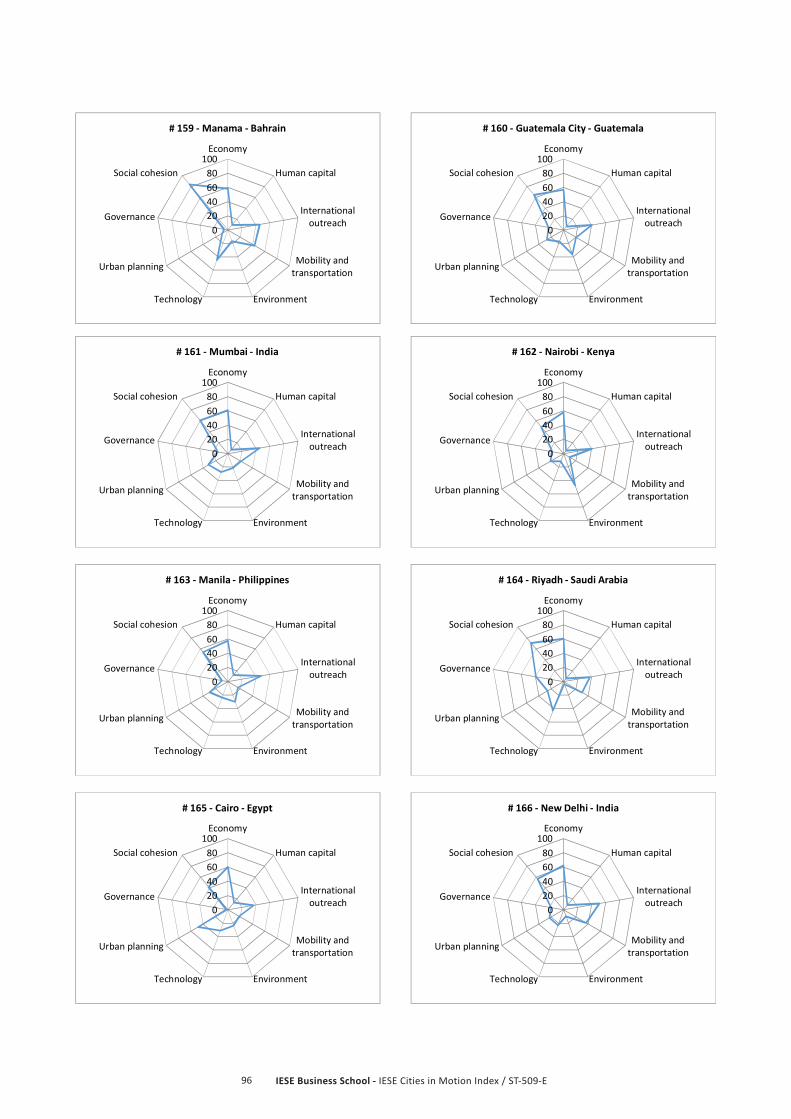
IESE Business School - IESE Cities in Motion Index / ST-509-E96
020406080100Economy
Human capital
Internationaloutreach
Mobility andtransportation
EnvironmentTechnology
Urban planning
Governance
Social cohesion
# 159 ‐ Manama ‐ Bahrain
020406080
100Economy
Human capital
Internationaloutreach
Mobility andtransportation
EnvironmentTechnology
Urban planning
Governance
Social cohesion
# 160 ‐ Guatemala City ‐ Guatemala
020406080100Economy
Human capital
Internationaloutreach
Mobility andtransportation
EnvironmentTechnology
Urban planning
Governance
Social cohesion
# 161 ‐ Mumbai ‐ India
020406080
100Economy
Human capital
Internationaloutreach
Mobility andtransportation
EnvironmentTechnology
Urban planning
Governance
Social cohesion
# 162 ‐ Nairobi ‐ Kenya
020406080100Economy
Human capital
Internationaloutreach
Mobility andtransportation
EnvironmentTechnology
Urban planning
Governance
Social cohesion
# 163 ‐ Manila ‐ Philippines
020406080
100Economy
Human capital
Internationaloutreach
Mobility andtransportation
EnvironmentTechnology
Urban planning
Governance
Social cohesion
# 164 ‐ Riyadh ‐ Saudi Arabia
020406080100Economy
Human capital
Internationaloutreach
Mobility andtransportation
EnvironmentTechnology
Urban planning
Governance
Social cohesion
# 165 ‐ Cairo ‐ Egypt
020406080
100Economy
Human capital
Internationaloutreach
Mobility andtransportation
EnvironmentTechnology
Urban planning
Governance
Social cohesion
# 166 ‐ New Delhi ‐ India
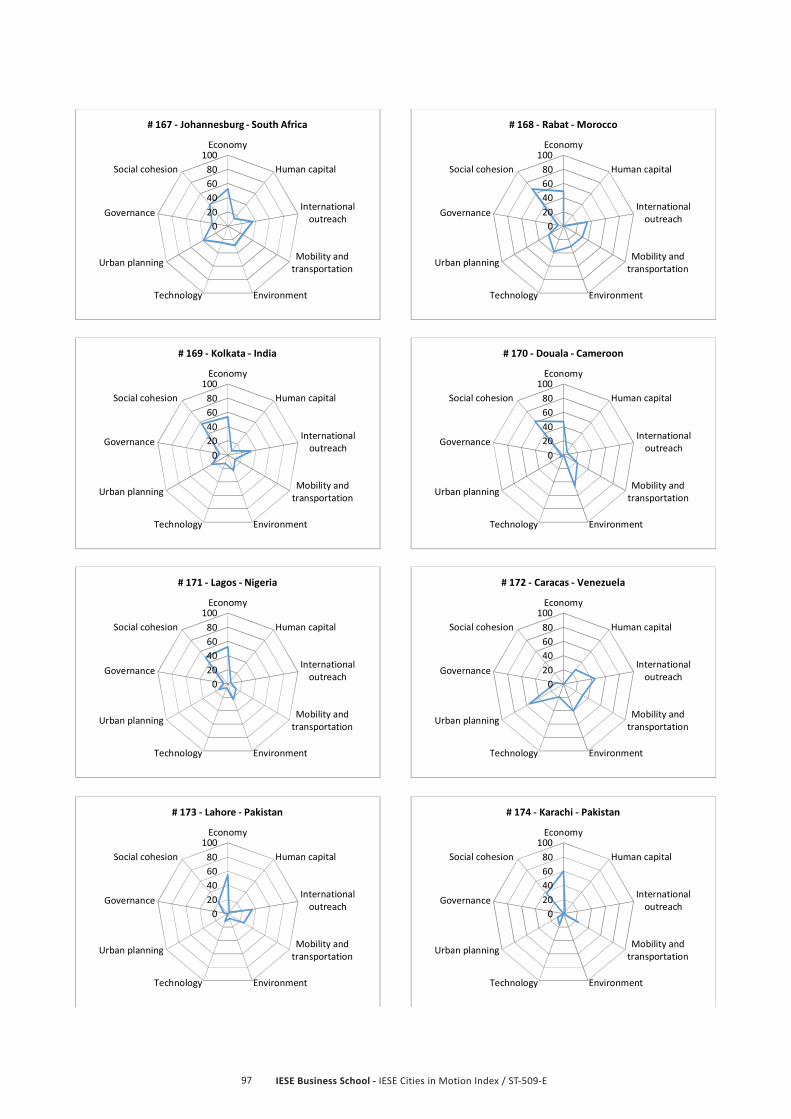
IESE Business School - IESE Cities in Motion Index / ST-509-E97
020406080100Economy
Human capital
Internationaloutreach
Mobility andtransportation
EnvironmentTechnology
Urban planning
Governance
Social cohesion
# 167 ‐ Johannesburg ‐ South Africa
020406080
100Economy
Human capital
Internationaloutreach
Mobility andtransportation
EnvironmentTechnology
Urban planning
Governance
Social cohesion
# 168 ‐ Rabat ‐ Morocco
020406080100Economy
Human capital
Internationaloutreach
Mobility andtransportation
EnvironmentTechnology
Urban planning
Governance
Social cohesion
# 169 ‐ Kolkata ‐ India
020406080
100Economy
Human capital
Internationaloutreach
Mobility andtransportation
EnvironmentTechnology
Urban planning
Governance
Social cohesion
# 170 ‐ Douala ‐ Cameroon
020406080100Economy
Human capital
Internationaloutreach
Mobility andtransportation
EnvironmentTechnology
Urban planning
Governance
Social cohesion
# 171 ‐ Lagos ‐ Nigeria
020406080
100Economy
Human capital
Internationaloutreach
Mobility andtransportation
EnvironmentTechnology
Urban planning
Governance
Social cohesion
# 172 ‐ Caracas ‐ Venezuela
020406080100Economy
Human capital
Internationaloutreach
Mobility andtransportation
EnvironmentTechnology
Urban planning
Governance
Social cohesion
# 173 ‐ Lahore ‐ Pakistan
020406080
100Economy
Human capital
Internationaloutreach
Mobility andtransportation
EnvironmentTechnology
Urban planning
Governance
Social cohesion
# 174 ‐ Karachi ‐ Pakistan


BarcelonaAv. Pearson, 21 08034 Barcelona, Spain (+ 34) 93 253 42 00
MadridCamino del Cerro del Águila, 3 28023 Madrid, Spain(+34) 91 211 30 00
New York165 W. 57th Street New York, NY 10019-2201 USA(+1) 646 346 8850
MunichMaria-Theresia-Straße 1581675 Munich, Germany(+49) 89 24 20 97 90
Sao PauloRua Martiniano de Carvalho, 573 Bela Vista 01321001 Sao Paulo, Brazil(+55) 11 3177 8221
Follow us
IESE Business School
IESE Business School
iesebs
iese
Related Documents