327 Comprehensive Flood Risk Management – Klijn & Schweckendiek (eds) © 2013 Taylor & Francis Group, London, ISBN 978-0-415-62144-1 Interpreting sensor measurements in dikes—experiences from UrbanFlood pilot sites Jonathan Simm, David Jordan & Alexandra Topple HR Wallingford, Wallingford, UK Ilya Mokhov & Alexander Pyayt Siemens LLC, Corporate Technology, St. Petersburg, Russia Tarek Abdoun & Victoria Bennett Rensselaer Polytechnic Institute, NY, USA Jeroen Broekhuijsen & Robert Meijer TNO, Groningen, The Netherlands ABSTRACT: The UrbanFlood project is creating an Early Warning System framework that can be used to link sensors via the Internet to predictive models and emergency warning systems. The project includes four pilot sites to apply and validate at full scale the technology being developed in the project: Amster- dam (Netherlands), Boston (UK) and Rhine River (Germany). This paper focuses on a description of the sensor instrumentation installed at the pilot sites and the emerging conclusions from the analysis of the results obtained to date. The sensors installed at the various sites include various MEMS modules to measure displacement and pore pressure and fibre optic cables able to detect strains. The gathered data are used for dike stability evaluation with different models and also, combined with an Artificial Intel- ligence (AI) component, for detection of anomalies in dike behaviour. Detected anomalies trigger assess- ment of the likelihood of levee breach and the consequences in terms of flood propagation and damage in the defended urban area. additional computer resources required by the framework can be made available on demand. UrbanFlood has validated the EWS frame- work and method for implementation in the con- text of dike performance (failure) in an urban environment. A number of live pilot sites are being used to prove the methodology. Dikes have been equippe- with sensor systems and the EWS service has been built up from a series of dike failure and flooding specific modules which include dike breach evolu- tion and flood-spreading models. UrbanFlood has demonstrated the feasibility of remotely monitor- ing dikes and floods, whether from nearby offices or from other countries and continents through secure use of web-based technologies. For the development of flood mitigation scenar- ios and the training of personnel, the framework is also connected to simulation modules that com- pute flood responses associated with failing dikes. The project includes four pilot sites to apply and validate at full scale the technology being devel- oped in the project: The final locations of these pilots are: Amsterdam (Netherlands—two sites), 1 INTRODUCTION—URBANFLOOD OVERVIEW More than two thirds of European cities have to deal with flood risk management issues on a reg- ular basis; these are issues which will worsen as climate change effects result in more extreme con- ditions. Early Warning Systems (EWS) can play a crucial role in mitigating flood risk by detecting conditions and predicting the onset of a catastro- phe before the event occurs, and by providing real time information during an event. EWSs thus fulfil multiple roles as general information systems, deci- sion support systems and alarm systems for multi- ple stakeholders including government, companies and the general public. The UrbanFlood project has created an EWS framework that can be used to link sensors via the Internet to predictive models and emergency warn- ing systems. The data collected from the sensors is being interpreted to assess the condition and likeli- hood of failure; different models will be used to predict the failure mode and subsequent potential inundation in near real time. Through the Internet,

Ieeepro techno solutions ieee 2013 embedded project interpreting sensor measurements in dikes—experiences from urban flood pilot sites
Feb 16, 2017
Welcome message from author
This document is posted to help you gain knowledge. Please leave a comment to let me know what you think about it! Share it to your friends and learn new things together.
Transcript

327
Comprehensive Flood Risk Management – Klijn & Schweckendiek (eds)© 2013 Taylor & Francis Group, London, ISBN 978-0-415-62144-1
Interpreting sensor measurements in dikes—experiences from UrbanFlood pilot sites
Jonathan Simm, David Jordan & Alexandra ToppleHR Wallingford, Wallingford, UK
Ilya Mokhov & Alexander PyaytSiemens LLC, Corporate Technology, St. Petersburg, Russia
Tarek Abdoun & Victoria BennettRensselaer Polytechnic Institute, NY, USA
Jeroen Broekhuijsen & Robert MeijerTNO, Groningen, The Netherlands
ABSTRACT: The UrbanFlood project is creating an Early Warning System framework that can be used to link sensors via the Internet to predictive models and emergency warning systems. The project includes four pilot sites to apply and validate at full scale the technology being developed in the project: Amster-dam (Netherlands), Boston (UK) and Rhine River (Germany). This paper focuses on a description of the sensor instrumentation installed at the pilot sites and the emerging conclusions from the analysis of the results obtained to date. The sensors installed at the various sites include various MEMS modules to measure displacement and pore pressure and fibre optic cables able to detect strains. The gathered data are used for dike stability evaluation with different models and also, combined with an Artificial Intel-ligence (AI) component, for detection of anomalies in dike behaviour. Detected anomalies trigger assess-ment of the likelihood of levee breach and the consequences in terms of flood propagation and damage in the defended urban area.
additional computer resources required by the framework can be made available on demand.
UrbanFlood has validated the EWS frame-work and method for implementation in the con-text of dike performance (failure) in an urban environment.
A number of live pilot sites are being used to prove the methodology. Dikes have been equippe-with sensor systems and the EWS service has been built up from a series of dike failure and flooding specific modules which include dike breach evolu-tion and flood-spreading models. UrbanFlood has demonstrated the feasibility of remotely monitor-ing dikes and floods, whether from nearby offices or from other countries and continents through secure use of web-based technologies.
For the development of flood mitigation scenar-ios and the training of personnel, the framework is also connected to simulation modules that com-pute flood responses associated with failing dikes.
The project includes four pilot sites to apply and validate at full scale the technology being devel-oped in the project: The final locations of these pilots are: Amsterdam (Netherlands—two sites),
1 INTRODUCTION—URBANFLOOD OVERVIEW
More than two thirds of European cities have to deal with flood risk management issues on a reg-ular basis; these are issues which will worsen as climate change effects result in more extreme con-ditions. Early Warning Systems (EWS) can play a crucial role in mitigating flood risk by detecting conditions and predicting the onset of a catastro-phe before the event occurs, and by providing real time information during an event. EWSs thus fulfil multiple roles as general information systems, deci-sion support systems and alarm systems for multi-ple stakeholders including government, companies and the general public.
The UrbanFlood project has created an EWS framework that can be used to link sensors via the Internet to predictive models and emergency warn-ing systems. The data collected from the sensors is being interpreted to assess the condition and likeli-hood of failure; different models will be used to predict the failure mode and subsequent potential inundation in near real time. Through the Internet,
328
Boston (UK) and Rhine River (Germany). Urban-Flood has also made use of data from the induced failure of real dikes at the IJkdijk field laboratory to test and validate the overall EWS framework and individual modules.
This paper is one of several presented on the UrbanFlood project at the FLOODrisk 2012 conference. This paper focuses on a description of the sensor instrumentation installed at the pilot sites, the emerging results, the analyses of the results using both conventional engineering methods and artificial intelligence. The paper also gives some conclusions which have emerged from the analysis of the results completed to date.
2 SENSOR SELECTION AND INSTALLATION
2.1 Failure modes
The principle failure modes of dikes or levees relate to either external erosion of various kinds, internal erosion eventually evidenced by some form of excessive seepage flow and mass instability. Of these, the latter two are particularly challenging to observe visually or by external instrumentation and are particularly suitable for monitoring by installed sensors.
The pilot sites were for the project were there-fore selected not only taking into account levee owner/operator interest but also the likelihood of obtaining interesting measurements given the most likely failure modes. At three of the four sites, mass instability was believed to be the most likely form of failure, but at the fourth (Rhine, Germany) seep-age was known to be a problem and hence internal erosion was suspected.
2.2 Sensor selection and installation
Selection of the sensor types was based on the experience already gleaned from the Ijkdike experi-ment in The Netherlands. Tables 1 and 2 show the range of sensors used in this previous experiment. The budget for instrumentation purchase was lim-ited in the UrbanFlood project and it was therefore decided, based on the previous positive experience at the Ijkdijk, to mainly focus on those forms of sensors that have displayed longevity, offer main-tenance free use. In particular, GeoBeads unit manufactured by Alert Solutions (Netherlands) were selected; these contain MEMS based sen-sors to detect tilt, temperature and pore pressure. GeoBeads® is a sensor network for real time moni-toring of ground stability and stability of infra-structural works. It consists of fully digital nodes with MEMS technology sensor devices that can scale to a wide area network operation, are energy
Table 1. Sensors used in Ijkdijk mass instability test.
Parameter Sensor
Pore pressure Vibrating wire piezometer, MEMS, BAT
Temperature Thermographic camera, fiber optics, MEMS
Movement (strain/tilt/consolidation)
Inclinometers, fiber optics, optical camera, MEMS, laser scanning, extensometer, inverted pendulum, liquid level settlement sensor, absolute pressure sensor
Visual inspection Human eye
Vibration Fiber optics, microphones, hydrophones
Weather conditions Weather station
Soil moisture content
MEMS, various agricultural sensors
Electrical conductivity
Agricultural sensor
Table 2. Sensors used in IjkDijk piping/internal erosion test.
Parameter Sensor
Pore pressure Vibrating wire piezometer, MEMS, fiber optics
Temperature Thermographic camera, MEMS
Movement (strain/tilt/consolidation)
Fiber optics, optical camera
Visual inspection Human eye
Vibration Fiber optics, hydrophones
Weather conditions Weather station
Soil moisture content Flow meter
Electrical conductivity Spoon (manual operation)
Self potential Non polarizing electrodes
efficient, low in cost, and robust to vandalism. Each small sized node in the network can simulta-neously house various measurement devices. The set per node commonly includes a piezometer, an inclinometer and thermal sensor. The nodes are designed to capture the most relevant parameters needed for thorough insight into the risks at hand. Data availability is immediate and is distributed via the internet.
In addition, two forms of fibre-optic cable were selected, one able to measure relative strain and the other able to measure seepage flows by sensing temperature changes.
Fibre optics have been widely used for many years in civil engineering applications, specialty pipelines, structural health monitoring systems or hydraulic works applications such as concrete and

329
earth dams, levees and dikes. By embedding opti-cal fibres onto a geotextile fabric, TenCate Geo-Detect® was the first system designed specifically for geotechnical and hydraulic works applications. The geotextile fabric, e.g., a textile installed in the soil, enhances its mechanical and hydraulic prop-erties by in-plane drainage capability, excellent anchoring interface with the soil, soil reinforce-ment, separation and filtration. For example the drainage properties of the geotextile combined with the temperature measurement with the optical fibres improves the speed of leakage detection. The filtration properties of the geotextile also increases the stability of the soil by inhibiting the internal erosion process. The friction interface also facili-tates the transfer of soil movements from the geo-textile to the fibre optic line.
This sensor enabled geotextile is designed to detect temperature and strain at the same time. Water leakage, which is the main cause of inter-nal erosion, is assessed through the measurement of temperature changes. First stages of soil move-ment, settlement or sliding are detected by strain measurement. Measuring at the same time and at the same location both temperature for leak detec-tion and soil strain for soil movement detection increases the probability of obtaining the right precursors of a malfunction. This solution meas-ures continuously hundreds to several thousands points with a single system along the full length of the hydraulic structure. It can provide leak and deformation location with a spatial resolution of 1 meter, or even 0.5 m in some cases. The system is able to monitor several tens of kilometres.
Once installed, the sensor enabled geotextile communicates the soil strain and temperature data to the system’s instrumentation equipment. Soil strain as low as 0.01% can be measured, and with the proper software, changes in temperature can be monitored at 0.1°C. Since 2007, this solution was used successfully in several projects (Artières et al, 2010; Artières et al, 2012).
The Shape Acceleration Array (SAA) instru-mentation uses Micro-Electro-Mechanical Systems (MEMS) accelerometers and digital temperature sensors to acquire three-dimensional profiles of ground deformations, accelerations, and tempera-ture readings up to a depth of 100 m (Abdoun and Bennett, 2008). The sensor array can be installed both vertically and horizontally, depending on the application. It is an advanced alternative to the traditional manual or in-place inclinometers and is connected to a wireless earth station for remote access and configuration over the cellular network or internet. Multiple arrays at a project site can be integrated into a data acquisition system to be accessed remotely in this manner. The SAAs have been extensively tested in the past to validate the
reliability of the deformation and acceleration measurements (Bennett, 2010) and are still pro-viding stable measurements after six years of field installation.
A multi-parameter system for thorough assess-ment of geotechnical systems has been developed through funding by the US National Institute of Standards and Technology (NIST). The Shape Acceleration Array with Pore Pressure (SAAP) includes a Geokon 4500S piezometer modified with the attachment of a microprocessor that converts the Geokon 4500S’s vibrating wire data to digital data (Geokon, 2011); this is all done downhole in real time (Measurand, 2012). The microprocessor used in the SAAP is the same as those used in the SAA. The system is fully integrated and data from all of the instrumentation can be viewed side-by-side in Measurand’s software.
2.2.1 Sensors at Netherlands sites in AmsterdamThe ‘Stammerdijk’ location was selected because of doubts regarding the overall stability of the dike. It was believed that extensive measurement of the pore pressures would be required—under the outer crest, under the inner crest, and under the inner toe of the dike, in several of the soil layers present. Measurements of deformations was also thought to be useful. To reduce the chances of non-repre-sentative measurements, two cross sections about 100 meters apart have been instrumented. In these two cross sections, a total of 19 GeoBeads have been installed using CPT equipment to measure pore pressure, temperature and tilt. In addition, 3 ‘traditional’ pore pressure meters to determine the compatibility between the old and the new system were installed under supervision of the regional water board, Waternet. The water level is also measured by a GeoBead. Weather information can be taken from the nearby Schiphol Amsterdam Airport. Any unusual circumstances are noted by the daily inspec-tions of this dike section by Waternet.
The second Netherlands dike was Ringdijk located as part of a typical urban polder and of interest because of visible instability and a recent failure to meet the required stability standards when assessed during its five-yearly review. This dike has 3 cross-sections instrumented with GeoBeads. Each of the cross-sections has two sets of three underground sensors, and an optical cable at shal-low depths near the inner toe of the dike. The sen-sors are monitoring the influence of trees on the dikes, especially during dry periods, the influence of the buildings on the sub-soil floors of the new office building and the pumping, which is required during construction and a reference cross-section where these influences are small.
The water pressure is the most important vari-able in the increase of pressure in a dike. Water
330
pressure data can be used, together with data on the dike construction and the subsoil and param-eters which generally do not change much, like the volume weight and the resistance to slipping, (which depends on the water pressure), to deter-mine the settlement and the stability of the dike body.
In addition on the Ringdijk, an optical cable has been installed along the dike near the inner crest line at shallow depth. This cable connects the three cross sections and continues a short way beyond the leftmost and rightmost cross section. This cable should be able to detect at least defor-mations. This is supplementary, and provides a cross-check on the results of the existing models of dikes, which calculate setting and stability. It will also answer the question as to whether the selected cross sections are the most characteristic, or whether larger distortions occur between the sections.
At both the Netherlands (Amsterdam) sites, the sensor system is powered by two batteries; these are expected to last more than a year before they need to be replaced. The power level is monitored remotely The transmission box is buried under a cover of about 10 cm of soil, making it invisible to vandals. The data is transmitted over the UMTS-system. The reception of the signal appears to be very strong; data can even be transmitted with 30 cm of soil cover.
2.2.2 Sensors at UK site: Boston (near ‘Grand Sluice’)
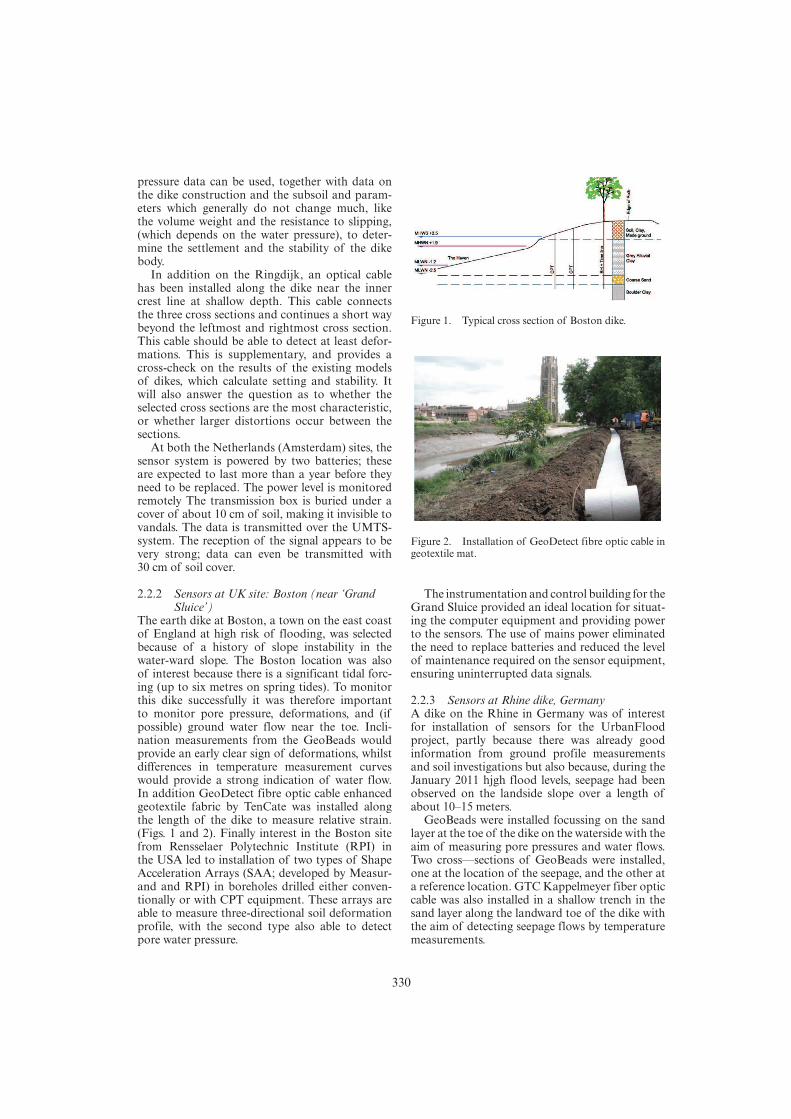
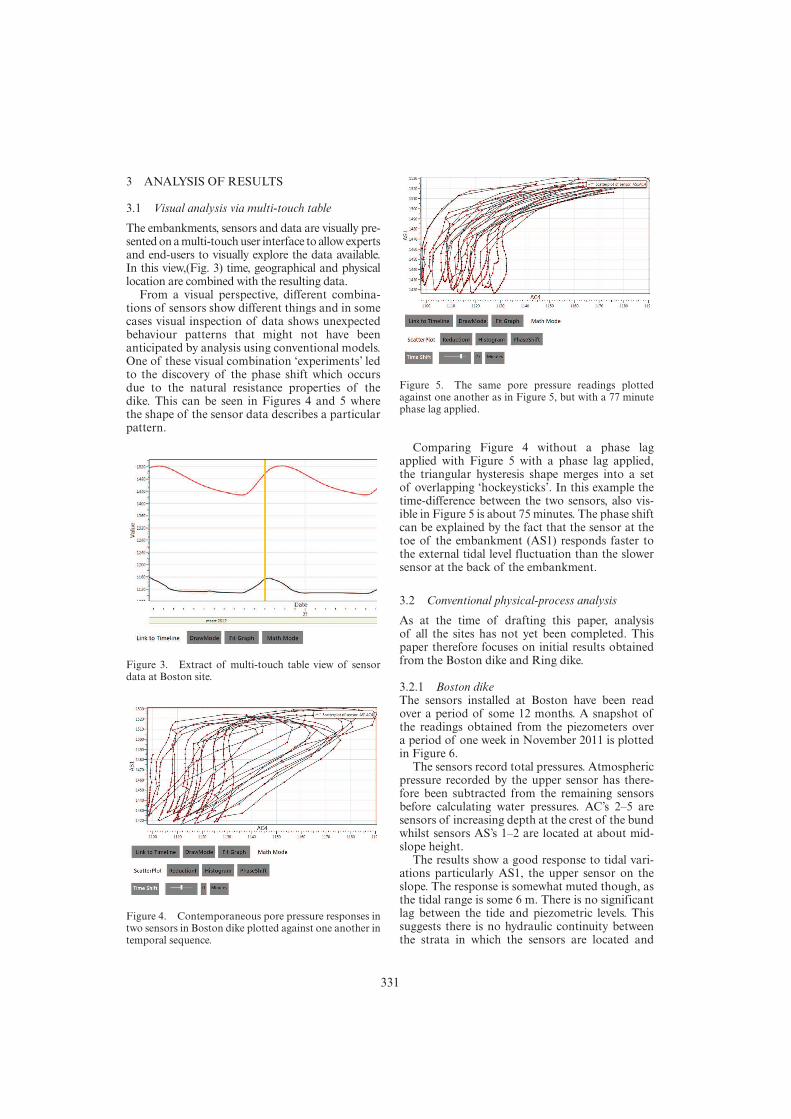
The earth dike at Boston, a town on the east coast of England at high risk of flooding, was selected because of a history of slope instability in the water-ward slope. The Boston location was also of interest because there is a significant tidal forc-ing (up to six metres on spring tides). To monitor this dike successfully it was therefore important to monitor pore pressure, deformations, and (if possible) ground water flow near the toe. Incli-nation measurements from the GeoBeads would provide an early clear sign of deformations, whilst differences in temperature measurement curves would provide a strong indication of water flow. In addition GeoDetect fibre optic cable enhanced geotextile fabric by TenCate was installed along the length of the dike to measure relative strain. (Figs. 1 and 2). Finally interest in the Boston site from Rensselaer Polytechnic Institute (RPI) in the USA led to installation of two types of Shape Acceleration Arrays (SAA; developed by Measur-and and RPI) in boreholes drilled either conven-tionally or with CPT equipment. These arrays are able to measure three-directional soil deformation profile, with the second type also able to detect pore water pressure.
Figure 1. Typical cross section of Boston dike.
Figure 2. Installation of GeoDetect fibre optic cable in geotextile mat.
The instrumentation and control building for the Grand Sluice provided an ideal location for situat-ing the computer equipment and providing power to the sensors. The use of mains power eliminated the need to replace batteries and reduced the level of maintenance required on the sensor equipment, ensuring uninterrupted data signals.
2.2.3 Sensors at Rhine dike, GermanyA dike on the Rhine in Germany was of interest for installation of sensors for the UrbanFlood project, partly because there was already good information from ground profile measurements and soil investigations but also because, during the January 2011 hjgh flood levels, seepage had been observed on the landside slope over a length of about 10–15 meters.
GeoBeads were installed focussing on the sand layer at the toe of the dike on the waterside with the aim of measuring pore pressures and water flows. Two cross—sections of GeoBeads were installed, one at the location of the seepage, and the other at a reference location. GTC Kappelmeyer fiber optic cable was also installed in a shallow trench in the sand layer along the landward toe of the dike with the aim of detecting seepage flows by temperature measurements.
331
3 ANALYSIS OF RESULTS
3.1 Visual analysis via multi-touch table
The embankments, sensors and data are visually pre-sented on a multi-touch user interface to allow experts and end-users to visually explore the data available. In this view,(Fig. 3) time, geographical and physical location are combined with the resulting data.
From a visual perspective, different combina-tions of sensors show different things and in some cases visual inspection of data shows unexpected behaviour patterns that might not have been anticipated by analysis using conventional models. One of these visual combination ‘experiments’ led to the discovery of the phase shift which occurs due to the natural resistance properties of the dike. This can be seen in Figures 4 and 5 where the shape of the sensor data describes a particular pattern.
Comparing Figure 4 without a phase lag applied with Figure 5 with a phase lag applied, the triangular hysteresis shape merges into a set of overlapping ‘hockeysticks’. In this example the time-difference between the two sensors, also vis-ible in Figure 5 is about 75 minutes. The phase shift can be explained by the fact that the sensor at the toe of the embankment (AS1) responds faster to the external tidal level fluctuation than the slower sensor at the back of the embankment.
3.2 Conventional physical-process analysis
As at the time of drafting this paper, analysis of all the sites has not yet been completed. This paper therefore focuses on initial results obtained from the Boston dike and Ring dike.
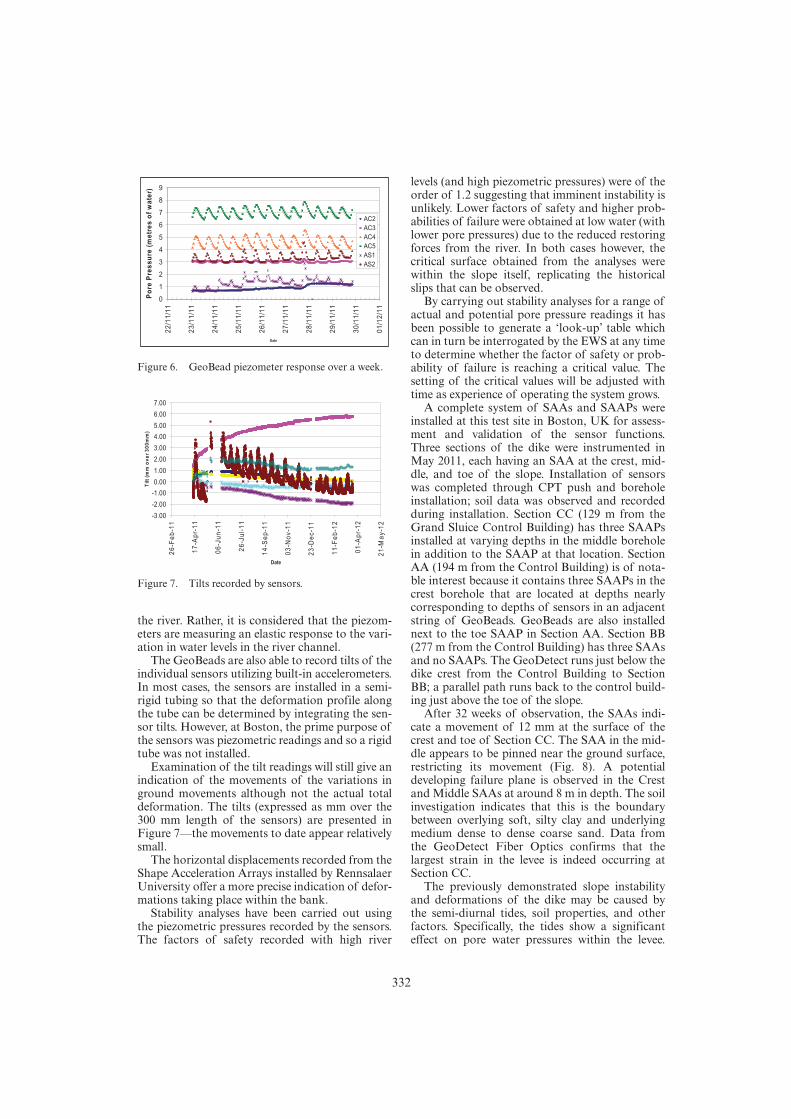
3.2.1 Boston dikeThe sensors installed at Boston have been read over a period of some 12 months. A snapshot of the readings obtained from the piezometers over a period of one week in November 2011 is plotted in Figure 6.
The sensors record total pressures. Atmospheric pressure recorded by the upper sensor has there-fore been subtracted from the remaining sensors before calculating water pressures. AC’s 2–5 are sensors of increasing depth at the crest of the bund whilst sensors AS’s 1–2 are located at about mid-slope height.
The results show a good response to tidal vari-ations particularly AS1, the upper sensor on the slope. The response is somewhat muted though, as the tidal range is some 6 m. There is no significant lag between the tide and piezometric levels. This suggests there is no hydraulic continuity between the strata in which the sensors are located and
Figure 3. Extract of multi-touch table view of sensor data at Boston site.
Figure 4. Contemporaneous pore pressure responses in two sensors in Boston dike plotted against one another in temporal sequence.
Figure 5. The same pore pressure readings plotted against one another as in Figure 5, but with a 77 minute phase lag applied.
332
the river. Rather, it is considered that the piezom-eters are measuring an elastic response to the vari-ation in water levels in the river channel.
The GeoBeads are also able to record tilts of the individual sensors utilizing built-in accelerometers. In most cases, the sensors are installed in a semi-rigid tubing so that the deformation profile along the tube can be determined by integrating the sen-sor tilts. However, at Boston, the prime purpose of the sensors was piezometric readings and so a rigid tube was not installed.
Examination of the tilt readings will still give an indication of the movements of the variations in ground movements although not the actual total deformation. The tilts (expressed as mm over the 300 mm length of the sensors) are presented in Figure 7—the movements to date appear relatively small.
The horizontal displacements recorded from the Shape Acceleration Arrays installed by Rennsalaer University offer a more precise indication of defor-mations taking place within the bank.
Stability analyses have been carried out using the piezometric pressures recorded by the sensors. The factors of safety recorded with high river
levels (and high piezometric pressures) were of the order of 1.2 suggesting that imminent instability is unlikely. Lower factors of safety and higher prob-abilities of failure were obtained at low water (with lower pore pressures) due to the reduced restoring forces from the river. In both cases however, the critical surface obtained from the analyses were within the slope itself, replicating the historical slips that can be observed.
By carrying out stability analyses for a range of actual and potential pore pressure readings it has been possible to generate a ‘look-up’ table which can in turn be interrogated by the EWS at any time to determine whether the factor of safety or prob-ability of failure is reaching a critical value. The setting of the critical values will be adjusted with time as experience of operating the system grows.
A complete system of SAAs and SAAPs were installed at this test site in Boston, UK for assess-ment and validation of the sensor functions. Three sections of the dike were instrumented in May 2011, each having an SAA at the crest, mid-dle, and toe of the slope. Installation of sensors was completed through CPT push and borehole installation; soil data was observed and recorded during installation. Section CC (129 m from the Grand Sluice Control Building) has three SAAPs installed at varying depths in the middle borehole in addition to the SAAP at that location. Section AA (194 m from the Control Building) is of nota-ble interest because it contains three SAAPs in the crest borehole that are located at depths nearly corresponding to depths of sensors in an adjacent string of GeoBeads. GeoBeads are also installed next to the toe SAAP in Section AA. Section BB (277 m from the Control Building) has three SAAs and no SAAPs. The GeoDetect runs just below the dike crest from the Control Building to Section BB; a parallel path runs back to the control build-ing just above the toe of the slope.
After 32 weeks of observation, the SAAs indi-cate a movement of 12 mm at the surface of the crest and toe of Section CC. The SAA in the mid-dle appears to be pinned near the ground surface, restricting its movement (Fig. 8). A potential developing failure plane is observed in the Crest and Middle SAAs at around 8 m in depth. The soil investigation indicates that this is the boundary between overlying soft, silty clay and underlying medium dense to dense coarse sand. Data from the GeoDetect Fiber Optics confirms that the largest strain in the levee is indeed occurring at Section CC.
The previously demonstrated slope instability and deformations of the dike may be caused by the semi-diurnal tides, soil properties, and other factors. Specifically, the tides show a significant effect on pore water pressures within the levee.
-3.00
-2.00
-1.00
0.00
1.00
2.00
3.00
4.00
5.00
6.00
7.00
26
-Fe
b-1
1
17
-Ap
r-1
1
06
-Ju
n-1
1
26
-Ju
l-1
1
14
-Se
p-1
1
03
-No
v-1
1
23
-De
c-1
1
11
-Fe
b-1
2
01
-Ap
r-1
2
21
- Ma
y-1
2
Date
Til
t (m
m o
ve
r 3
00
mm
)
Figure 7. Tilts recorded by sensors.
0
1
2
3
4
5
6
7
8
9
22
/11
/11
23
/11
/11
24
/11
/11
25
/11
/11
26
/11
/11
27
/11
/11
28
/11
/11
29
/11
/11
30
/11
/11
01
/12
/11
Date
Po
re P
res
su
re (
me
tre
s o
f w
ate
r)
AC2
AC3
AC4
AC5
AS1
AS2
Figure 6. GeoBead piezometer response over a week.

333
The difference between high tide and low tide dur-ing a spring tide is greater than six metres. During a neap tide, the difference is still a significant four metres. Figure 9 illustrates the behaviour of the GeoBeads and SAAPs over a three-day period during a spring tide at the end of August (100 days into observation). The SAAPs located in the crest of Section AA are labelled ‘PZ’, and the GeoBeads are labelled ‘AC’ for crest of Section AA and ‘AS’ for slope of Section AA. It is noted that AC1 and possibly AC2 are above the groundwater level and thus unsaturated. AC5 and PZ3 are located at nearly the same depth in the crest of Section AA and are in phase, exhibiting the same pattern and shape. The slight difference in pressure head read-ing is due to the difference in buried depth, con-firming that the SAAPs are working as intended.
AC4 and PZ2 exhibit the same period but dif-ferent amplitudes. The boundary between the sand and clay layers is between these two sen-sors; increased permeability possibly amplifies the response to the tides in the sand layer where AC4 is located. The greatest amplitudes are observed in the slope sensors. At high tide, the slope sensors measure values above the estimated hydrostatic pressure (Fig. 10). This is expected since the river overtops the slope sensors at high tide. The other
Figure 8. SAA displacement profile in Section CC at dike crest and toe.
Figure 9. SAAP and Geobeads pore pressure readings in metres of head (Section AA).
Figure 10. Pore pressure with depth at high tide during spring tide (Section AA).
sensors approximately measure the estimated hydrostatic pressure.
3.2.2 RingdikeUnlike the large tidal range experienced at Boston, Ringdike in Amsterdam has a virtually
334
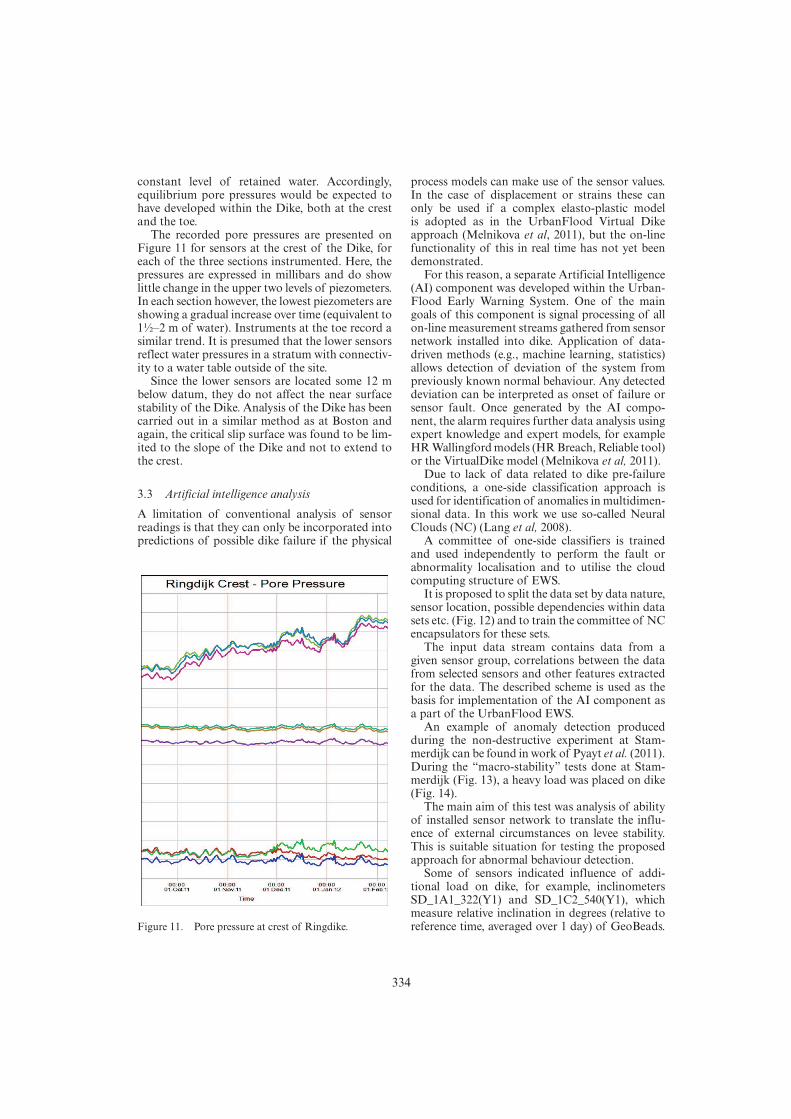
constant level of retained water. Accordingly, equilibrium pore pressures would be expected to have developed within the Dike, both at the crest and the toe.
The recorded pore pressures are presented on Figure 11 for sensors at the crest of the Dike, for each of the three sections instrumented. Here, the pressures are expressed in millibars and do show little change in the upper two levels of piezometers. In each section however, the lowest piezometers are showing a gradual increase over time (equivalent to 1½–2 m of water). Instruments at the toe record a similar trend. It is presumed that the lower sensors reflect water pressures in a stratum with connectiv-ity to a water table outside of the site.
Since the lower sensors are located some 12 m below datum, they do not affect the near surface stability of the Dike. Analysis of the Dike has been carried out in a similar method as at Boston and again, the critical slip surface was found to be lim-ited to the slope of the Dike and not to extend to the crest.
3.3 Artificial intelligence analysis
A limitation of conventional analysis of sensor readings is that they can only be incorporated into predictions of possible dike failure if the physical
process models can make use of the sensor values. In the case of displacement or strains these can only be used if a complex elasto-plastic model is adopted as in the UrbanFlood Virtual Dike approach (Melnikova et al, 2011), but the on-line functionality of this in real time has not yet been demonstrated.
For this reason, a separate Artificial Intelligence (AI) component was developed within the Urban-Flood Early Warning System. One of the main goals of this component is signal processing of all on-line measurement streams gathered from sensor network installed into dike. Application of data-driven methods (e.g., machine learning, statistics) allows detection of deviation of the system from previously known normal behaviour. Any detected deviation can be interpreted as onset of failure or sensor fault. Once generated by the AI compo-nent, the alarm requires further data analysis using expert knowledge and expert models, for example HR Wallingford models (HR Breach, Reliable tool) or the VirtualDike model (Melnikova et al, 2011).
Due to lack of data related to dike pre-failure conditions, a one-side classification approach is used for identification of anomalies in multidimen-sional data. In this work we use so-called Neural Clouds (NC) (Lang et al, 2008).
A committee of one-side classifiers is trained and used independently to perform the fault or abnormality localisation and to utilise the cloud computing structure of EWS.
It is proposed to split the data set by data nature, sensor location, possible dependencies within data sets etc. (Fig. 12) and to train the committee of NC encapsulators for these sets.
The input data stream contains data from a given sensor group, correlations between the data from selected sensors and other features extracted for the data. The described scheme is used as the basis for implementation of the AI component as a part of the UrbanFlood EWS.
An example of anomaly detection produced during the non-destructive experiment at Stam-merdijk can be found in work of Pyayt et al. (2011). During the “macro-stability” tests done at Stam-merdijk (Fig. 13), a heavy load was placed on dike (Fig. 14).
The main aim of this test was analysis of ability of installed sensor network to translate the influ-ence of external circumstances on levee stability. This is suitable situation for testing the proposed approach for abnormal behaviour detection.
Some of sensors indicated influence of addi-tional load on dike, for example, inclinometers SD_1A1_322(Y1) and SD_1C2_540(Y1), which measure relative inclination in degrees (relative to reference time, averaged over 1 day) of GeoBeads. Figure 11. Pore pressure at crest of Ringdike.

335
Analytical
redundancy
Physical
redundancy
(the same
placement)
Physical
redundancy (type
of sensor)
Committe
e
Feature
extraction
Cl1
Sensor
measure
ments
Confidence v
alu
es
-- NORMAL BEHAVIOUR
-- ABNORMAL BEHAVIOUR
-- NORMAL BEHAVIOUR
-- ABNORMAL BEHAVIOUR
X1
X2
-5 -4 -3 -2 -1 0 1 2 3 4 5
x 10-3
-4
-2
0
2
4
6x 10
-3
Cl2
Clk
Figure 12. Dike abnormal behaviour detection approach.
Figure 13. Cross-section 2 of Stammerdijk.
Figure 14. Non-destructive experiment at Stammerdijk.
0 500 1000 1500 2000 2500 3000 3500 4000
(a)
(c)
t
detected anomalies
0 500 2500 3000 35000
0.5
(c)
t3000 3500
1
3000 3500
0 500 1000 1500 2000 2500 3000 3500 400000.20.40.60.8
0 500 1000 1500 2000 2500 3000 3500 400000.10.20.30.4
(b)
(c)
t
t
t
Placement ofadditional heavy load
Figure 15. Confidence values calculated by Neural Clouds for 2 parameters. (a) calculated confidence value of dike normal behaviour, (b), and (c) relative inclination of SD_1A1_322(Y1) and SD_1C2_540(Y1) respectively—in degrees (relative to reference time, averaged over 1 day). Training period of NC is from 1 till 2054 timestamp, test-ing period is from 2055 till 3735. X axis for (a), (b), (c) represents discrete time step number, with the time step of 10 minutes between the measurements.
Figure 16. Constructed Neural Clouds. Confidence lev-els are represented by the 3D surface: close to 1—normal behaviour, close to 0—anomaly.
Here “SD” stands for StammerDijk, “1” is the cross-section number, “C2” is the sensor location, “540” is the depth of the sensor in centimetres.
Figure 15b and c show that additional load placed three times at dike was successfully detected by selected sensors—three rapid changes in graph-ics are related to the events of placing (time steps with numbers 2238, 2711, 3012) and removal (steps with numbers 2607, 2866, 3140) of the load.
These anomalies were detected by the Artificial Intelligence component (Fig. 15a). As training set the data related to normal mode were used. Test set includes data with anomalies as well as “normal”
data. Figure 15a shows that suggested approach is able to detect such kind of anomalies: in case of “normal” data confidence values are close to 1, in case of anomalies close to 0.
Figure 16 is a 3D projection of NC trained on Stammerdijk.
336
4 CONCLUSIONS
1. The UrbanFlood project has demonstrated at four pilot sites the use of advanced electronic sensors for the monitoring of dike performance and the way in which the sensor values can be linked to a dike-specific Early Warning System (EWS).
2. Selected sensors are based on MEMS or fibre optic technology and can detect pore pressures, tilts, strains and temperature changes.
3. Analysis has identified phase lags in pore pres-sure response between sensors in different locations. Changes in these phase lags may be indicative of deterioration and even an early warning of failure. Further Artificial Intelli-gence analysis is investigating this phenomenon further.
4. Stability analysis incorporating a range of poten-tial pore-pressure values at the sensor locations allow development of automated assessment of likely failure linked to the measured pore pres-sure values.
5. Tilt measurements can be assessed for changes in trends, but a more rapid assessment of abnor-malities in tilts and pore pressures can be deter-mined by the use of artificial intelligence. If the data obtained during normal loading ranges is classified using neural clouds, trials have shown that anomalies can be detected when abnormal loadings generate data which falls outside of these clouds. This can be used to trigger assess-ment of the likelihood of levee breach and the consequences in terms of flood propagation and damage in the defended urban area.
ACKNOWLEDGEMENTS
UrbanFlood is a project under the EU 7th frame-work Programme which started in December 2009 and will run for 3 years. Partners of UrbanFlood include TNO Information and Communication Technology, the University of Amsterdam and
STOWA (Foundation for Applied Water Research) from The Netherlands; HR Wallingford in the UK, ACC Cyfronet AGH in Poland and OOO Siemens in Russia.
The authors would like to thank Waternet, par-ticularly Rob van Putten, for providing Stammer-dijk measurements and support.
REFERENCES
Artières O., Galiana M., Royet P., Beck Y.L., Cunat P., Courivaud J.R., Fry J.J., Faure Y.H. Guidoux C. (2010). Fiber optics monitoring solution for canal dykes. Proc. of PIANC MMX Congress, Liverpool.
Artières, O., Beck, Y.L., Guidoux C., 2012. Scour erosion detection with a Fibre Optic Sensor-Enabled Geotex-tile. Proceedding of the 6th Int. Conf. on Scour Ero-sion., Paris, August 27–31, 2012.
Abdoun, T. and Bennett, V. (2008). “A New Wireless MEMS-Based System for Real-Time Deformation Monitoring,” Geotechnical News Magazine, Vol. 26, No. 1, pp. 36–40.
Bennett, V.G. (2010). “Development of a MEMS-Based In-Place Inclinometer-Accelerometer Array for Moni-toring and Evaluation of Geotechnical Systems,” Ph.D. Dissertation, Rensselaer Polytechnic Institute, Troy, NY.
Geokon, Inc. (2011). “Geokon 4500 Series Vibrating Wire Piezometers,” Instruction Manual, Lebanon, NH.
Lang, B., Poppe, T., Minin, A., Mokhov, I., Kuperin, Y., Mekler., A., Liapakina, I. (2008). “Neural Clouds for Monitoring of Complex Systems”. Optical Memory and Neural Networks (Information Optics). 2008. Vol. 17. No. 3. Pp. 183–192.
Measurand. (2012). Website: http://www.Measurand Geotechnical.com, Accessed Jan. 12, 2012.
Melnikova, N.B., Shirshov, G.S., Krzhizhanovskaya, V.V. (2011). “Virtual Dike: multiscale simulation of dike stability”. Procedia Computer Science, V. 4, pp. 791–800. http://dx.doi.org/10.1016/j.procs. 2011.04.084.
Pyayt, A.L., Mokhov, I.I., Lang, B., Krzhizhanovskaya, V.V., Meijer R.J (2011). “Machine Learning Methods for Environmental Monitoring and Flood Protec-tion”. Proceedings of the International Conference on Artificial Intelligence and Neural Networks (ICAINN 2011), Amsterdam, The Netherlands, July 13–15 2011, pp. 118–124.
Related Documents